
SKILLS TALENT CAREERS S U S TAINAB ILIT Y LIFELONG ...
212
Annual report and accounts 2019 SKILLS TALENT SKILLS CAREERS SUSTAINABILITY LIFELONG LEARNING CREATIVITY ASSESSMENTS PROGRESS LEARNERS CRITICAL T A L E N T O N L I N E EFFICACY SUSTAINABILITY LEARNERS LEADERSHIP LEADERSHIP OUTCOMES LEADERSHIP PERSONALISED DIGITAL COLLABORATION PERSONALISED DIGITAL COLLABORATION SKILLS CRITICAL THINKING CREDENTIALS EXPERIENTIAL LEARNING SKILLS EXPERIENTIAL DIGITAL CREATIVITY LEARNING OUTCOMES THINKING ECONOMY LEARNING EXPERIENTIAL COMMUNICATION SUSTAINABILITY COLLABORATION PERSONALISED LEARNING CRITICAL DI G I TA L LEADERSHIP THINKING PROGRESS THINKING CRITICAL SUSTAINABILITY COLLABORATION DIGITAL GROWTH ONLINE EFFICACY CRITICAL CRITICAL LIFELONG UNIQUE THINKING THINKING UNIQUE CONTENT LEARNING CAREERS PROGRESS CAREERS CREATIVITY LEARNING DIGITAL GROWTH DIGITAL UNIQUE CAREERS CONTENT EFFICACY PERSONALISED ONLINE LEARNING LEARNING TALENT SUSTAINABILITY GROWTH UNIQUE CONTENT THE TALENT ECONOMY PROGRESS LEARNERS SOFT SKILLS SKILLS TALENT ECONOMY LIFELONG LEARNING TALENT ECONOMY LIFELONG LEARNING COMMUNICATION COLLABORATION SUSTAINABILITY OUTCOMES PERSONALISED L E A R N I N G EFFICACY ONLINE CAREERS
-
Upload
khangminh22 -
Category
Documents
-
view
2 -
download
0
Transcript of SKILLS TALENT CAREERS S U S TAINAB ILIT Y LIFELONG ...

Annual report and accounts 2019
SKILLS
TALENTSKILLS
CAREERS
SUST
AIN
AB
ILIT
Y
LIFELONG LEARNING
C R E A T I V I T Y
A SSESSMENTS
P R O G R E S S
L E A R N E R S
C R I T I C A L
T A L E N T
ON
LI
NE
E F F I C A C Y
SUSTAINABILITY
L E A R N E R S
L E A D E R S H I P
L E A D E R S H I P
O U T C O M E S
LE
AD
ER
SH
IP
PERSO
NA
LISED D
IGITA
L COLLA
BO
RATIO
N
PERSO
NA
LISED D
IGITA
L COLLA
BO
RATIO
N
SKILLS CRITICAL THINKING CREDENTIALS
EXPERIENTIAL LEARNING SKILLS
E X PER I EN T I A L
D I G I T A L
C R E A T I V I T YL E A R N I N G
O U T C O M E S
T H I N K I N G
E C O N O M Y
LE
AR
NI
NG
EXPERIENTIAL
COM
MU
NIC
ATIO
NSU
STA
INA
BIL
ITY
COLL
AB
OR
ATIO
NP
ER
SO
NA
LIS
ED
L E A R N I N G
C R I T I C A L
D I G I T A L
L E A D E R S H I P
T H I N K I N G
P R O G R E S S
T H I N K I N GC R I T I C A L
S U S T A I N A B I L I T YCO L L A B O R AT I O N
D I G I TA L
GROWTH
ON
LIN
E
EFFICAC
Y
C R I T I C A L
CR
ITIC
AL
LIF
EL
ON
G
U N I Q U E
T H I N K I N G
THIN
KIN
G
UNIQUE
CONTENT
LE
AR
NIN
G
CA
RE
ER
SPROGRE S S
CA
RE
ER
S
CR
EA
TIV
ITY
L E A R N I N G
DIGITAL
GROWTH DIGITAL
UNIQUECAREERS
CON
TEN
TEF
FIC
ACY
PERSON
ALISED
ON
LINE LEARN
ING
LEAR
NIN
G
TALENT
SUSTA
INA
BILITY
GROW TH
U N I Q U ECONTENT
THE
TALE
NT
ECO
NO
MY
PROGRESSLEARNERS
SOF TSKILLS
SK
ILL
S
TALEN
T ECO
NO
MY LIFELO
NG
LEA
RN
ING
TALEN
T ECO
NO
MY LIFELO
NG
LEA
RN
ING
COMMUNIC ATION
CO L L A B O R AT I O NS U S TA I N A B I L I T YO U T C O M E S
P E R S O N A L I S E D
L E A R N I N G
EFFICACY
O N L I N E
CAREERS
Focused on digital, lifelong learning
Our commitment to sustainability and learning outcomes
Across our operations, we are committed to a new 2030 Sustainability Strategy to unleash untapped talent – helping everyone to reach their full potential and shape a brighter future.Read more about our Sustainability Strategy on p16
The outcomes that are being demanded of education are evolving. The next generation of Efficacy builds on what we have learned, to create the tools Pearson needs to be a trusted guide to lifelong learning, with the aspiration of improving learning outcomes.Read more about our approach to Efficacy on p27
Who we areWe are the world’s learning company, operating in 70 countries around the world, with more than 22,500 employees. We provide content, assessment and digital services to schools, colleges and universities, as well as professional and vocational education to learners to help increase their skills and lifelong employability prospects.
We aim to support learners throughout their lifetime for every moment that matters – whether this is exam preparation and success, graduating from university, getting a new job, studying for a postgraduate degree, changing career, or looking for a new challenge.
Our purpose is to help people make progress in their lives through learning.
Our vision is to have a direct relationship with millions of lifelong learners and to link education to the way people aspire to live and work every day. To do that, we will collaborate with a wide group of partners to help shape the future of learning.
Our capabilities include combining world-class educational content and assessment, powered by services and technology, to enable more effective teaching and personalised learning at scale. Our capabilities are based on our deep expertise in how people learn.
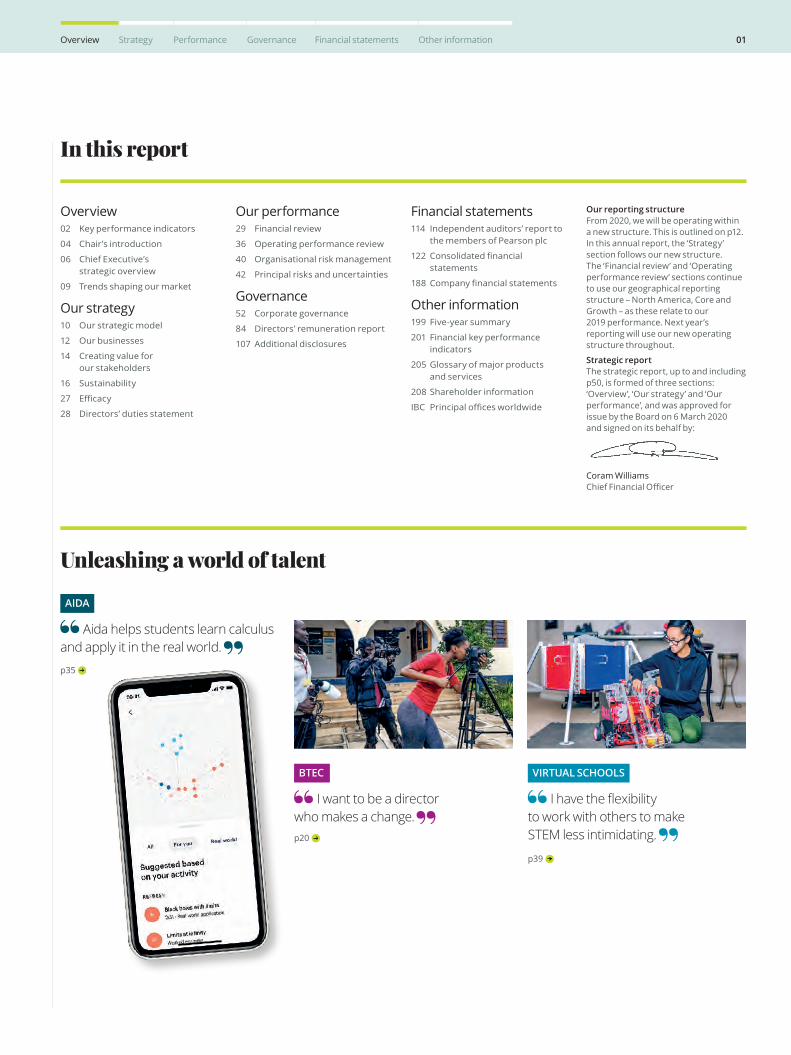
In this report
Unleashing a world of talent
AIDA
Aida helps students learn calculus and apply it in the real world.p35
I have the flexibility to work with others to make STEM less intimidating.
p39
VIRTUAL SCHOOLS
p20
BTEC
I want to be a director who makes a change.
Overview02 Key performance indicators
04 Chair’s introduction
06 Chief Executive’s strategic overview
09 Trends shaping our market
Our strategy10 Our strategic model
12 Our businesses
14 Creating value for our stakeholders
16 Sustainability
27 Efficacy
28 Directors’ duties statement
Our performance29 Financial review
36 Operating performance review
40 Organisational risk management
42 Principal risks and uncertainties
Governance52 Corporate governance
84 Directors’ remuneration report
107 Additional disclosures
Financial statements114 Independent auditors’ report to
the members of Pearson plc
122 Consolidatedfinancialstatements
188 Companyfinancialstatements
Other information199 Five-year summary
201 Financial key performance indicators
205 Glossary of major products and services
208 Shareholder information
IBC Principalofficesworldwide
Our reporting structure From 2020, we will be operating within a new structure. This is outlined on p12. In this annual report, the ‘Strategy’ section follows our new structure. The ‘Financial review’ and ‘Operating performance review’ sections continue to use our geographical reporting structure – North America, Core and Growth – as these relate to our 2019 performance. Next year’s reporting will use our new operating structure throughout.
Strategic report The strategic report, up to and including p50, is formed of three sections: ‘Overview’, ‘Our strategy’ and ‘Our performance’, and was approved for issue by the Board on 6 March 2020 and signed on its behalf by:
Coram Williams ChiefFinancialOfficer
01Overview Strategy Performance Governance Financial statements Other information
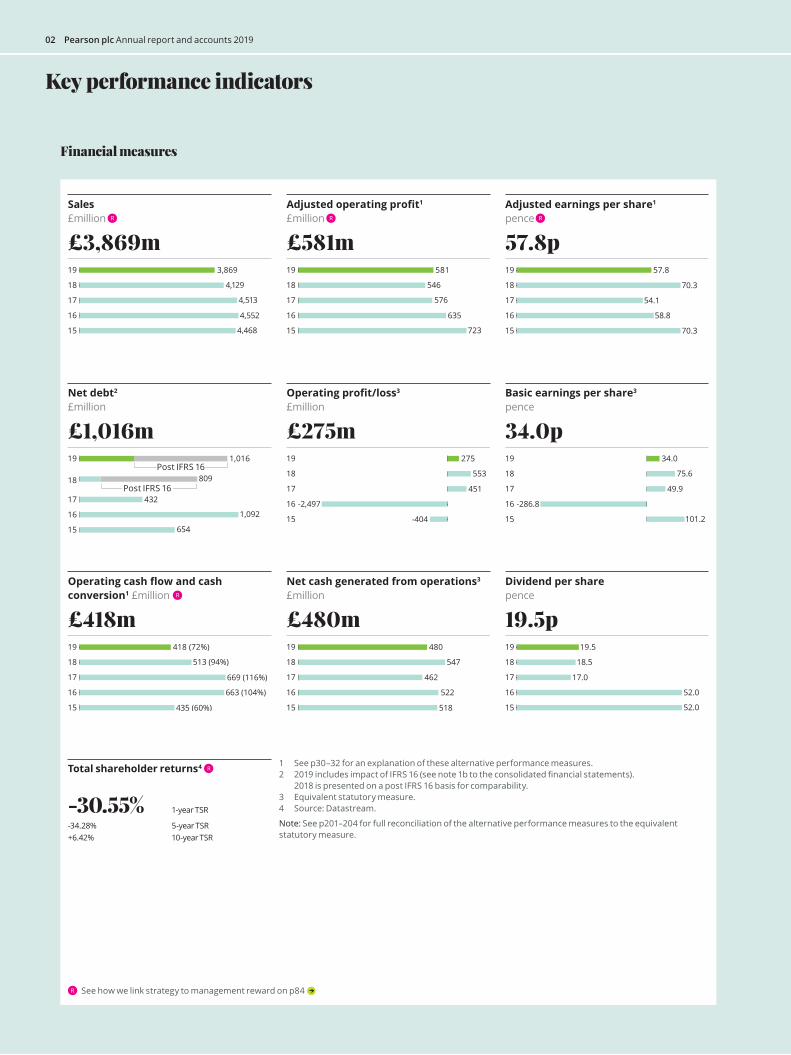
Key performance indicators
Financial measures
R See how we link strategy to management reward on p84
-30.55% 1-year TSR
-34.28% 5-year TSR+6.42% 10-year TSR
1 See p30–32 for an explanation of these alternative performance measures.2 2019 includes impact of IFRS 16 (see note 1b to the consolidated financial statements).
2018 is presented on a post IFRS 16 basis for comparability.3 Equivalent statutory measure.4 Source: Datastream.
Note: See p201–204 for full reconciliation of the alternative performance measures to the equivalent statutory measure.
Total shareholder returns4 R
15
16
17
18
19 3,869
4,129
4,513
4,552
4,468
£3,869m
Sales£million R
15
16
17
18
19 418 (72%)
513 (94%)
669 (116%)
663 (104%)
435 (60%)
£418m
Operating cash flow and cashconversion1 £million R
15
16
17
18
19 1,016
809
432
1,092
654
£1,016m
Net debt2
£million
Post IFRS 16
Post IFRS 16
15
16
17
18
19 480
547
462
522
518
£480m
Net cash generated from operations3
£million
15
16
17
18
19 19.5
18.5
17.0
52.0
52.0
19.5p
Dividend per sharepence
15
16
17
18
19 275
553
451
-2,497
-404
£275m
Operating profit/loss3
£million
15
16
17
18
19 34.0
75.6
49.9
-286.8
101.2
34.0p
Basic earnings per share3
pence
15
16
17
18
19 581
546
576
635
723
£581m
Adjusted operating profit1
£million R
15
16
17
18
19 57.8
70.3
54.1
58.8
70.3
57.8p
Adjusted earnings per share1
pence R
02 Pearson plc Annual report and accounts 2019

Digital revenue1 Business growth in our key businesses
Virtual Schools
Underlying revenue +6%
Full Time Equivalent (FTE) students in continuing partner schools +5%
Global Online Program Management
Underlying revenue +10%
Enrolments +6%
Professional Certification (Pearson VUE)
Underlying revenue +10%
Test volume +8%
US Student Assessment
Underlying revenue (1)%
Digital/print test volume % 57%/43%
English
English Courseware underlying revenue +3%
PTE Academic test volume +17%
UK Assessments & Qualifications
Underlying revenue +6%
US Higher Education Courseware
Underlying revenue (12)%
Digital/print revenue split % 63%/37%
Talent and employee engagement p21
Active Employee Resource Groups 50
Employee Engagement Network meetings connecting employees with the Board 2
Reduce our carbon footprint 2019 vs. 2018
Global greenhouse gas emissions (tCO2e) 80,421 (14)%
Improve gender diversity 2019 2018
Female Board members 33% 30%
Female senior managers2 34% 31%
Female employees 59% 62%
GB median gender pay gap 12% 14%
2 Two reporting lines from the Chief Executive.
Digital platforms Launch of the Pearson Learning Platform (PLP)
– Revel launched commercially with 17 titles in 2019
Launch of AI-enabled calculus app, Aida
Simplification
In-year incremental cost savings achieved in 2019 £130m
Annualised cost savings achieved from simplification programme £335m
Percentage of revenue on one Enterprise Planning Resource (ERP) system c.80%
Business measures
Non-financial measures
1 Excludes GEDU, Wall Street English (WSE) and US K12 Courseware. GEDU was sold in 2017, WSE was sold in 2018; US K12 Courseware was held for sale in 2018 and was sold in 2019.
Note: Underlying growth rates exclude currency movements, portfolio changes and accounting changes.
17
18
19 36% 30%
28%
27% 41%
38%
34%
34%
32%
66%
62%
59%
Digital Digitally-enabled Non-digital
03Overview Strategy Performance Governance Financial statements Other information
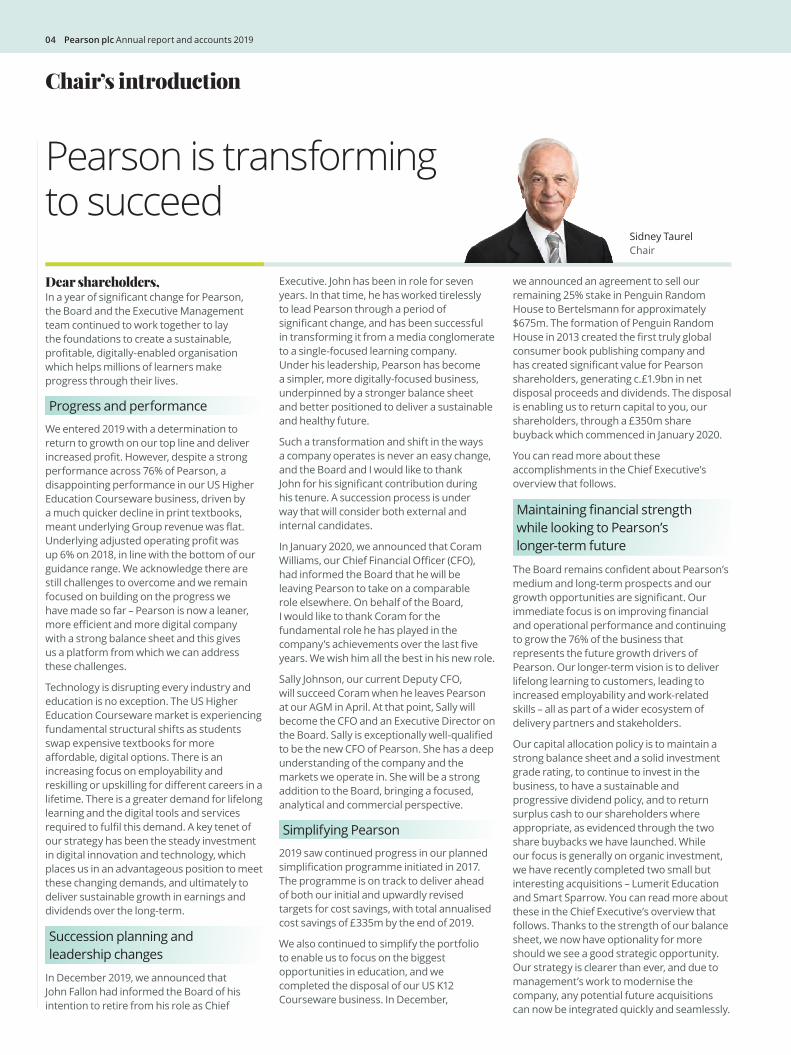
Chair’s introduction
Pearson is transforming to succeed
Sidney Taurel Chair
Dear shareholders,In a year of significant change for Pearson, the Board and the Executive Management team continued to work together to lay the foundations to create a sustainable, profitable, digitally-enabled organisation which helps millions of learners make progress through their lives.
Progress and performance
We entered 2019 with a determination to return to growth on our top line and deliver increased profit. However, despite a strong performance across 76% of Pearson, a disappointing performance in our US Higher Education Courseware business, driven by a much quicker decline in print textbooks, meant underlying Group revenue was flat. Underlying adjusted operating profit was up 6% on 2018, in line with the bottom of our guidance range. We acknowledge there are still challenges to overcome and we remain focused on building on the progress we have made so far – Pearson is now a leaner, more efficient and more digital company with a strong balance sheet and this gives us a platform from which we can address these challenges.
Technology is disrupting every industry and education is no exception. The US Higher Education Courseware market is experiencing fundamental structural shifts as students swap expensive textbooks for more affordable, digital options. There is an increasing focus on employability and reskilling or upskilling for different careers in a lifetime. There is a greater demand for lifelong learning and the digital tools and services required to fulfil this demand. A key tenet of our strategy has been the steady investment in digital innovation and technology, which places us in an advantageous position to meet these changing demands, and ultimately to deliver sustainable growth in earnings and dividends over the long-term.
Succession planning and leadership changes
In December 2019, we announced that John Fallon had informed the Board of his intention to retire from his role as Chief
Executive. John has been in role for seven years. In that time, he has worked tirelessly to lead Pearson through a period of significant change, and has been successful in transforming it from a media conglomerate to a single-focused learning company. Under his leadership, Pearson has become a simpler, more digitally-focused business, underpinned by a stronger balance sheet and better positioned to deliver a sustainable and healthy future.
Such a transformation and shift in the ways a company operates is never an easy change, and the Board and I would like to thank John for his significant contribution during his tenure. A succession process is under way that will consider both external and internal candidates.
In January 2020, we announced that Coram Williams, our Chief Financial Officer (CFO), had informed the Board that he will be leaving Pearson to take on a comparable role elsewhere. On behalf of the Board, I would like to thank Coram for the fundamental role he has played in the company’s achievements over the last five years. We wish him all the best in his new role.
Sally Johnson, our current Deputy CFO, will succeed Coram when he leaves Pearson at our AGM in April. At that point, Sally will become the CFO and an Executive Director on the Board. Sally is exceptionally well-qualified to be the new CFO of Pearson. She has a deep understanding of the company and the markets we operate in. She will be a strong addition to the Board, bringing a focused, analytical and commercial perspective.
Simplifying Pearson
2019 saw continued progress in our planned simplification programme initiated in 2017. The programme is on track to deliver ahead of both our initial and upwardly revised targets for cost savings, with total annualised cost savings of £335m by the end of 2019.
We also continued to simplify the portfolio to enable us to focus on the biggest opportunities in education, and we completed the disposal of our US K12 Courseware business. In December,
we announced an agreement to sell our remaining 25% stake in Penguin Random House to Bertelsmann for approximately $675m. The formation of Penguin Random House in 2013 created the first truly global consumer book publishing company and has created significant value for Pearson shareholders, generating c.£1.9bn in net disposal proceeds and dividends. The disposal is enabling us to return capital to you, our shareholders, through a £350m share buyback which commenced in January 2020.
You can read more about these accomplishments in the Chief Executive’s overview that follows.
Maintaining financial strength while looking to Pearson’s longer-term future
The Board remains confident about Pearson’s medium and long-term prospects and our growth opportunities are significant. Our immediate focus is on improving financial and operational performance and continuing to grow the 76% of the business that represents the future growth drivers of Pearson. Our longer-term vision is to deliver lifelong learning to customers, leading to increased employability and work-related skills – all as part of a wider ecosystem of delivery partners and stakeholders.
Our capital allocation policy is to maintain a strong balance sheet and a solid investment grade rating, to continue to invest in the business, to have a sustainable and progressive dividend policy, and to return surplus cash to our shareholders where appropriate, as evidenced through the two share buybacks we have launched. While our focus is generally on organic investment, we have recently completed two small but interesting acquisitions – Lumerit Education and Smart Sparrow. You can read more about these in the Chief Executive’s overview that follows. Thanks to the strength of our balance sheet, we now have optionality for more should we see a good strategic opportunity. Our strategy is clearer than ever, and due to management’s work to modernise the company, any potential future acquisitions can now be integrated quickly and seamlessly.
04 Pearson plc Annual report and accounts 2019
Digital
Digitally enabled
Non-digital
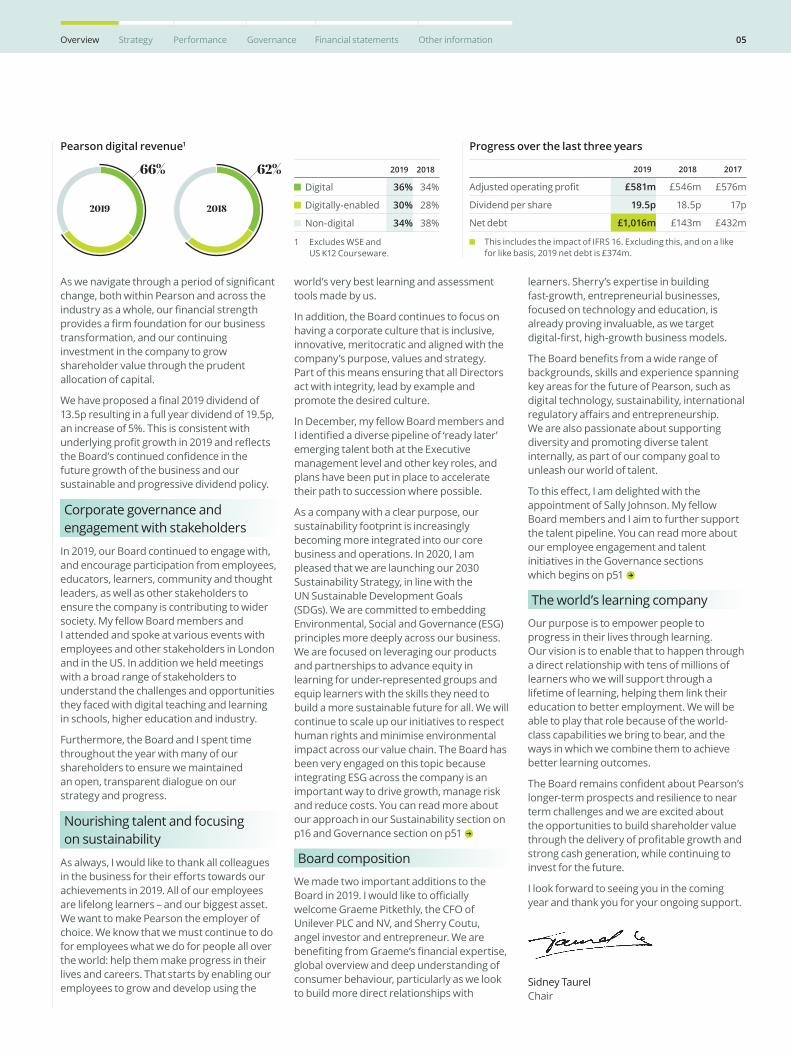
Pearson digital revenue* 2019 vs 2018
2019 2018
As we navigate through a period of significant change, both within Pearson and across the industry as a whole, our financial strength provides a firm foundation for our business transformation, and our continuing investment in the company to grow shareholder value through the prudent allocation of capital.
We have proposed a final 2019 dividend of 13.5p resulting in a full year dividend of 19.5p, an increase of 5%. This is consistent with underlying profit growth in 2019 and reflects the Board’s continued confidence in the future growth of the business and our sustainable and progressive dividend policy.
Corporate governance and engagement with stakeholders
In 2019, our Board continued to engage with, and encourage participation from employees, educators, learners, community and thought leaders, as well as other stakeholders to ensure the company is contributing to wider society. My fellow Board members and I attended and spoke at various events with employees and other stakeholders in London and in the US. In addition we held meetings with a broad range of stakeholders to understand the challenges and opportunities they faced with digital teaching and learning in schools, higher education and industry.
Furthermore, the Board and I spent time throughout the year with many of our shareholders to ensure we maintained an open, transparent dialogue on our strategy and progress.
Nourishing talent and focusing on sustainability
As always, I would like to thank all colleagues in the business for their efforts towards our achievements in 2019. All of our employees are lifelong learners – and our biggest asset. We want to make Pearson the employer of choice. We know that we must continue to do for employees what we do for people all over the world: help them make progress in their lives and careers. That starts by enabling our employees to grow and develop using the
world’s very best learning and assessment tools made by us.
In addition, the Board continues to focus on having a corporate culture that is inclusive, innovative, meritocratic and aligned with the company’s purpose, values and strategy. Part of this means ensuring that all Directors act with integrity, lead by example and promote the desired culture.
In December, my fellow Board members and I identified a diverse pipeline of ‘ready later’ emerging talent both at the Executive management level and other key roles, and plans have been put in place to accelerate their path to succession where possible.
As a company with a clear purpose, our sustainability footprint is increasingly becoming more integrated into our core business and operations. In 2020, I am pleased that we are launching our 2030 Sustainability Strategy, in line with the UN Sustainable Development Goals (SDGs). We are committed to embedding Environmental, Social and Governance (ESG) principles more deeply across our business. We are focused on leveraging our products and partnerships to advance equity in learning for under-represented groups and equip learners with the skills they need to build a more sustainable future for all. We will continue to scale up our initiatives to respect human rights and minimise environmental impact across our value chain. The Board has been very engaged on this topic because integrating ESG across the company is an important way to drive growth, manage risk and reduce costs. You can read more about our approach in our Sustainability section on p16 and Governance section on p51
Board composition
We made two important additions to the Board in 2019. I would like to officially welcome Graeme Pitkethly, the CFO of Unilever PLC and NV, and Sherry Coutu, angel investor and entrepreneur. We are benefiting from Graeme’s financial expertise, global overview and deep understanding of consumer behaviour, particularly as we look to build more direct relationships with
learners. Sherry’s expertise in building fast-growth, entrepreneurial businesses, focused on technology and education, is already proving invaluable, as we target digital-first, high-growth business models.
The Board benefits from a wide range of backgrounds, skills and experience spanning key areas for the future of Pearson, such as digital technology, sustainability, international regulatory affairs and entrepreneurship. We are also passionate about supporting diversity and promoting diverse talent internally, as part of our company goal to unleash our world of talent.
To this effect, I am delighted with the appointment of Sally Johnson. My fellow Board members and I aim to further support the talent pipeline. You can read more about our employee engagement and talent initiatives in the Governance sections which begins on p51
The world’s learning company
Our purpose is to empower people to progress in their lives through learning. Our vision is to enable that to happen through a direct relationship with tens of millions of learners who we will support through a lifetime of learning, helping them link their education to better employment. We will be able to play that role because of the world-class capabilities we bring to bear, and the ways in which we combine them to achieve better learning outcomes.
The Board remains confident about Pearson’s longer-term prospects and resilience to near term challenges and we are excited about the opportunities to build shareholder value through the delivery of profitable growth and strong cash generation, while continuing to invest for the future.
I look forward to seeing you in the coming year and thank you for your ongoing support.
Sidney Taurel Chair
2019 2018
Digital 36% 34%
Digitally-enabled 30% 28%
Non-digital 34% 38%
1 Excludes WSE and US K12 Courseware.
Pearson digital revenue1
66%Digital
Digitally enabled
Non-digital
Pearson digital revenue* 2019 vs 2018
2019 2018
62%
Progress over the last three years
2019 2018 2017
Adjusted operating profit £581m £546m £576m
Dividend per share 19.5p 18.5p 17p
Net debt £1,016m £143m £432m
This includes the impact of IFRS 16. Excluding this, and on a like for like basis, 2019 net debt is £374m.
05Overview Strategy Performance Governance Financial statements Other information
Chief Executive’s strategic overview
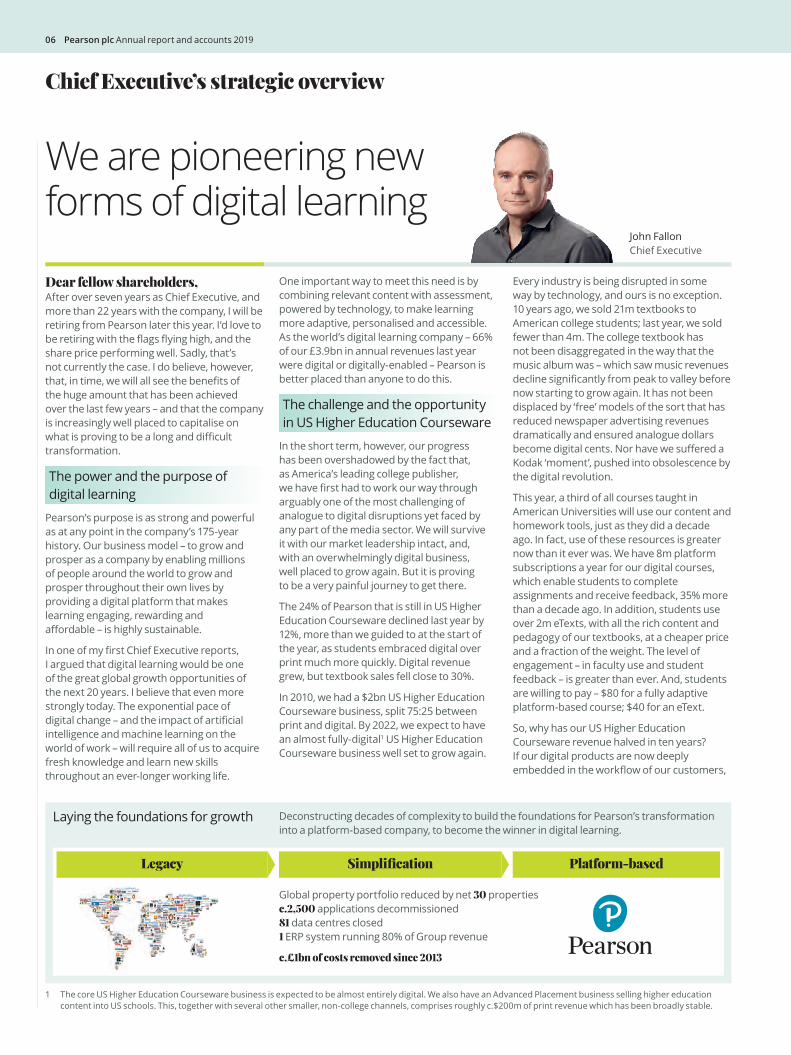
We are pioneering new forms of digital learning
John Fallon Chief Executive
Dear fellow shareholders,After over seven years as Chief Executive, and more than 22 years with the company, I will be retiring from Pearson later this year. I’d love to be retiring with the flags flying high, and the share price performing well. Sadly, that’s not currently the case. I do believe, however, that, in time, we will all see the benefits of the huge amount that has been achieved over the last few years – and that the company is increasingly well placed to capitalise on what is proving to be a long and difficult transformation.
The power and the purpose of digital learning
Pearson’s purpose is as strong and powerful as at any point in the company’s 175-year history. Our business model – to grow and prosper as a company by enabling millions of people around the world to grow and prosper throughout their own lives by providing a digital platform that makes learning engaging, rewarding and affordable – is highly sustainable.
In one of my first Chief Executive reports, I argued that digital learning would be one of the great global growth opportunities of the next 20 years. I believe that even more strongly today. The exponential pace of digital change – and the impact of artificial intelligence and machine learning on the world of work – will require all of us to acquire fresh knowledge and learn new skills throughout an ever-longer working life.
One important way to meet this need is by combining relevant content with assessment, powered by technology, to make learning more adaptive, personalised and accessible. As the world’s digital learning company – 66% of our £3.9bn in annual revenues last year were digital or digitally-enabled – Pearson is better placed than anyone to do this.
The challenge and the opportunity in US Higher Education Courseware
In the short term, however, our progress has been overshadowed by the fact that, as America’s leading college publisher, we have first had to work our way through arguably one of the most challenging of analogue to digital disruptions yet faced by any part of the media sector. We will survive it with our market leadership intact, and, with an overwhelmingly digital business, well placed to grow again. But it is proving to be a very painful journey to get there.
The 24% of Pearson that is still in US Higher Education Courseware declined last year by 12%, more than we guided to at the start of the year, as students embraced digital over print much more quickly. Digital revenue grew, but textbook sales fell close to 30%.
In 2010, we had a $2bn US Higher Education Courseware business, split 75:25 between print and digital. By 2022, we expect to have an almost fully-digital1 US Higher Education Courseware business well set to grow again.
Every industry is being disrupted in some way by technology, and ours is no exception. 10 years ago, we sold 21m textbooks to American college students; last year, we sold fewer than 4m. The college textbook has not been disaggregated in the way that the music album was – which saw music revenues decline significantly from peak to valley before now starting to grow again. It has not been displaced by ‘free’ models of the sort that has reduced newspaper advertising revenues dramatically and ensured analogue dollars become digital cents. Nor have we suffered a Kodak ‘moment’, pushed into obsolescence by the digital revolution.
This year, a third of all courses taught in American Universities will use our content and homework tools, just as they did a decade ago. In fact, use of these resources is greater now than it ever was. We have 8m platform subscriptions a year for our digital courses, which enable students to complete assignments and receive feedback, 35% more than a decade ago. In addition, students use over 2m eTexts, with all the rich content and pedagogy of our textbooks, at a cheaper price and a fraction of the weight. The level of engagement – in faculty use and student feedback – is greater than ever. And, students are willing to pay – $80 for a fully adaptive platform-based course; $40 for an eText.
So, why has our US Higher Education Courseware revenue halved in ten years? If our digital products are now deeply embedded in the workflow of our customers,
1 The core US Higher Education Courseware business is expected to be almost entirely digital. We also have an Advanced Placement business selling higher education content into US schools. This, together with several other smaller, non-college channels, comprises roughly c.$200m of print revenue which has been broadly stable.
06 Pearson plc Annual report and accounts 2019
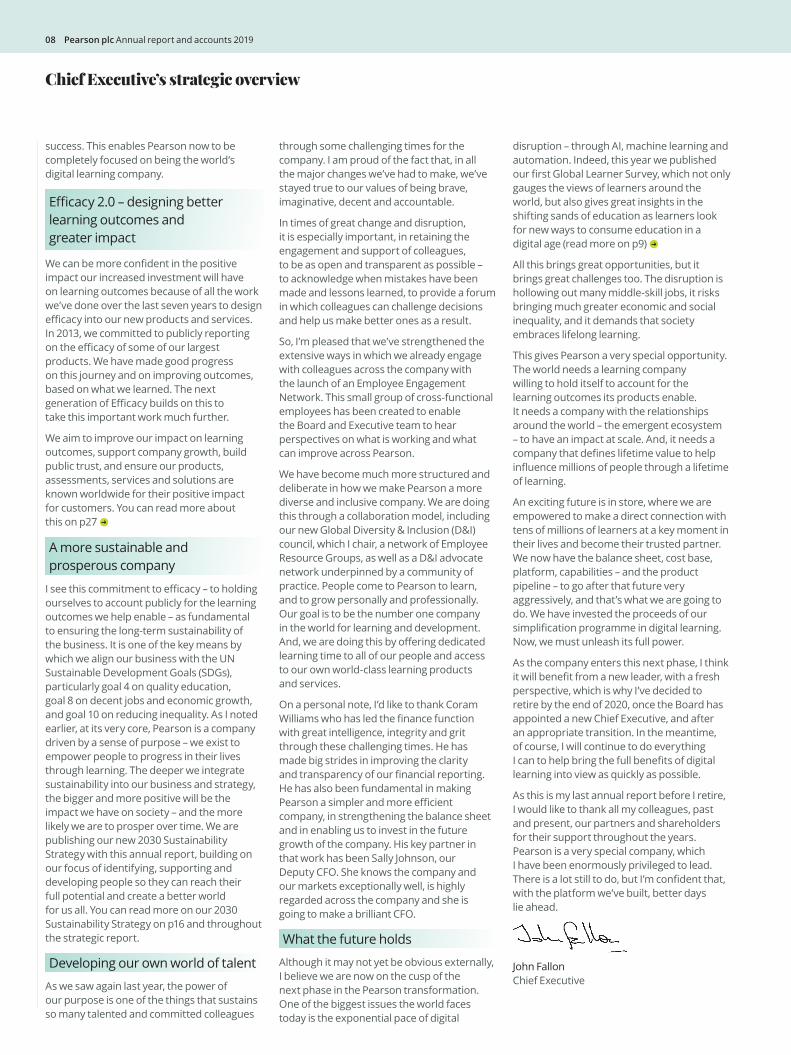
Legacy Platform-basedSimplification
Laying the foundations for growth
Global property portfolio reduced by net 30 propertiesc.2,500 applications decommissioned81 data centres closed1 ERP system running 80% of Group revenue
c.£1bn of costs removed since 2013
Deconstructing decades of complexity to build the foundations for Pearson’s transformation into a platform-based company, to become the winner in digital learning.
shouldn’t we have largely seen print migrate to digital on an orderly 1:1 basis? The answer lies in a number of factors that are specific to this market. Whilst professors decide what courseware to adopt, it is the students who buy them. This means that many of our sales go through thousands of campus stores, as well as through Amazon and specialist online retailers. And, whilst the physical textbook has an edition cycle of three to five years, a student often needs it for no more than a single four-month semester.
These market conditions proved fertile for the emergence of a highly disruptive trend – a large secondary market in the analogue product, the print textbook, enabled by technology. College textbooks have been bought and sold second-hand for decades. What technology changed was the nature of it: from some students selling back their books to the campus store at the end of the semester, to most students choosing to rent on a term-by-term basis. And, the scale of it: in 2010, the secondary market was a fraction of the size of the primary one; by last year, it had overtaken it.
Salvation rests in our own hands. The disruption has come to the analogue past, not the digital future, of US Higher Education Courseware. The future of learning will be digital, and consumer-defined. Experience, outcomes and affordability will all matter. The new Pearson Learning Platform – on which we are now launching our first products – will be the platform on which this future of learning will be built. It will enable engaging, immersive, learning experiences, that are personalised, diagnostic and adaptive. It will be fast, flexible and secure, enabling better learning outcomes at lower prices. A digital-first approach to updating features, content and tools – made for the benefit of the teacher and the learner, so the digital product is never out of date. A digital-first approach to pricing, in which students share in the financial benefits of a much more scalable, platform-based model.
Building on those 8m platform subscriptions, and 2m eTexts, Pearson will be well placed to start to regain share from secondary sales of its own textbooks – and do it in a sustainable and purposeful way.
A simpler, more efficient company
For many years, Pearson as a whole was overly dependent for profits from the US Higher Education Courseware business. The fact that we’ve been able to survive disruption on this scale is due to all that we have done to make Pearson as a whole a
much simpler, more efficient and modern company. Over the last six years, we’ve reduced the cost base by around £1bn, and headcount by around 20,000, due to divestitures and restructuring. We’ve decommissioned around 2,500 applications, closed 81 data centres, and implemented 16 new global, scalable, cloud-based platforms. 80% of the company runs on one ERP system today – which includes our major businesses in the US, UK and Canada. We plan to start the roll out across further markets in 2020.
As a result, benchmarking the costs of running Pearson against other large companies, we are now much more efficient than we were a few years ago. It will take some time yet to fully bed in all these new systems but, as we do so, they will give us the ability to both achieve further efficiencies and provide the data by which we can engage more deeply with our learners and support them at key moments of learning throughout their lives.
Investment, innovation and growth
As a simpler, more efficient company, we are able to invest more organically – significantly more than we were investing five years ago – and we’re starting to see the benefits. In spite of those ongoing challenges in US Higher Education Courseware, in 2019, Pearson as a whole was able to match prior year underlying sales for the first time since 2014. That’s because the broader 76% of Pearson grew by 4% in aggregate. Our growth businesses – Pearson VUE, Virtual Schools, OPM and PTE Academic – grew by 8%. We also performed well across our wider assessment and courseware businesses, where the majority have stabilised or grown.
Innovation and investment have come in many forms across the company in the last year:
We launched Aida, the world’s first AI-inspired calculus app to help maths students across the globe to apply calculus into the real world, breaking the unseen barrier to STEM (Science, Technology, English and Maths) careers.
We exported our highly regarded UK vocational qualifications overseas through our work growing the BTEC brand in markets such as the UAE, Turkey and Sri Lanka.
We supported the Egyptian government to digitally transform its national assessment system for high school students – Pearson’s biggest assessment commercial agreement by test volume to date.
We developed a commercial agreement with the UK Home Office for the UK Secure
English Language Test (SELT), which will drive future growth in our English business.
We agreed a partnership with Oxford University to offer new short courses for learners.
These growth businesses will continue to grow in 2020, as we invest in new forms of online education, in better, smarter, online assessments, in new AI-inspired direct-to-learner apps, and in shifting Pearson’s focus to link education and employability with the workplace.
This shift will be helped by a small, bolt-on acquisition – Lumerit Education – we made last year, our first in five years. You can read a case study on Lumerit Education in the Governance report on p61. Lumerit Education helps address the issues of college degree completion and affordability. It uses data and analytics to match learner profiles to academic programmes and will support the growth of our nascent ‘Accelerated Pathways’ business. Accelerated Pathways works with major corporates to maximise the value of their employee tuition assistance programmes and offer education as an employee benefit, which we see as a major new growth opportunity.
A second small acquisition – Smart Sparrow, an ed-tech company which specialises in the creation of rich, interactive content – will help our Pearson eText to become much more of an engaging, interactive and personalised learning experience. The strength of our balance sheet – which our CFO, Coram Williams, talks about on p30 – means that we are able to complement increased organic investment with bolt-on acquisitions that enable us to expand into faster-growing markets more quickly. And, the work we’ve done to simplify the company means we can now integrate these acquisitions much more quickly and seamlessly.
A fully-focused learning company
For almost 50 years, Pearson has been proud to play our part in the publishing and commercial success of first Penguin, and then more recently Penguin Random House. At the end of 2019, we announced that we are planning to sell our remaining 25% stake to our partner, Bertelsmann, for approximately $675m, which is expected to close in the first half of 2020. Using the proceeds, we launched a £350m share buyback programme in early 2020. Our total stake in Penguin Random House has generated c.£1.9bn in net disposal proceeds and dividends for Pearson. We know the company is in good hands and we wish our colleagues and authors every future
07Overview Strategy Performance Governance Financial statements Other information
Chief Executive’s strategic overview
success. This enables Pearson now to be completely focused on being the world’s digital learning company.
Efficacy 2.0 – designing better learning outcomes and greater impact
We can be more confident in the positive impact our increased investment will have on learning outcomes because of all the work we’ve done over the last seven years to design efficacy into our new products and services. In 2013, we committed to publicly reporting on the efficacy of some of our largest products. We have made good progress on this journey and on improving outcomes, based on what we learned. The next generation of Efficacy builds on this to take this important work much further.
We aim to improve our impact on learning outcomes, support company growth, build public trust, and ensure our products, assessments, services and solutions are known worldwide for their positive impact for customers. You can read more about this on p27
A more sustainable and prosperous company
I see this commitment to efficacy – to holding ourselves to account publicly for the learning outcomes we help enable – as fundamental to ensuring the long-term sustainability of the business. It is one of the key means by which we align our business with the UN Sustainable Development Goals (SDGs), particularly goal 4 on quality education, goal 8 on decent jobs and economic growth, and goal 10 on reducing inequality. As I noted earlier, at its very core, Pearson is a company driven by a sense of purpose – we exist to empower people to progress in their lives through learning. The deeper we integrate sustainability into our business and strategy, the bigger and more positive will be the impact we have on society – and the more likely we are to prosper over time. We are publishing our new 2030 Sustainability Strategy with this annual report, building on our focus of identifying, supporting and developing people so they can reach their full potential and create a better world for us all. You can read more on our 2030 Sustainability Strategy on p16 and throughout the strategic report.
Developing our own world of talent
As we saw again last year, the power of our purpose is one of the things that sustains so many talented and committed colleagues
through some challenging times for the company. I am proud of the fact that, in all the major changes we’ve had to make, we’ve stayed true to our values of being brave, imaginative, decent and accountable.
In times of great change and disruption, it is especially important, in retaining the engagement and support of colleagues, to be as open and transparent as possible – to acknowledge when mistakes have been made and lessons learned, to provide a forum in which colleagues can challenge decisions and help us make better ones as a result.
So, I’m pleased that we’ve strengthened the extensive ways in which we already engage with colleagues across the company with the launch of an Employee Engagement Network. This small group of cross-functional employees has been created to enable the Board and Executive team to hear perspectives on what is working and what can improve across Pearson.
We have become much more structured and deliberate in how we make Pearson a more diverse and inclusive company. We are doing this through a collaboration model, including our new Global Diversity & Inclusion (D&I) council, which I chair, a network of Employee Resource Groups, as well as a D&I advocate network underpinned by a community of practice. People come to Pearson to learn, and to grow personally and professionally. Our goal is to be the number one company in the world for learning and development. And, we are doing this by offering dedicated learning time to all of our people and access to our own world-class learning products and services.
On a personal note, I’d like to thank Coram Williams who has led the finance function with great intelligence, integrity and grit through these challenging times. He has made big strides in improving the clarity and transparency of our financial reporting. He has also been fundamental in making Pearson a simpler and more efficient company, in strengthening the balance sheet and in enabling us to invest in the future growth of the company. His key partner in that work has been Sally Johnson, our Deputy CFO. She knows the company and our markets exceptionally well, is highly regarded across the company and she is going to make a brilliant CFO.
What the future holds
Although it may not yet be obvious externally, I believe we are now on the cusp of the next phase in the Pearson transformation. One of the biggest issues the world faces today is the exponential pace of digital
disruption – through AI, machine learning and automation. Indeed, this year we published our first Global Learner Survey, which not only gauges the views of learners around the world, but also gives great insights in the shifting sands of education as learners look for new ways to consume education in a digital age (read more on p9)
All this brings great opportunities, but it brings great challenges too. The disruption is hollowing out many middle-skill jobs, it risks bringing much greater economic and social inequality, and it demands that society embraces lifelong learning.
This gives Pearson a very special opportunity. The world needs a learning company willing to hold itself to account for the learning outcomes its products enable. It needs a company with the relationships around the world – the emergent ecosystem – to have an impact at scale. And, it needs a company that defines lifetime value to help influence millions of people through a lifetime of learning.
An exciting future is in store, where we are empowered to make a direct connection with tens of millions of learners at a key moment in their lives and become their trusted partner. We now have the balance sheet, cost base, platform, capabilities – and the product pipeline – to go after that future very aggressively, and that’s what we are going to do. We have invested the proceeds of our simplification programme in digital learning. Now, we must unleash its full power.
As the company enters this next phase, I think it will benefit from a new leader, with a fresh perspective, which is why I’ve decided to retire by the end of 2020, once the Board has appointed a new Chief Executive, and after an appropriate transition. In the meantime, of course, I will continue to do everything I can to help bring the full benefits of digital learning into view as quickly as possible.
As this is my last annual report before I retire, I would like to thank all my colleagues, past and present, our partners and shareholders for their support throughout the years. Pearson is a very special company, which I have been enormously privileged to lead. There is a lot still to do, but I’m confident that, with the platform we’ve built, better days lie ahead.
John Fallon Chief Executive
08 Pearson plc Annual report and accounts 2019

Trends shaping our market
of workers in the UK have found themselves in need of upskilling or retraining in the last two years.
of workers in the US have found themselves in need of upskilling or retraining in the last two years.
2/3rds
or more of people in China, Brazil, Hispano-America and India have identified the need to upskill or retrain and are doing so.
1/41/3
68%
Half of Gen Z in the US, UK and Australia think you can be successful without a traditional college educationDespite statistics showing higher lifetime earnings with a college degree…
of Gen Z learners think you can do ‘ok’ in life without it.
Lifelong learning is not just a philosophy, it’s the new reality
Globally, there is wide agreement that people need to keep learning throughout their career to stay up-to-date in their careers.
of learners think you can do just as well with an education from a vocational or trade school.
China, India, Brazil and Hispano America are outpacing the US and UK in the upskilling race and defining a new global economy More than anywhere else in the world, people in these markets believe education is driving the global economy.
In September 2019, we released the results of our inaugural Global Learner Survey, the first of its kind study that gauges the opinions of learners worldwide. This new study captured the collective voice of 11,000 learners in 19 countries to get a full picture on how people are learning. The findings show that now, more than ever, people are taking charge of their education, and technology matters.
51% 53%in the US in the UK
In the next decade, digital and virtual learning will be the new normal
believe more primary and secondary students will too.
67%76%of people believe that more college students will be attending school virtually within 10 years.
Expectations of online learning Expectations of AI
believe that AI will have a positive impact on education.
c.70% 90%in the US, UK
& Europein China
Global Learner Survey
09Overview Strategy Performance Governance Financial statements Other information
Our values are brave, imaginative, decent and accountable We are the world’s learning company
Advance equity in learning
Build skills for sustainable futures
Lead by example
Our 2030 Sustainability Strategy
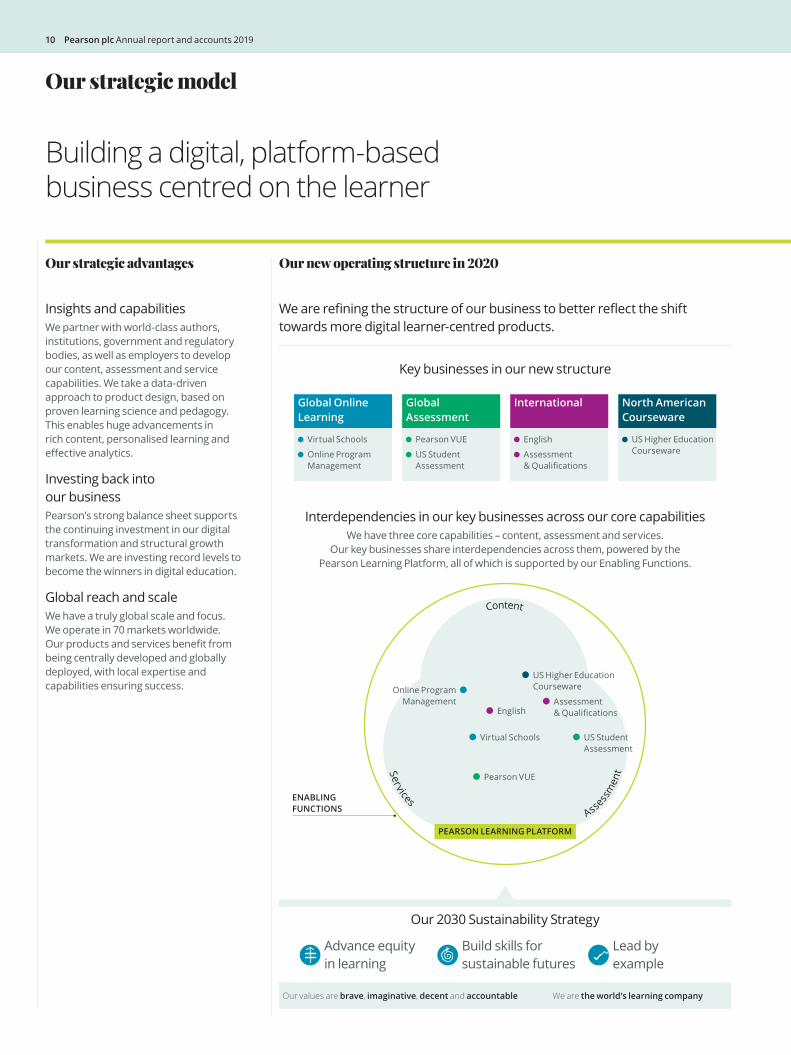
Our strategic model
Key businesses in our new structure
Global Online Learning
Global Assessment
International North American Courseware
Interdependencies in our key businesses across our core capabilitiesWe have three core capabilities – content, assessment and services.
Our key businesses share interdependencies across them, powered by the Pearson Learning Platform, all of which is supported by our Enabling Functions.
Content
ServicesAsse
ssm
ent
US Higher Education Courseware
Virtual Schools
Online Program Management
Pearson VUE
US Student Assessment
English Assessment & Qualifications
Virtual Schools
Online Program Management
Pearson VUE
US Student Assessment
English
�Assessment��&�Qualifications
�US�Higher�Education�Courseware
ENABLING FUNCTIONS
PEARSON LEARNING PLATFORM
Building a digital, platform-based business centred on the learner
Our new operating structure in 2020Our strategic advantages
Insights and capabilitiesWe partner with world-class authors, institutions, government and regulatory bodies, as well as employers to develop our content, assessment and service capabilities. We take a data-driven approach to product design, based on proven learning science and pedagogy. This enables huge advancements in rich content, personalised learning and effective analytics.
Investing back into our businessPearson’s strong balance sheet supports the continuing investment in our digital transformation and structural growth markets. We are investing record levels to become the winners in digital education.
Global reach and scaleWe have a truly global scale and focus. We operate in 70 markets worldwide. Our products and services benefit from being centrally developed and globally deployed, with local expertise and capabilities ensuring success.
We are refining the structure of our business to better reflect the shift towards more digital learner-centred products.
10 Pearson plc Annual report and accounts 2019
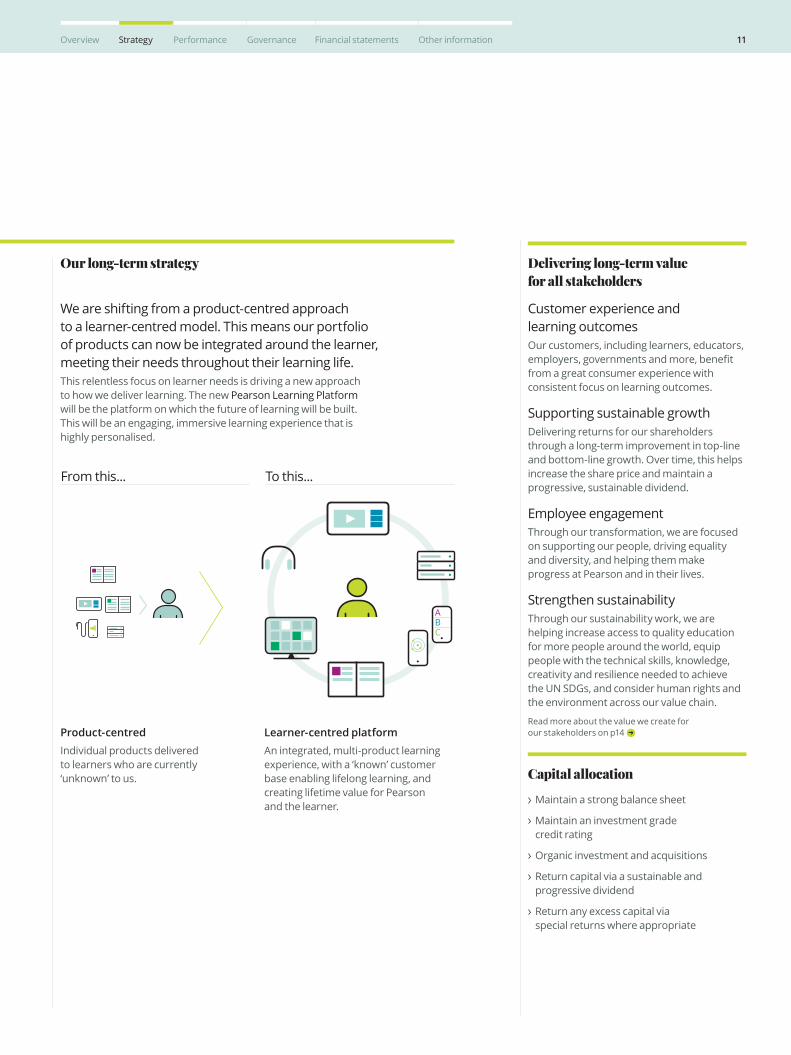
We are shifting from a product-centred approach to a learner-centred model. This means our portfolio of products can now be integrated around the learner, meeting their needs throughout their learning life. This relentless focus on learner needs is driving a new approach to how we deliver learning. The new Pearson Learning Platform will be the platform on which the future of learning will be built. This will be an engaging, immersive learning experience that is highly personalised.
Our long-term strategy
Customer experience and learning outcomesOur customers, including learners, educators, employers, governments and more, benefit from a great consumer experience with consistent focus on learning outcomes.
Supporting sustainable growthDelivering returns for our shareholders through a long-term improvement in top-line and bottom-line growth. Over time, this helps increase the share price and maintain a progressive, sustainable dividend.
Employee engagementThrough our transformation, we are focused on supporting our people, driving equality and diversity, and helping them make progress at Pearson and in their lives.
Strengthen sustainabilityThrough our sustainability work, we are helping increase access to quality education for more people around the world, equip people with the technical skills, knowledge, creativity and resilience needed to achieve the UN SDGs, and consider human rights and the environment across our value chain.
Read more about the value we create for our stakeholders on p14
Delivering long-term value for all stakeholders
Maintain a strong balance sheet
Maintain an investment grade credit rating
Organic investment and acquisitions
Return capital via a sustainable and progressive dividend
Return any excess capital via special returns where appropriate
Capital allocation
Product-centredIndividual products delivered to learners who are currently ‘unknown’ to us.
Learner-centred platformAn integrated, multi-product learning experience, with a ‘known’ customer base enabling lifelong learning, and creating lifetime value for Pearson and the learner.
ABC
From this... To this...
11Overview Strategy Performance Governance Financial statements Other information
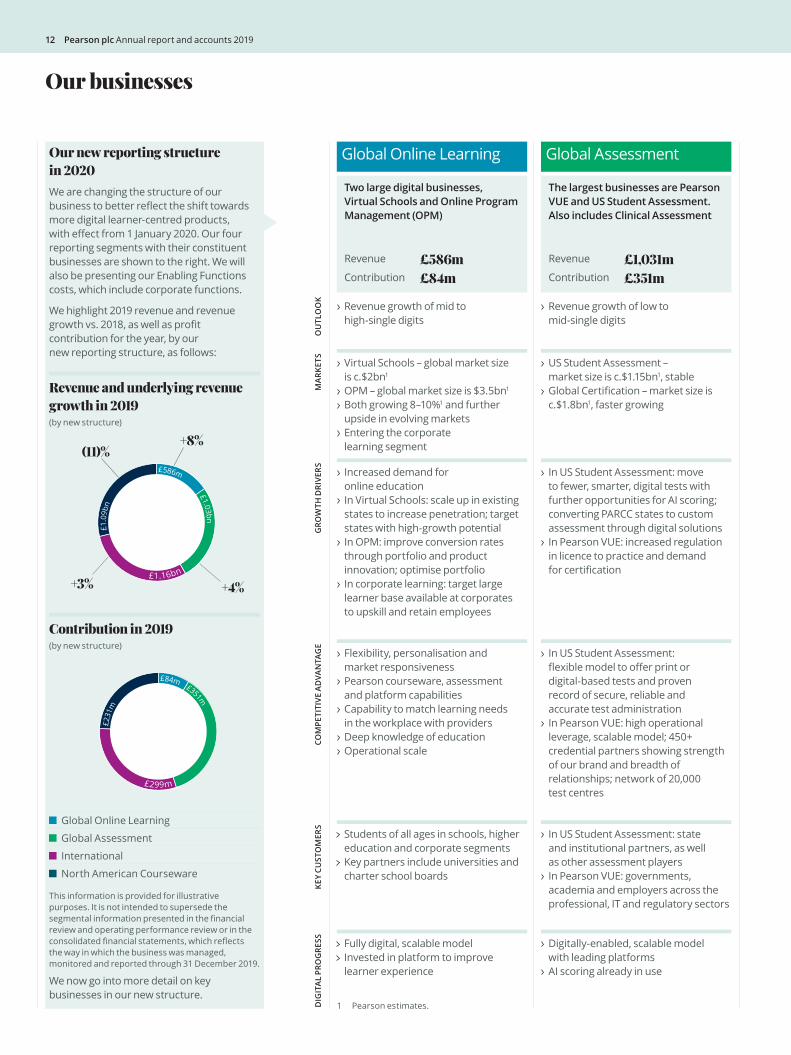
Our new reporting structure in 2020We are changing the structure of our business to better reflect the shift towards more digital learner-centred products, with effect from 1 January 2020. Our four reporting segments with their constituent businesses are shown to the right. We will also be presenting our Enabling Functions costs, which include corporate functions.
We highlight 2019 revenue and revenue growth vs. 2018, as well as profit contribution for the year, by our new reporting structure, as follows:
Our businesses
Global Online Learning Global Assessment
Two large digital businesses, Virtual Schools and Online Program Management (OPM)
The largest businesses are Pearson VUE and US Student Assessment. Also includes Clinical Assessment
Revenue Revenue
Contribution Contribution£586m £1,031m£84m £351m
Contribution in 2019 (by new structure)
Global Online Learning
Global Assessment
International
North American Courseware
Revenue and underlying revenue growth in 2019(by new structure)
+8%
+4%+3%
(11)%
This information is provided for illustrative purposes. It is not intended to supersede the segmental information presented in the financial review and operating performance review or in the consolidated financial statements, which reflects the way in which the business was managed, monitored and reported through 31 December 2019.
We now go into more detail on key businesses in our new structure.
£84m £351m
£231
m
£299m
£586m
£1.03bn
£1.0
9bn
£1.16bn
KEY
CUST
OM
ERS
Students of all ages in schools, higher education and corporate segments
Key partners include universities and charter school boards
In US Student Assessment: state and institutional partners, as well as other assessment players
In Pearson VUE: governments, academia and employers across the professional, IT and regulatory sectors
DIG
ITA
L PR
OG
RESS Fully digital, scalable model
Invested in platform to improve learner experience
Digitally-enabled, scalable model with leading platforms
AI scoring already in use
COM
PETI
TIVE
AD
VAN
TAG
E
Flexibility, personalisation and market responsiveness
Pearson courseware, assessment and platform capabilities
Capability to match learning needs in the workplace with providers
Deep knowledge of education Operational scale
In US Student Assessment: flexible model to offer print or digital-based tests and proven record of secure, reliable and accurate test administration
In Pearson VUE: high operational leverage, scalable model; 450+ credential partners showing strength of our brand and breadth of relationships; network of 20,000 test centres
OU
TLO
OK
Revenue growth of mid to high-single digits
Revenue growth of low to mid-single digits
Increased demand for online education
In Virtual Schools: scale up in existing states to increase penetration; target states with high-growth potential
In OPM: improve conversion rates through portfolio and product innovation; optimise portfolio
In corporate learning: target large learner base available at corporates to upskill and retain employees
In US Student Assessment: move to fewer, smarter, digital tests with further opportunities for AI scoring; converting PARCC states to custom assessment through digital solutions
In Pearson VUE: increased regulation in licence to practice and demand for certification
GRO
WTH
DRI
VER
SM
ARK
ETS
Virtual Schools – global market size is c.$2bn1
OPM – global market size is $3.5bn1
Both growing 8–10%1 and further upside in evolving markets
Entering the corporate learning segment
US Student Assessment – market size is c.$1.15bn1, stable
Global Certification – market size is c.$1.8bn1, faster growing
1 Pearson estimates.
12 Pearson plc Annual report and accounts 2019
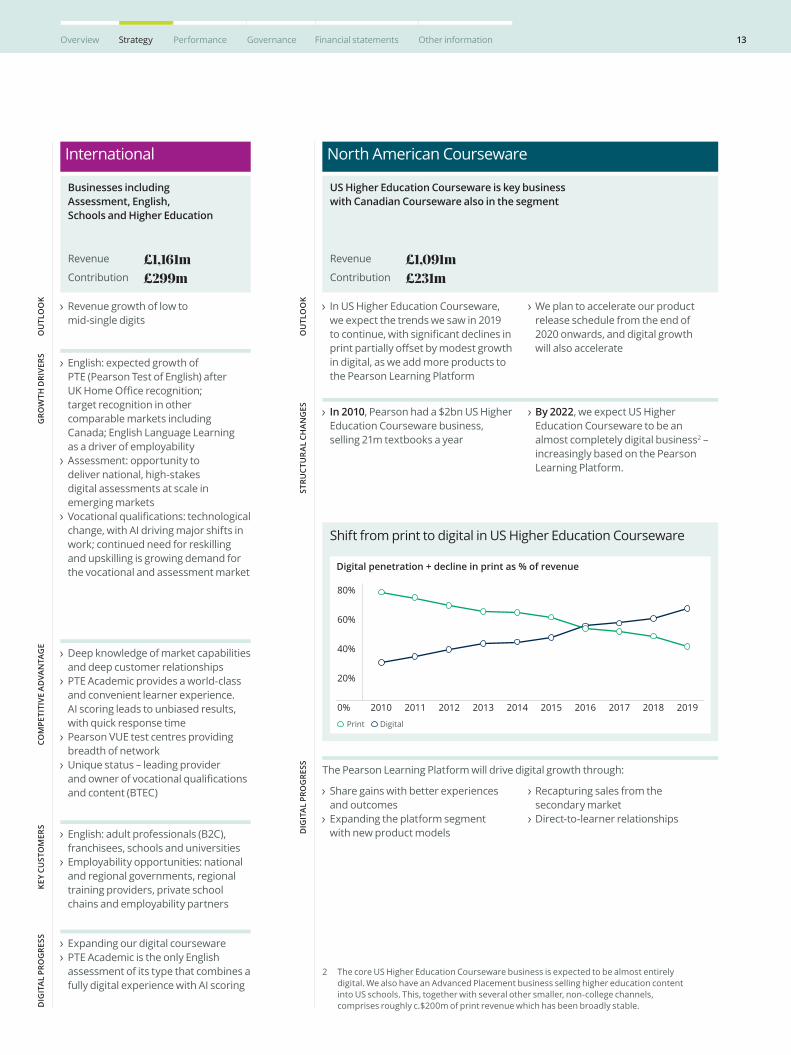
International North American Courseware
Businesses including Assessment, English, Schools and Higher Education
US Higher Education Courseware is key business with Canadian Courseware also in the segment
Shift from print to digital in US Higher Education Courseware
Revenue Revenue
Contribution Contribution£1,161m £1,091m£299m £231m
OU
TLO
OK
STRU
CTU
RA
L CH
AN
GES
DIG
ITA
L PR
OG
RESS
In US Higher Education Courseware, we expect the trends we saw in 2019 to continue, with significant declines in print partially offset by modest growth in digital, as we add more products to the Pearson Learning Platform
We plan to accelerate our product release schedule from the end of 2020 onwards, and digital growth will also accelerate
In 2010, Pearson had a $2bn US Higher Education Courseware business, selling 21m textbooks a year
By 2022, we expect US Higher Education Courseware to be an almost completely digital business2 – increasingly based on the Pearson Learning Platform.
The Pearson Learning Platform will drive digital growth through:
Share gains with better experiences and outcomes
Expanding the platform segment with new product models
Recapturing sales from the secondary market
Direct-to-learner relationships
Digital penetration + decline in print as % of revenue
Print Digital
0%
20%
40%
60%
80%
2019201820172016201520142013201220112010
KEY
CUST
OM
ERS
English: adult professionals (B2C), franchisees, schools and universities
Employability opportunities: national and regional governments, regional training providers, private school chains and employability partners
DIG
ITA
L PR
OG
RESS Expanding our digital courseware
PTE Academic is the only English assessment of its type that combines a fully digital experience with AI scoring
COM
PETI
TIVE
AD
VAN
TAG
E
Deep knowledge of market capabilities and deep customer relationships
PTE Academic provides a world-class and convenient learner experience. AI scoring leads to unbiased results, with quick response time
Pearson VUE test centres providing breadth of network
Unique status – leading provider and owner of vocational qualifications and content (BTEC)
OU
TLO
OK
Revenue growth of low to mid-single digits
English: expected growth of PTE (Pearson Test of English) after UK Home Office recognition; target recognition in other comparable markets including Canada; English Language Learning as a driver of employability
Assessment: opportunity to deliver national, high-stakes digital assessments at scale in emerging markets
Vocational qualifications: technological change, with AI driving major shifts in work; continued need for reskilling and upskilling is growing demand for the vocational and assessment market
GRO
WTH
DRI
VER
S
2 The core US Higher Education Courseware business is expected to be almost entirely digital. We also have an Advanced Placement business selling higher education content into US schools. This, together with several other smaller, non-college channels, comprises roughly c.$200m of print revenue which has been broadly stable.
13Overview Strategy Performance Governance Financial statements Other information
Creating value for our stakeholders
In a digital world, we are a driving force behind change. Our focus is on providing better access, affordability and learning outcomes
Learners Employees Shareholders
88%of people globally agree that education doesn’t stop at college/university and believe that you need to keep learning to stay relevant in your career
2Employee Engagement Network meetings connecting employees with the Board
477investor meetings with
284 institutions in 2019
Pearson helps tens of millions of learners across the world make progress in their lives.
Our purpose-driven employees are key to the sustainable success of Pearson.
We have a broad range of investors who entrust their capital with us.
We regularly gauge the views of learners to understand how people are incorporating learning into their lives beyond the traditional classroom. This enables us to put learners at the centre of what we do, build world-class digital products delivering amazing experiences, and help people to learn and thrive in the talent economy.
We are focused on creating a healthier company, encouraging and enabling more people to progress. We are working to develop talent, drive more diversity, ensure greater employee engagement, drive innovation, support accessibility and inclusion efforts, and improve best practice sharing across Pearson.
We engage with our investors on an ongoing basis. We communicate with them regularly, including at our financial results, our AGM and at investor meetings and conferences around the globe.
Our inaugural Global Learner Survey shows that around the world education is still highly valued. But, people are redefining when, how and what they learn, relying less on traditional institutions and adopting a do-it-yourself approach, learning on their own terms.
Our people want better tools to help them manage more effectively and develop their own careers. They want to feel more closely connected to leadership, be supported through our digital transformation and have more access to Pearson’s products and services.
Our shareholder base has a diverse range of views covering financial, environmental and ESG-related issues.
We are helping meet learners’ needs through working with institutions, employers and governments to increase options for virtual learning, online degrees, stackable credentials for adults and on-demand learning for everyone. See the strategy section on p10 for more about how we are becoming a learner-centric business.
In 2019, we introduced a more flexible approach to performance management, developed a new behaviours framework, and launched ‘Managers’ Corner’ to help managers guide their teams better. We created our first Employee Engagement Network and launched ‘Pearson Products for Pearson People’ as part of our commitment to help our employees prosper. See how this approach helps create long term value in our strategy section on p10
We have a positive, ongoing dialogue with our shareholder base. We aim to deliver long-term sustainable value for our investors and all our company stakeholders. We also respond to surveys and questionnaires to provide information about our ESG practices.
STA
KEH
OLD
ER G
ROU
PH
OW
WE
SERV
E &
EN
GAG
EKE
Y CO
NCE
RNS
OU
R RE
SPO
NSE
Read more on our interconnected approach to stakeholder engagement, and how the Board engages with our stakeholders, in the Governance report, on p62
Education is evolving to meet the changing demands of today’s learners. In a digital world, we are a driving force behind that change. This enables us to create long-term sustainable growth for our investors and all stakeholders of the company.
For Pearson, engaging with stakeholders always takes place through the lens of sustainability, which informs and influences our approach across our global operations. In order to ensure that our new 2030 Sustainability Strategy is focused on the areas that are most important to our stakeholders, an Engagement Strategy was a cornerstone of the process. Read more on p16
14 Pearson plc Annual report and accounts 2019
Employers Governments & Regulators
Business PartnersEducational Institutions & Educators
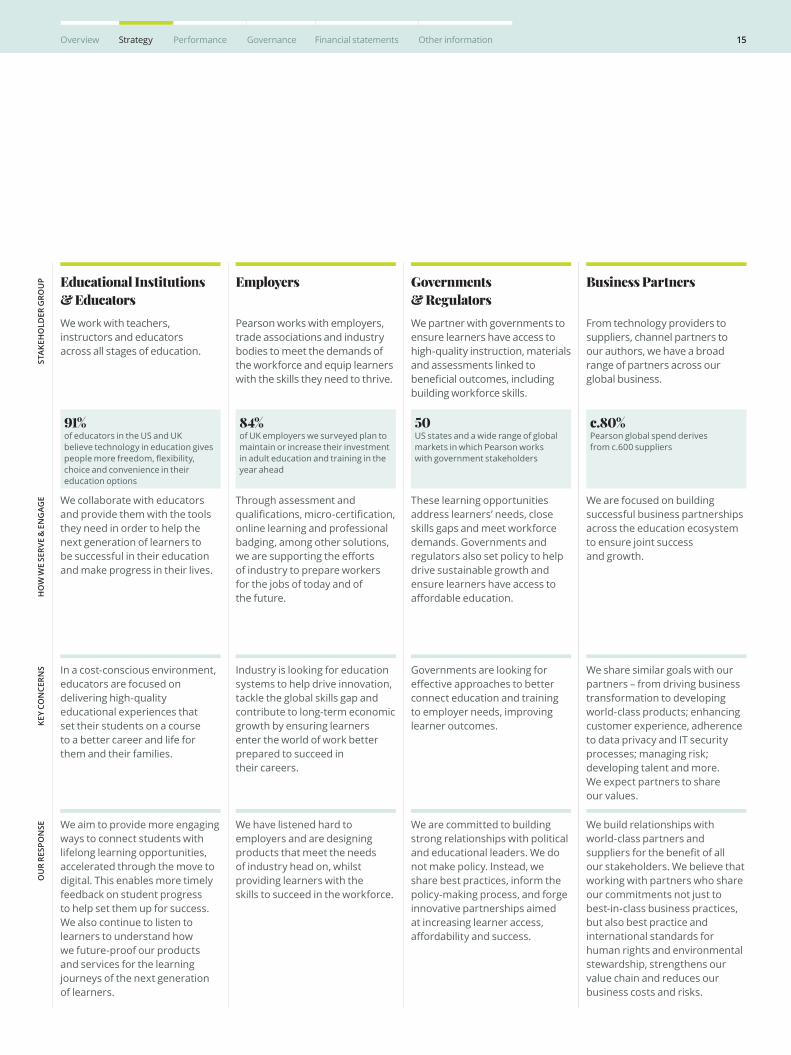
91%of educators in the US and UK believe technology in education gives people more freedom, flexibility, choice and convenience in their education options
84%of UK employers we surveyed plan to maintain or increase their investment in adult education and training in the year ahead
50 US states and a wide range of global markets in which Pearson works with government stakeholders
c.80% Pearson global spend derives from c.600 suppliers
We work with teachers, instructors and educators across all stages of education.
Pearson works with employers, trade associations and industry bodies to meet the demands of the workforce and equip learners with the skills they need to thrive.
We partner with governments to ensure learners have access to high-quality instruction, materials and assessments linked to beneficial outcomes, including building workforce skills.
From technology providers to suppliers, channel partners to our authors, we have a broad range of partners across our global business.
We collaborate with educators and provide them with the tools they need in order to help the next generation of learners to be successful in their education and make progress in their lives.
Through assessment and qualifications, micro-certification, online learning and professional badging, among other solutions, we are supporting the efforts of industry to prepare workers for the jobs of today and of the future.
These learning opportunities address learners’ needs, close skills gaps and meet workforce demands. Governments and regulators also set policy to help drive sustainable growth and ensure learners have access to affordable education.
We are focused on building successful business partnerships across the education ecosystem to ensure joint success and growth.
In a cost-conscious environment, educators are focused on delivering high-quality educational experiences that set their students on a course to a better career and life for them and their families.
Industry is looking for education systems to help drive innovation, tackle the global skills gap and contribute to long-term economic growth by ensuring learners enter the world of work better prepared to succeed in their careers.
Governments are looking for effective approaches to better connect education and training to employer needs, improving learner outcomes.
We share similar goals with our partners – from driving business transformation to developing world-class products; enhancing customer experience, adherence to data privacy and IT security processes; managing risk; developing talent and more. We expect partners to share our values.
We aim to provide more engaging ways to connect students with lifelong learning opportunities, accelerated through the move to digital. This enables more timely feedback on student progress to help set them up for success. We also continue to listen to learners to understand how we future-proof our products and services for the learning journeys of the next generation of learners.
We have listened hard to employers and are designing products that meet the needs of industry head on, whilst providing learners with the skills to succeed in the workforce.
We are committed to building strong relationships with political and educational leaders. We do not make policy. Instead, we share best practices, inform the policy-making process, and forge innovative partnerships aimed at increasing learner access, affordability and success.
We build relationships with world-class partners and suppliers for the benefit of all our stakeholders. We believe that working with partners who share our commitments not just to best-in-class business practices, but also best practice and international standards for human rights and environmental stewardship, strengthens our value chain and reduces our business costs and risks.
STA
KEH
OLD
ER G
ROU
PH
OW
WE
SERV
E &
EN
GAG
EO
UR
RESP
ON
SEKE
Y CO
NCE
RNS
15Overview Strategy Performance Governance Financial statements Other information
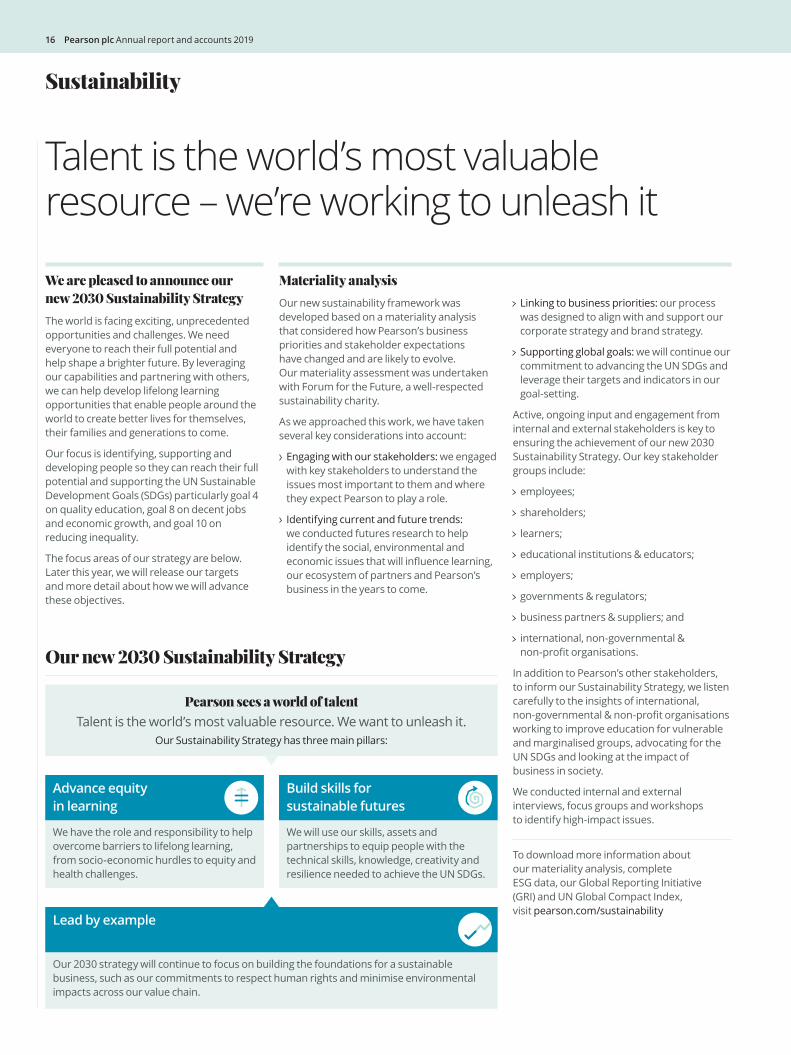
We are pleased to announce our new 2030 Sustainability Strategy The world is facing exciting, unprecedented opportunities and challenges. We need everyone to reach their full potential and help shape a brighter future. By leveraging our capabilities and partnering with others, we can help develop lifelong learning opportunities that enable people around the world to create better lives for themselves, their families and generations to come.
Our focus is identifying, supporting and developing people so they can reach their full potential and supporting the UN Sustainable Development Goals (SDGs) particularly goal 4 on quality education, goal 8 on decent jobs and economic growth, and goal 10 on reducing inequality.
The focus areas of our strategy are below. Later this year, we will release our targets and more detail about how we will advance these objectives.
Materiality analysisOur new sustainability framework was developed based on a materiality analysis that considered how Pearson’s business priorities and stakeholder expectations have changed and are likely to evolve. Our materiality assessment was undertaken with Forum for the Future, a well-respected sustainability charity.
As we approached this work, we have taken several key considerations into account:
�Engaging with our stakeholders: we engaged with key stakeholders to understand the issues most important to them and where they expect Pearson to play a role.
�Identifying current and future trends: we conducted futures research to help identify the social, environmental and economic�issues�that�will�influence�learning,�our ecosystem of partners and Pearson’s business in the years to come.
�Linking to business priorities: our process was designed to align with and support our corporate strategy and brand strategy.
�Supporting global goals: we will continue our commitment to advancing the UN SDGs and leverage their targets and indicators in our goal-setting.
Active, ongoing input and engagement from internal and external stakeholders is key to ensuring the achievement of our new 2030 Sustainability Strategy. Our key stakeholder groups include:
�employees;
�shareholders;
�learners;
�educational�institutions�& educators;
�employers;
�governments�& regulators;
�business�partners�& suppliers;�and
�international,�non-governmental�&�non-profit�organisations.�
In addition to Pearson’s other stakeholders, to inform our Sustainability Strategy, we listen carefully to the insights of international, non-governmental�&�non-profit�organisations�working to improve education for vulnerable and marginalised groups, advocating for the UN SDGs and looking at the impact of business in society.
We conducted internal and external interviews, focus groups and workshops to identify high-impact issues.
Sustainability
Talent is the world’s most valuable resource – we’re working to unleash it
Pearson sees a world of talentTalent is the world’s most valuable resource. We want to unleash it.
Our Sustainability Strategy has three main pillars:
We have the role and responsibility to help overcome barriers to lifelong learning, from socio-economic hurdles to equity and health challenges.
Our 2030 strategy will continue to focus on building the foundations for a sustainable business, such as our commitments to respect human rights and minimise environmental impacts across our value chain.
We will use our skills, assets and partnerships to equip people with the technical skills, knowledge, creativity and resilience�needed�to�achieve�the�UN SDGs.
Advance equity in learning
Lead by example
Build skills for sustainable futures
Our new 2030 Sustainability Strategy
To download more information about our materiality analysis, complete ESG data, our Global Reporting Initiative (GRI) and UN Global Compact Index, visit pearson.com/sustainability
16 Pearson plc Annual report and accounts 2019
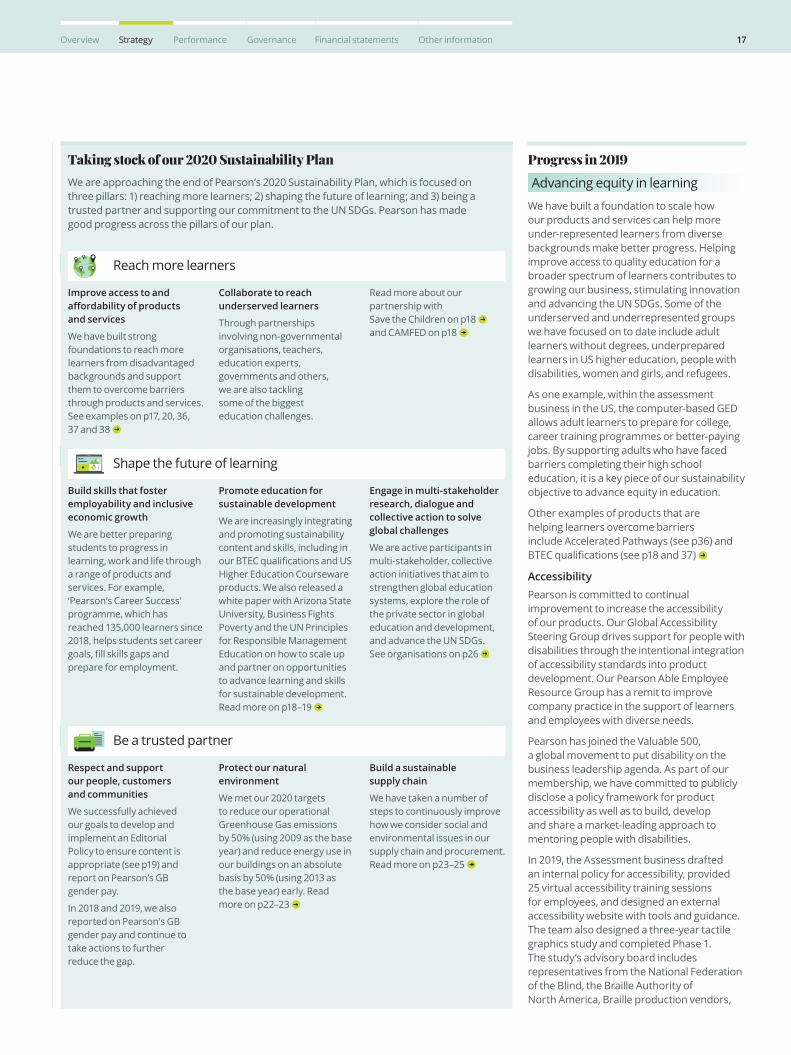
Taking stock of our 2020 Sustainability PlanWe are approaching the end of Pearson’s 2020 Sustainability Plan, which is focused on three�pillars:�1)�reaching�more�learners;�2)�shaping�the�future�of�learning;�and�3)�being�a�trusted partner and supporting our commitment to the UN SDGs. Pearson has made good progress across the pillars of our plan.
Progress in 2019Advancing equity in learning
We have built a foundation to scale how our products and services can help more under-represented learners from diverse backgrounds make better progress. Helping improve access to quality education for a broader spectrum of learners contributes to growing our business, stimulating innovation and advancing the UN SDGs. Some of the underserved and underrepresented groups we have focused on to date include adult learners without degrees, underprepared learners in US higher education, people with disabilities, women and girls, and refugees.
As one example, within the assessment business in the US, the computer-based GED allows adult learners to prepare for college, career training programmes or better-paying jobs. By supporting adults who have faced barriers completing their high school education, it is a key piece of our sustainability objective to advance equity in education.
Other examples of products that are helping learners overcome barriers include Accelerated Pathways (see p36) and BTEC�qualifications�(see�p18�and�37)�
AccessibilityPearson is committed to continual improvement to increase the accessibility of our products. Our Global Accessibility Steering Group drives support for people with disabilities through the intentional integration of accessibility standards into product development. Our Pearson Able Employee Resource Group has a remit to improve company practice in the support of learners and employees with diverse needs.
Pearson has joined the Valuable 500, a global movement to put disability on the business leadership agenda. As part of our membership, we have committed to publicly disclose a policy framework for product accessibility as well as to build, develop and share a market-leading approach to mentoring people with disabilities.
In 2019, the Assessment business drafted an internal policy for accessibility, provided 25 virtual accessibility training sessions for employees, and designed an external accessibility website with tools and guidance. The team also designed a three-year tactile graphics study and completed Phase 1. The study’s advisory board includes representatives from the National Federation of the Blind, the Braille Authority of North America, Braille production vendors,
Reach more learners
Shape the future of learning
Be a trusted partner
Improve access to and affordability of products and services
We have built strong foundations to reach more learners from disadvantaged backgrounds and support them to overcome barriers through products and services. See�examples�on�p17,�20,�36,� 37�and�38�
Collaborate to reach underserved learners
Through partnerships involving non-governmental organisations, teachers, education experts, governments and others, we are also tackling some of the biggest education challenges.
Read more about our partnership with Save the Children on p18 and CAMFED on p18
Build skills that foster employability and inclusive economic growth
We are better preparing students to progress in learning, work and life through a range of products and services. For example, ‘Pearson’s Career Success’ programme, which has reached 135,000 learners since 2018, helps students set career goals,�fill�skills�gaps�and�prepare for employment.
Promote education for sustainable development
We are increasingly integrating and promoting sustainability content and skills, including in our�BTEC�qualifications�and�US�Higher Education Courseware products. We also released a white paper with Arizona State University, Business Fights Poverty and the UN Principles for Responsible Management Education on how to scale up and partner on opportunities to advance learning and skills for sustainable development. Read more on p18–19
Engage in multi-stakeholder research, dialogue and collective action to solve global challenges
We are active participants in multi-stakeholder, collective action initiatives that aim to strengthen global education systems, explore the role of the private sector in global education and development, and advance the UN SDGs. See organisations on p26
Respect and support our people, customers and communities
We successfully achieved our goals to develop and implement an Editorial Policy to ensure content is appropriate (see p19) and report on Pearson’s GB gender pay.
In 2018 and 2019, we also reported on Pearson's GB gender pay and continue to take actions to further reduce the gap.
Protect our natural environment
We met our 2020 targets to reduce our operational Greenhouse Gas emissions by 50% (using 2009 as the base year) and reduce energy use in our buildings on an absolute basis by 50% (using 2013 as the base year) early. Read more on p22–23
Build a sustainable supply chain
We have taken a number of steps to continuously improve how we consider social and environmental issues in our supply chain and procurement. Read more on p23–25
17Overview Strategy Performance Governance Financial statements Other information

Supporting Syrian refugee and host community girls and boys
Sustainability
certified�Braille�transcribers,�students,�parents and teachers of the visually impaired.
In 2019, the Global Product business revised an existing internal policy on accessibility and laid the foundations to update all guidelines from Web Content Accessibility Guidelines (WCAG) 2.0 to 2.1, in line with increasingly global customer requirements. The team also signed agreements with a number of new channel partners to ensure the widest and most convenient possible access to our products.
Every Child LearningSince 2015, Pearson has joined forces with Save the Children to deliver the multilateral Every Child Learning programme to support Syrian refugee and host community girls and boys in Jordan, aged 9–12 years, in Grades 4, 5 and 6. The programme helps improve their learning and build their resilience, whilst making their learning environments safer.
To achieve this ambition, the partnership has focused on researching and integrating new programmatic and digital educational solutions – including the creation of the innovative classroom mobile learning tool, the ‘Space Hero’ (Batl Al Fada’a) maths app.
The programme was successfully expanded from three to 19 schools during the academic year 2018–19, working collaboratively with children, parents, teachers, school leadership and the Jordanian Ministry of Education. Over 10,000 children used the Space Hero app through the programme, and over 2,000 participated in Arabic remedial classes to help them catch up with their peers through the programme.
To support educators, we developed and tested a user dashboard complementing the ‘Space Hero’ app, which includes features to help teachers follow up on their students’ progress and tailor future classes. The partners published ‘The Space Hero Manual’ and distributed it to maths teachers in�schools.�In�addition,�over�300�school�staff�members were trained on academic subjects and providing psychosocial support.
CAMFEDSince 2013, Pearson has partnered with international NGO CAMFED (Campaign for Female Education) to help girls from low-income communities in sub-Saharan Africa stay in school, learn and develop key skills for life and work. The project is funded by the UK Department for International Development’s Girls’ Education Challenge, and supported by national Ministries of Education. Together, we developed a life skills curriculum and learning resources used by young women ‘Learner Guides’ in supporting vulnerable children studying in rural schools. We also created a customised BTEC�qualification�to�recognise�the�skills,�experience and achievements of Learner Guides and enhance their employability prospects. As of December 2019, we have awarded 2,880 BTECs to young women from marginalised backgrounds in Zimbabwe, Tanzania, Ghana and Malawi, against a target of 5,000.
In 2019, Pearson and CAMFED adapted the BTEC�qualification�to�make�it�accessible�to�all�the young women acting as volunteer guides in CAMFED’s programme: not just guides working in schools but also those supporting girls as they graduate from school, and those mentoring young women to set up and grow local�enterprises.�The�revisions�also�reflect�a�greater emphasis on employability skills, and new content has been introduced on topics such as sexual and reproductive health and information technology. The revised BTEC qualification�was�launched�in�Zimbabwe,�Tanzania and Zambia during 2019 and is projected to reach a further 4,500 candidates over the next three years.
Pearson VenturesPearson Ventures invests in companies building new market opportunities using innovative business models, future technologies and new educational experiences. In December 2019, the initiative made�investments�in�its�first�two�startups,�Springboard and Knowledge to Practice (K2P), which are focused on lifelong learning and employability. The investments total $4.2m with Springboard at $2.2m and K2P at $2m.
VolunteeringPearson sponsored a 2019 North America Volunteer Day to support the philanthropic interests of its employees and make a difference�in�communities�across�the�US�and�Canada. Over 500 colleagues participated in a variety of impactful activities including book drives, reading to classrooms, food drives, Habitat for Humanity, mentoring at the�Boys�&�Girls�Club,�park�clean-ups�and� trips to local animal shelters.
Building skills for sustainable futures
We want our learners to be equipped with the skills and capabilities they need to build careers and communities, navigate uncertainty, address the world’s biggest sustainable development challenges and thrive in the 21st century and beyond.
In response to our customers, we have developed�content,�courses,�qualifications�and other services that help students learn about sustainability. By integrating sustainability-related content into our products, we can explore new market opportunities while making a direct contribution to the UN SDGs and inspiring the next generation to improve their world.
18 Pearson plc Annual report and accounts 2019
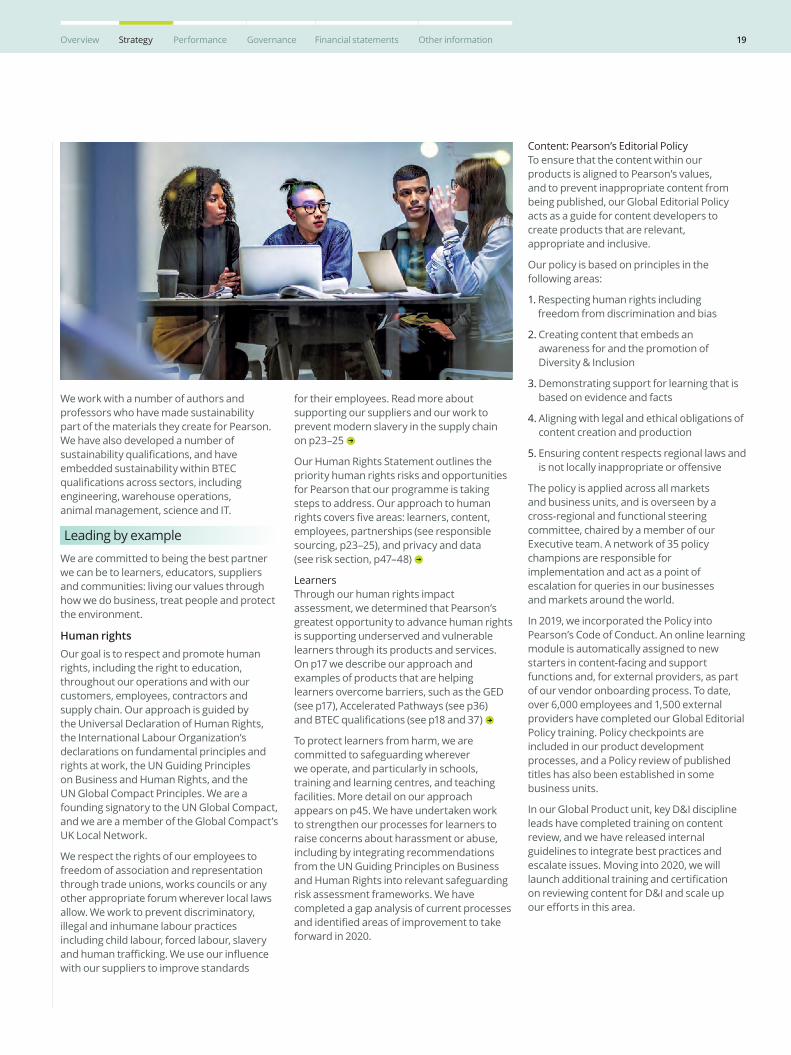
We work with a number of authors and professors who have made sustainability part of the materials they create for Pearson. We have also developed a number of sustainability�qualifications,�and�have�embedded sustainability within BTEC qualifications�across�sectors,�including�engineering, warehouse operations, animal management, science and IT.
Leading by example
We are committed to being the best partner we can be to learners, educators, suppliers and communities: living our values through how we do business, treat people and protect the environment.
Human rightsOur goal is to respect and promote human rights, including the right to education, throughout our operations and with our customers, employees, contractors and supply chain. Our approach is guided by the Universal Declaration of Human Rights, the International Labour Organization’s declarations on fundamental principles and rights at work, the UN Guiding Principles on Business and Human Rights, and the UN Global Compact Principles. We are a founding signatory to the UN Global Compact, and we are a member of the Global Compact’s UK Local Network.
We respect the rights of our employees to freedom of association and representation through trade unions, works councils or any other appropriate forum wherever local laws allow. We work to prevent discriminatory, illegal and inhumane labour practices including child labour, forced labour, slavery and�human�trafficking.�We�use�our�influence�with our suppliers to improve standards
for their employees. Read more about supporting our suppliers and our work to prevent modern slavery in the supply chain on p23–25
Our Human Rights Statement outlines the priority human rights risks and opportunities for Pearson that our programme is taking steps to address. Our approach to human rights�covers�five�areas:�learners,�content,�employees, partnerships (see responsible sourcing, p23–25), and privacy and data (see�risk�section,�p47–48)�
LearnersThrough our human rights impact assessment, we determined that Pearson’s greatest opportunity to advance human rights is supporting underserved and vulnerable learners through its products and services. On�p17�we�describe�our�approach�and�examples of products that are helping learners overcome barriers, such as the GED (see�p17),�Accelerated�Pathways�(see�p36)� and�BTEC�qualifications�(see�p18�and�37)�
To protect learners from harm, we are committed to safeguarding wherever we operate, and particularly in schools, training and learning centres, and teaching facilities. More detail on our approach appears on p45. We have undertaken work to strengthen our processes for learners to raise concerns about harassment or abuse, including by integrating recommendations from the UN Guiding Principles on Business and Human Rights into relevant safeguarding risk assessment frameworks. We have completed a gap analysis of current processes and�identified�areas�of�improvement�to�take�forward in 2020.
Content: Pearson’s Editorial PolicyTo ensure that the content within our products is aligned to Pearson’s values, and to prevent inappropriate content from being published, our Global Editorial Policy acts as a guide for content developers to create products that are relevant, appropriate and inclusive.
Our policy is based on principles in the following areas:
1. Respecting human rights including freedom from discrimination and bias
2. Creating content that embeds an awareness for and the promotion of Diversity�&�Inclusion
3. Demonstrating support for learning that is based on evidence and facts
4. Aligning with legal and ethical obligations of content creation and production
5. Ensuring content respects regional laws and is�not�locally�inappropriate�or�offensive�
The policy is applied across all markets and business units, and is overseen by a cross-regional and functional steering committee, chaired by a member of our Executive team. A network of 35 policy champions are responsible for implementation and act as a point of escalation for queries in our businesses and markets around the world.
In 2019, we incorporated the Policy into Pearson’s Code of Conduct. An online learning module is automatically assigned to new starters in content-facing and support functions and, for external providers, as part of our vendor onboarding process. To date, over 6,000 employees and 1,500 external providers have completed our Global Editorial Policy training. Policy checkpoints are included in our product development processes, and a Policy review of published titles has also been established in some business units.
In�our�Global�Product�unit,�key�D&I�discipline�leads have completed training on content review, and we have released internal guidelines to integrate best practices and escalate issues. Moving into 2020, we will launch�additional�training�and�certification� on�reviewing�content�for�D&I�and�scale�up� our�efforts�in�this�area.�
19Overview Strategy Performance Governance Financial statements Other information

BTEC Student of the Year 2019, Josephine Kiaga, is both a creative and an inspirational voice for her peers and the wider community.
She took a BTEC Subsidiary Diploma in Creative Media Production (Film and Television), as well as a BTEC Diploma in Performing Arts (Acting) at Braeburn International School Arusha in Tanzania, to support her ambitions to become a director.
Josephine sets her sights high: “I want the female African perspective to be heard and film�is�a�powerful�tool�to�express�my�ideas.� I want to be a director who makes a change and who creates with a purpose.”
Josephine is a powerful leader. She was an ambassador of human rights at the East African Model United Nations (EAMUN) conference and she co-organised a ‘Girls’ Empowerment’ day for local girls in the community where they ran workshops regarding entrepreneurship, female hygiene and more. She has also achieved distinctions in public speaking enabling her to teach London Academy of Music and Dramatic Art (LAMDA) classes assisting fellow students.
As BTEC Student of the Year, Josephine is a future creative leader and a powerful advocate for women and her country. Her energy and passion for the creative arts will take her far.
About�Pearson’s�BTEC�qualificationsOver 1m learners every year choose a BTEC course through c.6,000 approved BTEC
centres in 60 countries around the globe. Learners choose BTECs because they are high-quality,�hands-on�qualifications�grounded in the real world of work.
Students learn by doing, and develop valuable employability skills that they will use throughout their future career or for progression into university and to make a positive impact on the world. We know that this�has�a�positive�effect�on�students:�research�from the UK Department for Education shows that, for pupils in state-funded mainstream schools, taking a Technical Award, such as a BTEC Tech Award, is associated with pupils having lower absence rates, lower permanent exclusion�rates�and�lower�fixed�exclusion�rates, when compared with similar pupils who did not take a Technical Award.
Our priority growth markets are China, ASEAN, Middle East, Central/Eastern Europe and North Africa. The key strategic industry sectors that we are focused on to address the skills demand are engineering, construction, digital/tech, travel and tourism, as well as health and care.
This is an example of how we are designing products to have an impact on key learning outcomes such as employability skills and promoting education to advance the UN SDGs as part of our 2030 Sustainability Strategy. Learn�more�about�Efficacy�on�p27�
Learn more in our Sustainability section on p16
Creative and inspirational
I want the female African perspective to be heard and film is a powerful tool to express my ideas. I want to be a director who makes a change.Josephine Kiaga, BTEC Student of the Year 2019
BTECCASE STUDY
20 Pearson plc Annual report and accounts 2019
EmployeesOur�employees�are�key�to�helping�us�fulfill� our vision of helping far more people prosper throughout a lifetime of learning. As such, we play a crucial role in creating a working environment that enables our employees to grow, develop and succeed. This strategic report describes the various ways in which the company engages with, invests in and rewards its employees. The remuneration report also describes the remuneration philosophy which applies to the company as a whole.
Employee engagementThis year, we have enabled engagement with a range of opportunities for employees at all levels of the organisation.
On the back of our successful Innovation Jam in 2018, we formed Tiger Teams to support implementing ideas and solutions. The Tiger Teams have been directly involved with introducing�a�more�flexible�approach�to�performance management, including a new behaviours framework, and they have been instrumental in shaping our learning strategy for 2020.
We launched the ‘Managers’ Corner’ community in January 2019 to streamline communications for our managers. The purpose is to help our managers understand what they need to know, need to do and need to talk about with their teams. This is a critical channel for ensuring all employees are aware of�key�matters�of�concern,�including�financial�and�economic�factors�affecting�our�business.�Our ‘We are Pearson’ campaign launched in October 2019 with the celebration of Pearson’s�175th�birthday.�The�activity�was�focused on reinvigorating the hearts and minds of our employees across the globe virtually and through 59 in-person local birthday celebrations in 25 countries.
In response to the UK Corporate Governance Code, we are excited to take part in strengthening the voice of our workforce with the creation of our Employee Engagement Network (read more on p64)
Investing in and supporting our talentThis year, we launched ‘Pearson Products for Pearson People’, as part of our commitment to help our employees prosper. We introduced GEDWorks™, an opportunity for regular employees and their families in the US to earn a GED credential for free (read more about�the�GED�on�p17),�and�free�access� to Pearson’s eText titles through the VitalSource Bookshelf.
We implemented changes to our performance management approach to shift our focus from an annual backward-looking conversation to regular conversations over the year, giving employees the opportunity to continuously learn, grow and improve performance. The relationship between pay and performance has not changed, to ensure that employees are rewarded for their contribution and impact.�Managers�have�more�flexibility�to�differentiate�their�reward�decisions.
We�offer�benefit�programmes�that�make� our employees’ lives easier, simpler and more rewarding. Our programmes vary globally and include health insurance, disability coverage, retirement savings matching, employee share purchase�options,�commuter�benefits,�tuition�reimbursement, and programmes that support wellbeing and work-life balance.
This year, we implemented US policy changes designed to give our employees more time with family when needed. Maternity leave and�Parental�&�Serious�Illness�in�the�Family�Leave (PSIL) were extended and the Financial Aid�for�Adoption�Policy�was�modified�to�expand�reimbursement�benefits�to�offset�surrogacy expenses.
Pearson maintains its accreditation by the Living Wage Foundation and has committed to paying employees and regularly contracted staff�working�in�our�buildings�across�the� UK and in London the real Living Wage.
Labour practicesWe respect the right of our employees to freedom of association and representation through trade unions, works councils or any other appropriate forum wherever local laws allow. We have policies and processes in place to prevent discriminatory, illegal or inhumane labour practices, including child labour, forced labour, slavery and human trafficking,�in�our�places�of�business,� as well as to address violations when they occur. Representation takes many forms. We support the right to unionise in the UK.
Employee learning and development Our culture is centred around helping people unlock their futures through learning and a range of diverse work experiences.
To�become�a�digital-first�company,� we recognise the importance of helping our employees build their own digital skills. ‘Digital Learning Live’ launched this year as an interactive webinar series to provide all employees with practical digital skills that can be used across Pearson. The Help Me kNow hub provides a large library of videos, activities and lessons to help our employees feel more comfortable with the new digital tools introduced company-wide this year.
We are introducing a Senior Vice President (SVP)–Employee Experience role which will bring together our HR Centres of Expertise to integrate our approach from recruitment to retirement in a more meaningful way for employees.
Managing organisational changesPearson experienced continued change this year, through consolidation and headcount reduction, as we work to achieve our digital-first�strategy.�We�continue�to�support�our employees with regular communication. In the UK, we follow a legally prescribed consultation process and undertake a minimum period of 45 days.
We are also in the early stages of implementing predictive analytics to help us identify variations in employee turnover globally. As we mature in this space, we will be better positioned to develop targeted strategies that increase retention.
In 2019, the Pearson Alumni Network supported a community of past and current engagement with employees through quarterly newsletters, a ‘Leaders in Learning’ podcast, the ‘Career Coach’ to share job opportunities from around the sector, and the ‘Alumni Learning Series’.
21Overview Strategy Performance Governance Financial statements Other information

Key performance indicators: global Greenhouse Gas emissions dataMetric tonnes of CO2e 20091 2018 2019
Combustion of fuel and operation of facilities (GHG Protocol Scope 1) 44,649 13,057 13,251
Electricity (GHG Protocol Scope 2 – location based) 130,395 49,920 47,384
Electricity (GHG Protocol Scope 2 – market based)2 – 4,583 418
Emissions relating to air and rail travel, electricity transmission, waste and water (GHG Protocol Scope 3) 35,262 30,0223 19,786
Total – location based 210,306 92,999 80,421
Total – market based 39,312 33,454
20131 2018 2019
Total energy used in buildings (MWh) 285,590 127,083 129,717Intensity ratios
tCO2e�per�employee�(scope�1,�2�&�3) 6.8 3.48 3.57
tCO2e/sales�revenue�(scope�1,�2�&�3) 20.50 20.79
1 2009 is a baseline year for carbon reduction and 2013 is a baseline year for energy reduction.2� For�nine�of�our�key�markets�we�buy�renewable�energy�through�green�energy�tariffs�or�renewable�
energy�certificates�(RECs)�in�the�country�of�consumption.�This�accounts�for�97%�of�our�electricity�use.�We buy RECs regionally for the remaining 3% in those markets where we have a small presence.
3 A new, enhanced data source was employed in 2019. We have updated and rebased our estimated emissions as a result.
Methodology: We have reported on all of the emission sources required under the Companies Act 2006. The method we have used to calculate GHG emissions is the GHG Protocol Corporate Accounting and Reporting Standard (revised edition), using the Scope 2 dual reporting methodology, together with the latest emission factors from recognised public sources, including, but not limited to, the UK Department for�Business,�Energy�&�Industrial�Strategy,�the�International�Energy�Agency,�the�US�Energy�Information�Administration, the US Environmental Protection Agency and the Intergovernmental Panel on Climate Change.�The�data�in�the�table�above�has�been�independently�verified�by�Corporate�Citizenship.
Key performance indicators: women in Pearson Among�our�seven�D&I�priorities�is�a�goal�to�improve�gender�representation�at�the�top�two�levels of the company. At Board level, 33% of our members were female as at the end of 2019. As a founding member of the 30% Club, we have endorsed and committed to work towards the target of a minimum of 33% representation of women on the Board and in our Senior Leadership Group by 2020. The table below sets out our female representation over�the�past�three�years.�The�final�column�on�the�right�represents�actual�numbers.
2018 2019 2019
Board of Directors 30% 33% 4
Senior leadership1 31% 34% 34
All employees2 62% 59% 13,022
1 Two reporting lines from the Chief Executive.
2�� Total�employee�figures�for�female�composition�of�workforce�are�based�on�a�snapshot�of�employees�as�at�31�December�2019.�Average�annual�figures�for�2019�are�used�elsewhere�in�this�report�and�differ�due�to including seasonal employees at peak periods in our assessment businesses, as well as those who may�no�longer�be�employed�by�the�Group�at�31�December�2019�due�to�the�simplification�programme.
Diversity�&�InclusionEvery person is unique, whether that be in terms of age, gender, identity, race, ethnicity, religion, disability, sexual orientation, education, learning style, national origin, personality type, as well as across a range of other�factors�–�as�set�out�in�our�Diversity�&�Inclusion Statement. At Pearson, we value a diverse workforce and a workplace which reflects�our�learners�–�the�customers�we� serve around the world.
Last year, Pearson designed and adopted a new strategic framework for diversity and inclusion practice. Our charter is to capitalise on�different�perspectives�and�leverage�diversity to spur innovation and growth through an inclusive culture and working environment. Our approach includes:
�a�Global�Diversity�&�Inclusion�(D&I)�Council�led by the CEO to provide strategic oversight and to extend our work into many more markets and countries. The Council includes business leaders, allies and advocates as well as representatives from our Employee Resource Groups.
�a�set�of�seven�priorities�which�guide�our�action planning and major initiatives.
�a�global�network�of�D&I�Advocates�who�provide support to advance our practice in their businesses and geographic locations.
�a�plan�to�help�our�ten�employee�resource�groups at Pearson evolve and mature. The networks are for women, women in technology, parents, veterans, Latinos, the LGBT+ community, generational differences,�people�with�disabilities,�employees of black and/or African ancestry, and a group representing black, Asian and minority ethnic people.
�a�D&I�dashboard�review�and�goal-setting�session held with each business and function leadership team. This was a new introduction in 2019.
Disability is an important part of our wider commitment�to�Diversity�&�Inclusion.� We work to ensure that appropriate procedures, training and support are in place for people with disabilities to ensure fair access to career and progression opportunities. Our Pearson ABLE employee resource group helps improve practice by bringing together people with disabilities in Pearson and accessibility advocates.
Sustainability
22 Pearson plc Annual report and accounts 2019
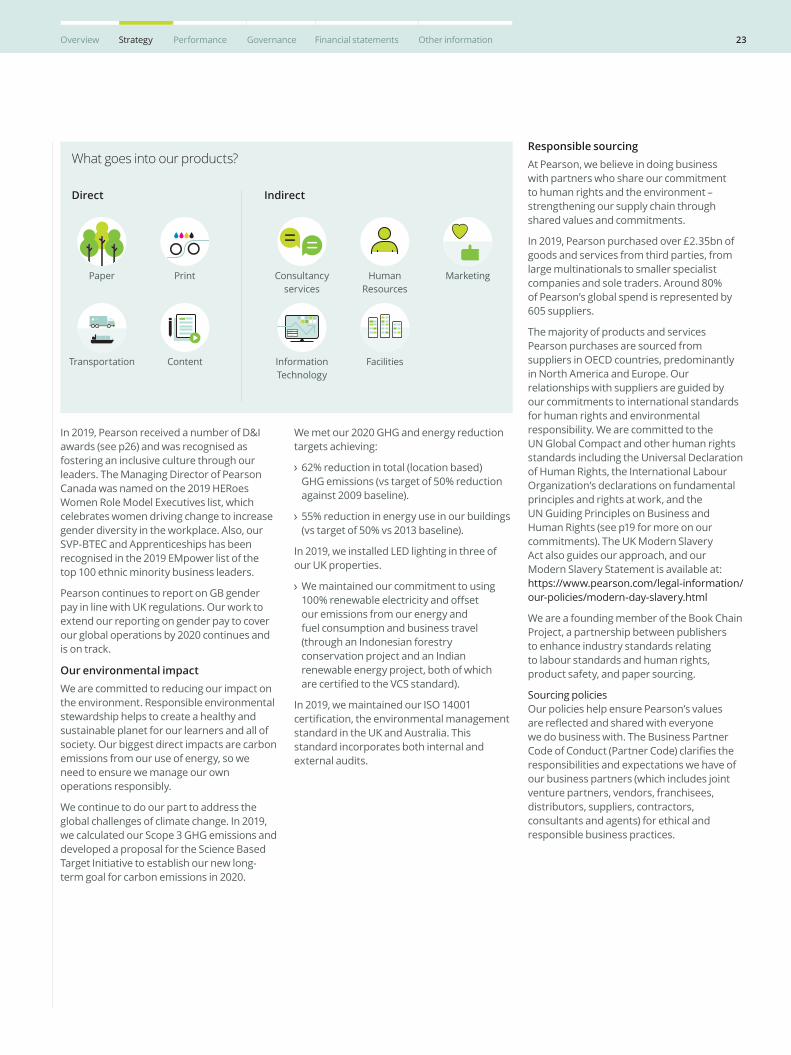
In�2019,�Pearson�received�a�number�of�D&I�awards (see p26) and was recognised as fostering an inclusive culture through our leaders. The Managing Director of Pearson Canada was named on the 2019 HERoes Women Role Model Executives list, which celebrates women driving change to increase gender diversity in the workplace. Also, our SVP-BTEC and Apprenticeships has been recognised in the 2019 EMpower list of the top 100 ethnic minority business leaders.
Pearson continues to report on GB gender pay in line with UK regulations. Our work to extend our reporting on gender pay to cover our global operations by 2020 continues and is on track.
Our environmental impactWe are committed to reducing our impact on the environment. Responsible environmental stewardship helps to create a healthy and sustainable planet for our learners and all of society. Our biggest direct impacts are carbon emissions from our use of energy, so we need to ensure we manage our own operations responsibly.
We continue to do our part to address the global challenges of climate change. In 2019, we calculated our Scope 3 GHG emissions and developed a proposal for the Science Based Target Initiative to establish our new long-term goal for carbon emissions in 2020.
We met our 2020 GHG and energy reduction targets achieving:
�62%�reduction�in�total�(location�based)� GHG emissions (vs target of 50% reduction against 2009 baseline).
�55%�reduction�in�energy�use�in�our�buildings�(vs target of 50% vs 2013 baseline).
In 2019, we installed LED lighting in three of our UK properties.
�We�maintained�our�commitment�to�using�100%�renewable�electricity�and�offset� our emissions from our energy and fuel consumption and business travel (through an Indonesian forestry conservation project and an Indian renewable energy project, both of which are�certified�to�the�VCS�standard).
In 2019, we maintained our ISO 14001 certification,�the�environmental�management�standard in the UK and Australia. This standard incorporates both internal and external audits.
What goes into our products?
Direct Indirect
Paper Consultancy services
Print Human Resources
Transportation Content
Marketing
Information Technology
Facilities
Responsible sourcingAt Pearson, we believe in doing business with partners who share our commitment to human rights and the environment – strengthening our supply chain through shared values and commitments.
In 2019, Pearson purchased over £2.35bn of goods and services from third parties, from large multinationals to smaller specialist companies and sole traders. Around 80% of Pearson’s global spend is represented by 605 suppliers.
The majority of products and services Pearson purchases are sourced from suppliers in OECD countries, predominantly in North America and Europe. Our relationships with suppliers are guided by our commitments to international standards for human rights and environmental responsibility. We are committed to the UN Global Compact and other human rights standards including the Universal Declaration of Human Rights, the International Labour Organization’s declarations on fundamental principles and rights at work, and the UN Guiding Principles on Business and Human Rights (see p19 for more on our commitments). The UK Modern Slavery Act also guides our approach, and our Modern Slavery Statement is available at: https://www.pearson.com/legal-information/our-policies/modern-day-slavery.html
We are a founding member of the Book Chain Project, a partnership between publishers to enhance industry standards relating to labour standards and human rights, product safety, and paper sourcing.
Sourcing policiesOur policies help ensure Pearson’s values are�reflected�and�shared�with�everyone� we do business with. The Business Partner Code�of�Conduct�(Partner�Code)�clarifies�the�responsibilities and expectations we have of our business partners (which includes joint venture partners, vendors, franchisees, distributors, suppliers, contractors, consultants and agents) for ethical and responsible business practices.
23Overview Strategy Performance Governance Financial statements Other information

We are committed to reducing our impact on the environment.
The Partner Code sets out our support for environmental stewardship, universal human rights (including equal employment, freedom of speech and of association, and cultural, economic and social wellbeing), good labour practices, and decent working conditions. It also sets out expectations that our supply partners, and their subcontractors, oppose discriminatory, illegal, or inhumane labour practices, including slavery and human trafficking.�The�Partner�Code�is�present�in�new�contracts and is included when contracts are renewed or updated. Compliance with the principles in our code is a minimum standard of behaviour outlined in contracts.
Our�Business�Terms�of�Reference,�specific� to Pearson supply chain contracts, set out the terms and conditions for purchase of goods and services, and are agreed prior to engaging suppliers. This provides Pearson with the power of audit and right�to�terminate�a�relationship�if�we�find�issues of non-compliance, ensuring our responsible purchasing principles are contractually enforceable.
When working with schools and campuses, suppliers must have an acceptable safeguarding policy which meets or exceeds Pearson’s own (see p45 for more on safeguarding). Suppliers are also subject to Pearson’s Anti-Bribery and Corruption Policy�(see�p49�and�p77)�and�Gifts�and�Hospitality Policy.
Direct supply chainWhile we have a growing technology-enabled supply�chain�reflecting�our�increasing�shift�to�digital, our traditional paper-based products continue to be a key area of focus. Our Supply Chain function manages our purchases of paper for books, as well as our contracts with printers and works with distributors and shippers who bring our products to market.
US Higher Education Courseware supply chainPearson does not directly manage paper procurement, print manufacturing, warehousing and distribution operations for our US Higher Education Courseware business. These activities are outsourced to LSC Communications, which is subject to our Business Partner Code of Conduct.
Paper sourcingPearson has a longstanding Responsible Paper Sourcing Policy that sets out our approach to managing risks related to human rights and environmental practices in our direct supply chain. This policy sets out our preference for paper suppliers which hold Forest�Stewardship�Council�(FSC)�certification,�and we also recognise the Programme for the Endorsement�of�Forest�Certification�(PEFC)�system�of�certification.�
In 2019, we purchased over 100,000 tonnes of paper globally. To help to reduce our impact, we have retained Chain of Custody accreditation from the FSC in the UK, which enables Pearson products to carry the FSC logo. Of the more than 12,000 tonnes of paper we�purchased�in�the�UK,�86%�was�certified� to an environmental standard, such as FSC or PEFC.
Print productionWe rely on third-party suppliers to print our textbooks and course materials. Globally, we have over 200 print suppliers representing approximately £200m in spend.
In the UK, we require suppliers rated as high risk and with spend of over £100,000 to undertake an independent third-party audit before being approved as a supplier, and to agree to regular review audits at least once every two years. We rate suppliers as medium or high risk based on a Book Chain tool designed�specifically�to�help�publishers�identify labour and environmental risks in the supply chain. The audits are carried out by third-party auditors and shared via the Book Chain platform.
Our due diligence process also includes visiting suppliers around the world to assess compliance with our standards, and to ensure suppliers address non-compliance. These visits provide a valuable opportunity to reinforce our commitments to eliminating all forms of child, forced and compulsory labour, as well as promoting environmental stewardship.
Sustainability
24 Pearson plc Annual report and accounts 2019
In our UK business, we had £26m in spend with 46 suppliers in total. Of these, we have identified�four�suppliers,�representing�£6.6m�in spend, as high-risk based on country of operation (China and Malaysia), guidance from the Book Chain Project and meeting our £100,000 materiality threshold. All four were visited in 2019 and have a valid audit in place.
Indirect procurementFollowing deployment of systems in the UK, US and Canada, new supplier requests are tracked and pass through audited approval�actions�before�being�confirmed�for�onboarding into Pearson systems. Suppliers submit information directly and securely through our platform, governed by SOX control standards, where risk assessment concerns�are�tested�across:�conflict�of�interest,�trade sanctions, sanctioned countries, sustainability, physical security, diversity, and business continuity.
Our 2020 supplier risk initiatives will focus on: a reduction in the number of ‘active’ suppliers available for the business users to purchase against (therefore reducing our risk landscape);�risk�assessment�of�incumbent�suppliers;�and�improvement�of�Pearson’s�supplier risk assessment enabled by technology and partnerships.
Contingent workersAllegis Global Solutions (AGS) is the major partner supporting Pearson’s relationships with our contingent workforce population. Our�contingent�workers�frequently�fill�roles�such as engineers, developers, exam graders and project managers.
AGS, and our other partners, help Pearson ensure our contingent workers receive detailed information outlining how Pearson’s people policies apply to them, and help to hold contingent worker agencies accountable for ensuring that workers are informed of these policies.
Supplier diversityOur supplier diversity programme focuses on local, small, diverse businesses – such as underutilised, or women-, minority-, LGBT- or veteran-owned. Building close partnerships with diverse suppliers helps make us more competitive and drive innovation. In 2019, the Global Supplier Diversity team contributed to�37�proposals�with�supplier�diversity�requirements, whose total potential contract value exceeds ~£400m.
A roadmap for the futureIn 2019, we undertook a project with sustainability advisers, BSR, to assess our existing approach to human rights in our supply chain, ensure we meet global standards and stakeholder expectations, identify any gaps, and develop a roadmap to improve our approach. Based on the project’s�findings,�Pearson�plans�to�improve�spend data, facilitate better measurement and reporting of KPIs, and continue to inform both buyers and suppliers on human rights issues to Pearson’s standards.
Through our Procurement Function, Pearson will continue to contribute to our corporate social responsibility and sustainability targets by�influencing�our�sourcing�methodologies� to promote spend with qualifying suppliers. We are putting processes in place to: increase our�diverse�spend;�include�supplier�diversity�language�in�our�requests�for�proposals;� and work with non-diverse suppliers to incorporate supplier diversity goals into their procurement process.
Governance
Our strong governance structures and internal systems are key to managing risks and embedding sustainability, responsibility and ethics across our business. Key areas include our organisational risk management (see p40–50), compliance and anti-bribery process (see p49), public policy (see p45) and�tax�(see�p47)�
Sustainability governanceThe�Reputation�&�Responsibility�Committee,� a formal committee of the Board, provides ongoing oversight, scrutiny and challenge on matters relating to our Sustainability Strategy and our corporate reputation. Learn more on�p72�
The Pearson Executive oversees implementation of business and sustainability strategy. The Responsible Business Leadership Council drives implementation of the strategy on behalf of the Board. It is chaired�by�our�Chief�Corporate�Affairs�Officer�and comprises leaders from across the business. We updated the membership and terms of reference in 2019 to oversee and support the integration of our updated sustainable business priorities.
Code of ConductThe Pearson Code of Conduct underpins our values by setting out the global ethical, social and environmental standards of behaviour we expect from employees, and we have a companion code for business partners.
Our Code of Conduct was revised and refreshed in 2019, and the course included a focus�on�raising�concerns,�a�certification�to�the�Code�and�an�overview�of�our�Global�Conflicts�of Interest Policy and disclosure process. We make sure all Pearson employees are aware�of�our�Code�and�confirm�they�understand and will comply with it. In 2019, we achieved our target of 100% employee completion and acknowledgement of the Code by all employees. The Code is also assigned as part of the onboarding process for all new Pearson employees.
Raising concernsWe�operate�a�free,�confidential�telephone�helpline and website for anyone who wants to raise a concern, and we have a clear Raising Concerns and Anti-Retaliation Policy in place to encourage honesty and openness. Cases that�pose�significant�risks�to�our�business�are�reported to the Pearson Audit Committee with ultimate ownership by the Board.
25Overview Strategy Performance Governance Financial statements Other information
Recognition and multi-stakeholder engagementAwards Initiatives
Non-financial information statement & more informationThe�following�table�outlines�where�the�key�contents�requirements�of�the�non-financial�information�statement�(as�required�by�sections�414CA and 414CB of the Companies Act 2006) can be found in this document.
Please visit our website for a complete set of our environmental, social and governance performance data and information about how we are aligning with the UN Global Compact principles, Global Reporting Initiative and Carbon Disclosure Project.
Reporting requirement Pearson policies and procedures Section of annual report
Environmental matters Environmental Policy
Paper Purchasing Policy
Our environmental impact, p22–23
Employees Code of Conduct
Human Rights Statement
Raising Concerns and Anti-Retaliation Policy
Health�&�Safety�Statement
Diversity�&�Inclusion�Statement
Our employees, p21–22
Human rights Human Rights Statement
Editorial Policy
Modern Slavery Statement
Safeguarding Principles
Human rights, p19
Editorial Policy, p19
Our employees, p21–22
Social matters Human Rights Statement Our 2030 strategy, p6
Advance�equity�in�learning,�p17
Build skills for sustainable futures, p18–19
Anti-corruption and bribery Code of Conduct
Anti-Bribery and Corruption (ABC) Policy
Raising Concerns and Anti-Retaliation Policy
Legal and compliance, p48–49
Policy embedding, due diligence and outcomes Organisational risk management, p40–50
Sustainability, p16–26
Description of principal risks and impact of business activity Organisational risk management, p40–50
Description of business model Our strategic model, p10–11
Non-financial�key�performance�indicators Sustainability, p16–26
Publicly available policies in the list above can be found at: www.pearson.com/corporate/our-policies.html
Sustainability
26 Pearson plc Annual report and accounts 2019
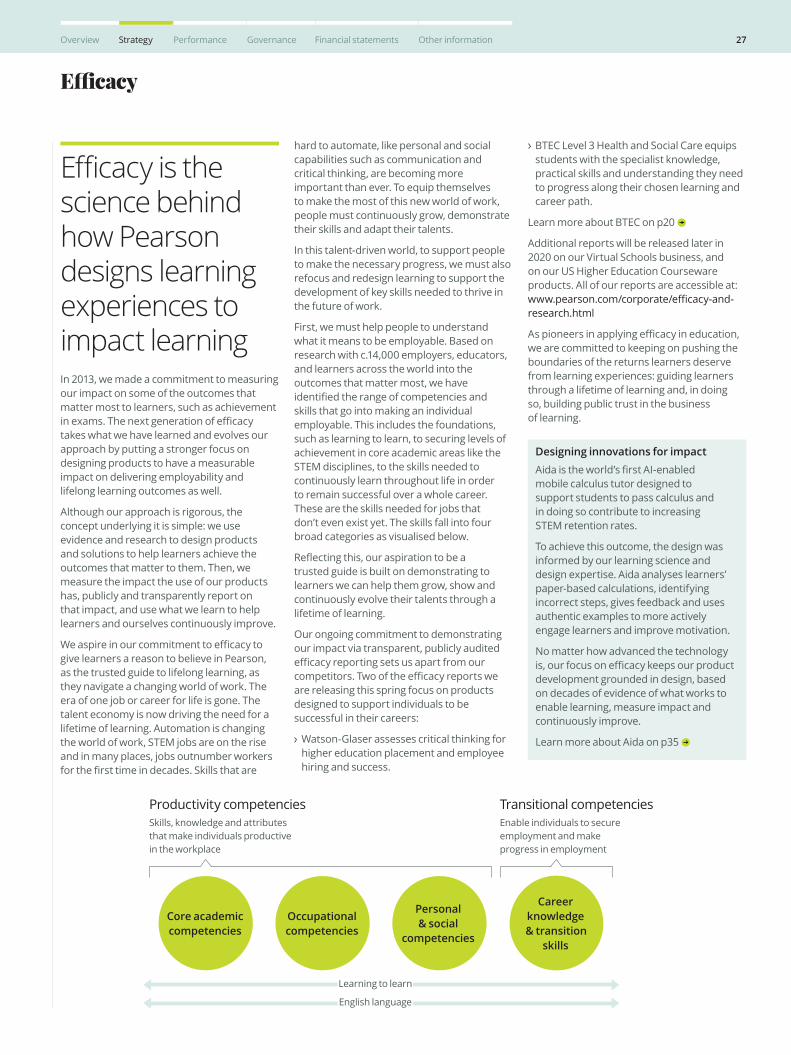
Productivity competenciesSkills, knowledge and attributes that make individuals productive in the workplace
Transitional competenciesEnable individuals to secure employment and make progress in employment
Core academic competencies
Occupational competencies
Personal & social
competencies
Career knowledge & transition
skills
Learning to learn
English language
In 2013, we made a commitment to measuring our impact on some of the outcomes that matter most to learners, such as achievement in�exams.�The�next�generation�of�efficacy�takes what we have learned and evolves our approach by putting a stronger focus on designing products to have a measurable impact on delivering employability and lifelong learning outcomes as well.
Although our approach is rigorous, the concept underlying it is simple: we use evidence and research to design products and solutions to help learners achieve the outcomes that matter to them. Then, we measure the impact the use of our products has, publicly and transparently report on that impact, and use what we learn to help learners and ourselves continuously improve.
We�aspire�in�our�commitment�to�efficacy�to�give learners a reason to believe in Pearson, as the trusted guide to lifelong learning, as they navigate a changing world of work. The era of one job or career for life is gone. The talent economy is now driving the need for a lifetime of learning. Automation is changing the world of work, STEM jobs are on the rise and in many places, jobs outnumber workers for�the�first�time�in�decades.�Skills�that�are�
hard to automate, like personal and social capabilities such as communication and critical thinking, are becoming more important than ever. To equip themselves to make the most of this new world of work, people must continuously grow, demonstrate their skills and adapt their talents.
In this talent-driven world, to support people to make the necessary progress, we must also refocus and redesign learning to support the development of key skills needed to thrive in the future of work.
First, we must help people to understand what it means to be employable. Based on research with c.14,000 employers, educators, and learners across the world into the outcomes that matter most, we have identified�the�range�of�competencies�and� skills that go into making an individual employable. This includes the foundations, such as learning to learn, to securing levels of achievement in core academic areas like the STEM disciplines, to the skills needed to continuously learn throughout life in order to remain successful over a whole career. These are the skills needed for jobs that don’t even exist yet. The skills fall into four broad categories as visualised below.
Reflecting�this,�our�aspiration�to�be�a� trusted guide is built on demonstrating to learners we can help them grow, show and continuously evolve their talents through a lifetime of learning.
Our ongoing commitment to demonstrating our impact via transparent, publicly audited efficacy�reporting�sets�us�apart�from�our�competitors.�Two�of�the�efficacy�reports�we�are releasing this spring focus on products designed to support individuals to be successful in their careers:
�Watson-Glaser�assesses�critical�thinking�for�higher education placement and employee hiring and success.
�BTEC�Level�3�Health�and�Social�Care�equips�students with the specialist knowledge, practical skills and understanding they need to progress along their chosen learning and career path.
Learn more about BTEC on p20
Additional reports will be released later in 2020 on our Virtual Schools business, and on our US Higher Education Courseware products. All of our reports are accessible at: www.pearson.com/corporate/efficacy-and-research.html
As�pioneers�in�applying�efficacy�in�education,�we are committed to keeping on pushing the boundaries of the returns learners deserve from learning experiences: guiding learners through a lifetime of learning and, in doing so, building public trust in the business of learning.
Efficacy is the science behind how Pearson designs learning experiences to impact learning
Efficacy
Designing innovations for impact Aida�is�the�world’s�first�AI-enabled� mobile calculus tutor designed to support students to pass calculus and in doing so contribute to increasing STEM retention rates.
To achieve this outcome, the design was informed by our learning science and design expertise. Aida analyses learners’ paper-based calculations, identifying incorrect steps, gives feedback and uses authentic examples to more actively engage learners and improve motivation.
No matter how advanced the technology is,�our�focus�on�efficacy�keeps�our�product�development grounded in design, based on decades of evidence of what works to enable learning, measure impact and continuously improve.
Learn more about Aida on p35
27Overview Strategy Performance Governance Financial statements Other information
Directors’ duties statement
The Directors of Pearson plc – and those of all UK companies – must act in accordance with a set of general duties. These duties are detailed in the Companies Act 2006 and include in Section�172�a�duty�to�promote�the�success� of the company (see inset, right).
As part of their induction at Pearson, the Directors are briefed on their duties and they can access professional advice on these – either through the company or, if they judge it necessary, from an independent provider. Typically, in large and complex businesses such�as�Pearson,�the�Directors�fulfil�their�duties partly through a governance framework that delegates day-to-day decision-making to employees of the Group.
The Board recognises that such delegation needs to be much more than a simple financial�authority�and,�throughout�this�document, we have summarised: our governance�framework;�the�values�and�behaviours expected of our employees and business partners, including the standards to which�they�must�adhere;�how�we�engage�with�stakeholders, including to understand and take�into�account�their�views�and�concerns;�and how the Board looks to ensure that we have a robust system of control and assurance processes in place.
In this annual report, we provide examples of how the Directors take into account the likely consequences of decisions in the long term, build relationships with stakeholders, engage with employees, understand the impact of Pearson’s operations on communities and the environment, and attribute importance to behaving as an ethical and responsible business. In particular, you are encouraged to read the following sections of this report which illustrate how the Directors, with the support of the wider business, consider these matters in the course of their duties, although this is not intended to be an exhaustive list as such matters are integrated throughout this report:
�Creating�value�for�our�stakeholders�(p14),�which summarises our stakeholder groups, how we serve and engage with them, their key concerns and our response.
�The�Board’s�disclosure,�Engagement�with�stakeholders (p62), which summarises:
– how Directors have engaged with employees and had regard to employees’ interests;�and
– how Directors have had regard to the need to foster the company’s business relationships with suppliers, customers and others. Pearson considers its key customer groups to be Learners, Educators and Educational Institutions, and describes its suppliers as Business Partners – we have categorised our engagement with these groups accordingly.
�Sustainability�(p16),�which�describes:
– how stakeholders were consulted in the development of our new 2030 Sustainability Strategy, which is ongoing and�is�overseen�by�our�Reputation�&�Responsibility�Committee;
– the ways in which we engage in respect of the social, environmental and economic issues�that�will�influence�learning;
– initiatives through which we strive to improve access to quality education for underserved and underrepresented�groups;
– the ways in which Pearson strives to be the best partner we can be to customers such as learners and educators, suppliers and communities: living our values through how we do business, treat people and protect the environment.
A continued understanding of the key issues affecting�stakeholders�is�an�integral�part�of�the Board’s decision-making process and the insights which the Board gains through engagement mechanisms form an important part of the context for all of the Board’s discussions and decision-making processes. The case study on Pearson’s recent acquisition of Lumerit Education (p61) provides an illustrative example of how the Board takes stakeholder views, and the impact on stakeholders, into account in its decision-making.
Section 172 of the Companies ActIn�summary,�as�required�by�Section�172� of the Companies Act 2006, a director of a company must act in the way he considers, in good faith, would most likely promote the success of the company for the benefit�of�its�shareholders.�In�doing�this,�the director must have regard, amongst other matters, to:
�the�likely�consequences�of�any�decisions�in�the�long�term;
�the�interests�of�the�company’s�employees;�
�the�need�to�foster�the�company’s�business relationships with suppliers, customers�and�others;
�the�impact�of�the�company’s�operations�on�the�community�and�environment;
�the�company’s�reputation�for�high�standards�of�business�conduct;�and
�the�need�to�act�fairly�as�between�members of the company.
28 Pearson plc Annual report and accounts 2019
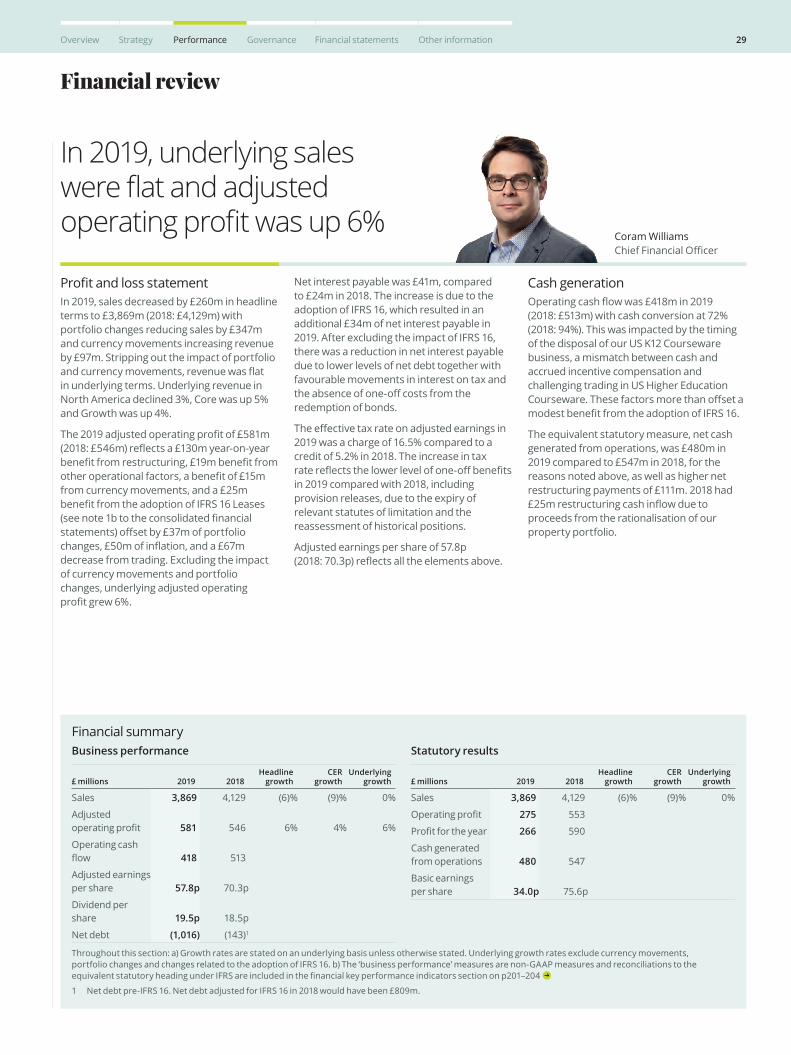
Financial review
Profit�and�loss�statementIn 2019, sales decreased by £260m in headline terms to £3,869m (2018: £4,129m) with portfolio�changes�reducing�sales�by�£347m�and currency movements increasing revenue by�£97m.�Stripping�out�the�impact�of�portfolio�and�currency�movements,�revenue�was�flat� in underlying terms. Underlying revenue in North America declined 3%, Core was up 5% and Growth was up 4%.
The�2019�adjusted�operating�profit�of�£581m�(2018:�£546m)�reflects�a�£130m�year-on-year�benefit�from�restructuring,�£19m�benefit�from�other�operational�factors,�a�benefit�of�£15m�from currency movements, and a £25m benefit�from�the�adoption�of�IFRS�16�Leases�(see�note�1b�to�the�consolidated�financial�statements)�offset�by�£37m�of�portfolio�changes,�£50m�of�inflation,�and�a�£67m�decrease from trading. Excluding the impact of currency movements and portfolio changes, underlying adjusted operating profit�grew�6%.�
Net interest payable was £41m, compared to £24m in 2018. The increase is due to the adoption of IFRS 16, which resulted in an additional £34m of net interest payable in 2019. After excluding the impact of IFRS 16, there was a reduction in net interest payable due to lower levels of net debt together with favourable movements in interest on tax and the�absence�of�one-off�costs�from�the�redemption of bonds.
The�effective�tax�rate�on�adjusted�earnings�in�2019 was a charge of 16.5% compared to a credit of 5.2% in 2018. The increase in tax rate�reflects�the�lower�level�of�one-off�benefits�in 2019 compared with 2018, including provision releases, due to the expiry of relevant statutes of limitation and the reassessment of historical positions.
Adjusted�earnings�per�share�of�57.8p� (2018:�70.3p)�reflects�all�the�elements�above.�
Cash generationOperating�cash�flow�was�£418m�in�2019� (2018:�£513m)�with�cash�conversion�at�72%�(2018: 94%). This was impacted by the timing of the disposal of our US K12 Courseware business, a mismatch between cash and accrued incentive compensation and challenging trading in US Higher Education Courseware.�These�factors�more�than�offset�a�modest�benefit�from�the�adoption�of�IFRS�16.�
The equivalent statutory measure, net cash generated from operations, was £480m in 2019�compared�to�£547m�in�2018,�for�the�reasons noted above, as well as higher net restructuring payments of £111m. 2018 had £25m�restructuring�cash�inflow�due�to�proceeds from the rationalisation of our property portfolio.
Financial summaryBusiness performance
£ millions 2019 2018Headline
growthCER
growthUnderlying
growth
Sales 3,869 4,129 (6)% (9)% 0%
Adjusted operating�profit 581 546 6% 4% 6%
Operating cash flow 418 513
Adjusted earnings per share 57.8p 70.3p
Dividend per share 19.5p 18.5p
Net debt (1,016) (143)1
Statutory results
£ millions 2019 2018Headline
growthCER
growthUnderlying
growth
Sales 3,869 4,129 (6)% (9)% 0%
Operating�profit 275 553
Profit�for�the�year 266 590
Cash generated from operations 480 547
Basic earnings per share 34.0p 75.6p
Throughout this section: a) Growth rates are stated on an underlying basis unless otherwise stated. Underlying growth rates exclude currency movements, portfolio changes and changes related to the adoption of IFRS 16. b) The ‘business performance’ measures are non-GAAP measures and reconciliations to the equivalent�statutory�heading�under�IFRS�are�included�in�the�financial�key�performance�indicators�section�on�p201–204�
1 Net debt pre-IFRS 16. Net debt adjusted for IFRS 16 in 2018 would have been £809m.
In 2019, underlying sales were flat and adjusted operating profit was up 6%
Coram Williams Chief�Financial�Officer
29Overview Strategy Performance Governance Financial statements Other information
Financial review
Statutory resultsOur�statutory�operating�profit�was�£275m� in 2019, compared to £553m in 2018. The decrease in 2019 is largely due to the decrease in gains on disposals, together with increased intangible and restructuring charges,�which�more�than�offset�the�increase�in�adjusted�operating�profit.�
Capital allocationOur capital allocation policy is to maintain a strong balance sheet and a solid investment grade rating, to continue to invest in the business and through acquisitions, to have a sustainable and progressive dividend policy, and to return surplus cash to our shareholders. Given the strength of the balance�sheet�and,�with�the�simplification� of�our�back�office�largely�complete,�this�gives�us more scope for inorganic investment.
Balance sheetNet debt to adjusted EBITDA was 1.3x on a post-IFRS 16 basis. On a post-IFRS 16 basis, net debt rose from £809m in 2018 to £1,016m in�2019,�reflecting�lower�operating�free�cash�flow,�dividends,�additional�capital�invested�in�Penguin Random House, the acquisitions of Smart Sparrow and Lumerit Education and outflows�from�the�disposal�of�the�US�K12�Courseware business.
In March 2019, the Group repurchased €55m�of�its�remaining�€500m�Euro�1.875%�notes due May 2021, to leave €195m outstanding.�The�Group�also�refinanced�its�revolving credit facility (RCF) in February 2019, extending the maturity to February 2024 and reducing the size to $1.19bn. Borrowings at 31 December 2019 included drawings on the Group’s RCF of £230m (2018: £nil).
Pension planThe overall surplus on UK pension plan of £571m�at�the�end�of�2018�has�decreased� to a surplus of £429m at the end of 2019. The decrease has arisen principally due to the unfavourable impact from changes in discount rate assumptions.
DividendIn line with our policy, the Board is proposing a�final�dividend�of�13.5p�(2018:�13p),�an�increase of 4%, which results in an overall dividend of 19.5p (2018: 18.5p), up 5% on prior year, and subject to shareholder approval. This�will�be�payable�on�7�May�2020.�
Share buybackIn January 2020, the Group commenced a £350m share buyback programme, in connection with the announcement in December 2019 of the sale of its remaining 25% interest in Penguin Random House. As of 3 March 2020, being the latest practicable date before the publication of this report, we have completed £105m of the share buyback so far.
Businesses held for saleIn December 2019, the Group announced the agreement to sell its remaining 25% interest in Penguin Random House to Bertelsmann, generating net proceeds of approximately�$675m.�
At the end of December, our share of the assets of Penguin Random House has�been�classified�as�held�for�sale�on�the�balance sheet.
Businesses disposed ofFollowing the decision to sell the US K12 Courseware business, the assets and liabilities of�that�business�were�classified�as�held�for�sale on the balance sheet at the end of 2018. In March 2019, the Group completed the sale, resulting�in�a�pre-tax�profit�on�sale�of�£13m.�
2020 outlook In�2019,�we�delivered�flat�underlying�revenue,�achieved�adjusted�operating�profit�growth,�made�good�progress�on�our�simplification�programme and laid the foundations for growth. Our guidance for 2020 is for adjusted operating�profit�between�£410m�and�£490m�and adjusted earnings per share of 38.0p to 47.0p.�This�reflects�our�portfolio�excluding�Penguin Random House, exchange rates as at 31 December 2019 and the following factors:
Inflation and other operational factorsOur�2020�guidance�incorporates�cost�inflation�of�c.£30m�which�reflects�a�lower�cost�base�and�the�benefits�of�our�simplification� drive, other operational factors of £45m predominantly due to the reinstatement of�staff�incentives,�as�well�as�continued�investment in our strategic growth areas.
TradingTrading�is�expected�to�impact�profit�between�flat�and�£(80)m�with�the�decline�in�US�Higher�Education�Courseware�offset�by�growth�in�the�rest of the business.
Restructuring benefitsWe�expect�incremental�in-year�benefits�from�the�2017–2019�restructuring�programme�of�£60m in 2020.
DisposalsWe expect a negative impact of £55m on adjusted�operating�profit,�from�portfolio�changes, including £65m from the sale of Penguin Random House.
Interest and taxWe expect a 2020 net interest charge of c.£50m and a tax rate of c.21%, excluding Penguin Random House.
CurrencyIn 2019, Pearson generated approximately 62% of its sales in the US, 3% in Greater China, 5% in the Eurozone, 3% in Brazil, 3% in Canada, 4% in Australia, 2% in South Africa and 2% in India and our guidance is based on exchange rates at 31 December 2019.
We calculate that a 5c move in the US Dollar exchange rate to Sterling would impact adjusted EPS by around 2p to 2.5p.
Adjusted performance measuresThe Group’s adjusted performance measures are�non-GAAP�financial�measures�and� are�included�as�they�are�key�financial�measures used by management to evaluate performance and allocate resources to business segments. The measures also enable investors to more easily, and consistently, track the underlying operational performance of the Group and its business segments over time by separating out those items of income and expenditure relating to acquisition and disposal transactions, major restructuring programmes and certain other items that are also not representative of underlying performance.
The�Group’s�definition�of�adjusted�performance measures may not be comparable to other similarly titled measures reported by other companies. A reconciliation of the adjusted measures to their corresponding statutory reported figures�is�shown�in�summary�below�and�in�more detail on p201–204
30 Pearson plc Annual report and accounts 2019
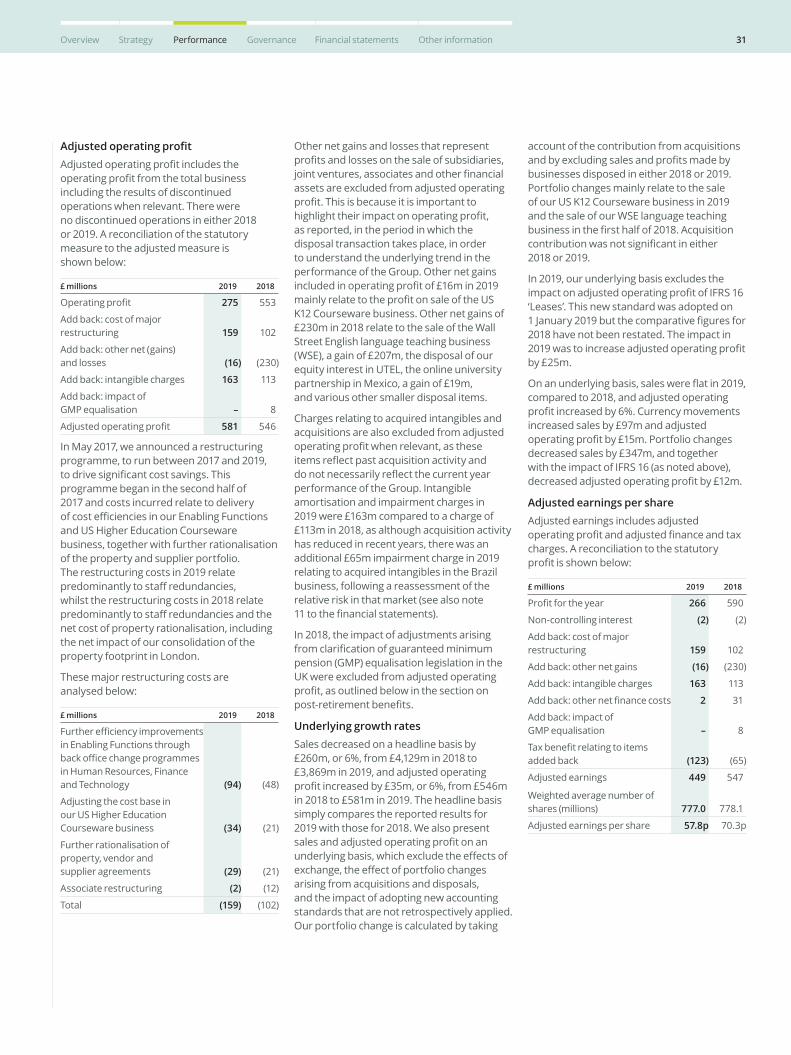
Adjusted operating profitAdjusted�operating�profit�includes�the�operating�profit�from�the�total�business�including the results of discontinued operations when relevant. There were no discontinued operations in either 2018 or 2019. A reconciliation of the statutory measure to the adjusted measure is shown below:
£ millions 2019 2018
Operating�profit 275 553
Add back: cost of major restructuring 159 102
Add back: other net (gains) and losses (16) (230)
Add back: intangible charges 163 113
Add back: impact of GMP equalisation – 8
Adjusted�operating�profit 581 546
In�May�2017,�we�announced�a�restructuring�programme,�to�run�between�2017�and�2019,� to�drive�significant�cost�savings.�This�programme began in the second half of 2017�and�costs�incurred�relate�to�delivery� of�cost�efficiencies�in�our�Enabling�Functions�and US Higher Education Courseware business, together with further rationalisation of the property and supplier portfolio. The restructuring costs in 2019 relate predominantly�to�staff�redundancies,� whilst the restructuring costs in 2018 relate predominantly�to�staff�redundancies�and�the�net cost of property rationalisation, including the net impact of our consolidation of the property footprint in London.
These major restructuring costs are analysed below:
£ millions 2019 2018
Further�efficiency�improvements�in Enabling Functions through back�office�change�programmes�in Human Resources, Finance and Technology (94) (48)
Adjusting the cost base in our US Higher Education Courseware business (34) (21)
Further rationalisation of property, vendor and supplier agreements (29) (21)
Associate restructuring (2) (12)
Total (159) (102)
Other net gains and losses that represent profits�and�losses�on�the�sale�of�subsidiaries,�joint�ventures,�associates�and�other�financial�assets are excluded from adjusted operating profit.�This�is�because�it�is�important�to�highlight�their�impact�on�operating�profit,� as reported, in the period in which the disposal transaction takes place, in order to understand the underlying trend in the performance of the Group. Other net gains included�in�operating�profit�of�£16m�in�2019�mainly�relate�to�the�profit�on�sale�of�the�US�K12 Courseware business. Other net gains of £230m in 2018 relate to the sale of the Wall Street English language teaching business (WSE),�a�gain�of�£207m,�the�disposal�of�our�equity interest in UTEL, the online university partnership in Mexico, a gain of £19m, and various other smaller disposal items.
Charges relating to acquired intangibles and acquisitions are also excluded from adjusted operating�profit�when�relevant,�as�these� items�reflect�past�acquisition�activity�and� do�not�necessarily�reflect�the�current�year�performance of the Group. Intangible amortisation and impairment charges in 2019 were £163m compared to a charge of £113m in 2018, as although acquisition activity has reduced in recent years, there was an additional £65m impairment charge in 2019 relating to acquired intangibles in the Brazil business, following a reassessment of the relative risk in that market (see also note 11�to�the�financial�statements).
In 2018, the impact of adjustments arising from�clarification�of�guaranteed�minimum�pension (GMP) equalisation legislation in the UK were excluded from adjusted operating profit,�as�outlined�below�in�the�section�on�post-retirement�benefits.
Underlying growth ratesSales decreased on a headline basis by £260m, or 6%, from £4,129m in 2018 to £3,869m in 2019, and adjusted operating profit�increased�by�£35m,�or�6%,�from�£546m�in 2018 to £581m in 2019. The headline basis simply compares the reported results for 2019 with those for 2018. We also present sales�and�adjusted�operating�profit�on�an�underlying�basis,�which�exclude�the�effects�of�exchange,�the�effect�of�portfolio�changes�arising from acquisitions and disposals, and the impact of adopting new accounting standards that are not retrospectively applied. Our portfolio change is calculated by taking
account of the contribution from acquisitions and�by�excluding�sales�and�profits�made�by�businesses disposed in either 2018 or 2019. Portfolio changes mainly relate to the sale of our US K12 Courseware business in 2019 and the sale of our WSE language teaching business�in�the�first�half�of�2018.�Acquisition�contribution�was�not�significant�in�either� 2018 or 2019.
In 2019, our underlying basis excludes the impact�on�adjusted�operating�profit�of�IFRS�16�‘Leases’. This new standard was adopted on 1�January�2019�but�the�comparative�figures�for�2018 have not been restated. The impact in 2019�was�to�increase�adjusted�operating�profit�by £25m.
On�an�underlying�basis,�sales�were�flat�in�2019,�compared to 2018, and adjusted operating profit�increased�by�6%.�Currency�movements�increased�sales�by�£97m�and�adjusted�operating�profit�by�£15m.�Portfolio�changes�decreased�sales�by�£347m,�and�together� with the impact of IFRS 16 (as noted above), decreased�adjusted�operating�profit�by�£12m.�
Adjusted earnings per shareAdjusted earnings includes adjusted operating�profit�and�adjusted�finance�and�tax�charges. A reconciliation to the statutory profit�is�shown�below:
£ millions 2019 2018
Profit�for�the�year 266 590
Non-controlling interest (2) (2)
Add back: cost of major restructuring 159 102
Add back: other net gains (16) (230)
Add back: intangible charges 163 113
Add�back:�other�net�finance�costs 2 31
Add back: impact of GMP equalisation – 8
Tax�benefit�relating�to�items�added back (123) (65)
Adjusted earnings 449 547
Weighted average number of shares (millions) 777.0 778.1
Adjusted earnings per share 57.8p 70.3p
31Overview Strategy Performance Governance Financial statements Other information

Net�finance�costs�classified�as�other�net�finance�costs�or�income�are�excluded�in�the�calculation of adjusted earnings.
Finance�income�relating�to�retirement�benefits�are excluded, as management believe the presentation�does�not�reflect�the�economic�substance of the underlying assets and liabilities. Finance costs relating to acquisition transactions are also excluded as these relate to future earnouts or acquisition expenses and�are�not�part�of�the�underlying�financing.
Foreign exchange and other gains and losses are also excluded as they represent short-term�fluctuations�in�market�value�and�are�subject�to�significant�volatility.�Other�gains�and losses may not be realised in due course, as it is normally the intention to hold the related instruments to maturity.
In 2019, the total of these items excluded from adjusted earnings was a charge of £2m compared to a charge of £31m in 2018. Finance�income�relating�to�retirement�benefits�increased from £11m in 2018 to £13m in 2019, reflecting�the�comparative�funding�position� of the plans at the beginning of each year. The remainder of the decrease was largely driven by a reduction in foreign exchange losses on unhedged cash and cash equivalents in 2019 compared to 2018.
The adjusted income tax charge excludes the�tax�benefit�or�charge�on�items�that�are�excluded�from�the�profit�or�loss�before� tax.�In�addition,�the�tax�benefit�from�tax�deductible goodwill and intangibles is added to the adjusted income tax charge, as this benefit�more�accurately�aligns�the�adjusted�tax charge with the expected rate of cash tax payments.
Operating cash flowOperating�cash�flow�is�presented�in�order� to�align�the�cash�flows�with�corresponding�adjusted�operating�profit�measures.� A�reconciliation�to�operating�cash�flow� from net cash generated from operations, the equivalent statutory measure, is shown below:
£ millions 2019 2018
Net cash generated from operations 480 547
Dividends from joint ventures and associates 64 67
Capital expenditure on property, plant, equipment and software (including leased assets) (257) (204)
Proceeds from sale of property plant, equipment and software (including disposal of leased assets) 18 128
Investment income 2 –
Add back: costs paid/ (proceeds from) major restructuring projects 111 (25)
Operating�cash�flow 418 513
Operating�cash�flow�decreased�on�a�headline�basis by £95m from £513m in 2018, to £418m in 2019. The decrease results from increased investment in pre-publication assets and other increases in net working capital, including�the�impact�of�reduced�staff�incentives and the absence of a contribution from the US K12 Courseware business, following�its�disposal�in�the�first�half�of�the�year.�These�factors�more�than�offset�a�positive�impact from the adoption of IFRS 16.
Restructuring�cash�inflow�of�£25m�in�2018�included proceeds from the sale of property primarily associated with the rationalisation of the property footprint in London and in 2019�restructuring�cash�outflow�was�£111m.�The restructuring payments made in 2019, together with the impact of the adoption of IFRS 16 (see section below ‘Adoption of new accounting standards in 2019’) largely explain the reduction in provisions and other liabilities on the balance sheet when comparing 2019 and 2018.
Other�financial�informationNet finance costs
£ millions 2019 2018
Net interest payable (41) (24)
Finance income in respect of retirement�benefits� 13 11
Other�net�finance�costs (15) (42)
Net�finance�costs (43) (55)
Net interest payable in 2019 was £41m, compared to £24m in 2018. The increase is due to the adoption of IFRS 16, which resulted in an additional £34m of net interest payable in 2019. After excluding the impact of IFRS 16, there was a reduction in net interest payable due to lower levels of average net debt, together with favourable movements in interest�on�tax,�and�the�absence�of�one-off�costs relating to the redemption of bonds.
As detailed in the adjusted earnings per share�section,�finance�income�in�respect�of�retirement�benefits,�and�other�net�finance�costs are excluded from adjusted earnings.
Capital riskThe Group’s objectives when managing capital are:
�to�maintain�a�strong�balance�sheet�and�a�solid�investment�grade�rating;�
�to�continue�to�invest�in�the�business�organically�and�through�acquisitions;
�to�have�a�sustainable�and�progressive�dividend�policy;�and
�to�return�surplus�cash�to�our�shareholders�where appropriate.
The Group is currently rated BBB (negative outlook) with Standard and Poor’s and Baa2 (stable outlook) with Moody’s.
Financial review
32 Pearson plc Annual report and accounts 2019
Net debtThe net debt position of the Group is set out below.
£ millions 2019 2018
Cash and cash equivalents 437 568
Investment�in�finance�leases 196 –
Derivative�financial�instruments 15 9
Bank loans and overdrafts (3) (43)
Revolving credit facility (230) –
Bonds (593) (672)
Lease liabilities (838) (5)
Net debt (1,016) (143)
The Group’s net debt increased from £143m at the end of 2018, to £1,016m at the end of 2019. The adoption of IFRS 16 added £666m of debt on transition, with the remainder of the increase principally due to treasury share purchases, additional capital invested in�Penguin�Random�House�and�outflows� from the US K12 Courseware business disposal transaction, which outweighed the�normal�cash�inflow�from�operations� after taking account of interest, tax and dividend payments.
Liquidity and fundingThe Group had a strong liquidity position at 31 December 2019, with over £400m of cash and�a�significant�proportion�undrawn�on� its Revolving Credit Facility due in 2024 of $1.19bn (at 31 December 2018, the Group had cash of over £500m and was undrawn on the Revolving Credit Facility).
TaxationThe�effective�tax�rate�on�adjusted�earnings� in 2019 was a charge of 16.5%, compared to�an�effective�rate�credit�of�5.2%�in�2018.� The increase is mainly due to: the lower level of�one-off�benefits�present�in�2019�compared�to 2018, including the release of provisions due to the expiry of relevant statutes of limitation;�the�reassessment�of�historical�positions,�as�well�as�a�one-off�benefit�from�a�reassessment of the tax treatment of certain items of income and expenses.
The reported tax charge on a statutory basis�in�2019�was�a�credit�of�£34m�(14.7%),�compared to a credit of £92m (18.5%) in 2018. The statutory tax credit in 2019 was primarily due to US tax losses generated on the disposal of the US K12 Courseware business.
Operating tax paid in 2019 was £9m. This was impacted by a refund received in the US relating to historical periods together, with no US tax being paid in relation to 2019 as a result of the tax loss on the sale of our US K12 Courseware business. Non-operating tax paid of £21m in 2019 relates to tax paid to the Chinese tax authorities, following the disposal of WSE during 2018, and New York state and city taxes paid in the US as a result of a settlement with the tax authorities relating to past disposals. Deferred tax liabilities reduced from £136m in 2018 to £48m in 2019, mainly due to the generation of tax losses in the US as noted above. Deferred tax assets and current tax liabilities remained relatively consistent year on year. There are contingent liabilities in relation to tax as outlined in note 34 to the financial�statements.
The Group adopted IFRIC 23 ‘Uncertainty over Income Tax Treatments’ on 1 January 2019, resulting in a reduction of £5m in provisions for uncertain tax positions. The cumulative effect�of�applying�this�adjustment�has�been�applied to retained earnings at 1 January. The impact of adopting IFRIC 23 on the income statement for 2019 was not material.
Other comprehensive incomeIncluded in other comprehensive income are the�net�exchange�differences�on�translation�of�foreign operations. The loss on translation of £115m in 2019 compares to a gain in 2018 of £90m. The loss in 2019 mainly arises from the weakness of the US dollar compared to sterling.�A�significant�proportion�of�the�Group’s operations are based in the US and the US dollar weakened in 2019 from an opening�rate�of�£1:$1.27�to�a�closing�rate�at� the end of 2019 of £1:$1.32. At the end of 2018 the US dollar had strengthened from an opening rate of £1:$1.35 to a closing rate of £1:$1.27�and�this�movement�was�the�main�reason for the gain in 2018.
Also included in other comprehensive income in 2019 is an actuarial loss of £149m in relation to�retirement�benefit�obligations�of�the�Group�and�our�share�of�the�retirement�benefit�obligations of Penguin Random House. The loss arises from the unfavourable impact of changes in the assumptions used to value the liabilities in the plans and in particular movements in the discount rate. The value of assets was also impacted following the UK plan’s purchase of insurance buy-in policies�in�the�first�half�of�2019.�The�loss�in�2019 compares to an actuarial gain in 2018 of £25m.
Post-retirement benefitsPearson operates a variety of pension and post-retirement plans. Our UK Group pension plan�has�by�far�the�largest�defined�benefit�section.�We�have�some�smaller�defined�benefit�sections�in�the�US�and�Canada�but,�outside the UK, most of our companies operate�defined�contribution�plans.�
The�charge�to�profit�in�respect�of�worldwide�pensions�and�retirement�benefits�amounted�to £56m in 2019 (2018: £56m) of which a charge�of�£69m�(2018:�£67m)�was�reported� in�adjusted�operating�profit�and�income�of�£13m (2018: £11m) was reported against other�net�finance�costs.�The�small�increase� in the operating charge in 2019 is largely explained by the absence of material past service items, which in 2018 included a credit of £11m relating to changes in the US post-retirement medical plan, and a charge of £8m relating to guaranteed minimum pension (GMP) equalisation.
The overall surplus on UK Group pension plans�of�£571m�at�the�end�of�2018�has�decreased to a surplus of £429m at the end of 2019. The decrease has arisen principally due to the actuarial loss noted above in the other comprehensive income section. In total, our worldwide net position in respect of pensions and�other�post-retirement�benefits�decreased�from�a�net�asset�of�£471m,�at�the�end�of�2018,�to�a�net�asset�of�£337m�at�the�end�of�2019.�
Adoption of new accounting standards in 2019The adoption of IFRS 16 ‘Leases’ has impacted both the income statement, as described above, and has had an impact on certain lines in the balance sheet. The lease liability (classified�as�financial�liabilities�–�borrowings)�brought onto the balance sheet at transition was £881m, with the corresponding right-of-use�asset�(classified�within�property,�plant�and�equipment) valued at £424m. In addition, certain�subleases�have�been�reclassified�as�finance�leases�resulting�in�an�additional�lease�receivable�(classified�as�other�receivables)� of £215m being brought on balance sheet. The net impact on the balance sheet is a reduction of net assets of £83m, after taking into account existing liabilities relating to onerous lease provisions (reducing provisions for other liabilities and charges by £101m), lease incentives, prepayments, adjustments to tax and the net impact on associates. The full impact of the adoption of this standard is outlined in note 1b to the consolidated�financial�statements.�
33Overview Strategy Performance Governance Financial statements Other information

The impact of adopting IFRIC 23 ‘Uncertainty over Income Tax Treatments’ had a small impact on the current tax balance but has not materially impacted the income statement (see note 1c to the consolidated financial�statements).
The impact of adopting Amendments to IFRS�9�and�IFRS�7�has�not�had�a�material�impact�on�the�financial�statements�(see�note�1d�to�the�consolidated�financial�statements).
DividendsThe dividend accounted for in our 2019 financial�statements�totalling�£147m�represents�the�final�dividend�in�respect�of�2018 (13.0p) and the interim dividend for 2019�(6.0p).�We�are�proposing�a�final�dividend�for 2019 of 13.5p bringing the total paid and payable�in�respect�of�2019�to�19.5p.�This�final�2019 dividend, which was approved by the Board in February 2020, is subject to approval at the forthcoming AGM and will be charged against�2020�profits.�For�2019,�the�dividend�is�covered 3.0 times by adjusted earnings.
Businesses held for saleFollowing the decision to sell the US K12 Courseware business, the assets and liabilities of�that�business�were�classified�as�held�for�sale on the balance sheet at the end of 2018. In March 2019, the Group completed the sale of its US K12 Courseware business, resulting in�a�pre-tax�profit�on�sale�of�£13m.�Total�gross�proceeds were £200m including £180m of deferred proceeds, which include the fair value of an unconditional vendor note for $225m, an entitlement to 20% of future cash�flows�to�equity�holders,�and�20%�of�net�proceeds in the event of a subsequent sale.
The�cash�outflow�in�the�year�relating�to�the�disposal of subsidiaries was £101m, mainly reflecting�the�deferral�of�proceeds�for�the� US K12 Courseware business and the seasonal level�of�cash�reflecting�deferred�revenue�in� the business at the disposal date.
Tax on the disposal of the US K12 Courseware business�is�estimated�to�be�a�benefit�of�£51m.�The�benefit�arises�as�the�transaction�gives�rise�to a loss for tax purposes mainly due to the differing�treatment�of�deferred�revenue�disposed in the tax computation. In addition to the tax on the US K12 Courseware business there�were�£17m�of�tax�credits�relating�to�adjustments following settlement of tax relating to prior year disposals.
In December 2019, the Group announced the sale of its remaining 25% interest in Penguin Random House. At the end of December, our share of the assets of Penguin Random House has�been�classified�as�held�for�sale�on�the�balance sheet.
Acquisitions and disposalsDuring 2019, the Group made some small acquisitions for total consideration of £40m. There�were�no�significant�acquisitions�in�2018.�
The main disposal in 2019 was the US K12 Courseware business as noted above. In 2018, the Group disposed of the Wall Street English language teaching business (WSE), realising a gain�of�£207m,�and�the�equity�interest�in�UTEL,�the online university partnership in Mexico, realising a gain of £19m. Various other smaller disposal items resulted in a net gain of £4m in 2018.
Related party transactionsTransactions with related parties are shown in note 36 of the consolidated financial�statements.
Post balance sheet events In January 2020, the Group commenced a £350m share buyback programme in connection with the announcement in December 2019 of the sale of its remaining 25% interest in Penguin Random House.
Financial review
34 Pearson plc Annual report and accounts 2019
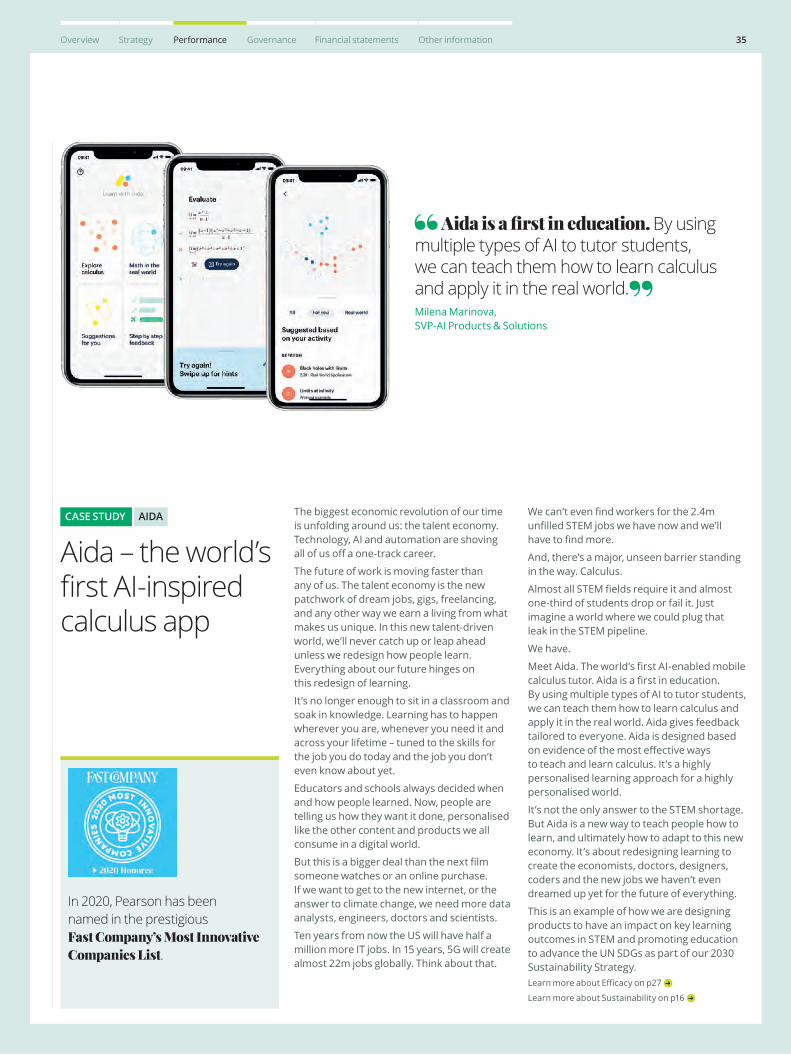
The biggest economic revolution of our time is unfolding around us: the talent economy. Technology, AI and automation are shoving all�of�us�off�a�one-track�career.�
The future of work is moving faster than any of us. The talent economy is the new patchwork of dream jobs, gigs, freelancing, and any other way we earn a living from what makes us unique. In this new talent-driven world, we’ll never catch up or leap ahead unless we redesign how people learn. Everything about our future hinges on this redesign of learning.
It’s no longer enough to sit in a classroom and soak in knowledge. Learning has to happen wherever you are, whenever you need it and across your lifetime – tuned to the skills for the job you do today and the job you don’t even know about yet.
Educators and schools always decided when and how people learned. Now, people are telling us how they want it done, personalised like the other content and products we all consume in a digital world.
But�this�is�a�bigger�deal�than�the�next�film�someone watches or an online purchase. If we want to get to the new internet, or the answer to climate change, we need more data analysts, engineers, doctors and scientists.
Ten years from now the US will have half a million more IT jobs. In 15 years, 5G will create almost 22m jobs globally. Think about that.
We�can’t�even�find�workers�for�the�2.4m�unfilled�STEM�jobs�we�have�now�and�we’ll�have�to�find�more.�
And, there’s a major, unseen barrier standing in the way. Calculus.
Almost�all�STEM�fields�require�it�and�almost�one-third of students drop or fail it. Just imagine a world where we could plug that leak in the STEM pipeline.
We have.
Meet�Aida.�The�world’s�first�AI-enabled�mobile�calculus�tutor.�Aida�is�a�first�in�education.� By using multiple types of AI to tutor students, we can teach them how to learn calculus and apply it in the real world. Aida gives feedback tailored to everyone. Aida is designed based on�evidence�of�the�most�effective�ways� to teach and learn calculus. It’s a highly personalised learning approach for a highly personalised world.
It’s not the only answer to the STEM shortage. But Aida is a new way to teach people how to learn, and ultimately how to adapt to this new economy. It’s about redesigning learning to create the economists, doctors, designers, coders and the new jobs we haven’t even dreamed up yet for the future of everything.
This is an example of how we are designing products to have an impact on key learning outcomes in STEM and promoting education to advance the UN SDGs as part of our 2030 Sustainability Strategy. Learn�more�about�Efficacy�on�p27�
Learn more about Sustainability on p16
AIDA
Aida – the world’s first AI-inspired calculus app
Aida is a first in education. By using multiple types of AI to tutor students, we can teach them how to learn calculus and apply it in the real world.Milena Marinova, SVP-AI�Products�&�Solutions
CASE STUDY
In 2020, Pearson has been named in the prestigious Fast Company’s Most Innovative Companies List.
35Overview Strategy Performance Governance Financial statements Other information
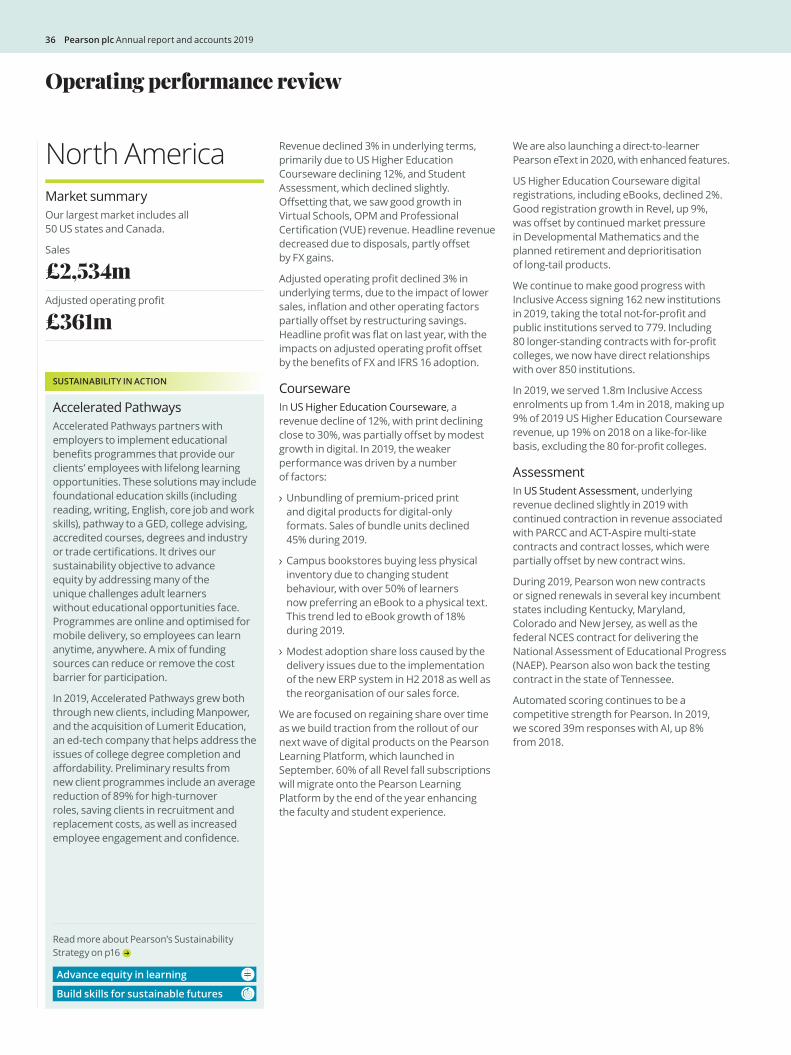
Operating performance review
Revenue declined 3% in underlying terms, primarily due to US Higher Education Courseware declining 12%, and Student Assessment, which declined slightly. Offsetting that, we saw good growth in Virtual Schools, OPM and Professional Certification (VUE) revenue. Headline revenue decreased due to disposals, partly offset by FX gains.
Adjusted operating profit declined 3% in underlying terms, due to the impact of lower sales, inflation and other operating factors partially offset by restructuring savings. Headline profit was flat on last year, with the impacts on adjusted operating profit offset by the benefits of FX and IFRS 16 adoption.
CoursewareIn US Higher Education Courseware, a revenue decline of 12%, with print declining close to 30%, was partially offset by modest growth in digital. In 2019, the weaker performance was driven by a number of factors:
Unbundling of premium-priced print and digital products for digital-only formats. Sales of bundle units declined 45% during 2019.
Campus bookstores buying less physical inventory due to changing student behaviour, with over 50% of learners now preferring an eBook to a physical text. This trend led to eBook growth of 18% during 2019.
Modest adoption share loss caused by the delivery issues due to the implementation of the new ERP system in H2 2018 as well as the reorganisation of our sales force.
We are focused on regaining share over time as we build traction from the rollout of our next wave of digital products on the Pearson Learning Platform, which launched in September. 60% of all Revel fall subscriptions will migrate onto the Pearson Learning Platform by the end of the year enhancing the faculty and student experience.
We are also launching a direct-to-learner Pearson eText in 2020, with enhanced features.
US Higher Education Courseware digital registrations, including eBooks, declined 2%. Good registration growth in Revel, up 9%, was offset by continued market pressure in Developmental Mathematics and the planned retirement and deprioritisation of long-tail products.
We continue to make good progress with Inclusive Access signing 162 new institutions in 2019, taking the total not-for-profit and public institutions served to 779. Including 80 longer-standing contracts with for-profit colleges, we now have direct relationships with over 850 institutions.
In 2019, we served 1.8m Inclusive Access enrolments up from 1.4m in 2018, making up 9% of 2019 US Higher Education Courseware revenue, up 19% on 2018 on a like-for-like basis, excluding the 80 for-profit colleges.
AssessmentIn US Student Assessment, underlying revenue declined slightly in 2019 with continued contraction in revenue associated with PARCC and ACT-Aspire multi-state contracts and contract losses, which were partially offset by new contract wins.
During 2019, Pearson won new contracts or signed renewals in several key incumbent states including Kentucky, Maryland, Colorado and New Jersey, as well as the federal NCES contract for delivering the National Assessment of Educational Progress (NAEP). Pearson also won back the testing contract in the state of Tennessee.
Automated scoring continues to be a competitive strength for Pearson. In 2019, we scored 39m responses with AI, up 8% from 2018.
Market summaryOur largest market includes all 50 US states and Canada.
Sales
£2,534mAdjusted operating profit
£361m
Accelerated PathwaysAccelerated Pathways partners with employers to implement educational benefits programmes that provide our clients’ employees with lifelong learning opportunities. These solutions may include foundational education skills (including reading, writing, English, core job and work skills), pathway to a GED, college advising, accredited courses, degrees and industry or trade certifications. It drives our sustainability objective to advance equity by addressing many of the unique challenges adult learners without educational opportunities face. Programmes are online and optimised for mobile delivery, so employees can learn anytime, anywhere. A mix of funding sources can reduce or remove the cost barrier for participation.
In 2019, Accelerated Pathways grew both through new clients, including Manpower, and the acquisition of Lumerit Education, an ed-tech company that helps address the issues of college degree completion and affordability. Preliminary results from new client programmes include an average reduction of 89% for high-turnover roles, saving clients in recruitment and replacement costs, as well as increased employee engagement and confidence.
North America
SUSTAINABILITY IN ACTION
Build skills for sustainable futures
Advance equity in learning
Read more about Pearson’s Sustainability Strategy on p16
36 Pearson plc Annual report and accounts 2019

In Professional Certification (VUE), global test volume rose 8% to c.16.5m. Revenue in North America was up a high single-digit percentage, mostly driven by the IT sector with increased demand for cloud technology certifications through Microsoft and Amazon, and volume growth in an education contract launched at the end of 2018, which is now operating at its full run rate.
We signed over 40 new contracts in 2019, including the Project Management Institute (PMI) and our renewal rate on existing contracts continues to be over 95%.
In Clinical Assessment, underlying revenue declined as demand for new product only partially offset normal declines in products in the later stages of their lifecycle.
ServicesSchool Services (Virtual Schools) grew revenue 6% and served 76,000 Full Time Equivalent (FTE) students through 42 continuing full-time virtual partner schools in 28 states, up 5% on last year.
Six new full-time, online, state-wide partner schools opened in the 2019–20 school year in the states of Oregon, Washington, Tennessee, Minnesota and California, while a contract was exited in North Carolina.
Higher Education Services (including OPM and Learning Studio) grew revenue 4%, due to growth in OPM, partially offset by a small drag from Learning Studio revenue, a learning management system, which was fully retired in 2019.
In OPM, revenue grew 9%, with growth in course registrations of 5% and new programmes launched more than offsetting programmes terminated. Our overall active programme count grew to 347 from 325 in 2018.
During 2019, we continued to optimise our portfolio and reduce the number of partners to 25 from 35. This will allow us to shift towards enterprise models where we have a number of programmes with a single partner and can benefit from economies of scale in marketing and recruitment. We are also working to integrate more content and assessment services into our partnerships.
Market summaryOur international business in established and mature education markets.
Sales
£838mAdjusted operating profit
£92m
BTECBTEC qualifications support progression to higher or further education, apprenticeships or directly into employment. Across England as a whole, 44% of white working-class students who make it to higher education have at least one BTEC. 48% of black British students accepted to higher education have at least one vocational qualification.
We are committed to increasing the number of BTEC registrations outside the UK, particularly in markets where vocational education is developing. In 2018, the Group had 33,403 registrations outside of the UK, which increased to 43,906 registrations in 2019 (an increase of 31%).
BTEC also helps to build skills for a sustainable future. Sustainability is embedded within 31% of BTEC qualifications across sectors, including engineering, logistics, construction, health, health and social care, science and IT.
We recently launched our first sustainability-backed loan, linking to our progress in increasing access to quality vocational education to learners in international markets.
Core Revenue was up 5% in underlying terms and 4% in headline terms, with growth in Student Assessment and Qualifications, including the delivery of a new digital assessment contract in Egypt, PTE Academic, OPM and Professional Certification (VUE), all partially offset by declines in Courseware.
Adjusted operating profit increased 58% in underlying terms and 61% in headline terms due to trading growth and restructuring savings.
CoursewareCourseware revenue declined moderately. Declines in School Courseware in the UK and Australia offset growth in Italy. In Higher Education Courseware, revenue declines in the UK and Europe more than offset growth in Australia.
AssessmentIn Student Assessment and Qualifications, revenue grew strongly, due to price and volume increases for A levels and GCSEs and the delivery of a new digital assessment contract in Egypt. This was partially offset by continued market declines in Apprenticeships.
We successfully delivered the National Curriculum Test (NCT) for 2019, marking 3.8m scripts, up slightly from 2018. The NCT will be delivered by another provider in 2020.
In Professional Certification (VUE), revenue was up due to good growth in the DVSA test in the UK, additional exam series added to the ICAEW contract and good growth in the MOI (French driving test) which launched in late 2017.
Clinical Assessment sales declined primarily in France and the Netherlands due to an absence of new major product introductions.
PTE Academic saw continued strong growth in test volumes in Australia and New Zealand, up 14% from 2018. This was driven by its use to support visa applications to the Australian Department of Home Affairs, as well as good growth in New Zealand. We recently announced the win of the UK Secure English Language Test (SELT) contract with the UK Home Office, which we expect to drive future growth.
ServicesIn Higher Education Services (OPM), revenue growth was driven by course enrolment growth in the UK. During the year, we also announced new OPM partnerships in Australia with the University of Adelaide and University of Wollongong.
SUSTAINABILITY IN ACTION
Build skills for sustainable futures
Advance equity in learning
Read more about Pearson’s Sustainability Strategy on p16
37Overview Strategy Performance Governance Financial statements Other information
Operating performance review
Revenue grew 4% in underlying terms due to strong growth in China and good growth in Brazil and the Middle East, partially offset by declines in South Africa. Headline revenue declined due to disposals.
Adjusted operating profit increased 24% in underlying terms, reflecting higher revenue together with the benefits of restructuring. In headline terms, adjusted operating profit increased 7% with the impact of disposals more than offset by trading and restructuring savings.
CoursewareCourseware revenue was flat in underlying terms, with growth in English Language Courseware in China and School Courseware in the Middle East and Hispano America, offset by declines in Higher Education Courseware in South Africa following a change in government funding.
AssessmentProfessional Certification (VUE) revenue grew well due to a large ICT infrastructure certification contract, and a number of new smaller contract launches in China.
PTE Academic saw strong growth in revenue with test volumes up 25% in India and China.
ServicesIn English Services, underlying revenue grew slightly in our English Language School franchise in Brazil due to new product launches.
In School Services, underlying revenue grew slightly due to price increases and new product launches in our sistemas in Brazil.
In Higher Education Services, enrolments grew 3% at the Pearson Institute of Higher Education (formerly CTI), however revenue declined modestly due to changes in mix.
GrowthMarket summaryEmerging and developing economies with investment priorities in Brazil, India, South Africa, Hispano-America, China and the Middle East.
Sales
£497mAdjusted operating profit
£63m
ChinaWe have taken action to assist learners as the COVID-19 epidemic has taken hold in China. As schools across China have been closed down to prevent the further spread of the illness, Pearson has made dozens of online products and courses available for free to students unable to attend school.
Both students and teachers have welcomed these resources. For example, there were over 60,000 applicants to International Connections Academy and almost 200,000 people are using free AI learning resources on the Longman English Plus WeChat Platform, known as ‘Longman Xiaoying.’
Penguin Random House
Adjusted operating profit
£65m
Pearson owns 25% of Penguin Random House, the first truly global consumer book publishing company.
Penguin Random House performed solidly with underlying revenue growth from a rise in audio sales, stable print sales, and the industry’s top bestsellers, including Where the Crawdads Sing by Delia Owen, Becoming by Michelle Obama, and bestselling books by Margaret Atwood, Tara Westover, Lee Child, Jamie Oliver, Jeff Kinney, and Dr. Seuss.
We announced the sale of the remaining 25% in Penguin Random House on 18 December 2019. The transaction is expected to close in H1 2020.
SUSTAINABILITY IN ACTION
Build skills for sustainable futures
Advance equity in learning
Read more about Pearson’s Sustainability Strategy on p16
38 Pearson plc Annual report and accounts 2019

I have the flexibility to work with others to make STEM less intimidating without sacrificing the quality of my education.Madison Kenney
39Overview Strategy Performance Governance Financial statements Other information
Madison Kenney has a passion for STEM and wants to share that enthusiasm with other young female students. STEM is often intimidating and Madison has made it her mission to work with female students to make STEM more approachable. To allow Madison to spend more time on this mission, her mother enrolled her in Connections Academy, Pearson’s Virtual Schools programme for students in K12.
“I was first introduced to robotics at a Girl Scout Expo and immediately knew that this is what I wanted to do,” says Madison. “Attending Connections Academy gives me the flexibility to work with others to make STEM less intimidating without sacrificing the quality of my education.”
Madison keeps a busy schedule coaching FIRST Lego League and Seaperch, and has earned several awards for STEM excellence, including the Prudential Spirit of Community Award and the President’s Volunteer Service Award, among others.
Madison is also a full-time, dual-enrolled student at Kennesaw State University, and hopes to pursue a career as a mechatronics engineer for NASA. Madison says, “Online learning helped prepare me for college as it has made me an independent and motivated learner.”
Efficacy research shows that Connections Academy students like Madison can receive the same quality of education as that offered at their local public school, while simultaneously taking advantage of the benefits offered to them by virtual schools.
Pearson and Virtual Schools Pearson delivers K12 online education to schools and students across the US and internationally. Solutions include the accredited Connections Academy, an online school programme which is delivered via full-time, online public schools. This is an option for families seeking personalised learning and a high-quality alternative to the traditional classroom. A global online private school, International Connections Academy, is also available.
This is an example of how we are designing products to have an impact on key learning outcomes and promoting education to advance the UN SDGs as part of our 2030 Sustainability Strategy. We will release a new Efficacy Report on Virtual Schools later in 2020. Learn more about Efficacy on p27
Learn more about Sustainability on p16
Online school provides opportunity for young students to pursue passions and achieve their dreams Read the 2018 efficacy report: www.pearson.com/corporate/ efficacy-and-research/reports/ connections-academy.html
VIRTUAL SCHOOLSCASE STUDY
Our risk management process is used to identify and mitigate our exposures and, where possible, turn risks into business opportunities. The focus of our risk management process, which we call ‘organisational risk management’, is on identifying, analysing, managing and mitigating risks, with our goal to support Pearson in meeting its strategic and operational objectives.
Our risk approach aligns to international standards (e.g. COSO and ISO 31000) and aids our continued compliance with the Financial Reporting Council’s (FRC) UK Corporate Governance Code guidance on risk management, also enabling us to adapt to any required changes in approach.
The risk reporting process is carried out biannually and reviewed by the Audit Committee and the Board. During the year, the Audit Committee and Board conduct deep dives into selected principal risks.
Principal risks and uncertaintiesIn 2019, the Board of Directors undertook a robust assessment of the current principal and emerging risks facing Pearson, in accordance with provision 28 of the 2018 UK Corporate Governance Code.
Listed in the table and shown on the adjacent risk map are the most significant risks that may affect Pearson’s future. A longer list of business area and company-wide risks is monitored and reviewed internally throughout the year. The most material risks are those which have a higher probability and significant impact on strategy, reputation or operations, or a financial impact greater than £50m, and are classed as our principal risks.
Brexit The UK exited the EU on 31 January 2020. Given the prolonged negotiation process during 2019, we continued our mitigation planning, led by a Steering Committee chaired by the CFO. We worked to identify and mitigate any potential impact on our principal risks, including supply chain and operations (covered in the customer experience risk), tax and data privacy, treasury, workforce mobility and more. By virtue of that analysis and mitigation planning, we continue to believe that Brexit will not have a material adverse impact on Pearson as a whole; and we have plans in place to ensure we continue with business as usual.
Coronavirus (COVID-19)At the time of publication of our annual report, the COVID-19 outbreak in China and globally is an emerging risk that is being closely monitored on a day-by-day basis. Our primary focus is on ensuring the safety and well-being of our employees, customers and learners. We have invoked our business resilience plans to help support our customers and maintain our business operations. At this time, we do not believe that COVID-19 will have a material adverse impact on Pearson’s financial results. We are actively continuing to monitor the situation.
Mitigation and controlsThroughout all 14 principal risks, Pearson adopts mitigation activities in the form of internal controls, as part of regular internal meetings and external consultations. These include reporting to the Board, reporting to Pearson’s Executive management team, and monitoring compliance with Pearson policies, international regulations and standards.
The following principal risks also relate to the material issues considered in the Sustainability section of this report on p16: products and services, testing failure, political and regulatory, information security and data privacy, customer experience, and safety and security.
Organisational risk management
40 Pearson plc Annual report and accounts 2019
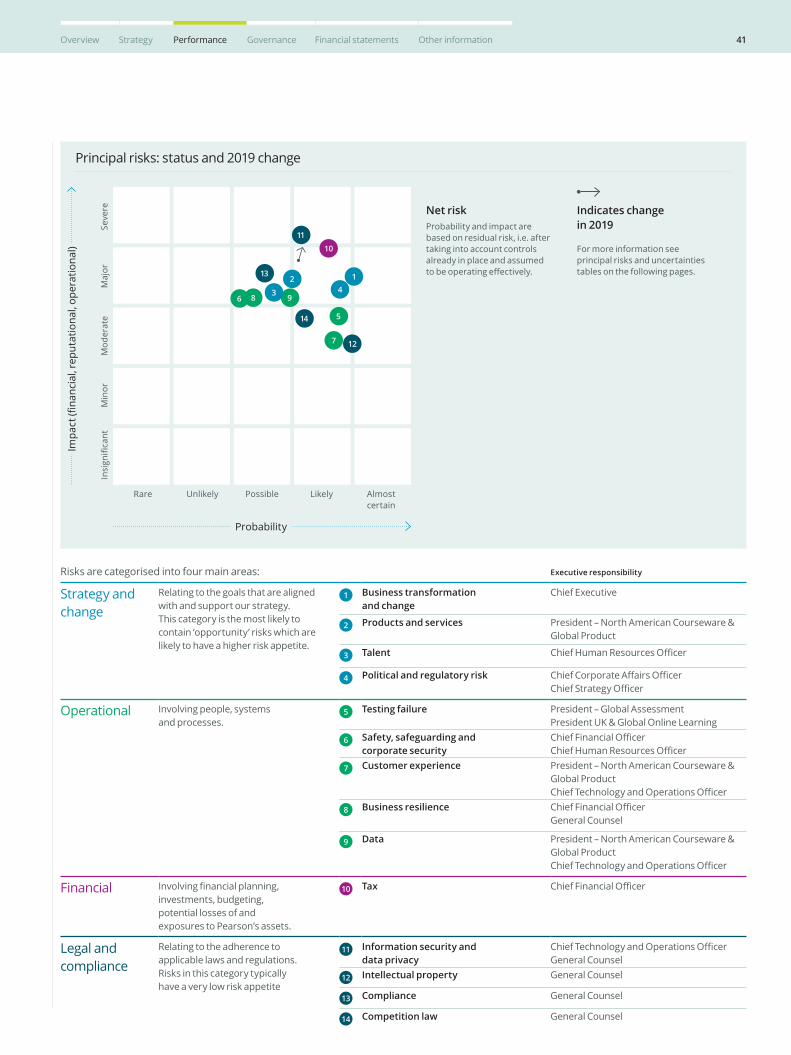
Risks are categorised into four main areas: Executive responsibility
Strategy and change
Relating to the goals that are aligned with and support our strategy. This category is the most likely to contain ‘opportunity’ risks which are likely to have a higher risk appetite.
1 Business transformation and change
Chief Executive
2 Products and services President – North American Courseware & Global Product
3 Talent Chief Human Resources Officer
4 Political and regulatory risk Chief Corporate Affairs Officer Chief Strategy Officer
Operational Involving people, systems and processes.
5 Testing failure President – Global Assessment President UK & Global Online Learning
6 Safety, safeguarding and corporate security
Chief Financial Officer Chief Human Resources Officer
7 Customer experience President – North American Courseware & Global Product Chief Technology and Operations Officer
8 Business resilience Chief Financial Officer General Counsel
9 Data President – North American Courseware & Global Product Chief Technology and Operations Officer
Financial Involving financial planning, investments, budgeting, potential losses of and exposures to Pearson’s assets.
10 Tax Chief Financial Officer
Legal and compliance
Relating to the adherence to applicable laws and regulations. Risks in this category typically have a very low risk appetite
11 Information security and data privacy
Chief Technology and Operations Officer General Counsel
12 Intellectual property General Counsel
13 Compliance General Counsel
14 Competition law General Counsel
Principal risks: status and 2019 change
Impa
ct (fi
nanc
ial,
repu
tatio
nal,
oper
atio
nal)
Rare Unlikely Possible Likely Almost certain
Insi
gnifi
cant
Min
orM
oder
ate
Maj
orSe
vere
2
10
113
11
14
4
12
8
5
7
Probability
96
Indicates change in 2019
Net risk Probability and impact are based on residual risk, i.e. after taking into account controls already in place and assumed to be operating effectively.
For more information see principal risks and uncertainties tables on the following pages.
3
41Overview Strategy Performance Governance Financial statements Other information
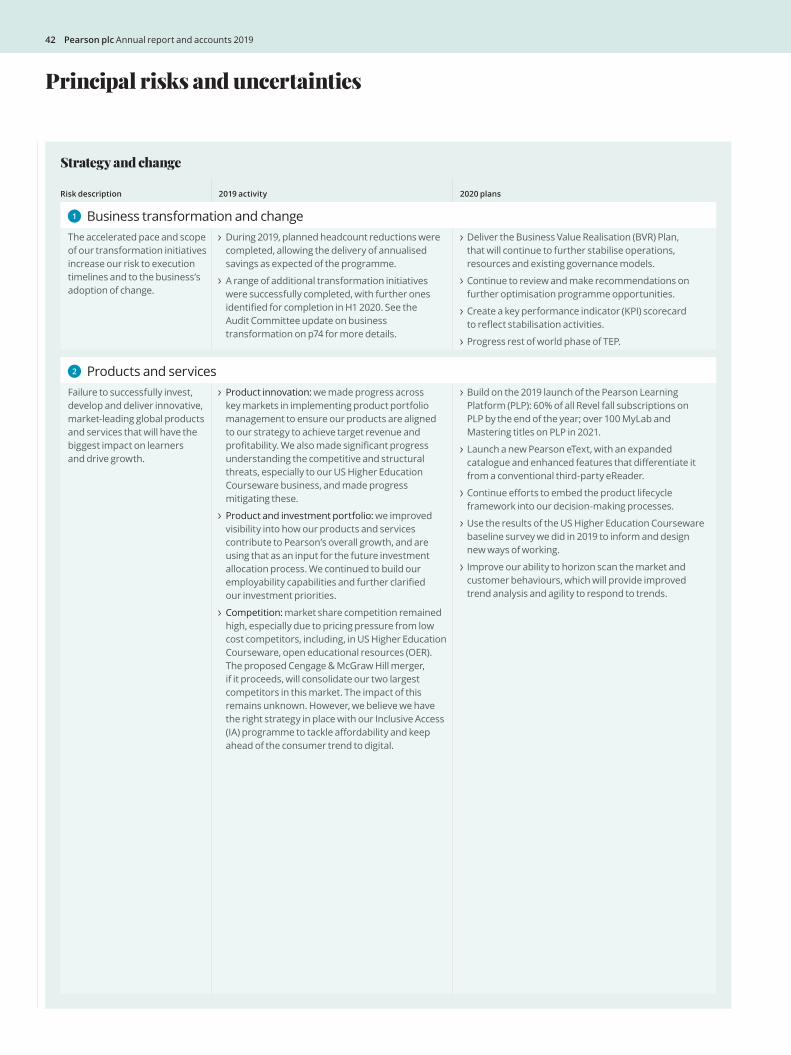
Risk description 2019 activity 2020 plans
1 Business transformation and changeThe accelerated pace and scope of our transformation initiatives increase our risk to execution timelines and to the business’s adoption of change.
During 2019, planned headcount reductions were completed, allowing the delivery of annualised savings as expected of the programme.
A range of additional transformation initiatives were successfully completed, with further ones identified for completion in H1 2020. See the Audit Committee update on business transformation on p74 for more details.
Deliver the Business Value Realisation (BVR) Plan, that will continue to further stabilise operations, resources and existing governance models.
Continue to review and make recommendations on further optimisation programme opportunities.
Create a key performance indicator (KPI) scorecard to reflect stabilisation activities.
Progress rest of world phase of TEP.
2 Products and servicesFailure to successfully invest, develop and deliver innovative, market-leading global products and services that will have the biggest impact on learners and drive growth.
Product innovation: we made progress across key markets in implementing product portfolio management to ensure our products are aligned to our strategy to achieve target revenue and profitability. We also made significant progress understanding the competitive and structural threats, especially to our US Higher Education Courseware business, and made progress mitigating these.
Product and investment portfolio: we improved visibility into how our products and services contribute to Pearson’s overall growth, and are using that as an input for the future investment allocation process. We continued to build our employability capabilities and further clarified our investment priorities.
Competition: market share competition remained high, especially due to pricing pressure from low cost competitors, including, in US Higher Education Courseware, open educational resources (OER). The proposed Cengage & McGraw Hill merger, if it proceeds, will consolidate our two largest competitors in this market. The impact of this remains unknown. However, we believe we have the right strategy in place with our Inclusive Access (IA) programme to tackle affordability and keep ahead of the consumer trend to digital.
Build on the 2019 launch of the Pearson Learning Platform (PLP): 60% of all Revel fall subscriptions on PLP by the end of the year; over 100 MyLab and Mastering titles on PLP in 2021.
Launch a new Pearson eText, with an expanded catalogue and enhanced features that differentiate it from a conventional third-party eReader.
Continue efforts to embed the product lifecycle framework into our decision-making processes.
Use the results of the US Higher Education Courseware baseline survey we did in 2019 to inform and design new ways of working.
Improve our ability to horizon scan the market and customer behaviours, which will provide improved trend analysis and agility to respond to trends.
Strategy and change
Principal risks and uncertainties
42 Pearson plc Annual report and accounts 2019
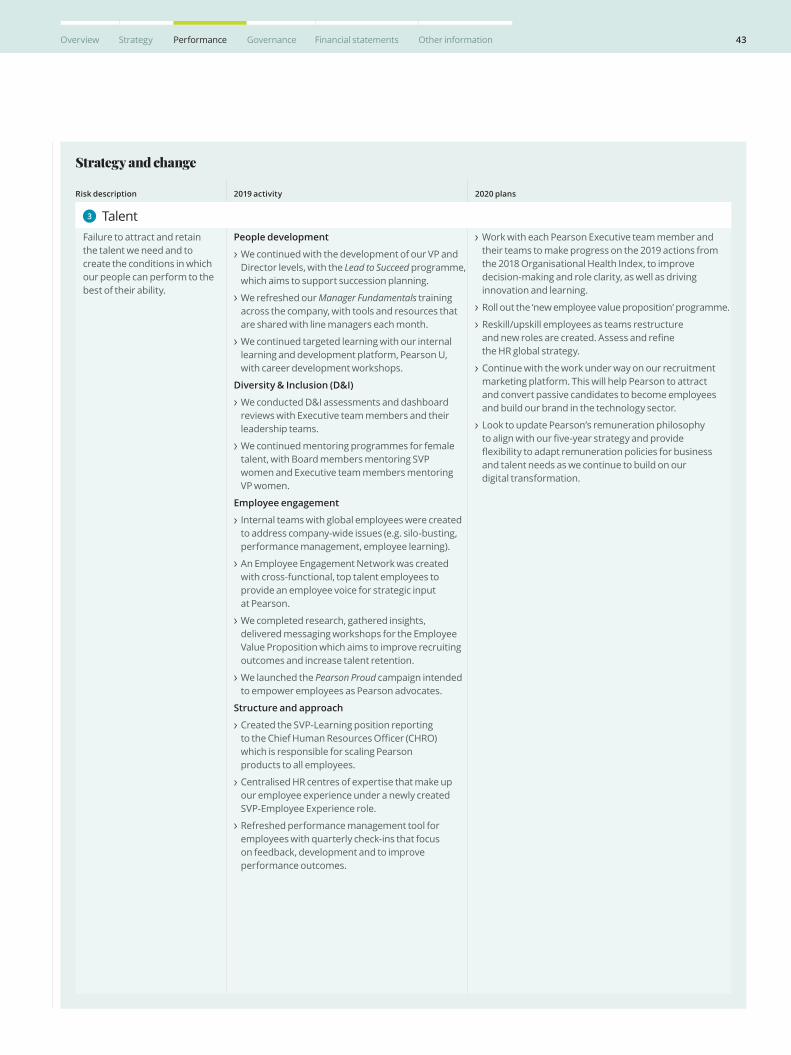
Risk description 2019 activity 2020 plans
3 TalentFailure to attract and retain the talent we need and to create the conditions in which our people can perform to the best of their ability.
People development
We continued with the development of our VP and Director levels, with the Lead to Succeed programme, which aims to support succession planning.
We refreshed our Manager Fundamentals training across the company, with tools and resources that are shared with line managers each month.
We continued targeted learning with our internal learning and development platform, Pearson U, with career development workshops.
Diversity & Inclusion (D&I)
We conducted D&I assessments and dashboard reviews with Executive team members and their leadership teams.
We continued mentoring programmes for female talent, with Board members mentoring SVP women and Executive team members mentoring VP women.
Employee engagement
Internal teams with global employees were created to address company-wide issues (e.g. silo-busting, performance management, employee learning).
An Employee Engagement Network was created with cross-functional, top talent employees to provide an employee voice for strategic input at Pearson.
We completed research, gathered insights, delivered messaging workshops for the Employee Value Proposition which aims to improve recruiting outcomes and increase talent retention.
We launched the Pearson Proud campaign intended to empower employees as Pearson advocates.
Structure and approach
Created the SVP-Learning position reporting to the Chief Human Resources Officer (CHRO) which is responsible for scaling Pearson products to all employees.
Centralised HR centres of expertise that make up our employee experience under a newly created SVP-Employee Experience role.
Refreshed performance management tool for employees with quarterly check-ins that focus on feedback, development and to improve performance outcomes.
Work with each Pearson Executive team member and their teams to make progress on the 2019 actions from the 2018 Organisational Health Index, to improve decision-making and role clarity, as well as driving innovation and learning.
Roll out the ‘new employee value proposition’ programme.
Reskill/upskill employees as teams restructure and new roles are created. Assess and refine the HR global strategy.
Continue with the work under way on our recruitment marketing platform. This will help Pearson to attract and convert passive candidates to become employees and build our brand in the technology sector.
Look to update Pearson’s remuneration philosophy to align with our five-year strategy and provide flexibility to adapt remuneration policies for business and talent needs as we continue to build on our digital transformation.
Strategy and change
43Overview Strategy Performance Governance Financial statements Other information
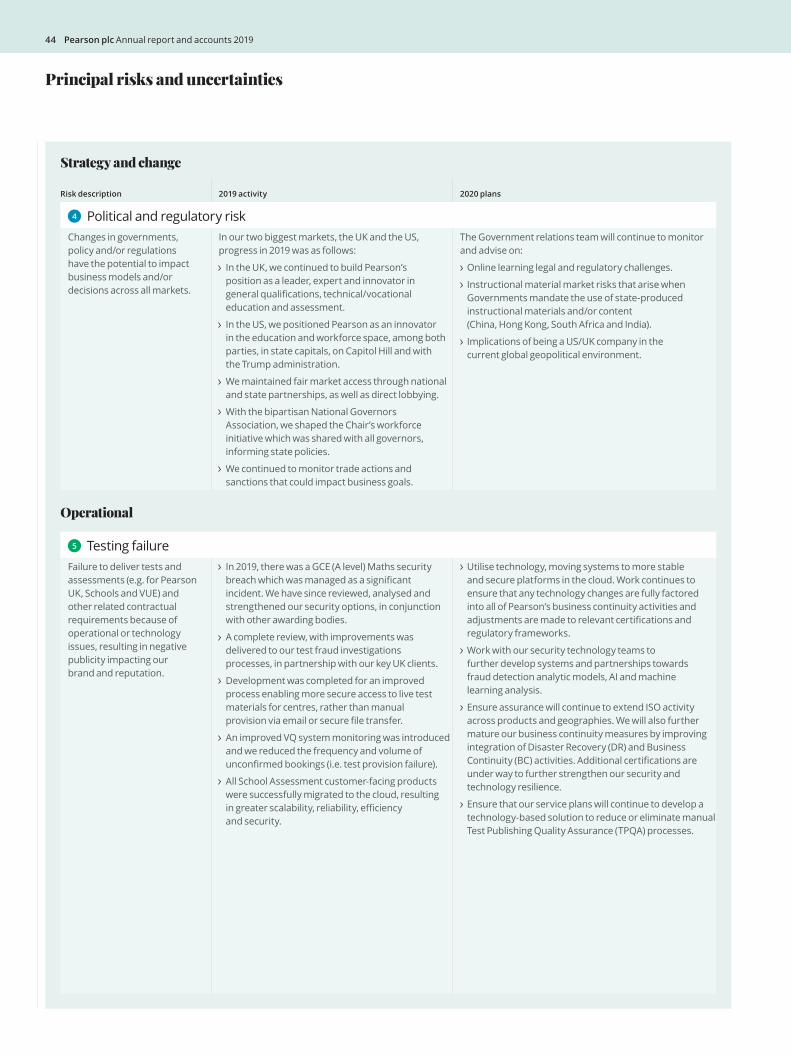
Principal risks and uncertainties
Risk description 2019 activity 2020 plans
4 Political and regulatory riskChanges in governments, policy and/or regulations have the potential to impact business models and/or decisions across all markets.
In our two biggest markets, the UK and the US, progress in 2019 was as follows:
In the UK, we continued to build Pearson’s position as a leader, expert and innovator in general qualifications, technical/vocational education and assessment.
In the US, we positioned Pearson as an innovator in the education and workforce space, among both parties, in state capitals, on Capitol Hill and with the Trump administration.
We maintained fair market access through national and state partnerships, as well as direct lobbying.
With the bipartisan National Governors Association, we shaped the Chair’s workforce initiative which was shared with all governors, informing state policies.
We continued to monitor trade actions and sanctions that could impact business goals.
The Government relations team will continue to monitor and advise on:
Online learning legal and regulatory challenges.
Instructional material market risks that arise when Governments mandate the use of state-produced instructional materials and/or content (China, Hong Kong, South Africa and India).
Implications of being a US/UK company in the current global geopolitical environment.
Operational
5 Testing failureFailure to deliver tests and assessments (e.g. for Pearson UK, Schools and VUE) and other related contractual requirements because of operational or technology issues, resulting in negative publicity impacting our brand and reputation.
In 2019, there was a GCE (A level) Maths security breach which was managed as a significant incident. We have since reviewed, analysed and strengthened our security options, in conjunction with other awarding bodies.
A complete review, with improvements was delivered to our test fraud investigations processes, in partnership with our key UK clients.
Development was completed for an improved process enabling more secure access to live test materials for centres, rather than manual provision via email or secure file transfer.
An improved VQ system monitoring was introduced and we reduced the frequency and volume of unconfirmed bookings (i.e. test provision failure).
All School Assessment customer-facing products were successfully migrated to the cloud, resulting in greater scalability, reliability, efficiency and security.
Utilise technology, moving systems to more stable and secure platforms in the cloud. Work continues to ensure that any technology changes are fully factored into all of Pearson’s business continuity activities and adjustments are made to relevant certifications and regulatory frameworks.
Work with our security technology teams to further develop systems and partnerships towards fraud detection analytic models, AI and machine learning analysis.
Ensure assurance will continue to extend ISO activity across products and geographies. We will also further mature our business continuity measures by improving integration of Disaster Recovery (DR) and Business Continuity (BC) activities. Additional certifications are under way to further strengthen our security and technology resilience.
Ensure that our service plans will continue to develop a technology-based solution to reduce or eliminate manual Test Publishing Quality Assurance (TPQA) processes.
Strategy and change
44 Pearson plc Annual report and accounts 2019
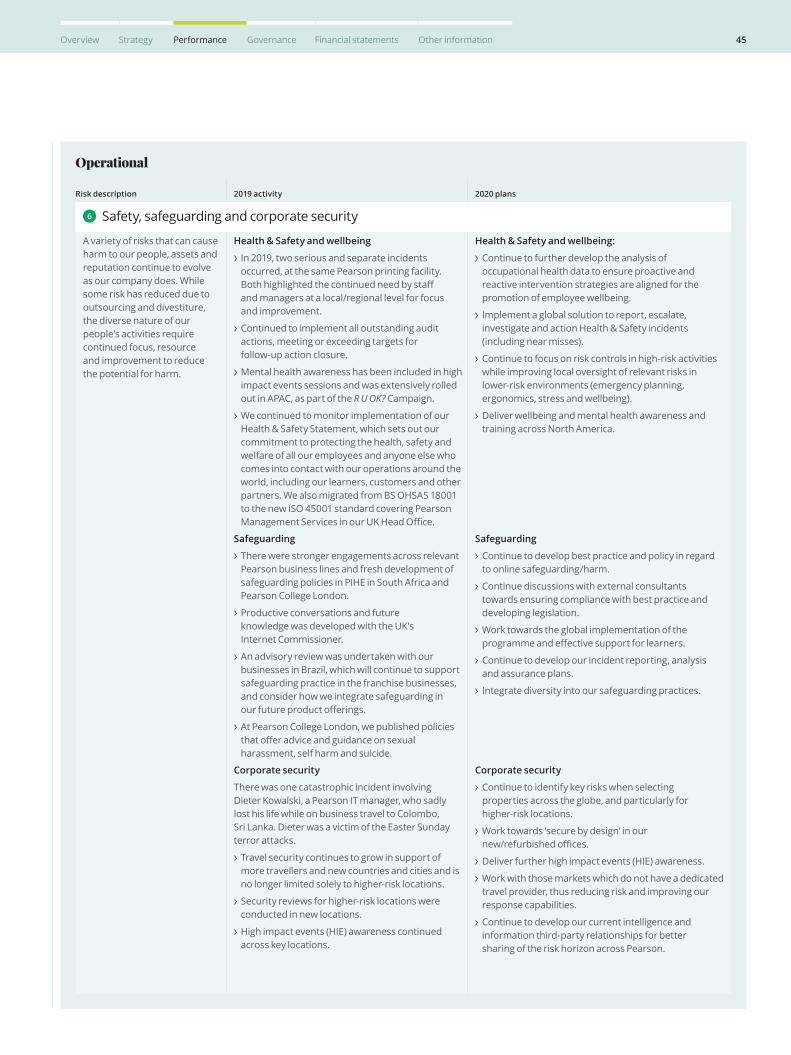
Risk description 2019 activity 2020 plans
6 Safety, safeguarding and corporate security
A variety of risks that can cause harm to our people, assets and reputation continue to evolve as our company does. While some risk has reduced due to outsourcing and divestiture, the diverse nature of our people’s activities require continued focus, resource and improvement to reduce the potential for harm.
Health & Safety and wellbeing
In 2019, two serious and separate incidents occurred, at the same Pearson printing facility. Both highlighted the continued need by staff and managers at a local/regional level for focus and improvement.
Continued to implement all outstanding audit actions, meeting or exceeding targets for follow-up action closure.
Mental health awareness has been included in high impact events sessions and was extensively rolled out in APAC, as part of the R U OK? Campaign.
We continued to monitor implementation of our Health & Safety Statement, which sets out our commitment to protecting the health, safety and welfare of all our employees and anyone else who comes into contact with our operations around the world, including our learners, customers and other partners. We also migrated from BS OHSAS 18001 to the new ISO 45001 standard covering Pearson Management Services in our UK Head Office.
Health & Safety and wellbeing:
Continue to further develop the analysis of occupational health data to ensure proactive and reactive intervention strategies are aligned for the promotion of employee wellbeing.
Implement a global solution to report, escalate, investigate and action Health & Safety incidents (including near misses).
Continue to focus on risk controls in high-risk activities while improving local oversight of relevant risks in lower-risk environments (emergency planning, ergonomics, stress and wellbeing).
Deliver wellbeing and mental health awareness and training across North America.
Safeguarding
There were stronger engagements across relevant Pearson business lines and fresh development of safeguarding policies in PIHE in South Africa and Pearson College London.
Productive conversations and future knowledge was developed with the UK’s Internet Commissioner.
An advisory review was undertaken with our businesses in Brazil, which will continue to support safeguarding practice in the franchise businesses, and consider how we integrate safeguarding in our future product offerings.
At Pearson College London, we published policies that offer advice and guidance on sexual harassment, self harm and suicide.
Safeguarding
Continue to develop best practice and policy in regard to online safeguarding/harm.
Continue discussions with external consultants towards ensuring compliance with best practice and developing legislation.
Work towards the global implementation of the programme and effective support for learners.
Continue to develop our incident reporting, analysis and assurance plans.
Integrate diversity into our safeguarding practices.
Corporate security
There was one catastrophic incident involving Dieter Kowalski, a Pearson IT manager, who sadly lost his life while on business travel to Colombo, Sri Lanka. Dieter was a victim of the Easter Sunday terror attacks.
Travel security continues to grow in support of more travellers and new countries and cities and is no longer limited solely to higher-risk locations.
Security reviews for higher-risk locations were conducted in new locations.
High impact events (HIE) awareness continued across key locations.
Corporate security
Continue to identify key risks when selecting properties across the globe, and particularly for higher-risk locations.
Work towards ‘secure by design’ in our new/refurbished offices.
Deliver further high impact events (HIE) awareness.
Work with those markets which do not have a dedicated travel provider, thus reducing risk and improving our response capabilities.
Continue to develop our current intelligence and information third-party relationships for better sharing of the risk horizon across Pearson.
Operational
45Overview Strategy Performance Governance Financial statements Other information
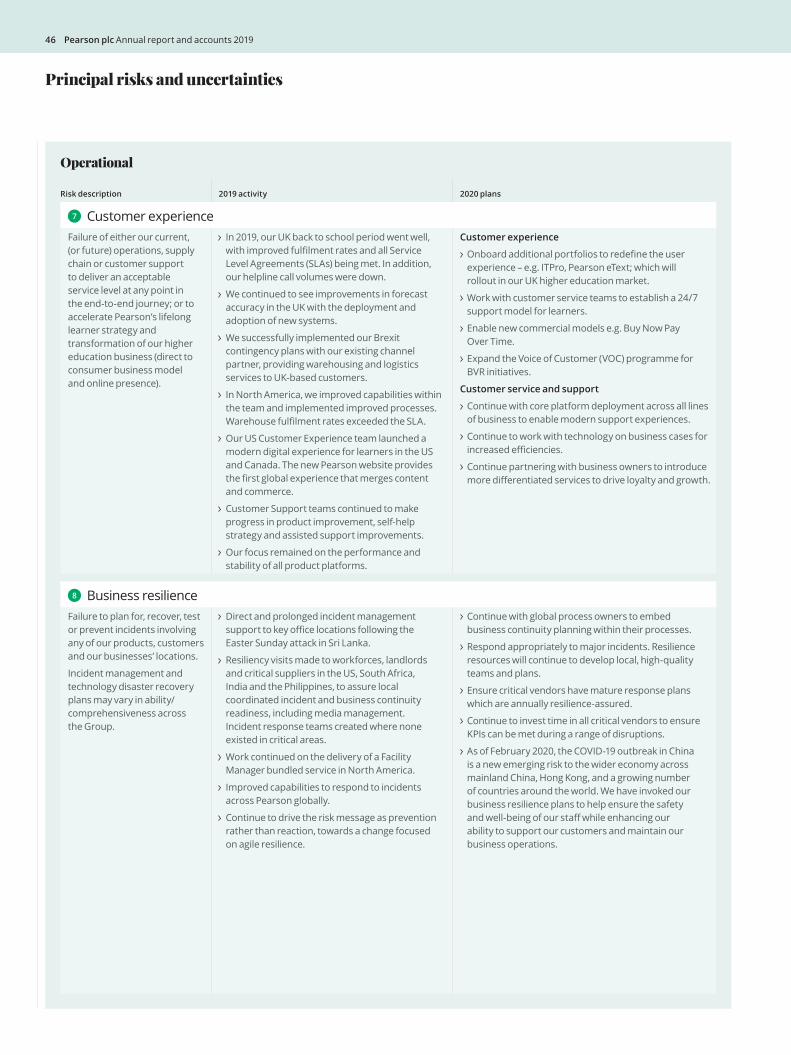
Principal risks and uncertainties
Risk description 2019 activity 2020 plans
7 Customer experienceFailure of either our current, (or future) operations, supply chain or customer support to deliver an acceptable service level at any point in the end-to-end journey; or to accelerate Pearson’s lifelong learner strategy and transformation of our higher education business (direct to consumer business model and online presence).
In 2019, our UK back to school period went well, with improved fulfilment rates and all Service Level Agreements (SLAs) being met. In addition, our helpline call volumes were down.
We continued to see improvements in forecast accuracy in the UK with the deployment and adoption of new systems.
We successfully implemented our Brexit contingency plans with our existing channel partner, providing warehousing and logistics services to UK-based customers.
In North America, we improved capabilities within the team and implemented improved processes. Warehouse fulfilment rates exceeded the SLA.
Our US Customer Experience team launched a modern digital experience for learners in the US and Canada. The new Pearson website provides the first global experience that merges content and commerce.
Customer Support teams continued to make progress in product improvement, self-help strategy and assisted support improvements.
Our focus remained on the performance and stability of all product platforms.
Customer experience
Onboard additional portfolios to redefine the user experience – e.g. ITPro, Pearson eText; which will rollout in our UK higher education market.
Work with customer service teams to establish a 24/7 support model for learners.
Enable new commercial models e.g. Buy Now Pay Over Time.
Expand the Voice of Customer (VOC) programme for BVR initiatives.
Customer service and support
Continue with core platform deployment across all lines of business to enable modern support experiences.
Continue to work with technology on business cases for increased efficiencies.
Continue partnering with business owners to introduce more differentiated services to drive loyalty and growth.
8 Business resilienceFailure to plan for, recover, test or prevent incidents involving any of our products, customers and our businesses’ locations.
Incident management and technology disaster recovery plans may vary in ability/comprehensiveness across the Group.
Direct and prolonged incident management support to key office locations following the Easter Sunday attack in Sri Lanka.
Resiliency visits made to workforces, landlords and critical suppliers in the US, South Africa, India and the Philippines, to assure local coordinated incident and business continuity readiness, including media management. Incident response teams created where none existed in critical areas.
Work continued on the delivery of a Facility Manager bundled service in North America.
Improved capabilities to respond to incidents across Pearson globally.
Continue to drive the risk message as prevention rather than reaction, towards a change focused on agile resilience.
Continue with global process owners to embed business continuity planning within their processes.
Respond appropriately to major incidents. Resilience resources will continue to develop local, high-quality teams and plans.
Ensure critical vendors have mature response plans which are annually resilience-assured.
Continue to invest time in all critical vendors to ensure KPIs can be met during a range of disruptions.
As of February 2020, the COVID-19 outbreak in China is a new emerging risk to the wider economy across mainland China, Hong Kong, and a growing number of countries around the world. We have invoked our business resilience plans to help ensure the safety and well-being of our staff while enhancing our ability to support our customers and maintain our business operations.
Operational
46 Pearson plc Annual report and accounts 2019
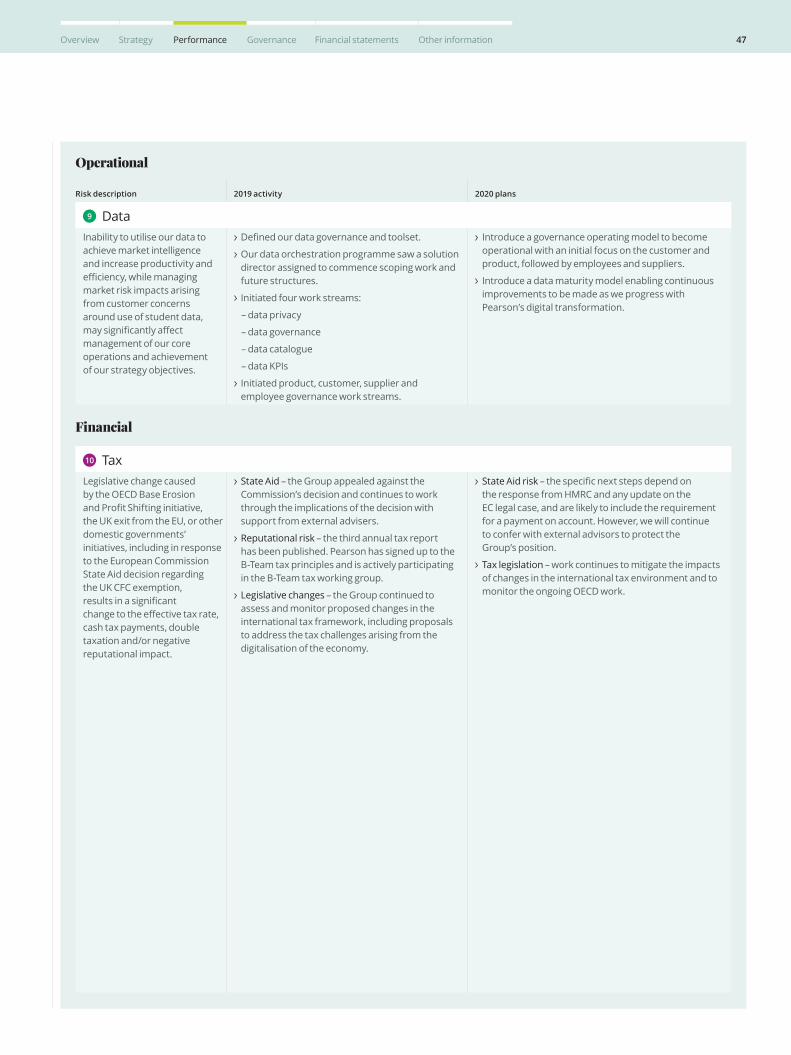
Risk description 2019 activity 2020 plans
9 DataInability to utilise our data to achieve market intelligence and increase productivity and efficiency, while managing market risk impacts arising from customer concerns around use of student data, may significantly affect management of our core operations and achievement of our strategy objectives.
Defined our data governance and toolset.
Our data orchestration programme saw a solution director assigned to commence scoping work and future structures.
Initiated four work streams:
– data privacy
– data governance
– data catalogue
– data KPIs
Initiated product, customer, supplier and employee governance work streams.
Introduce a governance operating model to become operational with an initial focus on the customer and product, followed by employees and suppliers.
Introduce a data maturity model enabling continuous improvements to be made as we progress with Pearson’s digital transformation.
Financial
10 TaxLegislative change caused by the OECD Base Erosion and Profit Shifting initiative, the UK exit from the EU, or other domestic governments’ initiatives, including in response to the European Commission State Aid decision regarding the UK CFC exemption, results in a significant change to the effective tax rate, cash tax payments, double taxation and/or negative reputational impact.
State Aid – the Group appealed against the Commission’s decision and continues to work through the implications of the decision with support from external advisers.
Reputational risk – the third annual tax report has been published. Pearson has signed up to the B-Team tax principles and is actively participating in the B-Team tax working group.
Legislative changes – the Group continued to assess and monitor proposed changes in the international tax framework, including proposals to address the tax challenges arising from the digitalisation of the economy.
State Aid risk – the specific next steps depend on the response from HMRC and any update on the EC legal case, and are likely to include the requirement for a payment on account. However, we will continue to confer with external advisors to protect the Group’s position.
Tax legislation – work continues to mitigate the impacts of changes in the international tax environment and to monitor the ongoing OECD work.
Operational
47Overview Strategy Performance Governance Financial statements Other information
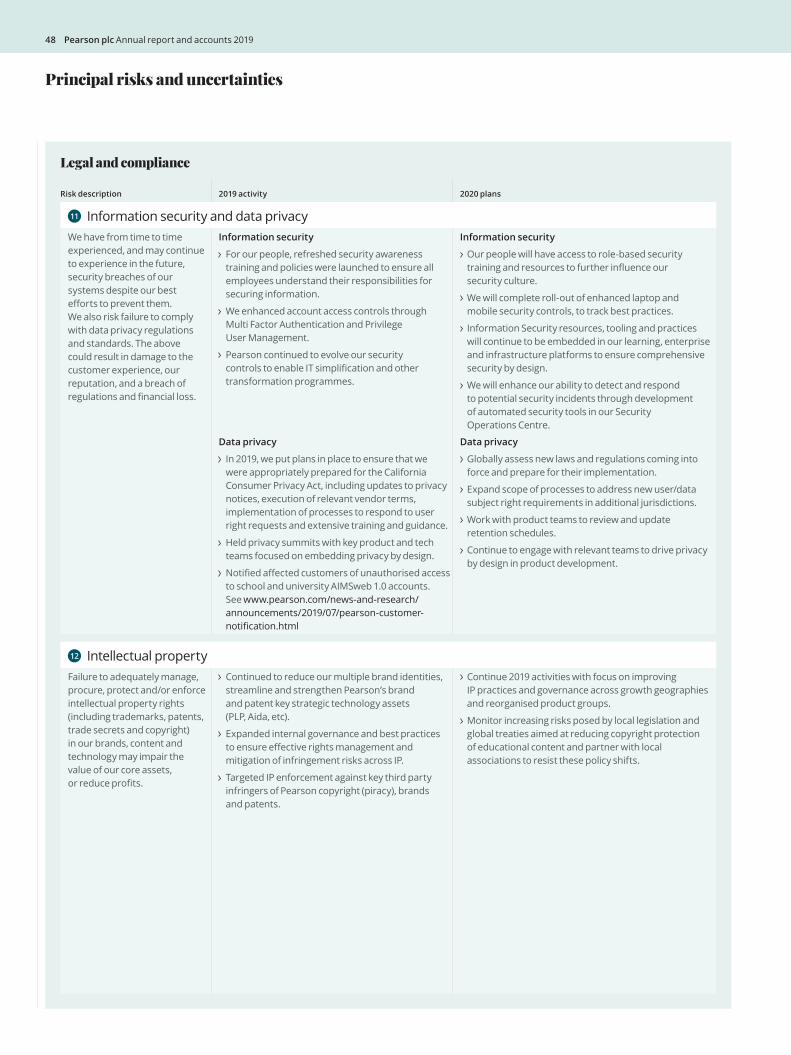
Principal risks and uncertainties
Risk description 2019 activity 2020 plans
11 Information security and data privacyWe have from time to time experienced, and may continue to experience in the future, security breaches of our systems despite our best efforts to prevent them. We also risk failure to comply with data privacy regulations and standards. The above could result in damage to the customer experience, our reputation, and a breach of regulations and financial loss.
Information security
For our people, refreshed security awareness training and policies were launched to ensure all employees understand their responsibilities for securing information.
We enhanced account access controls through Multi Factor Authentication and Privilege User Management.
Pearson continued to evolve our security controls to enable IT simplification and other transformation programmes.
Information security
Our people will have access to role-based security training and resources to further influence our security culture.
We will complete roll-out of enhanced laptop and mobile security controls, to track best practices.
Information Security resources, tooling and practices will continue to be embedded in our learning, enterprise and infrastructure platforms to ensure comprehensive security by design.
We will enhance our ability to detect and respond to potential security incidents through development of automated security tools in our Security Operations Centre.
Data privacy
In 2019, we put plans in place to ensure that we were appropriately prepared for the California Consumer Privacy Act, including updates to privacy notices, execution of relevant vendor terms, implementation of processes to respond to user right requests and extensive training and guidance.
Held privacy summits with key product and tech teams focused on embedding privacy by design.
Notified affected customers of unauthorised access to school and university AIMSweb 1.0 accounts. See www.pearson.com/news-and-research/announcements/2019/07/pearson-customer-notification.html
Data privacy
Globally assess new laws and regulations coming into force and prepare for their implementation.
Expand scope of processes to address new user/data subject right requirements in additional jurisdictions.
Work with product teams to review and update retention schedules.
Continue to engage with relevant teams to drive privacy by design in product development.
12 Intellectual propertyFailure to adequately manage, procure, protect and/or enforce intellectual property rights (including trademarks, patents, trade secrets and copyright) in our brands, content and technology may impair the value of our core assets, or reduce profits.
Continued to reduce our multiple brand identities, streamline and strengthen Pearson’s brand and patent key strategic technology assets (PLP, Aida, etc).
Expanded internal governance and best practices to ensure effective rights management and mitigation of infringement risks across IP.
Targeted IP enforcement against key third party infringers of Pearson copyright (piracy), brands and patents.
Continue 2019 activities with focus on improving IP practices and governance across growth geographies and reorganised product groups.
Monitor increasing risks posed by local legislation and global treaties aimed at reducing copyright protection of educational content and partner with local associations to resist these policy shifts.
Legal and compliance
48 Pearson plc Annual report and accounts 2019
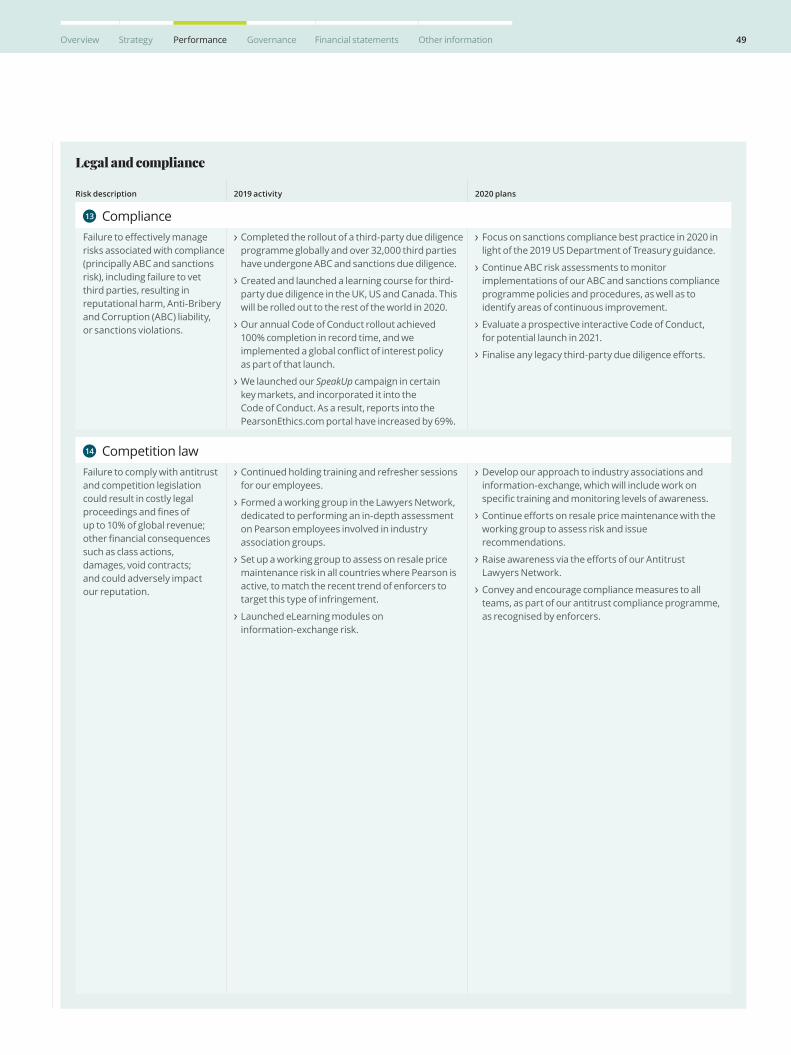
Risk description 2019 activity 2020 plans
13 ComplianceFailure to effectively manage risks associated with compliance (principally ABC and sanctions risk), including failure to vet third parties, resulting in reputational harm, Anti-Bribery and Corruption (ABC) liability, or sanctions violations.
Completed the rollout of a third-party due diligence programme globally and over 32,000 third parties have undergone ABC and sanctions due diligence.
Created and launched a learning course for third-party due diligence in the UK, US and Canada. This will be rolled out to the rest of the world in 2020.
Our annual Code of Conduct rollout achieved 100% completion in record time, and we implemented a global conflict of interest policy as part of that launch.
We launched our SpeakUp campaign in certain key markets, and incorporated it into the Code of Conduct. As a result, reports into the PearsonEthics.com portal have increased by 69%.
Focus on sanctions compliance best practice in 2020 in light of the 2019 US Department of Treasury guidance.
Continue ABC risk assessments to monitor implementations of our ABC and sanctions compliance programme policies and procedures, as well as to identify areas of continuous improvement.
Evaluate a prospective interactive Code of Conduct, for potential launch in 2021.
Finalise any legacy third-party due diligence efforts.
14 Competition lawFailure to comply with antitrust and competition legislation could result in costly legal proceedings and fines of up to 10% of global revenue; other financial consequences such as class actions, damages, void contracts; and could adversely impact our reputation.
Continued holding training and refresher sessions for our employees.
Formed a working group in the Lawyers Network, dedicated to performing an in-depth assessment on Pearson employees involved in industry association groups.
Set up a working group to assess on resale price maintenance risk in all countries where Pearson is active, to match the recent trend of enforcers to target this type of infringement.
Launched eLearning modules on information-exchange risk.
Develop our approach to industry associations and information-exchange, which will include work on specific training and monitoring levels of awareness.
Continue efforts on resale price maintenance with the working group to assess risk and issue recommendations.
Raise awareness via the efforts of our Antitrust Lawyers Network.
Convey and encourage compliance measures to all teams, as part of our antitrust compliance programme, as recognised by enforcers.
Legal and compliance
49Overview Strategy Performance Governance Financial statements Other information
Principal risks and uncertainties
Risk assessment of prospects and viabilityThis section should be read together with the full viability statement on p107
Pearson’s principal risks and our ability to manage them as outlined in this section are linked to our viability as a company. These risks have therefore been taken into account when preparing the viability statement.
The Board assessed the prospects of the company over a three-year period, longer than the minimum 12 months for the annual going concern review. The three-year period corresponds with Pearson’s strategic planning process and represents the time over which the company can reasonably predict market dynamics and the likely impact of additions to the product portfolio.
The Board discusses the company’s three year plan on an annual basis taking account of a range of factors including market conditions, the principal risks to the Group above, product and capital investment levels as well as available funding. Pearson’s strategic model and businesses are discussed in more detail on p10–13
The key assumptions which underpin our three-year plan to December 2022 are as follows:
there are further declines in enrolments and other downwards pressure in the US Higher Education Courseware market.
OPM grows, driven by global enrolment in undergraduate and postgraduate online courses.
Virtual Schools grows, driven by increased enrolments in new and existing schools.
other growth businesses, including Professional Certification (VUE) and English show good growth.
the remaining Pearson business shows modest growth.
our 2017-2019 cost efficiency programme is completed and additional cost savings are achieved in 2020.
our investment in the product technology platform accelerates the shift to digital and enhances courseware service capabilities.
investment continues in our growth businesses and the Pearson Brand in order to drive growth.
our stake in Penguin Random House is sold and no additional share of profits are recorded.
In assessing the company’s viability for the three years to December 2022, the Board analysed a variety of downside scenarios, including a scenario where the company is impacted by all principal risks from 2020. The primary modelling overlaid a ‘severe but plausible’ downside scenario onto the base case three-year plan for the Group, focusing on the impact of the following assumptions and key risks:
the benefits of our 2017–2019 cost efficiency programme are not sustainable;
further declines in US Higher Education Courseware, with digital growth failing to take hold;
failure to accelerate our digital transformation in the wider Pearson Group;
our growth businesses including OPM and Virtual Schools do not deliver despite increased investment; and
the Group is required to make significant cash tax payments in respect of a negative ruling on UK CFC exemption (EU State Aid). Other contingencies are not expected to crystallise in the period to December 2022.
The Board also stress-tested the impact on our liquidity of all the principal risks occurring together. Although this is not regarded as a plausible scenario, the test showed that the company would still have liquid resources subject to a limited number of management actions.
The Board’s confirmation of Pearson’s viability for the three years to 2022, based on this assessment, is included alongside the going concern statement on p107
50 Pearson plc Annual report and accounts 2019
Governance report
Corporate governance 52 Letter from the Chair
54 Board of Directors
57 Pearson Executive management
58 Corporate governance review
68 Nomination & Governance Committee report
72 Reputation & Responsibility Committee report
74 Audit Committee report
82 Risk governance and control
Directors’ remuneration report84 Remuneration overview
88 2019 remuneration report
97 2020 Remuneration Policy
Additional disclosures107 Report of the Directors
112 Statement of Directors’ responsibilities
In this section
51Overview Strategy Performance Governance Financial statements Other information
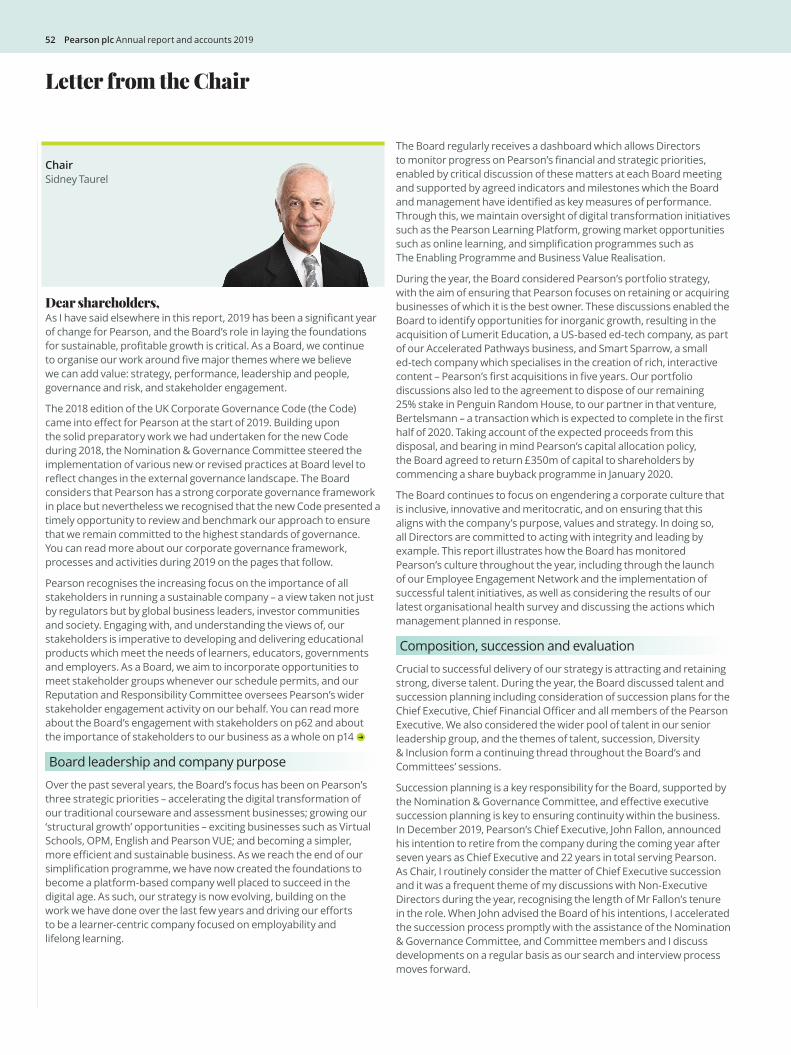
Dear shareholders,As I have said elsewhere in this report, 2019 has been a significant year of change for Pearson, and the Board’s role in laying the foundations for sustainable, profitable growth is critical. As a Board, we continue to organise our work around five major themes where we believe we can add value: strategy, performance, leadership and people, governance and risk, and stakeholder engagement.
The 2018 edition of the UK Corporate Governance Code (the Code) came into effect for Pearson at the start of 2019. Building upon the solid preparatory work we had undertaken for the new Code during 2018, the Nomination & Governance Committee steered the implementation of various new or revised practices at Board level to reflect changes in the external governance landscape. The Board considers that Pearson has a strong corporate governance framework in place but nevertheless we recognised that the new Code presented a timely opportunity to review and benchmark our approach to ensure that we remain committed to the highest standards of governance. You can read more about our corporate governance framework, processes and activities during 2019 on the pages that follow.
Pearson recognises the increasing focus on the importance of all stakeholders in running a sustainable company – a view taken not just by regulators but by global business leaders, investor communities and society. Engaging with, and understanding the views of, our stakeholders is imperative to developing and delivering educational products which meet the needs of learners, educators, governments and employers. As a Board, we aim to incorporate opportunities to meet stakeholder groups whenever our schedule permits, and our Reputation and Responsibility Committee oversees Pearson’s wider stakeholder engagement activity on our behalf. You can read more about the Board’s engagement with stakeholders on p62 and about the importance of stakeholders to our business as a whole on p14
Board leadership and company purpose
Over the past several years, the Board’s focus has been on Pearson’s three strategic priorities – accelerating the digital transformation of our traditional courseware and assessment businesses; growing our ‘structural growth’ opportunities – exciting businesses such as Virtual Schools, OPM, English and Pearson VUE; and becoming a simpler, more efficient and sustainable business. As we reach the end of our simplification programme, we have now created the foundations to become a platform-based company well placed to succeed in the digital age. As such, our strategy is now evolving, building on the work we have done over the last few years and driving our efforts to be a learner-centric company focused on employability and lifelong learning.
The Board regularly receives a dashboard which allows Directors to monitor progress on Pearson’s financial and strategic priorities, enabled by critical discussion of these matters at each Board meeting and supported by agreed indicators and milestones which the Board and management have identified as key measures of performance. Through this, we maintain oversight of digital transformation initiatives such as the Pearson Learning Platform, growing market opportunities such as online learning, and simplification programmes such as The Enabling Programme and Business Value Realisation.
During the year, the Board considered Pearson’s portfolio strategy, with the aim of ensuring that Pearson focuses on retaining or acquiring businesses of which it is the best owner. These discussions enabled the Board to identify opportunities for inorganic growth, resulting in the acquisition of Lumerit Education, a US-based ed-tech company, as part of our Accelerated Pathways business, and Smart Sparrow, a small ed-tech company which specialises in the creation of rich, interactive content – Pearson’s first acquisitions in five years. Our portfolio discussions also led to the agreement to dispose of our remaining 25% stake in Penguin Random House, to our partner in that venture, Bertelsmann – a transaction which is expected to complete in the first half of 2020. Taking account of the expected proceeds from this disposal, and bearing in mind Pearson’s capital allocation policy, the Board agreed to return £350m of capital to shareholders by commencing a share buyback programme in January 2020.
The Board continues to focus on engendering a corporate culture that is inclusive, innovative and meritocratic, and on ensuring that this aligns with the company’s purpose, values and strategy. In doing so, all Directors are committed to acting with integrity and leading by example. This report illustrates how the Board has monitored Pearson’s culture throughout the year, including through the launch of our Employee Engagement Network and the implementation of successful talent initiatives, as well as considering the results of our latest organisational health survey and discussing the actions which management planned in response.
Composition, succession and evaluation
Crucial to successful delivery of our strategy is attracting and retaining strong, diverse talent. During the year, the Board discussed talent and succession planning including consideration of succession plans for the Chief Executive, Chief Financial Officer and all members of the Pearson Executive. We also considered the wider pool of talent in our senior leadership group, and the themes of talent, succession, Diversity & Inclusion form a continuing thread throughout the Board’s and Committees’ sessions.
Succession planning is a key responsibility for the Board, supported by the Nomination & Governance Committee, and effective executive succession planning is key to ensuring continuity within the business. In December 2019, Pearson’s Chief Executive, John Fallon, announced his intention to retire from the company during the coming year after seven years as Chief Executive and 22 years in total serving Pearson. As Chair, I routinely consider the matter of Chief Executive succession and it was a frequent theme of my discussions with Non-Executive Directors during the year, recognising the length of Mr Fallon’s tenure in the role. When John advised the Board of his intentions, I accelerated the succession process promptly with the assistance of the Nomination & Governance Committee, and Committee members and I discuss developments on a regular basis as our search and interview process moves forward.
Letter from the Chair
Chair Sidney Taurel
52 Pearson plc Annual report and accounts 2019
In January 2020, Pearson’s CFO, Coram Williams, announced his intention to step down from the Board and leave the company. The Board and I are delighted that Pearson’s Deputy CFO, Sally Johnson, has agreed to take on the position of CFO, and shareholders will be invited to vote on Sally’s appointment to the Board at the AGM on 24 April, at which point Coram will step down from the Board.
Pearson has a fully engaged Board, including a strong Non-Executive team with a breadth of experience and perspectives. We were pleased to welcome Sherry Coutu and Graeme Pitkethly to the Pearson Board, following their appointments as Non-Executive Directors with effect from 1 May 2019. Sherry’s experience in building fast-growth, entrepreneurial businesses, focused on technology and education, and Graeme’s financial expertise, global overview and deep understanding of consumer behaviour have further strengthened our capabilities in these areas, and I am pleased to confirm that each is already making a valuable contribution to our deliberations as a Board and to the Committees which they have joined.
In the coming year, we will say goodbye to Josh Lewis, a Non-Executive Director of Pearson since 2011, who intends to step down from the Board at the forthcoming AGM in April 2020, in line with our normal practice for Non-Executive Directors to remain on the Board for a maximum of nine years. The Board joins me in thanking both Coram and Josh for their commitment and contributions to Pearson during these years of change for the company.
The 2019 Board evaluation, which was led by our Senior Independent Director, Vivienne Cox, found the Board to be well-functioning, with a good quality of relationships between members of the Board and an appropriate level of challenge and support provided to management. There was recognition by the Board of how much has been achieved by Pearson and its employees in recent years, and of the energy and effort which this journey has required from all concerned. More detail on our 2019 Board evaluation can be found on p66. Progress on recommendations arising from our annual Board evaluation is reported at each Nomination & Governance Committee meeting until such recommendations are complete or embedded to the Committee’s satisfaction.
Audit, risk and internal control
The Board of Directors is accountable for Pearson’s successes and addressing its challenges. We aim to communicate to you in a transparent manner the steps we have taken to ensure that we have a clear oversight of the business and the work we have undertaken in respect of Pearson’s strategy throughout the year. Our Audit Committee, led by Tim Score, plays a key role in monitoring and evaluating our compliance and risk management processes, providing independent oversight of our external audit and internal control programmes, accounting policies and business transformation projects, and in assisting the Board in reporting in a fair, balanced and understandable manner to our shareholders.
Remuneration
In 2019, the Remuneration Committee has reviewed and updated Pearson’s remuneration philosophy and developed a set of principles to underpin its updated remuneration policy which will be put to shareholder vote at the 2020 AGM. These principles will inform how Pearson develops remuneration strategy for the whole organisation and give the business flexibility to deliver on its strategy and digital transformation. Pearson’s current approach to Executive remuneration is explained in more detail in the remuneration section of this report on p84
Conclusion
I hope this report clearly sets out how your company is run, and how we align governance and our Board agenda with the strategic direction of Pearson. We always welcome questions or comments from shareholders, either via our website (www.pearson.com) or in person at our AGM.
Sidney Taurel Chair
The UK Corporate Governance CodeThe principles set out in the UK Corporate Governance Code (the Code) emphasise the value of good corporate governance to the long-term sustainable success of listed companies. These principles, and their supporting provisions, cover five broad themes and the Pearson Board is responsible for ensuring that the Group has in place appropriate frameworks to comply with the Code’s requirements.
The five themes are covered in particular on the following pages of the Governance report, with additional information contained in the Strategic report.
Board leadership and company purpose; Division of responsibilities; and Composition, succession and evaluation on p54–73
Audit, risk and internal control on p74–83
Remuneration on p84–106
This year, we are reporting against the 2018 edition of the Code. The Board believes that during 2019 the company was in full compliance with all applicable principles and provisions of the Code, save that as noted on p87 the Company continues to work to align pension contributions for Executive Directors to those available to the workforce. This Governance report and the Strategic report set out how Pearson has applied the principles of the Code throughout the year.
The Code can be found on the Financial Reporting Council’s website at www.frc.org.uk and we encourage readers to view our compliance schedule on the company website at www.pearson.com/governance.
53Overview Strategy Performance Governance Financial statements Other information

Board of Directors
business strategy and governance innovation and disruption education digital and technology talent, people and culture finance and investment sustainability and environmental matters marketing, brand and media government, international and regulatory affairs.
Our Board members’ biographies illustrate the contribution each Director makes to the Board by way of their individual experience.
Pearson Board members bring a wide range of experience, skills and backgrounds which complement our strategy. All Board members have strong leadership experience at global businesses and institutions and, as a group, their experience covers:
Executive Directors Executive Director-elect
Key to CommitteesA AuditN Nomination & GovernanceRR Reputation & ResponsibilityR Remuneration
Committee chairCurrent notable commitments reflect other listed company directorships and full-time or executive roles.
Coram Williams Chief Financial Officer aged 46, appointed 1 August 2015
Coram joined Pearson in 2003 and has held a number of senior positions including Finance and Operations Director for Pearson’s English language teaching business in Europe, Middle East & Africa, Interim President of Pearson Education Italia and Head of Financial Planning and Analysis for Pearson. In 2008, Coram became CFO of The Penguin Group and was latterly appointed CFO of Penguin Random House in 2013, where he oversaw the integration of the two businesses. Coram trained at Arthur Andersen, and subsequently worked in both the auditing and consulting practices of the firm. He is a Non-Executive Director and Chairman of the audit committee for the Guardian Media Group.
Coram will be stepping down from the Board and his role as Chief Financial Officer at the Annual General Meeting on 24 April 2020.
John Fallon Chief Executiveaged 57, appointed 3 October 2012
John became Pearson’s Chief Executive on 1 January 2013. Since 2008, he had been responsible for the company’s education businesses outside North America and a member of the Pearson management committee. He joined Pearson in 1997 as Director of Communications and was appointed President of Pearson Inc. in 2000. In 2003, he was appointed CEO of Pearson’s educational publishing businesses for Europe, Middle East & Africa. Prior to joining Pearson, John was Director of Corporate Affairs at Powergen plc and was also a member of the company’s executive committee. Earlier in his career, John held senior public policy and communications roles in UK local government. John is also President of the London Chamber of Commerce & Industry (LCCI).
John has announced his intention to retire from Pearson during 2020.
Sally Johnson Chief Financial Officer-electaged 46, to be appointed 24 April 2020
Sally joined Pearson in 2000, and has held various finance and operations roles across The Penguin Group, the education business and at a corporate level. She brings to the Board extensive commercial and strategic finance experience as well as transformation, treasury, tax, risk management, business and financial operations, investor relations and M&A expertise. She has held various senior level roles across the business, most recently as Deputy CFO of Pearson. Sally is a member of the Institute of Chartered Accountants in England and Wales and trained at PricewaterhouseCoopers. She was also a Trustee for the Pearson Pension Plan from 2012 to 2018.
Chair
Sidney Taurel Chairaged 71, appointed 1 January 2016 N R
Sidney has over 45 years of experience in business and finance, and is currently a Director of IBM Corporation, where he also serves on the directors and corporate governance committee. Sidney is an advisory board member at pharmaceutical firm Almirall. He was Chief Executive Officer of global pharmaceutical firm Eli Lilly and Company from 1998 until 2008, Chairman from 1999 until 2008, and has been Chairman Emeritus since 2009. He was also a Director at McGraw Hill Financial, Inc., a role which he held from 1996 until April 2016 and at ITT Industries from 1996 to 2001. In 2002, Sidney received three US presidential appointments to: the Homeland Security Advisory Council, the President’s Export Council and the Advisory Committee for Trade Policy and Negotiations, and is an officer of the French Legion of Honour.
Current notable commitments: IBM Corporation (Non-Executive Director)
54 Pearson plc Annual report and accounts 2019

Non-Executive Directors
Dame Elizabeth Corley, DBE Non-Executive Director A N R
aged 63, appointed 1 May 2014
Elizabeth has extensive experience in the financial services industry having been CEO of Allianz Global Investors, initially for Europe then globally, from 2005 to 2016, and was a senior adviser to the firm until the end of December 2019. She was previously at Merrill Lynch Investment Managers and Coopers & Lybrand. Elizabeth is a Non-Executive Director of BAE Systems plc and Morgan Stanley Inc. Elizabeth is active in representing the investment industry and developing standards within it. She is a member of the Committee of 200. She was appointed Dame Commander of the Order of the British Empire in the Queen’s Birthday Honours in 2019 for her services to the economy and financial services.
Current notable commitments: BAE Systems plc (Non-Executive Director), Morgan Stanley Inc. (Non-Executive Director)
Josh Lewis Non-Executive Director aged 57, appointed 1 March 2011 N R
Josh’s experience spans finance, education and the development of digital enterprises. He is founder of Salmon River Capital LLC, a New York-based private equity/venture capital firm focused on technology-enabled businesses in education, financial services and other sectors, through which he has taken on the role of Non-Executive Director of several enterprises. Over a 25-year career in active, principal investing, he has been involved in a broad range of successful companies, including several pioneering enterprises in the education sector. In addition, he has long been active in the non-profit education sector.
Current notable commitments: Salmon River Capital LLC (Founder & Managing Principal)
Sherry Coutu, CBE Non-Executive Directoraged 56, appointed 1 May 2019 N R
Sherry has extensive experience in the technology industry. She is the Chairman of Founders4Schools and founder of the Scaleup Institute. Previously, she was CEO of Interactive Investor International plc, served on the board of Bloomberg New Energy Finance and the London Stock Exchange plc. In education, she was SID and Remuneration Committee Chair of RM plc, on the board of Cambridge University, Cambridge Assessment and Cambridge University Press, and Chesterton Community College. Sherry has started and or invested in over 60 technology businesses and served on the boards of Zoopla plc, Raspberry Pi, NESTA, and the Advisory boards of the National Gallery, Royal Society and Linkedin. She was appointed Commander of the British Empire in the 2013 New Year Honours for her services to entrepreneurship.
Vivienne Cox, CBE Senior Independent Director A N RR
aged 60, appointed 1 January 2012
Vivienne has wide experience in energy, natural resources and business innovation. She worked for BP plc for 28 years in global roles including Executive Vice President and Chief Executive of BP’s gas, power and renewables business and its alternative energy unit. She is Chair of the supervisory board of Vallourec S.A., a leader in the seamless steel pipe markets, and a Non-Executive Director at pharmaceutical company GlaxoSmithKline plc. She serves as Chair of the Rosalind Franklin Institute and Vice Chair of the Saïd Business School (part of Oxford University). She was appointed Commander of the British Empire in the 2016 New Year Honours for her services to the economy and sustainability.
Current notable commitments: GlaxoSmithKline plc (Non-Executive Director), Vallourec S.A. (Chair of the supervisory board)
Linda Lorimer Non-Executive Director aged 67, appointed 1 July 2013 A RR
Linda has spent almost 40 years serving higher education. She retired from Yale in 2016 after 34 years at the university where she served in an array of senior positions including Vice President for Global & Strategic Initiatives. She oversaw the development of Yale’s burgeoning online education division and the expansion of Yale’s international programmes and centres. During her tenure, she was responsible for many administrative services, ranging from Yale’s public communications and alumni relations to sustainability, human resources and the university press. She also served on the boards of several public companies, including as Presiding Director of the McGraw-Hill companies. Linda is a member of the board of Yale New Haven Hospital, where she chairs the nominating and governance committee and is a trustee of Hollins University. She also remains on several consequential advisory committees at Yale University.
Michael Lynton Non-Executive Directoraged 60, appointed 1 February 2018 A RR
Michael served as CEO of Sony Entertainment from 2012 until 2017, overseeing Sony’s global entertainment businesses. He was also Chairman and CEO of Sony Pictures Entertainment from 2004. Prior to that, he held senior roles within Time Warner and AOL, and earlier served as Chairman and CEO of Penguin Group where he extended the Penguin brand to music and the internet. Michael is Chairman of Snap, Inc., Schrödinger, Inc. and Warner Music, and currently serves on the boards of IEX and Ares Management Corporation LLC.
Current notable commitments: Ares Management Corporation LLC (Non-Executive Director), Snap, Inc. (Chairman), Schrödinger, Inc. (Chairman)
55Overview Strategy Performance Governance Financial statements Other information

Board of Directors
Governance at Pearson
Non-Executive Directors continued
Audit Committee
Appraises our financial management and reporting and assesses the integrity of our accounting procedures and financial control.
Remuneration Committee
Determines the remuneration and benefits of the Executive Directors and oversees remuneration arrangements for the Pearson Executive.
Nomination & Governance Committee
Reviews corporate governance matters, including Code compliance and Board evaluation, considers the appointment of new Directors, Board experience and diversity, and reviews Board induction and succession plans.
Reputation & Responsibility Committee
Considers the company’s impact on society and the communities in which Pearson operates, including to ensure that strategies are in place to manage and improve Pearson’s reputation.
PEM consists of John Fallon (Chief Executive) and his direct reports. They are the executive leadership group for Pearson, responsible for delivering Pearson’s strategy under clearly defined accountabilities and in line with agreed governance and processes.
Chief Executive
Chief Financial Officer
Chief Technology & Operations Officer
Chief Corporate Affairs Officer
Chief Human Resources Officer
Chief Strategy Officer
President – UK & Global Online Learning
President – International
President – Global Assessment
President – North American Courseware & Global Product
General Counsel & Chief Legal Officer
Pearson Executive Management (PEM)
see opposite
Lincoln Wallen Non-Executive Directoraged 59, appointed 1 January 2016 A RR
Lincoln has extensive experience in the technology and media industries, and is currently CTO of Improbable, a technology start-up supplying next-generation cloud hosting and networking services to the video game industry. Lincoln was CEO of DWA Nova, a software-as-a-service company spun out of DreamWorks Animation Studios in Los Angeles, a position he held until 2017. He worked at DreamWorks Animation for nine years in a variety of leadership roles including Chief Technology Officer and Head of Animation Technology. He was formerly CTO at Electronic Arts Mobile, leading their entry into the mobile gaming business internationally. Lincoln is a Non-Executive Director of the Smith Institute for Industrial Mathematics and Systems Engineering. His early career involved 20 years of professional IT and mathematics research, including as a reader in Computer Science at Oxford.
Current notable commitments: Improbable (Chief Technology Officer)
Tim Score Non-Executive Directoraged 59, appointed 1 January 2015 A N R
Tim has extensive experience of the technology sector in both developed and emerging markets, having served as Chief Financial Officer of ARM Holdings plc, the world’s leading semiconductor IP company, for 13 years. He is an experienced non-executive director and serves as Chairman of The British Land Company plc, a role to which he was appointed in July 2019, a non-executive director of HM Treasury, and a Trustee of the National Theatre. He served on the board of National Express Group plc from 2005 to 2014, including time as interim Chairman and six years as the Senior Independent Director. Earlier in his career Tim held senior finance roles with Rebus Group, William Baird, LucasVarity plc and BTR plc.
Current notable commitments: The British Land Company plc (Chairman)
Board of Directors
FLOW OF INFORMATION
Graeme Pitkethly Non-Executive Directoraged 53, appointed 1 May 2019 A RR
Graeme joined Unilever in 2002 and, prior to being appointed CFO and Board member, was responsible for Unilever’s UK and Ireland business. Previously, he had held a number of senior financial and commercial roles within Unilever and spent the earlier part of his career in senior corporate finance roles in the telecommunications industry. Graeme served as Vice President of Financial Planning and Vice President of Corporate Development at FLAG Telecom and started his career at PricewaterhouseCoopers. Graeme is a Vice Chair of the Task Force on Climate Related Financial Disclosures and is a Chartered Accountant.
Current notable commitments: Unilever plc and Unilever NV (Chief Financial Officer)
56 Pearson plc Annual report and accounts 2019

Pearson Executive Management
Tim Bozik President – North American Courseware & Global Product
Tim Bozik has extensive experience in product development and higher education. Tim joined Pearson in 1983 as a sales representative and has since held leadership roles in product and general management.
Gio Giovannelli President – International
Gio was previously CEO of Grupo Multi, which was acquired by Pearson in 2013. He has also held three other CEO positions in Brazil, across different sectors. Gio is a former board member of Natura and of CVC Viagens, both listed in the São Paulo Stock Exchange.
Bjarne Tellmann General Counsel & Chief Legal Officer
Bjarne previously worked across Europe, Asia and the US in various capacities with The Coca-Cola Company, most recently as Associate General Counsel. He has also held legal positions at Kimberly-Clark and the law firms of Sullivan & Cromwell LLP and White & Case LLP.
Rod Bristow President – UK & Global Online Learning
Rod is a Trustee for the Education and Employers Taskforce, a Fellow of the Royal Society of Arts, and Governor for Harlow College and the BMAT multi-academy trust.
Albert Hitchcock Chief Technology & Operations Officer
Albert has been Chief Technology & Operations Officer since March 2014. Previously, Albert was Group CIO at Vodafone and prior to this was Global CIO at Nortel Networks. Albert is a Chartered Engineer and a Fellow of the Institute of Engineering & Technology.
Anna Vikström Persson Chief Human Resources Officer
Anna has been Chief Human Resources Officer since February 2018. She has over 20 years of international HR experience. Previously, Anna served as EVP & Head of Group Human Resources for Sandvik, and similarly for SSAB. She was also VP, HR & Organisation for Ericsson.
Jonathan Chocqueel-Mangan Chief Strategy Officer
Jonathan was formerly Chief Strategy and Transformation Officer at Kantar Consumer Insights. Jonathan has professional qualifications in Consulting and Coaching for Change from the Saïd Business School and a Doctor of Business Administration in Organisational Behaviour from the University of Surrey.
Deirdre Latour Chief Corporate Affairs Officer
Deirdre has been Chief Corporate Affairs Officer since January 2019. She brings over 20 years of experience in corporate communications and issues management. Previously, Deirdre was the Chief Communications Officer for GE and worked for the global public relations firm Edelman.
Bob Whelan President – Global Assessment
Bob has significant expertise in assessment and has driven Pearson’s growth as a global leader in computer-based assessments since 2000. Bob leads Pearson’s combined assessment businesses including US Student Assessment, Clinical Assessment, as well as Pearson VUE.
57Overview Strategy Performance Governance Financial statements Other information
Board of Directors
Composition of the Board As at the date of this report, the Board consists of the Chair, Sidney Taurel, two Executive Directors: the Chief Executive, John Fallon, and CFO, Coram Williams and nine independent Non-Executive Directors. Sherry Coutu and Graeme Pitkethly were appointed as Non-Executive Directors on 1 May 2019.
The Chair is primarily responsible for the leadership of the Board and ensuring its effectiveness. He ensures that the Board upholds and promotes the highest standards of corporate governance, setting the Board’s agenda and encouraging open, constructive debate of all agenda items for effective decision-making. He regularly meets the Chief Executive to stay informed and provide advice. He also ensures that shareholders’ views are communicated to the Board.
Chair’s significant commitments There were no changes to the Chair’s significant commitments during 2019.
Independence of Chair In accordance with the UK Corporate Governance Code (the Code), Sidney Taurel was considered to be independent upon his appointment as Chair on 1 January 2016.
The Chief Executive is responsible for the operational management of the business and for the development and implementation of the company’s strategy as agreed by the Board and management. He is responsible for developing operational proposals and policies for approval by the Board, he promotes Pearson’s culture and standards, and is the main representative of the company to its external stakeholders.
The Senior Independent Director’s role includes meeting regularly with the Chair and Chief Executive to discuss specific issues, as well as being available to shareholders generally should they have concerns that have not been addressed through the normal channels. She also leads the evaluation of the Chair on behalf of the other Directors.
Division of responsibilities There is a defined split of responsibilities between the Chair and the executive leadership of Pearson. The roles and responsibilities of the Chair, Chief Executive and the Senior Independent Director are clearly defined, set out in writing and reviewed and agreed by the Board on an annual basis. These can be found on the company website at www.pearson.com/governance.
Independence of Directors All of the Non-Executive Directors who served during 2019 were considered by the Board to be independent for the purposes of the Code. The Board reviews the independence of each of the Non-Executive Directors annually. This includes reviewing their external appointments and any potential conflicts of interest as well as assessing their individual circumstances in order to ensure that there are no relationships or matters likely to affect their judgement. In addition to this review, each of the Non-Executive Directors is asked annually to complete an independence questionnaire to satisfy requirements arising from Pearson’s US listing and the Code.
Directors’ commitments and conflicts of interest Under the Companies Act 2006 (the Act), the Directors have a statutory duty to avoid conflicts of interest with the company. The company’s Articles of Association allow the Directors to authorise conflicts of interest. The company has an established procedure to identify actual and potential conflicts of interest, including all directorships or other appointments to, or relationships with, companies which are not part of the Pearson Group and which could give rise to actual or potential conflicts of interest.
Additionally, in response to Provision 15 of the Code, Pearson has developed internal guidance to be taken into account when considering changes to a Director’s commitments, or when appointing a new Director, as well as formalising the Board approval process for such matters.
Once notified to the company, any potential conflicts and commitments are considered for authorisation by the Board at its next scheduled meeting or, where necessary in the interests of timeliness, by a Committee comprising the Chair, Senior Independent Director and Company Secretary. In particular, the Board or Committee considers the type of role, expected time commitment and any impact which this may have on the Director’s duties to Pearson, as well as any relationships between Pearson and the external organisation. The interested Director is not permitted to vote, or be counted in the quorum, for any resolution relating to his/her commitments, conflict or potential conflict. The Board reviews any authorisations granted on an annual basis.
During 2019, the Board approved two new significant commitments for existing Directors. Firstly, the appointment of Lincoln Wallen as Chief Technology Officer of Improbable, a technology start-up company. The Board was of the opinion that this additional appointment was acceptable as the time commitment expected of Mr Wallen in his new role would be no greater than his previous executive role at the time he joined the Pearson Board. Secondly, the appointment of Tim Score as Chairman of The British Land Company plc (British Land). The Board was of the opinion that this appointment was acceptable as Mr Score holds no other directorships of listed companies apart from Pearson and British Land, therefore it was deemed that the additional time commitment would not impact on Mr Score’s duties to Pearson. Additionally, in the cases of both Mr Wallen and Mr Score, the Board believes that the experience gained by Directors through their other commitments can bring valuable perspectives to the Pearson Board. There were no other new commitments of Directors during 2019 which the Board considered to be significant in nature.
Early in 2020, Michael Lynton informed the Chair that two of the companies in which he holds non-executive positions intended to list during the course of the year, namely Schrödinger and Warner Music. Once those companies are listed, Mr Lynton would then be serving on five listed company boards. Mindful of Pearson’s own internal guidance, and shareholder sentiment in relation to Directors’ commitments, Mr Lynton and the Chair have agreed to review this situation over the course of 2020, once there is absolute clarity regarding Mr Lynton’s future intentions. To date there has been no impact on Mr Lynton’s ability to commit to the Pearson Board, and he has demonstrated a full attendance record at Pearson since his appointment in 2018.
It should be noted that, should this position not change during the course of 2020, Mr Lynton has agreed with the Chair that he will not stand for re-election to the Pearson Board at the 2021 AGM.
The role and business of the Board
The Board is deeply engaged in developing and measuring the company’s long-term strategy, performance, culture and values. We believe that it adds a valuable and diverse set of external perspectives and that robust, open debate about significant business issues brings an additional discipline to major decisions.
Corporate governance review
58 Pearson plc Annual report and accounts 2019
The key responsibilities of the Board include:
overall leadership of the company and setting the company’s values and standards, including monitoring culture
determining the company’s strategy in consultation with management, reviewing performance against it and overseeing management execution thereof
major changes to the company’s corporate, capital, management and control structures
approval of all transactions or financial commitments in excess of the authority limits delegated to the Chief Executive and other Executive management
assessment of management performance and Board and Executive succession planning.
A schedule of formal matters reserved for the Board’s decision and approval is available on our website, at www.pearson.com/governance.
Culture, purpose and values
Pearson’s core values – to be brave, imaginative, decent and accountable – go to the heart of our purpose: to help people make progress in their lives and careers, and the Board and employees are committed to demonstrating these characteristics throughout their work and deliberations. The Board endorses Pearson’s culture of innovation, fostering talent and inclusivity at all levels and demonstrated this during the year by engaging with employees from across Pearson through a variety of in-person and virtual events. The Board monitors the culture and organisational health of the company with the assistance of its Committees, including through regular updates from the Chief Human Resources Officer on talent, D&I and Pearson’s values as well as considering Group-wide programmes such as Code of Conduct, compliance, Health & Safety, and training initiatives. Building on discussions during 2019 and with the help of the Chief Human Resources Officer, we aim to introduce a dashboard drawing together key cultural indicators from across the Group, which will add quantitative metrics to augment the Board’s existing oversight of culture and organisational health.
Strategic planning and decision-making
The Board spends considerable time in assessing that any proposed transaction aligns with the strategy and future prospects for the business. In addition, an annual strategy session enhances the Board’s decision-making in shaping the company’s strategic and financial plans.
The Board and Committees receive timely, regular and necessary financial, management and other information to fulfil their duties. Comprehensive meeting papers are circulated to the Board and Committee members at least one week in advance of each meeting and the Board receives a regular dashboard and key milestones report and regular updates from the Chief Executive and Chief Financial Officer. In addition to meeting papers, a library of current and historical corporate information is made available to Directors electronically to support the Board’s decision-making process. The Directors can obtain independent professional advice, at the company’s expense, in the performance of their duties. All Directors have access to the advice and services of the Company Secretary, whose appointment and removal is a matter reserved for the full Board.
The Directors recognise their duties towards the shareholders and other stakeholders of the company as set out in Section 172 of the Act, and a continued understanding of the key issues affecting stakeholders is an integral part of the Board’s decision-making process. You can read more on the pages that follow about the Board’s engagement with stakeholders and an illustrative example of how it takes stakeholder views into account in its decision-making.
Board meetings
The Board held seven scheduled meetings in 2019, with discussions and debates focused on the key strategic issues facing the company. Major items covered by the Board in 2019 are shown in the table on p60. In addition to its scheduled meetings, the Board meets in person or by telephone as necessary to consider matters of a time-sensitive nature. There were two such meetings in 2019 to allow the Board to consider matters relating to business performance and acquisition and disposal opportunities.
October, North America At a two-day meeting in October, the Board and Pearson Executive reviewed Pearson’s digital transformation journey towards a single set of global platforms and the alignment of these initiatives with the long-term company strategy. The Board reviewed the Pearson Learning Platform (PLP) and discussed and agreed ways in which to accelerate the release of new products on the platform. They also considered the ways in which Pearson’s technology and platform strategy would enable innovation through the ongoing development of the PLP while keeping learner experience and requirements at the centre of the plan.
Two stakeholder panel sessions allowed the Board to hear directly from authors, educators and learners about their experiences of digital teaching and learning in schools and higher education. You can read more about the Board’s engagement with these stakeholders on p62–63. The Board also attended an event with new and emerging talent, particularly employees with digital and technology skills, engaged with new members of Pearson’s senior leadership team who have enhanced our skills and expertise in digital platforms and AI, and gained valuable insights into employees’ views on Pearson’s current challenges and opportunities through a session facilitated by HR and Talent leadership.
December, North America At a three-day meeting in December, the Board and the Pearson Executive were joined by members of the Global Online Learning leadership team who provided an overview of the global business. The Board took a deeper dive into the OPM and Virtual Schools businesses, considering areas such as:
Strategic plans and potential growth opportunities for OPM and Virtual Schools
The customer-focused culture of the Virtual Schools business, and transformation programmes in respect of Virtual Schools technology and curriculum which would be delivered in the coming year
Key points of differentiation between Connections Academy, our Virtual Schools business, and traditional ‘bricks and mortar’ schools
Examples of OPM partnerships in action such as Arizona State University, Northeastern University and the University of Adelaide
The Board also participated in a tour of the facilities to see the OPM business in action and to meet with employees.
59Overview Strategy Performance Governance Financial statements Other information
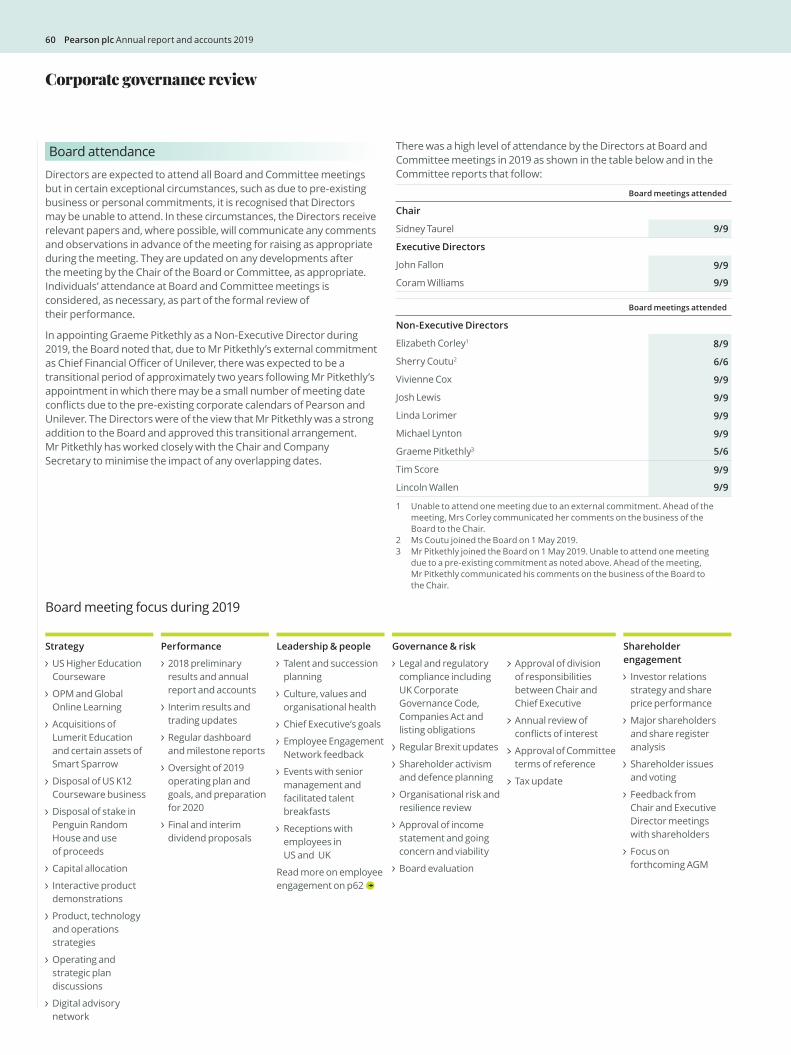
Board meeting focus during 2019
Strategy
US Higher Education Courseware
OPM and Global Online Learning
Acquisitions of Lumerit Education and certain assets of Smart Sparrow
Disposal of US K12 Courseware business
Disposal of stake in Penguin Random House and use of proceeds
Capital allocation
Interactive product demonstrations
Product, technology and operations strategies
Operating and strategic plan discussions
Digital advisory network
Performance
2018 preliminary results and annual report and accounts
Interim results and trading updates
Regular dashboard and milestone reports
Oversight of 2019 operating plan and goals, and preparation for 2020
Final and interim dividend proposals
Leadership & people
Talent and succession planning
Culture, values and organisational health
Chief Executive’s goals
Employee Engagement Network feedback
Events with senior management and facilitated talent breakfasts
Receptions with employees in US and UK
Read more on employee engagement on p62
Governance & risk
Legal and regulatory compliance including UK Corporate Governance Code, Companies Act and listing obligations
Regular Brexit updates
Shareholder activism and defence planning
Organisational risk and resilience review
Approval of income statement and going concern and viability
Board evaluation
Approval of division of responsibilities between Chair and Chief Executive
Annual review of conflicts of interest
Approval of Committee terms of reference
Tax update
Shareholder engagement
Investor relations strategy and share price performance
Major shareholders and share register analysis
Shareholder issues and voting
Feedback from Chair and Executive Director meetings with shareholders
Focus on forthcoming AGM
Board attendance
Directors are expected to attend all Board and Committee meetings but in certain exceptional circumstances, such as due to pre-existing business or personal commitments, it is recognised that Directors may be unable to attend. In these circumstances, the Directors receive relevant papers and, where possible, will communicate any comments and observations in advance of the meeting for raising as appropriate during the meeting. They are updated on any developments after the meeting by the Chair of the Board or Committee, as appropriate. Individuals’ attendance at Board and Committee meetings is considered, as necessary, as part of the formal review of their performance.
In appointing Graeme Pitkethly as a Non-Executive Director during 2019, the Board noted that, due to Mr Pitkethly’s external commitment as Chief Financial Officer of Unilever, there was expected to be a transitional period of approximately two years following Mr Pitkethly’s appointment in which there may be a small number of meeting date conflicts due to the pre-existing corporate calendars of Pearson and Unilever. The Directors were of the view that Mr Pitkethly was a strong addition to the Board and approved this transitional arrangement. Mr Pitkethly has worked closely with the Chair and Company Secretary to minimise the impact of any overlapping dates.
There was a high level of attendance by the Directors at Board and Committee meetings in 2019 as shown in the table below and in the Committee reports that follow:
Board meetings attended
Chair
Sidney Taurel 9/9
Executive Directors
John Fallon 9/9
Coram Williams 9/9
Board meetings attended
Non-Executive Directors
Elizabeth Corley1 8/9
Sherry Coutu2 6/6
Vivienne Cox 9/9
Josh Lewis 9/9
Linda Lorimer 9/9
Michael Lynton 9/9
Graeme Pitkethly3 5/6
Tim Score 9/9
Lincoln Wallen 9/9
1 Unable to attend one meeting due to an external commitment. Ahead of the meeting, Mrs Corley communicated her comments on the business of the Board to the Chair.
2 Ms Coutu joined the Board on 1 May 2019.3 Mr Pitkethly joined the Board on 1 May 2019. Unable to attend one meeting
due to a pre-existing commitment as noted above. Ahead of the meeting, Mr Pitkethly communicated his comments on the business of the Board to the Chair.
Corporate governance review
60 Pearson plc Annual report and accounts 2019
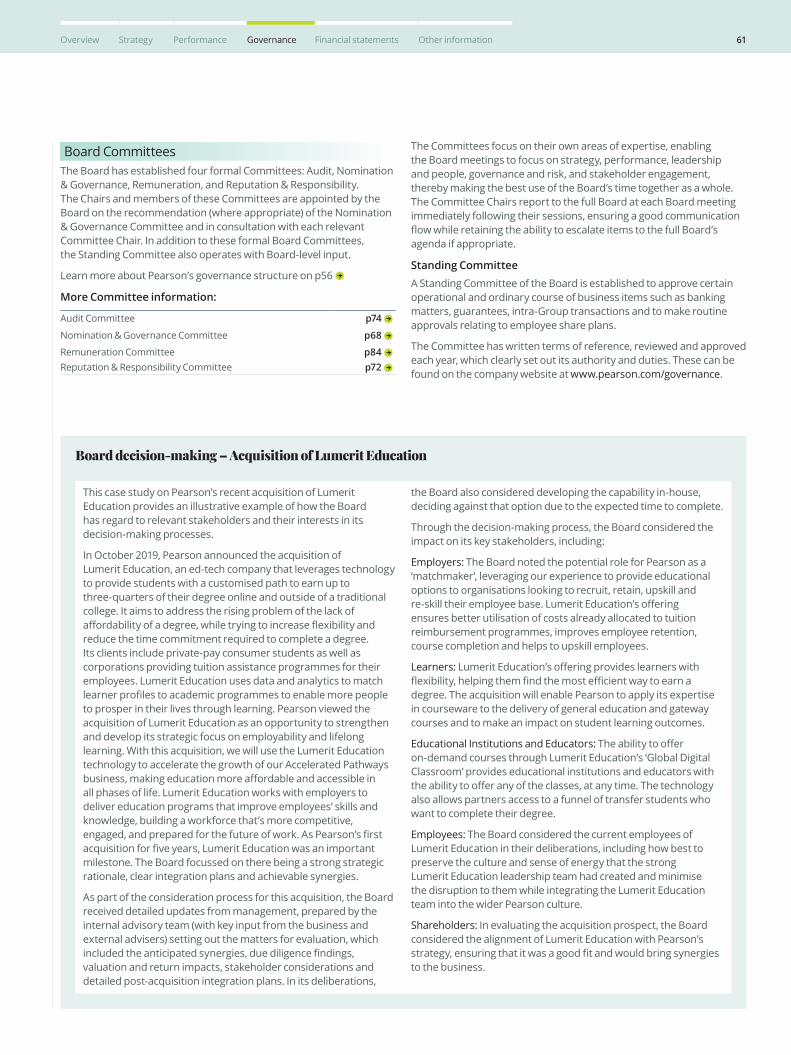
Board CommitteesThe Board has established four formal Committees: Audit, Nomination & Governance, Remuneration, and Reputation & Responsibility. The Chairs and members of these Committees are appointed by the Board on the recommendation (where appropriate) of the Nomination & Governance Committee and in consultation with each relevant Committee Chair. In addition to these formal Board Committees, the Standing Committee also operates with Board-level input.
Learn more about Pearson’s governance structure on p56
More Committee information:
Audit Committee p74
Nomination & Governance Committee p68
Remuneration Committee p84 Reputation & Responsibility Committee p72
The Committees focus on their own areas of expertise, enabling the Board meetings to focus on strategy, performance, leadership and people, governance and risk, and stakeholder engagement, thereby making the best use of the Board’s time together as a whole. The Committee Chairs report to the full Board at each Board meeting immediately following their sessions, ensuring a good communication flow while retaining the ability to escalate items to the full Board’s agenda if appropriate.
Standing CommitteeA Standing Committee of the Board is established to approve certain operational and ordinary course of business items such as banking matters, guarantees, intra-Group transactions and to make routine approvals relating to employee share plans.
The Committee has written terms of reference, reviewed and approved each year, which clearly set out its authority and duties. These can be found on the company website at www.pearson.com/governance.
Board decision-making – Acquisition of Lumerit Education
This case study on Pearson’s recent acquisition of Lumerit Education provides an illustrative example of how the Board has regard to relevant stakeholders and their interests in its decision-making processes.
In October 2019, Pearson announced the acquisition of Lumerit Education, an ed-tech company that leverages technology to provide students with a customised path to earn up to three-quarters of their degree online and outside of a traditional college. It aims to address the rising problem of the lack of affordability of a degree, while trying to increase flexibility and reduce the time commitment required to complete a degree. Its clients include private-pay consumer students as well as corporations providing tuition assistance programmes for their employees. Lumerit Education uses data and analytics to match learner profiles to academic programmes to enable more people to prosper in their lives through learning. Pearson viewed the acquisition of Lumerit Education as an opportunity to strengthen and develop its strategic focus on employability and lifelong learning. With this acquisition, we will use the Lumerit Education technology to accelerate the growth of our Accelerated Pathways business, making education more affordable and accessible in all phases of life. Lumerit Education works with employers to deliver education programs that improve employees’ skills and knowledge, building a workforce that’s more competitive, engaged, and prepared for the future of work. As Pearson’s first acquisition for five years, Lumerit Education was an important milestone. The Board focussed on there being a strong strategic rationale, clear integration plans and achievable synergies.
As part of the consideration process for this acquisition, the Board received detailed updates from management, prepared by the internal advisory team (with key input from the business and external advisers) setting out the matters for evaluation, which included the anticipated synergies, due diligence findings, valuation and return impacts, stakeholder considerations and detailed post-acquisition integration plans. In its deliberations,
the Board also considered developing the capability in-house, deciding against that option due to the expected time to complete.
Through the decision-making process, the Board considered the impact on its key stakeholders, including:
Employers: The Board noted the potential role for Pearson as a ‘matchmaker’, leveraging our experience to provide educational options to organisations looking to recruit, retain, upskill and re-skill their employee base. Lumerit Education’s offering ensures better utilisation of costs already allocated to tuition reimbursement programmes, improves employee retention, course completion and helps to upskill employees.
Learners: Lumerit Education’s offering provides learners with flexibility, helping them find the most efficient way to earn a degree. The acquisition will enable Pearson to apply its expertise in courseware to the delivery of general education and gateway courses and to make an impact on student learning outcomes.
Educational Institutions and Educators: The ability to offer on-demand courses through Lumerit Education’s ‘Global Digital Classroom’ provides educational institutions and educators with the ability to offer any of the classes, at any time. The technology also allows partners access to a funnel of transfer students who want to complete their degree.
Employees: The Board considered the current employees of Lumerit Education in their deliberations, including how best to preserve the culture and sense of energy that the strong Lumerit Education leadership team had created and minimise the disruption to them while integrating the Lumerit Education team into the wider Pearson culture.
Shareholders: In evaluating the acquisition prospect, the Board considered the alignment of Lumerit Education with Pearson’s strategy, ensuring that it was a good fit and would bring synergies to the business.
61Overview Strategy Performance Governance Financial statements Other information
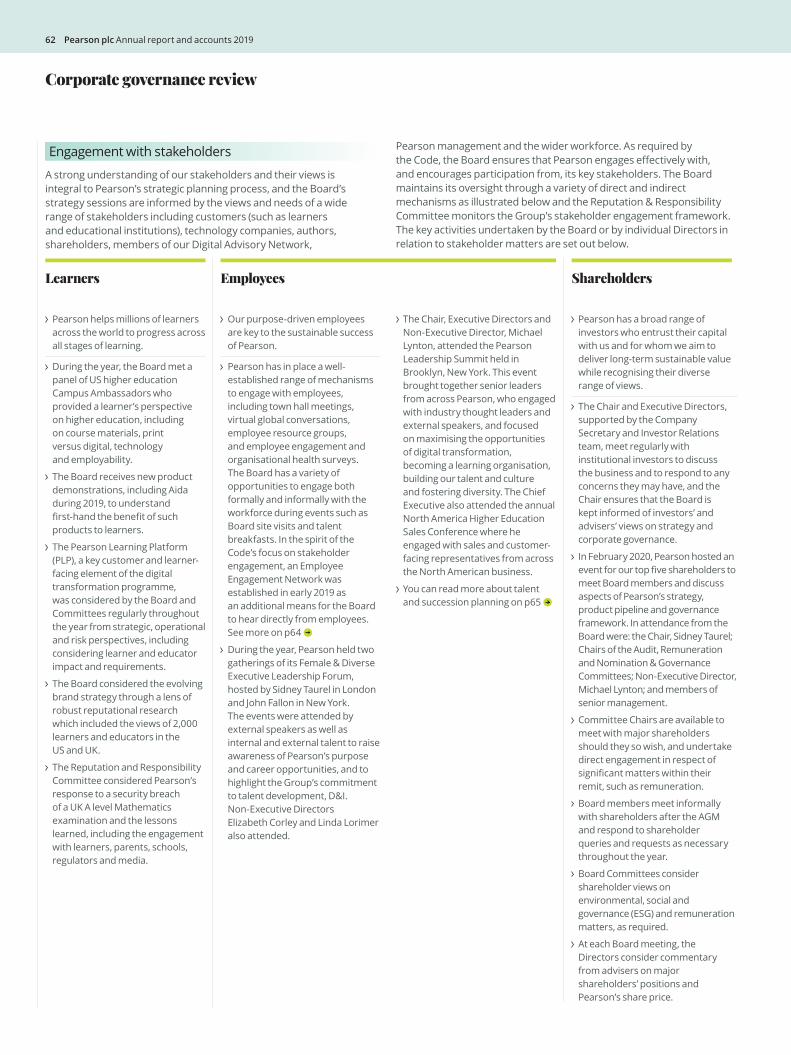
Engagement with stakeholders
A strong understanding of our stakeholders and their views is integral to Pearson’s strategic planning process, and the Board’s strategy sessions are informed by the views and needs of a wide range of stakeholders including customers (such as learners and educational institutions), technology companies, authors, shareholders, members of our Digital Advisory Network,
Pearson management and the wider workforce. As required by the Code, the Board ensures that Pearson engages effectively with, and encourages participation from, its key stakeholders. The Board maintains its oversight through a variety of direct and indirect mechanisms as illustrated below and the Reputation & Responsibility Committee monitors the Group’s stakeholder engagement framework. The key activities undertaken by the Board or by individual Directors in relation to stakeholder matters are set out below.
Pearson has a broad range of investors who entrust their capital with us and for whom we aim to deliver long-term sustainable value while recognising their diverse range of views.
The Chair and Executive Directors, supported by the Company Secretary and Investor Relations team, meet regularly with institutional investors to discuss the business and to respond to any concerns they may have, and the Chair ensures that the Board is kept informed of investors’ and advisers’ views on strategy and corporate governance.
In February 2020, Pearson hosted an event for our top five shareholders to meet Board members and discuss aspects of Pearson’s strategy, product pipeline and governance framework. In attendance from the Board were: the Chair, Sidney Taurel; Chairs of the Audit, Remuneration and Nomination & Governance Committees; Non-Executive Director, Michael Lynton; and members of senior management.
Committee Chairs are available to meet with major shareholders should they so wish, and undertake direct engagement in respect of significant matters within their remit, such as remuneration.
Board members meet informally with shareholders after the AGM and respond to shareholder queries and requests as necessary throughout the year.
Board Committees consider shareholder views on environmental, social and governance (ESG) and remuneration matters, as required.
At each Board meeting, the Directors consider commentary from advisers on major shareholders’ positions and Pearson’s share price.
Our purpose-driven employees are key to the sustainable success of Pearson.
Pearson has in place a well-established range of mechanisms to engage with employees, including town hall meetings, virtual global conversations, employee resource groups, and employee engagement and organisational health surveys. The Board has a variety of opportunities to engage both formally and informally with the workforce during events such as Board site visits and talent breakfasts. In the spirit of the Code’s focus on stakeholder engagement, an Employee Engagement Network was established in early 2019 as an additional means for the Board to hear directly from employees. See more on p64
During the year, Pearson held two gatherings of its Female & Diverse Executive Leadership Forum, hosted by Sidney Taurel in London and John Fallon in New York. The events were attended by external speakers as well as internal and external talent to raise awareness of Pearson’s purpose and career opportunities, and to highlight the Group’s commitment to talent development, D&I. Non-Executive Directors Elizabeth Corley and Linda Lorimer also attended.
The Chair, Executive Directors and Non-Executive Director, Michael Lynton, attended the Pearson Leadership Summit held in Brooklyn, New York. This event brought together senior leaders from across Pearson, who engaged with industry thought leaders and external speakers, and focused on maximising the opportunities of digital transformation, becoming a learning organisation, building our talent and culture and fostering diversity. The Chief Executive also attended the annual North America Higher Education Sales Conference where he engaged with sales and customer-facing representatives from across the North American business.
You can read more about talent and succession planning on p65
Corporate governance review
ShareholdersEmployees
Pearson helps millions of learners across the world to progress across all stages of learning.
During the year, the Board met a panel of US higher education Campus Ambassadors who provided a learner’s perspective on higher education, including on course materials, print versus digital, technology and employability.
The Board receives new product demonstrations, including Aida during 2019, to understand first-hand the benefit of such products to learners.
The Pearson Learning Platform (PLP), a key customer and learner-facing element of the digital transformation programme, was considered by the Board and Committees regularly throughout the year from strategic, operational and risk perspectives, including considering learner and educator impact and requirements.
The Board considered the evolving brand strategy through a lens of robust reputational research which included the views of 2,000 learners and educators in the US and UK.
The Reputation and Responsibility Committee considered Pearson’s response to a security breach of a UK A level Mathematics examination and the lessons learned, including the engagement with learners, parents, schools, regulators and media.
Learners
62 Pearson plc Annual report and accounts 2019
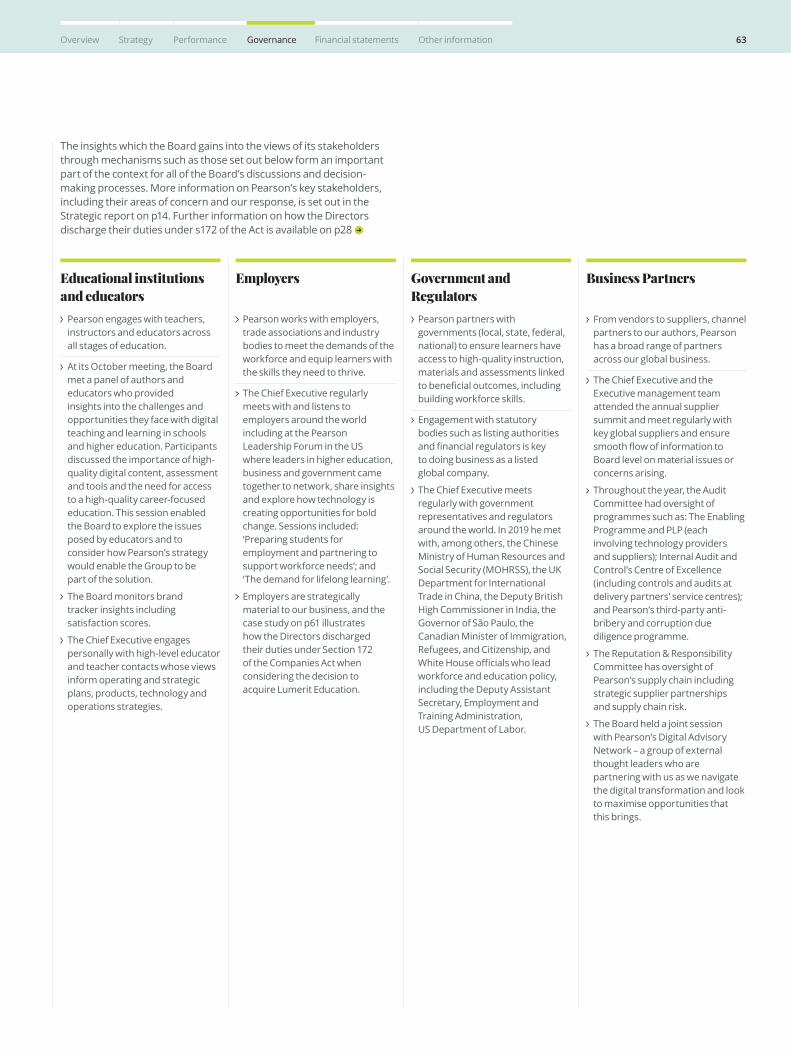
The insights which the Board gains into the views of its stakeholders through mechanisms such as those set out below form an important part of the context for all of the Board’s discussions and decision-making processes. More information on Pearson’s key stakeholders, including their areas of concern and our response, is set out in the Strategic report on p14. Further information on how the Directors discharge their duties under s172 of the Act is available on p28
Pearson engages with teachers, instructors and educators across all stages of education.
At its October meeting, the Board met a panel of authors and educators who provided insights into the challenges and opportunities they face with digital teaching and learning in schools and higher education. Participants discussed the importance of high-quality digital content, assessment and tools and the need for access to a high-quality career-focused education. This session enabled the Board to explore the issues posed by educators and to consider how Pearson’s strategy would enable the Group to be part of the solution.
The Board monitors brand tracker insights including satisfaction scores.
The Chief Executive engages personally with high-level educator and teacher contacts whose views inform operating and strategic plans, products, technology and operations strategies.
Educational institutions and educators
Pearson partners with governments (local, state, federal, national) to ensure learners have access to high-quality instruction, materials and assessments linked to beneficial outcomes, including building workforce skills.
Engagement with statutory bodies such as listing authorities and financial regulators is key to doing business as a listed global company.
The Chief Executive meets regularly with government representatives and regulators around the world. In 2019 he met with, among others, the Chinese Ministry of Human Resources and Social Security (MOHRSS), the UK Department for International Trade in China, the Deputy British High Commissioner in India, the Governor of São Paulo, the Canadian Minister of Immigration, Refugees, and Citizenship, and White House officials who lead workforce and education policy, including the Deputy Assistant Secretary, Employment and Training Administration, US Department of Labor.
From vendors to suppliers, channel partners to our authors, Pearson has a broad range of partners across our global business.
The Chief Executive and the Executive management team attended the annual supplier summit and meet regularly with key global suppliers and ensure smooth flow of information to Board level on material issues or concerns arising.
Throughout the year, the Audit Committee had oversight of programmes such as: The Enabling Programme and PLP (each involving technology providers and suppliers); Internal Audit and Control’s Centre of Excellence (including controls and audits at delivery partners’ service centres); and Pearson’s third-party anti-bribery and corruption due diligence programme.
The Reputation & Responsibility Committee has oversight of Pearson’s supply chain including strategic supplier partnerships and supply chain risk.
The Board held a joint session with Pearson’s Digital Advisory Network – a group of external thought leaders who are partnering with us as we navigate the digital transformation and look to maximise opportunities that this brings.
Pearson works with employers, trade associations and industry bodies to meet the demands of the workforce and equip learners with the skills they need to thrive.
The Chief Executive regularly meets with and listens to employers around the world including at the Pearson Leadership Forum in the US where leaders in higher education, business and government came together to network, share insights and explore how technology is creating opportunities for bold change. Sessions included: ‘Preparing students for employment and partnering to support workforce needs’; and ‘The demand for lifelong learning’.
Employers are strategically material to our business, and the case study on p61 illustrates how the Directors discharged their duties under Section 172 of the Companies Act when considering the decision to acquire Lumerit Education.
Government and Regulators
Business PartnersEmployers
63Overview Strategy Performance Governance Financial statements Other information
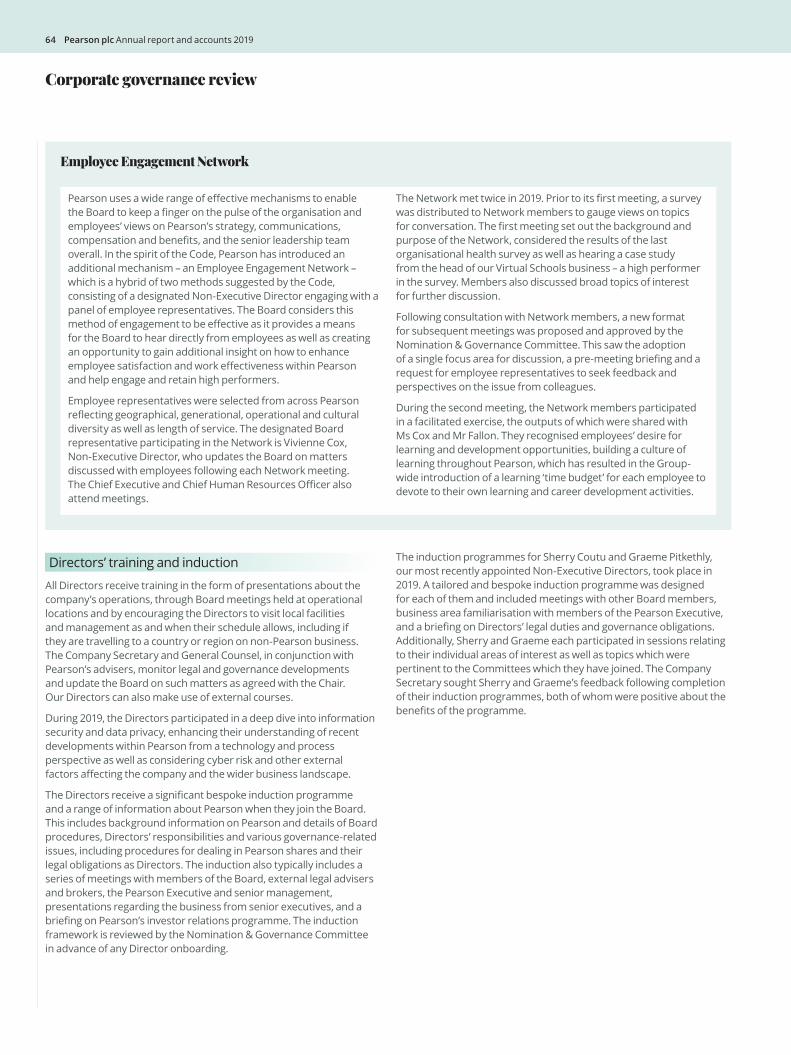
Corporate governance review
Employee Engagement Network
Pearson uses a wide range of effective mechanisms to enable the Board to keep a finger on the pulse of the organisation and employees’ views on Pearson’s strategy, communications, compensation and benefits, and the senior leadership team overall. In the spirit of the Code, Pearson has introduced an additional mechanism – an Employee Engagement Network – which is a hybrid of two methods suggested by the Code, consisting of a designated Non-Executive Director engaging with a panel of employee representatives. The Board considers this method of engagement to be effective as it provides a means for the Board to hear directly from employees as well as creating an opportunity to gain additional insight on how to enhance employee satisfaction and work effectiveness within Pearson and help engage and retain high performers.
Employee representatives were selected from across Pearson reflecting geographical, generational, operational and cultural diversity as well as length of service. The designated Board representative participating in the Network is Vivienne Cox, Non-Executive Director, who updates the Board on matters discussed with employees following each Network meeting. The Chief Executive and Chief Human Resources Officer also attend meetings.
The Network met twice in 2019. Prior to its first meeting, a survey was distributed to Network members to gauge views on topics for conversation. The first meeting set out the background and purpose of the Network, considered the results of the last organisational health survey as well as hearing a case study from the head of our Virtual Schools business – a high performer in the survey. Members also discussed broad topics of interest for further discussion.
Following consultation with Network members, a new format for subsequent meetings was proposed and approved by the Nomination & Governance Committee. This saw the adoption of a single focus area for discussion, a pre-meeting briefing and a request for employee representatives to seek feedback and perspectives on the issue from colleagues.
During the second meeting, the Network members participated in a facilitated exercise, the outputs of which were shared with Ms Cox and Mr Fallon. They recognised employees’ desire for learning and development opportunities, building a culture of learning throughout Pearson, which has resulted in the Group-wide introduction of a learning ‘time budget’ for each employee to devote to their own learning and career development activities.
Directors’ training and induction
All Directors receive training in the form of presentations about the company’s operations, through Board meetings held at operational locations and by encouraging the Directors to visit local facilities and management as and when their schedule allows, including if they are travelling to a country or region on non-Pearson business. The Company Secretary and General Counsel, in conjunction with Pearson’s advisers, monitor legal and governance developments and update the Board on such matters as agreed with the Chair. Our Directors can also make use of external courses.
During 2019, the Directors participated in a deep dive into information security and data privacy, enhancing their understanding of recent developments within Pearson from a technology and process perspective as well as considering cyber risk and other external factors affecting the company and the wider business landscape.
The Directors receive a significant bespoke induction programme and a range of information about Pearson when they join the Board. This includes background information on Pearson and details of Board procedures, Directors’ responsibilities and various governance-related issues, including procedures for dealing in Pearson shares and their legal obligations as Directors. The induction also typically includes a series of meetings with members of the Board, external legal advisers and brokers, the Pearson Executive and senior management, presentations regarding the business from senior executives, and a briefing on Pearson’s investor relations programme. The induction framework is reviewed by the Nomination & Governance Committee in advance of any Director onboarding.
The induction programmes for Sherry Coutu and Graeme Pitkethly, our most recently appointed Non-Executive Directors, took place in 2019. A tailored and bespoke induction programme was designed for each of them and included meetings with other Board members, business area familiarisation with members of the Pearson Executive, and a briefing on Directors’ legal duties and governance obligations. Additionally, Sherry and Graeme each participated in sessions relating to their individual areas of interest as well as topics which were pertinent to the Committees which they have joined. The Company Secretary sought Sherry and Graeme’s feedback following completion of their induction programmes, both of whom were positive about the benefits of the programme.
64 Pearson plc Annual report and accounts 2019
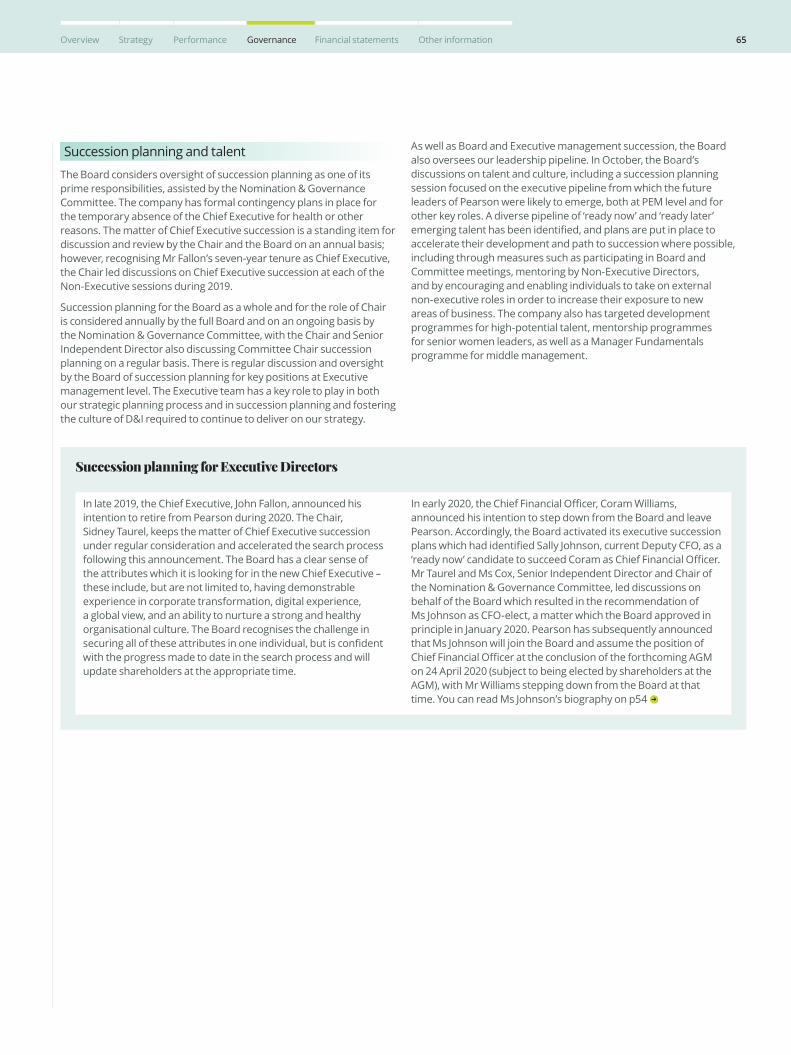
Succession planning and talent
The Board considers oversight of succession planning as one of its prime responsibilities, assisted by the Nomination & Governance Committee. The company has formal contingency plans in place for the temporary absence of the Chief Executive for health or other reasons. The matter of Chief Executive succession is a standing item for discussion and review by the Chair and the Board on an annual basis; however, recognising Mr Fallon’s seven-year tenure as Chief Executive, the Chair led discussions on Chief Executive succession at each of the Non-Executive sessions during 2019.
Succession planning for the Board as a whole and for the role of Chair is considered annually by the full Board and on an ongoing basis by the Nomination & Governance Committee, with the Chair and Senior Independent Director also discussing Committee Chair succession planning on a regular basis. There is regular discussion and oversight by the Board of succession planning for key positions at Executive management level. The Executive team has a key role to play in both our strategic planning process and in succession planning and fostering the culture of D&I required to continue to deliver on our strategy.
As well as Board and Executive management succession, the Board also oversees our leadership pipeline. In October, the Board’s discussions on talent and culture, including a succession planning session focused on the executive pipeline from which the future leaders of Pearson were likely to emerge, both at PEM level and for other key roles. A diverse pipeline of ‘ready now’ and ‘ready later’ emerging talent has been identified, and plans are put in place to accelerate their development and path to succession where possible, including through measures such as participating in Board and Committee meetings, mentoring by Non-Executive Directors, and by encouraging and enabling individuals to take on external non-executive roles in order to increase their exposure to new areas of business. The company also has targeted development programmes for high-potential talent, mentorship programmes for senior women leaders, as well as a Manager Fundamentals programme for middle management.
Succession planning for Executive Directors
In late 2019, the Chief Executive, John Fallon, announced his intention to retire from Pearson during 2020. The Chair, Sidney Taurel, keeps the matter of Chief Executive succession under regular consideration and accelerated the search process following this announcement. The Board has a clear sense of the attributes which it is looking for in the new Chief Executive – these include, but are not limited to, having demonstrable experience in corporate transformation, digital experience, a global view, and an ability to nurture a strong and healthy organisational culture. The Board recognises the challenge in securing all of these attributes in one individual, but is confident with the progress made to date in the search process and will update shareholders at the appropriate time.
In early 2020, the Chief Financial Officer, Coram Williams, announced his intention to step down from the Board and leave Pearson. Accordingly, the Board activated its executive succession plans which had identified Sally Johnson, current Deputy CFO, as a ‘ready now’ candidate to succeed Coram as Chief Financial Officer. Mr Taurel and Ms Cox, Senior Independent Director and Chair of the Nomination & Governance Committee, led discussions on behalf of the Board which resulted in the recommendation of Ms Johnson as CFO-elect, a matter which the Board approved in principle in January 2020. Pearson has subsequently announced that Ms Johnson will join the Board and assume the position of Chief Financial Officer at the conclusion of the forthcoming AGM on 24 April 2020 (subject to being elected by shareholders at the AGM), with Mr Williams stepping down from the Board at that time. You can read Ms Johnson’s biography on p54
65Overview Strategy Performance Governance Financial statements Other information
Corporate governance review
Board evaluation
The Board operates a three-yearly evaluation cycle which employs a variety of methodologies to ensure the most effective evaluation outcomes.
The Nomination & Governance Committee is responsible for overseeing the evaluation process on behalf of the Board and it spent time during the year scoping the process and themes for the 2019 evaluation, with Committee members being invited to suggest particular questions or items for discussion.
In line with the framework agreed by the Committee, the Senior Independent Director held one-to-one conversations with each member of the Board during October 2019. Discussion areas covered during the individual interviews included matters which are important to Pearson in particular, as well as those items laid down in the Code, including:
the Board’s understanding of markets, products and stakeholders, the quality of the information provided and discussion time to facilitate this
Pearson’s strategy, including its articulation and strategic process, and the quality of the Board’s discussions on strategy
the functioning of the Board, including composition, competencies, diversity and agendas
relationships between the Board and senior leaders, and between members of the Board itself
succession planning for Executive Directors and other senior leaders
the Board’s monitoring of organisational culture and behaviours
understanding of risks facing the company, including probability and mitigation
concerns and areas for improvement.
The Company Secretary invited all members of the Pearson Executive to provide their views on these topics by way of a questionnaire prior to the Directors’ individual interviews. The findings from this exercise involving the Pearson Executive were analysed with the assistance of an external advisory firm, Lintstock,1 and shared with the Senior Independent Director in advance of her conversations with Board members to allow for the Executive’s opinions to be taken into account during the process.
The Nomination & Governance Committee reviewed the findings from the Board evaluation with the full Board at its meeting in December 2019. The Committee will develop an action plan to address areas for improvement and will monitor progress during the year.
Key findings included:
a high overall level of satisfaction with the functioning of the Board, the competence and capabilities of the Directors, and the quality of relationships between Chair, Non-Executive Directors and the Executive
the level of support and challenge provided by the Board to management was generally viewed to be of an appropriate and balanced level
positive views in relation to the performance of the Committees including the volume and importance of work which they undertake on behalf of the Board
the composition and size of the Board was considered to be appropriate, with a good balance of skills and capabilities. Board members noted that consideration should be given to agreeing the skills profile for any new Non-Executive Directors as part of ongoing succession planning for the Board.
The main areas identified by the Board for continued focus during 2020 were:
refinement of the strategy, in particular continuing to develop the framework supporting lifelong learning and employability and ensuring clear and tight articulation of the strategy
the Board’s monitoring and challenge of the digital transformation, including scrutiny of progression metrics and oversight of the continued rollout of digital products
an awareness of the risk of transformation fatigue within the organisation
an ongoing focus on customers, including appropriate market and behavioural insights to facilitate the right level of scrutiny and challenge by the Board.
In addition, a number of actions were taken during the year in response to findings arising from the 2018 externally facilitated Board evaluation process. You can read more about progress on these in the table opposite. The Board has confirmed that these items were addressed to its satisfaction, with recommendations having been put into practice or a clear action plan identified for each.
Further, the Chair meets regularly with the Non-Executive Directors as a whole and these sessions include reciprocal feedback on the functioning of the Board to augment the formal Board evaluation process.
1 Lintstock’s involvement with the Pearson Group is limited to matters led by the Company Secretary’s office, namely to assist with tools and market insights in respect of listed company governance practices and obligations.
In-depth evaluation, externally facilitated 2017
1
Questionnaire, tailored to specific needs of the business
2018
2
Internally facilitated interview, to be led by the Chair, Senior Independent Director and/or Company Secretary as appropriate
2019
Year MethodologyLast
undertaken
Three-yearly evaluation cycle
3
66 Pearson plc Annual report and accounts 2019

Progress on findings of 2018 evaluation
Finding Response/action taken
Ongoing development and articulation of the strategy
There is acknowledgement by longer-serving members of the Board of the significant progress that has been made on development of the strategy, particularly in respect of the articulation of the five-year strategic vision. Refinement and articulation of the strategy will be a continued area of focus throughout 2020, and the Board is mindful of the need to balance the thinking on the long term with execution of short-term goals in a challenging environment for certain parts of the business.
Board succession planning Two new Non-Executive Directors, Sherry Coutu and Graeme Pitkethly, joined the Board in 2019. Succession planning for Non-Executives, including for the Committee Chair and Senior Independent Director roles, will be a continued focus in 2020. This will include a skills mapping process to enable the Board to design a candidate profile for future Non-Executive Directors in preparation for retirements in the coming years.
Leadership development and succession planning below Board level
Executive talent and succession planning are regular items on the Board’s agenda, with two such sessions taking place during the year, augmented by networking and mentoring programmes involving the Board and senior leaders. Read more about succession planning on p65
Continue to enhance Board’s oversight of culture
In early 2019, the Board considered results of the latest employee engagement survey, and it receives periodic updates on employee engagement from the designated Non-Executive Director, Vivienne Cox. The Nomination & Governance Committee discussed in detail the Code’s requirement for the Board to monitor culture, and how best to achieve this, which led to a session on talent, culture and values at the Board’s October meeting. The Board and its Committees also receive information which provides insights into organisational culture, such as compliance and talent metrics, and has a variety of opportunities to see the culture in action at events throughout the year. Culture will remain an area of focus during 2020 as the Board is mindful of the potential effects of business transformation on organisational culture.
Continue to consider the competitive landscape and customer views
During the year, the Board received updates on the competitive landscape and discussed customer trends during its regular sessions on the US Higher Education Courseware business, as well as meeting in person with learner and educator representatives. In December, as part of its site visit to the Online Program Management business in the US, the Board considered the competitive landscape for that sector. Additionally, the Board’s milestones dashboard contains metrics regarding Pearson’s performance in the markets in which the company operates, and the competitive landscape is a factor considered in any proposals relating to acquisitions or disposals.
Board’s understanding of risk Risk deep dives take place at each Audit Committee meeting on key risk areas, supplemented by Reputation & Responsibility Committee oversight of certain risks. The Board retains oversight of the organisational risk management process, with support from the Audit Committee, and during the year the full Board held a deep dive into data privacy and information security, considering the external landscape and Pearson’s frameworks to address these risks.
Individual evaluation
In addition to the evaluation of the Board as a whole, Executive Directors are evaluated each year on their overall performance against goals agreed by the Board, and in respect of personal objectives under the company’s annual incentive plan. These goals and objectives are linked to the key metrics for the company, including both financial and strategic objectives as well as goals linked to culture, talent and brand. Progress against each of these metrics is reviewed by the Board on a regular basis, as part of a dashboard of KPIs.
The Chair leads a formal individual evaluation of each Non-Executive Director every other year and encourages open channels of communication between Directors and the Chair on an ongoing basis. In the Board’s opinion, these ongoing lines of communication, combined with a Group-wide culture which allows and encourages feedback at any time, provide the most effective means for evaluation. In assessing the contribution of each Non-Executive Director, the Chair has confirmed that each continues to make a significant contribution to the business and deliberations of the Board. The Non-Executive Directors, led by the Senior Independent Director, also conduct an annual review of the Chair’s performance, with the Senior Independent Director providing feedback from this review to the Chair.
Committee evaluation
All Committees undertake an annual evaluation process to review their performance and effectiveness. For 2019, the Committee evaluation process formed part of the wider Board evaluation led by the Senior Independent Director, and the findings from this were considered by the Board as a whole in December 2019. Read more on this in the Committee reports on the pages that follow.
67Overview Strategy Performance Governance Financial statements Other information
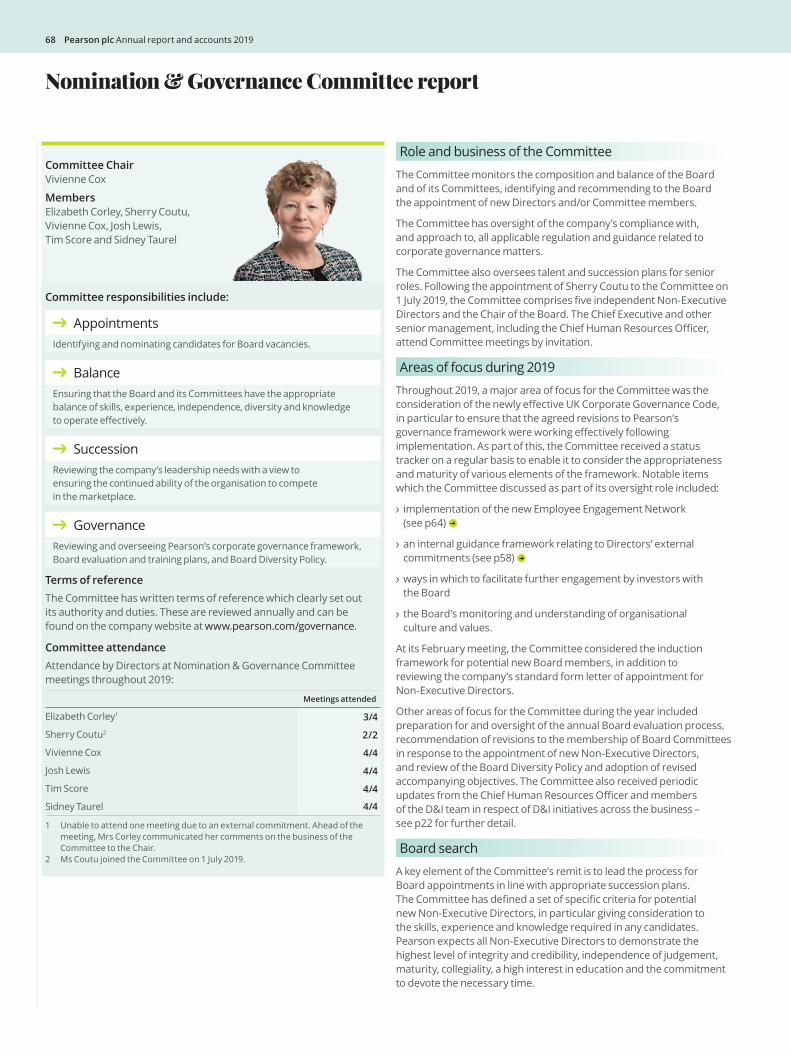
Role and business of the Committee
The Committee monitors the composition and balance of the Board and of its Committees, identifying and recommending to the Board the appointment of new Directors and/or Committee members.
The Committee has oversight of the company’s compliance with, and approach to, all applicable regulation and guidance related to corporate governance matters.
The Committee also oversees talent and succession plans for senior roles. Following the appointment of Sherry Coutu to the Committee on 1 July 2019, the Committee comprises five independent Non-Executive Directors and the Chair of the Board. The Chief Executive and other senior management, including the Chief Human Resources Officer, attend Committee meetings by invitation.
Areas of focus during 2019
Throughout 2019, a major area of focus for the Committee was the consideration of the newly effective UK Corporate Governance Code, in particular to ensure that the agreed revisions to Pearson’s governance framework were working effectively following implementation. As part of this, the Committee received a status tracker on a regular basis to enable it to consider the appropriateness and maturity of various elements of the framework. Notable items which the Committee discussed as part of its oversight role included:
implementation of the new Employee Engagement Network (see p64)
an internal guidance framework relating to Directors’ external commitments (see p58)
ways in which to facilitate further engagement by investors with the Board
the Board’s monitoring and understanding of organisational culture and values.
At its February meeting, the Committee considered the induction framework for potential new Board members, in addition to reviewing the company’s standard form letter of appointment for Non-Executive Directors.
Other areas of focus for the Committee during the year included preparation for and oversight of the annual Board evaluation process, recommendation of revisions to the membership of Board Committees in response to the appointment of new Non-Executive Directors, and review of the Board Diversity Policy and adoption of revised accompanying objectives. The Committee also received periodic updates from the Chief Human Resources Officer and members of the D&I team in respect of D&I initiatives across the business – see p22 for further detail.
Board search
A key element of the Committee’s remit is to lead the process for Board appointments in line with appropriate succession plans. The Committee has defined a set of specific criteria for potential new Non-Executive Directors, in particular giving consideration to the skills, experience and knowledge required in any candidates. Pearson expects all Non-Executive Directors to demonstrate the highest level of integrity and credibility, independence of judgement, maturity, collegiality, a high interest in education and the commitment to devote the necessary time.
Nomination & Governance Committee report
Committee Chair Vivienne Cox
Members Elizabeth Corley, Sherry Coutu, Vivienne Cox, Josh Lewis, Tim Score and Sidney Taurel
Committee responsibilities include:
AppointmentsIdentifying and nominating candidates for Board vacancies.
BalanceEnsuring that the Board and its Committees have the appropriate balance of skills, experience, independence, diversity and knowledge to operate effectively.
SuccessionReviewing the company’s leadership needs with a view to ensuring the continued ability of the organisation to compete in the marketplace.
GovernanceReviewing and overseeing Pearson’s corporate governance framework, Board evaluation and training plans, and Board Diversity Policy.
Terms of referenceThe Committee has written terms of reference which clearly set out its authority and duties. These are reviewed annually and can be found on the company website at www.pearson.com/governance.
Committee attendance Attendance by Directors at Nomination & Governance Committee meetings throughout 2019:
Meetings attended
Elizabeth Corley1 3/4
Sherry Coutu2 2/2
Vivienne Cox 4/4
Josh Lewis 4/4
Tim Score 4/4
Sidney Taurel 4/4
1 Unable to attend one meeting due to an external commitment. Ahead of the meeting, Mrs Corley communicated her comments on the business of the Committee to the Chair.
2 Ms Coutu joined the Committee on 1 July 2019.
68 Pearson plc Annual report and accounts 2019
In its most recent search, the Committee agreed that it was particularly interested to identify candidates who would complement its current skill set, ideally bringing a combination of global executive experience, financial background and UK listed company expertise.
Taking into account the agreed person specification, the Committee engaged Russell Reynolds Associates in 2018 to commence a search process for new Non-Executive Directors. This process continued into early 2019 and, in line with the objectives of the Board’s Diversity Policy, the Committee, led by Ms Cox, worked closely with Russell Reynolds Associates to ensure that the list of candidates reflected diversity of gender and ethnicity as well as diversity in its broadest sense.
Following consideration by the Committee of a shortlist of candidates, including their current commitments, skills and previous experience, and bearing in mind the Pearson culture, the search process culminated in the appointments of Sherry Coutu and Graeme Pitkethly as Non-Executive Directors with effect from 1 May 2019.
At the end of 2019, reflecting the announcement by John Fallon of his intention to retire from the Pearson Board, the Committee commenced a search process for a new Chief Executive, putting into practice the Chief Executive succession plans which are reviewed by the Board on an annual basis. This search process, in which both internal and external candidates are under consideration, is being led by the Chair of the Board, Sidney Taurel, with support from Ms Cox and other Board members as well as the Chief Human Resources Officer. Pearson is being assisted in the external element of this search process by Russell Reynolds Associates (search activity) and Jan Hall Consulting Limited (trading as ‘No. 4’) (advisory activity). You can read more about Succession planning for Executive Directors on p65
In addition to the Non-Executive Director and Chief Executive search processes, Russell Reynolds Associates undertakes broader executive search activity for the Group, and is a signatory to the Voluntary Code of Conduct for Executive Search Firms. Jan Hall Consulting Limited has no other current connection to Pearson.
Committee evaluation
The Committee undertook an annual evaluation to review its own performance and effectiveness. The process was undertaken as part of the wider Board evaluation process and sought views from the Board and Company Secretary on matters including Committee roles and responsibilities, quality and timeliness of meeting materials, opportunity for discussion and debate, dialogue with management and access to independent advice.
The Committee was considered to have operated effectively throughout 2019 with a clear agenda and effective leadership, and there was recognition of the volume of work which the Committee had undertaken during the year. In response to the findings of the 2018 evaluation, the Committee gave consideration to the processes relating to Non-Executive Director search activity, as a result of which the Committee agreed an interview framework for candidates which would encourage openness and communication between potential candidates and existing Board members.
Nomination & Governance Committee meeting focus during 2019
Appointments Search for two new Non-Executive Directors, resulting in appointments of Sherry Coutu and Graeme Pitkethly
Directors’ commitments guidance framework
Balance Membership of Board Committees
D&I initiatives at Pearson
Review and approval of Board Diversity Policy and accompanying objectives
Succession Executive and Non-Executive Director succession planning
Induction outline for new Directors
Governance Board evaluation preparation and findings
Compliance with UK Corporate Governance Code
Oversight of development of the Employee Engagement Network
Schedule and length of meetings
Approval of Committee terms of reference
Committee aims for 2020
In 2020, the Committee will continue to pay attention to the principles and provisions of the Code, giving consideration to areas in which there may be scope to go above and beyond Pearson’s current governance arrangements in ensuring a world-class corporate governance framework. Building on discussions during 2019, we will continue to monitor Pearson’s organisational culture and, with the help of the Chief Human Resources Officer, we aim to introduce a dashboard drawing together key cultural indicators from across the Group, which will add quantitative metrics to augment the Board’s existing oversight of culture and organisational health. We will also hold updates on D&I and talent and succession. As part of these sessions we will consider the Board D&I policy and wider initiatives in place across Pearson, such as Valuable 500 and mentoring programmes, and we will review the format of the Employee Engagement Network after its first complete year of operation. Additionally, the Committee will oversee the Board evaluation process which, for 2020, will be externally-facilitated.
Vivienne Cox Chair of Nomination & Governance Committee
69Overview Strategy Performance Governance Financial statements Other information
Nomination & Governance Committee report
Board diversity
The commercial benefits of having a diverse Board are well established. At Pearson, we believe that diversity of all types on the Board makes us a better business by enabling enhanced commercial results and also that inclusive leadership for the company leads to better decision-making. It also reflects an overt commitment to finding and retaining the best, most diverse talent.
The Board embraces the Code’s underlying principles with regard to Board balance and diversity, including in respect of ethnicity, gender and age. The objectives set out in the Board’s Diversity Policy and our progress towards these objectives are shown in the table below. The Committee ensures that the Directors of Pearson demonstrate a broad balance of skills, background and experience, to support Pearson’s strategic development and reflect the global nature of our business.
The Committee also ensures that appointments are made on merit and relevant experience, while taking into account the broadest definition of diversity. In the recent Non-Executive Director search process, the Committee encouraged the retained search firm to place an emphasis on putting forward candidates who would enhance the overall diversity of the Board.
The gender diversity of the Board was 33% female representation as at 31 December 2019 (2018: 30%), achieving the recommendations suggested by the Hampton-Alexander Review aimed at having at least 33% female representation on the Board by 2020. We are committed to maintaining female representation on our Board at or in excess of this level. Pearson also satisfies the recommendation in the Parker Review that at least one Director should be from an ethnic minority background ahead of the 2021 target date.
Board D&I objectives
The Committee has agreed the following objectives on behalf of the Board, which were reviewed and updated during the year, to support the Board D&I Policy:
Objectives Progress
We will strive to maintain a Board composition of:
at least 33% female Directors
at least one Director of colour.
33% female Directors achieved.
Board includes one Director who identifies as Mixed – White & Black Caribbean.
All Board appointments will be made on merit, in the context of the skills and relevant experience that are needed for the Board to oversee Pearson’s strategic development and that reflect the global nature of our business.
Rigorous process used during recent search for Sherry Coutu and Graeme Pitkethly who each have relevant experience and skills.
The Board will continue to incorporate a focus on a diverse pipeline in its succession and appointment planning including to prioritise the use of search firms which adhere to the Voluntary Code of Conduct for Executive Search Firms (the Voluntary Code) when seeking to make Board-level appointments
Russell Reynolds Associates assisted Pearson with the recent Non-Executive Director search process and are engaged on the external element of the Chief Executive search. Russell Reynolds Associates are a signatory to the Voluntary Code.
The Board will continue to adopt best practice, as appropriate, in response to the Davies Review, the Hampton-Alexander Review and the Parker Review.
The recommendations of the Davies Review, Hampton-Alexander Review and Parker Review in respect of gender and ethnic diversity have been noted by the Board.
The Board will consider its composition and diversity as part of its consideration of effectiveness in the Board evaluation review process
These matters were considered in the 2019 evaluation process.
Where appropriate, we will assist with the development and support of initiatives that promote all forms of D&I in the Board, Pearson Executive and our senior management.
Board mentoring scheme of senior leadership talent ongoing throughout 2019.
Board members participated in Pearson’s Female & Diverse Executive Leadership Forum events held in London and New York, developed in direct response to a suggestion by the Nomination & Governance Committee.
We will review and report on our progress in line with the policy and our objectives in the annual report, including providing details of initiatives to promote D&I in the Board, Pearson Executive and our senior management.
The Nomination & Governance Committee reviewed the Board’s Diversity Policy and accompanying objectives during the year, as well as developments on diversity in the external landscape.
We will continue to make key D&I information, about the Board, senior management and our wider employee population, available in the annual report, and aim for ongoing transparency in this area in line with best practice.
This information is included in the annual report.
Target achieved New target Changed target
70 Pearson plc Annual report and accounts 2019
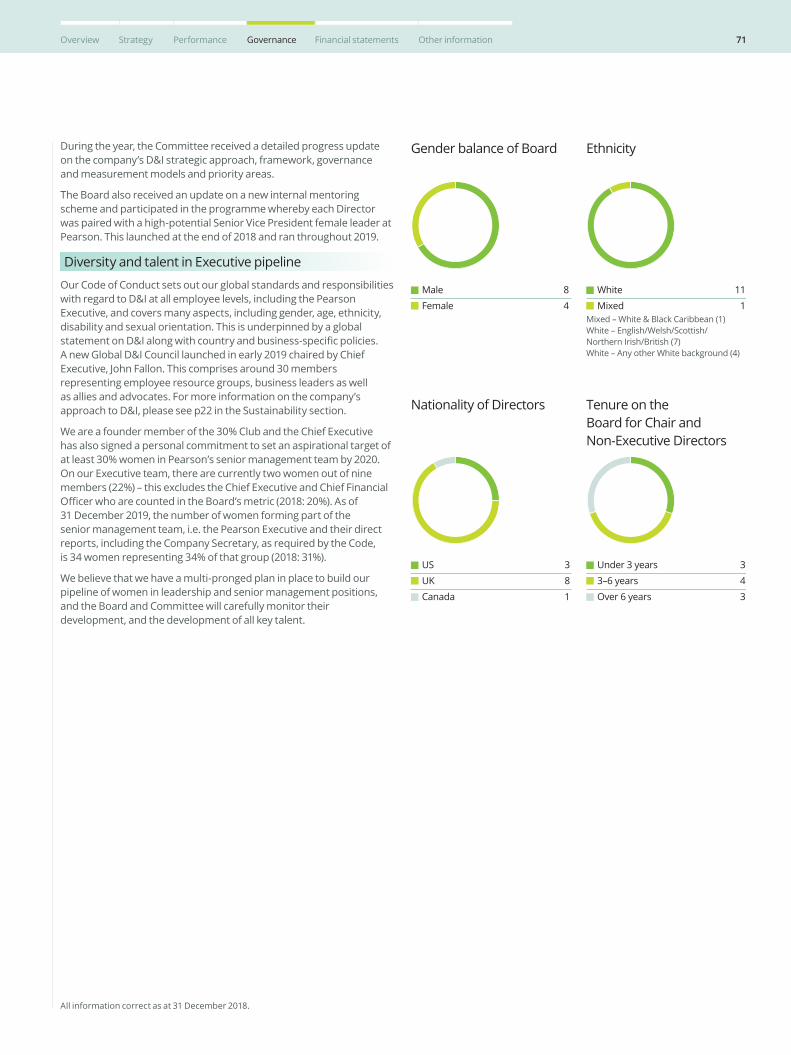
All information correct as at 31 December 2018.
Male 8
Female 4
Gender balance of Board
US 3
UK 8
Canada 1
Nationality of Directors
White 11
Mixed 1Mixed – White & Black Caribbean (1)White – English/Welsh/Scottish/Northern Irish/British (7)White – Any other White background (4)
Ethnicity
Under 3 years 3
3–6 years 4
Over 6 years 3
Tenure on the Board for Chair and Non-Executive Directors
During the year, the Committee received a detailed progress update on the company’s D&I strategic approach, framework, governance and measurement models and priority areas.
The Board also received an update on a new internal mentoring scheme and participated in the programme whereby each Director was paired with a high-potential Senior Vice President female leader at Pearson. This launched at the end of 2018 and ran throughout 2019.
Diversity and talent in Executive pipeline
Our Code of Conduct sets out our global standards and responsibilities with regard to D&I at all employee levels, including the Pearson Executive, and covers many aspects, including gender, age, ethnicity, disability and sexual orientation. This is underpinned by a global statement on D&I along with country and business-specific policies. A new Global D&I Council launched in early 2019 chaired by Chief Executive, John Fallon. This comprises around 30 members representing employee resource groups, business leaders as well as allies and advocates. For more information on the company’s approach to D&I, please see p22 in the Sustainability section.
We are a founder member of the 30% Club and the Chief Executive has also signed a personal commitment to set an aspirational target of at least 30% women in Pearson’s senior management team by 2020. On our Executive team, there are currently two women out of nine members (22%) – this excludes the Chief Executive and Chief Financial Officer who are counted in the Board’s metric (2018: 20%). As of 31 December 2019, the number of women forming part of the senior management team, i.e. the Pearson Executive and their direct reports, including the Company Secretary, as required by the Code, is 34 women representing 34% of that group (2018: 31%).
We believe that we have a multi-pronged plan in place to build our pipeline of women in leadership and senior management positions, and the Board and Committee will carefully monitor their development, and the development of all key talent.
71Overview Strategy Performance Governance Financial statements Other information
Reputation & Responsibility Committee role
The Committee forms an important part of the Board’s governance structure. It works to advance and assess Pearson’s reputation across the range of its stakeholders and to maximise the company’s positive impact on society and the communities where we work and serve.
The Committee’s remit covers issues and initiatives relating to the company’s reputation and its civic responsibilities. These include those matters that are material to Pearson’s stakeholders and the company’s long-term sustainability, as well as a regular review of those incidents that could adversely affect the company’s reputation. We promote Pearson’s sustainability plan and assess the progress in advancing its tenets. The Committee works in alignment with the company’s Responsible Business Leadership Council, which comprises senior leaders from across the business.
Read more about Sustainability on p16
Changes to the Committee
Graeme Pitkethly, who joined the Board in May 2019, was appointed to the Reputation & Responsibility Committee on 1 July 2019. Graeme brings valuable experience in sustainability practice and consumer behaviour from his time at Unilever, as well as a strong understanding of best practice in external reporting on sustainability and climate change due to his role as Vice Chair of the Task Force on Climate-related Financial Disclosures. I look forward to working closely with him on the Committee; he is already adding important insights.
Areas of focus during 2019
The Committee conducts in-depth reviews of issues that are important to the sustainability of our business and our reputation. Key issues, which are monitored by the Committee and discussed either by the Board or one of its Committees, include:
1. competitiveness of digital products
2. data privacy and information security
3. security, Health & Safety
4. corporate governance
5. economic empowerment
6. access to education
7. affordability of products/services
8. 21st-century skills
9. greenhouse gas emissions and climate change.
In the first year of the Code’s stakeholder engagement requirements, we helped to scope and monitor the company’s framework for gathering and responding to stakeholder views (see p14). Learners are a key stakeholder for Pearson, and we held in-depth discussions into privacy and ethical issues related to learners’ data. The Committee also reviewed Pearson’s planned standard for learner data management, which will shape the company’s use of AI technology and personal data collection.
In October, the Committee considered plans for Pearson’s 2030 Sustainability Strategy and carbon reduction targets. In particular, we discussed the three main pillars for the 2030 plan that had been identified through extensive stakeholder engagement and materiality mapping, namely: advance equity in learning; build skills for sustainable futures; and lead by example through initiatives for
Reputation & Responsibility Committee report
Committee Chair Linda Lorimer
Members Vivienne Cox, Linda Lorimer, Michael Lynton, Graeme Pitkethly and Lincoln Wallen
Committee responsibilities include:
ReputationPearson’s reputation among major stakeholders, including governments, investors, employees, customers, learners and the education community.
RiskOversight of Pearson’s approach to reputational risk, and ensuring that clear roles have been assigned for the management of the reputation dimension of risks identified.
SustainabilityOversight of 2020 sustainability plan and performance against sustainability goals and commitments.
Brand & cultureManagement of the Pearson brand to ensure that its value and reputation are maintained and enhanced. Pearson’s approach to monitoring and supporting the values and desired behaviours that form our corporate culture.
EthicsEthical business standards, including Pearson’s approach to issues relevant to its reputation as a responsible corporate citizen.
StrategyStrategies, policies and communication plans related to reputation and responsibility issues and the people and processes that are in place to manage, anticipate and adapt to them.
Terms of referenceThe Committee has written terms of reference that clearly set out its authority and duties. These are reviewed annually and can be found on the company at website www.pearson.com/governance.
Committee attendance Attendance by Directors at Reputation & Responsibility Committee meetings throughout 2019:
Meetings attended
Vivienne Cox 4/4
Linda Lorimer 4/4
Michael Lynton 4/4
Graeme Pitkethly1 3/3
Lincoln Wallen 4/4
1 Appointed to the Committee on 1 July 2019.
72 Pearson plc Annual report and accounts 2019
advancing such areas as human rights and the environment. Committee members offered guidance regarding potential goals for each of the three pillars and the timeline for the strategy, and considered the integration of sustainability within Pearson’s business model with reference to the UN Sustainable Development Goals.
During 2019, the Committee also reviewed proposed public statements on modern slavery and considered Pearson’s broader human rights strategy, both of which are important to Pearson’s values and the delivery of its sustainability plan. We also considered incidents of reputational note, including those which had received coverage through traditional or social media such as Pearson’s response to the security breach of a UK A level Maths exam paper and the company’s subsequent engagement with learners, schools and the exam regulator.
Pearson’s brand strategy was another important area of focus during the year for the Committee. The brand strategy was informed by reputational research insights from a study of learners, educators and members of the public across the US and UK. The Committee also spent time with the Chief Corporate Affairs Officer, who had joined Pearson at the start of 2019, in order to understand her priorities.
We also examined progress on supply chain risk and, as every year, delved into the areas of health, safety and safeguarding, which are principal risks for Pearson. The Committee also reviewed Pearson’s efficacy programme and discussed future plans for continued integration of efficacy findings into our product development cycle. Read more about Efficacy on p27
Committee evaluation
In 2019, the Committee evaluation formed part of the wider Board evaluation process led by Senior Independent Director, Vivienne Cox. She sought views from all members of the Board and the Company Secretary through a series of one-to-one interviews. The evaluation found that Directors were pleased with the functioning of the Committee, recognising the Chair for the manner in which the Committee’s work is cogently reported to the Board. The Directors commented that the work of the Committee is becoming ever more important and closely linked to strategy, and that it was necessary to ensure sufficient time during the year to cover the growing roster of matters within its remit. Particular areas highlighted by the Directors for continued focus during the coming year were privacy and data management and the development of the brand in support of the strategy.
Progress on findings of 2018 evaluationThe responses to the 2018 evaluation, which was conducted by way of a questionnaire to Committee members and key internal stakeholders, highlighted that:
the Committee has matured, with increasing focus on strategically material issues. The development of the 2030 Sustainability Strategy will only make the Committee’s work more valuable.
the introduction of private sessions as part of each meeting, similar to Audit and Remuneration Committees, was recommended. They have proven to be beneficial and enable Committee members to discuss and agree on key issues to take forward with management. These sessions will be continued as a regular part of each Committee meeting over the coming year.
Reputation & Responsibility Committee meeting focus during 2019
Reputation Supply chain and third-party risk management
Issues and incidents reports
Reputation research
Editorial Policy – progress report
Risk Safeguarding
Health & Safety
Sustainability 2030 Sustainability Strategy
Greenhouse gas emissions and carbon reduction targets
Brand & culture Brand strategy
Efficacy update and future plans
Ethics Human Rights Policy
Modern Slavery Act statement
Strategy Learner data
Artificial intelligence
Governance Committee terms of reference
Stakeholder engagement framework
Committee aims for 2020
Over the next year, we will continue to focus on data privacy from the perspective of the learner and continue to monitor the advancement of our brand strategy as well as Pearson’s approach to reputational risk.
We will continue to explore Pearson’s material sustainability issues (e.g. 21st-century skills and climate change), monitor progress on supply chain risk, engage in the next phase of development of our 2030 Sustainability Strategy (focusing on the goals and KPIs to underpin successful delivery of the strategy). The Committee will also examine the results of our global learner survey and investor priorities and opportunities in the environmental, social and governance (ESG) space.
Linda Lorimer Chair of Reputation & Responsibility Committee
73Overview Strategy Performance Governance Financial statements Other information
Audit Committee role
The Committee has been established by the Board primarily for the purpose of overseeing the accounting, financial reporting, internal control and risk management processes of the company and the audit of the financial statements of the company. As a Committee, we are responsible for assisting the Board’s oversight of the quality and integrity of the company’s external financial reporting and statements and the company’s accounting policies and practices.
Pearson’s SVP-Internal Audit, Risk and Compliance has a dual reporting line to the Chief Financial Officer and to me, and external auditors have direct access to the Committee to raise any matters of concern and to report on the results of work directed by the Committee. As Audit Committee Chair, I report to the full Board at every Board meeting immediately following a Committee meeting. I also work closely with the CFO and senior financial management outside the formal meeting schedule to ensure robust oversight and challenge in relation to financial control and risk management.
Audit Committee composition
Following his appointment to the Board in May 2019, Graeme Pitkethly was appointed to the Audit Committee on 1 July 2019. Graeme’s leadership experience in complex global businesses, as well as his background as a Chartered Accountant and in-depth knowledge of financial and operational matters, will complement the Committee’s existing skill set, and I look forward to working closely with him. Following Graeme’s appointment, the Committee comprises seven independent Non-Executive Directors. As a Committee, we have a good balance of skills and knowledge with competence and experience covering all aspects of the sectors in which Pearson operates – education, digital and services – and our key geographic markets.
Fair, balanced and understandable reporting
We are mindful of the Code’s principle N relating to fair, balanced and understandable reporting and we build sufficient time into our annual report timetable to ensure that the full Board receives sufficient opportunity to review, consider and comment on the report as it progresses. Learn more about fair, balanced and understandable reporting on p110
Risk assessment, assurance and integrity
A key role of the Committee is to provide oversight and reassurance to the Board with regard to the integrity of the company’s financial reporting, internal control policies and procedures for the identification, assessment and reporting of risk. During 2019, we conducted a number of deep dives into selected principal risks, and the key risks on which the Committee focused throughout the year are set out below. Learn more about principal risks and uncertainties on p40
Business transformationOngoing business transformation and change is one of Pearson’s key risks and opportunities, and The Enabling Programme (TEP) is an important operational simplification project covering Pearson’s key enterprise resource planning technology and processes, including financial, operations and HR systems and processes.
Audit Committee report
Committee Chair Tim Score
Members Elizabeth Corley, Vivienne Cox, Linda Lorimer, Michael Lynton, Graeme Pitkethly, Tim Score and Lincoln Wallen
Committee responsibilities include:
ReportingThe quality and integrity of financial reporting and statements and related disclosure.
PolicyGroup policies, including accounting policies and practices.
External auditExternal audit, including the appointment, qualification, independence and performance of the external auditor.
Internal audit, risk & internal controlRisk management systems and the internal control environment including oversight of the work of the internal audit function.
Compliance & governanceCompliance with legal and regulatory requirements in relation to financial reporting and accounting matters.
Terms of referenceThe Committee has written terms of reference which clearly set out its authority and duties. These are reviewed annually and can be found on the company website at www.pearson.com/governance.
Committee attendance Attendance by Directors at Audit Committee meetings throughout 2019:
Meetings attended
Elizabeth Corley1 3/4
Vivienne Cox 4/4
Linda Lorimer 4/4
Michael Lynton 4/4
Graeme Pitkethly2 2/2
Tim Score 4/4
Lincoln Wallen 4/4
1 Part-attendance at one meeting due to an external commitment – this is formally recorded as an absence.
2 Appointed to the Audit Committee on 1 July 2019.
74 Pearson plc Annual report and accounts 2019

Audit Committee meeting focus during 2019
Reporting Accounting and technical updates
Impact of legal claims and regulatory issues on financial reporting
Fair, balanced and understandable, going concern and viability statements
2018 annual report and accounts: preliminary announcement, financial statements and income statement
Review of interim results and trading updates
Form 20-F and related disclosures, including annual Sarbanes-Oxley Act section 404 attestation of financial reporting internal controls
Significant issues reporting
Analysis supporting viability statement
Policy Accounting matters and Group accounting policies
Annual review and approval of external auditors’ policy
Treasury policy and reporting
Tax strategy, including an update on EU state aid and impact of US tax reforms
External audit Provision of non-audit services by PwC
Receipt of external auditors’ report on Form 20-F and year-end audit
Report on half-year procedures
Reappointment of external auditors
Confirmation of auditor independence
2019 external audit plan
Remuneration and engagement letter of external auditors
Review opinion on interim results
Review of the effectiveness of external auditors
Internal audit, risk & internal control Internal audit activity reports and review of key findings
Organisational risk management
2020 internal audit plan
Assessment of the effectiveness of internal audit function, internal control environment and risk management systems
Oversight of The Enabling Programme
Risk deep dives: information and cyber-security; data privacy; treasury and insurance; anti-bribery and corruption (ABC); tax; business resilience
Oversight of the programme to develop the Pearson Learning Platform
Controls Centre of Excellence updates
Compliance & governance Fraud, whistleblowing reports and compliance investigations
Schedule of authorities
Compliance with accounting and audit-related aspects of the UK Corporate Governance Code
Audit Committee, Verification Committee and internal audit function terms of reference
Audit Committee evaluation
The Committee has received an update at each meeting during the planning and implementation phases of TEP, engaging with the senior management team leading the programme. The primary areas of focus for the Committee in 2019 were:
in the first half of the year, oversight of the implementation of finance, procurement, e-commerce and supply chain systems to: (i) the remainder of our North American business which had been operating on legacy systems; and (ii) the Assessments business, including Clinical and VUE. In particular, the Committee considered the preparatory steps from technology, employee and customer perspectives, progress on system integration and testing, and status of key readiness milestones in advance of the implementation
preparations for the Rest of World phase of TEP which will see most remaining markets outside of Pearson’s UK and US business move to the new systems and processes
in the second half of the year, monitoring the progress of the business value realisation (BVR) programme. Following TEP deployment in the UK and US, management took the decision to review the live environment in order to: (i) identify continuous improvement opportunities; and (ii) explore areas of the deployment where further integration was required, with the overall aim of BVR being to assess how best to leverage business value from TEP and integrated release investments. As part of the Committee’s regular deep dives, Committee members were updated on the ways in which processes had been considered from an employee, customer and data quality perspective, resulting in opportunities being identified for improvements in areas such as data quality and end-to-end delivery. The Committee then considered the progress made in those areas, noting that attention was now turning to prevention and maintenance of those data assets.
75Overview Strategy Performance Governance Financial statements Other information
Alongside TEP, Pearson has moved to a shared services model for delivery of certain Finance and HR processes, and the Committee considered regularly the work undertaken by the Controls Centre of Excellence team. The external auditors, PwC, updated the Committee at each meeting on the work that they had conducted in respect of testing controls, and they shared perspectives on strategic opportunities to further enhance the controls framework.
Data privacy and Information securityPearson considers data privacy and information security as principal risks reflecting a business model which is increasingly based around digital products. In 2019, the Chief Privacy Officer and Chief Information Security Officer reported on both topics to the Committee, and the Board as a whole, recognising the increasing importance of cyber-risk to modern businesses.
As part of the report, the Committee reviewed Pearson’s readiness for the California Consumer Privacy Act (which came into effect at the start of 2020), and an overview of privacy laws which would soon be introduced in other jurisdictions in which Pearson operates. Key aspects of Pearson’s data privacy programme were also considered, including:
the principles and priorities underpinning Pearson’s multi-year data privacy strategy
the emphasis on ‘privacy by design’ in the development of new Pearson products and platforms
the advancement of processes to respond to user/data subject requests, including the rights to access, correct and delete data
the review and enhancement of the data privacy governance structure
In addition, an update on the AimsWeb 1.0 security incident was provided.
The information security report allowed the Committee to consider the progress made in recent years. In considering the current status of the information security programme, the Committee noted the frameworks which had been put in place in respect of:
fundamental and proactive user, network and cloud security building blocks which limit outsider access to critical information
platforms and processes which control least-privilege access to various IT systems
Pearson’s ability to react as quickly as possible to a detected event, thereby aiming to reduce the window of vulnerability
Tools and processes to help the business assess and manage risk, set standards and measure compliance with internal and external requirements
The establishment of standards and methods to ensure Pearson products are designed to protect learners’ data and to ensure products continue to function if attacked
The Committee considered in particular the ways in which the architecture of the PLP and ways of working in its design and development aim to greatly increase the inherent platform security as well as the many ‘digital native’ security features which have been built into PLP. Separately, the Chief Information Security Officer noted that the decommissioning of certain legacy systems was a particular area of focus in reducing the level of risk attached to Pearson’s information security programme.
Audit Committee meetings and activities
At every meeting, the Committee considered reports on the activities of the internal audit and compliance functions, including the results of internal audits, risk reviews, project assurance reviews and fraud and whistleblowing reports. The Committee also monitored the company’s financial reporting and risk management procedures, reviewed the services provided by PwC and considered any significant legal claims and regulatory issues in the context of their impact on financial reporting, each on a regular basis.
During the year, the Committee also discussed the finance and IT controls environment at each meeting, including Sarbanes-Oxley testing and scope, updates on prior year items, and the ongoing transformation of the Group-wide controls framework which is evolving in support of Pearson’s Global Business Services model.
In addition to the risk deep dives described above, the Committee also conducted deep dives into business resilience and crisis management, treasury, tax, and anti-bribery and corruption. In February 2020, the Committee considered the 2019 annual report and accounts, including the preliminary results announcement, financial statements, strategic report and Directors’ report.
View the key activities of the Audit Committee on p75
Internal audit evaluationThe International Standards for the Professional Practice of Internal Auditing (the Standards) require an independent external assessment of internal audit to be conducted at least once every five years by a qualified, independent assessor or assessment team from outside the organisation. At its December meeting, the Audit Committee considered the findings of an external quality assessment of internal audit, facilitated by Protiviti. The objectives of the review were to assess conformance with the Standards; to assess the effectiveness of internal audit within the context of its mandate and stakeholder expectations; and to provide recommendations to internal audit on improvement opportunities and emerging practices. The assessment
Members
All of the Audit Committee members are independent Non-Executive Directors and have financial and/or related business experience due to the senior positions they hold or have held in other listed or publicly traded companies and/or similar large organisations. Tim Score, Chair of the Committee since April 2015, is the company’s designated financial expert,
having recent and relevant financial experience, and is an Associate Chartered Accountant. Until July 2019, he also served as Audit Committee Chair for The British Land Company plc. The qualifications and relevant experience of the other Committee members are detailed on p54–56
Audit Committee report
76 Pearson plc Annual report and accounts 2019
was conducted by: interviewing key stakeholders of the internal audit function including the Committee Chair, members of the Pearson Executive, and senior financial, legal and operational management; reviewing a sample of internal audit files and other functional documentation including the audit universe and plan; and interviewing members of the internal audit function.
The findings indicated an effective internal audit function that conforms to the IIA’s International Standards. One conformance gap was identified – the requirement to have an external quality assessment every five years – which was addressed by the review itself taking place. Opportunities for improvement were also noted, largely related to the quality of supporting documentation. Based on the findings of the external review, and on its own ongoing assessment of the effectiveness of the internal audit function, the Committee is of the opinion that the quality, experience and expertise of the function is appropriate for the business.
Additional meeting attendeesIn addition to the Committee members, advisers and executives from across the business also attended meetings during the year. This gives the Committee direct contact with key leadership. The Chair and Chief Executive each attend at least one meeting per year, and the Chief Executive also attends for discussion of matters with an operational and customer focus such as the ongoing transformation and digital initiatives. The Committee also meets regularly in private with the external auditors; SVP-Internal Audit, Risk and Compliance; and VP-Internal Audit.
Audit Committee training
The Committee receives technical updates at each meeting, including on matters such as accounting standards and the audit and governance landscape, as well as specific or personal training as appropriate. In 2019, the Committee and other members of the Board and management participated in a training session covering:
the reviews of the audit market and regulatory landscape
corporate reporting and governance matters
a technical update on IFRS 16 (Leases).
Committee members also meet with local management on a periodic basis, such as when travelling for overseas Board meetings, in order to gain a better understanding of how Pearson’s policies are embedded in operations.
Committee evaluation
In 2019, the Committee evaluation formed part of the wider Board evaluation process led by Senior Independent Director, Vivienne Cox, which sought views from all members of the Board and the Company Secretary through a series of one-to-one interviews. The evaluation found that Directors were pleased with the functioning of the Committee, and they recognised the Chair for the quality of the work conducted by the Committee and the manner in which this is reported to the Board.
Progress on findings of 2018 evaluationThe responses to the 2018 evaluation found an effective and well-functioning Audit Committee, which uses its time well and has an appropriate focus on the key issues.
Suggestions arising from the 2018 process, and the progress which has been made on these, include:
invite a wider range of business leaders to Committee meetings, enabling leaders to engage in Board-level discussions, as well as facilitating a greater understanding of the Committee’s role in the wider business – the Committee has embraced this suggestion, with a number of leaders and senior managers (typically one or two levels below the Pearson Executive) leading sessions such as risk deep dives, internal control and process updates and financial review matters. The Committee also invited Pearson’s Local Compliance Counsel of the year to lead a session on compliance and ABC achievements in Pearson’s Brazilian business
as progress continues to be made with the implementation of TEP and transformation of Pearson, consider a review to confirm that Pearson has maximised the opportunity to strengthen the control environment and better manage risk – progress on TEP and the associated BVR programme was a regular item for discussion for the Committee throughout the year and will continue to be considered as transformation initiatives continue during 2020. Read more detail on the risk deep dive overview on p74
Internal audit
The internal audit function is responsible for providing independent assurance to management and the Audit Committee on the design and effectiveness of internal controls, to mitigate strategic, financial, operational and compliance risks. The SVP-Internal Audit, Risk and Compliance reports formally to the Chair of the Audit Committee and the CFO, with a reporting line to the General Counsel on compliance matters. The VP-Internal Audit, responsible for the day-to-day operations of internal audit and execution of the annual audit plan, also reports formally to the Chair of the Audit Committee and the SVP-Internal Audit, Risk and Compliance.
The internal audit mandate and plan are approved annually by the Audit Committee. Progress and changes to the plan are also reviewed and approved by the Audit Committee throughout the year. The internal audit plan is aligned to our greatest areas of risk, as identified by the ERM process, and the Audit Committee considers issues and risks arising from internal audits. Management action plans to improve internal controls and to mitigate risks, or both, are agreed with the business area after each audit. Formal management self-assessments allow internal audit to monitor progress in implementing action plans, agreed as part of audits, to resolve any control deficiencies identified. Internal audit will request and assess evidence of action plan implementation and may re-test controls if necessary. Progress of management action plans is reported to the Audit Committee at each meeting. Internal audit has a formal collaboration process in place with the external auditors to ensure efficient coverage of internal controls. Regular reports on the findings and emerging themes identified through internal audits are provided to Executive management and, via the Audit Committee, to the Board.
The SVP-Internal Audit, Risk and Compliance oversees compliance with our Code of Conduct and works with senior legal and HR personnel to investigate any reported incidents, including ethical, corruption and fraud allegations. The Audit Committee is provided with an update of all significant matters received through our whistleblowing reporting system and, on behalf of the Board , considers an annual review of the effectiveness of this system. The Pearson anti-bribery and corruption programme provides the framework to support our compliance with various anti-bribery and corruption regulations such as the UK Bribery Act 2010 and the US Foreign Corrupt Practices Act.
77Overview Strategy Performance Governance Financial statements Other information
External audit
Oversight of external auditorsThe Committee reviews and makes recommendations to the Board in respect of the appointment and compensation of the external auditors. This recommendation is made by the Committee after considering the external auditors’ performance during the year, reviewing external auditor fees, conducting an effectiveness review, and confirming the independence, objectivity, qualifications and experience of the external auditors.
The Committee reviewed the effectiveness and independence of the external auditors during 2019, as it does every year, and remains satisfied that the auditors provide effective independent challenge to management. The external auditors’ review was conducted by distributing a questionnaire to key audit stakeholders, including members of the Audit Committee; CFO; Deputy CFO; SVP-Internal Audit, Risk and Compliance; SVP-Finance for each business area; and other heads of corporate functions. Overall, responses to the questionnaire were positive, indicating an effective and independent external audit process. The main area identified as presenting an opportunity for possible improvement related to coordination between PwC and the Pearson team, namely ensuring clear and timely communication in respect of requirements and deliverables.
The Committee will continue to review the performance of the external auditors on an annual basis and will consider their independence and objectivity, taking account of all appropriate guidelines. There are no contractual obligations restricting the Committee’s choice of external auditors. The external auditors are required to rotate the audit partner responsible for the Pearson audit every five years and the current lead audit partner, Giles Hannam, rotated onto the Pearson audit at the beginning of 2018.
AQR Review of the external audit During the year, the FRC’s Audit Quality Review (AQR) team selected for review PwC’s audit of the Group’s 2018 financial statements as part of its 2019 annual inspection of audit firms. On completion of its review, the AQR team wrote to the Committee Chair and provided a copy of its final report. The Committee discussed the findings of the review with PwC at its February 2020 meeting, in particular focusing on those areas of the external audit procedures that had been identified as requiring improvement. The Committee was satisfied that PwC had taken all necessary actions to address the AQR findings in the audit of the Group’s 2019 financial statements.
Audit tendering and rotationPearson’s last audit tender was in respect of the 1996 year end and resulted in the appointment of Price Waterhouse as auditors. Developments at an EU level regarding mandatory audit rotation for listed companies have changed the UK landscape on audit tendering and rotation. EU regulations and the 2014 Order by the UK Competition and Markets Authority (CMA) impose mandatory tendering and rotation requirements, with Pearson required to appoint a new auditor no later than for the 2024 financial year end.
In last year’s annual report, the Committee reiterated its expectation that an audit tender process would commence in 2022, taking into account the significant level of business change being experienced by the Group – including through The Enabling Programme (TEP) – and the focus that would be required by finance and management teams to conduct the tender process, and any resulting auditor transition, thoroughly and effectively. As indicated however, the Committee, with the support of management, has kept under review whether this timing remains appropriate in the light of business developments. With TEP implementation and finance transformation in the UK and North America now complete, and more than 80% of Pearson’s business in revenue terms having now transitioned to new systems and processes, the Committee has revisited the matter. As a result, at its meeting in February 2020, the Committee decided to proceed with an audit tender during 2020, which will commence with issuing a Request for Proposal (RFP) in April 2020, with a view to changing audit firm for the financial year ending 31 December 2021.
In making this decision, the Committee noted that finance and management teams believe they have the capacity to support a tender and change in auditor, leveraging changes from the finance transformation programme. Although TEP and the finance transformation are yet to be implemented in Pearson’s remaining International markets, the majority of Group audit scope sits within North America and the UK and it is felt manageable by the Committee, management and the finance function to onboard a new auditor at a time of change in those smaller International markets.
In discussing its preferred approach to the tender process, the Committee has had regard to the detailed timeline, governance framework (including confirmation of the working group that will lead the process), selection criteria and the degree of involvement by all Committee members in the various stages of the process. The Committee has also given consideration to the Chief Financial Officer transition process which will take place during 2020 and has determined, with the agreement of the incoming CFO, Sally Johnson, that the proposed timeline achieves the optimal balance between business priorities and internal capacity while also allowing for the new senior finance team to ensure a rigorous and comprehensive audit tender process.
Following the upcoming audit tender, Pearson will adopt a policy of putting the audit contract out to tender at least every ten years, as required. The Committee will continue to pay close attention to developments in the audit landscape in response to: the findings of Sir Donald Brydon’s independent review into the quality and effectiveness of audit; and the outcome of the BEIS consultations on the recommendations made (i) by Sir John Kingman in his independent review of the FRC, and (ii) by the CMA in its market study into the statutory audit market, and will take these into account as and when appropriate.
Compliance with the CMA OrderPearson confirms that it was in compliance with the provisions of The Statutory Audit Services for Large Companies Market Investigation (Mandatory Use of Competitive Tender Processes and Audit Committee Responsibilities) Order 2014 during the financial year ended 31 December 2019.
Audit Committee report
78 Pearson plc Annual report and accounts 2019
Review of the external auditDuring the year, the Committee discussed the planning, conduct and conclusions of the external audit as it proceeded.
At its July 2019 meeting, the Committee discussed and approved the external audit plan and reviewed the key risks of misstatement of Pearson’s financial statements. The external auditors provided an update at the December 2019 Committee meeting, having concluded that their analysis of significant and elevated risks remained the same.
The table on p80–81 sets out the significant issues considered by the Committee together with details of how these items have been addressed. The Committee discussed these issues with the auditors at the time of their review of the half-year interim financial statements in July 2019 and again at the conclusion of their audit of the financial statements for the full year in February 2020.
All the significant issues were also areas of focus for the auditors. Learn more in the Independent auditor’s report on p114
In December 2019, the Committee discussed with the auditors the status of their work, focusing in particular on internal controls and Sarbanes-Oxley testing.
As the auditors concluded their audit, they explained to the Committee:
The work they had conducted over revenue, including over long-term revenue contracts and judgements in relation to provisions for returns
Their work in evaluating management’s goodwill impairment exercise, on a value-in-use basis, including assessing assumptions around CGU identification, goodwill reallocation, operating cash flow forecasts, the appropriateness of the inclusion of restructuring cost savings, perpetuity growth rates and discount rates
The work performed over the nature and presentation of non-trading items, focusing on subjective judgements and the transparency with which related adjusted measures are presented
The work they had done to audit the provisioning levels in respect of potential tax exposures and uncertain tax positions and related disclosures
Their evaluation of the recoverability of investments in digital platforms and pre-publication assets
Their work over the completed disposal of the US K12 Courseware business
The results of their controls testing for Sarbanes-Oxley Act section 404 reporting purposes and in support of their financial statements audit
The results of their work over the company’s going concern and viability statement reports
Their work over finance transformation related to the continued roll-out of TEP and the organisational change resulting from implementing the target operating model
Their work in relation to the adoption of IFRS 16 from 1 January 2019
Their work in relation to other matters which are not classified as key audit matters, but may give rise to additional disclosure requirements e.g. pensions.
The auditors also reported to the Committee the unadjusted misstatements that they had found in the course of their work, which were immaterial, and the Committee confirmed that there were no material items remaining unadjusted in these financial statements.
Auditors’ independence
In line with best practice, our relationship with PwC is governed by our policy on external auditors, which is reviewed and approved annually by the Audit Committee. The policy establishes procedures to ensure that the auditors’ independence is not compromised, as well as defining those non-audit services that PwC may or may not provide to Pearson. These allowable services are in accordance with relevant UK and US legislation. The policy takes into account certain voluntary commitments by PwC regarding independence and applies to all Pearson businesses globally, including associate companies.
The Audit Committee approves all audit and non-audit services provided by PwC. Our policy on the use of the external auditors for non-audit services reflects the restriction on the use of pre-approval in the 2016 FRC Guidance on Audit Committees and, accordingly, all non-audit services, irrespective of value, are required to be approved by the Audit Committee. In particular, we expressly prohibit the provision of certain tax, HR and other services by the external auditor. We review non-audit services on a case-by-case basis, including reviewing the ongoing effectiveness and appropriateness of our policy.
The Audit Committee receives regular reports summarising the amount of fees paid to the auditors. During 2019, Pearson spent £0.7m less on non-audit fees with PwC compared with 2018, due to the absence of a requirement for the audit of disposals and a reduction in fees associated with the audit of efficacy reporting. For 2019, non-audit fees represented 6% of external audit fees (17% in 2018).
For all non-audit work in 2019, PwC was selected only after consideration that it was best able to provide the services we required at a reasonable fee and within the terms of our policy on external auditors. Where PwC is selected to provide audit-related services, we take into account its existing knowledge and experience of Pearson. Where appropriate, services were tendered prior to a decision being made as to whether to award work to the auditors.
Significant non-audit work performed by PwC during 2019 included:
audit of Pearson’s efficacy programme
provision of comfort letters for potential bond issues
controls assurance related to non-financial controls
half-year review of interim financial statements.
A full statement of the fees for audit and non-audit services is provided in note 4 to the financial statements on p145
Tim Score Chair of Audit Committee
79Overview Strategy Performance Governance Financial statements Other information

Significant issues considered by the Audit Committee
Issue Action taken by Audit Committee Outcome
Impairment reviewsPearson carries significant goodwill and other intangible asset balances. There is judgement exercised in the identification of cash-generating units (CGUs) and the process of allocating goodwill to CGUs and aggregate CGUs and in the assumptions underlying the impairment review. Pearson has made significant impairments to goodwill across a variety of its businesses in recent years.
The Committee monitored the Group’s plans and forecasts during the year to determine if there were impairment triggers and considered the results of the Group’s annual goodwill impairment review including the revision to CGUs and the related reallocation of goodwill driven by organisation changes and systems consolidation. Key assumptions – including cash flows derived from strategic and operating plans that include longer-term plans for the OPM business, long-term growth rates and the weighted average cost of capital – were reviewed and challenged. The Committee considered the sensitivities to changes in assumptions and the adequacy of disclosures required by IAS 36 ‘Impairment of Assets’ in relation to the Group’s CGUs, noting that certain CGUs still remain sensitive to assumption changes after a number of impairments in recent years.
Revised CGUs confirmed and goodwill allocations agreed. Annual impairment review finalised with confirmation of sufficient headroom in each of the CGUs with the exception of Brazil, where a £65m impairment to acquired intangible assets was made to align the carrying values with the value in use.
Leases and IFRS 16Pearson adopted IFRS 16 in respect of its lease portfolio in 2019. The Group has a significant number of property leases and several other low-value vehicle and equipment leases. The implementation of the standard has resulted in the recognition of right-of-use assets and sublease investments and corresponding lease liabilities on the balance sheet for the first time.
The Committee continued to monitor progress on the IFRS 16 lease conversion process. This included review of the implementation of the transition options taken and the quantification of the impact, including sensitivities relating to the selection of appropriate discount rates. The impact of the change was also considered in the light of banking arrangements, strategic plans and the reporting of cash flow and net debt. In addition, the Committee reviewed the new policies and lease disclosures presented in the interim report and in this report.
The Committee reviewed the impact of adopting the new standard on the financial statements, key performance indicators, banking covenants and future strategy and approved the transition options taken, discount rates applied, and disclosures made.
Disposal transactionsThe Group finalised the sale of its US K12 Courseware business and announced the sale of its remaining stake in Penguin Random House.
The Committee reviewed the accounting for the disposal of the US K12 Courseware business with specific focus on the fair value of non-cash proceeds in the form of loans and an earn-out. The Committee also reviewed tax assumptions relating to the disposal transaction. The implications for the treatment of Penguin Random House as held for sale were noted.
The Committee determined that disposal accounting had been appropriately recorded and that the fair value of proceeds reflected its understanding of the disposal transaction and future expectations for cash flow. The Committee also agreed that the criteria for held for sale treatment in respect of the Penguin Random House interest had been met.
Audit Committee report
80 Pearson plc Annual report and accounts 2019
Issue Action taken by Audit Committee Outcome
RestructuringThe restructuring programme announced in 2017 was in its final year of implementation in 2019. Costs incurred in 2019 were mainly related to redundancies and asset impairments. There are several accounting judgements to be made regarding categorisation and timing of cost recognition.
The Committee continued to review progress on the restructuring programme and considered the judgements required in accounting for the costs of redundancy and asset impairment, mainly in respect of the Group’s North America operations and enabling functions. In particular, in 2019, the Committee reviewed the impact of restructuring on technology and content assets and the implications of initiatives to drive cost-efficiencies on strategic partnerships.
The Committee confirmed that the assumptions underlying the timing of cost recognition were reasonable and that the accounting and disclosure for the restructuring programme were appropriate.
ReturnsThe determination of appropriate provisions for product returns requires a significant amount of judgement and, in the light of recent volatility in returns in the US Higher Education Courseware business, the Committee continued to review returns data and our policy on providing for returns.
The Committee considered returns provisioning for the US Higher Education Courseware business and reviewed the methodology for establishing provisions.
The Committee were particularly interested to understand the impact of the new digital first strategy in North America on estimates associated with returns and stock obsolescence.
Assumptions underlying the returns reserve methodology were reviewed and challenged.
TaxThe impact of tax legislation changes including US tax reform, EU state aid, proposed digital services tax, the trend for increased tax transparency, and provision levels.
The Committee considered various developments during the year, including the internal refinancing of the Group’s US operations which completed in June, US tax reform, tax authority audit activity in Brazil and the EU state aid case.
The outcome of the refinancing combined with provision releases reduced the 2019 adjusted tax rate. The 2019 adjusted tax rate is higher than the prior year due to several one-off benefits occurring in 2018. This was reported to the Committee at the December meeting.
The Committee considered an update on Pearson’s involvement endorsing the B-Team Responsible Tax Principles initiative.
The Chair of the Committee approved the third report on tax strategy prior to its publication in November 2019.
The Committee was satisfied with Pearson’s approach to managing the impact of tax legislation changes and agreed with the views of management regarding tax provisioning levels.
81Overview Strategy Performance Governance Financial statements Other information
Control environment
The Board has overall responsibility for Pearson’s systems of internal control and risk management, which are designed to manage, and where possible mitigate, the risks facing Pearson, safeguard assets and provide reasonable, but not absolute, assurance against material financial misstatement or loss. The Board confirms that it has conducted a review of the effectiveness of Pearson’s systems of risk management and internal control in accordance with provision 29 of the Code and the FRC Guidance on Risk Management, Internal Control and Related Financial and Business Reporting (FRC Guidance). The Board confirms these systems operated satisfactorily throughout the year and to the date of this report, and no significant failings or weaknesses were identified in the review process.
The Board has delegated responsibility for monitoring the effectiveness of the company’s risk management and internal control systems to the Audit Committee. The Audit Committee oversees a risk-based internal audit programme, including periodic audits of the risk processes across the organisation. It provides assurance on the management of risk (including risk deep dives, as described on p74), and receives reports on the efficiency and effectiveness of internal controls. You can read more about Pearson’s internal audit function on p77. Each business area maintains internal controls and procedures appropriate to its structure, business environment and risk assessment, while complying with company-wide policies, standards and guidelines.
Internal control and risk management
Our internal controls and risk oversight are monitored and continually improved to ensure their compliance with FRC Guidance.
The Board is ultimately accountable for effective risk management in Pearson and determines our strategic approach to risk. It confirms our organisational risk management framework as well as our risk appetite targets. Twice yearly it receives and reviews reports on the status of the top Group-wide risks. It is supported in the following ways:
the Audit Committee is responsible for overseeing internal controls within Pearson which includes determining the risk appetite (recommended by Pearson Executive management), reviewing and commenting upon key risks, and ensuring that risk management is effective.
Pearson’s Executive and leadership teams are responsible for identifying and mitigating principal risks.
leaders and managers at all levels in Pearson are responsible for managing risk in their area of responsibility, including the identification, assessment and treatment of risk.
the Organisational Risk and Resilience team owns the overall risk management framework for the company and facilitates consolidated reporting on risk.
The internal audit team provides independent assurance on the adequacy of the risk management arrangements in place. The internal audit plan is aligned to identified Pearson-wide risks and it presents issues and risks arising from internal audits at each Audit Committee meeting.
The involvement of the Board and Audit Committee in the design, implementation, identification, monitoring and review of risks (including setting risk appetite and reviewing how risk is being embedded in our culture) is outlined in more detail in the organisational risk management section on p40
Financial management and reporting
There is a comprehensive strategic planning, budgeting and forecasting system with an annual operating plan approved by the Board. Monthly financial information, including trading results, balance sheets, cash flow statements, capital expenditures and indebtedness, is reported against the corresponding figures for the plan and prior years, with corrective action outlined by the appropriate senior Executive. Pearson’s senior management meets regularly with business area management to review their business and financial performance against plan and forecast. Major risks relevant to each business area as well as performance against the stated financial and strategic objectives are reviewed in these meetings.
There is an ongoing process to monitor the risks and effectiveness of controls in relation to the financial reporting and consolidation process, including the related information systems. This includes up-to-date Pearson financial policies, formal requirements for finance to certify that they have been in compliance with policies and that the control environment has been maintained throughout the year, consolidation reviews and analysis of material variances, finance technical reviews, and review and sign-off by senior finance managers. The Group finance function also monitors and assesses these processes and controls through finance and technology compliance functions and a Controls Steering Committee comprising cross-functional experts.
These controls include those over external financial reporting which are documented and tested in accordance with the applicable regulatory requirements, including section 404 of the Sarbanes-Oxley Act, which is relevant to our US listing. One key control in this area is the Verification Committee, which submits reports to the Audit Committee. This Committee is chaired by the SVP-Internal Audit, Risk and Compliance, and members include the Chief Financial Officer and/or their deputy, the Deputy General Counsel, SVP-Investor Relations and the Company Secretary as well as senior members of financial management. The primary responsibility of this Committee is to review Pearson’s public reporting and disclosures to ensure that information provided to shareholders is complete, accurate and compliant with all applicable legislation and listing regulations. In addition, our separate Market Disclosure Committee is responsible for considering potential inside information and its treatment in accordance with the EU Market Abuse Regulation. The effectiveness of key financial controls is subject to management review and self-certification and independent evaluation by the external auditors.
Risk governance and control
82 Pearson plc Annual report and accounts 2019
Treasury management
The treasury department operates within policies approved by the Audit Committee on behalf of the Board, and treasury transactions and procedures are subject to regular internal audit. Major transactions are authorised outside the department at the requisite level, and there is an appropriate segregation of duties. Frequent reports are made to the Deputy Chief Financial Officer and Chief Financial Officer. Regular reports are prepared for the Audit Committee and the Board and an annual risk review meeting takes place between the Treasurer and Audit Committee. The Treasury Policy is described in more detail in note 19 to the financial statements on p165
Insurance
Pearson reviews its risk financing options regularly to determine how the company’s insurable risk exposures are managed and protected. Pearson purchases comprehensive insurance cover and annually reviews coverage, insurers and premium spend, ensuring the programme is fit for purpose and cost-effective.
Pearson’s insurance subsidiary, Spear Insurance Company Limited, is used to leverage Pearson’s risk retention capability and to achieve a balance between retaining insurance risk and transferring it to external insurers.
Tax
The Board has delegated responsibility for the integrity of financial reporting and risk management to the Audit Committee. This includes setting tax strategy and monitoring tax risk. The Tax Department reports at least annually to the Audit Committee. Regular updates are provided to the Deputy CFO and the CFO throughout the year.
83Overview Strategy Performance Governance Financial statements Other information
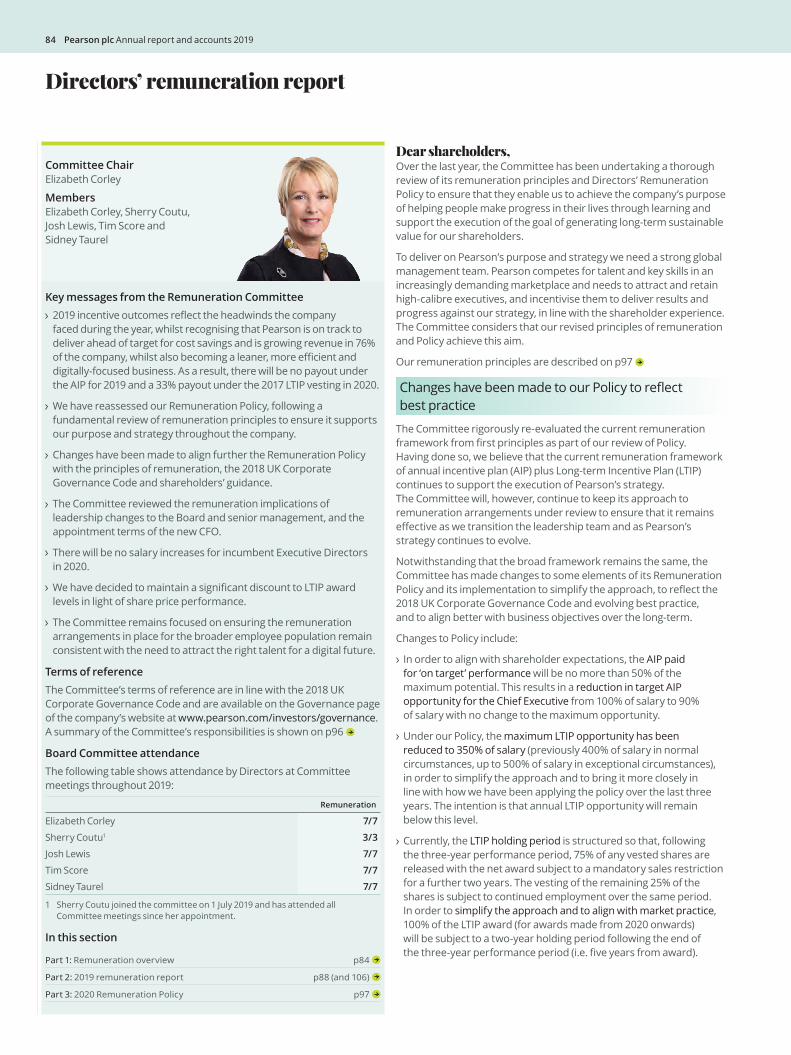
Dear shareholders,Over the last year, the Committee has been undertaking a thorough review of its remuneration principles and Directors’ Remuneration Policy to ensure that they enable us to achieve the company’s purpose of helping people make progress in their lives through learning and support the execution of the goal of generating long-term sustainable value for our shareholders.
To deliver on Pearson’s purpose and strategy we need a strong global management team. Pearson competes for talent and key skills in an increasingly demanding marketplace and needs to attract and retain high-calibre executives, and incentivise them to deliver results and progress against our strategy, in line with the shareholder experience. The Committee considers that our revised principles of remuneration and Policy achieve this aim.
Our remuneration principles are described on p97
Changes have been made to our Policy to reflect best practice
The Committee rigorously re-evaluated the current remuneration framework from first principles as part of our review of Policy. Having done so, we believe that the current remuneration framework of annual incentive plan (AIP) plus Long-term Incentive Plan (LTIP) continues to support the execution of Pearson’s strategy. The Committee will, however, continue to keep its approach to remuneration arrangements under review to ensure that it remains effective as we transition the leadership team and as Pearson’s strategy continues to evolve.
Notwithstanding that the broad framework remains the same, the Committee has made changes to some elements of its Remuneration Policy and its implementation to simplify the approach, to reflect the 2018 UK Corporate Governance Code and evolving best practice, and to align better with business objectives over the long-term.
Changes to Policy include:
In order to align with shareholder expectations, the AIP paid for ‘on target’ performance will be no more than 50% of the maximum potential. This results in a reduction in target AIP opportunity for the Chief Executive from 100% of salary to 90% of salary with no change to the maximum opportunity.
Under our Policy, the maximum LTIP opportunity has been reduced to 350% of salary (previously 400% of salary in normal circumstances, up to 500% of salary in exceptional circumstances), in order to simplify the approach and to bring it more closely in line with how we have been applying the policy over the last three years. The intention is that annual LTIP opportunity will remain below this level.
Currently, the LTIP holding period is structured so that, following the three-year performance period, 75% of any vested shares are released with the net award subject to a mandatory sales restriction for a further two years. The vesting of the remaining 25% of the shares is subject to continued employment over the same period. In order to simplify the approach and to align with market practice, 100% of the LTIP award (for awards made from 2020 onwards) will be subject to a two-year holding period following the end of the three-year performance period (i.e. five years from award).
Directors’ remuneration report
Committee Chair Elizabeth Corley
Members Elizabeth Corley, Sherry Coutu, Josh Lewis, Tim Score and Sidney Taurel
Key messages from the Remuneration Committee 2019 incentive outcomes reflect the headwinds the company faced during the year, whilst recognising that Pearson is on track to deliver ahead of target for cost savings and is growing revenue in 76% of the company, whilst also becoming a leaner, more efficient and digitally-focused business. As a result, there will be no payout under the AIP for 2019 and a 33% payout under the 2017 LTIP vesting in 2020.
We have reassessed our Remuneration Policy, following a fundamental review of remuneration principles to ensure it supports our purpose and strategy throughout the company.
Changes have been made to align further the Remuneration Policy with the principles of remuneration, the 2018 UK Corporate Governance Code and shareholders’ guidance.
The Committee reviewed the remuneration implications of leadership changes to the Board and senior management, and the appointment terms of the new CFO.
There will be no salary increases for incumbent Executive Directors in 2020.
We have decided to maintain a significant discount to LTIP award levels in light of share price performance.
The Committee remains focused on ensuring the remuneration arrangements in place for the broader employee population remain consistent with the need to attract the right talent for a digital future.
Terms of referenceThe Committee’s terms of reference are in line with the 2018 UK Corporate Governance Code and are available on the Governance page of the company’s website at www.pearson.com/investors/governance. A summary of the Committee’s responsibilities is shown on p96
Board Committee attendance The following table shows attendance by Directors at Committee meetings throughout 2019:
Remuneration
Elizabeth Corley 7/7
Sherry Coutu1 3/3
Josh Lewis 7/7
Tim Score 7/7
Sidney Taurel 7/7
1 Sherry Coutu joined the committee on 1 July 2019 and has attended all Committee meetings since her appointment.
In this section
Part 1: Remuneration overview p84
Part 2: 2019 remuneration report p88 (and 106)
Part 3: 2020 Remuneration Policy p97
84 Pearson plc Annual report and accounts 2019
From 2018, we lowered the pension opportunity such that new appointments are eligible to receive pension contributions of up to 16% of pensionable salary or a cash allowance of up to 16% of salary. This is in line with the maximum company contribution as a percentage of salary that UK employees are eligible to receive. This provision will be incorporated into our new Policy.
In light of evolving shareholder expectations and market practice, we have strengthened our existing post-employment shareholding guideline (implemented in 2017) such that Executive Directors are expected to retain their current guideline (300% of salary for the Chief Executive and 200% of salary for the CFO) for two years following stepping down as an Executive Director.
Performance measures for 2020
The Committee is proposing some minor changes to performance measures for the AIP and LTIP.
The AIP will continue to be based on a mix of adjusted operating profit, sales, operating cash flow and strategic objectives. The weightings of operating profit and sales have been changed to 30% on each (previously 40% on operating profit and 20% on sales). This change is to reflect that Pearson is focusing on delivering value for shareholders through top-line growth as well as through operational efficiencies and to strengthen further alignment with this objective. The remaining 40% of AIP opportunity will be equally weighted on operating cash flow and strategic objectives which will be aligned with our corporate goals.
The LTIP will continue to be based on adjusted EPS, ROIC and relative TSR vs. FTSE 100 (measures equally weighted). We have previously communicated that the Committee believes net ROIC is a fairer assessment of management’s performance in generating shareholder returns on the capital currently invested in the business, but that this metric would only be introduced after the company had tracked it for a number of years. Net ROIC has now been used as a key metric in Board reporting and reported as a KPI since Pearson’s 2017 strategic report; therefore, going forward, we will measure net ROIC rather than gross ROIC for the purposes of the LTIP. The Committee’s intention is to operate net ROIC such that any payouts reflect the underlying performance of the new management team by measuring return on capital excluding existing impairments on legacy acquisitions only. If the management team impairs an asset within the performance period, the final calculation of the outcome under the LTIP will be adjusted to ensure it does not benefit the outcome.
Leadership changes
On 18 December 2019, we announced that our Chief Executive, John Fallon, will retire in 2020 once a successor has been appointed. John Fallon will remain eligible to participate in the AIP for 2020 on a pro-rata basis. He will not receive an LTIP award in respect of 2020 and his salary will remain at £817,400 per annum. His benefits also remain unchanged.
The Committee reviewed the approach to the Chief Executive’s pension in light of shareholder views and best practice, and agreed with him that his pension allowance would be reduced on a phased basis over the next three years to bring it into line with the UK workforce at 16% of salary. Notwithstanding his planned retirement, John Fallon’s cash pension allowance has been reduced by 3 percentage points to 23% of salary as the first step on this planned phased reduction.
On 16 January 2020, we announced that Coram Williams will be leaving the company and Sally Johnson, currently Deputy CFO, will succeed him as CFO. It has since been confirmed that Coram Williams will step down at the AGM on 24 April 2020 and Sally Johnson will be appointed as CFO and as an Executive Director on this date.
Coram Williams will not be eligible for AIP and LTIP in respect of 2020 and he will forfeit any unvested LTIP awards on departure. His salary will continue at £539,500 per annum until he steps down. His pension and other benefits remain unchanged. He will receive no payment in relation to loss of office.
Sally Johnson’s salary will be £515,000 per annum. Her maximum AIP opportunity will be 170% of salary and her LTIP award will have a face value of 245% of salary (which is the same award opportunity as for Coram Williams in 2017, 2018 and 2019), reflecting the previous discounts to LTIP awards in light of share price performance.
The Committee believes that a further reduction in the CFO-elect’s award level is not appropriate, beyond the discount already applied. This discount was set at a time when the share price was comparable to the current share price and the Committee considers that alignment between management and shareholders would be better supported by maintaining her level of grant at 245% of salary in 2020.
Sally Johnson is a member of the Pearson Pension Plan and will continue to accrue pension at a rate of 1/60th of pensionable salary per annum, restricted to the plan earnings cap, in line with other participants in the Plan.
Incentive outcomes for 2019 reflect a challenging year
Pearson as a whole was able to match prior year underlying sales for the first time since 2014 because the broader 76% of Pearson grew by 4% in aggregate, demonstrating that Pearson is starting to see the returns from the strategy of investment in growth businesses and the evolution towards a simpler, more sustainable business. This progress was, however, offset by an underlying decline in the US Higher Education Courseware business where sales from print textbooks reduced more rapidly than anticipated. Pearson delivered Group adjusted operating profit of £581m, an increase of 6% on 2018.
Despite strong progress against strategic objectives, financial performance did not meet the threshold required to result in a payment under the AIP and therefore there will be no bonus payment for the Executive Directors in respect of 2019. The Committee carefully considered the impact of no payout on talent and retention across the company, and agreed with management that to have no payout at all would not be a fair reflection of the progress that was made across the company. As such, the Committee approved discretionary funding for employees, excluding the Executive Directors.
LTIP awards granted in 2017 were based on adjusted EPS, gross ROIC and relative TSR performance. Adjusted EPS for 2019 was 57.8p which was between threshold and target, resulting in 39% of this portion of the award vesting. ROIC for 2019 was 5.2% which is again between threshold and target, resulting in 57% of this portion of the award vesting. TSR performance is below median and therefore no portion of this award vested. Overall, therefore, performance resulted in 32.7% of the 2017 LTIP award vesting.
85Overview Strategy Performance Governance Financial statements Other information

Directors’ remuneration report
Remuneration framework
Remuneration Policy development and alignment to remuneration principles and company strategy
Our remuneration principles and Directors’ Remuneration Policy have been developed to support our purpose and strategy throughout the company.
The Committee’s review of our remuneration philosophy and Directors’ Remuneration Policy focused on ensuring that the company was equipped to achieve its purpose of helping people make progress in their lives through learning, and supports the execution of the goal of generating long-term sustainable value for shareholders. Throughout the process, we had due regard for the 2018 Corporate Governance Code, wider workforce remuneration and emerging best practice in relation to Executive Director remuneration.
Pearson developed a company-wide set of remuneration principles to govern how people are rewarded. The principles have been developed to ensure alignment to company culture, and the ability to attract and reward the right talent to enable the company’s digital future, whilst recognising that remuneration is one part of the broader employee value proposition at Pearson. These principles were used to shape the development of our 2020 Executive Directors’ Remuneration Policy.
The Committee has taken steps to simplify our Policy and its implementation to ensure that it is clearly aligned to company strategy, including re-weighting measures in the AIP, aligning on target opportunities and consolidating maximum LTIP opportunity.
In addition, the committee has reviewed quantum under incentive plans and reduced the Chief Executive target AIP opportunity to 90% of salary and the maximum LTIP award limit to 350% of salary – removing the exceptional maximum limit.
Our remuneration framework and outcomes are designed to be aligned with performance achieved:
– Performance measures selected for the AIP and LTIP are key to achieving strategic objectives. This year, we have made some changes to performance measures to ensure they continue to incentivise the right management behaviours and goals.
– We carry out a robust target-setting process each year, taking into account Pearson’s strategic plan, as well as analyst expectations to reflect market expectations, resulting in stretching yet achievable targets for the AIP and LTIP.
– Maximum awards under the AIP and LTIP are capped and the maximums are disclosed in our Policy.
– When determining payouts under each plan, the Committee discusses if the outcome is reflective of overall company performance and shareholder experience over the period and, if not, has discretion to alter plan outcomes up or down.
The Committee is mindful of reputational and other risks when determining Remuneration Policy and outcomes for Executive Directors and senior management. The company also has safeguards in place, such as clawback and malus and a two-year holding period on the LTIP, as well as robust shareholding guidelines including post-employment which have been further strengthened this year.
Before signing off the remuneration report and Remuneration Policy, the Committee reviewed drafts of the report and provided input to clarify our disclosure. We also undertook consultation with our top 20 shareholders, who represent 74% of our share capital, giving early sight to our Policy changes and to inform our final conclusions.
In 2019, Pearson developed remuneration principles that govern the whole organisation. We have evolved our Remuneration Policy to match the following updated remuneration principles, which are described on p97
Aligned to longer-term strategy
Pay for performance
Market competitive
Targeted differentiation
Tailored
Remuneration is one part of the employee value proposition at Pearson
The Committee very carefully considered the vesting outcome in the context of the shareholder experience, the progress made against the delivery of our strategic initiatives and sustainable efficiency measures, as well as achievements in innovation, people, culture and sustainability agendas. Despite the challenges the company has faced over the last year in US Higher Education Courseware, the Committee concluded that the vesting outcome was a fair reflection of the performance the company has achieved over the last three years and the progress against the strategic objectives and therefore it was not necessary to exercise discretion to adjust the vesting outcome. In doing so, we also considered that the LTIP targets were set with considerable stretch after extensive shareholder consultation.
The Committee consulted with shareholders regarding the changes to Policy and its implementation for 2020; the final proposals reflect feedback from shareholders. Continuing conversations with shareholders have been invaluable and we thank shareholders for the time they have spent with us in shaping our approach. I look forward to receiving your support at the AGM in relation to our Directors’ Remuneration Policy and our remuneration report.
Elizabeth Corley Chair of Remuneration Committee
6 March 2020
86 Pearson plc Annual report and accounts 2019
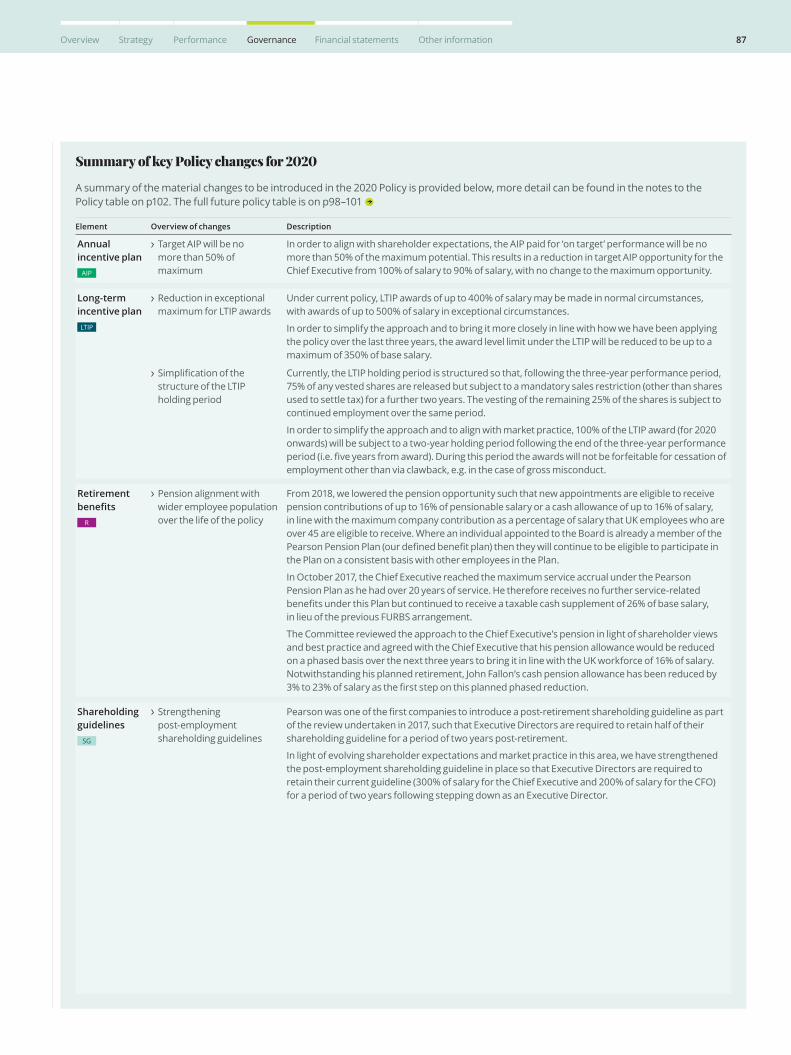
Summary of key Policy changes for 2020
A summary of the material changes to be introduced in the 2020 Policy is provided below, more detail can be found in the notes to the Policy table on p102. The full future policy table is on p98–101
Element Overview of changes Description
Annual incentive plan
AIP
Target AIP will be no more than 50% of maximum
In order to align with shareholder expectations, the AIP paid for ‘on target’ performance will be no more than 50% of the maximum potential. This results in a reduction in target AIP opportunity for the Chief Executive from 100% of salary to 90% of salary, with no change to the maximum opportunity.
Long-term incentive planLTIP
Reduction in exceptional maximum for LTIP awards
Under current policy, LTIP awards of up to 400% of salary may be made in normal circumstances, with awards of up to 500% of salary in exceptional circumstances.
In order to simplify the approach and to bring it more closely in line with how we have been applying the policy over the last three years, the award level limit under the LTIP will be reduced to be up to a maximum of 350% of base salary.
Simplification of the structure of the LTIP holding period
Currently, the LTIP holding period is structured so that, following the three-year performance period, 75% of any vested shares are released but subject to a mandatory sales restriction (other than shares used to settle tax) for a further two years. The vesting of the remaining 25% of the shares is subject to continued employment over the same period.
In order to simplify the approach and to align with market practice, 100% of the LTIP award (for 2020 onwards) will be subject to a two-year holding period following the end of the three-year performance period (i.e. five years from award). During this period the awards will not be forfeitable for cessation of employment other than via clawback, e.g. in the case of gross misconduct.
Retirement benefits
R
Pension alignment with wider employee population over the life of the policy
From 2018, we lowered the pension opportunity such that new appointments are eligible to receive pension contributions of up to 16% of pensionable salary or a cash allowance of up to 16% of salary, in line with the maximum company contribution as a percentage of salary that UK employees who are over 45 are eligible to receive. Where an individual appointed to the Board is already a member of the Pearson Pension Plan (our defined benefit plan) then they will continue to be eligible to participate in the Plan on a consistent basis with other employees in the Plan.
In October 2017, the Chief Executive reached the maximum service accrual under the Pearson Pension Plan as he had over 20 years of service. He therefore receives no further service-related benefits under this Plan but continued to receive a taxable cash supplement of 26% of base salary, in lieu of the previous FURBS arrangement.
The Committee reviewed the approach to the Chief Executive’s pension in light of shareholder views and best practice and agreed with the Chief Executive that his pension allowance would be reduced on a phased basis over the next three years to bring it in line with the UK workforce of 16% of salary. Notwithstanding his planned retirement, John Fallon’s cash pension allowance has been reduced by 3% to 23% of salary as the first step on this planned phased reduction.
Shareholding guidelines
SG
Strengthening post-employment shareholding guidelines
Pearson was one of the first companies to introduce a post-retirement shareholding guideline as part of the review undertaken in 2017, such that Executive Directors are required to retain half of their shareholding guideline for a period of two years post-retirement.
In light of evolving shareholder expectations and market practice in this area, we have strengthened the post-employment shareholding guideline in place so that Executive Directors are required to retain their current guideline (300% of salary for the Chief Executive and 200% of salary for the CFO) for a period of two years following stepping down as an Executive Director.
87Overview Strategy Performance Governance Financial statements Other information
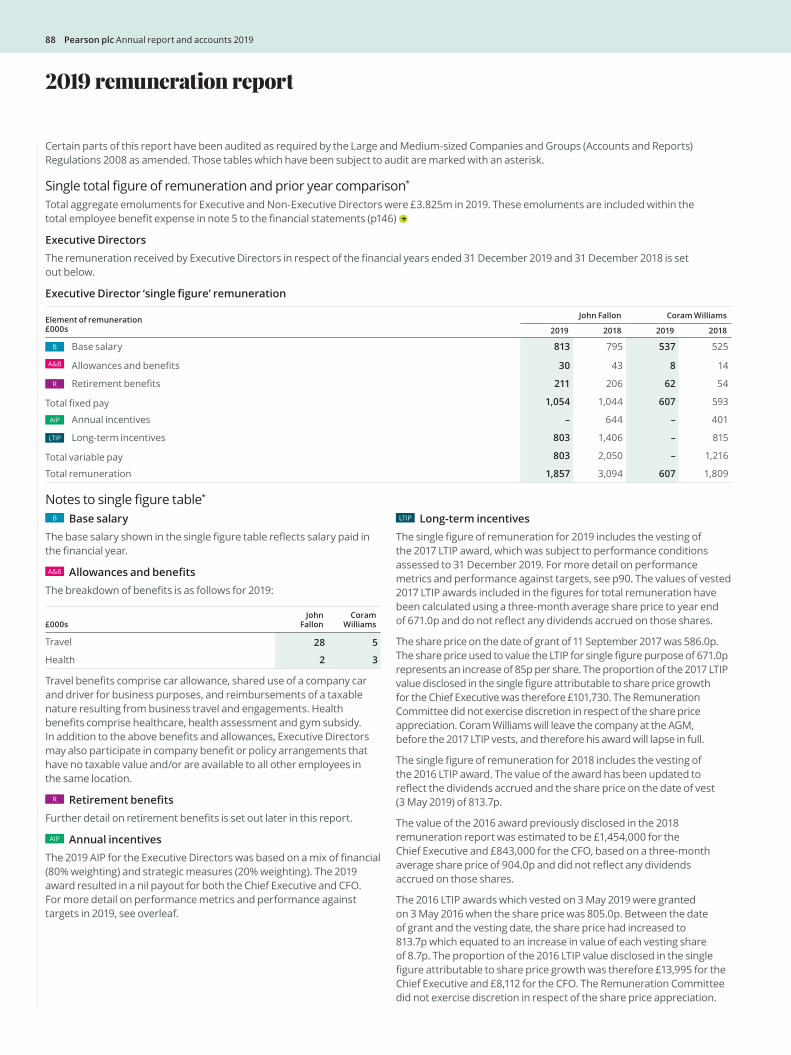
2019 remuneration report
Certain parts of this report have been audited as required by the Large and Medium-sized Companies and Groups (Accounts and Reports) Regulations 2008 as amended. Those tables which have been subject to audit are marked with an asterisk.
Single total figure of remuneration and prior year comparison*
Total aggregate emoluments for Executive and Non-Executive Directors were £3.825m in 2019. These emoluments are included within the total employee benefit expense in note 5 to the financial statements (p146)
Executive DirectorsThe remuneration received by Executive Directors in respect of the financial years ended 31 December 2019 and 31 December 2018 is set out below.
Executive Director ‘single figure’ remuneration
Element of remuneration £000s
John Fallon Coram Williams
2019 2018 2019 2018
B Base salary 813 795 537 525
A&B Allowances and benefits 30 43 8 14
R Retirement benefits 211 206 62 54
Total fixed pay 1,054 1,044 607 593
AIP Annual incentives – 644 – 401
LTIP Long-term incentives 803 1,406 – 815
Total variable pay 803 2,050 – 1,216
Total remuneration 1,857 3,094 607 1,809
Notes to single figure table* B Base salary
The base salary shown in the single figure table reflects salary paid in the financial year.
A&B Allowances and benefits The breakdown of benefits is as follows for 2019:
£000sJohn
FallonCoram
Williams
Travel 28 5
Health 2 3
Travel benefits comprise car allowance, shared use of a company car and driver for business purposes, and reimbursements of a taxable nature resulting from business travel and engagements. Health benefits comprise healthcare, health assessment and gym subsidy. In addition to the above benefits and allowances, Executive Directors may also participate in company benefit or policy arrangements that have no taxable value and/or are available to all other employees in the same location.
R Retirement benefitsFurther detail on retirement benefits is set out later in this report.
AIP Annual incentivesThe 2019 AIP for the Executive Directors was based on a mix of financial (80% weighting) and strategic measures (20% weighting). The 2019 award resulted in a nil payout for both the Chief Executive and CFO. For more detail on performance metrics and performance against targets in 2019, see overleaf.
LTIP Long-term incentives The single figure of remuneration for 2019 includes the vesting of the 2017 LTIP award, which was subject to performance conditions assessed to 31 December 2019. For more detail on performance metrics and performance against targets, see p90. The values of vested 2017 LTIP awards included in the figures for total remuneration have been calculated using a three-month average share price to year end of 671.0p and do not reflect any dividends accrued on those shares.
The share price on the date of grant of 11 September 2017 was 586.0p. The share price used to value the LTIP for single figure purpose of 671.0p represents an increase of 85p per share. The proportion of the 2017 LTIP value disclosed in the single figure attributable to share price growth for the Chief Executive was therefore £101,730. The Remuneration Committee did not exercise discretion in respect of the share price appreciation. Coram Williams will leave the company at the AGM, before the 2017 LTIP vests, and therefore his award will lapse in full.
The single figure of remuneration for 2018 includes the vesting of the 2016 LTIP award. The value of the award has been updated to reflect the dividends accrued and the share price on the date of vest (3 May 2019) of 813.7p.
The value of the 2016 award previously disclosed in the 2018 remuneration report was estimated to be £1,454,000 for the Chief Executive and £843,000 for the CFO, based on a three-month average share price of 904.0p and did not reflect any dividends accrued on those shares.
The 2016 LTIP awards which vested on 3 May 2019 were granted on 3 May 2016 when the share price was 805.0p. Between the date of grant and the vesting date, the share price had increased to 813.7p which equated to an increase in value of each vesting share of 8.7p. The proportion of the 2016 LTIP value disclosed in the single figure attributable to share price growth was therefore £13,995 for the Chief Executive and £8,112 for the CFO. The Remuneration Committee did not exercise discretion in respect of the share price appreciation.
88 Pearson plc Annual report and accounts 2019

AIP Executive Directors’ annual incentive payments for 2019*
The following table summarises the performance targets and performance against these targets for the 2019 award which resulted in a nil payout for both the Chief Executive and CFO.
Overall outcome
Performance measure % of total
Performance range
Actual results
Payout
Threshold Target Max% of max bonus
opportunity
Adjusted operating profit 40% £588m £612m £671m £581m 0%
Sales 20% £3,902m £3,976m £4,050m £3,869m 0%
Operating cash flow 20% £401m £434m £492m £307m 0%
Strategic measures 20% See below 0%
100% 0%
Note 1: Operating cash flow is measured post-restructuring. Operating cash flow pre-restructuring is £418m.
Note 2: See below for performance against strategic measures.
Note 3: The outcomes under all measures have been reviewed by internal audit.
Performance against strategic measuresThe targets (and outcomes) for performance against each of the strategic measures are shown in the table and supporting narrative below:
Strategic priority Measure% of total funding Threshold Target Max Outcome
Gain share through digital transformation
Growth in digital and digitally-enabled sales as a proportion of revenues
5% 62.5% (+0.5% on 2018 result)
63% (+1% on 2018 result)
64.0% (+2% on 2018 result)
Digital and digitally-enabled sales increased to 66.3% of total revenues in 2019 vs 62% in 2018.
Digital platforms – delivery of key 2019 milestones related to AI app and Revel pilots
5% Critical milestones on track
Critical milestones and key deliverables on track
All milestones and deliverables on track
Aida app and Revel both launched and available for commercial use.
Progress made against other milestones has resulted in an accelerated innovative product roadmap, which will drive cumulative incremental value at a lower cost than the original plan over future years.
Growing market opportunities
Invest in growing market opportunities – total revenue growth
5% +5% revenue growth
+7.5% revenue growth
+10% revenue growth
Our growth businesses – Pearson VUE, Virtual Schools, OPM and PTE Academic – grew by 8% in revenue. These growth businesses will continue to grow in 2020, as we invest in new forms of online education, in better, smarter, online assessments, in new AI-inspired direct-to learner apps, and in shifting Pearson’s focus to link education and employability with the workplace.
Becoming simpler, more efficient and sustainable
The Enabling Programme (TEP) – linked to key deliverables/milestones including (successful) deployment of Wave 3 Release, progress on RoW and Red Amber Green (RAG) status of value realisation plan
5% Critical milestones on track
Critical milestones and key deliverables on track
All milestones and deliverables on track
Good progress was made against the business value realisation plan but further work is still needed to sustain fixes and overcome more complicated issues. Wave 3 was deployed successfully.
Due to significant progress against strategic goals in 2019, an above target result was achieved under these measures. However, as the financial underpin was not met therefore there will not be a payout under the strategic measures for 2019.
89Overview Strategy Performance Governance Financial statements Other information
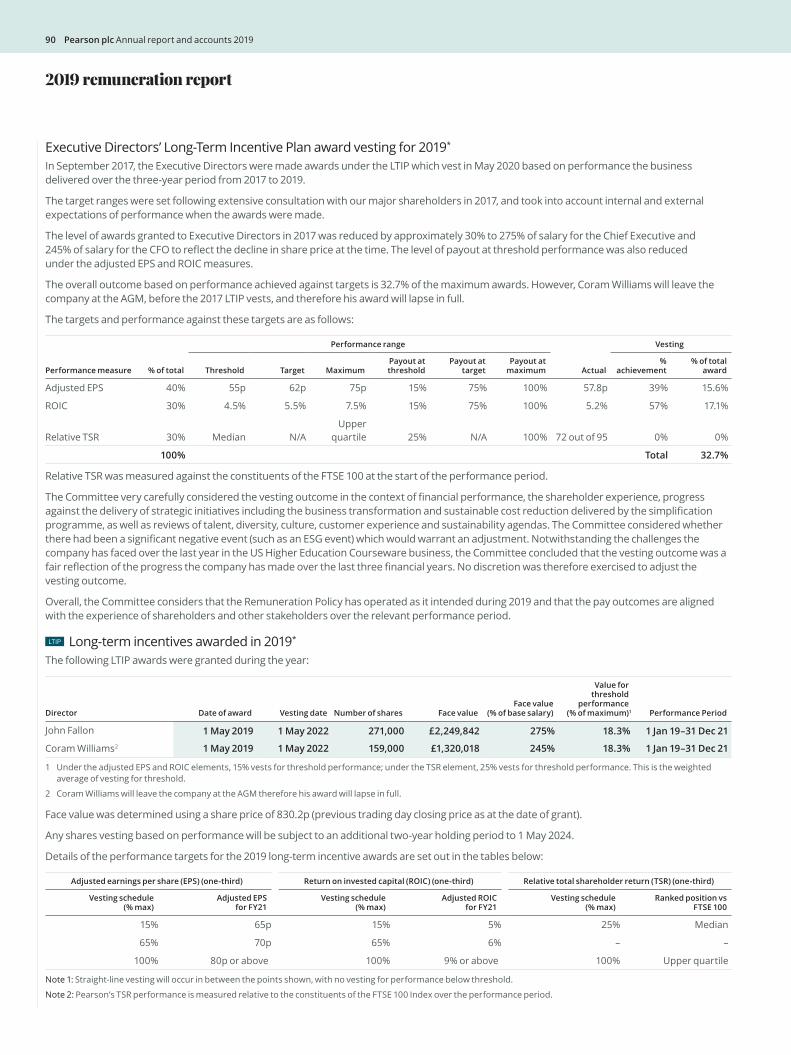
Executive Directors’ Long-Term Incentive Plan award vesting for 2019*
In September 2017, the Executive Directors were made awards under the LTIP which vest in May 2020 based on performance the business delivered over the three-year period from 2017 to 2019.
The target ranges were set following extensive consultation with our major shareholders in 2017, and took into account internal and external expectations of performance when the awards were made.
The level of awards granted to Executive Directors in 2017 was reduced by approximately 30% to 275% of salary for the Chief Executive and 245% of salary for the CFO to reflect the decline in share price at the time. The level of payout at threshold performance was also reduced under the adjusted EPS and ROIC measures.
The overall outcome based on performance achieved against targets is 32.7% of the maximum awards. However, Coram Williams will leave the company at the AGM, before the 2017 LTIP vests, and therefore his award will lapse in full.
The targets and performance against these targets are as follows:
Performance measure % of total
Performance range
Actual
Vesting
Threshold Target MaximumPayout at threshold
Payout at target
Payout at maximum
% achievement
% of total award
Adjusted EPS 40% 55p 62p 75p 15% 75% 100% 57.8p 39% 15.6%
ROIC 30% 4.5% 5.5% 7.5% 15% 75% 100% 5.2% 57% 17.1%
Relative TSR 30% Median N/AUpper
quartile 25% N/A 100% 72 out of 95 0% 0%
100% Total 32.7%
Relative TSR was measured against the constituents of the FTSE 100 at the start of the performance period.
The Committee very carefully considered the vesting outcome in the context of financial performance, the shareholder experience, progress against the delivery of strategic initiatives including the business transformation and sustainable cost reduction delivered by the simplification programme, as well as reviews of talent, diversity, culture, customer experience and sustainability agendas. The Committee considered whether there had been a significant negative event (such as an ESG event) which would warrant an adjustment. Notwithstanding the challenges the company has faced over the last year in the US Higher Education Courseware business, the Committee concluded that the vesting outcome was a fair reflection of the progress the company has made over the last three financial years. No discretion was therefore exercised to adjust the vesting outcome.
Overall, the Committee considers that the Remuneration Policy has operated as it intended during 2019 and that the pay outcomes are aligned with the experience of shareholders and other stakeholders over the relevant performance period.
LTIP Long-term incentives awarded in 2019*
The following LTIP awards were granted during the year:
Director Date of award Vesting date Number of shares Face value Face value
(% of base salary)
Value for threshold
performance(% of maximum)1 Performance Period
John Fallon 1 May 2019 1 May 2022 271,000 £2,249,842 275% 18.3% 1 Jan 19–31 Dec 21
Coram Williams2 1 May 2019 1 May 2022 159,000 £1,320,018 245% 18.3% 1 Jan 19–31 Dec 21
1 Under the adjusted EPS and ROIC elements, 15% vests for threshold performance; under the TSR element, 25% vests for threshold performance. This is the weighted average of vesting for threshold.
2 Coram Williams will leave the company at the AGM therefore his award will lapse in full.
Face value was determined using a share price of 830.2p (previous trading day closing price as at the date of grant).
Any shares vesting based on performance will be subject to an additional two-year holding period to 1 May 2024.
Details of the performance targets for the 2019 long-term incentive awards are set out in the tables below:
Adjusted earnings per share (EPS) (one-third) Return on invested capital (ROIC) (one-third) Relative total shareholder return (TSR) (one-third)
Vesting schedule (% max)
Adjusted EPS for FY21
Vesting schedule (% max)
Adjusted ROIC for FY21
Vesting schedule (% max)
Ranked position vs FTSE 100
15% 65p 15% 5% 25% Median
65% 70p 65% 6% – –
100% 80p or above 100% 9% or above 100% Upper quartile
Note 1: Straight-line vesting will occur in between the points shown, with no vesting for performance below threshold.
Note 2: Pearson’s TSR performance is measured relative to the constituents of the FTSE 100 Index over the performance period.
2019 remuneration report
90 Pearson plc Annual report and accounts 2019
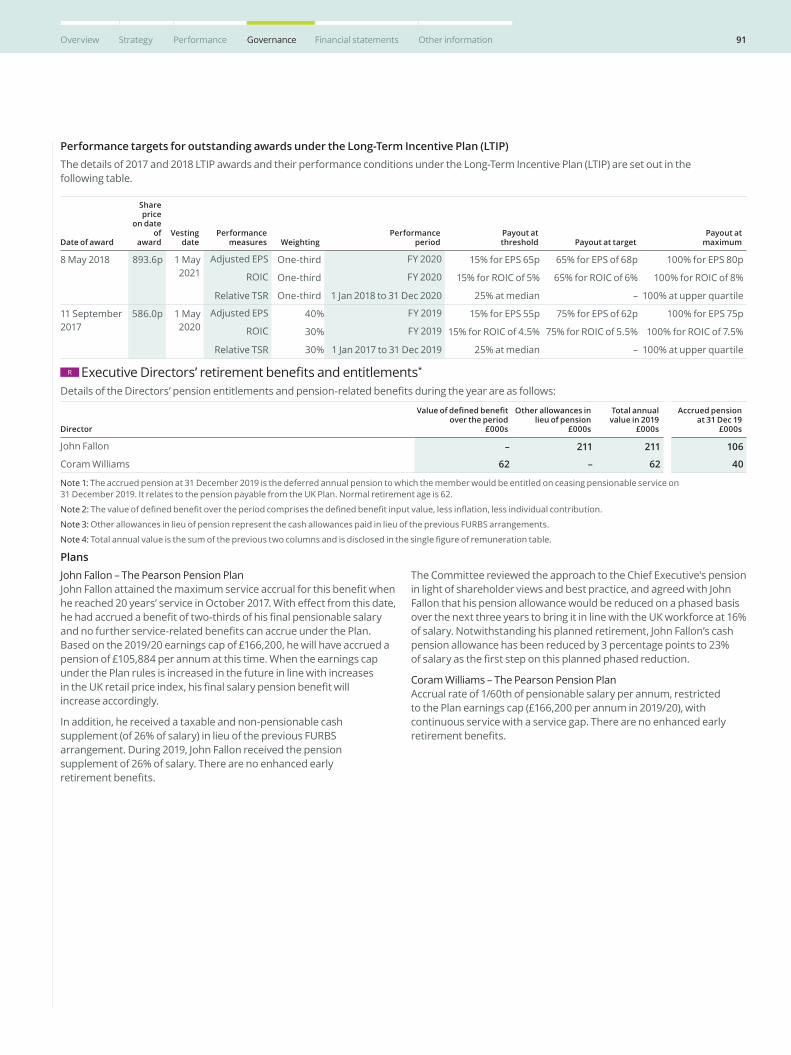
Performance targets for outstanding awards under the Long-Term Incentive Plan (LTIP)The details of 2017 and 2018 LTIP awards and their performance conditions under the Long-Term Incentive Plan (LTIP) are set out in the following table.
Date of award
Share price
on date of
awardVesting
datePerformance
measures WeightingPerformance
periodPayout at threshold Payout at target
Payout at maximum
8 May 2018 893.6p 1 May 2021
Adjusted EPS One-third FY 2020 15% for EPS 65p 65% for EPS of 68p 100% for EPS 80p
ROIC One-third FY 2020 15% for ROIC of 5% 65% for ROIC of 6% 100% for ROIC of 8%
Relative TSR One-third 1 Jan 2018 to 31 Dec 2020 25% at median – 100% at upper quartile
11 September 2017
586.0p 1 May 2020
Adjusted EPS 40% FY 2019 15% for EPS 55p 75% for EPS of 62p 100% for EPS 75p
ROIC 30% FY 2019 15% for ROIC of 4.5% 75% for ROIC of 5.5% 100% for ROIC of 7.5%
Relative TSR 30% 1 Jan 2017 to 31 Dec 2019 25% at median – 100% at upper quartile
R Executive Directors’ retirement benefits and entitlements*
Details of the Directors’ pension entitlements and pension-related benefits during the year are as follows:
Director
Value of defined benefit over the period
£000s
Other allowances in lieu of pension
£000s
Total annual value in 2019
£000s
Accrued pension at 31 Dec 19
£000s
John Fallon – 211 211 106
Coram Williams 62 – 62 40
Note 1: The accrued pension at 31 December 2019 is the deferred annual pension to which the member would be entitled on ceasing pensionable service on 31 December 2019. It relates to the pension payable from the UK Plan. Normal retirement age is 62.
Note 2: The value of defined benefit over the period comprises the defined benefit input value, less inflation, less individual contribution.
Note 3: Other allowances in lieu of pension represent the cash allowances paid in lieu of the previous FURBS arrangements.
Note 4: Total annual value is the sum of the previous two columns and is disclosed in the single figure of remuneration table.
PlansJohn Fallon – The Pearson Pension Plan John Fallon attained the maximum service accrual for this benefit when he reached 20 years’ service in October 2017. With effect from this date, he had accrued a benefit of two-thirds of his final pensionable salary and no further service-related benefits can accrue under the Plan. Based on the 2019/20 earnings cap of £166,200, he will have accrued a pension of £105,884 per annum at this time. When the earnings cap under the Plan rules is increased in the future in line with increases in the UK retail price index, his final salary pension benefit will increase accordingly.
In addition, he received a taxable and non-pensionable cash supplement (of 26% of salary) in lieu of the previous FURBS arrangement. During 2019, John Fallon received the pension supplement of 26% of salary. There are no enhanced early retirement benefits.
The Committee reviewed the approach to the Chief Executive’s pension in light of shareholder views and best practice, and agreed with John Fallon that his pension allowance would be reduced on a phased basis over the next three years to bring it in line with the UK workforce at 16% of salary. Notwithstanding his planned retirement, John Fallon’s cash pension allowance has been reduced by 3 percentage points to 23% of salary as the first step on this planned phased reduction.
Coram Williams – The Pearson Pension Plan Accrual rate of 1/60th of pensionable salary per annum, restricted to the Plan earnings cap (£166,200 per annum in 2019/20), with continuous service with a service gap. There are no enhanced early retirement benefits.
91Overview Strategy Performance Governance Financial statements Other information
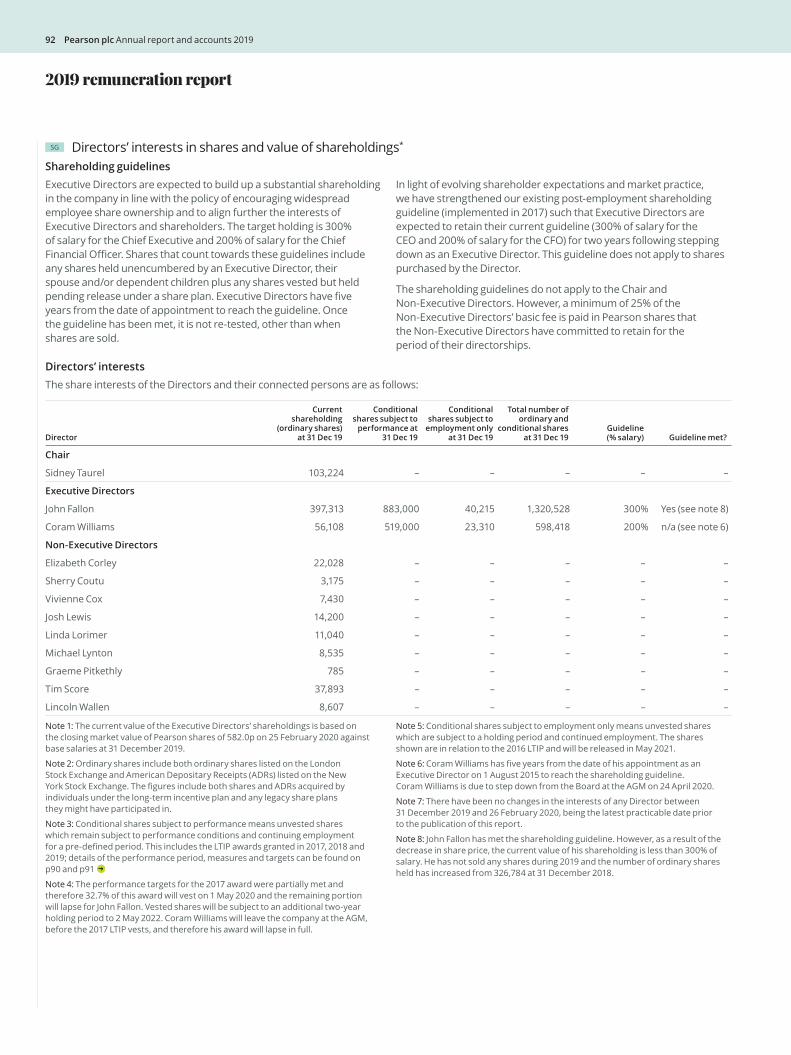
2019 remuneration report
SG Directors’ interests in shares and value of shareholdings*
Shareholding guidelines Executive Directors are expected to build up a substantial shareholding in the company in line with the policy of encouraging widespread employee share ownership and to align further the interests of Executive Directors and shareholders. The target holding is 300% of salary for the Chief Executive and 200% of salary for the Chief Financial Officer. Shares that count towards these guidelines include any shares held unencumbered by an Executive Director, their spouse and/or dependent children plus any shares vested but held pending release under a share plan. Executive Directors have five years from the date of appointment to reach the guideline. Once the guideline has been met, it is not re-tested, other than when shares are sold.
In light of evolving shareholder expectations and market practice, we have strengthened our existing post-employment shareholding guideline (implemented in 2017) such that Executive Directors are expected to retain their current guideline (300% of salary for the CEO and 200% of salary for the CFO) for two years following stepping down as an Executive Director. This guideline does not apply to shares purchased by the Director.
The shareholding guidelines do not apply to the Chair and Non-Executive Directors. However, a minimum of 25% of the Non-Executive Directors’ basic fee is paid in Pearson shares that the Non-Executive Directors have committed to retain for the period of their directorships.
Directors’ interestsThe share interests of the Directors and their connected persons are as follows:
Director
Current shareholding
(ordinary shares)at 31 Dec 19
Conditional shares subject to
performance at 31 Dec 19
Conditional shares subject to
employment only at 31 Dec 19
Total number of ordinary and
conditional shares at 31 Dec 19
Guideline (% salary) Guideline met?
Chair
Sidney Taurel 103,224 – – – – –
Executive Directors
John Fallon 397,313 883,000 40,215 1,320,528 300% Yes (see note 8)
Coram Williams 56,108 519,000 23,310 598,418 200% n/a (see note 6)
Non-Executive Directors
Elizabeth Corley 22,028 – – – – –
Sherry Coutu 3,175 – – – – –
Vivienne Cox 7,430 – – – – –
Josh Lewis 14,200 – – – – –
Linda Lorimer 11,040 – – – – –
Michael Lynton 8,535 – – – – –
Graeme Pitkethly 785 – – – – –
Tim Score 37,893 – – – – –
Lincoln Wallen 8,607 – – – – –
Note 1: The current value of the Executive Directors’ shareholdings is based on the closing market value of Pearson shares of 582.0p on 25 February 2020 against base salaries at 31 December 2019.
Note 2: Ordinary shares include both ordinary shares listed on the London Stock Exchange and American Depositary Receipts (ADRs) listed on the New York Stock Exchange. The figures include both shares and ADRs acquired by individuals under the long-term incentive plan and any legacy share plans they might have participated in.
Note 3: Conditional shares subject to performance means unvested shares which remain subject to performance conditions and continuing employment for a pre-defined period. This includes the LTIP awards granted in 2017, 2018 and 2019; details of the performance period, measures and targets can be found on p90 and p91
Note 4: The performance targets for the 2017 award were partially met and therefore 32.7% of this award will vest on 1 May 2020 and the remaining portion will lapse for John Fallon. Vested shares will be subject to an additional two-year holding period to 2 May 2022. Coram Williams will leave the company at the AGM, before the 2017 LTIP vests, and therefore his award will lapse in full.
Note 5: Conditional shares subject to employment only means unvested shares which are subject to a holding period and continued employment. The shares shown are in relation to the 2016 LTIP and will be released in May 2021.
Note 6: Coram Williams has five years from the date of his appointment as an Executive Director on 1 August 2015 to reach the shareholding guideline. Coram Williams is due to step down from the Board at the AGM on 24 April 2020.
Note 7: There have been no changes in the interests of any Director between 31 December 2019 and 26 February 2020, being the latest practicable date prior to the publication of this report.
Note 8: John Fallon has met the shareholding guideline. However, as a result of the decrease in share price, the current value of his shareholding is less than 300% of salary. He has not sold any shares during 2019 and the number of ordinary shares held has increased from 326,784 at 31 December 2018.
92 Pearson plc Annual report and accounts 2019
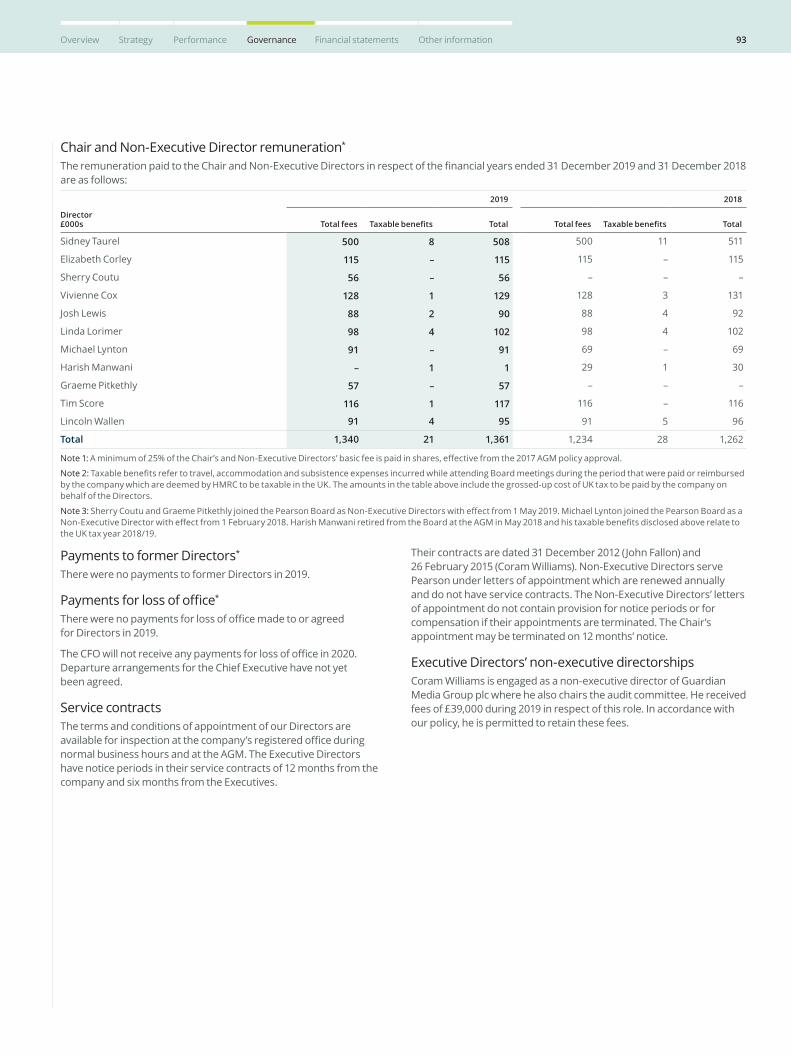
Chair and Non-Executive Director remuneration*
The remuneration paid to the Chair and Non-Executive Directors in respect of the financial years ended 31 December 2019 and 31 December 2018 are as follows:
Director £000s
2019 2018
Total fees Taxable benefits Total Total fees Taxable benefits Total
Sidney Taurel 500 8 508 500 11 511
Elizabeth Corley 115 – 115 115 – 115
Sherry Coutu 56 – 56 – – –
Vivienne Cox 128 1 129 128 3 131
Josh Lewis 88 2 90 88 4 92
Linda Lorimer 98 4 102 98 4 102
Michael Lynton 91 – 91 69 – 69
Harish Manwani – 1 1 29 1 30
Graeme Pitkethly 57 – 57 – – –
Tim Score 116 1 117 116 – 116
Lincoln Wallen 91 4 95 91 5 96
Total 1,340 21 1,361 1,234 28 1,262
Note 1: A minimum of 25% of the Chair’s and Non-Executive Directors’ basic fee is paid in shares, effective from the 2017 AGM policy approval.
Note 2: Taxable benefits refer to travel, accommodation and subsistence expenses incurred while attending Board meetings during the period that were paid or reimbursed by the company which are deemed by HMRC to be taxable in the UK. The amounts in the table above include the grossed-up cost of UK tax to be paid by the company on behalf of the Directors.
Note 3: Sherry Coutu and Graeme Pitkethly joined the Pearson Board as Non-Executive Directors with effect from 1 May 2019. Michael Lynton joined the Pearson Board as a Non-Executive Director with effect from 1 February 2018. Harish Manwani retired from the Board at the AGM in May 2018 and his taxable benefits disclosed above relate to the UK tax year 2018/19.
Payments to former Directors*
There were no payments to former Directors in 2019.
Payments for loss of office*
There were no payments for loss of office made to or agreed for Directors in 2019.
The CFO will not receive any payments for loss of office in 2020. Departure arrangements for the Chief Executive have not yet been agreed.
Service contractsThe terms and conditions of appointment of our Directors are available for inspection at the company’s registered office during normal business hours and at the AGM. The Executive Directors have notice periods in their service contracts of 12 months from the company and six months from the Executives.
Their contracts are dated 31 December 2012 (John Fallon) and 26 February 2015 (Coram Williams). Non-Executive Directors serve Pearson under letters of appointment which are renewed annually and do not have service contracts. The Non-Executive Directors’ letters of appointment do not contain provision for notice periods or for compensation if their appointments are terminated. The Chair’s appointment may be terminated on 12 months’ notice.
Executive Directors’ non-executive directorshipsCoram Williams is engaged as a non-executive director of Guardian Media Group plc where he also chairs the audit committee. He received fees of £39,000 during 2019 in respect of this role. In accordance with our policy, he is permitted to retain these fees.
93Overview Strategy Performance Governance Financial statements Other information
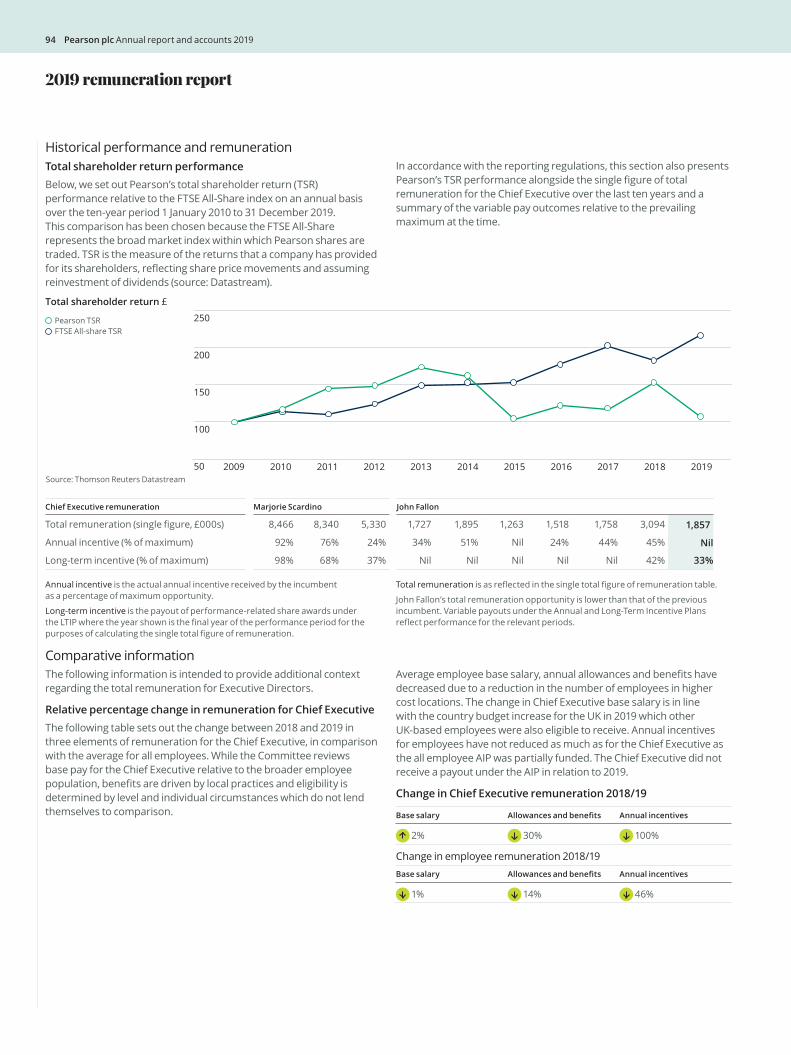
Historical performance and remunerationTotal shareholder return performanceBelow, we set out Pearson’s total shareholder return (TSR) performance relative to the FTSE All-Share index on an annual basis over the ten-year period 1 January 2010 to 31 December 2019. This comparison has been chosen because the FTSE All-Share represents the broad market index within which Pearson shares are traded. TSR is the measure of the returns that a company has provided for its shareholders, reflecting share price movements and assuming reinvestment of dividends (source: Datastream).
In accordance with the reporting regulations, this section also presents Pearson’s TSR performance alongside the single figure of total remuneration for the Chief Executive over the last ten years and a summary of the variable pay outcomes relative to the prevailing maximum at the time.
Total shareholder return £ Pearson TSRFTSE All-share TSR
Source: Thomson Reuters Datastream50
100
150
200
250
20192018201720162015201420132012201120102009
Chief Executive remuneration Marjorie Scardino John Fallon
Total remuneration (single figure, £000s) 8,466 8,340 5,330 1,727 1,895 1,263 1,518 1,758 3,094 1,857
Annual incentive (% of maximum) 92% 76% 24% 34% 51% Nil 24% 44% 45% Nil
Long-term incentive (% of maximum) 98% 68% 37% Nil Nil Nil Nil Nil 42% 33%
Annual incentive is the actual annual incentive received by the incumbent as a percentage of maximum opportunity.
Long-term incentive is the payout of performance-related share awards under the LTIP where the year shown is the final year of the performance period for the purposes of calculating the single total figure of remuneration.
Total remuneration is as reflected in the single total figure of remuneration table.
John Fallon’s total remuneration opportunity is lower than that of the previous incumbent. Variable payouts under the Annual and Long-Term Incentive Plans reflect performance for the relevant periods.
Comparative informationThe following information is intended to provide additional context regarding the total remuneration for Executive Directors.
Relative percentage change in remuneration for Chief ExecutiveThe following table sets out the change between 2018 and 2019 in three elements of remuneration for the Chief Executive, in comparison with the average for all employees. While the Committee reviews base pay for the Chief Executive relative to the broader employee population, benefits are driven by local practices and eligibility is determined by level and individual circumstances which do not lend themselves to comparison.
Average employee base salary, annual allowances and benefits have decreased due to a reduction in the number of employees in higher cost locations. The change in Chief Executive base salary is in line with the country budget increase for the UK in 2019 which other UK-based employees were also eligible to receive. Annual incentives for employees have not reduced as much as for the Chief Executive as the all employee AIP was partially funded. The Chief Executive did not receive a payout under the AIP in relation to 2019.
Change in Chief Executive remuneration 2018/19
Base salary Allowances and benefits Annual incentives
2% 30% 100%
Change in employee remuneration 2018/19Base salary Allowances and benefits Annual incentives
1% 14% 46%
2019 remuneration report
94 Pearson plc Annual report and accounts 2019
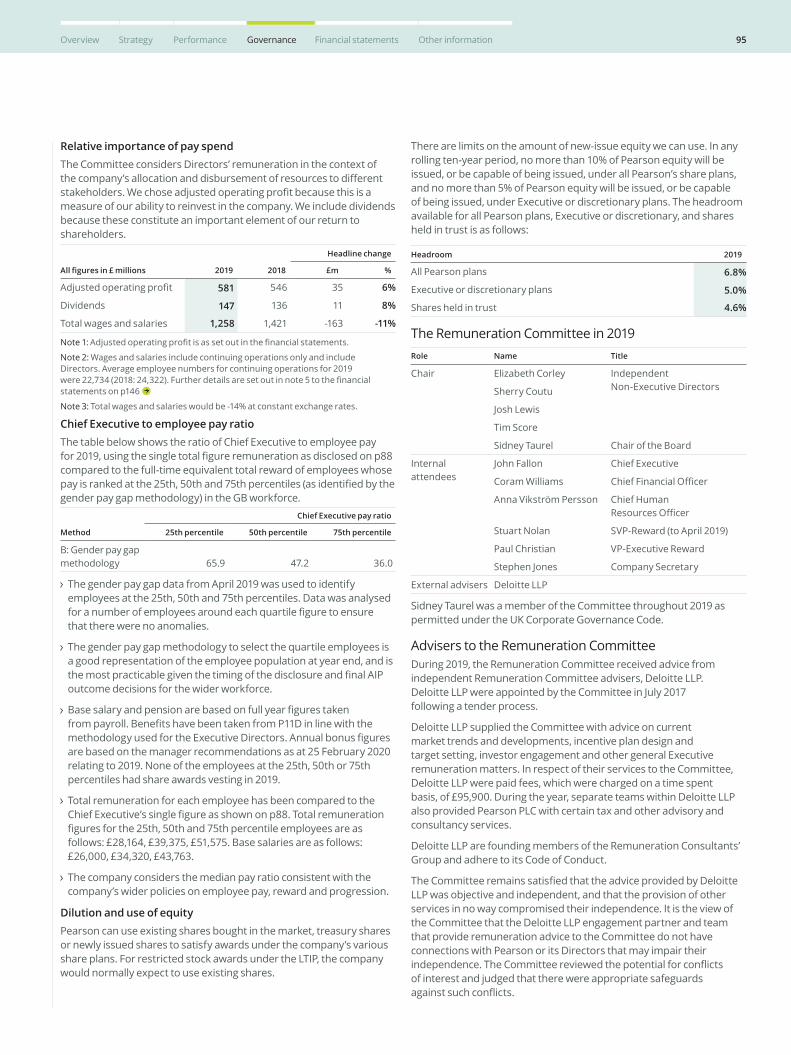
Relative importance of pay spendThe Committee considers Directors’ remuneration in the context of the company’s allocation and disbursement of resources to different stakeholders. We chose adjusted operating profit because this is a measure of our ability to reinvest in the company. We include dividends because these constitute an important element of our return to shareholders.
All figures in £ millions 2019 2018
Headline change
£m %
Adjusted operating profit 581 546 35 6%
Dividends 147 136 11 8%
Total wages and salaries 1,258 1,421 -163 -11%
Note 1: Adjusted operating profit is as set out in the financial statements.
Note 2: Wages and salaries include continuing operations only and include Directors. Average employee numbers for continuing operations for 2019 were 22,734 (2018: 24,322). Further details are set out in note 5 to the financial statements on p146
Note 3: Total wages and salaries would be -14% at constant exchange rates.
Chief Executive to employee pay ratioThe table below shows the ratio of Chief Executive to employee pay for 2019, using the single total figure remuneration as disclosed on p88 compared to the full-time equivalent total reward of employees whose pay is ranked at the 25th, 50th and 75th percentiles (as identified by the gender pay gap methodology) in the GB workforce.
Method
Chief Executive pay ratio
25th percentile 50th percentile 75th percentile
B: Gender pay gap methodology 65.9 47.2 36.0
The gender pay gap data from April 2019 was used to identify employees at the 25th, 50th and 75th percentiles. Data was analysed for a number of employees around each quartile figure to ensure that there were no anomalies.
The gender pay gap methodology to select the quartile employees is a good representation of the employee population at year end, and is the most practicable given the timing of the disclosure and final AIP outcome decisions for the wider workforce.
Base salary and pension are based on full year figures taken from payroll. Benefits have been taken from P11D in line with the methodology used for the Executive Directors. Annual bonus figures are based on the manager recommendations as at 25 February 2020 relating to 2019. None of the employees at the 25th, 50th or 75th percentiles had share awards vesting in 2019.
Total remuneration for each employee has been compared to the Chief Executive’s single figure as shown on p88. Total remuneration figures for the 25th, 50th and 75th percentile employees are as follows: £28,164, £39,375, £51,575. Base salaries are as follows: £26,000, £34,320, £43,763.
The company considers the median pay ratio consistent with the company’s wider policies on employee pay, reward and progression.
Dilution and use of equityPearson can use existing shares bought in the market, treasury shares or newly issued shares to satisfy awards under the company’s various share plans. For restricted stock awards under the LTIP, the company would normally expect to use existing shares.
There are limits on the amount of new-issue equity we can use. In any rolling ten-year period, no more than 10% of Pearson equity will be issued, or be capable of being issued, under all Pearson’s share plans, and no more than 5% of Pearson equity will be issued, or be capable of being issued, under Executive or discretionary plans. The headroom available for all Pearson plans, Executive or discretionary, and shares held in trust is as follows:
Headroom 2019
All Pearson plans 6.8%
Executive or discretionary plans 5.0%
Shares held in trust 4.6%
The Remuneration Committee in 2019Role Name Title
Chair Elizabeth Corley Independent Non-Executive DirectorsSherry Coutu
Josh Lewis
Tim Score
Sidney Taurel Chair of the Board
Internal attendees
John Fallon Chief Executive
Coram Williams Chief Financial Officer
Anna Vikström Persson Chief Human Resources Officer
Stuart Nolan SVP-Reward (to April 2019)
Paul Christian VP-Executive Reward
Stephen Jones Company Secretary
External advisers Deloitte LLP
Sidney Taurel was a member of the Committee throughout 2019 as permitted under the UK Corporate Governance Code.
Advisers to the Remuneration CommitteeDuring 2019, the Remuneration Committee received advice from independent Remuneration Committee advisers, Deloitte LLP. Deloitte LLP were appointed by the Committee in July 2017 following a tender process.
Deloitte LLP supplied the Committee with advice on current market trends and developments, incentive plan design and target setting, investor engagement and other general Executive remuneration matters. In respect of their services to the Committee, Deloitte LLP were paid fees, which were charged on a time spent basis, of £95,900. During the year, separate teams within Deloitte LLP also provided Pearson PLC with certain tax and other advisory and consultancy services.
Deloitte LLP are founding members of the Remuneration Consultants’ Group and adhere to its Code of Conduct.
The Committee remains satisfied that the advice provided by Deloitte LLP was objective and independent, and that the provision of other services in no way compromised their independence. It is the view of the Committee that the Deloitte LLP engagement partner and team that provide remuneration advice to the Committee do not have connections with Pearson or its Directors that may impair their independence. The Committee reviewed the potential for conflicts of interest and judged that there were appropriate safeguards against such conflicts.
95Overview Strategy Performance Governance Financial statements Other information
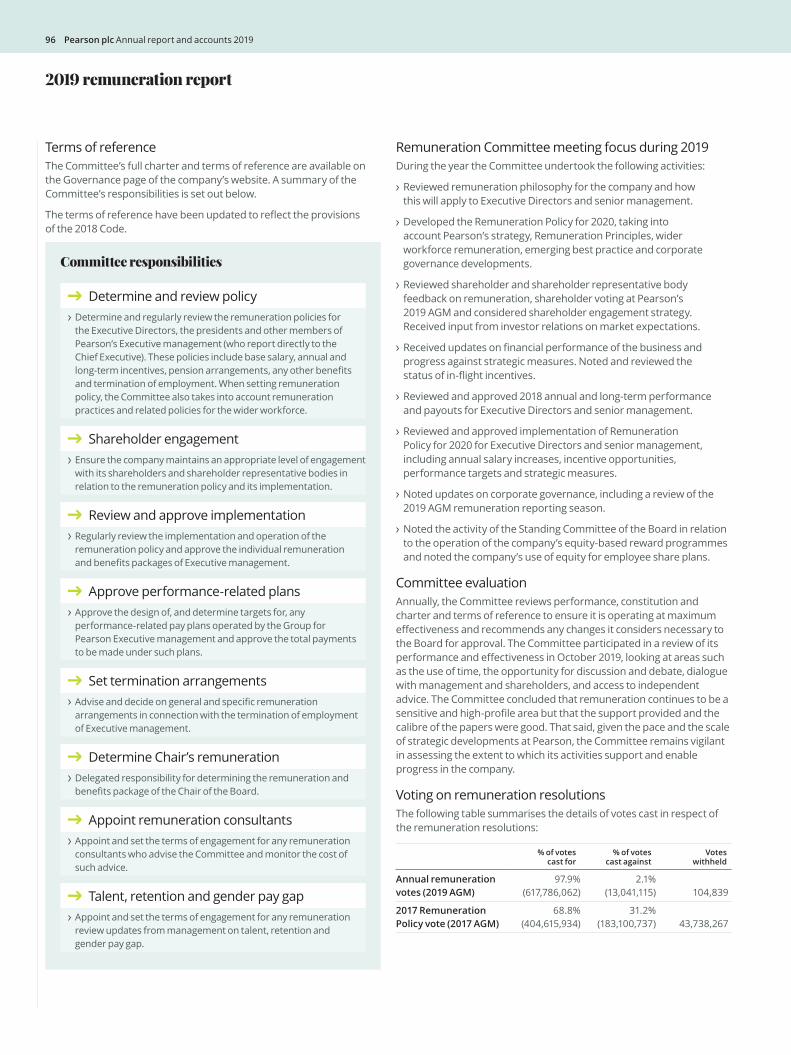
Terms of referenceThe Committee’s full charter and terms of reference are available on the Governance page of the company’s website. A summary of the Committee’s responsibilities is set out below.
The terms of reference have been updated to reflect the provisions of the 2018 Code.
Committee responsibilities
Determine and review policy Determine and regularly review the remuneration policies for the Executive Directors, the presidents and other members of Pearson’s Executive management (who report directly to the Chief Executive). These policies include base salary, annual and long-term incentives, pension arrangements, any other benefits and termination of employment. When setting remuneration policy, the Committee also takes into account remuneration practices and related policies for the wider workforce.
Shareholder engagement Ensure the company maintains an appropriate level of engagement with its shareholders and shareholder representative bodies in relation to the remuneration policy and its implementation.
Review and approve implementation Regularly review the implementation and operation of the remuneration policy and approve the individual remuneration and benefits packages of Executive management.
Approve performance-related plans Approve the design of, and determine targets for, any performance-related pay plans operated by the Group for Pearson Executive management and approve the total payments to be made under such plans.
Set termination arrangements Advise and decide on general and specific remuneration arrangements in connection with the termination of employment of Executive management.
Determine Chair’s remuneration Delegated responsibility for determining the remuneration and benefits package of the Chair of the Board.
Appoint remuneration consultants Appoint and set the terms of engagement for any remuneration consultants who advise the Committee and monitor the cost of such advice.
Talent, retention and gender pay gap Appoint and set the terms of engagement for any remuneration review updates from management on talent, retention and gender pay gap.
Remuneration Committee meeting focus during 2019During the year the Committee undertook the following activities:
Reviewed remuneration philosophy for the company and how this will apply to Executive Directors and senior management.
Developed the Remuneration Policy for 2020, taking into account Pearson’s strategy, Remuneration Principles, wider workforce remuneration, emerging best practice and corporate governance developments.
Reviewed shareholder and shareholder representative body feedback on remuneration, shareholder voting at Pearson’s 2019 AGM and considered shareholder engagement strategy. Received input from investor relations on market expectations.
Received updates on financial performance of the business and progress against strategic measures. Noted and reviewed the status of in-flight incentives.
Reviewed and approved 2018 annual and long-term performance and payouts for Executive Directors and senior management.
Reviewed and approved implementation of Remuneration Policy for 2020 for Executive Directors and senior management, including annual salary increases, incentive opportunities, performance targets and strategic measures.
Noted updates on corporate governance, including a review of the 2019 AGM remuneration reporting season.
Noted the activity of the Standing Committee of the Board in relation to the operation of the company’s equity-based reward programmes and noted the company’s use of equity for employee share plans.
Committee evaluationAnnually, the Committee reviews performance, constitution and charter and terms of reference to ensure it is operating at maximum effectiveness and recommends any changes it considers necessary to the Board for approval. The Committee participated in a review of its performance and effectiveness in October 2019, looking at areas such as the use of time, the opportunity for discussion and debate, dialogue with management and shareholders, and access to independent advice. The Committee concluded that remuneration continues to be a sensitive and high-profile area but that the support provided and the calibre of the papers were good. That said, given the pace and the scale of strategic developments at Pearson, the Committee remains vigilant in assessing the extent to which its activities support and enable progress in the company.
Voting on remuneration resolutionsThe following table summarises the details of votes cast in respect of the remuneration resolutions:
% of votes cast for
% of votes cast against
Votes withheld
Annual remuneration votes (2019 AGM)
97.9% (617,786,062)
2.1% (13,041,115) 104,839
2017 Remuneration Policy vote (2017 AGM)
68.8% (404,615,934)
31.2% (183,100,737) 43,738,267
2019 remuneration report
96 Pearson plc Annual report and accounts 2019
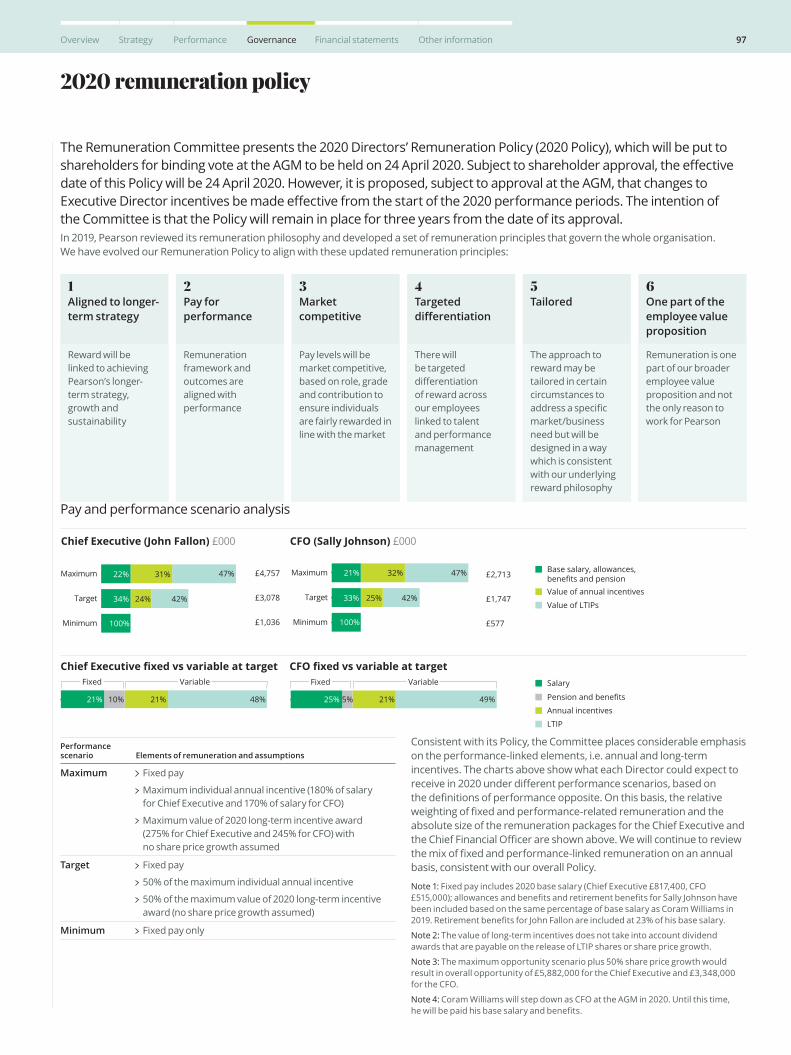
Pay and performance scenario analysis
2020 remuneration policy
The Remuneration Committee presents the 2020 Directors’ Remuneration Policy (2020 Policy), which will be put to shareholders for binding vote at the AGM to be held on 24 April 2020. Subject to shareholder approval, the effective date of this Policy will be 24 April 2020. However, it is proposed, subject to approval at the AGM, that changes to Executive Director incentives be made effective from the start of the 2020 performance periods. The intention of the Committee is that the Policy will remain in place for three years from the date of its approval.In 2019, Pearson reviewed its remuneration philosophy and developed a set of remuneration principles that govern the whole organisation. We have evolved our Remuneration Policy to align with these updated remuneration principles:
1Aligned to longer-term strategy
4Targeted differentiation
3Market competitive
6One part of the employee value proposition
2Pay for performance
5Tailored
Performance scenario Elements of remuneration and assumptions
Maximum Fixed pay
Maximum individual annual incentive (180% of salary for Chief Executive and 170% of salary for CFO)
Maximum value of 2020 long-term incentive award (275% for Chief Executive and 245% for CFO) with no share price growth assumed
Target Fixed pay
50% of the maximum individual annual incentive
50% of the maximum value of 2020 long-term incentive award (no share price growth assumed)
Minimum Fixed pay only
Consistent with its Policy, the Committee places considerable emphasis on the performance-linked elements, i.e. annual and long-term incentives. The charts above show what each Director could expect to receive in 2020 under different performance scenarios, based on the definitions of performance opposite. On this basis, the relative weighting of fixed and performance-related remuneration and the absolute size of the remuneration packages for the Chief Executive and the Chief Financial Officer are shown above. We will continue to review the mix of fixed and performance-linked remuneration on an annual basis, consistent with our overall Policy.
Note 1: Fixed pay includes 2020 base salary (Chief Executive £817,400, CFO £515,000); allowances and benefits and retirement benefits for Sally Johnson have been included based on the same percentage of base salary as Coram Williams in 2019. Retirement benefits for John Fallon are included at 23% of his base salary.
Note 2: The value of long-term incentives does not take into account dividend awards that are payable on the release of LTIP shares or share price growth.
Note 3: The maximum opportunity scenario plus 50% share price growth would result in overall opportunity of £5,882,000 for the Chief Executive and £3,348,000 for the CFO.
Note 4: Coram Williams will step down as CFO at the AGM in 2020. Until this time, he will be paid his base salary and benefits.
Minimum
Target
Maximum
Minimum
Target
Maximum
Chief Executive (John Fallon) £000 CFO (Sally Johnson) £000
21%
33%
100%
32% 47%
42%25%
£2,713
£1,747
£577
22%
34%
100%
31% 47%
42%24%
£4,757
£3,078
£1,036
Base salary, allowances,benefits and pensionValue of annual incentives
Value of LTIPs
Chief Executive fixed vs variable at target CFO fixed vs variable at target
21% 10% 21% 48% 25% 5% 21% 49%
Salary
Pension and benefits
Annual incentives
LTIP
Fixed Variable Fixed Variable
Reward will be linked to achieving Pearson’s longer-term strategy, growth and sustainability
Remuneration framework and outcomes are aligned with performance
Pay levels will be market competitive, based on role, grade and contribution to ensure individuals are fairly rewarded in line with the market
There will be targeted differentiation of reward across our employees linked to talent and performance management
The approach to reward may be tailored in certain circumstances to address a specific market/business need but will be designed in a way which is consistent with our underlying reward philosophy
Remuneration is one part of our broader employee value proposition and not the only reason to work for Pearson
97Overview Strategy Performance Governance Financial statements Other information

2020 remuneration policy
Policy table for Executive DirectorsTotal remuneration is made up of fixed and performance-linked elements, with each element supporting different strategic objectives. Remuneration is normally reviewed annually in the context of business performance and conditions prevailing, taking into account pay levels for similar positions in comparable companies as well as internal ratios.
B Base salaryPurpose and link to strategy
Helps to recruit, reward and retain.
Reflects level, role, skills, experience, the competitive market and individual contribution.
Purpose and link to strategy
Help to recruit, reward and retain.
Reflect local competitive market.
Operation
Base salaries are set to provide the appropriate rate of remuneration for the job, taking into account relevant recruitment markets, business sectors and geographic regions.
Base salaries are normally reviewed annually taking into account: general economic and market conditions; the level of increases made across the company as a whole; particular circumstances such as changes in role, responsibilities or organisation; the remuneration and level of increases for executives in similar positions in comparable companies in both the UK, US and internationally; and individual performance.
Opportunity
While there is no maximum salary level or maximum increase that may be offered, salary increases will normally be in line with typical increases awarded to other employees in the Group.
However, increases may be above this level in certain circumstances such as:
Where a new Executive Director has been appointed to the Board at a lower than typical market salary to allow for growth in the role then larger increases may be awarded to move salary positioning closer to typical market level as the Executive Director gains experience.
Where an Executive Director has been promoted or has had a change in responsibilities.
Where there has been a significant change in market practice or where there has been a significant change in the size and/or scope of the business.
Performance conditions and period
None, although performance of both the company and the individual are taken into account when determining an appropriate level of base salary increase each year.
Operation
Allowances and benefits comprise cash allowances and non-cash benefits which may include:
travel-related benefits (such as car allowance, company car and private use of a driver)
health-related benefits (such as healthcare, health assessment and gym subsidy) and
risk benefits (such as additional life cover and long-term disability insurance that are not covered by the company’s retirement plans).
Executive Directors are also eligible to participate in savings-related share acquisition programmes, which are not subject to any performance conditions, on the same terms and to the same value as other employees.
Where an Executive Director is required to relocate to perform their role, appropriate one-off or ongoing expatriate/relocation benefits may be provided (e.g. housing, schooling, etc.)
The Committee may introduce other benefits if it is considered appropriate to do so, taking into account the individual circumstances, the country of residence of a Director, the benefits available to all employees and the wider external market.
Opportunity
The cost of the provision of allowances and benefits varies from year to year depending on the cost to Pearson and there is no prescribed maximum limit. However, the Committee monitors annually the overall cost of the benefits provided, to ensure that it remains appropriate.
A&B Allowances and benefits
98 Pearson plc Annual report and accounts 2019
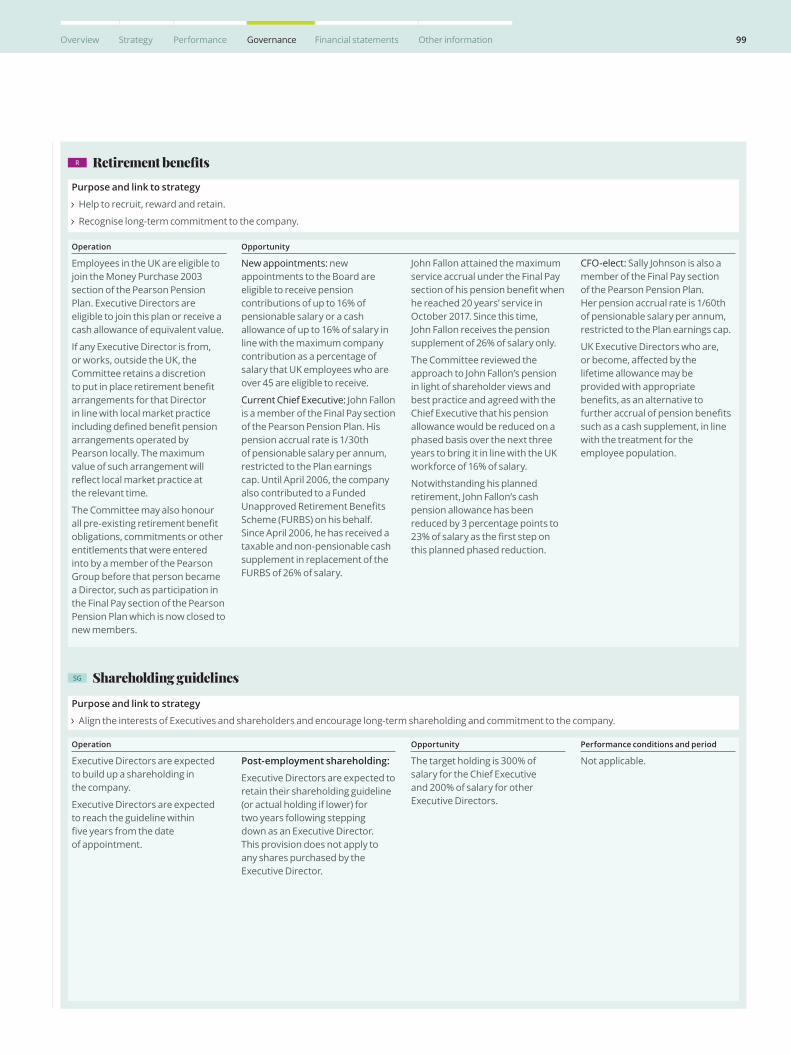
R Retirement benefits Purpose and link to strategy
Help to recruit, reward and retain.
Recognise long-term commitment to the company.
Operation
Employees in the UK are eligible to join the Money Purchase 2003 section of the Pearson Pension Plan. Executive Directors are eligible to join this plan or receive a cash allowance of equivalent value.
If any Executive Director is from, or works, outside the UK, the Committee retains a discretion to put in place retirement benefit arrangements for that Director in line with local market practice including defined benefit pension arrangements operated by Pearson locally. The maximum value of such arrangement will reflect local market practice at the relevant time.
The Committee may also honour all pre-existing retirement benefit obligations, commitments or other entitlements that were entered into by a member of the Pearson Group before that person became a Director, such as participation in the Final Pay section of the Pearson Pension Plan which is now closed to new members.
Opportunity
New appointments: new appointments to the Board are eligible to receive pension contributions of up to 16% of pensionable salary or a cash allowance of up to 16% of salary in line with the maximum company contribution as a percentage of salary that UK employees who are over 45 are eligible to receive.
Current Chief Executive: John Fallon is a member of the Final Pay section of the Pearson Pension Plan. His pension accrual rate is 1/30th of pensionable salary per annum, restricted to the Plan earnings cap. Until April 2006, the company also contributed to a Funded Unapproved Retirement Benefits Scheme (FURBS) on his behalf. Since April 2006, he has received a taxable and non-pensionable cash supplement in replacement of the FURBS of 26% of salary.
John Fallon attained the maximum service accrual under the Final Pay section of his pension benefit when he reached 20 years’ service in October 2017. Since this time, John Fallon receives the pension supplement of 26% of salary only.
The Committee reviewed the approach to John Fallon’s pension in light of shareholder views and best practice and agreed with the Chief Executive that his pension allowance would be reduced on a phased basis over the next three years to bring it in line with the UK workforce of 16% of salary.
Notwithstanding his planned retirement, John Fallon’s cash pension allowance has been reduced by 3 percentage points to 23% of salary as the first step on this planned phased reduction.
CFO-elect: Sally Johnson is also a member of the Final Pay section of the Pearson Pension Plan. Her pension accrual rate is 1/60th of pensionable salary per annum, restricted to the Plan earnings cap.
UK Executive Directors who are, or become, affected by the lifetime allowance may be provided with appropriate benefits, as an alternative to further accrual of pension benefits such as a cash supplement, in line with the treatment for the employee population.
Purpose and link to strategy
Align the interests of Executives and shareholders and encourage long-term shareholding and commitment to the company.
Operation
Executive Directors are expected to build up a shareholding in the company.
Executive Directors are expected to reach the guideline within five years from the date of appointment.
Post-employment shareholding:
Executive Directors are expected to retain their shareholding guideline (or actual holding if lower) for two years following stepping down as an Executive Director. This provision does not apply to any shares purchased by the Executive Director.
Opportunity
The target holding is 300% of salary for the Chief Executive and 200% of salary for other Executive Directors.
Performance conditions and period
Not applicable.
SG Shareholding guidelines
99Overview Strategy Performance Governance Financial statements Other information
AIP Annual incentive planPurpose and link to strategy
Help to recruit, reward and retain.
Motivate the achievement of annual business goals and strategic objectives.
Provide a focus on key financial and non-financial metrics.
Reward individual contribution to the success of the company.
Align to strategy execution priorities.
Operation
Measures and performance targets are set by the Committee at the start of the year with payment made after year end following the Committee’s assessment of performance relative to targets.
Annual incentive plans are discretionary. The Committee reserves the right to adjust payments up or down if it believes that the outcome does not reflect underlying financial or non-financial performance or if such other exceptional factors warrant doing so.
The Committee may apply malus and/or clawback for a period of five years in certain circumstances, such as financial misstatement, individual misconduct or reputational damage to the company.
Opportunity
Annual incentives will not exceed 200% of base salary.
For the Chief Executive, the individual maximum incentive opportunity that will apply for 2020 is 180% of base salary and 170% for the Chief Financial Officer (which are the same opportunities as applied for 2019).
There is normally no payout for performance at threshold.
50% of the maximum opportunity is payable for on-target levels of performance.
Performance conditions and period
The Committee has the discretion to select the performance measures and relative weightings from year to year to ensure continuing alignment with strategy and to ensure targets are sufficiently stretching. The Committee sets performance targets for each measure annually.
Annual incentives will normally be based on financial and strategic performance targets. Financial metrics will account for at least 75% of the total annual opportunity with the remaining portion normally being based on strategic and/or performance against personal objectives. Financial measures currently account for 80% of the total funding, The Committee would intend to consult with shareholders in advance if there was to be a significant change in the weighting of financial and strategic measures.
The plan is designed to incentivise and reward underlying performance. Actual results may be adjusted to remove the effect of foreign exchange and portfolio changes (acquisitions and disposals) and other relevant factors that the Committee considers do not reflect the underlying performance of the business in the performance year.
Details of performance measures, weightings and targets will be disclosed in the annual remuneration report for the relevant financial year if and to the extent that the Committee deems them to be no longer commercially sensitive.
The performance period is one year.
2020 remuneration policy
100 Pearson plc Annual report and accounts 2019
LTIP Long-term incentive planPurpose and link to strategy
Help to recruit, reward and retain.
Drive long-term earnings, share price growth and value creation.
Align the interests of executives and shareholders.
Encourage long-term shareholding and commitment to the company.
Operation
Awards of shares are made on an annual basis, which vest on a sliding scale based on performance against stretching corporate performance targets measured at the end of the three-year performance period.
Awards are normally subject to a post vesting holding period for two years following the end of the performance period. For awards granted prior to 2020, the holding period applied will be in line with the approach set out in the Directors’ Remuneration Policy in place at the time of award.
Participants may receive additional shares representing the gross value of dividends that would have been paid on shares that vest during the performance period.
The Committee reserves the right to adjust payouts up or down before they are released if it believes that the vesting outcome does not reflect underlying financial or non-financial performance or if such other exceptional factors warrant doing so. In making such adjustments, the Committee is guided by the principle of aligning shareholder and management interests.
The Committee may apply malus and/or clawback for a period of five years in certain circumstances, such as financial misstatement, individual misconduct or reputational damage to the company.
Opportunity
The maximum award is 350% of base salary in respect of a financial year.
For 2020, the incoming CFO will be granted an award of 245% of salary.
Performance conditions and period
The Committee will determine the performance measures, weightings and targets governing an award of shares prior to grant to ensure continuing alignment with strategy and to ensure that targets are sufficiently stretching.
The Committee establishes a threshold below which no payout is achieved and a maximum at or above which the award pays out in full. The proportion of the award that vests at threshold may be up to 25%.
Awards will normally be subject to the achievement of targets for earnings per share, a return on measure and relative total shareholder return (weighted equally). The Committee may determine that different measures or weightings may apply for future awards; however, the Committee would intend to consult with shareholders in advance if there was to be a significant change in the weighting of measures or the performance measures used.
The performance period is three years.
101Overview Strategy Performance Governance Financial statements Other information

Notes to the Policy tableChanges to PolicyThe key changes to this Policy compared to the 2017 Policy are summarised below:
Policy limits and measures – The exceptional maximum limits under base salary, benefits and LTIP have been removed to improve transparency for shareholders around how we intend to implement the Policy. Additional flexibility has been provided to allow for changes to performance measures for future years.
LTIP limit reduced – The normal maximum potential LTIP award has also been reduced from 400% of salary to 350% of salary to bring it more in-line with how we have implemented the Policy in recent years.
Target AIP – In order to align with shareholder expectations, the AIP paid for ‘on target’ performance will be no more than 50% of the maximum potential. This results in a reduction in target AIP opportunity for the Chief Executive from 100% of salary to 90% of salary with no change to maximum opportunity.
Simplified the holding period – We have simplified the structure of the LTIP holding period to reflect typical market practice. 100% of the LTIP award (for 2020 onwards) will be subject to a two-year holding period following the end of the three-year performance period (i.e. five years from award).
Best practice – Changes have been made to the Policy to reflect the adoption of the 2018 UK Corporate Governance Code (including to incorporate changes outlined in previous Directors’ remuneration reports) as well as other areas of best practice. These include:
– Pensions for new appointments – Pension arrangements for new appointments have been aligned with the pension arrangements available to the majority of UK employees of a similar age.
– Pension for the Chief Executive – Chief Executive pension opportunity is being reduced in stages over three years to 16% of base salary to align with the rate available to UK employees.
– Post-employment guideline – These guidelines have been formalised in the Policy and enhanced such that 100% of in-employment guideline is expected to be retained for two years following ceasing to be an Executive Director.
Other minor changes have been made to the wording of the Policy to simplify and aid its operation and to increase clarity.
In determining the new Remuneration Policy, the Committee followed a robust process which included discussions on the content of the Policy at four Remuneration Committee meetings in 2019. The Committee considered the input from our independent advisors and management, and sought the views of Pearson’s major shareholders. Further information on the Committee’s decision-making process is set out in the remuneration report.
Selection of performance measures and target settingIn the selection and weighting of performance measures for the annual and long-term incentive awards, the Committee takes into account Pearson’s strategic objectives and short and long-term business priorities.
Annual incentive plan
AIP
For 2020, the Committee identified sales, adjusted operating profit, operating cash flow and key strategic business imperatives as being relevant measures of Pearson’s performance against its shorter-term strategic objectives and business priorities.
Long-term incentive plan
LTIP
For 2020 awards, the Committee has judged the following to be most closely matched to sustained delivery of strategy and alignment with shareholders’ interests:
Adjusted earnings per share rewards the delivery of the desired outcomes from our strategic growth objectives and is imperative if the company is to improve our total shareholder return and our return on invested capital.
Return on invested capital is used to track investment returns and to help assess capital allocation decisions within the business.
Total shareholder return relative to the constituents of the FTSE 100 is used as the Committee believes, in line with many of our shareholders, that part of Executive Directors’ rewards should be linked to long-term performance relative to companies of comparable size, scale and maturity that are similarly impacted by global macro-economic influences.
The performance ranges chosen set a careful balance between upside opportunity and downside risk and are normally based on targets in accordance with the company’s operating and strategic plans.
The charts on p97 illustrate how remuneration will be implemented in 2020 based on threshold, target and maximum performance scenarios.
Pre-existing commitments The Committee reserves the right to make remuneration payments and payments for loss of office (which includes exercising related discretions) that are not in line with this Policy if the terms of the payment were agreed:
1. before the Policy came into effect, if the payment was agreed or made in line with the policy in force at the time or was otherwise approved by shareholders; and
2. at a time when the recipient was not subject to the Policy, provided the Committee does not consider the payment to have been made in consideration of the recipient becoming subject to the Policy.
For these purposes ‘payment’ means any payment that would otherwise be subject to the Policy and, in relation to a share award, will not be considered to have been ‘agreed’ any later than the date of grant.
Remuneration policy for other employees During the year, the Committee reviewed and developed a revised set of remuneration principles, which shape how we develop our remuneration policies. The principles are consistent across the employee population but how they are applied varies by business need, level and geography as required.
Our remuneration policy is as follows:
The approach to setting base salary increases elsewhere in the company takes into account economic factors, competitive market rates, roles, skills, experience and individual performance.
Allowances and benefits for employees reflect the local labour market in which they are based.
2020 remuneration policy
102 Pearson plc Annual report and accounts 2019
Around 1,200 employees participate in an Annual Incentive Plan. The funding for the plan is based on the same performance conditions as those used for the Executive Directors. A number of other employees participate in other forms of cash-based annual incentive such as profit-share or sales commission plan based on performance targets.
Share incentive plans for the Pearson Executive management team form the basis of the incentive plans throughout the organisation, establishing performance measures and standards and setting the ceiling for individual incentive opportunities. Approximately 5% of the company’s employees below the Pearson Executive management team – selected on the basis of their role, performance and potential – participate in share incentive plans.
All eligible employees (including Executive Directors) are also eligible to participate in savings-related share acquisition programmes in the UK, US and the rest of the world, which are not subject to any performance conditions.
Pearson employees in the UK may participate in the same underlying pension arrangements as the Executive Directors, subject to certain age bands and legacy arrangements.
RecruitmentThe Committee expects any new Executive Directors to be engaged on the same terms and to be awarded variable remuneration within the same normal limits and subject to the same conditions as for the current Executive Directors outlined in the policy.
The maximum level of variable remuneration which may be awarded (excluding any ‘buyout’ awards referred to above) in respect of recruitment is 550% of salary, which is in line with the current maximum limit under the annual bonus and LTIP.
In setting the basic salary for any new Executive Director, the Committee will apply a level appropriate to recruit a suitable candidate, having regard to the factors set out in the future policy table.
The Committee recognises that it cannot always predict accurately the circumstances in which any new Directors may be recruited. The Committee may determine that it is in the interests of the company and shareholders to secure the services of a particular individual which may require the Committee to take account of the terms of that individual’s existing employment and/or their personal circumstances. The Committee may do this in the following circumstances:
Where an individual is relocating in order to take up the role, in which case the company may provide certain benefits such as reasonable relocation expenses, accommodation for a short period following appointment and assistance with visa applications or other immigration issues and ongoing arrangements such as tax equalisation, annual flights home, schooling and housing allowance.
Where an individual forfeits outstanding variable pay opportunities or contractual rights at a previous employer as a result of appointment, the Committee may offer compensatory payments or awards, in such form as the Committee considers appropriate taking into account all relevant factors including the form of awards, expected value and vesting timeframe of forfeited opportunities. The Committee would require reasonable evidence of the nature and value of any forfeited award and would, to the extent practicable, ensure any compensation was provided on a like-for-like basis and was no more valuable than the forfeited award.
In making any decision on any aspect of the remuneration package for a new recruit, the Committee would balance shareholder expectations, current best practice and the requirements of any new recruit and would strive not to pay more than is necessary to achieve the recruitment. The Committee would give full details of the terms of the package of any new recruit in the next annual remuneration report.
Where an existing employee of the company is promoted to the Board, the company may honour all existing contractual commitments including any outstanding share awards and benefits, including pensions.
Pearson expects any new Chair or Non-Executive Director to be engaged on terms that are consistent with the general remuneration principles outlined in the relevant sections of this Policy.
Service contracts and termination provisionsIn accordance with long established policy, all Executive Directors have service agreements under which, other than by termination in accordance with the terms of these agreements, employment continues indefinitely.
There are no special provisions for notice or non-share-based compensation in the event of a change of control of Pearson.
It is the company’s policy that the company may terminate the Chair’s and Executive Directors’ service agreements by giving no more than 12 months’ notice.
Payment in lieu of noticeAs an alternative, for Executive Directors the company may at its discretion pay in lieu of that notice. Payment in lieu of notice may be made in equal monthly instalments from the date of termination to the end of any unexpired notice period. Payment in lieu of notice in instalments may also be subject to mitigation and reduced taking into account earnings from alternative employment.
For Executive Directors, payment in lieu of notice comprises 100% of the annual salary at the date of termination and the annual cost to the company of providing pension and all other benefits. For the Chair, payment in lieu of notice comprises 100% of the annual fees at the date of termination.
The company may, depending on the circumstances of the termination, determine that it will not pay the Director in lieu of notice and may instead terminate a Director’s contract in breach and make a damages payment, taking into account as appropriate the Director’s ability to mitigate his or her loss.
The company may also pay an amount considered to be reasonable by the Remuneration Committee in respect of fees for legal and tax advice and outplacement support for the departing Director. The Committee reserves the right to make any other payments in connection with a Director’s cessation of office or employment where the payments are made in good faith, in discharge of an existing legal obligation (or by way of damages for breach of such an obligation) or by way of settlement of any claim arising in connection with the cessation of a Director’s office or employment.
Share awardsOn cessation of employment, unless otherwise provided for under the rules of Pearson’s discretionary share plans, Executive Directors’ entitlements to any unvested awards lapse automatically. In the case of injury, disability, ill-health or redundancy (as determined by the Committee), where a participant’s employing company ceases to be part of Pearson, or any other reason if the Committee so decides in its absolute discretion:
103Overview Strategy Performance Governance Financial statements Other information
awards will stay in force as if the participant had not ceased employment and shall ordinarily vest on the original vesting date/be released in line with normal time horizons subject to performance conditions.
the number of shares that are released shall be pro-rated for the period of the participant’s service in the restricted period (although the Committee may in its absolute discretion waive or vary the pro-rating).
In determining whether and how to exercise its discretion under Pearson’s discretionary share plans, the Committee will have regard to all relevant circumstances distinguishing between different types of leaver, the circumstances at the time the award was originally made, the Director’s performance and the circumstances in which the Director left employment.
The rules of Pearson’s discretionary share plans also make provision for the treatment of awards in respect of corporate activity, including a change of control of Pearson. The Committee would act in accordance with the terms of the awards in these circumstances, which includes terms as to the assessment of performance conditions and time apportionment.
Annual bonusOn cessation of employment, Executive Directors may, at the Committee’s discretion, retain entitlement to a pro rata annual incentive for their period of service in the financial year prior to their leaving date. Such payout will normally be calculated in good faith on the same terms and paid at the same time as for continuing Executive Directors.
Other elements of remunerationEligibility for allowances and benefits including retirement benefits (other than pension payments in connection with subsequent retirement) normally ceases on retirement or on the termination of employment for any other reason.
Individual service agreementsDetails of each individual’s service agreement are outlined in the table below. Employment agreements for other employees are determined according to local labour law and market practice.
Position Date of agreement Notice periods
Compensation on termination of employment by the company without notice or cause
Chair 25 October 2015 12 months from the Director; 12 months from the company
Payment in lieu of notice of 100% of annual fees at the date of termination
Executive Directors
31 December 2012 (John Fallon)
26 February 2015 (Coram Williams)
15 January 2020 (Sally Johnson)
6 months from the Director; 12 months from the company
Payment in lieu of notice of 100% of annual salary at the date of termination and the annual cost of pension and all other benefits
Note Under payment in lieu of notice, the annual cost of pension for Executive Directors is normally calculated as the sum, where applicable, of: an amount equal to the company’s cost of providing the Executive’s pension under the pension plan based on the Future Service Company Contribution Rate for the relevant section of the pension plan as stated in the most recent actuarial valuation (as at the date of termination of employment) as limited by the earnings cap; and any cash allowance in lieu of pension or to take account of the fact that pension benefits and life assurance cover are restricted by the earnings cap.
Non-Executive Directors serve Pearson under letters of appointment which are renewed annually and do not have service contracts. For Non-Executive Directors, there is no notice period or entitlement to compensation on the termination of their directorships.
Executive Directors’ non-Executive DirectorshipsThe Committee’s policy is that Executive Directors may, by agreement with the Board, serve as non-executives of other companies and retain any fees payable for their services.
Employment conditionsUnder the Committee’s charter and terms of reference, the Committee’s remit includes determining remuneration for the Chief Executive, other Executive Directors and other members of the Pearson Executive management team. In addition, the Committee’s remit includes oversight of certain remuneration matters below this level. Before the remuneration packages for the Pearson Executive management team are set for the year ahead, the Committee considers reports from the Chief Executive on general morale and Chief Human Resources Officer on retention, general pay trends in the market and the level of pay increases and incentives across the company as a whole. This helps to ensure that Executive remuneration packages are reviewed in the context of the wider organisation.
The company consults with various employee representative bodies – including trade unions and works councils in some jurisdictions – about the company’s strategy, competitiveness and performance of the business and other matters affecting employees. The company also conducts an employee engagement survey to find out how people feel about working for Pearson, what they think about the work they do, the opportunities they have and the rewards they get (including a section on pay and benefits). The company uses all of this feedback to inform decisions on people-related activities, resources and investment, local management action plans and wider business unit and organisational strategies.
It is the company’s intention to continue to engage with employees and employee representatives in this way in the future.
The Committee has not consulted directly with employees on the setting of the Directors’ Remuneration Policy.
Shareholder viewsThe company consults regularly with shareholders on all matters affecting its strategy and business operations. As part of that process, we also engage with shareholders on matters relating to Executive remuneration. The Committee continues to monitor and respond to best practice guidelines of shareholders and their representative bodies.
Over the past three years, we have undertaken a thorough review of our Executive Director Remuneration Policy and its implementation. As part of this review, we engaged extensively with our shareholders to ensure Executive remuneration is set appropriately, rewards for performance and aligns management with the shareholder experience. We would like to thank our shareholders for the time they have spent with us in this regard.
In January 2020, we wrote to our key shareholders and the voting advisory agencies, seeking their views on the proposed changes to Pearson’s Directors’ Remuneration Policy. We received valuable feedback on a number of points, which reflected a significant range of opinions. This feedback has been helpful to the Committee in formulating policy and is much appreciated.
We are committed to continued engagement going forward.
2020 remuneration policy
104 Pearson plc Annual report and accounts 2019
Future policy table for Chair’s and Non-Executive Directors’ remunerationThe table below summarises policy with respect to the remuneration of the Chair and Non-Executive Directors:
Chair and Non-Executive Director remunerationPurpose and link to strategy
To attract and retain high-calibre individuals, with appropriate experience or industry-relevant skills, by offering market competitive fee levels.
Operation
The Chair is paid a single fee for all of their responsibilities.
The Chair’s fee is set at a level that is competitive with those of chairmen in similar positions in comparable companies.
The Non-Executive Directors are paid a basic fee.
The Committee Chairs, members of the main Board Committees and the Senior Independent Director are paid an additional fee to reflect their extra responsibilities. Fees for Non-Executive Directors are determined by the full Board having regard to market practice.
Additional fees or other payments may be paid to reflect additional responsibilities, roles or contribution, as appropriate.
The Chair and Non-Executive Directors are not entitled to any annual or long-term incentive, retirement or other employee benefits. Selected benefits may be introduced, if considered appropriate.
The company reimburses the Chair’s and Non-Executive Directors’ travel and other business expenses and any tax incurred thereon, if applicable.
Normally a minimum of 25% of the Chair’s and Non-Executive Directors’ basic fee is paid in Pearson shares that the Non-Executive Directors have committed to retain for the period of their directorships. Shares are normally acquired quarterly at the prevailing market price with the individual’s after-tax fee payments.
Opportunity
Fee levels are reviewed on a periodic basis.
The total fees payable to the Non-Executive Directors (excluding the Chair) are subject to the limit set out in the Articles of Association of the company (currently £750,000) and as increased by ordinary resolution from time to time.
Performance conditions and period
None.
105Overview Strategy Performance Governance Financial statements Other information
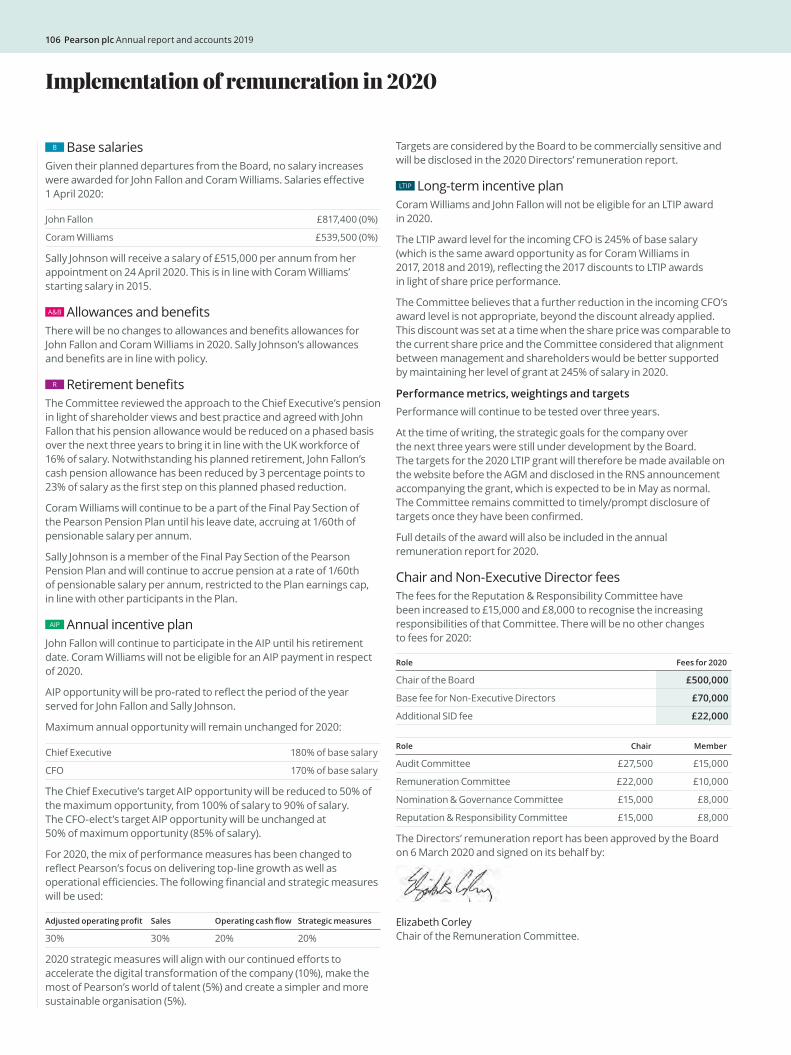
Implementation of remuneration in 2020
B Base salariesGiven their planned departures from the Board, no salary increases were awarded for John Fallon and Coram Williams. Salaries effective 1 April 2020:
John Fallon £817,400 (0%)
Coram Williams £539,500 (0%)
Sally Johnson will receive a salary of £515,000 per annum from her appointment on 24 April 2020. This is in line with Coram Williams’ starting salary in 2015.
A&B Allowances and benefitsThere will be no changes to allowances and benefits allowances for John Fallon and Coram Williams in 2020. Sally Johnson’s allowances and benefits are in line with policy.
R Retirement benefitsThe Committee reviewed the approach to the Chief Executive’s pension in light of shareholder views and best practice and agreed with John Fallon that his pension allowance would be reduced on a phased basis over the next three years to bring it in line with the UK workforce of 16% of salary. Notwithstanding his planned retirement, John Fallon’s cash pension allowance has been reduced by 3 percentage points to 23% of salary as the first step on this planned phased reduction.
Coram Williams will continue to be a part of the Final Pay Section of the Pearson Pension Plan until his leave date, accruing at 1/60th of pensionable salary per annum.
Sally Johnson is a member of the Final Pay Section of the Pearson Pension Plan and will continue to accrue pension at a rate of 1/60th of pensionable salary per annum, restricted to the Plan earnings cap, in line with other participants in the Plan.
AIP Annual incentive planJohn Fallon will continue to participate in the AIP until his retirement date. Coram Williams will not be eligible for an AIP payment in respect of 2020.
AIP opportunity will be pro-rated to reflect the period of the year served for John Fallon and Sally Johnson.
Maximum annual opportunity will remain unchanged for 2020:
Chief Executive 180% of base salary
CFO 170% of base salary
The Chief Executive’s target AIP opportunity will be reduced to 50% of the maximum opportunity, from 100% of salary to 90% of salary. The CFO-elect’s target AIP opportunity will be unchanged at 50% of maximum opportunity (85% of salary).
For 2020, the mix of performance measures has been changed to reflect Pearson’s focus on delivering top-line growth as well as operational efficiencies. The following financial and strategic measures will be used:
Adjusted operating profit Sales Operating cash flow Strategic measures
30% 30% 20% 20%
2020 strategic measures will align with our continued efforts to accelerate the digital transformation of the company (10%), make the most of Pearson’s world of talent (5%) and create a simpler and more sustainable organisation (5%).
Targets are considered by the Board to be commercially sensitive and will be disclosed in the 2020 Directors’ remuneration report.
LTIP Long-term incentive planCoram Williams and John Fallon will not be eligible for an LTIP award in 2020.
The LTIP award level for the incoming CFO is 245% of base salary (which is the same award opportunity as for Coram Williams in 2017, 2018 and 2019), reflecting the 2017 discounts to LTIP awards in light of share price performance.
The Committee believes that a further reduction in the incoming CFO’s award level is not appropriate, beyond the discount already applied. This discount was set at a time when the share price was comparable to the current share price and the Committee considered that alignment between management and shareholders would be better supported by maintaining her level of grant at 245% of salary in 2020.
Performance metrics, weightings and targets Performance will continue to be tested over three years.
At the time of writing, the strategic goals for the company over the next three years were still under development by the Board. The targets for the 2020 LTIP grant will therefore be made available on the website before the AGM and disclosed in the RNS announcement accompanying the grant, which is expected to be in May as normal. The Committee remains committed to timely/prompt disclosure of targets once they have been confirmed.
Full details of the award will also be included in the annual remuneration report for 2020.
Chair and Non-Executive Director feesThe fees for the Reputation & Responsibility Committee have been increased to £15,000 and £8,000 to recognise the increasing responsibilities of that Committee. There will be no other changes to fees for 2020:
Role Fees for 2020
Chair of the Board £500,000
Base fee for Non-Executive Directors £70,000
Additional SID fee £22,000
Role Chair Member
Audit Committee £27,500 £15,000
Remuneration Committee £22,000 £10,000
Nomination & Governance Committee £15,000 £8,000
Reputation & Responsibility Committee £15,000 £8,000
The Directors’ remuneration report has been approved by the Board on 6 March 2020 and signed on its behalf by:
Elizabeth Corley Chair of the Remuneration Committee.
106 Pearson plc Annual report and accounts 2019
Additional disclosures
Pages 52–112 of this document comprise the Directors’ report for the year ended 31 December 2019.
Set out below is other statutory and regulatory information that Pearson is required to disclose in its Directors’ report.
Going concernThe Directors have made an assessment of the Group’s ability to continue as a going concern and consider it appropriate to adopt the going concern basis of accounting.
Viability statement As set out on p50, the Board has also reviewed the prospects of Pearson over the three-year period to December 2022 taking account of the company’s three-year plan, a ‘severe but plausible’ downside case and further stress-testing based on the principal risks set out from p40
Based on the results of these procedures, and considering the company’s strong balance sheet, the Directors have a reasonable expectation that Pearson will be able to continue in operation and meet its liabilities as they fall due over the three-year period ending December 2022. Further details of the Group’s liquidity are shown in the Financial review on p33
Share capitalDetails of share issues and cancellations are given in note 27 to the financial statements on p178. The company has a single class of shares which is divided into ordinary shares of 25p each. The ordinary shares are in registered form. As at 31 December 2019, 782,098,929 ordinary shares were in issue. At the AGM held on 26 April 2019, the company was authorised, subject to certain conditions, to acquire up to 78,141,414 ordinary shares by market purchase and to issue up to 520,942,760 ordinary shares. Shareholders will be asked to renew this authority at the AGM on 24 April 2020.
Share buybackIn December, we announced the sale of our 25% stake in Penguin Random House to Bertelsmann, generating total net proceeds of approximately $675m. The partial divestment of our stake in Penguin Random House was in line with our strategy for simplification and allowed us to create significant shareholder value through the synergies from the integration of the two businesses. Our stake in Penguin Random House will have generated c.£1.9bn in net disposal proceeds and dividends.
We have set out clear capital allocation priorities as follows:
Maintaining a strong balance sheet and solid investment-grade credit ratings through an appropriate capital structure. Accordingly, we intend to maintain a year-end net debt/EBITDA of less than 2.2x on a post IFRS 16 basis and 1.5x on a pre IFRS 16 basis.
Simplifying our portfolio and investing in the business to drive sustainable organic growth.
Delivering shareholder returns through a sustainable and progressive dividend policy, returning surplus cash to shareholders where appropriate through buybacks or special dividends.
In line with those priorities, the Board decided that we would use the proceeds from the transaction to maintain a strong balance sheet and invest in our business in addition to returning £350m of surplus capital to shareholders following the closing of the transaction.
The Board considered investor views on preferred methods of cash return, the amount being returned and other factors and concluded a share buyback was the most appropriate methodology to return that capital to our shareholders at that time.
We commenced a £350m share buyback programme on 16 January 2020. As of 3 March 2020, being the latest practicable date before the publication of this report, we had repurchased for cancellation 18,356,161 shares at an average price of 574 pence per share.
Major shareholdersInformation provided to the company pursuant to the Financial Conduct Authority’s Disclosure and Transparency Rules (DTR) is published on a Regulatory Information Service and on the company’s website.
As at 31 December 2019, the company had been notified under DTR 5 of the following holders of significant voting rights in its shares.
Number of voting rights
Percentage as at date of notification
Schroders plc 97,302,791 12.44%
Lindsell Train Limited 78,465,444 10.04%
Silchester International Investors LLP 77,889,093 9.98%
BlackRock, Inc. 50,946,154 6.51%
Ameriprise Financial, Inc. and its group 41,236,375 5.02%
Libyan Investment Authority1 24,431,000 3.01%
1 Based on notification to the company dated 7 June 2010. We have been notified of no change to this holding since that date. Assets belonging to, or owned, held or controlled on 16 September 2011 by the Libyan Investment Authority and located outside Libya on that date, are frozen in accordance with Article 5(4) of Regulation 2016/44 of the Council of the European Union.
107Overview Strategy Performance Governance Financial statements Other information
Additional disclosures
Between 31 December 2019 and 3 March 2020, being the latest practicable date before the publication of this report, the company received further notifications under DTR 5, with the most recent positions being as follows:
Number of voting rights
Percentage as at date of notification
Schroders plc 101,370,711 13.00%
Silchester International Investors LLP 85,106,480 11.00%
Annual General MeetingThe notice convening the AGM, to be held at 12 noon on Friday, 24 April 2020 at IET London, 2 Savoy Place, London WC2R 0BL, is contained in a circular to shareholders to be dated 23 March 2020.
Registered auditorsIn accordance with section 489 of the Act, a resolution proposing the reappointment of PricewaterhouseCoopers LLP as auditors to the company will be proposed at the AGM, at a level of remuneration to be agreed by the Audit Committee.
Amendment to Articles of AssociationAny amendments to the Articles of Association of the company (the Articles) may be made in accordance with the provisions of the Act by way of a special resolution.
Rights attaching to sharesThe rights attaching to the ordinary shares are defined in the Articles. A shareholder whose name appears on the company’s register of members can choose whether his/her shares are evidenced by share certificates (i.e. in certificated form) or held electronically (i.e. uncertificated form) in CREST (the electronic settlement system in the UK).
Subject to any restrictions below, shareholders may attend any general meeting of the company and, on a show of hands, every shareholder (or his/her representative) who is present at a general meeting has one vote on each resolution and, on a poll, every shareholder (whether an individual or a corporation) present in person or by proxy shall have one vote for every 25p of nominal share capital held. A resolution put to the vote at a general meeting is decided on a show of hands unless before, or on the declaration of the result of, a vote on a show of hands, a poll is demanded. A poll can be demanded by the Chair of the meeting, or by at least three shareholders (or their representatives) present in person and having the right to vote, or by any shareholders (or their representatives) present in person having at least 10% of the total voting rights of all shareholders, or by any shareholders (or their representatives) present in person holding ordinary shares on which an aggregate sum has been paid up of at least 10% of the total sum paid up on all ordinary shares. At this year’s AGM, voting will again be conducted on a poll, consistent with best practice.
Shareholders can declare a final dividend by passing an ordinary resolution but the amount of the dividend cannot exceed the amount recommended by the Board. The Board can pay interim dividends on any class of shares of the amounts and on the dates and for the periods they decide. In all cases, the distributable profits of the company must be sufficient to justify the payment of the relevant dividend.
The Board may, if authorised by an ordinary resolution of the shareholders, offer any shareholder the right to elect to receive new ordinary shares, which will be credited as fully paid, instead of their cash dividend.
Any dividend which has not been claimed for 12 years after it became due for payment will be forfeited and will then belong to the company, unless the Directors decide otherwise.
If the company is wound up, the liquidator can, with the sanction of a special resolution passed by the shareholders, divide among the shareholders all or any part of the assets of the company and he/she can value assets and determine how the division shall be carried out as between the shareholders or different classes of shareholders. The liquidator can also, with the same sanction, transfer the whole or any part of the assets to trustees upon such trusts for the benefit of the shareholders.
Voting at general meetingsAny form of proxy sent by the shareholders to the company in relation to any general meeting must be delivered to the company (via its registrars), whether in written or electronic form, not less than 48 hours before the time appointed for holding the meeting or adjourned meeting at which the person named in the appointment proposes to vote.
The Board may decide that a shareholder is not entitled to attend or vote either personally or by proxy at a general meeting or to exercise any other right conferred by being a shareholder if he/she or any person with an interest in shares has been sent a notice under section 793 of the Act (which confers upon public companies the power to require information with respect to interests in their voting shares) and he/she or any interested person failed to supply the company with the information requested within 14 days after delivery of that notice. The Board may also decide, where the relevant shareholding comprises at least 0.25% of the nominal value of the issued shares of that class, that no dividend is payable in respect of those default shares and that no transfer of any default shares shall be registered.
Pearson operates an employee benefit trust to hold shares, pending employees becoming entitled to them under the company’s employee share plans. There were 2,095,272 shares held as at 31 December 2019. The trust has an independent trustee which has full discretion in relation to the voting of such shares. A dividend waiver operates on the shares held in the trust.
108 Pearson plc Annual report and accounts 2019
Pearson also operates two nominee shareholding arrangements which hold shares on behalf of employees. There were 2,515,611 shares held in the Sharestore account and 902,514 shares held in the Global Nominee account as at 31 December 2019. The beneficial owners of shares held in Sharestore are invited to submit voting instructions online at www.shareview.co.uk and Global Nominee participants are invited to submit voting instructions by email to [email protected]. If no instructions are given by the beneficial owner by the date specified, the trustees holding these shares will not exercise the voting rights.
Transfer of sharesThe Board may refuse to register a transfer of a certificated share which is not fully paid, provided that the refusal does not prevent dealings in shares in the company from taking place on an open and proper basis. The Board may also refuse to register a transfer of a certificated share unless: (i) the instrument of transfer is lodged, duly stamped (if stampable), at the registered office of the company or any other place decided by the Board, and is accompanied by the certificate for the share to which it relates and such other evidence as the Board may reasonably require to show the right of the transferor to make the transfer; (ii) it is in respect of only one class of shares; and (iii) it is in favour of not more than four transferees.
Transfers of uncertificated shares must be carried out using CREST and the Board can refuse to register a transfer of an uncertificated share in accordance with the regulations governing the operation of CREST.
Variation of rightsIf at any time the capital of the company is divided into different classes of shares, the special rights attaching to any class may be varied or revoked either:
(i) with the written consent of the holders of at least 75% in nominal value of the issued shares of the relevant class or
(ii) with the sanction of a special resolution passed at a separate general meeting of the holders of the shares of the relevant class.
Without prejudice to any special rights previously conferred on the holders of any existing shares or class of shares, any share may be issued with such preferred, deferred or other special rights, or such restrictions, whether in regard to dividend, voting, return of capital or otherwise as the company may from time to time by ordinary resolution determine.
Appointment and replacement of DirectorsThe Articles contain the following provisions in relation to Directors.
Directors shall be no less than two in number. Directors may be appointed by the company by ordinary resolution or by the Board. A Director appointed by the Board shall hold office only until the next AGM and shall then be eligible for reappointment, but shall not be taken into account in determining the Directors or the number of Directors who are to retire by rotation at that meeting. The Board may from time to time appoint one or more Directors to hold Executive office with the company for such period (subject to the provisions of the Act) and upon such terms as the Board may decide and may revoke or terminate any appointment so made.
The Articles provide that, at every AGM of the company, at least one-third of the Directors shall retire by rotation (or, if their number is not a multiple of three, the number nearest to one-third). The first Directors to retire by rotation shall be those who wish to retire and not offer themselves for re-election. Any further Directors so to retire shall be those of the other Directors subject to retirement by rotation who have been longest in office since they were last re-elected but, as between persons who became or were last re-elected on the same day, those to retire shall (unless they otherwise agree among themselves) be determined by lot. In addition, any Director who would not otherwise be required to retire shall retire by rotation at the third AGM after they were last re-elected.
Notwithstanding the provisions of the Articles, the Board has resolved that all Directors should offer themselves for re-election annually, in accordance with the UK Corporate Governance Code (the Code).
The company may by ordinary resolution remove any Director before the expiration of his/her term of office. In addition, the Board may terminate an agreement or arrangement with any Director for the provision of his/her services to the company.
Powers of the DirectorsSubject to the Articles, the Act and any directions given by special resolution, the business of the company will be managed by the Board who may exercise all the powers of the company, including powers relating to the issue and/or buying back of shares by the company (subject to any statutory restrictions or restrictions imposed by shareholders in a general meeting).
109Overview Strategy Performance Governance Financial statements Other information
Directors’ indemnitiesA qualifying third-party indemnity (QTPI), as permitted by the Articles and sections 232 and 234 of the Act, has been granted by the company to each of its Directors. Under the provisions of the QTPI, the company undertakes to indemnify each Director against liability to third parties (excluding criminal and regulatory penalties) and to pay Directors’ costs as incurred, provided that they are reimbursed to the company if the Director is found guilty, the court refuses to grant the relief sought or, in an action brought by the company, judgement is given against the Director. The indemnity has been in force for the financial year ended 31 December 2019 and is currently in force. The company has purchased and maintains Directors’ and Officers’ insurance cover against certain legal liabilities and costs for claims in connection with any act or omission by such Directors and Officers in the execution of their duties.
Significant agreementsThe following significant agreements contain provisions entitling the counterparties to exercise termination or other rights in the event of a change of control of the company.
At 31 December 2019, the Group had a $1,190m revolving credit facility agreement dated August 2014 (amended February 2019) which matures in February 2024 between, among others, the company, Barclays Bank plc (Agent) and the banks and financial institutions named therein as lenders (the Facility), under which any such bank may, upon a change of control of the company, require its outstanding advances, together with accrued interest and any other amounts payable in respect of such Facility, and its commitments, to be cancelled, each within 60 days of notification to the banks by the Agent. For these purposes, a ‘change of control’ occurs if the company becomes a subsidiary of any other company, or one or more persons acting either individually or in concert obtains control (as defined in section 1124 of the Corporation Tax Act 2010) of the company.
Shares acquired through the company’s employee share plans rank pari passu with shares in issue and have no special rights. For legal and practical reasons, the rules of these plans set out the consequences of a change of control of the company.
Other statutory informationOther information that is required by the Companies Act 2006 (the Act) and by the Large and Medium-sized Companies and Groups (Accounts and Reports) Regulations 2008 (as amended) to be included in the Directors’ report, and which is incorporated by reference, can be located as follows:
Summary disclosures index See more
Dividend recommendation p30
Financial instruments and financial risk management p165
Important events since year end p34
Future development of the business p6
Research and development activities p27
Employment of disabled persons p22
Employee involvement p21
Greenhouse gas emissions p22
Statement describing employee engagement p28
Statement describing regard to suppliers, customers and other stakeholders’ interests p28
With the exception of the dividend waiver described on p108 there is no information to be disclosed in accordance with Listing Rule 9.8.4.
No political donations or contributions were made or expenditure incurred by the company or its subsidiaries during the year.
Fair, balanced and understandable reporting and disclosure of informationAs required by the Code, we have established arrangements to ensure that all information we report to investors and regulators is fair, balanced and understandable. A process and timetable for the production and approval of this year’s report was agreed by the Board at its meeting in December 2019. The full Board then had the opportunity to review and comment on the report as it progressed.
Representatives from financial reporting, corporate affairs, company secretarial, legal and internal audit, compliance and risk are involved in the preparation and review of the annual report to ensure a cohesive and balanced approach and, as with all of our financial reporting, our Verification Committee conducts a thorough verification of narrative and financial statements. We also have procedures in place to ensure the timely release of inside information, through our Market Disclosure Committee.
Additional disclosures
110 Pearson plc Annual report and accounts 2019
The Audit Committee is also available to advise the Board on certain aspects of the report, to enable the Directors to fulfil their responsibility in this regard. The Directors consider that the annual report and accounts, taken as a whole, is fair, balanced and understandable and provides the information necessary for shareholders to assess the company’s position, performance, business model and strategy.
The Directors also confirm that, for each Director in office at the date of this report:
so far as the Director is aware, there is no relevant audit information of which the Group and company’s auditors are unaware
they have taken all the steps that they ought to have taken as Directors in order to make themselves aware of any relevant audit information and to establish that the Group and the company’s auditors are aware of that information.
Directors in officeThe following Directors were in office during the year and up until the signing of the financial statements:
E P L Corley M M Lynton
S L Coutu (appointed on 1 May 2019) G D Pitkethly (appointed on 1 May 2019)
V Cox T Score
J J Fallon S Taurel
S J Lewis L A Wallen
L K Lorimer C Williams
The Directors’ report has been approved by the Board on 6 March 2020 and signed on its behalf by:
Stephen JonesCompany Secretary
111Overview Strategy Performance Governance Financial statements Other information
Statement of Directors’ responsibilities
Statement of Directors’ responsibilities The Directors are responsible for preparing the annual report and the financial statements in accordance with applicable law and regulation.
Company law requires the Directors to prepare financial statements for each financial year. Under that law, the Directors have prepared the Group and company financial statements in accordance with International Financial Reporting Standards (IFRSs) as adopted by the European Union. Under company law, the Directors must not approve the financial statements unless they are satisfied that they give a true and fair view of the state of affairs of the Group and company and of the profit or loss of the Group for that period. In preparing the financial statements, the Directors are required to:
select suitable accounting policies and then apply them consistently
state whether applicable IFRSs as adopted by the European Union have been followed for the Group and company financial statements, subject to any material departures disclosed and explained in the financial statements
make judgements and accounting estimates that are reasonable and prudent
prepare the financial statements on the going concern basis unless it is inappropriate to presume that the Group and company will continue in business.
The Directors are responsible for keeping adequate accounting records that are sufficient to show and explain the Group and company’s transactions and disclose with reasonable accuracy at any time the financial position of the Group and company and enable them to ensure that the financial statements and the Directors’ remuneration report comply with the Companies Act 2006 and, as regards the Group financial statements, Article 4 of the IAS Regulation.
The Directors are also responsible for safeguarding the assets of the Group and company and hence for taking reasonable steps for the prevention and detection of fraud and other irregularities.
The Directors are responsible for the maintenance and integrity of the company’s website. Legislation in the United Kingdom governing the preparation and dissemination of financial statements may differ from legislation in other jurisdictions.
Each of the Directors, whose names and functions are listed on p54–56, confirms that, to the best of their knowledge:
the Group and company financial statements, which have been prepared in accordance with IFRSs as adopted by the European Union, give a true and fair view of the assets, liabilities, financial position and profit of the Group and company
the Strategic report contained in the annual report includes a fair review of the development and performance of the business and the position of the Group and company, together with a description of the principal risks and uncertainties that they face.
This responsibility statement has been approved by the Board on 6 March 2020 and signed on its behalf by:
Coram Williams Chief Financial Officer
112 Pearson plc Annual report and accounts 2019

Financial statements
Consolidated financial statements114 Independent auditors’ report to the
members of Pearson plc
122 Consolidated income statement
123 Consolidated statement of comprehensive income
124 Consolidated balance sheet
126 Consolidated statement of changes in equity
127 Consolidated cash flow statement
Notes to the consolidated financial statements128 1 Accounting policies
137 2 Segment information
139 3 Revenue from contracts with customers
144 4 Operating expenses
146 5 Employee information
146 6 Net finance costs
147 7 Income tax
148 8 Earnings per share
151 9 Dividends
151 10 Property, plant and equipment
152 11 Intangible assets
155 12 Investments in joint ventures and associates
157 13 Deferred income tax
158 14 Classification of financial instruments
160 15 Other financial assets
160 16 Derivative financial instruments and hedge accounting
163 17 Cash and cash equivalents (excluding overdrafts)
164 18 Financial liabilities – borrowings
165 19 Financial risk management
168 20 Intangible assets – pre-publication
168 21 Inventories
169 22 Trade and other receivables
170 23 Provisions for other liabilities and charges
170 24 Trade and other liabilities
171 25 Retirement benefit and other post-retirement obligations
177 26 Share-based payments
178 27 Share capital and share premium
179 28 Treasury shares
179 29 Other comprehensive income
180 30 Business combinations
181 31 Disposals
182 32 Held for sale
183 33 Cash generated from operations
184 34 Contingencies and commitments
184 35 Leases
187 36 Related party transactions
187 37 Events after the balance sheet date
187 38 Accounts and audit exemptions
Company financial statements188 Company balance sheet
189 Company statement of changes in equity
190 Company cash flow statement
191 Notes to the company financial statements
In this section
113Overview Strategy Performance Governance Financial statements Other information
Report on the audit of the financial statementsOpinionIn our opinion, Pearson plc’s consolidated financial statements and company financial statements (the “financial statements”):
give a true and fair view of the state of the Group’s and of the company’s affairs at 31 December 2019 and of the Group’s profit and the Group’s and the company’s cash flows for the year then ended;
have been properly prepared in accordance with International Financial Reporting Standards (IFRSs) as adopted by the European Union and, as regards the company financial statements, as applied in accordance with the provisions of the Companies Act 2006; and
have been prepared in accordance with the requirements of the Companies Act 2006 and, as regards the consolidated financial statements, Article 4 of the IAS Regulation.
We have audited the financial statements, included within the Annual Report and Accounts (the “Annual Report”), which comprise: the consolidated and company balance sheets at 31 December 2019; the consolidated income statement and consolidated statement of comprehensive income, the consolidated and company cash flow statements and the consolidated and company statements of changes in equity for the year then ended; and the notes to the financial statements, which include a description of the significant accounting policies.
Our opinion is consistent with our reporting to the Audit Committee.
Basis for opinionWe conducted our audit in accordance with International Standards on Auditing (UK) (“ISAs (UK)”) and applicable law. Our responsibilities under ISAs (UK) are further described in the auditors’ responsibilities for the audit of the financial statements section of our report. We believe that the audit evidence we have obtained is sufficient and appropriate to provide a basis for our opinion.
IndependenceWe remained independent of the Group in accordance with the ethical requirements that are relevant to our audit of the financial statements in the UK, which includes the FRC’s Ethical Standard, as applicable to listed public interest entities, and we have fulfilled our other ethical responsibilities in accordance with these requirements.
To the best of our knowledge and belief, we declare that non-audit services prohibited by the FRC’s Ethical Standard were not provided to the Group or to the company.
Other than those disclosed in note 4 to the consolidated financial statements, we have provided no non-audit services to the Group or to the company in the period from 1 January 2019 to 31 December 2019.
Independent auditors’ report to the members of Pearson plc
Our audit approach
OverviewMateriality Overall Group materiality: £27 million (2018: £25 million) based on approximately 5% of adjusted profit before tax.
Overall company materiality: £49 million (2018: £45 million) based on approximately 1% of net assets.
Audit scope We conducted work in four key territories, being the UK, US, Brazil and Italy. This included full scope audits at four reporting components and specific audit procedures at a further eight components. In addition, we obtained an audit opinion on the financial information reported by the US component of the Group’s associate, Penguin Random House.
The territories where we conducted audit procedures, together with work performed at corporate functions and at the Group level, accounted for approximately: 73% of the Group’s revenue; 73% of the Group’s statutory profit before tax; and 73% of the Group’s adjusted profit before tax.
Areas of focus for the 2019 audit were as follows: Carrying values of goodwill and acquired intangible assets (Group) Returns provisioning (Group) Recoverability of pre-publication assets (Group) Provisions for uncertain tax positions (Group) Finance transformation (Group) Disposals (Group) Risk of fraud in revenue recognition (Group) Carrying values of investments in subsidiaries (company)
Materiality
Audit scope
Areas offocus
114 Pearson plc Annual report and accounts 2019
The scope of our auditAs part of designing our audit, we determined materiality and assessed the risks of material misstatement in the financial statements.
Capability of the audit in detecting irregularities, including fraudBased on our understanding of the Group and the industry in which it operates, we identified that the principal risks of non-compliance with laws and regulations related to failure to comply with UK and international tax regulations and we considered the extent to which non-compliance might have a material effect on the financial statements. We also considered those laws and regulations that have a direct impact on the preparation of the financial statements such as the Companies Act 2006. We evaluated management’s incentives and opportunities for fraudulent manipulation of the financial statements (including the risk of override of controls) and determined that the principal risks were related to posting inappropriate journal entries, management bias in accounting for estimates including estimates relating to revenue recognition and manipulation of cut-off of shipments at major warehouse locations. The Group engagement team shared this risk assessment with the component auditors so that they could include appropriate audit procedures in response to such risks in their work. Audit procedures performed by the Group engagement team and/or component auditors included:
Discussions with management, internal audit and the Group’s legal advisors, including consideration of known or suspected instances of non-compliance with laws and regulations and fraud;
Evaluation of the effectiveness of management’s controls designed to prevent and detect irregularities;
Identification and testing of significant manual journal entries; and
Testing of assumptions and judgements made by management in making significant accounting estimates.
There are inherent limitations in the audit procedures described above and the further removed non-compliance with laws and regulations is from the events and transactions reflected in the financial statements, the less likely we would become aware of it. Also, the risk of not detecting a material misstatement due to fraud is higher than the risk of not detecting one resulting from error as fraud may involve deliberate concealment by, for example, forgery or intentional misrepresentations or through collusion.
115Overview Strategy Performance Governance Financial statements Other information
Independent auditors’ report to the members of Pearson plc
Significant issues considered by the Audit Committee
Key audit matter How our audit addressed the key audit matter
Carrying values of goodwill and acquired intangible assetsRefer to note 11 in the consolidated financial statements.
The Group recorded goodwill of £2,139m (2018: £2,111m) and acquired intangible assets of £310m (2018: £451m) at 31 December 2019, including acquired customer lists, contracts and relationships, acquired trademarks and brands and acquired publishing rights.
The carrying values of goodwill and intangible assets are dependent on estimates of future cash flows of the underlying cash generating units (CGUs) and there is a risk that if management does not achieve these cash flow estimates it could give rise to further impairment charges. This risk increases in periods when the Group’s trading performance and projections do not meet expectations.
The impairment reviews performed by management contain a number of significant judgements and estimates. Changes in these assumptions can result in materially different impairment charges or available headroom.
In addition, management has changed the level at which certain reporting units are monitored and reported in 2019 as a result of the continued roll-out of the Group’s new ERP system and following the disposal of the US K12 Courseware business, thereby requiring a change in CGU determination and a reallocation of goodwill to the new CGU groupings.
An impairment charge of £65m has been recorded in 2019 relating to Brazil which has been applied against Brazil’s acquired intangible assets.
We tested management’s CGU reassessment and reallocation of goodwill within these newly defined CGUs and we evaluated the methodology applied by management to reallocate goodwill. We assessed whether return on asset measures encompassing goodwill are monitored or measured at a level lower than management’s revised CGU groupings.
We obtained management’s value in use impairment model at 31 December 2019 and we tested its mathematical integrity, including validating forecasts and carrying values included in management’s model.
Our procedures have been focused on the North American Courseware, OPM, Core and Brazil CGUs where headroom is lower or more sensitive to changes in key assumptions.
We agreed the forecast cash flows to Board approved budgets and strategic plans and we assessed how these budgets and strategic plans are compiled. We evaluated management’s related judgements and estimates, including short-term revenue and operating profit growth rates, cash conversion, corporate cost allocations and restructuring savings. We compared management’s forecasts and key assumptions to industry projections and comparable companies where this information was available.
Management has applied a longer forecast period extending until 2030 for specific cash flow projections for the OPM CGU compared to the three year period covered by the Group’s strategic planning process, which is applied to all other CGUs. We evaluated the rationale why a longer period was appropriate for OPM and why management was able to prepare reliable forecasts over the longer-term.
We deployed valuations experts to assess the perpetuity growth rate and discount rate for each CGU by comparison with third party information, past performance and relevant risk factors. We compared management’s valuations with third party valuations implied by trading and transaction multiples of the Group’s competitors where this information was available for specific CGUs.
Where an impairment was identified by management relating to the Brazil CGU based on value in use, we tested the calculation of the impairment charge and we ensured that the fair value less costs of disposal would not give rise to a higher recoverable amount for this CGU.
We performed our own independent sensitivity analyses to understand the impact of reasonably possible changes to key assumptions. We assessed the appropriateness of management’s decision to provide additional disclosures about sensitivities in note 11 of the financial statements in relation to the North American Courseware, OPM, Core and Brazil CGUs. More broadly, we considered whether the disclosures in note 11 complied with IAS 36.
Based on the procedures performed, we noted no material issues arising from our work.
Key audit mattersKey audit matters are those matters that, in the auditors’ professional judgement, were of most significance in the audit of the financial statements of the current period and include the most significant assessed risks of material misstatement (whether or not due to fraud) identified by the auditors, including those which had the greatest effect on: the overall audit strategy; the allocation of resources in the audit; and directing the efforts of the engagement team. These matters, and any comments we make on the results of our procedures thereon, were addressed in the context of our audit of the financial statements as a whole and in forming our opinion thereon and we do not provide a separate opinion on these matters. This is not a complete list of all risks identified by our audit.
116 Pearson plc Annual report and accounts 2019

Key audit matter How our audit addressed the key audit matter
Returns provisioningRefer to notes 3 and 24 in the consolidated financial statements.
The Group has provided £122m (2018: £173m) for sales returns at 31 December 2019. The most significant exposure to potential returns within the Group arises in the US Higher Education Courseware business. Trends in the US market, including the growth of textbook rentals and the availability of free online content, continue to affect this business and have the potential to impact returns levels if shipping practices and arrangements with retailers are not managed in response to these trends.
Management provides for returns based on past experience by customer and channel. In 2019, management changed its methodology to apply a two year historical returns average compared to three years previously in response to market changes and related changes to customer buying patterns.
We assessed management’s evaluation of market trends and the Group’s responses and we considered whether management’s revised provisioning methodology is appropriate in this context.
We tested the returns provision calculations at 31 December 2019 and we agreed inputs including historical sales and actual returns experience to underlying records. We performed detailed testing over shipment and returns levels around the year-end and we evaluated whether these gave rise to an increased risk of future returns. We considered the reduction in the provision for sales returns in 2019 by reference to the related reduction in US Higher Education Courseware sales.
We evaluated whether management had adopted methods and reached estimates for future returns that were supportable and appropriate.
Based on the procedures performed, we noted no material issues arising from our work.
Recoverability of pre-publication assetsRefer to note 20 in the consolidated financial statements.
The Group holds £870m (2018: £817m) of pre-publication assets at 31 December 2019. Pre-publication assets represent direct costs incurred in the development of education platforms, programmes and titles prior to their public release.
Judgement is required to assess the recoverability of the carrying value of these assets. This judgement is further complicated by the transition to digital as the Group invests in new, less proven, inter-linked digital content and platforms.
We assessed the appropriateness of capitalisation and amortisation policies and we considered whether these policies had been consistently applied. We selected a sample of costs to test their magnitude and appropriateness for capitalisation. We evaluated the reasonableness of amortisation periods and profiles compared to sales forecasts and historical sales experience, including considering the impact of the transition towards digital products.
We challenged the carrying value of certain pre-publication assets where products are yet to be launched, are less proven or where sales are lower than originally anticipated.
We assessed forecast cash flows against historical experience and we obtained supporting evidence for management’s explanations.
Based on the procedures performed, we noted no material issues arising from our work.
Provisions for uncertain tax positionsRefer to notes 7 and 34 in the consolidated financial statements.
The Group is subject to several tax regimes due to the geographical diversity of its businesses. At 31 December 2019, the Group held provisions for uncertain tax positions of £152m (2018: £181m).
Management is required to exercise significant judgement in determining the appropriate amount to provide in respect of potential tax exposures and uncertain tax positions. The most significant provisions relate to US tax, transfer pricing and tax on prior year disposals. In addition, there are material unprovided tax exposures related to EU state aid and a Brazilian tax authority assessment related to goodwill amortisation deductions.
Changes in assumptions about the views that might be taken by tax authorities can materially impact the level of provisions recorded in the consolidated financial statements.
We engaged our tax specialists in the US and UK and we obtained an understanding of the Group’s tax strategy and risks. We assessed the tax impact of business developments in 2019, including the disposal of the US K12 Courseware business and internal refinancing transactions. We recalculated the Group’s tax provisions and determined whether the treatments adopted were in line with the Group’s tax policies and had been applied consistently.
We evaluated the key underlying assumptions, particularly in the US and UK. In making this evaluation, we considered the status of tax authority audits and enquiries. We considered the basis and support in particular for provisions not subject to tax audit in comparison with our experience of similar situations at comparable companies. We evaluated whether any risk of material misstatement existed for uncertain tax position provisioning outside of the US and UK.
We evaluated the consistency of management’s approach to establishing or changing prior provision estimates and we validated that changes in prior provisions reflected a change in facts and circumstances during 2019. Where provisions have not been established, including for material potential exposures like EU state aid and the assessment from the Brazilian tax authority, we evaluated the basis for management’s judgements, including an assessment of the treatment of similar exposures at comparable companies. We evaluated third party advice obtained by the Group as we independently formed our own view about the likelihood of these possible tax risks crystallising in future cash outflows.
We noted that the assumptions and judgements required to formulate these provisions mean that the range of possible outcomes is broad. We evaluated the disclosures in notes 7 and 34 in relation to uncertain tax provisions and we considered whether the disclosures were consistent with the underlying positions and with the requirements of IAS 1 and IAS 12. In addition, we considered the Group’s application of IFRIC 23 with effect from 1 January 2019.
Based on the procedures performed, we noted no material issues arising from our work.
117Overview Strategy Performance Governance Financial statements Other information

Key audit matter How our audit addressed the key audit matter
Finance transformationThe Group has continued to implement significant change across its finance function in 2019 with the continued roll-out of The Enabling Programme (TEP) and the organisational change resulting from implementing the target operating model. The ERP system roll-out continued in 2019 with certain US businesses going live and finance transaction processing activities were migrated to offshore shared service centres.
This change represents a risk as controls and processes that have been established and embedded over a number of years are changed and migrated to the new ERP system environment and into new shared service centres. There is an increased risk of break-down in internal control during the transition.
We centrally managed the work performed by component audit teams at Pearson Finance Services and in migrating markets like the US, which consisted of controls and substantive transaction testing, and we conducted oversight visits to key sites impacted by the transformation activities to direct the work performed.
We evaluated the design and tested the operating effectiveness of key automated and manual controls after the migration including IT general controls and controls in respect of data migration into the new ERP system environment. We also tested balance sheet reconciliations for migrating entities to identify any migration issues. Where issues were identified, we performed testing of compensating controls and we increased the level of substantive transaction testing to address any residual risk.
DisposalsRefer to note 31 in the consolidated financial statements.
In March 2019, the Group completed the disposal of its US K12 Courseware business, resulting in a pre-tax profit of £13m. Total proceeds amounted to £200m of which £180m is deferred.
Accounting for the transaction required management judgement and estimation to establish the fair value of the deferred proceeds related to an unconditional vendor note for $225m and an entitlement to 20% of future cash flows to equity holders and to 20% of net proceeds in the event of a subsequent sale of K12. Changes to the assumptions applied by management in establishing the fair value of the deferred proceeds could have a material effect on the profit on disposal.
We reviewed the sale agreement and we vouched the cash received. We assessed the net assets disposed by reference to the audited balance sheet of K12 at 31 December 2018, understanding and evaluating any subsequent movements in key balances. We validated the cash held on the completion balance sheet and we recalculated management’s goodwill allocation. We tested a sample of the transaction costs.
We focused our assessment on the valuation of the deferred proceeds at the date of disposal. The vendor note and earn-out receivables are measured at fair value which is calculated as the present value of the expected future cash flows, meaning that the fair value is impacted by both the quantum and timing of any future payments from the vendor. We assessed management’s assumptions related to the expected payment profile of the vendor note, the expected timing of the vendor’s potential exit and the estimated equity value of K12 at that time. We compared management’s assumptions against external evidence where available. We performed our own independent sensitivity analyses to understand the impact of reasonably possible changes in the key assumptions.
We deployed our treasury specialists to test the appropriateness of the discount rate used to present value the future cash flows and to assess management’s classification of these receivables as fair value through profit and loss as defined by IFRS 9.
We have subsequently tested management’s remeasurement and disclosure of these receivables at 31 December 2019.
We separately considered management’s decision to classify Penguin Random House (PRH) as held for sale at year-end and whether the announcement of the sale of the Group’s stake in December 2019 crystallised any impairment, comparing the carrying value of PRH’s net assets with the contracted disposal proceeds.
Based on the procedures performed, we noted no material issues arising from our work.
Risk of fraud in revenue recognitionRefer to note 3 in the consolidated financial statements.
Certain of the Group’s businesses in the US and UK enter into long-term contracts that span year-end, where revenue is recognised using estimated percentage of completion based on costs. These include contracts to design, develop and deliver testing and accreditation services.
These contracts generate material deferred revenue balances and changes to the underlying assumptions or estimation calculations could have a material effect on the consolidated financial statements.
For a selection of the larger, more judgemental and more recent long-term contracts, covering both assessment activities and online delivery of teaching, we read the contracts and we assessed the accounting methodologies being applied to calculate the proportion of revenue being recognised in 2019. We considered whether management’s revenue recognition practices are in accordance with Group policies and related accounting standards and have been consistently applied.
We tested costs incurred to date and management’s estimates of forecast costs and revenues by reference to historical experience and current contract status. We recalculated management’s percentage of completion estimates and we performed look-back tests to assess management’s historical accuracy of forecasting for these types of arrangement.
In addition, we performed manual journals testing focusing on unusual or unexpected entries to revenue.
Based on the procedures performed, we noted no material issues arising from our work.
Independent auditors’ report to the members of Pearson plc
118 Pearson plc Annual report and accounts 2019
How we tailored the audit scopeWe tailored the scope of our audit to ensure that we performed enough work to be able to give an opinion on the financial statements as a whole, taking into account the structure of the Group and the company, the accounting processes and controls and the industry in which they operate.
The consolidated financial statements are a consolidation of 565 reporting units, each of which is considered to be a component. We identified four components in the UK, US and Italy that required a full scope audit due to their size. Audit procedures over specific financial statement line items were performed at a further eight components in the UK, US and Brazil to achieve appropriate audit coverage. In addition, we obtained an audit opinion on the financial information reported by the US component of the Group’s associate, Penguin Random House.
In establishing the overall approach to the Group audit, we determined the type of work that needed to be performed at the components by us, as the Group engagement team, or component auditors within PwC UK and from other PwC network firms operating under our instruction. Where the work was performed by component auditors, we determined the level of involvement we needed to have in the audit work at those reporting units to be able to conclude whether sufficient appropriate audit evidence had been obtained as a basis for our opinion on the consolidated financial statements as a whole.
We performed full scope audits in respect of NCS Pearson, Pearson Education US, Pearson Education UK, Pearson Italy and Penguin Random House US.
We performed specified procedures at a further eight components over financial statement line items including revenue, trade and other receivables and deferred income, cash, intangible assets, accruals, provisions for returns, product development and amortisation, fixed assets and depreciation, cost of sales and operating expenses.
This ensured that sufficient and appropriate audit procedures were performed to achieve sufficient coverage over these financial statement line items.
In addition to instructing and reviewing the reporting from our component audit teams, we conducted visits to component teams in the US (New York and Minneapolis), Italy, Brazil and the UK (Belfast) which included file reviews and attendance at key meetings with local management. We also had regular dialogue with component teams throughout the year.
The Group consolidation, financial statement disclosures and corporate functions were audited by the Group engagement team. This included our work over taxation, goodwill and acquired intangible assets, post-retirement benefits and major transactions.
Taken together, the components and corporate functions where we conducted audit procedures accounted for approximately 73% of the Group’s revenue, 73% of the Group’s statutory profit before tax and 73% of the Group’s adjusted profit before tax. This provided the evidence we needed for our opinion on the consolidated financial statements taken as a whole. This was before considering the contribution to our audit evidence from performing audit work at the Group level, including disaggregated analytical review procedures, which covered certain of the Group’s smaller and lower risk components that were not directly included in our Group audit scope.
MaterialityThe scope of our audit was influenced by our application of materiality. We set certain quantitative thresholds for materiality. These, together with qualitative considerations, helped us to determine the scope of our audit and the nature, timing and extent of our audit procedures on the individual financial statement line items and disclosures and in evaluating the effect of misstatements, both individually and in aggregate on the financial statements as a whole.
Key audit matter How our audit addressed the key audit matter
Carrying values of investments in subsidiariesRefer to note 2 in the company financial statements.
The company holds investments in subsidiaries amounting to £6,664m (2018: £6,710m) at 31 December 2019.
Investments in subsidiaries are accounted for at cost less provision for impairment in the company balance sheet. Investments are tested for impairment if impairment indicators exist. If such indicators exist, the recoverable amounts of investments in subsidiaries are estimated in order to determine the extent of the impairment loss, if any. Any such impairment loss is recognised in the income statement.
The impairment assessment was identified as a key audit matter given the size of the underlying investment carrying values and the differential to the Group’s market capitalisation. Further impairment indicators were identified in connection with certain of the investments in subsidiaries due to the carrying value of investments exceeding their net assets. The assessment required the application of management judgement, particularly in determining whether any impairment indicators have arisen that trigger the need for an impairment assessment and in assessing whether the carrying value of each investment can be supported by the recoverable amount. Changes to these judgements and estimates could have a material impact on the company financial statements.
We evaluated management’s assessment whether any indicators of impairment existed by comparing the carrying values of investments in subsidiaries with their net assets at 31 December 2019.
For investments where the net assets were lower than the carrying values, we assessed their recoverable value by reference to the value in use of the investments compared to their carrying values at 31 December 2019. Where applicable, we verified that the recoverable values of investments were consistent with the recoverable values of the related CGUs tested for goodwill impairment purposes, leveraging the audit work undertaken as part of the Group audit.
We separately evaluated the difference between the investment carrying values and the Group’s market capitalisation.
Based on the procedures performed, we noted no material issues arising from our work.
119Overview Strategy Performance Governance Financial statements Other information
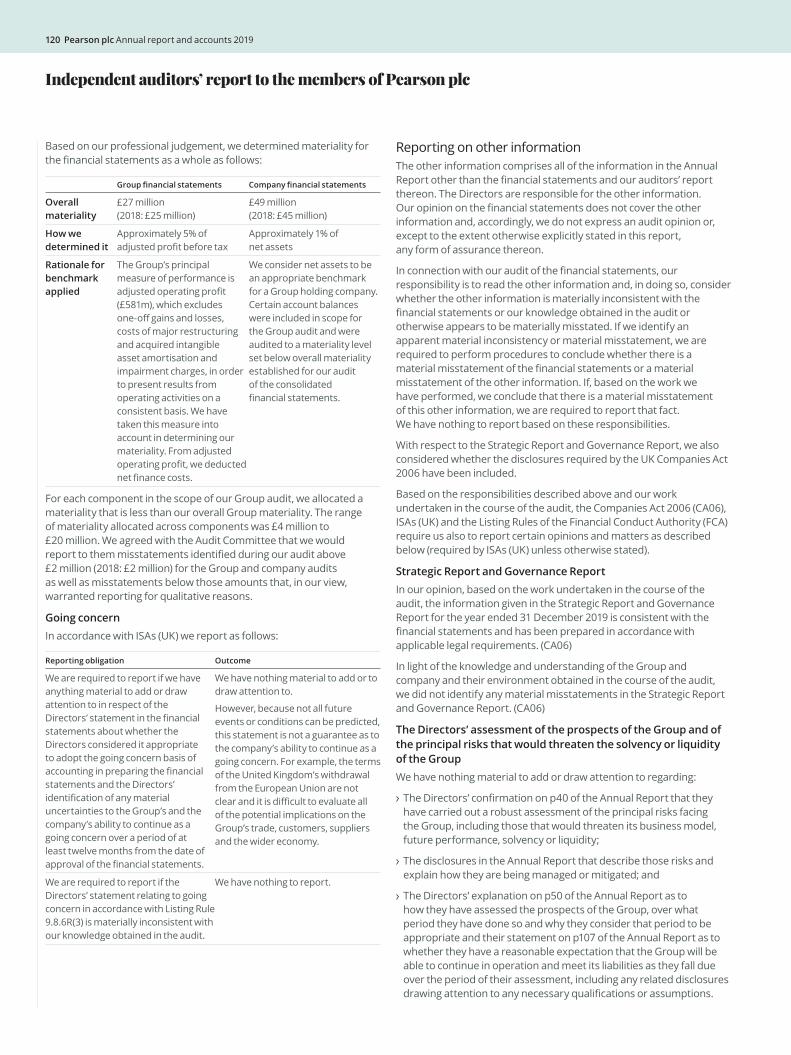
Based on our professional judgement, we determined materiality for the financial statements as a whole as follows:
Group financial statements Company financial statements
Overall materiality
£27 million (2018: £25 million)
£49 million (2018: £45 million)
How we determined it
Approximately 5% of adjusted profit before tax
Approximately 1% of net assets
Rationale for benchmark applied
The Group’s principal measure of performance is adjusted operating profit (£581m), which excludes one-off gains and losses, costs of major restructuring and acquired intangible asset amortisation and impairment charges, in order to present results from operating activities on a consistent basis. We have taken this measure into account in determining our materiality. From adjusted operating profit, we deducted net finance costs.
We consider net assets to be an appropriate benchmark for a Group holding company. Certain account balances were included in scope for the Group audit and were audited to a materiality level set below overall materiality established for our audit of the consolidated financial statements.
For each component in the scope of our Group audit, we allocated a materiality that is less than our overall Group materiality. The range of materiality allocated across components was £4 million to £20 million. We agreed with the Audit Committee that we would report to them misstatements identified during our audit above £2 million (2018: £2 million) for the Group and company audits as well as misstatements below those amounts that, in our view, warranted reporting for qualitative reasons.
Going concernIn accordance with ISAs (UK) we report as follows:
Reporting obligation Outcome
We are required to report if we have anything material to add or draw attention to in respect of the Directors’ statement in the financial statements about whether the Directors considered it appropriate to adopt the going concern basis of accounting in preparing the financial statements and the Directors’ identification of any material uncertainties to the Group’s and the company’s ability to continue as a going concern over a period of at least twelve months from the date of approval of the financial statements.
We have nothing material to add or to draw attention to.
However, because not all future events or conditions can be predicted, this statement is not a guarantee as to the company’s ability to continue as a going concern. For example, the terms of the United Kingdom’s withdrawal from the European Union are not clear and it is difficult to evaluate all of the potential implications on the Group’s trade, customers, suppliers and the wider economy.
We are required to report if the Directors’ statement relating to going concern in accordance with Listing Rule 9.8.6R(3) is materially inconsistent with our knowledge obtained in the audit.
We have nothing to report.
Reporting on other information The other information comprises all of the information in the Annual Report other than the financial statements and our auditors’ report thereon. The Directors are responsible for the other information. Our opinion on the financial statements does not cover the other information and, accordingly, we do not express an audit opinion or, except to the extent otherwise explicitly stated in this report, any form of assurance thereon.
In connection with our audit of the financial statements, our responsibility is to read the other information and, in doing so, consider whether the other information is materially inconsistent with the financial statements or our knowledge obtained in the audit or otherwise appears to be materially misstated. If we identify an apparent material inconsistency or material misstatement, we are required to perform procedures to conclude whether there is a material misstatement of the financial statements or a material misstatement of the other information. If, based on the work we have performed, we conclude that there is a material misstatement of this other information, we are required to report that fact. We have nothing to report based on these responsibilities.
With respect to the Strategic Report and Governance Report, we also considered whether the disclosures required by the UK Companies Act 2006 have been included.
Based on the responsibilities described above and our work undertaken in the course of the audit, the Companies Act 2006 (CA06), ISAs (UK) and the Listing Rules of the Financial Conduct Authority (FCA) require us also to report certain opinions and matters as described below (required by ISAs (UK) unless otherwise stated).
Strategic Report and Governance ReportIn our opinion, based on the work undertaken in the course of the audit, the information given in the Strategic Report and Governance Report for the year ended 31 December 2019 is consistent with the financial statements and has been prepared in accordance with applicable legal requirements. (CA06)
In light of the knowledge and understanding of the Group and company and their environment obtained in the course of the audit, we did not identify any material misstatements in the Strategic Report and Governance Report. (CA06)
The Directors’ assessment of the prospects of the Group and of the principal risks that would threaten the solvency or liquidity of the GroupWe have nothing material to add or draw attention to regarding:
The Directors’ confirmation on p40 of the Annual Report that they have carried out a robust assessment of the principal risks facing the Group, including those that would threaten its business model, future performance, solvency or liquidity;
The disclosures in the Annual Report that describe those risks and explain how they are being managed or mitigated; and
The Directors’ explanation on p50 of the Annual Report as to how they have assessed the prospects of the Group, over what period they have done so and why they consider that period to be appropriate and their statement on p107 of the Annual Report as to whether they have a reasonable expectation that the Group will be able to continue in operation and meet its liabilities as they fall due over the period of their assessment, including any related disclosures drawing attention to any necessary qualifications or assumptions.
Independent auditors’ report to the members of Pearson plc
120 Pearson plc Annual report and accounts 2019

We have nothing to report having performed a review of the Directors’ statement that they have carried out a robust assessment of the principal risks facing the Group and statement in relation to the longer-term viability of the Group. Our review was substantially less in scope than an audit and only consisted of making inquiries and considering the Directors’ process supporting their statements; checking that the statements are in alignment with the relevant provisions of the UK Corporate Governance Code (the “Code”); and considering whether the statements are consistent with the knowledge and understanding of the Group and company and their environment obtained in the course of the audit. (Listing Rules)
Other Code provisionsWe have nothing to report in respect of our responsibility to report when:
The statement given by the Directors, on p111, that they consider the Annual Report taken as a whole to be fair, balanced and understandable and provides the information necessary for the members to assess the Group’s and company’s position and performance, business model and strategy is materially inconsistent with our knowledge of the Group and company obtained in the course of performing our audit;
The section of the Annual Report on p80 and 81 describing the work of the Audit Committee does not appropriately address matters communicated by us to the Audit Committee; and
The Directors’ statement relating to the company’s compliance with the Code does not properly disclose a departure from a relevant provision of the Code specified, under the Listing Rules, for review by the auditors.
Directors’ RemunerationIn our opinion, the part of the Directors’ Remuneration Report to be audited has been properly prepared in accordance with the Companies Act 2006. (CA06)
Responsibilities for the financial statements and the auditResponsibilities of the Directors for the financial statementsAs explained more fully in the Statement of Directors’ Responsibilities set out on p112, the Directors are responsible for the preparation of the financial statements in accordance with the applicable framework and for being satisfied that they give a true and fair view. The Directors are also responsible for such internal control as they determine is necessary to enable the preparation of financial statements that are free from material misstatement, whether due to fraud or error.
In preparing the financial statements, the Directors are responsible for assessing the Group’s and the company’s ability to continue as a going concern, disclosing, as applicable, matters related to going concern and using the going concern basis of accounting unless the Directors either intend to liquidate the Group or the company or to cease operations or have no realistic alternative but to do so.
Auditors’ responsibilities for the audit of the financial statementsOur objectives are to obtain reasonable assurance about whether the financial statements as a whole are free from material misstatement, whether due to fraud or error, and to issue an auditors’ report that includes our opinion. Reasonable assurance is a high level of assurance, but is not a guarantee that an audit conducted in accordance with ISAs (UK) will always detect a material misstatement when it exists. Misstatements can arise from fraud or error and are considered material if, individually or in the aggregate, they could reasonably be expected to influence the economic decisions of users taken on the basis of these financial statements.
A further description of our responsibilities for the audit of the financial statements is located on the FRC’s website at: www.frc.org.uk/auditorsresponsibilities. This description forms part of our auditors’ report
Use of this reportThis report, including the opinions, has been prepared for and only for the company’s members as a body in accordance with Chapter 3 of Part 16 of the Companies Act 2006 and for no other purpose. We do not, in giving these opinions, accept or assume responsibility for any other purpose or to any other person to whom this report is shown or into whose hands it may come save where expressly agreed by our prior consent in writing.
Other required reportingCompanies Act 2006 exception reportingUnder the Companies Act 2006, we are required to report to you if, in our opinion:
we have not received all the information and explanations we require for our audit; or
adequate accounting records have not been kept by the company or returns adequate for our audit have not been received from branches not visited by us; or
certain disclosures of Directors’ remuneration specified by law are not made; or
the company financial statements and the part of the Directors’ Remuneration Report to be audited are not in agreement with the accounting records and returns.
We have no exceptions to report arising from this responsibility.
AppointmentFollowing the recommendation of the Audit Committee, we were appointed by the members on 6 February 1996 to audit the financial statements for the year ended 31 December 1996 and subsequent financial periods. The period of total uninterrupted engagement is 24 years, covering the years ended 31 December 1996 to 31 December 2019.
Giles Hannam (Senior Statutory Auditor) for and on behalf of PricewaterhouseCoopers LLP Chartered Accountants and Statutory Auditors London
6 March 2020
121Overview Strategy Performance Governance Financial statements Other information
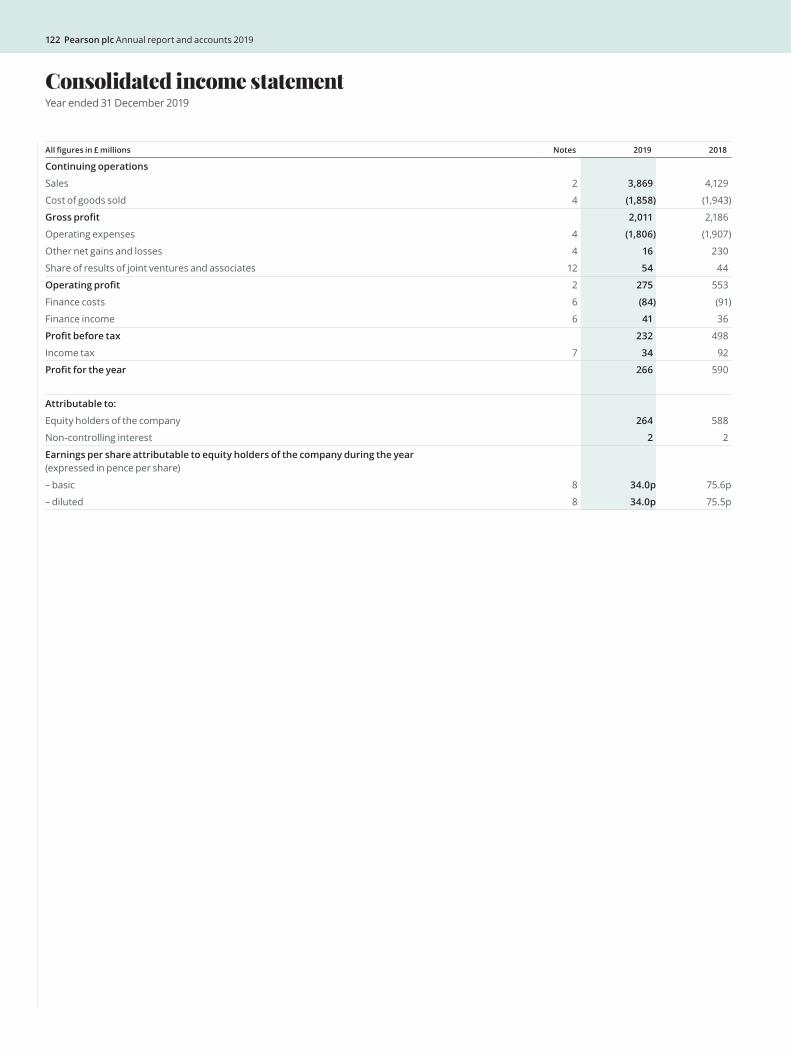
122 Pearson plc Annual report and accounts 2019
All figures in £ millions Notes 2019 2018
Continuing operations
Sales 2 3,869 4,129
Cost of goods sold 4 (1,858) (1,943)
Gross profit 2,011 2,186
Operating expenses 4 (1,806) (1,907)
Other net gains and losses 4 16 230
Share of results of joint ventures and associates 12 54 44
Operating profit 2 275 553
Finance costs 6 (84) (91)
Finance income 6 41 36
Profit before tax 232 498
Income tax 7 34 92
Profit for the year 266 590
Attributable to:
Equity holders of the company 264 588
Non-controlling interest 2 2
Earnings per share attributable to equity holders of the company during the year (expressed in pence per share)
– basic 8 34.0p 75.6p
– diluted 8 34.0p 75.5p
Consolidated income statementYear ended 31 December 2019
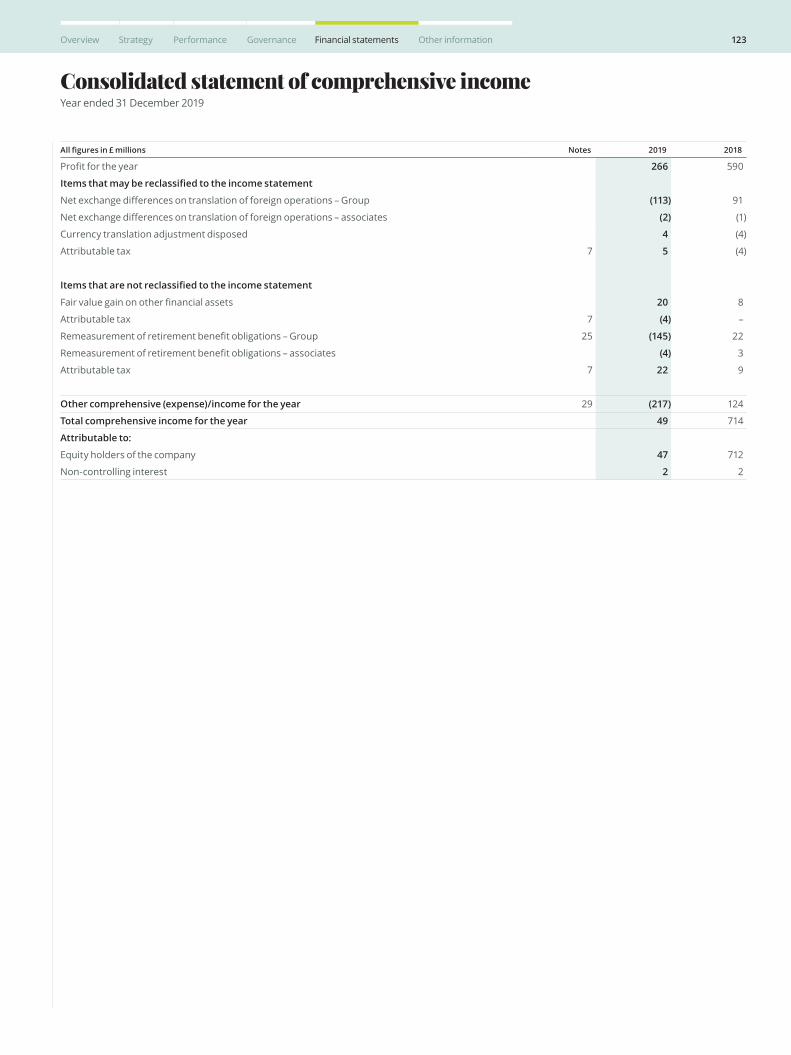
123Overview Strategy Performance Governance Financial statements Other information
Consolidated statement of comprehensive incomeYear ended 31 December 2019
All figures in £ millions Notes 2019 2018
Profit for the year 266 590
Items that may be reclassified to the income statement
Net exchange differences on translation of foreign operations – Group (113) 91
Net exchange differences on translation of foreign operations – associates (2) (1)
Currency translation adjustment disposed 4 (4)
Attributable tax 7 5 (4)
Items that are not reclassified to the income statement
Fair value gain on other financial assets 20 8
Attributable tax 7 (4) –
Remeasurement of retirement benefit obligations – Group 25 (145) 22
Remeasurement of retirement benefit obligations – associates (4) 3
Attributable tax 7 22 9
Other comprehensive (expense)/income for the year 29 (217) 124
Total comprehensive income for the year 49 714
Attributable to:
Equity holders of the company 47 712
Non-controlling interest 2 2
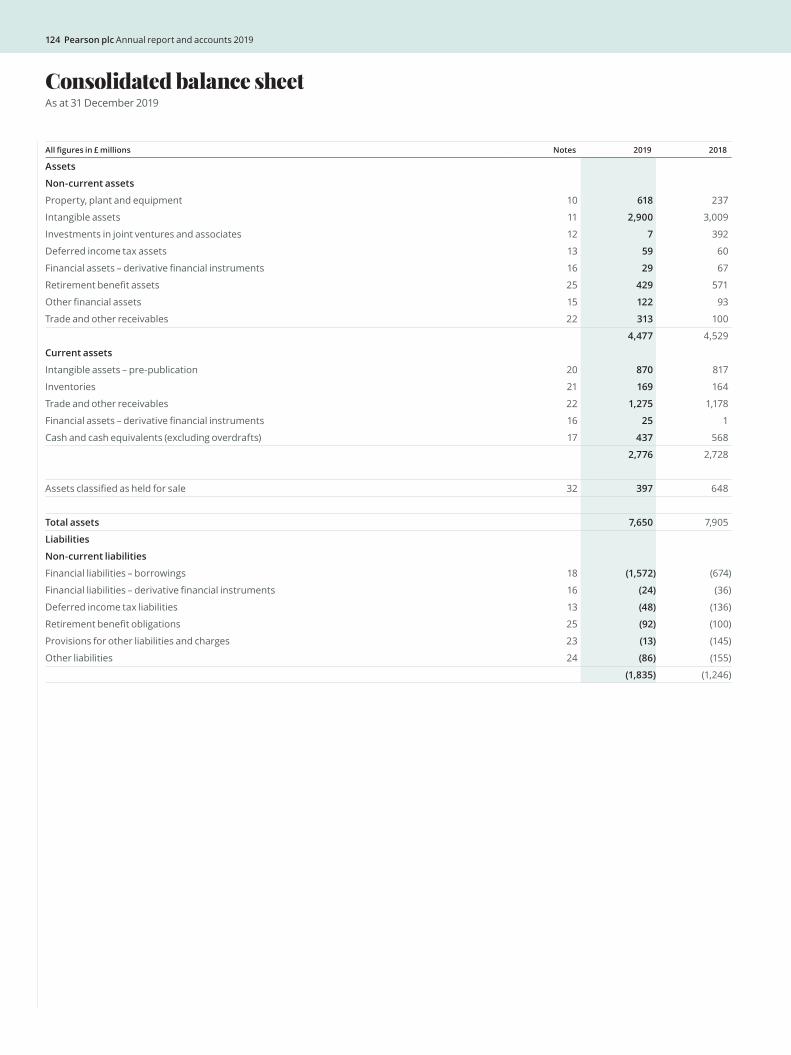
124 Pearson plc Annual report and accounts 2019
Consolidated balance sheetAs at 31 December 2019
All figures in £ millions Notes 2019 2018
Assets
Non-current assets
Property, plant and equipment 10 618 237
Intangible assets 11 2,900 3,009
Investments in joint ventures and associates 12 7 392
Deferred income tax assets 13 59 60
Financial assets – derivative financial instruments 16 29 67
Retirement benefit assets 25 429 571
Other financial assets 15 122 93
Trade and other receivables 22 313 100
4,477 4,529
Current assets
Intangible assets – pre-publication 20 870 817
Inventories 21 169 164
Trade and other receivables 22 1,275 1,178
Financial assets – derivative financial instruments 16 25 1
Cash and cash equivalents (excluding overdrafts) 17 437 568
2,776 2,728
Assets classified as held for sale 32 397 648
Total assets 7,650 7,905
Liabilities
Non-current liabilities
Financial liabilities – borrowings 18 (1,572) (674)
Financial liabilities – derivative financial instruments 16 (24) (36)
Deferred income tax liabilities 13 (48) (136)
Retirement benefit obligations 25 (92) (100)
Provisions for other liabilities and charges 23 (13) (145)
Other liabilities 24 (86) (155)
(1,835) (1,246)
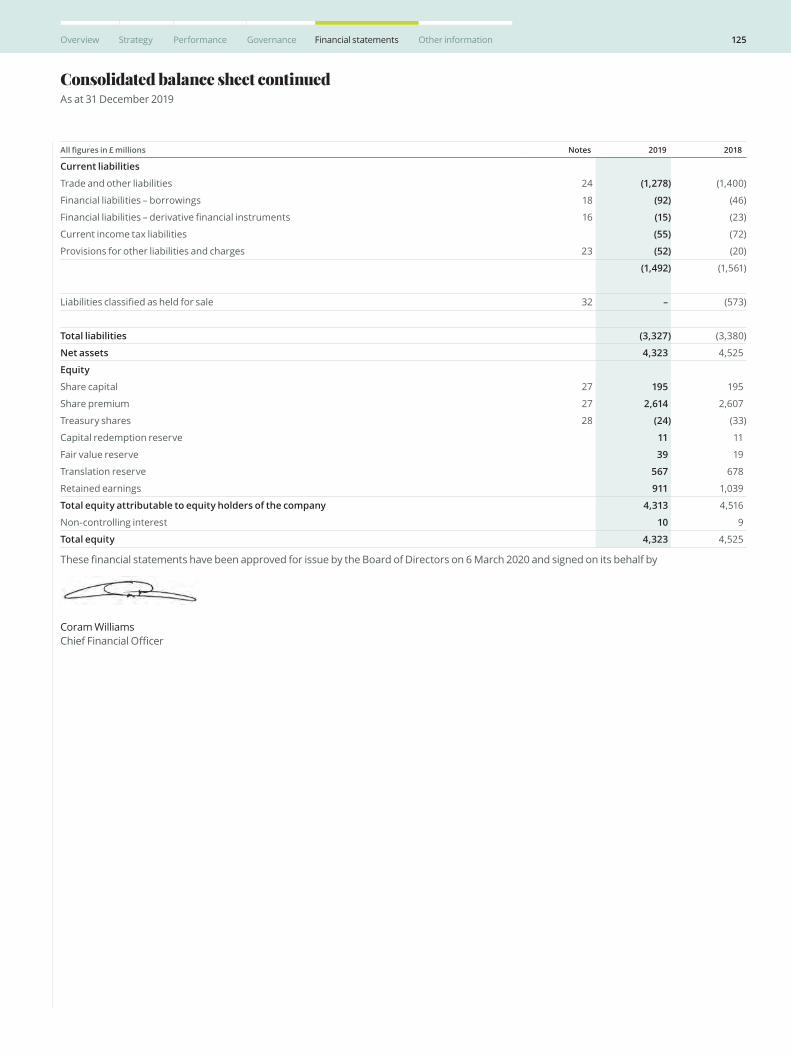
125Overview Strategy Performance Governance Financial statements Other information
Consolidated balance sheet continuedAs at 31 December 2019
All figures in £ millions Notes 2019 2018
Current liabilities
Trade and other liabilities 24 (1,278) (1,400)
Financial liabilities – borrowings 18 (92) (46)
Financial liabilities – derivative financial instruments 16 (15) (23)
Current income tax liabilities (55) (72)
Provisions for other liabilities and charges 23 (52) (20)
(1,492) (1,561)
Liabilities classified as held for sale 32 – (573)
Total liabilities (3,327) (3,380)
Net assets 4,323 4,525
Equity
Share capital 27 195 195
Share premium 27 2,614 2,607
Treasury shares 28 (24) (33)
Capital redemption reserve 11 11
Fair value reserve 39 19
Translation reserve 567 678
Retained earnings 911 1,039
Total equity attributable to equity holders of the company 4,313 4,516
Non-controlling interest 10 9
Total equity 4,323 4,525
These financial statements have been approved for issue by the Board of Directors on 6 March 2020 and signed on its behalf by
Coram Williams Chief Financial Officer
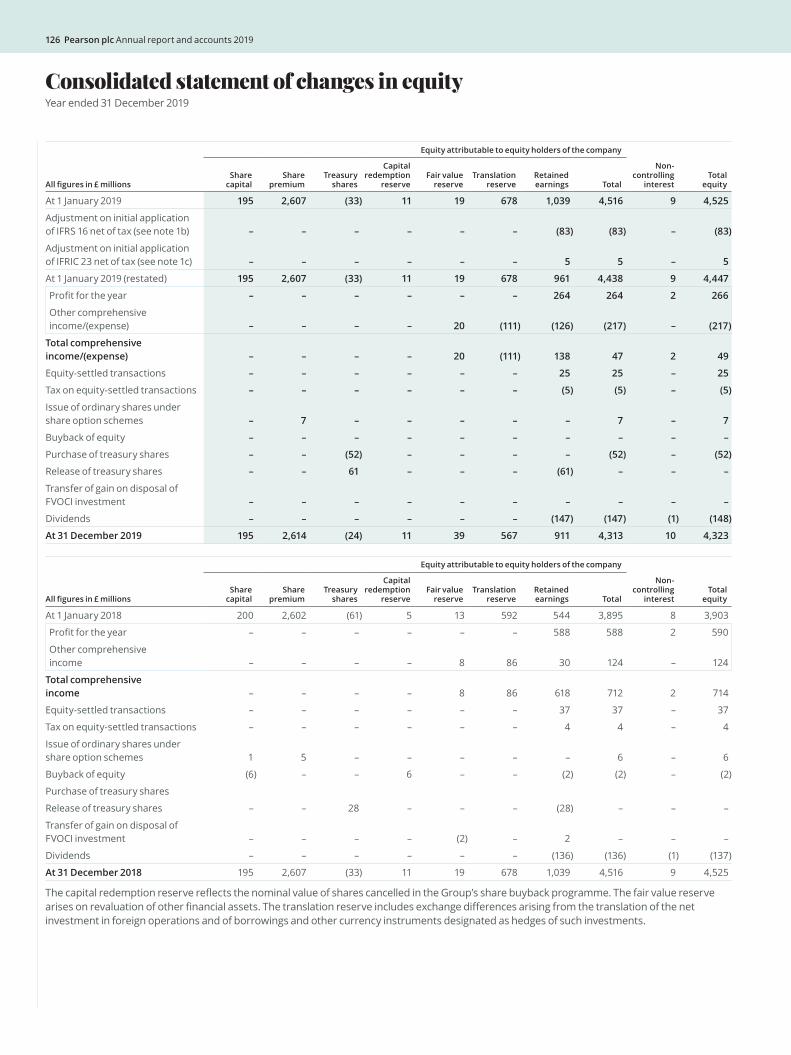
126 Pearson plc Annual report and accounts 2019
Consolidated statement of changes in equityYear ended 31 December 2019
All figures in £ millions
Equity attributable to equity holders of the company
Non-controlling
interestTotal
equityShare
capitalShare
premiumTreasury
shares
Capital redemption
reserveFair value
reserveTranslation
reserveRetained earnings Total
At 1 January 2019 195 2,607 (33) 11 19 678 1,039 4,516 9 4,525
Adjustment on initial application of IFRS 16 net of tax (see note 1b) – – – – – – (83) (83) – (83)
Adjustment on initial application of IFRIC 23 net of tax (see note 1c) – – – – – – 5 5 – 5
At 1 January 2019 (restated) 195 2,607 (33) 11 19 678 961 4,438 9 4,447
Profit for the year – – – – – – 264 264 2 266
Other comprehensive income/(expense) – – – – 20 (111) (126) (217) – (217)
Total comprehensive income/(expense) – – – – 20 (111) 138 47 2 49
Equity-settled transactions – – – – – – 25 25 – 25
Tax on equity-settled transactions – – – – – – (5) (5) – (5)
Issue of ordinary shares under share option schemes – 7 – – – – – 7 – 7
Buyback of equity – – – – – – – – – –
Purchase of treasury shares – – (52) – – – – (52) – (52)
Release of treasury shares – – 61 – – – (61) – – –
Transfer of gain on disposal of FVOCI investment – – – – – – – – – –
Dividends – – – – – – (147) (147) (1) (148)
At 31 December 2019 195 2,614 (24) 11 39 567 911 4,313 10 4,323
All figures in £ millions
Equity attributable to equity holders of the company
Non-controlling
interestTotal
equityShare
capitalShare
premiumTreasury
shares
Capital redemption
reserveFair value
reserveTranslation
reserveRetained earnings Total
At 1 January 2018 200 2,602 (61) 5 13 592 544 3,895 8 3,903
Profit for the year – – – – – – 588 588 2 590
Other comprehensive income – – – – 8 86 30 124 – 124
Total comprehensive income – – – – 8 86 618 712 2 714
Equity-settled transactions – – – – – – 37 37 – 37
Tax on equity-settled transactions – – – – – – 4 4 – 4
Issue of ordinary shares under share option schemes 1 5 – – – – – 6 – 6
Buyback of equity (6) – – 6 – – (2) (2) – (2)
Purchase of treasury shares
Release of treasury shares – – 28 – – – (28) – – –
Transfer of gain on disposal of FVOCI investment – – – – (2) – 2 – – –
Dividends – – – – – – (136) (136) (1) (137)
At 31 December 2018 195 2,607 (33) 11 19 678 1,039 4,516 9 4,525
The capital redemption reserve reflects the nominal value of shares cancelled in the Group’s share buyback programme. The fair value reserve arises on revaluation of other financial assets. The translation reserve includes exchange differences arising from the translation of the net investment in foreign operations and of borrowings and other currency instruments designated as hedges of such investments.
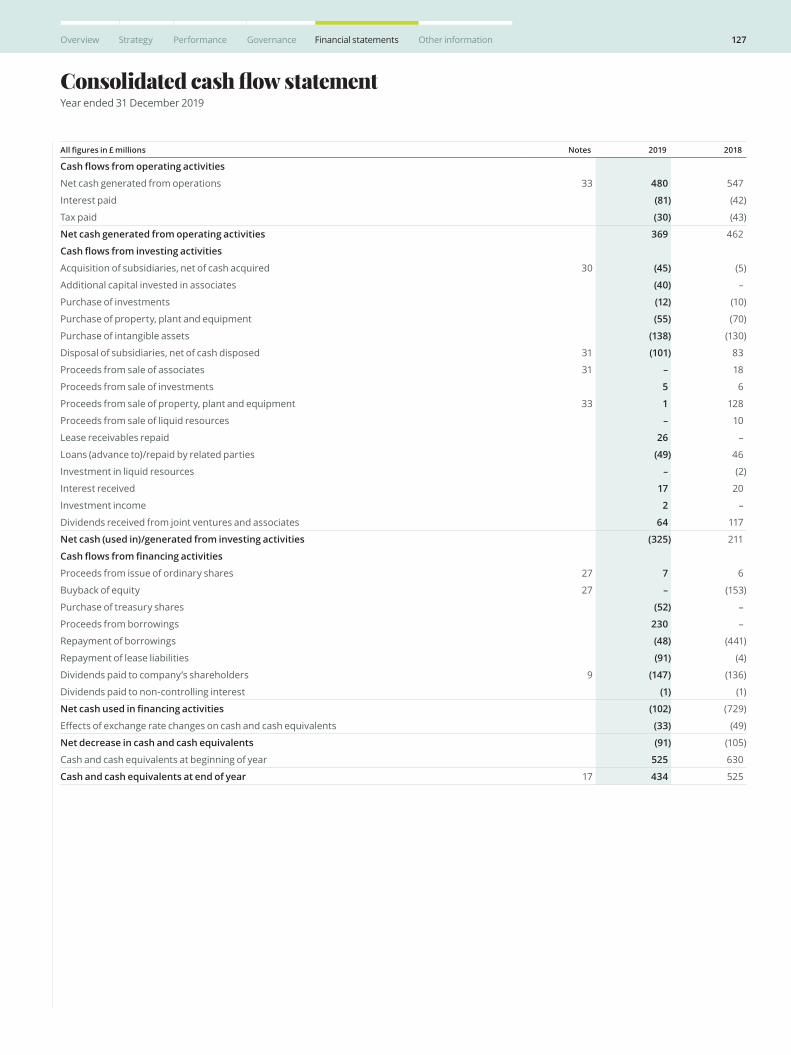
127Overview Strategy Performance Governance Financial statements Other information
Consolidated cash flow statementYear ended 31 December 2019
All figures in £ millions Notes 2019 2018
Cash flows from operating activities
Net cash generated from operations 33 480 547
Interest paid (81) (42)
Tax paid (30) (43)
Net cash generated from operating activities 369 462
Cash flows from investing activities
Acquisition of subsidiaries, net of cash acquired 30 (45) (5)
Additional capital invested in associates (40) –
Purchase of investments (12) (10)
Purchase of property, plant and equipment (55) (70)
Purchase of intangible assets (138) (130)
Disposal of subsidiaries, net of cash disposed 31 (101) 83
Proceeds from sale of associates 31 – 18
Proceeds from sale of investments 5 6
Proceeds from sale of property, plant and equipment 33 1 128
Proceeds from sale of liquid resources – 10
Lease receivables repaid 26 –
Loans (advance to)/repaid by related parties (49) 46
Investment in liquid resources – (2)
Interest received 17 20
Investment income 2 –
Dividends received from joint ventures and associates 64 117
Net cash (used in)/generated from investing activities (325) 211
Cash flows from financing activities
Proceeds from issue of ordinary shares 27 7 6
Buyback of equity 27 – (153)
Purchase of treasury shares (52) –
Proceeds from borrowings 230 –
Repayment of borrowings (48) (441)
Repayment of lease liabilities (91) (4)
Dividends paid to company’s shareholders 9 (147) (136)
Dividends paid to non-controlling interest (1) (1)
Net cash used in financing activities (102) (729)
Effects of exchange rate changes on cash and cash equivalents (33) (49)
Net decrease in cash and cash equivalents (91) (105)
Cash and cash equivalents at beginning of year 525 630
Cash and cash equivalents at end of year 17 434 525
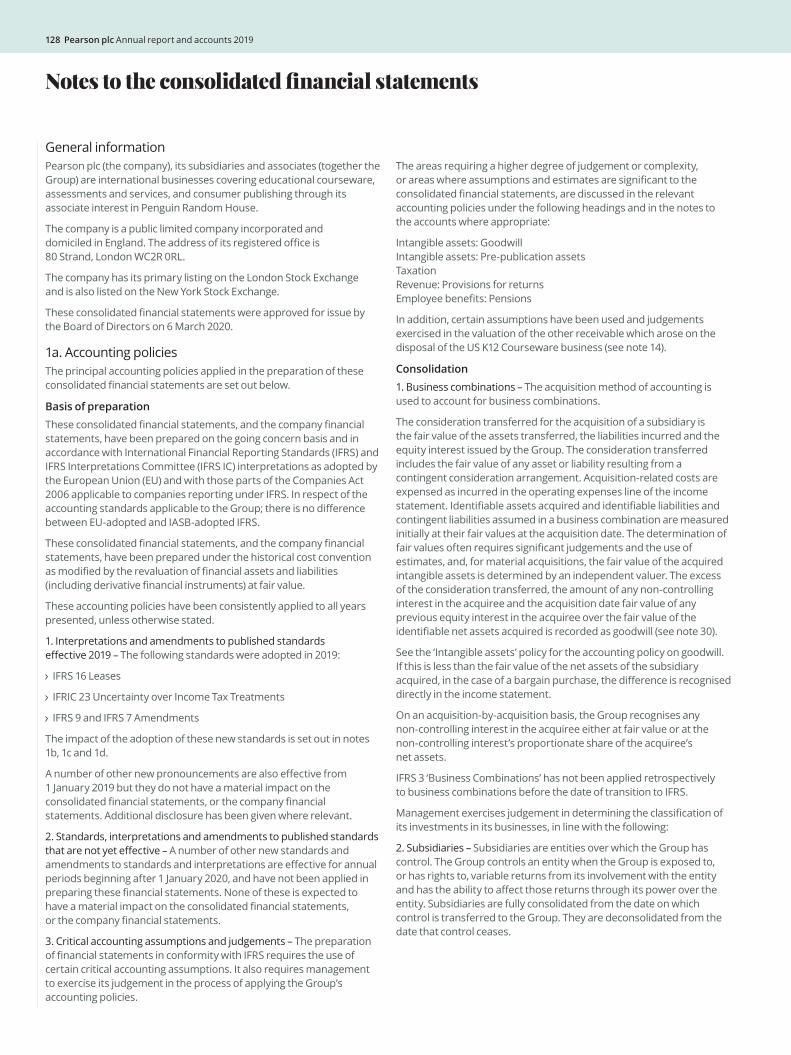
128 Pearson plc Annual report and accounts 2019
Notes to the consolidated financial statements
General informationPearson plc (the company), its subsidiaries and associates (together the Group) are international businesses covering educational courseware, assessments and services, and consumer publishing through its associate interest in Penguin Random House.
The company is a public limited company incorporated and domiciled in England. The address of its registered office is 80 Strand, London WC2R 0RL.
The company has its primary listing on the London Stock Exchange and is also listed on the New York Stock Exchange.
These consolidated financial statements were approved for issue by the Board of Directors on 6 March 2020.
1a. Accounting policiesThe principal accounting policies applied in the preparation of these consolidated financial statements are set out below.
Basis of preparationThese consolidated financial statements, and the company financial statements, have been prepared on the going concern basis and in accordance with International Financial Reporting Standards (IFRS) and IFRS Interpretations Committee (IFRS IC) interpretations as adopted by the European Union (EU) and with those parts of the Companies Act 2006 applicable to companies reporting under IFRS. In respect of the accounting standards applicable to the Group; there is no difference between EU-adopted and IASB-adopted IFRS.
These consolidated financial statements, and the company financial statements, have been prepared under the historical cost convention as modified by the revaluation of financial assets and liabilities (including derivative financial instruments) at fair value.
These accounting policies have been consistently applied to all years presented, unless otherwise stated.
1. Interpretations and amendments to published standards effective 2019 – The following standards were adopted in 2019:
IFRS 16 Leases
IFRIC 23 Uncertainty over Income Tax Treatments
IFRS 9 and IFRS 7 Amendments
The impact of the adoption of these new standards is set out in notes 1b, 1c and 1d.
A number of other new pronouncements are also effective from 1 January 2019 but they do not have a material impact on the consolidated financial statements, or the company financial statements. Additional disclosure has been given where relevant.
2. Standards, interpretations and amendments to published standards that are not yet effective – A number of other new standards and amendments to standards and interpretations are effective for annual periods beginning after 1 January 2020, and have not been applied in preparing these financial statements. None of these is expected to have a material impact on the consolidated financial statements, or the company financial statements.
3. Critical accounting assumptions and judgements – The preparation of financial statements in conformity with IFRS requires the use of certain critical accounting assumptions. It also requires management to exercise its judgement in the process of applying the Group’s accounting policies.
The areas requiring a higher degree of judgement or complexity, or areas where assumptions and estimates are significant to the consolidated financial statements, are discussed in the relevant accounting policies under the following headings and in the notes to the accounts where appropriate:
Intangible assets: Goodwill Intangible assets: Pre-publication assets Taxation Revenue: Provisions for returns Employee benefits: Pensions
In addition, certain assumptions have been used and judgements exercised in the valuation of the other receivable which arose on the disposal of the US K12 Courseware business (see note 14).
Consolidation1. Business combinations – The acquisition method of accounting is used to account for business combinations.
The consideration transferred for the acquisition of a subsidiary is the fair value of the assets transferred, the liabilities incurred and the equity interest issued by the Group. The consideration transferred includes the fair value of any asset or liability resulting from a contingent consideration arrangement. Acquisition-related costs are expensed as incurred in the operating expenses line of the income statement. Identifiable assets acquired and identifiable liabilities and contingent liabilities assumed in a business combination are measured initially at their fair values at the acquisition date. The determination of fair values often requires significant judgements and the use of estimates, and, for material acquisitions, the fair value of the acquired intangible assets is determined by an independent valuer. The excess of the consideration transferred, the amount of any non-controlling interest in the acquiree and the acquisition date fair value of any previous equity interest in the acquiree over the fair value of the identifiable net assets acquired is recorded as goodwill (see note 30).
See the ‘Intangible assets’ policy for the accounting policy on goodwill. If this is less than the fair value of the net assets of the subsidiary acquired, in the case of a bargain purchase, the difference is recognised directly in the income statement.
On an acquisition-by-acquisition basis, the Group recognises any non-controlling interest in the acquiree either at fair value or at the non-controlling interest’s proportionate share of the acquiree’s net assets.
IFRS 3 ‘Business Combinations’ has not been applied retrospectively to business combinations before the date of transition to IFRS.
Management exercises judgement in determining the classification of its investments in its businesses, in line with the following:
2. Subsidiaries – Subsidiaries are entities over which the Group has control. The Group controls an entity when the Group is exposed to, or has rights to, variable returns from its involvement with the entity and has the ability to affect those returns through its power over the entity. Subsidiaries are fully consolidated from the date on which control is transferred to the Group. They are deconsolidated from the date that control ceases.
129Overview Strategy Performance Governance Financial statements Other information
1a. Accounting policies continuedConsolidation continued3. Transactions with non-controlling interests – Transactions with non-controlling interests that do not result in loss of control are accounted for as equity transactions, that is, as transactions with the owners in their capacity as owners. Any surplus or deficit arising from disposals to a non-controlling interest is recorded in equity. For purchases from a non-controlling interest, the difference between consideration paid and the relevant share acquired of the carrying value of the subsidiary is recorded in equity.
4. Joint ventures and associates – Joint ventures are entities in which the Group holds an interest on a long-term basis and has rights to the net assets through contractually agreed sharing of control. Associates are entities over which the Group has significant influence but not the power to control the financial and operating policies, generally accompanying a shareholding of between 20% and 50% of the voting rights. Ownership percentage is likely to be the key indicator of investment classification; however, other factors, such as Board representation, may also affect the accounting classification. Judgement is required to assess all of the qualitative and quantitative factors which may indicate that the Group does, or does not, have significant influence over an investment. Penguin Random House is the Group’s only material associate – see note 12 for further details on the judgements involved in its accounting classification. Investments in joint ventures and associates are accounted for by the equity method and are initially recognised at the fair value of consideration transferred.
The Group’s share of its joint ventures’ and associates’ post-acquisition profits or losses is recognised in the income statement and its share of post-acquisition movements in reserves is recognised in reserves.
The Group’s share of its joint ventures’ and associates’ results is recognised as a component of operating profit as these operations form part of the core publishing business of the Group and are an integral part of existing wholly-owned businesses. The cumulative post-acquisition movements are adjusted against the carrying amount of the investment. When the Group’s share of losses in a joint venture or associate equals or exceeds its interest in the joint venture or associate, the Group does not recognise further losses unless the Group has incurred obligations or made payments on behalf of the joint venture or associate.
Unrealised gains and losses on transactions between the Group and its joint ventures and associates are eliminated to the extent of the Group’s interest in these entities.
5. Contribution of a subsidiary to an associate or joint venture – The gain or loss resulting from the contribution or sale of a subsidiary to an associate or a joint venture is recognised in full. Where such transactions do not involve cash consideration, significant judgements and estimates are used in determining the fair values of the consideration received.
Foreign currency translation1. Functional and presentation currency – Items included in the financial statements of each of the Group’s entities are measured using the currency of the primary economic environment in which the entity operates (the functional currency). The consolidated financial statements are presented in sterling, which is the company’s functional and presentation currency.
2. Transactions and balances – Foreign currency transactions are translated into the functional currency using the exchange rates prevailing at the dates of the transactions. Foreign exchange gains and losses resulting from the settlement of such transactions and from the translation at year-end exchange rates of monetary assets and liabilities denominated in foreign currencies are recognised in the income statement, except when deferred in equity as qualifying net investment hedges.
3. Group companies – The results and financial position of all Group companies that have a functional currency different from the presentation currency are translated into the presentation currency as follows:
i) Assets and liabilities are translated at the closing rate at the date of the balance sheet
ii) Income and expenses are translated at average exchange rates
iii) All resulting exchange differences are recognised as a separate component of equity.
On consolidation, exchange differences arising from the translation of the net investment in foreign entities, and of borrowings and other currency instruments designated as hedges of such investments, are taken to shareholders’ equity. The Group treats specific inter-company loan balances, which are not intended to be repaid in the foreseeable future, as part of its net investment. When a foreign operation is sold, such exchange differences are recognised in the income statement as part of the gain or loss on sale.
The principal overseas currency for the Group is the US dollar. The average rate for the year against sterling was $1.28 (2018: $1.34) and the year-end rate was $1.32 (2018: $1.27).
Property, plant and equipmentProperty, plant and equipment are stated at historical cost less depreciation. Cost includes the original purchase price of the asset and the costs attributable to bringing the asset to its working condition for intended use. Land is not depreciated. Depreciation on other assets is calculated using the straight-line method to allocate their cost less their residual values over their estimated useful lives as follows:
Buildings (freehold): 20–50 years
Buildings (leasehold): over the period of the lease
Plant and equipment: 3–10 years
The assets’ residual values and useful lives are reviewed, and adjusted if appropriate, at each balance sheet date.
The carrying value of an asset is written down to its recoverable amount if the carrying value of the asset is greater than its estimated recoverable amount.
130 Pearson plc Annual report and accounts 2019
Notes to the consolidated financial statements
1a. Accounting policies continuedIntangible assets1. Goodwill – For the acquisition of subsidiaries made on or after 1 January 2010, goodwill represents the excess of the consideration transferred, the amount of any non-controlling interest in the acquiree and the acquisition date fair value of any previous equity interest in the acquiree over the fair value of the identifiable net assets acquired. For the acquisition of subsidiaries made from the date of transition to IFRS to 31 December 2009, goodwill represents the excess of the cost of an acquisition over the fair value of the Group’s share of the net identifiable assets acquired. Goodwill on acquisitions of subsidiaries is included in intangible assets. Goodwill on acquisition of associates and joint ventures represents the excess of the cost of an acquisition over the fair value of the Group’s share of the net identifiable assets acquired. Goodwill on acquisitions of associates and joint ventures is included in investments in associates and joint ventures.
Goodwill is tested at least annually for impairment and carried at cost less accumulated impairment losses. An impairment loss is recognised to the extent that the carrying value of goodwill exceeds the recoverable amount. The recoverable amount is the higher of fair value less costs of disposal and value in use. These calculations require the use of estimates in respect of forecast cash flows and discount rates and significant management judgement in respect of CGU and cost allocation; impairment is a key source of estimation uncertainty and has a significant risk of resulting in a material adjustment to the carrying amount of relevant assets within the next financial year. A summary of these assets by CGU and a description of the key assumptions and sensitivities is included in note 11.
Goodwill is allocated to aggregated cash-generating units for the purpose of impairment testing. The allocation is made to those aggregated cash-generating units that are expected to benefit from the business combination in which the goodwill arose.
Gains and losses on the disposal of an entity include the carrying amount of goodwill relating to the entity sold.
2. Acquired software – Software separately acquired for internal use is capitalised at cost. Software acquired in material business combinations is capitalised at its fair value as determined by an independent valuer. Acquired software is amortised on a straight-line basis over its estimated useful life of between three and eight years.
3. Internally developed software – Internal and external costs incurred during the preliminary stage of developing computer software for internal use are expensed as incurred. Internal and external costs incurred to develop computer software for internal use during the application development stage are capitalised if the Group expects economic benefits from the development. Capitalisation in the application development stage begins once the Group can reliably measure the expenditure attributable to the software development and has demonstrated its intention to complete and use the software. Internally developed software is amortised on a straight-line basis over its estimated useful life of between three and ten years.
4. Acquired intangible assets – Acquired intangible assets include customer lists, contracts and relationships, trademarks and brands, publishing rights, content, technology and software rights. These assets are capitalised on acquisition at cost and included in intangible assets. Intangible assets acquired in material business combinations are capitalised at their fair value as determined by an independent valuer. Intangible assets are amortised over their estimated useful lives of between two and 20 years, using an amortisation method that reflects the pattern of their consumption.
5. Pre-publication assets – Pre-publication assets represent direct costs incurred in the development of educational programmes and titles prior to their publication. These costs are recognised as current intangible assets where the title will generate probable future economic benefits and costs can be measured reliably.
Pre-publication assets relating to content are amortised upon publication of the title over estimated economic lives of five years or less, being an estimate of the expected operating lifecycle of the title, with a higher proportion of the amortisation taken in the earlier years. Pre-publication assets relating to product platforms are amortised over ten years or less being an estimate of the expected useful life.
The assessment of the useful economic life and the recoverability of pre-publication assets involves a significant degree of judgement based on historical trends and management estimation of future potential sales. An incorrect amortisation profile could result in excess amounts being carried forward as intangible assets that would otherwise have been written off to the income statement in an earlier period.
Reviews are performed regularly to estimate recoverability of pre-publication assets. The carrying amount of pre-publication assets is set out in note 20.
The investment in pre-publication assets has been disclosed as part of cash generated from operations in the cash flow statement (see note 33).
Other financial assetsOther financial assets are non-derivative financial assets classified and measured at estimated fair value.
Marketable securities and cash deposits with maturities of greater than three months are classified and subsequently measured at fair value through profit and loss.
They are remeasured at each balance sheet date by using market data and the use of established valuation techniques. Any movement in the fair value is immediately recognised in finance income or finance costs in the income statement.
Investments in the equity instruments of other entities are classified and subsequently measured at fair value through other comprehensive income. Changes in fair value are recorded in equity in the fair value reserve via other comprehensive income. On subsequent disposal of the asset, the net fair value gains or losses are reclassified from the fair value reserve to retained earnings. Any dividends received from equity investments classified as fair value through other comprehensive income are recognised in the income statement unless they represent a return of capital.
131Overview Strategy Performance Governance Financial statements Other information
1a. Accounting policies continuedInventoriesInventories are stated at the lower of cost and net realisable value. Cost is determined using the weighted average method or an approximation thereof, such as the first in first out (FIFO) method. The cost of finished goods and work in progress comprises raw materials, direct labour, other direct costs and related production overheads. Net realisable value is the estimated selling price in the ordinary course of business, less estimated costs necessary to make the sale. Provisions are made for slow-moving and obsolete stock.
Royalty advancesAdvances of royalties to authors are included within trade and other receivables when the advance is paid less any provision required to adjust the advance to its net realisable value. The realisable value of royalty advances relies on a degree of management estimation in determining the profitability of individual author contracts. If the estimated realisable value of author contracts is overstated, this will have an adverse effect on operating profits as these excess amounts will be written off.
The recoverability of royalty advances is based upon an annual detailed management review of the age of the advance, the future sales projections for new authors and prior sales history of repeat authors.
The royalty advance is expensed at the contracted or effective royalty rate as the related revenues are earned. Royalty advances which will be consumed within one year are held in current assets. Royalty advances which will be consumed after one year are held in non-current assets.
Cash and cash equivalentsCash and cash equivalents in the cash flow statement include cash in hand, deposits held on call with banks, other short-term highly liquid investments with original maturities of three months or less, and bank overdrafts. Bank overdrafts are included in borrowings in current liabilities in the balance sheet.
Short-term deposits and marketable securities with maturities of greater than three months do not qualify as cash and cash equivalents and are reported as financial assets. Movements on these financial assets are classified as cash flows from financing activities in the cash flow statement where these amounts are used to offset the borrowings of the Group or as cash flows from investing activities where these amounts are held to generate an investment return.
Share capitalOrdinary shares are classified as equity.
Incremental costs directly attributable to the issue of new shares or options are shown in equity as a deduction, net of tax, from the proceeds.
Where any Group company purchases the company’s equity share capital (treasury shares), the consideration paid, including any directly attributable incremental costs, net of income taxes, is deducted from equity attributable to the company’s equity holders until the shares are cancelled, reissued or disposed of. Where such shares are subsequently sold or reissued, any consideration received, net of any directly attributable transaction costs and the related income tax effects, is included in equity attributable to the company’s equity holders.
Ordinary shares purchased under a buyback programme are cancelled and the nominal value of the shares is transferred to a capital redemption reserve.
BorrowingsBorrowings are recognised initially at fair value, which is proceeds received net of transaction costs incurred. Borrowings are subsequently stated at amortised cost with any difference between the proceeds (net of transaction costs) and the redemption value being recognised in the income statement over the period of the borrowings using the effective interest method. Accrued interest is included as part of borrowings.
Where a debt instrument is in a fair value hedging relationship, an adjustment is made to its carrying value in the income statement to reflect the hedged risk.
Where a debt instrument is in a net investment hedge relationship gains and losses on the effective portion of the hedge are recognised in other comprehensive income.
Derivative financial instrumentsDerivatives are recognised at fair value and remeasured at each balance sheet date. The fair value of derivatives is determined by using market data and the use of established estimation techniques such as discounted cash flow and option valuation models.
For derivatives in a hedge relationship, the currency basis spread is excluded from the designation as a hedging instrument.
Changes in the fair value of derivatives are recognised immediately in finance income or costs. However, derivatives relating to borrowings and certain foreign exchange contracts are designated as part of a hedging transaction.
132 Pearson plc Annual report and accounts 2019
1a. Accounting policies continuedDerivative financial instruments continuedThe accounting treatment is summarised as follows:
Typical reason for designation
Reporting of gains and losses on effective portion of the hedge
Reporting of gains and losses on disposal
Net investment hedge
The derivative creates a foreign currency liability which is used to hedge changes in the value of a subsidiary which transacts in that currency.
Recognised in other comprehensive income.
On disposal, the accumulated value of gains and losses reported in other comprehensive income is transferred to the income statement.
Fair value hedges
The derivative transforms the interest profile on debt from fixed rate to floating rate. Changes in the value of the debt as a result of changes in interest rates and foreign exchange rates are offset by equal and opposite changes in the value of the derivative. When the Group’s debt is swapped to floating rates, the contracts used are designated as fair value hedges.
Gains and losses on the derivative are reported in finance income or finance costs. However, an equal and opposite change is made to the carrying value of the debt (a ‘fair value adjustment’) with the benefit/cost reported in finance income or finance costs. The net result should be a zero charge on a perfectly effective hedge.
If the debt and derivative are disposed of, the value of the derivative and the debt (including the fair value adjustment) are reset to zero. Any resultant gain or loss is recognised in finance income or finance costs.
Non-hedge accounted contracts
These are not designated as hedging instruments. Typically these are short-term contracts to convert debt back to fixed rates or foreign exchange contracts where a natural offset exists.
No hedge accounting applies.
TaxationCurrent tax is recognised at the amounts expected to be paid or recovered under the tax rates and laws that have been enacted or substantively enacted at the balance sheet date.
Deferred income tax is provided, using the balance sheet liability method, on temporary differences arising between the tax bases of assets and liabilities and their carrying amounts. Deferred income tax is determined using tax rates and laws that have been enacted or substantively enacted by the balance sheet date and are expected to apply when the related deferred tax asset is realised or the deferred income tax liability is settled.
Deferred tax assets are recognised to the extent that it is probable that future taxable profit will be available against which the temporary differences can be utilised.
Deferred income tax is provided in respect of the undistributed earnings of subsidiaries, associates and joint ventures other than where it is intended that those undistributed earnings will not be remitted in the foreseeable future.
Current and deferred tax are recognised in the income statement, except when the tax relates to items charged or credited directly to equity or other comprehensive income, in which case the tax is also recognised in equity or other comprehensive income.
The Group is subject to income taxes in numerous jurisdictions. Significant judgement is required in determining the estimates in relation to the worldwide provision for income taxes. There are many transactions and calculations for which the ultimate tax determination is uncertain during the ordinary course of business. The Group recognises tax provisions when it is considered probable that there will be a future outflow of funds to a tax authority. The provisions are based on management’s best judgement of the application of tax legislation and best estimates of future settlement amounts (see note 7). Where the final tax outcome of these matters is different from the amounts that were initially recorded, such differences will impact the income tax and deferred tax provisions in the period in which such determination is made.
Deferred tax assets and liabilities require management judgement and estimation in determining the amounts to be recognised. In particular, when assessing the extent to which deferred tax assets should be recognised, significant judgement is used when considering the timing of the recognition and estimation is used to determine the level of future taxable income together with any future tax planning strategies (see note 13).
Employee benefits1. Pensions – The retirement benefit asset and obligation recognised in the balance sheet represent the net of the present value of the defined benefit obligation and the fair value of plan assets at the balance sheet date. The defined benefit obligation is calculated annually by independent actuaries using the projected unit credit method. The present value of the defined benefit obligation is determined by discounting estimated future cash flows using yields on high-quality corporate bonds which have terms to maturity approximating the terms of the related liability.
When the calculation results in a potential asset, the recognition of that asset is limited to the asset ceiling – that is the present value of any economic benefits available in the form of refunds from the plan or a reduction in future contributions. Management uses judgement to determine the level of refunds available from the plan in recognising an asset.
The determination of the pension cost and defined benefit obligation of the Group’s defined benefit pension schemes depends on the selection of certain assumptions, which include the discount rate, inflation rate, salary growth and longevity (see note 25).
Actuarial gains and losses arising from experience adjustments and changes in actuarial assumptions are charged or credited to equity in other comprehensive income in the period in which they arise.
The service cost, representing benefits accruing over the year, is included in the income statement as an operating cost. Net interest is calculated by applying the discount rate to the net defined benefit obligation and is presented as finance costs or finance income.
Notes to the consolidated financial statements
133Overview Strategy Performance Governance Financial statements Other information
1a. Accounting policies continuedEmployee benefits continuedObligations for contributions to defined contribution pension plans are recognised as an operating expense in the income statement as incurred.
2. Other post-retirement obligations – The expected costs of post-retirement medical and life assurance benefits are accrued over the period of employment, using a similar accounting methodology as for defined benefit pension obligations. The liabilities and costs relating to significant other post-retirement obligations are assessed annually by independent qualified actuaries.
3. Share-based payments – The fair value of options or shares granted under the Group’s share and option plans is recognised as an employee expense after taking into account the Group’s best estimate of the number of awards expected to vest. Fair value is measured at the date of grant and is spread over the vesting period of the option or share. The fair value of the options granted is measured using an option model that is most appropriate to the award. The fair value of shares awarded is measured using the share price at the date of grant unless another method is more appropriate. Any proceeds received are credited to share capital and share premium when the options are exercised.
ProvisionsProvisions are recognised if the Group has a present legal or constructive obligation as a result of past events, it is more likely than not that an outflow of resources will be required to settle the obligation and the amount can be reliably estimated. Provisions are discounted to present value where the effect is material.
Prior to 1 January 2019 the Group recognised a provision for onerous lease contracts when the expected benefits to be derived from a contract were less than the unavoidable costs of meeting the obligations under the contract. The calculation of onerous lease provisions involved estimates of potential sublet income, lease terms including rent free periods, void periods, lease incentives and running costs. On the initial application of IFRS 16 on 1 January 2019, onerous lease provisions have been offset against the relevant right-of-use asset (see note 23).
The provision was based on the present value of future payments for surplus leased properties under non-cancellable operating leases, net of estimated sub-leasing income.
Revenue recognitionThe Group’s revenue streams are courseware, assessments and services. Courseware includes curriculum materials provided in book form and/or via access to digital content. Assessments includes test development, processing and scoring services provided to governments, educational institutions, corporations and professional bodies. Services includes the operation of schools, colleges and universities, including sistemas in Brazil, as well as the provision of online learning services in partnership with universities and other academic institutions.
Revenue is recognised in order to depict the transfer of control of promised goods and services to customers in an amount that reflects the consideration to which we expect to be entitled in exchange for those goods and services. This process begins with the identification of our contract with a customer, which is generally through a master services agreement, customer purchase order, or a combination thereof. Within each contract, judgement is applied to determine the extent to which activities within the contract represent distinct performance obligations to be delivered and the total amount of transaction price to which we expect to be entitled.
The transaction price determined is net of sales taxes, rebates and discounts, and after eliminating sales within the Group. Where a contract contains multiple performance obligations such as the provision of supplementary materials or online access with textbooks, revenue is allocated on the basis of relative standalone selling prices. Where a contract contains variable consideration significant estimation is required to determine the amount to which the Group is expected to be entitled.
Revenue is recognised on contracts with customers when or as performance obligations are satisfied which is the period or the point in time where control of goods or services transfers to the customer. Judgement is applied to determine first whether control passes over time and if not, then the point in time at which control passes. Where revenue is recognised over time judgement is used to determine the method which best depicts the transfer of control. Where an input method is used significant estimation is required to determine the progress towards delivering the performance obligation.
Revenue from the sale of books is recognised net of a provision for anticipated returns. This provision is based primarily on historical return rates, customer buying patterns and retailer behaviours including stock levels (see note 22). If these estimates do not reflect actual returns in future periods then revenues could be understated or overstated for a particular period. When the provision for returns is remeasured at each reporting date to reflect changes in estimates, a corresponding adjustment is also recorded to revenue.
The Group may enter into contracts with another party in addition to our customer. In making the determination as to whether revenue should be recognised on a gross or net basis, the contract with the customer is analysed to understand which party controls the relevant good or service prior to transferring to the customer. This judgement is informed by facts and circumstances of the contract in determining whether the Group has promised to provide the specified good or service or whether the Group is arranging for the transfer of the specified good or service, including which party is responsible for fulfilment, has discretion to set the price to the customer and is responsible for inventory risk. On certain contracts, where the Group acts as an agent, only commissions and fees receivable for services rendered are recognised as revenue. Any third party costs incurred on behalf of the principal that are rechargeable under the contractual arrangement are not included in revenue.
Income from recharges of freight and other activities which are incidental to the normal revenue-generating activities is included in other income.
Additional details on the Group’s revenue streams are also included in note 3.
134 Pearson plc Annual report and accounts 2019
1a. Accounting policies continuedLeases
Policy applicable from 1 January 2019The Group as a lesseeThe Group assesses whether a contract is or contains a lease at the inception of the contract. A contract is, or contains a lease, if the contract conveys the right to control the use of an identified asset for a period of time in exchange for consideration. The Group recognises a right-of-use asset and a lease liability at the lease commencement date with respect to all lease arrangements except for short-term leases (leases with a lease term of 12 months or less) and leases of low value assets. For these leases, the lease payments are recognised as an operating expense on a straight-line basis over the term of the lease.
The right-of-use asset is initially measured at cost, comprising the initial amount of the lease liability plus any initial direct costs incurred and an estimate of costs to restore the underlying asset, less any lease incentives received. The right-of-use asset is subsequently depreciated using the straight-line method from the commencement date to the earlier of the end of the useful life of the asset or the end of the lease term. The Group applies IAS 36 to determine whether a right-of-use asset is impaired. The lease liability is initially measured at the present value of the lease payments that are not paid at the commencement date, discounted using the interest rate implicit in the lease or, if that rate cannot be readily determined, the incremental borrowing rate. The lease liability is measured at amortised cost using the effective interest method. It is remeasured when there is a change in future lease payments arising from a change in an index or a rate or a change in the Group’s assessment of whether it will exercise an extension or termination option. When the lease liability is remeasured, a corresponding adjustment is made to the right-of-use asset.
Management uses judgement to determine the lease term where extension and termination options are available within the lease.
The Group as a lessor:When the Group is an intermediate lessor, the head lease and sub-lease are accounted for as two separate contracts. The head lease is accounted for as per the lessee policy above. The sub-lease is classified as a finance lease or operating lease by reference to the right-of-use asset arising from the head lease. Where the lease transfers substantially all the risks and rewards of ownership to the lessee the contract is classified as a finance lease; all other leases are classified as operating leases. Rental income from operating leases is recognised on a straight-line basis over the term of the relevant lease. Amounts due from lessees under finance sub-leases are recognised as receivables at the amount of the Group’s net investment in the leases discounted using the interest rate implicit in the lease or, if that rate cannot be readily determined, the discount rate used in the head lease.
Policy applicable before 1 January 2019Leases of property, plant and equipment where the Group has substantially all the risks and rewards of ownership are classified as finance leases. Finance leases are capitalised at the commencement of the lease at the lower of the fair value of the leased property and the present value of the minimum lease payments. Each lease payment is allocated between the liability and finance charges to achieve a constant rate on the finance balance outstanding. The corresponding rental obligations, net of finance charges, are included in financial liabilities – borrowings. The interest element of the finance cost is charged to the income statement over the lease period to produce a constant periodic rate of interest on the remaining balance of the liability for each period. The property, plant and equipment acquired under finance leases are depreciated over the shorter of the useful life of the asset or the lease term.
Leases where a significant portion of the risks and rewards of ownership are retained by the lessor are classified as operating leases by the lessee. Payments made under operating leases (net of any incentives received from the lessor) are charged to the income statement on a straight-line basis over the period of the lease.
DividendsFinal dividends are recorded in the Group’s financial statements in the period in which they are approved by the company’s shareholders. Interim dividends are recorded when paid.
Discontinued operationsA discontinued operation is a component of the Group’s business that represents a separate major line of business or geographical area of operations that has been disposed of or meets the criteria to be classified as held for sale.
Discontinued operations are presented in the income statement as a separate line and are shown net of tax.
Assets and liabilities held for saleAssets and liabilities are classified as held for sale and stated at the lower of carrying amount and fair value less costs to sell if it is highly probable that the carrying amount will be recovered principally through a sale transaction rather than through continuing use. No depreciation is charged in respect of non-current assets classified as held for sale. Amounts relating to non-current assets and liabilities held for sale are classified as discontinued operations in the income statement where appropriate.
Trade receivablesTrade receivables are stated at fair value after provision for bad and doubtful debts. Provisions for bad and doubtful debts are based on the expected credit loss model. The ‘simplified approach’ is used with the expected loss allowance measured at an amount equal to the lifetime expected credit losses. Trade receivables are also stated after provision for anticipated future sales returns (also see Revenue recognition policy).
Notes to the consolidated financial statements
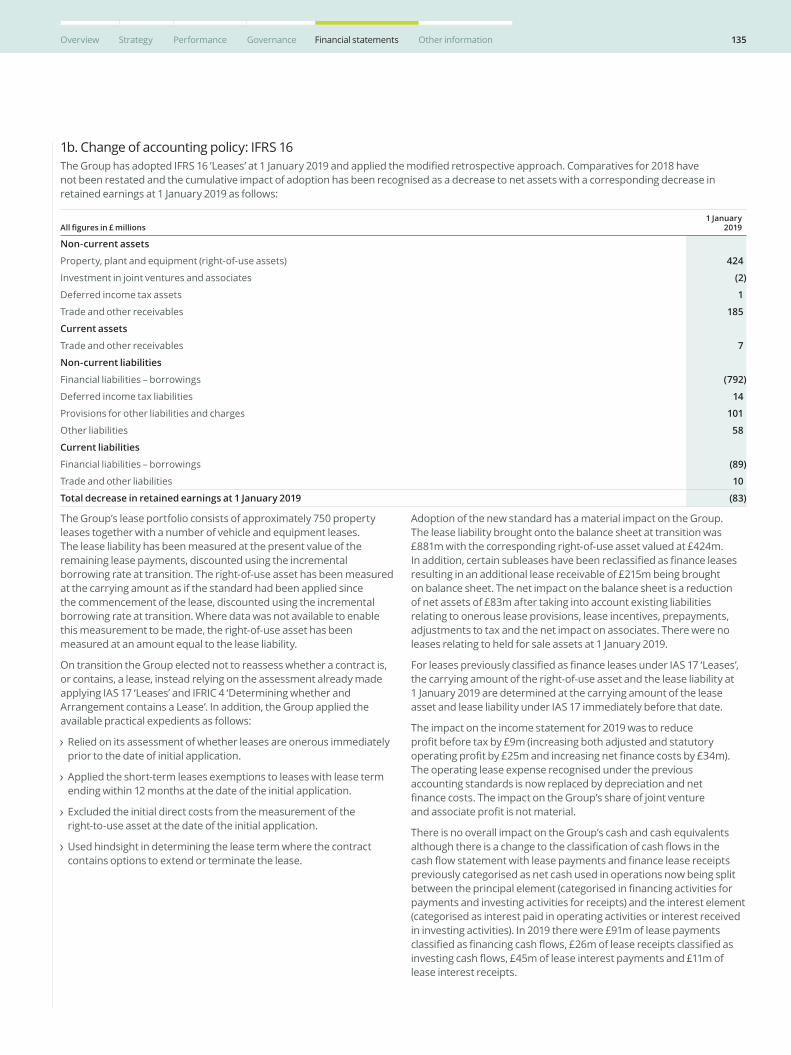
135Overview Strategy Performance Governance Financial statements Other information
1b. Change of accounting policy: IFRS 16The Group has adopted IFRS 16 ’Leases’ at 1 January 2019 and applied the modified retrospective approach. Comparatives for 2018 have not been restated and the cumulative impact of adoption has been recognised as a decrease to net assets with a corresponding decrease in retained earnings at 1 January 2019 as follows:
All figures in £ millions1 January
2019
Non-current assets
Property, plant and equipment (right-of-use assets) 424
Investment in joint ventures and associates (2)
Deferred income tax assets 1
Trade and other receivables 185
Current assets
Trade and other receivables 7
Non-current liabilities
Financial liabilities – borrowings (792)
Deferred income tax liabilities 14
Provisions for other liabilities and charges 101
Other liabilities 58
Current liabilities
Financial liabilities – borrowings (89)
Trade and other liabilities 10
Total decrease in retained earnings at 1 January 2019 (83)
The Group’s lease portfolio consists of approximately 750 property leases together with a number of vehicle and equipment leases. The lease liability has been measured at the present value of the remaining lease payments, discounted using the incremental borrowing rate at transition. The right-of-use asset has been measured at the carrying amount as if the standard had been applied since the commencement of the lease, discounted using the incremental borrowing rate at transition. Where data was not available to enable this measurement to be made, the right-of-use asset has been measured at an amount equal to the lease liability.
On transition the Group elected not to reassess whether a contract is, or contains, a lease, instead relying on the assessment already made applying IAS 17 ‘Leases’ and IFRIC 4 ‘Determining whether and Arrangement contains a Lease’. In addition, the Group applied the available practical expedients as follows:
Relied on its assessment of whether leases are onerous immediately prior to the date of initial application.
Applied the short-term leases exemptions to leases with lease term ending within 12 months at the date of the initial application.
Excluded the initial direct costs from the measurement of the right-to-use asset at the date of the initial application.
Used hindsight in determining the lease term where the contract contains options to extend or terminate the lease.
Adoption of the new standard has a material impact on the Group. The lease liability brought onto the balance sheet at transition was £881m with the corresponding right-of-use asset valued at £424m. In addition, certain subleases have been reclassified as finance leases resulting in an additional lease receivable of £215m being brought on balance sheet. The net impact on the balance sheet is a reduction of net assets of £83m after taking into account existing liabilities relating to onerous lease provisions, lease incentives, prepayments, adjustments to tax and the net impact on associates. There were no leases relating to held for sale assets at 1 January 2019.
For leases previously classified as finance leases under IAS 17 ‘Leases’, the carrying amount of the right-of-use asset and the lease liability at 1 January 2019 are determined at the carrying amount of the lease asset and lease liability under IAS 17 immediately before that date.
The impact on the income statement for 2019 was to reduce profit before tax by £9m (increasing both adjusted and statutory operating profit by £25m and increasing net finance costs by £34m). The operating lease expense recognised under the previous accounting standards is now replaced by depreciation and net finance costs. The impact on the Group’s share of joint venture and associate profit is not material.
There is no overall impact on the Group’s cash and cash equivalents although there is a change to the classification of cash flows in the cash flow statement with lease payments and finance lease receipts previously categorised as net cash used in operations now being split between the principal element (categorised in financing activities for payments and investing activities for receipts) and the interest element (categorised as interest paid in operating activities or interest received in investing activities). In 2019 there were £91m of lease payments classified as financing cash flows, £26m of lease receipts classified as investing cash flows, £45m of lease interest payments and £11m of lease interest receipts.
136 Pearson plc Annual report and accounts 2019
1b. Change of accounting policy: IFRS 16 continuedThe Group has also included the lease liability and investment in finance lease as part of its net debt which impacts the calculation of the Group’s non-GAAP measures for operating cash flow and free cash flow.
The lease liabilities at 1 January 2019 can be reconciled to the operating lease commitments at 31 December 2018 as follows:
All figures in £ millions1 January
2019
Operating lease commitments disclosed at 31 December 2018 (note 35) 1,175
Discounted using the lessee’s incremental borrowing rate at the date of initial application (290)
(Less): commitments relating to short-term leases (7)
Add: adjustments relating to the different treatment of extension and termination options 3
Additional lease liability recognised at 1 January 2019 881
Analysed at:
Current lease liabilities 89
Non-current lease liabilities 792
In addition to the lease liabilities transitioned above, the Group had £5m of lease liabilities that were accounted for as finance leases at 31 December 2018. The weighted average incremental borrowing rate applied to the lease liabilities on 1 January 2019 was 5.0%.
1c. Change of accounting policy: IFRIC 23The Group adopted IFRIC 23 ‘Uncertainty over Income Tax Treatments’ effective 1 January 2019. The interpretation clarifies the application of the recognition and measurement requirements in IAS 12 ‘Income taxes’ where there is uncertainty over income tax treatments. The interpretation provides guidance to determine whether uncertain tax positions should be considered separately or together, and that measurement should be whether the single most likely outcome or the probability weighted sum of a range of outcomes, whichever better predicts the resolution. The reassessment of current tax liabilities resulted in a decrease in liabilities of £5m but does not have a material impact on the income statement.
1d. Change of accounting policy: Amendments to IFRS 9 and IFRS 7The Group has considered the impact of IBOR reform on its hedge accounting. The Group has elected to early adopt amendments to IFRS 9 and IFRS 7 ‘Interest Rate Benchmark Reform’ issued in September 2019. In accordance with the transition provisions, the amendments have been adopted retrospectively to hedging relationships that existed at the start of the reporting period or were designated thereafter. The amendments provide temporary relief from applying specific hedge accounting requirements to hedging relationships directly affected by IBOR reform. The adoption of these amendments has not had a material impact on these financial statements (see note 19).
Notes to the consolidated financial statements
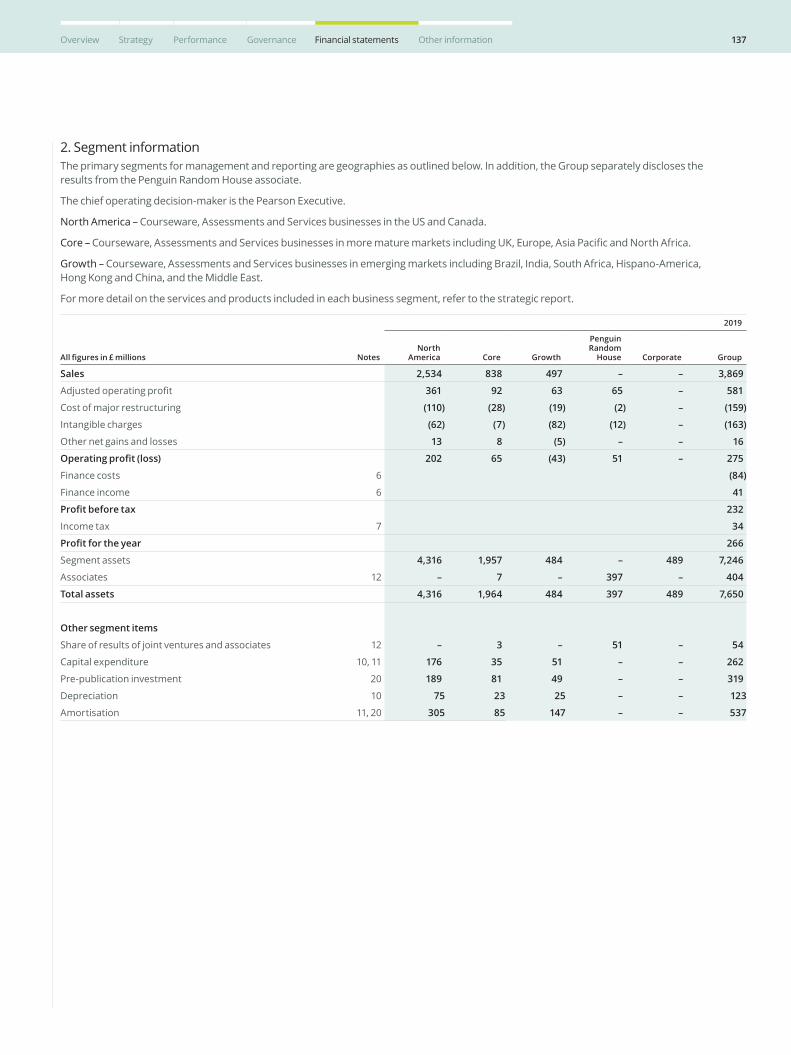
137Overview Strategy Performance Governance Financial statements Other information
2. Segment informationThe primary segments for management and reporting are geographies as outlined below. In addition, the Group separately discloses the results from the Penguin Random House associate.
The chief operating decision-maker is the Pearson Executive.
North America – Courseware, Assessments and Services businesses in the US and Canada.
Core – Courseware, Assessments and Services businesses in more mature markets including UK, Europe, Asia Pacific and North Africa.
Growth – Courseware, Assessments and Services businesses in emerging markets including Brazil, India, South Africa, Hispano-America, Hong Kong and China, and the Middle East.
For more detail on the services and products included in each business segment, refer to the strategic report.
All figures in £ millions Notes
2019
North America Core Growth
Penguin Random
House Corporate Group
Sales 2,534 838 497 – – 3,869
Adjusted operating profit 361 92 63 65 – 581
Cost of major restructuring (110) (28) (19) (2) – (159)
Intangible charges (62) (7) (82) (12) – (163)
Other net gains and losses 13 8 (5) – – 16
Operating profit (loss) 202 65 (43) 51 – 275
Finance costs 6 (84)
Finance income 6 41
Profit before tax 232
Income tax 7 34
Profit for the year 266
Segment assets 4,316 1,957 484 – 489 7,246
Associates 12 – 7 – 397 – 404
Total assets 4,316 1,964 484 397 489 7,650
Other segment items
Share of results of joint ventures and associates 12 – 3 – 51 – 54
Capital expenditure 10, 11 176 35 51 – – 262
Pre-publication investment 20 189 81 49 – – 319
Depreciation 10 75 23 25 – – 123
Amortisation 11, 20 305 85 147 – – 537
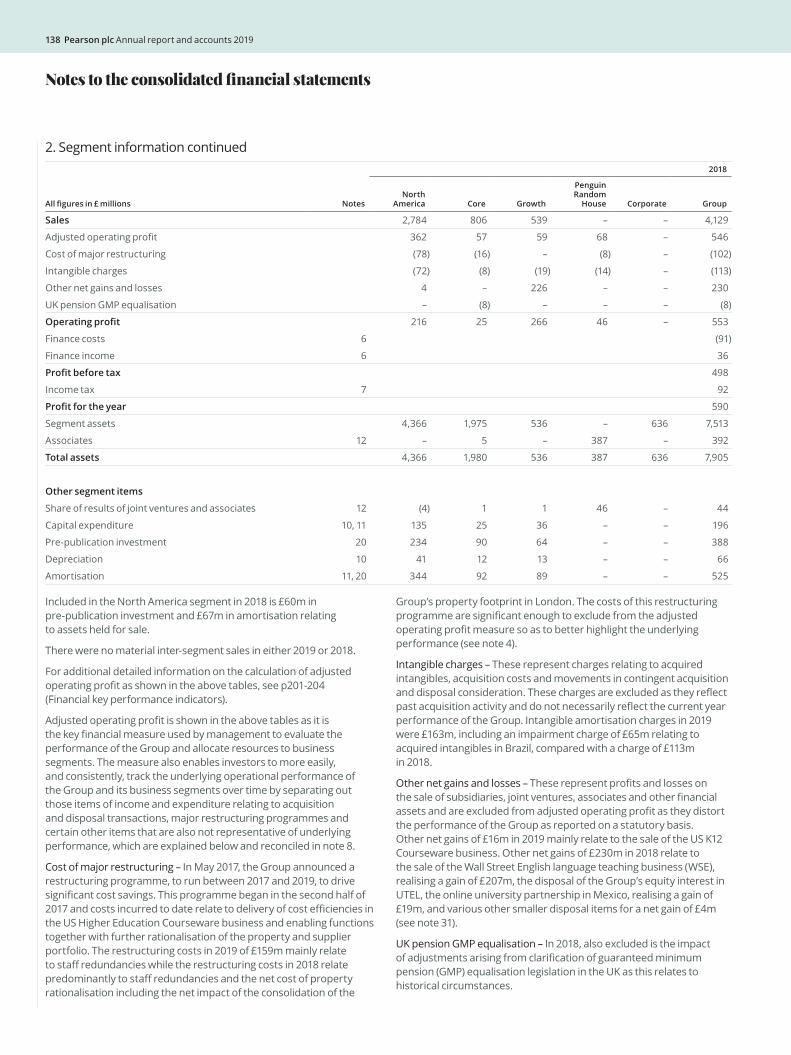
138 Pearson plc Annual report and accounts 2019
2. Segment information continued
All figures in £ millions Notes
2018
North America Core Growth
Penguin Random
House Corporate Group
Sales 2,784 806 539 – – 4,129
Adjusted operating profit 362 57 59 68 – 546
Cost of major restructuring (78) (16) – (8) – (102)
Intangible charges (72) (8) (19) (14) – (113)
Other net gains and losses 4 – 226 – – 230
UK pension GMP equalisation – (8) – – – (8)
Operating profit 216 25 266 46 – 553
Finance costs 6 (91)
Finance income 6 36
Profit before tax 498
Income tax 7 92
Profit for the year 590
Segment assets 4,366 1,975 536 – 636 7,513
Associates 12 – 5 – 387 – 392
Total assets 4,366 1,980 536 387 636 7,905
Other segment items
Share of results of joint ventures and associates 12 (4) 1 1 46 – 44
Capital expenditure 10, 11 135 25 36 – – 196
Pre-publication investment 20 234 90 64 – – 388
Depreciation 10 41 12 13 – – 66
Amortisation 11, 20 344 92 89 – – 525
Included in the North America segment in 2018 is £60m in pre-publication investment and £67m in amortisation relating to assets held for sale.
There were no material inter-segment sales in either 2019 or 2018.
For additional detailed information on the calculation of adjusted operating profit as shown in the above tables, see p201-204 (Financial key performance indicators).
Adjusted operating profit is shown in the above tables as it is the key financial measure used by management to evaluate the performance of the Group and allocate resources to business segments. The measure also enables investors to more easily, and consistently, track the underlying operational performance of the Group and its business segments over time by separating out those items of income and expenditure relating to acquisition and disposal transactions, major restructuring programmes and certain other items that are also not representative of underlying performance, which are explained below and reconciled in note 8.
Cost of major restructuring – In May 2017, the Group announced a restructuring programme, to run between 2017 and 2019, to drive significant cost savings. This programme began in the second half of 2017 and costs incurred to date relate to delivery of cost efficiencies in the US Higher Education Courseware business and enabling functions together with further rationalisation of the property and supplier portfolio. The restructuring costs in 2019 of £159m mainly relate to staff redundancies while the restructuring costs in 2018 relate predominantly to staff redundancies and the net cost of property rationalisation including the net impact of the consolidation of the
Group’s property footprint in London. The costs of this restructuring programme are significant enough to exclude from the adjusted operating profit measure so as to better highlight the underlying performance (see note 4).
Intangible charges – These represent charges relating to acquired intangibles, acquisition costs and movements in contingent acquisition and disposal consideration. These charges are excluded as they reflect past acquisition activity and do not necessarily reflect the current year performance of the Group. Intangible amortisation charges in 2019 were £163m, including an impairment charge of £65m relating to acquired intangibles in Brazil, compared with a charge of £113m in 2018.
Other net gains and losses – These represent profits and losses on the sale of subsidiaries, joint ventures, associates and other financial assets and are excluded from adjusted operating profit as they distort the performance of the Group as reported on a statutory basis. Other net gains of £16m in 2019 mainly relate to the sale of the US K12 Courseware business. Other net gains of £230m in 2018 relate to the sale of the Wall Street English language teaching business (WSE), realising a gain of £207m, the disposal of the Group’s equity interest in UTEL, the online university partnership in Mexico, realising a gain of £19m, and various other smaller disposal items for a net gain of £4m (see note 31).
UK pension GMP equalisation – In 2018, also excluded is the impact of adjustments arising from clarification of guaranteed minimum pension (GMP) equalisation legislation in the UK as this relates to historical circumstances.
Notes to the consolidated financial statements
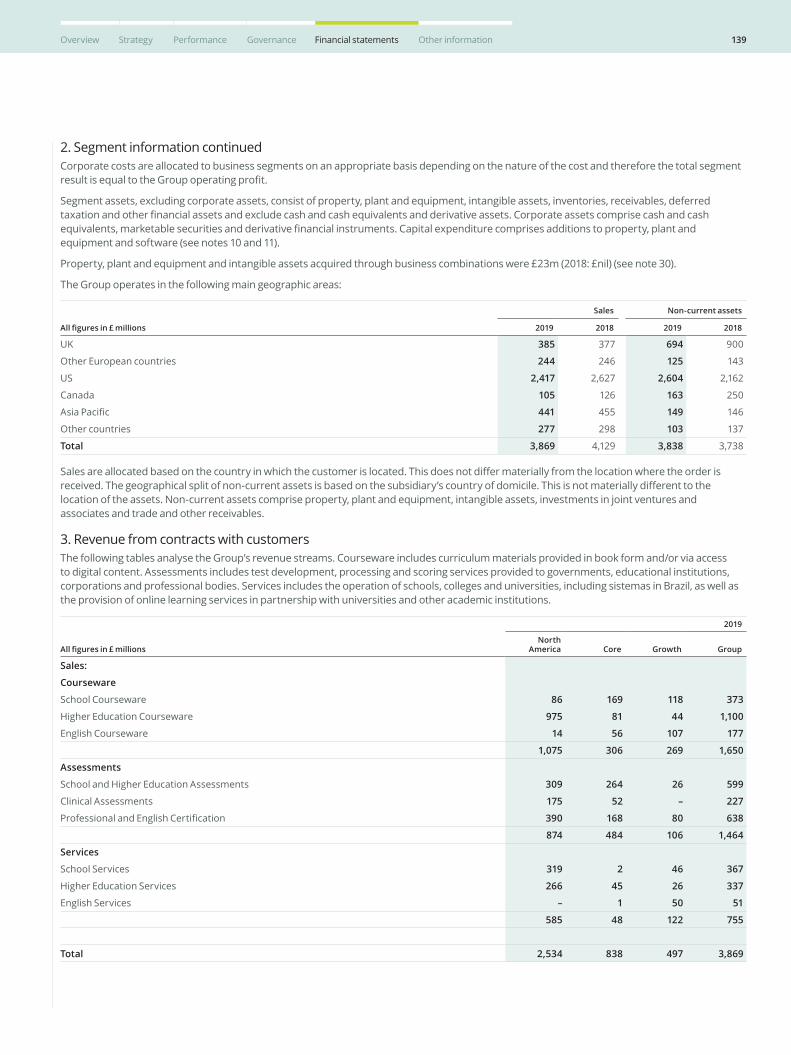
139Overview Strategy Performance Governance Financial statements Other information
2. Segment information continuedCorporate costs are allocated to business segments on an appropriate basis depending on the nature of the cost and therefore the total segment result is equal to the Group operating profit.
Segment assets, excluding corporate assets, consist of property, plant and equipment, intangible assets, inventories, receivables, deferred taxation and other financial assets and exclude cash and cash equivalents and derivative assets. Corporate assets comprise cash and cash equivalents, marketable securities and derivative financial instruments. Capital expenditure comprises additions to property, plant and equipment and software (see notes 10 and 11).
Property, plant and equipment and intangible assets acquired through business combinations were £23m (2018: £nil) (see note 30).
The Group operates in the following main geographic areas:
All figures in £ millions
Sales Non-current assets
2019 2018 2019 2018
UK 385 377 694 900
Other European countries 244 246 125 143
US 2,417 2,627 2,604 2,162
Canada 105 126 163 250
Asia Pacific 441 455 149 146
Other countries 277 298 103 137
Total 3,869 4,129 3,838 3,738
Sales are allocated based on the country in which the customer is located. This does not differ materially from the location where the order is received. The geographical split of non-current assets is based on the subsidiary’s country of domicile. This is not materially different to the location of the assets. Non-current assets comprise property, plant and equipment, intangible assets, investments in joint ventures and associates and trade and other receivables.
3. Revenue from contracts with customersThe following tables analyse the Group’s revenue streams. Courseware includes curriculum materials provided in book form and/or via access to digital content. Assessments includes test development, processing and scoring services provided to governments, educational institutions, corporations and professional bodies. Services includes the operation of schools, colleges and universities, including sistemas in Brazil, as well as the provision of online learning services in partnership with universities and other academic institutions.
All figures in £ millions
2019
North America Core Growth Group
Sales:
Courseware
School Courseware 86 169 118 373
Higher Education Courseware 975 81 44 1,100
English Courseware 14 56 107 177
1,075 306 269 1,650
Assessments
School and Higher Education Assessments 309 264 26 599
Clinical Assessments 175 52 – 227
Professional and English Certification 390 168 80 638
874 484 106 1,464
Services
School Services 319 2 46 367
Higher Education Services 266 45 26 337
English Services – 1 50 51
585 48 122 755
Total 2,534 838 497 3,869
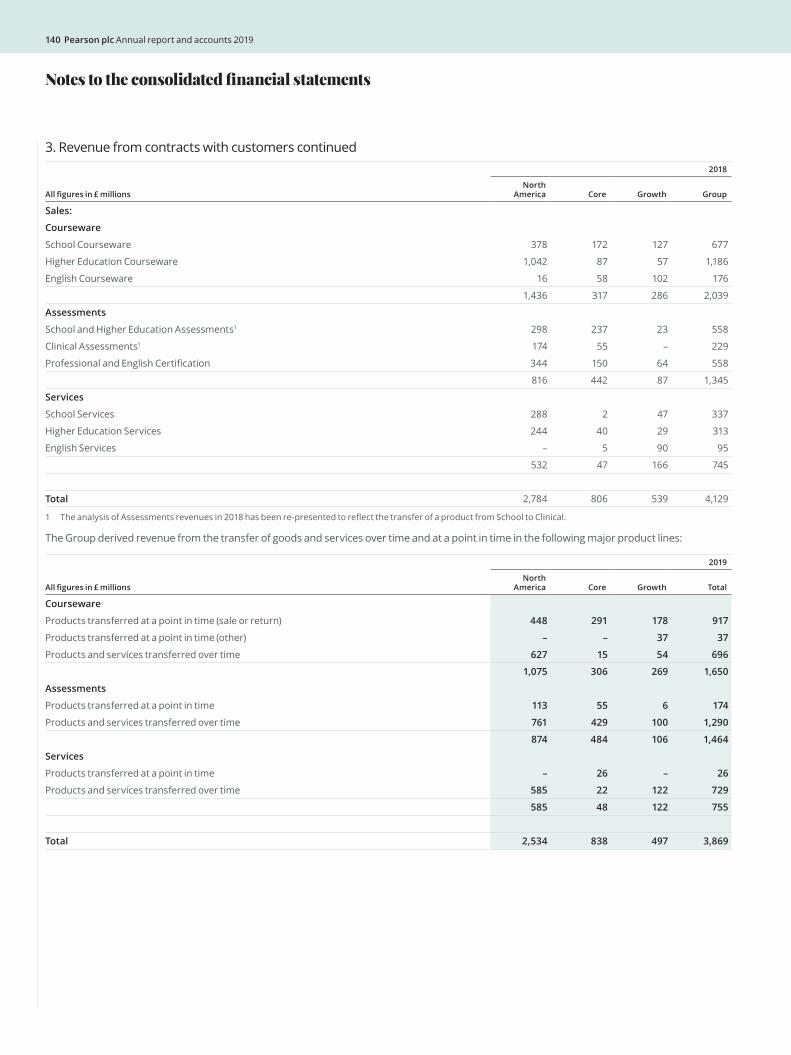
140 Pearson plc Annual report and accounts 2019
3. Revenue from contracts with customers continued
All figures in £ millions
2018
North America Core Growth Group
Sales:
Courseware
School Courseware 378 172 127 677
Higher Education Courseware 1,042 87 57 1,186
English Courseware 16 58 102 176
1,436 317 286 2,039
Assessments
School and Higher Education Assessments1 298 237 23 558
Clinical Assessments1 174 55 – 229
Professional and English Certification 344 150 64 558
816 442 87 1,345
Services
School Services 288 2 47 337
Higher Education Services 244 40 29 313
English Services – 5 90 95
532 47 166 745
Total 2,784 806 539 4,129
1 The analysis of Assessments revenues in 2018 has been re-presented to reflect the transfer of a product from School to Clinical.
The Group derived revenue from the transfer of goods and services over time and at a point in time in the following major product lines:
All figures in £ millions
2019
North America Core Growth Total
Courseware
Products transferred at a point in time (sale or return) 448 291 178 917
Products transferred at a point in time (other) – – 37 37
Products and services transferred over time 627 15 54 696
1,075 306 269 1,650
Assessments
Products transferred at a point in time 113 55 6 174
Products and services transferred over time 761 429 100 1,290
874 484 106 1,464
Services
Products transferred at a point in time – 26 – 26
Products and services transferred over time 585 22 122 729
585 48 122 755
Total 2,534 838 497 3,869
Notes to the consolidated financial statements
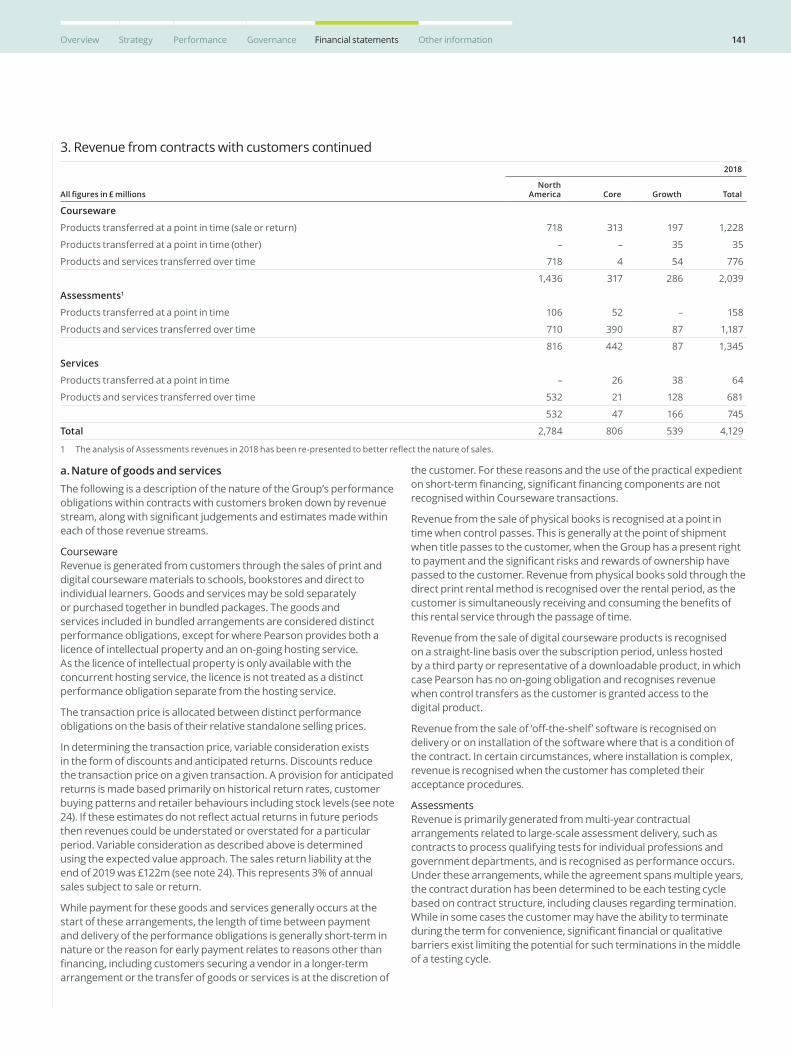
141Overview Strategy Performance Governance Financial statements Other information
3. Revenue from contracts with customers continued
All figures in £ millions
2018
North America Core Growth Total
Courseware
Products transferred at a point in time (sale or return) 718 313 197 1,228
Products transferred at a point in time (other) – – 35 35
Products and services transferred over time 718 4 54 776
1,436 317 286 2,039
Assessments1
Products transferred at a point in time 106 52 – 158
Products and services transferred over time 710 390 87 1,187
816 442 87 1,345
Services
Products transferred at a point in time – 26 38 64
Products and services transferred over time 532 21 128 681
532 47 166 745
Total 2,784 806 539 4,129
1 The analysis of Assessments revenues in 2018 has been re-presented to better reflect the nature of sales.
a. Nature of goods and servicesThe following is a description of the nature of the Group’s performance obligations within contracts with customers broken down by revenue stream, along with significant judgements and estimates made within each of those revenue streams.
CoursewareRevenue is generated from customers through the sales of print and digital courseware materials to schools, bookstores and direct to individual learners. Goods and services may be sold separately or purchased together in bundled packages. The goods and services included in bundled arrangements are considered distinct performance obligations, except for where Pearson provides both a licence of intellectual property and an on-going hosting service. As the licence of intellectual property is only available with the concurrent hosting service, the licence is not treated as a distinct performance obligation separate from the hosting service.
The transaction price is allocated between distinct performance obligations on the basis of their relative standalone selling prices.
In determining the transaction price, variable consideration exists in the form of discounts and anticipated returns. Discounts reduce the transaction price on a given transaction. A provision for anticipated returns is made based primarily on historical return rates, customer buying patterns and retailer behaviours including stock levels (see note 24). If these estimates do not reflect actual returns in future periods then revenues could be understated or overstated for a particular period. Variable consideration as described above is determined using the expected value approach. The sales return liability at the end of 2019 was £122m (see note 24). This represents 3% of annual sales subject to sale or return.
While payment for these goods and services generally occurs at the start of these arrangements, the length of time between payment and delivery of the performance obligations is generally short-term in nature or the reason for early payment relates to reasons other than financing, including customers securing a vendor in a longer-term arrangement or the transfer of goods or services is at the discretion of
the customer. For these reasons and the use of the practical expedient on short-term financing, significant financing components are not recognised within Courseware transactions.
Revenue from the sale of physical books is recognised at a point in time when control passes. This is generally at the point of shipment when title passes to the customer, when the Group has a present right to payment and the significant risks and rewards of ownership have passed to the customer. Revenue from physical books sold through the direct print rental method is recognised over the rental period, as the customer is simultaneously receiving and consuming the benefits of this rental service through the passage of time.
Revenue from the sale of digital courseware products is recognised on a straight-line basis over the subscription period, unless hosted by a third party or representative of a downloadable product, in which case Pearson has no on-going obligation and recognises revenue when control transfers as the customer is granted access to the digital product.
Revenue from the sale of ‘off-the-shelf’ software is recognised on delivery or on installation of the software where that is a condition of the contract. In certain circumstances, where installation is complex, revenue is recognised when the customer has completed their acceptance procedures.
AssessmentsRevenue is primarily generated from multi-year contractual arrangements related to large-scale assessment delivery, such as contracts to process qualifying tests for individual professions and government departments, and is recognised as performance occurs. Under these arrangements, while the agreement spans multiple years, the contract duration has been determined to be each testing cycle based on contract structure, including clauses regarding termination. While in some cases the customer may have the ability to terminate during the term for convenience, significant financial or qualitative barriers exist limiting the potential for such terminations in the middle of a testing cycle.
142 Pearson plc Annual report and accounts 2019
3. Revenue from contracts with customers continueda. Nature of goods and services continuedWithin each testing cycle, a variety of service activities are performed such as test administration, delivery, scoring, reporting, item development, operational services and programme management. These services are not treated as distinct in the context of the customer contract as Pearson provides an integrated managed service offering and these activities are accounted for together as one comprehensive performance obligation.
Within each testing cycle, the transaction price may contain both fixed and variable amounts. Variable consideration within these transactions primarily relates to expected testing volumes to be delivered in the cycle. The assumptions, risks and uncertainties inherent to long-term contract accounting can affect the amounts and timing of revenue and related expenses reported. Variable consideration is measured using the expected value method, except where amounts are contingent upon a future event’s occurrence, such as performance bonuses. Such event-driven contingency payments are measured using the most likely amount approach. To the extent that a higher degree of uncertainty exists regarding variable consideration, these amounts are excluded from the transaction price and expensed when the uncertainty is reasonably removed.
Customer payments are generally defined in the contract through a payment schedule, which may require customer acceptance for services rendered. Pearson has a history of providing satisfactory services which are accepted by the customer. While a delay between rendering of services and payment may exist, payment terms are within 12 months and the Group has elected to use the practical expedient available in IFRS 15 Revenue from Contracts with Customers and not identify a significant financing component on these transactions.
Revenue is recognised for Assessment contracts over time as the customer is benefiting as performance takes place through a continuous transfer of control to the customer. This continuous transfer of control to the customer is supported by clauses in the contracts which may allow the customer to terminate for convenience, compensate us for work performed to date, and take possession of work in process.
As control transfers over time, revenue is recognised based on the extent of progress towards completion of the performance obligation. The selection of the method to measure progress towards completion requires judgement and is based on the nature of the services provided. Revenue is recognised on a percentage completion basis, calculated using the proportion of the total estimated costs incurred to date. Percentage of completion is used to recognise the transfer of control of services provided as these services are not provided evenly throughout the testing cycle and involve varying degrees of effort during the term.
Losses on contracts are recognised in the period in which the loss first becomes foreseeable. Contract losses are determined to be the amount by which estimated total costs of the contract exceed the estimated total revenues that will be generated.
In Assessments contracts driven primarily by transactions directly to end users, Pearson’s main obligation to the customer involves test delivery and scoring. Test delivery and scoring are defined as a single performance obligation delivered over time whether the test is subsequently manually scored or digitally scored on the day of the assessment. Customers may also purchase print and digital supplemental materials. Print products in this revenue stream are recognised at a point in time when control passes to the customer upon shipment. Recognition of digital revenue will occur based on the extent of Pearson’s on-going hosting obligation.
ServicesRevenue is primarily generated from multi-year contractual arrangements related to large-scale educational service delivery to academic institutions, such as schools and higher education universities. Under these arrangements, while an agreement may span multiple years, the contract duration has been determined to be each academic period based on the structure of contracts, including clauses regarding termination. While in some cases the customer may have the ability to terminate during the term for convenience, significant financial or qualitative barriers exist limiting the potential for such terminations in the middle of an academic period. The academic period for this customer base is normally an academic year for schools and a semester for higher education universities.
Within each academic period, a variety of services are provided such as programme development, student acquisition, education technology and student support services. These services are not distinct in the context of the customer contract as Pearson provides an integrated managed service offering and these activities are accounted for together as a comprehensive performance obligation.
Where Services are provided to university customers, volume and transaction price are fixed at the start of the semester. Where Services are provided to School customers, the transaction price may contain both fixed and variable amounts which require estimation during the academic period. Estimation is required where consideration is based upon average enrolments or other metrics which are not known at the start of the academic year. Variable consideration is measured using the expected value method. To the extent that a higher degree of uncertainty exists regarding variable consideration, these amounts are excluded from the transaction price and recognised when the uncertainty is reasonably removed.
Customer payments are generally defined in the contract as occurring shortly after invoicing. Where there is a longer payment term offered to a customer through a payment schedule, payment terms are within 12 months and the Group has elected to use the practical expedient available in IFRS 15 and not identify a significant financing component on these transactions.
Revenue is recognised for Service contracts over time as the customer is benefiting as performance takes place through a continuous transfer of control to the customer. This continuous transfer of control to the customer is supported by clauses in the contracts which may allow the customer to terminate for convenience, compensate for work performed to date, and take possession of work in process.
Notes to the consolidated financial statements
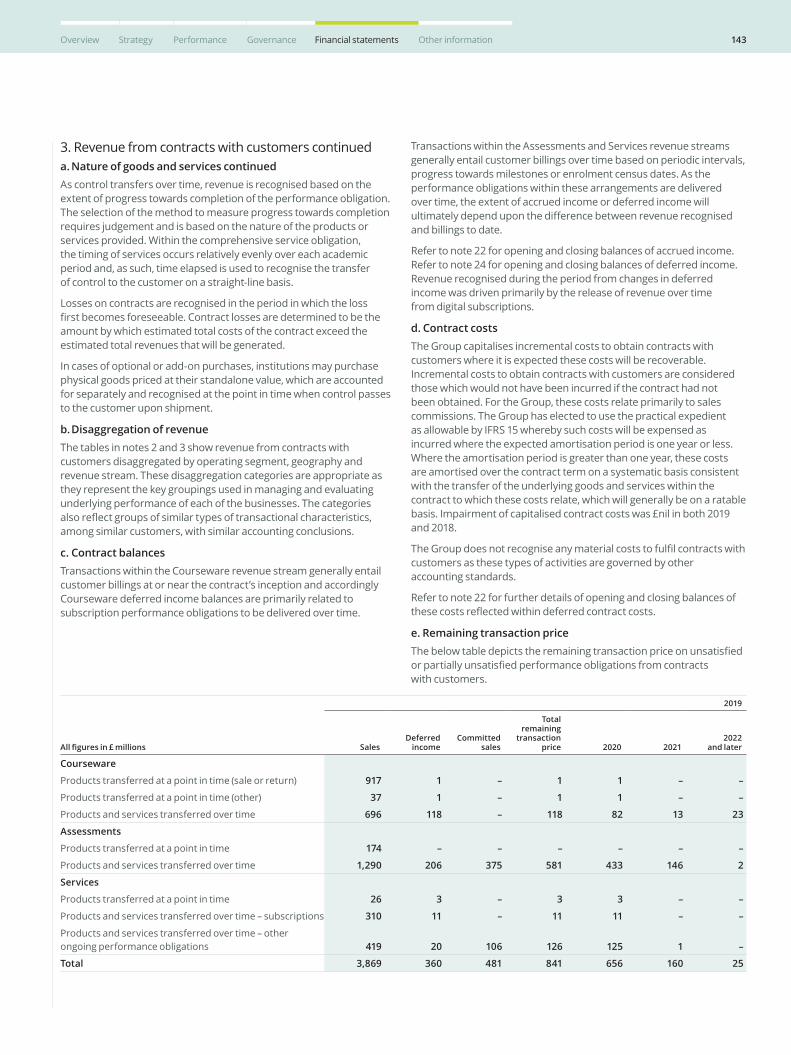
143Overview Strategy Performance Governance Financial statements Other information
3. Revenue from contracts with customers continueda. Nature of goods and services continuedAs control transfers over time, revenue is recognised based on the extent of progress towards completion of the performance obligation. The selection of the method to measure progress towards completion requires judgement and is based on the nature of the products or services provided. Within the comprehensive service obligation, the timing of services occurs relatively evenly over each academic period and, as such, time elapsed is used to recognise the transfer of control to the customer on a straight-line basis.
Losses on contracts are recognised in the period in which the loss first becomes foreseeable. Contract losses are determined to be the amount by which estimated total costs of the contract exceed the estimated total revenues that will be generated.
In cases of optional or add-on purchases, institutions may purchase physical goods priced at their standalone value, which are accounted for separately and recognised at the point in time when control passes to the customer upon shipment.
b. Disaggregation of revenueThe tables in notes 2 and 3 show revenue from contracts with customers disaggregated by operating segment, geography and revenue stream. These disaggregation categories are appropriate as they represent the key groupings used in managing and evaluating underlying performance of each of the businesses. The categories also reflect groups of similar types of transactional characteristics, among similar customers, with similar accounting conclusions.
c. Contract balancesTransactions within the Courseware revenue stream generally entail customer billings at or near the contract’s inception and accordingly Courseware deferred income balances are primarily related to subscription performance obligations to be delivered over time.
Transactions within the Assessments and Services revenue streams generally entail customer billings over time based on periodic intervals, progress towards milestones or enrolment census dates. As the performance obligations within these arrangements are delivered over time, the extent of accrued income or deferred income will ultimately depend upon the difference between revenue recognised and billings to date.
Refer to note 22 for opening and closing balances of accrued income. Refer to note 24 for opening and closing balances of deferred income. Revenue recognised during the period from changes in deferred income was driven primarily by the release of revenue over time from digital subscriptions.
d. Contract costsThe Group capitalises incremental costs to obtain contracts with customers where it is expected these costs will be recoverable. Incremental costs to obtain contracts with customers are considered those which would not have been incurred if the contract had not been obtained. For the Group, these costs relate primarily to sales commissions. The Group has elected to use the practical expedient as allowable by IFRS 15 whereby such costs will be expensed as incurred where the expected amortisation period is one year or less. Where the amortisation period is greater than one year, these costs are amortised over the contract term on a systematic basis consistent with the transfer of the underlying goods and services within the contract to which these costs relate, which will generally be on a ratable basis. Impairment of capitalised contract costs was £nil in both 2019 and 2018.
The Group does not recognise any material costs to fulfil contracts with customers as these types of activities are governed by other accounting standards.
Refer to note 22 for further details of opening and closing balances of these costs reflected within deferred contract costs.
e. Remaining transaction priceThe below table depicts the remaining transaction price on unsatisfied or partially unsatisfied performance obligations from contracts with customers.
All figures in £ millions
2019
SalesDeferred
incomeCommitted
sales
Total remaining
transaction price 2020 2021
2022 and later
Courseware
Products transferred at a point in time (sale or return) 917 1 – 1 1 – –
Products transferred at a point in time (other) 37 1 – 1 1 – –
Products and services transferred over time 696 118 – 118 82 13 23
Assessments
Products transferred at a point in time 174 – – – – – –
Products and services transferred over time 1,290 206 375 581 433 146 2
Services
Products transferred at a point in time 26 3 – 3 3 – –
Products and services transferred over time – subscriptions 310 11 – 11 11 – –
Products and services transferred over time – other ongoing performance obligations 419 20 106 126 125 1 –
Total 3,869 360 481 841 656 160 25
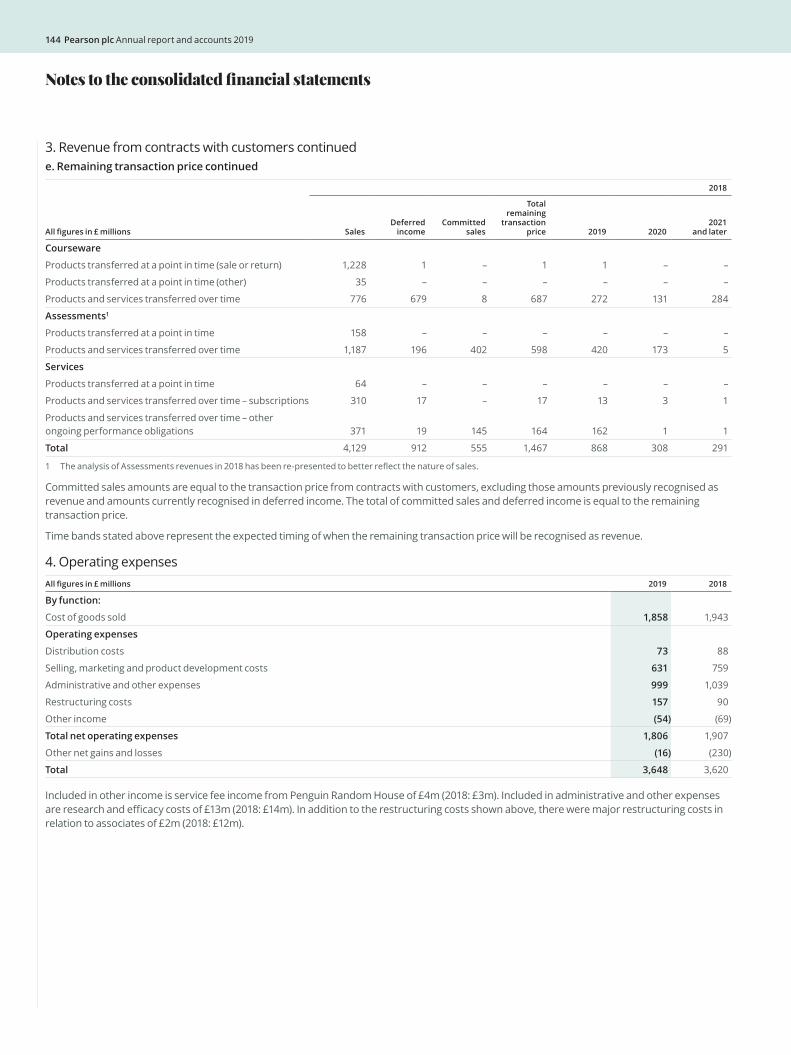
144 Pearson plc Annual report and accounts 2019
3. Revenue from contracts with customers continuede. Remaining transaction price continued
All figures in £ millions
2018
SalesDeferred
incomeCommitted
sales
Total remaining
transaction price 2019 2020
2021 and later
Courseware
Products transferred at a point in time (sale or return) 1,228 1 – 1 1 – –
Products transferred at a point in time (other) 35 – – – – – –
Products and services transferred over time 776 679 8 687 272 131 284
Assessments1
Products transferred at a point in time 158 – – – – – –
Products and services transferred over time 1,187 196 402 598 420 173 5
Services
Products transferred at a point in time 64 – – – – – –
Products and services transferred over time – subscriptions 310 17 – 17 13 3 1
Products and services transferred over time – other ongoing performance obligations 371 19 145 164 162 1 1
Total 4,129 912 555 1,467 868 308 291
1 The analysis of Assessments revenues in 2018 has been re-presented to better reflect the nature of sales.
Committed sales amounts are equal to the transaction price from contracts with customers, excluding those amounts previously recognised as revenue and amounts currently recognised in deferred income. The total of committed sales and deferred income is equal to the remaining transaction price.
Time bands stated above represent the expected timing of when the remaining transaction price will be recognised as revenue.
4. Operating expensesAll figures in £ millions 2019 2018
By function:
Cost of goods sold 1,858 1,943
Operating expenses
Distribution costs 73 88
Selling, marketing and product development costs 631 759
Administrative and other expenses 999 1,039
Restructuring costs 157 90
Other income (54) (69)
Total net operating expenses 1,806 1,907
Other net gains and losses (16) (230)
Total 3,648 3,620
Included in other income is service fee income from Penguin Random House of £4m (2018: £3m). Included in administrative and other expenses are research and efficacy costs of £13m (2018: £14m). In addition to the restructuring costs shown above, there were major restructuring costs in relation to associates of £2m (2018: £12m).
Notes to the consolidated financial statements
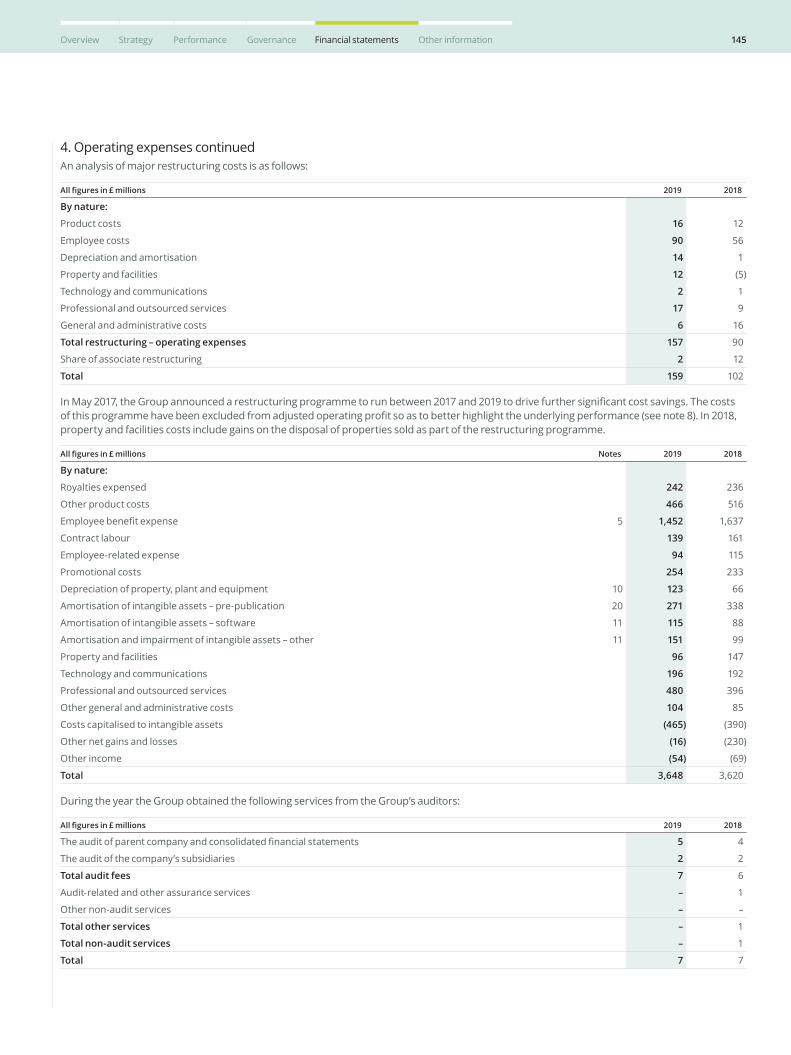
145Overview Strategy Performance Governance Financial statements Other information
4. Operating expenses continuedAn analysis of major restructuring costs is as follows:
All figures in £ millions 2019 2018
By nature:
Product costs 16 12
Employee costs 90 56
Depreciation and amortisation 14 1
Property and facilities 12 (5)
Technology and communications 2 1
Professional and outsourced services 17 9
General and administrative costs 6 16
Total restructuring – operating expenses 157 90
Share of associate restructuring 2 12
Total 159 102
In May 2017, the Group announced a restructuring programme to run between 2017 and 2019 to drive further significant cost savings. The costs of this programme have been excluded from adjusted operating profit so as to better highlight the underlying performance (see note 8). In 2018, property and facilities costs include gains on the disposal of properties sold as part of the restructuring programme.
All figures in £ millions Notes 2019 2018
By nature:
Royalties expensed 242 236
Other product costs 466 516
Employee benefit expense 5 1,452 1,637
Contract labour 139 161
Employee-related expense 94 115
Promotional costs 254 233
Depreciation of property, plant and equipment 10 123 66
Amortisation of intangible assets – pre-publication 20 271 338
Amortisation of intangible assets – software 11 115 88
Amortisation and impairment of intangible assets – other 11 151 99
Property and facilities 96 147
Technology and communications 196 192
Professional and outsourced services 480 396
Other general and administrative costs 104 85
Costs capitalised to intangible assets (465) (390)
Other net gains and losses (16) (230)
Other income (54) (69)
Total 3,648 3,620
During the year the Group obtained the following services from the Group’s auditors:
All figures in £ millions 2019 2018
The audit of parent company and consolidated financial statements 5 4
The audit of the company’s subsidiaries 2 2
Total audit fees 7 6
Audit-related and other assurance services – 1
Other non-audit services – –
Total other services – 1
Total non-audit services – 1
Total 7 7
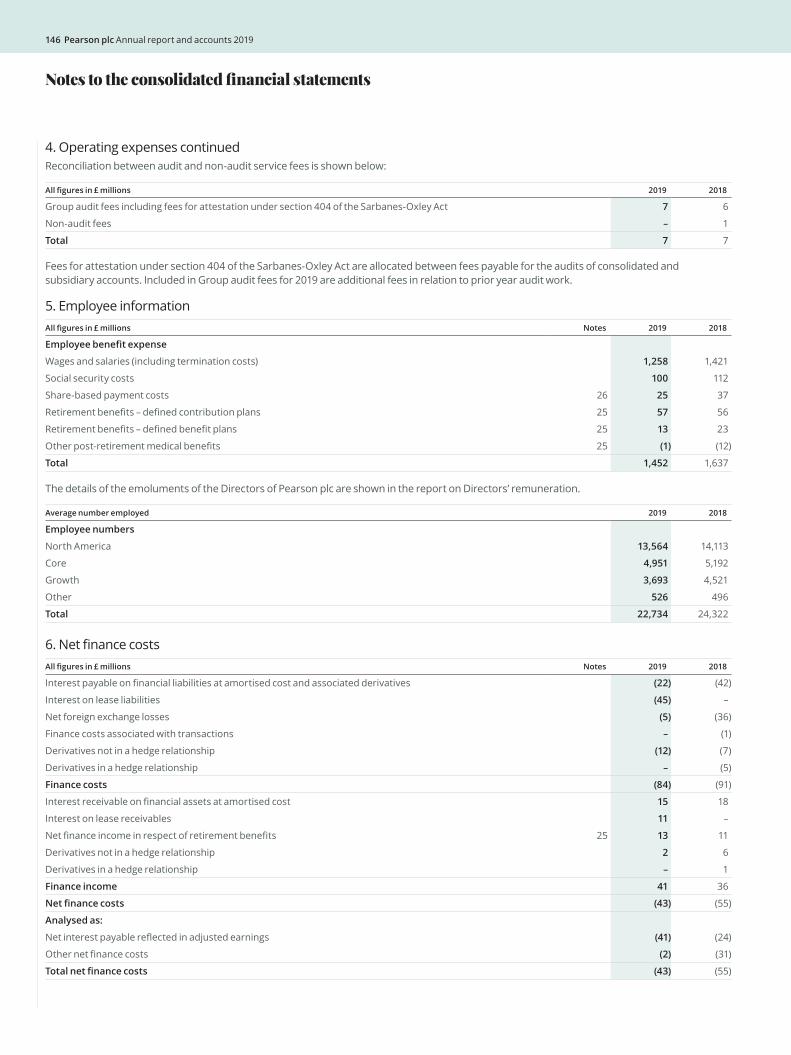
146 Pearson plc Annual report and accounts 2019
4. Operating expenses continuedReconciliation between audit and non-audit service fees is shown below:
All figures in £ millions 2019 2018
Group audit fees including fees for attestation under section 404 of the Sarbanes-Oxley Act 7 6
Non-audit fees – 1
Total 7 7
Fees for attestation under section 404 of the Sarbanes-Oxley Act are allocated between fees payable for the audits of consolidated and subsidiary accounts. Included in Group audit fees for 2019 are additional fees in relation to prior year audit work.
5. Employee informationAll figures in £ millions Notes 2019 2018
Employee benefit expense
Wages and salaries (including termination costs) 1,258 1,421
Social security costs 100 112
Share-based payment costs 26 25 37
Retirement benefits – defined contribution plans 25 57 56
Retirement benefits – defined benefit plans 25 13 23
Other post-retirement medical benefits 25 (1) (12)
Total 1,452 1,637
The details of the emoluments of the Directors of Pearson plc are shown in the report on Directors’ remuneration.
Average number employed 2019 2018
Employee numbers
North America 13,564 14,113
Core 4,951 5,192
Growth 3,693 4,521
Other 526 496
Total 22,734 24,322
6. Net finance costsAll figures in £ millions Notes 2019 2018
Interest payable on financial liabilities at amortised cost and associated derivatives (22) (42)
Interest on lease liabilities (45) –
Net foreign exchange losses (5) (36)
Finance costs associated with transactions – (1)
Derivatives not in a hedge relationship (12) (7)
Derivatives in a hedge relationship – (5)
Finance costs (84) (91)
Interest receivable on financial assets at amortised cost 15 18
Interest on lease receivables 11 –
Net finance income in respect of retirement benefits 25 13 11
Derivatives not in a hedge relationship 2 6
Derivatives in a hedge relationship – 1
Finance income 41 36
Net finance costs (43) (55)
Analysed as:
Net interest payable reflected in adjusted earnings (41) (24)
Other net finance costs (2) (31)
Total net finance costs (43) (55)
Notes to the consolidated financial statements
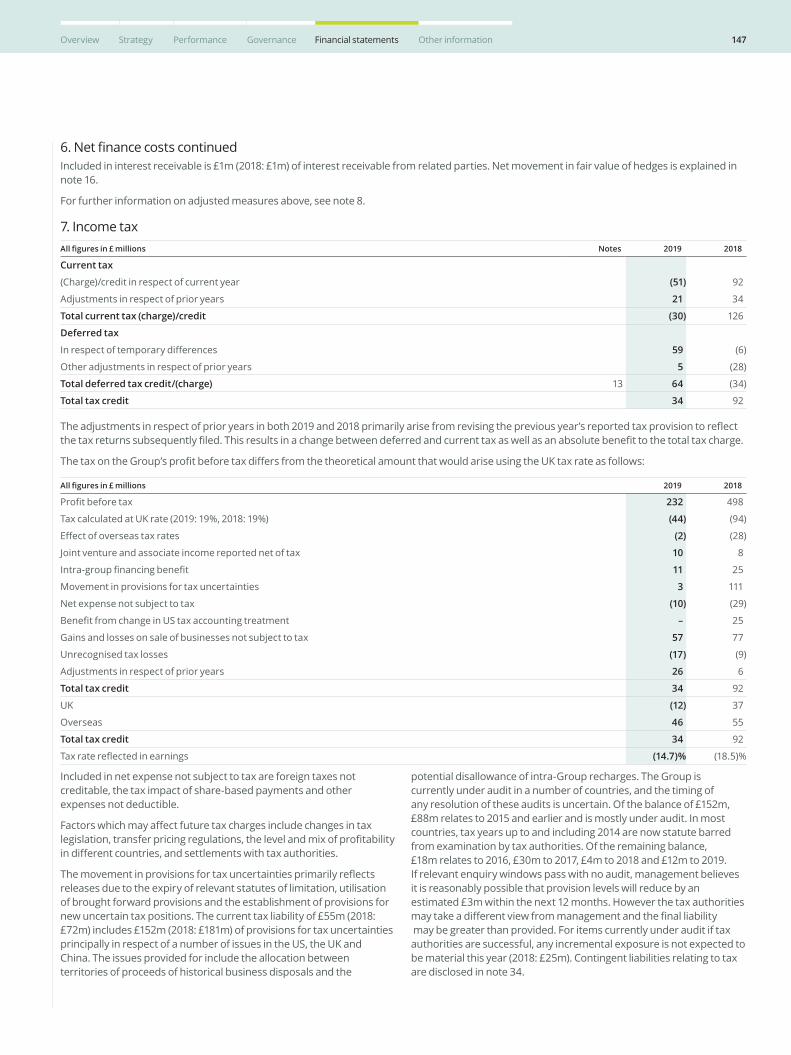
147Overview Strategy Performance Governance Financial statements Other information
6. Net finance costs continuedIncluded in interest receivable is £1m (2018: £1m) of interest receivable from related parties. Net movement in fair value of hedges is explained in note 16.
For further information on adjusted measures above, see note 8.
7. Income taxAll figures in £ millions Notes 2019 2018
Current tax
(Charge)/credit in respect of current year (51) 92
Adjustments in respect of prior years 21 34
Total current tax (charge)/credit (30) 126
Deferred tax
In respect of temporary differences 59 (6)
Other adjustments in respect of prior years 5 (28)
Total deferred tax credit/(charge) 13 64 (34)
Total tax credit 34 92
The adjustments in respect of prior years in both 2019 and 2018 primarily arise from revising the previous year’s reported tax provision to reflect the tax returns subsequently filed. This results in a change between deferred and current tax as well as an absolute benefit to the total tax charge.
The tax on the Group’s profit before tax differs from the theoretical amount that would arise using the UK tax rate as follows:
All figures in £ millions 2019 2018
Profit before tax 232 498
Tax calculated at UK rate (2019: 19%, 2018: 19%) (44) (94)
Effect of overseas tax rates (2) (28)
Joint venture and associate income reported net of tax 10 8
Intra-group financing benefit 11 25
Movement in provisions for tax uncertainties 3 111
Net expense not subject to tax (10) (29)
Benefit from change in US tax accounting treatment – 25
Gains and losses on sale of businesses not subject to tax 57 77
Unrecognised tax losses (17) (9)
Adjustments in respect of prior years 26 6
Total tax credit 34 92
UK (12) 37
Overseas 46 55
Total tax credit 34 92
Tax rate reflected in earnings (14.7)% (18.5)%
Included in net expense not subject to tax are foreign taxes not creditable, the tax impact of share-based payments and other expenses not deductible.
Factors which may affect future tax charges include changes in tax legislation, transfer pricing regulations, the level and mix of profitability in different countries, and settlements with tax authorities.
The movement in provisions for tax uncertainties primarily reflects releases due to the expiry of relevant statutes of limitation, utilisation of brought forward provisions and the establishment of provisions for new uncertain tax positions. The current tax liability of £55m (2018: £72m) includes £152m (2018: £181m) of provisions for tax uncertainties principally in respect of a number of issues in the US, the UK and China. The issues provided for include the allocation between territories of proceeds of historical business disposals and the
potential disallowance of intra-Group recharges. The Group is currently under audit in a number of countries, and the timing of any resolution of these audits is uncertain. Of the balance of £152m, £88m relates to 2015 and earlier and is mostly under audit. In most countries, tax years up to and including 2014 are now statute barred from examination by tax authorities. Of the remaining balance, £18m relates to 2016, £30m to 2017, £4m to 2018 and £12m to 2019. If relevant enquiry windows pass with no audit, management believes it is reasonably possible that provision levels will reduce by an estimated £3m within the next 12 months. However the tax authorities may take a different view from management and the final liability may be greater than provided. For items currently under audit if tax authorities are successful, any incremental exposure is not expected to be material this year (2018: £25m). Contingent liabilities relating to tax are disclosed in note 34.
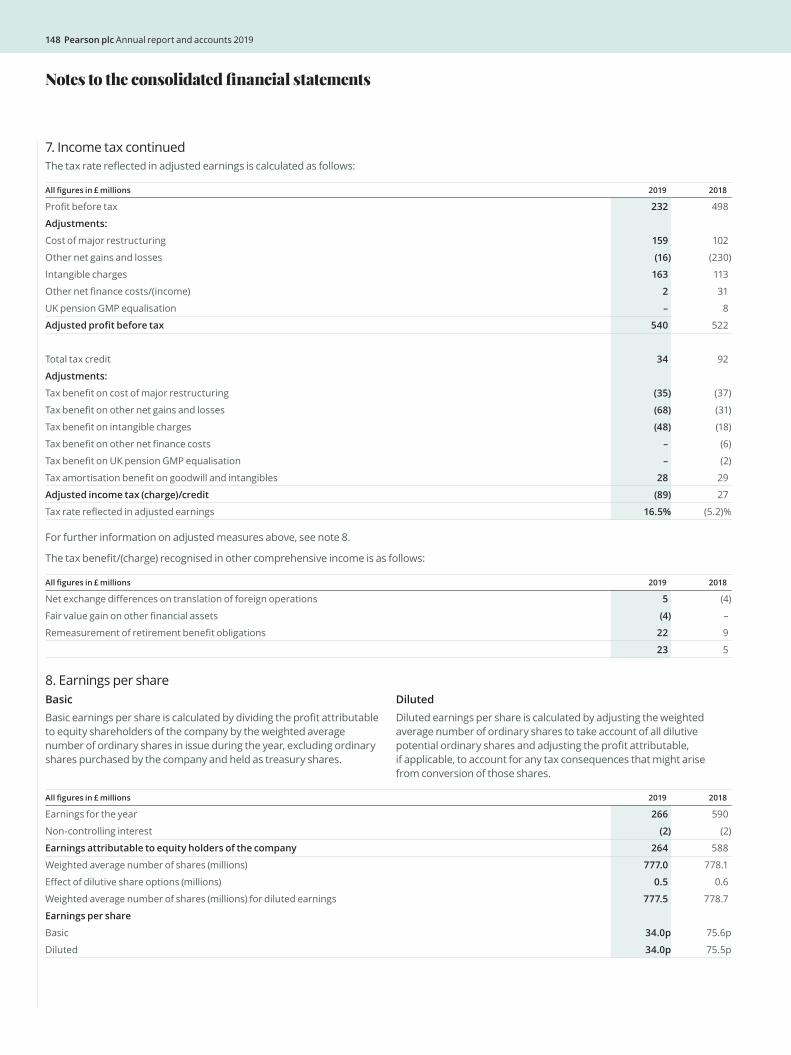
148 Pearson plc Annual report and accounts 2019
7. Income tax continuedThe tax rate reflected in adjusted earnings is calculated as follows:
All figures in £ millions 2019 2018
Profit before tax 232 498
Adjustments:
Cost of major restructuring 159 102
Other net gains and losses (16) (230)
Intangible charges 163 113
Other net finance costs/(income) 2 31
UK pension GMP equalisation – 8
Adjusted profit before tax 540 522
Total tax credit 34 92
Adjustments:
Tax benefit on cost of major restructuring (35) (37)
Tax benefit on other net gains and losses (68) (31)
Tax benefit on intangible charges (48) (18)
Tax benefit on other net finance costs – (6)
Tax benefit on UK pension GMP equalisation – (2)
Tax amortisation benefit on goodwill and intangibles 28 29
Adjusted income tax (charge)/credit (89) 27
Tax rate reflected in adjusted earnings 16.5% (5.2)%
For further information on adjusted measures above, see note 8.
The tax benefit/(charge) recognised in other comprehensive income is as follows:
All figures in £ millions 2019 2018
Net exchange differences on translation of foreign operations 5 (4)
Fair value gain on other financial assets (4) –
Remeasurement of retirement benefit obligations 22 9
23 5
8. Earnings per shareBasicBasic earnings per share is calculated by dividing the profit attributable to equity shareholders of the company by the weighted average number of ordinary shares in issue during the year, excluding ordinary shares purchased by the company and held as treasury shares.
DilutedDiluted earnings per share is calculated by adjusting the weighted average number of ordinary shares to take account of all dilutive potential ordinary shares and adjusting the profit attributable, if applicable, to account for any tax consequences that might arise from conversion of those shares.
All figures in £ millions 2019 2018
Earnings for the year 266 590
Non-controlling interest (2) (2)
Earnings attributable to equity holders of the company 264 588
Weighted average number of shares (millions) 777.0 778.1
Effect of dilutive share options (millions) 0.5 0.6
Weighted average number of shares (millions) for diluted earnings 777.5 778.7
Earnings per share
Basic 34.0p 75.6p
Diluted 34.0p 75.5p
Notes to the consolidated financial statements
149Overview Strategy Performance Governance Financial statements Other information
8. Earnings per share continuedAdjustedFor additional detailed information on the calculation of adjusted measures, see p201-204 (Financial key performance indicators). See note 2 for details of specific items excluded from or included in adjusted operating profit in 2019 and 2018.
In order to show results from operating activities on a consistent basis, an adjusted earnings per share is presented. The Group’s definition of adjusted earnings per share may not be comparable with other similarly titled measures reported by other companies.
Adjusted earnings is a non-GAAP (non-statutory) financial measure and is included as it is a key financial measure used by management to evaluate the performance of the Group and allocate resources to business segments. The measure also enables investors to more easily, and consistently, track the underlying operational performance of the Group and its business segments over time by separating out those items of income and expenditure relating to acquisition and disposal transactions, major restructuring programmes and certain other items that are also not representative of underlying performance.
Adjusted earnings per share is calculated as adjusted earnings divided by the weighted average number of shares in issue on an undiluted basis. The following items are excluded from or included in adjusted earnings:
Cost of major restructuring – In May 2017, the Group announced a restructuring programme, to run between 2017 and 2019, to drive significant cost savings. This programme began in the second half of 2017 and costs incurred to date relate to delivery of cost efficiencies in the US Higher Education Courseware business and enabling functions together with further rationalisation of the property and supplier portfolio. The restructuring costs in 2019 of £159m mainly relate to staff redundancies while the restructuring costs in 2018 relate predominantly to staff redundancies and the net cost of property rationalisation including the net cost of the consolidation of the Group’s property footprint in London. The costs of this restructuring programme are significant enough to exclude from the adjusted operating profit measure so as to better highlight the underlying performance (see note 4).
Other net gains and losses – These represent profits and losses on the sale of subsidiaries, joint ventures, associates and other financial assets and are excluded from adjusted earnings as they distort the performance of the Group as reported on a statutory basis. Other net gains of £16m in 2019 mainly relate to the sale of the US K12 Courseware business. Other net gains of £230m in 2018 relate to the sale of the Wall Street English language teaching business (WSE), realising a gain of £207m, the disposal of the Group’s equity interest in UTEL, the online university partnership in Mexico, realising a gain of £19m, and various other smaller disposal items for a net gain of £4m (see note 31).
Intangible charges – These represent charges in respect of intangible assets acquired through business combinations and the direct costs of acquiring those businesses. These charges are excluded as they reflect past acquisition activity and do not necessarily reflect the current year performance of the Group. Intangible amortisation charges in 2019 were £163m, including an impairment charge of £65m relating to acquired intangibles in Brazil, compared with a charge of £113m in 2018.
Other net finance income/costs – These include finance costs in respect of retirement benefits, finance costs of deferred consideration and foreign exchange and other gains and losses. Finance income relating to retirement benefits is excluded as management does not believe that the consolidated income statement presentation under IAS 19 reflects the economic substance of the underlying assets and liabilities. Finance costs associated with transactions are excluded as these relate to future earn-outs or acquisition expenses and are not part of the underlying financing. Foreign exchange and other gains and losses are excluded as they represent short-term fluctuations in market value and are subject to significant volatility. Other gains and losses may not be realised in due course as it is normally the intention to hold the related instruments to maturity. In 2019 and 2018 the foreign exchange gains and losses largely relate to foreign exchange differences on unhedged US dollar and euro loans, cash and cash equivalents.
UK pension GMP equalisation – In 2018, also excluded is the impact of adjustments arising from clarification of guaranteed minimum pension (GMP) equalisation legislation in the UK as this relates to historical circumstances.
Tax – Tax on the above items is excluded from adjusted earnings. Where relevant, the Group also excludes the benefit from recognising previously unrecognised pre-acquisition and capital losses. The tax benefit from tax deductible goodwill and intangibles is added to the adjusted income tax charge as this benefit more accurately aligns the adjusted tax charge with the expected rate of cash tax payments.
Non-controlling interest – Non-controlling interest for the above items is excluded from adjusted earnings.

150 Pearson plc Annual report and accounts 2019
8. Earnings per share continuedAdjusted continuedThe following tables reconcile the statutory income statement to the adjusted income statement.
All figures in £ millions
2019
Statutory income
statement
Cost of major
restructuring
Other net gains and
lossesIntangible
charges
Other net finance
income/ costs
UK pension GMP
equalisation
Tax amortisation
benefit
Adjusted income
statement
Operating profit 275 159 (16) 163 – – – 581
Net finance costs (43) – – – 2 – – (41)
Profit before tax 232 159 (16) 163 2 – – 540
Income tax 34 (35) (68) (48) – – 28 (89)
Profit for the year 266 124 (84) 115 2 – 28 451
Non-controlling interest (2) – – – – – – (2)
Earnings 264 124 (84) 115 2 – 28 449
Weighted average number of shares (millions) 777.0 777.0
Weighted average number of shares (millions) for diluted earnings 777.5 777.5
Earnings per share (basic) 34.0p 57.8p
Earnings per share (diluted) 34.0p 57.7p
All figures in £ millions
2018
Statutory income
statement
Cost of major
restructuring
Other net gains and
lossesIntangible
charges
Other net finance
income/ costs
UK pension GMP
equalisation
Tax amortisation
benefit
Adjusted income
statement
Operating profit 553 102 (230) 113 – 8 – 546
Net finance costs (55) – – – 31 – – (24)
Profit before tax 498 102 (230) 113 31 8 – 522
Income tax 92 (37) (31) (18) (6) (2) 29 27
Profit for the year 590 65 (261) 95 25 6 29 549
Non-controlling interest (2) – – – – – – (2)
Earnings 588 65 (261) 95 25 6 29 547
Weighted average number of shares (millions) 778.1 778.1
Weighted average number of shares (millions) for diluted earnings 778.7 778.7
Earnings per share (basic) 75.6p 70.3p
Earnings per share (diluted) 75.5p 70.2p
Notes to the consolidated financial statements
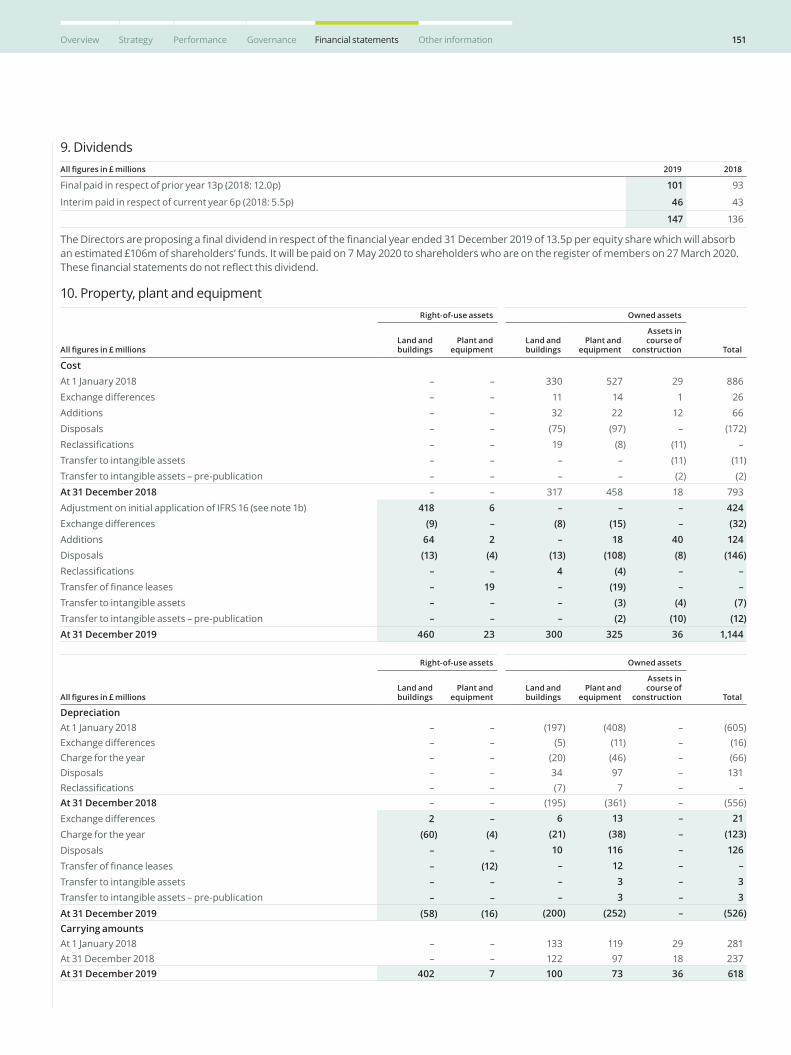
151Overview Strategy Performance Governance Financial statements Other information
9. DividendsAll figures in £ millions 2019 2018
Final paid in respect of prior year 13p (2018: 12.0p) 101 93
Interim paid in respect of current year 6p (2018: 5.5p) 46 43
147 136
The Directors are proposing a final dividend in respect of the financial year ended 31 December 2019 of 13.5p per equity share which will absorb an estimated £106m of shareholders’ funds. It will be paid on 7 May 2020 to shareholders who are on the register of members on 27 March 2020. These financial statements do not reflect this dividend.
10. Property, plant and equipment
All figures in £ millions
Right-of-use assets Owned assets
TotalLand and buildings
Plant and equipment
Land and buildings
Plant and equipment
Assets in course of
construction
CostAt 1 January 2018 – – 330 527 29 886Exchange differences – – 11 14 1 26Additions – – 32 22 12 66Disposals – – (75) (97) – (172)Reclassifications – – 19 (8) (11) –Transfer to intangible assets – – – – (11) (11)Transfer to intangible assets – pre-publication – – – – (2) (2)At 31 December 2018 – – 317 458 18 793Adjustment on initial application of IFRS 16 (see note 1b) 418 6 – – – 424Exchange differences (9) – (8) (15) – (32)Additions 64 2 – 18 40 124Disposals (13) (4) (13) (108) (8) (146)Reclassifications – – 4 (4) – –Transfer of finance leases – 19 – (19) – –Transfer to intangible assets – – – (3) (4) (7)Transfer to intangible assets – pre-publication – – – (2) (10) (12)At 31 December 2019 460 23 300 325 36 1,144
All figures in £ millions
Right-of-use assets Owned assets
TotalLand and buildings
Plant and equipment
Land and buildings
Plant and equipment
Assets in course of
construction
DepreciationAt 1 January 2018 – – (197) (408) – (605)Exchange differences – – (5) (11) – (16)Charge for the year – – (20) (46) – (66)Disposals – – 34 97 – 131Reclassifications – – (7) 7 – –At 31 December 2018 – – (195) (361) – (556)Exchange differences 2 – 6 13 – 21
Charge for the year (60) (4) (21) (38) – (123)
Disposals – – 10 116 – 126
Transfer of finance leases – (12) – 12 – –
Transfer to intangible assets – – – 3 – 3Transfer to intangible assets – pre-publication – – – 3 – 3
At 31 December 2019 (58) (16) (200) (252) – (526)Carrying amountsAt 1 January 2018 – – 133 119 29 281At 31 December 2018 – – 122 97 18 237At 31 December 2019 402 7 100 73 36 618
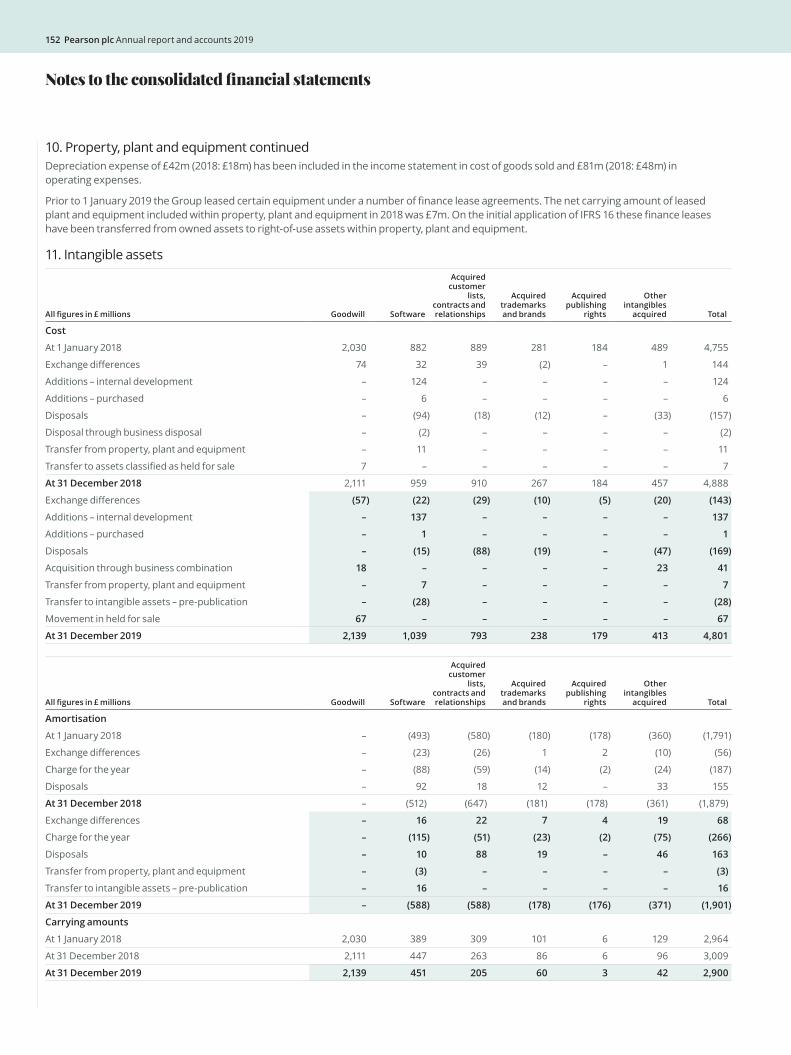
152 Pearson plc Annual report and accounts 2019
10. Property, plant and equipment continuedDepreciation expense of £42m (2018: £18m) has been included in the income statement in cost of goods sold and £81m (2018: £48m) in operating expenses.
Prior to 1 January 2019 the Group leased certain equipment under a number of finance lease agreements. The net carrying amount of leased plant and equipment included within property, plant and equipment in 2018 was £7m. On the initial application of IFRS 16 these finance leases have been transferred from owned assets to right-of-use assets within property, plant and equipment.
11. Intangible assets
All figures in £ millions Goodwill Software
Acquired customer
lists, contracts and relationships
Acquired trademarks and brands
Acquired publishing
rights
Other intangibles
acquired Total
Cost
At 1 January 2018 2,030 882 889 281 184 489 4,755
Exchange differences 74 32 39 (2) – 1 144
Additions – internal development – 124 – – – – 124
Additions – purchased – 6 – – – – 6
Disposals – (94) (18) (12) – (33) (157)
Disposal through business disposal – (2) – – – – (2)
Transfer from property, plant and equipment – 11 – – – – 11
Transfer to assets classified as held for sale 7 – – – – – 7
At 31 December 2018 2,111 959 910 267 184 457 4,888
Exchange differences (57) (22) (29) (10) (5) (20) (143)
Additions – internal development – 137 – – – – 137
Additions – purchased – 1 – – – – 1
Disposals – (15) (88) (19) – (47) (169)
Acquisition through business combination 18 – – – – 23 41
Transfer from property, plant and equipment – 7 – – – – 7
Transfer to intangible assets – pre-publication – (28) – – – – (28)
Movement in held for sale 67 – – – – – 67
At 31 December 2019 2,139 1,039 793 238 179 413 4,801
All figures in £ millions Goodwill Software
Acquired customer
lists, contracts and relationships
Acquired trademarks and brands
Acquired publishing
rights
Other intangibles
acquired Total
Amortisation
At 1 January 2018 – (493) (580) (180) (178) (360) (1,791)
Exchange differences – (23) (26) 1 2 (10) (56)
Charge for the year – (88) (59) (14) (2) (24) (187)
Disposals – 92 18 12 – 33 155
At 31 December 2018 – (512) (647) (181) (178) (361) (1,879)
Exchange differences – 16 22 7 4 19 68
Charge for the year – (115) (51) (23) (2) (75) (266)
Disposals – 10 88 19 – 46 163
Transfer from property, plant and equipment – (3) – – – – (3)
Transfer to intangible assets – pre-publication – 16 – – – – 16
At 31 December 2019 – (588) (588) (178) (176) (371) (1,901)
Carrying amounts
At 1 January 2018 2,030 389 309 101 6 129 2,964
At 31 December 2018 2,111 447 263 86 6 96 3,009
At 31 December 2019 2,139 451 205 60 3 42 2,900
Notes to the consolidated financial statements
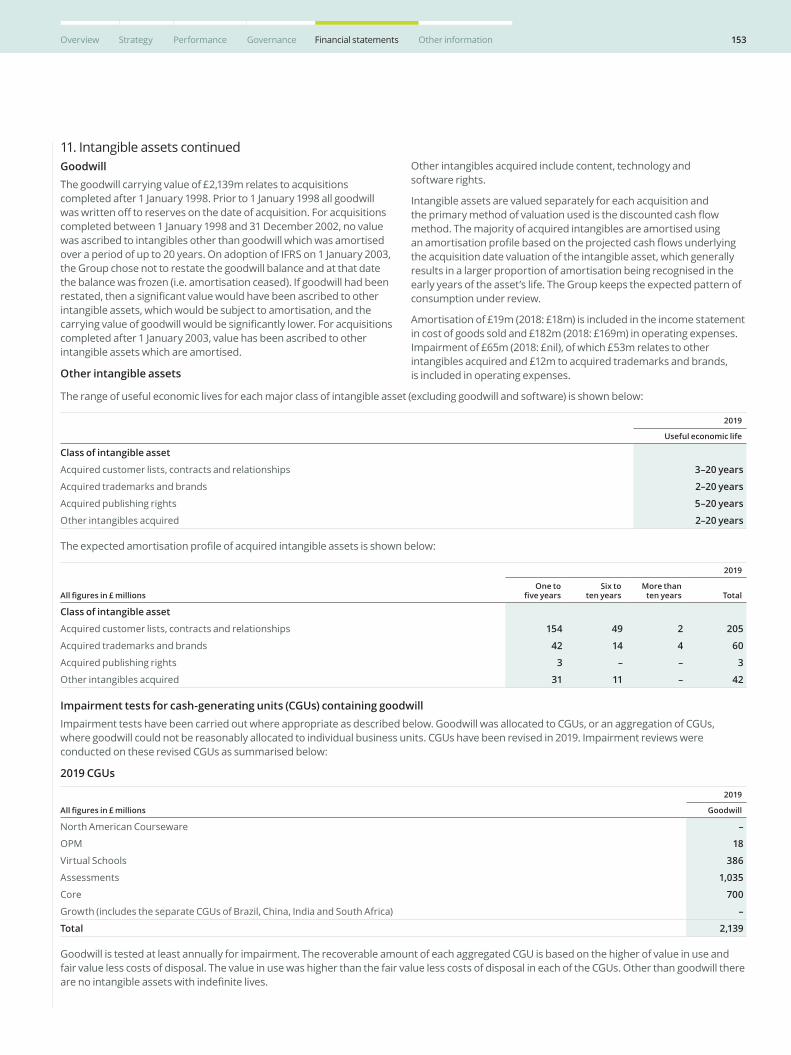
153Overview Strategy Performance Governance Financial statements Other information
11. Intangible assets continuedGoodwillThe goodwill carrying value of £2,139m relates to acquisitions completed after 1 January 1998. Prior to 1 January 1998 all goodwill was written off to reserves on the date of acquisition. For acquisitions completed between 1 January 1998 and 31 December 2002, no value was ascribed to intangibles other than goodwill which was amortised over a period of up to 20 years. On adoption of IFRS on 1 January 2003, the Group chose not to restate the goodwill balance and at that date the balance was frozen (i.e. amortisation ceased). If goodwill had been restated, then a significant value would have been ascribed to other intangible assets, which would be subject to amortisation, and the carrying value of goodwill would be significantly lower. For acquisitions completed after 1 January 2003, value has been ascribed to other intangible assets which are amortised.
Other intangible assets
Other intangibles acquired include content, technology and software rights.
Intangible assets are valued separately for each acquisition and the primary method of valuation used is the discounted cash flow method. The majority of acquired intangibles are amortised using an amortisation profile based on the projected cash flows underlying the acquisition date valuation of the intangible asset, which generally results in a larger proportion of amortisation being recognised in the early years of the asset’s life. The Group keeps the expected pattern of consumption under review.
Amortisation of £19m (2018: £18m) is included in the income statement in cost of goods sold and £182m (2018: £169m) in operating expenses. Impairment of £65m (2018: £nil), of which £53m relates to other intangibles acquired and £12m to acquired trademarks and brands, is included in operating expenses.
The range of useful economic lives for each major class of intangible asset (excluding goodwill and software) is shown below:
2019
Useful economic life
Class of intangible asset
Acquired customer lists, contracts and relationships 3–20 years
Acquired trademarks and brands 2–20 years
Acquired publishing rights 5–20 years
Other intangibles acquired 2–20 years
The expected amortisation profile of acquired intangible assets is shown below:
All figures in £ millions
2019
One to five years
Six to ten years
More than ten years Total
Class of intangible asset
Acquired customer lists, contracts and relationships 154 49 2 205
Acquired trademarks and brands 42 14 4 60
Acquired publishing rights 3 – – 3
Other intangibles acquired 31 11 – 42
Impairment tests for cash-generating units (CGUs) containing goodwillImpairment tests have been carried out where appropriate as described below. Goodwill was allocated to CGUs, or an aggregation of CGUs, where goodwill could not be reasonably allocated to individual business units. CGUs have been revised in 2019. Impairment reviews were conducted on these revised CGUs as summarised below:
2019 CGUs
All figures in £ millions
2019
Goodwill
North American Courseware –
OPM 18
Virtual Schools 386
Assessments 1,035
Core 700
Growth (includes the separate CGUs of Brazil, China, India and South Africa) –
Total 2,139
Goodwill is tested at least annually for impairment. The recoverable amount of each aggregated CGU is based on the higher of value in use and fair value less costs of disposal. The value in use was higher than the fair value less costs of disposal in each of the CGUs. Other than goodwill there are no intangible assets with indefinite lives.
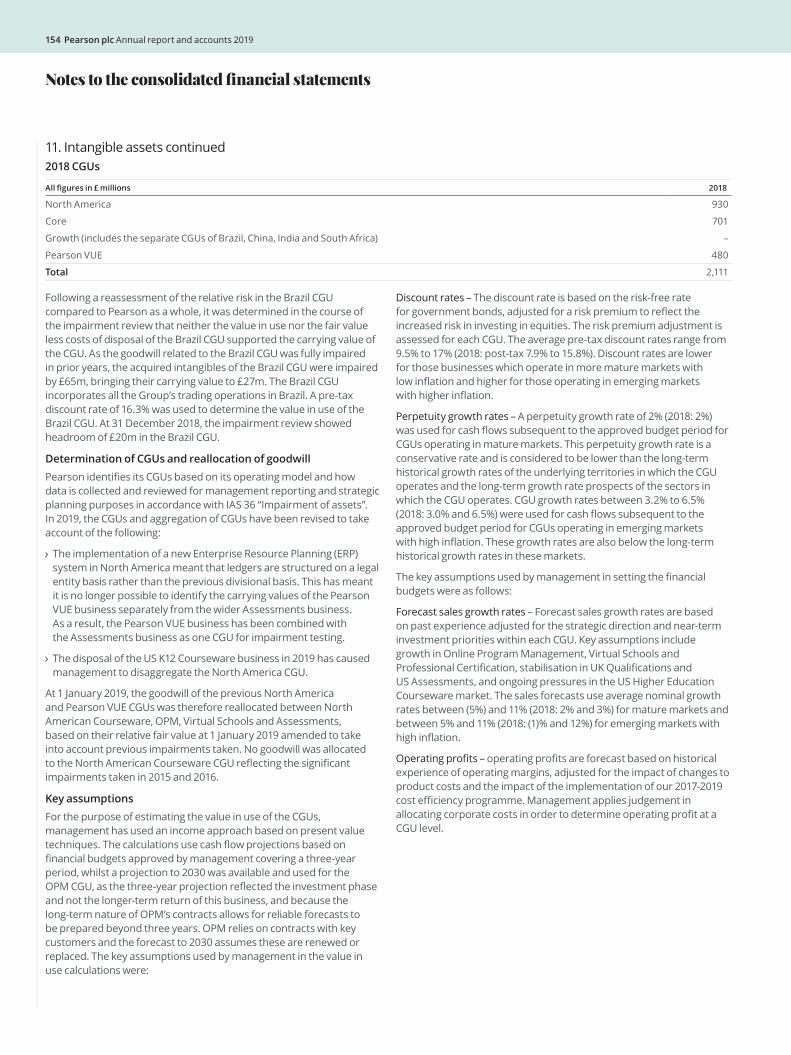
154 Pearson plc Annual report and accounts 2019
11. Intangible assets continued2018 CGUs
All figures in £ millions 2018
North America 930
Core 701
Growth (includes the separate CGUs of Brazil, China, India and South Africa) –
Pearson VUE 480
Total 2,111
Following a reassessment of the relative risk in the Brazil CGU compared to Pearson as a whole, it was determined in the course of the impairment review that neither the value in use nor the fair value less costs of disposal of the Brazil CGU supported the carrying value of the CGU. As the goodwill related to the Brazil CGU was fully impaired in prior years, the acquired intangibles of the Brazil CGU were impaired by £65m, bringing their carrying value to £27m. The Brazil CGU incorporates all the Group’s trading operations in Brazil. A pre-tax discount rate of 16.3% was used to determine the value in use of the Brazil CGU. At 31 December 2018, the impairment review showed headroom of £20m in the Brazil CGU.
Determination of CGUs and reallocation of goodwillPearson identifies its CGUs based on its operating model and how data is collected and reviewed for management reporting and strategic planning purposes in accordance with IAS 36 “Impairment of assets”. In 2019, the CGUs and aggregation of CGUs have been revised to take account of the following:
The implementation of a new Enterprise Resource Planning (ERP) system in North America meant that ledgers are structured on a legal entity basis rather than the previous divisional basis. This has meant it is no longer possible to identify the carrying values of the Pearson VUE business separately from the wider Assessments business. As a result, the Pearson VUE business has been combined with the Assessments business as one CGU for impairment testing.
The disposal of the US K12 Courseware business in 2019 has caused management to disaggregate the North America CGU.
At 1 January 2019, the goodwill of the previous North America and Pearson VUE CGUs was therefore reallocated between North American Courseware, OPM, Virtual Schools and Assessments, based on their relative fair value at 1 January 2019 amended to take into account previous impairments taken. No goodwill was allocated to the North American Courseware CGU reflecting the significant impairments taken in 2015 and 2016.
Key assumptionsFor the purpose of estimating the value in use of the CGUs, management has used an income approach based on present value techniques. The calculations use cash flow projections based on financial budgets approved by management covering a three-year period, whilst a projection to 2030 was available and used for the OPM CGU, as the three-year projection reflected the investment phase and not the longer-term return of this business, and because the long-term nature of OPM’s contracts allows for reliable forecasts to be prepared beyond three years. OPM relies on contracts with key customers and the forecast to 2030 assumes these are renewed or replaced. The key assumptions used by management in the value in use calculations were:
Discount rates – The discount rate is based on the risk-free rate for government bonds, adjusted for a risk premium to reflect the increased risk in investing in equities. The risk premium adjustment is assessed for each CGU. The average pre-tax discount rates range from 9.5% to 17% (2018: post-tax 7.9% to 15.8%). Discount rates are lower for those businesses which operate in more mature markets with low inflation and higher for those operating in emerging markets with higher inflation.
Perpetuity growth rates – A perpetuity growth rate of 2% (2018: 2%) was used for cash flows subsequent to the approved budget period for CGUs operating in mature markets. This perpetuity growth rate is a conservative rate and is considered to be lower than the long-term historical growth rates of the underlying territories in which the CGU operates and the long-term growth rate prospects of the sectors in which the CGU operates. CGU growth rates between 3.2% to 6.5% (2018: 3.0% and 6.5%) were used for cash flows subsequent to the approved budget period for CGUs operating in emerging markets with high inflation. These growth rates are also below the long-term historical growth rates in these markets.
The key assumptions used by management in setting the financial budgets were as follows:
Forecast sales growth rates – Forecast sales growth rates are based on past experience adjusted for the strategic direction and near-term investment priorities within each CGU. Key assumptions include growth in Online Program Management, Virtual Schools and Professional Certification, stabilisation in UK Qualifications and US Assessments, and ongoing pressures in the US Higher Education Courseware market. The sales forecasts use average nominal growth rates between (5%) and 11% (2018: 2% and 3%) for mature markets and between 5% and 11% (2018: (1)% and 12%) for emerging markets with high inflation.
Operating profits – operating profits are forecast based on historical experience of operating margins, adjusted for the impact of changes to product costs and the impact of the implementation of our 2017-2019 cost efficiency programme. Management applies judgement in allocating corporate costs in order to determine operating profit at a CGU level.
Notes to the consolidated financial statements
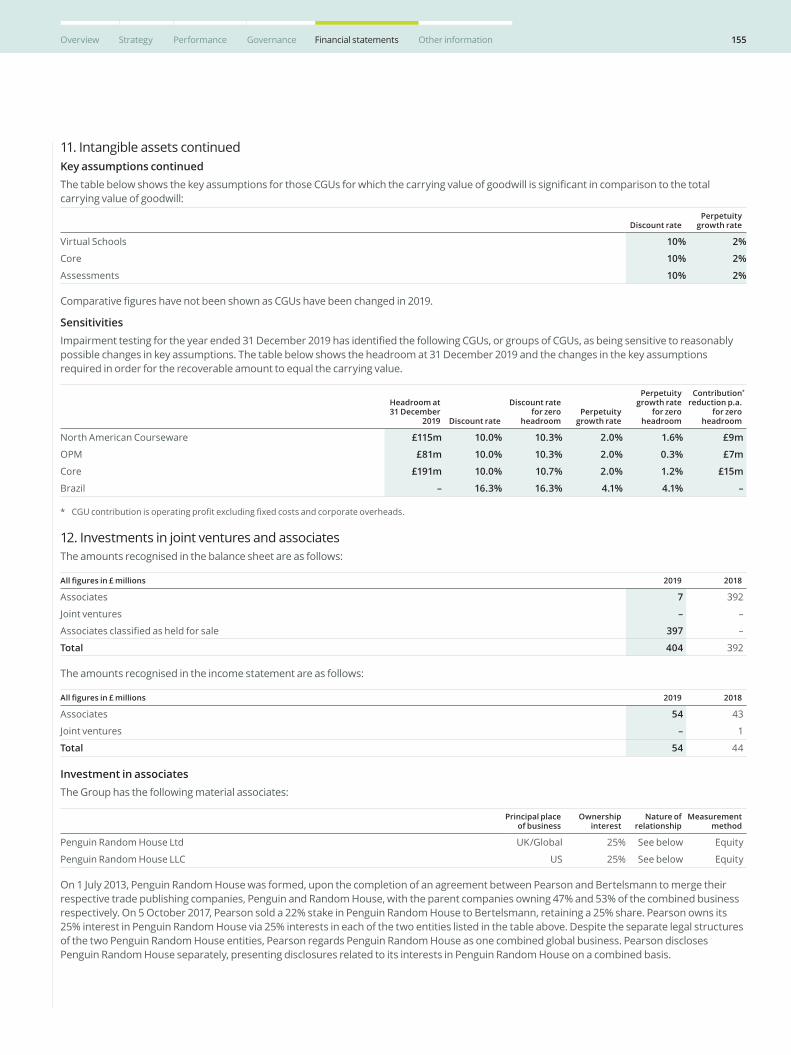
155Overview Strategy Performance Governance Financial statements Other information
11. Intangible assets continuedKey assumptions continuedThe table below shows the key assumptions for those CGUs for which the carrying value of goodwill is significant in comparison to the total carrying value of goodwill:
Discount ratePerpetuity
growth rate
Virtual Schools 10% 2%
Core 10% 2%
Assessments 10% 2%
Comparative figures have not been shown as CGUs have been changed in 2019.
SensitivitiesImpairment testing for the year ended 31 December 2019 has identified the following CGUs, or groups of CGUs, as being sensitive to reasonably possible changes in key assumptions. The table below shows the headroom at 31 December 2019 and the changes in the key assumptions required in order for the recoverable amount to equal the carrying value.
Headroom at 31 December
2019 Discount rate
Discount rate for zero
headroom Perpetuity
growth rate
Perpetuity growth rate
for zero headroom
Contribution*
reduction p.a. for zero
headroom
North American Courseware £115m 10.0% 10.3% 2.0% 1.6% £9m
OPM £81m 10.0% 10.3% 2.0% 0.3% £7m
Core £191m 10.0% 10.7% 2.0% 1.2% £15m
Brazil – 16.3% 16.3% 4.1% 4.1% –
* CGU contribution is operating profit excluding fixed costs and corporate overheads.
12. Investments in joint ventures and associatesThe amounts recognised in the balance sheet are as follows:
All figures in £ millions 2019 2018
Associates 7 392
Joint ventures – –
Associates classified as held for sale 397 –
Total 404 392
The amounts recognised in the income statement are as follows:
All figures in £ millions 2019 2018
Associates 54 43
Joint ventures – 1
Total 54 44
Investment in associatesThe Group has the following material associates:
Principal place of business
Ownership interest
Nature of relationship
Measurement method
Penguin Random House Ltd UK/Global 25% See below Equity
Penguin Random House LLC US 25% See below Equity
On 1 July 2013, Penguin Random House was formed, upon the completion of an agreement between Pearson and Bertelsmann to merge their respective trade publishing companies, Penguin and Random House, with the parent companies owning 47% and 53% of the combined business respectively. On 5 October 2017, Pearson sold a 22% stake in Penguin Random House to Bertelsmann, retaining a 25% share. Pearson owns its 25% interest in Penguin Random House via 25% interests in each of the two entities listed in the table above. Despite the separate legal structures of the two Penguin Random House entities, Pearson regards Penguin Random House as one combined global business. Pearson discloses Penguin Random House separately, presenting disclosures related to its interests in Penguin Random House on a combined basis.
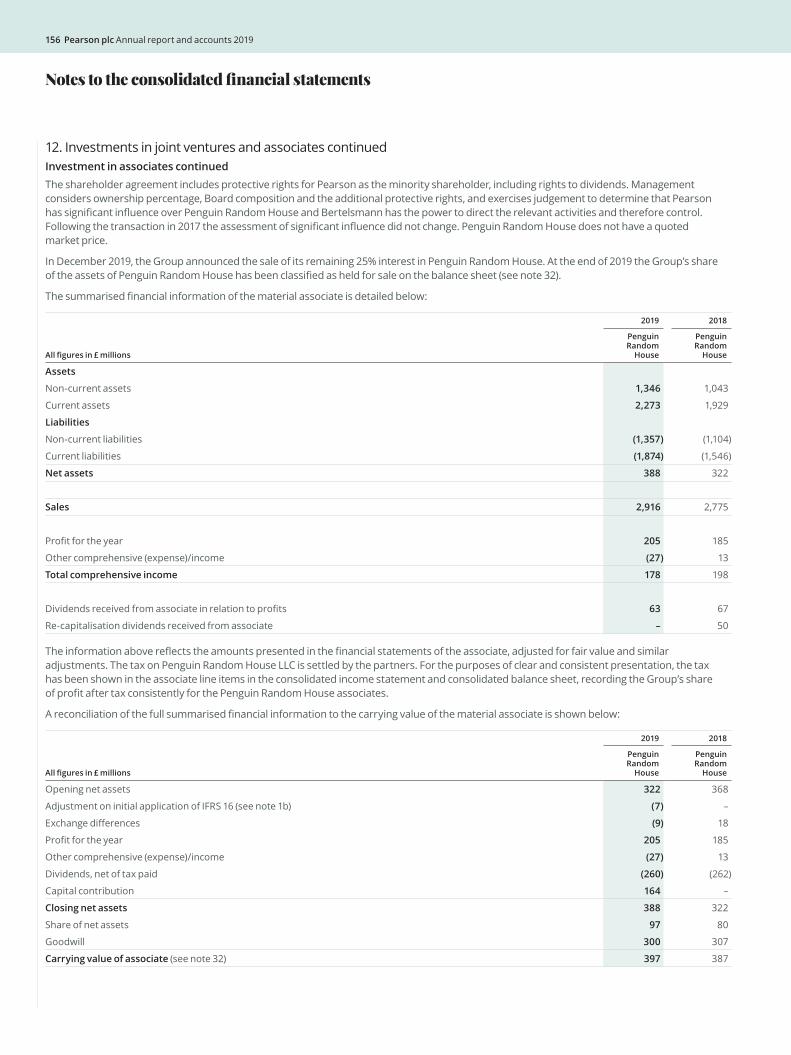
156 Pearson plc Annual report and accounts 2019
12. Investments in joint ventures and associates continuedInvestment in associates continuedThe shareholder agreement includes protective rights for Pearson as the minority shareholder, including rights to dividends. Management considers ownership percentage, Board composition and the additional protective rights, and exercises judgement to determine that Pearson has significant influence over Penguin Random House and Bertelsmann has the power to direct the relevant activities and therefore control. Following the transaction in 2017 the assessment of significant influence did not change. Penguin Random House does not have a quoted market price.
In December 2019, the Group announced the sale of its remaining 25% interest in Penguin Random House. At the end of 2019 the Group’s share of the assets of Penguin Random House has been classified as held for sale on the balance sheet (see note 32).
The summarised financial information of the material associate is detailed below:
All figures in £ millions
2019 2018
Penguin Random
House
Penguin Random
House
Assets
Non-current assets 1,346 1,043
Current assets 2,273 1,929
Liabilities
Non-current liabilities (1,357) (1,104)
Current liabilities (1,874) (1,546)
Net assets 388 322
Sales 2,916 2,775
Profit for the year 205 185
Other comprehensive (expense)/income (27) 13
Total comprehensive income 178 198
Dividends received from associate in relation to profits 63 67
Re-capitalisation dividends received from associate – 50
The information above reflects the amounts presented in the financial statements of the associate, adjusted for fair value and similar adjustments. The tax on Penguin Random House LLC is settled by the partners. For the purposes of clear and consistent presentation, the tax has been shown in the associate line items in the consolidated income statement and consolidated balance sheet, recording the Group’s share of profit after tax consistently for the Penguin Random House associates.
A reconciliation of the full summarised financial information to the carrying value of the material associate is shown below:
All figures in £ millions
2019 2018
Penguin Random
House
Penguin Random
House
Opening net assets 322 368
Adjustment on initial application of IFRS 16 (see note 1b) (7) –
Exchange differences (9) 18
Profit for the year 205 185
Other comprehensive (expense)/income (27) 13
Dividends, net of tax paid (260) (262)
Capital contribution 164 –
Closing net assets 388 322
Share of net assets 97 80
Goodwill 300 307
Carrying value of associate (see note 32) 397 387
Notes to the consolidated financial statements
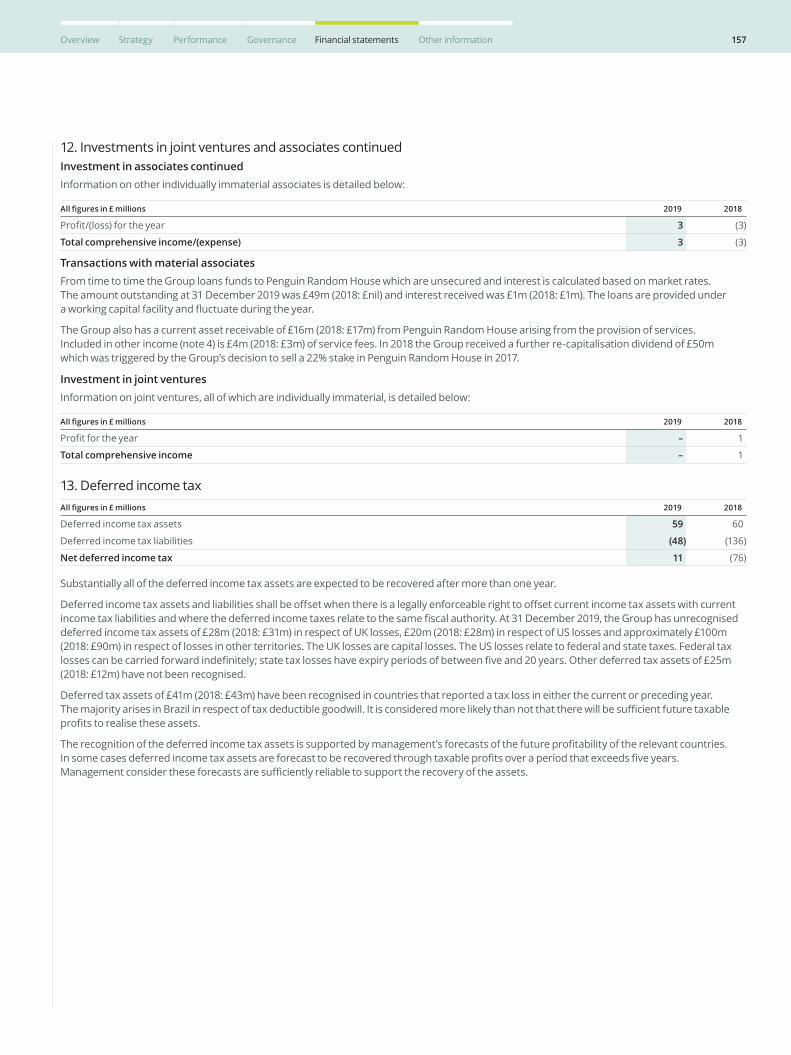
157Overview Strategy Performance Governance Financial statements Other information
12. Investments in joint ventures and associates continuedInvestment in associates continuedInformation on other individually immaterial associates is detailed below:
All figures in £ millions 2019 2018
Profit/(loss) for the year 3 (3)
Total comprehensive income/(expense) 3 (3)
Transactions with material associatesFrom time to time the Group loans funds to Penguin Random House which are unsecured and interest is calculated based on market rates. The amount outstanding at 31 December 2019 was £49m (2018: £nil) and interest received was £1m (2018: £1m). The loans are provided under a working capital facility and fluctuate during the year.
The Group also has a current asset receivable of £16m (2018: £17m) from Penguin Random House arising from the provision of services. Included in other income (note 4) is £4m (2018: £3m) of service fees. In 2018 the Group received a further re-capitalisation dividend of £50m which was triggered by the Group’s decision to sell a 22% stake in Penguin Random House in 2017.
Investment in joint venturesInformation on joint ventures, all of which are individually immaterial, is detailed below:
All figures in £ millions 2019 2018
Profit for the year – 1
Total comprehensive income – 1
13. Deferred income taxAll figures in £ millions 2019 2018
Deferred income tax assets 59 60
Deferred income tax liabilities (48) (136)
Net deferred income tax 11 (76)
Substantially all of the deferred income tax assets are expected to be recovered after more than one year.
Deferred income tax assets and liabilities shall be offset when there is a legally enforceable right to offset current income tax assets with current income tax liabilities and where the deferred income taxes relate to the same fiscal authority. At 31 December 2019, the Group has unrecognised deferred income tax assets of £28m (2018: £31m) in respect of UK losses, £20m (2018: £28m) in respect of US losses and approximately £100m (2018: £90m) in respect of losses in other territories. The UK losses are capital losses. The US losses relate to federal and state taxes. Federal tax losses can be carried forward indefinitely; state tax losses have expiry periods of between five and 20 years. Other deferred tax assets of £25m (2018: £12m) have not been recognised.
Deferred tax assets of £41m (2018: £43m) have been recognised in countries that reported a tax loss in either the current or preceding year. The majority arises in Brazil in respect of tax deductible goodwill. It is considered more likely than not that there will be sufficient future taxable profits to realise these assets.
The recognition of the deferred income tax assets is supported by management’s forecasts of the future profitability of the relevant countries. In some cases deferred income tax assets are forecast to be recovered through taxable profits over a period that exceeds five years. Management consider these forecasts are sufficiently reliable to support the recovery of the assets.

158 Pearson plc Annual report and accounts 2019
13. Deferred income tax continuedThe movement in deferred income tax assets and liabilities during the year is as follows:
All figures in £ millionsTrading
lossesReturns
provisions
Retirement benefit
obligationsDeferred revenue
Goodwill and intangibles Other Total
Deferred income tax assets/(liabilities)
At 1 January 2018 9 34 (44) 42 (155) 64 (50)
Exchange differences – 1 1 6 (16) (5) (13)
Income statement (charge)/benefit 11 (4) (21) 20 (34) (14) (42)
Disposal through business disposal – – – – – 16 16
Tax benefit in other comprehensive income – – 9 – – – 9
Tax benefit in equity – – – – – 4 4
At 31 December 2018 20 31 (55) 68 (205) 65 (76)
Adjustment on initial application of IFRS 16 (see note 1b) – – – – – 15 15
Exchange differences (1) (1) (1) (3) 6 (5) (5)
Income statement benefit/(charge) 70 (10) (4) (24) – 32 64
Tax benefit/(charge) in other comprehensive income – – 22 – – (4) 18
Tax charge in equity – – – – – (5) (5)
At 31 December 2019 89 20 (38) 41 (199) 98 11
Other deferred income tax items include temporary differences in respect of share-based payments, provisions, depreciation, interest limitation and royalty advances.
As at 31 December 2019, no deferred tax assets or liabilities were classified as held for sale (2018: £98m asset). In 2018 there was a charge of £8m relating to assets and liabilities held for sale.
14. Classification of financial instrumentsThe accounting classification of each class of the Group’s financial assets, and their carrying values, is as follows:
All figures in £ millions Notes
2019 2018
Fair valueAmortised
cost
Total carrying
value
Fair valueAmortised
cost
Total carrying
valueFVOCI FVTPL
Fair value – hedging
instrumentFinancial
assets FVOCI FVTPL
Fair value – hedging
instrumentFinancial
assets
Investments in unlisted securities 15 122 – – – 122 93 – – – 93
Cash and cash equivalents 17 – – – 437 437 – – – 568 568
Derivative financial instruments 16 – 6 48 – 54 – 4 64 – 68
Trade receivables 22 – – – 918 918 – – – 904 904
Other receivable – 182 – – 182 – – – – –
Trade receivables – within assets classified as held for sale – – – – – – – – 49 49
Total financial assets 122 188 48 1,355 1,713 93 4 64 1,521 1,682
The carrying value of the Group’s financial assets is equal to, or approximately equal to, the market value. The other receivable relates to the receivable which arose on the disposal of the US K12 Courseware business and is included in other receivables, non-current and current, in note 22.
Notes to the consolidated financial statements
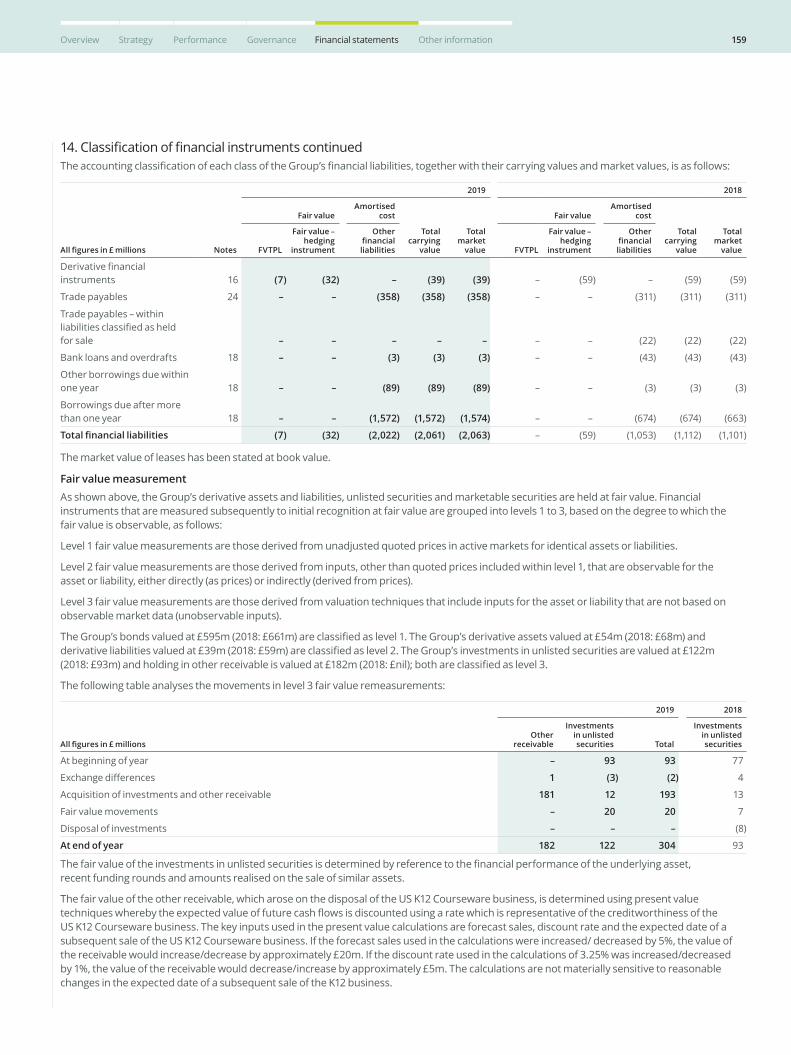
159Overview Strategy Performance Governance Financial statements Other information
14. Classification of financial instruments continuedThe accounting classification of each class of the Group’s financial liabilities, together with their carrying values and market values, is as follows:
All figures in £ millions Notes
2019 2018
Fair valueAmortised
cost
Total carrying
value
Total market
value
Fair valueAmortised
cost
Total carrying
value
Total market
valueFVTPL
Fair value – hedging
instrument
Other financial liabilities FVTPL
Fair value – hedging
instrument
Other financial liabilities
Derivative financial instruments 16 (7) (32) – (39) (39) – (59) – (59) (59)
Trade payables 24 – – (358) (358) (358) – – (311) (311) (311)
Trade payables – within liabilities classified as held for sale – – – – – – – (22) (22) (22)
Bank loans and overdrafts 18 – – (3) (3) (3) – – (43) (43) (43)
Other borrowings due within one year 18 – – (89) (89) (89) – – (3) (3) (3)
Borrowings due after more than one year 18 – – (1,572) (1,572) (1,574) – – (674) (674) (663)
Total financial liabilities (7) (32) (2,022) (2,061) (2,063) – (59) (1,053) (1,112) (1,101)
The market value of leases has been stated at book value.
Fair value measurement As shown above, the Group’s derivative assets and liabilities, unlisted securities and marketable securities are held at fair value. Financial instruments that are measured subsequently to initial recognition at fair value are grouped into levels 1 to 3, based on the degree to which the fair value is observable, as follows:
Level 1 fair value measurements are those derived from unadjusted quoted prices in active markets for identical assets or liabilities.
Level 2 fair value measurements are those derived from inputs, other than quoted prices included within level 1, that are observable for the asset or liability, either directly (as prices) or indirectly (derived from prices).
Level 3 fair value measurements are those derived from valuation techniques that include inputs for the asset or liability that are not based on observable market data (unobservable inputs).
The Group’s bonds valued at £595m (2018: £661m) are classified as level 1. The Group’s derivative assets valued at £54m (2018: £68m) and derivative liabilities valued at £39m (2018: £59m) are classified as level 2. The Group’s investments in unlisted securities are valued at £122m (2018: £93m) and holding in other receivable is valued at £182m (2018: £nil); both are classified as level 3.
The following table analyses the movements in level 3 fair value remeasurements:
All figures in £ millions
2019 2018
Other receivable
Investments in unlisted securities Total
Investments in unlisted securities
At beginning of year – 93 93 77
Exchange differences 1 (3) (2) 4
Acquisition of investments and other receivable 181 12 193 13
Fair value movements – 20 20 7
Disposal of investments – – – (8)
At end of year 182 122 304 93
The fair value of the investments in unlisted securities is determined by reference to the financial performance of the underlying asset, recent funding rounds and amounts realised on the sale of similar assets.
The fair value of the other receivable, which arose on the disposal of the US K12 Courseware business, is determined using present value techniques whereby the expected value of future cash flows is discounted using a rate which is representative of the creditworthiness of the US K12 Courseware business. The key inputs used in the present value calculations are forecast sales, discount rate and the expected date of a subsequent sale of the US K12 Courseware business. If the forecast sales used in the calculations were increased/ decreased by 5%, the value of the receivable would increase/decrease by approximately £20m. If the discount rate used in the calculations of 3.25% was increased/decreased by 1%, the value of the receivable would decrease/increase by approximately £5m. The calculations are not materially sensitive to reasonable changes in the expected date of a subsequent sale of the K12 business.
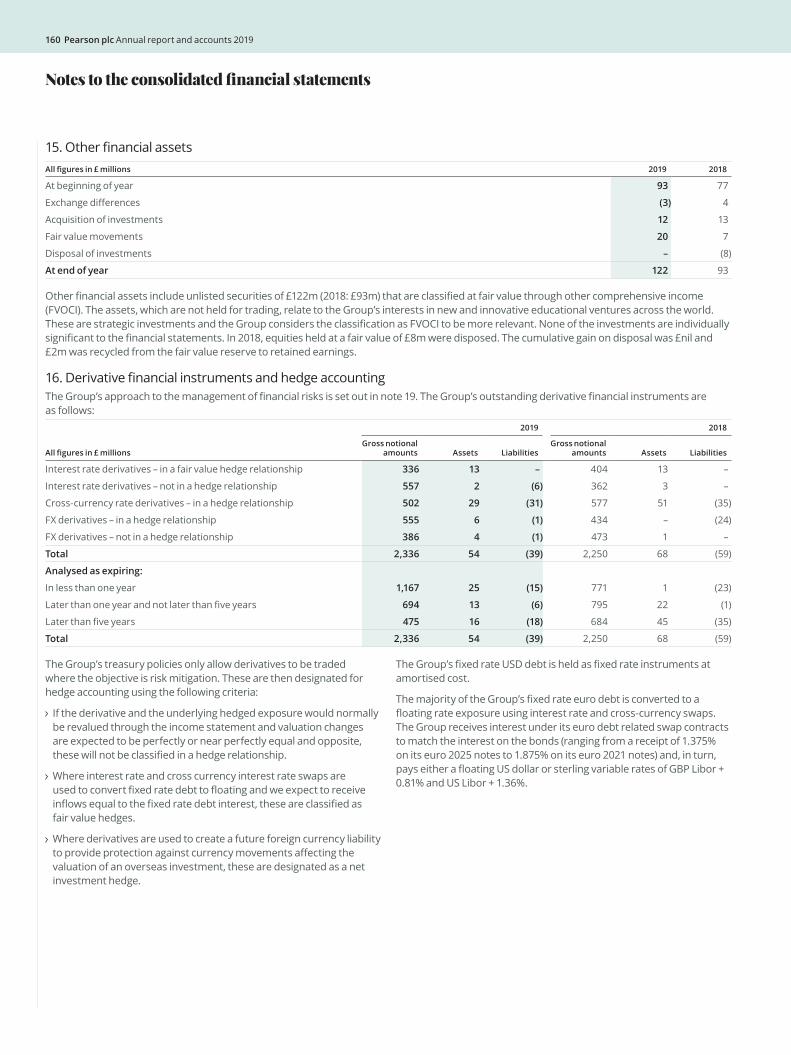
160 Pearson plc Annual report and accounts 2019
15. Other financial assetsAll figures in £ millions 2019 2018
At beginning of year 93 77
Exchange differences (3) 4
Acquisition of investments 12 13
Fair value movements 20 7
Disposal of investments – (8)
At end of year 122 93
Other financial assets include unlisted securities of £122m (2018: £93m) that are classified at fair value through other comprehensive income (FVOCI). The assets, which are not held for trading, relate to the Group’s interests in new and innovative educational ventures across the world. These are strategic investments and the Group considers the classification as FVOCI to be more relevant. None of the investments are individually significant to the financial statements. In 2018, equities held at a fair value of £8m were disposed. The cumulative gain on disposal was £nil and £2m was recycled from the fair value reserve to retained earnings.
16. Derivative financial instruments and hedge accountingThe Group’s approach to the management of financial risks is set out in note 19. The Group’s outstanding derivative financial instruments are as follows:
All figures in £ millions
2019 2018
Gross notional amounts Assets Liabilities
Gross notional amounts Assets Liabilities
Interest rate derivatives – in a fair value hedge relationship 336 13 – 404 13 –
Interest rate derivatives – not in a hedge relationship 557 2 (6) 362 3 –
Cross-currency rate derivatives – in a hedge relationship 502 29 (31) 577 51 (35)
FX derivatives – in a hedge relationship 555 6 (1) 434 – (24)
FX derivatives – not in a hedge relationship 386 4 (1) 473 1 –
Total 2,336 54 (39) 2,250 68 (59)
Analysed as expiring:
In less than one year 1,167 25 (15) 771 1 (23)
Later than one year and not later than five years 694 13 (6) 795 22 (1)
Later than five years 475 16 (18) 684 45 (35)
Total 2,336 54 (39) 2,250 68 (59)
The Group’s treasury policies only allow derivatives to be traded where the objective is risk mitigation. These are then designated for hedge accounting using the following criteria:
If the derivative and the underlying hedged exposure would normally be revalued through the income statement and valuation changes are expected to be perfectly or near perfectly equal and opposite, these will not be classified in a hedge relationship.
Where interest rate and cross currency interest rate swaps are used to convert fixed rate debt to floating and we expect to receive inflows equal to the fixed rate debt interest, these are classified as fair value hedges.
Where derivatives are used to create a future foreign currency liability to provide protection against currency movements affecting the valuation of an overseas investment, these are designated as a net investment hedge.
The Group’s fixed rate USD debt is held as fixed rate instruments at amortised cost.
The majority of the Group’s fixed rate euro debt is converted to a floating rate exposure using interest rate and cross-currency swaps. The Group receives interest under its euro debt related swap contracts to match the interest on the bonds (ranging from a receipt of 1.375% on its euro 2025 notes to 1.875% on its euro 2021 notes) and, in turn, pays either a floating US dollar or sterling variable rates of GBP Libor + 0.81% and US Libor + 1.36%.
Notes to the consolidated financial statements
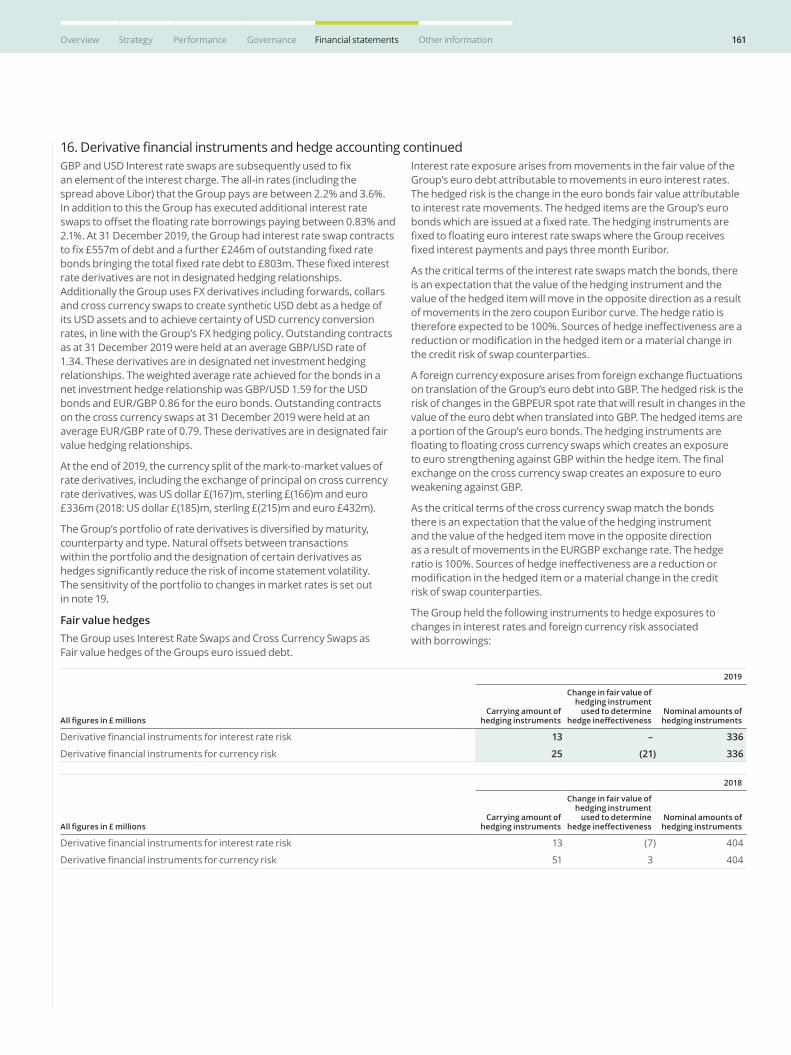
161Overview Strategy Performance Governance Financial statements Other information
16. Derivative financial instruments and hedge accounting continuedGBP and USD Interest rate swaps are subsequently used to fix an element of the interest charge. The all-in rates (including the spread above Libor) that the Group pays are between 2.2% and 3.6%. In addition to this the Group has executed additional interest rate swaps to offset the floating rate borrowings paying between 0.83% and 2.1%. At 31 December 2019, the Group had interest rate swap contracts to fix £557m of debt and a further £246m of outstanding fixed rate bonds bringing the total fixed rate debt to £803m. These fixed interest rate derivatives are not in designated hedging relationships. Additionally the Group uses FX derivatives including forwards, collars and cross currency swaps to create synthetic USD debt as a hedge of its USD assets and to achieve certainty of USD currency conversion rates, in line with the Group’s FX hedging policy. Outstanding contracts as at 31 December 2019 were held at an average GBP/USD rate of 1.34. These derivatives are in designated net investment hedging relationships. The weighted average rate achieved for the bonds in a net investment hedge relationship was GBP/USD 1.59 for the USD bonds and EUR/GBP 0.86 for the euro bonds. Outstanding contracts on the cross currency swaps at 31 December 2019 were held at an average EUR/GBP rate of 0.79. These derivatives are in designated fair value hedging relationships.
At the end of 2019, the currency split of the mark-to-market values of rate derivatives, including the exchange of principal on cross currency rate derivatives, was US dollar £(167)m, sterling £(166)m and euro £336m (2018: US dollar £(185)m, sterling £(215)m and euro £432m).
The Group’s portfolio of rate derivatives is diversified by maturity, counterparty and type. Natural offsets between transactions within the portfolio and the designation of certain derivatives as hedges significantly reduce the risk of income statement volatility. The sensitivity of the portfolio to changes in market rates is set out in note 19.
Fair value hedgesThe Group uses Interest Rate Swaps and Cross Currency Swaps as Fair value hedges of the Groups euro issued debt.
Interest rate exposure arises from movements in the fair value of the Group’s euro debt attributable to movements in euro interest rates. The hedged risk is the change in the euro bonds fair value attributable to interest rate movements. The hedged items are the Group’s euro bonds which are issued at a fixed rate. The hedging instruments are fixed to floating euro interest rate swaps where the Group receives fixed interest payments and pays three month Euribor.
As the critical terms of the interest rate swaps match the bonds, there is an expectation that the value of the hedging instrument and the value of the hedged item will move in the opposite direction as a result of movements in the zero coupon Euribor curve. The hedge ratio is therefore expected to be 100%. Sources of hedge ineffectiveness are a reduction or modification in the hedged item or a material change in the credit risk of swap counterparties.
A foreign currency exposure arises from foreign exchange fluctuations on translation of the Group’s euro debt into GBP. The hedged risk is the risk of changes in the GBPEUR spot rate that will result in changes in the value of the euro debt when translated into GBP. The hedged items are a portion of the Group’s euro bonds. The hedging instruments are floating to floating cross currency swaps which creates an exposure to euro strengthening against GBP within the hedge item. The final exchange on the cross currency swap creates an exposure to euro weakening against GBP.
As the critical terms of the cross currency swap match the bonds there is an expectation that the value of the hedging instrument and the value of the hedged item move in the opposite direction as a result of movements in the EURGBP exchange rate. The hedge ratio is 100%. Sources of hedge ineffectiveness are a reduction or modification in the hedged item or a material change in the credit risk of swap counterparties.
The Group held the following instruments to hedge exposures to changes in interest rates and foreign currency risk associated with borrowings:
All figures in £ millions
2019
Carrying amount of hedging instruments
Change in fair value of hedging instrument
used to determine hedge ineffectiveness
Nominal amounts of hedging instruments
Derivative financial instruments for interest rate risk 13 – 336
Derivative financial instruments for currency risk 25 (21) 336
All figures in £ millions
2018
Carrying amount of hedging instruments
Change in fair value of hedging instrument
used to determine hedge ineffectiveness
Nominal amounts of hedging instruments
Derivative financial instruments for interest rate risk 13 (7) 404
Derivative financial instruments for currency risk 51 3 404
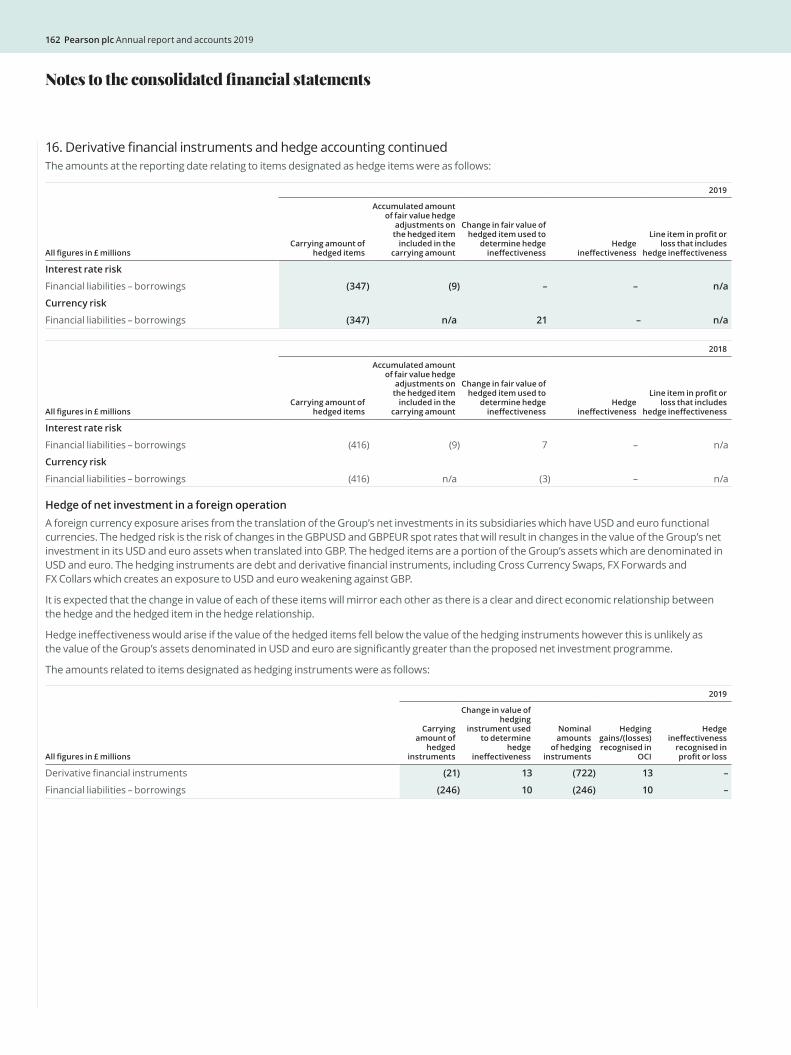
162 Pearson plc Annual report and accounts 2019
16. Derivative financial instruments and hedge accounting continuedThe amounts at the reporting date relating to items designated as hedge items were as follows:
All figures in £ millions
2019
Carrying amount of hedged items
Accumulated amount of fair value hedge
adjustments on the hedged item
included in the carrying amount
Change in fair value of hedged item used to
determine hedge ineffectiveness
Hedge ineffectiveness
Line item in profit or loss that includes
hedge ineffectiveness
Interest rate risk
Financial liabilities – borrowings (347) (9) – – n/a
Currency risk
Financial liabilities – borrowings (347) n/a 21 – n/a
All figures in £ millions
2018
Carrying amount of hedged items
Accumulated amount of fair value hedge
adjustments on the hedged item
included in the carrying amount
Change in fair value of hedged item used to
determine hedge ineffectiveness
Hedge ineffectiveness
Line item in profit or loss that includes
hedge ineffectiveness
Interest rate risk
Financial liabilities – borrowings (416) (9) 7 – n/a
Currency risk
Financial liabilities – borrowings (416) n/a (3) – n/a
Hedge of net investment in a foreign operation A foreign currency exposure arises from the translation of the Group’s net investments in its subsidiaries which have USD and euro functional currencies. The hedged risk is the risk of changes in the GBPUSD and GBPEUR spot rates that will result in changes in the value of the Group’s net investment in its USD and euro assets when translated into GBP. The hedged items are a portion of the Group’s assets which are denominated in USD and euro. The hedging instruments are debt and derivative financial instruments, including Cross Currency Swaps, FX Forwards and FX Collars which creates an exposure to USD and euro weakening against GBP.
It is expected that the change in value of each of these items will mirror each other as there is a clear and direct economic relationship between the hedge and the hedged item in the hedge relationship.
Hedge ineffectiveness would arise if the value of the hedged items fell below the value of the hedging instruments however this is unlikely as the value of the Group’s assets denominated in USD and euro are significantly greater than the proposed net investment programme.
The amounts related to items designated as hedging instruments were as follows:
All figures in £ millions
2019
Carrying amount of
hedged instruments
Change in value of hedging
instrument used to determine
hedge ineffectiveness
Nominal amounts
of hedging instruments
Hedging gains/(losses) recognised in
OCI
Hedge ineffectiveness
recognised in profit or loss
Derivative financial instruments (21) 13 (722) 13 –
Financial liabilities – borrowings (246) 10 (246) 10 –
Notes to the consolidated financial statements
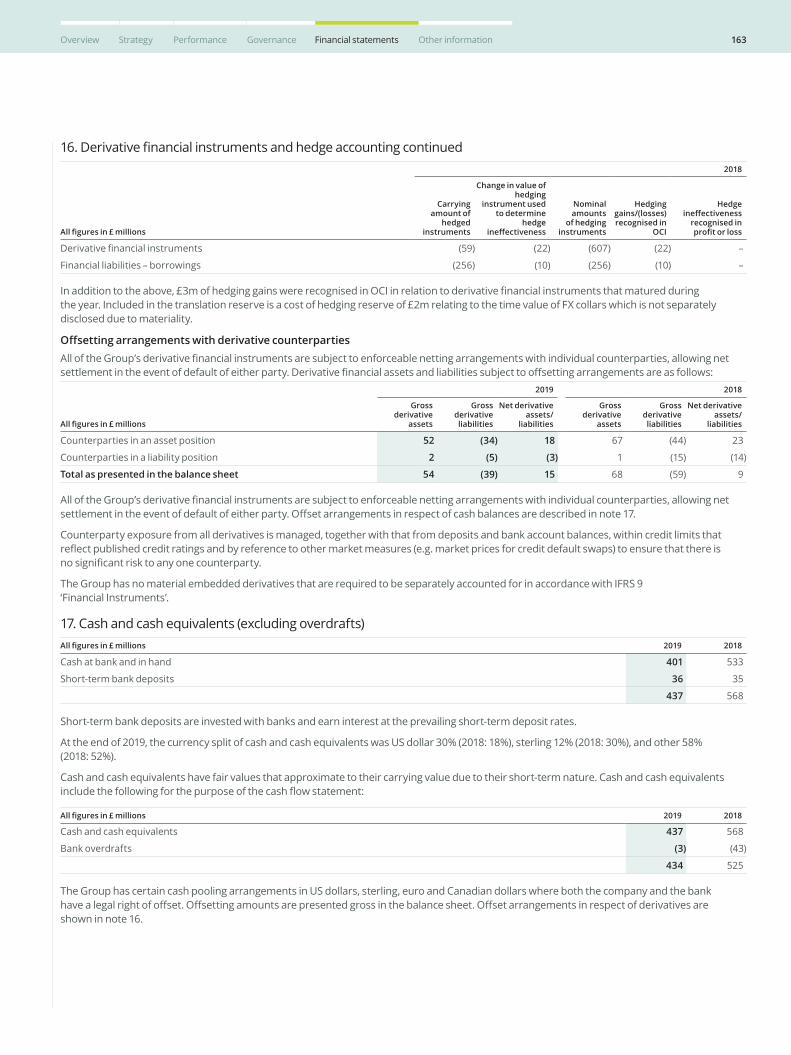
163Overview Strategy Performance Governance Financial statements Other information
16. Derivative financial instruments and hedge accounting continued
All figures in £ millions
2018
Carrying amount of
hedged instruments
Change in value of hedging
instrument used to determine
hedge ineffectiveness
Nominal amounts
of hedging instruments
Hedging gains/(losses) recognised in
OCI
Hedge ineffectiveness
recognised in profit or loss
Derivative financial instruments (59) (22) (607) (22) –
Financial liabilities – borrowings (256) (10) (256) (10) –
In addition to the above, £3m of hedging gains were recognised in OCI in relation to derivative financial instruments that matured during the year. Included in the translation reserve is a cost of hedging reserve of £2m relating to the time value of FX collars which is not separately disclosed due to materiality.
Offsetting arrangements with derivative counterpartiesAll of the Group’s derivative financial instruments are subject to enforceable netting arrangements with individual counterparties, allowing net settlement in the event of default of either party. Derivative financial assets and liabilities subject to offsetting arrangements are as follows:
All figures in £ millions
2019 2018
Gross derivative
assets
Gross derivative liabilities
Net derivative assets/
liabilities
Gross derivative
assets
Gross derivative liabilities
Net derivative assets/
liabilities
Counterparties in an asset position 52 (34) 18 67 (44) 23
Counterparties in a liability position 2 (5) (3) 1 (15) (14)
Total as presented in the balance sheet 54 (39) 15 68 (59) 9
All of the Group’s derivative financial instruments are subject to enforceable netting arrangements with individual counterparties, allowing net settlement in the event of default of either party. Offset arrangements in respect of cash balances are described in note 17.
Counterparty exposure from all derivatives is managed, together with that from deposits and bank account balances, within credit limits that reflect published credit ratings and by reference to other market measures (e.g. market prices for credit default swaps) to ensure that there is no significant risk to any one counterparty.
The Group has no material embedded derivatives that are required to be separately accounted for in accordance with IFRS 9 ‘Financial Instruments’.
17. Cash and cash equivalents (excluding overdrafts)All figures in £ millions 2019 2018
Cash at bank and in hand 401 533
Short-term bank deposits 36 35
437 568
Short-term bank deposits are invested with banks and earn interest at the prevailing short-term deposit rates.
At the end of 2019, the currency split of cash and cash equivalents was US dollar 30% (2018: 18%), sterling 12% (2018: 30%), and other 58% (2018: 52%).
Cash and cash equivalents have fair values that approximate to their carrying value due to their short-term nature. Cash and cash equivalents include the following for the purpose of the cash flow statement:
All figures in £ millions 2019 2018
Cash and cash equivalents 437 568
Bank overdrafts (3) (43)
434 525
The Group has certain cash pooling arrangements in US dollars, sterling, euro and Canadian dollars where both the company and the bank have a legal right of offset. Offsetting amounts are presented gross in the balance sheet. Offset arrangements in respect of derivatives are shown in note 16.
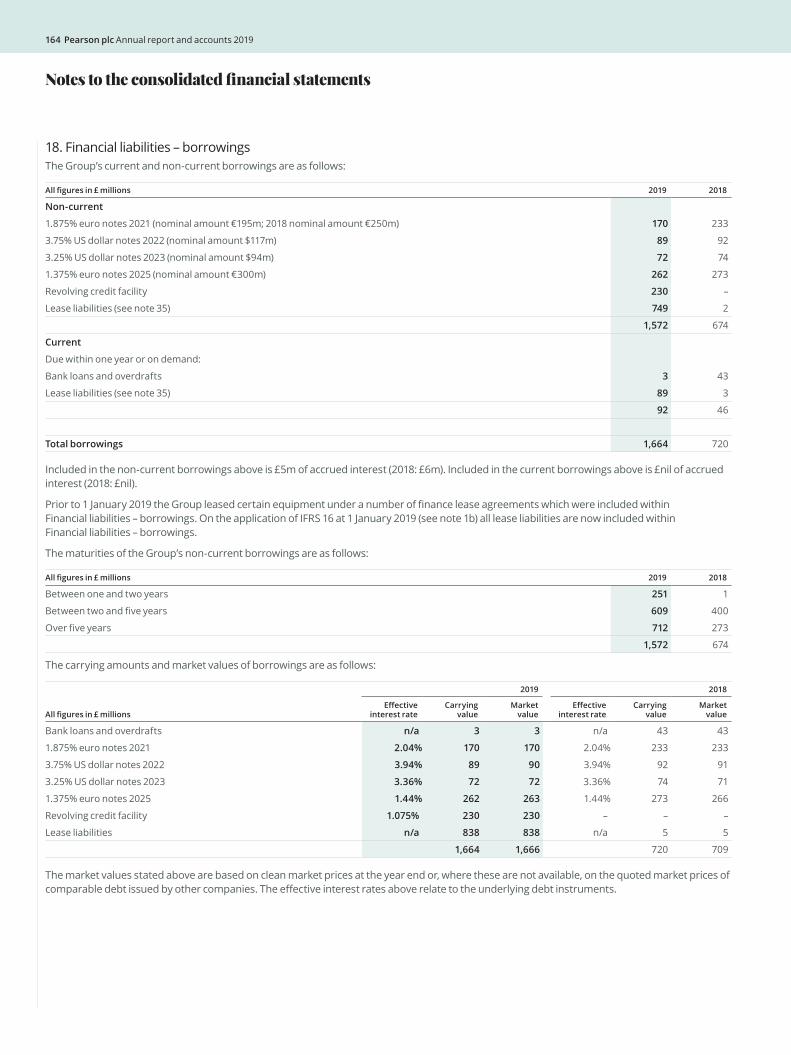
164 Pearson plc Annual report and accounts 2019
18. Financial liabilities – borrowingsThe Group’s current and non-current borrowings are as follows:
All figures in £ millions 2019 2018
Non-current
1.875% euro notes 2021 (nominal amount €195m; 2018 nominal amount €250m) 170 233
3.75% US dollar notes 2022 (nominal amount $117m) 89 92
3.25% US dollar notes 2023 (nominal amount $94m) 72 74
1.375% euro notes 2025 (nominal amount €300m) 262 273
Revolving credit facility 230 –
Lease liabilities (see note 35) 749 2
1,572 674
Current
Due within one year or on demand:
Bank loans and overdrafts 3 43
Lease liabilities (see note 35) 89 3
92 46
Total borrowings 1,664 720
Included in the non-current borrowings above is £5m of accrued interest (2018: £6m). Included in the current borrowings above is £nil of accrued interest (2018: £nil).
Prior to 1 January 2019 the Group leased certain equipment under a number of finance lease agreements which were included within Financial liabilities – borrowings. On the application of IFRS 16 at 1 January 2019 (see note 1b) all lease liabilities are now included within Financial liabilities – borrowings.
The maturities of the Group’s non-current borrowings are as follows:
All figures in £ millions 2019 2018
Between one and two years 251 1
Between two and five years 609 400
Over five years 712 273
1,572 674
The carrying amounts and market values of borrowings are as follows:
All figures in £ millions
2019 2018
Effective interest rate
Carrying value
Market value
Effective interest rate
Carrying value
Market value
Bank loans and overdrafts n/a 3 3 n/a 43 43
1.875% euro notes 2021 2.04% 170 170 2.04% 233 233
3.75% US dollar notes 2022 3.94% 89 90 3.94% 92 91
3.25% US dollar notes 2023 3.36% 72 72 3.36% 74 71
1.375% euro notes 2025 1.44% 262 263 1.44% 273 266
Revolving credit facility 1.075% 230 230 – – –
Lease liabilities n/a 838 838 n/a 5 5
1,664 1,666 720 709
The market values stated above are based on clean market prices at the year end or, where these are not available, on the quoted market prices of comparable debt issued by other companies. The effective interest rates above relate to the underlying debt instruments.
Notes to the consolidated financial statements
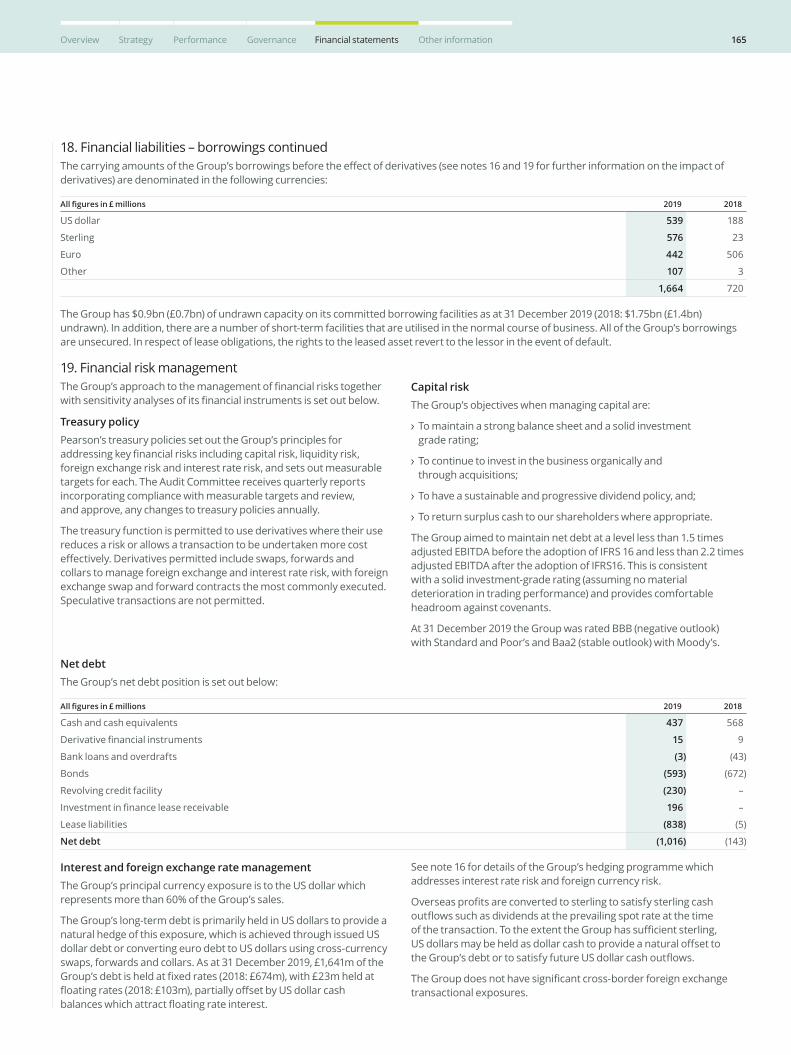
165Overview Strategy Performance Governance Financial statements Other information
18. Financial liabilities – borrowings continuedThe carrying amounts of the Group’s borrowings before the effect of derivatives (see notes 16 and 19 for further information on the impact of derivatives) are denominated in the following currencies:
All figures in £ millions 2019 2018
US dollar 539 188
Sterling 576 23
Euro 442 506
Other 107 3
1,664 720
The Group has $0.9bn (£0.7bn) of undrawn capacity on its committed borrowing facilities as at 31 December 2019 (2018: $1.75bn (£1.4bn) undrawn). In addition, there are a number of short-term facilities that are utilised in the normal course of business. All of the Group’s borrowings are unsecured. In respect of lease obligations, the rights to the leased asset revert to the lessor in the event of default.
19. Financial risk managementThe Group’s approach to the management of financial risks together with sensitivity analyses of its financial instruments is set out below.
Treasury policyPearson’s treasury policies set out the Group’s principles for addressing key financial risks including capital risk, liquidity risk, foreign exchange risk and interest rate risk, and sets out measurable targets for each. The Audit Committee receives quarterly reports incorporating compliance with measurable targets and review, and approve, any changes to treasury policies annually.
The treasury function is permitted to use derivatives where their use reduces a risk or allows a transaction to be undertaken more cost effectively. Derivatives permitted include swaps, forwards and collars to manage foreign exchange and interest rate risk, with foreign exchange swap and forward contracts the most commonly executed. Speculative transactions are not permitted.
Capital risk The Group’s objectives when managing capital are:
To maintain a strong balance sheet and a solid investment grade rating;
To continue to invest in the business organically and through acquisitions;
To have a sustainable and progressive dividend policy, and;
To return surplus cash to our shareholders where appropriate.
The Group aimed to maintain net debt at a level less than 1.5 times adjusted EBITDA before the adoption of IFRS 16 and less than 2.2 times adjusted EBITDA after the adoption of IFRS16. This is consistent with a solid investment-grade rating (assuming no material deterioration in trading performance) and provides comfortable headroom against covenants.
At 31 December 2019 the Group was rated BBB (negative outlook) with Standard and Poor’s and Baa2 (stable outlook) with Moody’s.
Net debtThe Group’s net debt position is set out below:
All figures in £ millions 2019 2018
Cash and cash equivalents 437 568
Derivative financial instruments 15 9
Bank loans and overdrafts (3) (43)
Bonds (593) (672)
Revolving credit facility (230) –
Investment in finance lease receivable 196 –
Lease liabilities (838) (5)
Net debt (1,016) (143)
Interest and foreign exchange rate managementThe Group’s principal currency exposure is to the US dollar which represents more than 60% of the Group’s sales.
The Group’s long-term debt is primarily held in US dollars to provide a natural hedge of this exposure, which is achieved through issued US dollar debt or converting euro debt to US dollars using cross-currency swaps, forwards and collars. As at 31 December 2019, £1,641m of the Group’s debt is held at fixed rates (2018: £674m), with £23m held at floating rates (2018: £103m), partially offset by US dollar cash balances which attract floating rate interest.
See note 16 for details of the Group’s hedging programme which addresses interest rate risk and foreign currency risk.
Overseas profits are converted to sterling to satisfy sterling cash outflows such as dividends at the prevailing spot rate at the time of the transaction. To the extent the Group has sufficient sterling, US dollars may be held as dollar cash to provide a natural offset to the Group’s debt or to satisfy future US dollar cash outflows.
The Group does not have significant cross-border foreign exchange transactional exposures.
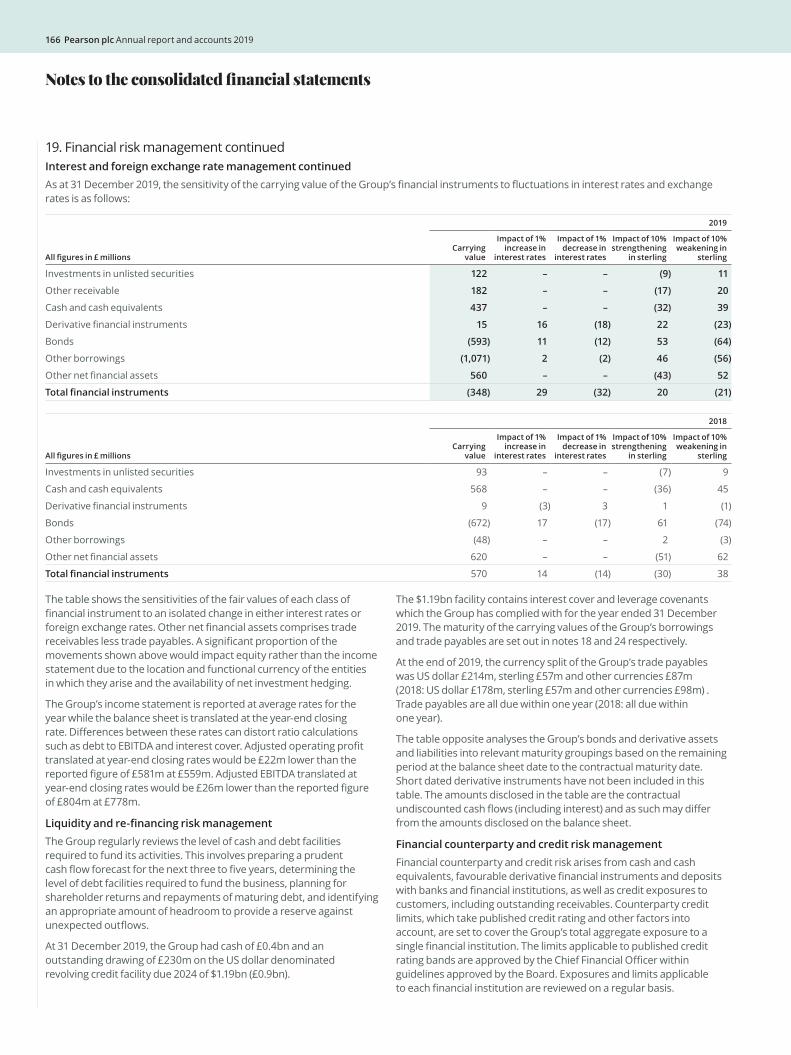
166 Pearson plc Annual report and accounts 2019
19. Financial risk management continuedInterest and foreign exchange rate management continuedAs at 31 December 2019, the sensitivity of the carrying value of the Group’s financial instruments to fluctuations in interest rates and exchange rates is as follows:
All figures in £ millions
2019
Carrying value
Impact of 1% increase in
interest rates
Impact of 1% decrease in
interest rates
Impact of 10% strengthening
in sterling
Impact of 10% weakening in
sterling
Investments in unlisted securities 122 – – (9) 11
Other receivable 182 – – (17) 20
Cash and cash equivalents 437 – – (32) 39
Derivative financial instruments 15 16 (18) 22 (23)
Bonds (593) 11 (12) 53 (64)
Other borrowings (1,071) 2 (2) 46 (56)
Other net financial assets 560 – – (43) 52
Total financial instruments (348) 29 (32) 20 (21)
All figures in £ millions
2018
Carrying value
Impact of 1% increase in
interest rates
Impact of 1% decrease in
interest rates
Impact of 10% strengthening
in sterling
Impact of 10% weakening in
sterling
Investments in unlisted securities 93 – – (7) 9
Cash and cash equivalents 568 – – (36) 45
Derivative financial instruments 9 (3) 3 1 (1)
Bonds (672) 17 (17) 61 (74)
Other borrowings (48) – – 2 (3)
Other net financial assets 620 – – (51) 62
Total financial instruments 570 14 (14) (30) 38
The table shows the sensitivities of the fair values of each class of financial instrument to an isolated change in either interest rates or foreign exchange rates. Other net financial assets comprises trade receivables less trade payables. A significant proportion of the movements shown above would impact equity rather than the income statement due to the location and functional currency of the entities in which they arise and the availability of net investment hedging.
The Group’s income statement is reported at average rates for the year while the balance sheet is translated at the year-end closing rate. Differences between these rates can distort ratio calculations such as debt to EBITDA and interest cover. Adjusted operating profit translated at year-end closing rates would be £22m lower than the reported figure of £581m at £559m. Adjusted EBITDA translated at year-end closing rates would be £26m lower than the reported figure of £804m at £778m.
Liquidity and re-financing risk management The Group regularly reviews the level of cash and debt facilities required to fund its activities. This involves preparing a prudent cash flow forecast for the next three to five years, determining the level of debt facilities required to fund the business, planning for shareholder returns and repayments of maturing debt, and identifying an appropriate amount of headroom to provide a reserve against unexpected outflows.
At 31 December 2019, the Group had cash of £0.4bn and an outstanding drawing of £230m on the US dollar denominated revolving credit facility due 2024 of $1.19bn (£0.9bn).
The $1.19bn facility contains interest cover and leverage covenants which the Group has complied with for the year ended 31 December 2019. The maturity of the carrying values of the Group’s borrowings and trade payables are set out in notes 18 and 24 respectively.
At the end of 2019, the currency split of the Group’s trade payables was US dollar £214m, sterling £57m and other currencies £87m (2018: US dollar £178m, sterling £57m and other currencies £98m) . Trade payables are all due within one year (2018: all due within one year).
The table opposite analyses the Group’s bonds and derivative assets and liabilities into relevant maturity groupings based on the remaining period at the balance sheet date to the contractual maturity date. Short dated derivative instruments have not been included in this table. The amounts disclosed in the table are the contractual undiscounted cash flows (including interest) and as such may differ from the amounts disclosed on the balance sheet.
Financial counterparty and credit risk managementFinancial counterparty and credit risk arises from cash and cash equivalents, favourable derivative financial instruments and deposits with banks and financial institutions, as well as credit exposures to customers, including outstanding receivables. Counterparty credit limits, which take published credit rating and other factors into account, are set to cover the Group’s total aggregate exposure to a single financial institution. The limits applicable to published credit rating bands are approved by the Chief Financial Officer within guidelines approved by the Board. Exposures and limits applicable to each financial institution are reviewed on a regular basis.
Notes to the consolidated financial statements
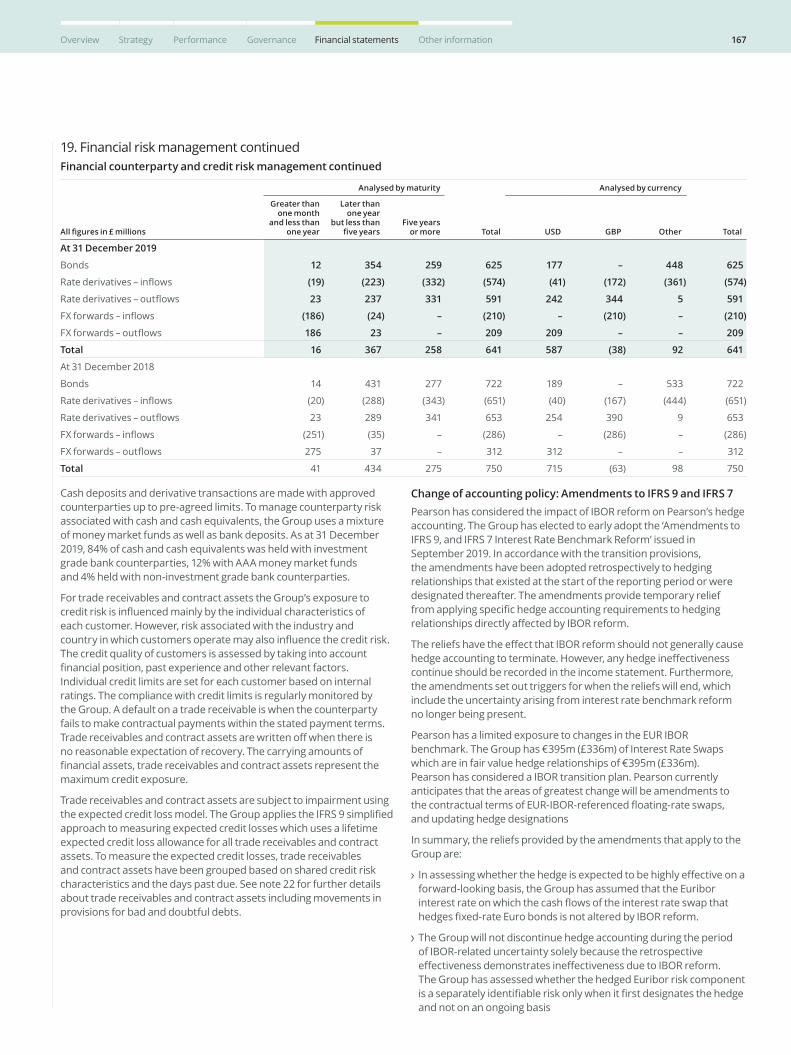
167Overview Strategy Performance Governance Financial statements Other information
19. Financial risk management continuedFinancial counterparty and credit risk management continued
All figures in £ millions
Analysed by maturity
Total
Analysed by currency
Total
Greater than one month
and less than one year
Later than one year
but less than five years
Five years or more USD GBP Other
At 31 December 2019
Bonds 12 354 259 625 177 – 448 625
Rate derivatives – inflows (19) (223) (332) (574) (41) (172) (361) (574)
Rate derivatives – outflows 23 237 331 591 242 344 5 591
FX forwards – inflows (186) (24) – (210) – (210) – (210)
FX forwards – outflows 186 23 – 209 209 – – 209
Total 16 367 258 641 587 (38) 92 641
At 31 December 2018
Bonds 14 431 277 722 189 – 533 722
Rate derivatives – inflows (20) (288) (343) (651) (40) (167) (444) (651)
Rate derivatives – outflows 23 289 341 653 254 390 9 653
FX forwards – inflows (251) (35) – (286) – (286) – (286)
FX forwards – outflows 275 37 – 312 312 – – 312
Total 41 434 275 750 715 (63) 98 750
Cash deposits and derivative transactions are made with approved counterparties up to pre-agreed limits. To manage counterparty risk associated with cash and cash equivalents, the Group uses a mixture of money market funds as well as bank deposits. As at 31 December 2019, 84% of cash and cash equivalents was held with investment grade bank counterparties, 12% with AAA money market funds and 4% held with non-investment grade bank counterparties.
For trade receivables and contract assets the Group’s exposure to credit risk is influenced mainly by the individual characteristics of each customer. However, risk associated with the industry and country in which customers operate may also influence the credit risk. The credit quality of customers is assessed by taking into account financial position, past experience and other relevant factors. Individual credit limits are set for each customer based on internal ratings. The compliance with credit limits is regularly monitored by the Group. A default on a trade receivable is when the counterparty fails to make contractual payments within the stated payment terms. Trade receivables and contract assets are written off when there is no reasonable expectation of recovery. The carrying amounts of financial assets, trade receivables and contract assets represent the maximum credit exposure.
Trade receivables and contract assets are subject to impairment using the expected credit loss model. The Group applies the IFRS 9 simplified approach to measuring expected credit losses which uses a lifetime expected credit loss allowance for all trade receivables and contract assets. To measure the expected credit losses, trade receivables and contract assets have been grouped based on shared credit risk characteristics and the days past due. See note 22 for further details about trade receivables and contract assets including movements in provisions for bad and doubtful debts.
Change of accounting policy: Amendments to IFRS 9 and IFRS 7Pearson has considered the impact of IBOR reform on Pearson’s hedge accounting. The Group has elected to early adopt the ‘Amendments to IFRS 9, and IFRS 7 Interest Rate Benchmark Reform’ issued in September 2019. In accordance with the transition provisions, the amendments have been adopted retrospectively to hedging relationships that existed at the start of the reporting period or were designated thereafter. The amendments provide temporary relief from applying specific hedge accounting requirements to hedging relationships directly affected by IBOR reform.
The reliefs have the effect that IBOR reform should not generally cause hedge accounting to terminate. However, any hedge ineffectiveness continue should be recorded in the income statement. Furthermore, the amendments set out triggers for when the reliefs will end, which include the uncertainty arising from interest rate benchmark reform no longer being present.
Pearson has a limited exposure to changes in the EUR IBOR benchmark. The Group has €395m (£336m) of Interest Rate Swaps which are in fair value hedge relationships of €395m (£336m). Pearson has considered a IBOR transition plan. Pearson currently anticipates that the areas of greatest change will be amendments to the contractual terms of EUR-IBOR-referenced floating-rate swaps, and updating hedge designations
In summary, the reliefs provided by the amendments that apply to the Group are:
In assessing whether the hedge is expected to be highly effective on a forward-looking basis, the Group has assumed that the Euribor interest rate on which the cash flows of the interest rate swap that hedges fixed-rate Euro bonds is not altered by IBOR reform.
The Group will not discontinue hedge accounting during the period of IBOR-related uncertainty solely because the retrospective effectiveness demonstrates ineffectiveness due to IBOR reform. The Group has assessed whether the hedged Euribor risk component is a separately identifiable risk only when it first designates the hedge and not on an ongoing basis

168 Pearson plc Annual report and accounts 2019
20. Intangible assets – pre-publicationAll figures in £ millions 2019 2018
Cost
At beginning of year 2,096 1,854
Exchange differences (66) 70
Additions 306 328
Disposals (82) (158)
Transfer from property, plant and equipment 9 2
Transfer from intangible assets 12 –
At end of year 2,275 2,096
Amortisation
At beginning of year (1,279) (1,113)
Exchange differences 53 (53)
Charge for the year (261) (271)
Disposals 82 158
At end of year (1,405) (1,279)
Carrying amounts at end of year 870 817
Included in the above are pre-publication assets amounting to £585m (2018: £577m) which will be realised in more than one year.
Amortisation is included in the income statement in cost of goods sold.
In addition to the above, in 2019 there was a £10m charge and additions of £13m relating to assets and liabilities held for sale. In 2018 £242m of pre-publication assets were included in assets classified as held for sale (see note 32) with a charge of £67m and additions of £60m in 2018 related to assets and liabilities held for sale.
21. InventoriesAll figures in £ millions 2019 2018
Raw materials 5 5
Work in progress 2 –
Finished goods 155 149
Returns asset 7 10
169 164
The cost of inventories recognised as an expense and included in the income statement in cost of goods sold amounted to £231m (2018: £375m). In 2019, £33m (2018: £39m) of inventory provisions was charged in the income statement. None of the inventory is pledged as security.
Included within the inventory balance is the estimation of the right to receive goods from contracts with customers via returns. The value of the returns asset is measured at the carrying amount of the assets at the time of sale aligned to the Group’s normal inventory valuation methodology less any expected costs to recover the asset and any expected reduction in value. Impairment charges against the inventory returns asset are £nil in 2019 (2018: £nil). The returns asset all relates to finished goods.
Notes to the consolidated financial statements
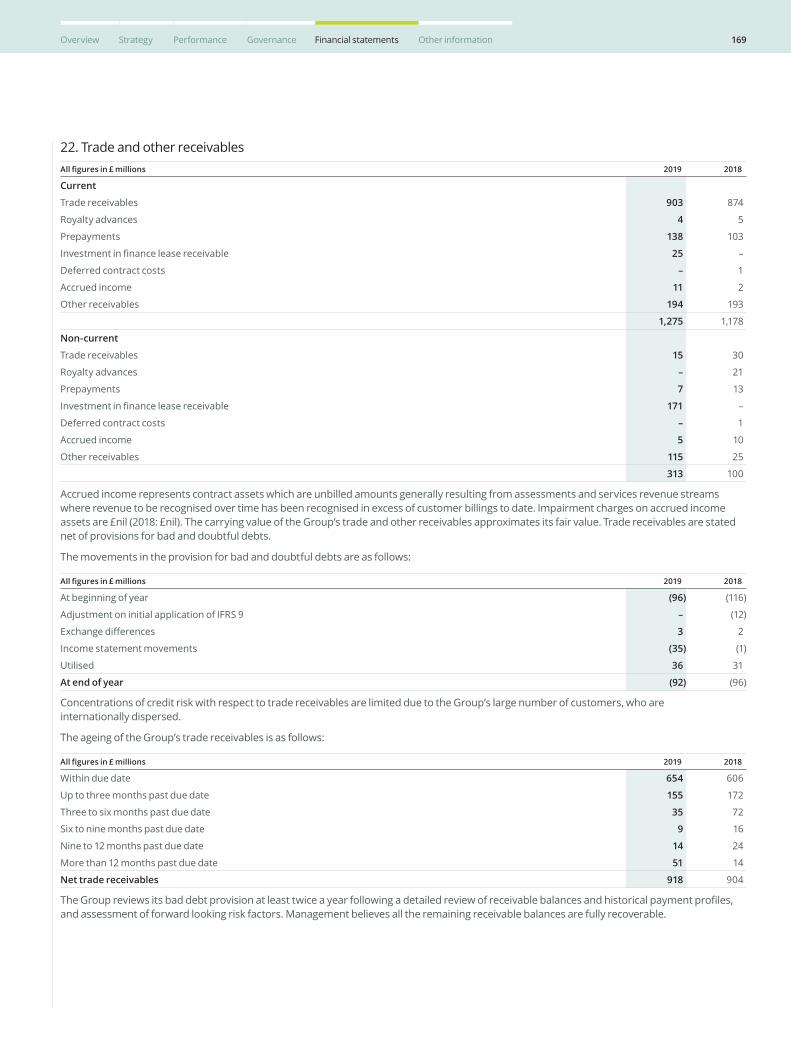
169Overview Strategy Performance Governance Financial statements Other information
22. Trade and other receivablesAll figures in £ millions 2019 2018
Current
Trade receivables 903 874
Royalty advances 4 5
Prepayments 138 103
Investment in finance lease receivable 25 –
Deferred contract costs – 1
Accrued income 11 2
Other receivables 194 193
1,275 1,178
Non-current
Trade receivables 15 30
Royalty advances – 21
Prepayments 7 13
Investment in finance lease receivable 171 –
Deferred contract costs – 1
Accrued income 5 10
Other receivables 115 25
313 100
Accrued income represents contract assets which are unbilled amounts generally resulting from assessments and services revenue streams where revenue to be recognised over time has been recognised in excess of customer billings to date. Impairment charges on accrued income assets are £nil (2018: £nil). The carrying value of the Group’s trade and other receivables approximates its fair value. Trade receivables are stated net of provisions for bad and doubtful debts.
The movements in the provision for bad and doubtful debts are as follows:
All figures in £ millions 2019 2018
At beginning of year (96) (116)
Adjustment on initial application of IFRS 9 – (12)
Exchange differences 3 2
Income statement movements (35) (1)
Utilised 36 31
At end of year (92) (96)
Concentrations of credit risk with respect to trade receivables are limited due to the Group’s large number of customers, who are internationally dispersed.
The ageing of the Group’s trade receivables is as follows:
All figures in £ millions 2019 2018
Within due date 654 606
Up to three months past due date 155 172
Three to six months past due date 35 72
Six to nine months past due date 9 16
Nine to 12 months past due date 14 24
More than 12 months past due date 51 14
Net trade receivables 918 904
The Group reviews its bad debt provision at least twice a year following a detailed review of receivable balances and historical payment profiles, and assessment of forward looking risk factors. Management believes all the remaining receivable balances are fully recoverable.
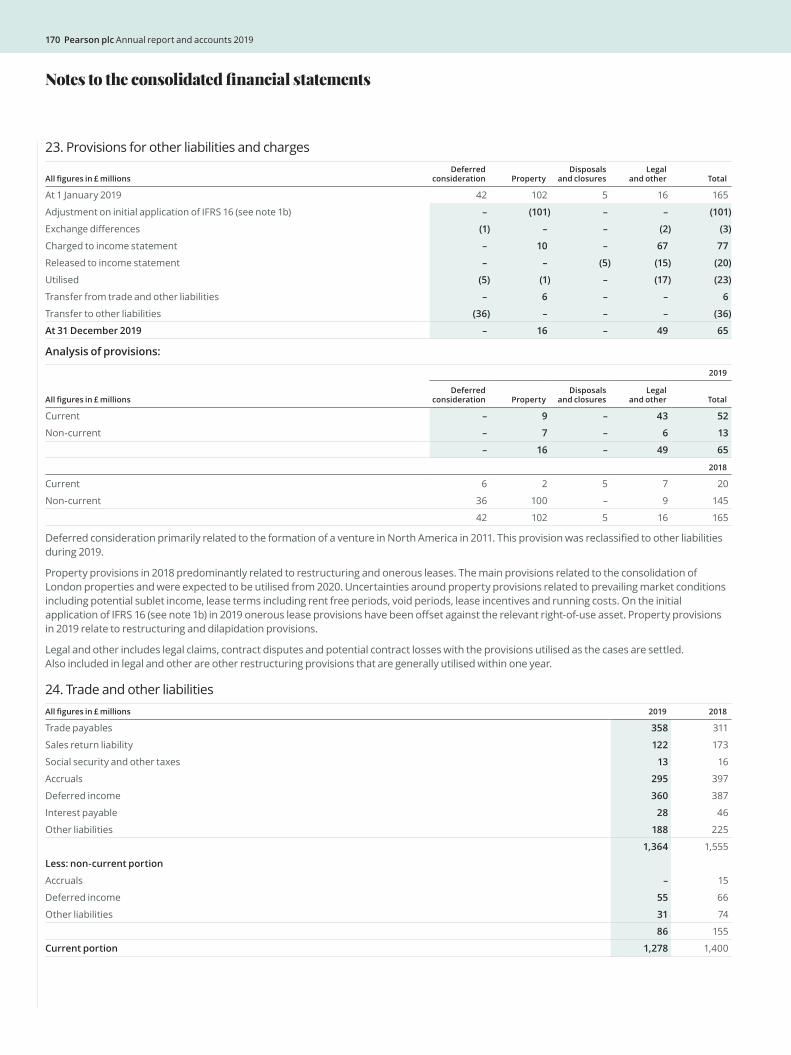
170 Pearson plc Annual report and accounts 2019
23. Provisions for other liabilities and charges
All figures in £ millionsDeferred
consideration PropertyDisposals
and closuresLegal
and other Total
At 1 January 2019 42 102 5 16 165
Adjustment on initial application of IFRS 16 (see note 1b) – (101) – – (101)
Exchange differences (1) – – (2) (3)
Charged to income statement – 10 – 67 77
Released to income statement – – (5) (15) (20)
Utilised (5) (1) – (17) (23)
Transfer from trade and other liabilities – 6 – – 6
Transfer to other liabilities (36) – – – (36)
At 31 December 2019 – 16 – 49 65
Analysis of provisions:
All figures in £ millions
2019
Deferred consideration Property
Disposals and closures
Legal and other Total
Current – 9 – 43 52
Non-current – 7 – 6 13
– 16 – 49 65
2018
Current 6 2 5 7 20
Non-current 36 100 – 9 145
42 102 5 16 165
Deferred consideration primarily related to the formation of a venture in North America in 2011. This provision was reclassified to other liabilities during 2019.
Property provisions in 2018 predominantly related to restructuring and onerous leases. The main provisions related to the consolidation of London properties and were expected to be utilised from 2020. Uncertainties around property provisions related to prevailing market conditions including potential sublet income, lease terms including rent free periods, void periods, lease incentives and running costs. On the initial application of IFRS 16 (see note 1b) in 2019 onerous lease provisions have been offset against the relevant right-of-use asset. Property provisions in 2019 relate to restructuring and dilapidation provisions.
Legal and other includes legal claims, contract disputes and potential contract losses with the provisions utilised as the cases are settled. Also included in legal and other are other restructuring provisions that are generally utilised within one year.
24. Trade and other liabilitiesAll figures in £ millions 2019 2018
Trade payables 358 311
Sales return liability 122 173
Social security and other taxes 13 16
Accruals 295 397
Deferred income 360 387
Interest payable 28 46
Other liabilities 188 225
1,364 1,555
Less: non-current portion
Accruals – 15
Deferred income 55 66
Other liabilities 31 74
86 155
Current portion 1,278 1,400
Notes to the consolidated financial statements
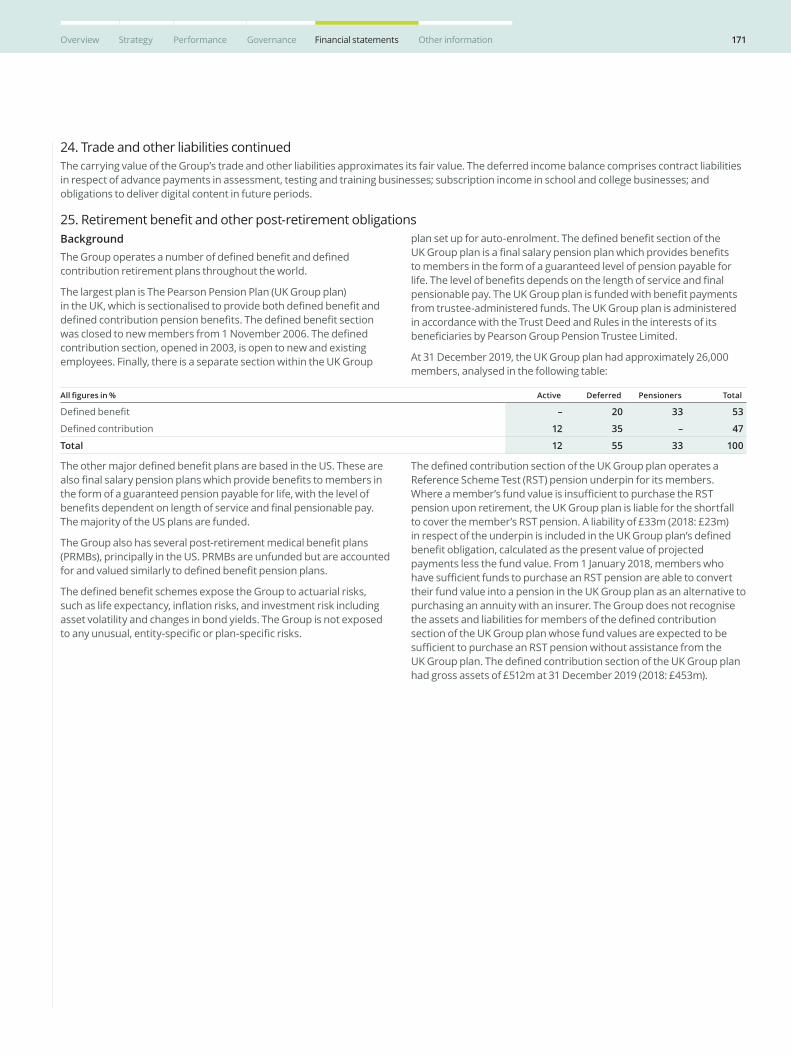
171Overview Strategy Performance Governance Financial statements Other information
24. Trade and other liabilities continuedThe carrying value of the Group’s trade and other liabilities approximates its fair value. The deferred income balance comprises contract liabilities in respect of advance payments in assessment, testing and training businesses; subscription income in school and college businesses; and obligations to deliver digital content in future periods.
25. Retirement benefit and other post-retirement obligationsBackgroundThe Group operates a number of defined benefit and defined contribution retirement plans throughout the world.
The largest plan is The Pearson Pension Plan (UK Group plan) in the UK, which is sectionalised to provide both defined benefit and defined contribution pension benefits. The defined benefit section was closed to new members from 1 November 2006. The defined contribution section, opened in 2003, is open to new and existing employees. Finally, there is a separate section within the UK Group
plan set up for auto-enrolment. The defined benefit section of the UK Group plan is a final salary pension plan which provides benefits to members in the form of a guaranteed level of pension payable for life. The level of benefits depends on the length of service and final pensionable pay. The UK Group plan is funded with benefit payments from trustee-administered funds. The UK Group plan is administered in accordance with the Trust Deed and Rules in the interests of its beneficiaries by Pearson Group Pension Trustee Limited.
At 31 December 2019, the UK Group plan had approximately 26,000 members, analysed in the following table:
All figures in % Active Deferred Pensioners Total
Defined benefit – 20 33 53
Defined contribution 12 35 – 47
Total 12 55 33 100
The other major defined benefit plans are based in the US. These are also final salary pension plans which provide benefits to members in the form of a guaranteed pension payable for life, with the level of benefits dependent on length of service and final pensionable pay. The majority of the US plans are funded.
The Group also has several post-retirement medical benefit plans (PRMBs), principally in the US. PRMBs are unfunded but are accounted for and valued similarly to defined benefit pension plans.
The defined benefit schemes expose the Group to actuarial risks, such as life expectancy, inflation risks, and investment risk including asset volatility and changes in bond yields. The Group is not exposed to any unusual, entity-specific or plan-specific risks.
The defined contribution section of the UK Group plan operates a Reference Scheme Test (RST) pension underpin for its members. Where a member’s fund value is insufficient to purchase the RST pension upon retirement, the UK Group plan is liable for the shortfall to cover the member’s RST pension. A liability of £33m (2018: £23m) in respect of the underpin is included in the UK Group plan’s defined benefit obligation, calculated as the present value of projected payments less the fund value. From 1 January 2018, members who have sufficient funds to purchase an RST pension are able to convert their fund value into a pension in the UK Group plan as an alternative to purchasing an annuity with an insurer. The Group does not recognise the assets and liabilities for members of the defined contribution section of the UK Group plan whose fund values are expected to be sufficient to purchase an RST pension without assistance from the UK Group plan. The defined contribution section of the UK Group plan had gross assets of £512m at 31 December 2019 (2018: £453m).
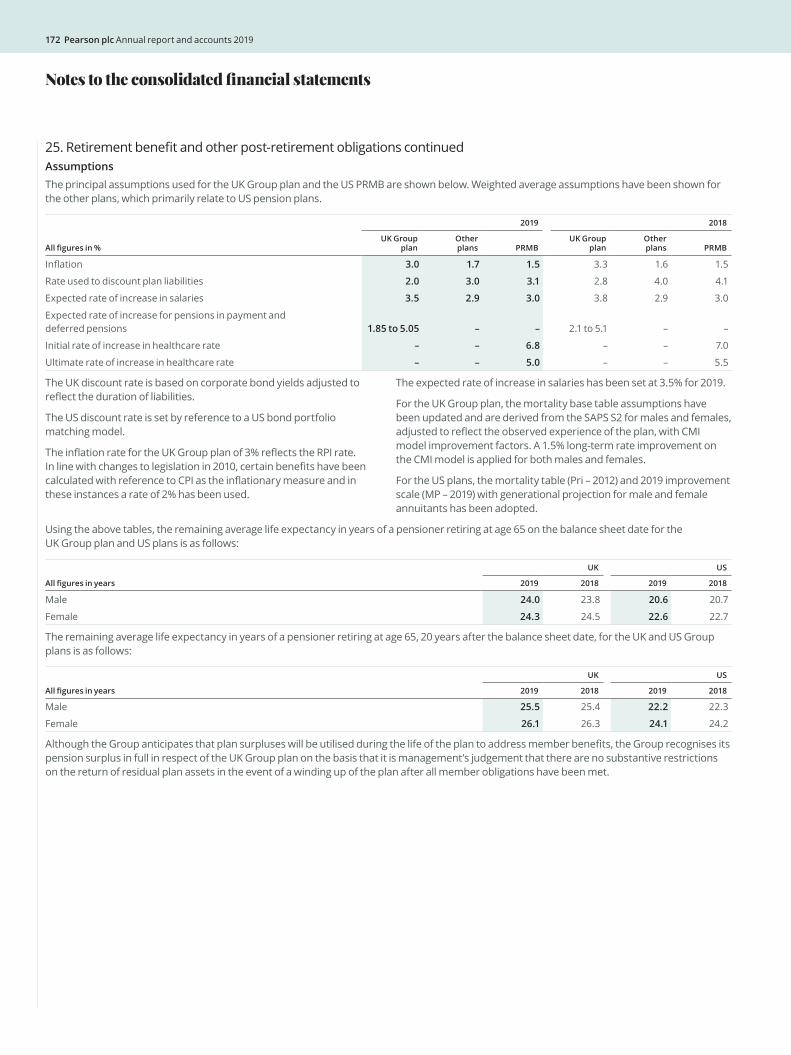
172 Pearson plc Annual report and accounts 2019
25. Retirement benefit and other post-retirement obligations continuedAssumptionsThe principal assumptions used for the UK Group plan and the US PRMB are shown below. Weighted average assumptions have been shown for the other plans, which primarily relate to US pension plans.
All figures in %
2019 2018
UK Group plan
Other plans PRMB
UK Group plan
Other plans PRMB
Inflation 3.0 1.7 1.5 3.3 1.6 1.5
Rate used to discount plan liabilities 2.0 3.0 3.1 2.8 4.0 4.1
Expected rate of increase in salaries 3.5 2.9 3.0 3.8 2.9 3.0
Expected rate of increase for pensions in payment and deferred pensions 1.85 to 5.05 – – 2.1 to 5.1 – –
Initial rate of increase in healthcare rate – – 6.8 – – 7.0
Ultimate rate of increase in healthcare rate – – 5.0 – – 5.5
The UK discount rate is based on corporate bond yields adjusted to reflect the duration of liabilities.
The US discount rate is set by reference to a US bond portfolio matching model.
The inflation rate for the UK Group plan of 3% reflects the RPI rate. In line with changes to legislation in 2010, certain benefits have been calculated with reference to CPI as the inflationary measure and in these instances a rate of 2% has been used.
The expected rate of increase in salaries has been set at 3.5% for 2019.
For the UK Group plan, the mortality base table assumptions have been updated and are derived from the SAPS S2 for males and females, adjusted to reflect the observed experience of the plan, with CMI model improvement factors. A 1.5% long-term rate improvement on the CMI model is applied for both males and females.
For the US plans, the mortality table (Pri – 2012) and 2019 improvement scale (MP – 2019) with generational projection for male and female annuitants has been adopted.
Using the above tables, the remaining average life expectancy in years of a pensioner retiring at age 65 on the balance sheet date for the UK Group plan and US plans is as follows:
All figures in years
UK US
2019 2018 2019 2018
Male 24.0 23.8 20.6 20.7
Female 24.3 24.5 22.6 22.7
The remaining average life expectancy in years of a pensioner retiring at age 65, 20 years after the balance sheet date, for the UK and US Group plans is as follows:
All figures in years
UK US
2019 2018 2019 2018
Male 25.5 25.4 22.2 22.3
Female 26.1 26.3 24.1 24.2
Although the Group anticipates that plan surpluses will be utilised during the life of the plan to address member benefits, the Group recognises its pension surplus in full in respect of the UK Group plan on the basis that it is management’s judgement that there are no substantive restrictions on the return of residual plan assets in the event of a winding up of the plan after all member obligations have been met.
Notes to the consolidated financial statements
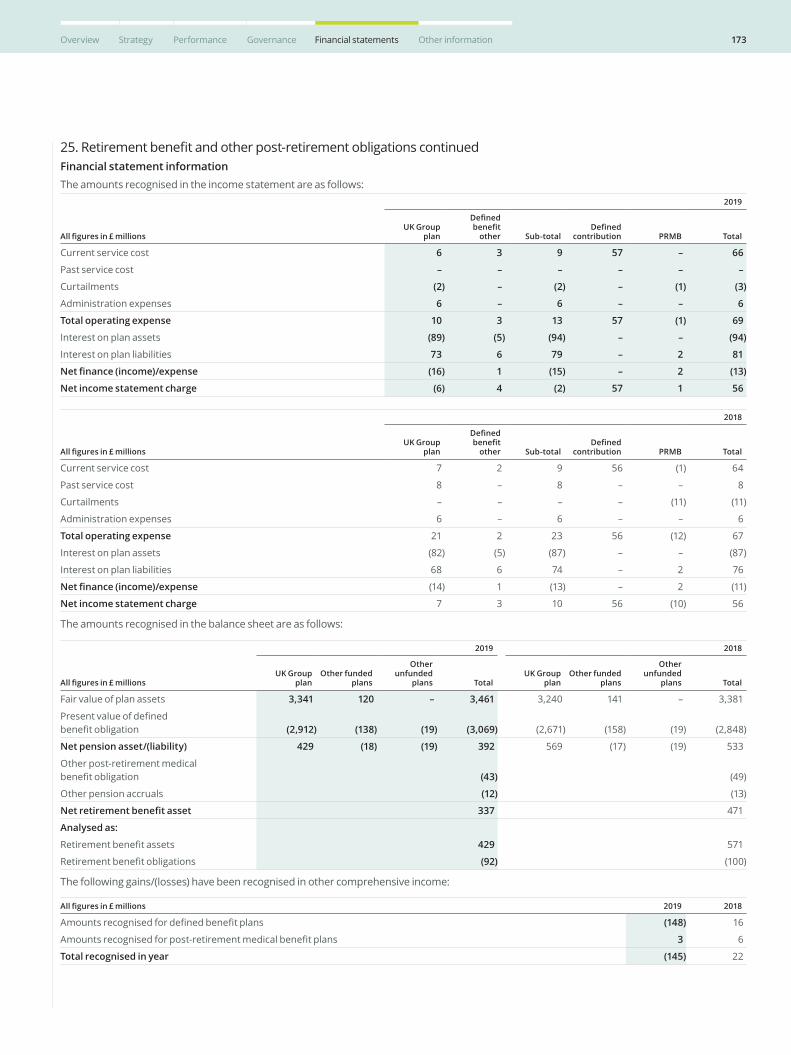
173Overview Strategy Performance Governance Financial statements Other information
25. Retirement benefit and other post-retirement obligations continuedFinancial statement informationThe amounts recognised in the income statement are as follows:
All figures in £ millions
2019
UK Group plan
Defined benefit
other Sub-totalDefined
contribution PRMB Total
Current service cost 6 3 9 57 – 66
Past service cost – – – – – –
Curtailments (2) – (2) – (1) (3)
Administration expenses 6 – 6 – – 6
Total operating expense 10 3 13 57 (1) 69
Interest on plan assets (89) (5) (94) – – (94)
Interest on plan liabilities 73 6 79 – 2 81
Net finance (income)/expense (16) 1 (15) – 2 (13)
Net income statement charge (6) 4 (2) 57 1 56
All figures in £ millions
2018
UK Group plan
Defined benefit
other Sub-totalDefined
contribution PRMB Total
Current service cost 7 2 9 56 (1) 64
Past service cost 8 – 8 – – 8
Curtailments – – – – (11) (11)
Administration expenses 6 – 6 – – 6
Total operating expense 21 2 23 56 (12) 67
Interest on plan assets (82) (5) (87) – – (87)
Interest on plan liabilities 68 6 74 – 2 76
Net finance (income)/expense (14) 1 (13) – 2 (11)
Net income statement charge 7 3 10 56 (10) 56
The amounts recognised in the balance sheet are as follows:
All figures in £ millions
2019 2018
UK Group plan
Other funded plans
Other unfunded
plans TotalUK Group
planOther funded
plans
Other unfunded
plans Total
Fair value of plan assets 3,341 120 – 3,461 3,240 141 – 3,381
Present value of defined benefit obligation (2,912) (138) (19) (3,069) (2,671) (158) (19) (2,848)
Net pension asset/(liability) 429 (18) (19) 392 569 (17) (19) 533
Other post-retirement medical benefit obligation (43) (49)
Other pension accruals (12) (13)
Net retirement benefit asset 337 471
Analysed as:
Retirement benefit assets 429 571
Retirement benefit obligations (92) (100)
The following gains/(losses) have been recognised in other comprehensive income:
All figures in £ millions 2019 2018
Amounts recognised for defined benefit plans (148) 16
Amounts recognised for post-retirement medical benefit plans 3 6
Total recognised in year (145) 22

174 Pearson plc Annual report and accounts 2019
25. Retirement benefit and other post-retirement obligations continuedFinancial statement information continuedThe fair value of plan assets comprises the following:
All figures in %
2019 2018
UK Group plan
Other funded plans Total
UK Group plan
Other funded plans Total
Insurance 43 – 43 28 1 29
Equities 1 1 2 1 1 2
Bonds 5 2 7 – 2 2
Property 5 – 5 7 – 7
Pooled asset investment funds 30 – 30 44 – 44
Other 13 – 13 16 – 16
The plan assets do not include any of the Group’s own financial instruments, or any property occupied by the Group. The table below further disaggregates the plan assets into additional categories and those assets which have a quoted market price in an active market and those that do not:
All figures in %
2019 2018
Quoted market price
No quoted market price
Quoted market price
No quoted market price
Insurance 43 – 29 –
Non-UK equities – 2 – 2
Fixed-interest securities 7 – 2 –
Property – 5 – 7
Pooled asset investment funds 30 – 44 –
Other – 13 – 16
Total 80 20 75 25
The liquidity profile of the UK Group plan assets is as follows:
All figures in % 2019 2018
Liquid – call <1 month 37 51
Less liquid – call 1–3 months – –
Illiquid – call >3 months 63 49
Notes to the consolidated financial statements
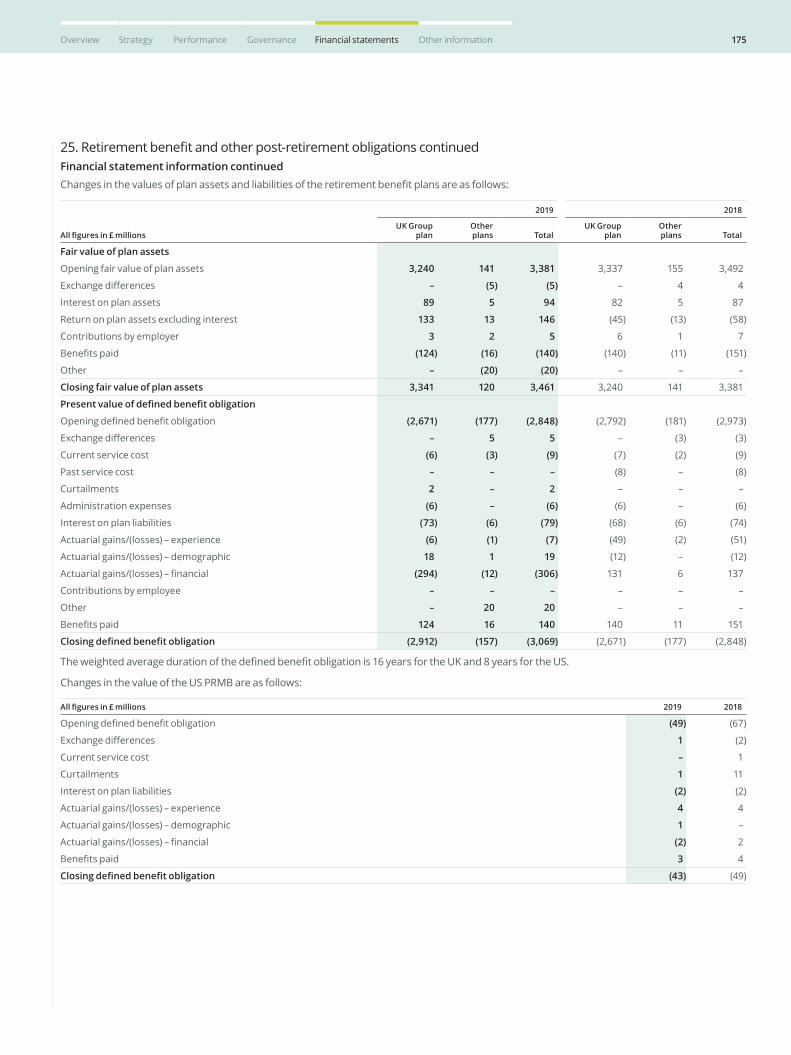
175Overview Strategy Performance Governance Financial statements Other information
25. Retirement benefit and other post-retirement obligations continuedFinancial statement information continuedChanges in the values of plan assets and liabilities of the retirement benefit plans are as follows:
All figures in £ millions
2019 2018
UK Group plan
Other plans Total
UK Group plan
Other plans Total
Fair value of plan assets
Opening fair value of plan assets 3,240 141 3,381 3,337 155 3,492
Exchange differences – (5) (5) – 4 4
Interest on plan assets 89 5 94 82 5 87
Return on plan assets excluding interest 133 13 146 (45) (13) (58)
Contributions by employer 3 2 5 6 1 7
Benefits paid (124) (16) (140) (140) (11) (151)
Other – (20) (20) – – –
Closing fair value of plan assets 3,341 120 3,461 3,240 141 3,381
Present value of defined benefit obligation
Opening defined benefit obligation (2,671) (177) (2,848) (2,792) (181) (2,973)
Exchange differences – 5 5 – (3) (3)
Current service cost (6) (3) (9) (7) (2) (9)
Past service cost – – – (8) – (8)
Curtailments 2 – 2 – – –
Administration expenses (6) – (6) (6) – (6)
Interest on plan liabilities (73) (6) (79) (68) (6) (74)
Actuarial gains/(losses) – experience (6) (1) (7) (49) (2) (51)
Actuarial gains/(losses) – demographic 18 1 19 (12) – (12)
Actuarial gains/(losses) – financial (294) (12) (306) 131 6 137
Contributions by employee – – – – – –
Other – 20 20 – – –
Benefits paid 124 16 140 140 11 151
Closing defined benefit obligation (2,912) (157) (3,069) (2,671) (177) (2,848)
The weighted average duration of the defined benefit obligation is 16 years for the UK and 8 years for the US.
Changes in the value of the US PRMB are as follows:
All figures in £ millions 2019 2018
Opening defined benefit obligation (49) (67)
Exchange differences 1 (2)
Current service cost – 1
Curtailments 1 11
Interest on plan liabilities (2) (2)
Actuarial gains/(losses) – experience 4 4
Actuarial gains/(losses) – demographic 1 –
Actuarial gains/(losses) – financial (2) 2
Benefits paid 3 4
Closing defined benefit obligation (43) (49)
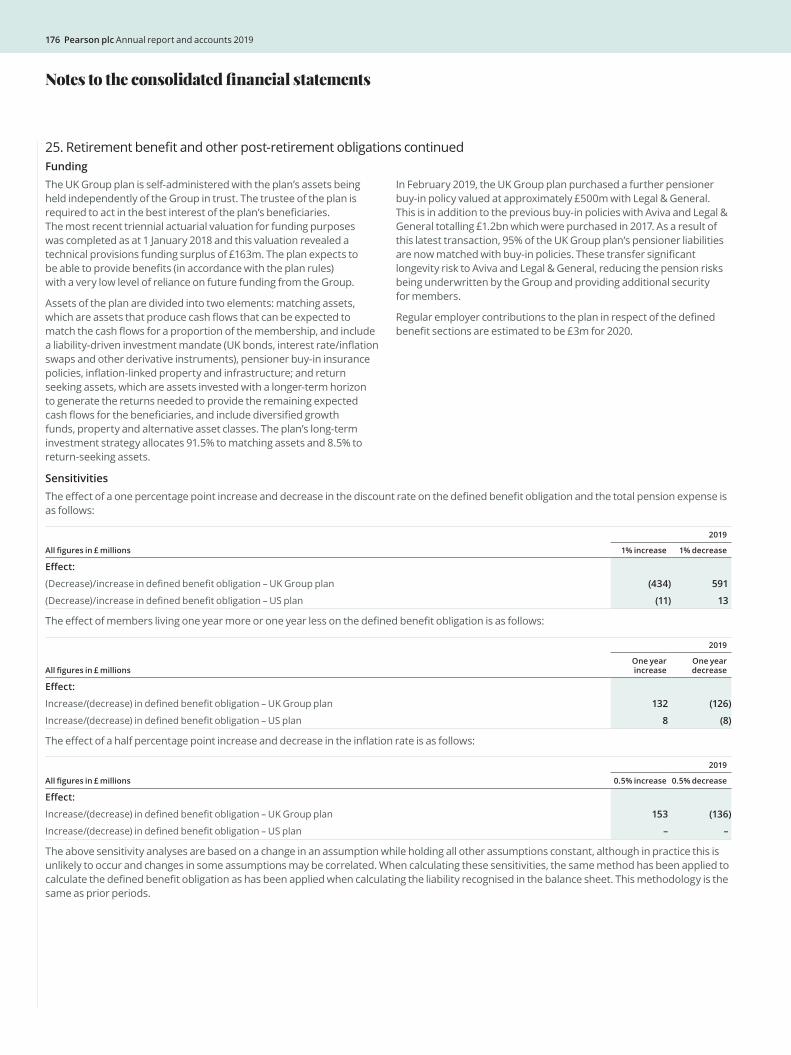
176 Pearson plc Annual report and accounts 2019
25. Retirement benefit and other post-retirement obligations continuedFundingThe UK Group plan is self-administered with the plan’s assets being held independently of the Group in trust. The trustee of the plan is required to act in the best interest of the plan’s beneficiaries. The most recent triennial actuarial valuation for funding purposes was completed as at 1 January 2018 and this valuation revealed a technical provisions funding surplus of £163m. The plan expects to be able to provide benefits (in accordance with the plan rules) with a very low level of reliance on future funding from the Group.
Assets of the plan are divided into two elements: matching assets, which are assets that produce cash flows that can be expected to match the cash flows for a proportion of the membership, and include a liability-driven investment mandate (UK bonds, interest rate/inflation swaps and other derivative instruments), pensioner buy-in insurance policies, inflation-linked property and infrastructure; and return seeking assets, which are assets invested with a longer-term horizon to generate the returns needed to provide the remaining expected cash flows for the beneficiaries, and include diversified growth funds, property and alternative asset classes. The plan’s long-term investment strategy allocates 91.5% to matching assets and 8.5% to return-seeking assets.
In February 2019, the UK Group plan purchased a further pensioner buy-in policy valued at approximately £500m with Legal & General. This is in addition to the previous buy-in policies with Aviva and Legal & General totalling £1.2bn which were purchased in 2017. As a result of this latest transaction, 95% of the UK Group plan’s pensioner liabilities are now matched with buy-in policies. These transfer significant longevity risk to Aviva and Legal & General, reducing the pension risks being underwritten by the Group and providing additional security for members.
Regular employer contributions to the plan in respect of the defined benefit sections are estimated to be £3m for 2020.
SensitivitiesThe effect of a one percentage point increase and decrease in the discount rate on the defined benefit obligation and the total pension expense is as follows:
All figures in £ millions
2019
1% increase 1% decrease
Effect:
(Decrease)/increase in defined benefit obligation – UK Group plan (434) 591
(Decrease)/increase in defined benefit obligation – US plan (11) 13
The effect of members living one year more or one year less on the defined benefit obligation is as follows:
All figures in £ millions
2019
One year increase
One year decrease
Effect:
Increase/(decrease) in defined benefit obligation – UK Group plan 132 (126)
Increase/(decrease) in defined benefit obligation – US plan 8 (8)
The effect of a half percentage point increase and decrease in the inflation rate is as follows:
All figures in £ millions
2019
0.5% increase 0.5% decrease
Effect:
Increase/(decrease) in defined benefit obligation – UK Group plan 153 (136)
Increase/(decrease) in defined benefit obligation – US plan – –
The above sensitivity analyses are based on a change in an assumption while holding all other assumptions constant, although in practice this is unlikely to occur and changes in some assumptions may be correlated. When calculating these sensitivities, the same method has been applied to calculate the defined benefit obligation as has been applied when calculating the liability recognised in the balance sheet. This methodology is the same as prior periods.
Notes to the consolidated financial statements
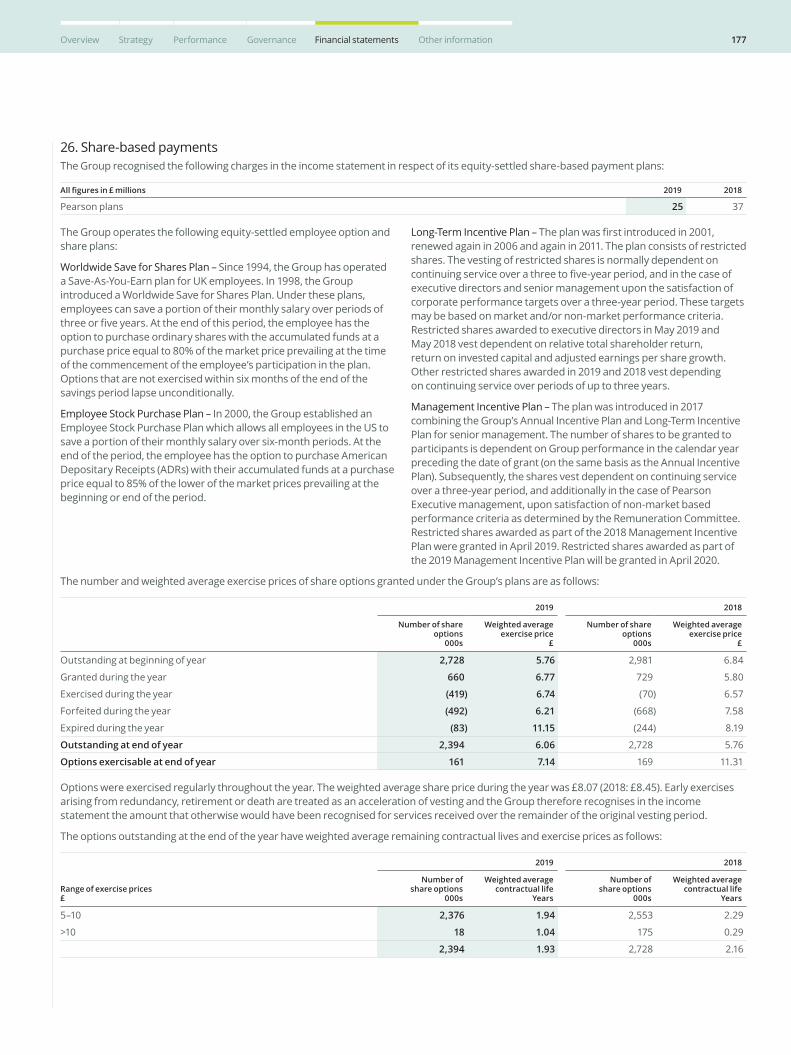
177Overview Strategy Performance Governance Financial statements Other information
26. Share-based paymentsThe Group recognised the following charges in the income statement in respect of its equity-settled share-based payment plans:
All figures in £ millions 2019 2018
Pearson plans 25 37
The Group operates the following equity-settled employee option and share plans:
Worldwide Save for Shares Plan – Since 1994, the Group has operated a Save-As-You-Earn plan for UK employees. In 1998, the Group introduced a Worldwide Save for Shares Plan. Under these plans, employees can save a portion of their monthly salary over periods of three or five years. At the end of this period, the employee has the option to purchase ordinary shares with the accumulated funds at a purchase price equal to 80% of the market price prevailing at the time of the commencement of the employee’s participation in the plan. Options that are not exercised within six months of the end of the savings period lapse unconditionally.
Employee Stock Purchase Plan – In 2000, the Group established an Employee Stock Purchase Plan which allows all employees in the US to save a portion of their monthly salary over six-month periods. At the end of the period, the employee has the option to purchase American Depositary Receipts (ADRs) with their accumulated funds at a purchase price equal to 85% of the lower of the market prices prevailing at the beginning or end of the period.
Long-Term Incentive Plan – The plan was first introduced in 2001, renewed again in 2006 and again in 2011. The plan consists of restricted shares. The vesting of restricted shares is normally dependent on continuing service over a three to five-year period, and in the case of executive directors and senior management upon the satisfaction of corporate performance targets over a three-year period. These targets may be based on market and/or non-market performance criteria. Restricted shares awarded to executive directors in May 2019 and May 2018 vest dependent on relative total shareholder return, return on invested capital and adjusted earnings per share growth. Other restricted shares awarded in 2019 and 2018 vest depending on continuing service over periods of up to three years.
Management Incentive Plan – The plan was introduced in 2017 combining the Group’s Annual Incentive Plan and Long-Term Incentive Plan for senior management. The number of shares to be granted to participants is dependent on Group performance in the calendar year preceding the date of grant (on the same basis as the Annual Incentive Plan). Subsequently, the shares vest dependent on continuing service over a three-year period, and additionally in the case of Pearson Executive management, upon satisfaction of non-market based performance criteria as determined by the Remuneration Committee. Restricted shares awarded as part of the 2018 Management Incentive Plan were granted in April 2019. Restricted shares awarded as part of the 2019 Management Incentive Plan will be granted in April 2020.
The number and weighted average exercise prices of share options granted under the Group’s plans are as follows:
2019 2018
Number of share options
000s
Weighted average exercise price
£
Number of share options
000s
Weighted average exercise price
£
Outstanding at beginning of year 2,728 5.76 2,981 6.84
Granted during the year 660 6.77 729 5.80
Exercised during the year (419) 6.74 (70) 6.57
Forfeited during the year (492) 6.21 (668) 7.58
Expired during the year (83) 11.15 (244) 8.19
Outstanding at end of year 2,394 6.06 2,728 5.76
Options exercisable at end of year 161 7.14 169 11.31
Options were exercised regularly throughout the year. The weighted average share price during the year was £8.07 (2018: £8.45). Early exercises arising from redundancy, retirement or death are treated as an acceleration of vesting and the Group therefore recognises in the income statement the amount that otherwise would have been recognised for services received over the remainder of the original vesting period.
The options outstanding at the end of the year have weighted average remaining contractual lives and exercise prices as follows:
Range of exercise prices£
2019 2018
Number of share options
000s
Weighted average contractual life
Years
Number of share options
000s
Weighted average contractual life
Years
5–10 2,376 1.94 2,553 2.29
>10 18 1.04 175 0.29
2,394 1.93 2,728 2.16
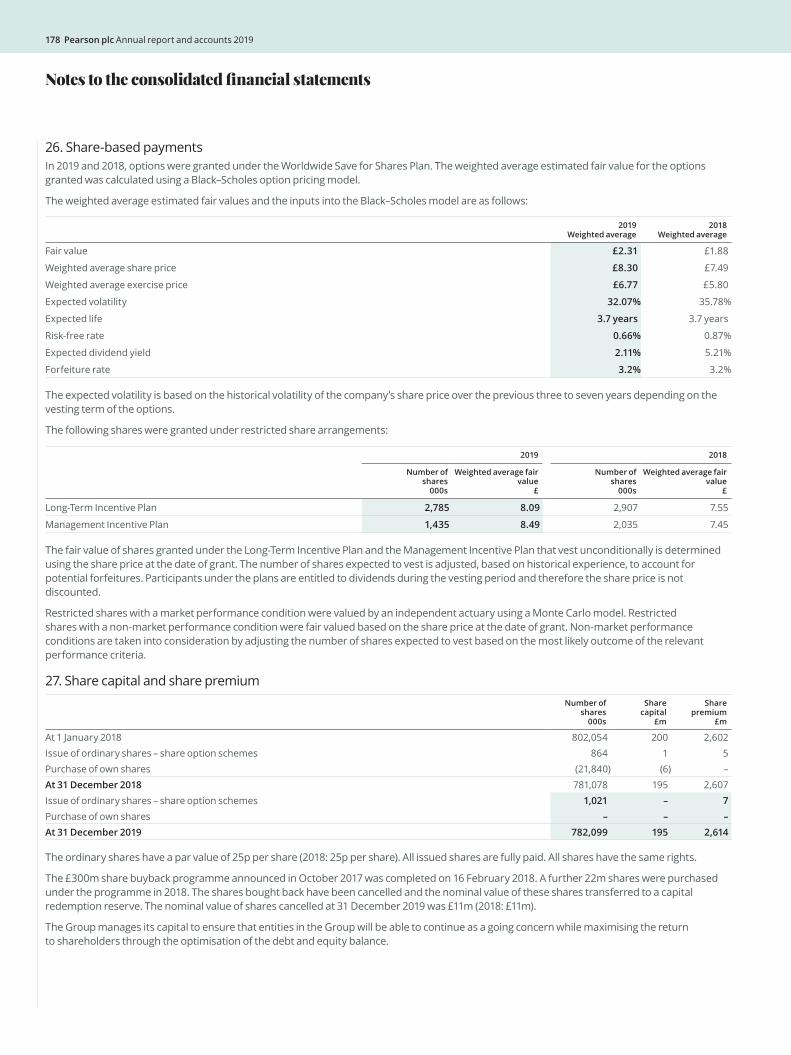
178 Pearson plc Annual report and accounts 2019
26. Share-based paymentsIn 2019 and 2018, options were granted under the Worldwide Save for Shares Plan. The weighted average estimated fair value for the options granted was calculated using a Black–Scholes option pricing model.
The weighted average estimated fair values and the inputs into the Black–Scholes model are as follows:
2019 Weighted average
2018 Weighted average
Fair value £2.31 £1.88
Weighted average share price £8.30 £7.49
Weighted average exercise price £6.77 £5.80
Expected volatility 32.07% 35.78%
Expected life 3.7 years 3.7 years
Risk-free rate 0.66% 0.87%
Expected dividend yield 2.11% 5.21%
Forfeiture rate 3.2% 3.2%
The expected volatility is based on the historical volatility of the company’s share price over the previous three to seven years depending on the vesting term of the options.
The following shares were granted under restricted share arrangements:
2019 2018
Number of shares
000s
Weighted average fair value
£
Number of shares
000s
Weighted average fair value
£
Long-Term Incentive Plan 2,785 8.09 2,907 7.55
Management Incentive Plan 1,435 8.49 2,035 7.45
The fair value of shares granted under the Long-Term Incentive Plan and the Management Incentive Plan that vest unconditionally is determined using the share price at the date of grant. The number of shares expected to vest is adjusted, based on historical experience, to account for potential forfeitures. Participants under the plans are entitled to dividends during the vesting period and therefore the share price is not discounted.
Restricted shares with a market performance condition were valued by an independent actuary using a Monte Carlo model. Restricted shares with a non-market performance condition were fair valued based on the share price at the date of grant. Non-market performance conditions are taken into consideration by adjusting the number of shares expected to vest based on the most likely outcome of the relevant performance criteria.
27. Share capital and share premiumNumber of
shares 000s
Share capital
£m
Share premium
£m
At 1 January 2018 802,054 200 2,602Issue of ordinary shares – share option schemes 864 1 5Purchase of own shares (21,840) (6) –At 31 December 2018 781,078 195 2,607Issue of ordinary shares – share option schemes 1,021 – 7Purchase of own shares – – –At 31 December 2019 782,099 195 2,614
The ordinary shares have a par value of 25p per share (2018: 25p per share). All issued shares are fully paid. All shares have the same rights.
The £300m share buyback programme announced in October 2017 was completed on 16 February 2018. A further 22m shares were purchased under the programme in 2018. The shares bought back have been cancelled and the nominal value of these shares transferred to a capital redemption reserve. The nominal value of shares cancelled at 31 December 2019 was £11m (2018: £11m).
The Group manages its capital to ensure that entities in the Group will be able to continue as a going concern while maximising the return to shareholders through the optimisation of the debt and equity balance.
Notes to the consolidated financial statements
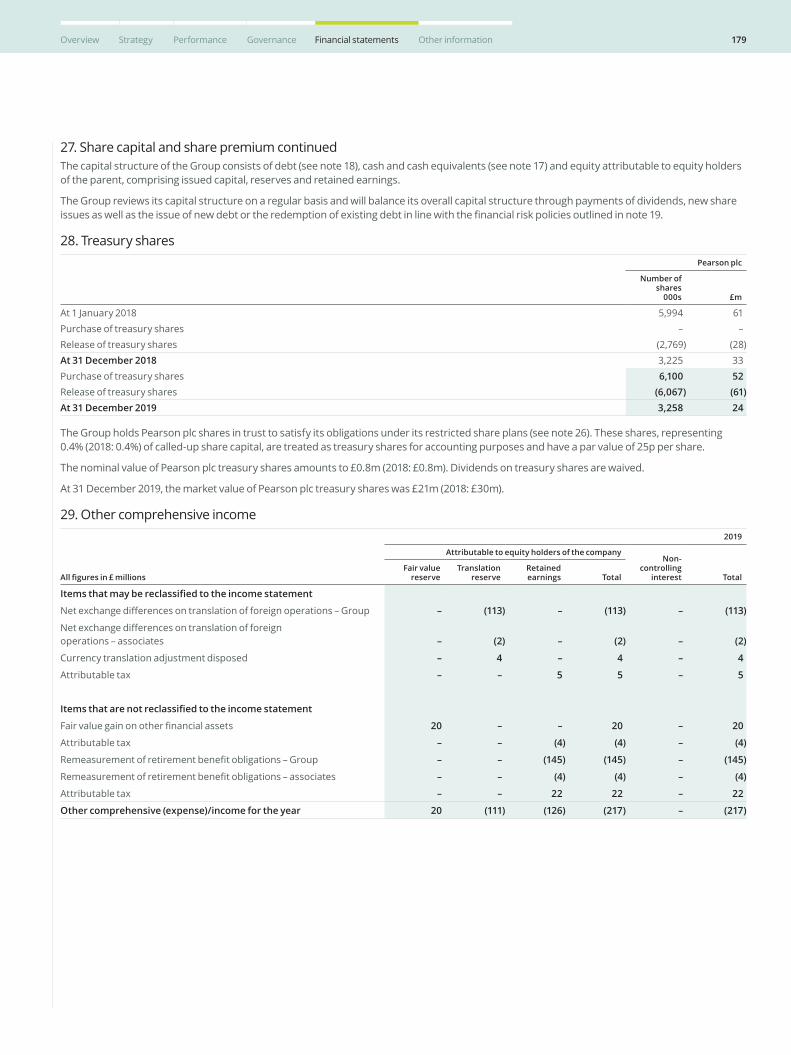
179Overview Strategy Performance Governance Financial statements Other information
27. Share capital and share premium continuedThe capital structure of the Group consists of debt (see note 18), cash and cash equivalents (see note 17) and equity attributable to equity holders of the parent, comprising issued capital, reserves and retained earnings.
The Group reviews its capital structure on a regular basis and will balance its overall capital structure through payments of dividends, new share issues as well as the issue of new debt or the redemption of existing debt in line with the financial risk policies outlined in note 19.
28. Treasury sharesPearson plc
Number of shares
000s £m
At 1 January 2018 5,994 61Purchase of treasury shares – –Release of treasury shares (2,769) (28)At 31 December 2018 3,225 33Purchase of treasury shares 6,100 52Release of treasury shares (6,067) (61)At 31 December 2019 3,258 24
The Group holds Pearson plc shares in trust to satisfy its obligations under its restricted share plans (see note 26). These shares, representing 0.4% (2018: 0.4%) of called-up share capital, are treated as treasury shares for accounting purposes and have a par value of 25p per share.
The nominal value of Pearson plc treasury shares amounts to £0.8m (2018: £0.8m). Dividends on treasury shares are waived.
At 31 December 2019, the market value of Pearson plc treasury shares was £21m (2018: £30m).
29. Other comprehensive income
All figures in £ millions
2019
Attributable to equity holders of the companyNon-
controlling interest Total
Fair value reserve
Translation reserve
Retained earnings Total
Items that may be reclassified to the income statement
Net exchange differences on translation of foreign operations – Group – (113) – (113) – (113)
Net exchange differences on translation of foreign operations – associates – (2) – (2) – (2)
Currency translation adjustment disposed – 4 – 4 – 4
Attributable tax – – 5 5 – 5
Items that are not reclassified to the income statement
Fair value gain on other financial assets 20 – – 20 – 20
Attributable tax – – (4) (4) – (4)
Remeasurement of retirement benefit obligations – Group – – (145) (145) – (145)
Remeasurement of retirement benefit obligations – associates – – (4) (4) – (4)
Attributable tax – – 22 22 – 22
Other comprehensive (expense)/income for the year 20 (111) (126) (217) – (217)
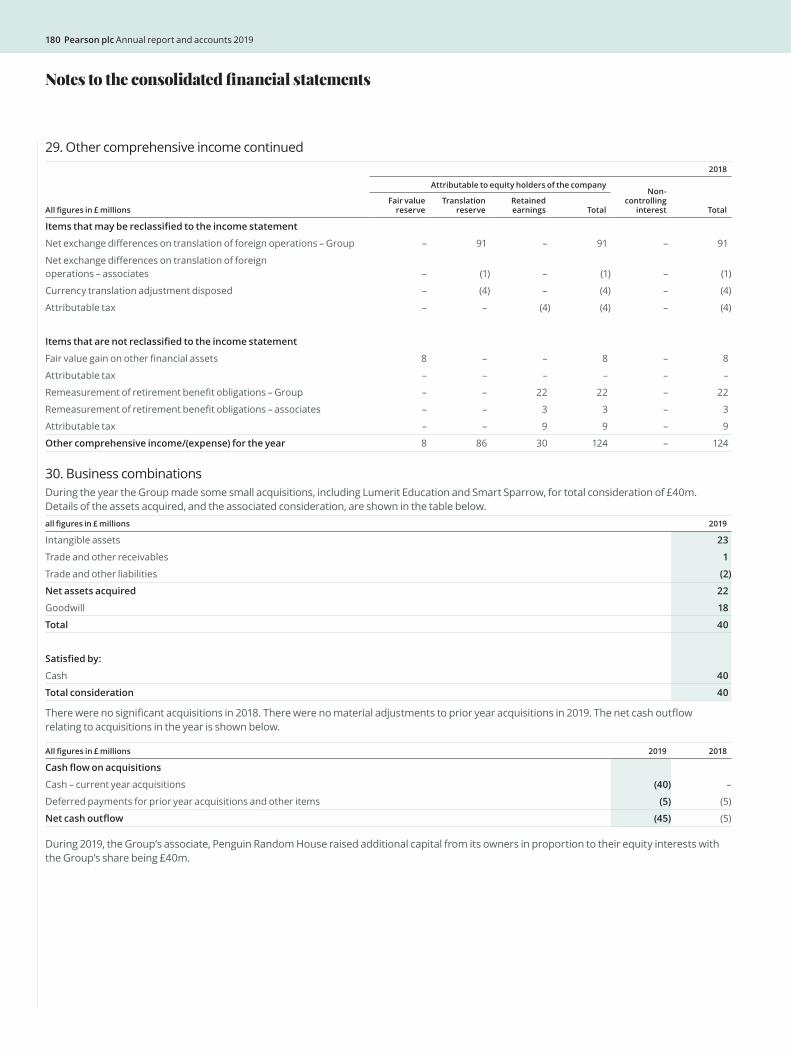
180 Pearson plc Annual report and accounts 2019
29. Other comprehensive income continued
All figures in £ millions
2018
Attributable to equity holders of the companyNon-
controlling interest Total
Fair value reserve
Translation reserve
Retained earnings Total
Items that may be reclassified to the income statement
Net exchange differences on translation of foreign operations – Group – 91 – 91 – 91
Net exchange differences on translation of foreign operations – associates – (1) – (1) – (1)
Currency translation adjustment disposed – (4) – (4) – (4)
Attributable tax – – (4) (4) – (4)
Items that are not reclassified to the income statement
Fair value gain on other financial assets 8 – – 8 – 8
Attributable tax – – – – – –
Remeasurement of retirement benefit obligations – Group – – 22 22 – 22
Remeasurement of retirement benefit obligations – associates – – 3 3 – 3
Attributable tax – – 9 9 – 9
Other comprehensive income/(expense) for the year 8 86 30 124 – 124
30. Business combinationsDuring the year the Group made some small acquisitions, including Lumerit Education and Smart Sparrow, for total consideration of £40m. Details of the assets acquired, and the associated consideration, are shown in the table below. all figures in £ millions 2019
Intangible assets 23
Trade and other receivables 1
Trade and other liabilities (2)
Net assets acquired 22
Goodwill 18
Total 40
Satisfied by:
Cash 40
Total consideration 40
There were no significant acquisitions in 2018. There were no material adjustments to prior year acquisitions in 2019. The net cash outflow relating to acquisitions in the year is shown below.
All figures in £ millions 2019 2018
Cash flow on acquisitions
Cash – current year acquisitions (40) –
Deferred payments for prior year acquisitions and other items (5) (5)
Net cash outflow (45) (5)
During 2019, the Group’s associate, Penguin Random House raised additional capital from its owners in proportion to their equity interests with the Group’s share being £40m.
Notes to the consolidated financial statements
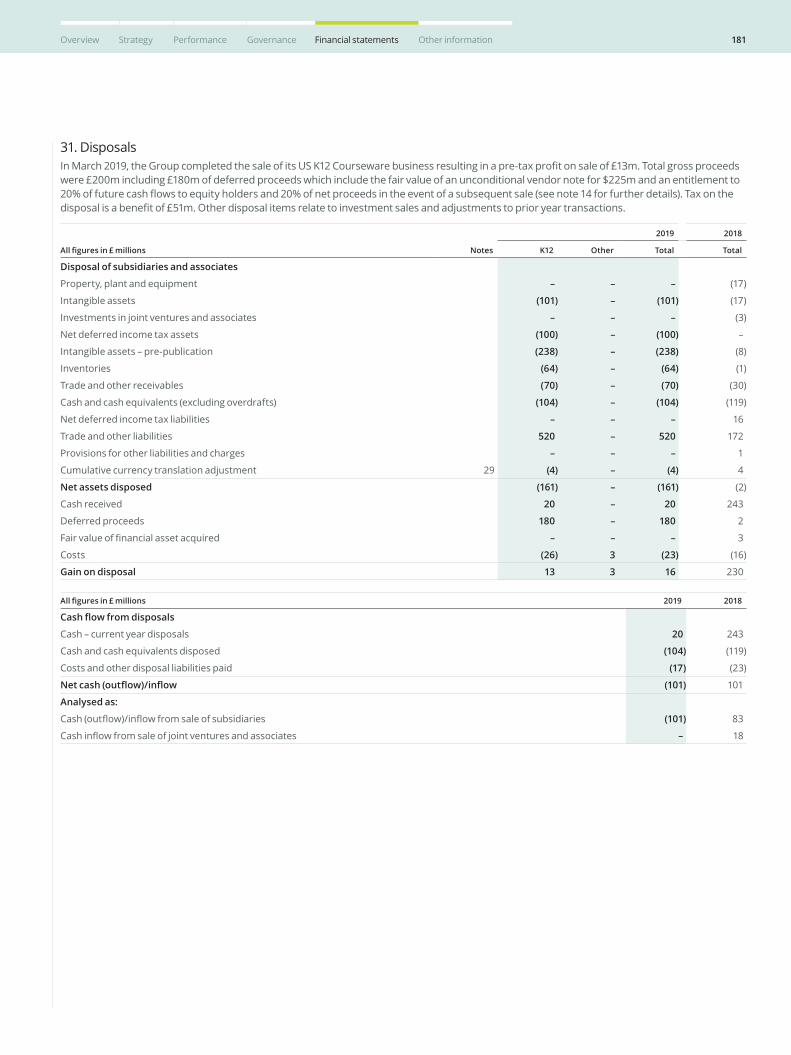
181Overview Strategy Performance Governance Financial statements Other information
31. DisposalsIn March 2019, the Group completed the sale of its US K12 Courseware business resulting in a pre-tax profit on sale of £13m. Total gross proceeds were £200m including £180m of deferred proceeds which include the fair value of an unconditional vendor note for $225m and an entitlement to 20% of future cash flows to equity holders and 20% of net proceeds in the event of a subsequent sale (see note 14 for further details). Tax on the disposal is a benefit of £51m. Other disposal items relate to investment sales and adjustments to prior year transactions.
All figures in £ millions Notes
2019 2018
K12 Other Total Total
Disposal of subsidiaries and associates
Property, plant and equipment – – – (17)
Intangible assets (101) – (101) (17)
Investments in joint ventures and associates – – – (3)
Net deferred income tax assets (100) – (100) –
Intangible assets – pre-publication (238) – (238) (8)
Inventories (64) – (64) (1)
Trade and other receivables (70) – (70) (30)
Cash and cash equivalents (excluding overdrafts) (104) – (104) (119)
Net deferred income tax liabilities – – – 16
Trade and other liabilities 520 – 520 172
Provisions for other liabilities and charges – – – 1
Cumulative currency translation adjustment 29 (4) – (4) 4
Net assets disposed (161) – (161) (2)
Cash received 20 – 20 243
Deferred proceeds 180 – 180 2
Fair value of financial asset acquired – – – 3
Costs (26) 3 (23) (16)
Gain on disposal 13 3 16 230
All figures in £ millions 2019 2018
Cash flow from disposals
Cash – current year disposals 20 243
Cash and cash equivalents disposed (104) (119)
Costs and other disposal liabilities paid (17) (23)
Net cash (outflow)/inflow (101) 101
Analysed as:
Cash (outflow)/inflow from sale of subsidiaries (101) 83
Cash inflow from sale of joint ventures and associates – 18
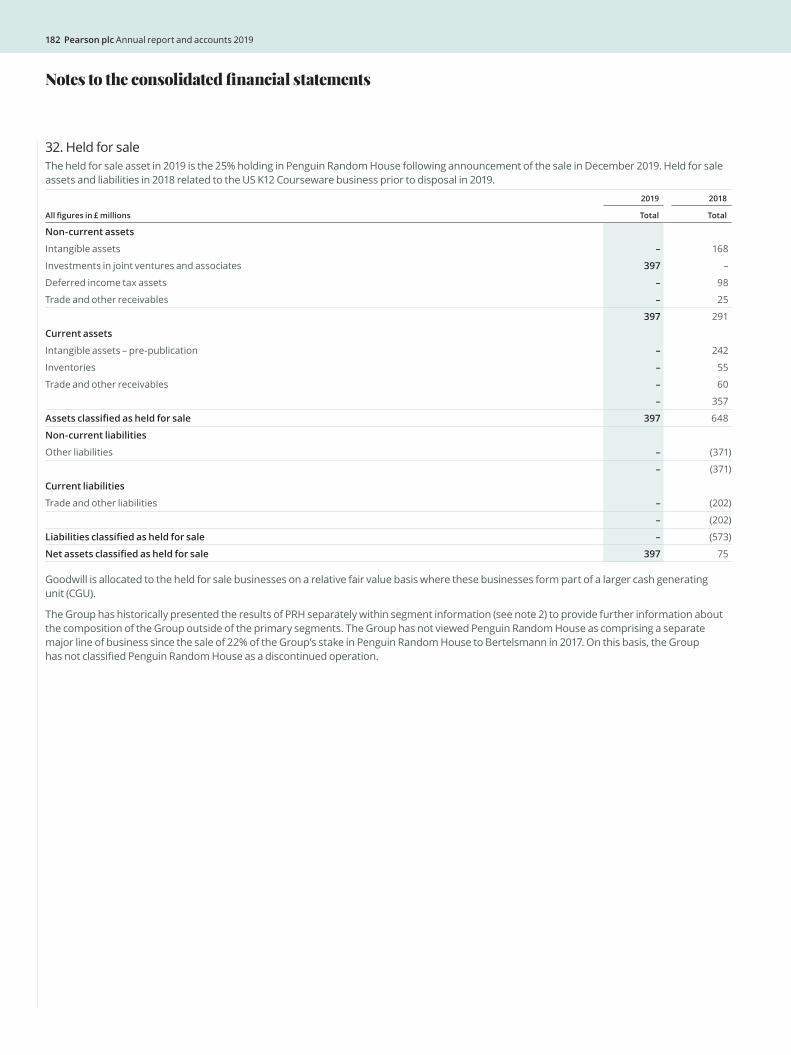
182 Pearson plc Annual report and accounts 2019
32. Held for saleThe held for sale asset in 2019 is the 25% holding in Penguin Random House following announcement of the sale in December 2019. Held for sale assets and liabilities in 2018 related to the US K12 Courseware business prior to disposal in 2019.
All figures in £ millions
2019 2018
Total Total
Non-current assets
Intangible assets – 168
Investments in joint ventures and associates 397 –
Deferred income tax assets – 98
Trade and other receivables – 25
397 291
Current assets
Intangible assets – pre-publication – 242
Inventories – 55
Trade and other receivables – 60
– 357
Assets classified as held for sale 397 648
Non-current liabilities
Other liabilities – (371)
– (371)
Current liabilities
Trade and other liabilities – (202)
– (202)
Liabilities classified as held for sale – (573)
Net assets classified as held for sale 397 75
Goodwill is allocated to the held for sale businesses on a relative fair value basis where these businesses form part of a larger cash generating unit (CGU).
The Group has historically presented the results of PRH separately within segment information (see note 2) to provide further information about the composition of the Group outside of the primary segments. The Group has not viewed Penguin Random House as comprising a separate major line of business since the sale of 22% of the Group’s stake in Penguin Random House to Bertelsmann in 2017. On this basis, the Group has not classified Penguin Random House as a discontinued operation.
Notes to the consolidated financial statements
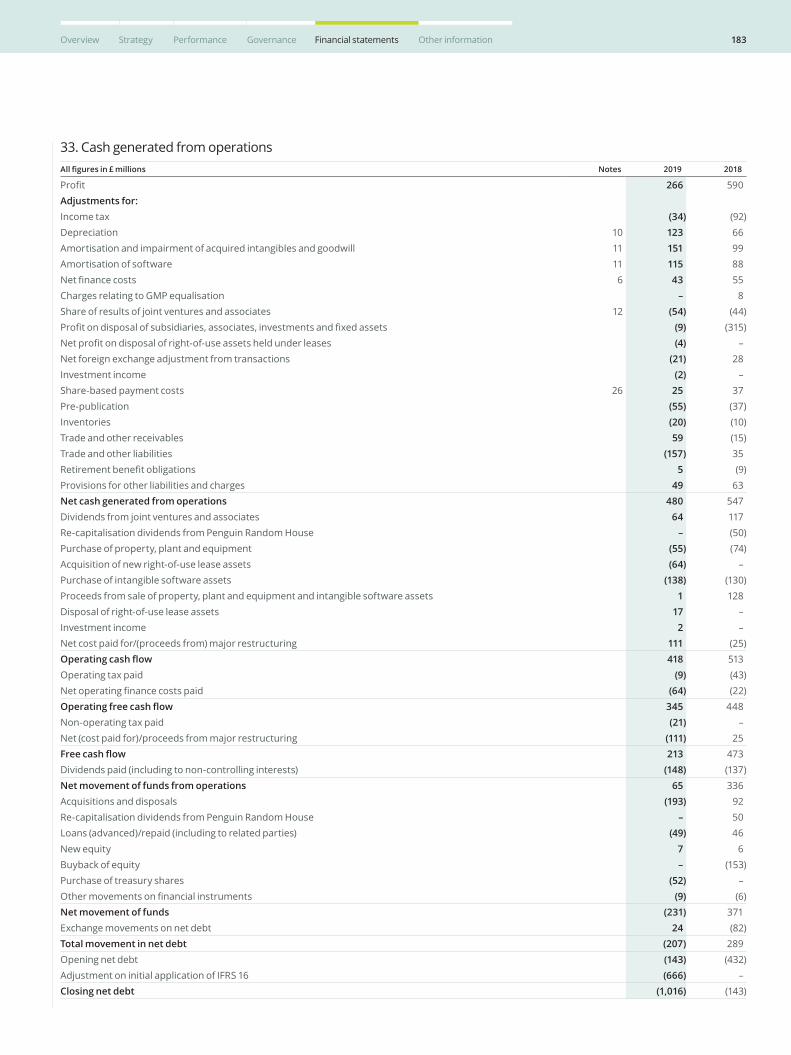
183Overview Strategy Performance Governance Financial statements Other information
33. Cash generated from operationsAll figures in £ millions Notes 2019 2018
Profit 266 590Adjustments for:Income tax (34) (92)Depreciation 10 123 66Amortisation and impairment of acquired intangibles and goodwill 11 151 99Amortisation of software 11 115 88Net finance costs 6 43 55Charges relating to GMP equalisation – 8Share of results of joint ventures and associates 12 (54) (44)Profit on disposal of subsidiaries, associates, investments and fixed assets (9) (315)Net profit on disposal of right-of-use assets held under leases (4) –Net foreign exchange adjustment from transactions (21) 28Investment income (2) –Share-based payment costs 26 25 37Pre-publication (55) (37)Inventories (20) (10)Trade and other receivables 59 (15)Trade and other liabilities (157) 35Retirement benefit obligations 5 (9)Provisions for other liabilities and charges 49 63Net cash generated from operations 480 547Dividends from joint ventures and associates 64 117Re-capitalisation dividends from Penguin Random House – (50)Purchase of property, plant and equipment (55) (74)Acquisition of new right-of-use lease assets (64) –Purchase of intangible software assets (138) (130)Proceeds from sale of property, plant and equipment and intangible software assets 1 128Disposal of right-of-use lease assets 17 –Investment income 2 –Net cost paid for/(proceeds from) major restructuring 111 (25)Operating cash flow 418 513Operating tax paid (9) (43)Net operating finance costs paid (64) (22)Operating free cash flow 345 448Non-operating tax paid (21) –Net (cost paid for)/proceeds from major restructuring (111) 25Free cash flow 213 473Dividends paid (including to non-controlling interests) (148) (137)Net movement of funds from operations 65 336Acquisitions and disposals (193) 92Re-capitalisation dividends from Penguin Random House – 50Loans (advanced)/repaid (including to related parties) (49) 46
New equity 7 6Buyback of equity – (153)Purchase of treasury shares (52) –Other movements on financial instruments (9) (6)Net movement of funds (231) 371Exchange movements on net debt 24 (82)Total movement in net debt (207) 289Opening net debt (143) (432)Adjustment on initial application of IFRS 16 (666) –Closing net debt (1,016) (143)
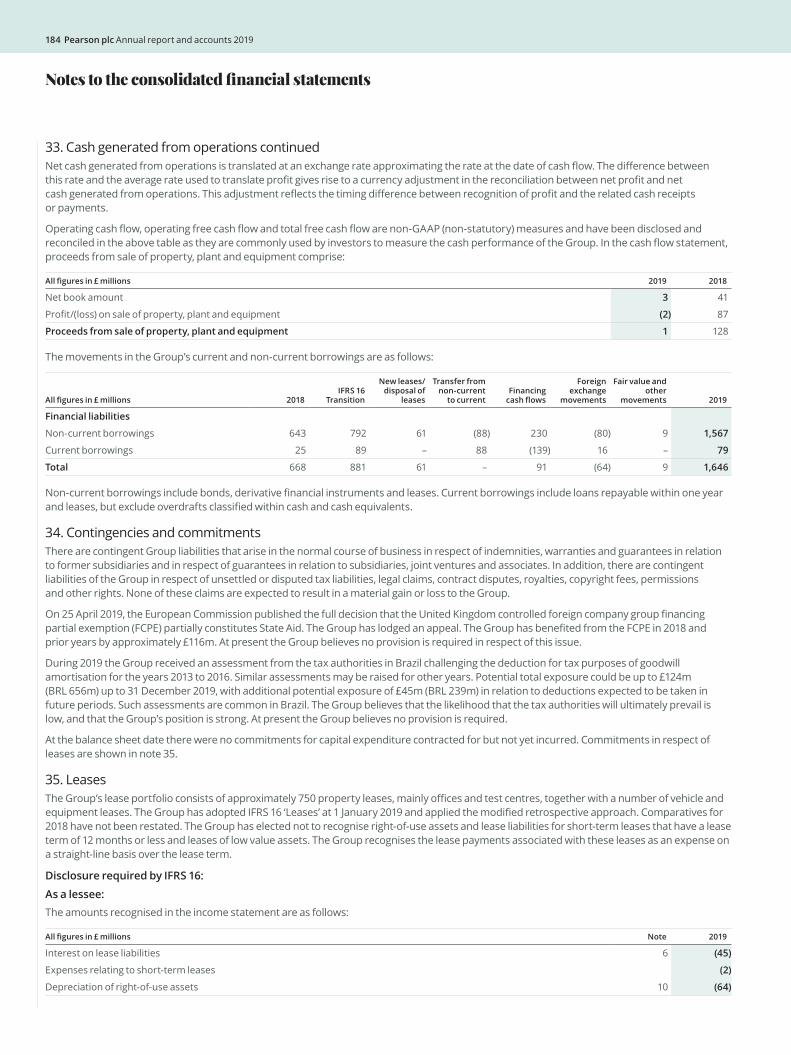
184 Pearson plc Annual report and accounts 2019
33. Cash generated from operations continuedNet cash generated from operations is translated at an exchange rate approximating the rate at the date of cash flow. The difference between this rate and the average rate used to translate profit gives rise to a currency adjustment in the reconciliation between net profit and net cash generated from operations. This adjustment reflects the timing difference between recognition of profit and the related cash receipts or payments.
Operating cash flow, operating free cash flow and total free cash flow are non-GAAP (non-statutory) measures and have been disclosed and reconciled in the above table as they are commonly used by investors to measure the cash performance of the Group. In the cash flow statement, proceeds from sale of property, plant and equipment comprise:
All figures in £ millions 2019 2018
Net book amount 3 41
Profit/(loss) on sale of property, plant and equipment (2) 87
Proceeds from sale of property, plant and equipment 1 128
The movements in the Group’s current and non-current borrowings are as follows:
All figures in £ millions 2018IFRS 16
Transition
New leases/disposal of
leases
Transfer from non-current
to currentFinancing
cash flows
Foreign exchange
movements
Fair value and other
movements 2019
Financial liabilities
Non-current borrowings 643 792 61 (88) 230 (80) 9 1,567
Current borrowings 25 89 – 88 (139) 16 – 79
Total 668 881 61 – 91 (64) 9 1,646
Non-current borrowings include bonds, derivative financial instruments and leases. Current borrowings include loans repayable within one year and leases, but exclude overdrafts classified within cash and cash equivalents.
34. Contingencies and commitmentsThere are contingent Group liabilities that arise in the normal course of business in respect of indemnities, warranties and guarantees in relation to former subsidiaries and in respect of guarantees in relation to subsidiaries, joint ventures and associates. In addition, there are contingent liabilities of the Group in respect of unsettled or disputed tax liabilities, legal claims, contract disputes, royalties, copyright fees, permissions and other rights. None of these claims are expected to result in a material gain or loss to the Group.
On 25 April 2019, the European Commission published the full decision that the United Kingdom controlled foreign company group financing partial exemption (FCPE) partially constitutes State Aid. The Group has lodged an appeal. The Group has benefited from the FCPE in 2018 and prior years by approximately £116m. At present the Group believes no provision is required in respect of this issue.
During 2019 the Group received an assessment from the tax authorities in Brazil challenging the deduction for tax purposes of goodwill amortisation for the years 2013 to 2016. Similar assessments may be raised for other years. Potential total exposure could be up to £124m (BRL 656m) up to 31 December 2019, with additional potential exposure of £45m (BRL 239m) in relation to deductions expected to be taken in future periods. Such assessments are common in Brazil. The Group believes that the likelihood that the tax authorities will ultimately prevail is low, and that the Group’s position is strong. At present the Group believes no provision is required.
At the balance sheet date there were no commitments for capital expenditure contracted for but not yet incurred. Commitments in respect of leases are shown in note 35.
35. LeasesThe Group’s lease portfolio consists of approximately 750 property leases, mainly offices and test centres, together with a number of vehicle and equipment leases. The Group has adopted IFRS 16 ‘Leases’ at 1 January 2019 and applied the modified retrospective approach. Comparatives for 2018 have not been restated. The Group has elected not to recognise right-of-use assets and lease liabilities for short-term leases that have a lease term of 12 months or less and leases of low value assets. The Group recognises the lease payments associated with these leases as an expense on a straight-line basis over the lease term.
Disclosure required by IFRS 16:
As a lessee:The amounts recognised in the income statement are as follows:
All figures in £ millions Note 2019
Interest on lease liabilities 6 (45)
Expenses relating to short-term leases (2)
Depreciation of right-of-use assets 10 (64)
Notes to the consolidated financial statements
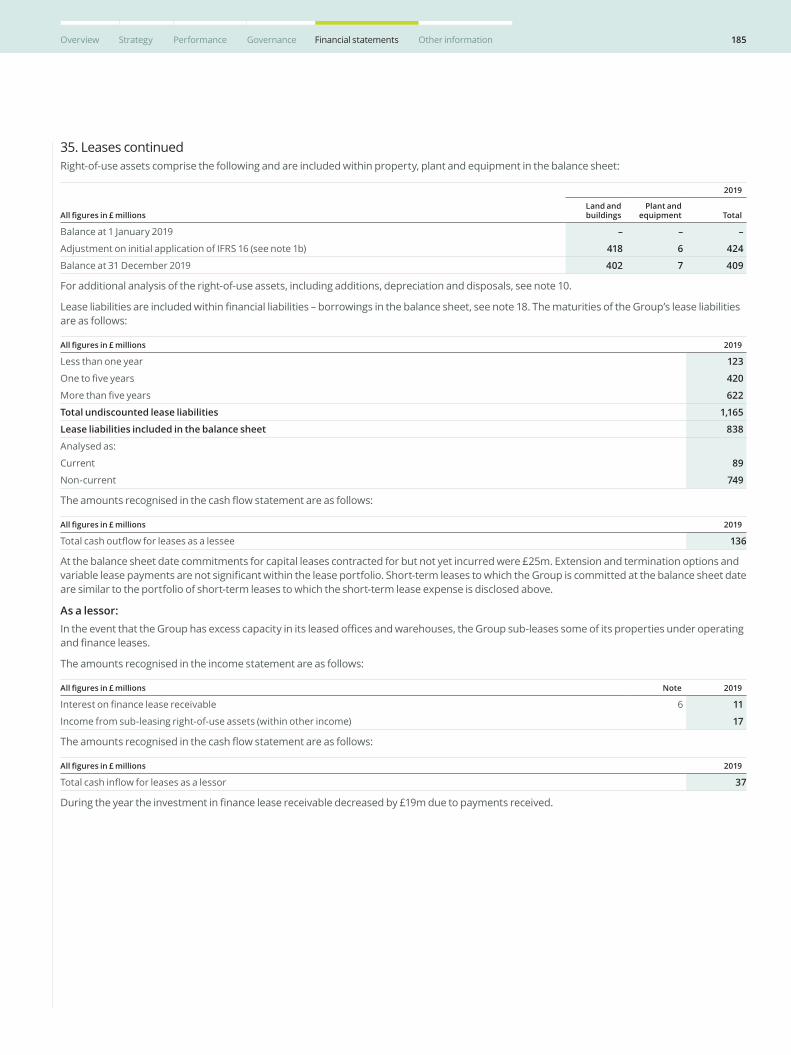
185Overview Strategy Performance Governance Financial statements Other information
35. Leases continuedRight-of-use assets comprise the following and are included within property, plant and equipment in the balance sheet:
All figures in £ millions
2019
Land and buildings
Plant and equipment Total
Balance at 1 January 2019 – – –
Adjustment on initial application of IFRS 16 (see note 1b) 418 6 424
Balance at 31 December 2019 402 7 409
For additional analysis of the right-of-use assets, including additions, depreciation and disposals, see note 10.
Lease liabilities are included within financial liabilities – borrowings in the balance sheet, see note 18. The maturities of the Group’s lease liabilities are as follows:
All figures in £ millions 2019
Less than one year 123
One to five years 420
More than five years 622
Total undiscounted lease liabilities 1,165
Lease liabilities included in the balance sheet 838
Analysed as:
Current 89
Non-current 749
The amounts recognised in the cash flow statement are as follows:
All figures in £ millions 2019
Total cash outflow for leases as a lessee 136
At the balance sheet date commitments for capital leases contracted for but not yet incurred were £25m. Extension and termination options and variable lease payments are not significant within the lease portfolio. Short-term leases to which the Group is committed at the balance sheet date are similar to the portfolio of short-term leases to which the short-term lease expense is disclosed above.
As a lessor:In the event that the Group has excess capacity in its leased offices and warehouses, the Group sub-leases some of its properties under operating and finance leases.
The amounts recognised in the income statement are as follows:
All figures in £ millions Note 2019
Interest on finance lease receivable 6 11
Income from sub-leasing right-of-use assets (within other income) 17
The amounts recognised in the cash flow statement are as follows:
All figures in £ millions 2019
Total cash inflow for leases as a lessor 37
During the year the investment in finance lease receivable decreased by £19m due to payments received.

186 Pearson plc Annual report and accounts 2019
35. Leases continuedThe following table sets out the maturity analysis of lease payments receivable for sub-leases classified as operating leases, showing the undiscounted lease payments to be received after the reporting date, and sub-leases classified as finance leases showing the undiscounted lease payments to be received after the reporting date and the net investment in the finance lease receivable.
All figures in £ millionsOperating
leasesFinance
leases 2019 Total
Less than one year 12 34 46
One to two years 4 40 44
Two to three years 4 33 37
Three to four years 3 30 33
Four to five years 3 31 34
More than five years 20 67 87
Total undiscounted lease payments receivable 46 235 281
Unearned finance income (39)
Net investment in finance lease receivable 196
IAS 17 disclosure for 2018:The maturity of the Group’s finance lease obligations is as follows:
All figures in £ millions 2018
Finance lease liabilities – minimum lease payments
Not later than one year 3
Later than one year and not later than two years 1
Later than two years and not later than three years 1
Later than three years and not later than four years –
Later than four years and not later than five years –
Later than five years –
Future finance charges on finance leases –
Present value of finance lease liabilities 5
The present value of the Group’s finance lease obligations is as follows:
All figures in £ millions 2018
Not later than one year 3
Later than one year and not later than five years 2
Later than five years –
5
The carrying amounts of the Group’s lease obligations approximate their fair value.
In 2018 the Group leased various offices and warehouses under non-cancellable operating lease agreements. The leases had varying terms and renewal rights. The Group also leased various plant and equipment under operating lease agreements, also with varying terms. Lease expenditure charged to the income statement in 2018 was £128m. The future aggregate minimum lease payments in respect of operating leases were as follows:
All figures in £ millions 2018
Not later than one year 143
Later than one year and not later than two years 130
Later than two years and not later than three years 115
Later than three years and not later than four years 101
Later than four years and not later than five years 91
Later than five years 595
1,175
Notes to the consolidated financial statements
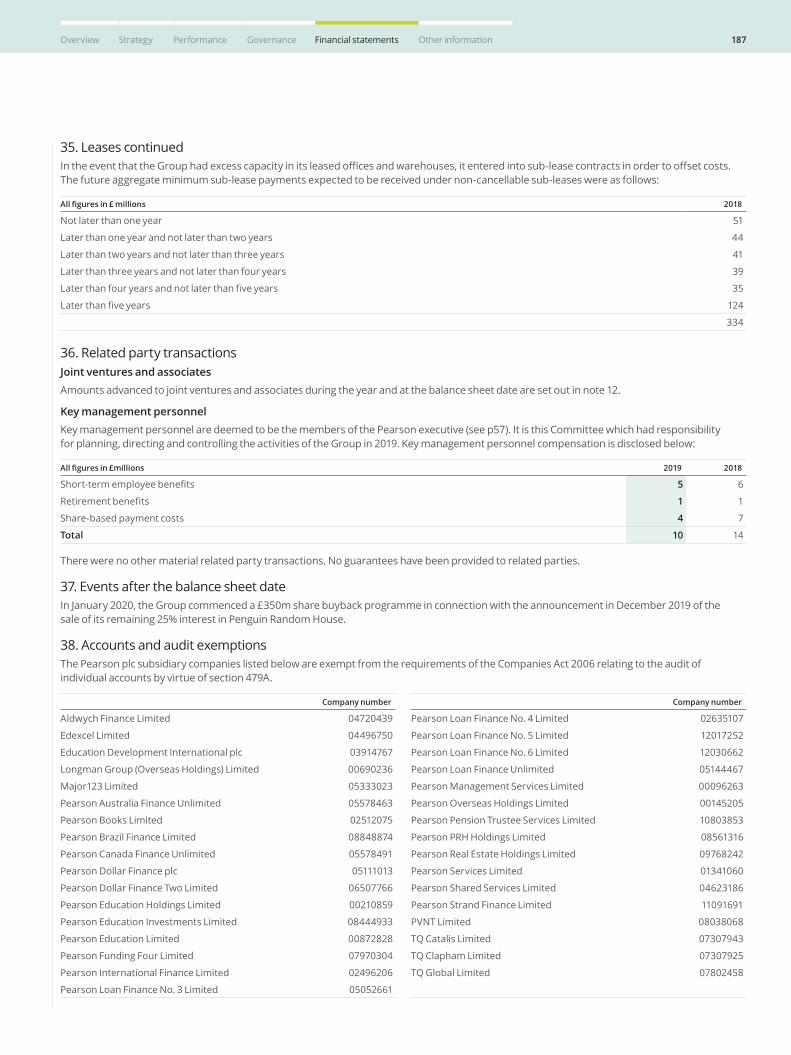
187Overview Strategy Performance Governance Financial statements Other information
35. Leases continuedIn the event that the Group had excess capacity in its leased offices and warehouses, it entered into sub-lease contracts in order to offset costs. The future aggregate minimum sub-lease payments expected to be received under non-cancellable sub-leases were as follows:
All figures in £ millions 2018
Not later than one year 51
Later than one year and not later than two years 44
Later than two years and not later than three years 41
Later than three years and not later than four years 39
Later than four years and not later than five years 35
Later than five years 124
334
36. Related party transactions Joint ventures and associatesAmounts advanced to joint ventures and associates during the year and at the balance sheet date are set out in note 12.
Key management personnelKey management personnel are deemed to be the members of the Pearson executive (see p57). It is this Committee which had responsibility for planning, directing and controlling the activities of the Group in 2019. Key management personnel compensation is disclosed below:
All figures in £millions 2019 2018
Short-term employee benefits 5 6
Retirement benefits 1 1
Share-based payment costs 4 7
Total 10 14
There were no other material related party transactions. No guarantees have been provided to related parties.
37. Events after the balance sheet dateIn January 2020, the Group commenced a £350m share buyback programme in connection with the announcement in December 2019 of the sale of its remaining 25% interest in Penguin Random House.
38. Accounts and audit exemptionsThe Pearson plc subsidiary companies listed below are exempt from the requirements of the Companies Act 2006 relating to the audit of individual accounts by virtue of section 479A.
Company number
Aldwych Finance Limited 04720439
Edexcel Limited 04496750
Education Development International plc 03914767
Longman Group (Overseas Holdings) Limited 00690236
Major123 Limited 05333023
Pearson Australia Finance Unlimited 05578463
Pearson Books Limited 02512075
Pearson Brazil Finance Limited 08848874
Pearson Canada Finance Unlimited 05578491
Pearson Dollar Finance plc 05111013
Pearson Dollar Finance Two Limited 06507766
Pearson Education Holdings Limited 00210859
Pearson Education Investments Limited 08444933
Pearson Education Limited 00872828
Pearson Funding Four Limited 07970304
Pearson International Finance Limited 02496206
Pearson Loan Finance No. 3 Limited 05052661
Company number
Pearson Loan Finance No. 4 Limited 02635107
Pearson Loan Finance No. 5 Limited 12017252
Pearson Loan Finance No. 6 Limited 12030662
Pearson Loan Finance Unlimited 05144467
Pearson Management Services Limited 00096263
Pearson Overseas Holdings Limited 00145205
Pearson Pension Trustee Services Limited 10803853
Pearson PRH Holdings Limited 08561316
Pearson Real Estate Holdings Limited 09768242
Pearson Services Limited 01341060
Pearson Shared Services Limited 04623186
Pearson Strand Finance Limited 11091691
PVNT Limited 08038068
TQ Catalis Limited 07307943
TQ Clapham Limited 07307925
TQ Global Limited 07802458
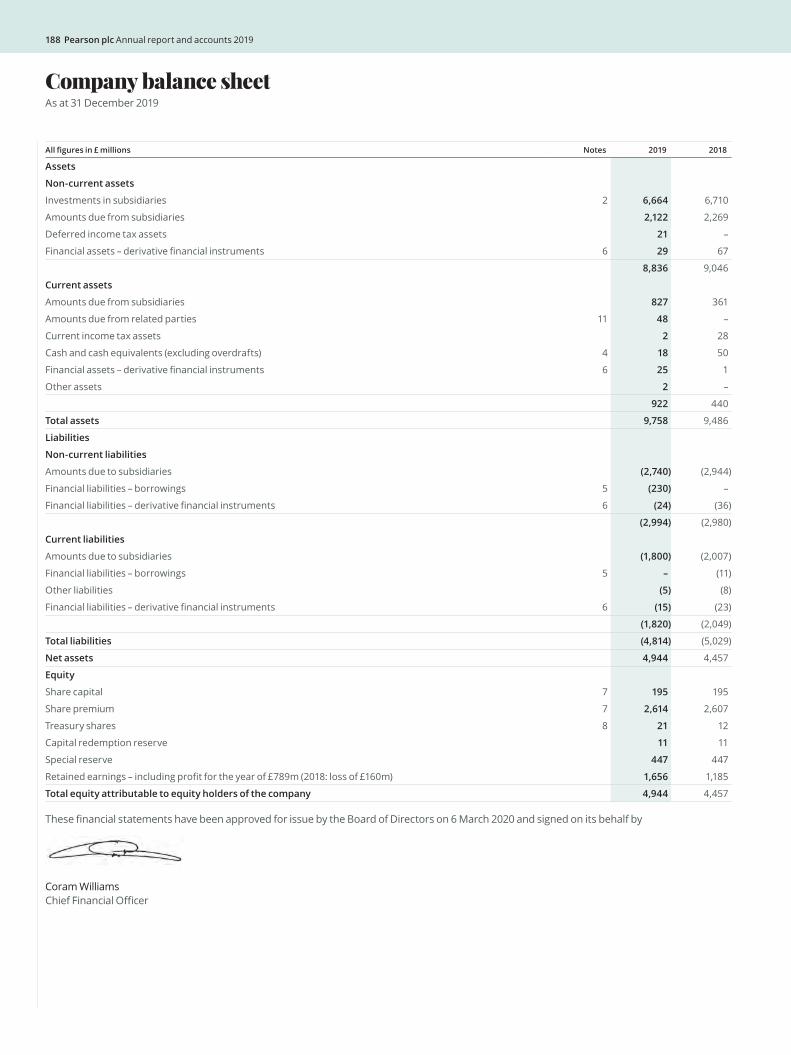
188 Pearson plc Annual report and accounts 2019
Company balance sheetAs at 31 December 2019
All figures in £ millions Notes 2019 2018
Assets
Non-current assets
Investments in subsidiaries 2 6,664 6,710
Amounts due from subsidiaries 2,122 2,269
Deferred income tax assets 21 –
Financial assets – derivative financial instruments 6 29 67
8,836 9,046
Current assets
Amounts due from subsidiaries 827 361
Amounts due from related parties 11 48 –
Current income tax assets 2 28
Cash and cash equivalents (excluding overdrafts) 4 18 50
Financial assets – derivative financial instruments 6 25 1
Other assets 2 –
922 440
Total assets 9,758 9,486
Liabilities
Non-current liabilities
Amounts due to subsidiaries (2,740) (2,944)
Financial liabilities – borrowings 5 (230) –
Financial liabilities – derivative financial instruments 6 (24) (36)
(2,994) (2,980)
Current liabilities
Amounts due to subsidiaries (1,800) (2,007)
Financial liabilities – borrowings 5 – (11)
Other liabilities (5) (8)
Financial liabilities – derivative financial instruments 6 (15) (23)
(1,820) (2,049)
Total liabilities (4,814) (5,029)
Net assets 4,944 4,457
Equity
Share capital 7 195 195
Share premium 7 2,614 2,607
Treasury shares 8 21 12
Capital redemption reserve 11 11
Special reserve 447 447
Retained earnings – including profit for the year of £789m (2018: loss of £160m) 1,656 1,185
Total equity attributable to equity holders of the company 4,944 4,457
These financial statements have been approved for issue by the Board of Directors on 6 March 2020 and signed on its behalf by
Coram Williams Chief Financial Officer

189Overview Strategy Performance Governance Financial statements Other information
All figures in £ millions
Equity attributable to equity holders of the company
Share capital
Share premium
Treasury shares
Capital redemption
reserveSpecial
reserveRetained earnings Total
At 1 January 2019 195 2,607 12 11 447 1,185 4,457
Profit for the year – – – – – 789 789
Issue of ordinary shares under share option schemes1 – 7 – – – – 7
Buyback of equity – – – – – – –
Purchase of treasury shares – – (52) – – – (52)
Release of treasury shares – – 61 – – (61) –
Capital reduction – – – – – (110) (110)
Dividends – – – – – (147) (147)
At 31 December 2019 195 2,614 21 11 447 1,656 4,944
All figures in £ millions
Equity attributable to equity holders of the company
Share capital
Share premium
Treasury shares
Capital redemption
reserveSpecial
reserveRetained earnings Total
At 1 January 2018 200 2,602 (16) 5 447 1,511 4,749
Loss for the year – – – – – (160) (160)
Issue of ordinary shares under share option schemes1 1 5 – – – – 6
Buyback of equity (6) – – 6 – (2) (2)
Purchase of treasury shares – – – – – – –
Release of treasury shares – – 28 – – (28) –
Dividends – – – – – (136) (136)
At 31 December 2018 195 2,607 12 11 447 1,185 4,457
The capital redemption reserve reflects the nominal value of shares cancelled in the Group’s share buyback programme. The special reserve represents the cumulative effect of cancellation of the company’s share premium account.
Included within retained earnings is an amount of £162m (2018: £162m) relating to profit on intra-Group disposals that is not distributable.
1 Full details of the share-based payment plans are disclosed in note 26 to the consolidated financial statements.
Company statement of changes in equityYear ended 31 December 2019
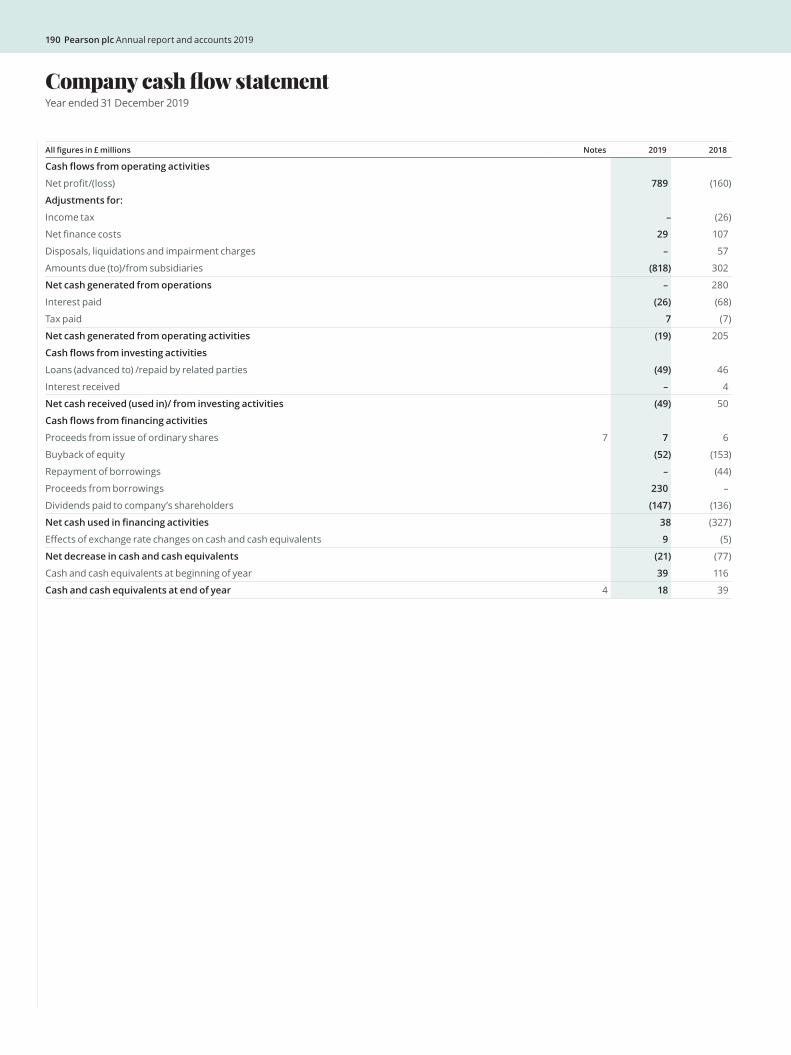
190 Pearson plc Annual report and accounts 2019
All figures in £ millions Notes 2019 2018
Cash flows from operating activities
Net profit/(loss) 789 (160)
Adjustments for:
Income tax – (26)
Net finance costs 29 107
Disposals, liquidations and impairment charges – 57
Amounts due (to)/from subsidiaries (818) 302
Net cash generated from operations – 280
Interest paid (26) (68)
Tax paid 7 (7)
Net cash generated from operating activities (19) 205
Cash flows from investing activities
Loans (advanced to) /repaid by related parties (49) 46
Interest received – 4
Net cash received (used in)/ from investing activities (49) 50
Cash flows from financing activities
Proceeds from issue of ordinary shares 7 7 6
Buyback of equity (52) (153)
Repayment of borrowings – (44)
Proceeds from borrowings 230 –
Dividends paid to company’s shareholders (147) (136)
Net cash used in financing activities 38 (327)
Effects of exchange rate changes on cash and cash equivalents 9 (5)
Net decrease in cash and cash equivalents (21) (77)
Cash and cash equivalents at beginning of year 39 116
Cash and cash equivalents at end of year 4 18 39
Company cash flow statementYear ended 31 December 2019
191Overview Strategy Performance Governance Financial statements Other information
1. Accounting policiesThe financial statements on p188-198 comprise the separate financial statements of Pearson plc.
As permitted by section 408 of the Companies Act 2006, only the consolidated income statement and statement of comprehensive income have been presented.
The company has no employees (2018: nil).
The basis of preparation and accounting policies applied in the preparation of these company financial statements are the same as those set out in note 1a to the consolidated financial statements with the addition of the following:
InvestmentsInvestments in subsidiaries are stated at cost less provision for impairment, with the exception of certain hedged investments that are held in a foreign currency and revalued at each balance sheet date.
Lending to/from subsidiaries is considered to be an operating activity and any movements are classified as cash flows from operating activities in the cash flow statement.
Amounts owed by subsidiariesAmounts owed by subsidiaries generally mature within five years, but can be called upon on short notice, or are repayable on demand. The company has assessed and concluded that these loans will be fully recovered. Therefore credit losses are considered to be immaterial.
New accounting standardsThe following standards were adopted in 2019:
IFRS 16 Leases
IFRIC 23 Uncertainty over Income Tax Treatment
Amendments to IFRS 9 and IFRS 7
Adoption of these standards has not had a material impact on the company financial statements.
2. Investments in subsidiariesAll figures in £ millions 2019 2018
At beginning of year 6,710 6,691
Impairments – (57)
Currency revaluations (46) 76
At end of year 6,664 6,710
Impairments in 2018 related to the carrying value of intermediate holding company investments. There were no impairments in 2019.
The recoverability of investments is considered annually and significant estimation is required to determine the recoverable amount. Recoverability is based upon financial information related to the subsidiaries including cash flow projections in conjunction with the goodwill impairment analysis performed by the Group (see note 11 of the consolidated financial statements).
3. Financial risk managementThe company’s financial instruments comprise amounts due to/from subsidiary undertakings, cash and cash equivalents, derivative financial instruments and current borrowings. Derivative financial instruments are held at fair value, with all other financial instruments held at amortised cost, which approximates fair value. The company’s approach to the management of financial risks is consistent with the Group’s treasury policy, as discussed in note 19 to the consolidated financial statements. The company believes the value of its financial assets to be fully recoverable.
The carrying value of the company’s financial instruments is exposed to movements in interest rates and foreign currency exchange rates (primarily US dollars). The company estimates that a 1% increase in interest rates would result in a £16m increase in the carrying value of its financial instruments, with a 1% decrease in interest rates resulting in an £18m decrease in their carrying value. The company also estimates that a 10% strengthening in sterling would decrease the carrying value of its financial instruments by £23m, while a 10% weakening in the value of sterling would increase the carrying value by £22m. These increases and decreases in carrying value would be recorded through the income statement. Sensitivities are calculated using estimation techniques such as discounted cash flow and option valuation models. Where modelling an interest rate decrease of 1% led to negative interest rates, these points on the yield curve were adjusted to 0%.
Notes to the company financial statements
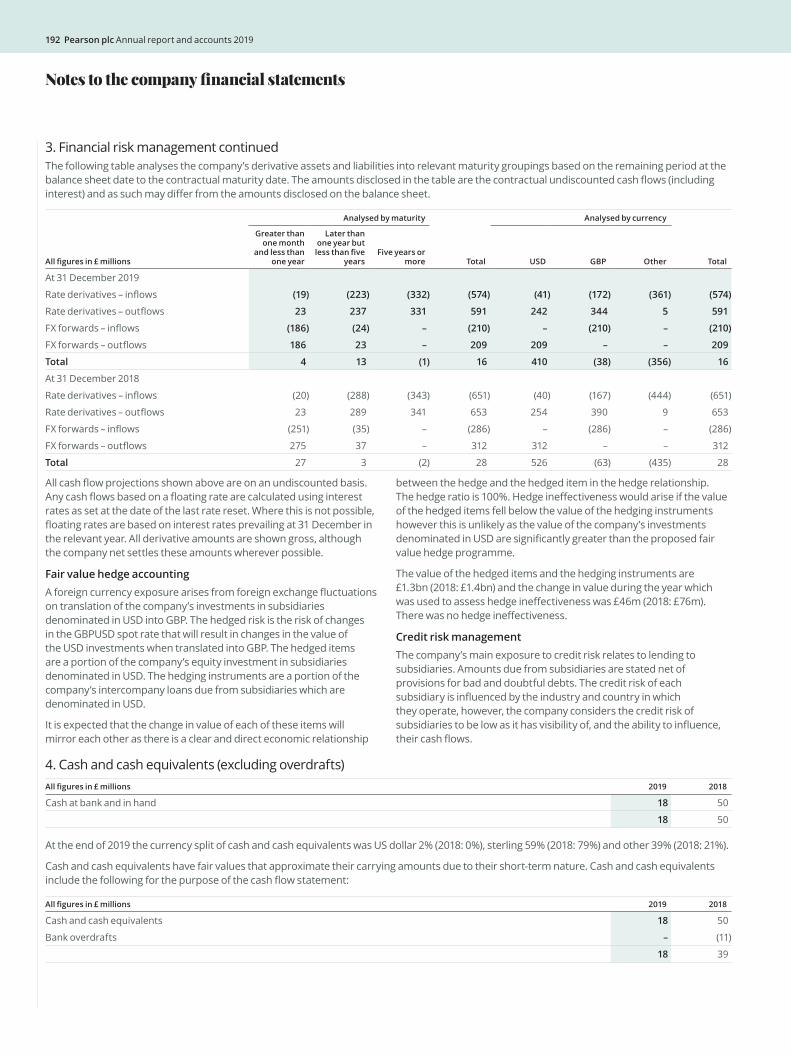
192 Pearson plc Annual report and accounts 2019
3. Financial risk management continuedThe following table analyses the company’s derivative assets and liabilities into relevant maturity groupings based on the remaining period at the balance sheet date to the contractual maturity date. The amounts disclosed in the table are the contractual undiscounted cash flows (including interest) and as such may differ from the amounts disclosed on the balance sheet.
All figures in £ millions
Analysed by maturity
Total
Analysed by currency
Total
Greater thanone month
and less thanone year
Later than one year but less than five
yearsFive years or
more USD GBP Other
At 31 December 2019
Rate derivatives – inflows (19) (223) (332) (574) (41) (172) (361) (574)
Rate derivatives – outflows 23 237 331 591 242 344 5 591
FX forwards – inflows (186) (24) – (210) – (210) – (210)
FX forwards – outflows 186 23 – 209 209 – – 209
Total 4 13 (1) 16 410 (38) (356) 16
At 31 December 2018
Rate derivatives – inflows (20) (288) (343) (651) (40) (167) (444) (651)
Rate derivatives – outflows 23 289 341 653 254 390 9 653
FX forwards – inflows (251) (35) – (286) – (286) – (286)
FX forwards – outflows 275 37 – 312 312 – – 312
Total 27 3 (2) 28 526 (63) (435) 28
All cash flow projections shown above are on an undiscounted basis. Any cash flows based on a floating rate are calculated using interest rates as set at the date of the last rate reset. Where this is not possible, floating rates are based on interest rates prevailing at 31 December in the relevant year. All derivative amounts are shown gross, although the company net settles these amounts wherever possible.
Fair value hedge accountingA foreign currency exposure arises from foreign exchange fluctuations on translation of the company’s investments in subsidiaries denominated in USD into GBP. The hedged risk is the risk of changes in the GBPUSD spot rate that will result in changes in the value of the USD investments when translated into GBP. The hedged items are a portion of the company’s equity investment in subsidiaries denominated in USD. The hedging instruments are a portion of the company’s intercompany loans due from subsidiaries which are denominated in USD.
It is expected that the change in value of each of these items will mirror each other as there is a clear and direct economic relationship
between the hedge and the hedged item in the hedge relationship. The hedge ratio is 100%. Hedge ineffectiveness would arise if the value of the hedged items fell below the value of the hedging instruments however this is unlikely as the value of the company’s investments denominated in USD are significantly greater than the proposed fair value hedge programme.
The value of the hedged items and the hedging instruments are £1.3bn (2018: £1.4bn) and the change in value during the year which was used to assess hedge ineffectiveness was £46m (2018: £76m). There was no hedge ineffectiveness.
Credit risk managementThe company’s main exposure to credit risk relates to lending to subsidiaries. Amounts due from subsidiaries are stated net of provisions for bad and doubtful debts. The credit risk of each subsidiary is influenced by the industry and country in which they operate, however, the company considers the credit risk of subsidiaries to be low as it has visibility of, and the ability to influence, their cash flows.
4. Cash and cash equivalents (excluding overdrafts)All figures in £ millions 2019 2018
Cash at bank and in hand 18 50
18 50
At the end of 2019 the currency split of cash and cash equivalents was US dollar 2% (2018: 0%), sterling 59% (2018: 79%) and other 39% (2018: 21%).
Cash and cash equivalents have fair values that approximate their carrying amounts due to their short-term nature. Cash and cash equivalents include the following for the purpose of the cash flow statement:
All figures in £ millions 2019 2018
Cash and cash equivalents 18 50
Bank overdrafts – (11)
18 39
Notes to the company financial statements
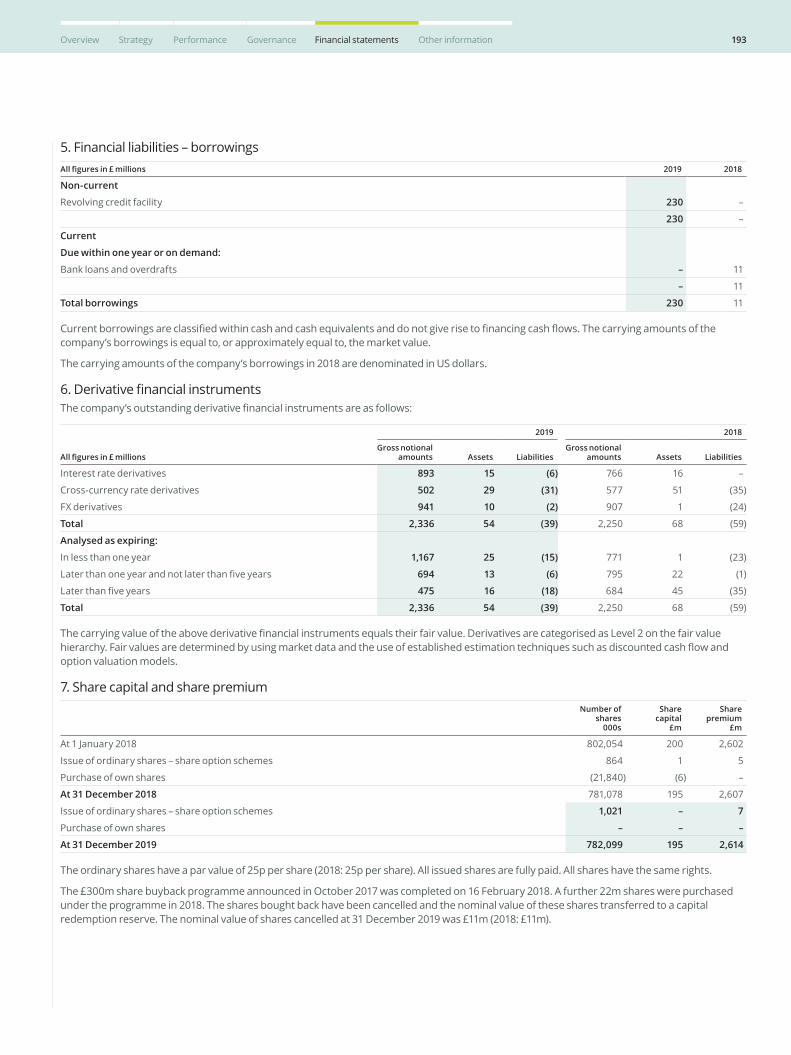
193Overview Strategy Performance Governance Financial statements Other information
5. Financial liabilities – borrowingsAll figures in £ millions 2019 2018
Non-current
Revolving credit facility 230 –
230 –
Current
Due within one year or on demand:
Bank loans and overdrafts – 11
– 11
Total borrowings 230 11
Current borrowings are classified within cash and cash equivalents and do not give rise to financing cash flows. The carrying amounts of the company’s borrowings is equal to, or approximately equal to, the market value.
The carrying amounts of the company’s borrowings in 2018 are denominated in US dollars.
6. Derivative financial instrumentsThe company’s outstanding derivative financial instruments are as follows:
All figures in £ millions
2019 2018
Gross notional amounts Assets Liabilities
Gross notional amounts Assets Liabilities
Interest rate derivatives 893 15 (6) 766 16 –
Cross-currency rate derivatives 502 29 (31) 577 51 (35)
FX derivatives 941 10 (2) 907 1 (24)
Total 2,336 54 (39) 2,250 68 (59)
Analysed as expiring:
In less than one year 1,167 25 (15) 771 1 (23)
Later than one year and not later than five years 694 13 (6) 795 22 (1)
Later than five years 475 16 (18) 684 45 (35)
Total 2,336 54 (39) 2,250 68 (59)
The carrying value of the above derivative financial instruments equals their fair value. Derivatives are categorised as Level 2 on the fair value hierarchy. Fair values are determined by using market data and the use of established estimation techniques such as discounted cash flow and option valuation models.
7. Share capital and share premiumNumber of
shares 000s
Share capital
£m
Share premium
£m
At 1 January 2018 802,054 200 2,602
Issue of ordinary shares – share option schemes 864 1 5
Purchase of own shares (21,840) (6) –
At 31 December 2018 781,078 195 2,607
Issue of ordinary shares – share option schemes 1,021 – 7
Purchase of own shares – – –
At 31 December 2019 782,099 195 2,614
The ordinary shares have a par value of 25p per share (2018: 25p per share). All issued shares are fully paid. All shares have the same rights.
The £300m share buyback programme announced in October 2017 was completed on 16 February 2018. A further 22m shares were purchased under the programme in 2018. The shares bought back have been cancelled and the nominal value of these shares transferred to a capital redemption reserve. The nominal value of shares cancelled at 31 December 2019 was £11m (2018: £11m).

194 Pearson plc Annual report and accounts 2019
8. Treasury sharesNumber of
shares 000s £m
At 1 January 2018 5,994 16
Release of treasury shares (2,769) (28)
At 31 December 2018 3,225 (12)
Purchase of treasury shares 6,100 52
Release of treasury shares (6,067) (61)
At 31 December 2019 3,258 (21)
The company holds its own shares in trust to satisfy its obligations under its restricted share plans. These shares are treated as treasury shares for accounting purposes and have a par value of 25p per share. The nominal value of the company’s treasury shares amounts to £0.8m (2018: £0.8m). At 31 December 2019, the market value of the company’s treasury shares was £21m (2018: £30m). The gross book value of the shares at 31 December 2019 amounts to £24m. This value has been netted off with contributions received from operating companies of £45m, resulting in a net credit value of £21m.
9. ContingenciesThere are contingent liabilities that arise in the normal course of business in respect of indemnities, warranties and guarantees in relation to former subsidiaries and in respect of guarantees in relation to subsidiaries. In addition, there are contingent liabilities in respect of legal claims. None of these claims are expected to result in a material gain or loss to the company.
10. Audit feesStatutory audit fees relating to the company were £35,000 (2018: £35,000).
11. Related party transactions SubsidiariesThe company transacts and has outstanding balances with its subsidiaries. Amounts due from subsidiaries and amounts due to subsidiaries are disclosed on the face of the company balance sheet.
These loans are generally unsecured and interest is calculated based on market rates. The company has interest payable to subsidiaries for the year of £104m (2018: £105m) and interest and guarantee fees receivable from subsidiaries for the year of £91m (2018: £105m). Management fees payable to subsidiaries in respect of centrally provided services amounted to £45m (2018: £59m). Management fees receivable from subsidiaries in respect of centrally provided services amounted to £35m (2018: £35m). Dividends received from subsidiaries were £803m (2018: £nil).
AssociatesAmounts due from related parties, disclosed on the face of the company balance sheet, relate to loans to Penguin Random House, an associate of the Group. These loans are unsecured and interest is calculated based on market rates. The amount outstanding at 31 December 2019 was £48m (2018: £nil). The loans are provided under a working capital facility and fluctuate during the year.
Key management personnelKey management personnel are deemed to be the members of the Pearson executive.
It is this committee which had responsibility for planning, directing and controlling the activities of the company in 2019. Key management personnel compensation is disclosed in note 36 to the consolidated financial statements.
Notes to the company financial statements
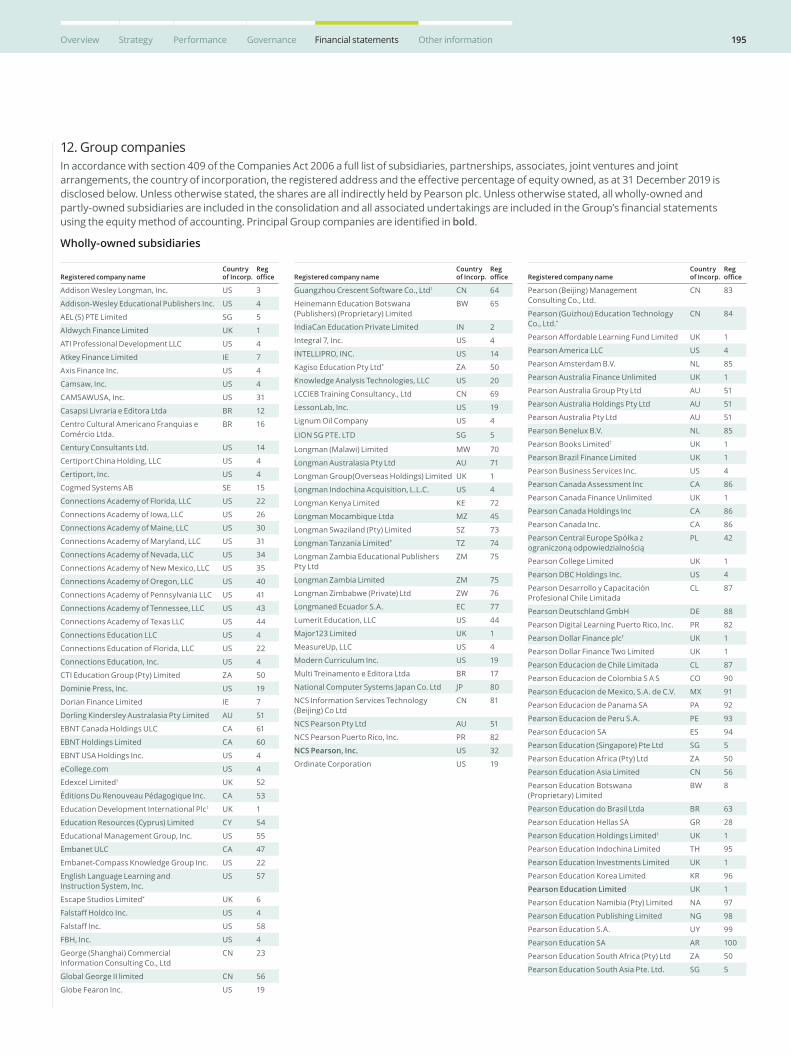
195Overview Strategy Performance Governance Financial statements Other information
12. Group companiesIn accordance with section 409 of the Companies Act 2006 a full list of subsidiaries, partnerships, associates, joint ventures and joint arrangements, the country of incorporation, the registered address and the effective percentage of equity owned, as at 31 December 2019 is disclosed below. Unless otherwise stated, the shares are all indirectly held by Pearson plc. Unless otherwise stated, all wholly-owned and partly-owned subsidiaries are included in the consolidation and all associated undertakings are included in the Group’s financial statements using the equity method of accounting. Principal Group companies are identified in bold.
Wholly-owned subsidiaries
Registered company nameCountry of Incorp.
Reg office
Addison Wesley Longman, Inc. US 3
Addison-Wesley Educational Publishers Inc. US 4
AEL (S) PTE Limited SG 5
Aldwych Finance Limited UK 1
ATI Professional Development LLC US 4
Atkey Finance Limited IE 7
Axis Finance Inc. US 4
Camsaw, Inc. US 4
CAMSAWUSA, Inc. US 31
Casapsi Livraria e Editora Ltda BR 12
Centro Cultural Americano Franquias e Comércio Ltda.
BR 16
Century Consultants Ltd. US 14
Certiport China Holding, LLC US 4
Certiport, Inc. US 4
Cogmed Systems AB SE 15
Connections Academy of Florida, LLC US 22
Connections Academy of Iowa, LLC US 26
Connections Academy of Maine, LLC US 30
Connections Academy of Maryland, LLC US 31
Connections Academy of Nevada, LLC US 34
Connections Academy of New Mexico, LLC US 35
Connections Academy of Oregon, LLC US 40
Connections Academy of Pennsylvania LLC US 41
Connections Academy of Tennessee, LLC US 43
Connections Academy of Texas LLC US 44
Connections Education LLC US 4
Connections Education of Florida, LLC US 22
Connections Education, Inc. US 4
CTI Education Group (Pty) Limited ZA 50
Dominie Press, Inc. US 19
Dorian Finance Limited IE 7
Dorling Kindersley Australasia Pty Limited AU 51
EBNT Canada Holdings ULC CA 61
EBNT Holdings Limited CA 60
EBNT USA Holdings Inc. US 4
eCollege.com US 4
Edexcel Limited† UK 52
Éditions Du Renouveau Pédagogique Inc. CA 53
Education Development International Plc† UK 1
Education Resources (Cyprus) Limited CY 54
Educational Management Group, Inc. US 55
Embanet ULC CA 47
Embanet-Compass Knowledge Group Inc. US 22
English Language Learning and Instruction System, Inc.
US 57
Escape Studios Limited* UK 6
Falstaff Holdco Inc. US 4
Falstaff Inc. US 58
FBH, Inc. US 4
George (Shanghai) Commercial Information Consulting Co., Ltd
CN 23
Global George II limited CN 56
Globe Fearon Inc. US 19
Registered company nameCountry of Incorp.
Reg office
Guangzhou Crescent Software Co., Ltd† CN 64
Heinemann Education Botswana (Publishers) (Proprietary) Limited
BW 65
IndiaCan Education Private Limited IN 2
Integral 7, Inc. US 4
INTELLIPRO, INC. US 14
Kagiso Education Pty Ltd* ZA 50
Knowledge Analysis Technologies, LLC US 20
LCCIEB Training Consultancy., Ltd CN 69
LessonLab, Inc. US 19
Lignum Oil Company US 4
LION SG PTE. LTD SG 5
Longman (Malawi) Limited MW 70
Longman Australasia Pty Ltd AU 71
Longman Group(Overseas Holdings) Limited UK 1
Longman Indochina Acquisition, L.L.C. US 4
Longman Kenya Limited KE 72
Longman Mocambique Ltda MZ 45
Longman Swaziland (Pty) Limited SZ 73
Longman Tanzania Limited* TZ 74
Longman Zambia Educational Publishers Pty Ltd
ZM 75
Longman Zambia Limited ZM 75
Longman Zimbabwe (Private) Ltd ZW 76
Longmaned Ecuador S.A. EC 77
Lumerit Education, LLC US 44
Major123 Limited UK 1
MeasureUp, LLC US 4
Modern Curriculum Inc. US 19
Multi Treinamento e Editora Ltda BR 17
National Computer Systems Japan Co. Ltd JP 80
NCS Information Services Technology (Beijing) Co Ltd
CN 81
NCS Pearson Pty Ltd AU 51
NCS Pearson Puerto Rico, Inc. PR 82
NCS Pearson, Inc. US 32
Ordinate Corporation US 19
Registered company nameCountry of Incorp.
Reg office
Pearson (Beijing) Management Consulting Co., Ltd.
CN 83
Pearson (Guizhou) Education Technology Co., Ltd.*
CN 84
Pearson Affordable Learning Fund Limited UK 1
Pearson America LLC US 4
Pearson Amsterdam B.V. NL 85
Pearson Australia Finance Unlimited UK 1
Pearson Australia Group Pty Ltd AU 51
Pearson Australia Holdings Pty Ltd AU 51
Pearson Australia Pty Ltd AU 51
Pearson Benelux B.V. NL 85
Pearson Books Limited† UK 1
Pearson Brazil Finance Limited UK 1
Pearson Business Services Inc. US 4
Pearson Canada Assessment Inc CA 86
Pearson Canada Finance Unlimited UK 1
Pearson Canada Holdings Inc CA 86
Pearson Canada Inc. CA 86
Pearson Central Europe Spółka z ograniczoną odpowiedzialnością
PL 42
Pearson College Limited UK 1
Pearson DBC Holdings Inc. US 4
Pearson Desarrollo y Capacitación Profesional Chile Limitada
CL 87
Pearson Deutschland GmbH DE 88
Pearson Digital Learning Puerto Rico, Inc. PR 82
Pearson Dollar Finance plc† UK 1
Pearson Dollar Finance Two Limited UK 1
Pearson Educacion de Chile Limitada CL 87
Pearson Educacion de Colombia S A S CO 90
Pearson Educacion de Mexico, S.A. de C.V. MX 91
Pearson Educacion de Panama SA PA 92
Pearson Educacion de Peru S.A. PE 93
Pearson Educacion SA ES 94
Pearson Education (Singapore) Pte Ltd SG 5
Pearson Education Africa (Pty) Ltd ZA 50
Pearson Education Asia Limited CN 56
Pearson Education Botswana (Proprietary) Limited
BW 8
Pearson Education do Brasil Ltda BR 63
Pearson Education Hellas SA GR 28
Pearson Education Holdings Limited† UK 1
Pearson Education Indochina Limited TH 95
Pearson Education Investments Limited UK 1
Pearson Education Korea Limited KR 96
Pearson Education Limited UK 1
Pearson Education Namibia (Pty) Limited NA 97
Pearson Education Publishing Limited NG 98
Pearson Education S.A. UY 99
Pearson Education SA AR 100
Pearson Education South Africa (Pty) Ltd ZA 50
Pearson Education South Asia Pte. Ltd. SG 5
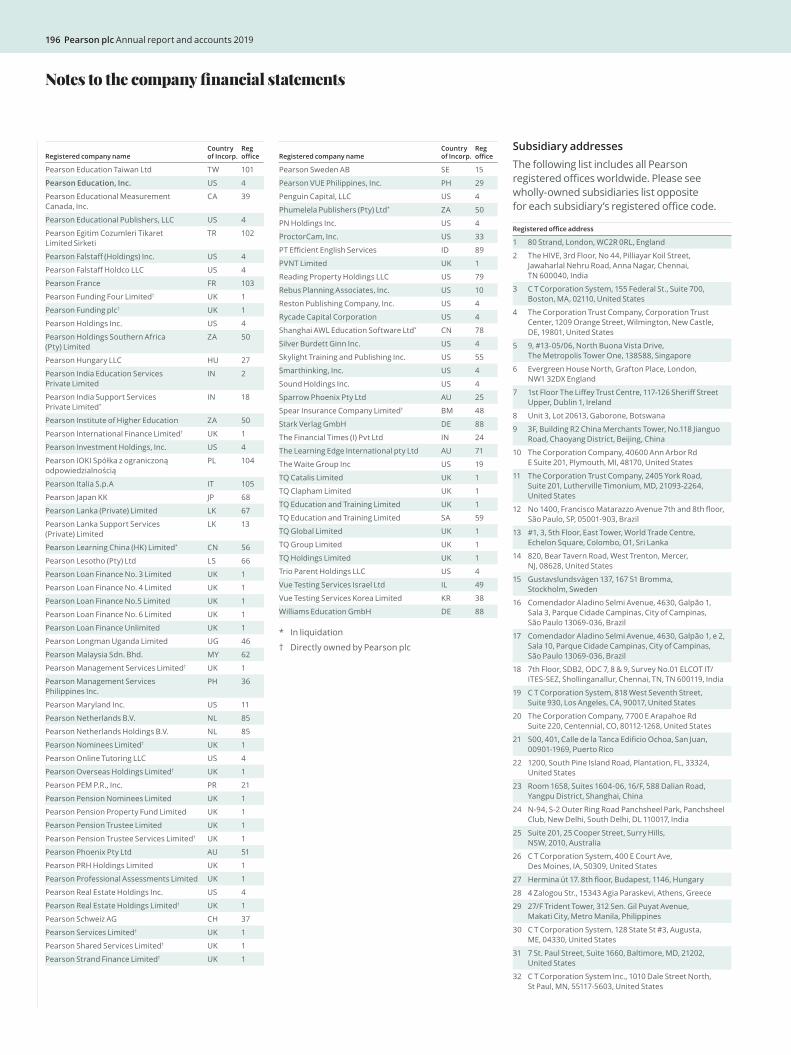
196 Pearson plc Annual report and accounts 2019
Registered company nameCountry of Incorp.
Reg office
Pearson Education Taiwan Ltd TW 101
Pearson Education, Inc. US 4
Pearson Educational Measurement Canada, Inc.
CA 39
Pearson Educational Publishers, LLC US 4
Pearson Egitim Cozumleri Tikaret Limited Sirketi
TR 102
Pearson Falstaff (Holdings) Inc. US 4
Pearson Falstaff Holdco LLC US 4
Pearson France FR 103
Pearson Funding Four Limited† UK 1
Pearson Funding plc† UK 1
Pearson Holdings Inc. US 4
Pearson Holdings Southern Africa (Pty) Limited
ZA 50
Pearson Hungary LLC HU 27
Pearson India Education Services Private Limited
IN 2
Pearson India Support Services Private Limited*
IN 18
Pearson Institute of Higher Education ZA 50
Pearson International Finance Limited† UK 1
Pearson Investment Holdings, Inc. US 4
Pearson IOKI Spółka z ograniczoną odpowiedzialnością
PL 104
Pearson Italia S.p.A IT 105
Pearson Japan KK JP 68
Pearson Lanka (Private) Limited LK 67
Pearson Lanka Support Services (Private) Limited
LK 13
Pearson Learning China (HK) Limited* CN 56
Pearson Lesotho (Pty) Ltd LS 66
Pearson Loan Finance No. 3 Limited UK 1
Pearson Loan Finance No. 4 Limited UK 1
Pearson Loan Finance No.5 Limited UK 1
Pearson Loan Finance No. 6 Limited UK 1
Pearson Loan Finance Unlimited UK 1
Pearson Longman Uganda Limited UG 46
Pearson Malaysia Sdn. Bhd. MY 62
Pearson Management Services Limited† UK 1
Pearson Management Services Philippines Inc.
PH 36
Pearson Maryland Inc. US 11
Pearson Netherlands B.V. NL 85
Pearson Netherlands Holdings B.V. NL 85
Pearson Nominees Limited† UK 1
Pearson Online Tutoring LLC US 4
Pearson Overseas Holdings Limited† UK 1
Pearson PEM P.R., Inc. PR 21
Pearson Pension Nominees Limited UK 1
Pearson Pension Property Fund Limited UK 1
Pearson Pension Trustee Limited UK 1
Pearson Pension Trustee Services Limited† UK 1
Pearson Phoenix Pty Ltd AU 51
Pearson PRH Holdings Limited UK 1
Pearson Professional Assessments Limited UK 1
Pearson Real Estate Holdings Inc. US 4
Pearson Real Estate Holdings Limited† UK 1
Pearson Schweiz AG CH 37
Pearson Services Limited† UK 1
Pearson Shared Services Limited† UK 1
Pearson Strand Finance Limited† UK 1
Registered company nameCountry of Incorp.
Reg office
Pearson Sweden AB SE 15
Pearson VUE Philippines, Inc. PH 29
Penguin Capital, LLC US 4
Phumelela Publishers (Pty) Ltd* ZA 50
PN Holdings Inc. US 4
ProctorCam, Inc. US 33
PT Efficient English Services ID 89
PVNT Limited UK 1
Reading Property Holdings LLC US 79
Rebus Planning Associates, Inc. US 10
Reston Publishing Company, Inc. US 4
Rycade Capital Corporation US 4
Shanghai AWL Education Software Ltd* CN 78
Silver Burdett Ginn Inc. US 4
Skylight Training and Publishing Inc. US 55
Smarthinking, Inc. US 4
Sound Holdings Inc. US 4
Sparrow Phoenix Pty Ltd AU 25
Spear Insurance Company Limited† BM 48
Stark Verlag GmbH DE 88
The Financial Times (I) Pvt Ltd IN 24
The Learning Edge International pty Ltd AU 71
The Waite Group Inc US 19
TQ Catalis Limited UK 1
TQ Clapham Limited UK 1
TQ Education and Training Limited UK 1
TQ Education and Training Limited SA 59
TQ Global Limited UK 1
TQ Group Limited UK 1
TQ Holdings Limited UK 1
Trio Parent Holdings LLC US 4
Vue Testing Services Israel Ltd IL 49
Vue Testing Services Korea Limited KR 38
Williams Education GmbH DE 88
* In liquidation
† Directly owned by Pearson plc
Subsidiary addressesThe following list includes all Pearson registered offices worldwide. Please see wholly-owned subsidiaries list opposite for each subsidiary’s registered office code.
Registered office address
1 80 Strand, London, WC2R 0RL, England
2 The HIVE, 3rd Floor, No 44, Pilliayar Koil Street, Jawaharlal Nehru Road, Anna Nagar, Chennai, TN 600040, India
3 C T Corporation System, 155 Federal St., Suite 700, Boston, MA, 02110, United States
4 The Corporation Trust Company, Corporation Trust Center, 1209 Orange Street, Wilmington, New Castle, DE, 19801, United States
5 9, #13-05/06, North Buona Vista Drive, The Metropolis Tower One, 138588, Singapore
6 Evergreen House North, Grafton Place, London, NW1 32DX England
7 1st Floor The Liffey Trust Centre, 117-126 Sheriff Street Upper, Dublin 1, Ireland
8 Unit 3, Lot 20613, Gaborone, Botswana
9 3F, Building R2 China Merchants Tower, No.118 Jianguo Road, Chaoyang District, Beijing, China
10 The Corporation Company, 40600 Ann Arbor Rd E Suite 201, Plymouth, MI, 48170, United States
11 The Corporation Trust Company, 2405 York Road, Suite 201, Lutherville Timonium, MD, 21093-2264, United States
12 No 1400, Francisco Matarazzo Avenue 7th and 8th floor, São Paulo, SP, 05001-903, Brazil
13 #1, 3, 5th Floor, East Tower, World Trade Centre, Echelon Square, Colombo, O1, Sri Lanka
14 820, Bear Tavern Road, West Trenton, Mercer, NJ, 08628, United States
15 Gustavslundsvägen 137, 167 51 Bromma, Stockholm, Sweden
16 Comendador Aladino Selmi Avenue, 4630, Galpão 1, Sala 3, Parque Cidade Campinas, City of Campinas, São Paulo 13069-036, Brazil
17 Comendador Aladino Selmi Avenue, 4630, Galpão 1, e 2, Sala 10, Parque Cidade Campinas, City of Campinas, São Paulo 13069-036, Brazil
18 7th Floor, SDB2, ODC 7, 8 & 9, Survey No.01 ELCOT IT/ITES-SEZ, Shollinganallur, Chennai, TN, TN 600119, India
19 C T Corporation System, 818 West Seventh Street, Suite 930, Los Angeles, CA, 90017, United States
20 The Corporation Company, 7700 E Arapahoe Rd Suite 220, Centennial, CO, 80112-1268, United States
21 500, 401, Calle de la Tanca Edificio Ochoa, San Juan, 00901-1969, Puerto Rico
22 1200, South Pine Island Road, Plantation, FL, 33324, United States
23 Room 1658, Suites 1604-06, 16/F, 588 Dalian Road, Yangpu District, Shanghai, China
24 N-94, S-2 Outer Ring Road Panchsheel Park, Panchsheel Club, New Delhi, South Delhi, DL 110017, India
25 Suite 201, 25 Cooper Street, Surry Hills, NSW, 2010, Australia
26 C T Corporation System, 400 E Court Ave, Des Moines, IA, 50309, United States
27 Hermina út 17. 8th floor, Budapest, 1146, Hungary
28 4 Zalogou Str., 15343 Agia Paraskevi, Athens, Greece
29 27/F Trident Tower, 312 Sen. Gil Puyat Avenue, Makati City, Metro Manila, Philippines
30 C T Corporation System, 128 State St #3, Augusta, ME, 04330, United States
31 7 St. Paul Street, Suite 1660, Baltimore, MD, 21202, United States
32 C T Corporation System Inc., 1010 Dale Street North, St Paul, MN, 55117-5603, United States
Notes to the company financial statements
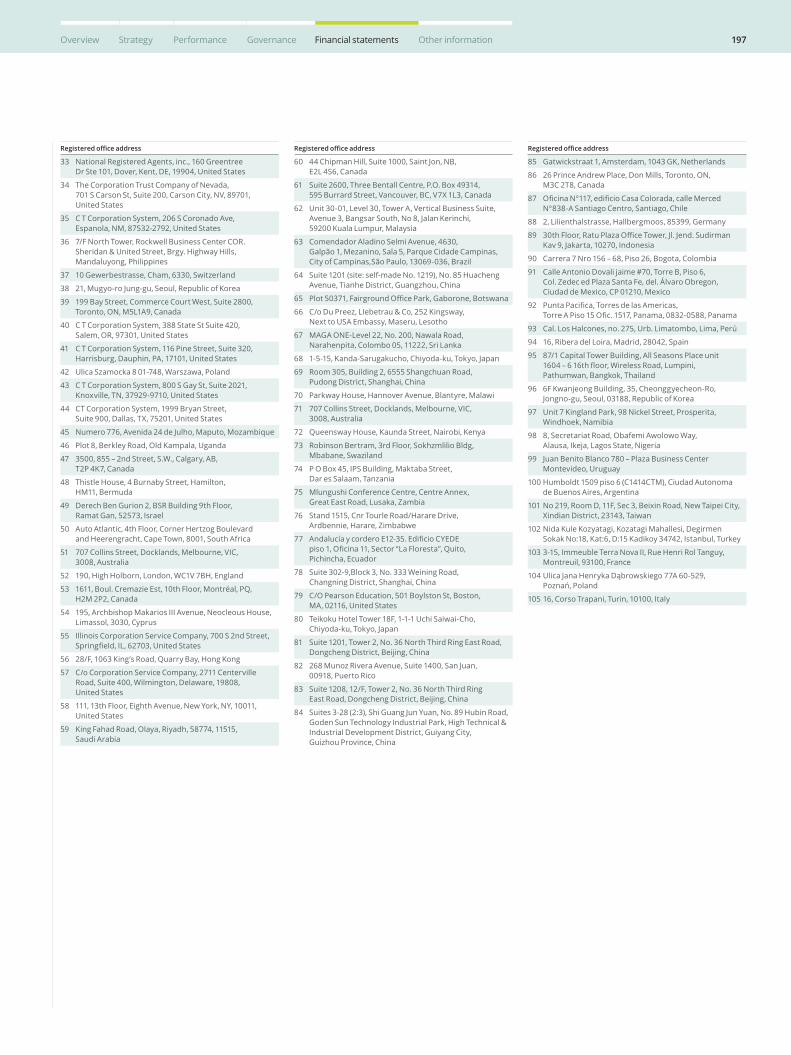
197Overview Strategy Performance Governance Financial statements Other information
Registered office address
33 National Registered Agents, inc., 160 Greentree Dr Ste 101, Dover, Kent, DE, 19904, United States
34 The Corporation Trust Company of Nevada, 701 S Carson St, Suite 200, Carson City, NV, 89701, United States
35 C T Corporation System, 206 S Coronado Ave, Espanola, NM, 87532-2792, United States
36 7/F North Tower, Rockwell Business Center COR. Sheridan & United Street, Brgy. Highway Hills, Mandaluyong, Philippines
37 10 Gewerbestrasse, Cham, 6330, Switzerland
38 21, Mugyo-ro Jung-gu, Seoul, Republic of Korea
39 199 Bay Street, Commerce Court West, Suite 2800, Toronto, ON, M5L1A9, Canada
40 C T Corporation System, 388 State St Suite 420, Salem, OR, 97301, United States
41 C T Corporation System, 116 Pine Street, Suite 320, Harrisburg, Dauphin, PA, 17101, United States
42 Ulica Szamocka 8 01-748, Warszawa, Poland
43 C T Corporation System, 800 S Gay St, Suite 2021, Knoxville, TN, 37929-9710, United States
44 CT Corporation System, 1999 Bryan Street, Suite 900, Dallas, TX, 75201, United States
45 Numero 776, Avenida 24 de Julho, Maputo, Mozambique
46 Plot 8, Berkley Road, Old Kampala, Uganda
47 3500, 855 – 2nd Street, S.W., Calgary, AB, T2P 4K7, Canada
48 Thistle House, 4 Burnaby Street, Hamilton, HM11, Bermuda
49 Derech Ben Gurion 2, BSR Building 9th Floor, Ramat Gan, 52573, Israel
50 Auto Atlantic, 4th Floor, Corner Hertzog Boulevard and Heerengracht, Cape Town, 8001, South Africa
51 707 Collins Street, Docklands, Melbourne, VIC, 3008, Australia
52 190, High Holborn, London, WC1V 7BH, England
53 1611, Boul. Cremazie Est, 10th Floor, Montréal, PQ, H2M 2P2, Canada
54 195, Archbishop Makarios III Avenue, Neocleous House, Limassol, 3030, Cyprus
55 Illinois Corporation Service Company, 700 S 2nd Street, Springfield, IL, 62703, United States
56 28/F, 1063 King’s Road, Quarry Bay, Hong Kong
57 C/o Corporation Service Company, 2711 Centerville Road, Suite 400, Wilmington, Delaware, 19808, United States
58 111, 13th Floor, Eighth Avenue, New York, NY, 10011, United States
59 King Fahad Road, Olaya, Riyadh, 58774, 11515, Saudi Arabia
Registered office address
60 44 Chipman Hill, Suite 1000, Saint Jon, NB, E2L 4S6, Canada
61 Suite 2600, Three Bentall Centre, P.O. Box 49314, 595 Burrard Street, Vancouver, BC, V7X 1L3, Canada
62 Unit 30-01, Level 30, Tower A, Vertical Business Suite, Avenue 3, Bangsar South, No 8, Jalan Kerinchi, 59200 Kuala Lumpur, Malaysia
63 Comendador Aladino Selmi Avenue, 4630, Galpão 1, Mezanino, Sala 5, Parque Cidade Campinas, City of Campinas,São Paulo, 13069-036, Brazil
64 Suite 1201 (site: self-made No. 1219), No. 85 Huacheng Avenue, Tianhe District, Guangzhou, China
65 Plot 50371, Fairground Office Park, Gaborone, Botswana
66 C/o Du Preez, LIebetrau & Co, 252 Kingsway, Next to USA Embassy, Maseru, Lesotho
67 MAGA ONE-Level 22, No. 200, Nawala Road, Narahenpita, Colombo 05, 11222, Sri Lanka
68 1-5-15, Kanda-Sarugakucho, Chiyoda-ku, Tokyo, Japan
69 Room 305, Building 2, 6555 Shangchuan Road, Pudong District, Shanghai, China
70 Parkway House, Hannover Avenue, Blantyre, Malawi
71 707 Collins Street, Docklands, Melbourne, VIC, 3008, Australia
72 Queensway House, Kaunda Street, Nairobi, Kenya
73 Robinson Bertram, 3rd Floor, Sokhzmlilio Bldg, Mbabane, Swaziland
74 P O Box 45, IPS Building, Maktaba Street, Dar es Salaam, Tanzania
75 Mlungushi Conference Centre, Centre Annex, Great East Road, Lusaka, Zambia
76 Stand 1515, Cnr Tourle Road/Harare Drive, Ardbennie, Harare, Zimbabwe
77 Andalucía y cordero E12-35. Edificio CYEDE piso 1, Oficina 11, Sector “La Floresta”, Quito, Pichincha, Ecuador
78 Suite 302-9,Block 3, No. 333 Weining Road, Changning District, Shanghai, China
79 C/O Pearson Education, 501 Boylston St, Boston, MA, 02116, United States
80 Teikoku Hotel Tower 18F, 1-1-1 Uchi Saiwai-Cho, Chiyoda-ku, Tokyo, Japan
81 Suite 1201, Tower 2, No. 36 North Third Ring East Road, Dongcheng District, Beijing, China
82 268 Munoz Rivera Avenue, Suite 1400, San Juan, 00918, Puerto Rico
83 Suite 1208, 12/F, Tower 2, No. 36 North Third Ring East Road, Dongcheng District, Beijing, China
84 Suites 3-28 (2:3), Shi Guang Jun Yuan, No. 89 Hubin Road, Goden Sun Technology Industrial Park, High Technical & Industrial Development District, Guiyang City, Guizhou Province, China
Registered office address
85 Gatwickstraat 1, Amsterdam, 1043 GK, Netherlands
86 26 Prince Andrew Place, Don Mills, Toronto, ON, M3C 2T8, Canada
87 Oficina N°117, edificio Casa Colorada, calle Merced N°838-A Santiago Centro, Santiago, Chile
88 2, Lilienthalstrasse, Hallbergmoos, 85399, Germany
89 30th Floor, Ratu Plaza Office Tower, Jl. Jend. Sudirman Kav 9, Jakarta, 10270, Indonesia
90 Carrera 7 Nro 156 – 68, Piso 26, Bogota, Colombia
91 Calle Antonio Dovali jaime #70, Torre B, Piso 6, Col. Zedec ed Plaza Santa Fe, del. Álvaro Obregon, Ciudad de Mexico, CP 01210, Mexico
92 Punta Pacifica, Torres de las Americas, Torre A Piso 15 Ofic. 1517, Panama, 0832-0588, Panama
93 Cal. Los Halcones, no. 275, Urb. Limatombo, Lima, Perú
94 16, Ribera del Loira, Madrid, 28042, Spain
95 87/1 Capital Tower Building, All Seasons Place unit 1604 – 6 16th floor, Wireless Road, Lumpini, Pathumwan, Bangkok, Thailand
96 6F Kwanjeong Building, 35, Cheonggyecheon-Ro, Jongno-gu, Seoul, 03188, Republic of Korea
97 Unit 7 Kingland Park, 98 Nickel Street, Prosperita, Windhoek, Namibia
98 8, Secretariat Road, Obafemi Awolowo Way, Alausa, Ikeja, Lagos State, Nigeria
99 Juan Benito Blanco 780 – Plaza Business Center Montevideo, Uruguay
100 Humboldt 1509 piso 6 (C1414CTM), Ciudad Autonoma de Buenos Aires, Argentina
101 No 219, Room D, 11F, Sec 3, Beixin Road, New Taipei City, Xindian District, 23143, Taiwan
102 Nida Kule Kozyatagi, Kozatagi Mahallesi, Degirmen Sokak No:18, Kat:6, D:15 Kadikoy 34742, Istanbul, Turkey
103 3-15, Immeuble Terra Nova II, Rue Henri Rol Tanguy, Montreuil, 93100, France
104 Ulica Jana Henryka Dąbrowskiego 77A 60-529, Poznań, Poland
105 16, Corso Trapani, Turin, 10100, Italy
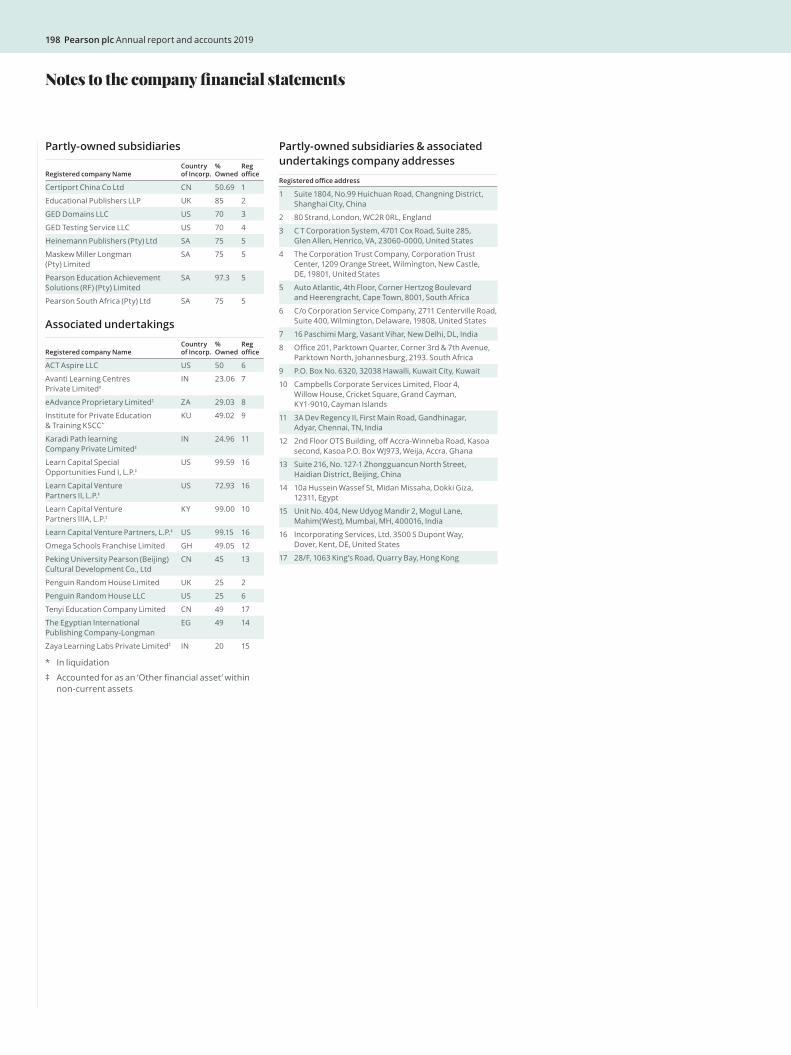
198 Pearson plc Annual report and accounts 2019
Partly-owned subsidiaries
Registered company NameCountry of Incorp.
% Owned
Reg office
Certiport China Co Ltd CN 50.69 1
Educational Publishers LLP UK 85 2
GED Domains LLC US 70 3
GED Testing Service LLC US 70 4
Heinemann Publishers (Pty) Ltd SA 75 5
Maskew Miller Longman (Pty) Limited
SA 75 5
Pearson Education Achievement Solutions (RF) (Pty) Limited
SA 97.3 5
Pearson South Africa (Pty) Ltd SA 75 5
Associated undertakings
Registered company NameCountry of Incorp.
% Owned
Reg office
ACT Aspire LLC US 50 6
Avanti Learning Centres Private Limited‡
IN 23.06 7
eAdvance Proprietary Limited‡ ZA 29.03 8
Institute for Private Education & Training KSCC*
KU 49.02 9
Karadi Path learning Company Private Limited‡
IN 24.96 11
Learn Capital Special Opportunities Fund I, L.P.‡
US 99.59 16
Learn Capital Venture Partners II, L.P.‡
US 72.93 16
Learn Capital Venture Partners IIIA, L.P.‡
KY 99.00 10
Learn Capital Venture Partners, L.P.‡ US 99.15 16
Omega Schools Franchise Limited GH 49.05 12
Peking University Pearson (Beijing) Cultural Development Co., Ltd
CN 45 13
Penguin Random House Limited UK 25 2
Penguin Random House LLC US 25 6
Tenyi Education Company Limited CN 49 17
The Egyptian International Publishing Company-Longman
EG 49 14
Zaya Learning Labs Private Limited‡ IN 20 15
* In liquidation
‡ Accounted for as an ‘Other financial asset’ within non-current assets
Partly-owned subsidiaries & associated undertakings company addresses
Registered office address
1 Suite 1804, No.99 Huichuan Road, Changning District, Shanghai City, China
2 80 Strand, London, WC2R 0RL, England
3 C T Corporation System, 4701 Cox Road, Suite 285, Glen Allen, Henrico, VA, 23060-0000, United States
4 The Corporation Trust Company, Corporation Trust Center, 1209 Orange Street, Wilmington, New Castle, DE, 19801, United States
5 Auto Atlantic, 4th Floor, Corner Hertzog Boulevard and Heerengracht, Cape Town, 8001, South Africa
6 C/o Corporation Service Company, 2711 Centerville Road, Suite 400, Wilmington, Delaware, 19808, United States
7 16 Paschimi Marg, Vasant Vihar, New Delhi, DL, India
8 Office 201, Parktown Quarter, Corner 3rd & 7th Avenue, Parktown North, Johannesburg, 2193. South Africa
9 P.O. Box No. 6320, 32038 Hawalli, Kuwait City, Kuwait
10 Campbells Corporate Services Limited, Floor 4, Willow House, Cricket Square, Grand Cayman, KY1-9010, Cayman Islands
11 3A Dev Regency II, First Main Road, Gandhinagar, Adyar, Chennai, TN, India
12 2nd Floor OTS Building, off Accra-Winneba Road, Kasoa second, Kasoa P.O. Box WJ973, Weija, Accra. Ghana
13 Suite 216, No. 127-1 Zhongguancun North Street, Haidian District, Beijing, China
14 10a Hussein Wassef St, Midan Missaha, Dokki Giza, 12311, Egypt
15 Unit No. 404, New Udyog Mandir 2, Mogul Lane, Mahim(West), Mumbai, MH, 400016, India
16 Incorporating Services, Ltd. 3500 S Dupont Way, Dover, Kent, DE, United States
17 28/F, 1063 King’s Road, Quarry Bay, Hong Kong
Notes to the company financial statements
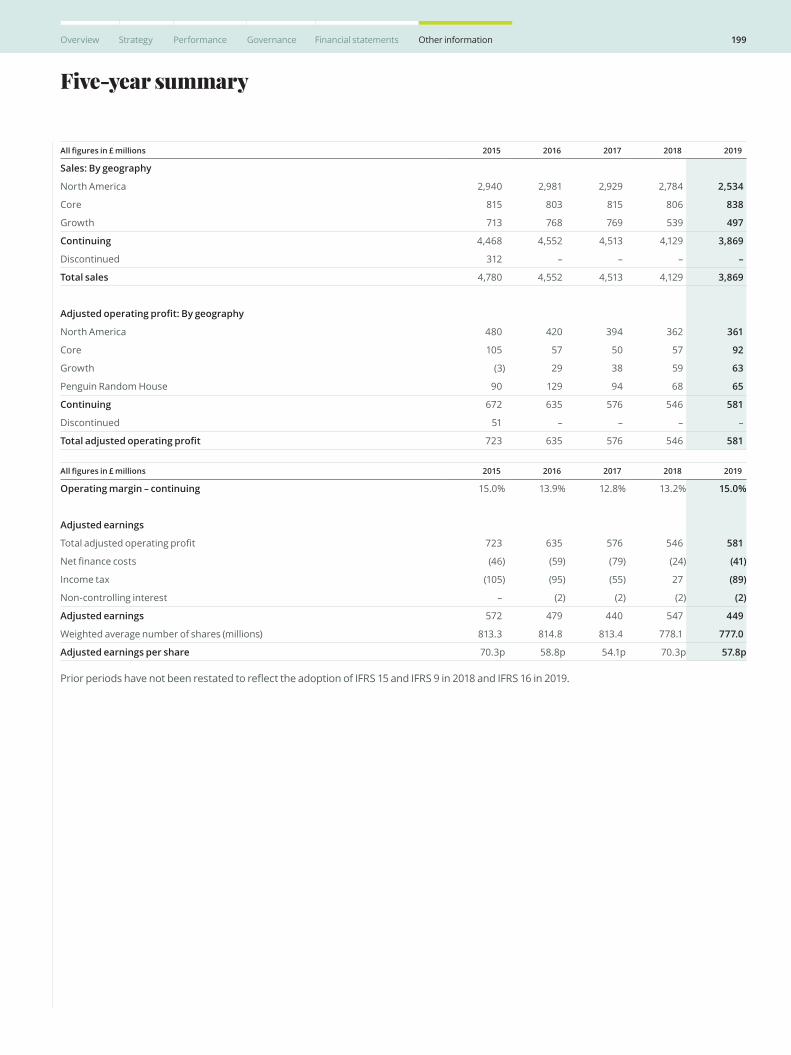
All figures in £ millions 2015 2016 2017 2018 2019
Sales: By geography
North America 2,940 2,981 2,929 2,784 2,534
Core 815 803 815 806 838
Growth 713 768 769 539 497
Continuing 4,468 4,552 4,513 4,129 3,869
Discontinued 312 – – – –
Total sales 4,780 4,552 4,513 4,129 3,869
Adjusted operating profit: By geography
North America 480 420 394 362 361
Core 105 57 50 57 92
Growth (3) 29 38 59 63
Penguin Random House 90 129 94 68 65
Continuing 672 635 576 546 581
Discontinued 51 – – – –
Total adjusted operating profit 723 635 576 546 581
All figures in £ millions 2015 2016 2017 2018 2019
Operating margin – continuing 15.0% 13.9% 12.8% 13.2% 15.0%
Adjusted earnings
Total adjusted operating profit 723 635 576 546 581
Net finance costs (46) (59) (79) (24) (41)
Income tax (105) (95) (55) 27 (89)
Non-controlling interest – (2) (2) (2) (2)
Adjusted earnings 572 479 440 547 449
Weighted average number of shares (millions) 813.3 814.8 813.4 778.1 777.0
Adjusted earnings per share 70.3p 58.8p 54.1p 70.3p 57.8p
Prior periods have not been restated to reflect the adoption of IFRS 15 and IFRS 9 in 2018 and IFRS 16 in 2019.
Five-year summary
199Overview Strategy Performance Governance Financial statements Other information
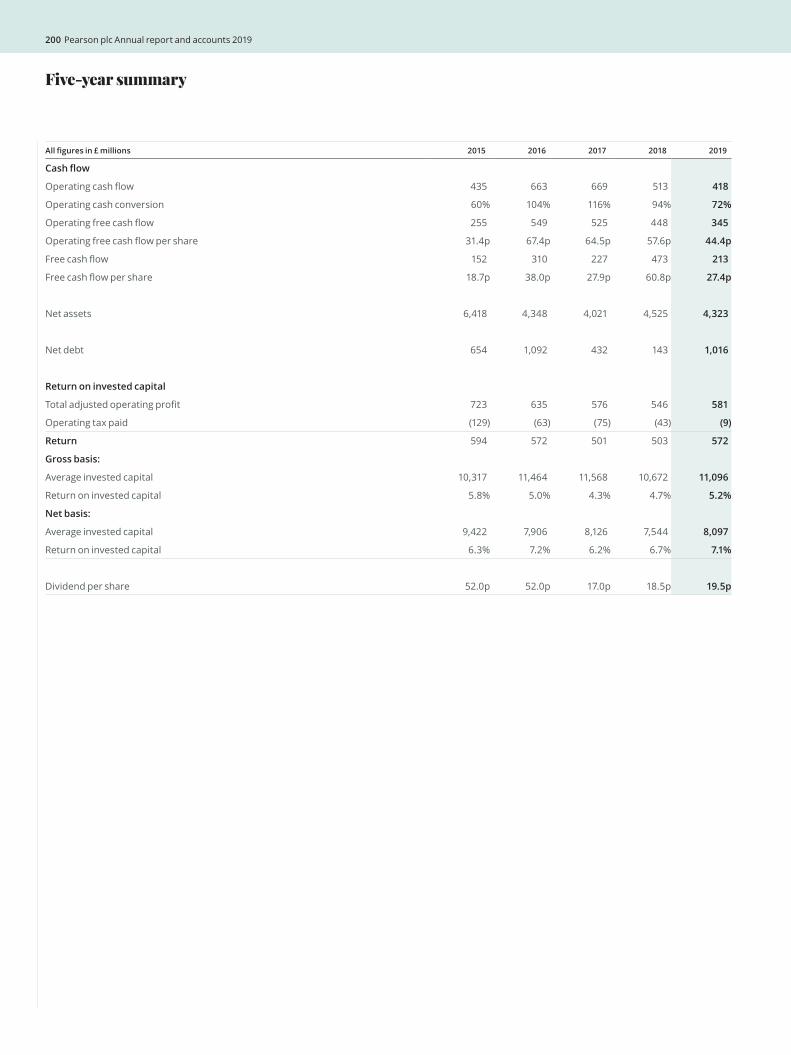
All figures in £ millions 2015 2016 2017 2018 2019
Cash flow
Operating cash flow 435 663 669 513 418
Operating cash conversion 60% 104% 116% 94% 72%
Operating free cash flow 255 549 525 448 345
Operating free cash flow per share 31.4p 67.4p 64.5p 57.6p 44.4p
Free cash flow 152 310 227 473 213
Free cash flow per share 18.7p 38.0p 27.9p 60.8p 27.4p
Net assets 6,418 4,348 4,021 4,525 4,323
Net debt 654 1,092 432 143 1,016
Return on invested capital
Total adjusted operating profit 723 635 576 546 581
Operating tax paid (129) (63) (75) (43) (9)
Return 594 572 501 503 572
Gross basis:
Average invested capital 10,317 11,464 11,568 10,672 11,096
Return on invested capital 5.8% 5.0% 4.3% 4.7% 5.2%
Net basis:
Average invested capital 9,422 7,906 8,126 7,544 8,097
Return on invested capital 6.3% 7.2% 6.2% 6.7% 7.1%
Dividend per share 52.0p 52.0p 17.0p 18.5p 19.5p
Five-year summary
200 Pearson plc Annual report and accounts 2019
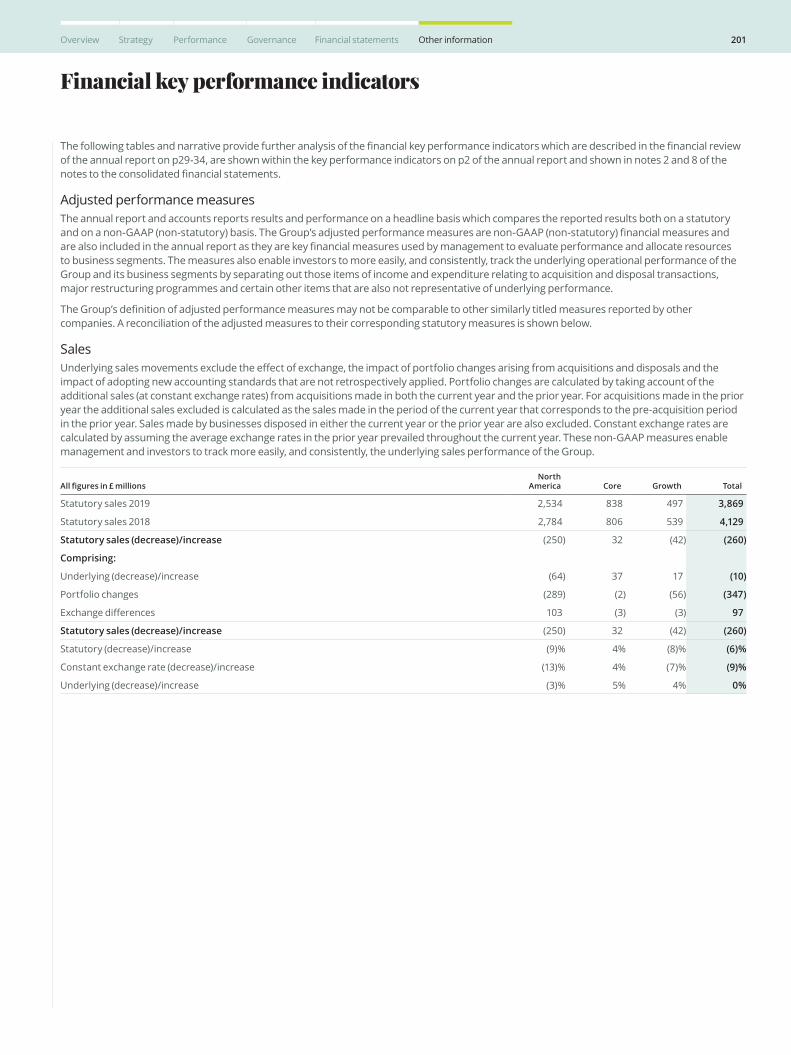
Financial key performance indicators
The following tables and narrative provide further analysis of the financial key performance indicators which are described in the financial review of the annual report on p29-34, are shown within the key performance indicators on p2 of the annual report and shown in notes 2 and 8 of the notes to the consolidated financial statements.
Adjusted performance measuresThe annual report and accounts reports results and performance on a headline basis which compares the reported results both on a statutory and on a non-GAAP (non-statutory) basis. The Group’s adjusted performance measures are non-GAAP (non-statutory) financial measures and are also included in the annual report as they are key financial measures used by management to evaluate performance and allocate resources to business segments. The measures also enable investors to more easily, and consistently, track the underlying operational performance of the Group and its business segments by separating out those items of income and expenditure relating to acquisition and disposal transactions, major restructuring programmes and certain other items that are also not representative of underlying performance.
The Group’s definition of adjusted performance measures may not be comparable to other similarly titled measures reported by other companies. A reconciliation of the adjusted measures to their corresponding statutory measures is shown below.
SalesUnderlying sales movements exclude the effect of exchange, the impact of portfolio changes arising from acquisitions and disposals and the impact of adopting new accounting standards that are not retrospectively applied. Portfolio changes are calculated by taking account of the additional sales (at constant exchange rates) from acquisitions made in both the current year and the prior year. For acquisitions made in the prior year the additional sales excluded is calculated as the sales made in the period of the current year that corresponds to the pre-acquisition period in the prior year. Sales made by businesses disposed in either the current year or the prior year are also excluded. Constant exchange rates are calculated by assuming the average exchange rates in the prior year prevailed throughout the current year. These non-GAAP measures enable management and investors to track more easily, and consistently, the underlying sales performance of the Group.
All figures in £ millionsNorth
America Core Growth Total
Statutory sales 2019 2,534 838 497 3,869
Statutory sales 2018 2,784 806 539 4,129
Statutory sales (decrease)/increase (250) 32 (42) (260)
Comprising:
Underlying (decrease)/increase (64) 37 17 (10)
Portfolio changes (289) (2) (56) (347)
Exchange differences 103 (3) (3) 97
Statutory sales (decrease)/increase (250) 32 (42) (260)
Statutory (decrease)/increase (9)% 4% (8)% (6)%
Constant exchange rate (decrease)/increase (13)% 4% (7)% (9)%
Underlying (decrease)/increase (3)% 5% 4% 0%
201Overview Strategy Performance Governance Financial statements Other information
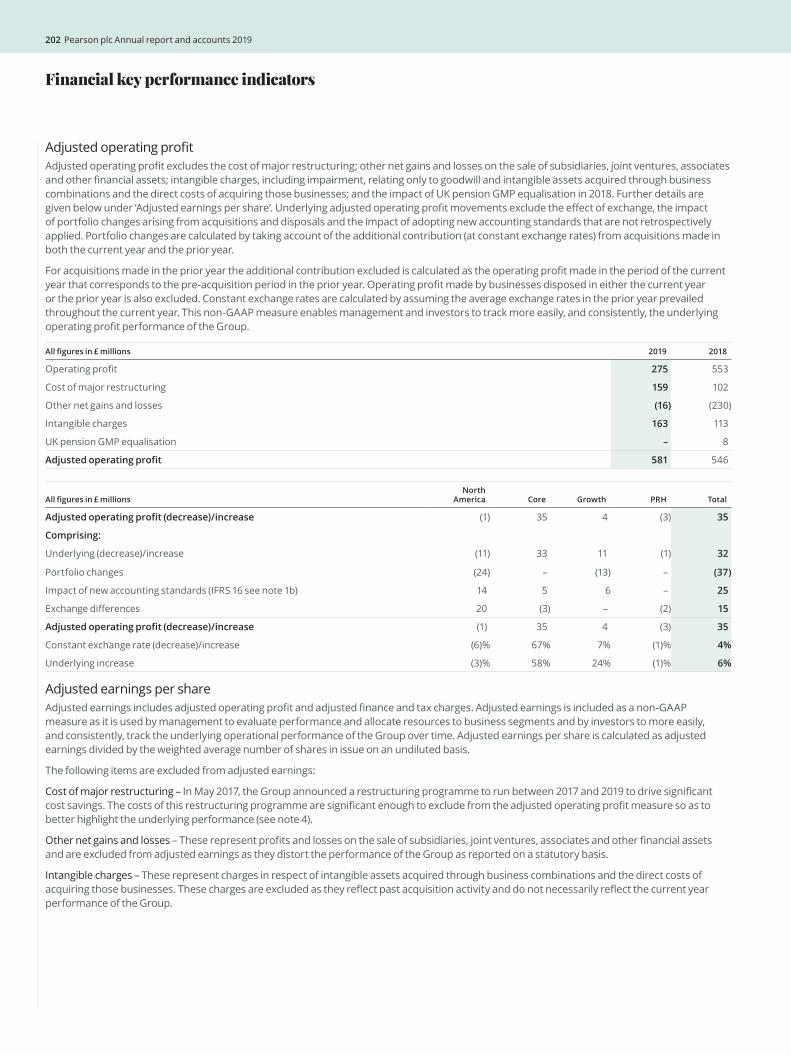
Financial key performance indicators
Adjusted operating profitAdjusted operating profit excludes the cost of major restructuring; other net gains and losses on the sale of subsidiaries, joint ventures, associates and other financial assets; intangible charges, including impairment, relating only to goodwill and intangible assets acquired through business combinations and the direct costs of acquiring those businesses; and the impact of UK pension GMP equalisation in 2018. Further details are given below under ‘Adjusted earnings per share’. Underlying adjusted operating profit movements exclude the effect of exchange, the impact of portfolio changes arising from acquisitions and disposals and the impact of adopting new accounting standards that are not retrospectively applied. Portfolio changes are calculated by taking account of the additional contribution (at constant exchange rates) from acquisitions made in both the current year and the prior year.
For acquisitions made in the prior year the additional contribution excluded is calculated as the operating profit made in the period of the current year that corresponds to the pre-acquisition period in the prior year. Operating profit made by businesses disposed in either the current year or the prior year is also excluded. Constant exchange rates are calculated by assuming the average exchange rates in the prior year prevailed throughout the current year. This non-GAAP measure enables management and investors to track more easily, and consistently, the underlying operating profit performance of the Group.
All figures in £ millions 2019 2018
Operating profit 275 553
Cost of major restructuring 159 102
Other net gains and losses (16) (230)
Intangible charges 163 113
UK pension GMP equalisation – 8
Adjusted operating profit 581 546
All figures in £ millionsNorth
America Core Growth PRH Total
Adjusted operating profit (decrease)/increase (1) 35 4 (3) 35
Comprising:
Underlying (decrease)/increase (11) 33 11 (1) 32
Portfolio changes (24) – (13) – (37)
Impact of new accounting standards (IFRS 16 see note 1b) 14 5 6 – 25
Exchange differences 20 (3) – (2) 15
Adjusted operating profit (decrease)/increase (1) 35 4 (3) 35
Constant exchange rate (decrease)/increase (6)% 67% 7% (1)% 4%
Underlying increase (3)% 58% 24% (1)% 6%
Adjusted earnings per shareAdjusted earnings includes adjusted operating profit and adjusted finance and tax charges. Adjusted earnings is included as a non-GAAP measure as it is used by management to evaluate performance and allocate resources to business segments and by investors to more easily, and consistently, track the underlying operational performance of the Group over time. Adjusted earnings per share is calculated as adjusted earnings divided by the weighted average number of shares in issue on an undiluted basis.
The following items are excluded from adjusted earnings:
Cost of major restructuring – In May 2017, the Group announced a restructuring programme to run between 2017 and 2019 to drive significant cost savings. The costs of this restructuring programme are significant enough to exclude from the adjusted operating profit measure so as to better highlight the underlying performance (see note 4).
Other net gains and losses – These represent profits and losses on the sale of subsidiaries, joint ventures, associates and other financial assets and are excluded from adjusted earnings as they distort the performance of the Group as reported on a statutory basis.
Intangible charges – These represent charges in respect of intangible assets acquired through business combinations and the direct costs of acquiring those businesses. These charges are excluded as they reflect past acquisition activity and do not necessarily reflect the current year performance of the Group.
202 Pearson plc Annual report and accounts 2019
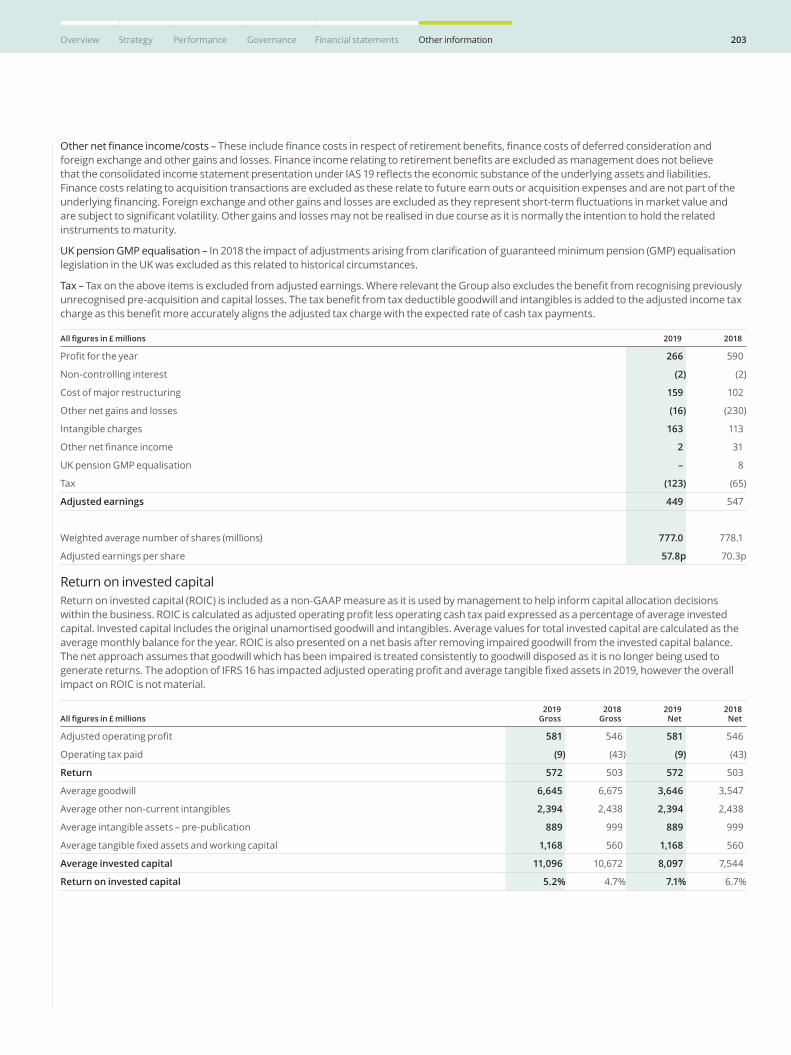
Other net finance income/costs – These include finance costs in respect of retirement benefits, finance costs of deferred consideration and foreign exchange and other gains and losses. Finance income relating to retirement benefits are excluded as management does not believe that the consolidated income statement presentation under IAS 19 reflects the economic substance of the underlying assets and liabilities. Finance costs relating to acquisition transactions are excluded as these relate to future earn outs or acquisition expenses and are not part of the underlying financing. Foreign exchange and other gains and losses are excluded as they represent short-term fluctuations in market value and are subject to significant volatility. Other gains and losses may not be realised in due course as it is normally the intention to hold the related instruments to maturity.
UK pension GMP equalisation – In 2018 the impact of adjustments arising from clarification of guaranteed minimum pension (GMP) equalisation legislation in the UK was excluded as this related to historical circumstances.
Tax – Tax on the above items is excluded from adjusted earnings. Where relevant the Group also excludes the benefit from recognising previously unrecognised pre-acquisition and capital losses. The tax benefit from tax deductible goodwill and intangibles is added to the adjusted income tax charge as this benefit more accurately aligns the adjusted tax charge with the expected rate of cash tax payments.
All figures in £ millions 2019 2018
Profit for the year 266 590
Non-controlling interest (2) (2)
Cost of major restructuring 159 102
Other net gains and losses (16) (230)
Intangible charges 163 113
Other net finance income 2 31
UK pension GMP equalisation – 8
Tax (123) (65)
Adjusted earnings 449 547
Weighted average number of shares (millions) 777.0 778.1
Adjusted earnings per share 57.8p 70.3p
Return on invested capitalReturn on invested capital (ROIC) is included as a non-GAAP measure as it is used by management to help inform capital allocation decisions within the business. ROIC is calculated as adjusted operating profit less operating cash tax paid expressed as a percentage of average invested capital. Invested capital includes the original unamortised goodwill and intangibles. Average values for total invested capital are calculated as the average monthly balance for the year. ROIC is also presented on a net basis after removing impaired goodwill from the invested capital balance. The net approach assumes that goodwill which has been impaired is treated consistently to goodwill disposed as it is no longer being used to generate returns. The adoption of IFRS 16 has impacted adjusted operating profit and average tangible fixed assets in 2019, however the overall impact on ROIC is not material.
All figures in £ millions2019
Gross2018
Gross2019 Net
2018 Net
Adjusted operating profit 581 546 581 546
Operating tax paid (9) (43) (9) (43)
Return 572 503 572 503
Average goodwill 6,645 6,675 3,646 3,547
Average other non-current intangibles 2,394 2,438 2,394 2,438
Average intangible assets – pre-publication 889 999 889 999
Average tangible fixed assets and working capital 1,168 560 1,168 560
Average invested capital 11,096 10,672 8,097 7,544
Return on invested capital 5.2% 4.7% 7.1% 6.7%
203Overview Strategy Performance Governance Financial statements Other information
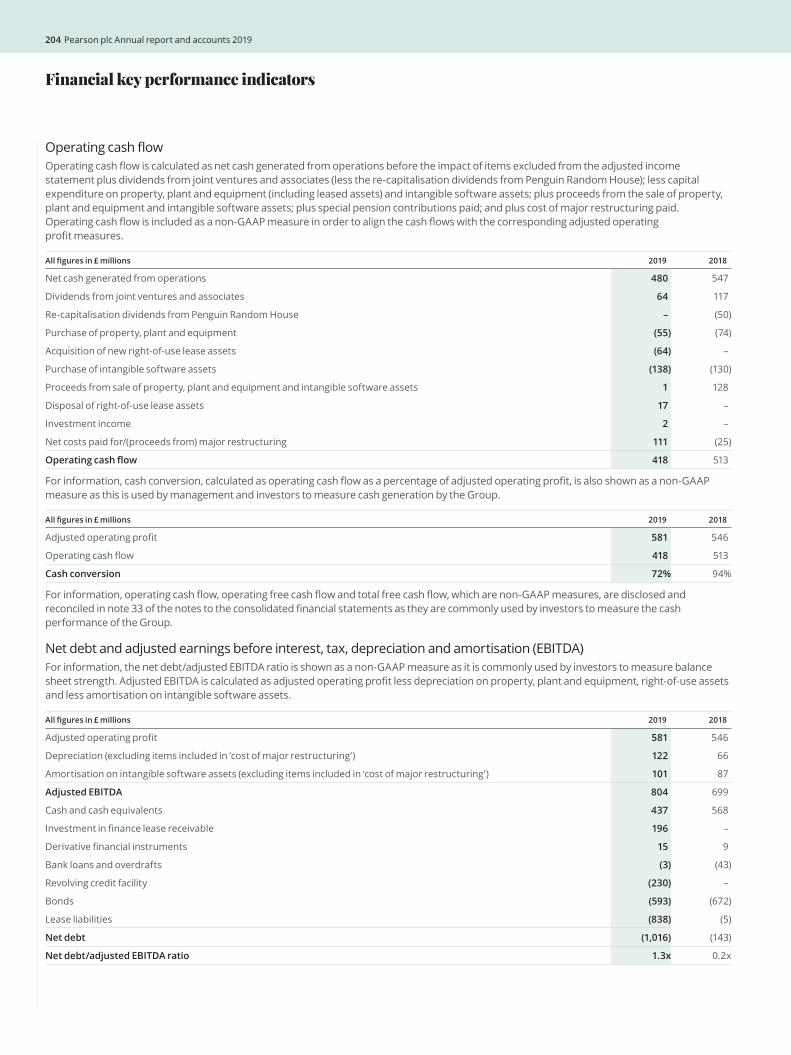
Operating cash flowOperating cash flow is calculated as net cash generated from operations before the impact of items excluded from the adjusted income statement plus dividends from joint ventures and associates (less the re-capitalisation dividends from Penguin Random House); less capital expenditure on property, plant and equipment (including leased assets) and intangible software assets; plus proceeds from the sale of property, plant and equipment and intangible software assets; plus special pension contributions paid; and plus cost of major restructuring paid. Operating cash flow is included as a non-GAAP measure in order to align the cash flows with the corresponding adjusted operating profit measures.
All figures in £ millions 2019 2018
Net cash generated from operations 480 547
Dividends from joint ventures and associates 64 117
Re-capitalisation dividends from Penguin Random House – (50)
Purchase of property, plant and equipment (55) (74)
Acquisition of new right-of-use lease assets (64) –
Purchase of intangible software assets (138) (130)
Proceeds from sale of property, plant and equipment and intangible software assets 1 128
Disposal of right-of-use lease assets 17 –
Investment income 2 –
Net costs paid for/(proceeds from) major restructuring 111 (25)
Operating cash flow 418 513
For information, cash conversion, calculated as operating cash flow as a percentage of adjusted operating profit, is also shown as a non-GAAP measure as this is used by management and investors to measure cash generation by the Group.
All figures in £ millions 2019 2018
Adjusted operating profit 581 546
Operating cash flow 418 513
Cash conversion 72% 94%
For information, operating cash flow, operating free cash flow and total free cash flow, which are non-GAAP measures, are disclosed and reconciled in note 33 of the notes to the consolidated financial statements as they are commonly used by investors to measure the cash performance of the Group.
Net debt and adjusted earnings before interest, tax, depreciation and amortisation (EBITDA)For information, the net debt/adjusted EBITDA ratio is shown as a non-GAAP measure as it is commonly used by investors to measure balance sheet strength. Adjusted EBITDA is calculated as adjusted operating profit less depreciation on property, plant and equipment, right-of-use assets and less amortisation on intangible software assets.
All figures in £ millions 2019 2018
Adjusted operating profit 581 546
Depreciation (excluding items included in ‘cost of major restructuring’) 122 66
Amortisation on intangible software assets (excluding items included in ‘cost of major restructuring’) 101 87
Adjusted EBITDA 804 699
Cash and cash equivalents 437 568
Investment in finance lease receivable 196 –
Derivative financial instruments 15 9
Bank loans and overdrafts (3) (43)
Revolving credit facility (230) –
Bonds (593) (672)
Lease liabilities (838) (5)
Net debt (1,016) (143)
Net debt/adjusted EBITDA ratio 1.3x 0.2x
Financial key performance indicators
204 Pearson plc Annual report and accounts 2019
AcceleratED pathways: a corporate education benefit, where Pearson partners with companies to improve employee development by focusing on the educational needs of a specific business and its people, helping to strategically align educational assistance spending to the talent objectives of the organisation.
ACCUPLACER®/MyFoundationsLab®: this all-in-one diagnostics and intervention programme combines The College Board’s assessment programme with Pearson’s proven online intervention solution. It identifies the areas where a student needs work and then takes a personalised learning path that helps them work on their individual skills deficit. Last year alone, Pearson delivered 9.2M tests on the ACCUPLACER® platform.
Artificial intelligence (AI): describes machines that can sense and interact with environments in a perception-planning-action cycle, or with other machines, without explicit programming. This is typically accomplished through Machine Learning (ML) which is the development, and application of algorithms that improve their performance (inference) at some task based on experience (training). Pearson takes a human-centric perspective of AI that considers the entire learning ecosystem when developing AI capabilities including ethics, privacy, appropriate uses and user needs.
Bug Club: a core reading programme for 4-11 year olds, which has everything needed to deliver the 2014 UK primary curriculum and includes over 590 finely levelled titles, available in print and eBook format and a unique online learning platform with in-built assessment.
BTEC: taught in colleges, schools and university throughout the world, a BTEC gives learners of all levels and ages the knowledge and skills they need for career success, now and into the future. The unique experience BTEC learners get of having to apply the knowledge and skills they’ve learned to real-life scenarios means more employers and learners are choosing BTEC.
BTEC Level 1/Level 2 Firsts: BTEC Firsts allow level 2 learners to develop knowledge and understanding by applying their learning and skills in real-life scenarios. Combined with other qualifications, they enable learners to progress to further study, an apprenticeship, or into employment.
BTEC Level 1/Level 2 Tech Awards: studied alongside GCSE, BTEC Tech Awards provide a great introduction to a professional sector where students learn transferable skills they’ll use if they progress to further study, and in their future career.
BTEC Level 2 Technicals: designed in collaboration with employers and industry professionals, BTEC Level 2 Technicals provide career-focused, applied courses for post-16 level 2 learners in a specialist occupational area. They support progression to an apprenticeship, to further technical study, or into the workplace.
BTEC Level 3 Nationals: allow level 3 learners to apply their learning in real-life scenarios to develop the specialist knowledge and skills they need to progress towards their chosen career path, whether that is through further or higher education, an apprenticeship or directly into the workplace.
BTEC Higher Nationals: available at levels 4 and 5, BTEC Higher Nationals are internationally recognised, career-focused higher education courses which are the same level as the first and second years of a degree course. Co-designed with employers and representing the most up-to-date professional standards, they support learners to develop the real-world knowledge, skills and behaviours needed to succeed, allowing them to move on to complete degree and progress in their chosen career path.
Clinical Assessment: our Clinical Assessment business provides assessments to help professionals improve lives by providing valuable information that can identify and manage an individual learner’s strengths and weaknesses and learning barriers. For example, AimsWeb Plus provides universal screening, benchmarking, and progress monitoring assessments to give educators the reliable data they need to improve students’ maths and reading skills.
The Clinical Assessment portfolio also offers a range of assessments serving a diverse audience of professionals including Psychologists, Speech Language Pathologists, Occupational Therapists and more. These professionals rely on leading measures like the Wechsler Scales of Intelligence, which assess an individual’s cognitive strengths and weaknesses or the Minnesota Multiphasic Personality Inventory (MMPI), a world renowned measure of psychopathology and personality.
Other examples of our Clinical products include:
Behaviour Assessment System for Children: a comprehensive set of rating scales and forms to help children thrive in their school and home environments through effective behaviour assessment. BASC provides a complete picture of child and adolescent behaviour. School and clinical psychologists have depended on BASC for more than 20 years.
Goldman-Fristoe Test of Articulation-Third Edition (GFTA-3): a systematic means of assessing an individual’s ability to pronounce different speech sounds of Standard American English in order to diagnose different disorders which can inhibit an individual’s articulation. It provides information about an individual’s speech sound ability by sampling both spontaneous and imitative sound production in single words and connected speech.
Q-Interactive: a digital system for administering and scoring tests in a one-on-one setting between an examiner and examinee. Testing takes place on two iPads with an app called Assess. The simplicity of the system improves accuracy and speed in providing real-time scoring and allows for greater flexibility.
Connections Academy: The Connections Academy online school programme for grades K-12 is a comprehensive collection of online learning products and school support services for online public schools across the US, most of which carry the Connections Academy name. In addition, International Connections Academy is a private online school for grades K-12 and serves students worldwide.
Digitally–enabled learning: learning that is enabled through digital media, tools or technology.
Edexcel GCSE/A level: AS and A levels – sometimes called General Certificates of Education (GCE) or Advanced levels – are normally studied after level 2 in a BTEC or GCSEs. They mainly involve studying the theory of a subject, combined with some investigative work, and are usually studied full time over two years at school or college. AS and A levels are at level 3 on the National Qualifications Framework.
English Benchmark Young Learners: a motivating English test for young learners aged 6-13, which proves students’ English abilities to parents, monitors learning progress, and ensures teaching targets the right skills. English Benchmark measures students’ speaking, listening, reading, and writing skills, through fun and interactive tablet-based activities, and uses AI-based automated scoring to provide immediate detailed reports for teachers and parents that include students’ strengths, suggestions for improvement, and recommended activities to improve their skills.
ePen: an assessment scoring tool with various features designed for use by a variety of education stakeholders, including Education Agency officials, educators, independent contractors, and Pearson employees.
Glossary of major products and services
205Overview Strategy Performance Governance Financial statements Other information

Pearson ordinary shares are listed on the London Stock Exchange and on the New York Stock Exchange in the form of American Depositary Receipts.
Corporate websiteThe investors’ section of our corporate website www.pearson.com/corporate/investors.html provides a wealth of information for shareholders. It is also possible to sign up to receive email alerts for reports and press releases relating to Pearson at www.pearson.com/ news-and-research/announcements.html
Shareholder information onlineShareholder information can be found on our website www.pearson.com/corporate/investors.html
Our registrar, Equiniti, also provides a range of shareholder information online. You can check your holding and find practical help on transferring shares or updating your details at www.shareview.co.uk. For more information, please contact our registrar, Equiniti, Aspect House, Spencer Road, Lancing, West Sussex, BN99 6DA. Telephone 0371 384 2233* or, for those shareholders with hearing difficulties, textphone number 0371 384 2255*.
Information about the Pearson share priceThe company’s share price can be found on our website at www.pearson.com/corporate/investors.html It also appears in the financial columns of the national press.
2019 dividends
Payment date Amount per share
Interim 13 September 2019 6 pence
Final1 7 May 2020 13.5 pence
1 Subject to approval by shareholders at the Annual General Meeting.
2020 financial calendar
Ex-dividend date 26 March
Record date 27 March
Last date for dividend reinvestment election 16 April
Annual General Meeting 24 April
Payment date for dividend and share purchase date for dividend reinvestment 7 May
Payment of dividends to mandated accountsShould you elect to have your dividends paid through BACS, this can be done directly into a bank or building society account, with the tax voucher sent to the shareholder’s registered address. Equiniti can be contacted for information on 0371 384 2043*.
Dividend reinvestment plan (DRIP)The DRIP gives shareholders the right to buy the company’s shares on the London stock market with their cash dividend. For further information, please contact Equiniti on 0371 384 2268*.
Individual Savings Accounts (ISAs)Equiniti offers ISAs in Pearson shares. For more information, please go to www.shareview.co.uk/dealing or call customer services on 0345 300 0430*.
Share dealing facilitiesEquiniti offers telephone and internet services for dealing in Pearson shares. For further information, please contact their telephone dealing helpline on 03456 037 037* or, for online dealing, log on to www.shareview.co.uk/dealing. You will need your shareholder reference number as shown on your share certificate.
A postal dealing service is also available through Equiniti. Please telephone 0371 384 2248* for details or log on to www.shareview.co.uk to download a form.
* Lines open 8.30 am to 5.30 pm Monday to Friday (excluding UK public holidays).
ShareGiftShareholders with small holdings of shares, whose value makes them uneconomic to sell, may wish to donate them to ShareGift, the share donation charity (registered charity number 1052686). Further information about ShareGift and the charities it has supported may be obtained from their website, www.ShareGift.org, or by contacting them at ShareGift, PO Box 72253, London, SW1P 9LQ.
American Depositary Receipts (ADRs)Pearson’s ADRs are listed on the New York Stock Exchange and traded under the symbol PSO. Each ADR represents one ordinary share. For enquiries regarding registered ADR holder accounts and dividends, please contact Bank of New York Mellon, Shareholder Correspondence (ADR), PO Box 505000, Louisville, KY 40233-5000, telephone 1 (866) 259 2289 (toll free within the US) or 001 201 680 6825 (outside the US). Alternatively, you may email [email protected]
Voting rights for registered ADR holders can be exercised through Bank of New York Mellon, and for beneficial ADR holders (and/or nominee accounts) through your US brokerage institution. Pearson will file with the Securities and Exchange Commission a Form 20-F.
Share register fraud: protecting your investmentPearson does not contact its shareholders directly to provide recommendations or investment advice and neither does it appoint third parties to do so. As required by law, our shareholder register is available for public inspection but we cannot control the use of information obtained by persons inspecting the register. Please treat any approaches purporting to originate from Pearson with caution.
For more information, please log on to our website at www.pearson.com/corporate/investors/share-management/share-register-fraud.html
Tips on protecting your shares Keep any documentation that contains your shareholder reference number in a safe place and shred any unwanted documentation
Inform our registrar, Equiniti, promptly when you change address
Be aware of dividend payment dates and contact the registrar if you do not receive your dividend cheque or, better still, make arrangements to have the dividend paid directly into your bank account
Consider holding your shares electronically in a CREST account via a nominee.
Shareholder information
208 Pearson plc Annual report and accounts 2019
Remote proctoring: in our Pearson VUE business, remote proctoring is when a proctor and a test-taker are not physically located in the same room. In most cases, the person takes their entire exam on a computer while the proctor watches through an online video camera. “Remote proctoring” is often synonymous with “online proctoring”. Pearson VUE’s online proctoring solution is called OnVUE.
Revel: replaces traditional texts with an engaging learning experience that prepares students for class. It presents an affordable, seamless blend of author-created digital text, media, and assessment based on learning science. Students can read, practice, and study anywhere, anytime, and on any device. With assignment and tracking tools, Revel also allows instructors to gauge student understanding and engagement with the material inside and outside the classroom, empowering them to spend class time on meaningful instruction. For example, each additional five hours a student spent on Revel Psychology readings was associated with an increase of 2.19 (±1.10) percentage points on unit exams.
Sistemas: a complete package of products and services for private and public K12 schools in Brazil. With a single price per student, we provide courseware, educational assistance, professional development, management consulting, and marketing support, as well as digital content.
Smarthinking: expert online tutoring and writing review that gives students 24x7 access to academic help from live professional educators and uses a proven, problem-solving approach to help students learn, gain confidence, and handle future assignments on their own. Complementing Pearson content and technology solutions, Smarthinking’s human delivered services have 30 years of experience improving student performance, course persistence, and overall retention. Karen Reilly, Campus Dean of Learning Support at Valencia College, said that “The results of our analysis show that Smarthinking is an important component in our overall academic support programme; it is essential that students have access to tutoring assistance after hours and on weekends – whenever a learning moment is happening.”
Speak Out: part of our English Language Teaching product portfolio, Speak Out is an English language course that includes video content from the BBC to engage students and make teaching easier by exposing students to a wide array of words and accents, familiarising students with English as it is spoken. By watching many such videos, students learn proper pronunciation, expand their vocabulary bank and reinforce their English-language confidence.
TestNav: an innovative online test delivery platform that is part of Pearson’s comprehensive assessment solution. TestNav delivers millions of secure, high-stakes state and national tests in K12 schools every year. Secure, scalable, and reliable, TestNav provides engaging and interactive testing to students who learn and play in a digital environment.
The Enabling Programme (TEP): one of Pearson’s largest business transformation projects. Its aim is to make us a simpler organisation, with globally consistent ways of working across HR, finance, procurement, supply chain, and rights and royalties.
Top Notch: part of our English Language Teaching product portfolio, Top Notch is a communicative English course that prepares students to communicate in English with an emphasis on cultural fluency that enables students to navigate the social, travel and business situations that they will encounter in their lives. Top Notch makes English unforgettable through the right input of language, intensive practice, and systematic recycling using a diverse array of speakers around the world who have a wide range of native and non-native accents.
Wiz.me: an English language learning app within Wizard schools that gives students the opportunity to continue to learn and practice their skills outside the classroom.
Wizard: a franchise of language-learning schools that offers eight different language courses and uses the international certification, TOEIC, as a teaching mode. TOEIC is the Test of English for International Communication (TOEIC®), an examination for international communication, which measures the English proficiency of a foreigner in everyday situations, and especially in situations related to the job market.
In the US Higher Education landscape, we partner and provide products and services to a diverse array of educational institutions including:
Community College: sometimes called junior colleges, are two-year schools that provide affordable postsecondary education as a pathway to a four-year degree.
Private Not For Profit: a private foundation that is engaged in social or public benefit activities and is registered as such with the IRS. It derives its revenue from a small group of donors without any intention of earning income for its owners. All the profits and donations of a not-for-profit organisation are used in operating the organisation as per its objectives (i.e., charity or public service).
4 Year Public Universities: a university offering a Bachelor’s degree that is predominantly funded by public means through a national or subnational government, as opposed to private universities.
For-Profit Universities: a university that is owned and run by a private organisation or corporation.
US School Assessment Business: helps young children and students reach their educational aspirations through meaningful feedback. Testing plays an integral role in determining educator and student success, and we are the largest provider of educational assessment services in the US. We partner with departments of education and educators to develop customised, effective, and scalable assessments that measure 21st century skills and inform instruction throughout the school year. We also partner with test providers to deliver their paper and/or online assessments. Examples of the tests we support include:
SAT: an entrance exam used by most colleges and universities to make admissions decisions. It is a multiple-choice, pencil-and-paper test with the purpose to measure a high school student’s readiness for college, and provide colleges with one common data point that can be used to compare all applicants.
National Assessment of Educational Progress (NAEP): The National Assessment of Educational Progress (NAEP) is the largest nationally representative and continuing assessment of what America’s students know and can do in various subject areas.
ACT: The ACT® test is the nation’s most popular college entrance exam accepted and valued by all universities and colleges in the US.
207Overview Strategy Performance Governance Financial statements Other information
Pearson ordinary shares are listed on the London Stock Exchange and on the New York Stock Exchange in the form of American Depositary Receipts.
Corporate websiteThe investors’ section of our corporate website www.pearson.com/corporate/investors.html provides a wealth of information for shareholders. It is also possible to sign up to receive email alerts for reports and press releases relating to Pearson at www.pearson.com/ news-and-research/announcements.html
Shareholder information onlineShareholder information can be found on our website www.pearson.com/corporate/investors.html
Our registrar, Equiniti, also provides a range of shareholder information online. You can check your holding and find practical help on transferring shares or updating your details at www.shareview.co.uk. For more information, please contact our registrar, Equiniti, Aspect House, Spencer Road, Lancing, West Sussex, BN99 6DA. Telephone 0371 384 2233* or, for those shareholders with hearing difficulties, textphone number 0371 384 2255*.
Information about the Pearson share priceThe company’s share price can be found on our website at www.pearson.com/corporate/investors.html It also appears in the financial columns of the national press.
2019 dividends
Payment date Amount per share
Interim 13 September 2019 6 pence
Final1 7 May 2020 13.5 pence
1 Subject to approval by shareholders at the Annual General Meeting.
2020 financial calendar
Ex-dividend date 26 March
Record date 27 March
Last date for dividend reinvestment election 16 April
Annual General Meeting 24 April
Payment date for dividend and share purchase date for dividend reinvestment 7 May
Payment of dividends to mandated accountsShould you elect to have your dividends paid through BACS, this can be done directly into a bank or building society account, with the tax voucher sent to the shareholder’s registered address. Equiniti can be contacted for information on 0371 384 2043*.
Dividend reinvestment plan (DRIP)The DRIP gives shareholders the right to buy the company’s shares on the London stock market with their cash dividend. For further information, please contact Equiniti on 0371 384 2268*.
Individual Savings Accounts (ISAs)Equiniti offers ISAs in Pearson shares. For more information, please go to www.shareview.co.uk/dealing or call customer services on 0345 300 0430*.
Share dealing facilitiesEquiniti offers telephone and internet services for dealing in Pearson shares. For further information, please contact their telephone dealing helpline on 03456 037 037* or, for online dealing, log on to www.shareview.co.uk/dealing. You will need your shareholder reference number as shown on your share certificate.
A postal dealing service is also available through Equiniti. Please telephone 0371 384 2248* for details or log on to www.shareview.co.uk to download a form.
* Lines open 8.30 am to 5.30 pm Monday to Friday (excluding UK public holidays).
ShareGiftShareholders with small holdings of shares, whose value makes them uneconomic to sell, may wish to donate them to ShareGift, the share donation charity (registered charity number 1052686). Further information about ShareGift and the charities it has supported may be obtained from their website, www.ShareGift.org, or by contacting them at ShareGift, PO Box 72253, London, SW1P 9LQ.
American Depositary Receipts (ADRs)Pearson’s ADRs are listed on the New York Stock Exchange and traded under the symbol PSO. Each ADR represents one ordinary share. For enquiries regarding registered ADR holder accounts and dividends, please contact Bank of New York Mellon, Shareholder Correspondence (ADR), PO Box 505000, Louisville, KY 40233-5000, telephone 1 (866) 259 2289 (toll free within the US) or 001 201 680 6825 (outside the US). Alternatively, you may email [email protected]
Voting rights for registered ADR holders can be exercised through Bank of New York Mellon, and for beneficial ADR holders (and/or nominee accounts) through your US brokerage institution. Pearson will file with the Securities and Exchange Commission a Form 20-F.
Share register fraud: protecting your investmentPearson does not contact its shareholders directly to provide recommendations or investment advice and neither does it appoint third parties to do so. As required by law, our shareholder register is available for public inspection but we cannot control the use of information obtained by persons inspecting the register. Please treat any approaches purporting to originate from Pearson with caution.
For more information, please log on to our website at www.pearson.com/corporate/investors/share-management/share-register-fraud.html
Tips on protecting your shares Keep any documentation that contains your shareholder reference number in a safe place and shred any unwanted documentation
Inform our registrar, Equiniti, promptly when you change address
Be aware of dividend payment dates and contact the registrar if you do not receive your dividend cheque or, better still, make arrangements to have the dividend paid directly into your bank account
Consider holding your shares electronically in a CREST account via a nominee.
Shareholder information
208 Pearson plc Annual report and accounts 2019
Reliance on this document The intention of this document is to provide information to shareholders and is not designed to be relied upon by any other party or for any other purpose.
Forward-looking statements This document includes forward-looking statements concerning Pearson’s financial condition, business and operations and its strategy, plans and objectives. In particular, all statements that express forecasts, expectations and projections, including trends in results of operations, margins, growth rates, overall market trends, the impact of interest or exchange rates, the availability of financing, anticipated cost savings and synergies and the execution of Pearson’s strategy, are forward-looking statements.
By their nature, forward-looking statements involve known and unknown risks and uncertainties because they relate to events and depend on circumstances that may occur in the future. They are based on numerous expectations, assumptions and beliefs regarding Pearson’s present and future business strategies and the environment in which it will operate in the future. There are various factors which could cause Pearson’s actual financial condition, results and development to differ materially from the plans, goals, objectives and expectations expressed or implied by these forward-looking statements, many of which are outside Pearson’s control. These include international, national and local conditions, as well as the impact of competition. They also include other risks detailed from time to time in Pearson’s publicly-filed documents and, in particular, the risk factors set out in this document, which you are advised to read. Any forward-looking statements speak only as of the date they are made and, except as required by law, Pearson gives no undertaking to update any forward-looking statements in this document whether as a result of new information, future developments, changes in its expectations or otherwise. Readers are cautioned not to place undue reliance on such forward-looking statements.
Designed and produced by Friend www.friendstudio.com Print: Pureprint Group
As part of its offsetting commitments Pearson has offset the carbon dioxide generated by the production of this report and associated documents.
This report has been printed on Edixion Challenger Offset which is FSC® certified and made from 100% Elemental Chlorine Free (ECF) pulp. The mill and the printer are both certified to ISO 14001 environmental management system. The report was printed using vegetable-based inks by a CarbonNeutral® printer.
Principal offices
80 Strand, London WC2R 0RL, UK T +44 (0)20 7010 2000 F +44 (0)20 7010 6060
221 River Street, Hoboken, NJ 07030, USA T +1 201 236 7000
Pearson plcRegistered number 53723 (England)
www.pearson.com
@pearson

A SSESSMENTS
C R E A T I V I T Y
SUSTAINABILITY
L E A D E R S H I P
PERSONALISED
ON
LIN
E
PROGRESS
CA
RE
ER
S
PERSONALISED
L E A R N I N G
C R I T I C A L
D I G I T A L
L E A D E R S H I P
T H I N K I N G
GROWTH CON
TEN
TEF
FICA
CY
SKILLS
CAREERS
L E A R N E R S
E F F I C A C YL E A D E R S H I P
E X P E R I E N T I A L
CR
ITIC
AL
TH
INK
ING
EFFIC AC Y
P R O G R E S S
T A L E N T
L E A R N E R S
O U T C O M E S
E C O N O M Y
EXPERIENTIAL
P R O G R E S S
T H I N K I N GC R I T I C A L
EFFICAC
Y
UNIQUE
CONTENT
DIGITALLEAR
NIN
G
TALENT
SOF TSKILLS
SUSTAINABILIT YPERSONALISED DIGITAL COLLABORATION TALENT
CON
TEN
T
TALENT ECONOMY SKILLS LIFELONG LEARNING
PERSON
ALISED D
IGITAL CO
LLABOR
ATION
L E A R N I N GEXPERIENTIAL
D I G I T A L
C R E A T I V I T YL E A R N I N G
O U T C O M E S
COM
MU
NIC
ATIO
NSU
STA
INA
BIL
ITY
C O L L A B O R A T I O N
COLL
AB
OR
ATIO
N
EXPERIENTIAL LEARNING
P E R S O N A L I S E D
C R I T I C A L
SUSTAINABILITY
LIF
EL
ON
G
T H I N K I N G
A S S E S S M E N T S
LE
AR
NIN
G
PROG R E S S
L E A D E R S H I P
CA
RE
ER
S
CR
EA
TIV
ITY
L E A R N I N G
COLLABORATION
GROWTH DIGITAL
U N I Q U ECAREERS
LIFE
LON
G L
EARN
ING
D I G I T A LLEARNERS
SK
ILL
S
TALEN
T ECON
OM
Y LIFELON
G LEA
RNIN
G
COMMUNIC ATION
CO L L A B O R AT I O NS U S TA I N A B I L I T YO U T C O M E S
P E R S O N A L I S E D
L E A R N I N GO N L I N E
SKILLS
UNIQUE
C R E A T I V I T Y
L E A R N E R S
E F F I C A C Y
L E A D E R S H I P
E X PERIENTI A L
S U S TA I N A B I L I T YCO L L A B O R AT I O N
D I G I TA LPROGRESS
SUSTA
INA
BILITY
CAREERS
THE TALEN
T ECON
OM
YO N L I N E
EFFICACY