SIZE-PHYTOMASS ALLOMETRY IN SOME HALOPHYTIC OR SALT TOLERANT SPECIES OF KARACHI COAST, PAKISTAN
14
INT. J. BIOL. BIOTECH., 7(3): 325-338, 2010. SIZE-PHYTOMASS ALLOMETRY IN SOME HALOPHYTIC OR SALT TOLERANT SPECIES OF KARACHI COAST, PAKISTAN D. Khan 1 , S. Shahid Shaukat 2 and M. Javed Zaki 3 1 Department of Botany, Government National College, Karachi, Pakistan. 2 Institute of Environmental studies, University of Karachi, Karachi-75270, Pakistan. 3 Department of Botany, University of Karachi, Karachi-75270, Pakistan. ABSTRACT Allometric equations were developed to estimate aboveground dry phytomass (AGDP) in some coastal herbaceous halophytic species of Karachi viz. Atriplex griffithii Moq. Cressa cretica L., Phragmites karka (Retz.) Trin ex Steud., Limonium stocksii (Boiss.) O. Ktze, and Urochondra setulosa (Trin.) C.E. Hubb. Best fit least square regression models were developed using height and crown diameter to estimate AGDP of individual plants. In case of P. karka, culm height, culm basal diameter or culm volume were employed to estimate phytomass of an individual culm. The crown diameter was generally better predictor of phytomass than height. The inclusion of parameter of height as an independent variable along with crown diameter could not improve the estimation of phytomass significantly except in case of P. karka where substantial improvement in estimation of culm mass was recorded (24.3%) when height was included along with culm diameter in a natural log-log model of multiple correlation and regression. Quadratic (curvilinear) relationships between phytomass and crown diameter were significant in all plants. The quadratic equations were more or less as equally statistically efficient as multiple regression models in estimating phytomass in Atriplex, Cressa and Limonium. Culm phytomass in Phragmites and AGDP in Urochondra setulosa were, however, better estimated by multiple regression models with natural log-log transformed variables. Key Words: Size-phytomass allometry, herbaceous species, coastal halophytes of Pakistan. INTRODUCTION The application of destructive technique for estimating biomass is expensive and not generally appreciated for its negative effects on biota. In non-destructive procedures for estimating standing biomass and its change over time, regression analysis relating biomass to various structural dimensions of plants provide a viable alternative (Martin et. al, 1982). Although many regression equations have been worked out by many authors with trees (Roussopoulos and Loomis (1979), Crow (1983), Monk et. al. (1970), Pastor et al., (1984), Schreuder and Swank (1971), Swank and Schreuder (1974), Whittaker and Woodwell (1968); Young (1976), Khan et. al .(1983), Fownes and Harrington (1991), Mette et. al. (2003), Niklas et. al., (2003), Fentu (2005), Pokorný and Tomášková (2007), Litton and Kaufman. (2008), Ghazehei et. al (2009), Tanaka et. al. (2009), only few published reports are available for herbaceous plants (Elliot and Clinton, 1993). Such studies are useful in predicting carrying capacities of various vegetation types based on browse estimate (Grigel and Moddy, 1980; Ohmann et. al., 1981), in determining maximum level of production of herbs, shrubs and trees (Martin, 1979) in an ecosystem, and in estimating the fuel wood availability (Roussopoulos and Loomis, 1979; Hierro, et. al, 2000; Zianis and Mencuccini, 2003; Ghazehei et. al., 2009; Tanaka et. al., 2009). The present investigation was undertaken to develop relevant equations with respect to size-biomass relationship in case of some halophytic or salt tolerant herbaceous species of Pakistan coast viz. Atriplex griffithii Moq. Cressa cretica L., Limonium stocksii (Boiss.) O. Ktze, and Urochondra setulosa (Trin.) C.E. Hubb. and a tree grass, Phragmites karka (Retz.) Trin ex Steud. as a preliminary to the so imperative but the virgin area of investigations in Pakistan. MATERIALS AND METHODS The aim of our studies was to predict the biomass of individual plant from easily measured variables such as plant height and/or canopy diameter. For parameterization, a sizeable number of plants of wide ranges of sizes (Table 1) of selected species from their respective populations around Karachi were randomly harvested at the ground level and prior to their harvest their heights and crown diameters were measured. All the sites were differentially salinity-affected, mostly sandy and basic in reaction. Crown diameters were measured by taking two perpendicular measurements through the centre of each plant. The plant material was dried at 70 o C for 72 hours and then weighed. Phragmitis karka is a perennial reed with long creeping rhizomes and culms. Culms of this species
-
Upload
independent -
Category
Documents
-
view
0 -
download
0
Transcript of SIZE-PHYTOMASS ALLOMETRY IN SOME HALOPHYTIC OR SALT TOLERANT SPECIES OF KARACHI COAST, PAKISTAN

INT. J. BIOL. BIOTECH., 7(3): 325-338, 2010.
SIZE-PHYTOMASS ALLOMETRY IN SOME HALOPHYTIC OR SALT TOLERANT
SPECIES OF KARACHI COAST, PAKISTAN
D. Khan
1, S. Shahid Shaukat
2 and M. Javed Zaki
3
1Department of Botany, Government National College, Karachi, Pakistan.
2Institute of Environmental studies, University of Karachi, Karachi-75270, Pakistan.
3Department of Botany, University of Karachi, Karachi-75270, Pakistan.
ABSTRACT
Allometric equations were developed to estimate aboveground dry phytomass (AGDP) in some coastal herbaceous
halophytic species of Karachi viz. Atriplex griffithii Moq. Cressa cretica L., Phragmites karka (Retz.) Trin ex Steud.,
Limonium stocksii (Boiss.) O. Ktze, and Urochondra setulosa (Trin.) C.E. Hubb. Best fit least square regression models
were developed using height and crown diameter to estimate AGDP of individual plants. In case of P. karka, culm
height, culm basal diameter or culm volume were employed to estimate phytomass of an individual culm.
The crown diameter was generally better predictor of phytomass than height. The inclusion of parameter of height as an
independent variable along with crown diameter could not improve the estimation of phytomass significantly except in
case of P. karka where substantial improvement in estimation of culm mass was recorded (24.3%) when height was
included along with culm diameter in a natural log-log model of multiple correlation and regression. Quadratic
(curvilinear) relationships between phytomass and crown diameter were significant in all plants. The quadratic
equations were more or less as equally statistically efficient as multiple regression models in estimating phytomass in
Atriplex, Cressa and Limonium. Culm phytomass in Phragmites and AGDP in Urochondra setulosa were, however,
better estimated by multiple regression models with natural log-log transformed variables.
Key Words: Size-phytomass allometry, herbaceous species, coastal halophytes of Pakistan.
INTRODUCTION
The application of destructive technique for estimating biomass is expensive and not generally appreciated for
its negative effects on biota. In non-destructive procedures for estimating standing biomass and its change over time,
regression analysis relating biomass to various structural dimensions of plants provide a viable alternative (Martin
et. al, 1982). Although many regression equations have been worked out by many authors with trees (Roussopoulos
and Loomis (1979), Crow (1983), Monk et. al. (1970), Pastor et al., (1984), Schreuder and Swank (1971), Swank
and Schreuder (1974), Whittaker and Woodwell (1968); Young (1976), Khan et. al .(1983), Fownes and Harrington
(1991), Mette et. al. (2003), Niklas et. al., (2003), Fentu (2005), Pokorný and Tomášková (2007), Litton and
Kaufman. (2008), Ghazehei et. al (2009), Tanaka et. al. (2009), only few published reports are available for
herbaceous plants (Elliot and Clinton, 1993). Such studies are useful in predicting carrying capacities of various
vegetation types based on browse estimate (Grigel and Moddy, 1980; Ohmann et. al., 1981), in determining
maximum level of production of herbs, shrubs and trees (Martin, 1979) in an ecosystem, and in estimating the fuel
wood availability (Roussopoulos and Loomis, 1979; Hierro, et. al, 2000; Zianis and Mencuccini, 2003; Ghazehei et.
al., 2009; Tanaka et. al., 2009). The present investigation was undertaken to develop relevant equations with respect
to size-biomass relationship in case of some halophytic or salt tolerant herbaceous species of Pakistan coast viz.
Atriplex griffithii Moq. Cressa cretica L., Limonium stocksii (Boiss.) O. Ktze, and Urochondra setulosa (Trin.) C.E.
Hubb. and a tree grass, Phragmites karka (Retz.) Trin ex Steud. as a preliminary to the so imperative but the virgin
area of investigations in Pakistan.
MATERIALS AND METHODS
The aim of our studies was to predict the biomass of individual plant from easily measured variables such as
plant height and/or canopy diameter. For parameterization, a sizeable number of plants of wide ranges of sizes
(Table 1) of selected species from their respective populations around Karachi were randomly harvested at the
ground level and prior to their harvest their heights and crown diameters were measured. All the sites were
differentially salinity-affected, mostly sandy and basic in reaction. Crown diameters were measured by taking two
perpendicular measurements through the centre of each plant. The plant material was dried at 70oC for 72 hours and
then weighed. Phragmitis karka is a perennial reed with long creeping rhizomes and culms. Culms of this species
D. KHAN ET AL.,
INTERNATIONAL JOURNAL OF BIOLOGY AND BIOTECHNOLOGY 7(3): 325-338, 2010.
326
were randomly selected and measured for their height and culm diameter at the base. The volume of the erect culm
was determined as conic area: 2h/3, where r, the radius of the culm at the base and h, the height of the culm
including panicle (if any). Several statistical models were tested to predict aboveground biomass of the plant. The
selection of the best regression model was based on examining p value and comparison of the coefficients of
determination (R2), values of F and relative standard errors (Elliot and Clinton, 1993).
RESULTS AND DISCUSSION
The plants of wide ranges of sizes of the selected species were included in the sampling for parameterization
(Table 1). The least square methods of correlation and regression were applied to the raw data of aboveground
phytomass of various species (untransformed) as dependent parameter and their height and crown diameter values as
independent parameters (untransformed). Such equations were although statistically significant but suffered from
usually low values of adjusted R2, and high values of Standard errors of regression (Table 2 - 6).
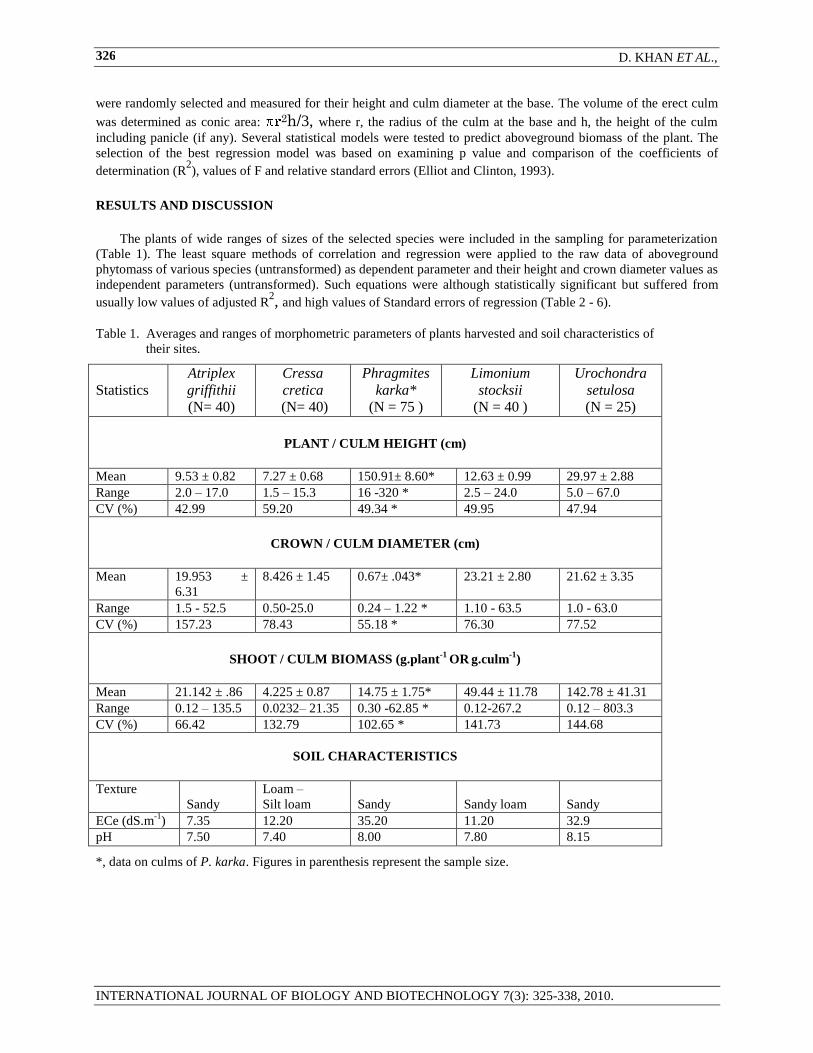
Table 1. Averages and ranges of morphometric parameters of plants harvested and soil characteristics of
their sites.
Statistics
Atriplex
griffithii
(N= 40)
Cressa
cretica
(N= 40)
Phragmites
karka*
(N = 75 )
Limonium
stocksii
(N = 40 )
Urochondra
setulosa
(N = 25)
PLANT / CULM HEIGHT (cm)
Mean 9.53 ± 0.82 7.27 ± 0.68 150.91± 8.60* 12.63 ± 0.99 29.97 ± 2.88
Range 2.0 – 17.0 1.5 – 15.3 16 -320 * 2.5 – 24.0 5.0 – 67.0
CV (%) 42.99 59.20 49.34 * 49.95 47.94
CROWN / CULM DIAMETER (cm)
Mean 19.953 ±
6.31
8.426 ± 1.45 0.67± .043* 23.21 ± 2.80 21.62 ± 3.35
Range 1.5 - 52.5 0.50-25.0 0.24 – 1.22 * 1.10 - 63.5 1.0 - 63.0
CV (%) 157.23 78.43 55.18 * 76.30 77.52
SHOOT / CULM BIOMASS (g.plant
-1 OR
g.culm
-1)
Mean 21.142 ± .86 4.225 ± 0.87 14.75 ± 1.75* 49.44 ± 11.78 142.78 ± 41.31
Range 0.12 – 135.5 0.0232– 21.35 0.30 -62.85 * 0.12-267.2 0.12 – 803.3
CV (%) 66.42 132.79 102.65 * 141.73 144.68
SOIL CHARACTERISTICS
Texture
Sandy
Loam –
Silt loam
Sandy
Sandy loam
Sandy
ECe (dS.m-1
) 7.35 12.20 35.20 11.20 32.9
pH 7.50 7.40 8.00 7.80 8.15
*, data on culms of P. karka. Figures in parenthesis represent the sample size.

SIZE-PHYTOMASS ALLOMETRY IN SOME HALOPHYTIC PLANTS
INTERNATIONAL JOURNAL OF BIOLOGY AND BIOTECHNOLOGY 7(3): 325-338, 2010.
327
Table 2.Correlation and regression analyses between biomass (B, g per plant) and morphometric parameters such as
height (H, cm), and crown diameter (CD, cm) of Atriplex griffithii in coastal sand bars of Hawkes Bay, Karachi.
Parameters
(Y / X)
a b r2 Adj. r
2 F p SE
Y = a + bX ± SE (N= 40)
B / H - 29.025
t = 3.195
p < 0.003
5.3138
t = 6.05
p < 0.001
0.4909
0.4275
36.63
0.001
22.451
B / CD - 16.394
t= 4.171
p< 0.001
1.9228
t = 11.882
p < 0.001
0.7881
0.7826
141.352
0.001
14.483
B / loge H - 56.731
t = 3.289
p< 0.002
36.562
t = 4.67
p < 0.001
0.3643
0.3476
21.776
0.001
25.09
B/loge CD - 31.620
t = 3.097
p< 0.004
21.457
T = 5.593
p < 0.001
0.4516
0.4371
31.29
0.001
23.301
log B/ H - 1.935
t = 3.980
p< 0.001
0.3875
t= 8.242
p < 0.001
0.6412
0.6319
67.925
0.001
1.203
Loge B/ CD - 0.79783
t= 4.149
p < 0.001
0.12930
t= 16.334
p < 0.001
0.8753
0,8720
266.81
0.001
0.7089
Loge B / loge H -4.827
t = 5.766
p < 0.001
3.0733
t = 8.081
p < 0.001
0.6322
0.6225
65.31
0.001
1.218
Loge B / loge CD - 3.1336
t = 14.17
p< 0.001
1.880
t = 23.713
p < 0.001
0.9367
0.9304
562.312
0.001
0.5051
Y = a +b1 X1 + b2 X2 ± SE
Parameters a b1 b2 r2 Adj. r
2 F p SE
B / H & CD -17.204
t=2.793
p< 0.001
0.15787
t=0.1722
p < 0.864
1.8876
t=7.2099
p < 0.001
0.7883
0.7769
68.89
0.001
14.671
B /loge H & loge CD - 46.616
t= 2.848
p< 0.001
13.116
t=1.168
p < 0.250
15.421
t=2.733
p< 0.010
0.4711
0.4425
16.475
0.001
23.191
loge B / loge H &
loge CD
- 3.7236
t = 10.96
p < 0.001
0.51604
t= 2.22
p < 0.033
1.6819
t= 14.4
p< 0.001
0.9441
0.9411
312.55
0.001
0.4809
Note: Given in bold are the best fit equations.

D. KHAN ET AL.,
INTERNATIONAL JOURNAL OF BIOLOGY AND BIOTECHNOLOGY 7(3): 325-338, 2010.
328
Table 3. Correlation and regression analyses between biomass (B, g per plant) and morphometric parameters such as
height (H, cm), and crown diameter (CD, cm) of Cressa cretica in coastal sandy saline plain of Korangi, Karachi.
Parameters
(Y / X)
a b r2 Adj. r
2 F P SE
Y = a + bX ± SE
B / H -3.40
t= -3.20
p < 003
1.048
t = 8.31
P <0.001
0.645
0.636
69.04
0.001
3.389
B / CD -2.506
t = -4.97
p< 0.001
0.786
t = 16.85
P < 0.001
0.882
0.879
283.9
0.001
1.954
B / loge H -5.598
t = -3.293
p < 0.001
5.558
t = 6.221
p < 0.001
0.505
0.492
38.70
0.001
4.000
B/loge CD -2.227
t = -1.925
p < 0.001
3.787
t = 6.576
P < 0.001
0.530
0.520
43.42
0.001
3.891
log B/ H -3.382
t = -11.79
p < 0.001
0.467
t = 13.70
p < 0.001
0.832
0.827
187.66
0.001
0.916
Loge B/ CD -2.517
t= - 10.04
p < 0.001
0.300
t = 12.75
p < 0.001
0.811
0.806
162.57
.001
0.971
Loge B / loge H -3.171
t = -18.62
p < 0.001
1.976
t= 24.85
p < 0.001
0.914
0.912
404.1
0.001
0.6542
Loge B / loge CD -3.352
t = -20.98
p < 0.001
1.976
t = 24.85
p < 0.001
0.942
0.941
617.7
0.001
0.537
Y = a +b1 X1 + b2 X2 ± SE
Parameters a b1 b2 r2 Adj. r
2 F P SE
B / H & CD -1.262
t = 2.17
p< 0.001
-0.565
t = 3.36
p < 0.001
1.137
t= 10.40
p< 0.001
0.910
0.905
186.12
0.001
1.733
B /loge H &
loge CD
-2.833
t = -1.14
p <
0.261
0.891
t = 0.287
p < 0.784
3.219
t = 1.51
p <
0.140
.533
0.508
21.13
0.001
3.939
loge B / loge H &
loge CD
-3.977
t=-12.32
p< 0.001
0.919
t= 2.20
p < 0.001
1.389
t = 5.00
p< 0.001
0.949
0.946
342.34
0.001
0.512
Note: Given in bold are the best fit equations.

SIZE-PHYTOMASS ALLOMETRY IN SOME HALOPHYTIC PLANTS
INTERNATIONAL JOURNAL OF BIOLOGY AND BIOTECHNOLOGY 7(3): 325-338, 2010.
329
Table 4.Correlation and regression analyses between biomass (B, g per plant) and morphometric parameters such as
height (H, cm), and crown diameter (CD, cm) of Limonium stocksii in coastal halo-xeric plains of Hawkes Bay,
Karachi.
Parameters
(Y / X)
a b r2 Adj. r
2 F P SE
Y = a + bX ± SE
B / H - 60. 323
t=3.82
p < 0.001
8.689
t = 7.75
p < 0.001
0.6123
0.6021
60.01
0.001
44.20
B / CD - 34.968
t = 4.76
p < 0.001
3.637
t = 14.39
p< 0.001
0.8450
.8409
207.2
0.001
27.94
B / loge H -138.63
t= 3.99
P = 0.001
78.791
t = 5.75
P < 0.001
0.4498
0.4354
31.07
0.001
52.64
B/loge CD -64.251
t = 2.92
p < 006
41.942
t = 5.59
p < 0.001
0.4511
0.4366
31.23
0.001
52.58
loge B/ H - 1.609
t = 4.43
p < 0.001
0.3219
t = 12.49
p < 0.001
0.8042
0.7999
156.05
0.001
1.1065
Loge B/ CD - 0.1833
t = 0.652
p < 0.518
0.1137
t = 11.94
p < 0.001
0.7898
0.7842
142.76
0.001
1.0522
Loge B / loge H - 6.1044
t = 12.272
p < 0.001
3.5874
t = 17.78
p < 0.001
0.8922
0.8893
314.37
0.001
0.7536
Loge B / loge CD - 0.2.858
t = 12.53
p< 0.001
1.9615
t = 25.18
p < 0.001
0.9535
0.9420
634.05
0.001
0.5457
Y = a +b1 X1 + b2 X2 ± SE
Parameters a b1 b2 r2 Adj. r
2 F P SE
B / H & CD 14.602
t = 1.344
P < 0.190
- 4.0214
t = 2.428
P < 0.02
4.948
t= 2.428
p < .001
0.8663
0.6491
119.80
0.001
26.301
B /loge H & loge CD -105.325
t=2.44
P < 0.035
39.774
t = 0.96
P < 0.34
22.077
t = 1.00
P < 0.32
0.4644
0.4355
16.05
NS
52.64
loge B / loge H &
loge CD
- 3.924
t = 8.45
p< 0.001
1.0323
t = 2.580
p < 0.001
1.4760
t = 6.80
p< .001
0.9520
0.9445
367.69
0.001
0.5090
Note: Given in bold are the best fit equations.
D. KHAN ET AL.,
INTERNATIONAL JOURNAL OF BIOLOGY AND BIOTECHNOLOGY 7(3): 325-338, 2010.
330
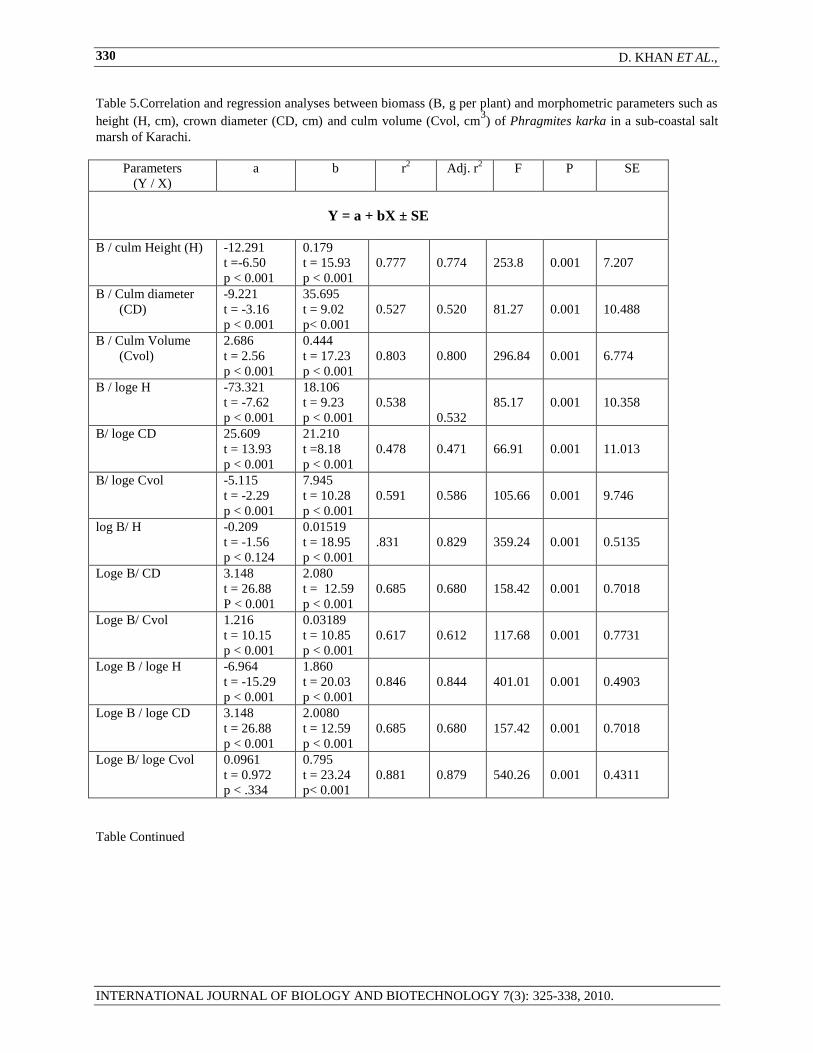
Table 5.Correlation and regression analyses between biomass (B, g per plant) and morphometric parameters such as
height (H, cm), crown diameter (CD, cm) and culm volume (Cvol, cm3) of Phragmites karka in a sub-coastal salt
marsh of Karachi.
Parameters
(Y / X)
a b r2 Adj. r
2 F P SE
Y = a + bX ± SE
B / culm Height (H) -12.291
t =-6.50
p < 0.001
0.179
t = 15.93
p < 0.001
0.777
0.774
253.8
0.001
7.207
B / Culm diameter
(CD)
-9.221
t = -3.16
p < 0.001
35.695
t = 9.02
p< 0.001
0.527
0.520
81.27
0.001
10.488
B / Culm Volume
(Cvol)
2.686
t = 2.56
p < 0.001
0.444
t = 17.23
p < 0.001
0.803
0.800
296.84
0.001
6.774
B / loge H
-73.321
t = -7.62
p < 0.001
18.106
t = 9.23
p < 0.001
0.538
0.532
85.17
0.001
10.358
B/ loge CD 25.609
t = 13.93
p < 0.001
21.210
t =8.18
p < 0.001
0.478
0.471
66.91
0.001
11.013
B/ loge Cvol
-5.115
t = -2.29
p < 0.001
7.945
t = 10.28
p < 0.001
0.591
0.586
105.66
0.001
9.746
log B/ H -0.209
t = -1.56
p < 0.124
0.01519
t = 18.95
p < 0.001
.831
0.829
359.24
0.001
0.5135
Loge B/ CD 3.148
t = 26.88
P < 0.001
2.080
t = 12.59
p < 0.001
0.685
0.680
158.42
0.001
0.7018
Loge B/ Cvol
1.216
t = 10.15
p < 0.001
0.03189
t = 10.85
p < 0.001
0.617
0.612
117.68
0.001
0.7731
Loge B / loge H -6.964
t = -15.29
p < 0.001
1.860
t = 20.03
p < 0.001
0.846
0.844
401.01
0.001
0.4903
Loge B / loge CD 3.148
t = 26.88
p < 0.001
2.0080
t = 12.59
p < 0.001
0.685
0.680
157.42
0.001
0.7018
Loge B/ loge Cvol
0.0961
t = 0.972
p < .334
0.795
t = 23.24
p< 0.001
0.881
0.879
540.26
0.001
0.4311
Table Continued

SIZE-PHYTOMASS ALLOMETRY IN SOME HALOPHYTIC PLANTS
INTERNATIONAL JOURNAL OF BIOLOGY AND BIOTECHNOLOGY 7(3): 325-338, 2010.
331
Table 5 … Continued.
Y = a +b1 X1 + b2 X2 ± SE
Parameters a b1 b2 r2 Adj. r
2 F P SE
B / H & CD -14.508
t = -7.23
< 0.001
0.150
t = 9.75
p < 0.001
9.771
t = 2.62
p < 0.001
0.796
0.790
140.49
0.001
6.934
B / H & Cvol
8.362
T = 3.42
p< 0.001
-13.17
T = -2.55
p< 0.001
0.560
T = 10.78
p < 0.001
0.819
0.814
162.89
0.001
6.532
B / CD & Cvol
-5.596
t = -2.97
p< 0.001
0.0876
t = 5.02
p< 0.001
0.262
t=6.16
p< 0.001
0.854
0.850
210.15
0.001
5.871
B /loge H & loge CD -38.45
t=-2.94
p< 0.001
12.105
t = 4.93
p< 0.001
11.080
t =3.63
p< 0.001
0.610
0.599
56.27
0.001
9.589
B / loge H & loge
Cvol
-31.171
t = -2.12
p< 0.038
6.590
t =1.79
P < 0.078
5.546
t = 3.60
P < 0.001
0.609
0.598
56.03
0.001
9.602
B / loge CD & loge
C vol
-20.935
t = -2.15
p< 0.035
-12.061
t = -1.67
p < 0.100
11.803
t = 4.85
p < 0.001
0.607
0.596
55.51
0.001
9.629
loge B / loge H &
loge CD
-3.953
t=-8.41
p<0.001
1.342
t= 15.23
p< 0.001
0.957
t=8.74
p< 0.001
0.925
.923
445.56
0.001
0.344
Loge B / loge H &
Loge Cvol
-3.302
t=-6.25
p< 0.001
0.859
t=6.51
p< 0.001
0.482
t=8.71
p< 0.001
0.925
0.923
444.31
0.001
0.344
Loge B / Loge CD &
Loge Cvol
-2.044
t=-6.25
p< 0.001
-1.632
t=-6.20
p< 0.001
1.317
t=14.86
p< 0.001
0.922
0.920
428.07
0.001
0.350
Note: Given in bold are the best fit equations.
In our studies, a natural log-log model multiple regression generally gave the best fit equation between size
measurements and total aboveground phytomass of individual plant. The values of adjusted R2 were generally
higher (≥ 0.92) (Table 2 -6). These results are similar to other studies (Brown, 1976; Ohmann et.al., 1976; Murray
and Jacobson, 1982; Rittenhouse and Sneva, 1977; Bryant and Kothmann, 1979, Hughes et.al., 1987; Pereira et.al.,
1995; Heirro et.al., 2000; Busuki et.al., 2009). The inclusion of parameter of height as an independent variable
along with crown diameter could not improve the estimation of phytomass in any substantial magnitude (Atriplex:
1.07%; Cressa: 0.5%; Limonium: 0.25%;l Urochondra: 0.2%) except in case of P. karka where substantial
improvement in estimation of culm mass was recorded (24.3%) when height was included along with culm basal
diameter in a natural log-log model of multiple correlation and regression. Fownes and Harrington (1991) have also
reported improvement in accounting for variation in biomass due to inclusion of height in addition to stem diameter
to be relatively modest.
We found that crown diameter was better predictor of phytomass in natural log-log model of regression and also
in the quadratic relationship to the aboveground dry phytomass (AGDP). Amongst various morphological plant
parameters in trees, DBH has been found to be better predictor of aboveground organ mass of Norway spruce than
height (Pokorný and Tomášková, 2007). DBH is also reported to provide better estimates of aboveground biomass
in Acacia abyssinica, A. seyal, A. tortilis, Eucalyptus globulus, E. grandis and E. saligna (Fentu, 2005). Tanaka et.
al. (2009) also reported better allometric relations for aboveground biomass with DBH in logged-over tropical
rainforests in Sarawak, Malaysia. DBH was reported as single successful predictor for range of prediction values of
total aboveground biomass closer to lower and upper limits of the observed mean in Dipterocarpus, Hopea,
Palaquinum and Shorea of Dipterocap forests in east Kalimantan, Indonesia with a log-log model: log e (Total
aboveground biomass) = c + a loge (DBH) (Basuki et. al. , 2009). The diameter of the longest stem in several

D. KHAN ET AL.,
INTERNATIONAL JOURNAL OF BIOLOGY AND BIOTECHNOLOGY 7(3): 325-338, 2010.
332
species was reported to the best predictor of biomass in Argentine shrubs (Hierro et. al., 2000). Diameter at breast
height in Fagus moesiaca (a tree in Vermio Mountain of Northern Greece), explained most of the variability in the
dependent variables such as total aboveground stem biomass and branch biomass (Zianis and Mencuccini, 2003).
Highly significant allometric regression, however, resulted from using basal diameter and crown depth in Jetropha
curcas L (Ghezehei et. al. (2009).
Table 6.Correlation and regression analyses between biomass (B, g per plant) and morphometric parameters such as
height (H, cm), and crown diameter (CD, cm) of Urochondra setulosa in coastal halo-xeric plain of Hawkes Bay,
Karachi.
Parameters
(Y / X)
a b r2 Adj. r
2 F P SE
Y = a + bX ± SE
B / H -195.67
t = 3.19
p < 0.001
11.294
t = 6.09
p < 0.001
0.617
0.600
37.10
0.001
130.59
B / CD -102.15
t = -3.72
p < 0.001
11.329
t =11.191
p < 0.001
0.845
0.838
125.24
0.001
83.12
B / loge H -525.098
t = -2.85
P < 0.009
205.198
t = 3.691
p < 0.001
0.372
0.345
13.63
0.001
167.22
B/loge CD -213.78
T = -2.53
P < 0.001
133.19
T = 8.37
P < 0.001
0.470
0.447
20.41
0.001
153.60
log B/ H -1.459
t = -2.246
p < 0.001
0.155
T = 7.89
P < 0.001
0.730
0.718
62.18
0.001
1.381
Loge B/ CD 0.266
t = 0.608
p < 0.549
0.135
t = 8.37
p < 0.001
0.753
0.742
70.00
0.001
1.322
Loge B / loge H -9.237
t = -7.25
p < 0.001
3.814
t = 9.91
p < 0.001
0.900
0.810
98.19
0.001
1.158
Loge B / loge CD -3.149
t= - 8.316
P < 0.001
2.363
t = 17.93
P < 0.001
0.933
0.930
321.44
0.001
0.6868
Y = a +b1 X1 + b2 X2 ± SE
Parameters a b1 b2 r2 Adj. r
2 F P SE
B / H & CD -91.062
t=- 2.075
p < 0.001
-0.801
t= -0.328
p < 0.001
11.926
t = 5.71
p < 0.001
0.920
0.846
60.25
0.001
84.78
B /loge H & loge CD 33.99
t = 1.12
p< 0.091
-138.584
t = 0.85
p < 0.405
209.132
t = 2.22
p < 0.037
0.487
0.440
10.44
0.001
154.53
loge B / loge H &
loge CD
-1.871
t = -1.39
p < 0.18
-0.715
t = - 0.99
p < 0.335
2.755
t = 6.58
p < 0.001
0.936
0.930
161.01
0.001
0.6852
Note: Given in bold are the best fit equations.

SIZE-PHYTOMASS ALLOMETRY IN SOME HALOPHYTIC PLANTS
INTERNATIONAL JOURNAL OF BIOLOGY AND BIOTECHNOLOGY 7(3): 325-338, 2010.
333
BIOMASS
DIAM
6050403020100
140
120
100
80
60
40
20
0
-20
Figure 1. Curve estimation (quadratic relationship) between culm dry mass and crown diameter of Atriplex griffithii.
Continuous line, observed data; broken line, estimated curve.
BIOMASS
DIAM
3020100
30
20
10
0
-10
Figure 2. Curve estimation (quadratic relationship) between biomass (g) per plant and crown diameter of Cressa
cretica (cm). Continuous line, observed data; broken line, estimated curve.
CROWN DIAMETER (cm)
R2 = 0.946
Adj. R2 = 0.943
F= 325.69
P < 0.0001
a = 3.2939
b = -0.7911
c = 0.5740
SE = 7.39
R2 = 0.953
Adj R2= 0.950
F = 372.24
p < 0.001
a = -0.3244
b = 0.1174
c = 0.0313
SE = 1.254
CROWN DIAMETER (cm)
BIOMASS PER PLANT (g)
BIOMASS PER PLANT (g)

D. KHAN ET AL.,
INTERNATIONAL JOURNAL OF BIOLOGY AND BIOTECHNOLOGY 7(3): 325-338, 2010.
334
BIOMASS
DIAM
706050403020100
300
200
100
0
-100
Figure 3. Curve estimation (quadratic relationship) between biomass (g) and crown diameter (cm) of Limonium
stocksii. Continuous line, observed data; broken line, estimated curve.
CULMH
4003002001000
70
60
50
40
30
20
10
0
-10
Figure 4. Curve estimation (quadratic relationship) between culm biomass (g) and culm Height (cm) of P. karka.
Continuous line, observed data; broken line, estimated curve.
R2 = 0.946
Adj. R2 = 0.943
F = 326.01
p < 0.0001
a = 0.0719
b = -0.3539
c = 0.0682
SE = 16.67
CROWN DIAMETER (cm)
BIOMASS PER PLANT (g)
R2 = 0.843
Adj. R2 = 0.839
F = 193.47
p < 0.0001
a = 0.90568
b = -0.02476
c = 0.000605
SE = 6.081
CULM BIOMASS (g)
CULM HEIGHT (cm)
SIZE-PHYTOMASS ALLOMETRY IN SOME HALOPHYTIC PLANTS
INTERNATIONAL JOURNAL OF BIOLOGY AND BIOTECHNOLOGY 7(3): 325-338, 2010.
335
CULMSD
1.41.21.0.8.6.4.2
70
60
50
40
30
20
10
0
-10
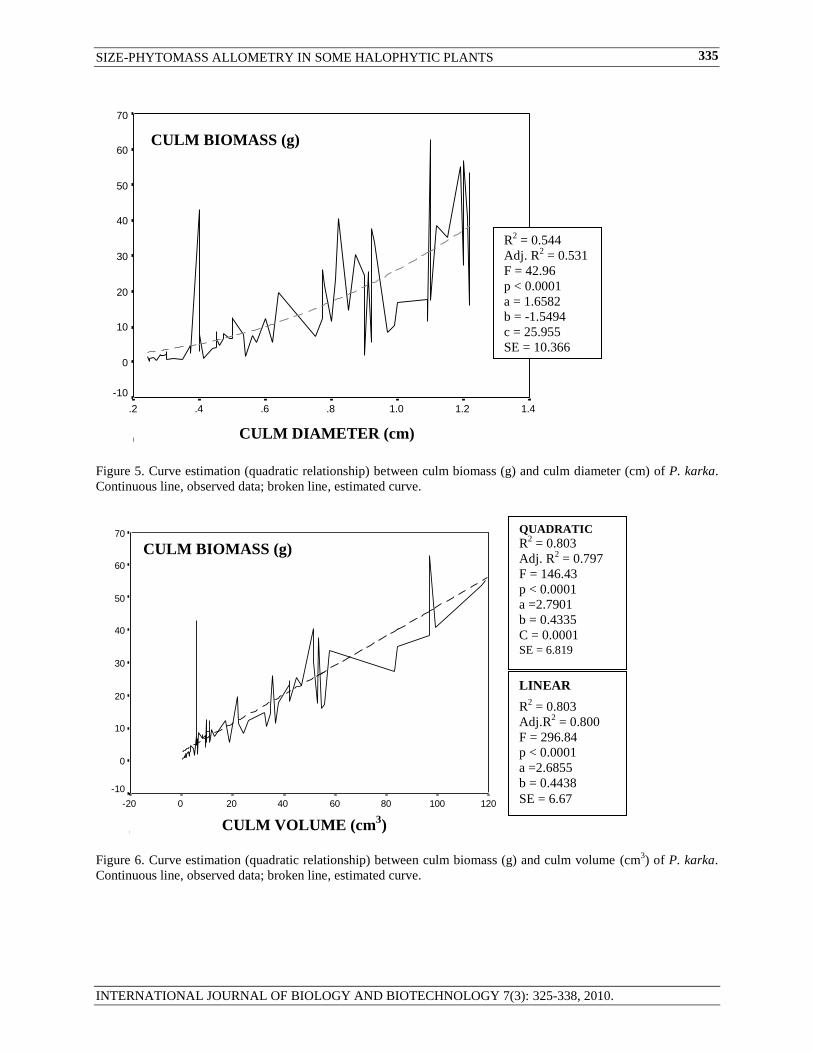
Figure 5. Curve estimation (quadratic relationship) between culm biomass (g) and culm diameter (cm) of P. karka.
Continuous line, observed data; broken line, estimated curve.
CULMVOL
120100806040200-20
70
60
50
40
30
20
10
0
-10
Figure 6. Curve estimation (quadratic relationship) between culm biomass (g) and culm volume (cm3) of P. karka.
Continuous line, observed data; broken line, estimated curve.
LINEAR
R2 = 0.803
Adj.R2 = 0.800
F = 296.84
p < 0.0001
a =2.6855
b = 0.4438
SE = 6.67
CULM VOLUME (cm3)
CULM BIOMASS (g)
QUADRATIC
R2 = 0.803
Adj. R2 = 0.797
F = 146.43
p < 0.0001
a =2.7901
b = 0.4335
C = 0.0001 SE = 6.819
R2 = 0.544
Adj. R2 = 0.531
F = 42.96
p < 0.0001
a = 1.6582
b = -1.5494
c = 25.955
SE = 10.366
CULM DIAMETER (cm)
CULM BIOMASS (g)

D. KHAN ET AL.,
INTERNATIONAL JOURNAL OF BIOLOGY AND BIOTECHNOLOGY 7(3): 325-338, 2010.
336
BIOMASS
DIAM
706050403020100
1000
800
600
400
200
0
-200
Fig. 7. Curve estimation (quadratic relationship) between plant biomass (g) and crown diameter (cm) in
Urochondra setulosa. Continuous line, observed data; broken line, estimated curve.
It appears from our study that in herbaceous species in hand crown diameter is more important parameter than
plant height so far aboveground phytomass is to be estimated. Logarithmic transformation is commonly employed to
linearize data (Niklas, 2006) but such a practice introduces a systematic bias that must be corrected when back-
transforming the values. Using logarithmic form of equations produces systematic underestimation of dependent
variable (Y) when converting the estimated loge Y back to the original untransformed scale Y. Such a bias was
recognized by Fenny (1941). Several authors (Baskerville, 1917; Beauchamp and Olsen, 1973; Yanale and Wiant,
1981; Duan, 1983; Sprugel, 1993; Zianis and Mencuccini, 2003) indicated its potential impact in biomass estimation
using logarithmic regressions. The details regarding calculation of correction factor may be seen in Zianis and
Mencuccini (2003). We, therefore, examined non-linear models with our data also (Fig. 1 -7) i.e., biomass regressed
for curvilinear model (Y = a + bX + cX2 ± SE) against crown diameter (or culm diameter in case of P. karka). The
non-linear model as are generally said to be better models than log-transformed linear models based on goodness of
fit parameters - p values, R2 and CV, etc. ( Litton and Kauffman, 2008). Quadratic models, in our case, were more
or less as equally statistically efficient as natural log-log multiple regression models in estimating phytomass in
Atriplex, Cressa and Limonium (R2 ranging from 0.943 to 0.950). Culm phytomass in Phragmites and AGDP in
Urochondra setulosa were, however, better estimated by multiple regression models with natural log-log
transformed variables (around 92%) than quadratic models in these species (Quadratic R2:
0.531 and 0.875,
respectively). Culm height and culm volume could, however, defined culm biomass of P. karaka curvilinearly only
83.7 and 79.7%.
It has been stated that in P. karka in stead of plant mass, culm mass was estimated on the basis of culm
diameter, height or culm volume with a view that aboveground biomass in unit area of its populations could be
estimated by frequency counting in sampling which is similar to frequency counting of each living shoot or branch
(or say the culm) appearing above the ground independently.
Most of the halophytic communities in arid areas are generally open and plants individuality is well explicit.
These equations may be useful in estimating phytomass of species in hand during field studies but. But a word of
caution is necessary. The proposed equations may only be used for plants falling within the size ranges of sampled
plants because exploitation of curves beyond the region of fit is subject to error (Fownes and Harrington, 1991). The
testing of these equations in field is, of course, imperative which is underway. REFERENCES
Baskarville, G.L. (1972). The use of logarithmic regression in the estimation of plant biomass. Can. J. For. Res.
2:49-53.
R2 = 0.886
Adj. R2 = 0.875
F = 85.09
p < 0.0001
a = -33.931
b = 3.7625
c = 0.1294
SE = 73.03
CROWN DIAMETER (cm)
BIOMASS PER PLANT (g)

SIZE-PHYTOMASS ALLOMETRY IN SOME HALOPHYTIC PLANTS
INTERNATIONAL JOURNAL OF BIOLOGY AND BIOTECHNOLOGY 7(3): 325-338, 2010.
337
Basuki, T.M., P.E. van Laake, A.K. Skidmore and Y.A. Hussin (2009). Allometric equations for estimating the
above-ground biomass in tropical lowland Dipterocarp forests. For. Ecol. & Manage. 257 (8): 1684 – 1694.
Beauchamp, J.J. and J.S. Olsen (1973). Correction for bias in regression estimates after logarithmic transformation.
Ecol. 54: 1402 – 1407.
Bryant, F. and M. Kothmann (1979). Variability in predicting edible browse from crown volume. J. Range Manage.
32: 144-146.
Brown, J.K. (1976). Estimating shrub biomass from basal stem diameters. Can. J. For. Res. 6: 153 – 158.
Castelan-Estrada, M., P. Vivin and J.P. Gaudillière (2002). Allometric relationships to estimate seasonal
aboveground vegetative and reproductive biomass of Vitis vinifera L. Ann. Bot. 89: 401 – 408.
Crow, T.R. (1983). Comparing biomass regression by site and stand age for red maple. Can. J. For. Res. 13: 283-
288.
Duan, N. (1983).Smearing estimate: A non-parametric retransformation method. J. Am. Stat. Assoc. 78: 605-610.
Elliot, K.J. and B.D. Clinton (1993). Equations for estimating biomass of herbaceous and woody vegetation in early-
successional Southern Appalachian Pine-hardwood forests. US dept. Agriculture, Forest service, Southeastern
Forest Exp. Station. Research Note NO. SE-365.
Fanny, D.J. (1941). On the distribution of a variable whose logarithm is normally distributed. J. R. Stat. Soc. Series
B: 155 – 161.
Fantu, W. (2005). Aboveground biomass allometric equations and fuelwood properties of six species grown in
Ethiopia. Ph. D. Thesis. Faculty of Forestry, Univesiti Putra Malaysia.
Fownes, J.H. and R.A. Harrington (1991). Allometry of woody biomass and leaf area in five tropical multipurpose
trees. J. Trop. For. Sci. 4(4): 317 – 330.
Gardner, F.P., R.B. Pearce and R.L. Mitchell (1985). Physiology of crop plants. IOWA State Univ. Press, Ames. P.
187-208.
Ghezehei, S.B., J.G. Annandale and C.S. Everson (2009). Shoot allometry in Jetropha curcas. Southern Forests: A
Journal of For. Sci. 71(4): 279-286.
Grigal, D.F. and N. R. Moody (1980). Estimates of browse by site classes for snowshoe hare. Wildl. Manage. 44 (1):
34 – 40.
Hierro, J.L., L.C. Branch, D. Villarreal and K.L. Clark (2000). Predictive equations for biomass and fuel
characteristics of Argentine shrubs. J. Range Manage. 53: 617-621.
Hughes, G., L. Verner and L. Blankeship (1987). Estimating shrub production from plant dimensions. J. range
manage. 40: 367-369.
Johnson, P.S. C.L. Johnson and N.E. West (1988). Estimation of phytomass for ungrazed crested wheatgrass plants
using allometric equations. J. Range Mange. 41(5): 421- . Utah Agricultural Experimental Station Journal paper
No. 3544.
Khan, M.N.I, R. Suwa and A. Hagihara (2005). Allometric relationship for estimating the aboveground phytomass
and leaf area of mangrove Kandelia candel (L.) Druce trees in the Manko wetland, Okinawa island, Japan.
Trees- Structure & Function 19 (3): 266 – 272.
Litton, C.M. and J.B. Kaufman (2008). Allometric models for predicting aboveground biomass in two widespread
woody plants in Hawaii. Biotropica 40(3): 313 - 320.
Matte, T, I. Hajnsek and k. Papathanassiou (2003). Height-biomass allometry in temperate forests. 0-7803-7929-
2/03/$17.00( C ) 2003 IEEE.
(Web- ieeexplore.leee.org/ie/5/9010/28603/01294300.pdf?arnumber=1294300)
Maghembe, J.A., E.M. Kariuki and R.D. Haller (1983).Biomass and nutrient accumulation in young Prosopis
juliflora at Mombasa, Kenya. Agroforestry Systems (Biomedical & Life sciences and Earth Environmental
Science) vol. 1 (1): 313- 321.
Martin, W.L., T.L. Sharik, R.G. Oderwald, and D. Wm. Smith (1982). Phtyomass: Structural relationships for
woody plant species in the understory of an Appalachian oak forest. Can. J. Bot. 60(10): 1923-1927.
Monk, C.D., G.J. child, S.A. Nicholson (1970). Biomass, litter and leaf surface area estimates of an oak-hickory
forest. Oikos. 21: 138-141.
Murray, R. and M. Jacobson (1982). An evaluation of dimension analysis for predicting shrub biomass. J. Range
Manage. 35: 451-454.
Niklas, K.J.(2006). A phyletic perspective on the allometry of plant biomass-partitioning patterns and functionally
equivalent organ—categories. New Phytol. 171:27-40.
Niklas, K.J., J.J. Midgley and B.J. Enquist (2003). A general model for mass-growth-density relations across tree
dominated communities. Evol. Ecol. Res. 5: 459-468.

D. KHAN ET AL.,
INTERNATIONAL JOURNAL OF BIOLOGY AND BIOTECHNOLOGY 7(3): 325-338, 2010.
338
Ohmann, L. F., D.F. Grigel and R. Brandar (1976). Biomass estimation for five shrubs from northeastern Minnesota.
USDA Forestr Serv. Res Note NC 133.
Ohmann, L.F., D.F. Grigal, and L. L. Rogers (1991).Estimating plant biomass for undergrowth species in
northeastern Minnesota forest communities. US Dept. Agriculture Forest Service, North Central Experimental
Station, St. Paul, MN.
Pastor, J., J.D. Abor and J.M. Melillo (1984). Biomass prediction using generalized allometric regression for some
Northeast tree species. For. Ecol. & Manage. 7: 265-274.
Pokorný, R and I. Tomášková (2007). Allometric relationship for surface area and dry mass of young Norway
spruce aboveground organs. J. For. Sci. 53(12): 548 – 554.
Pereira, J.M.C., N.M.S. Sequeira and M.B. Carreiras (1995). Structural properties and dimensional relations of some
Mediterranean shrub fuels. Int. J. Wildl. Fire 5: 35-42.
Rittenhouse, L.R. and F.A. Sneva (1977). A technique for estimating big sagebrush production. J. Range Manage.
30: 68-70.
Roussopoulos, P.J. and R.M. Loomis (1979). Weights and dimensional properties of shrubs and small trees of the
Great Lakes conifer forest. U.S. Forest Serv. Res. Pap. NC. 178.
Schreuder, H.T., W.T. Swank (1971). A comparison of several statistical models in forest biomass and surface area
estimates. In: Young, H.E (ed.) Forest Biomass Studies. IUFRO, section 25: Growth and Yield. Misc. publ.
132.Orono, ME: University of Maine: 125-138.
Sprugel, D.G. (1983). Correcting for bias in log-transformed allometric equations. Ecology 64: 209 – 210.
Swank, W.T. and H.T. schreuder (1974). Comparison of three methods of estimating surface area and biomass for a
forest of young eastern white pine. For. Sci. 20: 91-100.
Tanaka, K., F. Ryo, H. Daisuke, K.J. Jawa, T. Sota, S. Katsutoshi and N. Ikuo (2009). Allomteric equations for
accurate estimation of above-ground biomass in logged-over tropical rainforests in Sarawak, Malaysia. J. For.
Res. 14 (6): 365 – 372.
Whittaker, R.H. and G.M. Woodwell (1968). Dimensions and production relations of trees and shrubs in the
Brookhaven forest. J. Ecol. 56: 1-25.
Yanale, D.O. and H.V. Wiant (1981). Estimation of plant biomass based on the allometric equation. Can. J. For.
Res. 11: 833 – 834.
Young, H.E. (1976). A summary and analysis of weight table studies. In: Young, H.E. (ed.). Oslo Biomass Studies.
Orono, ME: University of Maine. 251 – 282.
Zianis, D. and M. Mencuccini (2003). Aboveground biomass relationships for beech (Fagus moesiaca Cz.) trees in
Vermio Mountain, Northern Greece, and generalized equations for Fagus sp. Ann. For. Sci. 60: 439 – 448.
(Accepted for publication July 2010)