Six Sigma Green Belt Final Report Unfavorable Yield ... - CSMR
12
Six Sigma Green Belt Final Report Unfavorable Yield Variances Kellogg of Seelyville By Steven M Landwer Prepared for Professor Kenneth Jones Indiana State University May 2, 2013
-
Upload
khangminh22 -
Category
Documents
-
view
4 -
download
0
Transcript of Six Sigma Green Belt Final Report Unfavorable Yield ... - CSMR
Six Sigma Green Belt Final Report
Unfavorable Yield Variances
Kellogg of Seelyville
By Steven M Landwer
Prepared for Professor Kenneth Jones
Indiana State University
May 2, 2013

OSCM 445 Green Belt Final Paper Steven M. Landwer
- 1 -
TABLE OF CONTENTS
Section Page
EXECUTIVE SUMMARY .................................................................................................2
INTRODUCTION ...............................................................................................................3
DEFINE ...............................................................................................................................3
MEASURE ..........................................................................................................................3
ANALYZE ...........................................................................................................................4
IMPROVE............................................................................................................................5
CONTROL ...........................................................................................................................5
ADDITIONAL RECOMMENDATIONS ...........................................................................6

OSCM 445 Green Belt Final Paper Steven M. Landwer
- 2 -
Executive Summary
My Six Sigma Green Belt Project was with the Kellogg Plant of Seelyville, IN. One of
the main issues that they were trying to figure out was the unfavorable yield on line 2 in the
plant. When I started the project in January, the yield was extremely unfavorable and they
wanted to prove where the loss was at and fix it. We discussed a few options on where to look,
but ultimately decided to delve into the product weights on the line before the crackers went into
the oven. The numbers at a glance showed a discrepancy between the weights on the east and
west side of the line compared to the center.
The way that they collect these weights is to gather a certain number of raw crackers
from the east, center, and west part of the line and weigh them. I took all of the data from 2012
and organized it in such a way that I could run tests on it. I chose to run an ANOVA test to
compare the means of the three weights. The results that I got were as I expected. The center
weight was statistically and significantly higher than the east and west weights. What this shows
us is that the east and west crackers are not getting cooked the same because of the size
difference. The east and west sides of the oven notoriously cook slightly more, and now we have
a significant reason why this is happening.
One of the problems with the crackers not cooking the same is consistent products. The
outer crackers could very well be cooking out too much moisture, which hurts the yield and
makes it overly brittle for the customer. The center of the line crackers could be cooking ever so
slightly less than they should, which could make the cracker stale. If we were able to fix this
issue, the yield should start to get back to favorable.
The only cost effective way to begin improving this issue is called a “crackdown.” This
is where the supervisors on the shift make the first two rolls tighter so that the last roller doesn’t
have to depress the dough as much. They can also make sure that the dough is getting more
evenly spread before it ever hits the first roller. There are some dangers to this method though.
If they stretch the dough too much, it will only temporarily hold that form. By the time it is
finished baking the crackers can shrink and be much smaller than they would want them to be.
The best way to help control this is to have the supervisors make sure that they check on
this personally twice a day. They can check the dough heights going into each roller with
calipers and then check the operators’ numbers on the weights to make sure that they are in
control. They would then want to visually check the size of the crackers as well as the numbers
from the operator after the oven. The checks only take a couple minutes, so under normal
circumstances, they are easily manageable. The supervisors should also explain the situation to
the operators so that if they see something out of the ordinary, they can call it to their attention.
I did learn recently that my study helped push an approval to purchase a new finishing
roll for line 2. This is a significant purchase that has to have multiple factors proven before it
can get replaced. I will be continuing to help out with this yield issue in the future just so that I
can learn more about the entire process.
OSCM 445 Green Belt Final Paper Steven M. Landwer
- 3 -
Introduction
Kellogg is a company of which most people are very familiar. They produce a very large
line of products. They are probably best known for their breakfast and snack food. A couple of
brother’s accidentally discovered how to flake a grain while trying to make granola in 1898.
They took the idea and applied it to corn and eight years later opened their own plant to produce
Kellogg’s Corn Flakes. Their headquarters are located in Grand Rapids, Michigan.
In 2008, they purchased what used to be known as IndyBake. They had been making
some pretty major investments there before the purchase and decided that it would be a great
long term investment to just own the plant outright. This created a lot of new jobs for people
around the Seelyville area. Seelyville is only a few miles east of Terre Haute. The new plant
manager for this facility is Carol Cruz and she approved the start of this project. My initial
contact for this project was the current Continuous Improvement Manager and acting Operations
Manager, Ryan Smith. I spoke on multiple occasions with Art Sells, an Operations Supervisor.
Define
My main contact throughout this entire project was Denny Wentz, the current third shift
Operations Supervisor. He was incredibly helpful with the entire process, including running
experiments on the flatbreads on his shift. We have had many discussions on where exactly the
unfavorable yield variance could be coming from, but neither he nor Ryan wanted to persuade to
where this project would lead. We knew that finding the cause of the yield variance was our
focus during this project.
Measure
I decided that I would analyze the weights on the line before they are run through the
oven for a couple of reasons. The main reason is because having an evenly distributed product
going into the oven should produce the most consistent product after it leaves the oven. If the
weights are heavier than they should be for one or more of the sections, the oven settings will be
off for that section. This could cause the product to fail one or more of the checks that it goes
through after the oven.
The heavier section could have a moisture that is higher than standard while being too
light in color. This could also cause those crackers to become stale more rapidly than they
should. The lighter sections could be overcooked, causing them to be brittle. It could also cook
out more moisture than it should, which causes lower yield automatically. It can also cause a
cracker to be much darker than it should be. This would make it so that the crackers have an
undesirable appearance to the customer.
The yield issue has just about every factor along the entire line calculated into it. This
makes it difficult to identify the most crucial issue at hand. We decided that this was the most
critical because it affects every cracker in every box. My goal was to prove that the center
weight of the crackers on the line is higher than those on the east and west sides of the line. The

OSCM 445 Green Belt Final Paper Steven M. Landwer
- 4 -
weights are taken every half hour while the line is running after they are cut into their individual
shapes but before they go into the oven.
The operator took a sample of ten crackers from all three sections of the line and weighed
them on a scale to the tenth of a gram. This data collection has been a standard procedure for a
long time. I was able to obtain data for the entire year of 2012 and up to the most recent week in
2013. It took me some time to organize this data in order to be able to run tests on it. The test I
chose to run was an analysis of variance, or ANOVA.
The ANOVA test would be able to prove that the center weight was significantly higher
than the east and west weights. I used Minitab, a powerful statistical analysis software, in order
to run these tests. I ran these tests on all of the products produced on line 2, but we chose to
focus on the flatbreads. They produced three different styles of flatbread crackers on line 2
during 2012. These styles were Italian Herb, Roasted Garlic, and Sea Salt and Olive Oil.
Analyze
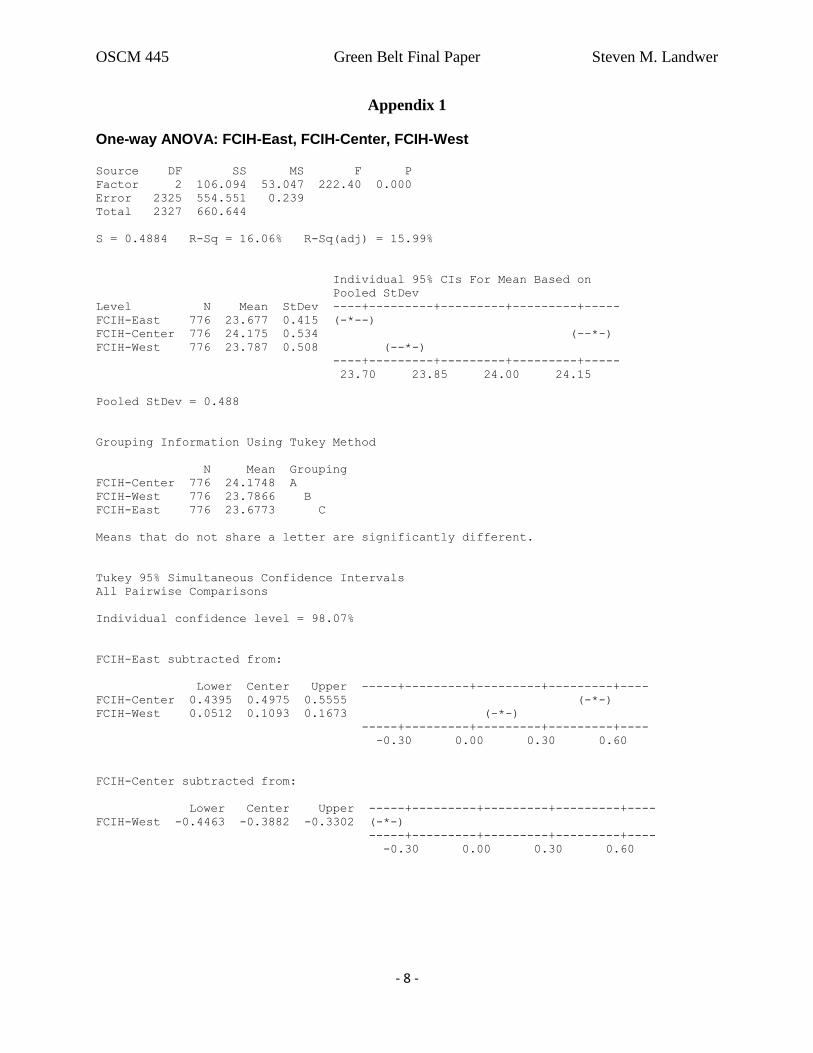
The results that I got from the ANOVA for the Italian Herb showed me that the center
was higher than both the east and the west. On average, the center was .5 grams higher than the
east and .39 grams higher than the west. The west was also .11 grams higher than the east. The
west being larger than the east is not nearly as large as the difference between those and the
center. As far as this product goes, the test proves that our center weight is significantly higher
than the east and the west, statistically speaking. To see the full analysis results, please refer to
Appendix 1.
The results that I got from the ANOVA for the Roasted Garlic showed me that the center
was higher than both the east and the west. On average, the center was .48 grams higher than the
east and .5 grams higher than the west. The west was also .02 grams lighter than the east. The
east being heavier than the west is statistically significant, so we can ignore that factor. As far as
this product goes, the test proves that our center weight is significantly higher than the east and
the west, statistically speaking. To see the full analysis results, please refer to Appendix 2.
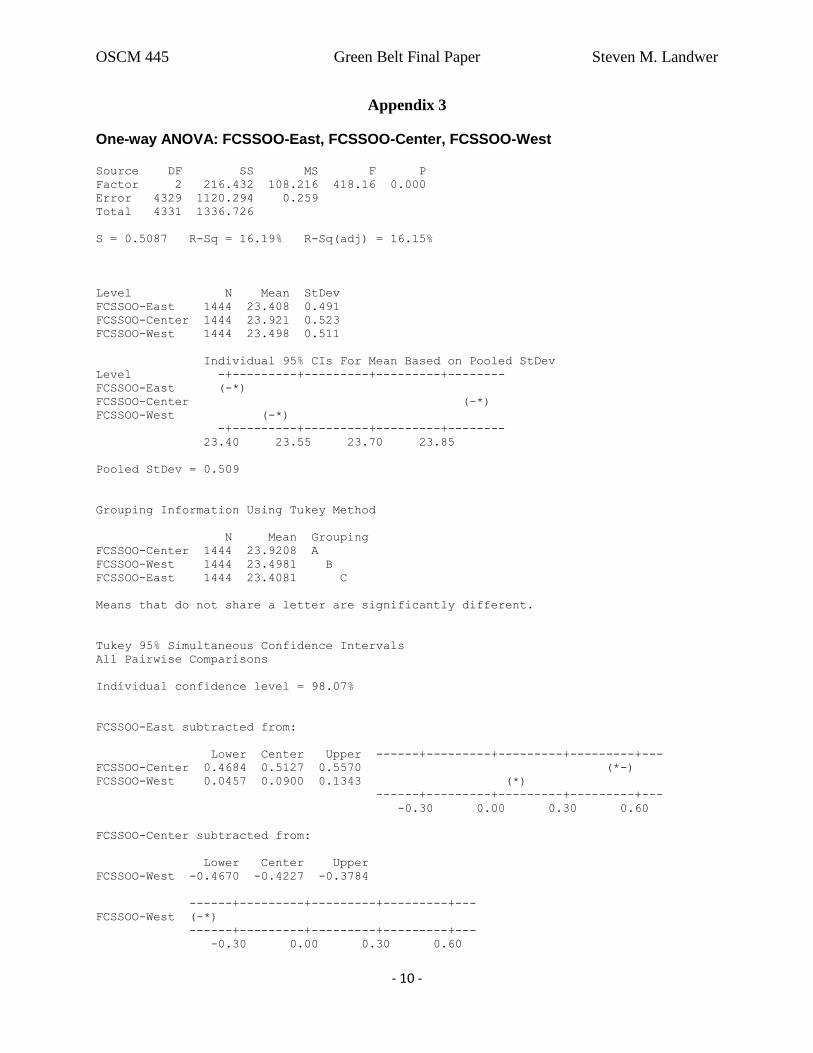
The results that I got from the ANOVA for the Sea Salt and Olive Oil showed me that the
center was higher than both the east and the west. On average, the center was .51 grams higher
than the east and .42 grams higher than the west. The west was also .09 grams higher than the
east. The west being larger than the east is not nearly as large as the difference between those
and the center. As far as this product goes, the test proves that our center weight is significantly
higher than the east and the west, statistically speaking. To see the full analysis results, please
refer to Appendix 3.
After analyzing all three ANOVA tests, I am able to conclude with a very high level of
confidence that the center weight is consistently higher than the weight of the east and the west.
The small difference in weights between the east and the west were not consistent across all three
products and was a much smaller difference as well. For these reasons, I feel comfortable
ignoring this part of the analysis at this juncture.
OSCM 445 Green Belt Final Paper Steven M. Landwer
- 5 -
Improve and Control
There are a few ways that can help fix this problem. I will explain the process of
improvement first and then the control of it before I move on to the next option. The first option
would be the most cost effective for the time being. It is what Ryan, and the bakery, calls a
“crackdown.” The way it works is by manually stretching or smoothing out the dough more
evenly before it reaches the first roller. The supervisors would also reduce height of the first and
second rollers so that by the time it reaches the finishing roller, it has less dough to reduce to the
final thickness of the cracker. This, in theory, should make the final roller more accurate. This
should allow the crackers to bake more evenly. The best part about this option is that it does not
have any additional cost.
The downfall of the “crackdown” process is that the dough can get stretched too much. If
this happens, the dough can shrink before or in the oven and cause the cracker to get burnt, dry
out, and not have the correct shape. This will cause a lot of problems for the oven operators and
the quality checks that they have to make. The line operators and supervisors must be very
careful while they perform the “crackdown” so that these problems do not arise or, if they do, get
out of control.
This improvement is really only a short term solution and must be watched constantly.
The supervisor must personally check the dough before and after each of the first two rollers a
couple of times during their shift. They must also check the quality checks that they do after the
finishing roller to make sure they stay within specifications. They must also make sure that their
operators understand what they are doing as we as why they are doing it. This way the operator
will be able to recognize minor issues with this process before it leads to a real problem.
One opportunity that I thought of to be a more long term solution is to add a fourth roller
at the beginning of this process. This could completely replace the “crackdown” so that the
operator and supervisor can attend to more pressing issues at the time. The only control that
would be necessary is to analyze the weights to make sure that they are getting the desired effect.
There are two main issues with this option. The first is that this would involve a costly
renovation to the line in order to purchase and install the extra roller. The other issue is the
reengineering of such a small section of the line could be very time consuming and costly as
well. There is no way to test if this would work to the level that they would need in order to
make this investment.
Another option would be to replace the finishing roller. This roller has, by far, the largest
effect on whether or not the weights are consistent. This would cost Kellogg a pretty significant
amount of money and there is also no real way of predicting how much of an improvement it
would have. The roller they are currently using is over 40 years old and over time, they do need
to be replaced. I spoke with Art Sells and he informed me that they are going to make this
investment. He was unable to disclose the cost of it, but he did let me know that it was not going
to come in until the middle or late July. He said that my analysis helped in pushing this
investment into the actual purchasing phase. The control with this improvement is to do more
analysis after the new finishing roller is installed. This will let us know if the center weight
being higher was a significant cause of an unfavorable yield.

OSCM 445 Green Belt Final Paper Steven M. Landwer
- 6 -
Additional Recommendations
Another cost effective way to help with all issues across the plant is to hold the operators
more accountable. They can use either a demerit style or bonus system to do this. I personally
feel that a bonus system is more effective. I feel that rewarding good work is better than scaring
people into doing what they are supposed to do. This system could help identify other possible
issues that may be causing an unfavorable yield. One example how this could be utilized is
where they do their data input. They could have a supervisor pull a random day and compare it
to the data in the computer. They could have some sort of bonus, which does not necessarily
need to be monetary, if they get five consecutive random audits with over a certain percentage of
accuracy, which should be at least 95%.
Throughout the process of walking through the plant, I have found that accuracy in the
data collection as well as the data input could play a role in the yield variances. I feel like there
needs to be more of a standard on how all of the operators and quality control checks are done.
There were visible variations between the shifts that I noticed. One of the biggest ones is with
the amount of decimal places being put on the quality check sheet. Some operators did not put
any decimal places and just rounded to the nearest whole number. The scales that they use,
however, are capable of reading two decimal places. The time it takes to write the extra number
or two is incredibly small, so I feel that the supervisors need to have their operators make the
data as precise as possible.
One of the biggest areas that I consistently noticed this was in the bagging area. The
numbers did not match up from the shift report to the computer and it was taken as a whole
number. The yield calculation uses the average bag weight, so this number must be accurate in
order to get an accurate yield calculation. The amount of samples they take is also really low for
the amount of production that they have. On a smoothly running shift, they produce around
40,000 bags of flatbread crackers. They only take ten samples an hour during that same shift.
The confidence level of that small of a sample is way below that standard of 95%.
Ryan, Denny, and I collaborated on a miniature project to see what kind of accuracy
those numbers could possibly be producing, and what I found was way off. I did a calculation to
find out what size sample I would need to have to get a 95% confidence level for the weight of
the bags. This sample size would need to be around 1500. This size of a sample is too high to
do on a normal basis, but was needed in order to check the accuracy of the smaller sample. Most
of the bags are produced on the first three baggers for line 2, so I wanted the majority of the
samples to come from them. Later in the test, bagger 3 went down, so they finished the test
using baggers 1, 2, and 4.
I did have a few samples from fifth bagger just so that I could make sure that we were
getting somewhat of an average from all of the baggers based off of the general percentage that
they produce for the shift. I was not able to have this test run on one shift so I have six hours
from the third shift and two hours from the first shift. They were not able to get me the amount
of samples that I had requested, but they still were able to get me a significant amount. Although
OSCM 445 Green Belt Final Paper Steven M. Landwer
- 7 -
it did not give me as high of a confidence level as I had hoped for, I was still able to get a much
more accurate sample of bag weights.
From the 8 hour time period that we tested, the average weight was 273 grams on the
quality weight check sheet. The weight in the computer was 269 grams. The actual average
weight based on the test of 1,197 samples was 270.4 (see Appendix 4 for bagger by bagger
results). This tells us that there needs to be more checks for accuracy with the data input. There
also needs to be a larger sample taken for weight checks each night. They should also make sure
that they sample from all five baggers throughout the night. I have no way of knowing if they
currently do that because it changes amongst operators and between shifts.
OSCM 445 Green Belt Final Paper Steven M. Landwer
- 8 -
Appendix 1 One-way ANOVA: FCIH-East, FCIH-Center, FCIH-West Source DF SS MS F P
Factor 2 106.094 53.047 222.40 0.000
Error 2325 554.551 0.239
Total 2327 660.644
S = 0.4884 R-Sq = 16.06% R-Sq(adj) = 15.99%
Individual 95% CIs For Mean Based on
Pooled StDev
Level N Mean StDev ----+---------+---------+---------+-----
FCIH-East 776 23.677 0.415 (-*--)
FCIH-Center 776 24.175 0.534 (--*-)
FCIH-West 776 23.787 0.508 (--*-)
----+---------+---------+---------+-----
23.70 23.85 24.00 24.15
Pooled StDev = 0.488
Grouping Information Using Tukey Method
N Mean Grouping
FCIH-Center 776 24.1748 A
FCIH-West 776 23.7866 B
FCIH-East 776 23.6773 C
Means that do not share a letter are significantly different.
Tukey 95% Simultaneous Confidence Intervals
All Pairwise Comparisons
Individual confidence level = 98.07%
FCIH-East subtracted from:
Lower Center Upper -----+---------+---------+---------+----
FCIH-Center 0.4395 0.4975 0.5555 (-*-)
FCIH-West 0.0512 0.1093 0.1673 (-*-)
-----+---------+---------+---------+----
-0.30 0.00 0.30 0.60
FCIH-Center subtracted from:
Lower Center Upper -----+---------+---------+---------+----
FCIH-West -0.4463 -0.3882 -0.3302 (-*-)
-----+---------+---------+---------+----
-0.30 0.00 0.30 0.60

OSCM 445 Green Belt Final Paper Steven M. Landwer
- 9 -
Appendix 2 One-way ANOVA: FCRG-East, FCRG-Center, FCRG-West Source DF SS MS F P
Factor 2 319.453 159.726 754.70 0.000
Error 5922 1253.351 0.212
Total 5924 1572.804
S = 0.4600 R-Sq = 20.31% R-Sq(adj) = 20.28%
Level N Mean StDev
FCRG-East 1975 23.300 0.441
FCRG-Center 1975 23.780 0.461
FCRG-West 1975 23.277 0.478
Individual 95% CIs For Mean Based on Pooled StDev
Level +---------+---------+---------+---------
FCRG-East (*-)
FCRG-Center (*-)
FCRG-West (-*)
+---------+---------+---------+---------
23.25 23.40 23.55 23.70
Pooled StDev = 0.460
Grouping Information Using Tukey Method
N Mean Grouping
FCRG-Center 1975 23.7804 A
FCRG-East 1975 23.2996 B
FCRG-West 1975 23.2768 B
Means that do not share a letter are significantly different.
Tukey 95% Simultaneous Confidence Intervals
All Pairwise Comparisons
Individual confidence level = 98.07%
FCRG-East subtracted from:
Lower Center Upper --------+---------+---------+---------+-
FCRG-Center 0.4465 0.4808 0.5150 (*)
FCRG-West -0.0570 -0.0228 0.0115 (*)
--------+---------+---------+---------+-
-0.30 0.00 0.30 0.60
FCRG-Center subtracted from:
Lower Center Upper --------+---------+---------+---------+-
FCRG-West -0.5378 -0.5036 -0.4693 (*)
--------+---------+---------+---------+-
-0.30 0.00 0.30 0.60
OSCM 445 Green Belt Final Paper Steven M. Landwer
- 10 -
Appendix 3 One-way ANOVA: FCSSOO-East, FCSSOO-Center, FCSSOO-West Source DF SS MS F P
Factor 2 216.432 108.216 418.16 0.000
Error 4329 1120.294 0.259
Total 4331 1336.726
S = 0.5087 R-Sq = 16.19% R-Sq(adj) = 16.15%
Level N Mean StDev
FCSSOO-East 1444 23.408 0.491
FCSSOO-Center 1444 23.921 0.523
FCSSOO-West 1444 23.498 0.511
Individual 95% CIs For Mean Based on Pooled StDev
Level -+---------+---------+---------+--------
FCSSOO-East (-*)
FCSSOO-Center (-*)
FCSSOO-West (-*)
-+---------+---------+---------+--------
23.40 23.55 23.70 23.85
Pooled StDev = 0.509
Grouping Information Using Tukey Method
N Mean Grouping
FCSSOO-Center 1444 23.9208 A
FCSSOO-West 1444 23.4981 B
FCSSOO-East 1444 23.4081 C
Means that do not share a letter are significantly different.
Tukey 95% Simultaneous Confidence Intervals
All Pairwise Comparisons
Individual confidence level = 98.07%
FCSSOO-East subtracted from:
Lower Center Upper ------+---------+---------+---------+---
FCSSOO-Center 0.4684 0.5127 0.5570 (*-)
FCSSOO-West 0.0457 0.0900 0.1343 (*)
------+---------+---------+---------+---
-0.30 0.00 0.30 0.60
FCSSOO-Center subtracted from:
Lower Center Upper
FCSSOO-West -0.4670 -0.4227 -0.3784
------+---------+---------+---------+---
FCSSOO-West (-*)
------+---------+---------+---------+---
-0.30 0.00 0.30 0.60

OSCM 445 Green Belt Final Paper Steven M. Landwer
- 11 -
Appendix 4
Bagger 1 269.83
Bagger 2 270.46
Bagger 3 271.30
Bagger 4 270.50
Bagger 5 268.95
All Baggers 270.43
Count 1197