Situation Report on Children, Youth and Women in the ...
69
-
Upload
khangminh22 -
Category
Documents
-
view
3 -
download
0
Transcript of Situation Report on Children, Youth and Women in the ...


1
Situation Report on
Children, Youth
and Women
in the
Federated States of
Micronesia
2004
First Draft
November 2004

2
Contents
Summary
1. Development trends in the Federated States of Micronesia
The situation analysis
FSM: a large federation of small islands
Development standards National averages
The nature and extent of poverty in the FSM
Differences between and within the states
An upside down economy, dependent on foreign aid Dependence on foreign aid
The economic reform program
The impact on employment
An upsurge in emigration
Ill-health, poor diet and loss of food security
A crowded environment and poor living conditions
Access to basic services
The changing social and cultural contexts of children’s and women’s lives The place of children
The place of youth
The roles of women
The role of the media in social change
Conclusions
2. The situation of children
Children in the population
Health and well-being Infants and young children
Children aged 5 to 14
Older teenagers
Child development
Early childhood education
Access to basic education
School facilities for disabled children
Child protection issues Child adoption
Children who are neglected or abused
Children who are exploited
Children who become pregnant
Children involved with the law
Public understanding about child rights
Conclusions
3
3. The situation of youth
Introduction
Education and training
Jobs and other livelihoods
Health and well-being
Main causes of illness and death
Sexually transmitted infections
Substance abuse
Suicide
The National Youth Policy, 2004-2010
Conclusions
4. The situation of women
Introduction
The general advancement of women
Decline in fertility
Women‟s health
Main causes of illness and death
Reproductive health
„Lifestyle‟ diseases
Injuries and poisoning
Obesity and diet
Domestic and sexual violence
Education
Livelihoods
Family responsibilities
Institutional mechanisms to promote the interests of women
Women‟s involvement in national and island politics
Conclusions
5. The agenda for change
References

4
Summary
As part of its country programmes, UNICEF assists governments to produce and update a report on development trends in their country that describes how these changes affect the well-being of children, youth and women. The national reports help to direct UNICEF‟s programmes and provide a useful reference for national agencies, the public and other development partners. This report presents an overview of the situation of children and women in the Federated States of Micronesia (FSM) at the start of the 21st century. It was drafted with help from many people in the FSM, and draws upon both published and unpublished information.
Long exposed to foreign cultures, FSM societies are now undergoing a period of particularly rapid social change, a situation intensified by recent efforts to reconstruct the economy. Economic and cultural forces of change have together transformed the structure of FSM households, from the predominance of the extended family several decades ago, to mostly nuclear households today.
Many people live with various forms of poverty, including economic hardship and poverty of opportunity. Unemployment and emigration have both escalated since the mid-1990s. Heavily dependent on foreign aid, particularly from the US, the FSM Government faces a considerable challenge to counter the deterioration of basic services to rural communities, particularly as aid receipts have decreased. Meanwhile, dependency on foreign aid has skewed the development of social services in particular ways, creating expensive, centralised services and large bureaucracies. The FSM Government recognises that reducing national dependency is difficult but very necessary – as also is to change systems of service delivery to more equitable and efficient forms. Dependency is also reflected in a prevalent view, that “development” is a government rather than community concern. Efforts are being made to build community capacity and involvement in development programs. Other than the churches, however, there are few non-government organisations to assist this process.
The health status of children in the FSM reflects the generally poor access to basic services, poor access to clean water and adequate sanitation, and poor nutrition. The education status similarly reflects the poor management of basic education services, especially in remote areas. Service delivery is difficult in small multi-island nations but the FSM measures up quite poorly against some other Pacific island countries that face similar difficulties.
Emerging health concerns for children include high consumption of nutritionally poor, processed foods and drinks, such as soft drinks, sweets, and processed food, and low consumption of fruits and vegetables. Even some young teenagers abuse substances such as tobacco, marijuana, betel and alcohol. Effective public health campaigns are needed to assist this generation at risk of serious health problems in their early to mid-adulthood.
There appears to be little general concern about the conditions of children in the FSM, but there is also little public understanding about the issues involved in the Convention on the Rights of the Child (CRC) or the need to promote child rights. Child labour is a case in point. In rural, semi-subsistence communities, children are expected to contribute some help to family work but, in the absence of any survey of child labour, it is difficult to be sure that this is an issue that deserves complacency. Other problems also lie beneath the general calm and pleasantness of FSM society, such as the physical and sexual abuse of children, for which the signs exist but there is little acknowledgement.
Young adults in the FSM face a number of difficulties, but particularly that of establishing themselves in livelihoods that fit with their expectations and aspirations. For this age group, the weaknesses of the education system are all too apparent. The poverty of opportunity with

5
which this age group especially is faced is evident in their low vocational and tertiary enrolments, high unemployment, high migration and in the social problems of substance abuse, crime and a high rate of suicide.
The National Youth Policy sets out to address these problems. It is an ambitious policy. Its success will largely depend on future economic growth in the FSM, and whether this growth is able to generate the types of jobs that young FSM people are qualified to perform.
As a group, women in the FSM have not shared well in the benefits of development in the FSM, such as they are. Their health status is quite poor, particularly in regard to reproductive health, with one of the highest maternal mortality rates in the Pacific island region. As they become more economically active in the public domain, they retain or even further gain domestic responsibilities and work-loads. Violence against women is of particular concern in the FSM.
The FSM is signatory to two most important international conventions that protect and advance the status of children and women, namely the Convention on the Rights of the Child and the Convention to Eliminate All Forms of Discrimination Against Women. Many policies have been developed to address particular issues, and many programs implemented, but the lack of coordination has worked against real benefits being realised by the community.
A lot of work has gone towards the present phase of national planning and the current National Strategic Development Plan. The plans for youth and women acknowledge and intend to address many of the current problems. Over the past decade, much has been promised, particularly in regard to improvements in the status of women. But the outcomes have been slow, and perhaps hard to realise by people in the community. The existence of these plans nevertheless shows that there is a strong desire in the FSM to work through the present difficulties and to create a more prosperous and equitable society. But whether these plans progress into practical action will depend not just upon the availability of necessary resources but on finding ways to overcome some of the problems of the past, particularly in the set-up of service delivery systems.
6
1. Development trends in the Federated States of Micronesia
The situation analysis As part of its country programmes, UNICEF assists governments to produce and update a report on development trends in their country that describes how these changes affect the well-being of children, youth and women. The national reports help to direct UNICEF‟s programmes and provide a useful reference for national agencies, the public and other development partners. This report presents an overview of the situation of children and women in the Federated States of Micronesia (FSM) at the start of the 21st century. It was drafted with help from many people in the FSM, and also draws upon both published and unpublished information.
The FSM joined the United Nations in 1990. In 1993, the FSM Government ratified the Convention on the Rights of the Child (CRC), thereby acknowledging its obligation to ensure the survival and health of children; to ensure that children benefit from education; to protect children from exploitation and cruelty; and to ensure that children are allowed to participate in society in accordance with their maturing capacities.
UNICEF is assisting countries to implement this convention and to monitor their progress. Within two years of ratification, each government must report their progress to an international review panel in Geneva. FSM‟s first report was presented in 1996 and the second was being finalised in late 2004. Progress on implementing the CRC is therefore an important backdrop to this report but will be discussed more fully in the next national CRC Implementation Report.
FSM: a large federation of small islands Located just above the equator in the northern Pacific Ocean, the FSM includes most of the Caroline Island archipelago.1 This is a country of 607 islands which total only 271 square miles of land, spread over approximately one million square miles of ocean and ranging 1,700 miles from east to west. Of these islands, only 65 are inhabited. They include both mountainous volcanic islands with fertile soils and arid, low-lying coral atolls. The climate is tropical with a marked monsoon season but the availability of water varies a great deal, from the well-watered high islands which receive heavy rain throughout the year, to the mostly dry atolls which often suffer from drought.
The FSM consists of four states which have considerable autonomy from one another and quite different histories, cultures, and living conditions: Kosrae, Pohnpei, Chuuk and Yap. Each state has its own executive, legislature and judiciary, with responsibility for state-wide economic and social development.
Half the population lives in Chuuk, most in Chuuk Lagoon which itself comprises three large groups of islands: the Northern Namoneas (Weno, Pis-Paneu and Fono); the Southern Namoneas (Tonoas, Fefen, Etten, Siis, Uman, Oarem and Totiw) and Faichuk (Eot, Udot, Romonum, Fanapanges, Wonei, Paata, Tol and Pole). There are six other island groups in the state. With a fast-growing population, Chuuk faces pressure on land
1 The western part of the archipelago is a separate country, the Republic of Palau.

7
resources and high under-employment, and is experiencing particularly rapid social change, urbanisation and labour migration.
Another one third of the population lives in Pohnpei, most on Pohnpei Island, which alone constitutes around half of the land area of the FSM. The state includes five other island groups. The seat of national government is at Palikir on Pohnpei Island. The largest urban area, Kolonia, the international airport and main port are also located there.
Ten per cent of the population lives in Yap, the western-most state, which has a total of 46 square miles of land, 405 square miles of lagoon, and includes 12 inhabited island groups. This is the most traditional state of the FSM, both in general adherence to local culture and the importance of subsistence production to the local economy.
With only 7 per cent of the national population, Kosrae is the least populated state. Lying furthest to the east and relatively remote from the rest of the country, this state includes the island of Kosrae, a steep, volcanic island which has no lagoon.
The Caroline Islands have had a long and complex colonial history. First claimed by Spain in the sixteenth century, a short-lived Spanish colonial government administered some of the islands from the 1880s to 1890s, when they were purchased by Germany. Germany ruled the islands until 1914 and the outbreak of World War I, when its possessions in Micronesia were seized by Japan. The islands were governed as a Japanese colony until the end of World War II in 1945, after which their administration passed through trusteeship of the United Nations to the United States, and they became part of the United States Trust Territory of the Pacific Islands. In 1979 the FSM was formed through the unification of the four island groups: Chuuk, Pohnpei, Yap and Kosrae. In 1986, the FSM became a quasi-independent nation under a Compact of Free Association with the United States. Under this agreement, a major US presence remains in the area for military purposes and to oversee funding and other conditions of the Compact.2
The population of the FSM, which numbered around 108,200 in 2004, is almost entirely Micronesian. A few Polynesians live in Pohnpei State and a few expatriate workers live throughout the country, less now than in the 1970s. In the 1970s and 1980s, most foreign residents were Asian male workers. Since the early 1990s, a growing but still small number of residents have been from the US, most filling senior professional and managerial positions.3
As happened throughout the world, in the twentieth century the FSM experienced an increase in average life expectancy at birth, rising by almost seven years from 1969 to 2000.4 Mortality rates dropped, especially for infants and children, and fertility rose.5 From the 1950s, the population grew very quickly. This very fast growth began to slow down in the 1970s as fertility rates crept down and emigration from the FSM started to grow.
2 Division of Statistics, 2000.
3 National Census, 2000:40.
4 Census, 2000.
5 An important impact of the Christian churches, colonial governments, and the general process of economic change was to change the status of women and discourage traditional practices that limited fertility, such as abortion, use of traditional contraceptives, taboos on particular male-female relations, and, in some places, infanticide. Such traditions in various parts of FSM have been described by many anthropologists including E. Hunt, 1949; D. Schneider, 1955; K. Sudo, 1985; J. Underwood.

8
Figure 1
Rising life expectancy at birth, 1970-2000
45
49
53
57
61
65
69
73
1970 1975 1980 1985 1990 1995 2000
Approximate year
Age in
years
Total
Male
Female
Source: National Censuses, 1994, 2000
In 2000, average life expectancy at birth was 67.2 years, 66.6 years for males and 67.7 years for females
Figure 2
Population growth by state, 1920-2000
0
10,000
20,000
30,000
40,000
50,000
60,000
1920 1925 1930 1935 1940 1945 1950 1955 1960 1965 1970 1975 1980 1985 1990 1995 2000
Yap
Chuuk
Pohnpei
Kosrae
Source: National Census, 2000
The State of Chuuk has the largest and fastest growing population but population growth has almost stalled everywhere since the mid-1990s.
The average number of children per woman has almost halved over the past thirty years, dropping from 8.2 in 1973 to 4.4 in 2000. Although fertility has dropped, it is still high. This is reflected in the young age structure of the population, with 44 per cent under the age of 15 years, and a crude birth rate of 22.3 in 2000.6 This level of fertility would still create a fast-growing population were it not for emigration.
Because of the drop in fertility and rise in emigration, population growth slowed from 2.6 per cent per year between the early 1970s and the mid 1980s; to about 1.9 per cent a year from the
6 FSM Department of Health, 2001.

9
mid 1980s to mid-1990s. 7 Since the mid-1990s, this growth has virtually stopped, with the population growing at only 0.3 per cent per year from 1994 to 2000 because of an enormous increase in emigration in response to a cutback in public sector jobs.
Development standards
National averages
Measuring development standards in the FSM is difficult. Although the Division of Statistics has produced useful data through a series of national surveys, the quality of data from service administrations such as health and education suffers from reporting and coordination difficulties among the many islands and between the four state and one national governments. With regard to health statistics, for example, the FSM has no national hospital or health services, the four states independently operate and maintain their own facilities, and there is only partial reporting to national government. Mortality rates are especially erratic and inaccurate because of the small number of deaths and under-reporting, especially of child deaths.8 Only around 80 per cent of births and 60 per cent of deaths are registered.9 The smallness of island populations also makes statistical rates unstable.
On the Human Development Index, the FSM ranks in the mid-range of its neighbouring Pacific island countries, with similar basic conditions of human development to Samoa, Tuvalu and Marshall Islands. The HDI for the FSM is high mainly because of relatively high GDP per capita and this largely reflects a high level of foreign aid. On many other indicators, conditions in the FSM are quite poor.
Figure 3
HDI for Pacific Island countries, 1999
0
0.1
0.2
0.3
0.4
0.5
0.6
0.7
0.8
0.9
1
Palau Cook
Islands
Niue Fiji Islands Tonga Samoa Tuvalu FSM M arshall
Is
Kiribati Vanuatu Solomon
Is
HD
I
Source: UNDP, 1999 HDI is a general measurement of literacy, life expectancy, and GDP per capita.
7 National Census, 2000.
8 Census, 1994.
9 Ministry of Health statistician, Pers. Comm.. The Ministry is trying to improve this situation by strengthening the reporting system from the dispensaries to the state and national level and more training of health personnel.

10
Table 1 Progress in the FSM towards the goals of the World Summit for Children
Goal Measurement 1980 1990 2000 Progress in last decade
Reduce mortality for children under the age of five
1
Infant mortality rate (deaths per 1,000 live births)
48 46(1994) 40
Child mortality rate (deaths under 5 yrs per 1,000 live births)
17 16(1994)
12
Immunisation coverage for infants (%)
81
Reduce child malnutrition 2 Newborns weighing at least
2500 gm at birth (%) 89
Under-weight children under 5 yrs (%)
13 13 15 (1997) SPC
Improve adult literacy 3 Adult literacy rate (%) 89 94
(1994) 92
Ensure universal access to basic education
4
Net primary enrolment (%) 75.3 93.7 (1994)
92.3
10-14 yr olds in school (%)
Ensure universal access to safe drinking water and sanitation
5
Safe drinking water (% of households)
67 80 86 (41? Min
Health)
Basic sanitation (% of households)
7.9 27.5 25.2 (49? Min
Health)
Reduce maternal mortality 6 Maternal mortality rate
(pregnancy related deaths per 100,000 live births)
83 95 (1993)
274 (1999, Min
Health)
Births delivered by trained personnel (%)
87 (2001)
Symbols: positive change; no appreciable change; going backwards; √ already at target level
World Summit Goals: 1. One-third reduction of 1990 infant mortality rates by 2000; to below 35/1000 by 2015; and to less than 70/1000 for under-five
mortality (also ICPD). 2. The halving of the 1990 rate by 2000. 3. The halving of the 1990 adult illiteracy rate by 2000 (also WSSD).
10
4. Complete access to primary school by both girls and boys before 2015, and extend access to and completion of secondary school (also ICPD, WSSD).
5. Safe drinking water and proper sanitation for all (also WSSD, ICPD, HFA).
The nature and extent of poverty in the FSM
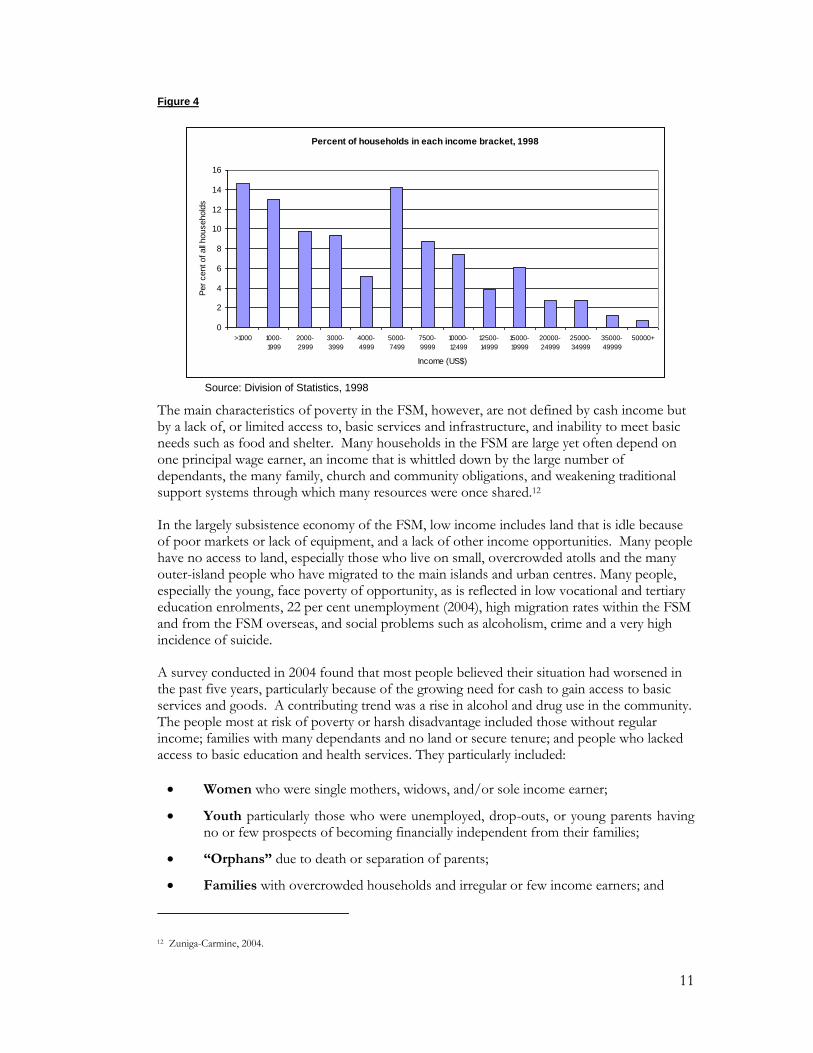
Poverty affects many people in the FSM. With a human poverty index of 26.7, the FSM has the fourth highest extent of poverty in the Pacific island region.11 In 1998, a national household and income survey found about 40 per cent of FSM households had incomes too low to afford basic living costs and a basic nutritious diet. Just over half (52 per cent) of all households earned less than US$5,000 a year, and 14 per cent earned less than $1,000 (Figure 4).
10 There has been no survey of adult literacy in FSM. The 1994 and 2000 censuses asked whether each person could read and write in any language. Although this may not be an accurate way to measure it, literacy is likely to be high as reported because elementary education has been widely available since the 1950s.
11 Asian Development Bank, 2000.
11
Figure 4
Percent of households in each income bracket, 1998
0
2
4
6
8
10
12
14
16
>1000 1000-
1999
2000-
2999
3000-
3999
4000-
4999
5000-
7499
7500-
9999
10000-
12499
12500-
14999
15000-
19999
20000-
24999
25000-
34999
35000-
49999
50000+
Income (US$)
Per
cent of all
household
s
Source: Division of Statistics, 1998
The main characteristics of poverty in the FSM, however, are not defined by cash income but by a lack of, or limited access to, basic services and infrastructure, and inability to meet basic needs such as food and shelter. Many households in the FSM are large yet often depend on one principal wage earner, an income that is whittled down by the large number of dependants, the many family, church and community obligations, and weakening traditional support systems through which many resources were once shared.12
In the largely subsistence economy of the FSM, low income includes land that is idle because of poor markets or lack of equipment, and a lack of other income opportunities. Many people have no access to land, especially those who live on small, overcrowded atolls and the many outer-island people who have migrated to the main islands and urban centres. Many people, especially the young, face poverty of opportunity, as is reflected in low vocational and tertiary education enrolments, 22 per cent unemployment (2004), high migration rates within the FSM and from the FSM overseas, and social problems such as alcoholism, crime and a very high incidence of suicide.
A survey conducted in 2004 found that most people believed their situation had worsened in the past five years, particularly because of the growing need for cash to gain access to basic services and goods. A contributing trend was a rise in alcohol and drug use in the community. The people most at risk of poverty or harsh disadvantage included those without regular income; families with many dependants and no land or secure tenure; and people who lacked access to basic education and health services. They particularly included:
Women who were single mothers, widows, and/or sole income earner;
Youth particularly those who were unemployed, drop-outs, or young parents having no or few prospects of becoming financially independent from their families;
“Orphans” due to death or separation of parents;
Families with overcrowded households and irregular or few income earners; and
12 Zuniga-Carmine, 2004.

12
People who were landless, mentally or physically challenged, “lazy” and always drinking “sakau”, men without wives (widowers), or elderly without a regular income or children to rely on.13
Table 2 Priorities for change identified by the communities
Women Men Youth
Access income generating opportunities (e.g., job, market access)
Access to income opportunities (e.g., market access, jobs creation, livelihood tools)
Job opportunities
Improved access to basic services and infrastructure (e.g., community school, health centre, transport, power supply)
Improved access to basic services (e.g., island transport, education, health, power supply, water)
Improved access to basic services (e.g., education, paved road)
More access to family planning information
Access to information (e.g., family planning, good parenting, and planning)
Access to scholarships & skills training
Access to skills & recreation centre Accountability of government funds Have community training & recreation centre particularly for school drop-outs
Solution to drugs & alcohol issues
Enforcement of law on child support
Source: Zuniga-Camine, 2004
Differences between and within the states
Geographical and historical differences between the states are reflected in their economies and other aspects of their development. There are also significant disparities within each state. Around 18,000 people, 17 per cent of the national population, live on remote atolls far from main islands and urban centres. Most people, economic opportunities, modern facilities, and forces of social change are concentrated in the towns and on the main islands. Within each state, government offices are situated on the largest island which is also the centre of commerce, post-primary education, transportation (airport and dock facilities), and medical services. Dispensaries are located in most urban centres and on islands with relatively large populations. These facilities and opportunities are generally much less accessible to people in small, remote and often conservative communities in the outer islands.
Differences in opportunity and lifestyle within and between states drive urbanisation and emigration. In Pohnpei State, over 2,000 outer islanders have settled on the main island of Pohnpei. In Chuuk, 5,000 outer islanders have moved to the small island of Weno, the state capital.
Table 3 Urban and rural households with electricity, * by state, 2000
FSM Yap Chuuk Pohnpei Kosrae
Urban households 81 88 72 90 100
Rural households 30 54 10 34 100
Source: 2000 FSM Census Note: * Includes electricity from solar power and generator.
13 Zuniga-Carmine, 2004.
13
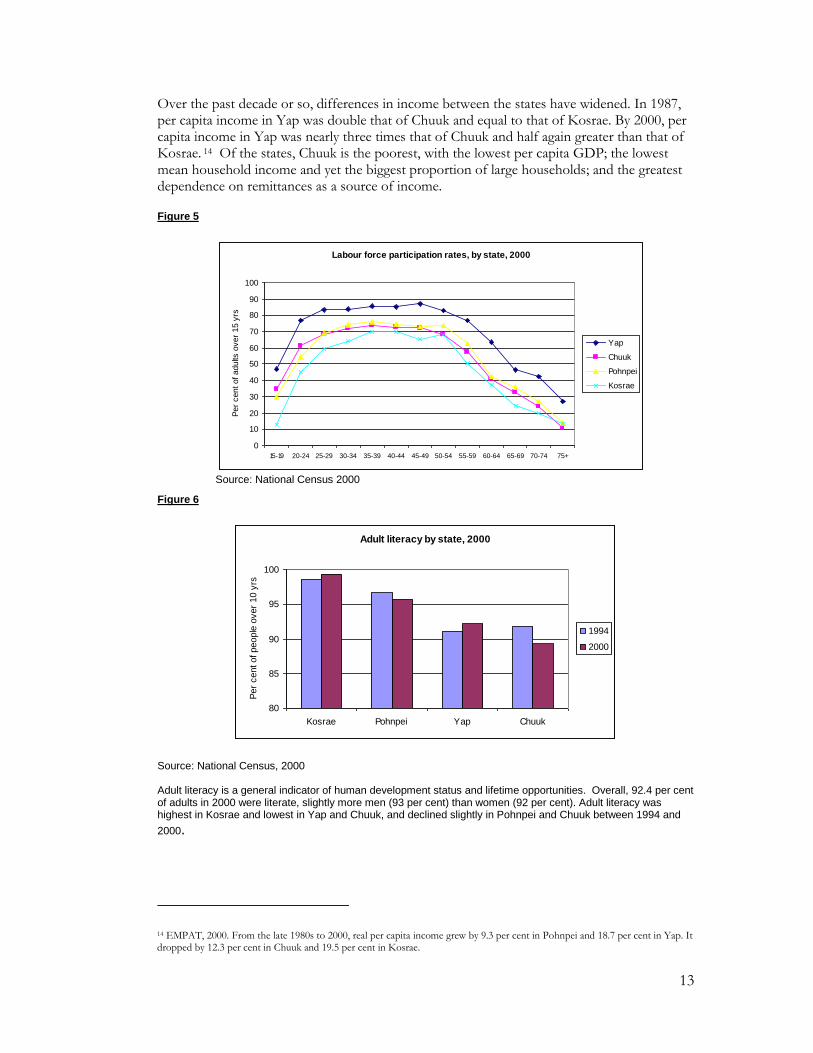
Over the past decade or so, differences in income between the states have widened. In 1987, per capita income in Yap was double that of Chuuk and equal to that of Kosrae. By 2000, per capita income in Yap was nearly three times that of Chuuk and half again greater than that of Kosrae. 14 Of the states, Chuuk is the poorest, with the lowest per capita GDP; the lowest mean household income and yet the biggest proportion of large households; and the greatest dependence on remittances as a source of income.
Figure 5
Labour force participation rates, by state, 2000
0
10
20
30
40
50
60
70
80
90
100
15-19 20-24 25-29 30-34 35-39 40-44 45-49 50-54 55-59 60-64 65-69 70-74 75+
Per
cent of adults
over
15 y
rs
Yap
Chuuk
Pohnpei
Kosrae
Source: National Census 2000
Figure 6
Adult literacy by state, 2000
80
85
90
95
100
Kosrae Pohnpei Yap Chuuk
Per
cent of people
over
10 y
rs
1994
2000
Source: National Census, 2000
Adult literacy is a general indicator of human development status and lifetime opportunities. Overall, 92.4 per cent of adults in 2000 were literate, slightly more men (93 per cent) than women (92 per cent). Adult literacy was highest in Kosrae and lowest in Yap and Chuuk, and declined slightly in Pohnpei and Chuuk between 1994 and
2000.
14 EMPAT, 2000. From the late 1980s to 2000, real per capita income grew by 9.3 per cent in Pohnpei and 18.7 per cent in Yap. It dropped by 12.3 per cent in Chuuk and 19.5 per cent in Kosrae.

14
An ‘upside-down’ economy, dependent on foreign aid
Dependence on foreign aid
The FSM economy has been described as „upside-down‟ because wage employment has long depended more on jobs in government than in the private sector or any productive
industry.15 In the late 1990s, imports were more than ten times the value of exports.16
Despite a major effort to readjust the economy during the 1990s, it remains dominated by public sector spending and employment and heavily dependent on aid.
From the 1960s, money from the United States through the Compact of Free Association and other federal programmes has supported large bureaucracies in the national, state and municipal governments. This accounted for most of the growth in paid jobs; provided cash incomes for many households; promoted the monetization of the FSM economy, particularly in the urban areas; and had a major effect on the structure of families and communities. 17 The aim of the Compact was to help make the FSM self-sufficient but ironically it served instead to greatly inflate the public sector and imports, handicap the private sector and discourage local production. In 2004, the FSM still had few exports and a large trade imbalance, and self-sufficiency was still elusive.
Under a new Compact of Free Association for 2004-2023, the US will continue its substantial aid to the FSM but the national and state governments will also contribute to the start-up capital of a Compact Trust Fund. There will be a shift from general budgetary grants to sector grants linked to performance conditions. US financial contributions will be $104.9 million annually from 2005.18
The economic reform program
The first „step-down‟ in Compact funding in 1992 was partly eased by government borrowing and the level of public expenditure barely changed. The second step-down in 1997, however, was felt more directly for it coincided with a campaign to reform the economy by cutting public sector expenditure and the number of public servants. It was recognised that this was bitter medicine; that in the short term at least, the „fiscal adjustments‟ would impact negatively and quickly on living standards.19 Policy-makers hoped the private sector would quickly expand to fill the vacuum, yet acknowledged that the FSM neither had, nor was producing, the necessary human resources.20
The cuts had immediate effect on government services. As well as shedding employees, Chuuk and Pohnpei States had to institute a four-day work week and a 20 per cent pay cut for remaining staff. Between 1997 and 1999, the public work force dropped by 23 per cent and the wage bill by 29 per cent – less than anticipated but large cuts nevertheless. The drop in paid employment resonated throughout the economy, causing a general drop in demand
15 Hezel, 1996.
16 FSM Division of Statistics, 2004. In 1997, the value of imports was US$82.5 million, and exports US$ 8 million.
17 Funding from the Compact amounted to US$60 million per year 1986-1990, $51miilion per year, 1991-1995, and $40 million per year 1996-2001. Other US assistance programs added approximately $50 million more each year. (US Department of the Interior, 1999).
18 ADB, 2004. 19 Asian Development Bank, 2000.
20 Eg. Asian Development Bank, Human Resources paper.

15
for goods and services. Only subsistence farming and fishing were little affected, for they are still largely outside the cash economy and insulated from it.
From 1995 to 2000, GDP fell an average 1.1 per cent each year. Most affected were Chuuk and Kosrae where there were very few paid jobs outside the public sector. The impact was also quite hard felt in Pohnpei after 1995 through the effect on the national government which is located there. GDP growth has since rebounded as the private sector resumed some of the activity lost by Government. Private sector employment has grown, but slowly - but so too have emigration and unemployment.
Despite the wide impact of the economic reforms, by the late 1990s it was evident that further, extensive, long-term economic adjustment was needed if dependence on aid was to be reduced. In 2004, national and state governments were adjusting their spending in line with lower aid receipts.
The impact on employment
From the mid 1990s, the growth of jobs almost stopped. Employment opportunities have changed in three major ways, all having multiple effects throughout the society and on the well-being of children, women and all parts of the population.
Figure 7
Job growth, 1970-2000
0
500
1,000
1,500
2,000
2,500
3,000
3,500
1970-75 1975-80 1980-85 1985-90 1990-95 1995-2000
Five-year period
Num
ber
of new
jobs
Source: Micronesian Seminar, 2001
More unemployment From 1994, unemployment has risen sharply, reaching 22 per cent in 2004. The number of unemployed men rose at every age except the very oldest. Although unemployment has always been higher for women, their pattern of change was not so regular: unemployment fell for younger and older women and rose only for women in their late 20s and 30s. In other words, employment opportunities have dropped for men of all ages but grown for younger and older women.

16
Female unemployment, 1994 & 2000
0
10
20
30
40
50
60
15-19 20-24 25-29 30-34 35-39 40-44 45-49 50-54 55-59 60-64
Age-group
Per
cent of la
bour
forc
e
1994
2000
Figures 8a & 8b
Male unemployment, 1994 & 2000
0
10
20
30
40
50
60
15-19 20-24 25-29 30-34 35-39 40-44 45-49 50-54 55-59 60-64
Age-group
Per
cent of la
bour
forc
e
1994
2000
A decrease in employment in the public sector and a small increase in employment in the private sector. The private sector replaced some of the lost government jobs. Government pay rates are generally twice as high as in the private sector, so for many people this change involved a cut in income.
Figure 9
Sectors of employment, 1994 & 2000
0
10
20
30
40
50
1994 2000
Per
cent of fo
rmal w
ork
-forc
e
State Govt
Private enterprise
Self-employed
17
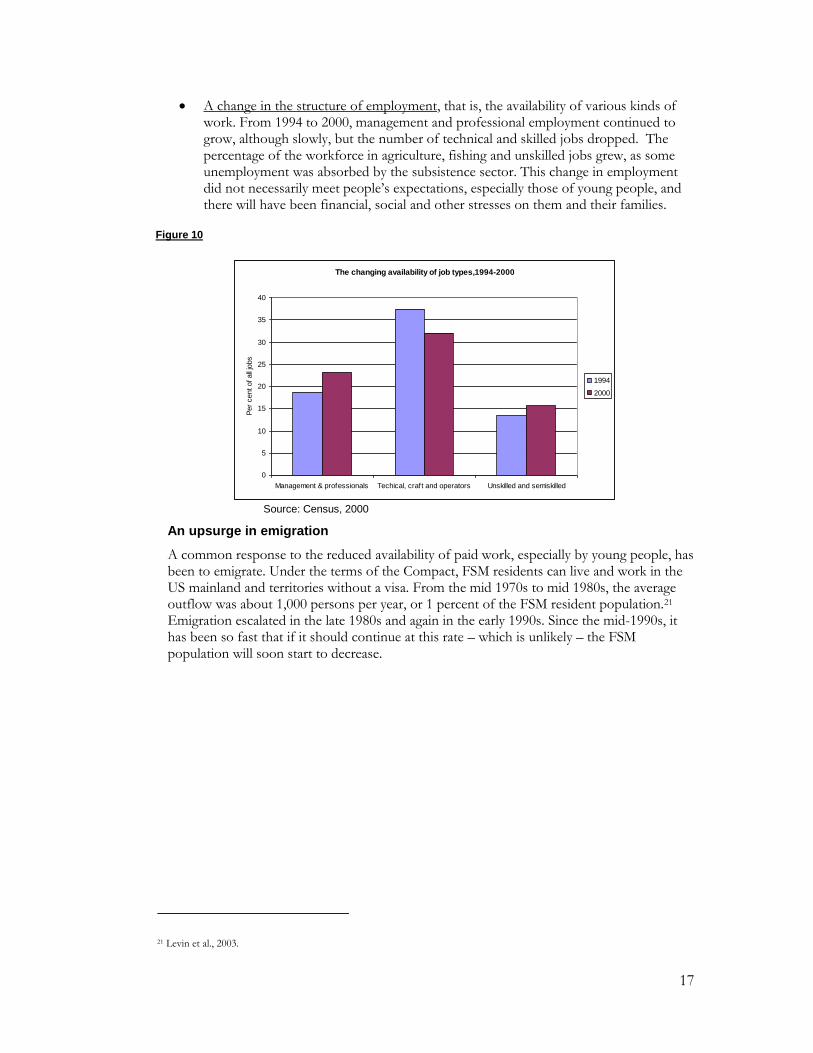
A change in the structure of employment, that is, the availability of various kinds of work. From 1994 to 2000, management and professional employment continued to grow, although slowly, but the number of technical and skilled jobs dropped. The percentage of the workforce in agriculture, fishing and unskilled jobs grew, as some unemployment was absorbed by the subsistence sector. This change in employment did not necessarily meet people‟s expectations, especially those of young people, and there will have been financial, social and other stresses on them and their families.
Figure 10
The changing availability of job types,1994-2000
0
5
10
15
20
25
30
35
40
Management & professionals Techical, craft and operators Unskilled and semiskilled
Per
cent of all
jobs
1994
2000
Source: Census, 2000
An upsurge in emigration
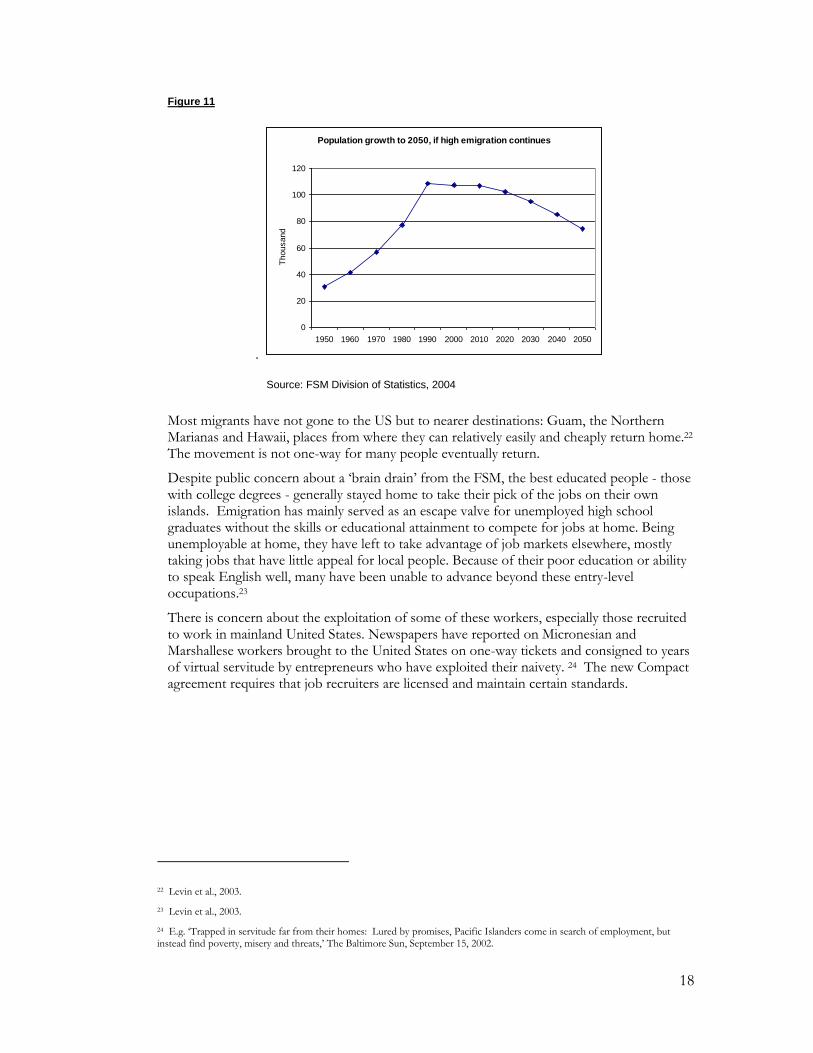
A common response to the reduced availability of paid work, especially by young people, has been to emigrate. Under the terms of the Compact, FSM residents can live and work in the US mainland and territories without a visa. From the mid 1970s to mid 1980s, the average outflow was about 1,000 persons per year, or 1 percent of the FSM resident population.21 Emigration escalated in the late 1980s and again in the early 1990s. Since the mid-1990s, it has been so fast that if it should continue at this rate – which is unlikely – the FSM population will soon start to decrease.
21 Levin et al., 2003.
18
Figure 11
.
Population growth to 2050, if high emigration continues
0
20
40
60
80
100
120
1950 1960 1970 1980 1990 2000 2010 2020 2030 2040 2050
Thousand
Source: FSM Division of Statistics, 2004
Most migrants have not gone to the US but to nearer destinations: Guam, the Northern Marianas and Hawaii, places from where they can relatively easily and cheaply return home.22 The movement is not one-way for many people eventually return.
Despite public concern about a „brain drain‟ from the FSM, the best educated people - those with college degrees - generally stayed home to take their pick of the jobs on their own islands. Emigration has mainly served as an escape valve for unemployed high school graduates without the skills or educational attainment to compete for jobs at home. Being unemployable at home, they have left to take advantage of job markets elsewhere, mostly taking jobs that have little appeal for local people. Because of their poor education or ability to speak English well, many have been unable to advance beyond these entry-level occupations.23
There is concern about the exploitation of some of these workers, especially those recruited to work in mainland United States. Newspapers have reported on Micronesian and Marshallese workers brought to the United States on one-way tickets and consigned to years of virtual servitude by entrepreneurs who have exploited their naivety. 24 The new Compact agreement requires that job recruiters are licensed and maintain certain standards.
22 Levin et al., 2003.
23 Levin et al., 2003.
24 E.g. „Trapped in servitude far from their homes: Lured by promises, Pacific Islanders come in search of employment, but instead find poverty, misery and threats,‟ The Baltimore Sun, September 15, 2002.

19
Despite having mostly low-paid jobs, the income earned by migrants has increased rapidly and is large compared to earning levels at home. Since around 1994, the inflow of remittances has grown to become an important source of household income in the FSM. Initially remittances were mostly food and second-hand clothes, but now a large amount is cash. In 1994, remittances totalled $1.26 million, on average nearly 15 percent of the total income of households that reported receiving them. Almost three-quarters of these remittances went to Chuuk, where almost 29 per cent of households (double the national figure) reported receiving them.25
Ill-health, poor diet, and loss of food security
The burden of ill-health in the FSM is high. While the prevalence of vaccine-preventable diseases has declined considerably, parasitic and infectious diseases – especially those borne by food and water - are still major causes of sickness and death. These sicknesses include acute respiratory infections, influenza, otis media, diarrhoea, gastroenteritis, and conjunctivitis. The FSM has the highest prevalence of leprosy in the Pacific and a growing incidence of tuberculosis.26 Poor reproductive health is a major cause of morbidity and mortality among women. Sexually transmitted infections are also quite prevalent, and the known number of people infected with HIV has grown quickly, to reach 49 in 2004 and raise concern about the possibility of a serious HIV epidemic.
Generally, however, over the past several decades there has been a steady reduction in infectious diseases, but epidemic-like rises in diseases related to diet and lifestyle, especially diabetes and hypertension. „People in the FSM, starting in childhood, are eating too much of the wrong foods, smoking and chewing [betel nut] excessively, drinking too much, using dangerous substances too often, and generally participating too often in dangerous behaviour.‟27 Non-communicable diseases are now major causes of illness and death among adults who are dying from myocardial infarctions, strokes and peripheral diseases at relatively young ages.28
The change in diet, from the traditional one of locally available foods to one of imported foods, and a change in daily routine, from vigorous activity to a sedentary lifestyle that comes with the moneyed economy, is thought to be the single most important factor in this increased morbidity among the adult populations. Foods with excess amounts of animal fats, such as found in canned meats (spam and other local favourites) and turkey tails lead directly in the adult population to the current high rates of obesity, diabetes mellitus, and hypertension. Children‟s diets of Cheese Whiz, soft drinks, rice and soya sauce have led to vitamin A deficiency which, on islands rich with a perennial supply of papayas and mangoes, should be as rare as malaria in Iowa.29
Although 20 per cent of households depend for their livelihood on subsistence agriculture and around 80 per cent of households do so to some extent, food security in the FSM has plummeted.
25 National Census, 2000.
26 Ministry of Health?? In 1998-2000, there were 31.16 cases of leprosy per 10,000 population, with 189 new cases detected. In the same period, 394 new cases of tuberculosis were detected.
27 Ministry of Health, Health Sector Strategic Plan, 2004.
28 Flear, 1997.
29 Flear, 1997.

20
Chuuk State, with a large and growing population and little arable land, is particularly vulnerable to food shortages, particularly as many households have little cash with which to buy imported food.
Traditional subsistence foods have been largely replaced by imported foods.30 Traditional foods are now often regarded as inferior to store-bought foods, and not recognised for their economic and nutrition value. Efforts are being made to change this perception, work that needs to be sustained for a long time.
Even though subsistence agriculture serves as the backbone of the FSM economy in terms of the number of livelihoods it provides for, agricultural extension services have concentrated on commercial producers and given little attention to the subsistence tradition and crops.
Food security in the outer islands largely depends on swamp taro and coconuts, both crops now under pressure. Traditional methods to protect swamp taro from seawater damage are almost lost, just as the threat of environmental change has increased. Deforestation on atolls – often a response to population pressure - largely involves the loss of food trees.31 Many people now eat imported rice instead. The move away from traditional foods exposes people to problems such as cash shortages and shipping delays. In 2004, Kapingamarangi Island (Pohnpei State) faced famine because of shipping delays and salt damage to taro pits.32
The greatest impetus to increased food security may have been the recent economic difficulties. Food dropped from almost 27.8 per cent of all imports in 1995 to 24.8 per cent in 1999, and there was a major drop in all imports in the mid-1990s.33 It appears that with less cash to spend, many families are partly returning to local foods.
A crowded environment and poor living conditions
As the population has both grown and concentrated in the main islands and urban centres, so too has pressure on land resources, infrastructure and services. Faced with the dual challenges of a growing population and a country of many small and remote islands, the government has faced difficulty in expanding services and infrastructure fast enough and ensuring their fair distribution.
Environmental change has been rapid. Urgent environmental concerns include the growing towns with poor services; poor management of solid wastes, including toxic and hazardous wastes; destruction of reefs by dynamite fishing and cyanide poisoning (especially in Chuuk); poorly controlled entry of non-indigenous plant and animal species; and over cultivation of steep slopes and erosion.34 The average annual rate of deforestation 1990-2000 was 4.5 per cent,35 a very serious concern on atolls in particular.
The availability of safe water supplies has improved over the past two decades. Yet public and community systems still cater for only around 30 per cent of the population, mostly in
30 FSM Government, FSM Strategic Development Plan, 2005-2023, in draft; Engelberger et al., 2003.
31 Engelberger, L, 2004.
32 FSM Government, FSM Strategic Development Plan, 2005-2023, in draft.
33 ADB, Website, 2004: data on imports.
34 South Pacific Regional Environment Program, 1993.
35 ADB, 2004 [web-page].

21
the urban areas. Catchments, tanks and drums include quite a variety of water collection arrangements, some more safe than others, but if they are all included, around 86 per cent of the population has access to safe water. Atoll dwellers, in particular, nevertheless often face water shortages. Public sewage systems and septic tanks also cater for only a small part of the population, up from 5 per cent in 1980 to 10 per cent in 2000. Only about 25 per cent of housing units are connected to a sewer, septic tank or cesspool. Human waste disposal now poses a major environmental problem, especially on densely populated atolls. Skin diseases are the most common reason for out-patient treatment and diarrhoeal disease is a major health problem, especially for children.
Table 4 Access to drinking water and sanitation
Access to improved drinking water (% of occupied households) 2000
Urban 92.7
Rural 86.4
Access to improved sanitation (% of occupied households) 2000
Urban 59.1
Rural 15.4
Source: 1994 and 2000 FSM Censuses, Table H3 and unpublished data.
Figure 12a & b
Sources of drinking water, 1980-2000
0
10
20
30
40
50
60
1980 1994 2000
Per
cent of housin
g u
nits
Catchment, tanks, drums
Public & community systems
Other
Individual w ell
Public standpipe
Sewage disposal, 1980-2000
0
20
40
60
80
100
1980 1994 2000
Per
cent of housin
g u
nits
Other
Septic tank, cesspool
Public sew er
Source: National censuses, 1994, 2000

22
Access to basic services
As with the economy, high levels of foreign aid have generally not served the development of basic services well in the FSM. Both the education and health systems are expensive to operate yet do not reach everyone, are highly centralised and, for health, are government-run with little community involvement. Many services operate separately under specific US federal-funded aid programs. Not only does this make them vulnerable to funding cuts, it works against overall system coordination. As well, many programs were designed for disadvantaged minorities in the US, not the specific conditions of the FSM, for example programs on drug abuse but not diabetes. 36 This inappropriateness has detracted from long-term improvements in social or economic conditions. Recent sector strategies acknowledge these problems and aim to solve them.
A recent survey found that communities throughout the FSM described limited access to services as a fundamental part of their poor quality of life.37 They acknowledged improvements to local facilities such as an improved village water supply, the presence of community unity, and the availability of some church programs. Most communities however believed that the quality of services and their standard of living had deteriorated due to:
The limited reach of basic services mostly only to households located along the main roads;
The inability of many households to afford basic goods and services such as education and communication;
The declining income of households for several reasons, including limited transport to sell produce or loss of traditional markets; and
Increasing social problems such as alcohol and drug abuse, stealing, and breakdown of marriages.
In recent years, health services have particularly deteriorated throughout the country. 38 It has long been acknowledged that they do not adequately address most people‟s health care needs. Health services are unevenly distributed by island and income group. Most resources are spent on hospital-based curative care in the main centres and off-island referrals for a fortunate few.39 Since the 1970s, there have been several unsuccessful attempts to decentralize health care from the hospitals to community dispensaries. In the 1990s this effort was weakened by concern over whether it was a cost-effective move in a time of shrinking funds. 40
Most rural people have little access to basic health care services. Many dispensaries lack adequate drugs, medical supplies and equipment, many health workers are poorly trained, and morale is low. After the step-down of Compact funds in the early 1990s, there has been minimal travel by health care officials and supervision and management of the clinics has deteriorated. Most people by-pass the clinics if they can and go directly to the hospital,
36 Schoeffel, 1993.
37 Zuniga-Carmine, 2004.
38 Ministry of Health, Health Sector Strategic Plan, 2004.
39 National Advisory Committee on Children, 1996.
40 J. Flear, 1997.

23
putting pressure on these facilities also. In recent times, every hospital has faced shortages of the most basic medicines and supplies.41
The health sector strategy now focuses on five goals, to improve both primary and secondary health services, to prioritise health promotion and services for major health problems, to ensure a sustainable health care financing mechanism, and to improve resource allocation and accountability systems. The strategy to develop a health care financing mechanism includes a move away from the current free service to user fees, health insurance and other sources of funding such as ear-marked taxes. Many services may be privatised or
corporatised. In order for users to be able to pay these costs, the strategy noted that
considerable economic growth must occur – perhaps a doubtful outlook for the FSM, at least in the short term.
Similarly for education, there are relatively high levels of public spending but it has been unevenly distributed. Because many programmes depend on specific aid funding,
they are vulnerable to sudden cuts. It has proven difficult to develop any overall national coordination. Although adult literacy and school enrolments are high, there is concern that the quality of education is falling. The FSM is not producing high school graduates to the levels achieved by earlier generations, nor the range of skills required for a modernising economy. The education system is handicapped by a lack of good facilities, too few well trained teachers; poor coordination between the states and national government; and generally poor planning, monitoring and management.42
The education sector strategy intends to address these problems by improving the quality of preschool, primary and secondary education services, and redirecting the education system to better met the manpower needs of the nation. Planned improvements to education include the provision of instructional and support services to schools; better school facilities and maintenance; more education services for disabled people; the provision of boarding, feeding and transportation services; improved teacher training and qualifications; changes to the curricula and instructional materials; improved administration and evaluation programmes; the development of an accreditation system for FSM schools; and improved accountability, information management and reporting systems.
The social and cultural context of children’s and women’s lives
Because of the marked cultural and historical differences between the states and even within each state, it is difficult to generalise about the traditional roles of people in the FSM, other than to say that outer island people tend to be more conservative because of their distance from the forces of social change on the main islands.43
The place of children
Over the past few decades, family structures in the FSM have changed in quite fundamental ways. The raising of children was largely a community responsibility rather than directly that of the biological parents but as households have become more nuclear in structure, children are now more likely to be considered the responsibility of their parents. Where it was once
41 Flear, 1997.
42 ADB 1995 Human Resources Study.
43 Schoeffel, 1993..

24
common for children to be adopted or brought up by their relatives or other families, this is less so today. The burden of child-rearing now falls directly on parents and there is much less intervention by other relatives in conflicts between parents and children. Relationships between men and their sons have become particularly difficult, and children and women generally are easier targets for abuse now than in the past when social controls operated much more effectively.44
Within their families, most children are expected to help with household chores but the borderlines between family help and real work are somewhat blurred. By law all children must complete primary school, but there is little enforcement of this. Nor is there any legal definition of a minimum age for employment. It is difficult, therefore, to know the extent to which children that are out of school are at work in the FSM. There are probably very few young children in the formal work-force because there are few paid jobs, but no doubt many do work in the informal sector. There has been no survey of the extent or nature of child labour in the FSM.
The place of youth
Young people in the FSM are on the cutting edge of social and economic change. The economic changes of the 1990s, in particular, have thrown into sharp light the long-standing problem in the FSM of inadequate and inappropriate education which poorly fits young people to the available jobs, and particularly to their expectations of work and lifestyle. Expectations of their families and communities about their behaviour and achievements also weigh heavily on young people. One difficulty is ambiguity about how they can participate in society, according to the cultural dictates of an older generation, on one hand, and the vision of society portrayed through modern media, on the other. These tensions evidently underlie social problems associated with this age-group, particularly substance abuse, unruly and risky behaviour, and a very high rate of suicide.
This report examines key areas in their lives of young people: their health and well-being, education, employment, and the participation of youth in society.
The roles of women
There is great variation in culture within the FSM and therefore in the traditional status of women. As generalisations, however, FSM women traditionally had important responsibilities as caretakers of the land.45 Over the past century or so they have experienced a generally similar process of change: 46
Most communities (except the main islands of Yap, which were patrilineal) were once organised by matrilineal clans. Land was inherited through women and residence was mainly matrilocal;
Traditionally, men were associated with the sea and the cultivation of coconut trees. Women were associated with the land, the production of staple food crops, and inshore net fishing and gathering of sea foods. Women also manufactured valued traditional goods such as loom-woven waist cloths, pandanus mats, oils, medicines and ornaments.
Colonial administrations removed the pattern of matrilineal land tenure on the main islands, except in Chuuk. As the economy changed over the twentieth century,
44 Hezel, 2001. 45 Hezel, 2001.
46 Schoeffel, 1993.
25
women-made goods were replaced with imported goods and women‟s food crops with imported cereals. The loss or reduction of women‟s traditional economic role was not compensated for by any significant access to higher education, well-paid jobs or other economic opportunities.
This process of change marginalised women. They are now mostly housewives dependent upon male wage-earners, although many women still contribute to food production and, in Yap, to producing traditional clothing. Nevertheless, their overall burden of work has grown.
The roles of men have also changed.47 There always were sharp distinctions between the roles of men and women. The shape of the Micronesian family began to undergo momentous changes with the rapid expansion of the cash economy during the 1960s, as the family‟s resource base swung away from local produce from the land and sea to cash.
These changes have split the traditional extended family, and fostered the appearance of the nuclear household as the basic social unit. This transformation of the Micronesian family has involved a major social upheaval, with enormous changes in the roles of family members.
Since the early 1990s, the national and state governments have been supporting more active involvement of women in national development, through the strengthening of women‟s units, advisory councils, and a national machinery for women‟s affairs. This is discussed in more detail in Chapter 5.
The role of the media in social change
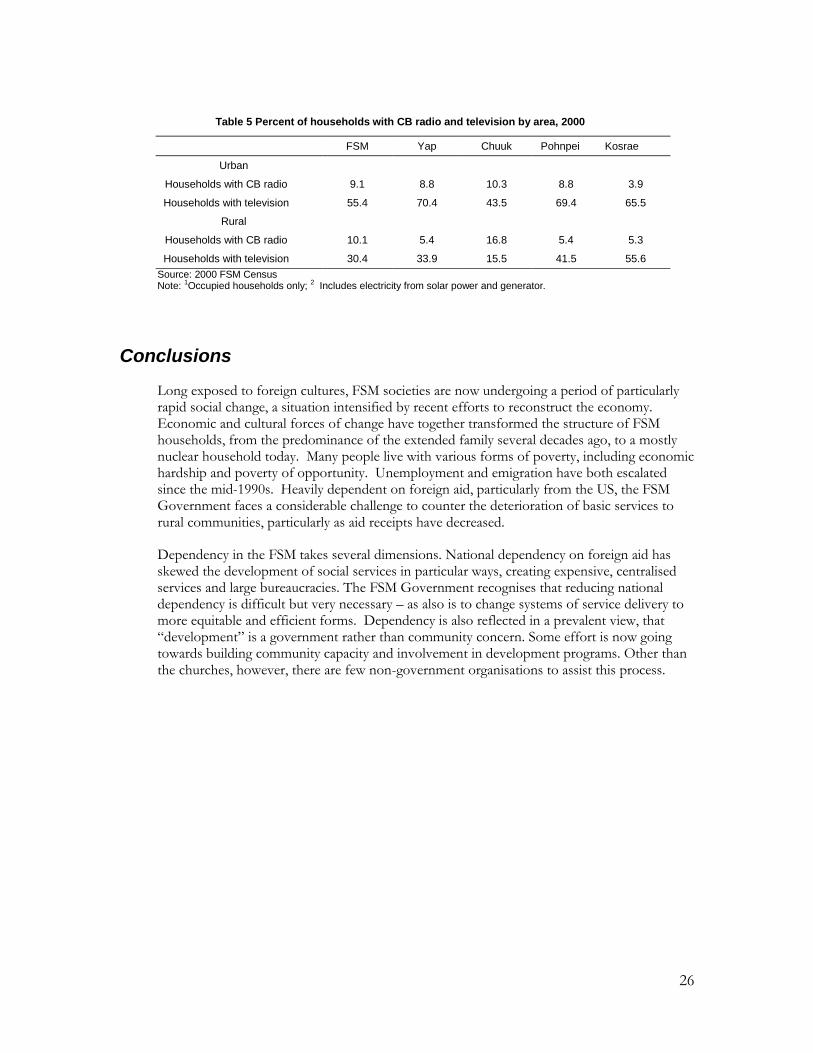
The media, particularly US-based television – has had a profound impact on social change in the FSM. Around half of urban households and one third of rural households have television, a high proportion compared to other Pacific island countries. A small proportion of programmes are produced locally; most come direct from the US. Additionally, many people have access to videos and DVDs, and to modern, mostly US-based, popular culture.
A film documentary by Dennis O‟Rourke, „Yap...How did you know we‟d like TV?‟ (1987) chronicled how in 1979, during the negotiations leading to the Compact, the people of Yap learned that they were to be given a television station and a steady supply of American programmes. This came complete with commercials for Big Macs, Buicks, deodorants and carpet shampoo, all provided free by the "Pacific Taping Company" of Los Angeles. The six thousand residents of Yap were also supplied with a small television studio and amateur video equipment, with which they were to produce local news reports. Many Yapese were opposed to television. They saw it as a threat to their fragile culture and as an outsider's attempt to foist changes on them. Some believed the "Pacific Taping Company" was a front for a conspiracy designed to create dependency and promote U.S. cultural values in an otherwise insignificant, but strategically important, island.48
47 Hezel, 2001.
48 www.directcinema.com
26
Table 5 Percent of households with CB radio and television by area, 2000
FSM Yap Chuuk Pohnpei Kosrae
Urban
Households with CB radio 9.1 8.8 10.3 8.8 3.9
Households with television 55.4 70.4 43.5 69.4 65.5
Rural
Households with CB radio 10.1 5.4 16.8 5.4 5.3
Households with television 30.4 33.9 15.5 41.5 55.6
Source: 2000 FSM Census Note: 1Occupied households only; 2 Includes electricity from solar power and generator.
Conclusions
Long exposed to foreign cultures, FSM societies are now undergoing a period of particularly rapid social change, a situation intensified by recent efforts to reconstruct the economy. Economic and cultural forces of change have together transformed the structure of FSM households, from the predominance of the extended family several decades ago, to a mostly nuclear household today. Many people live with various forms of poverty, including economic hardship and poverty of opportunity. Unemployment and emigration have both escalated since the mid-1990s. Heavily dependent on foreign aid, particularly from the US, the FSM Government faces a considerable challenge to counter the deterioration of basic services to rural communities, particularly as aid receipts have decreased.
Dependency in the FSM takes several dimensions. National dependency on foreign aid has skewed the development of social services in particular ways, creating expensive, centralised services and large bureaucracies. The FSM Government recognises that reducing national dependency is difficult but very necessary – as also is to change systems of service delivery to more equitable and efficient forms. Dependency is also reflected in a prevalent view, that “development” is a government rather than community concern. Some effort is now going towards building community capacity and involvement in development programs. Other than the churches, however, there are few non-government organisations to assist this process.

27
2. The situation of children
Children in the population Children are defined in the FSM as people up to the age of 18 years, although in order to qualify for special benefits children with disabilities are considered to not reach adulthood until the age of 21.49 One difficulty in gauging the situation of children in the FSM is that neither the age-groups used by the Department of Statistics in reporting on the population nor those used by the Ministry of Health exactly coincide with the general definition of childhood.
As fertility rates have fallen since the early 1970s, the shape of the population has changed. There are fewer young children in the population now and the number of teenagers has grown. Still, people up to the age of 19 years make up just over half (53 per cent) of the population.
Figure 13
Children aged 0-19 as a percentage of the total FSM population,
1973 & 2000
0
2
4
6
8
10
12
14
16
18
20
0-4 5-9 10-14 15-19
Age-group
Perc
enta
ge
1973
2000
Source: National Census, 2000
Health and well-being
Infants and young children
Infant mortality has dropped over the past few decades, from 68 deaths per 1000 live births in 1973 to around 40 in 2000. Deaths to children aged less than 5 years also decreased over this period, from 27 to 12 deaths per 1,000 live births.50 These rates are still quite high when compared with other multi-island countries in the Pacific region. There is a large difference among the states in the infant mortality rate, which in 2002 ranged from 41.6 per 1,000 live
49 National Advisory Committee on Children, 2002.
50 Ministry of Health, 2004, citing 1973 and 1980 TTPI Censuses and 1994 and 2000 FSM Censuses.

28
births in Kosrae to 29.3 in Chuuk, 11.9 in Yap and 11.6 in Pohnpei. These figures are quite volatile because in these small populations even a single death makes a large difference.
Figure 14
Declining infant and child mortality rates, 1969-1999
0
10
20
30
40
50
60
70
80
1969 1976 1990 1996 1999
Death
s p
er
1,0
00 li
ve b
irth
s
Infant mortality rate
Child mortality
Source: Dept of Statistics, 2000
The main causes of neonatal deaths are prematurity and congenital abnormalities. For post-neonatal deaths they are acute infections (especially respiratory and gastric) and complications of malnutrition. Causal factors are the large number of teenage pregnancies, which in turn contribute to the high prevalence of low birth weights; the prevalence of infections; and limited access to adequate prenatal care.51 The FSM does not have any facilities for high-risk deliveries and neonates.52
In 2004, almost 9 per cent of infants had a birth weight below 2.5 kg. This number has grown since the early 1990s, up from 7.6 per cent in 1992 and 7.1 per cent in 1999.53
In 2002, only 29 per cent of women who gave birth received prenatal care from the first trimester. This figure has fluctuated from the mid-1990s but changed little: from 27 per cent in 1995, 26 per cent in 1996, 20 per cent in 1998, 9.7 per cent in 1999, 23 per cent in 2000, and 32 per cent in 2001.
The high incidence of infections and skin diseases is linked to poor water and sanitation services and limited public health education, problems compounded by the poor access that many communities have to primary health care; the limited availability of oral rehydration therapy to treat diarrhoea; inadequate immunisation; and poor nutritional status, particularly Vitamin A deficiency. Tuberculosis, which is
rife in the FSM, also poses a serious risk to infants and children.
51 Ministry of Health, Education and Social Welfare, 2004.
52 CRC Report, 2002 (in draft); Ministry of Health, Education and Social Welfare, 2004.
53 Ministry of Health, Education and Social Welfare, 2004. The incidence of very low birth rate – less than 1500 grams - has however decreased, to 0.27 per cent (1999-2002). It remains much higher in Pohnpei (6 per cent) than in Kosrae (1 per cent), Yap (0.7 per cent) or Chuuk (0.5 per cent).
29
Table 6 Main reasons for hospital treatment of infants and young children, 2003
Age > 1 year Aged 1-4 years
Condition Cases Condition Cases
Perinatal conditions 342 Infectious & parasitic diseases
304
Respiratory infections 272 Respiratory infections 284
Infectious & parasitic diseases 169 Skin diseases 68
Skin diseases 25 Digestive system diseases 42
Congenital deformities etc. 16 Endocrine, nutritional & metabolic 34
Endocrine, nutritional & metabolic 14 Symptoms, signs, etc. 26
Source: Ministry of Health, 2003, unpublished data
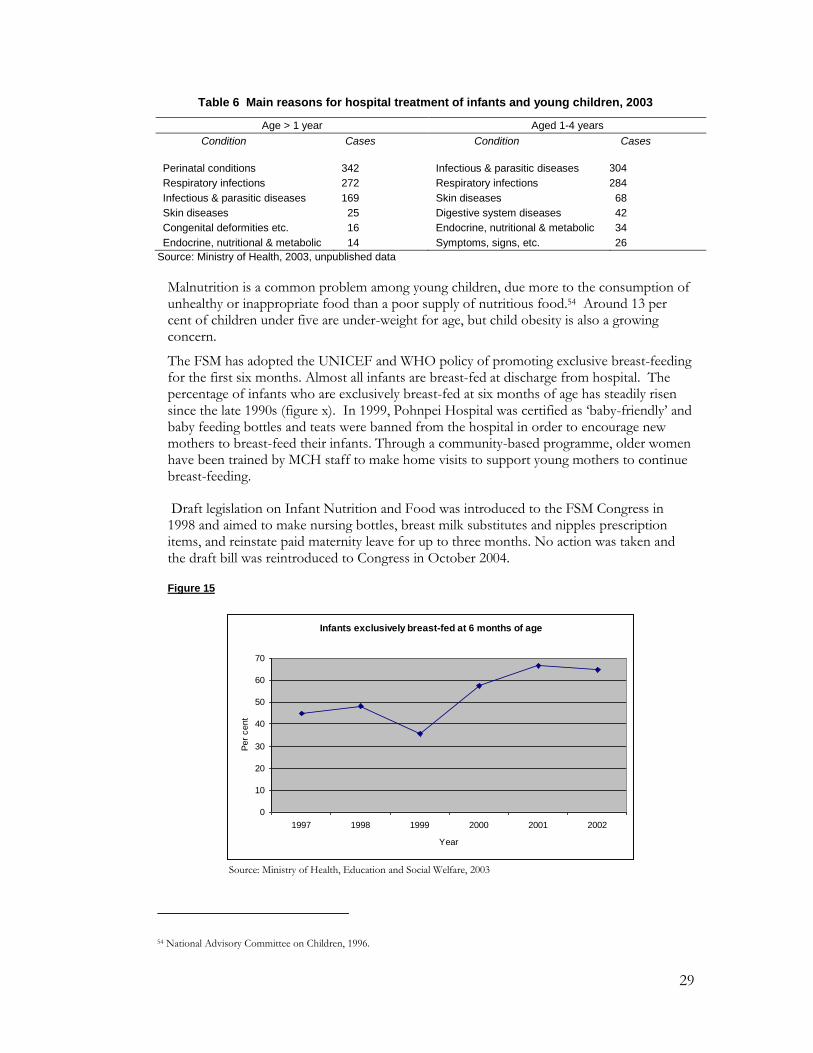
Malnutrition is a common problem among young children, due more to the consumption of unhealthy or inappropriate food than a poor supply of nutritious food.54 Around 13 per cent of children under five are under-weight for age, but child obesity is also a growing concern.
The FSM has adopted the UNICEF and WHO policy of promoting exclusive breast-feeding for the first six months. Almost all infants are breast-fed at discharge from hospital. The percentage of infants who are exclusively breast-fed at six months of age has steadily risen since the late 1990s (figure x). In 1999, Pohnpei Hospital was certified as „baby-friendly‟ and baby feeding bottles and teats were banned from the hospital in order to encourage new mothers to breast-feed their infants. Through a community-based programme, older women have been trained by MCH staff to make home visits to support young mothers to continue breast-feeding.
Draft legislation on Infant Nutrition and Food was introduced to the FSM Congress in 1998 and aimed to make nursing bottles, breast milk substitutes and nipples prescription items, and reinstate paid maternity leave for up to three months. No action was taken and the draft bill was reintroduced to Congress in October 2004.
Figure 15
Infants exclusively breast-fed at 6 months of age
0
10
20
30
40
50
60
70
1997 1998 1999 2000 2001 2002
Year
Per
cent
Source: Ministry of Health, Education and Social Welfare, 2003
54 National Advisory Committee on Children, 1996.

30
The rate of Vitamin A deficiency (VAD) is very high in the FSM, one of the highest in the world. VAD contributes to blindness and high death rates for children from respiratory infections and acute gastroenteritis. A recent survey of children in Kosrae State found that 57 per cent were Vitamin A deficient and 13 per cent had low haemoglobin. In Yap State, the figures were 38 per cent and 11 per cent respectively.
Many local foods, particularly bananas and sweet potatoes, are very rich in carotenoids and would provide great protection against VAD, but they are no longer commonly eaten. UNICEF has assisted the FSM with a VAD and de-worming campaign for children aged 1-12 years, and supported a public education program to encourage more use of local foods rich in Vitamin A. Pohnpei, Chuuk and Kosrae states have Vitamin A supplementation programs.
Immunization coverage for infants under the age of 24 months in the FSM varies by state and fluctuates by year. In 2001 it was 72.5 per cent, down from 81 per cent in 2000, but an improvement on 61 per cent in 1997 and 63 per cent in 1998.55 Immunisation coverage is lower among 19 to 34 month-old children (Figure x).
The vaccination programmes have made a big contribution to reducing some serious infectious diseases. Polio, tetanus and diphtheria, once major causes of child-hood deaths and illness, have virtually disappeared. Up until the early 1990s, bacterial meningitis killed and crippled many FSM children but this disease has also been drastically reduced. There still are, however, periodic outbreaks of measles and whooping cough and high rates of tuberculosis and leprosy.56 Efforts continue to increase the coverage of the immunization programme. Under FSM law, all children must now be immunised against communicable diseases before enrolling in school.57
Figure 16
Per cent of 19-34 month-old children fully immunised, 1994-2002
0
10
20
30
40
50
60
70
80
90
1994 1995 1996 1997 1998 1999 2000 2001 2002
Year
Per
cent
Source: Ministry of Health, Education and Social Welfare, 2003
Note: The immunisation programs are those recommended by the US Centre for Disease Control and include vaccination against measles, mumps, rubella, polio, diphtheria, tetanus, pertussis, haemophilis influenza and hepatitis B.
55 FSM Department of Health, 2001.
56 Flear, 1997.
57 National Advisory Committee on Children.

31
Children aged 5 to 14
For older children, the main causes of illness are infectious and parasitic diseases. Poor nutrition and Vitamin A deficiency increase the susceptibility of children to these infections.
Table 7 Main causes of hospital treatment for children aged 5-14 years, 2003
Condition Cases
Infectious and parasitic diseases 103
Respiratory diseases 87
Digestive diseases 62
Skin diseases 41
Diseases of the genitourinary system 36
Symptoms and signs 34
Diseases of the circulatory system 23
Nervous system 22
Pregnancy, childbirth & the puerperium 20
Source: Ministry of Health, 2003, unpublished data
The school-aged population is also at particular risk of developing streptococcal pharynitis, rheumatic fever and rheumatic heart disease. There is poor access to preventative health services to detect or treat these conditions, and few patients properly complete antibiotic treatments. According to one review, it is administratively easier in the FSM to refer a child off-island for open heart surgery costing up to $50,000 than it is to provide $0.50 worth of penicillin within a PHC setting to timely treat these infections.58
Dental disease is a major public health concern in all states. Recent surveys have found approximately 80 per cent of children have significant dental disease. A 1998 survey of children in Head-start Programs in Pohnpei found that 99 per cent had diseased teeth. A program is underway to provide protective sealants on permanent molar teeth. In 2002, 44 per cent of all third-grade children had sealants on at least one permanent tooth. There is an urgent need to develop and implement a comprehensive childhood oral health program that focuses on awareness and education, multi-vitamin supplements, school-based fluoride and toothbrush programs, and improving access to dental care.59
There is no systematic information on the incidence of accidents to children. Vehicle deaths to children under the age of 14 years are recorded as a rate of 2.3/100,000 in 2002, representing one death out of a total of 43,100 children. This low figure partly reflects limited access to motor vehicles in many parts of the FSM.
Older teenagers
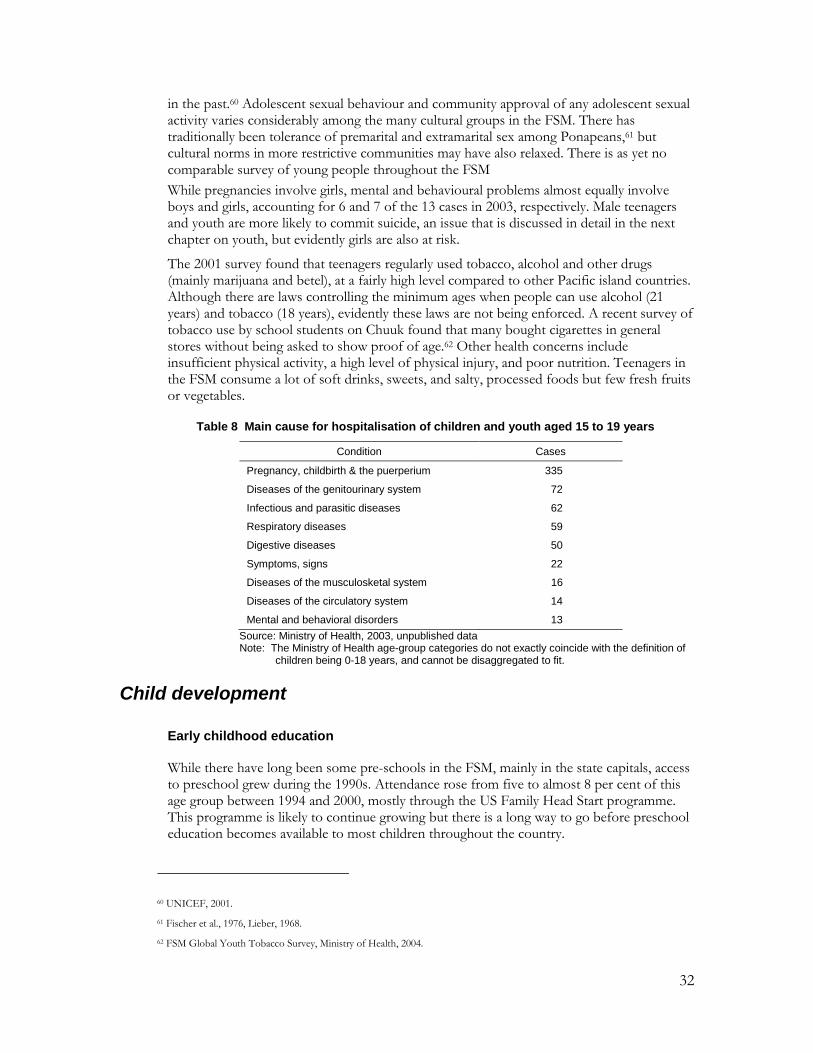
The main causes of hospitalisation for children aged 15 to 18 are pregnancy and childbirth, genitourinary problems and parasitic, respiratory and infectious diseases (Table x). The number of teenage pregnancies points to a high level of unprotected sexual activity, and the exposure of many young people to sexually transmitted diseases which are quite prevalent in the FSM. In 2004, two girls aged between 13 and 19 were found to be HIV positive. There is no regular screening of this age-group except through the antenatal clinics.
A survey conducted in 2001 of young people in Pohnpei, most aged 14 to 17, found that three in five students and three-quarters of the out-of-school youth reported having had sex
58 National Advisory Committee on Children, 1996.
59 Ministry of Health, Education and Social Welfare, 2003.
32
in the past.60 Adolescent sexual behaviour and community approval of any adolescent sexual activity varies considerably among the many cultural groups in the FSM. There has traditionally been tolerance of premarital and extramarital sex among Ponapeans,61 but cultural norms in more restrictive communities may have also relaxed. There is as yet no comparable survey of young people throughout the FSM
While pregnancies involve girls, mental and behavioural problems almost equally involve boys and girls, accounting for 6 and 7 of the 13 cases in 2003, respectively. Male teenagers and youth are more likely to commit suicide, an issue that is discussed in detail in the next chapter on youth, but evidently girls are also at risk.
The 2001 survey found that teenagers regularly used tobacco, alcohol and other drugs (mainly marijuana and betel), at a fairly high level compared to other Pacific island countries. Although there are laws controlling the minimum ages when people can use alcohol (21 years) and tobacco (18 years), evidently these laws are not being enforced. A recent survey of tobacco use by school students on Chuuk found that many bought cigarettes in general stores without being asked to show proof of age.62 Other health concerns include insufficient physical activity, a high level of physical injury, and poor nutrition. Teenagers in the FSM consume a lot of soft drinks, sweets, and salty, processed foods but few fresh fruits or vegetables.
Table 8 Main cause for hospitalisation of children and youth aged 15 to 19 years
Condition Cases
Pregnancy, childbirth & the puerperium 335
Diseases of the genitourinary system 72
Infectious and parasitic diseases 62
Respiratory diseases 59
Digestive diseases 50
Symptoms, signs 22
Diseases of the musculosketal system 16
Diseases of the circulatory system 14
Mental and behavioral disorders 13
Source: Ministry of Health, 2003, unpublished data Note: The Ministry of Health age-group categories do not exactly coincide with the definition of
children being 0-18 years, and cannot be disaggregated to fit.
Child development
Early childhood education
While there have long been some pre-schools in the FSM, mainly in the state capitals, access to preschool grew during the 1990s. Attendance rose from five to almost 8 per cent of this age group between 1994 and 2000, mostly through the US Family Head Start programme. This programme is likely to continue growing but there is a long way to go before preschool education becomes available to most children throughout the country.
60 UNICEF, 2001.
61 Fischer et al., 1976, Lieber, 1968.
62 FSM Global Youth Tobacco Survey, Ministry of Health, 2004.

33
Access to basic education
The FSM has an American style education system with free public education from the ages of six to 15 years or completion of the 8th grade. Complementing the public education system, religious groups run privately funded elementary and secondary schools.
Over the past generation, access to education in the FSM has expanded a great deal. In the 12 years from 1984 to 1996, the number of elementary and secondary students grew more than 50 per cent, putting a major strain on its facilities and finances.63 The distribution of students by type of school also changed. In the early 1970s, only 20 per cent of students in the FSM were at secondary school and the rest attended primary school. Now the ratio of secondary to primary school students has grown, and there are small but growing numbers of children in preschool and young adults at college.
Figure 17
School attendance by level of enrolment, 1973 & 2000
0%
20%
40%
60%
80%
100%
1973 2000
Year
College
High School
Elementary
Preschool
Source: Department of Statistics, National Censuses, various years
The school system generally is not in a good state. As more people have migrated to the state capitals, urban schools have become over-crowded and outer-island schools depleted of students. Many school buildings are old and in poor repair, textbooks and other teaching aids are in short supply. The school system has had difficulty in keeping up with the growing school-age population, a problem compounded by the economic down-turn.
Many outer island schools are very small. Some do not have electricity or good access to State centres. Most outer island schools can only be contacted by short wave radio. This makes it difficult for state and national agencies to provide technical assistance and support.
63 FSM National Division of Education, 1997.

34
Table 9 Accessibility of schools to State Departments of Education
Has electricity
(%)
Motor vehicle (%)
Small boat (%)
Ocean going ship (%)
Small plane (%)
Motor vehicle + walking (%)
Kosrae 87 87 12 - - -
Pohnpei 75 82 5 12 - 2
Chuuk 17 18 51 32 - -
Yap 40 40 - 60 31 -
Total 38 40 29 31 6 0.5
Source: FSM National Division of Education, 1997
By national law, school attendance is compulsory for all children, including those with disabilities, from the ages of six to fourteen or at graduation from the eighth grade but this regulation is not enforced. There is a high level of truancy. According to the 2000 National Census, school attendance peaked around 9 to 11 years at 90 per cent of all children, suggesting that around 10 per cent of this age-group does not attend school (Figure x). Furthermore, only two-thirds (67 per cent) of children complete the primary school programme.64 Enrolments decline considerably from the age of 14 or 15, after graduation from elementary school.
Access to secondary school is not automatic. All states administer high school entrance tests to 8th graders. This is partly to bring the number of students down to the much smaller capacity of the secondary schools. Three states have one government-supported high school - Yap has three - but there are also some junior high schools and private schools. Another reason for the tests is that many primary schools have low levels of academic success which handicap children and prevent them from continuing their schooling to secondary level. Outer island students are disadvantaged because they must board in urban centres, and so face higher financial and social costs.
Figure 18
Source: National Census, 2000
64 FSM Division of Statistics, 2004.
School enrolments from 3 to 18 years, 1994 and 2000
0 10 20 30 40 50 60 70 80 90
100
3 4 5 6 7 8 9 10 11 12 13 14 15 16 17 18 Age
Per cent
1994 2000

35
Table 10 Gross enrolment and sex ratios in FSM schools, 1994 and 2000
1994 2000
Male Female Total Male Female Total
Gross enrolment ratio
Elementary school 93.5 93.9 93.7 91.7 92.9 92.3
Secondary school 78.4 84.7 81.4 68.1 76.7 72.3
Ratio of girls to boys
Elementary school - - 0.92 - - 0.93
Secondary school - - 0.98 - - 1.04
Tertiary education 0.79 1.07
Source: National censuses, 1994, 2000
Between 1994 and 2000 there was an overall small decline in school enrolments but an increase in female over male student numbers. Both changes are most evident at secondary school.
At all levels of education, FSM students lag significantly behind their age peer group in other countries. One reason for this is that English is the first language of few FSM children, perhaps less than two per cent, and each state must develop instructional materials in both English and one or more local languages.65 Teachers in the higher grades of elementary schools and in the secondary schools must teach in English but many do not have enough competence in English to do this effectively. Many also have limited qualifications. While they are required to have a degree – although some do not - there are no requirements about having teaching skills such as appropriate teaching strategies, classroom management or knowledge of the content of the courses they are teaching. The low standard of teacher education and a generally low level of competence in either English or local language makes it difficult to improve educational standards in the schools.
School facilities for disabled children
United States federal funds support special programmes for disabled children in the FSM, along very similar lines to programmes operating in the USA. Under FSM law, disabled children have the right to special care, education and training up to the age of 21 years. Programs include special preschool and school classes; transition programmes between the home, school and work; training for parents and other care-givers; and related services such as speech or physical therapy and vocational guidance. An estimated 2,600 children in the FSM are disabled in some way, including learning problems. The programmes face difficulties in serving all eligible children and not all can participate. Especially in Chuuk, transportation of the children is a particular problem. Also, the materials used are from the United States and many children in the FSM have poor understanding of English.
Child protection issues Child adoption
In traditional Micronesian society, child adoption was very common. Children usually were adopted out to families close to the natural parents but of another lineage, often couples who were childless, and this served to bring different families closer together. Many children were also fostered out within their extended family. This traditional adoption has become a less common practice today, partly because there are fewer childless couples (as child survival has increased) and parents are more inclined to look after their own children. The
65 FSM National Division of Education, 1997.

36
role of adoption has changed from sharing the wealth that a child represented to, more often today, finding a home for an unwanted child. 66 Surveys conducted by the Micronesian Seminar in the 1980s also found that adoption had become associated with child abuse or neglect.
Foreign adoption agencies have been „recruiting‟ Micronesian children in recent years, more from the Marshall Islands than the FSM. However, some of these agencies are now operating through the FSM, as a stop-over on the route from the Marshall Islands to the United States, although it is not clear what purpose this serves.
Children who are neglected or abused
Child neglect and abuse are growing problems in the FSM, problems that apparently stem from disrupted cultural safeguards and taboos.67 Title 41, Chapter 5 of the FSM Code requires every person who examines, attends, teaches or treats a child and suspects they have been sexually abused in some way is required to report this to the police. Even so, incidents of abuse, particularly incest, are believed to be quite under-reported because of the cultural sensitivity of this problem.
Children who are exploited
Other than the neglect and abuse described above, the exploitation of child labour is not believed to be a serious problem in the FSM, although it is difficult to define this clearly in a subsistence economy. Most child labour occurs in the informal sector, in fishing or agriculture tied to the subsistence nature of the FSM economy, in private family activities, or in family stores.68 No laws protect children within the extended family from exploitation through labour, or work that is hazardous or interferes with his or her education. National legislation has been proposed to impose restrictions on these situations, but these controls are not yet in place.
Children who become pregnant
Young teenage pregnancy is a considerable problem in the FSM, but there is very little reliable information about it. Pohnpei stands out as having the highest rate of teenage pregnancies; the Micronesian Seminar counted at least 43 births there to girls under the age of 15 during nine years from the late 1980s, an average of about five per year.69 As Table 8 shows, in 2003 alone, 20 girls under the age of 15 were admitted to FSM hospitals for pregnancy-related causes. Given the poor quality of reporting, the limited extent of prenatal care, the possibility of spontaneous or assisted abortion, and the high mobility of people in and out of the FSM, this figure is almost certainly an under-count. Figure 19 shows that births to teenagers represent a large proportion of all births in the FSM, with the teenage birth rate out-numbering the overall crude birth rate.
Informed people attribute most young teenage pregnancies to incest and rape, issues that people are reluctant to discuss, particularly as by most Micronesian customs such young pregnancies are considered particularly shameful. Older teenagers report that common „causes‟ are alcohol use, peer pressure, boredom and little parental supervision.
Most teenagers leave school as soon as their pregnancy starts to show, and few return to continue their education.70 While all births to teenagers carry some health risks, much
66 Hezel, 2002.
67 National Advisory Committee on Children, 1996.
68 National Advisory Committee on Children, 2002.
69 Samuel, 2002.
70 Samuel, 2002.

37
depends on the social circumstances of the pregnancy and birth. While some older teenagers are in stable unions, many are not, and these births were unintended. While almost all babies were once quite welcomed by the extended family, as these families have fragmented this welcome has become less automatic. While many teenagers can expect support from their family, this can no longer be relied upon. Welfare agencies report that some young mothers have a most difficult time supporting themselves and their infants.71
Figure 19
The teenage birth rate and crude birth rate, FSM, 1996-2002
0
5
10
15
20
25
30
35
40
1996 1997 1998 1999 2000 2001 2002
Year
Birth
s p
er
1000 p
opula
tion
Teenage birth
rateCrude birth
rate
Source: Ministry of Health, 2003
Children involved with the law
Juvenile crime is not perceived to be a problem in the FSM.72 In cases involving juvenile crimes or delinquency, traditional methods of resolution are practiced throughout the FSM. It is customary for the offending child‟s family to take responsibility for his or her behaviour and make amends with the other parties. In the rare instances of child imprisonment, a child is kept separate from adult offenders. There is no law that establishes a minimum age for providing testimony in court, for lodging complaints, or for seeking redress without parental consent.73
Public understanding about child rights
Policy-makers in the FSM are just beginning to work on the observation and protection of children‟s rights.74 While national and state plans of action have been drafted to address children‟s rights, Chuuk is the only state to have adopted its State plan. The President‟s National Advisory Council on Children (PNACC) coordinates activities to promote the
71 Samuel, 2002.
72 Public Prosecutor, pers. comm.
73 The National Advisory Council on Children, 2002.
74 The National Advisory Council on Children, 2002.

38
Convention on the Rights of the Child (CRC) and children‟s rights. The PNACC compiled the FSM‟s initial 1996 CRC report and drafted the 2001 report, which is now being finalised. Neither NGOs nor any professional groups were involved in evaluating national progress on the CRC.
Other than this official observation of the requirements of the CRC, there is little public understanding about the issues involved or the need to promote child rights. No NGOs specifically promote the rights of children in the FSM or gather information on these issues. Quite a lot of information was distributed about the CRC in the early 1990s when the FSM first ratified the Convention. Since then, many training workshops and seminars have included the principles of the CRC on their agendas. There are, however, no specific programmes within the school system to regularly promote the CRC. Much more needs to be done to improve community understanding about the CRC and gather support among government and state agencies to implement it.
Conclusions
The health status of children in the FSM reflects the generally poor access to basic services, poor access to clean water and adequate sanitation, and poor nutrition. The education status similarly reflects the poor management of basic education services, especially in remote areas. Service delivery is difficult in small multi-island nations but the FSM measures up quite poorly against some other Pacific island countries which face similar difficulties.
Emerging health concerns for children include high consumption of nutritionally poor, processed foods and drinks, such as soft drinks, sweets, and processed food, and low consumption of fruits and vegetables. Evidently some even young teenagers use substances such as tobacco, marijuana, betel and alcohol. Effective public health campaigns are needed to assist this generation at risk of serious health problems in early to mid-adulthood.
There appears to be little general concern about the conditions of children in the FSM, but there is also little public understanding about the issues involved in the CRC or the need to promote child rights. Child labour is a case in point. In rural, semi-subsistence communities, children are expected to contribute some help to family work but, in the absence of any survey of child labour, it is difficult to be sure that this is an issue that deserves complacency. Other problems also lie beneath the general calm and pleasantness of FSM society, such as the physical and sexual abuse of children, for which the signs exist but the community prefer not to acknowledge.

39
3. The situation of youth
Introduction Youth in the FSM are defined as people aged between 19 and 34 years.75 As with children, however, it is difficult to find data that refers to this specific age-group. The national population census, health system data, and most other information systems use standard five-year age-groups, namely 15-20, 20-24, and so on. There is little information about this age group, for it is neither specifically collected nor disaggregated from general data.
Young people in the FSM find themselves on the cutting edge of social and economic change, and for many this is not a comfortable place to be. This period of life can be ambiguous for young people, as they are variously treated as children or adults, depending on the cultural situation or the requirements of particular laws. Social changes, including the erosion of the extended family network of support for young people, contribute to inter-generational conflict, confusion and stress.76
Table 9 Ages of responsibility in the FSM
Minimum age Chuuk Kosrae Pohnpei Yap
For criminal responsibility 16-18 16-18 16-18 16-18 Age 16 or 18, depending on the maturity of the child.
For trial in court 16 16 16 16
For employment None None None None
For sexual consent 13 13 15 13
For marriage
(a) With parent consent
(b) Without parent consent 16 (f)
18 (m)
16 (f)
18 (m)
16 (f)
18 (m)
16 (f)
18 (m)
Each state recognises customary marriages at different ages.
To operate a motor vehicle
To vote 18 18 18 18
To consume alcohol in public 21 21 21 21 No national laws; generally 21 yrs. FSMC Controlled Substances provides for criminal offences and penalties for production, trafficking and possession. FSMC § 1147 makes it a separate crime, with severe penalties, to distribute drugs to children under the age of 18.
To purchase tobacco 18 18 18 18
Sources: Note: In FSM, different states have different legislation, such as that covering the minimum age for sexual consent (which varies from 13 to 15 years) and for the use of alcohol.
As population growth has slowed in the FSM, youth have become the fastest growing age group. This change is sometimes referred to as the „youth bulge‟ or „demographic dividend.‟ It can be seen in the rising median age of the population (Figure 20). In theory, this change gives a country a good opportunity for economic growth, but only if other policies enable young people to contribute to economic activity, by providing vocational training or increasing the number of jobs for youth. The „dividend‟ will not be realised otherwise – and
75 Department of Health, Education and Social Affairs, 2004.
76 Hezel, 2001.

40
quite evidently in the FSM it has not been. Supplying adequate education, training and employment for new-comers into the labour force is a major challenge.
Figure 20
Rising median age, by state, 1973-2000
10
12
14
16
18
20
22
Yap Kosrae Pohnpei Chuuk
Age in
years
1973
2000
Source: National Census, 2000
Young adulthood has become more of a time of personal freedom than in the past. Marriage rates among young people have dropped slowly and the average age of marriage has risen. In 2000, this average was 27.4 years for males and 25.2 years for females, a considerable rise from a generation ago (Figure 21).
Figure 21
Rising age at marriage, 1973 & 2000
0
5
10
15
20
25
30
1973 2000
Age in
years
Males
Females
Source: National Censuses, various dates
Education and training Despite their common aspirations for paid jobs, there are few opportunities for young people in the FSM to earn appropriate qualifications to enter the formal work-force. The education system builds expectations of „white-collar‟ work. Many school leavers, however, find themselves working as their less educated parents did, as semi-subsistence farmers. The intertwined problems of the education system are, therefore, limited opportunities for people to earn real job qualifications, inappropriateness of the curricula for the types of livelihood opportunities that exist in the FSM, and academic standards that are too low to prepare migrants for much other than menial jobs overseas.

41
Most post-secondary education is located on Pohnpei. For young people who complete high school in the FSM and want to continue their education, only few spaces are available at the College of Micronesia-FSM National and State Campuses. There are also some vocational programmes available, including for students who do not complete formal education. Access to post-secondary education is improving with some part-time courses now available.
Some people go to study overseas, but the high costs and poor education standards in FSM schools keep this number low also. Some financial assistance is available through the government scholarship program, the US Department of Education, and some donor countries‟ aid packages. The main difficulty that FSM students face, especially those from the public school system, is meeting the minimum academic qualifications for entry to college (Tables 12 and 13).
Table 12 Pass Rates on College of Micronesia-FSM Entrance Test (percentage of students passing) 1994-2000
School Average 1994 1995 1996 1997 1998 1999 2000
Pohnpei 52 40 29 41 42 69 69 75
Kosrae 46 35 40 22 38 40 75 73
Yap 35 29 36 21 22 0 48 51
Chuuk 24 29 23 23 16 24 28 27
Source: Hezel, Micronesian Seminar, 2004
Table 13 FSM Public High Schools: Pass Rates on College of Micronesia-FSM Entrance Test
(percentage of students passing) 1994-2000
School 1994 1995 1996 1997 1998 1999 2000 Av.
PICS/BOHS (Pohnpei) 38 27 37 44 65 65 72 50
Kosrae HS 35 40 22 38 40 75 73 46
Yap HS 29 44 25 24 47 59 60 41
Outer Islands HS (Yap) 35 26 11 19 27 39 39 28
Chuuk HS 8 3 1 2 5 8 11 5
Source: Hezel, Micronesian Seminar, 2004
Jobs and other livelihoods High unemployment in the FSM has hit youth disproportionately hard. While the unemployment rate in the general population is 22 per cent, for youth it is much higher, particularly in Chuuk. Many young people are also „under-employed‟ in the subsistence sector, as unpaid family workers. It is difficult to get an accurate figure in countries like the FSM where there is a large traditional informal sector. „Unemployment‟ is officially defined as the number of people out of work but actively looking for work, and many young people in this situation give up and wait passively for something to happen.

42
Figure 21
Youth unemployment, by state, 2000
0
10
20
30
40
50
60
15-19 20-24 25-29
Per
cent of people
aged 1
5-3
0 y
rsYap
Chuuk
Pohnpei
Kosrae
Source: National Census, 2000
Table 14 GDP and employment growth by state, 1987-2000 (average annual per cent)
Early Compact Period 1987-1995
Late Compact Period 1995-2000
Total: 1987-2000
GDP growth
Chuuk 2.5 -1.6 0.1
Kosrae 0.7 -1.3 0.5
Pohnpei* 5.6 -1.6 3.2
Yap 5.3 1.4 3.2
FSM 4.2 -1.1 2
Employment growth
Chuuk 1.2 -2.7 -0.3
Kosrae 0.6 1.8 1.1
Pohnpei* 4.6 1.3 3.3
Yap 5.9 1.7 4.2
FSM 3.2 0.2 2
Source: EMPAT, 2000 * Includes the national government.
The national priority in recent years has been to foster private sector growth, and this has accounted for some recent growth in employment, but much less than the demand for paid jobs. Given very few opportunities for paid employment, the choices for young people essentially are to remain unemployed, to work in the informal sector – which in the FSM largely means subsistence or semi-subsistence farming - or to migrate.
Agriculture has been declining in recent years. Production is much lower than in the past and the value of traditional production as a social safety-net has also eroded. Even so, more people today rely on subsistence agriculture for employment than ten years ago. 77 The poorest households, mostly those engaged in subsistence farming, receive only 3.6 per cent of all household income.78 Although there are new opportunities for commercial production, for most young people, raised on expectations of prosperity and images of US mainland lifestyles, farming of any sort is not an attractive prospect.
77 FSM Government, FSM Strategic Development Plan, 2005-2023, in draft.
78 FSM Government, FSM Strategic Development Plan, 2005-2023, in draft.

43
Migration has been the option taken by many people in recent years. Most migrants are young adults. They take up mostly menial jobs for which there are low entry-point qualifications. Many remit some of their incomes back to their families in the FSM.
Health and well-being
Main causes of illness and death
In recent years, the main causes of death for people aged 19 to 34 years were diseases of the circulatory system, diseases of the digestive system, and vaguely defined „external causes‟ of morbidity and mortality.79 For women, the main cause was pregnancy and child-birth, which illustrates the high level of maternal mortality in the FSM. For men, important causes were „transport‟ (presumably accidents) and intended self harm, but there were almost half as many (five) suicides by females as by males (13). There are few motor vehicles in the FSM, and therefore few vehicles accidents, but most involve young men under the influence of alcohol.
Table 15 Main causes of hospital treatment of young adults, 2003
Males Females
Ages 20-24 Number Number
Digestive diseases 40 Pregnancy, childbirth & puerperium 692
Infectious & parasitic diseases 22 Genitourinary system 74
Respiratory diseases 20 Digestive diseases 44
Musculoskeletal system 12 Infectious & parasitic diseases 31
Skin diseases 11 Respiratory diseases 22
Mental & behavioral disorders 9 Symptoms, signs 11
Ages 25-34
Digestive diseases 37 Pregnancy, childbirth & puerperium 1079
Circulatory diseases 35 Genitourinary system 131
Respiratory diseases 31 Digestive diseases 74
Infectious & parasitic diseases 29 Respiratory diseases 47
Skin diseases 29 Infectious & parasitic diseases 34
Genitourinary system 23 Symptoms, signs 19
Ministry of Health, unpublished data 2003
By far the largest number of hospital admissions are women admitted for pregnancy, child-birth and related causes. Concerns regarding reproductive health are discussed in more detail in the next chapter on women. While the schools conduct sex education classes, the high teenage and young adult fertility rates point to limited access to sexual and reproductive health services. In part this is a problem of geography, for health services generally are limited in rural and remote areas of the FSM. There has been no survey conducted of other factors that may limit the access of young people to reproductive health facilities, such as discrimination by health workers or youth discomfort at using services designed for adults.
Sexually transmitted infections
Particularly relevant to youth and young adults is the prevalence of sexually transmitted infections, particularly on Pohnpei. Although these are notifiable diseases, reporting systems
79 Ministry of Health unpublished data for 1998-2003.

44
are weak and the numbers recorded by the Ministry of Health are almost certainly an under-count. It is difficult to get accurate figures because the four states independently operate and maintain their own services and facilities, and there is not complete reporting to national government. Furthermore, STI screening programmes only cover blood donors. There are no specialist STI clinics; patients are treated in the general Out-Patients Departments.
Table 16 Notifications of sexually transmitted infections, FSM, 1998-2002
1998 1999 2000 2001 2002
HIV/AIDS 0 7 7 9 8
Chlamydia 17 0 0 6 8
Gonorrhea 190 184 140 155 93
HSV II 6 0 0 0 6
Syphilis 2 5 6 214 155
Source: Ministry of Health, 2004, unpublished data
HIV was first recorded in the FSM in 1989 and the number of reported cases has steadily increased. Since 1999, there have been 49 people reported with HIV or AIDS, of which 23 have died. The largest number tested positive in Chuuk, and nine others had returned to the FSM after testing positive abroad. Of known cases, most are young adults. Most tests were conducted because persons showed symptoms of AIDS, were inpatients or health clinic attendees, or were known contacts of HIV positive people. Surveillance of the general population is far from complete and the true extent of infection is unknown.
Figure 22
Age and sex of people reported to be HIV positive, FSM, 2004
0
1
2
3
4
5
6
7
0-4 5-9 10-14 15-19 20-24 25-29 30-34 35-39 40-44 45-49 Unknown
Age
Nu
mb
er
Male
Female
Source: Ministry of Health, unpublished data
There are significant risk factors for increased STI and HIV infection in the FSM. The concentration of STI infections in young people and the high teenage pregnancy rate reveals unprotected adolescent sexual activity. More people are travelling in and out of the FSM. Within the cultures of the FSM, men traditionally dominate over women in making decisions, including about sexual behaviour.
Efforts are being made to reduce the risks of STI and HIV infection through the Preventive Health Service. National and state STI s and HIV/AIDS coordinators have been appointed, but so far only Pohnpei State has a strategic plan in place to counter HIV and AIDS. The churches, which have powerful impact on public attitudes, acknowledge and are addressing the problems posed by STIs and HIV/AIDS. Foreign donor organisations are also supporting STI and HIV/AIDS prevention activities.

45
Table 17 Draft Strategic Plan for responding to HIV/AIDS and STIs in Pohnpei, 2001-2005
Objectives Strategies
1. To increase community awareness of STIs and related services
1. Awareness raising (parents and general community)
2. Dissemination of IEC materials
3. Training for teachers
4. STI service publicity
2. To promote safer sexual behaviors
1. Usage
2. Review access to condoms
3 Supply and storage
4. Promotion of monogamy and abstinence
3. To strengthen existing STI services and resources
1 Improvement of STI contact tracing services
2 Surveillance systems
3. Laboratory case management
4. Training –in counselling; for traditional healers; in syndromic management.
5. Confidentiality
Substance abuse
There is a high level of substance abuse by youth in the FSM, including betel and tobacco chewing, tobacco and marijuana smoking, and drinking of alcohol. The use of these and other substances has a major impact on young peoples‟ health because it exposes them to accidents, mental disorders and various diseases.
A survey of alcohol use by FSM youth conducted by the Micronesian Seminar in 1987 found that heavy use was quite widespread. An earlier ethnographic study in 1979 explored the role that alcohol, then a fairly recent import, played in Trukese society. By tradition warriors, young men were using alcohol as a socially sanctioned outlet for hostile feelings. Alcohol allowed young men to gain a public reputation for bravery in ways associated with cultural values, but alcohol use by young women was frowned upon.80 This problem is therefore not new but it appears to be growing and increasingly involves young women and younger age-groups.
Suicide
The FSM has one of the highest suicide rates in the world. The average rate for all ages 1991-95 was 27/100,000, which is a six-fold increase since the 1960s.81 Most of these deaths are of 16 to 20 year olds (80/100,000).82 A contributing factor appears to be changes in the nature of the extended family, and the progressive loss of the family network of support for young people.
“Most of the parenting burden today is borne by the mother and father alone. Parents don‟t have the resources to assist them that they once did, although they sometimes act as though they did…‟
„Today the father has come to dominate his immediate family as he could never have done in the past. There were simply too many on the playing field – his own father who may have ruled the estate, or his wife‟s brothers who would have taken a strong interest in his
80 Marshall, 1979.
81 Hezel, 2003.
82 National Advisory Committee on Children, 1996.
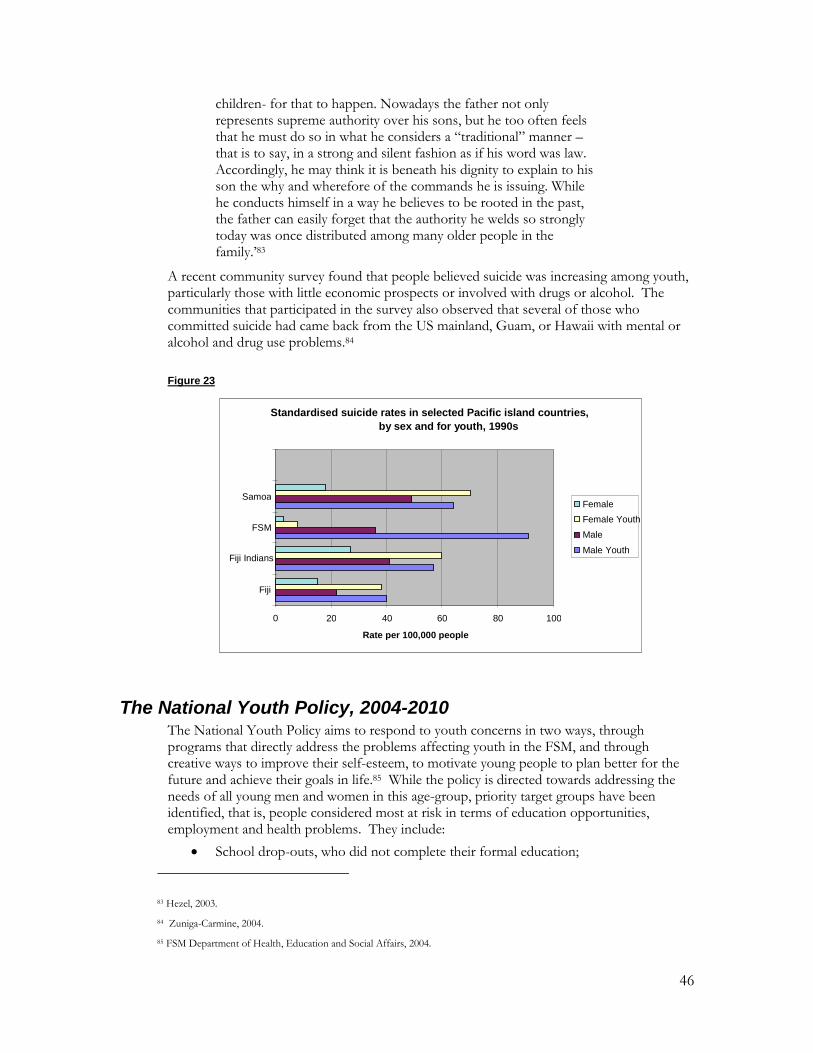
46
children- for that to happen. Nowadays the father not only represents supreme authority over his sons, but he too often feels that he must do so in what he considers a “traditional” manner – that is to say, in a strong and silent fashion as if his word was law. Accordingly, he may think it is beneath his dignity to explain to his son the why and wherefore of the commands he is issuing. While he conducts himself in a way he believes to be rooted in the past, the father can easily forget that the authority he welds so strongly today was once distributed among many older people in the family.‟83
A recent community survey found that people believed suicide was increasing among youth, particularly those with little economic prospects or involved with drugs or alcohol. The communities that participated in the survey also observed that several of those who committed suicide had came back from the US mainland, Guam, or Hawaii with mental or alcohol and drug use problems.84
Figure 23
The National Youth Policy, 2004-2010 The National Youth Policy aims to respond to youth concerns in two ways, through programs that directly address the problems affecting youth in the FSM, and through creative ways to improve their self-esteem, to motivate young people to plan better for the future and achieve their goals in life.85 While the policy is directed towards addressing the needs of all young men and women in this age-group, priority target groups have been identified, that is, people considered most at risk in terms of education opportunities, employment and health problems. They include:
School drop-outs, who did not complete their formal education;
83 Hezel, 2003.
84 Zuniga-Carmine, 2004.
85 FSM Department of Health, Education and Social Affairs, 2004.
Standardised suicide rates in selected Pacific island countries, by sex and for youth, 1990s
0 20 40 60 80 100
Fiji
Fiji Indians
FSM
Samoa
Rate per 100,000 people
Female Female Youth Male Male Youth
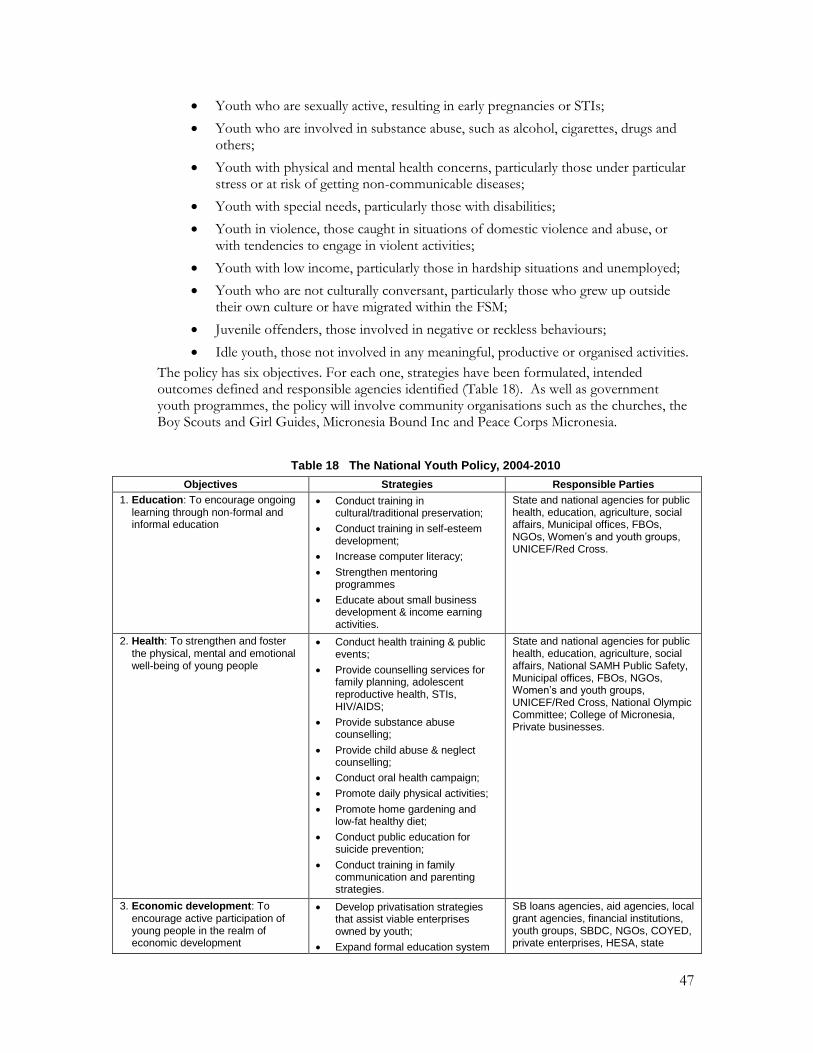
47
Youth who are sexually active, resulting in early pregnancies or STIs;
Youth who are involved in substance abuse, such as alcohol, cigarettes, drugs and others;
Youth with physical and mental health concerns, particularly those under particular stress or at risk of getting non-communicable diseases;
Youth with special needs, particularly those with disabilities;
Youth in violence, those caught in situations of domestic violence and abuse, or with tendencies to engage in violent activities;
Youth with low income, particularly those in hardship situations and unemployed;
Youth who are not culturally conversant, particularly those who grew up outside their own culture or have migrated within the FSM;
Juvenile offenders, those involved in negative or reckless behaviours;
Idle youth, those not involved in any meaningful, productive or organised activities.
The policy has six objectives. For each one, strategies have been formulated, intended outcomes defined and responsible agencies identified (Table 18). As well as government youth programmes, the policy will involve community organisations such as the churches, the Boy Scouts and Girl Guides, Micronesia Bound Inc and Peace Corps Micronesia.
Table 18 The National Youth Policy, 2004-2010
Objectives Strategies Responsible Parties
1. Education: To encourage ongoing learning through non-formal and informal education
Conduct training in cultural/traditional preservation;
Conduct training in self-esteem development;
Increase computer literacy;
Strengthen mentoring programmes
Educate about small business development & income earning activities.
State and national agencies for public health, education, agriculture, social affairs, Municipal offices, FBOs, NGOs, Women’s and youth groups, UNICEF/Red Cross.
2. Health: To strengthen and foster the physical, mental and emotional well-being of young people
Conduct health training & public events;
Provide counselling services for family planning, adolescent reproductive health, STIs, HIV/AIDS;
Provide substance abuse counselling;
Provide child abuse & neglect counselling;
Conduct oral health campaign;
Promote daily physical activities;
Promote home gardening and low-fat healthy diet;
Conduct public education for suicide prevention;
Conduct training in family communication and parenting strategies.
State and national agencies for public health, education, agriculture, social affairs, National SAMH Public Safety, Municipal offices, FBOs, NGOs, Women’s and youth groups, UNICEF/Red Cross, National Olympic Committee; College of Micronesia, Private businesses.
3. Economic development: To encourage active participation of young people in the realm of economic development
Develop privatisation strategies that assist viable enterprises owned by youth;
Expand formal education system
SB loans agencies, aid agencies, local grant agencies, financial institutions, youth groups, SBDC, NGOs, COYED, private enterprises, HESA, state

48
to include course on free enterprise, entrepreneurship and capital-based systems;
Encourage youth to create businesses, especially in farming, fishing and tourism;
Establish a national college scholarship fund for 20 young people per year who major in business development;
Conduct national campaign to “Buy Micronesia, By Micronesia”;
Establish state coalitions of Youth Economic Development;
Award contracts to businesses owned by youth;
Provide special loans and incentives to youth in business;
Conduct training workshops in business development;
Conduct business competitions for youth.
departments of education, national and state youth coordinators.
4. Cultural identity: To promote respect and appreciation for the cultural heritage of the FSM through the performing arts, crafts, traditions and language
Hold a National Youth Culture Week and a National Youth Award Scheme;
Create a National Youth Volunteer and Exchange Programme;
With PIALA, include youth participation in annual events and conferences;
Encourage local cultural experts to share knowledge and skills;
Develop partnership with traditional leaders to maintain traditional conservation practices.
National and state youth coordinators, Municipal offices, FSM Historic Preservation Offices, Municipal offices, COM-FSM, youth groups, NGOs, HESA.
5. Spirituality: To foster the spiritual development of young people and encourage them to maintain the various faith traditions of the FSM
Establish a Ministerial Association;
Declare non-sectarian days of prayer, recognise religious heritage, and recognise contributions of religious bodies to society;
Churches to host events reflecting a common heritage;
Form action groups to encourage youth to think about others and invest themselves into their communities;
Develop a data base of resources, ie Christians with useful skills.
Church representatives; church-sponsored youth groups, ecumenical action groups.
6. Environment: To promote education programs and practical projects for conservation and protection of the environment
Develop environmental education materials;
Conduct and coordinate training on specific resources to target groups;
Monitor changes in attitudes, behaviour of target groups;
Conduct training, seminars etc.
Develop partnerships with government and traditional leaders to encourage youth to be more proactive in environmental
National and state EPA, education departments, NGOs, CSP/TNC, traditional leaders, youth groups, municipal leaders, National and state youth offices.
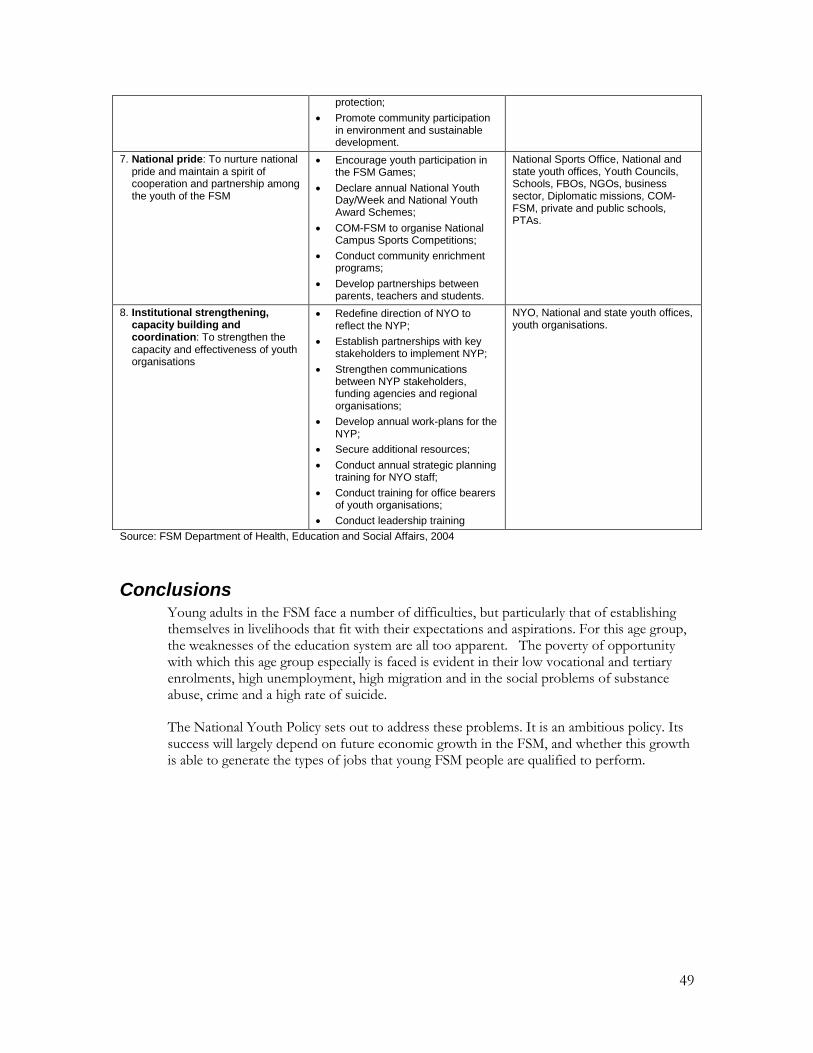
49
protection;
Promote community participation in environment and sustainable development.
7. National pride: To nurture national pride and maintain a spirit of cooperation and partnership among the youth of the FSM
Encourage youth participation in the FSM Games;
Declare annual National Youth Day/Week and National Youth Award Schemes;
COM-FSM to organise National Campus Sports Competitions;
Conduct community enrichment programs;
Develop partnerships between parents, teachers and students.
National Sports Office, National and state youth offices, Youth Councils, Schools, FBOs, NGOs, business sector, Diplomatic missions, COM-FSM, private and public schools, PTAs.
8. Institutional strengthening, capacity building and coordination: To strengthen the capacity and effectiveness of youth organisations
Redefine direction of NYO to reflect the NYP;
Establish partnerships with key stakeholders to implement NYP;
Strengthen communications between NYP stakeholders, funding agencies and regional organisations;
Develop annual work-plans for the NYP;
Secure additional resources;
Conduct annual strategic planning training for NYO staff;
Conduct training for office bearers of youth organisations;
Conduct leadership training
NYO, National and state youth offices, youth organisations.
Source: FSM Department of Health, Education and Social Affairs, 2004
Conclusions Young adults in the FSM face a number of difficulties, but particularly that of establishing themselves in livelihoods that fit with their expectations and aspirations. For this age group, the weaknesses of the education system are all too apparent. The poverty of opportunity with which this age group especially is faced is evident in their low vocational and tertiary enrolments, high unemployment, high migration and in the social problems of substance abuse, crime and a high rate of suicide.
The National Youth Policy sets out to address these problems. It is an ambitious policy. Its success will largely depend on future economic growth in the FSM, and whether this growth is able to generate the types of jobs that young FSM people are qualified to perform.
50
4. The situation of women
Introduction FSM women lag significantly behind males in almost every respect. Taking reproductive health into account, they have more health problems than men. They have a smaller share of the job market and are mainly employed in subordinate and lowly paid jobs. They are under-represented in policy-making at both state and national levels.86 As well, changes within FSM society have tended to increase the vulnerability of women, to heavier domestic work-loads and various forms of abuse, for they are less able to call on the protection of their kin-group than they were in the past.87
The FSM Government recognises the need to improve the status of women. Through various national policies, the Government is working to increase women‟s participation in economic and social development; improve maternal and child health, and improve living conditions, particularly in rural areas and the outer islands.
The FSM Government has also ratified or adopted important international programmes to advance the position of women. These include the Convention on the Elimination of All Forms of Discrimination Against Women and the Convention on the Rights of the Child (both ratified in 1993); the Pacific Platform for Action on Women and the Cairo Platform for Action on Population and Development (both adopted in 1994) and the Global Platform for Action on Women (adopted in 1995). The national and state governments have, however, not yet fully reflected these commitments in their policies and programs.88
Health and well-being Reproductive health
Complications of pregnancy are the leading cause of all hospital admissions, and a main cause of the deaths of women. Three signs that the reproductive and sexual health needs of many women are not being insufficiently met are:
High rates of fertility: (the total fertility rate for FSM was 4.5 in 2001 but varied considerably between the states);
High rates of maternal mortality; and
A fairly low rate of contraceptive use.
Many women do not receive adequate prenatal care. In 2002, only 29 per cent of pregnant women received prenatal care in the first trimester, a figure that ranged from 57 per cent in Pohnpei, to 37 per cent on Kosrae, 9 per cent on Chuuk, and 2.5 per cent on Yap. Of the women who sought prenatal care, only 53 per cent received care that was adequate, as measured by the Kotelchuk Index of Adequacy of Prenatal Care.89 Prenatal care is improving in the state centres and is being expanded to remote areas.90 The percentage of infants born to mothers receiving prenatal care beginning in the first trimester remained at around 20 per
86 Asian Development Bank, 2000.
87 Hezel, 2001.
88 National Strategic Development Plan, Chapter on Gender [in draft].
89 The National Advisory Committee on Children, 2002.
90 Ministry of Health, Education and Social Welfare, 2001.

51
cent from 1997 to 2000, but increased to 32 per cent in 200191 In spite of efforts to improve maternal and child health services, they still are poorly coordinated and insufficiently accessible to rural and outer island communities. Services for pregnant and post-partum women include pap smear and Chlamydia, STI and Hepatitis B screening. However, there are no consistent procedures to ensure that all women receive the full complement of screening services.92
Adequate care at birth is another important factor in the health and survival of mothers and infants. In 1997-2001, the Ministry of Health reported that on average 76 per cent of births were attended by qualified doctors or nurses and, altogether, 92 per cent by trained health workers. This number varied a good deal by state. In 2000, deliveries assisted by trained health personnel accounted for 50 per cent of births on Chuuk, 75 per cent on Pohnpei, 85 per cent on Yap, and 100 per cent on Kosrae.93
Limited access to good quality prenatal care and the remoteness of many communities from medical facilities, particularly in an emergency, contribute to the high maternal mortality rate. As Table 20 shows, on average six women die in the FSM from pregnancy related causes each year, a rate that has changed little over the past decade.
Table 19 Maternal and infant deaths in FSM, 1994-2003
Year Live births Infant deaths Maternal deaths Maternal death rate*
1994 2,808 66 6 213.7
1995 2,607 53 4 153.4
1996 2,567 51 5 194.8
1997 2,591 56 9 347.4
1998 2,667 50 7 262.5
1999 2,568 29 6 233.6
2000 2,677 33 6 224.1
2001 2,660 52 8 300.8
2002 2,518 62 8 317.7
2003 2,527 58 7 277.0
Source: Department of Health, Education and Social Affairs, 2004, unpublished data
Note: The Maternal mortality rate counts maternal deaths per 100,000 live births.
Complications of pregnancy are related to both high fertility and the prevalence of associated disease risks, particularly diabetes, hypertension, and obesity. These types of disease have become quite common in the FSM, affecting the health of both men and women. Even so, infectious diseases are still an important cause for hospital treatment of adults (Table 20).
Table 20 Main causes of hospital treatment of adults aged 35 and older, FSM, 2003
Males Females
Ages 35-44 Digestive system diseases 72 Pregnancy, child-birth & the puerperium 364
91 Ministry of Health, Education and Social Welfare, 2001.
92 Ministry of Health, Education and Social Welfare, 2003.
93 The National Advisory Committee on Children, 2002.
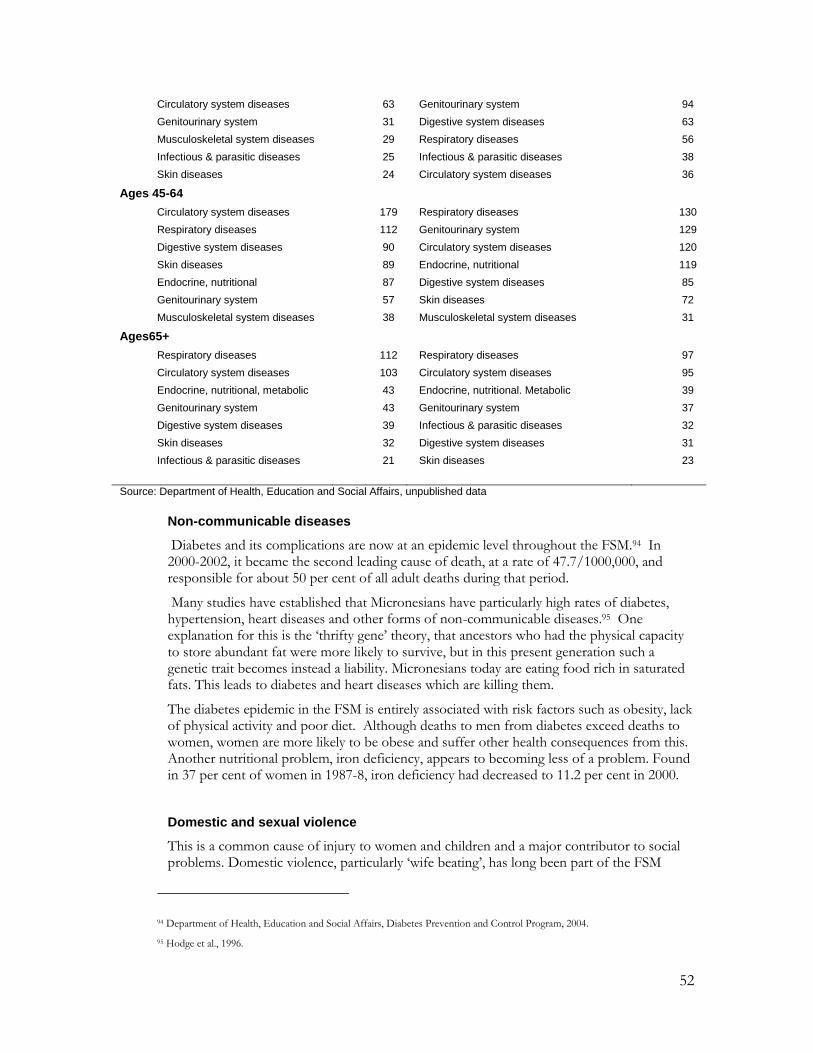
52
Circulatory system diseases 63 Genitourinary system 94
Genitourinary system 31 Digestive system diseases 63
Musculoskeletal system diseases 29 Respiratory diseases 56
Infectious & parasitic diseases 25 Infectious & parasitic diseases 38
Skin diseases 24 Circulatory system diseases 36
Ages 45-64
Circulatory system diseases 179 Respiratory diseases 130
Respiratory diseases 112 Genitourinary system 129
Digestive system diseases 90 Circulatory system diseases 120
Skin diseases 89 Endocrine, nutritional 119
Endocrine, nutritional 87 Digestive system diseases 85
Genitourinary system 57 Skin diseases 72
Musculoskeletal system diseases 38 Musculoskeletal system diseases 31
Ages65+
Respiratory diseases 112 Respiratory diseases 97
Circulatory system diseases 103 Circulatory system diseases 95
Endocrine, nutritional, metabolic 43 Endocrine, nutritional. Metabolic 39
Genitourinary system 43 Genitourinary system 37
Digestive system diseases 39 Infectious & parasitic diseases 32
Skin diseases 32 Digestive system diseases 31
Infectious & parasitic diseases 21 Skin diseases 23
Source: Department of Health, Education and Social Affairs, unpublished data
Non-communicable diseases
Diabetes and its complications are now at an epidemic level throughout the FSM.94 In 2000-2002, it became the second leading cause of death, at a rate of 47.7/1000,000, and responsible for about 50 per cent of all adult deaths during that period.
Many studies have established that Micronesians have particularly high rates of diabetes, hypertension, heart diseases and other forms of non-communicable diseases.95 One explanation for this is the „thrifty gene‟ theory, that ancestors who had the physical capacity to store abundant fat were more likely to survive, but in this present generation such a genetic trait becomes instead a liability. Micronesians today are eating food rich in saturated fats. This leads to diabetes and heart diseases which are killing them.
The diabetes epidemic in the FSM is entirely associated with risk factors such as obesity, lack of physical activity and poor diet. Although deaths to men from diabetes exceed deaths to women, women are more likely to be obese and suffer other health consequences from this. Another nutritional problem, iron deficiency, appears to becoming less of a problem. Found in 37 per cent of women in 1987-8, iron deficiency had decreased to 11.2 per cent in 2000.
Domestic and sexual violence
This is a common cause of injury to women and children and a major contributor to social problems. Domestic violence, particularly „wife beating‟, has long been part of the FSM
94 Department of Health, Education and Social Affairs, Diabetes Prevention and Control Program, 2004.
95 Hodge et al., 1996.

53
cultures, but not to the extent known today. The upsurge in violence is generally ascribed to an increase in alcohol consumption, a breakdown in the traditional protection system that the extended family once offered, and the reluctance that people have in turning to outsiders for help in what they consider to be family arguments.96 Most people still consider it to be something that couples or families must resolve by themselves and are reluctant to report it to the police.97 The police, in turn, have not been able to provide protection for the victims.
The National Development Plan calls for protective laws and safety measures to be adopted and enforced. One such measure is a „No Drop‟ Policy which would ensure that the legal systems continues to process allegations of abuse regardless of whether the victim drops the charges, for this often happens under duress.
Education Adult literacy and educational attainment
Adult literacy appears to have improved for both men and women over the past two decades, and it is now only in the oldest age-groups that there is an appreciable gender difference.
The educational attainment of both men and women has also risen considerably during the past two decades. There is a clear difference in this respect. Women are less likely than men to have attended secondary school, and only half as likely to have attended college. There are few opportunities for adult education in the FSM, other than informal programs run by NGOs and the churches.
Figure 24 a & b
Females: Educational attainment, 1980-2000
0
10
20
30
40
50
60
No school Elementary High school College
Per
cent adults
over
25 y
rs
1980
1994
2000
96 E. Samuel, 2003.
97 E. Samuel, 2003.

54
Males: Educational attainment, 1980-2000
0
10
20
30
40
50
60
No school Elementary High school College
Per
cent adults
over
25 y
rs
1980
1994
2000
Source: National Census, 2000
Livelihoods Labour force participation
Over the past decade, women have become more actively involved in economic activities outside the household. From 1990 to 2001, the labour participation rate for women rose from 30.1 to 50.1 per cent. Over the same period, the rate for men rose from 56.8 to 67.2 per cent, considerably higher than for women. Much of this growth in employment, however, has been in the informal sector, in subsistence agriculture and fishing (Figure 26).
Of all women who work in the formal sector, most work in service delivery or support services. Few work in administration or positions of high responsibility, although this situation is changing, particularly in government services where there are a growing number of women working at senior levels. Partly because they often have lower-ranking jobs, on average women earn much less than men (Figure 27).
Figure 26
Employment by sex, 1994 & 2000
0
10
20
30
40
50
60
Male Female Male Female
1994 2000
Per
cent of people
over
15 y
rs
Employed
Formal w ork
Subsistence agric/f ish
Source: National Census, 2000

55
Figure 27
Median incomes of working people, by age and sex, 2000
$500
$1,000
$1,500
$2,000
$2,500
$3,000
$3,500
$4,000
$4,500
$5,000
15-19 20-24 25-29 30-34 35-39 40-44 45-49 50-54 55-59 60-64 60+
Males
Females
Source: National Census, 2000
There are a small but growing number of businesses owned or operated by women. Small and medium-sized enterprises, operating in either the formal or informal sectors, provide a good way to generate cash incomes in rural and remote areas. There is still limited information about the extent of women‟s involvement in business in the FSM.98
Table 20 Women in small or medium-sized enterprises, 1999-2003, FSM
State Medium-sized Enterprises Small enterprises and home businesses
Chuuk 2 20
Kosrae 3 n.a
Pohnpei 6 n.a
Yap n.a 2
Total 11 22
Source: National Strategic Development Plan, Chapter on Gender (in draft). Table compiled from provisional information provided by National and States’ Women’s Programmes.
Labour exploitation
Trafficking is not yet a major source of criminal activity in the Pacific but the potential exists. A number of cases have been reported of women being recruited for jobs in the US mainland under some misleading pretences, and finding themselves trapped in hardship far from home. Under the new Compact, labour recruiters to the United States are required to be certified and meet minimum standards, and this should counter any trafficking of FSM women into the United States. There have also been some incidents, or rumours, of the passage of women from Asia to or through the FSM, possibly for prostitution.
A proposal now under consideration is that the FSM accede to the 2003 United Nations Protocol to Prevent, Suppress and Punish Trafficking in Persons, Especially Women and Children, in addition to the pending accession to the 1951 UN Convention for the Suppression of the Traffic in Persons and of the Exploitation of the Prostitution of Others. A draft Ant-Trafficking Bill which is now before Congress proposes some related changes to immigration law.
98 National Strategic Development Plan, Chapter on Gender (in draft).

56
Family responsibilities There is a strong community expectation that women are responsible for family care and maintenance of the household, even when they also work outside of the home, but the principal authority rests with the senior man. A recent survey found that women spend just over half (53 per cent) of their time in unpaid labour or subsistence work. This unpaid work includes child care, housekeeping, food preparation and production, farming or fishing, and assisting with family owner operations.
Changes are occurring within FSM societies that are impacting upon family responsibilities and household arrangements. As households become more nuclear in nature, more of the responsibilities for child support and parenting fall directly upon the parents, unlike before when they were shared to some extent among the extended family. As well, there has been a drop in the marriage rate of adults over the past few decades. More adults are either staying unmarried or are separating or divorcing (Figure 28). There are a small but growing number of women-headed households. Because the average earning capacity of women is much lower than men, this change in particular is associated with growing hardship and poverty.
Figure 28
Marital status, by sex, 1974 & 2000
0 10 20 30 40 50 60 70
Never married
Married
Separated/divorced
Widow ed
Never married
Married
Separated/divorced
Widow ed
Men
Wom
en
Per cent of adults
2000
1973
Source: National Census, 2000
Institutional mechanisms to promote the interests of women In order to ensure that women‟s views and their special interests are fully taken into account in the development of the FSM, much work has been done over the past decade or so to improve the organisation and coordination of women‟s organisations and to increase the participation of women in state and national affairs.
The formal involvement of women‟s organisations in national development dates from the early 1990s. In 1992, a National Women‟s Advisory Council (NWAC) was created by presidential order. That year, the first FSM National Women‟s Advisory Council was inaugurated, and a salaried National Women‟s Interest Officer‟s post was created in the Department of Health, Education and Social Affairs. In 1993, the first FSM Women‟s Policy and Framework was drafted. Over the next five years, women‟s programmes were established in three of the state governments, Kosrae, Pohnpei and Chuuk. NGO Women‟s Advisory Councils were also formed: in each state. The national and state programs focussed on coordinating activities and exchanging information about women‟s activities.

57
Despite this promising beginning, over the past decade the various women‟s programmes have not been able to effectively advocate, promote or support women‟s development programs. The two main reasons for this have been the lack of an official gender policy or planning, and inadequate funding. Most national and state women‟s programs exist as a „one-person‟ operation in a small office space provided as „in-kind‟ contribution by its host agencies. Budgets for the national and state Women‟s Programmes cover only travel and office supplies and there are no funds to implement programmes or provide services for women.
Women’s involvement in national and island politics Women‟s programmes and organisations in the FSM have long been advocating for more opportunities for women to participate in national development and governance, and for the under-representation of women in decision-making to be redressed. However, participation of women at the highest levels of national and state affairs has not changed since the FSM adopted the Beijing Global Platform for Action (GPA) in 1995. Women continued to be under-represented at the legislative, cabinet and highest levels of corporate sector and other economic and social institutions. 99 Women are discouraged from seeking careers in politics and other leadership because of cultural stereotypes, a lack of opportunities for leadership training, and a general apathy and lack of support for women wanting to move into roles that have traditionally been dominated by men.
Table 21 Participation of women in national parliament
1994 1998 2000 2004
Proportion of seats held by women 0 7.1%
Number of men elected 13
Number of women elected 1
The Gender Plan The 2004-2010 National Strategic Plan, now in draft, contains a chapter on gender issues. This aims to address many of the problems facing women and the issues that are being advocated by women‟s organisations. Objectives of the plan include the strengthening of the institutional capacity of women‟s programmes, the enhancement of the leadership capacity and roles for women, and establishment of a Commission on the Status of Women by 2010. The plan has nine goals, with outcomes, activities and outputs listed for each one (Table 22). The overall goal is to empower women, youth, senior citizens and disabled persons to be self-reliant individuals and productive members of FSM society.
Table 22 The Gender Strategic Planning Matrix
Goals Outcomes
1. To enhance and promote the cultural, economic, legal, political and social status of women
Adopt national policy on gender by 2007
Establish Commission on the Status of Women by 2010
2. To enhance the leadership capacity and roles for women
Increase the number of women in leadership, management and elected positions
Gender based stereotypes, attitudes, behaviours and practices are decreasing
3. To mainstream gender issues into decision-making, policies and strategic development plans
FSM gender policy advocacy and mainstreaming capacity enhanced

58
Acceptance of gender issues by decision makers
Enhanced mainstreaming capacity.
4. To maximise women’s contribution to and participation in democratic and development processes by creating opportunities for women’s active involvement
A safer environment at home, work, school and other public places
Women’s economic capacity and commercial networks are strengthened
Harmonize work and family responsibilities for men and women
Representation of women on all law and policymaking bodies by at least 2012.
5. To strengthen the institutional capacity of women’s programmes in the FSM
Establish Division of Gender and Social Affairs (GENSA) by 2007
Determine needs and requirements for appropriate skilled staff, technical equipment and office furniture
Improve capacity and access to ICT
Strengthen networks and alliances through increased advocacy.
6. To strengthen the institutional capacity, effectiveness and impact of youth organisations in the planning, delivery, promotion, monitoring and evaluation of youth programmes and the National Youth Policy
Adopt National Youth Policy in 2005
Strengthen youth councils, organisations and programs by 2007
Develop the full potential of FSM youth.
7. To strengthen youth development through social, economic and political participation
Increase participation of youth leaders in economic, political and social activities, dialogues and programs
Improve networking, partnership and collaboration with strategic stakeholders
Improve MIS, information and communication capacity.
8. To establish social protection and social welfare services for senior citizens
By FY 2006,create a National Senior Citizens Office
Improve senior citizen’s benefits and protection
Adopt National Senior Citizens Policy by 2010
Establish Senior Citizens Development Programs by 2006.
9. To address the special economic, legal, political and social needs of disabled persons and persons with special needs
Adopt national policy on disabled persons and persons with special needs
Mainstream disabled persons and persons with special needs into ongoing and regular public and private activities, programs and services
Recognition of positive contribution of disabled persons and persons with special needs.
Source: National Strategic Development Plan, in draft
Conclusions While individual women may fare considerably better or worse than the average person, as a group, women in the FSM have not shared well in the benefits of development in the FSM, such as they are. Their health status is quite poor, particularly in regard to reproductive health, with one of the highest maternal mortality rates in the Pacific island region. As they become more economically active in the public domain, they retain or even further gain domestic responsibilities and work-loads. Violence against women is of particular concern in the FSM.
The latest national development plan, now being finalised, has a comprehensive and ambitious plan to ensure that women‟s issues and concerns are addressed. Over the past decade, much has been promised in regard to improvements in the status of women but the outcomes have been slow, and perhaps hard to realise by women in the community.

59
5. The agenda for change
The FSM is signatory to two most important international conventions that protect and advance the status of children and women, namely the Convention on the Rights of the Child and the Convention to Eliminate All Forms of Discrimination Against Women. Many policies have been developed to address particular issues, and many programmes implemented, but the lack of coordination has worked against real benefits being realised by the community.
A lot of work has gone towards this next phase of national planning, the forth-coming National Strategic Development Plan. The plans for youth and women intend to address many of the current problems. The existence of these plans shows that there is a strong desire in the FSM to work through the present difficulties and to create a more prosperous and equitable society. But whether these plans progress into practical action will depend not just upon the availability of necessary resources but on finding ways to overcome some of the problems of the past, particularly in the set-up of service delivery systems.
The FSM is struggling with some quite basic development problems, a high burden of ill-health from both infectious and non-communicable diseases, problems with the quality of basic education, loss of food security and problems with poor nutrition, and burgeoning social problems. The most intractable problems are to meet the aspirations of people for paid work and sustainable livelihoods, and to maintain a good living environment, especially on the very crowded islands of Chuuk.
The economic problems of the country have widespread effects, including high unemployment and high emigration. Poverty is becoming more apparent. Government is trying to come in to terms with reduced aid, mainly from the US which provides so much of the operating capital for government activities. Public services already under pressure and with declining standards are likely to be even further eroded. Plans to implement „user pay‟ systems will be difficult to implement in communities where cash is rare. The plans are optimistic but the pace of change may be much slower.

60
References
Asian Development Bank, 1995. Human Resource Development, Pacific Region: Overview Paper: Federated States of Micronesia, Office of Pacific Operations, ADB, Manila.
Asian Development Bank, 2000. „Communities Will Improve Health And Education Services In Micronesia,‟ News Release No. 161/00, ADB, Manila.
Connell, J. 1997. The Northern Pacific: Contemporary Economic Developments.
Department of Economic Affairs, Division of Statistics, 1998, Household Income and Expenditure Survey, FSM National Government, Palikir.
Department of Economic Affairs, Division of Statistics, 2002, 2000 Population and Housing Census Report, FSM National Government, Palikir.
Department of Economic Affairs, 2002, FSM Economic Review. FSM National Government, Palikir.
Department of Health, 2001, Health Information Profile, FSM Department of Health, Palikir.
Department of Health, Education and Social Affairs, various dates, Title V Maternal and Child Health Services Block Grant, mimeo.
Department of Health, Education and Social Affairs, 2004, Systems-Bases Diabetes Prevention and Control Program: A Capacity Building Approach Under Program Announcement 03017, mimeo.
Department of Health, Education and Social Affairs, 2004, National Youth Policy, 2004-2010, mimeo.
Englberger, L., G. Marks and M Fitzgerald, 2003, „Insights on food and nutrition in the Federated States of Micronesia: a review of the literature,‟ Public Health Nutrition 6(1) 5-17.
Englberger, L. 2004. An Assessment of the Capacity to Address Agrobiodiversity Issues, National Biodiversity Strategy and Action Plan, Phase II, Government of the FSM.
Fischer, L., R. Ward and M. Ward, 1976, „Ponapean conceptions of incest‟ Journal of Polynesian Studies, 85:2. Special Issue: Incest Prohibitions in Micronesia and Polynesia.
Flear, J. 1997. Good Intentions, Good Enough? Observations on the Sociocultural Aspects of Health Care Delivery in Micronesia. Micronesian Seminar, Palikir.
FSM National Division of Education, 1997, Strategic Plan for Improvement of Education in the Federated States of Micronesia, Division of Education, Palikir.
FSM Women Association Network, 1999. FSM Gender and Development Progress Report, NGO Presentation to the Pacific Women National Focal Point Conference, 5-9 April 1999, Mocambo Hotel, Nadi, Fiji.

61
Government of FSM and UNICEF, 1996, A Situation Analysis of Children and Women in the Federated States of Micronesia, UNICEF, Suva.
Hezel, F., E. Pettys and D. Chang, 1996. Sustainable Human Development in the Federated States of Micronesia, UNDP, Suva.
Hezel, F. 2003. How Tough Was Your Dad? The Micronesian Counselor 48, Micronesian Seminar, Palikir.
Hodge, A., G. Dowse, P. Zimmet, 1996. „Obesity in the Pacific populations,‟ Pacific Health Dialog, 3:77-86.
Hunt. E. 1949, The Micronesians of Yap and their depopulation, Coordinated Investigation of Micronesian Anthropology #24, Harvard University, Massachusetts.
Levin, M, E. Grieco, M. Stroot, M. Samo and D. Sasamoto, 2003, The Status of Micronesian Migrants in 2003: A Study of the Impact of the Compacts of Free Association based of Censuses of Micronesian Migrants to Hawaii, Guam and the Commonwealth of the Northern Mariana Islands, US Office of Insular Affairs and US Bureau of the Census, Washington.
Lieber, M. 1968. Porakiet: A Kapingamarangi Colony in Ponape, Dept Anthropology, University Oregon, Eugene.
Marshall, M. 1979. Weekend Warriors: Alcohol in a Micronesian Culture, Mayfield Publishing Co., Palo Alto.
Medical and Vital Statistics Office, 1999, Annual Vital Statistical Report, Department of Health, Education and Social Affairs, Palikir.
Medical and Vital Statistics Office, 2000, Annual Vital Statistical Report, Department of Health, Education and Social Affairs, Palikir.
Medical and Vital Statistics Office, 2001, Annual Vital Statistical Report, Department of Health, Education and Social Affairs, Palikir.
National Advisory Council on Children, 1996, Federated States of Micronesia: National Report on Two Years Implementation on the United Nations Convention on the Rights of the Child, UNICEF, Suva.
National Advisory Council on Children, 2003, Federated States of Micronesia: Second National Report on Implementation on the United Nations Convention on the Rights of the Child (in draft).
Office of Planning and Statistics, 1995, Statistical Handbook, FSM National Government, Palikir.
Office of Planning and Statistics, 1996, 1994 FSM Census of Population and Housing, FSM National Government, Palikir.
Samuel, E. 2002. Too Young to be Mothers, The Micronesian Counsellor 43, Micronesian Seminar, Palikir.

62
Samuel, E. 2003, Spouse Abuse in Micronesia, The Micronesian Counsellor 46, Micronesian Seminar, Palikir.
Schneider, D. 1955, Abortion and depopulation on a Pacific island‟ in B. Paul (ed.) Health and Community, Russell Sage Foundation, New York.
Schoeffel, P. 1993, Women in Development: Federated States of Micronesia, Asian Development Bank Programs Department (East), Manila.
South Pacific Commission, 1977, Population 1974, Statistical Bulletin No. 7, SPC, Noumea.
South Pacific Commission, 1993, South Pacific Economies Statistical Summary, No. 13, SPC Noumea.
Sudo, K. 1985, Avoidance behavior and kin category in Satawalese society, Man and Culture in Oceania 1; pp. 1-26.
UNICEF, 2001, The State of Health Behaviour and Lifestyle of Pacific Youth: Pohnpei State, Federated States of Micronesia Report, UNICEF Pacific, Suva.
United States Census Division, 2001, The native Hawaiian and other Pacific Islander Population, US Census Brief, December 2001, USCD, Washington.
United States Department of the Interior, Office of Insular Affairs, 1999. A Report on the State of the Islands, US Government, Washington.
United States Department of the Interior, Office of Insular Affairs, 2003, The Status of Micronesian Migrants in 1998. US Government, Washington.

63
Millennium Development Goals: FSM
Pop Census Counts
Total Population 105,506 1994 107,008 Year = 2000
Total Population - Urban 26,942 Year = 23,893 Year =
Total Population - Rural 78,564 Year = 83,115 Year =
Female population aged 15-24 years 10,327 Year = 11,122 Year =
Male population aged 15-24 years 10,752 Year = 11,640 Year =
Total land area (excl inland water bodies) 701 km²
Hectares or Acres?
Year Value Year Value Source
1. Proportion of population below $1 (PPP) per daya 1
2. Poverty gap ratio (PGR) [incidence x depth of poverty]
PGR=(av income of below pov line/pov line)*(Percent below poverty line) #DIV/0!
Poverty line (household monthly income )
Per cent below poverty line 26.7%
Average income of below poverty line
3. Share of poorest quintile (20%) in national consumption
Share of lowest 20% = (inc or exp) / (total income or expenditure) 1998 5.21% 1998 8.87% household
Income or Expenditure of lowest 20% INCOME 9,421 EXP 15,536 HIES
Total Income or Expenditure 180,890 175,239
4. Prevalence of underweight children under-five years of age 1994 0.0000% 1997 15
SPC health surveillance
Underweight children under 5 years 1997 Pacific HDR
De facto population under 5 years 15,854
5. Proportion of population below minimum level of dietary energy consumption 1991 1996
SPC health surveillance
Proportion below minimum level of dietary energy 189 cases/94184 254
cases/109200
6. Net enrolment ratio in primary education
NER = (total enrolled / total in age group) 1994 93.7 2000 92.30 DEA
Age group for PRIMARY SCHOOL 6-13 years
Total de facto pop in primary school age group
Total in primary school age group attending primary school
7. Proportion of pupils starting grade 1 who reach grade 5 #DIV/0! 2000 66.9
PRIMARY completion rate,
2000 Census
Year and number of pupils starting Grade 1 DEA
Year + 5 and number of pupils completing Grade 5
8. Literacy rate of 15-24 year-olds 1994 71.00 Pacific HDR
Total literate de facto population aged 15-24 years 1994 2000
9. Ratios of girls to boys in primary, secondary and tertiary education
Ratio of girls to boys in primary school 1994 0.92 2000 0.93 Census
Ratio of girls to boys in secondary school 1994 0.98 2000 1.04
Ratio of girls to boys in tertiary education 1994 0.79 2000 1.07
Girls enrolled in primary school 10,770 10095
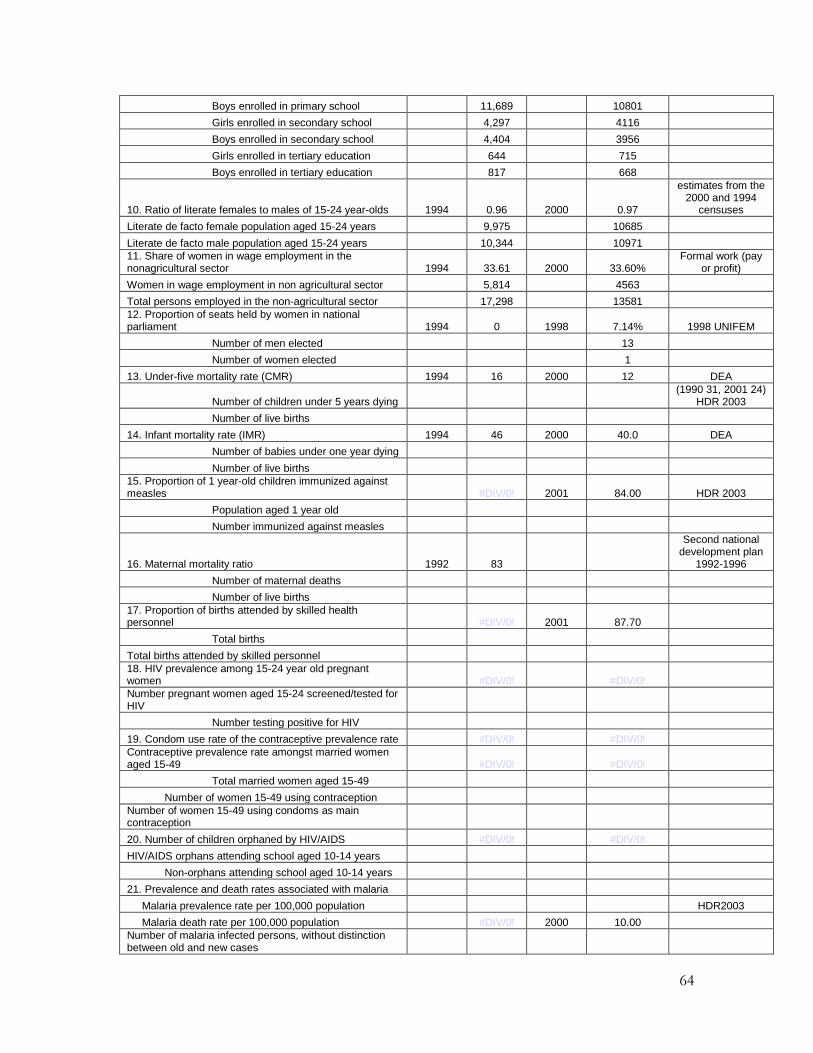
64
Boys enrolled in primary school 11,689 10801
Girls enrolled in secondary school 4,297 4116
Boys enrolled in secondary school 4,404 3956
Girls enrolled in tertiary education 644 715
Boys enrolled in tertiary education 817 668
10. Ratio of literate females to males of 15-24 year-olds 1994 0.96 2000 0.97
estimates from the 2000 and 1994
censuses
Literate de facto female population aged 15-24 years 9,975 10685
Literate de facto male population aged 15-24 years 10,344 10971
11. Share of women in wage employment in the nonagricultural sector 1994 33.61 2000 33.60%
Formal work (pay or profit)
Women in wage employment in non agricultural sector 5,814 4563
Total persons employed in the non-agricultural sector 17,298 13581
12. Proportion of seats held by women in national parliament 1994 0 1998 7.14% 1998 UNIFEM
Number of men elected 13
Number of women elected 1
13. Under-five mortality rate (CMR) 1994 16 2000 12 DEA
Number of children under 5 years dying (1990 31, 2001 24)
HDR 2003
Number of live births
14. Infant mortality rate (IMR) 1994 46 2000 40.0 DEA
Number of babies under one year dying
Number of live births
15. Proportion of 1 year-old children immunized against measles #DIV/0! 2001 84.00 HDR 2003
Population aged 1 year old
Number immunized against measles
16. Maternal mortality ratio 1992 83
Second national development plan
1992-1996
Number of maternal deaths
Number of live births
17. Proportion of births attended by skilled health personnel #DIV/0! 2001 87.70
Total births
Total births attended by skilled personnel
18. HIV prevalence among 15-24 year old pregnant women #DIV/0! #DIV/0!
Number pregnant women aged 15-24 screened/tested for HIV
Number testing positive for HIV
19. Condom use rate of the contraceptive prevalence rate #DIV/0! #DIV/0!
Contraceptive prevalence rate amongst married women aged 15-49 #DIV/0! #DIV/0!
Total married women aged 15-49
Number of women 15-49 using contraception
Number of women 15-49 using condoms as main contraception
20. Number of children orphaned by HIV/AIDS #DIV/0! #DIV/0!
HIV/AIDS orphans attending school aged 10-14 years
Non-orphans attending school aged 10-14 years
21. Prevalence and death rates associated with malaria
Malaria prevalence rate per 100,000 population HDR2003
Malaria death rate per 100,000 population #DIV/0! 2000 10.00
Number of malaria infected persons, without distinction between old and new cases

65
Total deaths caused by malaria
Total deaths
22. Proportion of population in malaria risk areas using effective malaria prevention and treatment measures
Percentage population aged under 5 years sleeping under insecticide treated bed nets #DIV/0! #DIV/0!
Percentage population aged under 5 years treated for malaria #DIV/0! #DIV/0!
Population aged under 5 years
Population aged under 5 years sleeping under insecticide treated bednets
Population aged under 5 years treated for malaria
23. Prevalence and death rates associated with tuberculosis
TB notification rate per 100,000 population 1989 72 2000 79 WHO
TB death rate per 100,000 population #DIV/0! 2002 12.7 WHO
Total deaths 0
Number of TB infected persons, without distinction between old and new cases 1994 160
Total deaths caused by TB
24. Proportion of tuberculosis cases detected and cured under directly observed treatment short course (DOTS)
Tuberculosis, DOTS detection rate, per cent total population 2000 31.00 2001 90.00 WHO
Tuberculosis, DOTS treatment success, per cent total population 1999 95.00 2000 93.00
Annual new smear positive notifications under DOTS
Estimated annual new smear-positive incidence (country)
All registered TB cases (country)
Registered patients who were cured (annual)
Registered patients who completed treatment (annual)
Proportion who completed treatment to all registered cases
25. Proportion of land area covered by forest 1999 17.64
Forested land area 123.66
26. Ratio of area protected to maintain biological diversity to surface area 1994 7.28% 2002 7.28%
Protected areas, sq. km 51 51
Total surface area, sq. km 701 701
27. Energy use (kg oil equivalent) per $1 GDP (PPP) #DIV/0!
GDP PPP Unit #DIV/0! #DIV/0!
Commercial energy use measured in units of kilograms of oil equivalent
GDP (local currency)
PPP Units
28. Carbon dioxide emissions (per capita) and consumption of ozone-depleting CFCs (ODP tons)
Carbon dioxide emissions (CO2), metric tons, per capita 1994 2 0
Consumption of ozone-depleting CFCs (ODP tons) 0 0
Carbon dioxide emissions (CO2), metric tons
CFC imports, ODP tons
CFC production, ODP tons
CFC exports, ODP tons
29. Proportion of households using solid fuels 1994 47% 2000 53.50%
Households using biomass fuels 7733 9092
30. Proportion of population with sustainable access to an improved water source, urban and rural

66
Proportion of population with sustainable access to an improved water source, urban 1994 93.50 2000 94.40% DEA
Proportion of population with sustainable access to an improved water source, rural 1994 87.90 2000 92.10% DEA
Population with improved water supply, urban 1994 2000
Population with improved water supply, rural 1994 2000
31. Proportion of urban population with access to improved sanitation 1994 34.41 2000 43.96%
total population, not only rural
Population with improved sanitation, urban 1994 2000
Improved sanitation includes flush toilet inside and outside
32. Proportion of households with access to secure tenure (owned or rented) #DIV/0! 2000 93.90%
Households owned or rented
Total households
33. Net ODA, total and to LDCs, as percentage of OECD/DAC donors’ gross national income
34. Proportion of total bilateral, sector-allocable ODA of OECD/DAC donors to basic social services
35. Proportion of bilateral ODA of OECD/DAC donors that is untied
37. ODA received in small island developing States as proportion of their GNIs
38. Proportion of total developed country imports (by value and excluding arms) from developing countries and LDCs, admitted free of duties
39. Average tariffs imposed by developed countries on agricultural products and textiles and clothing from developing countries
41. Proportion of ODA provided to help build trade capacity
44. Debt service as a percentage of exports of goods and services 1994 80 2000 66.00
Debt service
Exports of goods and services
45. Unemployment rate of 15-24 year-olds, each sex and total
Unemployment rate of 15-24 year-olds, female 1994 44.32% 2000 35.48% Census
Unemployment rate of 15-24 year-olds, male 24.67% 34.94%
Unemployment rate of 15-24 year-olds, total 32.66% 35.17%
Total de facto female population aged 15-24 years, labour force 2455 4386
Total de facto male population aged 15-24 years, labour force 3579 5624
Total de factor female population aged 15-24 years, unemployed 1088 1556
Total de factor male population aged 15-24 years, unemployed 883 1965
46. Proportion of population with access to affordable essential drugs on a sustainable basis 0 2000 95-100 HDR 2003
Population with access to affordable essential drugs
47. Telephone lines and cellular subscribers per 100 population
Telephone lines per 100 population 1990 2.50 9.44 HDR 2003
Cellular telephone subscribers per 100 population 0.00 1.68
Number of telephone lines 2003 10100
Number of cellular mobile telephone subscribers 1800
48. Personal computers in use per 100 population and Internet users per 100 population
Personal computers in use per 100 population 0.00 0.00
Internet users per 100 population 0.00 2002 5.09 ITU estimates

67
Personal computers in use
Internet users