Situation analysis for Mangroves for the Future - UNEP ...
50
Situation analysis for Mangroves for the Future: Understanding the resilience of coastal systems Melita Samoilys 1 , George Waweru Maina 1 , Julie Church 1 , Brigid Mibei 1 , Marta Monjane 2 , Abdulla Shah 2 , Doris Mutta 3 and Mine Pabari 2 1. CORDIO East Africa 2. IUCN 3. Nairobi Convention Secretariat (UNEP) March 2013 1
-
Upload
khangminh22 -
Category
Documents
-
view
0 -
download
0
Transcript of Situation analysis for Mangroves for the Future - UNEP ...
Situation analysis for Mangroves for the Future:
Understanding the resilience of coastal systems
Melita Samoilys1, George Waweru Maina1, Julie Church1, Brigid Mibei1, Marta Monjane2,Abdulla Shah2, Doris Mutta3 and Mine Pabari2
1. CORDIO East Africa2. IUCN3. Nairobi Convention Secretariat (UNEP)
March 2013
1

Table of Contents
1.0 Introduction and background
The purpose of this situation analysis is to better understand ecological and social coastal systems in EasternAfrica with a view to identifying key areas and effective strategies through which MFF can contribute to theconservation, restoration and sustainable management of coastal ecosystems as key natural infrastructurewhich support human wellbeing, resilience and security (see Fig.1).
More specifically, the analysis has attempted to address the following questions:
A. To what extent are coastal systems1 able to be resilient2 to global change(eg. climate) so as to enable sustainable development3?
B. What are the key factors affecting the resilience (illustrated in Fig. 1) ofcoastal systems?;
C. How effective are current responses to vulnerability at local, national andregional levels?
The approach of this study was largely a desk based review but was framed within an resiliencebased analyticalframework (Figure 1). Thus published papers and reports were interrogated using this framework to try and distilthe most relevant information to a) understand the resilience of the coastal systems, both ecological and socioeconomic, and b) help direct attention and focus on key areas to which MFFWIO can contribute, eithergeographically or through sociopolitical processes.
Global change is defined here for this review as changes caused by increasing greenhouse gas emissionsresulting in a high CO2 world and the direct and indirect changes that ensue. Increasing green house gasemissions are causing three major impacts on the ocean: warming sea surface temperature (SST), oceanacidification and deoxygenation (Turley et al 2011). The latter two are poorly understood at present, particularlyin Eastern Africa. Secondary impacts include sea level rise due to melting polar ice caps. Coral bleaching anddeath caused by SST rise has been extensively studied and measured (HoeghGuldberg 1999; Hughes et al.2003), including in the WIO (Obura 2005, McClanahan 2009), with likely ecosystem phase shifts as coral reefsbecome dominated by macroalgae (brown algae such as Turbinaria, Sargassum spp.) (Bellwood et al. 2004;Hughes et al. 2005). Ocean acidification is likely to have enormous impacts on marine resources and hencefisheries (Turley et al. 2011), as ocean chemistry is changed and thus any marine organisms that rely on Phsensitive chemical reactions will be affected. This field is still relatively new and early reports predict trophic level
1 Coastal systems are defined here as both social and ecological
2 Resilience is defined here as being able to anticipate, minimize and absorbdisturbances and reorganize while undergoing change
3 Economic and social developmental goals alongside the protection of biodiversity
2

shifts as organisms with calcium carbonate skeletons, e.g molluscs, corals, are compromised. Deoxygenation iscaused by ocean warming (oxgen becomes less soluble) which will result in less growth of most marineorganisms and a shift to low oxygentolerant organisms, often microorganisms. Coastal environments andpeople are also undergoing changes that are directly related to human pressures caused by development andother activities. These include increasing population, mechanisation (eg in fisheries), industrialisation (eg portsand coastal cities), pollution, and extraction of oil and gas.
3

Figure 1. Diagram illustrating key components of the resilience framework for the situation analysis
4
Changing temperatures Climate variability
- Individuals- Communities
Ecological Social
- Organizational systems & processes - National legislative, policy & planning frameworks- Markets
Institutional
- Local level Governance (formal & informal structures, norms,rules & regulations)
- Use &dependency
- Ecosystemgoods &services
- Developmentactivities
- Habitats- Species

The scope of this situation analysis is captured in the following three elements which are compiled in thesubstantive sections (2,3,4) of this report, and realte closely to the three questions posed earlier (A,B,C):
1. State (section 2, question A): Current state and trends of key components within 3 main domains – i)ecological; ii) socioeconomical; iii) institutional. Additionally, critical natural external forces affecting these 3domains will be identified and factored into the overall situation analysis;
2. Relationship (section 3, question B): between each of the domains and the extent to which they reinforceor undermine the resilience of one or more domains or components;
3. Adaptability (section 4, question C): of individual components within each of the domains.
This scope proved to be both broad and intensive due to finding an enormous amount of information availableand therefore the institutional analysis, which was led by WIOMSA, is presented in a separate report. Theintention of the third element of the study, Adaptability, was to bring together the environmental and socioeconomical domains, presented here, and the institutional domain, presented separately, and analyse themtogether to assess the adaptability of the different components. It became apparent that this was a huge task andone that required a more participatory, workshop approach with key partners and stakeholders. This is furtherdiscussed in section 4. In addition, section 3, Relationships, is focussed in this report on the relationshipsbetween two domains: environmental and socioeconomic.
The geographic scope of the analysis covers Kenya, Mozambique and Tanzania and uses a reef to ridgeapproach, focusing on territorial waters, riverbasins and catchments. Linkages with offshore marine systemshave also been taken into account where there is a significant relationship to coastal systems. Territorial watersare generally defined as within 12 nm and this value is used here as a useful benchmark since marine jurisdictioninvariably refers to territorial waters within 12nm as available exclusively for citizens and residents. In contrastthe EEZ waters outside the 12nm zone are reserved for foreign exploitation of fisheries and minerals, includingoil and gas.
Some reference is given to information from Madagascar, South Africa, Seychelles and Somalia since thesecountries have potential to partner with MFFWIO because they are either part of MFFAsia (Seychelles), or havesufficient internal resources and experience (South Africa), or have expressed interest in being part of MFFWIOin the future (Madagascar, Somalia).
2.0 State
This section synthesises the current state and trends of key components of both the ecological and the socioeconomic domains. Any critical natural forces that affect these domains are also mentioned here.
2.1 Ecological domain
The Eastern Africa countries of Mozambique, Tanzania and Kenya (Figure 2) have their coastal margins on thefar west of the Western IndoPacific biogeographic realm (Spalding et al. 2007). Based on taxonomicconfigurations, evolutionary history, dispersal and isolation, Spalding and coworkers defined this region as theWestern Indian Ocean (WIO) Province (Province no. 20) with three mainland ecoregions (Figure 2).
5

Figure 2. Map of the western Indian Ocean showing the three countries under review Kenya, Tanzania,Mozambique, as well as biogeographically related countries of the region: Madagascar, South Africa,Seychelles, Comoros and Somalia. Ecoregions are those defined by Obura (2012) based on the distribution ofhard coral species. (© CORDIO).
Obura’s (2012) recent analysis, based on the diversity and distribution of reefbuilding corals, has revisedSpalding et al. (2007)’s definitions of Marine Ecoregions of the World (MEOW) and defines five ecoregions(Table 2) which are used in this report. These give prominence to the oceanographic linkages across theMozambique Channel and the importance of this link for regional management planning and prioritisation forconservation action (Obura et al. 2012). We use them here as these ecoregions are closely defined by theoceanography of the WIO with its five distinct ocean circulation patterns (Figure 3), of which three, i) the SouthEquatorial Current; ii) the Comoros gyre and related eddies in the Mozambique channel; and iii) the East AfricanCoastal Current are all driving currents in this marine system. They will play an important role in conferringresilience to climate change in different areas of this region.
6

Table 1. Biophysical and geographic characteristics of Mozambique, Tanzania and Kenya within the WIO region; other countries included are those that may partner withMFF and they also help provide a regional perspective. (Data source: UNEP 2009; Spalding et al. 2010).
Country Coastlinekm
Territorialwaterskm2
Continentalshelfkm2
EEZmillionkm2
Majorrivers andlength, km
RiversMARi
Riversediment loadMt.yr-1
Coral reefareakm2
Mangroveareakm2
Seagrassareakm2
Mozambique
2,470 70,894 73,300 0.493 Zambezi –2,650Limpopo –1,750
67-19013
22-4310-34
1,860 2,909 439
Tanzania 1,424 36,578 17,903 0.204 Ruvuma –800Rufiji - ~ 600
96N/A
N/A15-17
3,580 1,287 N/A
Kenya 536 12,832 8,460 0.104 Tana – 1,102Sabaki - 650
3835
6.8 630 610 33.6
Somalia 3,025 68,849 40,392 1.200 Juba-Shebelle
N/A N/A 710 48 N/A
SouthAfrica
2,881 74,699 160,938 1.1016 Incomati -480
46 7 ~50 31 ~7
Madagascar
4,828 124,938 96,653 1.079 Betsiboka -525
N/A N/A 2,230 2,991 N/A
Seychelles
491 45,411 31,479 1.288 none - - 1,690 32 N/A
i. MAR=mean annual runoff NB1: Ruvuma River is placed in Tanzania but lies on the border in both Tanzania and Mozambique; NB2: for Somalia and South Africa values are for the whole country (UNEP 2009) and therefore include oceans outside the WIO.
7

Table 2. Ecoregions of the study area (Source: Obura 2012, Spalding et al. 2007).
No. Geographic range
1 Somalia
2 southern Somalia, Kenya, northern Tanzania monsoon coast
3 Northern Mozambique Channel: southern Tanzania, northern Mozambique
4 Southern Mozambique Channel: centralsouthern Mozambique
5 Delagoa: southern Mozambique, northern South Africa
Figure 3. Western Indian Ocean Province showing the main ocean currents that define the region. A = SouthEquatorial Current (SEC); B = eddies and Comoros gyre in the Mozambique channel; C = East African CoastalCurrent (EACC); D = Somali Current; E = Agulhas Current. © David Obura (2012).
This biogeographic description of the WIO is important in setting the context for understanding the vulnerabilities andlikely resilience to climate change of the different marine ecosystems of Eastern Africa.
Climatically the WIO is characterised by monsoon rains which drive the weather, river flows and sea conditions. Thenothern part of Mozambique, Tanzania, Kenya and southern Somalia receive long and heavy rains during March toMay before the strong south east monsoon winds set in. Short rains are experienced from around October to
8
December heralding the start of the lighter north east monsoon winds. However, this monsoonal pattern has becomeless predictable in recent years bringing more erratic rainfall and less consistent monsoon periods, as mentionedfrequently by coastal communities whose lives are closely aligned to these weather patterns (Maina et al. 2012;Laizer et al. in press).
Further south in Mozambique the climate shifts between tropical and subtropical regimes and cyclones are a featureof the southern Mozambique Channel. This southern weather pattern is driven by the Aguhlas current (Figure 3).Tropical cyclones are amongst the deadly hydro meteorological hazards that cyclically hit Mozambique, causinghavoc and negative impacts on several activities which has devastating effects on economic development. The closeproximity of tropical cyclones which pass mostly from the north to the south of the country over the areas betweenthe Mozambican Channel and 50 degree longitude, strongly affects the weather patterns over Mozambique,increasing convection and rain shower activities along the Intertropical Convergence Zone (ITCZ)4.
During the 2010/2011 season tropical cyclone “Bingiza” was the only tropical system that entered the MozambicanChannel, causing heavy rainfall over northern portion of Mozambique due to intensification of ITCZ over this area.Therefore the 2010/2011 tropical cyclone season was considered nonactive. In contrast, 2011/2012 was one of themost active tropical cyclone seasons along with 1974/1975 and 1999/2000, during which 5 tropical cyclones ortropical disturbances reached the Mozambican Channel. Mozambique was extremely affected by 2 of these 5 tropicalcyclones or storms, namely Tropical Storm “Dando” in southern Mozambique, (from 16 to 18 January, 2012) andtropical cyclone “Funso” over Zambézia province, central Mozambique (from 22 to 25 January, 2012)5.
Mozambique
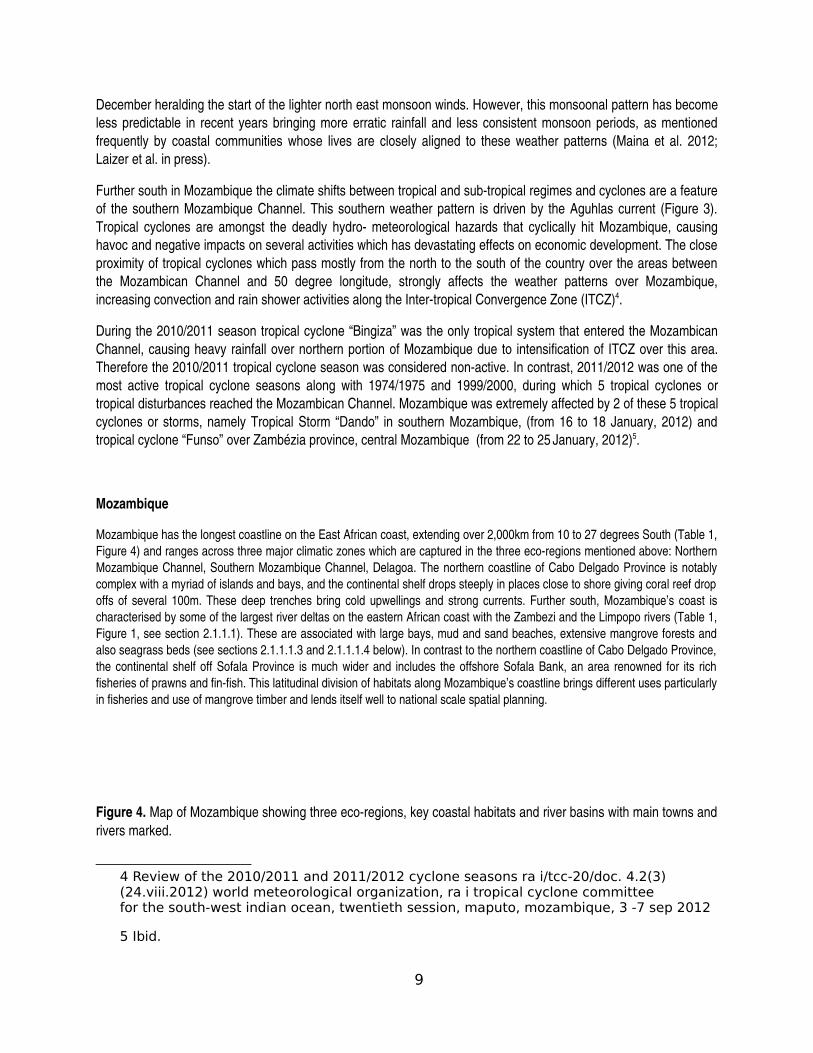
Mozambique has the longest coastline on the East African coast, extending over 2,000km from 10 to 27 degrees South (Table 1,Figure 4) and ranges across three major climatic zones which are captured in the three ecoregions mentioned above: NorthernMozambique Channel, Southern Mozambique Channel, Delagoa. The northern coastline of Cabo Delgado Province is notablycomplex with a myriad of islands and bays, and the continental shelf drops steeply in places close to shore giving coral reef dropoffs of several 100m. These deep trenches bring cold upwellings and strong currents. Further south, Mozambique’s coast ischaracterised by some of the largest river deltas on the eastern African coast with the Zambezi and the Limpopo rivers (Table 1,Figure 1, see section 2.1.1.1). These are associated with large bays, mud and sand beaches, extensive mangrove forests andalso seagrass beds (see sections 2.1.1.1.3 and 2.1.1.1.4 below). In contrast to the northern coastline of Cabo Delgado Province,the continental shelf off Sofala Province is much wider and includes the offshore Sofala Bank, an area renowned for its richfisheries of prawns and finfish. This latitudinal division of habitats along Mozambique’s coastline brings different uses particularlyin fisheries and use of mangrove timber and lends itself well to national scale spatial planning.
Figure 4. Map of Mozambique showing three ecoregions, key coastal habitats and river basins with main towns andrivers marked.
4 Review of the 2010/2011 and 2011/2012 cyclone seasons ra i/tcc-20/doc. 4.2(3)(24.viii.2012) world meteorological organization, ra i tropical cyclone committeefor the south-west indian ocean, twentieth session, maputo, mozambique, 3 -7 sep 2012
5 Ibid.
9

The biogeography and hence biodiversity of Mozambique’s coastal and marine ecosystems is strongly linked to thedominant ocean currents in the Mozambique channel (Figure 3) which have a major influence on Mozambique’scoastal ecosystems particularly the eddy formations which drive currents in all directions. For example, through larvalsupply and retention and also due to the cold upwellings, these currents systems combine to provide a concentrationof high biodiversity and productivity on the northern Mozambique coastline in Cabo Delgado Province giving some ofthe most species diverse coral reefs in the region (Obura 2012, Samoilys and AlvarezFilip in prep., see section2.1.1.1 below). This in turn plays an important role in conferring resilience in the coral reefs in this region to climatechange. These features have led to recent recommendations for this northern Mozambique coastline for WorldHeritage listing in a recent review of the WIO (Obura et al. 2012).
Tanzania
Tanzania’s coastline extends for 1,424 km giving it extensive territorial waters and EEZ area (Table 1). Thecontinental shelf is, however, generally narrow giving a total shelf area only 24% of that of Mozambique. There aretwo major river systems: the Rufiji River whose delta extends out to Songo Songo close to Mafia Island and supportsone of the largest areas of mangrove forests in East Africa (Figure 5). The Ruvuma River on the border withMozambique also supports extensive mangrove forests, and on the Tanzanian side is gazzetted as a Marine Park.Tanzania has the third largest stands of mangrove forests in the WIO, after Madagascar and Mozambique (Table 1).Tanzania also has some large islands with Pemba and Zanzibar in the north, and Mafia to the south (Figure 5), bothof which are rich in coral reefs. Tanzania’s mainland coastline is characterised by coral reefs that, except where thereare major rivers, fringe the coastline and are frequently closely associated with shallow seagrass beds (see section2.1.1.2). The northern coastline around Tanga also consists of several offshore submerged coral reefs. Many ofTanzania’s mainland reefs have, however, been destroyed through long term use of dynamite fishing, a problem thatis localised to Tanzania (Burke et al. 2011). Tanzania’s coast is split into two ecoregions (Table 2): the southernregion (no. 3), which extends into northern Mozambique and is influenced by the oceanography of the MozambiqueChannel and is where the South Equatorial Current meets the African coast; and the northern region (no.2) themonsoon coast which extends north through Kenya and into southern Somalia, driven largely by the north flowingEast African coastal current (Figure 3).
10

Figure 5. Map of Tanzania showing two ecoregions, key coastal habitats and river basins with main towns andrivers marked.
Kenya
Kenya has the shortest coastline of all countries of the WIO, at only 536 km, and consequently much smaller areas ofterritorial seas, continental shelf and EEZ area (Table 1). As found in Tanzania, the coast is dominated by fringingcoral reefs, often enclosing a shallow lagoon and often associated with seagrass beds (Figure 6). Kenya also has twomajor rivers that drain into the WIO, the Tana and the Sabaki (Table 1, Figure 6). The largest is in the north, the TanaRiver, which has extensive mangrove forests (see section 2.1.1.1.3) and whose delta flows out into the large mudsand Ungwana Bay with minimal reef systems. Beyond the Bay lies the North Kenya Bank, a broad area of shallowcontinental shelf that probably supports large populations of valuable offshore fishery species, though research onthis Bank has been minimal (Samoilys et al. 2011a). Kenya’s coast is contained within one ecoregion, no. 2 themonsoon coast (Table 2), which extends into southern Somalia, to include the Bajuni islands. The northern extent ofthis climatic zone is tempered by the Somali current and cold upwellings off the Somali coast (Figure 3) whicheffectively provides the northern boundary of the eastern African coral reef fauna (Obura 2012).
Figure 6. Map of Kenya showing key coastal habitats and river basins.
2.1.1 HabitatsThe mainland countries of the WIO Province are characterised by coastal and marine ecoystems that include riversand estuaries, coral reefs, mangrove forests, seagrass beds, sandy and/or muddy beaches and bays and rockyheadlands. This variety of tropical coastal habitats confers rich marine biodiversity with over 6,000 speciesdocumented (Table 2.1.1). However, detailed breakdowns per country for the different taxa are generally notavailable, highlighting a gap in knowledge that requires research attention. High diversity and endemism is also foundin the coastal flora which comprises mangroves of the saltwater coasts and tropical dry forests, within a mosaic ofsavannas, grassland habitats and wetland areas.
Table 2.1.1. Indices of marine biodiversity: key marine taxa and their total number of species per country in EasternAfrica. Numbers pooled across countries refer to the whole WIO region. (Source: a = Spalding et al. 2010; b = UNEP2009; c = Obura 2012; d = Samoilys & AlvarezFilip in prep.; e = Richmond 2002; f = Berggren and Coles 2009; g =
11

Obura et al. 2012; h = this study); numbers in parentheses indicate predicted total numbers using speciesaccumulation curves.
Taxa Mozambique Tanzania Kenyamangrovesa 10 9 9 seagrassesb 12 12 12hard coralsc 254 (297) 265 (280) 203 (239)coral reef fishesd 295 (322) 286 (320) N/Acoastal bony fishese >2,200sharkse >50rayse 15echinodermse 400 (shallow) 600 (deep)molluscse 3,270marine mammals EAf
marine mammals WIOh33 (17 whales, 13 dolphins, Dugong dugon)36 (23 whales, 13 dolphins, Dugong dugon)
turtlesg 5sea birdsg ~150
Here we synthesis information and data by major habitat relevant to the purpose of this review namely: to identify keyareas and effective strategies through which MFF can contribute to the conservation, restoration and sustainablemanagement of coastal ecosystems as key natural infrastructure which support human wellbeing, resilience andsecurity.
2.1.1.1 River basins and catchments
There are 12 main river basins that flow into the WIO of which six are in the three countries of this review (UNEP2009): the Tana and Sabaki rivers in Kenya, the Rufiji and Ruvuma in Tanzania and the Zambezi and Limpopo inMozambique, with the Ruvuma marking the boundary between Tanzania and Mozambique (Table 1, Table 2.1.1.1,Figure 1). The Zambezi and Limpopo are two of the nine largest river basins in Africa (FAO 2005). The ZambeziRiver flows for some 2,700 km through nine countries (Zambia, Angola, Namibia, DRC, Botswana, Zimbabwe,Malawi, Tanzania and Mozambique) and is Africa´s fourthlongest river (Figure 2.1.1).
12

Figure 2.1.1. Map showing the area encompassed by the Zambezi River and its catchment area. (Source:http://www.zamsoc.org/?page_id=636)
The rivers of eastern Africa provide significant water discharge to the sea reflecting their rainfall catchments inland.The long rains (see section 2.1 above on climate and monsoons) contribute the maximum river discharge in terms ofwater flow and sediment load and, together with river length and hence extent of catchment, this is intimately linkedto the size of the river estuaries and the mangroves forests associated with them. The largest river discharge is foundin the rivers of Mozambique which support extensive mangrove forests (Table 1). These mangrove forests are alsooften associated with seagrass beds in shallow protected waters usually in bays. These mangroveestuarine systemsare highly productive due to a combination of nutrients flowing from upstream and because they provide nurserygrounds and breeding areas for numerous important fishery species including prawns, crabs, snapper, emperor,grouper, sea cucumber and offshore commercially important finfish species, the scombrids (tunas and mackerel),such as the Spanish mackerel, locally called “kingfish”, Scomberomorus commerson (Samoilys et al 2011a; Waycottet al. 2011). In addition, many migratory bird populations rely on river deltas, wetlands and mangroves as stopoverand wintering habitat.
Table 2.1.1.1 Major river basins, their deltas and ecological functions in eastern Africa (Source: UNEP 2009;Richmond and Mohamed 2005; Wagner et al. 2004). All deltas have mangroves, though to varying extents, andtherefore all provide nursery grounds for fish and prawns and timber for local communities – these ecologicalfunctions are therefore not repeated in the table.
Country River Key features Ecological functionMozambique Limpopo small estuary of 6km length limited mangroves;
Zambezi delta is ~ 100km long, 120km wide at thecoast, covering 15,000km2; has beenextensively dammed in all 9 states it flowsthrough which has had significant negativeimpacts on the estuary
sustains rich offshorefishery stocks (fish,prawns) on Sofala Bank;largest dugong populationin eastern Africa
Tanzania Ruvuma Delta ~ 100km2 within MBREMP 94km2 of mangroves onthe Tanzanian side, linked
13

Country River Key features Ecological functionto large seagrass beds
Rufiji delta is 23km long, 65km wide, covering1,200km2; 3 subbasins, 13 lakes in the riverfloodplain
480km2 of mangroves, thelargest contiguousmangrove forest in E.Africa; linked to coral reefsystems offshore atSongosongo archipelagoand Mafia Island
Kenya Tana several estuaries (Kipini, Mto Tana, etc),extend 10km inland and some are relativelydeep. Delta is eroding due to extensivedamming upstream; extensive flood plain andfreshwater systems
41 km2 of mangroves;sustains rich fishinggrounds of Ungwana Bayand offshore North KenyaBank
Sabaki Small and narrow estuary at Malindi; highsediment load
limited mangroves; linkedto coral reefs of MalindiMarine Park
All the major rivers of the three countries (Table 2.1.1.1) have been dammed to varying extents for hydropower, orwater supply or irrigation, which has had negative impacts on water flow and nutrient discharge to the coast (UNEP2009). This is turn affects mangrove growth and hence productivity which in turn has negative consequences onassociated valuable fisheries. Baseline data prior to dams are scant and therefore quantified estimates of thereduction in ecosystem health and productivity of these mangrove river basin systems are not available. In addition,mangrove harvesting and removal does occurs in all three countries and is managed poorly in places. Nevertheless,the relative health and productivity of these major river basin mangrove ecosystems is good. Based on these factors,the relative size of the deltas, their productivity and close links with neighbouring seagrass beds and coral reefs, fourriver basins/deltas are recommended as regionally and nationally significant: Zambezi, Ruvuma, Rufiji and Tana.
2.1.1.2 Mangroves
Mangrove forests occupy some of the largest areas of all coastal habitats in Mozambique, Tanzania and Kenya, typically in river estuaries, with smaller stands in reef lagoons and on open seacoasts. The most extensive and diverse formations are found in the slightly wetter coastlines that extend along the central coastline of Tanzania and in central Mozambique, notably around the large
and highly productive deltas of the Rufiji and Zambezi rivers. The WIO has an estimated 7,900 km2 of mangroves (Table 2.1.1.2), 5.2% of the world’s total (Spalding et al. 2010,UNEP 2009), though there are differences in area estimates from different sources.
There are ten species of mangrove trees in the WIO all of which are found in Mozambique, and nine are found in Kenya and Tanzania (Table 2.1.1.2). Most species are distributed widely and these
forests also support a variety of shrubs and palms, including the climbing legume Derris trifoliata, which apparently attracts elephants into the Tana Delta mangrove forests (Plate 2.1.1.2;Spalding et al. 2010; Samoilys et al. 2011a). The WIO mangroves represent a subset of the species found in the IndoWest Pacific region, but are isolated by the expanse of the Indian Ocean andthe arid coastlines of the Middle East. They may therefore represent a distinct subregion of the IndoWest Pacific mangrove fauna and flora. Mangrove trees are characterised by their resistance tosalt water, enabling them to grow in brackish and fullsalinity seawater, and their ability to root in mud or sand. The bestdeveloped mangrove forests occur around river mouths where they play animportant role in trapping sediments washed down in river discharge that would otherwise be washed out to sea (see section 2.1.1.1 above).
14

a) b)
c)
d)
Plate 2.1.1.2. Mangrove forests in eastern Africa. a) Kiwaiyu channel, Lamu; b) Heriteria littoralis and Hyphenae palm, and replanted Seriops tagal inthe Tana Delta; c) Lamu archipelago, Kenya; d) Derris trifoliata legume with Heriteria littoralis.© M. Samoilys.
Mozambique and Madagascar have the largest mangrove areas in the WIO region with 2,909km 2 and 2,991km2, respectively, along their coastlines in the Mozambique Channel (Table 1). However,the largest contiguous stand of mangroves in the WIO is in the Rufiji Delta (480km 2) in Tanzania, followed by the mangrove forests associated with the Zambezi and Ruvuma rivers. Coastal islandchains, such as the Lamu Archipelago and Tana River Delta in northern Kenya, and Quirimbas in northern Mozambique also support mangrove forests in smaller deltas, creeks and bays.Mangroves support a high diversity of fauna in the form of vertebrates (e.g.fishes) and invertebrates (e.g. crabs, molluscs) and flora.
Table 2.1.1.2. Mangrove statistics (Source: Spalding et al. 2010).
Country No. of mangrove species Government gazzetted MPAs withmangroves
Mozambique 10 6Tanzania 9 24Kenya 9 11
Mozambique
Collectively, Mozambique’s mangroves forests account for 60% of mainland eastern Africa’s mangroves (Table 1;UNEP 2009; Spalding et al. 2010). The central coast around the Bith of Sofala, from Angoche to the Save River hasa total area of 1,900 km2 of mangroves, the most extensive in the region, though not contiguous. The gently slopingcoastline here hosts a number of large rivers, notably the Zambesi, enabling the formation of large deltaic andestuarine mangrove forests. The tidal influence in this region is also strong, and has influenced riverine mangrovesin the Zambezi and Quelimaine areas, that extend 50km inland. The Zambezi delta mangroves are adjacent to
15

important freshwater and terrestrial ecosystems, including coastal flooded savannah, coastal dunes, freshwaterswamps and miombo woodlands, creating a rich diversity of species related to the mangroves.
Other important mangrove areas are in the north bordering Tanzania in the Ruvuma River delta and further south inprotected bays in this northern Cabo Delgado Province (Figure 2.1.1.2). These forests are concentrated in four mainlocations (Table 2.1.1.2) and of significance is that the health of these forests is good, with minimal logging and otherpotentially degrading impacts; in fact all areas are increasing in coverage (Bandeira et al. 2009; Ferreira et al. 2009;Samoilys et al. in prep).
Further south from the River Save, mangroves become more intermittent. Important areas are found in embaymentsand estuaries particularly in the areas sheltered by north facing headlands of Ponta Sao Sebastiao, Ponta de Barraand Maputo Bay (Figure 2.1.1.2).
All 10 species of mangroves found in the WIO are found in Mozambique, though the southern limit for three of thespecies, Sonneratia alba, Pemphis acidula and Heriteria littoralis, are at the River Save at around 21o S. Furthersouth mangrove trees are rarely taller than 4 m, though trees of over 27 m have been recorded in the Limpopoestuary at around 25o S.
16

Figure 2.1.1.2. Major marine and coastal habitats in Cabo Delgado, northern Mozambique showing extent ofmangrove forests around the bays. (Source: Transmap Project Final Report 2010: www.transmap.fc.ul.pt).
Interestingly, Mozambique has the least amount of mangroves in government gazetted protected areas (Table2.1.1.2). However, in October 2003, the Government of Mozambique declared the Marromeu Complex of theZambezi Delta as the first Wetland of International Importance in Mozambique under the Ramsar Convention(Beilfuss and Bento 2003) and more recently a Ramsar review recommended the area be expanded due toincreasing threats particularly from oil and gas exploration (Ramsar Advisory Commission, No 62, 2009). Since 1998broader legal protection was provided for mangroves and other coastal living resources occurring within 100m of thecoast and WWF has played a key role in facilitating this. This necessitated licensing for the exploitation ofmangroves. However it is poorly enforced. Probably the greatest driver of change to Mozambique’s mangroves is theongoing and extensive oil and gas exploration and planned extraction in the Mozambique channel. Any oil findingswill lead to greater threats on mangroves through pollution, and both oil and gas exploitation have the potential to
17

damage coastal environments through the construction of terminals and shipping close to shore. Detailed mappingof potential impacts is not available and would be an important future activity for MFFWIO.
Tanzania
Collectively, Tanzania’s mangroves forests account for about 35% of mainland East Africa’s and nine of the 10mangrove species found in the WIO are found in Tanzania (Table 1; UNEP 2009; Spalding et al. 2010). Tanzania’smangroves are regionally significant not only due to their extent, but because they have been relatively wellprotected. Some are still in excellent condition and found in an array of different formations. The most extensive arein the Rufiji Delta where there are some 480 km2 of mangroves along 70 km of coast – the largest contiguous area inthe WIO. The delta is highly active, empting an average of 900 m3 of water per second. Other smaller yet significantmangrove formations include the complex sheltered creeks near Tanga in the north and the large offshore islands ofPemba, Zanzibar and Mafia. Esturine and deltaic formations are also important and include the Wami Delta, Ruvuestuary near Bagamoyo, Matandu Estuary and The Ruvuma River mouth.
Many of the larger mangrove forests are known to support associated species such as the Wami Delta where hipposand crocodiles are found within the mangroves. Also in the Rufiji Delta bird counts estimated 40,000 waterbirdscomprising 62 species (Spalding et al. 2010). Most significantly, in the seagrass beds off the Rufiji delta dugongshave been sighted. For example, 10 were sighted in 2011 (Seasense Annual Report 2011).
Mangroves were gazetted as forest reserves in Tanzania from 1928, and therefore a culture of use perpetuated.Mangrove degradation and loss has occurred, but at much lower levels than most other countries in the region. Thegreatest losses have occurred around Dar es Salaam, with conversion to urban and agricultural use. However,widespread overexploitation of mangroves for timber, fuel and tannin continues and some forests are considereddegraded and at risk.
Tanzania led the region in its approach to mangrove protection and sustainable use through the MangroveManagement Project (MMP) which was initiated in 1988, spearheaded by the late Dr. Adelaida Semesi. Togetherwith other projects, the MMP has helped to reduce illegal cutting and clearance and has encouraged replanting oflarge degraded areas (eg. Samoilys et al. 2007). Plans for a 100 km2 prawn farm in the Rufiji Delta were originallyapproved by the Government in 1996. The plan was thwarted in 2001 after it became clear people would bedisplaced, the delta would be destroyed and severe impacts on offshore ecosystems were predicted. The Rufiji Deltaand Mafia mangrove forests are now included in the RufijiMafiaKilwa Ramsar site which was declared in 2004(Ramsar 2004).
Kenya
The total area of mangroves in Kenya has been estimated to be between 53,000 – 61,000 ha with 67% occurring in the northern Lamu areaand 10% further south in Kilifi and Kwale Districts (Figure 6). The main forests are concentrated in the Lamu Archipelago and the permanentTana and Sabaki river estuaries with smaller mangrove areas on the south coast in creeks around Shimoni and Vanga; in the bays of Funziand Gazi, and also at Port Reitz and Tudor around Mombasa city, and in Mtwapa, Kilifi and Mida creeks. The bulk of these forests occur inintertidal areas where submarine ground water discharge or seepage occurs rather than in estuaries (Ruwa & Polk, 1986). The mangrovesof the Lamu archipelago combined with the nutrient rich colder Somali current (Figure 3) confer high productivitysupporting some of the highest densities of finfish and crustaceans inshore in Kenya. They are also likely to supporthighly productive offshore fisheries but this is not yet quantified. These mangrove trees also provide valuable woodproducts for local communities.
18

Nine out of the 10 species found in the WIO, are found in Kenya, with Rhizophora mucronata and Ceriops tagal being dominant andrepresented in almost all mangrove forests. Rarer species are Heritiera littoralis and Xylocarpus moluccensis with individuals being found in theTana River delta and northern Lamu mangrove forests. Kenya’s mangroves form a strong zonation of species controlled by the large tidalregime with the typical zonation pattern, from sea to land being: Sonneratia alba, R. mucronata, Brugeria gymnorrhiza, C. tagal, Avicenniamarina, X. granatum, Luminitzera racemosa and H littoralis.
Mangroves were declared a government reserved forest in 1932 (similar to Tanzania) and have been managed by District Forest officers, whomanage licenses, offtake and conservation. They fall under the Forest Act (2005) and are one of the ecosystems that “fall between the cracks”because the Forestry Department is primarily concerned with terrestrial forests which are seen as far more valuable (in terms of timber) thanmangrove forests (Samoilys et al 2011c). It is estimated that 10,300 ha of mangrove forest have been lost in Kenya either to conversionpressures, overexploitation or pollution (Ruwa 2003). Depending on the degree of alteration to the mangrove forest, recovery can take a longtime or may never occur.
Many of Kenya’s forests fortunately fall within national protected areas such as the Kiunga Marine National Reserve north of Lamu; Mida Creekin Watamu Marine Park and Reserve; and Shimoni/Tanga area within Kisite and Mpunguti Marine Park and Reserve (Figure 6, Table 2.1.1.2).Two (Watamu and Kiunga) have also been declared as UNESCO Heritage Sites in 1979 and 1980, respecitively. However, despite the nationalprotection status of these mangrove forests, particularly the two largest formations in north Kenya, in Tana Delta and the Lamu archipelago,they remain under threat from large developments. Development plans in the Tana Delta have been ongoing since the 1990s ranging fromdams, irrigation projects, sugar cane plantations, prawn farms and jotropha, and have been invariably contentious with little local communitysupport (Samoilys et al 2011a). Conflicts since 2012 over access to grazing during the dry season have meant this area has now become aninsecurity hotspot.
Summary
Over the last 50 years, about onethird of the world’s mangrove forests have been lost. However, within Mozambique, Tanzania and Kenya,mangrove decline is estimated to have been about 8%, from 1980 to 2005, compared with global projections of 25% decline by 2025 (Spaldinget al. 2010). Thus it appears that the mangrove systems of eastern Africa are less impacted and are in relatively good health compared with therest of the world. However, the harvesting of mangrove trees has persisted for centuries in eastern Africa, with export of poles to Oman and the Middle East being a staple of trade
throughout this time, and this continues today. Thus in some areas, utilisation is heavy and there are significant levels of degradation with trees becoming moresparsely distributed and stunted as a result of overexploitation. Uncontrolled or illegal cutting of mangroves has cleared large areas of previously productive forest. Mangroveforests are also the first to be cleared for the construction of salt pans from which most of the region’s sea salt is produced. Additional pressure from tourism developers, coastal construction, farmersand the evergrowing need for fuel wood, further encourages swathes of primary mangrove forest to be cut indiscriminately with little or no replanting (Ruwa and Polk 1986; Spalding et al. 2010).
Oil and gas extraction is one of the greatest threats to mangroves in eastern Africa. The largest gas reserves in theworld have been discovered off Cabo Delgado and are now set to be excavated this year (2013), drilling offshore at1,500m depth (IUCN 2012). While the drill is far from the mangroves the support terminal and base on shore andtransport from the drill platform to shore is planned for Palma Bay in the north. The mangroves in this bay are small inextent and therefore at a national level impacts will be minimised. Good governance through the Fair Coasts Initiativeproject through close and direct dialogue with and between the gas drilling company, government and localcommunities are planned to minimise the impacts (IUCN 2012). It should be noted that some gas extraction sites inTanzania such as Songosongo and Mnazi Bay appear to have worked well with little apparent environmental impact (MS pers. obs in MnaziBay), though formal monitoring of the impacts is not available.
Other drivers will include commercialising fisheries such as prawn farming. Mariculture is set to expland enormouslyin eastern Africa, and needs to if the demand for food and livelihoods is to be met. There are now many new methodsand technologies now for mitigating the impacts of prawn farms on mangroves through lessons learnt from Asia andthe Pacific (e.g. Ponia 2010) and it is vital that eastern Africa learns from these recent initiatives and does not repeatthe mistakes of Asia which resulted in widespread destruction of mangrove forests (Naylor et al. 2000) withdisastrous consequences during the Asian Tsunami of 2004 (Danielsen et al. 2005).
Poorly planned coastal development including port construction is a further threat to the mangroves forests of theregion with concerns expressed from local community groups environmental managers and conservationists over
19

improvement plans of ports at Mtwara and Tanga for shipping or for oil and gas companies. One of the most critical threatsto the majority of Kenya’s mangroves that are found in the LamuTana area is the development of the proposed Lamu Port. The mainmangrove forests around Lamu, Manda and Pate Islands including the Magogoni and Dodori creeks will be either removed or impacted byincreased dredging and port development. The discovery of oil in Northern Kenya and northern Uganda with the need to find a transport routefor the oil in south Sudan are the reasons behind the proposed Lamu Port. However the EIA has only just been released (March 2013) forpublic scrutiny and there is a considerable lack of information available to the public on the proposed development.
In the region, mangroves are more commonly managed as forest reserves rather than for biodiversity, falling under forestry regulations, andbeing viewed more from a utilization perspective than conservation. Their role as ecosystem service providers to a broad range of othersystems (e.g. coral reefs, fisheries, prawns, land protection) generally goes unrecognised and therefore is not valued against developmentalternatives.
2.1.1.3 Coral Reefs
Coral reefs dominate the coastal ecosytems of the WIO and are widely distributed along the Kenyan, Tanzanian andMozambican coasts (McClanahan et al. 2000). They are typically shallow fringing reefs, often enclosing a lagoon,and often closely associated with seagrass beds (Plate 2.1.1.3a: Obura et al. 2012). The reefs in southern Tanzaniaat Mnazi Bay and in northern Mozambique in Cabo Delgado are the exception, where reefs are more developed,covering extensive submerged areas, are less associated with seagrass beds and are also deeper (Samoilys et al.2011b; Hill et al.Davidson et al. 2006). For example good coral cover and growth was recorded to maximum depthsof 35 40m, eg. off Pemba, Mozambique and Mnazi Bay, Tanzania (Plate 2.1.1.3b, MS pers.obs.).
a) b)
Plate 2.1.1.3. a) typical shallow fringing coral reefs of eastern Africa at Mafia Island, Tanzania 3m depth. b) Coralcover at 35m depth at Pemba, Mozambique. © M. Samoilys.
The regional (WIOwide) list of hermatypic (hard) coral species recorded by Obura (2012) numbered 369, and theIUCN Red List has a total of 398 species for the WIO (IUCN 2011), from which Obura estimated a total potentialWIOwide pool of species of at least 450. The highest species diversity of corals was recorded at sites in theNorthern Mozambique Channel ecoregion – from northern Mozambique, southern Tanzania and NW Madagascarand Comoros (Figure 2.1.1.3).
Standardised SCUBA based surveys to assess coral reef fish diversity across four countries in the WIO(Madagascar, Comoros, Mozambique and Tanzania) based on a checklist of 19 families of fish that are associatedwith coral reefs (see Samoilys and Randriamanantsoa 2011 for details) recorded a total of 375 species across the
20

region. The highest number of species was located at sites in Cabo Delgado, northern Mozambique together withMafia Island and one site in Mnazi Bay, both in Tanzania (Figure 2.1.1.4).
Figure 2.1.1.3. Estimated maximum species richness of reefbuilding corals at survey locations in the WIO, orderedby decreasing diversity. The graph shows Smax, derived from the MichaelisMenten regression equation onpresence/absence from a pool of 369 coral species across all locations, and the number of species sampled.Symbols against the x axis correspond to the significant clusters of sites: blue triangles northern MozambiqueChannel; purple circles smaller islands in the Mozambique Channel and NW Seychelles; red stars lowdiversityoutliers. (Source: Obura 2012).
21

Figure 2.1.1.4. Total number of coral reef fish species at 45 sites across four WIO countries based on a standardisedSCUBA method. (Source: Samoilys and AlvarezFilip in prep.).
Corals are threatened by sea surface temperature rise caused by global warming which bleaches corals andeventually kills them if higher water temperatures persist. This threat has been well documented in the WesternIndian Ocean (Linden and Sporrong 1999; Wilkinson 2000; McClanahan, Baker and Ateweberhan 2011). Levels ofcoral bleaching from the extreme temperature event during the 1998 El Niňo and the subsequent recovery of coralreefs has been quantified in the WIO and show that recovery rates and resilience to bleaching vary considerablywithin the region with the northern Mozambique and southern Tanzanian coral reefs appearing to be the mostresilient or to recover the most quickly (Obura 2005; Obura 2006; McClanahan et al. 2007; Obura 2011).
Mozambique
Mozambique has the third largest area of coral reefs in the WIO, about 14.4% of the regional total, the largest beingin Madagascar and Tanzania (UNEP 2009, Table 1). Mozambique’s reefs are largely concentrated in the north inCabo Delgado and Nampula Provinces because major rivers characterise the coast further south bringing heavy riverdischarge, sediment and silty/sandy conditions which preclude coral growth.
The reefs of Cabo Delgado and Nampula Provinces contain some of the highest numbers of coral species in the WIO(Figure 2.1.1.3). However, sampling in Cabo Delgado by Obura (2012) was limited and therefore it is likely thatfurther work will result in a coral species richness between 350 and 400 species on the northern Mozambiquecoastline. Maps from Veron (2000) and related publications suggested a diversity of some 300 species. Davidson etal. (2006) surveyed the Vamizi Island area and reported 183 coral species in 46 genera from 14 families, and initialsurveys in northern Mozambique as part of the Mozambique Coral Reef Monitoring Programme built up lists of 127
22

species in initial surveys in 1999, and later 208 coral species in 54 genera and 16 families for Pemba Bay (Obura2003). The most recent figures by Obura (2012) using a survey technique that gives an actual number of coralspecies found and a predicted maximum number based on species accumulation curves simulating unlimitedsurveys, gives 254 (288) actual (predicted) species for Pemba Bay, and 207 (269) for Vamizi Island, within CaboDelgado Province. For comparison, 219 (297) species were reported for Nacala, in Nampula Province, and 265 (276)in Mnazi Bay Marine Park in Tanzania. Given the low sampling at individual areas in Mzambique, a more accuratecoral diversity for the northern coastline (Cabo Delgado and Nampula Provinces) can be estimated by combiningPemba, Vamizi, Nacala and Mnazi Bay to give a total actual number of 307 species (Obura 2012). This northernMozambique Channel region clearly has the highest species diversity of corals in the WIO (Figure 2.1.1.3) and areamong the most important for biodiversity in the Indian Ocean (Obura et al. 2012).
Not surprisingly given the coral diversity figures, the highest numbers of coral reef associated fish species were alsolocated at sites in Cabo Delgado, together with Mafia Island in Tanzania (see Figure 2.1.1.4). A total of 295 specieswere counted in Mozambique, the highest in the region (Table 2.1.1), with a predicted total of 232 species based oncumulative species curve analysis (Samoilys & AlvarezFilip in prep.).
Tanzania
Tanzania has by far the largest area of coral reefs within the WIO region (3,500km2, Table 1; Figure 5; UNEP 2009),with fringing reefs along most of the mainland coast and around the main islands of Pemba and Unguja in Zanzibarand Mafia, except where there are large river basins. Southern Tanzanian reefs around Mafia Island and Mnazi Bay,are, where protected, some of the most biodiverse in the region due to their location in the WIO current systems (seeabove). However, rampant dynamite fishing along much of the mainland coast has destroyed Tanzania’s reefs(Burke et al. 2011; see also www.wri.org/reefs/stories) and altered them to such an extent that they have becomedominated by macroalgae (Samoilys et al 2007; Wells 2009; Wells et al. 2010) and this practice is seriouslyundermining Tanzania’s marine biodiversity, coastal productivity in the form of fisheries, and also shoreline protection(see section 3 below).
Obura (2011) describes the resilience and recovery of reefs around Mafia Island and in the Songosongo Islands offthe Rufiji Delta as high, based on an index that combined hard coral and crustose coralline algae (CCA) to give amore integrated picture of the ability of reefs to return to a coraldominated state. This is because CCA is often aprecursor to increased coral growth particularly after a mortality event. This index indicated that though Mafia reefswere vulnerable to bleaching, they have a high resilience enabling recovery back to their prior state. Long termmonitoring data from the Mafia Island Marine Park suggests that recovery trajectories for reefs in this system is about1015 years under ideal conditions. The coral community in the region has not changed as a result of the massbleaching and mortality of 1998, with Acropora and Galaxea being the dominant genera, the former across all sitesand reef zones, the latter forming large stands in sheltered highturbidity locations. Reefs throughout this region werereported as “on a clear recovery trajectory since the 1998 mass coral bleaching event that affected the entire IndianOcean” (Obura 2011). In addition Obura found that coral cover was higher in Songosongo than Mafia as the reefs aremore impacted by turbid water from the Rufiji Delta, and it is likely that turbidity protected the reefs in Songosongofrom the high temperatures in 1998 resulting in less mortality of corals.
Kenya
Kenya has the smallest area of coral reefs in the region (630 km2, Table 1; Figure 6; UNEP 2009) but they are someof the most effectively protected and managed coral reefs in the region. This is largely through Kenya’s long standing
23

and well enforced government gazetted marine parks (McClanahan et al. 2007b; Samoilys and Obura 2011) as wellas, more recently, a network of community conservation areas (Maina et al. 2011). The location of government parkstended to be coral reefs as areas of high biodiversity and high aesthetic appeal, but later larger Reserves (wherefishing is allowed but managed), were introduced and these also encompassed neighbouring seagrass beds andmangrove forests providing a more balanced ecosystembased approach to marine conservation and management(Samoilys and Obura 2011).
Good enforcement of marine parks has led to significant recovery in fish populations over the last 20 years(McClanahan and Graham 2005). However, reefs in the far north of Kenya were some of the most heavily impactedfrom the El Niňo event of 1998 with mortality levels of >80% (Obura et al. 2006). Recovery in this region has beenmonitored from 1998 to 2008 and has progressed slowly in shallow inner and outer reefs to levels varying from 2080% of prebleaching levels.
Kenya’s northern reefs in the Lamu region represent the northern extremity of coral species (together with southernSomalia) due to being situated at the northern extreme of the eastern African coastline, in ecoregion 2 (Figure 3),providing an interesting mix of species that are rarely encountered elsewhere (Samoilys et al 2011a). Species ofspecial interest that are either rare, endemic or have limited ranges include: Horastrea indica, Siderastreasavignyana, Porites nodifera, P. columnaris, and an undescribed Coscinaraea.
Summary
Mozambique’s northern reefs in the Quirimbas archipelago of Cabo Delgado Province are one of the most diverseand apparently healthy and resilient coral reef systems in the WIO, hence their recommendation to be considered forWorld Heritage nomination (Obura et al. 2012). Tanzania’s southern reefs, in Mnazi Bay, Mafia Island and theSongosongo Archipelago are also highly diverse and resilient to climate change (Obura 2011), however, on themainland they suffer from dynamite fishing and overfishing and are therefore highly vulnerable to irreversibledamage. Kenya’s coral reefs, though less diverse and less resilient, are some of the best protected and thereforemost healthy, particularly in terms of their fish population densities.
Looking at these three countries in the MFF region, there is a clear gradient of coral species and general reefdiversity from Cabo Delgado province to northern Kenya, as well as in coral reef complexity and resilience. Thecurrents also flow from the south to the north. Thus the southern region is a critical source region for larvae for allspecies, including those important for fisheries, and a network approach linking the countries together, for MPA andfisheries management, is essential to maintain the health of the overall system, and particularly for reefs in the north.It is not clear if the north or the south of the region will have higher or lower vulnerability to future bleaching events,so a large scale approach to maintain reef health throughout the three countries should be taken.
2.1.1.4 Seagrass beds
Seagrasses are marine angiosperms widely distributed in both tropical and temperate coastal waters creating one ofthe most productive aquatic ecosystems on earth (Green and Short (2003). The distribution of seagrasses ranges from highintertidal to shallow subtidal soft bottoms, i.e. sandy bays, mud flats, lagoons and estuaries, where they often formextensive mono and multispecific meadows. They often occur in close connection to coral reefs and mangrovesand are generally in shallow water due to their dependence on light for photsynthesis. In areas of exceptional waterclarity they are known to grow at depths of up to 70m but this is not reported from the WIO. Seagrasses are thepreferred food of the Vulnerable Dugong (see section 2.1.2.6).
24

Of the 60 seagrass species identified globally, there are 13 species spread across the WIO region, but the highestnumber of 12 species per country is found in Kenya, Tanzania and Mozambique and these species are widelydistributed along this eastern coastline of Africa (Table 1, Table 2.1.1.4, UNEP 2009). Extensive seagrass beds arecharacteristic of all three countries: Mozambique has a total area of 439 km2 of seagrass beds, whereas Kenya hasonly 33.6km2 (UNEP 2009). No national figure is available for Tanzania – mapping of seagrass beds is urgentlyneeded in this country – the only area that has been studied is Mnazi Bay where 50km2 of seagrass beds have beenrecorded (Richmond and Mohamed 2005). Seagrass beds are closely associated with the shallow fringing coral reefsof the narrow continental shelf of the three countries (see 2.1.1.2) where seagrass beds occur in the backreeflagoons and bays with narrow channels connecting the lagoons with the sea. Detailed research on seagrasses isprimarily from Mozambique (see Bandeira publications) and Kenya (see Uko publications) and much of theinformation summarised here refers to all three countries.
Table 2.1.1.4. Seagrass species of eastern Africa (UNEP 2009).
Cymodocea serrulataC. rotundataHalodule wrightiiH. univernis Halophila ovalisH. minorH. stipulaceaEnhalus acoroidesSyringodium isoetifoliumThalassia hemprichiiThalassodendron cilitum Zostera capensis
Seagrass beds are among the most productive aquatic ecosystems (Waycott et al. 2011), provide important habitatsfor a diverse array of associated fauna and flora such as over 50 species of macroalgae; 18 species algal epiphytes;75 species of benthic invertebrates, 7 species of sea urchins, various shrimp, lobster, crab, starfish and seacucumber and over 100 fish species (Green and Short 2003). They are important as nursery grounds; as foragingareas for Dugong, turtles and fish; and provide predation refuges for numerous fish and invertebrate populations. Theimportance of seagrass beds to the local fisheries is emerging, as food fish such as rabbitfish (Siganidae),surgeonfish (Acanthuridae) and sea grass parrotfish (Leptoscarus spp) preferentially graze the epiphytes on theseagrass, whilst larger fish such as snappers, groupers and barracuda feed on the infauna of the seagrass beds.
The greatest threats to the seagrass beds of eastern Africa are fishing such as trawling or active seine netting (egbeach seines) which occurs widely along the coasts of all three countries. Trawling for prawns is also destructive toseagrasses and this occurs in Ungwana Bay off the Tana Delta in Kenya, and off the Rufiji Delta, in Mtwara andTanga in Tanzania. Illegal trawling in Tanga was recorded to have up to 80% of the prawn catch consisting ofseagrass (Ochieng and Erftemeijer 2003). Upstream farming activities have also led to reduced seagrass beds inDeltaic areas such as of the Sabaki and Tana Rivers in Kenya and Rufiji Delta in Tanzania.
Oil pollution and port development are growing concerns for the future of seagrass beds in eastern Africa partly dueto their low visibility – they are an ecosystem that has not received significant conservation and management
25

attention. The proposed Lamu Port in northern Kenya (see section 3.1.1 below) will impact the large tracts ofseagrass beds in the Pate, Wange and Dodori channels, which are important turtle and dugong feeding grounds.Similarly, further port development at Mtwara in southern Tanzania will impact the seagrass beds at the edge of thechannel, as will the planned Selander bridge coastal waterfront reclamation project in Dar es Salaam.
Increased coastal development if not well managed, results in increased pollution from solid waste, sewage disposaland dredge soil dumping, all of which are responsible for direct destruction of seagrass beds or indirectly throughdeclining water quality as these ecosystems are invariably close to shore in shallow protected waters (Green andShort, 2003).
Mozambique
The largest seagrass beds in Mozambique occur at Fernao Veloso, Quirimbas and InhacaPonta Do Ouro. Of thetotal of 439 km2 there are 25 km2 around Inhassoro and Bazaruto Island; 30 km2 at MecufiPemba and 45km2 in thesouthern Quirimbas Archipelago (Bandeira et al. 2009).
Twelve seagrass species exist in Mozambique (Table 2.1.1.4) and occur in mixed seagrass stands, especially inintertidal areas (Bandeira and Bjork 2001, Bandeira and Gell 2003 – see UNEP 2009). The three dominant mixedseagrass communities on the sand substrates of southern Mozambique (Southern coastline to Save River) includecombinations of Thalassia hemprichii, Halodule wrightii, Zostera capensis, Thalassodendron cilitum and Cymodoceaserrulata, and remain the most studied in this country by Bandeira and coworkers. In contrast, the seagrasscommunities of the northerly limestone areas typically surrounded by coral reefs from Zambezia Province to CaboDelgado are quite different with seagrasses tending to occur intermingled with algae (seaweed) such as Gracilariasalicornia, Halimedia spp, Sargassum spp. Here the dominant seagrass species include Thalassia hemprichii andHalodule wrightii and cover up to 88% of the shallow intertidal soft botttom areas in Cabo Delgado (Bandeira 1996).Species including Enhalus acorodies, Halophila stipulacea and Halophila minor are only found in the north; whilepure stands of Zostera capensis are largely confined to the south (Bandeira and Bjork 2001).
Threats to Mozambique’s seagrass beds include fisheries through drag netting which damages the beds; port andcoastal development and the fact that they are undervalued. Management and mitigation measures includeprotected areas such as Bazaruto and Quirimbas Marine Parks and recent research on the link between seagrassbeds as important food and habitats for the Vulnerable Dugong (IUCN Red List; Green and Short 2003; Obura et al.2012).
Tanzania
The most extensive seagrass beds of the back reef lagoons and bays in Tanzania are found in Tanga, Bagamoyo,Mohoro, Kilwa, Mtwara and Mnazi Bay (Green and Short, 2003). Some of the most studied seagrass beds are thoseof Mnazi Bay which cover a total area of 50km2 and are in good condition with luxuriant growth and high diversity(Richmond and Mohamed 2005).
In Tanzania, the first two marine protected areas were established in 1995 and include seagrass beds, but as inKenya, there are no management practices or guidelines for seagrass beds, and outside of protected areas they areoverlooked. Two main threats that impact seagrasses in Tanzania are trawling and dynamite fishing. The NationalIntegrated Coastal Management Strategy process (URT/VPO 2003) did however raise the profile and level ofunderstanding of marine resources including seagrasses in Tanzania. However, there still is very little information onthe seagrass beds of Tanzania as there has been little research and management focus on this particular ecosystem.
26

Moreover, poor fishing practices such as the use of beach seine and dynamite fishing has accelerated since 2005and continues to damage seagrass beds and their associated fauna and flora.
Kenya
The most extensive seagrass beds of the back reef lagoons and bays in Kenya are found in the bays of Gazi (8km 2)and Funzi, and the creeks or river mouths of Mida, Kilifi and Mtwapa and in the back lagoons around Momasba andDiani Chale (4.5km2). Gazi Bay and Diani Chale lagoons are more or less continuous and represent the largestseagrass area in Kenya (Ochieng and Erftemeijer 2003) see section 3.1.3 below.
Kenya has been highly proactive in marine conservation having established the first marine park in 1968 in Malindi,and Kenya’s guidelines for establishing marine parks and reserves and protecting rare species (turtles and Dugongfor instance), was adopted by UNEP’s action plan for the East African Regional Seas Programme (UNEP 1998).Even though these protected areas include seagrasses, there are no detailed distribution maps of seagrasses forKenya. Similarly, there are no existing management practices for protecting seagrass beds and their ecosystem perse. The impact of this is that outside protected areas, management and control over the exploitation of fauna thatoccur in seagrass beds is minimal, the ecosystem services role that seagrass beds play is overlooked, and they arenot viewed as an important resource for the national economy.
Summary
Seagrass beds are among the most productive aquatic ecosystems; provide important habitats for a wide range ofspecies including critically endangered Dugong and turtles; and are important nursery, breeding and feeding groundsfor numerous fish and invertebrates (Green and Short 2003; Waycott et al. 2011). They are therefore very importantto commercial, subsistence and recreational fisheries. Due to their high productivity and trapping of carbon in biomass and sediment trapping, seagrass beds are among the mostsignificant shallow marine carbon sinks, storing up to 500 tonnes/ha (or 50 g/m2). Nearly all of this is trapped in the sediment(Green and Short 2003). This is equivalent to the amount of carbon stored in primary tropical forests. Along with mangroves,seagrasses are therefore of great significance in carbon sequestration to reduce greenhouse gas buildup in the atmosphere andoceans. There does not appear to be any targeted research in eastern Africa on this topic, though a related study on carbonuptake strategies by different seagrass species in Kenya provides interesting insights on possible direction of future research(Uku 2005). It is clear that these ecosystems have received less attention in terms of research and management in easternAfrica due in part to their low visibility and less aesthetic appeal compared with, for example, coral reefs, and this is an area thatrequires attention.
The threats to seagrasses worldwide are similar and widespread. Seagrasses everywhere are vulnerable to eutrophication fromnutrient overenrichment of the environment and to turbid conditions caused by upland clearing and disturbance, both leading toreduced light availability. Seagrasses are also subject to total destruction through coastal construction and other direct humanimpacts. Direct use of seagrass plants by humans is limited, but seagrass beds support important coastal fisheries worldwide,and because they occur in easily accessible, shallow, sheltered areas these are often subsistence fisheries. Their high productivity and biomass are an integral part of many of their uses and values from a human perspectiveincluding: important for fisheries as food, shelter and nursery grounds; sediment stablisation and coastal protection;water purification and nutrient cycling; mitigating climate change and maintaining biodiversity and threatened species.Further research is needed to understand their importance particularly their resilience and adaptability to climatechange and their economic contribution to coastal communities in eastern Africa.
27
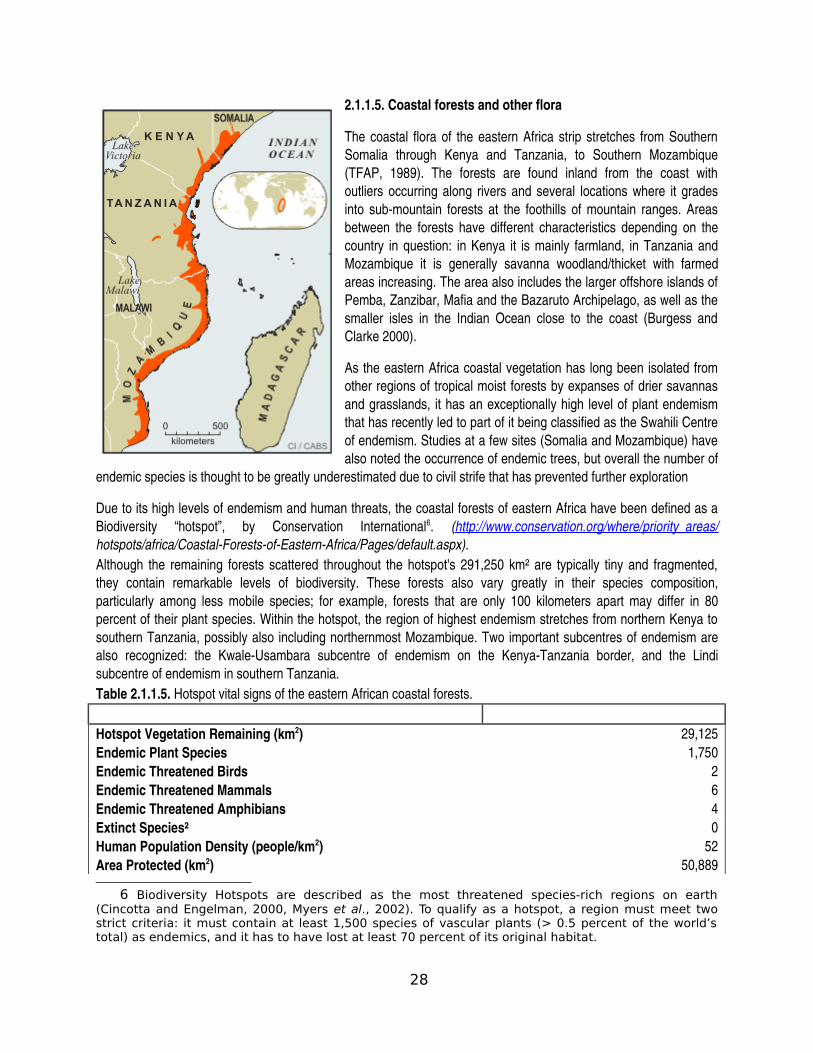
2.1.1.5. Coastal forests and other flora
The coastal flora of the eastern Africa strip stretches from SouthernSomalia through Kenya and Tanzania, to Southern Mozambique(TFAP, 1989). The forests are found inland from the coast withoutliers occurring along rivers and several locations where it gradesinto submountain forests at the foothills of mountain ranges. Areasbetween the forests have different characteristics depending on thecountry in question: in Kenya it is mainly farmland, in Tanzania andMozambique it is generally savanna woodland/thicket with farmedareas increasing. The area also includes the larger offshore islands ofPemba, Zanzibar, Mafia and the Bazaruto Archipelago, as well as thesmaller isles in the Indian Ocean close to the coast (Burgess andClarke 2000).
As the eastern Africa coastal vegetation has long been isolated fromother regions of tropical moist forests by expanses of drier savannasand grasslands, it has an exceptionally high level of plant endemismthat has recently led to part of it being classified as the Swahili Centreof endemism. Studies at a few sites (Somalia and Mozambique) havealso noted the occurrence of endemic trees, but overall the number of
endemic species is thought to be greatly underestimated due to civil strife that has prevented further exploration
Due to its high levels of endemism and human threats, the coastal forests of eastern Africa have been defined as aBiodiversity “hotspot”, by Conservation International6. (http://www.conservation.org/where/priority_areas/hotspots/africa/CoastalForestsofEasternAfrica/Pages/default.aspx). Although the remaining forests scattered throughout the hotspot's 291,250 km² are typically tiny and fragmented,they contain remarkable levels of biodiversity. These forests also vary greatly in their species composition,particularly among less mobile species; for example, forests that are only 100 kilometers apart may differ in 80percent of their plant species. Within the hotspot, the region of highest endemism stretches from northern Kenya tosouthern Tanzania, possibly also including northernmost Mozambique. Two important subcentres of endemism arealso recognized: the KwaleUsambara subcentre of endemism on the KenyaTanzania border, and the Lindisubcentre of endemism in southern Tanzania. Table 2.1.1.5. Hotspot vital signs of the eastern African coastal forests. Hotspot Original Extent (km2) 291,250Hotspot Vegetation Remaining (km2) 29,125Endemic Plant Species 1,750Endemic Threatened Birds 2Endemic Threatened Mammals 6Endemic Threatened Amphibians 4Extinct Species† 0Human Population Density (people/km2) 52Area Protected (km2) 50,889
6 Biodiversity Hotspots are described as the most threatened species-rich regions on earth(Cincotta and Engelman, 2000, Myers et al., 2002). To qualify as a hotspot, a region must meet twostrict criteria: it must contain at least 1,500 species of vascular plants (> 0.5 percent of the world’stotal) as endemics, and it has to have lost at least 70 percent of its original habitat.
28

Area Protected (km2) in Categories IIV* 11,343
Threats to coastal forests in Mozambique include clearing for agriculture and lack of management and conservation.Due to poor soil quality and an increasing population trend, subsistence agriculture as well as commercial farmingcontinues to consume more and more of the region's coastal forest habitat. Considering the diversity of habitatsalong the length of Mozambique coastline and the economic importance of the littoral waters, remarkably few coastalareas are protected (World Bank, 1996). In Mozambique they include Marromeu reserve (150 000 ha), Licuati ForestReserve (3 500 ha), Maputo elephant Reserve (70 000 ha), Pomene Reserve (20 000 ha), Bazaruto N. Park (8 000ha), Zinave National Park, Banhine National Park, Gile Reserve, Quirimbas National Park, Niassa Reserve. Situatedin the Zambezi River Delta system, the Marromeu Reserve comprises mangroves swamps, freshwater swamps andmiombo forest. The Maputo Elephant Reserve, located in the Southern part of the country, belongs to MaputalandCenter of endemism and is comprised by Dune vegetation, Grasslands, Floodplains swamp Forests and Mangroves.The Licuati forest Reserve is mainly comprised by Sand Forest, which lie within the vegetationally complex ofMaputaland Centre of Endemism. This region includes Maputo E. Reserve and part of the Natal in South Africa (Soto2007) .
In Kenya considerable areas of Coastal forests are under some sort of protection (Gachanja and Kanyanya 2004).They include Arabuko Sokoke Forest Reserve (37000 ha); Madunguni Forest Reserve (5300 ha); the Forestgrassland mosaic of Shimba Hills National Reserve (21400 ha); the mix Forest and woodland Kaya Forest Reserve(28400 ha); the Medium Kwale Forest Reserve (5100 ha); the Marafa Brachystegia Trust Land (3000 ha); TanaRiver Delta; the Witu Lamu Forest reserve (1500 ha); the predominantly woodland type Boni/Lungi Forest Reserve(9500 ha); the Tana Gallery Forest Trust Land; the Dodori/Boni Forest Reserve/National Reserve (22000 ha); theticket, forest, woodland mosaic Ras Tenawi Trust Land (2000 ha); the Kilibasi County Council Forest (200 ha); theMwangea Trust Land Forest (1500 ha) and; the Mwangea Hill Trust Land/Private Forest (500 ha).
Major threats to Coastal Forest conservation in Kenya include increased human populations with the associatedinefficient farming and agriculture systems; forest encroachment; grazing; insecure land and tree tenure; poorgovernance; charcoal burning; bush fires; mining and; double gazetting (e.g. Shimba hills are double gazetted asForest Reserve and National Reserve).
Tanzania has about 33.5 million hectares of forests and woodlands. About 13 million hectares of this total forest areahave been gazetted as Forest Reserves. The area covered by coastal forests is about 70,000 ha only. CoastalForests are usually rich in endemic tree species, but only scattered remnants are left of the original forests. Examplesinclude the evergreen tree cover type of Newtonia buchananii, Allanblakia stuhmannii and Parinari excelsa, occurringin Kwamkoro area, East Usambara Mountains, Tanga; Kimboza on the foot slopes of Uluguru Mountains and thelower slopes of the Udzungwa escarpment, in Morogoro region.
Protected coastal forests (not necessarily gazetted for the purpose of Coastal Forest protection) in Tanzania includethe MnaziBay Rovuma Estuary Marine Park (65,000 ha); the Mafia Island Marine Park (88,200 ha), the JozaniShwaka Bay National Park and Saadani National Park (1,06200 ha)(http://en.wikipedia.org/wiki/List_of_protected_areas_of_Tanzania). Main threats to their conservation include illegaland unsustainable logging, pit sawing, shifting cultivation, forest fires, poaching, hunting and other cultural uses aswell as infrastructure development such as roads and, tourism, etc. (Dallu 2000).
29

2.1.2 Species
The following summary of important species in eastern Africa’s marine environments highlights those species ofspecial significance. Species were selected based on some, all or a combination of the following criteria:
• IUCN Red List• endemic to the WIO• known functional ecology e.g. in resilience• key species in local fisheries for food• global significance – in terms of rarity and aesthetic value• vulnerable or resilient to climate change
2.1.2.1 Coelecanth
The coelacanth is possibly the sole remaining representative of a once widespread family of Sarcopterygian (fleshyfinned) fish that were thought to be extinct. A living coelacanth was netted by a fishing trawler off East London, SouthAfrica in 1938 and discovered by Marjorie CourtenayLatimer. J.L.B Smith then described the fish in an atmosphereof scientific excitement, skepticism and doubt and the media considered this to be the zoological discovery of thecentury.
Two species of coelacanth are alive today, the Western Indian Ocean (WIO) species Latimeria chalumnae, and amore restricted Indonesian species, L. menadoensis. Coelacanths are most commonly found on sloping continentalshelves, and early reports suggested they occur at depths of 300400m where bottom topography such as caves,and canyons/fissures leading into deep water provide shelter for them and habitat for their prey. They were reportedfrom the submarine canyons of the east and west coasts of the Mozambique channel: the steep volcanic slopes ofthe Comoros and areas off northern Mozambique, but more recently on the upper slopes of canyons in the PembaChannel around Tanga in much shallower depths of 75100m. Increasing accidental catches in deep water gillnets ofthis extraordinary and rare species in east Africa especially in northern Tanzania led to regional and internationalconcerns and the formation of the African Coelacanth Ecosystem Program (ACEP) which has been instrumental inworking with the Tanzanian government to establish the Tanga Coelacanth MPA. However, the proposed deepwaterharbour in Mwambani Bay near Tanga is likely to put the local population of coelacanth at risk and compromise thenew MPA.
2.1.2.2 Sharks and rays
Sharks and rays, the unique and large group of relatively primitive cartilaginous fishes (Class: Chondrichthyes) areconsidered to be highly vulnerable due to a combination of their life histories (produce few young, slow reproductiverates) and the lucrative Asian market for their fins which are used for the Asian delicacy of shark fin soup. It isestimated that between 26 and 83 million sharks are killed each year for their fins (IUCN Shark Specialist Group(SSG)). There are 1,044 described Chondrichthyan species around the world which include sharks (468 species),rays and skates (batoids) and chimaeras (ratfishes). The population status of almost 50% of all sharks is unknowndue to lack of data (IUCN Red List) and this is particularly so in the WIO. Of those species that have been assessed
30

by the IUCN Shark Specialist Group, 22 are Critically Endangered, 41 are Endangered, 116 are Vulnerable, and 133are Near Threatened. However these numbers are currently being revised through further assessments.
There is global concern for the status of sharks and rays due to heavy offshore fishing pressure by foreign longlinerand purseiner vessels, limited management and regulation in national fisheries, increasing pressure brought on bythe valuable trade in shark fin and the destruction of nearshore nursery grounds. Shark finning (i.e. removaland retention of shark fins and either immediately killing or discarding the body) has increased overthe past decade largely due to the increasing demand for shark fins for shark fin soup andtraditional cures, particularly in China and its territories, and as a result of improved fishingtechnology and market economics. IUCN’s Shark Specialist Group say that shark finning iswidespread, and that "the rapidly expanding and largely unregulated shark fin trade represents oneof the most serious threats to shark populations worldwide" (Buckley, 2007). Estimates of theglobal value of the shark fin trade range from a minimum of US$540 million to US$1.2 billion (Clarket al. 2006; Clark et al. 2007). Shark fins are among the most expensive seafood productsworldwide, commonly retailing at US$400 per kg. (Buckley, 2007). In the United States, where finningis prohibited, a bowl of sharkfin soup can sell for $70 to $150. For trophy species like the whaleshark and basking shark, a single fin can fetch $10,000 to $20,000 (Clark, 2007).
Studies estimate that 26 to 73 million sharks are harvested annually for their fins. The annualmedian for the period from 1996 to 2000 was said to be 38 million, which is nearly four times thenumber recorded by the Food and Agriculture Organization (FAO) of the United Nations,(Clark et al.2006) but considerably lower than the estimates of many conservationists. Of this total, around 30% isfrom the Indian Ocean, mainly from the southwestern part of the Indian Ocean. Catching of sharks for their finswhich can be sold at over $100 per kg is the greatest threat to shark populations in the WIO, and although banned inother countries (Republic of Palau, USA and Canada) this practice is not regulated in the WIO (Obura et al. 2012).
In the WIO sharks are increasingly threatened due to their vulnerability (see above) combined with little value placedon them by the public, decision makers and managers. There is poor understanding of their role as key species in theecology of eastern Africa’s marine systems as well as their value in tourism. For example, dive tourism in the RedSea is strongly linked to healthy shark populations where a live grey reef shark has been valued at $1000s/per yearcompared with a dead grey reef shark which fetches $25 (Cousteau Society unpubls. Sudan). Rays are usuallycaught by artisanal gill net fishers who salt their catch and sell it to local buyers. This is an unsophisticated fisherythat has operated in this region for decades. For example, in Tanga, Tanzania, rays comprise 72% of the catch fromgill nets (Anderson 2004).
In the WIO there are 137 species of sharks and rays, of which fifteen are endemic to the region (Smith and Heemstra2003). Ten species are endemic just to South African waters. The highest elasmobranch diversity in the region hasbeen recorded from Mozambique waters, with 108 species (73 sharks and 35 rays). Sharks have slow reproductiverates with many species only producing a handful of offspring when the adults are 1015 years old. The moreprimitive species lay eggs, while the most advanced species are viviparous, meaning the fetal sharks are connectedby placenta in utero, and are born live.
31

Table 2.1.2.2. Small coastal species of shark in eastern Africa of which nothing is known of their population status.(Source: IUCN Red List 2012; Smith and Heemstra 1995)
Species name Common Name Red List global status NotesCarcharhinusamblyrhynchos
Grey reef shark Not assessed Little known about their movementsbut thought to be highly site attached;known to forms daytime aggregationsin favoured places (Campagno, 1984,Smale, 2000).
C. melanopterus Black tip reef shark Near Threatened top predators on coral reefsTriaenodon obesus White tip reef shark Near Threatened top predators on coral reefsC. wheeleri Black tail reef shark Undetermined Juveniles in shallow inshore waters,
adults usually at depths of >80mC. sealei Black spot Undetermined Coastal shore usually at depths <40mC. dussumieri White cheek UndeterminedC. sorrah Spot tail Undetermined Top predators on corals reefs, in
depths of 2075mRhizoprionodonacutus
Milk shark Undetermined Inshore species
Published data on all sharks and rays in the region are rare, although this is changing as there is growing interest toreview sharks and rays from an ecological and conservation viewpoint (Obura et al. 2012). Data on the small (< 2m)coastal species are notably sparse and these species tend to be given little attention by management andconservation agencies (Table 2.1.2.2). They are likely to be very vulnerable and may well be being fished toextirpation because they have small home ranges (but not all, eg milk shark) and high site fidelity and occur incoastal waters making them accessible to artisanal fishers, as well as providing fins for the Asian market. Sharkfisheries in eastern Africa have existed for centuries because the meat preserves well when salted and dried and cantherefore be easily traded along the coast. For example in the northern area of Kenya (Lamu to Kiunga) shark fishingthrough set gill nets has been in practice for decades. However catch rates have declined in the order of 85% overthe last 40 years, though prices have not increased significantly, except for shark fin which increased from around $2per kg in 1998 to $28 per kg in 2008 (Samoilys and Kanyange 2008). A saleable amount of shark fin, c.10kg dryweight, may take a fisher up to a year to accumulate, as it requires fins from around 150 sharks. Since shark fins canfetch a high price (depending on the grade), and 10 kg of highgrade fins is worth at least approx. USD 555, artisanalfishers will keep and dry shark fins for sale to roving buyers for the Asian market (Samoilys and Kanyange 2008). Itshould be noted that sharks landed in eastern Africa are used fully and are not fished purely for the fins, with, forexample, liver oils used to treat wooden boats.
Recent research has focused on specific species such as the Great White shark (Carcharodon carcharias); WhaleSharks (Rhincodon typus) and Manta Rays (Manta alfredi), and in specific areas such as Tofo Beach, southernMozambique, which we summarise below. As top predators, sharks play a vital role in the food chain and exert topdown impacts on other trophic groups. The depletion of shark populations is likely to create worrying “trophiccascades” causing dramatic changes in food webs (Robbins et al 2006; Sandin et al 2008). Recent surveys of coralreefs in the region recorded a complete absence of reef associated sharks (eg. grey reef, black tip, white tip, at all 75
32

sites surveyed in Tanzania, Mozambique, Comoros and Madagascar, except at one site in Cabo Delgado,Mozambique (Samoilys and Osuka in prep.).
The Great White shark (Carcharodon carcharias)Great White sharks are naturally low in abundance, and range from cold temperate waters to tropical waters though in the latterthey tend to prefer cooler deeper waters. Most research on C. carcharias as been carried out in South Africa, and only a fewsightings have been recorded off Mozambique, Tanzania and Kenya where they are rare (Figure 2.1.2.2). Individuals have beencaught or seen throughout the region, mostly as large pregnant females, suggesting they may pup in warmer waters. Records foreast Africa include: a 5 m male trapped in a net by a local fisher in July 1989 off Malindi; a 3.5 m male captured off Zanzibar inthe 1990s and a 6.1m white shark caught in a tuna net about 3.2 km off Kiwengwa, East Zanzibar.
Great Whites have low reproductive potential, probably have a low natural mortality, and presumably possess a low capacity fordensity dependent compensation to rapid declines in population size. It is therefore reasonable to conclude that populations arevulnerable to recruitment overfishing and all forms of nonnatural mortality. Their population status is poorly known over thespecies range owing to a lack of robust abundance indicators, and quantitative stock assessments are not currently possible.
Figure 2.1.2.2 Observations of great white sharks in the WIO. The stars correspond to sparse observations or catch(data from Cliff et al., 2000 and MAYSHARK, unpubl. data in Kiska et al. 2009).
Whale sharks (Rhincodon typus)
From the first whale shark described in 1828 from the Indian Ocean, the region continues to be one of the most important areas for whale sharks.Whale sharks are a planktivorous broad ranging species with seasonal migration patterns of thousands of km, though they may beresident yearround in equatorial zones. Globally they are found in many areas with surface sea water temperatures of 18–30oC, andrange across the entire Indian Ocean. Unusually for sharks, females give birth to large numbers, even thousands, of young. The species hashowever been the subject of several targeted fisheries and thus sustained massive, rapid declines in population numbers. A number of fisheriestargeting whale shark have developed within the Indian Ocean, some from traditional roots, such as in India, Pakistan and the Maldives,that originated to supply the oil from the shark’s liver for waterproofing boats. Whale shark tourism has rapidly grown in importance inthe region, with predictable seasonal sightings known in Kenya (e.g. Diani), Tanzania (e.g. Mafia) and Mozambique (e.g. Tofo). Thedynamics and interrelatedness of these populations are not fully known but satellite tagging studies from Seychelles and Mozambiqueare examining this (Rowatt, 2008; Brunnschweiler et al. 2009) and offer a significant opportunity for blending conservation,research and economic development.
Focal studies on whale sharks are as follows:
33

• Mozambique – Tofo
The coastline around Tofo in southern Mozambique is a focal area for R. typus. Here, high densities gather yearround in a narrow (c. 20 km2) corridor close to shore. The high sighting rates and accessibility of the fish has led tothe development of a burgeoning marine tourism industry. Although the broader scale movement patterns andbehaviour of these fish are unknown, the local population structure (81% males) suggests that these fish constitute asubset of a larger population. A female R. typus was tagged off Tofo and showed a highly directional movement across the Mozambique Channeland around the southern tip of Madagascar, a minimum distance of 1200 km in 87 days. Dives to depths well into themesopelagic and bathypelagic zones (1286 m maximum depth) were recorded (Brunnschweiler et al. 2009).
• Kenya – Diani
Whale shark (R. typus) numbers appear to have increased off the southern coast of Kenya, particularly aroundDiani/Galu and Chale Island from an average of about 20 sighted in a year to 20 sighted in a day in 2011. Thereason for this increase is unknown, but it is speculated that there is a direct link to the increased volume ofmantis shrimp.It may alsobe related to increased monitoring and interest in this species. In response to this,increased fishing pressure and the rising interest of tourists, the East African Whale Shark Trust (EAWST) wasformed who have had some activity in tagging projects and recently have announced that they plan to capture ayoung whale shark and put it into a 500m enclosure for up to 6 months at a time for tourist viewing in the water,and revenues generated will go towards whale shark conservation. This project has become controversial andthe EIA is currently being reviewed.
Sharks are mentioned in multiple global instruments that have strategic conservation and management potential. The followingillustrate these with reference to the Whale Shark (Obura et al. 2012):
IUCN Red List the whale shark is listed as Vulnerable in the IUCN Red List
CITES Appendix II, 2002. This status should allow for the closer monitoring of and restriction in international trade in whale sharkproducts, and by so doing assist in the conservation of the species on a global scale. Changes in this listing are currently beingreported from the most recent CITES COP and therefore this status will change.
Convention on Migratory Species (CMS) Appendix II, 1999. On listing, a call was made for cooperative actions by 2001–2002,however, it was not until November 2005 that the CMS approved a ‘Recommendation for the conservation of migratory sharks’proposed jointly by Australia, New Zealand and Seychelles.
UNCLOS Agreement on Straddling Fish Stocks and Highly Migratory Fish Stocks . This agreement recognizes that as the whale sharkis a highly migratory species, coordinated management and assessment of shared migratory populations would promote anunderstanding of the cumulative impacts of fishing effort on the status of shared populations. To date, no such measures have beenproposed.
FAO International Plan of Action for Sharks there is a potential framework for whale shark conservation. Unfortunatelyimplementation of even National Plans of Action by FAO members has been extremely limited thus hampering plans for aninternational instrument.
Sawfish and guitarfish
The Critically Endangered sawfish Anoxypristis cuspidate (Knifetooth sawfish) and Pristis zijron (longcomb sawfish)occur in Ungwana Bay, Kenya and the lower reaches of the Tana River, but their reportings are extremely rare(Samoilys et al. 2011a). All sawfish are listed on Appendix 1 of CITES. Sawfish are the sole living family Pristidae
34

within the order Pristiformes. Guitarfish are known from the region, though since exploited they are likely to be highlydepleted. there are no data and this therefore requires urgent conservation attention.
Manta Rays (Manta alfredi)Manta rays are the largest batoid fishes in the world and are pelagic planktivores with wideranging distributions throughout most of theworld’s tropic and subtropic oceans (Last and Stevens 2009; Marshall et al. 2009). These large rays are most commonly found inproductive coastal areas and are commonly encountered by divers around island groups, shallow bays, tidal channels and offshoreseamounts and pinnacles (Dewar et al. 2008; Luiz et al. 2009; Marshall et al. 2009). Information is largely lacking on their populationsizes, population structure and demography and movement patterns in the WIO. However, at Tofo, Southern Mozambique, thereis a large manta ray aggregation that has been investigated for several years (Marshall et al. 2011) and is an areabeing given attention by WWF. Annual population size estimates for M. alfredi range from 149 to 454 individuals and the superpopulation size estimate was 802 individuals, the first reported for M. alfredi at a monitored aggregation site. Tofo also acts as a birthingground, with individuals typically giving birth in the austral summer period after a gestation of 1 year. Reproductive periodicity in M. alfredi is commonly biennial, but someindividuals are annual and the production of a single pup appears to be the normal situation, with occasionally two. this reproductive pattern means these species will behighly vulnerable to exploitation. manta rays have been taken for centuries in eastern Africa as part of the dried shark meat fishery and trade (see above). The impacts ofthis fishery are unknown. Research at Tofo has contributed to the limited baseline data currently available for M. alfredi and R. typhus and has highlighted the need for moreconservative management strategies.
Other sharks and raysReef and oceanic sharks are widely dispersed but their populations greatly reduced through fishing mortality. In theEastern African region the bull shark or Zambezi shark (Carcharhinus leucas) is most strongly implicated in attackson people, fuelling the general fear of sharks and low commitment to their conservation in most regional countries.The charismatic scalloped hammerhead sharks (Sphyrna lewini) used to be abundant near steep reef slopes offPemba, Tanzania but their numbers have dwindled (Last and Stevens, 2009), probably due to gillnetting of juvenilesin inshore waters and overfishing of adults by foreign offshore fishing fleets.
2.1.2.3 Bony (Teleost) fishes
Key species of teleost fishes that occur in the WIO and merit mention here are those listed as as threatened on theIUCN Red List or are rare and have regional or global significance. Examples are given in Table 2.1.2.3.
Table 2.1.2.3. Key species of teleost fishes that are threatened, rare and merit conservation attention. (Source:Samoilys and Osuka in prep.; Samoilys et al. in press; IUCN 2012 Red List data; Samoilys et al. 2011a)
Common name Latin name Red List / Populationstatus
Notable locations
Napoleon wrasse Cheilinus undulatus Endangered; CITESAppendix 2
Pate Island, N. KenyaMafia Island, TanzaniaVamizi Island, N. Mozambique
Humphead parrotfish Bolbometoponmuricatum
Vulnerable
Giant grouper Epinephelus lanceolatus Vulnerable rare throughout its range;preliminary data on a Zanzibarfishery based on a spawning
35

aggregationRed Sea/ArabianGulf angelfish
Apolemichthys xanthotis Least concern Only found in northern Kenya at itssouthern limit
The Napoleon wrasse is threatened due to the trade in this species to the Asian live reef fish market and crashingpopulations worldwide. However, there appear to be relatively healthy populations of this species in 23 locations ineastern Africa that therefore merit attention since they have not only national and regional but also globalsignificance. The location of this wrasse on Pate Island’s Pazarli reef in the channel of the proposed Lamu Port wouldtherefore be destroyed if the port goes ahead (Samoilys et al. 2011a). Surveys of all these species are limited andfurther surveys are needed to fully understand their population status and distribution and to evaluate areas ofparticular importance for these threatened species.
2.1.2.4 Corals
Corals unique to the WIO and also rare and of ancient lineage are found on the eastern African mainland, particularlyon the Cabo Delgado and Nampula Mozambique coast, and in Kiunga, Kenya (Obura 2012; see Figure 2.1.2.4).These are only recently being discovered (see Obura 2012) and warrant much more research to understand theirextent and distribution.
Figure 2.1.2.4. Rare and endemic corals from the Western Indian Ocean. © David Obura 2012.
36

2.1.2.5 Turtles
Five out of seven species of marine turtle worldwide occur in Mozambique, Tanzania and Kenya: Green turtleChelonia mydas, Hawksbill Eretmochelys imbricata, Loggerhead Caretta caretta, Leatherback Dermochelyscoriacea, and Olive Ridley Lepidochelys olivacea. The most abundant species is the green turtle, and the secondmost common is the Hawksbill. On the IUCN Red List of Threatened Species all are currently listed either asCritically Endangered (hawksbill, leatherback) or Endangered (Green, Olive Ridley and Loggerhead).
The complicated life cycles of sea turtles require them to utilise a variety of habitats. Eggs are laid and incubate inbeach sand, but posthatchlings are pelagic and inhabit the surface waters of convergence zones and major gyresystems throughout tropical and temperate oceans. These juvenile stages migrate with ocean currents over 1000s ofkilometers. Most adult turtles also migrate over such distances, but this varies between species. The feeding groundsof the bottomfeeding sea turtles (green, hawksbill, olive ridley and loggerhead) include seagrass, coral reef, sandand mud flats, and mangrove ecosystems, while the pelagic leatherback feeds in oceanic surface waters of tropical,temperate, and even polar seas.
The state of turtle populations is a good indicator of the overall health of coastal and marine ecosystems. Turtles mayalso be crucial for the functioning of healthy marine ecosystems; findings from the Caribbean suggest that the demiseof the macroherbivorous green turtles following European colonisation had significant effects as few other speciesfeed on seagrasses.
There has been extensive turtle research since the early 1990s in the region, but this information is still relativelyscattered and not always standardised. Nevertheless, turtle information has been a backbone of the subregional andecoregional marine planning exercises for mainland East Africa (WWF 2004). There is however a need for morespecific turtle data particularly on feeding, breeding, juvenile routes and adult migratory routes in the WIO. Importantnesting areas in eastern Africa are listed in Table 2.1.2.5.
Table 2.1.2.5. Locations of importance to Green and Hawksbill turtles (Source: Obura et al 2012).
Green turtles
Area Importance
Bazaruto,Mozambique
Nesting, feeding grounds and important for the juveniles
Quirimbas Mnazi Bay,Mozambique
Important nesting and feeding grounds, up to 200 nests per year
Mafia – Rufiji,Tanzania
Key feeding grounds and some key nesting sites i.e. particularly Mafia (since 2001 – 2011 hadover 1179 nests recorded (Seasense report 2011 http://www.seasense.org/fileadmin/documents/reports/Sea_Sense_2011_Annual_Report.pdf)
Kiunga and Lamu Key feeding and nesting area with up to 130 nests in Kiunga and over 100 nests in Lamu are
37

Kenya per year
Mozambiquechannel
Used by all 5 species, genetic differentiation likely due to oceanography of the channel,separating northern and southern populations
Hawksbill turtles
Area Importance
Bazaruto, Mozambique nesting, feeding grounds and important for the juveniles
Quirimbas – Mnazi Bay,Mozambique/Tanzania
important nesting and feeding grounds
Mafia – Rufiji, Tanzania Feeding grounds and some key nesting sites
Kiunga Feeding and nesting area with up to 10 nests a year however there is limitedinformation available
Mozambique channel migratory route
Isles Eparses in theMozambique Channel
Juan de Nova up to 50 nesting females a year
Europa – important as development habitat (mangrove) for juveniles
Loggerhead and leatherback turtles
Known important nesting areas for both species are in Mozambique particularly around the Maputo Bay –Machangulo Complex and the Bazaruto archipelago. Foraging populations of both species are found off all threecountries.
Olive RidleyThere is limited information on the Olive Ridley in the region especially on specific nesting, feeding grounds and theirjuvenile movements, with the exception of Mozambique. Olive Ridleys have been reported off Lamu, Tenewi Island,Kiunga Marine National Reserve and WatamuMalindi, and mortalities have been recorded off Rufiji Delta Tanzania(Muir 2005; West 2011). The northen section of Mozambique is a key nesting site for Olive Ridleys – one of the mostimportant in the WIO (Costa et al. 2007).
There are a very large number of turtle conservation groups in the region and these need to be supported andintegrated, and methods and approaches standardised, to build a regional database and management policy witheffective action on the ground. Specifically, the following is recommended:
• Create a regional database built of national and local sea turtle conservation efforts and use this data toguide and/or influence national development plans should they negatively impact notable feeding andbreeding grounds of sea turtles i.e. Lamu and Mtwara Ports
38

• Work with sea turtle scientists in the WIO region to develop a regional database, maps and overallunderstanding of sea turtles in Eastern Africa. With this develop guidelines for best sea turtle practices forEastern Africa, and use this to influence policy, where possible.
2.1.2.6 Marine Mammals – dugong, whales and dolphins
There are approximately 36 species marine mammals in the WIO region, of which eight are baleen whales, 2 3 aresperm whales, 13 are toothed whales, 13 are dolphins and there is one dugong species (Table 2.1.1). Of thesearound 17 whales and 13 dolphins are thought to occur in the three eastern African countries (Berggren and Coles2009) with the eastern African coastline forming important breeding grounds for several whale species (Figure2.1.2.6). The exact number is still being determined as marine mammal surveys are not extensive: information in theregion is limited. Among the main sources are reviews conducted to determine the effectiveness of the Indian OceanWhale Sanctuary (IOS) which consider the status of populations and trends in threats to cetacean stocks (Clark andLamberson, 1982). Recently marine mammal surveys have been conducted in northern Mozambique as part of thegas exploration environmental impact assessments (Samoilys et al. in prep.).
Figure 2.1.2.6. Cetacean zones in the WIO, emphasising the primary zones of cetacean sightings (green), bluewhale sighting zones (blue), primary feeding grounds for all cetaceans (pink), wintering grounds (red) for humpbackwhales and migration routes (arrows) for humpback whales. (Source: RAMP@COI from Obura et al. 2012).
Whale species known to have reduced in numbers in the region include blue whales (Balaenoptera musculus), finwhales (B. physalus), sei whales (B. borealis) and humpback whales (Megaptera novaeangliae) (Obura et al. 2012).The severe depletion of almost all stocks of ‘great whales’ is well documented and dates back to early whaling in the18th – 19th Centuries though information from the Indian Ocean is limited, most coming from the Atlantic and Pacific(Roberts 2007).
Below we summarise information on key species of marine mammals in eastern Africa.
Dugong (Dugong dugon)
Dugongs live in nearshore tropical and subtropical coastal and island waters of the IndoPacific between southernMozambique in the west and Vanuatu to Japan in the east, closely associated with seagrass beds, their preffered
39

food. While the status of the dugong over a large proportion of its range remains poorly known, their populations aresignificantly depleted in most locations, and believed to be declining in over twothirds of their range, and locallyextinct in some locations. The species is listed as Vulnerable (IUCN Red List, 2012) and is very vulnerable toextirpation in Africa. In Eastern Africa dugong once ranged from Somalia to Mozambique and across to westernMadagascar (Kemp, 2000; WWF 2004), but have suffered a steep decline since the 1960s and are now so rare theyare in danger of going locally extinct. Information on the dugong (Dugong dugon) is patchy throughout the region.They are reduced to scattered remnant populations with the most recent research and monitoring of dugong being inthe Bazaruto Archipelago in Mozambique (www.dugong.org). There are probably less than 500 animals in the WIO,of which there are around 20 in Tanzania, less than 10 in Kenya and over 300 are known to exist in the BazarutoArchipelago (www.dugong.org). It is likely that most populations are now nonviable except that of Bazaruto.
Dugong have been depleted largely through targeted fishing for their meat and through bycatch in seine, gillnet andtrawl fishing which increased enormously from the 1970s onwards. Habitat destruction of seagrass beds andincreased anthropogenic disturbance have also contributed as threats to dugong populations in Mozambique,Tanzania and Kenya. Although dugongs are protected across all the states, enforcement and consequent protectionis strongly limited by capacity and resources.
Mozambique
Surveys in the late 1960s suggested that dugongs were common along the Mozambique coastline from Maputo Bay,Chidenguele, Inhambane Bay, Bazaruto Bay, Mozambique Island and Pemba Bay and the Quirimbas Archipelago(Cockcroft et al, 1994, Cockcroft 1995). Dugong herd sizes of 8 10 individuals were reported for Inhaca Island in1992, although this area is now thought to support only 2 or 3 individuals. While dugong were observed throughoutInhambane Bay in October 1994, no animals were recorded during a survey of the bay in 2007. The BazarutoArchipelago supports the largest dugong population in the wider WIO region and although there were suggestionsthat the population was declining, recent surveys suggest about 300 individuals. Only one dugong was recorded inaerial surveys of the Quirimbas archipelago of northern Mozambique in 2007, and an incidental sighting of a loneindividual was made in 2009.
Tanzania
Seasense, a local NGO that works closely with coastal communities in Tanzania to conserve and protect endangeredmarine species including dugongs has noted a presence of a small breeding herd of dugong in the Rufiji Delta. Since2004, 51 dugongs have been sighted in the Delta of which 37 were live including 2 pairs of mothers and their calves;13 were drowned in gill nets and 1 was stranded. A few individuals have also been sighted off the Western side ofMafia Island.
Kenya
The Tana Delta seagrass beds may support one of the few remaining dugong populations in Kenya (Samoilys et al.2011a), though only one recent sighting has been reported in the northern area of LamuKiunga (WWF/KWS 2010,pers. comm.). There are no reliable historical data on dugong populations in Kenya (Wamukoya et al., 1997). It isbelieved that dugongs may now only remain in very small numbers in the LamuKiunga region (Dutton 1998) and inFunzi Bay in the south of the country. Recent reports (20072009) of 1 individual sighted per year in Funzi Bay, 2sightings off KisiteMpunguti further south, respectively (Magileviciute pers. comm. (Global Vision International))provide a startling indication or how rare these animals are, lending support to the view that dugong are one of themost endangered mammals on the African continent, and that populations of dugong in Kenya are no longer viable
40

(Samoilys et al. 2011a).
Humpback whales (Megaptera novaeangliae)Humpback whales are listed as Vulnerable on the IUCN Red List. Like many whales they feed in the Antarctic butbreed further north in the tropics and subtropics during the Austral winter (Figure 2.1.2.6). Seven breeding stocks (Ato G), of Humpback whale populations have been designated by the International Whaling Commission (IWC)ranging from the western South Atlantic, to the eastern South Pacific (Cerchio et al., 2008). Breeding stock C is thepopulation that over winters in the WIO, with an Austral winter distribution ranging from the East coast of South Africato Kenya (Cerchio et al., 2008). The busiest months are between July and August, and the majority of Humpbacksare mothers with calves. This breeding stock has been further subdivided into 4 subpopulations: 1) on the Eastcoast of Africa from South Africa to Kenya. This is a large substock, likely >6000 animals; 2) in the Comoro Islands, asmaller aggregation, with Mayotte having a high sighting rate of mothers with calves and potential high residency,and a late season peak; 3) around Madagascar, likely the largest substock with 70008000 animals; and 4) theMascarene and Seychelles Islands, a smaller aggregation, possibly a recent range expansion following recovery ofnumbers since protection from whaling. Current genetic evidence suggests the above may form 2 genetic substocksof the mainland and the Islands and the Comorian stock may represent a connection between the two. Migration ofhumpbacks is primarily along northsouth routes, with populations from the southern Ocean migrating along the EastAfrican coast (Figure 2.1.2.6). Thus key areas for humpback sightings above water and for hearing whalesongunderwater include Tofo (S. Mozambique), Nacala/Quirimbas (N. Mozambique), Maziwe and Pemba Islands(Zanzibar) and Mnazi Bay (Tanzania) and Malindi/Watamu (Kenya), see Table 2.1.2.6. Recent work suggests amajor wintering ground for humpbacks off Bazaruto, Mozambique, and significant concentrations off Zanzibar.
Table 2.1.2.6. Key locations and observers of Humpback whales.
Country Organisation LocationMozambique All Out Africa Whale Shark Conservation &
Marine Megafauna FoundationTofo, Southern Mozambique
Dolphin Care Africa group Ponto D’Oore, Southern MozambiqueAssociation for coastal conservation ofMozambique (ACCMZavora Marine Lab),
Zavora, southern Mozambique
Tanzania Friends of Maziwe Project Maziwe Island and Pemba island,Northern Tanzania
Mnazi Marine Park Staff and collaboratingfishers
Mnazi Bay Ruvuma Estuary MarinePark, Southern Tanzania
Collaborating fishers and individuals Kilwa, Fanjove, Dar es Salaam andZanzibar
Kenya Global Vision International (GVI) Kisite – Mpunguti, southern KenyaWatamu Marine Association (WMA) Watamu, Central Kenya coastKiruwitu Conservation Group Vipingo, Kenya
Four years ago the East African Humpback Whale Network was formed as an initiative aimed at encouraging thereporting of humpback whale sightings along the East African coast. All information gathered from Kenya, Tanzaniaand Mozambique contributes to a greater understanding of migration routes and patterns, humpback whalebehaviour, population abundance and threats (Richmond and Bisang, 2009). Currently the network is comprised ofapproximately 1520 regular whale watching locations/observers and holds records of 3,200 humpback whales. In
41

2011 1,989 sightings were recorded between June and December: ~1,300 from the southern Mozambique, 572 inTanzania, and 69 in Kenya.
Other whales There is limited and scattered information in eastern Africa on other whales. Interest is growing however as shown bythe increased research, monitoring and marine mammal networks in the region. Some important findings include:
• Rorqual whaleso Blue whales (Balaenoptera musculus) Historic data from whaling suggests there is a pygmy
population NW of the Seychelles (offshore Kenya/Somalia), but its current status is unknown andpossibility for migratory connections with southern populations is similarly unknown. Key bluewhale sightings have primarily been in the Mozambique Channel, and off the SW and SE coasts ofMadagascar, and on the Madagascar Plateau. Approx 450 pygmy blue whales are estimated forthe south of Madagascar on the Madagascar Plateau.
o Minke Whales have been recorded off Watamu, Kenya in 2013• Sperm whales
o Sightings have been recorded along the coastline from southern Mozambique to northern Kenya,but there are limited data and records (Kenya Marine Mammal Network, 2013).
• Pilot whales and Orcas o Sightings of small pods of Orcas up to 6 in number have been recorded off Watamu, Kenya in the
past 10 years (Kenya Marine Mammal Network, 2013).o Shortfinned Pilot Whales are reported annually from Pemba Channel on the south coast and
Watamu on the north coast of Kenya in pods of over 100 and are known to associate with otherspecies, namely bottlenose dolphins.
The greatest threats known to whales and dolphins, similar to the Dugong, include fishing net entanglement eitherdirectly (whaling) or indirectly causing death through drowning. Chemical pollution (heavy metals, pesticides andother toxins) can cause direct harm to the animals by accumulation in their tissue, via ingestion of contaminated prey.Marine debris, particularly plastics, is also being mistaken for food. Deep water beaked whales and delphinids arealso known to be sensitive to acoustic disturbance in areas with rapidly expanding exploration for offshore petroleum(including seismic surveys and bathymetric mapping, implicated in disturbance and strandings in other regions), all ofwhich are occuring along the eastern African coast.
Coastal DolphinsThe 13 dolphin species known from the region are widespread, though four coastal species are of primary interest forconservation:
• IndoPacific Humpback Dolphin (Sousa chinensis): Near Threatened (IUCN 2012) is widely distributed alongthe west coast Madagascar, and eastern African mainland from South Africa to Tanzania, and to northernKenya. It is typically in small group sizes, and may form mixed species groups with bottlenose and otherdolphins. The species prefers sheltered shallow (< 30 m) coastal waters. They are rare and are becomingmore endangered.
• IndoPacific Bottlenose Dolphin ( Tursiops aduncus ): Data deficient (IUCN 2012) is mainly coastal, unlike thecommon bottlenose dolphin Tursiops truncates which is more oceanic. The IndoPacific Bottlenose dolphinis widely distributed and common throughout the region and quite well documented. It is typically in nearshore, shallow waters, but can also be found in deeper coastal waters. In most locations it is not hunted, but
42

is vulnerable to human activities as there is a significant bycatch in coastal artisanal fisheries that usegillnets.
• Spinner Dolphin ( Stenella longirostris : Data deficient (IUCN 2012) is more oceanic and widely distributed.They are common in Mozambique, Tanzania and Kenya. While they are also typically found in nearshore,shallow waters, they can also frequent deeper coastal waters and may exhibit a diel pattern of close nearshore, shallow water distribution during daylight (resting phase), and offshore, deep water distribution duringnighttime (feeding phase). Unlike the other two species, group sizes can be large, in the 100s – 1000s(Berggren and Coles 2009).
• Spotted Dolphin ( Stenella attenuata ): Least Concern (IUCN 2012) are the most abundant species ofdolphin, in surveys conducted off Mozambique, and were also reported as abundant in surveys conducted inKenya (WWF, 2004). However, only one of this species has been sighted off Kenya between 2006 2013.This may be because they are oceanic, but they are not as common as expected (Kenya Marine MammalNetwork, 2013).
All four dolphin species have high conservation value as their coastal ranges, life history and habits make themvulnerable to human activities and they can also act as indicator species of general human impacts in the coastalmarine environment. Other species of interest include the Common Bottlenose Dolphin (Tursiops truncatus) which isone of the most widespread dolphins, best documented, and most comon in tourism and is recorded from Tanzaniaand Mozambique but not Kenya. The other is Risso’s Dolphin (Grampus griseus) a little known and studied dolphinsaid to occur in all three countries (Berggren and Coles 2009).
2.1.2.7 Coastal Forests Hotspot
The eastern African coastal forests hotspot is listed here by broad taxa and summarised in Table 2.1.2.7.
Plants
There are about 4,050 vascular plant species in the Coastal Forests of Eastern Africa Hotspot and approximately1,750 (43 percent) of the plant species are endemic (see Table 2.1.1.5 above). The hotspot holds at least 28endemic plant genera, most of which are monotypic. About 70% of endemic species and 90% of endemic genera arefound in forest habitats. Furthermore, about 40% of the endemic plant species are found in only a single forest; forexample, the Rondo Forest in southern Tanzania has about 60 endemic species and two endemic genera. Amongthe bestknown plants in the hotspot are the species of African violets (Saintpaulia spp.).
Table 2.1.2.7. Key Features and biodiversity of coastal vegetation habitats in eastern Africa
Ecoregion Location Conservation status:
Species:
East AfricanCoastal
GeographicLocation: East
Critical/Endangered
The 40,000 cultivated varieties of the African violet, whichform the basis of a US$100 million/year house plant trade
43

ForestMosaic(11,200,000ha)
Africa: Kenya,Somalia,Tanzania,Mozambique
globally, are all derived from just 3 species found in coastalTanzanian and Kenyan forests. Also found here are 11species of wild coffee, 8 of which are endemic. The EastAfrican Coastal Forests host more than 633 bird species 11of which are endemic. Among them are the Clarke's weaver(Ploceus golandi), Sokoke scops owl (Otus ireneae), Pembasunbird (Nectarina pemba), Fischer's tauraco (Tauracofishceri), and the Tana River cisticola (Cisticola restrictus).The forests also have their share of mammals including thePemba Island flying fox (Pteropus comorensis), Sokoke dogmongoose (Bdeogale omnivora), Zanzibar red colobus(Piliocolobus kirkii), Tana mangabey (Cercocebus galeritus),and the Zanj elephant shrew (Rhynchocyon petersi). Thisecoregion is home to a variety of primate species including 3endemic and highly threatened monkey species and 2endemic species of bushbabies.
BirdsMore than 633 bird species occur in the hotspot; eleven of these are endemic. Pemba Island, which is one of BirdLifeInternational's Endemic Bird Areas, has four endemic species: the Pemba whiteeye (Zosterops vaughani), Pembagreenpigeon (Treron pembaensis), Pemba sunbird (Nectarinia pembae), and Pemba scopsowl (Otus pembaensis).The Tana River cisticola (Cisticola restrictus) is endemic to the Lower Tana River, and the Malindi pipit (Anthusmelindae) is endemic to the coastal grasslands of Kenya. Most of the other endemics are found in the mainlandcoastal forest of Kenya and Tanzania, including the yellow flycatcher (Erythrocercus holochlorus), Sokoke pipit(Anthus sokokensis, EN), Clarke's weaver (Ploceus golandi, EN), and Mombasa woodpecker (Campetheramombassica). MammalsNearly 200 mammals are found in the Coastal Forests of Eastern Africa hotspot, and 11 of these are endemic,including the Ader's duiker (Cephalophus adersi, EN) from Zanzibar, ArabukoSokoke Forest and BoniDodori Forest,the Pemba flying fox (Pteropus voeltzkowi, VU) restricted to Pemba Island, the Kenyan wattled bat (Glauconycteriskenyacola), the Dar es Salaam pipistrelle (Pipistrellus permixtus), the goldenrumped elephant shrew (Rhynchocyonchrysopygus, EN), occurring in a narrow coastal strip in southeastern Kenya, and a recently described species ofhorseshoe bat (Rhinolophus maendeleo) in the Amboni Caves in Tanga District in Tanzania.
The primates are important flagship species for this hotspot. This relatively tiny hotspot boasts three endemicmonkey species. Found only in small patches of gallery forest along the lower Tana River in Kenya, the Tana Riverred colobus (Procolobus rufomitratus, CR) is represented by only about 1,1001,300 individuals, while the Tana Rivermangabey (Cercocebus galeritus, CR) has been reduced to only about 1,0001,200 individuals. The Zanzibar redcolobus (Procolobus kirkii, EN) has an estimated population of about 1,0001,500 individuals, mainly in Zanzibar'sJozani Forest, but also in a number of village forests. The Zanzibar red colobus is a significant tourist attraction that,historically, was not hunted by the Muslim inhabitants of the Island; however, there have been recent reports thatsuggest it is being hunted by immigrants from the mainland. There are also two endemic species of galagos (out of atotal of four occurring in the hotspot): the Rondo dwarf galago (Galagoides rondoensis) in the southern Tanzanianforests, the Kenya coast galago (G. cocos) from northern Tanzania and into Kenya.
44

The hotspot also still supports considerable populations of threatened large African herbivores, including blackrhinoceros (Diceros bicornis, CR) and savannah elephants (Loxodonta africana, VU), especially in the largerprotected areas and wilderness regions of southern Tanzania and northern Mozambique. There are also populationsof African wild dog (Lycaon pictus, EN).
ReptilesThere are about 250 reptile species in the Coastal Forests of Eastern Africa Hotspot, and more than 50 of these areendemic. The hotspot has one endemic reptile genus, Scolecoseps, which is represented by three species.
AmphibiansThe hotspot also has over 85 amphibian species, six of which are found nowhere else. These endemics include theMafia Island toad (Stephopaedes howelli, EN), Shimba Hills banana frog (Afrixalus sylvaticus, EN), Shimba Hills reedfrog (Hyperolius rubrovermiculatus, EN), and Phrynobatrachus pakenhami (EN), known only from northern Pemba,particularly Ngezi Forest Reserve. One species largely confined to the hotspot is Loveridge's snouted toad(Mertensophryne micranotis), the only member of its genus; this species is remarkable in that it is one of the fewamphibians to breed by internal fertilization, although it still lays eggs, rather than giving birth to live young. Inaddition, a new genus of frog, similar to members of the genus Kassina, has recently been found in the Jozani Foreston Zanzibar and awaits description.
Freshwater FishesNearly 220 fish species live in the fresh waterways of the Coastal Forests of Eastern Africa, and more than 30 of these areendemic. Of the 34 families represented in the hotspot, minnows (family Cyprinidae) are dominant, followed by killifishes(Nothobranchius spp.). Some species of fish have remarkable adaptations to survive in the hotspot's temporary coastal swampsand floodplains. For example, the airbreathing lungfishes Protopterus amphibious and P. annectens can survive in a dormantstate for over a year in cocoons underneath dried mud.
InvertebratesLevels of endemism within some invertebrate groups are significantly higher than among vertebrates. About 80 percent ofmillipedes and 68 percent of molluscs are found nowhere else. The hotspot is also home to a Gondwana relict dragonfly species(Coryphagrion grandis) that has its nearest relatives in Central and Southern America.
2.1.2.8 Other coastal forests and floraDune VegetationThe trees and other flora of the dunes systems in eastern Africa represent some of the most fragile coastal foresttypes. Species incude: Mimusops caffra, Diospyros rotundifolia, Sideroxylon inerme, Euclea natalensis, Eugeniacapensis, Olax spp, Bridellia catharrtica and Brexia madagascariensis among others. Due to the long history ofanthropogenic land use along the coast, much of this landscape today comprises a mosaic of agricultural fields, withgrassy fields and orchards of exotic trees species, such as coconut (Coco nucifera), cashew nut (Anacardiumoccidentale) and mango (Mangifera indica). Behind the dune forests there are grasslands, wooded grassland, swamp forests (in the South of Mozambique) andwoodland. Mozambique has the most extensive coastal dune systems which stretch from Bazaruto to Ponta de Ouroand beyond to Natal (Figure 4), at Mlalazi River (28 0 57’S), (850 km long) characterised by high parabolic dunes andnorth–oriented capes and barrier lakes. These dunes systems attain heights of 120m and are considered to be thehighest vegetal dunes in the world (Massinga & Hatton, 1996). Sand Forests
Sand forests have a poorly developed understorey and are characterised by the presence of the following treespecies: Dialium schlechteri, Afzelia quanzensis, Balamites maughamii (precious), Newtonia hilldebranddtii,Pteleopsis myrtifolia, Drypetes arguta, Hyperacanthus microphyllum?, and Erythrophleum lasianthum (Pereira et al.
45

2001;Van Rensburg et al. 2000). These forests have a distinctive boundary (12 m) of almost bare soil protecting itfrom the effects of annual fires. The Sand Forest rarely burns and fires usually stop at the border, creating a uniqueenvironment (Matthews, 2001). The more open, mixed woodland forest is characterised by common, woody savannaspecies such as Acacia burkei, Albizia veriscolor, Afzelia quanzensis, and Albizia adianthifolia. In addition, it has awelldeveloped grass understorey represented by Aristida, Ponarthria and Perotis species (ibid). The soils arehomogeneous, gray siliceous, aeolian sands, which are highly leached (dystrophic) and relatively acidic (water pH c.6.1) (B. J. van Rensburg et al 2000). Matutuine district in south Mozambique has the unique and rare forest typesknown as Sand Forests or Licuati forest (Chaposa, 2001).
Miombo Woodlands
Miombo woodlands are geographically located in the northern part of the Limpopo River Coastal area and extend tolarge parts of Tanzania. The Miombo woodlands are composed mainly of deciduous woody vegetation whereBrachystagia spp and Strichnos spinosa are often the dominant species. Sometimes they appear in the pure stands.Brachystagia is commonly associated with Julbernadia globiflora, Pterocarpus angolensis (Umbila), Burkea africana,Bridelia micrantha, Cynometra sp., Dalbergia melanoxylon, Swartizia madagascariensis, Millettia stuhlmannii whileStrichnos is usually associated with Combretum spp, Terminalia spp, and Pteleopsis myrtilifolia.
Evergreen forests are also said to occur (Saket 1995) along the coast, principally in Mozambique over theChiringoma hills and include common species such as: Erythrophloeum suaveolens (Missanda), Millettia stuhlmannii(PangaPanga), Pterocarpus angolensis (Umbila). In some restricted locations in Gaza and Inhambane provinces,these forests are composed of Androstschys johnsonii (Mecrusse or Cimbiri).
In summary, all coastal forests are threatened by unregulated and illegal logging, clearing for development, poormanagement and poor understanding of their biodiversity value.
2.2 Social domain
In this section we describe the socioeconomic setting of the coastal areas of the three countries to understand theircontext and trends in order to identify key areas and effective strategies for managing coastal systems under climatechange. First we detail the demographics of coastal populations, their educational standards and levels of poverty toprovide the social setting with particular reference to vulnerable groups. Next we describe the livelihoods anddependence on natural resources of coastal communities.
The three eastern African countries all contain coastal people that are strongly reliant on marine resources for theirlivelihoods, through commercial, artisanal and subsistence use (UNEP 2009). This is exemplified through smallscale fisheries, but increasingly through more commercial extractive use that includes commercial scale fisheries, oiland gas extraction, mariculture and urban development.
2.1 Demographic trends
46

In all three countries coastal populations have been steadily increasing through decreased infant mortality andthrough immigration to the coast from inland due the the perception that the coast offers better livelihoodopportunities.
Mozambique
Mozambique is the third most populous country in Southern Africa, with 23,515,934 people (July 2012 est., CIAWorld Factbook) from 7.7 million in 1960, changing by 213% during the last 50 years. From the past populationcensus surveys, the Mozambique population was: 5,738,911 (1950), 6,603,653 (1960), 8,168,933 (1970), (1980),15,278,334 (1997), and 20,252,223 (2007) (INE 2010). About 70% of the population resides in the rural areas inscattered settlements where provision of basic services such as education, electricity, and clean water is difficult(Gapar et al. 2002). The population density is very low compared to the majority of African countries, recording agradual increase from 9.5 pers./km2 in 1960, to 11.8 in 1970, 15.2 in 1980,20.1 in 1997, 21.9 in 2003 and estimatedat 29.74 in 2010. The civil war and elevated mortality during the time of war as well as emigration which was notcompensated by returns after the Peace resulted in the low population growth rate from 19801997 (INE 1998).
Figure 2.1.1. Trends in population density in Mozambique from 20032012.
The country consists of a central plateau which steps down to extensive coastal plains representing 44% of thecountry, with the remainder made up of plateau (43 %), and Montana regions (13 %) (Barnett, 1996). With a totalpopulation of roughly 23.9 million people, Mozambique is the tenth most populated country in subSaharan Africa,and has a population growth rate estimated at 2.1% between 2010 and 2030 against 2.7 between 1990 and2010(Figure 2.1.2.). The urban population accounted for 38% of the total population in 2010 and the urbanisation rateis estimated to drop to an average of 3.8% annually between 2010 and 2030 compared to 5.8% between 1990 and2010. The life expectancy is 52 years with an average for female estimated at 53 and for men 51 years. Lifeexpectancy at birth has improved from 43 years in 1990 to 50 in 2010.
47

Figure 2.1.2. Mozambique population growth (* 1000 000)
Mozambique is divided into 10 provinces and one capital city with provincial status and has a coastline measuring2,479km (GoM 1999) with 7 coastal provinces. The Mozambican population is mainly concentrated along coastalareas with an estimated 75% of the population living in rural areas (GoM 1999). The population distribution anddensity varies greatly by province from the least densely populated Inhambane (18.5 pers./km2) to the denselypopulated Maputo city (3154.5 pers./km2) (Table 1). Table 2.1.1. Population Distribution by province, sex, households and density along the coast of Mozambique, 2007census survey (INE 2010)
Provinces Surface area (km2) Population Population Density (#/km2)Zambezia 103,478 3,849,455 37.2Nampula 79,010 3,985,613 50.4Cabo Delgado 78,778 1,606,568 20.4Gaza 75,334 1,228,514 16.3Inhambane 68,775 1,271,818 18.5sofala 67,753 1,642,920 24.2Maputo 22,693 1,205,709 53.1Maputo City 347 1,094,628 3154.5Total 15,885,225
At the provincial level, the 1997 and 2007 population increased between by 4651% in Niassa, Tete and Maputoprovinces. Slight increase was recorded in Gaza (9%) and Inhambane (10%), as well as in the city of Maputo (11%).The City of Maputo lost population in favour of the Province of Maputo, mainly because of the new residential areasexpansion of the city of Matola and of the Districts of Boane and Marracuene.From past population trends, in the period 19601970, Maputo Province, Inhambane and Zambézia experienced >2%annual population growth rates, but all three had 12% growth from 19801997 (Gapar et al 2002). In the period19601970, Maputo Province, Inhambane, and Zambézia experienced >2% rates of growth, but all three had 12%growth rates from 19801997. In contrast, Cabo Delgado, Niassa, and Tete, which all had <1% population growthrates from 19601970, had shifted to >2% growth rates by 19801997. The provinces of Cabo Delgado, Niassa andTete were all strongly affected by the war of independence (Gapar et al 2002). Maputo and Nampula recorded thehighest growth rate (5%, 3.4% respectively) in 2007 due to influx of immigrants from other provinces. The Mozambique population is overwhelmingly young with 1997 census survey indicating 44.8% are less than 15year old, 52.3% aged between 15 and 64 years, and only 2.9% are aged 65 years and above (INE 2010). Recent
48

estimates (2011) indicate: 45.9% (male 5,295,776/female 5,245,485) are 014 years old, 51.1% are 1564 years(male 5,550,501/female 6,174,668) and 3% are 65 years old and above (male 313,892/female 368,536) (CIA WorldFactbook, accessed 27th February 2013). Along the coast, Maputo province has the least population of under 15yearolds (40.7%) and the highest population of the economically active persons (55.8%) (Table 2.1.2), largely as a resultof the high influx of people from other provinces.The population pyramid for Mozambique as for Tanzania and Kenya is very triangular (see below). This illustrates apopulation with a high number of young dependants (high birth rates) and a low life expectancy (especially amongthe nation’s poorest) hence few elderly dependants (aged over 65).The working age or economically active constitutenearly half of the population. The uneven geographical distribution of people is also another demographic problem.The demographic structures and distribution from the three countries therefore have direct impact on key sectors ofdevelopment, such as education, health, employment and housing. Gender disparity is also evident in populationdistribution, with more males in urban centres and more females in rural areas (Table 2.1.3) suggesting malemigration to towns.
Table 2.1.2. Population structure by province and age group from 2007 census survey in Mozambique (INE 2007) Provinces
Age group %014 1564 65+
Zambezia Nampula 47.9 49.5 2.7Cabo Delgado 44.6 52.1 5.3Gaza 44.9 49.9 5.2Inhambane 45.2 49.1 5.1sofala 47.2 48.6 4.2Maputo 40.7 55.8 3.5Maputo City
Table 2.1.3. Population by sex, place of residence and province, 1997. Figures are percentages. (Source: INE,1999).
Place of residence, province Total Men Women
Masculinity Index(M/100W) = 100
Total 100.0 100.0 100.0
Urban 28.6 29.5 27.8 97.7
Rural 71.4 70.5 72.2 89.9
Niassa 5.0 5.1 4.9 95.8
Cabo Delgado 8.6 8.7 8.5 93.8
Nampula 19.1 19.8 18.4 99.0
Zambézia 19.3 19.5 19.1 94.1
49

Tete 7.6 7.6 7.6 92.1
Manica 6.5 6.5 6.5 91.6
Sofala 8.5 8.7 8.4 95.1
Inhambane 7.2 6.6 7.8 77.8
Gaza 6.9 6.2 7.6 75.5
Maputo 5.2 5.1 5.2 89.1
Maputo City 6.1 6.3 6.0 96.1
Tanzania
The population distribution in Tanzania is extremely uneven, as indicated by past census surveys where two thirds ofthe population is concentrated in ~25% of the land area (see Table 2.1.1). Dar es Salaam, Tanga and Mtwara havethe highest population along the coast of 2.49 million, 1.64 million and 1.12 million respectively. However, thepopulation density varies from 12/km2 in Lindi and Pemba South to 1,786/km2 in Dar es Salaam (URT 2006a, Table2.1.1). The 1967 census survey reported a population of 12.3 million for Tanzania, which had increased to 34.4million in 2002, 180% increase (URT 2006a). The 2010 projected population was 43 million (NBS 2010). Five coastalregions of mainland Tanzania cover ~5% of the country’s total land area where approximately 25% of the country’spopulation lives (Table 2.1.4; URT 2006a).
Table 2.1.4. Population Distribution by region along the coast of Tanzania (URT 2006a)
Region Area (Km2) PopulationPopulation Density (#/km2) Growth rate (%)
Lindi 66,046 787,624 12 1.4Pwani 32,407 885,017 27 2.4Tanga 26,808 1,636,280 61 1.8Mtwara 16,707 1,124,481 67 1.7Dar es Salaam 1,393 2,487,288 1,786 4.3Unguja South 854 94,234 110 3.1 Pemba North 574 185,326 323 2.1Unguja North 470 136,639 291 2.6Pemba South 332 175,471 12 2.3Urban west 230 390,074 1,696 4.5The national population growth rate is estimated at 1.96% in 2011. All regions except Lindi, Mtwara and Tangarecorded a growth rate higher than the national projected average. The low population growth rate in some regions isdue to high infant mortality rates, low birth rates and high rate of ruralurban emigration to Dar es Salaam city (NBSand CRCO 2007). Dar es Salaam has recorded the highest population growth rate of 4.3% (Table 2.1.4). Tanzania’surban population has been growing at a rapid rate > 5% per annum over the past three decades, caused mainly byruralurban migration, rather than fertility and mortality. The proportion of the population living in urban areasincreased from 5% in 1967 to 13% in 1978; and from 21% in 1988 to 27% in 2002 (NBS and CRCO 2007). Thoughthe population of Tanzania has tripled in the past four decades, the country is still sparsely populated (Table 2.1.4).
50