Site Characterization Report for Building 3506 at Oak Ridre ...
168
ORNL/ER/Sub/87-99053/72 Restoration Program ORNL Environmental Restoration Program Site Characterization Report for Building 3506 at Oak Ridre National laboratory, Oak Rid ge g Texm^S S -s i ° i -is e 5 | ^ 8-g " s •S 5 s c-^Js 5 S f S § G 4V CV fi „ » JS o S S 2 d E S ! r, si g||| &|a".§Sa Js C w U (1 U & o « fl >> « S a a « S 0..2 s c « S g l l g'S o Sr •a: i s« « 1 g 8 | a J 1 1 i Date Issued-July 1994 Mil 23 ai b* S? ** -e e e-s o H I S S * S "5 s •§ g w "g * I - g 8 3 I £ g.s5« «6!b s 5 "8 * 0 8 S.S * a g - - u.g«s l l f i ^ l l g Prepared by a * 1 § t V e : f ° 5 Bechtel National, Inc. « I 5 3 I S 1 rf I i 0ak Tennessee 2 e « >- V f> « o e S 1J. 11 P 1 1 1 1 I I UDder subcontract 12B-99053C .a > a. v « c e _ POSS&gESga c « - Prepared for Oak Ridge, Tennessee 37831-6285 managed by MARTIN MARIETTA ENERGY SYSTEMS, INC. rirtw flin for the wi me U.s. DEPARTMENT OF ENERGY under contract DE-AC05-840R21400 pltlmUTM OF THIS B0CUMENT IS UWUMITFn
-
Upload
khangminh22 -
Category
Documents
-
view
0 -
download
0
Transcript of Site Characterization Report for Building 3506 at Oak Ridre ...

ORNL/ER/Sub/87-99053/72
Restoration Program ORNL Environmental Restoration Program
Site Characterization Report for Building 3506 at Oak Ridre National laboratory, Oak Ridge
g Texm^S
S -s i ° i -is e 5 | ^ 8-g " s
•S 5 s c-^Js 5 S f S § G 4V CV fi „ » JS
o S S 2 d E S ! r ,
s i g | | |
& | a " . § S a J s C w U (1 U & o « fl >> « S a a « S 0..2 s c « S g l l g'S o S r • a : i s « « 1 g 8 | a J 1 1 i Date Issued-July 1994 Mil 23 ai b* S?
** -e e e-s o H I S S * S "5 s •§ g
w "g * I - g 8 3 I £
g . s 5 « « 6 ! b s 5
"8 * 0 8 S.S * a g - - u . g « s l l f i ^ l l g Prepared by a * 1 § t Ve: f ° 5 Bechtel National, Inc. « I 5 3 I S 1 rf I i 0 a k Tennessee 2 e « >- V f> « o e S 1J. 1 1 P 1 1 1 1 I I U D d e r subcontract 12B-99053C .a > a. v « c e _ P O S S & g E S g a c « - Prepared for
Oak Ridge, Tennessee 37831-6285 managed by
MARTIN MARIETTA ENERGY SYSTEMS, INC. rirtw f l i n for the wi me
U.s. DEPARTMENT OF ENERGY under contract DE-AC05-840R21400
pltlmUTM OF THIS B0CUMENT IS UWUMITFn

;/
CONTENTS
FIGURES iv TABLES vi ACRONYMS vii EXECUTIVE SUMMARY viii
1. INTRODUCTION 1-1
2. SITE DESCRIPTION 2-1 2.1 BACKGROUND 2-1 2.2 EAST GALLERY 2-1 2.3 CELL AREA 2-8 2.4 BUILDING EXTERIOR 2-12
3. CHARACTERIZATION METHODS 3-1 3.1 INSPECTIONS 3-1 3.2 SAMPLING AND ANALYSIS 3-1 3.3 RADIOLOGICAL MEASUREMENTS 3-5 3.4 FIELD QUALITY CONTROL 3-6
4. CHEMICAL SAMPLING AND ANALYSIS 4-1 4.1 DATA PRESENTATION 4-1 4.2 DATA USABILITY ASSESSMENT , 4-2 4.3 VOC CONTAMINATION 4-4 4.4 BNAE CONTAMINATION 4-4 4.5 PESTICIDE/PCB CONTAMINATION 4-8 4.6 METALS AND CYANIDE CONTAMINATION 4-9 4.7 ASBESTOS AND LEAD IN PAINT AND SHIELDING 4-13 4.8 HISTORICAL SOIL SAMPLING EXTERIOR TO BUILDING 3506 . . . . 4-14 4.9 SUMMARY 4-19
5. RADIOLOGICAL SAMPLING AND ANALYSIS 5-1 5.1 DATA PRESENTATION 5-1 5.2 DATA USABILITY ASSESSMENT 5-7 5.3 ASL RESULTS 5-7
5.3.1 QC Equipment Rinsate (Sample 03936) 5-7 5.3.2 East Gallery Wall Concrete Core (72.SB002, Sample 03944) 5-7 5.3.3 East Gallery Floor Concrete Core (72.SB001, Sample 03943) 5-8
^ 5.3.4 East Gallery Soil (72.SB001, Sample 03933) 5-8 \ 5.3.5 Cell Wall Concrete Core (72.SB003, Sample 04044) 5-8 \ 5.3.6 Cell Floor Concrete Core (72.SB004, Sample 04045) 5-8
\\ 5.3.7 Cell Area Soil (72.SB004, Sample 03935) 5-9 ! 5.3.8 Cell Area Sediment (72.SD001, Sample 03934) 5-9
5.f HISTORICAL SOIL SAMPLING EXTERIOR TO BUILDING 3506 5-9 5.5'- SUMMARY 5-11
r-166 ii // f

6. RADIOLOGICAL FIELD MEASUREMENTS 6-1 6.1 DATA PRESENTATION 6-1 6.2 DATA USABILITY ASSESSMENT 6-1
6.2.1 Precision 6-1 6.2.2 Accuracy 6-1 6.2.3 Representativeness ; 6-2 6.2.4 Completeness ;> 6-2 6.2.5 Comparability 6-2
6.3 FIELD MEASUREMENTS 6-3 6.3.1 East Gallery 6-3 6.3.2 North/South Cells 6-15
7. WASTE TYPES AND VOLUME ESTIMATES 7-1 7.1 WASTE DISPOSAL TYPES 7-1
7.1.1 Radioactive 7-1 7.1.2 Hazardous 7-2 7.1.3 Mixed 7-2 7.1.4 Sanitary . . 7-3 7.1.5 Summary and Uncertainties .' 7-3
7.2 WASTE DISPOSAL VOLUMES 7-3 7.3 TOTAL CURIE ESTIMATES 7-5
8. SUMMARY AND CONCLUSIONS : . . . . 8-1 8.1 ENGINEERING PLANNING 8-1 8.2 PERSONNEL PROTECTION PLANNING 8-2 8.3 WASTE MANAGEMENT PLANNING 8-2 8.4 CONCLUSIONS 8-4
9. REFERENCES 9-1 c
Appendix A: List of Known Drawings of Building 3506 A-l
Appendix B: ES&H Survey of Building 3506 B-l
Appendix C: Structural Condition Assessment for Decontamination and Decommissioning of Building 3506 . . C-l
Appendix D: Field Investigation Measurement Equipment D-l
Appendix E: Contract-Required Detection Limits for TAL Inorganics and Contract-Required Quantitation Limits for TCL VOCs, SVOCs, and Pesticides/PCBs E-l
Appendix F: Detailed Field Measurement Results F-l -
i i i

FIGURES
1.1 Aerial photograph of Building 3506 and vicinity 1-2
2.1 Building 3506 plan and elevations pocket 2.2 Building 3506 2-2 2.3 East gallery, brick floor area 2-3 , 2.4 Typical east gallery floor drain 2-3 2.5 East gallery, manhole cover 2-3 2.6 Standpipes in east gallery floor 2-3 2.7 East gallery, east wall 2-4
" 2.8 East gallery, south wall 2-4 2.9 Pipe penetrations in gallery/cell wall 2-5 2.10 East gallery ceiling 2-7 2.11 East gallery crawlspace, south end 2-7 2.12 South cell with standing water 2-8 2.13 Cell floor liner and equipment stands 2-8 2.14 South cell filter housing 2-8 2.15 Cell floor core 2-9 2.16 East wall of cell area 2-10 2.17 Damaged concrete hotspot on east wall 2-11 2.18 Cell area south wall composite 2-11 2.19 West wall of cell area 2-12 2.20 Roof of Building 3506 2-12 2.21 Valve pits 2-13 2.22 Miscellaneous equipment west of Building 3506 2-13
3.1 Building 3506 sampling locations 3-2 •v
4.1 WAG 1 soil boring locations near Building 3506 .' 4-15
6.1 East gallery measurement locations 6-6 6.2 East gallery gamma spectroscopy locations .6-9 6.3 East gallery wall concrete core . / 6:10 6.4 East gallery floor concrete core 6-10 6.5 Gamma spectroscopy (HPGe) slit scanning geometry/configuration 6-5.2 6.6 East gallery floor core activity profile (location 72.SB001) 6-13 6.7 East gallery wall core activity profile (location 72.SB002) 6-14, 6.8 Cell area measurement locations 6-2Q;:'> 6.9 Cell area gamma spectroscopy locations . . 6-22^ 6.10 Cell area wall concrete core jh • • 6-24 6.11 Cell area wall core activity profile (location 72.SB003) 6 -25^ 6.12 Cell area floor core activity profile (location 72.SB004) . . . . 6-27 £ 6.13 Cell area TLD string locations 6-28 J. 6.14 Cell area shallow dose profile 6-29 6.15 Cell area deep dose profile 6-30 ^
R-166 iV f p

6.16 Deep vs. shallow cell area dose profile (string 1, N) 6-31 6.17 Deep vs. shallow cell area dose profile (string 2, W) '.' 6-32 6.18 Deep vs. shallow cell area dose profile (string 3, E) 6-33 6.19 Deep vs. shallow cell area dose profile (string 4, S) 6-34
R-166 v

TABLES
3.1 Sampling summary 3-3
4.1 Analytical detects for organic compounds 4-5 4.2 Analytical results for metals and cyanide 4-10 4.3 Chemical sampling summary for WAG 1 soil borings near Building 3506 . . 4-15 4.4 Analytical detects for organic compounds in WAG 1 soil borings 4-16 4.5 Analytical results for metals and cyanide in WAG 1 soil borings 4-17
5.1 Analytical methods 5-2 5.2 Radiological analysis results for the east gallery 5-3 5.3 Radiological analysis results for the cell area 5-5 5.4 Radiological sampling summary for WAG 1 soil borings near Building 3506 . 5-9 5.5 Radionuclide concentrations in WAG 1 soil samples taken near Building 3506 5-10
6.1 Summary results of location-specific measurements in the east gallery 6-4 6.2 Model prediction of average exposure rates in the east gallery 6-7 6.3 Strontium-90 analysis results for east gallery smears 6-8 6.4 Summary results of location-specific measurements in the north/south
cell area 6-16 6.5 Model prediction of average exposure rates in the north/south cell area . . . 6-19 6.6 Average results of location-specific measurements above and below
water mark in the north/south cell area 6-21
7.1 Disposal volume estimates . 7-6 7.2 Total curie content of radionuclides in concrete and sediment 7-7
F.l Location-specific measurement results for the east gallery F-2 F.2 CSL gamma spectroscopy results for east gallery smears F-3 F.3 Slit scanning results for east gallery floor core (location 72.SB001) F-4 F.4 Slit scanning results for east gallery wall core (location 72.SB002) F-5 F.5 Location-specific measurement results for the north portion of the cell F-7 F.6 s Location-specific measurement results for the south portion of the cell F-8
JF.7 CSL gamma spectroscopy results for north cell area smears F-9 F.8 CSL gamma spectroscopy results for south cell area smears F-10 F.9 CSL strontium-90 analysis results for cell area smears F-ll F.10 Slit scanning results for cell area wall core (location 72.SB003) F-12 F . l l Slit scanning results for cell area floor core (location 72.SB004) F-13 F.12 Analytical results for TLD strings in the cell F-16
R-166 vi

ACRONYMS
ALARA as low as reasonably achievable ASL analytical subcontract laboratory BNAE base/neutral/acid-extractable BZA breathing zone apparatus CH contact-handled CLP Contract Laboratory Program CSL Close Support Laboratory D&D decontamination and decommissioning DOE Department of Energy EPA Environmental Protection Agency ES&H environmental, safety, and health FWG field work guide GC/MS gas chromatography/mass spectrometry HPGe high-purity germanium LDR land disposal restriction MDL minimum detection limit ORNL Oak Ridge National Laboratory PAH polynuclear aromatic hydrocarbon PCB polychlorinated biphenyl QC quality control RCRA Resource Conservation and Recovery Act RH remote-handled RI/FS remedial investigation/feasibility study ROI region of interest RPD relative percent difference SLLW solid low-level waste SWSA solid waste storage area TAL Target Analyte List TCL Target Compound List TCLP toxicity characteristic leaching procedure TIC tentatively identified compound TLD thermoluminescent dosimeter TOC total organic carbon TRU transuranic TSCA Toxic Substances Control Act VOC volatile organic compound VLA , very low activity WAC if waste acceptance criteria WAG waste area grouping
R-166 C" vii

EXECUTIVE SUMMARY
BACKGROUND i ^
Building 3506, also known as the Waste Evaporator Facility, is a surplus facility at Oak Ridge National Laboratory (ORNL) slated for decontamination and decommissioning (D&D). The building, located in die'ORNL main plant area to the west of the South Tank Farm and near the intersection of Central Avenue and Third Street, includes a single concrete cell anc*' an operating gallery.
Site characterization activities were conducted in the autumn of 1993 to collect information necessary to plan the D&D of this building. The characterization followed the Site Characterization Planfor Decontamination and Decommissioning of Buildings 3506 and 3515 at Oak Ridge National Laboratory, Oak Ridge, Tennessee, which presents a detailed discussion of the data needs, data uses, and collection methods. This site characterization
, report documents the results of the investigation of Building 3506, presenting data from the field investigation and laboratory analyses in the form of a site description, as-built drawings, summary tables of radiological and chemical contaminant concentrations, and a waste volume estimate.
SUMMARY OF FINDINGS
Building 3506 was partially decontaminated before it was abandoned, and a filter housing and a few pipes and- supports are the only equipment remaining; this will facilitate D&D implementation. The structural,integrity of the building is adequate (i.e., it will remain structurally intact) for safe decontamination or,demolition. The gallery is relatively clean:, with only a few hotspots of contamination. Thy cell area is contaminated, with most of the
- contamination fixed to the surface of the cell walls. 1
The foundation slab of the cell is 4-ft-thick concrete with a,stainless steel liner. The slab consists of at least three distinct layers: a top layer that is 6.'5 in. thick, a middle layer that' is 13 in. thick, and a bottom layer that is 27.5 in. thick. The middle layer appears to be an old floor and exhibits the most radiological contamination. The bottom layer appears to be a base pad or mud mat from construction and is slightly contaminated. Results of concrete cc'e analyses indicate that, with exception of the cell floor slab, most of the measured activity in the cell is within 1 in. of the surface.
' General area measurements and concrete and sediment sample gamma spectroscopy results indicate that the primary gamma emitting isotope present is cesium-137/barium- 137m Other radiological contaminants include strontium-90, cobalt-60, uranium, thorium, and plutonium, although in very small amounts. Comparison of direct measurements and smear results indicates that most of the contamination is fixed.
R-1CG viii

The general area exposure rate (closed window) in the east gallery is < 1 mR/h. The general area exposure rate (closed window) in the cell ranges from 1 mR/h at the north end to 6 mR/h at the south end. Alpha activity is generally higher in the cell than in the east gallery. Alpha activity ranged from 16 to 769 dpm/100 cm2; smear results ranged from 1 to 32 dpm/100 cm2.
Location-specific direct beta/gamma readings ranged from < 1 to 38 mR/h (closed window) and < 1 to 65 mrad/h (open window). One location approximately 7 ft high on the east wall of the south portion of the cell exhibited an exposure rate of 25 mR/h (closed window) and 60 mrad/h (open window) at a distance of approximately 1 in. from the surface.
Concrete rubble will be by far the largest volume of waste generated, with a total of 8000 to 10,000 ft? for complete dismantlement and 3900 ft3 for partial dismantlement. Classification of the concrete waste (contact-handled solid low-level waste versus very-low-activity waste) depends on the D&D techniques used. Waste generated .from demolition of building construction materials (e.g., concrete, soil, or sediment) and packaged in 55-gal drums or low-specific-activity boxes would not be considered fissile or transuranic waste
% * * '
Analyses of the cell sediment and one of the cell wall concrete cores indicated the presence of polychlorinated biphenyls at levels greater than the limit specified by the Toxic Substances ~ Control Acis (TSCA). Radioactively contaminated TSCA hazardous substances will require a waste management strategy distinct from that for "other wastes. Analyses of the cell sediment, the soil under the east gallery, and one of the concrete .cores showed cadmium, chromium, lead, and mercury at levels exceeding toxicity characteristic leaching procedure (TCLP) equivalent limits. TCLP tests will, need to be performed for these particular metals to determine whether they are Resource Conservation and Recovery Act (RCRA) constituents exhibiting the toxicity characteristic. Radioactively contaminated RCRA-hazardous wastes will require a waste management strategy distinct from that for other wastes/The eight lead (shielding) plates attached to the building interior walls are considered low-level radioactive mixed waste. " ~
, R-166

1. INTRODUCTION
Building 3506, also known as the Waste Evaporator Facility, is a surplus facility at Oak Ridge National Laboratory (ORNL) slated for decontamination and decommissioning (D&D). The building is located in the ORNL main plant area, to the west of the South Tank Farm and near the intersection of Central Avenue and Third Street (Fig. 1.1). ORNli coordinates are approximately N22,000 and E30,800. Site characterization activities were conducted in the autumn of 1993 to collect information necessary to plan the D&D of this building. The characterization followed the Site Characterization Plan for Decontamination and Decommissioning of Buildings 3506 and 35 J „• at Oak Ridge National Laboratory, Oak Ridge, Tennessee (Bechtel 1993a). This site characterization report documents the results of the investigation.
The objective of the field investigation was to provide information necessary for
• engineering evaluation and planning of D&D approaches, • planning for protection of D&D workers, and • estimating waste volumes from D&D activities.
The site characterization plan presents a detailed discussion of the data needs, data uses, and collection methods; that information is not repeated in this report. ri
Characterization tasksconsisted of three main activities: inspections, radiological measurements, and radiological and chemical sampling and analysis. Inspection reports document general facility conditions, as-built information, and specialized information such as structural evaluations. Radiological measurements define the quantity and distribution of radioactive contaminants; this information is used to calibrate a dose model of the facility and estimate the total activity, in curies, of each major radioactive isotope. The radiological information from sample analyses is used to refine the radiological model of the facility, and the radionuclide and hazardous chemical analyses are used for waste management planning.
This report presents data from the field investigation and laboratory analyses in the form of a site description, as-built drawings, summary tables of radiological and chemical contaminant concentrations, and a waste volume estimate.
This site characterization was performed under the ORNL Remedial Investigation/ Feasibility Study (RI/FS) Project and made extensive use of the existing programmatic infrastructure. Permanent records of the investigation including logbooks, photographs, laboratory analytical results, and engineering calculations are maintained as RI/FS Project records.
R-166 1-1 I)

Fig. 1.1. Aerial photograph of Building 3506 and vicinity.

2. SITE DESCRIPTION
2.1 BACKGROUND
Building 3506 consists of an operating gallery and a cell area, as shown in Fig. 2.1 (Note: Fig. 2.1 is oversized and is in the pocket at the back of this report). The facility was built in 1949 to house the first liquid waste evaporator at ORNL (Horton 1984). Later it held an experimental radioactive waste incinerator, and drawings dated 1959 show equipment for rare earth separation installed in this facility. The building now consists of only one story, although at one time there had been a penthouse structure for access to the cell area. The building was partially decommissioned some time prior to 1980, and a filter housing and a few pipes are the only remaining equipment. In the early 1980s, the east gallery was used as a dressing room for workers in the tank farm area. Available ORNL drawings document past configurations of the building. Appendix A lists known drawings of this facility; most of these drawings are now obsolete, as the equipment shown on them has been removed. No operational records that would provide contamination history were found. Figure 2.2 presents photographs of the north, south, east, and west elevation views of the building as it appeared in June 1993.
2.2 EAST GALLERY
The east gallery extends 32 ft north to south and 9 ft east to west. The south and east walls are concrete block; there is a door in the south wall and two small windows in the east wall. The west wall (common to the cell area) is reinforced concrete, and numerous pipe penetrations extend to the cell area. The north wall is a wooden stud wall, consisting primarily of two wood doors. All four walls are covered with at least four different layers (and colors) of paint. The floor, approximately 3 ft above grade, is 9-in .-thick reinforced concrete; the ceiling, approximately 7.5 ft above the floor, is 1/2-in.-thick gypsum board; and the roof is 3/4-in. plywood supported by 2- by 6-in. wood joists and covered with stainless steel sheet. Under the gallery is a "crawlspace," shown by the field investigation to be approximately 7.5 ft high.
The gallery floor is painted concrete in good condition; the northwest corner is brick tile, presumably set into the concrete (Fig. 2.3). There are two drains in the floor and a manhole for access to the crawlspace (Figs. 2.4 and 2.5). There are also two short standpipes in the floor: a capped 4-in. pipe extending 8 in. above the floor along the east wall, and a pipe cap sticking out of the floor in the southwest corner (Fig. 2.6). Two sets of concrete stairs are present—one consisting of five steps from ground level at the north door, and the other consisting of two steps up to the south door.
The concrete block walls (east and south) of the gallery shown in Figs. 2.7 and 2.8 are in fair condition for their age, though the mortar is friable and crumbling. Significant discoloration and mold or mildew growth have occurred where water has leaked in via the east wall windows. The only devices mounted on these walls are three electrical boxes and some electrical conduit.
One of the two north wall doors is a personnel door at the bottom of the concrete steps described earlier. The other is a loading-dock size door at floor level (approximately 3 ft above grade). The wall and door frames are wood, and both doors are functional.
2 - 1

Fig. 2.2(a). North side. Fig. 2.2(b). East side.
Fig. 2.2(c). West side. Fi8- 2-2(d>- S o u t h s i d e-
Fig. 2.2. Building 3506.

2-3
Fig. 2.3. East gallery, brick floor area. Fig. 2.4. Topical east gallery floor drain.
Fig. 2.5. East gallery, manhole cover.
Fig. 2.6(a). F'g- 2.6(b). Fig. 2.6. Standpipes in east gallery floor.
SVQJ.9 4609/4769.3 \

2-4
Fig. 2.8. East gallery, south wall.
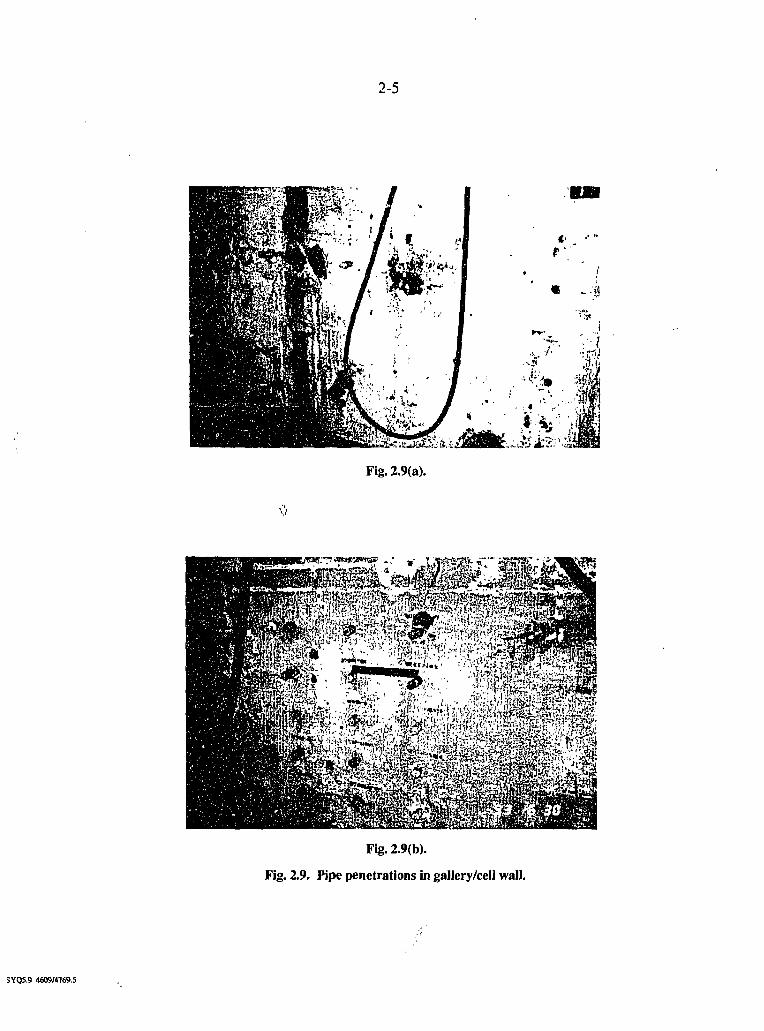
The west wall of the gallery is common to the cell area. It i? poured-in-place reinforced concrete, 3 ft thick at the south end and 2 ft thick at the north end (refer to Fig. 2.1). The wall contains arrays of pipe stubs that penetrate into the cell; all of the pipes were severed and/or capped when the equipment was removed during initial decommissioning (Fig. 2.9). Figure 2.1 shows the wall penetrations as they are currently configured. In addition to the pipe penetrations, a lO-in.-diam hole at floor level extends into the southern cell area. During the characterization, a 4-in. core was extracted from the wall, and that hole also remains open to the cell area. Two small lead plates attached to the wall cover slightly elevated radiological hotspots [see circled area in Fig. 2.9(d) and Appendix B, ES&H Survey]. The wall is in generally good condition, with only minor cracks. During a rainstorm, water was observed to run into the east gallery from the roof, the windows, and the 10-in. penetration from the cell. The dark vertical stain near the south end was observed to be due to rainwater inleakage from the roof (visible in Fig. 2.9(a).
;VQ5.9 4609/4769.4
2-4
Fig. 2.9(b).
Fig. 2.9. Pipe penetrations in gallery/cell wall.
;VQ5.9 4609/4769.5

2-6
Fig. 2.9(d).
IYQ5.9 4609/4769.8

2-4
The ceiling of the gallery is badly deteriorated in spots because of this rainwater inleakage (Fig. 2.10). Sagging and breakage are extensive, and the loosening of gypsum board around the attaching nails has led to loss of anchorage for the ceiling. In an effort to support the ceiling, plywood has been placed under it and attached by nailing into the joists, but in some areas the plywood has also pulled away from the ceiling. Two fluorescent electrical fixtures and assorted electrical conduits are mounted on the ceiling.
Fig. 2.10(a). F'g- 2.10(b). Fig. 2.10. East gallery ceiling.
Miscellaneous materials currently stored in the east gallery include a box of metal and wood parts, two sections of steel pipe, four wood boxes, and a length of rubber hose that extends into the cell area via the 10-in. hole in the wall.
The crawlspace below the east gallery is only accessible via the manhole in the east gallery floor, and that manhole does not include a ladder. Inspection of the crawlspace through the manhole revealed that the walls are poured concrete and the floor is covered with soil (Fig. 2.11). A soil boring hit refusal after just 1.9 ft, indicating that the slab from the cell area may extend under the gallery. The crawlspace is empty except for a number of pipes: pipes extend downward from the two gallery floor drains and from the pipe stub along the east wall of the gallery. Four pipes extend from the cell wall into the crawlspace under the gallery.
Fig. 2.11. East gallery crawlspace, south end.
;VQ5.9 4609/4769.7

2 - 8
2.3 CELL AREA
The Building 3506 cell area held the original liquid waste evaporator and subsequent experiments. Other than a few pipes and pipe/equipment supports, all equipment has been removed and the cell area is essentially a large empty room. The only access is from the roof via the exterior stairs on the west side of the building. No stairs or ladders into the cell exist, and for this investigation an extension ladder was installed from the roof for access. The cell area is currently covered with three large steel panels, and the original removable concrete roof slabs are no longer present. The cell area collects rainwater inleakage and held approximately 16 iii\ of standing water at the beginning of this investigation (Fig. 2.12).
The area can be divided into a north cell and a south cell, separated where the width changes from 10 ft to 8 ft. The total length of the cell area is 23 ft, and the walls are 17.3 ft from the floor to the roof elevation.
The floor of the cell area consists of a 1/8-in.-thick stainless steel liner on a concrete slab; the liner is welded sheet steel that extends approximately 4 in. up the wall and is keyed into the wall concrete. The floor slopes slightly to the south, where there is a small sump and pump with a rubber hose extending into the gallery. A number of carbon steel equipment stands are mounted on the floor (Fig. 2.13). Mounted on the floor in the south cell is a filter housing with a duct that extends through the west wall (Fig. 2.14). Rainwater infiltrating the cell area through gaps between the steel roof plates and the building structure appears to fill to the level of the duct and then overflow to the duct system. The "bathtub ring" created by the standing water is clearly visible in Fig. 2.14.
•tm'&z-iCjiSSSS""
Fig. 2.12. South cell with standing water.
The foundation slab was found to be 47 in. thick and consist of three distinct layers of concrete (Fig. 2.15). The 6.5-in.-thick top layer was poured on top of an old floor; the surface under the top layer is painted with red primer and gray floor paint. The second layer of concrete, 13 in. thick, was apparently an old floor, used before the steel liner was installed. Inspection of
Fig. 2.13. Cell floor liner and equipment stands. Fig. 2.14. South cell filter housing.
IYQ5.9 4609/4769.8

2-9
'' Fig. 2.15(a).
Fig. 2.15(b).
Fig. 2.15. Cell floor core.
5YQ5.9 4609/4769.9

the core sample shows that the concrete in this layer was poorly mixed, with weak, sandy concrete in veins through the layer. The top of the third (bottom) concrete layer has soil on it, which indicates that it is a base pad or concrete backfill poured during construction. This third layer is 27.5 in. thick and appears to rest on bedrock.
The walls of the cell area are reinforced concrete, 2 ft thick in the north cell and 3 ft thick in the south cell (Fig. 2.1). The north wall is free of equipment, but four flanged pipe ends project into the cell. The east wall holds the pipe penetrations from the gallery that were described earlier (Fig. 2.16). Rubber stoppers plug the cell ends of most of the pipes. A length of small-bore steel pipe remains on the east side of the south cell. Two steel I-beam supports extend from the east to the west wall—one near the middle of the cell area and the other at the south end.
Fig. 2.16. East wall of cell area.

An electrical box, incandescent light fixtures, and electrical conduit are present on the east wall. Figure 2.17 shows rough concrete on the south end of the east wall: this area is the most radioactive part of the cell, and the rough concrete may indicate an acid spill. A number of flanged or capped pipe ends and four bundles of instrument lines project from the south wall, and steel I-beam equipment supports are affixed to the south wall (Fig. 2.18). The west wall is bare except for four flanged pipe ends, some electrical fixtures and conduit, a 2-ft length of hose, the filter housing described earlier, and a length of 2-in. stainless pipe around the Filter housing (Fig. 2.19).
( /
The roof of the cell area consists of three welded steel decks, each measuring approximately 9 by 12 ft (see Fig. 2.20).
Fig. 2.17. Damaged concrete hotspot on east wall.
Cell area south wall composite.

2 - 1 2
Fig. 2.19(a). Fig. 2.19(b).
Fig. 2.19. West wall of cell area.
.jitawuH t j r * v, ts^l. a B i l i l rffinifrl*!?i,*,: • ' -
Fig. 2.20(a). Fig. 2.20(b). Fig. 2.20. Roof of Building 3506.
2.4 BUILDING EXTERIOR
The exterior of Building 3506 (see Fig. 2.2) is painted and maintained by ORNL. Important features include the deck and concrete pad to the south, the stairs to the west, and the valve pits to the north (dimensions are shown in Fig. 2.1). The valve pits to the north (shown in Fig. 2.21) were not accessible for characterization without destructive removal of the valve operators and concrete slabs. To the west of the building are some unidentified valves, pipes, and equipment (Fig. 2.22). Also to the west, and within 10 ft of the building, is a utility pole with active power lines. Mounted on the exterior of the south cell wall are five electrical boxes and related conduit and cable (Fig. 2.2d).
Q5.9 4A09/4769.12

2-13
Fig. 2.21. Valve pits.
i> ^asmiBiMmB&msamtim iftxr^tsz jt.-zn-mwt ^ Fig. 2.22(a). Fig. 2.22(b).
Fig. 2.22. Miscellaneous equipment west of Building 3506.
YQ5.!) 4609/4769.13

3. CHARACTERIZATION METHODS
Characterization of Building 3506 involved three techniques analysis, and field radiological measurements.
3.1 INSPECTIONS
No as-built information on Building 3506 was found when drawings and literature were searched, and it was known that the building had been partially decommissioned some time before the early 1980s. Inspections were done to reconcile as-built dimensions against building design drawings and to provide records for future D&D planning.
Photography was the primary method of documenting conditions in and around the building. Photographs provide a permanent record of the condition of the facility on the date of the inspection, and comparison of photographs with available drawings verifies as-built information and documents previous decommissioning activities. All photographs were recorded in a logbook, with time, date, photographer, and subject as minimum recorded information. A fully automatic 35mm camera was used so that the best possible images would be obtained regardless of the skill of the photographer. Complete albums of the photographs, along with negatives, are maintained as permanent ORNL RI/FS Project records.
As-built dimensions measured in the field with a steel tape to verify design drawings were recorded in field logbooks. Concrete core samples taken from walls and floors provided as-built thicknesses of the poured concrete.
A structural engineer inspected Building 3506; the evaluation of the structure with respect to potential decommissioning is presented in Appendix C. An industrial hygienist inspected the east gallery for asbestos and lead paint, and those findings are included in Sect. .4.(
—inspections, sampling and
3.2 SAMPLING AND ANALYSIS
The objectives of sampling were to identify radioisotopes present, including certain transuranic isotopes; determine depth of radionuclide penetration into concrete surfaces; and screen for the presence of hazardous chemicals. Samples consisted of concrete cores, subfoundation soil samples, and a sediment sample from the cell area. Because of the small size of this facility and the high cost of laboratory analyses, sampling activities were limited to just a few in each room or ceil. Figure 3.1 shows sampling locations, and Table 3.1 summarizes the samples collected and analyses performed. Laboratory analyses included a full suite of hazardous chemicals and radionuclides; results are presented in Sects. 4 and 5.
Concrete core samples were obtained using a 4-in.-diam diamond core drill. The core samples were analyzed by slit-scanning with a high-purity germanium (HPGe) gamma spectroscopy system to determine radionuclide penetration into concrete surfaces. Slit-scanning involves shielding the detector so that only a 1/4-in. slice of the core is measured
R-166 3-1

32.0' 3-2
.-MANHOLE pact r < COVER L A b 1
vJ GALLERY FLOOR DRAIH 13.4'
72.SB002-
72-SBOOJb
;i72.SB00la / — FLOOR 11,75' S DRAIN
IT
m-O-
• \ 'c
7 2 . 5 8 0 0 4 - ^ t \ 1 1
7 2 . 5 8 0 0 4 - ^ VIO'A HOLE
SOUTH [] 10.67' |
VIO'A HOLE
SOUTH [] 11.33"
VIO'A HOLE
SOUTH []
CELL
28.0'
BUILDING 3506 PLAN
BLDG SECTION A
NOTE : For 72.S600I, location (a) is the soil sanpling location and location lb) is the concrete core s a p l i n g location. A core was drilled at location la) but i t fe l l into the crawl space end was not retrieved.
Fig. 3.1. Building 3506 sampling locations.

Table 3.1. Sampling summary
Chemical Analysis
Location No."
Sample No.
Sample Type Sample Description
TCL VOCs
TCL BNAEs
TCL Pest./ PCBs
TAL Metals
TAL Cyanide
Radiological Analysis
72.SB001 03936 QC / equipment rinsate (unfiltered)
Prior to using the core drill in Building 3506, but after using the drill in sampling team practice sessions, organic-free water was pumped through the core drill system (i.e., from the poly-bottle sprayer, through plastic/rubber hoses, into the drill head, and through the core barrel).
X X X X X
03943 Concrete core
8.5-in. core (aggregate with rebar) taken from the gallery floor.
X X X X X
03933 Soil Hand-augered composite soil sample taken below gallery concrete floor and crawlspace. Depth for the sample was 8.25 to 10.1 ft from top of floor. (Exception: the VOC container was taken from 8.5 ft and the pesticide/PCBs container was taken from 9.9 ft.) Refusal at 10.1 ft may have been due to concrete surface. Percent solids is 78.9.
X X X X X X
03960 Trip blank! water
Submitted with sample 03933 X
72.SB002 03944 Concrete core
Horizontally drilled core from west wall of gallery into cell; core length is 1.98 ft.
X X X X X
04237 Concrete chips
Chips collected with hammer and chisel from west wall of gallery around core hole.
X X
72.SB003 04044 Concrete core
Horizontally drilled core from east wall of cell into crawlspace beneath gallery floor; core was drilled above the "bathtub ring," which is approximately 17 in. above ihe cell floor. Core length is 2 ft.
X X X X X

Table 3.1 (continued)
Chemical Analysis
Location No."
Sample No.
Sample Type Sample Description
TCL VOCs
TCL BNAEs
TCL PestJ PCBs
TAL Metals
TAL Cyanide
Radiological Analysis
72.SB004 04045 Concrete core
Composite core from cell floor using core intervals of 0 to 6.5 in., 10.5 to 19.5 in., and 19.5 to 24 in.
X X X X X
Concrete core
Relatively "hot" core interval from 6.5 to 10.5 in. X X X X X
Concrete core
Core interval of 24 to 47 in. archived; no analyses performed.
03935 Soil Auger refusal on bedrock limestone after drilling 0.2 ft (depth from 4 to 4.2 ft below floor grade). No chemical analyses performed because of insufficient sample volume.
X
72.SD001 03934 Grab sample/ sediment
Sample for VOC containers grabbed from northeast comer of cell; sample for other containers is composite mix of detritus covering entire stainless-steel-lined cell floor. Percent solids is 43.5.
X X X X X X
04047 Trip blank/ water
Submitted with sample 03934. X
" Locations are shown in Fig. 3.1.
Note: TCL—Target Compound List TAL—Target Analyte List VOC—Volatile organic compound BNAE—Base/neutral/acid-extractable PCB—Polychlorinated biphenyl QC—Quality control

3-5
at any one time. Each 1/4-in. increment down the length of the core is measured to develop a contamination profile.
Soil samples were collected from under the gallery and cell areas by hand-augering in the core holes in the floor slabs. A composite sediment sample was also collected from the floor of the cell area.
3.3 RADIOLOGICAL MEASUREMENTS
Field measurements of the radiological conditions in Building 3506, which are of primary importance, can be divided into "general area" and "location-specific." General area measurements included exposure rate surveys, directional gamma measurements, thermoluminescent dosimeter (TLD) strings, and gamma spectroscopy. Exposure rate surveys provide the general area exposure rates needed for ALARA (as low as reasonably achievable) planning and D&D task sequencing. Directional gamma measurements and TLD strings provide radiation profiles for modeling radiological sources within the building. Gamma spectroscopy provides identification, distribution, and concentrations of isotopes for radiological modeling and waste management planning.
Location-specific measurements (field counts and smears to quantify loose contamination) were done on potentially contaminated structural surfaces within the building. A protocol was developed to help ensure quantitative results under field conditions. First, calibrated field instruments were source- and background-checked before each day's use. Second, measurements at each selected location were as follows:
• Using a 10-cm X 10-cm square template, the location was outlined and numbered.
• Using a 0.68-cm standoff spacer, an alpha measurement consisting of three integrated counts was conducted.
• Using a 10-cm standoff spacer, a beta/gamma (open window) measurement consisting of three integrated counts was conducted.
• Using a 10-cm standoff spacer, a gamma (closed window) measurement consisting of three integrated counts was conducted.
• A smear sample was collected inside the 10-cm x 10-cm outline.
• The location was photographed.
Third, the field instruments were source- and background-checked at the end of each day's use. Primary instruments for these measurements were the Eberline HP-270 beta/gamma
R-1C6

3-6
Geiger-Mueller detector and the Eberline AC-3 alpha scintillation detector, both with the Eberline ESP-2 counter/ratemeter.
The smear samples were analyzed! for gross beta/gamma, gross alpha, and gamma isotopes (spectroscopy); strontium-90 analysis was conducted if gross beta levels exceeded 500 cpm and could not be accounted for by gamma spectroscopy results.
The site characterization plan (Bechtel 1993a) includes detailed descriptions of the instruments and methods used for radiological measurements of Building 3506. Appendix D lists the instruments used in this investigation. Results of field radiological measurements are presented in Sect. 6.
3.4 FIELD QUALITY CONTROL
Field quality control (QC) was ensured by adherence to approved plans, procedures, and field work guides (FWGs). These documents include requirements for training, record keeping, field QC checks, and personnel responsibilities. The FWGs detail proper measurement and sampling sequences.
Several QC oversight surveillances were conducted with checklists developed from approved ORNL RI/FS Project FWGs and other applicable procedures to ensure that activities were performed in accordance with appropriate requirements. These QC surveillances covered activities such as
• availability of work-controlling documents (project procedures and FWGs) for the work team at the site;
• deployment of required equipment and supplies;
• review of training records;
• initial entry for health and safety monitoring activities;
• use of appropriate personal protective equipment;
• access to the building in prescribed sequence based on results of the initial health and safety monitoring;
• systematic survey of the areas;
• selecting and marking of the measurement locations;
• methods of obtaining samples;
R-166

3-7
• radiological measurements;
• entry of measurement results and other information into field logbooks:
• photography of the building, remaining equipment, access points, and selected sample locations; and
• taking, marking, and handling of the concrete core and soil samples.
These surveillances resulted in no adverse findings or corrective action requests.
R-166

4. CHEMICAL SAMPLING AND ANALYSIS
This section tabulates and describes the chemical findings from D&D characterization sampling activities. In addition to the required QC samples, one equipment (core drill) rinsate, six concrete samples, one soil sample, one sediment sample, a paint sample (for lead content), and three samples of miscellaneous building materials (for asbestos content) were collected.
No known chemical characterization studies of Building 3506 had been performed before the 1993 field effort, and historical chemical data for the building itself probably do not exist. However, there are historical chemical data for some of the soils surrounding the building; at the end of this section is a tabulation and summary of chemical findings for soil samples taken near Building 3506 during Phase I of the remedial investigation of Waste Area Grouping (WAG) 1.
4.1 DATA PRESENTATION
Chemical data for liquid samples (e.g., rinsate or water blanks) are presented in units of micrograms of analyte per liter of liquid (/ig/L); one microgram per liter is approximately equivalent to one part per billion (ppb). Chemical data for solid samples (e.g., soil, concrete, or sediment) are presented in units of milligrams of analyte per kilogram of solid (mg/kg) on a dry weight basis; one milligram per kilogram is equivalent to one part per million (ppm).
For organics, only those analytes detected (i.e., "hits") are reported in this section. For inorganic analytes (i.e., metals and cyanide), all data are reported. When an inorganic analyte concentration is reported as a "less than" ( < ) value (e.g., <20 mg/kg), this indicates that it was not detected at or above its detection limit (in this case, 20 mg/kg).
The analytical data presented here for the regular samples have been qualified by the project as part of the validation process. The qualifiers applicable to this report are defined as follows.
• J: The associated numerical value is an estimated quantity. For organic compounds, the qualifier means the compound was detected at a value less than the quantitation limit.
• NJ: Presumptive evidence for the analyte exists (tentative identification) at an estimated quantity.
• R: Values are unusable; resampling and/or reanalysis is necessary for verification.
In the discussion that follows for the organic compounds, the notation "TIC" (tentatively identified compound) means that the compound has been identified solely by its mass spectrum in a machine search of spectra contained in a computer's library. The quantitation is based on the response factor of the nearest internal standard present in the chromatogram.
R-166 4-1

3-2
Because of the nature of the quantitation procedure, all nonrejected values reported are. by definition, approximate concentrations and bear the NJ qualifier. Parentheses in the organic analytical data tables indicate the number of TICs.
Chemical analyses [Environmental Protection Agency (EPA)] analytical support level IV include both Target Compound List (TCL) and Target Analyte List (TAL) analyses. Appendix E lists die individual TCL organic and TAL inorganic analytes, as well as their respective contract-required detection/quantitation limits as referenced in EPA's Statements of Work (EPA 1991a,b). Organic TICs are not specifically on the TCL but were reported by the laboratory if detected during the organic analyses.
As described in Sect. 3, the concrete cores were slit-scanned soon after they were collected. After slit-scanning, each core was broken up into 2-in. fragments, placed in a capped stainless steel tube, and sent to an analytical subcontract laboratory (ASL). The laboratory crushed and homogenized the concrete and then distributed the sample among containers for various designated analyses.
In addition to the samples collected by the Bechtel Team, Energy Systems Industrial Hygiene personnel collected and analyzed paint samples (for lead content) and building material samples (for asbestos content). Energy Systems also took a sample of the standing water in the Building 3506 cell for radiological waste processing analysis before pumping the water out; this water sample was not submitted for chemical analyses.
4.2 DATA USABILITY ASSESSMENT
Documentation provided by the laboratories for the chemical analyses met RI/FS QC level III requirements, as stated in the Technical Specification for Analytical Services (Bechtel 1993b). (Note: this QC Ievel refers to reporting requirements for analytical laboratory services and is not to tip confused with EPA analytical support levels.) QC level III mandates that QC data, including raw data (e.g., calibration and control data), be reported in a Contract Laboratory Program (CLP), or "CLP-like," data package.
Data validation of the packages met RI/FS QC level II requirements; the chemical data were reviewed in accordance with EPA CLP data validation procedures for organic data (EPA 1990) and inorganic data (EPA 1988), but the raw data were not checked by the validator to the same degree that they would have been checked in a QC level III protocol. QC level II validation was judged sufficient for this investigation.
The preparation and quantitative measurements of samples for organic compounds followed CLP methodology (EPA 1991a). Volatile organic compounds (VOCsj were determined using the CLP method for volatiles in water and solids by purge-and-trap gas chromatography/mass spectrometry (GC/MS). Analysis for base/neutral/acid-extractable constituents (BNAEs) consisted of extraction using methylene chloride, followed by GC-MS analysis.
R-l«6

If
4-3
Pesticides/polychlorinated biphenyls (PCBs) were prepared using sonication extraction and then measured using a capillary column GC method with an electron capture detector.
The analytical method for inorganics followed the CLP Statement of Work (EPA 1991b). In accordance with EPA's CLP protocol, arsenic, lead, selenium, and thallium were analyzed using atomic absorption (furnace technique); mercury was analyzed using the cold vapor technique (a.flameless atomic absorption procedure); cyanide was analyzed using a semiautomated spectrophotometric technique; and the remaining metals were analyzed by inductively coupled plasma atomic emission spectroscopy.
Difficulties with the TCL organics analyses occurred because of severe matrix effects, particularly for the concrete core samples. Some of the BNAE and PCB analyses were rejected (and some of the rejected samples were subsequently reanalyzed) because the concrete matrix negatively affected surrogate recoveries, matrix spike recoveries, and internal standard area counts.
Uncertainties in the TAL inorganics data include the following.
• One cyanide result (sample 03944) was rejected because the, holding time was exceeded by 15 days. The rejected result was a "nondetect."
• Blank analysis results are assessed to determine the existence and magnitude of contamination problems. Contaminants were found in some individual blanks; however, these appear to be isolated occurrences not affecting other data. Sample results greater than the detection limits but less than 5 times the amount in any blank were qualified as nondetects (U).
• The inductively coupled plasma interference check samples verily the laboratory's interelement and background correction factors. Interference check samples at the TMA laboratory often had positive detects for sodium and negative results for antimony; therefore, corresponding sodium detects may be biased high and antimony results may be biased low.
• Antimony results for samples 04044 and 04045 were rejected because of negative results • in the preparation blank and the interference check source. The rejected results were
nondetects.
• The matrix spike sample analysis provides information about the effect of each sample matrix on the digestion and measurement methodology. Analytes in solid samples most often found with percent recoveries less than the acceptable limits (of 80 to 120%) included antimony, arsenic, thallium, and selenium. Therefore, these spike recoveries indicate a negative bias and associated sample results were qualified as estimates (J).
For sample 03934, TCL organics and TAL inorganics analyses were performed at the IT Laboratory in St. Louis, Missouri. For the other samples, TCL organics analyses were
R-166

3-4
performed at the TMA Laboratory in Monravia, California, and TAL inorganics were analyzed at the TMA/Skinner and Sherman Laboratory in Waltham, Massachusetts.
The following subsections discuss the nonradiological chemicals detected, organized by contaminant groupings: VOCs, BNAEs, pesticides/PCBs, metals and cyanide, and asbestos and lead (in paint and shielding materials). Only summary tables of chemical findings are presented; complete analytical data packages are available as part of the ORNL RI/FS Project permanent records.
4.3 VOC CONTAMINATION
Table 4.1 lists the VOCs and VOC TICs detected in the chemical samples. TCL VOC analyses were performed for the soil sample from under the gallery (sample 03933) and the sediment sample from the cell floor (sample 03934; the VOC container was filled with sediment from the northeast corner of the cell floor, whereas the other analyte containers were filled with a composite of the sediment from the entire floor). TCL VOC analyses were not performed on the concrete samples because of (1) the impJausibility of significant quantities of VOCs remaining in concrete over years of non-use of the facility, or (2) the possibility of prematurely liberating the VOCs during drilling and core fragmentation prior to shipment.
No VOCs or VOC TICs were detected in the soil sample. Acetone was detected in the sediment sample at a concentration of 0.09 J mg/kg. Although acetone is a common laboratory contaminant, it was not detected in the method blank or the trip blank (sample 04047) associated with the sediment sample. One unknown VOC TIC was also detected in the sediment sample at a concentration of 0.019 NJ mg/kg.
4.4 BNAE CONTAMINATION
Table 4.1 lists the BNAEs and BNAE TICs detected; the BNAEs detected are not listed as RCRA toxicity characteristic contaminants (40 CFR 261.24).
The core drill rinsate sample (03936) was found to contain minor quantities of common plasticizers [3 J fig/L of di-n-butyl phthalate and 4 J jig/L of bis(2-ethylhexyl)phthalate] and BNAE TICs (three unknown hydrocarbons with a summed concentration of 12 NJ (ig/L). These contaminants are not unexpected given that the organic-free water was used to rinse rubber/plastic hoses and the water channels in the core drill.
The sediment sample (03934), composited from detritus on the cell floor, contained 1 phthalate and 16 other BNAEs consisting primarily of polynuclear aromatic hydrocarbons (PAHs), other polycyclic hydrocarbons, and benzene derivatives. The primary industrial sources of these types of compour.:' 'ire the high-temperature distillate fractions from coal tar and petroleum; examples inclu ;; heavy lubricating oils, asphalt or petroleum coke, and

Table 4.1. Analytical detects for organic compounds
Location ID 72.SB001
(East Gallery Floor) 72.SB002
(East Gallery Wall) 72.SB003
(Cell Wall) 72.SB004
(Cell Floor) 72.SD001
(Cell Floor)
Sample ID 03936 03943 03933 03944" 04237 04044 04045,
Composite'' 04045, Hot
Interval0 03934''
Sample Type QC/Equip. Rinsate Concrete Core Soil Concrete
Core Concrete
Chips Concrete
Core Concrete
Core Concrete
Core Misc.
Sediment
Units Pg/L mg/kg mg/kg mg/kg mg/kg mg/kg mg/kg mg/kg mg/kg
VOCs
Acetone NA NA NA NA NA NA NA 0.09 J
VOC TICs (No. of TICs)'
Unknown NA NA NA NA NA NA NA 0.019 NJ(1)
BNAEs
Acenaphthene 0.96 J
Anthracene 1.9 J
Benzo(a)pyrene 5.7 J
Benzo(g,h,i)perylene 1.1 J
Benzo(k)fluoranthene • • 46 J
Carbazole 2 J
Chrysene 19 J
Dibenz(a,h)anthracene 1.5 J
Dibenzofuran 0.51 J
FluoTanthene 27 J
Fluorene 0.85 J
Indeno(l ,2,3-cd)pyrene 9.6 J
•tt I

Table 4.1 (continued)
Location ID 72.SB001 (East Gallery Floor)
72.SB002 (East Gallery Wall)
72.SB003 (Cell Wall)
72.SB004 (Cell Floor)
72.SD001 (Cell Floor)
Sample ID 03936 03943 03933 03944" 04237 04044 04045,
Composite6 04045, Hot
Interval0 03934"
Sample Type QC/Equip. Rinsate Concrete Core Soil Concrete
Core Concrete
Chips Concrete
Core Concrete
Core Concrete
Core Misc.
Sediment Units mg/kg mg/kg mg/kg mg/kg mg/kg mg/kg mg/kg mg/kg
2-Methylnaphthalene 0.089 J 0.27 J Naphthalene 0.053 J 0.42 J Phenanthrene 0.24 J 17 J
Pyrene 22 J Dimethyl phthalate 0.055 J
Di-n-butylphthalate 3 J
Bis(2-ethylhexyl)phtha1ate 4 J 0.24 J 2.1 J BNAE TICs (No. ofTICs)'
Dimethyl phenanthrene isomer 0.37 NJ(1)
Hexanedioic acid ester 5.1 NJ(1) 4-Hydroxy-4-methyl-2-pentanone 530 R(ty 2,900 NJ(1) 2,900 NJ(I) 2,500 NJ(1)
Methyl phenanthrene isomer 0.68 NJ(2)
Oxygenated hydrocarbon xX 3.5 NJ(1)
Substituted benzene 0.44 NJ(1)
Unknown 0.81 NJ(1)
Unknown alcohol 0.82 NJ(l) 62 NJ(1) 39 NJ(I)
Unknown alkane 1.12 NJ(3) I NJ(I) 2.5 NJ(1) 2.7 NJ(2)
Unknown a/kene - - io6 R(2 y 70.6 NJ(2) 3.1 NJ(1)
I o\

Table 4.1 (continued)
Location ID 72.SB001 (East Gallery Floor)
72.SB002 (East Gallery Wall)
72.SB003 (Cell Wall)
7Z.SB004 (Cell Floor)
72.SD001 (Cell Floor)
Sample ID 03936 03943 03933 03944" 04237 04044 04045, Composite1"
04045, Hot Interval 03934'
Sample Type QC/Equip. Rinsate Concrete Core Soil Concrete
Core Concrete
Chips Concrete
Core Concrete
Core Concrete
Core Misc.
Sediment
Units mg/kg mg/kg mg/kg mg/kg mg/kg mg/kg mg/kg mg/kg
Unknown carboxylic acid ester 1.1 NJ(1) 3.2 NJ(1)
Unknown cycloalkene 57 NJ(1) 4.8 NJ(1)
Unknown hydrocarbons 12 NJ(3) 1,736.3 R(17/ 6.192 NJ(6) 12,637.1 NJ(ll) 0.75 NJ(2) 379.4 NJ(13) 337.2 NJ(12) 392.89
NJ(15)
Unknown ketone 0.88 NJ(I) 127.4 NJ(3) 131 NJ(2) 131 NJ(2)
Unknown PCB 26.1 NJ(6) 1.46 NJ(4) 29.1 NJ(18)
Xylene isomer 3.25 NJ(2)
Pesticides/PCBs
Aroclor-1254 0.37 •
25 R« 1.7 J 0.11 J 0.34 J 0.66 J 410
Aroclor-1260 0.11 0.011 31 R' 2.6 J 0.13/ 0.57 J 1.14 J
Heptachlor 4.7 J
" Sample 03944 was reanalyzed for BNAEs because the surrogates were diluted out of the first sample. The BNAE results are for the reanalyzed sample. 6 Composite core from cell floor using intervals of 0 to 6.5 in., 10.5 to 19.5 in., and 19.5 to 24 in. r "Hot" core interval from 6.5 to 10.5 in. d Sample 03934 was reanalyzed for BNAEs because the sample was spiked with the matrix spike instead of the surrogate. The BNAE results are for the reanalyzed sample, even though it is outside the holding times. ' The result is the sum of the TICs. The number of TICs is shown in parentheses. f BNAE values rejected due to the severe matrix effect; most of the surrogates and all of the spike recoveries were outside the required limits. ' PCB values rejected because all surrogates for the original run and dilution were diluted out.
Note: no organic analysis was performed for sample 03935 (soil sample from 72.SB004) due to the limited sample size.
Note: "NA" indicates that analyses were not conducted; a blank space indicates that the analyte was not detected.
-t* i -J

6-8
wood preservatives. Concentrations of individual BNAEs ranged from 0.27 J to 46 J mg/kg; the sum of the 17 BNAE concentrations is approximately 158 J mg/kg. All results for the detected BNAEs were assigned J qualifiers because the sample holding time was exceeded. Nineteen BNAE TICs were also identified in the sediment sample: 1 unknown TIC at 0.81 NJ mg/kg, and 18 unknown PCBs at a summed concentration of 29.1 NJ mg/kg.
BNAE analysis of the concrete chip sample (04237) revealed minor amounts of three PAHs at a summed concentration of 0.382 J mg/kg and two phthalates at a summed concentration of 0.295 J mg/kg. Eighteen BNAE TICs were also found in the sample at a summed concentration of 17.25 NJ mg/kg.
No BNAEs were detected above the quantitation limits of 0.41 to 1.6 mg/kg for samples 03933 (soil) and 03943 (concrete core), or above the quantitation limits of 3.4 to 8.4 mg/kg for the other four concrete cores.
Seventeen to 21 TICs were found in each concrete core extracted from Building 3506, and the total concentration of TICs for each sample ranged from approximately 3030 NJ to 12,790 NJ mg/kg. The data from sample 03943, though rejected (assigned the R flag), are included in Table 4.1. The values were rejected in accordance with established validation protocol because most of the surrogates and all of the spike recoveries for the sample were outside the required limits. Although the laboratory results indicate the likely presence of BNAE TICs in the sample, the TIC identification and quantification have no validity .-/
The BNAE and BNAE TIC contamination characteristics (e.g., number, name, and concentration of analytes) for the concrete cores are somewhat consistent between cores but are significantly different from those found in soil, sediment, and concrete chip samples. Although the origin of the TICs is unknown, the similarities in BNAE and BNAE TIC contamination between core-drilled samples lend credence to the hypothesis that some of the TICs possibly originated from core drill grease or lubricants liberated and transported during wet drilling operations.
Sample 03933, the soil sample from beneath the gallery floor, contains fewer TICs than the concrete cores (8 versus 17 to 21) at summed quantities 3 orders of magnitude less than those found in the concrete cores (8 NJ mg/kg versus 3030 NJ to 12,790 NJ mg/kg). Indeed, the soil sample and its associated method blank each contain roughly the same quantity and number of BNAE TICs, indicating that the contamination may have been due to carryover from previous analyses.
4.5 PESTICIDE/PCB CONTAMINATION
Table 4.1 lists the concentrations of the single pesticide/insecticide and two PCBs detected in the chemical samples.
• Heptachlor was detected in only one sample, the core drill rinsate, at a concentration of 4.7 J pg/L (0.0047 J ppm).
R-166

4-9
• Aroclor-1260, a PCB, was detected in the soil sample (03933) at a concentration of 0.011 mg/kg (ppm).
• Aroclors were found in concrete core sample 03944 at a summed concentration of 56 R mg/kg (ppm); this value was rejected during data validation because all surrogates for this sample were diluted out (i.e., the surrogates were undetected since the sample was diluted by a factor of 500). Aroclors were detected in the other concrete cores in summed concentrations of 0.24 J to 1.8 J mg/kg (ppm).
• Both Aroclor-1254 and Aroclor-1260 were detected in the concrete chip sample (04237) at a summed concentration of 4.3 J mg/kg (ppm). Since these chips were collected from the gallery side of location 72.SB002, and since these concentrations of PCBs were less than those found for the 72.SB002 core composite [56 R mg/kg (ppm)], it may be hypothesized that most of the PCB contamination for that location is on the cell side of the core.
« Aroclor-1254 was found in the cell sediment sample (03934) at 410 mg/kg (ppm)—the highest PCB concentration detected at Building 3506.
The Toxic Substances Control Act (TSCA) regulations in 40 CFR 700 contain storage, disposal, and cleanup requirements for materials contaminated with PCBs (Etnier et al. 1993}. 'These regulations require that debris containing PCB concentrations greater than 50 ppm (4Q CFR 761.60) be incinerated (40 CFR 761.70) or stored in a chemical waste landfill (40 CFiR 761.75). Energy Systems policy (ESS-EP-125, Rev. 1) states that waste soil, concrete, aad other debris contaminated to levels under 50 ppm should be disposed of by incineration cr burial in a chemical waste landfill, or through an approved alternative method of disposal; however* with appropriate approvals, on-site burial is allowed for debris, soil, or concrete with an average concentration of less than 25 ppm.
4.6 METALS AND CYANIDE CONTAMINATION
Metals occur naturally in soil and are therefore an integral component of structural materials such as concrete that are comprised of soil-related minerals. Table 4.2 lists the TAL metal and cyanide concentrations detected and, for comparison, the RCRA toxicity characteristic equivalent limits for solids.
Under the Resource Conservation and Recovery Act (RCRA), a solid waste is classified as hazardous if it exhibits any of the following characteristics: (1) ignitability, (2) reactivity, (3) corrosivity, or (4) toxicity. As described in 40 CFR 261.24, toxicity is generally determined by using an extraction procedure [e.g., the toxicity characteristic leaching procedure (TCLP)] with a 4.8-5.2 pH acetic acid solution to mimic sanitary landfill conditions. If the sample extract from the TCLP test contains toxic contaminants at concentrations greater than EPA's specified maximums for those contaminants, then the waste
R-IM

Table 4.2. Analytical results for metals and cyanide
Location ID 72.SB001
(East Gallery Floor)
72.SB002 (East Gallery
Wall) 72.SB003
(Cell Wall) 72. SB 004
(Cell Floor)
72.SD001 (Cell
Floor)
Sample ID 03936 03943 03933 03944 04044 04045°,
Composite 04045'', Hot
Interval 03934 RCRA Toxicity Characteristic
Equivalent Limits for Solids' Sample Type
QC/Equip. Rinsate
Concrete Core Soil
Concrete Core
Concrete Core
Concrete Core
Concrete Core
Misc. Sediment
RCRA Toxicity Characteristic
Equivalent Limits for Solids'
Units /ig/L mg/kg mg/kg mg/kg mg/kg mg/kg mg/kg mg/kg mg/kg
RCRA Metals
Arsenic <1.3 2.6 J 1.1 J 3.0 J 2.5 J 2.6 J 2.9 J 21.5 J 100
Barium <2.6 21.4 52.4 19.3 722 26.9 22.5 120 2,000
Cadmium <1.3 4.1 <0.25 5.1 180 J 5.8 J 3.6 J 60. t 20
Chromium 3.3 8.3 17.5 8.2 196 13.1 13.2 100
Lead <2.5 7.2 17.1 4.7 2.7 7.1 6.0 87&J 100
Mercury <0.2 <0.14 45.9 <0.09 0.34 0.05 0.07 ' % |8.7 4
Selenium <3.1 <2.7 <0.66 <2.4 <0.65 <3.2 <0.64 0.87 J 20
Silver <2.6 <0.74 1.4 J <0.69 <26 <0.73 <0.78 <1.9 100
Other TAL Metals •
Aluminum 174 4,080 9,590 4,820 147,000 4,540 4,570 9,530 "^T-r"* "" ~
Antimony <12.9 <1.8 <2.3 <1.7 <64.6 R' <1.8 R' <1.9 R" 36.2 J •
Beryllium <0.2 0.4 0.75 <0.23 17.6 0.42 0.53 <0.95 NA
Calcium <250 215,000 16,300 257,000 8,340,000 261,000 239,000 20,300 NA
Cobalt <2.6 3.2 9.6 2.0 68.8 2.3 2.7 <25.1 NA
Copper <13.3 10.8 14.2 7.5 378 9.8 9.6 385 NA

Table 4.1 (continued)
Location ID 72.SB001
(East Galleiy Floor)
72.SB002 (East Gallery
Wall) 72.SB003
(Cell Wall) 72.SB004
(Cell Floor)
72.SD001 (Cell
Floor)
Sample ID 03936 03943 03933 03944 04044 04045",
Composite 04045b, Hot
Interval 03934 RCRA Toxicity Characteristic
Equivalent Limits for Sol»dsc Sample Type
QC/Equip. Rinsate
Concrete Core Soil
Concrete Core
Concrete Core
Concrete Core
Concrete Core
Misc. Sediment
RCRA Toxicity Characteristic
Equivalent Limits for Sol»dsc
Units Mg/L mg/kg mg/kg mg/kg mg/kg mg/kg mg/kg mg/kg mg/kg
Iron 106 5,770 25,500 5,690 J 176,000 5,290 5,120 110,000 NA
Magnesium <56.4 36,800 5,110 42,300 1,390,000 37,900 38,700 7,930 NA
Manganese <6.1 261 348 265 J 9,530 281 274 1,310 NA
Nickel <3.4 5.3 12.6 6.0 138 6.8 6.6 169 NA
Potassium 94.4 829 1,710 1,030 33,700 792 756 822 NA
Sodium 264 309 J <152 <303 7,050 J 221 J 214 133 NA
Thallium <3.8 <0.75 <0.93 <0.76 <0.48 <0.47 <0.48 <0.46 NA
Vanadium <5.5 5.7 18.7 9.1 240 9.0 9.1 <28.7 NA
Zinc 16.8 737 60.2 979 34,900 J 1,000 J 687 J 7,420 J NA
TAL Cyanide
Cyanide <10 <0.48 <0.63 <0.52 R' <0.5 <0.53 <0.51 0.58 J NA
" Composite core from cell floor using intervals of 0 to 6.5 in., 10.5 to 19.5-in., and 19.5 to 24 in. " "Hot" interval from 6.5 to 10.5 in. c The RCRA equivalent limits are derived from values in 40 CFR 261.24; the maximum concentration of contaminants for the toxicity characteristic, listed by EPA in 40 CFR 261.24 in units of mg/L, was multiplied by a factor of 20 to obtain equivalent limits for solids in units of mg/kg. J Antimony values rejected because they are biased low, as indicated by an interference check source and the negative results in the preparation blank. ' Cyanide value rejected because cyanide holding time was missed by 15 days. Note 1: Samples 03960 (trip blank), 04237 (concrete chips), 03935 (soil), and 04047 (trip blank) did not undergo metals and cyanide analyses. Note 2: Shaded values indicate that the total metal content is greater than RCRA toxicity characteristic equivalent limits.
4-12
is considered hazardous. Eight metals are included in EPA's list of toxicity characteristic analytes to be evaluated in the TCLP test.
For the D&D characterization of Building 3506, TAL metals analyses (which give total metals content via a concentrated nitric acid digestion) were performed rather than the less aggressive TCLP tests. It was acknowledged during the initial planning that the TCLP procedure for solids might not be required if it could be demonstrated that the total metals content did not exceed the equivalent limits shown in Table 4.2. [Because of a 20-fold dilution during the TCLP extraction procedure for solids, the TCLP equivalent limits for solids (in mg/kg) are defined as 20 times the EPA regulatory limits for the extract (in mg/L).] However, if the total concentration of a particular metal is greater than the TCLP equivalent limit in Table 4.2 (which is equivalent to assuming that the metal will completely dissolve in the TCLP acetic acid solution), then that metal becomes suspect as a RCRA constituent exhibiting the toxicity characteristic. A TCLP test will need to be performed for that particular metal to determine whether or not it is a RCRA constituent.
Of the TAL metals, only thallium was not detected in any sample; selenium, silver, antimony, and cyanide were detected in only one sample.
Cadmium, chromium, lead, and mercury were detected in samples 03933 (soil), 04044 (concrete core), and 03934 (miscellaneous sediment) at sufficiently elevated levels to exceed the suggested relevant toxicity characteristic equivalents.
• Cadmium was detected at 180 J mg/kg in sample 04044, a concrete core from the cell wall (location 72.SB003); this concentration is a factor of 9 greater than the toxicity characteristic equivalent of 20 mg/kg. Cadmium was also detected at 60.1 mg/kg in sediment sample 03934 from the cell floor (location 72.SD001); this concentration is a factor of 3 greater than the RCRA equivalent limit.
• Chromium was also detected in core sample 04044 (196 mg/kg) and miscellaneous sediment sample 03934 (189 mg/kg). These concentrations exceed the toxicity characteristic equivalent limit of 100 mg/kg by a factor of 2.
• Lead was detected in the miscellaneous sediment sample (03934) at 878 J mg/kg; this concentration exceeds the RCRA equivalent limit of 100 mg/kg by a factor of 9.
• Mercury was detected at 45.9 mg/kg in sample 03933, the soil sample from under the gallery floor and crawlspace; this concentration is a factor of 12 greater than the toxicity characteristic equivalent of 4 mg/kg. Mercury was also detected in sediment sample 03934 at a concentration of 18.7 mg/kg, which is a factor of 5 greater than the toxicity characteristic equivalent limit.
R-166
4-13
4.7 ASBESTOS AND LEAD IN PAINT AND SHIELDING
On September 21, 1993, ORNL Industrial Hygiene personnel collected samples of sheet rock, tar paper, and window putty from the east gallery and submitted them to the Industrial Hygiene Analytical Laboratory for bulk asbestos analysis (ORNL Method SOP-IH-26.1). The asbestos content results were negative for the sheet rock and tar paper (felt roofing material) but positive (chrysotile at 1 to 5%) for the window putty. On July 14, 1994. ORNL Industrial Hygiene personnel collected two additional samples of tar paper for bulk asbestos analysis. The asbestos results were negative for one of the samples but positive (chrysotile at 1 to 5%) for the other.
EPA has listed asbestos as a hazardous substance under the Comprehensive Environmental Response, Compensation, and Liability Act (40 CFR 302.4) and regulates asbestos emissions during building demolition via specific work practices under the Clean Air Act; however, the impact of asbestos emissions from Building 3506 will likely be minimal given that the asbestos is bound up in the window putty and in the tar paper. The September 21 samples were radiologically surveyed in the field at the time of collection and found to be below the direct survey limits for free release of 300 and 1000 dpm/100 cm2 for alpha and beta/gamma contamination, respectively (Bechtel 1993c). Nevertheless, if the window putty and tar paper are classified during D&D as radioactively contaminated, they may be disposed of at Solid Waste Storage Area (SWSA) 6 in accordance with SWSA 6 waste acceptance criteria (Energy Systems 1993a).
During an initial site walkover of Building 3506 on June 30, 1993, it was noted (and documented in the field logbook) that the east gallery walls and floor and the cell walls are painted. At least four colors of paint are on the gallery walls, and some of the paint is peeling. On September 21, 1993, ORNL Industrial Hygiene collected paint samples from the east gallery and performed qualitative analyses (Lead Check Swabs™) to determine whether the paint is lead-based. The results of these analyses were negative, but the negative results are generally considered by Industrial Hygiene to be inconclusive given the relatively high frequency of false negatives with this technique (i.e., negative results should not be interpreted as an indication of the absence of lead). The paint samples were not submitted for a quantitative analysis of lead content.
On July 14,1994, ORNL Industrial Hygiene personnel collected two additional paint chip samples and submitted them to the ORNL laboratory for lead analysis using inductively coupled plasma atomic emission spectroscopy. The analytical results for the two samples (verbally reported to the Bechtel Team) are 890 and 8000 mg/kg; these concentrations exceed the toxicity characteristic equivalent limit of 100 mg/kg by factors of 9 and 80, respectively.
Removal of any lead-based paint must comply with the Occupational Safety and Health Administration interim final rule on lead abatement or exposure (29 CFR 1926.62). This rule sets a permissible exposure limit at 50 (J-g/m1 of air computed as an 8-h time-weighted average. The rule requires that in any construction work (which includes demolition or salvage of structures) where there is any occupational exposure to lead, an exposure assessment must be conducted to determine whether exposure exceeds the action level of 30
R-ltf

4-14
/ig/m3 computed as an 8-h time-weighted average. In addition to the exposure assessment, interim protection must be provided for certain listed activities while the assessment is being conducted.
A characterization of the paint removed during D&D will be necessary to determine whether any lead residuals may be classified as RCRA characteristic waste. If any fail the TCLP, the RCRA land disposal restrictions (LDRs) of 40 CFR 268 may be triggered [40 CFR 262.11; TDEC 1200-1-11-.03(e)].
The field logbook documents the presence of six contiguous 3/8-in.-thick lead shields attached to the north cell's east wall and covering a 4- by 4-ft area. Two noncontiguous 1/4-in.-thick lead shields that cover pipe openings are attached to the gallery's east wall. The height and length of these plates were: hot measured, but one is approximately 6 by 6 in. and the other is approximately 6 by 18 in. The presence of these lead shields was determined visually; no direct chemical analyses were performed. The lead shields would be considered a mixed low-level radioactive waste, and decontamination activities would be governed by the exposure limits of Department of Energy (DOE) Orders 5400.5 and 5820.2A as well as the RCRA LDRs. Lead shields are classified in the LDRs under waste code D008, which includes radioactive lead solids (40 CFR 268.42, Table 3). The LDR for D008 is a technology-based standard: microencapsulation with surface coating materials such as polymeric organics (e.g., resins and plastics) or with a jacket of inert organic materials to substantially reduce surface exposure to potential leaching media.
4.8 HISTORICAL SOIL SAMPLING EXTERIOR TO BUILDING 3506
Two soil borings (01.SB196 and 01.SB 197) were hand-augered within 18 ft of Building 3506 in July 1991 during Phase I of the WAG 1 RI (Bechtel 1992). These 4-in.-diameter borings yielded five soil samples. Figure 4.1 shows the location of the borings relative to Building 3506, and Table 4.3 presents total drilling depth, soil samples collected, sampling intervals, and analyte groups investigated by the laboratories. The analyte groups included VOCs, BNAEs, pesticides and PCBs, metals and cyanide, sulfide, and total organic carbon (TOC).
Table 4.4 presents the concentrations of the organic compounds detected. Carbon disulfide was the only VOC detected in the exterior soil borings; it was found at-concentrations of 0.013 and 0.016 mg/kg at a depth of 2 to 4 ft in boring 01.SB197, which is 8 ft north of Building 3506. Five BNAEs (chrysene, fluoranthene, and three phthalates) were detected sporadically in the two borings at various depths and at concentrations up to a maximum of 0.14 mg/kg. No pesticides or PCBs were detected.
Table 4.5 lists results for the metals and cyanide analyses. The RCRA metals were all detected at concentrations less than their RCRA toxicity characteristic equivalent limits.
Sulfide and TOC analyses were performed for the two soil samples (regular and duplicate) extracted from the 2- to 4-ft interval of boring 01.SB197. No sulfide was detected above the
R-166

Table 4.3. Chemical sampling summary for WAG 1 soil borings near Building 3506
Location Distance from Bldg. 3506"
Total Depth (ft BGS*)
Interval (ft)
Sample No. VOCs BNAEs
Pest./ PCBs Metals Cyanide Sulfide TOC
01.SB196 18 ft south 6.4 0-2 2203 X X X X X
01.SB197 8 ft north 8.8 2-4 2293 X X X X X X X
2-4 2294' X X X X X X X
6-8 2308 X X
8-8.8 2329 X X X
Chemical Analyses
- For location 01.SB196, the ORNL grid coordinates are 21963 (northing) and 30804 (easting); for location 01.SB197, the coordinates are 22021 (northing) and 30794 (easting). * BGS, below ground surface. ' Sample 2294 is a duplicate to sample 2293.
_L
12000-
V - J l ' I l l
II il
' j ) I W V I L ' j i:
21800
D1.SB197
3506(J f ) { ) { )
[ o o o a
P I n
Large Gunite tanks 80
3515
\ 0
3525 5 "
• a
Legend
A Soil Baring @ Soil Boring with Temporary Piezometer
•f. 1—• Lf)
Fig. 4.1. WAG 1 soil borinfe locations near Building 3506.

4-16 Table 4.4. Analytical detects for organic compounds in WAG 1 soil borings
Location ID 01.SB196 01.SB197
Sample ID 2203 2293 2294 (duplicate)
2308 2329
Interval 0 to 2 ft 2 to 4 ft 2 to 4 ft 6 to 8 ft 8 to 8.8 ft
Units mg/kg mg/kg mg/kg mg/kg mg/kg
/j VOCs
Carbon disulfide 0.013 0.016
BNAEs
Chrysene 0.086
Fluoranthene 0.041 J
Butylbenzylphthalate 0.14
Di-n-butylphthalate 0.11 J
Bis(2-ethylhexyl)phthalate 0.14 J
Note (1): Sample 2308 was not analyzed for pesticides/PCBs. Note (2): VOC and BNAE TICs were not reported in the WAG 1 data base and are therefore not
included in this table. Note (3): Blanks indicate that the analyte was not detected.

4-17 Table 4.5, Analytical results for metals and cyanide in WAG 1 soil borings
Location ID 01.SB196 01.SB197
Sample ID 2203 2293 2294
(duplicate) 2329 RCRA Toxicity Characteristic
Equivalent Limits for Solids' Interval 0 to 2 ft 2 to 4 ft 2 to 4 ft 8 to 8.8 ft
RCRA Toxicity Characteristic
Equivalent Limits for Solids'
Units mg/kg mg/kg mg/kg mg/kg mg/kg
RCRA Metals '
Arsenic 1.7 9.9 J 8.4 J 6.1 100
Barium 48 63.7 50 93.3 2,000
Cadmium <0.67 <0.75 <0.72 <0.64 20
Chromium 13 20.5 J 14 J 13.5 100
Lead 25 27 J 28.3 J 42 R 100
Mercury <0.11 0.17 J 0.43 J <0.12 4
Selenium <0.87 R <0.75 R <0.72 R <3.4 20
Silver <0.89 <0.5 <0.48 <0.43 , 100
Other TAL Metals
Aluminum 10,200 15,800 13,400 19,600 NA
Antimony <3.8 <3.2 R <3.1 R <2.8 R NA
Beryllium 0.44 1.1 J 1.1 J 1.1 NA
Calcium 42,800 J 9,470 7,860 51,500 J NA
Cobalt 8.1 16.1 J 10.6 J 17.7 J NA
Copper 14.7 3.7 J 3.3 J 30.1 J NA
Iron 15,300 24,600 23,800 28,000 NA
Magnesium 25,900 J 2,490 2,010 5,100 NA
Manganese 371 J 1,080 J 847 J 1,210 NA
Nickel 12.1 11.8 J 10.8 J 20.6 NA
Potassium 1,490 1,030 955 2,170 NA
Sodium 54.4 <69.9 <67.1 94.1 NA
Thallium <0.22 <0.75 <0.72 <3.4 NA
Vanadium 19.3 31.3 J 26.5 J 21.7 J NA
Zinc 43.3 21.3 J 19.5 J 50.4 NA
TAL Cyanide
Cyanide <5.7 , <0.38 <0.39 NA NA
I

4-18 Table 4.5 (continued)
" The RCRA equivalent limits are derived from values in 40 CFR 261.24; the maximum concentration of contaminants for the toxicity characteristic, listed by EPA in 40 CFR 261.24 in units of mg/L, was multiplied by a factor of 20 to obtain equivalent limits for solids in units of mg/kg. "
Note (1): Sample 2308 (location 01.SB197, interval 6-8 ft) was not analyzed for metals and cyanide; sample 2329 (location 01.SB197, interval 8-8.8 ft) was not analyzed for cyanide.

4-19
detection limit of 0.5 mg/kg. The TOC found in sample 2293 was 3300 mg/kg: the TOC found in the duplicate was 100 mg/kg.
4.9 SUMMARY
Five concrete core samples from the floors and walls were analyzed for TCL BNAEs. TCL pesticides/PCBs, and TAL inorganics. Although no BNAEs were detected, each core sample contained 3000 to 13,000 NJ mg/kg of BNAE TICs; a possible source of these TICs is core drill grease released during wet drilling operations. PCBs were detected in core samples at concentrations ranging from 0.24 J to 1.8 J mg/kg (ppm); one exception is the concrete core from the wall between the east gallery and cell (sample 03944) that had a PCB concentration of 56 R mg/kg (ppm). Inorganics analyses indicated two potential RCRA constituent metals (cadmium and chromium) for one of the cores (sample 04044). A TCLP test can determine whether or not they are RCRA constituents.
One concrete chip sample (04237) collected from the gallery's west wall was analyzed for TCL BNAEs and pesticides/PCBs. Only minor amounts of BNAEs (0.7 J mg/kg) and BNAE TICs (17 NJ mg/kg) were found. PCBs were detected at 4.3 J mg/kg.
One soil sample (03933) collected from under the gallery and crawlspace was analyzed for TCL organic and TAL inorganic analytes. No VOCs, VOC TICs, or BNAEs were detected in this sample, and only minor amounts of BNAE TICs (8 NJ mg/kg) and PCBs (0.011 mg/kg) were found. Inorganics analyses indicated the presence of mercury as a potential RCRA constituent at 45.9 mg/kg.
One sediment (or loose material) sample (03934) was collected from the cell floor and submitted to the offsite laboratory for the TCL/TAL suite of analyses. One VOC (acetone) and one unknown VOC TIC were detected at minor levels (0.09 J and 0.019 NJ mg/kg, respectively). Seventeen BNAEs were detected at a summed concentration of 158 J mg/kg, as well as 19 BNAE TICs at a summed concentration of 30 NJ mg/kg. PCBs were detected at 410 mg/kg (ppm). Four potential RCRA constituent metals (cadmium, chromium, lead, and mercury) were identified in the inorganic analyses.
Results of the asbestos analysis were negative for the sheerrock sample, but positive for the window putty and tar paper samples. Analysis of two paint chip samples found lead concentrations of 890 and 8000 mg/kg; these concentrations exceed the toxicity characteristic equivalent limit for lead.
Lead shielding plates, a potential mixed low-level radioactive waste, are mounted on the east wall of the gallery and the north cell area.
R-IM

5. RADIOLOGICAL SAMPLING AND ANALYSIS
5.1 DATA PRESENTATION
Radiological data for liquid samples (e.g., rinsate or water blanks) are presented in units of picocurie activity of a radioisotope per liter of liquid (pCi/L). Data for solid samples (e.g., soil, concrete, or sediment) are presented in units of picocurie activity of a radioisotope per gram of solids (pCi/g) on a dry weight basis.
On occasion, the concentration of a radionuclide is reported as a "less than" ( < ) value (e.g., < 2 pCi/g). This indicates that the radionuclide was not detected at or above its measurement method detection limit, referred to as minimum detection limit (MDL) (in this case, 2 pCi/g).
The radiological results presented for the regular samples were qualified by the off-site ASL and the project as part of the validation process. The ASL prepared the blanks, spikes, and duplicates. Blanks were qualified only by the ASL. The qualifiers (flags) for the regular samples were applied by RI/FS Project validators in accordance with project procedures, taking the results of regular samples, blanks, spikes, and duplicates into consideration. The qualifiers present the following information.
J: The detected numerical value is an estimated quantity.
U: The radionuclide was not detected; MDL value is reported.
UJ: The MDL numerical value is an estimated quantity.
R: Indicates that the data are unusable (i.e., calibration data are wrong or resampling and/or reanalysis is necessary for verification.)
<r - (or blank): No problems requiring the qualification of results.
ASL analyses included gross alpha; gross beta; gamma spectroscopy; total radioactive strontium; and plutonium, thorium, and uranium isotopics. Analytical methods are presented in Table 5.1. Table 3.1 provides location number, sample number, sample type and description, and types of analyses performed for each sample collected by the Bechtel Team. Tables 5.2 and 5.3 provide results of the radiological analyses for the east gallery and the cell areas, respectively. Average radionuclide concentrations from WAG 1 reference soil sample results are listed in Tables 5.2 and 5.3 for comparison.
R-lfe ; 5-1

5-2 Table 5.1. Analytical methods
Parameter Analytical Technique
Method Number*
Detection Limit* (solids, liquids)
Gross alpha Gas flow proportional counting
USEPA 900.0 1 pCi/g, 1 pCi/L
Gross beta Gas flow proportional counting
USEPA 900.0 2 pCi/g, 4 pCi/L
Gamma spectroscopy Gamma spectroscopy USEPA 600/901.1
0.2 pCi/g Cs-137. 20 pCi/L Cs-137
Total radioactive strontium
Radiochemical separation followed by gas flow proportional counting
USEPA 600/905 0.5 pCi/g, 5 pCi/L
Plutonium isotopics (^Pu, 2W240Pu)
Radiochemical separation followed by alpha spectroscopy
EML Pu-02 0.6 pCi/g, 1 pCi/L
Thorium isotopics C228Th, 230Th, 232Th)
Radiochemical separation followed by alpha spectroscopy
LANL ER200 0.6 pCi/g, 1 pCi/L
Uranium isotopics (^U, 233/234JJ 235JJ 238JJ Radiochemical separation
followed by alpha spectroscopy
EML U-02 0.6 pCi/g, 1 pCi/L
Sources: Bechtel National, "Technical Specification for Analytical Laboratory Services," Specification 19118-99-SP-03, Rev. 4, 1993; EPA, Index to EPA Test Methods, EPA 901/3-88-001; EPA, Contract Laboratory Program Statements of Work for Organics and Inorganics Analysis, Documents OLMOl.8 and ILM02.1, 1991; DOE, EML Procedures Manual, HASL-300, 1992; and LANL, Health and Environmental Chemistry: Analytical Techniques, Data Management, and Quality Assurance Manual, LA-10300M/UC907, 1986.
° Abbreviations are: EML—Environmental Measurements Laboratory; LANL—Los Alamos National Laboratory; CLP—Contract Laboratory Program; and SOW—Statement of Work.
fc Detection limits for radiological parameters are expressed as "detection limit goals."

Table 5.2. Radiological analysis results for the east gallery
Sample ID
Location ID
WAG 1 Reference
Results
03936 (QC Eq. Rinsate)
03943 (Concrete)
72.SB001
03933 (Soil)
72.SB001
-
03944 (Concrete)
72.SB002
Average Concen-tration (pCi/g)
Concen-tration (pCi/L)
Uncertainty (±)
Review Qualifier
Concen-tration (pCi/g)
Uncertainty (±)
Review Qualifier
Concen-tration (pCi/g)
Uncertainty (±)
Review Qualifier
Concen-tration (pci/g)
Uncertainty (±)
Review Qualifier
Gross Alpha 21.83 0.24 0.9 UJ 12.8 3.8 J 14.4 5.10 J 4.8 3.1 J
MIAm 25.23 5.7 1.69 0.29 J 0.50 0.29 J 2J9/2*)pu 0.21 U 0.00 0.00 R 0.75 0.45 J 0.39 UJ D8pu 0.67 0.37 0.06 0.25 R 0.29 0.25 UJ 0.39 UJ MRa 0.65 0.36 0.14 0.97 0.16 MTh 3.74 0.76 0.82 R 0.53 0.33 J 1.60 0.60 J 0.56 0.30 J
" T h 1.17 -0.06 0.09 R 1.20 0.53 2.0 0.7 1.00 0.43 U2Th 1.13 -0.06 0.09 R 0.29 0.22 J 1.7 0.62 0.43 0.25 J 233«34U 0.88 0.17 U 0.80 0.35 1.1 0.4 0.9 7 0.38 23JU 0.11 0.18 U 0.06 UJ 0.06 u 0.17 U 23SJJ 0.9 0.17 U 0.62 0.29 1.4 0.48 0.77 0.34
Gross Beta 15.69 0.32 UJ 54.4 7.1 J 91.2 9.90 J , 46.3 6.30 J l37Cs 0.15 12.4 U 15.05 0.39 20.28 0.37 22.79 0.51
9.62 --5.14 0.59 30.91 1.76 5.38 1.00 226Ra 0.65 :28Ra 0.9 0.37 0.24 1.48 0.28
"Sr 0.36 0.82 UJ 0.55 U 0.41 UJ 8.1 1.3
"Co
Tritium 0.16 129.4 u 25.6 3.06 J 30.6 4.09 J 0.65 1.7 J
" T h

Table 4.1 (continued)
Sample ID
Location ID
WAG 1 Reference
Results
03936 (QC Eq. Rinsate)
Concen Uncertainty Review tration . , . _ (pCi/L) ( ± ) Q u - , f i B r
03943 (Concrete)
72.SB00I
Concen Uncertainly Review tration J
(pCi/g) ( ± ) Q u a l , f i e r
03933 (Soil)
72.SB001
Concen Uncertainty Review tration . , . (pCi/g) ( ± ) Q u a l l f , C r
03944 (Concrete)
72.SB002
Concen- . , _ . Uncertainty Review tration . , . 17 _ .._ (pCi/g) ( ± ) Q u a h f , e r
Sample ID
Location ID
Average Concen-tration (pCi/g)
03936 (QC Eq. Rinsate)
Concen Uncertainty Review tration . , . _ (pCi/L) ( ± ) Q u - , f i B r
03943 (Concrete)
72.SB00I
Concen Uncertainly Review tration J
(pCi/g) ( ± ) Q u a l , f i e r
03933 (Soil)
72.SB001
Concen Uncertainty Review tration . , . (pCi/g) ( ± ) Q u a l l f , C r
03944 (Concrete)
72.SB002
Concen- . , _ . Uncertainty Review tration . , . 17 _ .._ (pCi/g) ( ± ) Q u a h f , e r
>"Pm
2l2Bi 0.73 2.1 0.93
Note:
(I) Most of the concrete aggregate is composed of sandstones with the following natural background concentrations*: radium-226, 0.71 pCi/g; uranium-228, 0.4 pCi/g; thorium-232, 0.65 pCi/g; and potassium-40, 8.8 pCi/g.
*Source: Eisenbud, M. 1987. Environmental Radioactivity from Natural, Industrial, and Military Sources, Academic Press, Inc., 3rd edition.
H lf* llll

Table 5 .3 Radiological analysis results for the cell area
Sample ID
Location ID
WAG 1 Reference
Results
04044 (Concrete)
72.SB003
04045 (Concrete) (Container 3)
72.SB004
04045 (Concrete) (Container 9)
72.SB004
03935 (Soil)
72.SB004
03934 (Sediment)
72.SD001
Average Concen-tration (pCi/g)
Concen tralion (pCi/g)
Uncertainty ( ± )
Review Qualifier
Concen-tration (pCi/g)
Uncertainty ( ± )
Review Qualifier
Concen tration (pCi/g)
Uncertainty ( ± )
Review Qualifier
Concen-tration (pCi/g)
Uncertainty (±>
Review Qualifier
Concen-tration (pCi/g)
Uncertainly ( ± )
Review Qualifier
Gross Alpha
21.83 3.80 3.30 J 0.0 12.90 J 1.7 13.60 J 13.6 4.70 J 1330 305 J
wAm 0.40 0.29 J 7.9 U 239/240py 0.48 UJ 2.0 1.0 ; 4.0 1.8 J 0.13 UJ 35.40 7.X0 M P u 0.64 UJ 0.0 0.14 R 0.45 0.44 J 0.03 UJ 1.16 0.42 J
^ R a 0.65 0.401 0.17 0.64 0.19 j a T h 3.74 0.84 0.57 J 0.33 W 0.38 0.27 J 1.40 0.50 J 0.54 0.22
1.17 1.40 0.77 J 1.10 0.53 1.20 0.56 1.70 0.58 0.04 UJ 232Th 1.13 0.87 0.56 J 0.35 0.27 J 0.52 0.32 J 1.40 0.52 J 0.55 0.22 233/2J«(J 0.88 0.49 0.27 1.10 0.45 1.30 0.49 0.96 0.31 3.43 0.84 233U 0.11 0.07 U 0.06 u 0.12 0.11 0.04 U 0.16 U mv 0.9 0.62 0.31 0.92 0.38 1.70 0.61 0.87 0.29 2.24 0.59
Gross Beta
15.69 53.6 6.6 J 1997 20.8 J 2464.7 26.3 J 63.7 8.80 J 20200 4040
131Cs 0.15 34.54 0.66 1535.0 4.0 1375.0 3.0 11.53 0.40 30800 3400 40K 9.62 5.28 1.20 4.76 1.12 3.47 0.91 19.59 2.08 9.43 6.19 256Ra 0.65 228 Ra 0.9 1.04 0.34 w Sr 0.36 0.34 u 12.8 1.9 11.6 1.5 0.41 UJ 9"!.5 9.81 mCo 0.25 0.09 0.13 0.07 3.43 0.63
Ui • I *
K-IM.IIII

Table 5.3 (continued)
Sample ID
Location ID
WAG 1 Reference
Results
04044 (Concrete)
72.SB003
Conccn- Uncertainty Review tration ( ± ) Qualifier (pCi/g)
04045 (Concrete) (Container 3)
72.SB004
Concen- Uncertainty Review tration ( ± ) Qualifier (pCi/g)
04045 (Concrete) (Container 9)
72.SB004
Concen- Uncertainty Review tration ( ± ) Qualifier (pCi/g)
03935 (Soil)
72.SB004
Concen- Uncertainty Review tration ( ± ) Qualifier (pCi/g)
03934 (Sediment)
72.SDOOI
Concen- Uncertainty Review tration ( ± ) Qualifier (PCi/g)
Sample ID
Location ID
Average Concen-tration fpCi/g)
04044 (Concrete)
72.SB003
Conccn- Uncertainty Review tration ( ± ) Qualifier (pCi/g)
04045 (Concrete) (Container 3)
72.SB004
Concen- Uncertainty Review tration ( ± ) Qualifier (pCi/g)
04045 (Concrete) (Container 9)
72.SB004
Concen- Uncertainty Review tration ( ± ) Qualifier (pCi/g)
03935 (Soil)
72.SB004
Concen- Uncertainty Review tration ( ± ) Qualifier (pCi/g)
03934 (Sediment)
72.SDOOI
Concen- Uncertainty Review tration ( ± ) Qualifier (PCi/g)
Tritium 0.16 21.1 2.78 J 0.86 1.65 J 2.04 2.73 J 1.00 0.16
^ T h 18.70 2.90 l41Pm 87.2 5.14 16.9 13.6 u*Th 6.31 2.90 J12Bi 0.73
Note:
(1) Most of the concrete aggregate is composed of sandstones with the following natural background concentrations*: radium-226, 0.71 pCi/g; uranium-228, 0.4 pCi/g; thorium-232, 0 .65 pCi/g; and - ~ potassium-40, 8.8 pCi/g.
*Source: Eisenbud, M. 1987. Environmental Radioactivity from Natural, Industrial, and Military Sources, Academic Press, Inc., 3rd edition.
i 0\
K IM> MI

5.2 DATA USABILITY ASSESSMENT
4-7
Radiological analyses were performed at the IT and TMA laboratories in Oak Ridge. Tennessee. The preparation and quantitative measurements of samples for radionuclide analysis followed the ASL's standard operating procedures, which are equivalent to the methods stipulated in Table 5.1.
Deficiencies and uncertainties in the results include the following.
• Some QC equipment rinsate results were rejected because of difficulties in tracer recovery.
• Thorium isotopic results for sample 03936 were rejected because of difficulties with tracer recovery.
• Plutonium isotopic results for sample 03943 were rejected because of difficulties with tracer recovery.
Documentation provided by the laboratories met RI/FS Project QC level III requirements, as described in Sect. 4. Validation of the data packages met RI/FS Project QC level II requirements: analytical results were reviewed in accordance with RI/FS validation procedures for radiological data (Project Procedure 1503.2), but the raw data were not checked by the validator to the same degree that they would have been checked in a QC level III validation protocol.
5.3 ASL RESULTS
One QC equipment rinsate, four concrete core, one sediment, and two soil samples were sent off site for radiological analysis. The concrete cores were crushed before they were shipped to the ASL, where they were ground to a homogenized powder and analyzed to determine radionuclide concentrations. Soil samples were also composited and mixed before radiological analysis.
5.3.1 QC Equipment Rinsate (Sample 03936)
An equipment rinsate sample collected from the core drill equipment was treated in the same way as a regular sample and analyzed for all parameters listed in Table 5.1. Concentrations of all the radionuclides analyzed for were less than or equal to their MDLs, and thorium isotopic results were flagged R (rejected) because of the problems with the tracer recovery.
5.3.2 East Gallery Wall Concrete Core (72.SB002, Sample 03944)
Gross alpha and beta activities were 4.8 and 46.3 pCi/g. Most of the alpha emitting radionuclides analyzed for were detected in concentrations < 1 pCi/g. Plutonium-
R-166

5-8
239/240/238 and uranium-235 levels were less than or equal to their MDLs, and cesium-137 and strontium-90 concentrations were approximately 23 and 8 pCi/g.
5.3.3 East Gallery Floor Concrete Core (72.SB001, Sample 03943)
Gross alpha and beta activities were 12.8 and 54.4 pCi/g. Most of the alpha emitting radionuclides analyzed for were detected in concentrations < 1 pCi/g. Plutonium-239/240/238 results were flagged R because of the problem with tracer recovery. Uranium-235 and strontium-90 levels were less than or equal to their MDLs, and the cesium-137 concentration was 15 pCi/g.
5.3.4 East Gallery Soil (72.SB001, Sample 03933)
Gross alpha and beta activities were 14.4 and 91.2 pCi/g. Most of the alpha emitting radionuclides analyzed for were detected in concentrations <1 pCi/g. Americium-241, thorium-228/232, and uranium-238 concentrations were > 1 but < 2 pCi/g. Plutonium-238, uranium-235, and strontium-90 levels were less than or equal to their MDLs. The cesium-137 concentration was 20 pCi/g.
5.3.5 Cell Wall Concrete Core (72.SB003, Sample 04044)
Gross alpha and beta activities were 3.8 and 53.6 pCi/g. Concentrations of most of the alpha emitters analyzed for were < 1 pCi/g. Americium-241 and thorium-230 were detected at 1.4 pCi/g. Plutonium-238/239/240, uranium-235, and strontium-90 levels were less than or equal to their MDLs. The cesium-137 concentration was 34.5 pCi/g.
5.3.6 Cell Floor Concrete Core (72.SB004, Sample 04045)
The concrete core obtained from the cell area floor was divided into two samples and put in separate containers. Container 3 held the section from the 6.5- to 10.5-in. depth, and container 9 held the sections from the 0- to 6.5-in. and 10.5- to 24-in. depths.
Container 3
Gross alpha and beta activities were zero and 1997 pCi/g. Most of the alpha emitters analyzed for were detected in concentrations <1 pCi/g. Plutonium-238 was flagged R because of tracer recovery problems. Thorium-228 and uranium-235 were detected at less than or equal to their MDLs. Plutonium-239/240, thorium-230, and uranium-233/234 were detected at 2, 1.1, and 1.1 pCi/g. Cesium-137 and strontium-90 concentrations were 1535 and 12.8 pCi/g, and promethium-145 and cobalt-60 concentrations were 87.2 and 0.25 pCi/g.
Container 9
Gross alpha and beta activities were 1.7 and 2464 pCi/g. Levels of most of the alpha emitters analyzed for were < 1 pCi/g. Piutonium-239/240, thorium-230, uranium-233/234, and uranium-238 were detected at4.0, 1.2, 1.3, and 1.7 pCi/g, respectively. Cesium-137 and
R-1C6

6-9
strontium-90 concentrations were 1375 and 11.6 pCi/g, and promethium-145 and cobalt-60 concentrations were 16.9 and 0.13 pCi/g.
5.3.7 Cell Area Soil (72.SB004, Sample 03935)
Gross alpha and beta activities were 13.6 and 63.7 pCi/g. Most of the alpha emitters analyzed for were detected at < 1 pCi/g. Thorium isotopes analyzed for were all detected at concentrations between 1 and 2 pCi/g. Americium-241 was detected at 0.4 pCi/g, cesium-137 was detected at 11.5 pCi/g, and strontium-90 was detected at 0.6 pCi/g.
5.3.8 Cell Area Sediment (72.SD001, Sample 03934)
Gross alpha and beta activities were 1330 and 20,200 pCi/g. Most of the alpha emitters analyzed for were detected at < 1 pCi/g. Concentrations of americium-241, plutonium-239/240, plutonium-238, uranium-232, uranium-233/234, uranium-238, and plutonium-242 were 5.0, 35.4, 1.2, 20.3, 3.4, 2.2, and 20.5 pCi/g, respectively. Cesium-137 and strontium-90 concentrations were 30,800 and 97.5 pCi/g, and cobalt-60 and promethium-145 concentrations were 3.4 and 18.7 pCi/g.
5.4 HISTORICAL SOIL SAMPLING EXTERIOR TO BUILDING 3506
Soil borings 01.SB196 and 01.SB197 were hand-augered within 18 ft of Building 3506 in July 1991 during Phase I of the WAG 1 RI (Bechtel 1992). These 4-in.-diameter borings yielded four soil samples. Figure 4.1 shows the locations of the borings; Table 5.4 summarizes radiological sampling information.
Table 5.4. Radiological sampling summary for WAG 1 soil borings near Building 3506
Location Distance from
Bldg. 3506" Total Depth
(ft BGSb) Interval (ft) Sample
No.
01.SB196 18 ft south 6.4 0-2 2203
01.SB197 8 ft north 8.8 2-4 2293
2-4 2294c
8-8.8 2329
" For location 01.SB 196, the ORNL grid coordinates are 21963 (northing) and 30804 (easting); for location 01.SB197, the coordinates are 22021 (northing) and 30794 (easting). 6 BGS, below ground surface. r Sample 2294 is a duplicate to sample 2293.
Table 5.5 lists the radionuclides detected and their concentrations. Cesium concentrations (approximately 1 to 4 pCi/g) in these borings are lower than those obtained from Building
R-166

Table 5.5. Radionuclide concentrations in WAG 1 soil samples taken near Building 3506
Sample ID 2203 2293 2294° 2329
Location ID 01.SB196 01.SB197 01.SB197 01.SB197
Concen-tration (pCi/g)
Uncertainty (±)
Review Qualifier
Concen-tration (pCi/g)
Uncertainty (±)
Review Qualifier
Concen-tration (PCi/g)
Uncertainty (±)
Review Qualifier
Concen-tration (pCi/g)
Uncertainty (±)
Review Qualifier
Gross Alpha 48 22.2 30.5 30.5 85.5 30.5 10.2 10.1
Gross Beta 77.9 15 37.3 9.1 101.2 18.4 16.1 6.6 Total Strontium 0.12 0.3 UJ 2.83 0.6 2.76 0.59 6.73 0.99
3H 0.11 0.02 0.13 0.01 0.2 0.02 0.14 0.02 -
137Cs 3.94 0.35 0.89 0.2 1.3 0.18
25 3.2 9.66 2.36 6.9 2.01 11.3 2.1 2,2Pb 1.02 0.22 0.85 0.25 0.73 0.19 1.01 0.24
^Ra 1.75 0.34 0.93 0.45 1.09 0.41 1.41 0.51 0.96 0.45 0.72 0.36 0.89 0.34 1.39 0.36
^Ra 0.59 0.29 0.43 0.26 0.54 0.23 J 0.43 0.18 2,4Pb 0.46 0.3 0.75 0.25 0.65 0.2 U8U 6.48 0.92 J 1.53 0.32 J 39.2 9.2 4.1 3.38 a5U 0.14 0.08 • J 0.06 0.05 J 0.59 0.89 UJ 2 3 4 y 1.91 0.37 J 0.35 0.24 J 9.06 3.65
^Tc 0.32 0.43 UJ
"^Th 1.33 0.28 J 1.2 0.28 J 1 1.19 0.34 J 1.41 0.51
^Th 1.05 0.24 J 0.91 0.24 J 0.93 0.29 J 228Th 1.45 0.29 J 1.37 0.31 J 0.96 0.37 0.97 0.23 3l"Bi 0.45 0.26 228Ac 1.09 0.41
"Duplicate o f sample 2293.
R.IW..TBI.

5-11
3506 by factors of approximately 3 to 10. Strontium concentrations are similar to those in samples from Building 3506 except for sample 2329 (obtained from the 8- to 8.8-ft interval of 01-SB197), in which the strontium concentration is higher (6.73 pCi/g) by approximately a factor of 6. The concentrations of alpha emitters are similar to those from Building 3506 with the following exceptions: (1) uranium-234 (9.06 pCi/g) in duplicate sample 2294 from 01.SB197; (2) uranium-238 (6.8 pCi/g) in sample 2203 from 01.SB196; (3) uranium-238 (39.2 pCi/g) in sample 2294 from 01.SB197; and (4) uranium-238 (4.1 pCi/g) in sample 2329 from 01.SB197. These concentrations of alpha emitters are higher than those from Building 3506.
5.5 SUMMARY
By far the highest radiological contaminant concentrations were found in sediments, followed by the concrete core from the cell area. Contaminant concentrations in the other samples are similar to each other.
Curium-233/234 and curium-242 were not detected in any sample. Americium-241 was detected only in east gallery soil and wall core samples 03933 and 03944, and in cell area soil sample 03935 and sediment sample 03934. Cobalt-60 was detected only in floor core sample 04045 and sediment sample 03934 from the cell area. Promethium-145 was detected only in floor core sample 04045.
The concentrations of radionuclides in soil samples from Building 3506 are generally similar to those in WAG 1 reference soil samples. Exceptions are cesium-137 (with concentrations that are consistently lower) and strontium-90, uranium-234, and uranium-238 (with concentrations that are higher) for samples 2329, 2294, and 2203.
R-M6

6. RADIOLOGICAL FIELD MEASUREMENTS
6.1 DATA PRESENTATION
As appropriate and depending on the instrument used, radiological data collected during field measurements are presented in counts per minute (cpm), disintegrations per minute (dpm), milliroentgen per hour (mR/h), or millirad (an absorbed ionizing radiation dose equal to 0.001 rad) per hour (mrad/h). TLD results are reported in millidose equivalent per hour (mrem/h). Smear sample results are reported in microcuries per one hundred square centimeters (jiCi/100 cm2) or disintegrations per minute per one hundred square centimeters (dpm/100 cm2). Modeling results are reported in nanocuries per cubic centimeter (nCi/cm3), microcuries (jiCi), or millicuries (mCi) as appropriate.
6.2 DATA USABILITY ASSESSMENT
The measuring scheme for Building 3506 was "biased" (nonrandom) rather than "unbiased" (random or gridded). Unbiased measuring is sometimes used to predict overall site characteristics or to provide representative estimates, but a biased scheme increases the chance of obtaining measurements and samples from the most heavily contaminated areas: direct reading survey instruments identified "hotspot.s" that were used as measurement locations. '*'
To ensure that the data collected are of known and acceptable quality, the data were evaluated for precision, accuracy, representativeness, completeness, and comparability.
6.2.1 Precision
Precision is a measure of the mutual agreement among individual measurements of the same property, usually under prescribed similar conditions. Precision is evaluated through the use of duplicate or replicate measures and is determined using the concept of "relative percent difference" (RPD).
During the characterization, approximately 10% of the locations surveyed were randomly selected for remeasurement and the RPD was determined. If the RPD were to fall outside a control limit of 20%, the instrument would be removed from service and all data collected since the last acceptable RPD would be reviewed. No such situation was encountered during the D&D field activities. Precision analysis was not performed for smears because they were collected from each location only once.
6.2.2 Accuracy
Accuracy is the degree of agreement between the observed (measurement) value and the true value. Each field survey instrument was calibrated, and changes in accuracy were monitored twice daily (when in use) via source checks for an instrument in a fixed geometry. RI/FS project procedures and appropriate field documents were followed to provide quality data for radiological analyses and counting at the Close Support Laboratory (CSL). During
R-166 6-1

4-2
the characterization survey, the field survey instruments were source-checked at the beginning and end of each day they were used. If the source check counts were within ±2 o of each other, the instrument was approved for use.
6.2.3 Representativeness
Representativeness expresses the degree to which data represent the contaminants present in the area of interest. Therefore, representativeness is dependent on appropriate measurement and sampling techniques for the matrix and contaminants under study and on measurement and sampling locations that are typical of the area being surveyed. Measurement and sampling techniques and the strategy for selecting measurement and sampling locations are described in Sects. 4 through 6 of the site characterization plan (Bechtel 1993a). This investigation was conducted using biased sampling so that assumptions for D&D planning will be conservative.
6.2.4 Completeness
Completeness is a measure of the amount of valid data obtained from a measurement system compared with the amount specified by the sampling plan. For each data type, the data set was considered complete even if the actual number of measurements was less than the planned number due to access or ALARA limitations encountered in the field.
6.2.5 Comparability u
Comparability expresses the confidence with which one data set may be compared with another. This includes two elements of the survey process: the measurement instruments and the technique by which measurements and samples were obtained.
Comparability of data collected with different measurement instruments was ensured through achievement of precision and accuracy. Comparability of survey technique was accomplished by adhering to FWGs and procedures and by documenting this adherence in field logbooks, ES&H notebooks, and sample results.
Field measurements were performed in accordance with appropriate procedures and documents to ensure the quality and consistency of the data. The instruments were calibrated at the ORNL calibration facility prior to use and were source-checked before and after each use to ensure that they were responding properly. The source checks were performed three times in succession to ensure that the measurements were within ±2 a of each other. If an instrument failed the test, it was replaced by another calibrated instrument. Field measurements were also taken three times at each location to ensure representative and reliable results.
R-166

6-3
6.3 FIELD MEASUREMENTS
Building 3506 was divided into three areas for this series of measurements: east gallery, north cell area, and south cell area.
6.3.1 East Gallery
Measurements in the east gallery included gross alpha, gross beta/gamma, smear, concrete core slit scanning with an HPGe gamma spectroscopy system, and field gamma spectroscopy with a thallium-doped Nal(Tl) system. Thirty 10-cm x 10-cm locations were selected on the walls and floor. Three gross beta/gamma measurements, three gross alpha measurements, and a smear were taken at each location; results for gross beta/gamma and gross alpha were averaged and used as accepted values for this location. In addition, general area gamma spectroscopy was conducted near the center of the room using a 5-cm x 5-cm NaI(Tl) detection system. The smears were analyzed at the CSL for gross alpha, gross beta/gamma, and gamma spectroscopy. If gamma spectroscopy results did not account for the beta activity, some of the smears were also screened for strontium-90/yttrium-90.
6.3.1.1 Location-specific measurements
Summary results for the location-specific east gallery measurements are presented in Table 6.1. Note that the elevated average for the field measurement results on the west wall is attributable to just one point (06-EG-07) with an elevated value of 7090 dpm/100 cm2. The smear results from this location also display the highest reading for the west wall. Detailed results (location by location) are tabulated in Appendix F, Table F. 1; measurement locations are shown in Fig. 6.1.
The average background value measured for the field alpha counting system (an.-Eberline AC-3 probe) is approximately 14 dpm/100 cm2. The average background values measured for the field beta/gamma counting system (an Eberline HP-270 probe) were approximately 7.5E-03 mrad/h and 8.6E-03 mR/h for open and closed window mode, respectively. These two numbers are the same if statistical uncertainty is taken into account; the apparent discrepancy is due to fluctuation in background at the time of the measurements. Note that the numbers reported are the average of many daily measurements. There is no difference between closed and open window for background measurements in the shielded (Plexiglas-lined lead box, open on one side to accommodate instruments) geometry used to perform the daily checks. Most of the background is due to cosmic and natura'. ^arth background radiation (gamma and X-rays). (Note that background has not been subtracted from the results of field measurements presented in this section, but it has been subtracted from CSL results reported for smears.)
The beta field contribution to the total radiation exposure field can be estimated by comparing closed and open window HP-270 results. When the window is closed, most beta particles are prevented from penetrating the active volume of the detector and being registered. Therefore, in the closed window mode, the detector is most sensitive to penetrating ionizing radiation such as gamma or X-rays. In the open window mode, the
R-166

Table 6.1. Summary results of location-specific measurements in the east gallery
South Wall West Wall North Wall" East Wall Floor
Direct Alpha Counting'' (dpm/100cm2)
Range .
Average
21-37 6-7,090 49 3-68 9-44
Direct Alpha Counting'' (dpm/100cm2)
Range .
Average 29 743 ~ 40 18
Direct Beta/Gamma11
Counting at 10 cm
Open Window (mrad/h)
Range
Average
Closed Window (mR/h)
Range
Average
6.1E-02-2.6E-02 2.7E-02-3.6E-01 , 6.2E-02 2.6E-02-1.4E-01 2.1E-02-9.7E-02
Direct Beta/Gamma11
Counting at 10 cm
Open Window (mrad/h)
Range
Average
Closed Window (mR/h)
Range
Average
4.3E-02 l.IE-01 ,/ 6.1E-02 5.2E-02
Direct Beta/Gamma11
Counting at 10 cm
Open Window (mrad/h)
Range
Average
Closed Window (mR/h)
Range
Average
5.3E-02-2.1E-02 2.1E-02-4.6E-01 5.2E-02 2.0E-02-1.2E-01 1.2E-02-1.2E-01
Direct Beta/Gamma11
Counting at 10 cm
Open Window (mrad/h)
Range
Average
Closed Window (mR/h)
Range
Average 3.7E-02 8.7E-02 ~ 5.3E-02 4.5E-02
Smear Counting"^
Alpha (dpm/100 cm2)
Range
Average
Beta/Gamma (dpm/100 cm2)
Range
Average
24-46 2-33 2 1-6 1-22
Smear Counting"^
Alpha (dpm/100 cm2)
Range
Average
Beta/Gamma (dpm/100 cm2)
Range
Average
35 10 - 3 6
Smear Counting"^
Alpha (dpm/100 cm2)
Range
Average
Beta/Gamma (dpm/100 cm2)
Range
Average
12-13 10-1,700 5 4-1,170 4-10,301
Smear Counting"^
Alpha (dpm/100 cm2)
Range
Average
Beta/Gamma (dpm/100 cm2)
Range
Average 12.5 381 - 283 1,550
CSL Cesium-137 Smears (fxCi/100 cm2)
Range
Average
7.72E-06-8.49E-06 8.88E-06-3.64E-04 1.33E-05-5.03E-04 4.94E-05-I.38E-03
CSL Cesium-137 Smears (fxCi/100 cm2)
Range
Average 8.11E-06 9.1E-05 - I.52E-04 3.18E-04 OS i
RIW.IBI.

Table 4.1 (continued)
"Only one location was selected and measured on this wall. ^Background has not been subtracted from these measurements. CA11 smears were counted at the CSL, and background has been subtracted.
Note: Detailed results are given in Appendix F. Radiological contamination control levels of surfaces as recommended by U.S. DOE "Radiological Control Manual," June 1992, are:
Category Removable Total
(fixed plus removable)
I M,U, 23SU, 238U, and 1,000 dpm a! 100 cm2 5,000 dpm a/100 cm2
associated decay products
II Transuranics 20 dpm at 100 cm2 500 dpm a/100 cm2
III MTh, 2"Th, ^Sr, 733, Ra, 200 dpm oc/100 cm2 1,000 dpm a/100 cm2
224Ra, 232U, ,26I, m I , ,33I 200 dpm oc/100 cm2
IV Beta-gamma emitters 1,000 dpm 6-7/IOO cm2 5,000 dpm dpm B-7/IOO cm2
(nuclides with decay modes other than alpha emission or spontaneous fission) except ^Sr and others noted above
V Tritium organic compounds 1,000 dpm:dpm B-7/IOO cm2 10,000 dpm B-y/lOO cm2
R.lfe Mil

<P1 ffllCN^ffflTa
f -
(EG-2Q)
CEILING
FLOOR
EAST WALL
s
7 = (EGI?) \ C < COVER J ^ ^ . EAST ¥ . /—FLOOR
LOOR GALLERr / DRA,N
^ JB> J ® NORTH WALL FLOOR PLAN
\ (EGOJ
SOUTH WALL
FLOOR
C E I L I N G
WEST WALL
••: v 0
ON
J L. )6
SCALE IN FEET
DUO DOFOI9.OGN I / 1 7 / 9 4
Fig. 6.1. East gallery measurement locations.

6-7
detector is sensitive to gamma rays, X-rays, and beta rays; thus the difference between the two modes can provide an indication of the relative strength of the beta and gamma fields. Open window readings were slightly higher than closed window readings in the east gallery, indicating a slight elevation in the exposure fields due to beta activities.
Loose and fixed surface contamination can be compared using the results of the location-specific measurements. Loose surface contamination is represented by the smear results. Fixed surface contamination is determined by subtracting the loose surface contamination from the total surface contamination represented by the average direct (alpha or beta/gamma) readings. A comparison of average direct alpha readings and alpha smear counting results, both of which are shown in units of dpm/100 cm2 in Table 6.1, indicates that the alpha contamination is mostly fixed.
The comparison of average direct beta/gamma readings and beta/gamma smear results is less straightforward using Table 6.1 because the units for the direct readings (mR/h for closed window) and the units for the smear results (/xCi/100 cm2) are different. To convert the units for the smear results to mR/h, the following steps were taken.
(1) The principal contributor to the results was assumed to be cesium-137/barium- 137m (see Sect. 6.3.1.2).
(2) The cesium-137/barium-137m smear results for each wall and the floor were averaged (average values shown in both Tables 6.1 and 6.2).
(3) The Microshield gamma shielding code (Version 4, Grove Engineering 1992) was used to estimate exposure rates at 10 cm from surfaces (infinite plane model) based on the average cesium-137/barium-137m smear results.
The Microshield results are shown in Table 6.2. Comparison of the model results in Table 6.2 and the direct beta/gamma counting results (closed window at 10 cm) indicates that most of the beta/gamma contamination (i.e., cesium-137/barium-173m) is fixed.
Table 6.2. Model prediction of average exposure rates in the east gallery
Location Average CSL Results for Cesium-137/Barium-137m Smear Activity
Model Exposure Rate Predicted at 10 cm from Surface
OzCi/100 cm2) (mR/h)
South Wall 8.11E-6 1.37E-5
West Wall 9.01E-5 1.52E-4
East Wall 1.52E-4 2.57E-4
Floor 3.18E-4 5.37E-4
R-166

6 - 8
6.3.1.2 General area and smear gamma spectroscopy
A general area gamma spectroscopy measurement near the center of the east gallery (15 ft 7 in. due south from the north wall, 3 ft 8 in. from the west wall, and 1.95 ft above the floor; see Fig. 6.2) indicated that the primary isotope present is cesium-137/barium-137m.
Field gamma spectroscopy results were used to model the east gallery walls and floor to estimate the total amount of cesium-137/barium-137m that might be present. The walls and floor were modeled as rectangular volume sources (contamination assumed to be limited to the first 2.54-cm layer of the concrete) and rectangular surface sources (contamination assumed to be in the first 0.1-cm layer of the concrete). Microshield (Grove Engineering 1992) was used to model the wall, floor, and detector locations. The total activity for each wall was estimated by ratioing the field gamma spectroscopy results to the model results, taking into account the detector's intrinsic efficiency (approximately 15.5% for a 662-keV gamma line of cesium-137/barium-137m) and model curie concentration. The model assumed that the walls and floor were concrete with a density of 2.35 g/cm3 and a uniform cesium-137 concentration of 1 /zCi/cm3. This series of calculations resulted in cesium-137/barium-137m activity estimates of 190 and 129 ixd for volume and surface sources, respectively.
CSL smear gamma spectroscopy results ranged from 7.72E-06 to 1.38E-03 / Ci/lOO cm2
of cesium-137/barium-137m. Four of the 30 smears showed cobalt-60 also present, but in very small amounts (approximately 1 order of magnitude less than cesium-137/barium-137m). Table F.2 presents the results of these analyses. In addition, five smears with total beta activity that could not be accounted for by gamma spectroscopy were screened for strontium-90/yttrium-90. Three smears showed levels less than a few picocuries/smear; EG-11 and EG-27 had levels of 117 and 1070 pCi/100 cm2 of strontium-90/yttrium-90 (see Table 6.3).
Table 6.3. Strontium-90 analysis results for east gallery smears
Location ID "Sr Activity (/iCi/smear)
West Wall 06-EG-03 3.20E-6
06-EG-05 3.25E-6
06-EG-ll 1.17E-4
East Wall 06-EG-15 3.09E-6
Floor 06-EG-27 1.07E-3
6.3.1.3 Concrete core slit scanning
Two concrete core samples were obtained from the east gallery: one from the west wall (adjacent to the cells, location 72.SB002), approximately 24 in. long by 3.75 in. in diameter; and one from the floor (location 72.SB001), approximately 8.5 in. long by 3.75 in. in diameter (see Figs. 6.3 and 6.4). A field HPGe gamma spectroscopy system set up in
R-166

BUILDING 3506 PLAN
BLDG SECTION A Legend Location of Nal(il) Detector
Fig. 6.2. East gallery gamma spectroscopy locations.

6-10
Fig. 6.3. East gallery wall concrete core.
Fig. 6.4. East gallery floor concrete core.
' 4663.1

6-11
Building 3505 was used to slit scan (see Fig 6.5) the entire length of each core before it was broken up and shipped off site for analysis.
The width of the slit was approximately 0.25 in., and the distance between the core and the surface of the detector was approximately 20.3 cm (see Fig. 6.5). The detector was shielded with lead and steel blocks on all sides to minimize the effects of local area background. Each 0.25-in. section of core was scanned for 4 min, and the core was rotated in place by 1/4 turn every minute to allow all quadrants of the core to be exposed to the slit for an equal time and make the measurement results more uniform. Results indicate that the primary isotope present in east gallery cores is cesium-137/barium-137m. Each 0.25-in. section of core was modeled to estimate the level of contaminant concentration; a cylindrical geometry was used to model the core sections (3.75-in. diameter, 0.25-in. length). The model cesium-137 concentration was assumed to be 1 ^Ci/cm3 and uniform within the field of view of the slit, and the core density was assumed to be 2.35 g/cm3 (average concrete density). The cesium-137/barium-137m activity for each section was estimated by ratioing the field gamma spectroscopy measurement results to the model results, taking into account the detector's intrinsic efficiency (approximately 14% for a 662-keV gamma line of cesium-137/barium-137m) and the model curie loading of cesium-137. Background measurements performed at Building 3505 indicated that there are other sources of cesium in the counting area [approximately 15 counts in 4 min above the continuum in the region of interest (ROI), which corresponds to 1.6 nCi/cm3]. The slit scanning results provided relative information about contaminant penetration into the concrete surfaces.
Readings from the floor core (location 72.SB001) slightly exceeded the counting area background (less than a factor of 2) and were fairly uniform from one end to the other; results are tabulated in Table F.3 and plotted in Fig. 6.6.
Readings from the wall core (location 72.SB002) were slightly higher; results, which exceeded the counting area background and ranged from a factor of 2 to 7, are tabulated in Table F.4 and plotted in Fig. 6.7. The activity on this core was low (2 times background) at the gallery face, reached a maximum (6 times background) around 8 to 9 in. from the top, and diminished to approximately 4 times background at the cell face. These results do not behave as would be expected (i.e., showing most of the contaminant activity at the surface or within the first inch on both the east gallery and cell sides, and decreasing as distance from the surface increases). The behavior of this core (shown in Fig. 6.7) is not completely understood, but the figure shows that the average value of ROI counts throughout the core is approximately twice the Lc limit, which is so small that a definitive conclusion could not be reached. But the fact remains that the core seems to be slightly contaminated and could be considered solid low-level waste (SLLW) or very-low-activity (VLA) waste. This can also be observed from ASL results in Sect. 5 (see Table 5.2, 72.SB002, cesium-137 concentration). In addition, it should be noted that these measurements were performed in the field (with high background) to provide relative contamination activity for core as function of distance from surfaces.
R-166

-
6-12
Fig. 6.5. Gamma spectrocopy (HPGe) iiit scanning geometry/configuration
7 4663.2

w O 5 +
+ + 3 4 5 6
Distance from Top of Floor (in.)
-Core — — — -Background -
Lc » CTSB + 2OB,
where o B = V C T S i and C T S b = ROI background counts.
5.58 4732.3 Fig. 6.6. East gallery floor core activity profile (location 72.SB001).

Distance from Gallery Wall (in.)
o Core - - - -Background Lc
Lc = CTSb + 2 oBl
where oB = VCTSi and CTSB= ROI background counts.
Fig. 6.7. East gallery wall core activity profile (location 72.SB002).
5.58 4732.4

6-15
6.3.1.4 Other observations
Two small lead plates affixed to the west wall of the east gallery were pried off so that the potential presence of contamination underneath could be investigated. The smaller piece of lead covered one pipe, and the larger piece covered three pipes. Maximum exposure rates at these locations were 25 mR/h and 250 mrad/h at approximately 1 in.
6.3.1.5 Summary
Except for a few isolated locations (such as EG-07, which had alpha readings approximately 2 orders of magnitude higher), the east gallery generally seems to be fairly clean. The location under the lead plates had moderate levels of exposure, mostly due to beta activity. No abnormally high radiation exposure levels were encountered. Open window readings were slightly higher than closed window readings. Most of the contamination in the east gallery is fixed on the surface. Concrete cores obtained from this area are not highly contaminated, and the activity patterns along the length of the cores from the walls and floor differ as a function of distance from the core surface.
6.3.2 North/South Cells
Thirty-two 10-cm X 10-cm locations were selected from the walls of the cell area. Three directional gross gamma and gross beta/gamma measurements, three gross alpha measurements, and a smear were collected at each location; except for the smear, results were averaged and used as accepted values for this location. The smears were analyzed at the CSL for gross alpha and gross beta/gamma activity. Gamma spectroscopy was performed on smears that exceeded 500 cpm gross beta; some were also screened for strontium-90/yttrium-90. General area gamma spectroscopy measurements were conducted at each side of the walkway on the roof, and TLD strings were deployed at four locations to obtain the top-to-bottom contaminant profile of the inside cell walls.
Energy Systems sampled and analyzed the standing water in the cell area before pumping the water out. Analytical results showed gross alpha at <2.73E+02 pCi/L, gross beta at 2.65E+03 pCi/L, and cesium-137 at 3.55E+03 pCi/L.
6.3.2.1 Location-specific measurements
Table 6.4 presents summary results for location-specific measurements in the north/south cell area. Liquid and light sludge standing at the bottom of the north and south cells prevented floor locations from being measured, but sludge samples were collected and sent to the ASL.
The average background value measured for the field alpha counting system (an Eberline AC-3 probe) was approximately 14 dpm/100 cm2. The average background exposure rates measured for the field beta/gamma counting system (an Eberline HP-270 probe) were approximately 7.5E-03 mrad/h and 8.6E-03 mR/h for open and closed window mode, respectively. (Note that background has not been subtracted from the results of field
R-166

Table 6.4. Summary results of location-specific measurements in the north/south ceil area
North Cell Area South Cell Area
West Wall North Wall East Wall HEPA System" East Wali South Wall West Wall
Direct Alpha Counting'' (dpm 100/cm2)
Range
Average
44-306 46-67 16-206 58 74-769 93-130 77-136
Direct Alpha Counting'' (dpm 100/cm2)
Range
Average 104 54 80 — 260/., 110 101
Direct Beta/Gamma Counting1' at 10 cm
Open Window (mrad/h)
Range
Average
Closed Window (mR/h)
Range
Average
7.5E-01-3.2E-00 5.8E-01-8.4E-01 6.8E-01-1.1E+01 2.1E-00 4.2E-00-6.5E+01 2. 8E-00-7. 0E-00 1.7E-00-4.4E-00
Direct Beta/Gamma Counting1' at 10 cm
Open Window (mrad/h)
Range
Average
Closed Window (mR/h)
Range
Average
1.6E-00 7.0E-01 3.8E-00 - 1.9E+01 5.4E-00 3.0E-00
Direct Beta/Gamma Counting1' at 10 cm
Open Window (mrad/h)
Range
Average
Closed Window (mR/h)
Range
Average
6.4E-01-1.9E-00 5.2E-01-6.7E-01 2.9E-01-8.3E-00 1.75E-00 2.4E-00-3.8E+01 2.4E-00-5.9E-00 1.5E-00-2.5E-00
Direct Beta/Gamma Counting1' at 10 cm
Open Window (mrad/h)
Range
Average
Closed Window (mR/h)
Range
Average 1.1E-00 5.9E-01 2.7E-00 - 1.2E+01 4.0E-00 1.9E-00
Smear Counting" Alpha (dpm/100 cm2)
Range
Average
Beta/Gamma (dpm/100 cm2)
Range
Average
1-32 2-4 1-9 5 2-7 1-4 2-26
Smear Counting" Alpha (dpm/100 cm2)
Range
Average
Beta/Gamma (dpm/100 cm2)
Range
Average
10 3.3 4.2 - 4.4 1.8 9
Smear Counting" Alpha (dpm/100 cm2)
Range
Average
Beta/Gamma (dpm/100 cm2)
Range
Average
63-5,480 198-821 27-48,600 524 573-3,640 63-748 67-2,640
Smear Counting" Alpha (dpm/100 cm2)
Range
Average
Beta/Gamma (dpm/100 cm2)
Range
Average 563 511 9,420 - 1,920 462 859
a . • Ox
K im n i l .
'V

Table 6.4 (continued)
North Cell Area South Cell Area
West Wall North Wall East Wall HEPA System" East Wall South Wall West Wall
CSL Cesium-137 Smears OtCi/100 cm2)
Range 2.68E-05-5.21E-03 8.80E-05-2.3 E-04 7.35E-05-1.29E-02 2.14E-04 2.44E-04-1.45E-03
2.69E-05-3.22E-04 1.35E-04-4.46E-04
Average 1.4E-03 2.22E-04 2.95E-03 8.07E-4 1.94E-04 1.64E-04
"Only one location was selected and measured. 'Background has not been subtracted from these measurements. 'All smears were counted in the CSL, and background has been subtracted.

6-18
measurements presented in this section, but it has been subtracted by the CSL from smear results).
As explained in Sect. 6.3.1.1, the difference between open and closed window measurements provides information about beta/gamma and gamma fields. The beta/gamma (open window) fields in the cell area are slightly higher than the gamma fields (closed window), and most of the fields are generated from gamma emitting contaminants. Most of the contaminants in this area are fixed (see Tables 6.4 and 6.5).
Location-specific, directional gross gamma counting results are presented in Tables F.5 and F.6; measurement locations are shown in Fig. 6.8. These measurements were made with a modified Eberline HP-270A probe encased in approximately 1/4 in. of Plexiglas™. This probe is very insensitive to low exposure rates (fields < 10 mR/h) and is not designed for low-exposure field measurements.
As noted, standing water in the north/south cell areas was pumped out before field measurements were performed. Averaged results of location-specific measurements performed above and below the water mark show no appreciable differences (see Table 6.6).
6.3.2.2 General area gamma spectroscopy
Two general area gamma spectroscopy measurements were performed on each side of the steel plate across the centerline of the cell with the Nal(Tl) detector suspended approximately 9.8 ft and 2 ft below the roof elevation. The first location was approximately 8.2 ft from the north wall, 5 ft from the west wall of the north part of the cell, and 9.8 ft into the cell; the second was approximately 8.2 ft from the south wall, 4 ft from the west wall of the south portion of the cell, and 2 ft into the cell (see Fig. 6.9).
These measurements were performed to provide information regarding the isotopic distribution of radiological contaminants. Results indicate that the primary gamma emitting isotope present is cesium-137/barium-137m, at levels that exceed background by more than an order of magnitude.
Field gamma spectroscopy results were used to model the cell walls and estimate the total amount of cesium-137/barium-137m that might be present. The walls were modeled as rectangular volume sources (contamination assumed to be limited to the first 2.54 cm) and rectangular surface sources (contamination assumed to be limited to the first 0.1 cm). The QAD-CG/GP gamma shielding code (Cain 1977) was used to model the cell wall and detector locations. The total activity was estimated for each wall by ratioing the field gamma spectroscopy results to the model results, taking into account the detector's intrinsic efficiency (approximately 15.5% for a 662-keV gamma line of cesium-137/barium-137m) and the model curie concentration. The model assumed that the concrete walls had a density of approximately 2.35 g/cm3 and a nonuniform cesium-137 concentration. The cell wall vertical exposure profiles, measured using TLD strings, were used to develop a radiological model profile of the wall. The source loading input to the shielding code was weighted in the vertical direction according to the TLD information (Sect. 6.3.2.4). Calculated cesium-
R-1M

6-19
Table 6.5. Model prediction ,'of ^vtj.ntfe exposure rates in the north/south cell area
Location Cj
, Average CSL Reswlis-for Cesium-137/Barium- 137m1 Sirj -ar Activity
OiCi/ioo
Model Exposure Rate Predicted at 10 cm from Surface
(mR/h)
North Cell Area
West Wall 1.40E-3 2.36E-3
North Wall 2.22E-4 3.75E-4
East Wall 2.95E-3 4.98E-3
South Cell Area
East Wall 8.07E-4 1.36E-3
. South Wall 1.94E-4 3.27E-4
West Wall 1.64E-4 2.77E-4
ii
R-166.TBL

ROOF
'OBI MIOX WW
FLOOR
(WM^
NORTH WALL
(jjinD ij)
(NC-09) V
(wc7!?) (5C-Oj)
[SC-O?) > (sRi) (52^ /
EAST WALL
- N O T E t SHADING INDICATES LEVEL OF STANDING WATER BEFORE OSAINGE OF C E L L S .
: V NORTH •• CELL AREA
SOUTH CELL AREA
^ SL HEPA FLOOR PLAN
1 /v
— — ( F o p v — \ ^ T f ) .
^SC-13)
FLOOR
ROOF
WEST WALL
SOUTH WALL
SCALE IN FEET
16
DND DDF020.DGN 1/27/94 Fig. 6.8. Cell area measurement locations.

Table 6.6. Average results of location-specific measurements above and below water mark in the north/south cell area
Measurements Performed Cell Area Direct Alpha
Counting" (dpm/100 cm2)
Direct Beta/Gamma Counting at 10 cm"
CSL Smear Counting6
(dpm/100 cm2)
Below Water Mark North South
9.95E+01 1.10E+02
Open Window Closed Window (mrad/h) (mR/h) Alpha Beta/Gamma
Below Water Mark North South
9.95E+01 1.10E+02
3.02E+00 1.9E+00 5.79E+00 3.65E+00
9.38E+00 4.16E+03 4.83E+00 9.30E+02
Above Water Mark North South
6.72E+01 1.9E+02
2.27E+00 1.8E+00 1.23E+01 8.24E+00
2.78E+00 9.3E+03 5.63E+00 1.27E+03
" Background has not been subtracted from these measurements. b All smears were counted in the CSL, and background has been subtracted.

6-22 79 n'
BUILDING 3506 PLAN
£ NORTH i CELL
V?.- £
rhcf '
_ b v
tit . Si/.'V.'*" *
. ^ V- v- A '
14'
BLDG SECTION A Legend (Jg) Location,of Nalltl) Detector SC Soutt/Cell Area NC North Cell Area
Fig. 6.9. Cell area gamma spectroscopy locations.

6-23
137/barium-137m activities were 260 and 480 mCi for volume source assumptions for the first and second detector locations, respectively; calculated cesium-137/barium-137m activities were 17 and 32 mCi for surface source assumptions.
The CSL smear gamma spectroscopy results (1.35E-05 to 1.29E-02 fiC'i cesium-137/barium-137m/100 cm2) also indicate that the primary gamma emitting isotope is cesium-137/barium 137m (see Tables F.7 and F.8). Smear NC-02 also shows radium-226, but in very small amounts (approximately 1 order of magnitude less than the low end of the cesium-137/barium-137m activity range for smears). Ten smears with total beta activity that could not be accounted for by gamma spectroscopy results were screened for strontium-90/yttrium-90; activity levels ranged from 2 to 28 pCi/100 cm2 (see Table F.9).
6.3.2.3 Concrete core slit scanning
Concrete cores were obtained from the wall (approximately 24 in. long by 37.5 in. in diameter; sample location 72.SB003) and from the floor (approximately 47 in. long by 3.75 in. in diameter; sample location 72.SB004). Figures 6.10 and 2.16 show the cores taken from the cell wall and floor, respectively. The spectroscopy system and methods described in Sect. 6.3.1.3 were used for scanning these cores and evaluating the results, which indicated that the primary gamma emitting isotope is cesium-137/barium-137m.
The wall core readings slightly exceed the counting area background (less than a factor of 2). Readings are fairly uniform from one end to the other except that the 1-in. segment at the cell face exhibits readings appreciably higher than background (a factor of 15 to 3 from the top to the bottom of the 1-in. portion). Below this section, maximum activities were a factor of 2 higher than the measurement area background level. Results are presented in Table F.10 and Fig. 6.11.
The floor core was recovered in five pieces; it is not as uniform as the wall core, and the activity varies.
• The floor is covered with 1/8-in.-thick stainless steel plates welded together.
• The top layer is approximately 6.5 in. thick and appears to be of good-quality concrete.
• The second layer is approximately 13 in. thick, and the core was recovered in two pieces (approximately 4 in. and 9 in.). The surface of this layer is covered with red primer and gray paint, and the concrete composition and density are different from the first and third layers. This layer appears to contain more sand and less aggregate, is more porous, and has a lower density.
• The third layer is approximately 27.5 in. thick and was recovered in two pieces (4.5 in. and 23 in.). The composition and density of this layer are similar to those of the first.
The first piece (approximately 6.5 in.) is fairly uniform for most of the top portion ( ~ 6 in.) with activity levels near area background; the bottom 0.25 in. has activities greater
R-166

6-24
Fig. 6.10. Cell area wall concrete core.
4863.3

Distance from Cell Wall (in.)
a core - Background Lq
L C = C T S B + 2OB,
where oB= VCTSi and CTSB = ROI background counts.
Fig. 6.11. Cell area wall core activity profile (location 72.SB003).
5.5B 4732.5

6-26
than area background by a factor of 2 to 3. The other four pieces are fairly uniform along their length with activities greater than area background by a factor of 3 to 5 in most portions of each piece. A small portion of the second piece (approximately 1 in. long and 3 in. from the top edge) exhibited readings appreciably higher than background (approximately a factor of 6 to 20), as did the top 1.5-in. portion of the third piece (approximately a factor of 6 to 10). These areas were notably less dense than other areas of the pieces. Activities in the bottom portion of piece No. 4 were only a factor of 2 above the counting area background. Slit scanning results are presented in Table F . l l and Fig. 6.12.
6.3.2.4 TLD string measurements
TLD strings were deployed at four locations to obtain the top-to-bottom profile of contamination of the inside walls of the cells. The first string was deployed along the north wall of the north cell area; the other three were arranged along the west, east, and south walls of the south cell area (see Fig. 6.13). Each string consisted of 10 TLDs; from the bottom up, the first 5 were spaced at 1-ft intervals and the second 5 at 2-fit intervals. Each string was placed approximately 1 ft from the wall and left there to be exposed to radiation fields for a discrete amount of time. When the TLD strings were removed, they were sent to the ORNL Dosimetry Department for further analyses. TLD results range from approximately 0.5 to 24 mrem/h for deep dose rate (Hd) and 0.5 to 98 mrem/h for shallow dose rate (H,). H^ is reported for penetrating ionizing radiation such as gamma and X-rays, and H, is reported for medium-range ionizing radiation such as beta particles. Hd and Hs results are obtained from the response of TLD chips housed in the beta-shielded and thin window cavities of a TLD, respectively. Table F.12 presents the results of these measurements. Figures 6.14 and 6.15 present plots of shallow and deep dose rate profiles for all four strings; Figs. 6.16 through 6.19 present plots of shallow vs. deep dose rate profile for individual locations. r:
6.3.2.5 Other observations
A health physics survey (Appendix B) was conducted at the beginning of the investigation of Building 3506. The general area exposure rate (closed window) in the east gallery is < 1 mR/h. The general area exposure rate (closed window) in the cell ranges from 1 mR/h at the north end to 6 mR/h at the south end.
Six 3/8-in.-thick lead plates ranging in size from 11-3/8 x 24 in. to 18 x 24 in. are attached to the wall in,the north cell. The elevation of plates is below the floor of the adjacent east gallery. No measurements were performed underneath these lead pieces due to their size and weight.
Air filter samples from personnel monitoring devices [breathing zone apparatus (BZAs)] were collected and analyzed at the CSL for airborne activities. Results from all BZA air filters collected during these activities were below the derived air concentration limits reported in Federal Guidance Report No. 11 (ORNL 1988).
*
R-166

E & C 3 O o_ 1
V) © CD C
1000 - r
900 - -
800 - -
700 - -
6 0 0 - -
500 - -0 c •§) 400 <u CE co
1 <n O
300 - -
200
100 - -
46.75"
cr\ to •«J
15cts
15 20 25 30 35 Distance from Top of Floor (in.)
Core — Background - - Lc
Lc - CTSB + 2<TB< where aB = \/CT55 and CTSB = ROI background counts.
Fig. 6.12. Cell area floor core activity profile (location 72.SB004).
S.59 4732.6

32.0'
Cf MANHOLE C A C T COVER t R 3 1
GALLERY L00R
ORAIN- 10'P HOLE
o
o ~0~
• «• * • V v v » • ' .O", O-.'O', o-, o ' ,
.S-.o. . « -
O' . ' t
NORTH CELL
6' -I0V4'
STBIHC
28.0'
STRING J l Ul,JUl,iui | " —
. X-3*
. U I J LiJ Li N fcLI I
16
SCALE IN FEET
DND BDF004.DGN 11/2/93 Fig. 6.13. Cell area TLD string locations.

ro
o\ I MD
6 8 10 Distance from Floor (ft)
-String 1, N •String 2, W -String 3, E -String 4, S
Fig. 6.14. Cell area shallow dose profile.
5.58 «73M

Distance from Floor (ft)
String 1,N o String2,W O String 3, E A Siring 4, S
Fig. 6.15. Cell area deep dose profile.
5.58 4732.1 '

Distance from Floor (ft)
• Shallow A Deep
Fig. 6.16. Deep vs. shallow cell area dose profile (string 1, N).
6.58 4732.7

Distance from Floor (ft)
• Shallow A Deep
Fig. 6.16. Deep vs. shallow cell area dose profile (string 1, N).
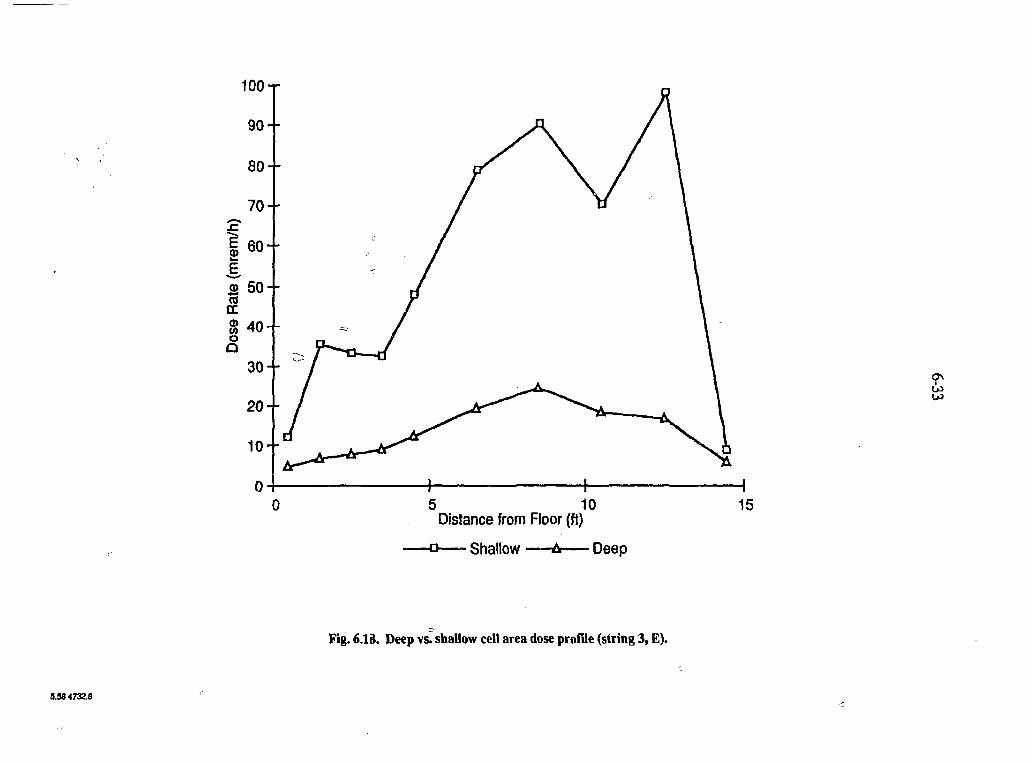
Distance from Floor (ft)
•o Shallow -—A Deep
Fig. 6.16. Deep vs. shallow cell area dose profile (string 1, N).
5.56 4732.8 0

w o D 2 +
1 +
H 1
0 5 10 15 Distance from Floor (ft)
Shallow A Deep
o Fig. 6.19. Deep vs. shallow cell area dose profile (string 4, S).
5,584732.10

6-35
6.3.2.6 Summary
In general, the cell seems to be contaminated with cesium-137/barium-137m and some alpha emitters. The level of the contamination is fairly low; general area exposure rates ranged from 1 to 5 mR/h, and no abnormally high radiation exposure levels were encountered. The stain mark that runs from top to bottom on the east wall of the south cell (same location as TLD string 3) was the only area exhibiting elevated readings. A health physics survey of the stain area approximately 213 cm above the floor and 91 cm from the south wall indicated exposure levels of 240 mrad/h and 90 mR/h at approximately 1 cm.
As in the east gallery, the north/south cell areas have higher open window readings than closed window, indicating a slight elevation in the exposure fields due to beta activities. Also, most of the surface contamination is fixed. Floor concrete core slit scanning results indicate a multilevel profile of contamination at various depths, implying that the floor was constructed at different times, perhaps for shielding purposes. Concrete cores from the wall indicate that most of the contaminants are confined to the first inch of the inner surface.
R-l«

7. WASTE TYPES AND VOLUME ESTIMATES
7.1 WASTE DISPOSAL TYPES
Solid and liquid wastes at ORNL are divided into four general categories: radioactive, hazardous, mixed, and sanitary. The waste categories can be further broken down into subcategories that have been defined in waste management plans and for which some protocols and waste acceptance criteria- (WAC) are available (Energy Systems 1993a,b: Gilpin 1992). If a final waste form resulting from D&D of Buildings 3506 matches the definition and WAC of an ORNL waste subcategory, then disposal or storage of the waste can proceed according to the established waste management protocols.
7.1.1 Radioactive
The principal wastes expected to be generated during D&D are radioactive—specifically, SLLW and liquid low-level wastes (any freestanding radioactive liquid waste was pumped out by Energy Systems prior to characterization). SLLW is defined as waste containing beta/garnma activity and/or alpha activity [in concentrations < 1 g/ft3 or <1 g total and transuranic (TRU) radionuclide specific activity < 100 nCi/g] and is not classified as high-level waste, TRU waste, or spent fuel. The SLLW category is divided into various subcategories; those subcategories with potential application to Building 3506 D&D are defined below (Energy Systems 1993a).
• Contact-Handled (CH) SLLW—Packaged waste with an unshielded container surface radiation dose equivalent rate of ^ 2 mSv/h (200 mrem/h). CH waste is divided into two groups: compactible (e.g., plastic bags and sheets, paper, cardboard, cloth, rubber gloves and shoe coverings, plastic bottles) and noncompactible (e.g., wood, scrap metal, glass bottles, metal tools, equipment).
• VLA Waste—Waste that contains no measurable contamination by radiation survey but, because of its past history and inaccessible areas, is judged by ORNL Radiation Protection to be possibly contaminated in excess of defined free release limits.
• Asbestos Waste—Any waste that contains commercial asbestos or asbestos material that is radioactively contaminated.
These types of SLLW, assuming that all the WAC are satisfied, are currently disposed of at ORNL's SWSA 6 or Interim Waste Management Facility.
Those subcategories of radioactive waste that were reviewed and, based on available information, do not apply to Building 3506 D&D are discussed below (Energy Systems 1993a).
• Remote-Handled (RH) SLLW—Packaged waste with an unshielded container surface radiation dose equivalent rate of > 2 mSv/h (200 mrem/h). RH waste is divided into two groups: (1) 2 mSv/h (200 mrem/h) to 10 mSv/h (1 rem/h) and (2) > 10 mSv/h (1 rem/h). RH SLLW >10 mSv/h (1 rem/h) is placed in retrievable storage. The RH SLLW
Rl«6 7-1

7-2
subcategory is not expected to apply to Building 3506 because the highest (closed window, near-surface) exposure rate measured in the building was 90 mR/h, which is approximately a factor of 2 less than the 200 mrem/h lower limit for this waste subcategory.
• TRU Waste—Waste contaminated with alpha emitting transuranic radionuclides (atomic number >92) with half-lives >20 years and specific activities > 100 nCi/g at the time of assay. Additional radioisotopes managed as TRU waste at ORNL include caIifornium-252, curium-244, and uranium-233. Most of the existing solid TRU waste storage facilities at ORNL are in the north area of SWSA 5; the wastes are stored there pending development of an approved strategy for permanent disposal. A review of Building 3506 sample results indicates that the specific activities of alpha emitting radionuclides are orders of magnitude less than the 100 nCi/g limit for a TRU waste.
• Fissile Waste Material—Solid waste that contains the isotopes uranium-233, uranium-235, plutonium-238,pIutoiiium-239,pIutonium-241, and/or the elements neptunium, americium. curium, berkelium, and californium. If the amount of fissile isotopes placed in a package exceeds 1 g of uranium-235 equivalent, or the concentration of fissile isotopes is greater than 1 g/ft3 uranium-235 equivalent, then it will be handled as fissile waste and will be stored retrievably. A review of sample data indicates that to be classified as a fissile waste, Building 3506 material would need quantities of the target isotopes orders of magnitude greater than thus far discovered.
7.1.2 Hazardous
The primary regulatory driver for ORNL hazardous waste management operations is RCRA; the secondary driver is TSCA. "Hazardous" compounds/substances are those that are listed in Subpart D of 40 CFR 261, and/or exhibit any of the characteristics of a hazardous waste as defined in Subpart C of 40 CFR 261 and 40 CFR 268, or fail the TCLP. If a waste is determined to be a hazardous waste, it must be handled in strict accordance with RCRA. The State of Tennessee, under the auspices of EPA, has implemented hazardous waste laws essentially equivalent to those of RCRA (Gilpin 1992). TSCA waste includes those compounds and substances contaminated with PCBs, as described in 40 CFR 761; nonradioactive asbestos is also regulated under TSCA. Several ORNL facilities are used for the short-term storage of hazardous waste. Although it is possible that small amounts of hazardous materials may be generated from Building 3506 D&D, it is considerably more probable that any chemical contamination is mixed with radiological contamination.
7.1.3 Mixed
Mixed waste is hazardous waste found to contain radioactive contamination. Examples include cleaning fluids or oils found in a radioactive environment and surface-contaminated lead. No on-site treatment of solid mixed wastes is currently available, and storage capacity at the Oak Ridge Reservation is limited. The sediment on the cell floor and the lead plates in the east gallery and cell are considered mixed waste.
R-!«6 w

7-3
7.1.4 Sanitary ,»
If some of the construction debris (including concrete, asphalt, and asbestos) resulting from D&D of Building 3506 is nonradioactive and nonhazardous, it may be disposed cf at the Sanitary Landfill II at the Y-12 Plant, or at an equivalent facility available at the time D&D is performed. Given the nature and extent of radiological contamination, however, it is expected that the bulk construction debris will be considered radioactive waste and not eligible for release as sanitary waste.
7.1.5 Summary and Uncertainties
In summary, the waste categories most relevant and applicable to Building 3506 D&D include CH SLLW, VLA, radioactively contaminated asbestos, and mixed waste. Uncertainties or issues with regard to waste categorization include the following.
• Lead is a possible RCRA constituent of the paint; a TCLP test may be needed to determine if D&D waste containing the paint has lead as a RCRA constituent.
• Cadmium and chromium were found to be possible RCRA constituents of one of the concrete cores; a TCLP test may therefore be needed to determine whether some of the concrete is a mixed waste. One of the concrete cores is also suspect with regard to PCBs because of its 56 R mg/kg analytical result.
• Four potential RCRA constituent metals were identified in the sediment sample from the cell floor. A TCLP test may be needed to determine RCRA applicability (the high PCB level in the sediment establishes TSCA applicability).
• Mercury was found to be a possible RCRA constituent of the soil sample; this may need to be investigated further if the D&D approach changes to include some soil removal.
7.2 WASTE DISPOSAL VOLUMES
The waste disposal volume estimates include the entire building, plus the foundation and equipment or materials within the building; they do not include the soils underneath and surrounding the building or the ancillary external piping or drains leading to or from the building. Remediation of the soils and ancillary external piping has been assigned to the Gunite and Associated Tanks Operable Unit and is not currently considered a part of D&D implementation. Also not included in the estimates is investigation-derived waste (e.g., protective clothing and equipment used during D&D implementation).
•I The disposal volume estimate was made based on as-built conditions determined through
field investigation and Energy Systems design drawings. Because the design drawings and field investigation gave conflicting information on the thickness and dimensions of the floor slab in the cell, a range for the concrete volume was calculated. The thickness was established by coring through the cell floor; the core length was 47 in., resulting in a
R - l t t

7-4
minimum thickness of 4 ft. The plan area of the cell foundation is where a large uncertainty exists. Energy Systems drawings show the foundation with a plan area of 30 ft by 16 ft, but the results of coring in and around the building suggest a plan area of approximately 36 ft by 22 ft with a potential thickness of 4.5 ft.
The concrete volume estimates include the walls, foundation/floor slab, sidewalk and miscellaneous pads, concrete stairs, and the valve pits. The steel volume estimate includes the roof plates, the railing and chain on the roof, the steel floor plate, the stairwell, the corrugated metal roof, and miscellaneous accessible pipes and drains. With the exception of the pipes and drains, most of the steel is assumed to be clean or easily cleanable. The wood consists primarily of portions of the roof. Sludge or sediment remains on the cell floor and in the sump; a sludge volume of 4 ft3 was calculated on the basis of conservative estimates of sludge thickness on the cell floor and sludge depth in the sump.
Some of the building material volumes were multiplied by the following swell factors to establish a disposal volume: concrete 1.25, steel 1.35, and wood 1.20. Swell factors for materials other than concrete, steel, and wood were assumed to be unity.
Four sets of waste volume estimates were prepared, each for a different D&D option.
(a) Complete dismantlement; all above- and below-ground materials are demolished and removed.
(b) No scabbling of concrete surfaces; concrete rubble is not segregated according to relative activity but is instead all designated as CH SLLW.
(a) Complete dismantlement. (b) Scabbling of cell walls to a depth of 1/4 in.; scabbled material is
designated as CH SLLW. It is assumed that the remaining portion of the cell walls has little or no contamination and is therefore designated as VLA waste.
(c) Segregation of the concrete pad; the top 20 in. of the pad is removed and designated as CH SLLW, and the remainder of the pad is designated VLA waste. The 20-in. depth assumes an existing "break" in the concrete at 19.5 in. (caused by separate concrete pours), and then the top 0.5 in. of the bottom concrete layer is scabbled.
(a) Complete dismantlement. (b) Scabbling of cell walls to a depth of 1 in. (surface contamination is more
deeply embedded in the concrete than in Option 2). (c) Segregation of the concrete pad (at 20 in.).
(a) Partial dismantlement; all of the above-ground (above-grade) materials are demolished and removed. The below-ground materials, with the exception of that quantity scabbled (see below), remain to be temporarily buried and then remediated with the surrounding soil as part of the Gunite and Associated Tanks Operable Unit.
(b) Scabbling of cell walls to a depth of 1 in. (both above and below grade).
Option 1.
Option 2.
Option 3.
Option 4.
7-5
Table 7.1 shows disposal volume estimates for the four waste removal and segregation options as a function of waste category and building material. For the complete dismantlement options, scabbling and subsequent segregation would significantly reduce CH SLLW disposal volume (but also be more labor intensive). The partial dismantlement option results in the smallest volumes of waste.
7.3 TOTAL CURIE ESTIMATES
The total volumes estimated for concrete and sediment and the radionuclide concentrations reported by the ASL were used to estimate the total curie content of the radionuclides in concrete and sediments. The calculations assumed densities of 1.1 g/cm3 and 2.3 g/cm3 for sediment and concrete, respectively.
Concentrations of radionuclides in the east gallery walls and floor were assumed to be represented by the floor core sample (SB.72001). The radionuclide concentrations in the cell area were assumed to be represented by the average concentrations in the concrete cores obtained from the east gallery and cell wall (72.SB002) and the cell/crawlspace wall (72.SB003). Average radionuclide concentrations in two samples (containers 3 and 9) from the cell floor core (72.SB004) were assumed to be representative of the radionuclides in the cell floor concrete slab.
The total curie content was calculated'for the two volume estimates described in Sect. 7.2; the total curie content for various radionuclides is listed in Table 7.2.
Radionuclide concentrations and volumes of a 55-gal drum or LSA box were used to determine whether the waste generated from demolition of Building 3506 construction materials would be in the TRU or fissile waste categories. These calculations indicated that waste packaged in 55-gal drums or LSA boxes would not be considered TRU or fissile.
Exposure rates generated by this material packaged in 55-gal drums and LSA boxes were calculated using Microshield; results indicated that waste packages would be CH SLLW.
R-166

Table 7.1. Disposal volume estimates (ft?)
Waste Removal and Segregation Options
Waste Category
Building Materia 1
Option 1: Complete Dismantlement; No Seabbling of
Concrete
Option 2: Complete Dismantlement;
Scabbling to 1/4-in. Depth; Pad Segregation
Option 3: Complete Dismantlement;
Scabbling to 1-in. Depth; Pad Segregation
Option 4: Partial Dismantlement;
Scabbling to 1-in. Depth
CHSLLW Concrete rubble Steel (piping)
8,19& to 10,253 12
1,023 to 1,673 12
1,091 to 1,741 12
91 12
VLA Waste" Concrete rubble Steel (other) Wood
0 78 103
7,175 to 8,580 78 103
7,107 to 8,512 78 103
3,799 75 103
Mixed Waste Sediment/sludge Lead shielding
4 0.6
4 0.6
4 0.6
4 0.6
Asbestos1" Window putty and tar paper
Minor (no estimate)
Minor (no estimate)
Minor (no estimate)
Minor (no estimate)
" May be categorized as sanitary waste debris if determined to be nonhazardous and nonradioactive. h Asbestos is assumed to be radioactively contaminated.

7-7
/
Table 7.2. Total curie fpntent of radionuclides in concrete and sediment
Radionuclide Total Curies in Concrete
Low volume High volume Total Curies in
Sediment 137Cs 2.04E-1 3.59E-1 3.84E-3 -
2.51E-3 3.82E-1 1.21E-5
"Co 2.56E-5 4.60E-5 4.27E-7 8 J U — ~ 2.53E-6
234/233y 3.74E-4 5.03E-4 4.27E-7 235U 4.19E-5 5.15E-5 1.99E-8 238U 3.73E-4 5.13E-4 2.79E-7
228Th 2.37E-4 2.75E-4 6.73E-8 229Th — — 2.33E-6 230Th 5.06E-4 6.29E-4 4.98E-9 232Th 2.17E-4 2.63E-4 ' 6.85E-8 238pu 1.4E-4 1.64E-4 1.45E-7
239/240py 4.93E-4 8.14E-4 4.41E-6 242Pu — ~ 2.55E-6

8. SUMMARY AND CONCLUSIONS
This section summarizes key planning information gathered during site characterization that may assist in the engineering of D&D approaches, the protection of D&D workers, and the management of D&D-generated wastes. The summaries presented here are organized by the data needs identified in the site characterization plan (Bechtel 1993a). The organization is somewhat arbitrary, as much of the data collected can and will be used for engineering, personnel protection, and waste management.
8.1 ENGINEERING PLANNING u
• Building 3506 was partially decontaminated before it was abandoned, and a filter housing and a few pipes and supports are the only remaining equipment. The partially decommissioned condition of the building will facilitate D&D implementation (see Sect.
• The structural integrity of the building is adequate (i.e., the building will remain structurally intact) for safe decontamination or demolition. All sides of the building can be accessed for D&D purposes, though utility lines to the west may need to be rerouted (see Appendix C).
• The foundation slab of the cell is 4-ft-thick concrete with a stainless steel liner. The slab consists of at least three distinct layers: a top layer 6.5 in. thick, a middle layer 13 in. thick, and a bottom layer 27.5 in. thick. The middle layer appears to be an old floor and exhibits the most radiological contamination. The bottom layer appears to be a base pad or mud mat from construction and is slightly contaminated (see Sect. 2).
• Concrete core slit scanning indicates that, with exception of the cell floor slab, most of the measured activity in the cell is within 1 in. of the surface; the activity distribution along the remainder of the core length is relatively uniform (see Sect. 6).
• General area measurements and concrete core gamma spectroscopy indicate that the primary gamma emitting isotope present is cesium-137/barium-137m (see Sect. 6).
• Comparison of direct measurements and smears shows that most of the contamination is fixed (see Sect. 6).
• TLD string results from four cell locations ranged from approximately 0.5 to 18 mrem/h for deep dose rate and 0.5 to 98 mrem/h for shallow dose rate. Tne east wall of the cell's south section exhibited higher activity than the other walls. The dose profile from the north and west walls indicated a higher dose rate at the bottom of the cell that decreased with height. But the east and south walls behaved differently—the doselirate was relatively low at floor level, reached a maximum at around 8 to 10 ft from the floor, and then decreased again at greater heights (see Sect. 6).
R-16S 8-1

7-2
• It was not possible to investigate the valve pit north of Building 3506 without destructive access; however, no elevated radiation readings were found around the valve pit exterior. Contamination of concrete-embedded or underground piping also was not investigated (see Sect. 3).
8.2 PERSONNEL PROTECTION PLANNING <
• The general area exposure rate (closed window) in the east gallery is <1 mR/h. The general area exposure rate (closed window) in the cell ranges from 1 mR/h at the north end to 6 mR/h at the south end (see Sect. ^
• Location-specific direct beta/gamma readings ranged from < 1 to 38 mR/h (closed window) and < 1 to 65 mrad/h (open window). One location approximately 7 ft high on the east wall of the south portion of the cell exhibited an exposure rate of 25 mR/h (closed window) and 60 mrad/h (open window) at a distance of approximately 10 cm from the surface. The same area was measured as 240 mrad/h and 90 mR/h on contact during a health physics survey (see Sect. 6).
• Alpha activity is generally higher in the cell than in the east gallery. Alpha activity ranged from 16 to 769 dpm/100 cm2; smear results ranged from 1 to 32 dpm/100 cm2 (see, Sect. 6). ^
• One location-specific measurement on the west wall (location 06-EG-07) exhibited a higher alpha reading than other east gallery locations; the alpha activity was 7090 dpm/100 cm2
for direct measurements and 33 dpm/100 cm2 for smears. The beta/gamma reading (open window) at this location was approximately 0.5 mrad/h (see Sect. 6)!
• Two small lead plates affixed to the west wall of the east gallery were removed to allow investigation of contamination of underlying pipes. Maximum exposure rates at these locations were 25 mR/h (closed window) and 250 mrad/h (open window) at a distance of approximately 2.5 cm (see Sect. 6).
8.3 WASTE MANAGEMENT PLANNING
• Concrete rubble will be by far the largest volume of waste generated, with a total of 8000 to 10,000 ft3 for complete dismantlement and 3900 ft* for partial dismantlement. Classification of the concrete waste (CH SLLW versus VLA) depends on the D&D techniques used (see Sect. 7).
• Total curie estimates were calculated for concrete rubble using average radionuclide concentrations and both the low and high waste volume estimates (previous bullet):
R-!«
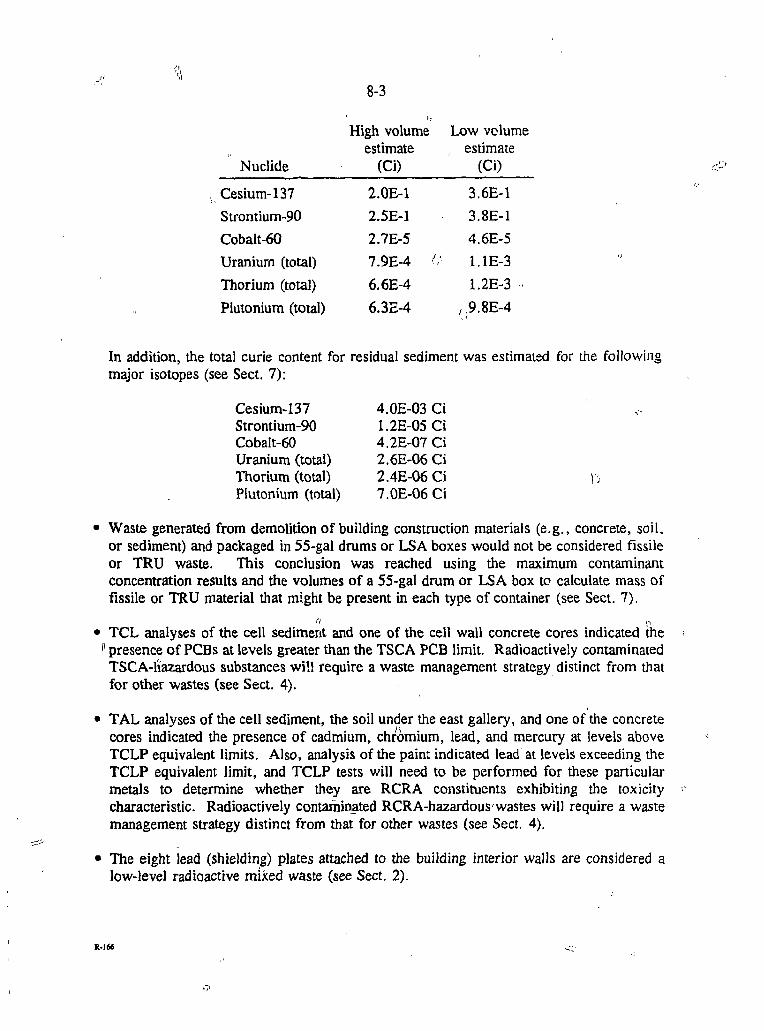
8-3
Nuclide
High volume Low volume estimate estimate
(Ci) (Ci)
Cesium-137 Strontium-90 Cobalt-60 Uranium (total) Thorium (total) Plutonium (total)
2.0E-1 3.6E-1 2.5E-1 3.8E-1 2.7E-5 4.6E-5 7.9E-4 C- 1.1E-3 6.6E-4 1.2E-3 6.3E-4 / ,9.8E-4
In addition, the total curie content for residual sediment was estimated for the following major isotopes (see Sect. 7):
• Waste generated from demolition of building construction materials (e.g., concrete, soil, or sediment) and packaged in 55-gal drums or LSA boxes would not be considered fissile or TRU waste. This conclusion was reached using the maximum contaminant concentration results and the volumes of a 55-gal drum or LSA box to calculate mass of fissile or TRU material that might be present in each type of container (see Sect. 7).
O J,
• TCL analyses of the cell sediment and one of the cell wall concrete cores indicated the fl presence of PCBs at levels greater than the TSCA PCB limit. Radioactively contaminated TSCA-liazardous substances will require a waste management strategy distinct from that for other wastes (see Sect. 4).
• TAL analyses of the cell sediment, the soil under the east gallery, and one of the concrete cores indicated the presence of cadmium, chromium, lead, and mercury at levels above TCLP equivalent limits. Also, analysis of the paint indicated lead at levels exceeding the TCLP equivalent limit, and TCLP tests will need to be performed for these particular metals to determine whether they are RCRA constituents exhibiting the toxicity characteristic. Radioactively contaminated RCRA-hazardous'wastes will require a waste management strategy distinct from that for other wastes (see Sect. 4).
• The eight lead (shielding) plates attached to the building interior walls are considered a low-level radioactive mixed waste (see Sect. 2).
Cesium-137 Strontium-90 Cobalt-60 Uranium (total) Thorium (total) Plutonium (total)
4.0E-03 Ci 1.2E-05 Ci 4.2E-07 Ci 2.6E-06 Ci 2.4E-06 Ci 7.0E-06 Ci
R-166

7-4
8.4 CONCLUSIONS
• The gallery is relatively clean, with only a few hotspots of contamination. The cell area is contaminated, with most of the contamination fixed to the surface of the cell walls.
• Since most of the radioactive contamination was found within the first inch of the concrete surface, surface decontamination operations would facilitate segregation of building wastes, into separate categories (e.g., mixed waste versus CH SLLW versus suspect or Vb'A waste). For example, decontamination and scabbling of particular "hot" spots in the east gallery could likely render the remainder of the gallery material as VLA waste.
• Further investigation or future remediation of the soils underlying and surrounding Building 3506 may be advantageously postponed to coincide with the remediation of the WAG 1 Gunite and Associated Tanks Operable Unit.
• Standard health physics practices (e.g., air monitoring, protective clothing, contamination control) will be sufficient for protection of D&D workers. Specifically, remote ^decontamination and demolition technologies will probably not be necessary.
a
R-166

9. REFERENCES
Bechtel 1992. Site Characterization Summary Report for Waste Area Grouping 1 at Oak Ridge National Laboratory, Oak Ridge, Tennessee, ORNL/ER/Sub/87-99053/59, Oak Ridge, Tennessee.
Bechtel 1993a. Site Characterization Plan for the Decontamination and Decommissioning of Buildings 3506 and 3515 at Oak Ridge National Laboratory, Oak Ridge, Tennessee, ORNL/ER/Sub/87-99C)53/69, Oak Ridge, Tennessee.
Bechtel 1993b. Technical Specification for Analytical Laboratory Services: Oak Ridge National Laboratory Remedial Investigation/Feasibility Study, Oak Ridge, Tennessee, Specification 19118-99-SP-03, Rev. 4, Oak Ridge, Tennessee.
Bechtel 1993c. Environmental, Safety, and Health Plan for the Remedial Investigation/ Feasibility Study at Oak Ridge National Laboratory, Oak Ridge, Tennessee. ORNL/ER/Sub/87-99053/3, Oak Ridge, Tennessee.
Cain, V. R. 1977. A Users Manual for QAD-CG, The Combinatorial Geometry, Version of the QAD-PSA, Point Kernel Shielding Code, RSIC, Oak Ridge National Laboratory, Oak Ridge, Tennessee.
Energy Systems 1993a. Waste Acceptance Criteria for Radioactive Solid Waste Disposal at SWSA 6, WMRA-WMPC-203, Oak Ridge, Tennessee.
Energy Systems 1993b. Waste Acceptance Criteria for Remote Handled Solid Low Level Waste Storage, WMRA-WMPC-205, Oak Ridge, Tennessee.
EPA 1988. Laboratory Data Validation: Functional Guidelines for Evaluating Inorganics Analyses.
EPA 1990. USEPA Contract Laboratory Program: National Functional Guidelines for Organic Data Review.
EPA 1991a. USEPA Contract Laboratory Program: Statement of Work for Organic Analysis, Multi-Media, Multi-Concentration, Document Number OLMOl.O, including Revisions OLMOl.l, OLMOl.2, OLMOl.3, OLMOl.4, OLMOl.5, OLMOl.6, OLMOl.7. and OLMOl.8.
EPA 1991b. USEPA Contract Laboratory Program: Statement of Work for Inorganic Analyses, Multi-Media, Multi-Concentration, Document Number OLM02.0, including Revision ILM02.1.
EPA 1992. Health Effects Summary Tables (HEAST), Annual FY 1992, OERR 9200.6-303 (92-1).
R-l 66 9-1

7-9
EPA 1993. Integrated Risk Information System (IRIS).
Etnier, E. L., E. P. McDonald, and L. M. Houlberg 1993. Applicable or Relevant and Appropriate Requirements (ARARs) for Remedial Action at the Oak Ridge Reservation: A Compendium of Major Environmental Laws, ES/ER/TM-1/R2, Oak Ridge, Tennessee.
Gilpin, J. K. 1992. Oak Ridge National Laboratory Waste Management Plan, ORNL/TM-11433/R2, Oak Ridge, Tennessee. ;
Grove Engineering 1992. "Microshield Version 4, User's Manual," Grove Engineering, Rockville, Maryland.
Horton, J. R. 1984. Preliminary Decommissioning Study Reports, Vol 14: Old Waste Evaporator (3506) and Fission Product Pilot Plant (3515), X-OE-231. Oak Ridge. Tennessee.
ORNL 1988. Limiting Values of Radionuclide Intake and Air Concentration and Dose Conversion Factors for Inhalation, Submersion, and Ingestion, Federal Guidance Report No. 11, Oak Ridge, Tennessee.
K-1C6

Appendix A:
List of Known Drawings of Building 3506

A-2
NUMBER TITLE BLDG. NO. 3506
D-36276 Equipment Promethium 147 FIRST FLOOR PLAN SECOND FLOOR PLAN SECTIONS
D-36278 Equipment Promethium 147 INTERIOR STAIRS & DOOR DETAILS
D-35553 CELL VENTILATION FILTER PIT PLAN & SECTION
D-36076 Equipment for Rare Earth Separation FP-6 LOCATION OF TRANSPORT LOADING PAD
S20536EB001D Stairway & Cover PLAN AND ELEVATION
C-35863 System for Rare Earth Separations PLOT PLAN
D-36277 Equipment Promethium 147 SECTIONS & DETAILS
D-36030 System for Rare Earth Separation of FP-6 ION EXCHANGE COLUMNS SUPPORT DETAILS
D-36032 System for Rare Earth Separation of FP-6 EQUIPMENT LOCATION @ el 800'-0" IN CELL
D-36035 System For Rare Earth Separation FP-6 EVAPORATORS E-l & E-2
D-36036 System for Rare Earth Separation FP-6 SAMPLER CUBICLE LOCATION & SECTION
D-36037 System for Rare Earth Separation FP-6 SAMPLER CUBICLE DETAILS Sht I
D-36038 System for Rare Earth Separation FP-6 SAMPLER CUBICLE DETAILS Sht 2
D-36039 Equipment for Rare Earth Separation FP-6 LIQUID-LIQUID EXTRACTION PROCESS SCHEME
D-36040 Equipment Promethium 147 HOLD-UP TANK H-l DETAILS
D-36041 System for Rare Earth Separation FP-6 STEEL CAN DETAILS B1 ,B2,B3,B6 & B7
• 166

A-3
NUMBER TITLE BLDG. NO. 3506
D-36043 System for Rare Earth Separation FP-6 PUMP - MOTOR ASSEMBLY P-9, P-16, P-17 & P-18
D-36045 System for Rare Earth Separation FP-6 EQUIPMENT SUPPORT DETAILS SHEET #1
D-36046 System for Rare Earth Separation FP-6 MISC. PROCESS EQUIPMENT FOR CELL
D-36047 System for Rare Earth Separation FP-6 DEMINERALIZED WATER TANK T-6
D-36048 System for Rare Earth Separation FP-6 SUPPORT DETAILS FOR EVAPORATORS ft\ & HI
D-36049 System for Rare Earth Separation FP-6 OPERATING GALLERY EQUIPMENT & PIPING ARRANGEMENT PLAN
D-36050 System for Rare Earth Separation FP-6 OPERATING GALLERY EQUIPMENT & PIPING ARRANGEMENT ELEVATION A-A & SECTIONS
D-36051 System for Rare Earth Separation FP-6 OPERATING GALLERY EQUIPMENT & PIPING ARRANGEMENT SECTION B-B & SECTION C-C
D-36054 System for Rare Earth Separation FP-6 WASH TANK W-l AND W-2 DETAILS
D-36055 Segmenting Cells PNEUMATIC CONTROL SYSTEM FOR CHARGER DOOR SEAL
D-36056 System for Rare Earth Separation FP-6 DETAIL "X" SCHEMATIC OF PIPING TO PUMPS P-2, P-3, & P-ll
D-36057 System for Rare Earth Separation FP-6 MODIFICATION OF 4-1/2" O.D. ION EXCHANGE COLUMNS
D-36058 System for Rare Earth Separation FP-6 SUPPORTS FOR CONTACTORS, UPPER LEVEL INSIDE CELL
D-36059 System for Rare Earth Separation FP-6 CELL PIPING SHEET # 1
D-36060 System for Rare Earth Separation FP-6 CELL PIPING SHEET 8 2
R-166

A-4
NUMBER TITLE BLDG. NO. 3506
D-36061 System for Rare Earth Separation FP-6 CELL PIPING SHEET 8 3
D-36062 System for Rare Earth Separation FP-6 MODIFICATION OF TANKS T-l & T-2
D-36063 System for Rare Earth Separation FP-6 MODIFICATION OF TANKS T-3, T-4, AND T-5
C-36065 Equipment for Rare Earth Separation FP-6 SAMPLE BOTTLE HOLDER CLIP
D-36066 System for Rare Earth Separation FP-6 AUXILIARY EQUIPMENT FOR CONTACTOR VESSELS
D-36067 System for Rare Earth Separation FP-6 SAMPLER STATION ASSEMBLY & INSTALLATION
D-36068 Equipment for Rare Earth Separation FP-6 SAMPLER STATION DETAIL SHEET #1
D-36069 Equipment for Rare Earth Separation FP-6 SAMPLER STATION DETAIL SHEET #2
D-36070 Equipment for Rare Earth Separation FP-6 SAMPLER STATION DETAIL SHEET #3
D-36071 System for Rare Earth Separation FP-6 SAMPLER STATION PIPING
D-36072 System for Rare Earth Separation FP-6 OPERATING GALLERY EQUIPMENT PIPING ARRANGEMENT ELEVATION K-K
C-36073 System for Rare Earth Separation FP-6 SOLUTION ADDITION FUNNEL DETAILS
D-36074 System for Rare Earth Separation FP-6 CONTACTORS #1 AND #2 FEED LINE DETAILS
D-36075 MIXER BLADE & SHAFT FOR WASH TANKS
D-36077 Equipment for Rare Earth Separation FP-6 TRANSPORT LOADING STATION-DETAILS
D-36079 System for Rare Earth Separation FP-6 OPERATING GALLERY - EQUIPMENT & PIPING ARRANGEMENT PLAN (EXTRACTION EQ'PT. ONLY)
•166

A-5
NUMBER TITLE BLDG. NO. 3506
D-36080 System for Rare Earth Separation FP-6 OPERATING GALLERY EQ'PT. & PIPING ARRANGEMENT -ELEVATION A-A & SECTIONS (EXTRACTION EQ'PT. ONLY)
D-36081 System for Rare Earth Separation FP-6 1
APPARATUS FOR PUMP DELIVERY OF CHEMICAL
D-36082 System for Rare Earth Separation FP-6 OPERATING GALLERY EQ'PT & PIPING ARRANGEMENT ELEV. K-K (EXTRACTION EQ'PT. ONLY)
D-36083 System for Rare Earth Separation FP-6 CELL PIPING SHEET #1 EXTRACTION EQUIPMENT ONLY
D-36084 System for Rare Earth Separation FP-6 CELL PIPING SHEET »2 EXTRACTION EQUIPMENT ONLY
D-36085 System for Rare Earth Separation FP-6 CELL PIPING SHEET #3 EXTRACTION EQUIPMENT ONLY
C-36090 System for Rare Earth Separation FP-6 MODIFICATIONS TO 20 STAGE CONTACTOR (TWO 10 STAGE DUPOINT MIXER SETTLERS
D-36091 Equipment for Rare Earth Separation FP-6 TEMPORARY OBSERVATION WINDOWS FOR CONTACTOR #1
D-35854 Equipment Promethium 147 12" CELL VENT. DUCT FROM BLDG. 3506 TO 54" DUCT AT 4TH ST PLOT PLAN - SHEET 1
D-35855 Equipment Promethium 147 12" CELL VENT. DUCT FROM BLDG. 3506 TO 54" DUCT AT 4TH ST PLOT PLAN - SHEET 2
D-35856 Equipment Promethium 147 12" CELL VENT. DUCT FROM BLDG. 3506 TO 54" DUCT AT 4TH ST PROFILE - SHEET 1
D-35857 Equipment Promethium 147 12" CELL VENT. DUCT FROM BLDG. 3506 TO 54" DUCT AT 4TH ST PROFILE - SHEET 2
D-35858 Equipment Promethium 147 2" OFF GAS LINE FROM BLDG. 3506 TO 10" DUCT AT 4TH STREET PLOT PLAN & DETAIL SHEET 1
R-166

A - 6
NUMBER TITLE BLDG. NO. 3506
D-35859 Equipment Promethium 147 2" OFF GAS LINE FROM BLDG. 3506 TO 10" DUCT AT 4TH STREET PLOT PLAN & DETAIL - SHEET 2
D-35860 Equipment Promethium 147 2" OFF GAS LINE FROM BLDG. 3506 TO 10" DUCT AT 4TH STREET PROFILE - SHEET 1
D-35861 Equipment Promethium 147 / / 2" OFF GAS LINE FROM BLDG. 3506 TO 10" DUCT AT 4TH STREET PROFILE - SHEET 2
C-35862 Sanitary Sewage System 7000 Area PLOT PLAN
E-35889 Equipment - Promethium 147 IMMI CONTACTOR M5-17 & MS-18 REVISED GEAR BOX ASSEMBLY
D-35890 Equipment - Promethium 147 IMMI CONTACTOR MS-17 & MS-18 REVISED GEAR BOX DETAIL SHEET 1
D-35891 Equipment - Promethium 147 IMMI CONTACTOR MS-17 & MS-18 REVISED GEAR BOX DETAIL SHEET 2
D-35892 Equipment - Promethium 147 IMMI CONTACTOR MS-17 & MS-18 REVISED GEAR BOX DETAIL SHEETS
E-35893 Equipment - Promethium 147 r; IMMI CONTACTOR MS-19 REVISED GEAR BOX ASSEMBLY
D-35894 Equipment - Promethium 147 IMMI CONTACTOR MS-19 REVISED GEAR BOX DETAIL SHEET 1
D-35895 Equipment - Promethium 147 IMMI CONTACTOR MS-19 REVISED GEAR BOX DETAIL SHEET 2
D-35896 Equipment - Promethium 147 IMMI CONTACTOR MS-19 REVISED GEAR BOX DETAIL SHEET 3
D-35897 Equipment - Promethium 147 IMMI CONTACTOR MS-19 REVISED GEAR BOX DETAIL SHEET 4
•166

NUMBER TITLE BLDG. NO. 3506
D-35554 Equipment Promethium 147 CELL VENTILATION FILTER PIT LINER - DETAILS
D-3555S Equipment Promethium 147 CELL VENTILATION DUCTWORK DETAILS
D-35556 Equipment Promethium 147 CELL VENTILATION CONCRETE PIT DETAILS
D-35557 Equipment Promethium 147 CELL VENTILATION 12" SST BUTTERFLY VALVE
C-5445 Tank Farm Evaporator , 206 AREA BLDG 3506 DRAWING LIST
D-37074 System for Rare Earth Separation FP-6 DRAWING INDEX
D-36029 Equipment Promethium 147 AQUEOUS HOLD-UP TANK H-4
R-166

Appendix B: l!
ES&H Survey of Building 3506

f ORNL Rl/FS PROJECT JOB 19118
B - 2
ES&H SURVEY F O R M
0 2 3 5 6 I
Page \ of 7
rioN / . •Ia S r ^ U , (Floor) YC
SURVEY NO. 7-0 - C O O - i ^ . 714
HWP NO.
01 - Geo I - Z DATE TIME
' Hao ErORfS)
F l e w INSTRUMENT TYPE ^ SERIAL NO.
5
CALIBRATION DUE D A T E ^
C.F. BKG, CT. Jfi. RADIATION TYPE: ID-*CCPHA CD^ETA E--GAMMA • NEUTRON
/•SeeaH&cU^-B^MEAR OXOTl
" TIME: TIME: yUA
FLOW R VOLUME AJA-
SURVEY TYPE: ^ • AIRBORNE T. rTOSE RATE • LIQUID iTHER
TAMINATION RESULTS RESULTS
Bq/IOOcm' RESULTS
dpm/lQOem'
LacA'-^C) Cbtk
sas J - t f f —
*
- Bo*, cf
Um*mmmmY//M r N i w
coonW ^or^ /v i t
® F?rs+ rtW eeu+uiaW, taoocwv,
© Crack r*>i~&.eas4- tjf df txUj loop CfM #
<0 Ale,a- wc.l^ SS»o cPA\ .
© Ficxsr bs< d/vA gQOG c f / n .
© Floor corner be* ba^vart i.oooo CPA\ .
f W frortv T.OO'iHO
CPAA u/ltU parvtciAce 6 - f \ <At+ecV.
AJo Jefec4nUt
Ucc-Ved. on of feoiUl.'A^ Zttfo.
DOSE-RATE RESULTS
NO mGy/hr mrsd/hr
— » i ^ v i w n t i
Boo of M:$c. «/\oLa. •fdxv <Are«..kA locuieJ \o*tJL. floor. /e*ls vjitr*.
E f f i <Wgr for imAr J8 % O f t
A c - a RBHom ' M i JTS:
KPLETED BY: —
REVIEWED BY:
L i k s M n , FIELD HEALTH A N p Si HEALTH AND SAFETY TECHNICIAN SAFETY SUPERVISOR

ORNL RI/FS PROJECT JOB 19118
B - 3
ES&H SURVEY FORM
0 2 3 5 6 1
( W 3 of 7
:ATION 3.5TOO G o l l a - w 1 W a l l J
SURVEY NO. HWP NO. 0( - o o o i -
DATE
°ihu fcz TIME
' / < / o o •IVEYORfSI 1 INSTRUMENT TYPi y SERIAL NO. CALIBRATION DUE DATE;*-
C.F. # 6KG. CT. RADIATION TYPE: £ W t f > H A C&-BETA G X l S M M A • NEUTRON
SURVEY TYPE: • AIRBORNE Q -C50SE RATE • LIQUID E ^ M E A R E S T H E R
RT TIME: / / A
A M IP TIME: FLOW R^T^ VOLUME
/JAr JNTAMlNATION RESULTS
RESULTS Bq/IOOcm'
RESULTS dpm/IDOem'
W '
DOSE-RATE RESULTS
NO.
ftll recKAi^s <oere£
i.e. < ^ . O CipfA
< Zo CPM oi>
roGy/hr mrad/hr
Est
ASP-JA f g O f t - /o X
A o - a
IENTS:
OMPLETED BY: REVIEWED BY:
i u e a i t l j Akin c a c c HEALTH AND SAFETY TECHNICIAN FIELD HEALTH AN® SAFETY SUPERVISOR

ORNL RI/FS PROJECT JOB 19118
B-4 E S & H S U R V E Y F O R M
0 2 3 5 6 1
ft^e 3 o f 7
ATION
IVEYORIS)
SURVEY NO.
"70- o o o HWP NO.
0 / - 0c o j - j I DATE TIME
INSTRUMENT TYPE y SERIAL NO. ., CALIBRATION DUE DATE^f
C.F. BKG. CT. Jfr RADIATION TYPE: aXClPHA ©'BETA G^G^MMA • NEUTF
SURVEY TYPE: a i k i A j u - X j • AIRBORNE C OUSE RATE • LIQUID E 'SMEAR 23-OTHER
RT TIME: P TIME:
JJA. /J A
FLOW RA^ VOLUME AJ4-
@ G>CO CPn a t O ^ W d f u / a l l a n o ^ j * 0«e hole. ( f i / tW- -Hvf^-koWi ^tv^+V-t jOJvLuic.|(
Q) loco CPM <*.+ -h>j> of Uall.
© looo cPtt oa s^' •
© iioo CM p.pja p ^ W V i o ^
0/\ + U r ^ f Wall.
jtrJ
Asp-I/qc-J-? i b f f f i c .
/ g % f W g f t n a (T&fo.
CUI
r"
A c - A r RB V o / 3
/o X- j/zS'/W f/-»/yy
IENT5:
OMPIETED BY: „ REVIEWED BY:
HEALTH AND SAFETY TECHNICIAN FIELD HEALTH ANDfifeAFETY SUPERVISOR FIELD HEALTH AND6SAF

ORNL RI/FS PROJECT JOB 19118 B-5
ES&H SURVEY FORM
0 2 3 5 6 1
H of 7
iJcUj c. Grilla-uj I u U t J SURVEY NO. HWP NO.
0 / - Oc-0 x - «} 3 DATE
Vnhi TIME
V^oc) RVEYORIS) » INSTRUMENT TYPE y SERIAL NO. CALIBRATION DUE DATE^f
ID-rftPHA 0>BETA [D-G^MMA • NEUTRON
;RT TIME: 3P TIME: JJK
FLOW^T^ VOLUME MA-
SURVEY TYPE: • AIRBORNE • POSE RATE • LIQUID CC^MEAR D I T H E R
DNTAMINATION RESULTS RESULTS
Bq/IOOem' RESULTS
dpm/IOOem' A - 7 . S "
O f
(All were ~
<• ^ O CpAt j.e..
a*/ a *
DOSE-RATE RESULTS
NO. mGy/hr mrad/hr
ASP-l/AtXJ-?
T i b
ft'ifW / 8 % uas!
<-±o I k hi feP-i/HP-jic BgVf 7 j / - /dK Ao-A 9V
iflENTS:
COMPLETED BY: REVIEWED BY:
HEALTH AND SAFETY TECHNICIAN F|£l LO HEALTH ANO StfFETY SUPERVISOR

ORNL RlfFS PROJECT JOB 19118 B - 6
ES&H SURVEY FORM
0 2 3 5 6 1
p < x ^ e 5 " o f 7
ATION / W e s + \
k U C w l k ™ ( Wal l y
SURVEY NO. 7 o • o o o -
HWP NO.
Ol-aco i - V i DATE
h i
TIME J 4 o o
VEYDRIS) 1 INSTRUMENT TYPE SERIAL NO. CALIBRATJON DUE DA7£'X-
^T TIME: P TIME:
MA. aTA f l o w ^ T ^ VOLUME
JUAr
O X l P H A ©-BETA 5 X 3 & M M A • NEUTRON
SURVEY TYPE: • AIRBORNE Q DOSE RATE • LIQUID G < £ M I A R ^ ' " s < f T H E R
NTAMINATION RESULTS RESULTS
Bq/lOOrm* RESULTS
dpm/IOQem' 3H M
O O O 0 0 0 ° ©
• • • ft • • • a a • • a • • • • • « a * • • • •
• a
: : ' a
• o
0 o o o o o @
• < D
® l0°0 C-rwclt a+-k>f a f We»f wtull.
© Hoooo cfYA of\ -Ors+owA P'P^ i>*lou "RadToj. . A'fW , C d / r V * * — f * j r * . c k /OOO C-PM . ^ ® 30000 cffA «*+•+*•* o'jjk+oT' +CA
V J e j V Cc . i l
© ^coAVqj "I<\.4WS urec,. "(ro^ +t> >oooo
0 |»ooo CPAA o*v jU3f p JaVe.. Svooo CPf-\ •.-v-^.'o.'Ul^ be-to J +U«. JacJI pUe. TWe /<t«Lpkk wect r«r*«xxj a ^ i c ^ - U m a ^ ^
(&) IOOOO Cfn 6A Wall W o u CO**" euig**- boanV.
Th. O/sL a-lpko. uJO.1 0.+ l«cL4vo*> © ;
0*1 0J9 Defhe
DOSE-RATE RESULTS
NO. mGy/hr mrad/hr
I^trj^i/it S* Tb B/fic. ASM/foe-*"? IS % <20. iik hi
g / j r / w Ao-A
ENTS:
DMPLETED BY: REVIEWED BY:
HEALTH AND SAFETY TECHNICIAN FIELD HEALTH AND SAFET^SUPERVISOR

B o i l d U c j 3 r P Q g - G+tterl^ ecu- 0 2 3 5 6 l ^ ! ) e ^ ^
/ W L V/JI
i
V e 5 l W J l
©
(B>
( 9
(3)
$
© <S>
)
Floor Wa|
d )
©
S^u+t , W*ll represen i
IcxMdioAs

H , 0 2 3 5 6 1 f L * J 0 f j
E CI.S'V Go-llgr^
Locale, I 13
} ^ — 15s
3 8 — rS-JL Lf 15- 10 r A — 1 * 3
0> a ibx 7 3 3 3 — 4 — y<r 1 — — & /a > | r
/ / (f — 1701 U i _ V / ? x — r
m - c 1 — H
/S" 3 H T J
% — * — 1 6
I? —
h — ~ f Ao X At 4 1Z3 t /<* 3 3 < 1 4 7 3
** ' A t S l
As" < l Afc 2.
; o 3 o i a * 4 ^
p a . i X K j
3° (p cf
I — tit a — <p 2M
— HO
"^TeA^elec LOVJ- $aJe^rcKMci
fi<xk\: LB> r/o0
SerlJ (aim d % •
faJcyejrd o . / a W }
e & d t ^ ( % ) : 3 r . l l 33 . W
ColcuUWA f r o ^ « J j € J ^ ^ c . ' + U CSL,

Q 2 3 5 6 I
H I ORNL RI/FS PROJECT y JOB 19118
B-9
ES&H SURVEY FORM
.TION / W e s + N ^ SS OCO , 6 » f U / V | ( WALL )
SURVEY NO. 1 o-ooo- oR-T-ir
HWP NO. CM - O o o 3 - <3.2
DATE TIME
' / 3 V O 'EYOR(S) INSTRUMENT TYPE ^ SERIAL NO, Y - CALIBRATION DUE DATE ^ U
C.F. BKG. CT. RADIATION TYPE: • ALPHA 5J-0ETA EJ-GAMMA O NEUTRON
T TIME:
TIME: ML. FLOW RATE
AM VOLUME SURVEY TYPE:
G AIRBORNE Q t 5 b S E RATE • LIQUID • SMEAR • OTHER
fTAMINATION RESULTS RESULTS
Bq/IOOcm' RESULTS
dpm/100em'
; I
® P
O o e e o o
< 7 0 0 0 0 0
©
o
• o o « P 4 • » a • o • • o • » o •
O 0 # o » • p o o • o »
<3
O
^ b o - d eicpocore t -ajr .^ , UsrJLc-tU rcer* k J n »
Tke . ad*, meo^o/uble e x p o r t . ; s OA 4 U ujei t u^-lf f k
Galle.ru,. Doj^ ^c-i. (oc^-Ws e x k . ' U V ^ a r t skttvVs .
LckjjMI A B c
Of** W:JLo ao^i ULJLJ
XT* i
DOSE-RATE RESULTS
NO. mGy/hr imad/hr
C J
•NTS:
R o - a. k£ VoV3 C I
JMPlETED BY:
HEALTH AND SAFETY TECHNICIAN
REVIEWED BY:
9 1 fifty ) HEALTH ANC/St FIELD SAFETY SUPERVISOR

ORNL RI/FS PROJECT JOB 19118
0 2 3 5 S I
B-10
ES&H SURVEY FORM
fh^e I o f
ION
do + Cells SURVEY NO. HWP NO.
O f - OCJO 2 - ^ 3 DATE
lot" I Hi TIME
YOfl(S)
f^hm'irm INSTRUMENT TYPE * SERIAL NO, CALIBRATION DUE DATE^.
C.F.
A/A BKG. CT. % RADIATION TYPE:
B ^ L P H A GD"SfcTA GD-tfAMMA • NEUTRON
faJktUJ) • DOSE RATE • LIQUID Q-SfilEAR E -OtHER
TIME: 'I ME:
MA A/A
FLOW RATE A/A
VOLUME A / A
SURVEY TYPE: • AIRBORNE
AMINATION RESULTS RESULTS
Bq/IOOcm1 RESULTS
dpm/IOOcm1
• f
Due +a k«gl ktwjdj/v OC.fi
fUcak* ftjpe G-Alprt)l>€. ^ m>{ opA -fj^ KesV<a|k. L'iUU meyo/c-
alpko. CinWi.'<\aW\ Ww cMccfeblc gmAX.4-
"tU sor^. "fig •flaps- uJtts ive-f 41* vu.lL
. Srr^TK ^ e r t -^JO/v
^ tytShl+LU
\
DOSE-RATE RESULTS
NO. mGy/hr mrid/hr
J 7
( o l f a ) uxtrt -bLu^ 32 .
/
rIODC">Xw
Oil ft* id" X D fi^OtACi.
fcmrKt/TT J U L <o2o iijkJAs
AsP-Qetrti/ifn fto-a. oa < iflMfaX 7/XmM
rs:
PLETED BY: REVIEWED BY:
HEALTH AND SAFETY TECHNICIAN FIELD HEALTH AND SAFETY SUPERVISOR

0 2 3 5 6 1 B - l l ~
fitting - Vje^- t C e l l s S ^ e i r U c o . - K o / \ s
Souik Well
Wall
©
c
Floor
(an rv*4U.5<lo of Hep A
West
AJdrii UAH

j. B-12 , „ « r r . f ^ - e - 3 >3 > m e g f fa - »
C e l
Alphck
L o ( ^ / l o o c r y p )
) fad) 10
2 3 s ? 3 (AJC-4 2 \ .SSXo** if Qjc-tw) * * ^ 4 2 3 * - *
I J 63 fr ( Jc-ofc) ^ 5 1 3 ^ Cut.cn} ^ I $ (OC-08) H gAi cj Oic-^0 I * * * *
/ o O u o / 4 < I * * * * / / C/uc-«> r / a . (A/C.-D) «} i s m n c«c-n) 3 i ^ /V (AK'/V) 12. |Ol=f K 6ycws-) 3 j /O H <g \o / ? 3 /? /<? (st-^V 5- a^ys-s
Osc-o«t> * 1 r * f
Cst-^ < 1
Csc-oO < l 0,2 ; H — W
,'< M . yXa -20, ^ A : 3k
5 ? fifr'a) ** JoSC* Cshj) M
^ 4 j g ^ H i (5C-IJ-3 - r ' •tam
JJ fax-ib) x (jx*-n) *
- 4
/ V M ; Lfi> 5T/0O
S e r i a l ^ fi
( c p r \ ) i o . c i y.cf?
( % ) • . 3s*. If <4* CeJcok-kil -ft*?™ gWfi/v " {ro^ fUCSL.
* * U A W ^ % - i l o wee* COOA^d <Jr, U l o - flockl ^ R t r W V / ^ W .U. . -/rAA . <r>* c*u, , * ~> , J, . .C£fe/.\. 6kc: T? ^

Y ORNL RI/FS PROJECT JOB 19118
B-13
ES&H SURVEY FORM
0 2 3 5 6 1
riON
M , l^est Cells SURVEY NO. HWP NO.
O I - O C J O J -DATE TIME
EYOfi IS)
. INSTRUMENT TYPE SERIAL NO. -Jf- 'CALIBRATION DUE DATE
C.F. A/A
TIME: a/A
BKG. CT. # RADIATION TYPE: • ALPHA SJ^ETA B ^ A M M A • NEUTRON
TIME: MA. FLOW RATE
MA VOLUME
A/fii SURVEY TYPE:
• AIRBORNE • B ^ O S E RATE 3 LIQUID • SMEAR 2 OTHER
TAMINATION RESULTS RESULTS
Bq/100em' RESULTS
dpm/IOOcm1
( ] ) 6en«ru I &t€*a. do a.
Ifcta r*~gtA. (rtt* 1+D ^ Ui/vfi rnoj''^ frar* •fa nosK Mch'oo "to t U SoO+Wn S£c+io/\
(2) rtoij red;auc.h'v4 S^Jtioa Uat (ocakJt ** -Mo { l o o t OA
He s f f ^ U f i
to ^ "TLj locc^rio* is
/dU/vblkeJ 45 ^ ^
/.S- ^ Uall
/ rf
n
(5> "X " A ' ^ AU^v u U ' c v
U&ff Kf-^ke^U-i o{ fco
DOSE-RATE RESULTS
NQl mGy/hr mrad/hr
r '
T f i e/»e» Cftl
Relets. ITS:
/1PLETED BY: REVIEWEt^BY:
^t^—eg/" ^ HEALTH AND SAFETY TECHNICIAN FIELD HEALTH AND
^ V L ND SAFETY S SUPERVISOR

Appendix C:
Structural Condition Assessment for Decontamination and Decommissioning of
Building 3506

C-2
1. PURPOSE
Building 3506 is being decommissioned and will be eventually dismantled. The purpose of this structural condition assessment is to determine the existing condition of the facility so that worker safety concerns are appropriately considered and addressed during the dismantlement process, and to facilitate planning the sequence of dismantlement activities.
2. FACILITY DESCRIPTION
2.1 LOCATION AND USE
Building 3506 is southeast of the intersection of Central Avenue and Third Street, in the vicinity of South Tank Farm (STF). Approximate ORNL coordinates are N22000, E30800.
2.2 CONSTRUCTION AND DESCRIPTION
The facility was constructed during 1949 to house a liquid waste evaporator. In 1954, evaporator operations ceased and the building housed an experimental radioactive waste incinerator and ancillary equipment. The facility has been out of service since 1976, and most of the equipment and piping has been removed.
The facility was built a using combination of concrete masonry and cast-in-place reinforced cement concrete (RCC) construction. Checkered steel plates with stiffeners were used as roofing panels over the cell area. Thin gage stainless steel sheeting mounted on plywood over wooden joists covers the gallery roof area.
The facility is a split level building with approximate plan dimensions of 221/: ft wide. 32 ft long, and 17 ft high. The building is divided into three areas: cell area (evaporator pit) on the west side, operating gallery on the east side, and crawlspace under the gallery floor. The finished floor elevations of the cell area and the operating gallery are 800 ft and 809 ft, respectively, above sea level.
The north, south, and east walls below the operating gallery area are RCC walls that extend approximately 6 ft below grade and butt against east wall of the cell area (connection details to the cell wall are not known). A masonry block veneer runs up the east wall from the footing to the operating floor elevation. The floor in the operating gallery is RCC, except for a small area (=40 ft2) of brick in front of the north entrance door. Double wythe, 6-in. concrete masonry unit (CMU) walls along the north, east, and south side extend approximately 10 ft above the operating floor level and match the top elevation of the cell area.
R.166

C - 3
The superstructure of the gallery area includes two windows on the east wall and wooden personnel doors on the north and south walls. The doors are installed with a short wood framing system, and doors and framing appear to be in good condition. The north wall of the gallery area also has a door at floor level to facilitate loading and unloading operations.
The cell area is of RCC construction, and the floor is approximately 6 ft below grade. The cell is divided into two parts approximately 10 ft wide (east-west) x 15 ft long (north-south) on the north side and 8 ft wide (east-west) by 8 ft long (north-south) on the south side. The east and west walls are 2 ft thick in the northern part and 3 ft thick in the southern part. The north wall is 3 ft thick, and the south wall is 2 ft thick. The existing floor is approximately 4 ft thick.
3. INSPECTION
3.1 METHODOLOGY
The existing condition of the facility was inspected during November 1993. The scope of the inspection was limited to review of available drawings and a walk-through of the facility by a structural engineer. Calculations were not performed to support the assessment. A list of available drawings is presented in Appendix A. The existing condition of the facility is documented by still photographs and videotape.
3.2 EAST GALLERY AREA
3.2.1 Walls
The CMU walls in the gallery area are in dilapidated condition with unfinished joints (no pointing) and crumbling mortar. The doors and windows on the north, south, and east walls appear to be in good condition.
3.2.2 Ceiling and Roof
The original design drawings of the gallery area indicate use of built-up roofing, which has been removed and replaced with a thin-gage stainless steel sheet roof over 2-in. by 6-in. joists spaced on 2 ft centers. Generally, the joists are in fair condition, although several show severe rotting due to exposure to rain and weather. This condition is accentuated at the east end of the joists and over the windows. The observed extent of deterioration includes total loss of bearing and structural integrity. The sill beam under the east end of the joists has also rotted completely across the northernmost window.
R-166

C - 4
The ceiling in the east gallery is 0.5-in.-thick gypsum board that has been severely damaged by rain. In many areas, the ceiling is sagging; gypsum board has broken off and has pulled away from the wood framing. In an effort to support the ceiling and prevent collapse, 0.25-in. thick plywood has been nailed to the joists. This plywood board has also deteriorated and pulled away from the joists. Conduit and lighting fixtures are hung from the ceiling.
On the west side of the ceiling of the gallery, a 3-in. by 2-in. wood runner is secured to the wall to support the ceiling. This wooden strip is in good condition over most of its length; however, the middle third of the strip has rotted and is considered to be structurally unsound. It appears that this runner was not intended to support the roof joists. However, the connection details could not be verified either in the field or on any available drawings.
3.2.3 Floor
Small cracks (less than 1/8-in.) exist in the floor of the east gallery. There are two floor drains, but their connection to external piping systems could not be established due to the unavailability of drawings. A manhole in the floor of the gallery provides for personnel access into the crawlspace below the floor. Overall, the floor is in good condition and shows minimal deterioration.
3.2.4 Stairs
Building 3506 has three access stairways, two of which go directly to the east gallery. On the north side of the building is a reinforced concrete stairway extending from grade to the floor of the east gallery. The stairway is in good condition.
A structural steel platform with stairs from the platform to grade exists on the south side of the building. The platform is nominally 1'4-in. x '/a-in. steel grating supported by 6-in. to 8-in.-deep structural steel channel sections. There is moderate corrosion at connections of the grating to the supporting members and at the tread supports on the stairs. Stair and platform handrails are in good condition. The platform is supported on 4-in.-diameter pipe section columns that sit on 12-in. X 12-in. concrete piers. The piers extend 12 in. above grade. South of the platform is a poured-in-place reinforced concrete pad approximately 6 ft by 8 ft and extending approximately 12 in. above grade. Platform vertical bracing of 2-in. x 2-in. x U-in. angles is welded to the pipe section columns.
3.3 CELL AREA
3.3.1 Walls
Review of the available drawings indicate that there were plans to modify the cell area into two discrete parts by installing a 2-ft-thick block wall. However, this modification was not
R-166

C - 5
executed. The cell walls are poured-in-place RCC with 3-ft-high lifts. The surfaces of the walls show no cracking, leaching, or presence of honeycomb. However, in some areas, spalling, small pop-outs, discoloration of concrete, and surface deterioration are observed. Within the cell, equipment and/or piping supports have been cut, leaving 6-in. to 12-in. stubs of steel and pipe attached to the wall.
There are numerous pipe and other penetrations in the wall common to the east gallery. Anchor bolts and several pieces of cold-formed channel steel used for equipment attachment and support remain mounted on the wall. The south wall also has numerous pipe penetrations and miscellaneous steel used for equipment support/attachment. The west wall has one cantilevered cold-formed steel section about 4 ft long, as well as electrical conduit and lighting fixtures.
The drawings for the cell area show openings in the concrete to receive removable precast concrete plugs. However, these plugs are not present.
3.3.2 Ceiling and Roof t)
There is no ceiling in the cell area. The stiffened checkered steel plate roof panels are supported by a 2-in.-wide shelf angle that traverses the perimeter of the north cell., The panels are painted and are in good condition.
! v • -3.3.3 Floor ,,
The floor of the cell could not be inspected because of accumulation of water and mud. A stainless steel liner approximately 1/8 in. thick secured to the floor extends approximately 4 in. up on each wall. The seams of this plate liner appear to be welded. The integrity and condition of the liner could not be assessed because of the accumulated waste. >
3.3.4 Stairs
The west cell has only one access, which is a structural steel stairway mounted on the outside face of the west wall of the cell extending from grade to the roof of the west cell. This stairway has light corrosion at the tread supports, at all welded connections, and at worn surfaces. Handrails and stairs are in good condition. Anchorage to the wall is also in good condition. There are no fixed ladders or stairs to provide access to the cell floor from the roof, and temporary ladders were installed to facilitate the inspection.
3.4 CRAWLSPACE
The walls under the gallery floor (crawlspace) could not be physically inspected due to access restrictions. However, photographs taken through the existing manhole do not show any deterioration of the walls, and the existing concrete appears to be in good condition.
R-l«6

C-6
3.5 FACILITY EXTERIOR
Exterior surfaces of the facility are painted, well maintained, and appear to be in good condition. Utilities such as instrument lines, electrical panels, rack for gas cylinders, etc.. have been mounted on the walls. On the south wall, an approximately 2-ft-wide by 13.5-ft-long corrugated leanto roof has been installed over the electrical utility boxes. Similarly, a small corrugated leanto roof has been provided over the gas cylinder storage area on the north wall. Some of these utilities service the South Tank Farm. Overhead power poles are in the immediate vicinity of the facility. All of the appurtenances are in good condition.
The access to the facility is on the west side from Third Street. Underground utilities appear to surround the facilities, but review of the these utilities was outside the scope of this inspection.
4. SUMMARY AND CONCLUSIONS
Except for some minor corrosion, all stairs, platforms, and handrails are in good condition and .may be adequate for moderate personnel use and laydown of small hand tools.
The, deteriorated ceiling in the east operating gallery will cause occupational safety hazards. The ceiling and the damaged roof joists must be repaired or removed to ensure w o r t e safety.
The underground utility connections from the facility should be reviewed and appropriately terminated to prevent cross contamination.
Review of the available design drawings indicates that the operating gallery portion of the facility is of light construction. This portion of the facility should be considered first in the dismantlement sequence along with removal of doors, windows, and other salvageable items.
The cell area can be considered structurally sound and self-supporting under normal loads.
The limited access, lack of available laydown area, and presence of overhead and underground utilities may cause difficulties for movement of heavy equipment during the dismantlement operations. With appropriate planning, however, this will not adversely affect, decommissioning and dismantlement activities.
5. REFERENCES
1. ACI 201.R, "Guide for Making a Condition Survey of Concrete in Service."
R-166

C-7
2. ANSI/ASCE 11-90, "Guidelines for Structural Condition Assessment ofExisting Buildings." /'
3. J. R. Horton, Preliminary Decommissioning Study Report, Volu., , Waste Evaporator Facility (3506) and Fission Product Pilot Plant (3515), X-C •'• v ' ,ptember 1984. 4, t*. Tit
4. Bechtel, Site Characterization Plan for the Decontamination arid 'Decommissioning of Buildings 3506 and 3515 at Oak Ridge National Laboratory, Oak Bidge, Tennessee, ORNL/ER/S ub/87-99053/69, 1993.
i, i>
R-166

Appendix D:
Field Investigation Measurement Equipment
i i i
R-166

D-2
Instrument Manufacturer Model
Alpha probe Eberline AC-3
Beta/gamma probe Eberline HP-270
Gamma probe Eberline HP-290
Directional gamma probe Eberline Modified HP-220A
Portable readout ratemeter/scaler Eberline ESP-2
Portable readout ratemeter/scaler Eberline SRM-100
Beta/gamma survey meter Eberline RO-2 or RO-2A
Portable gamma spectroscopy detector
EG&G ORTEC 2-in. Nal(Tl)
Portable gamma spectroscopy detector
CANBERRA Coaxial HPGe with beryllium window
Portable multichannel analyzer EG&G ORTEC 7500 and 7500B
Soil sample collection tool 2- and 3-in. hand augers
Concrete core drill Diamond Tool and Fastener; Black & Decker
4-in. diamond bit drill
R-166

Appendix E:
Contract-Required Detection Limits
for TAL Inorganics
and
Contract-Required Quantitation Limits
for TCL VOCs, SVOCs, and Pesticides/PCBs
R-166

E-2
Contract Required Detection Limits (CRDLs) for TAL Inorganics
Metals CRDLs" for Liquids (jig/L)
Aluminum 200
Antimony 60
Arsenic 10
Barium 200
Beryllium 5
Cadmium 5
Calcium 5000
Chromium 10
Cobalt 50
Copper 25
Cyanide 10
Iron 100
Lead 3
Magnesium 5000
Manganese 15
Mercury 0.2
Nickel 40
Potassium 5000
Selenium 5
Silver 10
Sodium 5000
Thallium 10
Vanadium 50
Zinc 20
"The CRDLs for solids will be higher than those for liquids and will be a function of the percent moisture present in the sample.
R-l 66

E-3
TARGET C3MPOUND LIST (TCL) AND CONTRACT-REQUIRED QUANTITATION LIMITS (CRQL)
Quantitation Limits a Low Med. On
CAS Water Soil Soil Column Analyte Number (M g/L) (Mg/kg) (Mg^g) (ng)
VOLATILES 1. Chloromethane 74-87-3 10 10 1200 (50) 2. Bromomethane 74-83-9 10 10 1200 (50) 3. Vinyl Chloride 75-01-4 10 10 1200 (50) 4. Chloroethane 75-00-3 10 10 1200 (50) 5. Methylene Chloride 75-09-2 10 10 1200 (50)
6. Acetone 67-64-1 10 10 1200 (50) 7. Carbon Disulfide 75-15-0 10 10 1200 (50) 8. 1,1-Dichloroethene 75-35-4 10 10 1200 (50) 9. 1,1-Dichloroethane 75-34-3 10 10 1200 (50) 10. 1,2-DichIoroethene (total) 540-59-0 10 10 1200 (50)
11. Chloroform 67-66-3 10 10 1200 (50) 12. 1,2-Dichloroethane 107-06-2 10 10 1200 (50) 13. 2-Butanone 78-93-3 10 10 1200 (50) 14. 1,1,1 -Tri chloroethane 71-55-6 10 10 1200 (50) 15. Carbon Tetrachloride 56-23-5 10 10 1200 (50)
16. Bromodichloromethane 75-27-4 10 10 1200 (50) 17. 1,2-Dichloropropane 78-87-5 10 10 1200 (50) 18. cis-1,3-Dichloropropene 10061-01-5 10 10 1200 (50) 19. Trichloroethene 79-01-6 10 10 1200 (50) 20. Dibromochloromethane 124-48-1 10 10 1200 (50)
21. 1,1,2-Trichloroethane 79-00-5 10 10 1200 (50) 22. Benzene 71-43-2 10 10 1200 (50) 23. trans-1,3-Dichloropropene 10061-02-6 10 10 1200 (50) 24. Bromoform 75-25-2 10 10 1200 (50) 25. 4-Methyl-2-pentanone 108-10-1 10 10 1200 (50)
26. 2-Hexanone 591-78-6 10 10 1200 (50) 27. Tetrachloroethene 127-18-4 10 10 1200 (50) 28. Toluene 108-88-3 10 10 1200 (50) 29. 1,1,2,2-Tetrachloroethane 79-34-5 10 10 1200 (50) 30. Chlorobenzene 108-90-7 10 10 1200 (50)
31. Ethyl Benzene 100-41-4 10 10 1200 (50) 32. Styrene 100-42-5 10 10 1200 (50)
R-166

E-4
Quantitation Limits a Low Med. On
CAS Water Soil Soil Column Analyte Number (M g/L) teg/kg) (fig/kg) (ng)
33. Xylenes (Total) 1330-20-7 10 10 1200 (50)
SEMIVOLATILES 34. Phenol 108-95-2 10 330 10000 (20) 35. bis(2-Ch!oroethyl) ether 111-44-4 10 330 10000 (20) 36. 2-Chlorophenol 95-57-8 10 330 10000 (20) 37. 1,3-Dichlorobenzene 541-73-1 10 330 10000 (20) 38. 1,4-Dichlorobenzene 106-46-7 10 330 10000 (20)
39. 1,2-Dichlorobenzene 95-50-1 10 330 10000 (20) 40. 2-Methylphenol 95-48-7 10 330 10000 (20) 41. 2,2'-oxybis (1- 108-60-1 10 330 10000 (20)
Chloropropane)fc
42. 4-Methylphenol 106-44-5 10 330 10000 (20) 43. N-Nitroso-di-n- 621-64-7 10 330 10000 (20)
propylamine
44. Hexachloroethane 67-72-1 10 330 10000 (20) 45. Nitrobenzene 98-95-3 10 330 10000 (20) 46. Isophorone 78-59-1 10 330 10000 (20) 47. 2-Nitrophenol 88-75-5 10 330 10000 (20) 48. 2,4-Dimethylphenol 105-67-9 10 330 10000 (20)
49. bis(2-Chloroethoxy) 111-91-1 10 330 10000 (20) methane
50. 2,4-Dichlorophenol 120-83-1 10 330 10000 (20) 51. 1,2,4-Trichlorobenzene 120-82-1 10 330 10000 (20) 52. Naphthalene 91-20-3 10 330 10000 (20) 53. 4-Chloroaniline 106-47-8 10 330 10000 (20)
54. Hexachlorobutad iene 87-68-3 10 330 10000 (20) 55. 4-Chloro-3-methylphenol 59-50-7 10 330 10000 (20) 56. 2-Methylnaphthalene 91-57-6 10 330 10000 (20) 57. Hexachlorocyclopentadiene 77-47-4 10 330 10000 (20) 58. 2,4,6-Trichlorophenol 88-06-2 10 330 10000 (20)
59. 2,4,5-Trichlorophenol 95-95-4 25 800 25000 (50) 60. 2-Chloronaphthalene 91-58-7 10 330 10000 (20) 61. 2-Nitroaniline 88-74-4 25 800 25000 (50) 62. Dimethylphthalate , 131-11-3 10 330 10000 (20) 63. Acenaphthylene 208-96-8 10 , s , 330 10000 (20)
R-166

E-5
Quantitation Limits a
Low Med. On CAS Water Soil Soil Column
Analyte Number (Mg/L) (Mg/kg) (Mg/kg) (ng)
64. 2,6-Dinitrotoluene 606-20-2 10 330 10000 (20) 65. 3-Nitroaniline 99-09-2 25 800 25000 (50) 66. Acenaphthene 83-32-9 10 330 10000 (20) 67. 2,4-Dinitrophenol 51-28-5 25 800 25000 (50) 68. 4-Nitrophenol 100-02-7 25 800 25000 (50)
69. Dibenzofuran 132-64-9 10 330 10000 (20) 70. 2,4-Dinitrotoluene 121-14-2 10 330 10000 (20) 71. Diethylphthalate 84-66-2 10 330 10000 (20) 72. 4-Chlorophenyl-phenyl ether 7005-72-3 10 330 10000 (20) 73. Fluorene 86-73-7 10 330 10000 (20)
74. 4-Nitroaniline 100-01-6 25 800 25000 (50) 75. 4,6-D initro-2-methy lphenol 534-52-1 25 800 25000 (50) 76. N-nitrosodiphenylamine 86-30-6 10 330 10000 (20) 77. 4-Bromopheny 1-pheny lether 101-55-3 10 330 10000 (20) 78. Hexach lorobenzene 118-74-1 10 330 10000 (20)
79. Pentachlorophenol 87-86-5 25 800 25000 (50) 80. Phenanthrene 85-01-8 10 330 10000 (20) 81. Anthracene 120-12-7 10 330 10000 (20) 82. Carbazole 86-74-8 10 330 10000 (20) 83. Di-n-buty Iphthalate 84-74-2 10 330 10000 (20)
84. Fluoranthene 206-44-0 10 330 10000 (20) 85. Pyrene 129-00-0 10 330 10000 (20) 86. Buty lbenzy lphthal ate 85-68-7 10 330 10000 (20) 87. 3,3'-Dichlorobenzidine 91-94-1 10 330 10000 (20) 88. Benzo(a) anthracene 56-55-3 10 330 10000 (20)
89. Chrysene 218-01-9 10 330 10000 (20) • 90. bis(2-Ethylhexyl)phthalate 117-81-7 10 330 10000 (20) 91. Di-n-octylphthalate 117-84-0 10 330 10000 (20) 92. Benzo(b) fluoranthene 205-99-2 10 330 10000 (20) 93. Benzo(k)fluoranthene 207-08-9 10 330 10000 (20)
94. Benzo(a)pyrene 50-32-8 10 330 10000 (20) 95. Indeno(l ,2,3-cd)pyrene 193-39-5 10 330 10000 (20) 96. Dibenz(a,h)anthracene 53-70-3 10 330 10000 (50) 97. Benzo(g,h,i)perylene 191-24-2 10 330 10000 (50)
R-166

E-6
Quantitation Limits"
Analyte CAS
Number
Low On Water Soil Column Gtg/L) (Mg/kg) (ng)
PESTICIDES/AROCLORS 98. alpha-BHC 319-84-6 99. beta-BHC 319-85-7 100. delta-BHC 319-86-8 101. gamma-BHC (Lindane) 58-89-9 102. Heptachior 76-44-8
103. Aldrin 309-00-2 104. Heptachior epoxide 1024-57-3 105. Endosulfan I 959-98-8 106. Dieldrin 60-57-1 107. 4,4'-DDE 72-55-9
108. Endrin 72-20-8 109. Endosulfan II 33213-65-9 110. 4,4'-DDD 72-54-8 111. Endosulfan sulfate 1031-07-8 112. 4,4'-DDT 50-29-3
113. Methoxychlor 72-43-5 114. Endrin ketone 53494-70-5 115. Endrin aldehyde 7421-36-3 116. alpha-Chlordane 5103-71-9 117. gamma-Chlordane 5103-74-2
118. Toxaphene 8001-35-2 119. Aroclor-1016 12674-11-2 120. Aroclor-1221 11104-28-2 121. Aroclor-1232 11141-16-5 122. Aroclor-1242 53469-21-9
123. Aroclor-1248 12672-29-6 124. Aroclor-1254 11097-69-1 125. Aroclor-1260 11096-82-5
0.05 0.05 0.05 0.05 0.05
0.05 0.05 0.05 0.10 0.10
0.10 0.10 0.10 0.10 0.10
' !
0 50 0.10 0.10 0.05 0.05
5.0 1.0 2.0 1.0 1.0
1.0 1.0 1.0
1.7 1.7 1.7 1.7 1.7
1.7 1.7 1.7 3.3 3.3
3.3 3.3 3.3 3.3 3.3
17.0 3.3 3.3 1.7 1.7
170.0 33.0 67.0 33.0 33.0
33.0 33.0 33.0
5 5 5 5 5
5 5 5 10 10
10 10 10 10 10
50 10 10 5 5
500 100 200 100 100
100 100 100
"Quantitation limits listed for soil/sediment are based on wet weight. The quantitation limits calculated by the laboratory for soil/sediment, calculated on dry weight basis as required by the contract, will be higher. There is no differentiation between the preparation of iow and medium soil samples in this method for the analysis of pesticides/aroilors.
'Previously know by the name bis(2-Chloroisopropyl)ether.
R-166

Appendix F:
Detailed Field Measurement Results

F-2
Table F.l . Location-specific measurement results for the east gallery
Direct Measurements Smear Screening
Location ID Alpha
(dpm/100 cm2)
Open Window Beta/Gamma
(mrad/h)
Closed Window Gamma (mR/h)
Gross Alpha (dpm/100 cm2)
Gross Beta/Gamma
(dpm/100 cm2) South Wall 06-EG-01 3.70E+01 6.06E-02 5.34E-02 2.40E+01 1.30E+01
06-EG-02 2.13E+01 2.63E-02 2.06E-02 4.60E+01 1.20E+01 Average 2.92E+01 4.34E-02 3.70E-02 3.50E+01 1.25E+01
West Wall 06-EG-03 4.26E+01 7.56E-02 6.I8E-02 8.00E+00 1.52E+02 06-EG-04 3.06E+01 5.54E-02 5.77E-02 1.50E+01 1.00E+01 06-EG-05 7.10E+01 6.84E-02 6.06E-02 2.00E+00 1.83E+02 06-EG-06 4.63E+01 5.28E-02 4.20E-02 2.00E+00 2.62E+02 06-EG-07 7.09E+03 3.55E-01 4.57E-01 3.30E+01 1.35E+03 06-EG-08 1.20E+01 7.38E-02 3.51E-02 4.00E+00 9.00E+00 06-EG-09 5.56E+00 2.69E-02 2.11E-02 1.60E+01 1.50E+01 06-EG-10 3.43E+01 4.14E-02 2.97E-02 7.00E-:-00 1.50E+01 06-EG-ll 4.91E+01 1.73E-01 5.05E-02 6.00E+00 1.70E+03 06-EG-12 4.35E+01 2.04E-01 5.39E-02 2.00E+00 1.15E+02
Average 7.43E+02 1.13E-01 8.70E-02 9.50E+00 3.81E+02
North Wall 06-EG-13 4.91E+01 6.18E-02 5.17E-02 2.00E+00 5.00E+00
East Wall 06-EG-14 3.43E+01 2.63E-02 2.40E-02 1.00E+00 4.00E+00 06-EG-15 4.63E+01 3.11E-02 2.83E-02 3.00E+00 4.57E+02 06-EG-16 2.50E+01 3.74E-02 3.00E-02 4.00E+00 1.00E+01 06-EG-17 3.98E+01 5.45E-02 4.57E-02 1.00E+00 S.80E+01 06-EG-18 3.98E+01 1.39E-01 1.22E-01 2.00E+00 1.17E+03 06-EG-19 6.48E+01 1.03E-01 8.94E-Q2 6.00E+00 2.40E+01 06-EG-20 2.78E+00 3.18E-02 1.98E-02 2.00E+00 4.00E+01 06-EG-21 3.98E+01 9.36E-02 9.06E-02 4.00E+00 7.33E+02 06-EG-22 6.76E+01 3.37E-02 2.89E-02 4.00E+00 1.60E+01
Average 4.00E+01 6.11E-02 5.32E-02 3.00E+00 2.83E+02
Hoor 06-EG-23 1.85E+01 3.97E-02 3.03E-02 1.00E+00 4.73E+02 06-EG-24 W1.85E+01 5.77E-02 4.03E-02 2.00E+00 1.81E+C2 06-EG-25 9.26E+00 7.50E-02 6.06E-02 1.00E+00 5.06E+02 06-EG-26 1.57E+01 4.23E-02 2.51E-02 2.00E+00 ?..04E+02 06-EG-27 4.35E+01 9.72E-02 1.23E-01 6.00E+00 1.03E+04 06-EG-28 2.13E+01 4.06E-02 3.65-02 4.00E+00 5.93E+02 06-EG-29 9.26E+00 4.28E-02 2.86E-02 2.20E+01 1.24E+02 06-EG-30 1.20E+01 2.14E-02 1.63E-02 6.00E+00 4.00E+00
Average 1.85E+01 5.21E-02 4.51E-02 5.50E+00 1.55E+03

F-3
Table F.8. CSL gamma spectroscopy results for south cell area smears
Location ID l37Cs/,37raBa
GiCi/lOO cm2) «Co
(/tCi/100 cm2) South Wall
West Wall
North Wall East Wall
Floor
06-EG-01 7.72E-06 06-EG-02 8.49E106 06-EG-03 3.80E-05 06-EG-04 8.88E-06 06-EG-05 4.98E-05 06-EG-06 1.08E-04 06-EG-07 1.89E-04 06-EG-08 9.07E-06 06-EG-10 9.84E-06 06-EG-l 1 3.64E-04 06-EG-12 3.26E-05 06-EG-13 *
06-EG-15 3.78E-05 06-EG-16 +
06-EG-17 4.03E-05 06-EG-l 8 5.03E-04 06-EG-19 1.33E-05 06-EG-20 1.76E-05 06-EG-21 3.02E-04 06-EG-23 2.Q0E-04 06-EG-24 7.35E-05 06-EG-25 2.28E-04 06-EG-26 7.78E-05 06-EG-27 1.38E-03 06-EG-28 2.19E-04 06-EG-29 4.94E-05 06-EG-30 *
1.46E-05 1.53E-05
1.19E-05 1.37E-05
8.69E-06
•Not detected or not measured.

F-4
Table F.3. Slit scanning results for east gallery floor core (location 72.SB001)
Core Position
(in.)
Region of Interest (counts)9
Area Bkg." (counts)"
Measured' Activity vs. Bkg.
(nCi/cm3) 0.25 18 3.12 Bkg. level j) 0.5 22 7.12 Bkg. level 0.75 12.05 -2.83 Bkg. level
1 19 4.12 Bkg. level 1.25 34 19.12 1.9 1.5 32 17.12 1.7
A L 7 5 19.5 4.62 Bkg. level 2 29.5 14.62 1.4
2.25 29.5 14.62 1.4 2.5 19.5 4.62 Bkg. level 3.5 7.5 -7.38 Bkg. level 4.5 22.5 7.62 Bkg. level 5.5 14.5 -0.38 Bkg. level 6.5 8.5 -6.38 Bkg. level 7.5 20 5.12 Bkg. level 8.5 16.5 1.62 Bkg. level
"Counts are for 4 minutes; core was rotated 90s each minute.
bArea background was measured to be 15 counts per 4 min. in the region of interest.
Tf ROI counts were less than Lc = CTSB + 2 oB,
\) uvhere °B = V C T S B ,
then the measurement was assumed to be at or below the area background level. Here, Lc = 23 counts per 4 min.

F-5
Table F.4. Slit scanning results for east gallery wall core (location 72.SB002)
Core Position
(in.)
Region of Interest (counts)
Area Bkg. (counts)
Measured Activity vs. Bkg.
(nCi/cm3)
0.25 37.5 22.62 2.2 0.5 67.5 52.62 5.2 0.75 47 32.12 3.2
1 50.5 35.62 3.5 1.25 36.5 21.62 2.1 1.5 27 12.12 1.2 1.75 49 34.12 3.4
2 53 38.12 3.E 2.25 57 42.12 4.1 2.5 43 28.12 2.8 3.J9 55 40.12. 3.9 4.19 58 43.12 4.2 5.19 66 51.12 5.0 6.19 65.5 50.62 5.0 7.19 54.5 39.62 3.9
^ 8.19 76 61.12 6.0 9.19 84.5 69.62 6.9 10.19 57.5 42.62 4.2 11.19 56 41.12 4.0 12.19 49.5 34.62 3.4 13.19 51.5 36.62 3.6 14.19 52 37.12 3.7 15.19 49.5 34.62 3.4 16.19 47 32.12 3.2 17.19 51.5 36.62 3.6 18.19 52.5 37.62 3.7 19.19 48.5 33.62 3.3 20.19 48 33.12 3.3 21.19 61 46.12 4.5 21.44 53 38.12 3.8 21.69 41 26.12 2.6 21.94 53 38.12 3.8 22.19 67.5 52.62 5.2 22.44 56 41.12 4.0 22.69 39.5 24.62 2.4 22.94 50.5 35.62 3.5 23.19 67.5 52.62 5.2

F-6
Table F.ll (continued)
Core Position
(in.)
Region of Interest (counts)
Area Bkg. (counts)
Measured Activity vs. Bkg.
(nCi/cm3) 23.44 58 43.12 4.2 23.69 59.5 44.62 4.4
"Counts are for 4 minutes; core was rotated 90° each minute.
''Area background was measured to be 15 counts per 4 min. in the region of interest.
I f ROI counts were less than L c = CTSa + 2 aB,
where ° B = / C T S B ,
then the measurement was assumed to be at or below the area background level. Here, Lc = 23 counts per 4 min.

F-7
Table F.5. Location-specific measurement results for the north portion of the cell
Direct Measurements Smear Screening
Location ID Open Window Closed Window Directional Gross Location ID Alpha Beta/Gamma Beta/Gamma Gamma Gross AJpha Beta/Gamma
(dpm/100 cm2) (mrad/h) (mR/h) (mR/h) (dpm/100 cm2) (dpm/100 cm2) West Wall 06-NC-01 6.48E-01 1.64E+01 1.28E+00 2.67E-02 1.00E+01 9.66E+02
06-NC-02 4.91E+01 1.03E+00 7.01E-01 5.54E-02 3.00E+00 9.70E+01 06-NC-03 3.06E+02 3.19E+00 1.9 IE+00 1.60E-01 3.20E+01 2.16E+04 06-NC-04 5.56E+01 1.36E+00 I.02E+00 1.64E-01 6.00E+00 5.48E+03 06-NC-05 4.35E+01 7.50E-01 . , 6.44E-01 1.64E-01 1.00E+00 6.30E+01
Average 1.04E+02 1.59E+00 1.11E+00 1.14E-01 1.04E+01 5.63E+03
North Wall 06-NC-06 6.76E+01 8.36E-01 6.73E-01 7.38E-02 4.00E+00 5.13E+02 06-NC-07 4.63E+01 5.77E-01 5.18E-01 1.09E-01 2.00E+00 1.98E+02 06-NC-08 4.91E+01 6.92E-01 5.87E-01 1.30E-01 4.00E+00 8.21E+02
Average 5.43E+01 7.02E-01 5.93E-01 1.04E-01 3.33E+00 5.11E+02
East Wall 06-NC-09 2.06E+02 1.10E+01 8.36E+00 5.70E-01 1.00E+00 3.06E+04 06-NC-10 5.56E+01 3.11E+00 2.70E+00 8.04E-02 1.00E+00 4.86E+04 06-NC-ll 7.41E+01 2.26E+00 1.26E+00 5.34E-02 5.00E+00 8.26E+02 06-NC-12 8.98E+01 4.55E+00 2.59E+00 1.03E-01 9.00E+00 1.85E+03 06-NC-13 8.98E+01 9.10E+00 5.35E+00 1.31E-01 3.00E+00 1.21E+03 06-NC-14 6.48E+01 2.20E+00 1.79E+00 9.84E-02 1.20E+01 1.02E+03 06-NC-15 5.56E+01 6.82E-01 5.00E-01 9.06E-02 3.00E+00 1.57E+02 06-NC-16 6.76E+01 1.32E+00 1.16E+00 2.67E-01 2.00E+00 4.37E+02 06-NC-17 1.57E+01 3.24E-01 2.90E-01 8.22E-03 2.00E+00 2.70E+01
Average 7.99E+01 3.83E+00 2.67E+00 1.56E-01 4.22E+00 9.42E+03
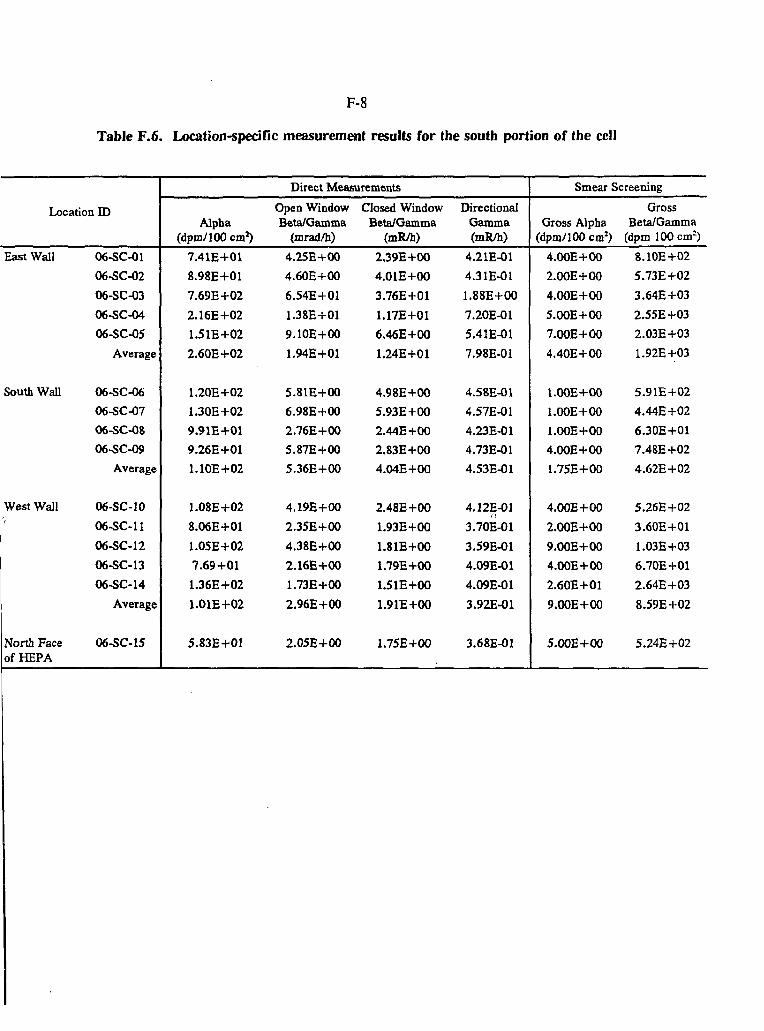
F-8
Table F.6. Location-specific measurement results for the south portion of the cell
Direct Measurements Smear Screening
Location ID Alpha
(dpm/100 cm2)
Open Window Beta/Gamma
(mrad/h)
Closed Window Beta/Gamma
(mR/h)
Directional Gamma (mR/h)
Gross Alpha (dpm/100 cm2)
Gross Beta/Gamma
(dpm 100 cm2) East Wall 06-SC-01 7.41E+01 4.25E+00 2.39E+00 4.21E-01 4.00E+00 8.10E+02
06-SC-02 8.98E+01 4.60E+00 4.01E+00 4.31E-01 2.00E+00 5.73E+02 06-SC-03 7.69E+02 6.54E+01 3.76E+01 1.88E+00 4.00E+00 3.64E+03 06-SC-04 2.16E+02 1.38E+01 1.17E+01 7.20E-01 5.00E+00 2.55E+03 06-SC-05 1.5 IE+02 9.10E+00 6.46E+00 5.41E-01 7.00E+00 2.03E+03
Average 2.60E+02 1.94E+01 1.24E+01 7.98E-01 4.40E+00 1.92E+03
South Wall 06-SC-06 1.20E+02 5.81E+00 4.98E+00 4.58E-01 1.00E+00 5.91E+02 06-SC-07 1.30E+02 6.98E+00 5.93E+00 4.57E-01 1.00E+00 4.44E+02 06-SC-08 9.91E+01 2.76E+00 2.44E+00 4.23E-01 1.00E+00 6.30E+01 06-SC-09 9.26E+01 5.87E+00 2.83E+00 4.73E-01 4.00E+00 7.48E+02
Average 1.10E+02 5.36E+00 4.04E+00 4.53E-01 1.75E+00 4.62E+02
West Wall 06-SC-10 1.08E+02 4.19E+00 2.48E+00 4.12E-01 4.00E+00 5.26E+02 ! 06-SC-ll 8.06E+01 2.35E+00 1.93E+00 3.70E-01 2.00E+00 3.60E+01
06-SC-12 l.OSE+02 4.38E+00 1.81E+00 3.S9E-01 9.00E+00 1.03E+03 06-SC-13 7.69+01 2.16E+00 1.79E+00 4.09E-01 4.00E+00 6.70E+01 06-SC-14 1.36E+02 1.73E+00 1.51E+00 4.09E-01 2.60E+01 2.64E+03
Average 1.01E+02 2.96E+00 1.91E+00 3.92E-01 9.00E+00 8.59E+02
North Face of HEP A
06-SC-15 5.83E+01 2.05E+00 1.75E+00 3.68E-01 5.00E+00 5.24E+02

F-9
Table F.8. CSL gamma spectroscopy results for south cell area smears
Location ID West Wall
North Wall
East Wall
06-NC-01 06-NC-02 06-NC-03 06-NC-04 06-NC-05
06-NC-06 06-NC-07 06-NC-08
06-NC-09 06-NC-10 06-NC-ll 06-NC-12 06-NC-13 06-NC-14 06-NC-15 06-NC-16 06-NC-17
137Cs/l37mBa
OiCi/100 cm2) 4.33-04
3.22E-05 5.21E-03 1.29E-03 2.68E-0S
2.30E-04 8.80E-05 3.47E-04
8.35E-03 1.29E-02 3.75E-04 8.13E-04 5.28E-04 3.76E-04 7.35E-05 2.01E-04
OiCi/100 cm2)
7.08E-5
O
Note: Blanks indicate no data.
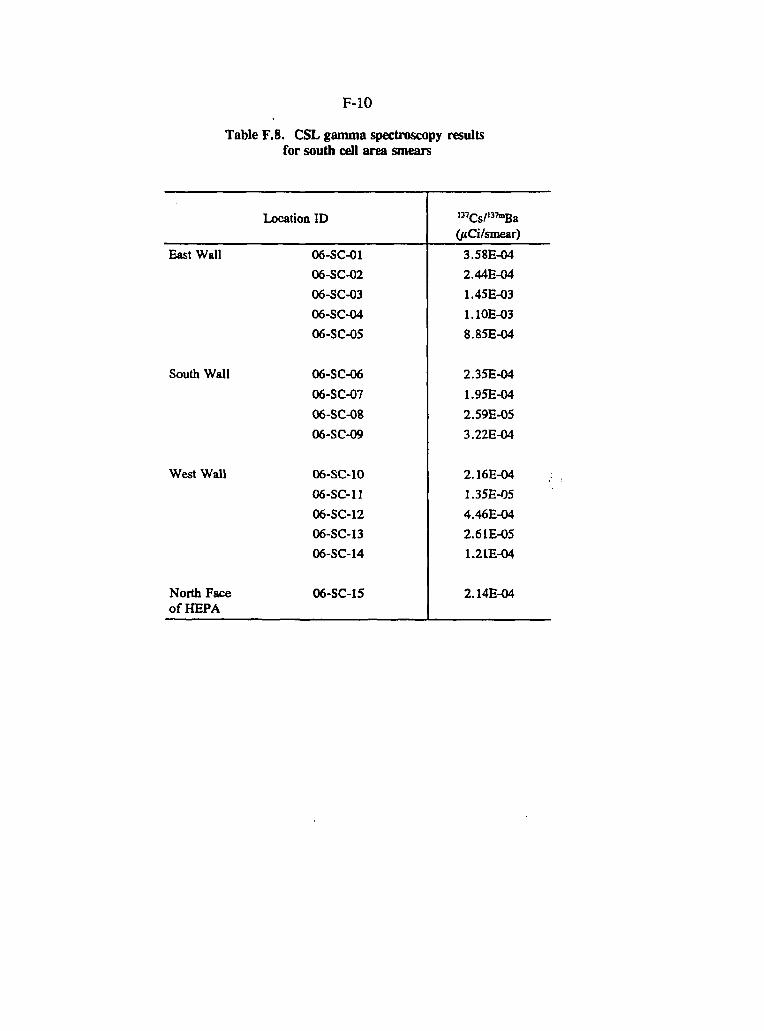
F-10
Table F.8. CSL gamma spectroscopy results for south cell area smears
Location ID 137Cs/'37mBa (/xCi/smear)
East Wall 06-SC-01 3.58E-04 06-SC-02 2.44E-04 06-SC-03 1.45E-03 06-SC-04 1.10E-03 06-SC-05 8.85E-04
South Wall 06-SC-06 2.35E-04 06-SC-07 1.95E-04 06-SC-08 2.59E-05 06-SC-09 3.22E-04
West Wall 06-SC-10 2.16E-04 06-SC-l 1 1.35E-05 06-SC-12 4.46E-04 06-SC-13 2.61E-05 06-SC-14 1.21E-04
North Face of HEPA
06-SC-15 2.14E-04

F-11
Table F.9. CSL strontium-90 analysis results for cell area smears
Location ID wSr Activity
(jxCillOO cm2)
North Cell Area West Wall 06-NC-03 7.69E-06
06-NC-04 2.58E-05
East Wall 06-NC-09 2.81E-05
06-NC-10 1.29E-05
06-NC-12 4.96E-06 A
06-NC-13 3.57E-06
South Cell Area East Wall 06-SC-03 3.25E-06
06-SC-04 2.29E-06
06-SC-05 3.68E-06
West Wall 06-SC-14 6.84E-06

F-12
Table F.10. Slit scanning results for cell area wall core (location 72.SB003)
I. Core
Position (in.)
Region of Interest (ROI) (counts)
ROI Bkg. (counts)
Activity (nCi/cm')
0.25 304.5 289.62 28.5 0.5 210 195.12 19.2
0.75 105 90.12 8.9 1 75.5 60.62 6.0
1.25 27 12.12 1.2 1.5 23 8.12 0.8
1.75 23.5 8.62 0.8 2 23 8.12 0.8 3 1.5 -13.38 Bkg. level 4 20.5 5.62 0.6 6 0 -14.88 Bkg. level 8 14 -0.88 Bkg. level 10 26.5 11.62 1.1 12 9 -5.88 Bkg. level 14 12.5 -2.38 Bkg. level 16 14 -0.88 Bkg. level 18 10 -4.88 Bkg. level 20 10.5 -4.38 Bkg. level
21.62 33 18.12 1.8 21.87 10.5 -4.38 Bkg. level 22.12 3.5 -11.38 Bkg. level 22.37 13 -1.88 Bkg. level 23.62 25.5 10.62 1.0 23.87 12 -2.88 Bkg. level 24.12 12.5 -2.38 Bkg. level 24.37 10 -4.88 Bkg. level 24.62 22 7.12 0.7

F-13
Table F . l l . Slit scanning results for cell area floor core (location 72.SB0G4)
Core Position
(in.)
Region of Interest (counts)
ROI Bkg. • (counts)
Activity (nCi/cm3)
Piece 1 0.25 39 24.12 2.4 0.5 25.5 10.62 1.0
0.75 10 -4.88 Bkg. level 1 19 4.12 0.4
1.25 11 -3.88 Bkg. level 1.5 19.5 4.62 0.5 1.75 13 -1.88 Bkg. level
2 21 6.12 0.6 2.5 17 2.12 0.2 3.25 17.5 2.62 0.3
4 9.5 -5.38 Bkg. level 4.5 23.5 8.62 0.8 4.75 30 15. J 2 1.5
5 24 9.12 0.9 5.25 18 3.12 0.3 5.5 5 -9.88 Bkg. level 5.75 33.5 18.62 1.8
6 21.5 6.62 0.7 6.25 32.5 17.62 1.7 6.5 54.5 39.62 3.9
Piece 2 6.75 131 116.12 11.4 7 115.5 100.62 9.9
7.25 72 57.12 5.6 7.5 92 77.12 7.6 7.75 85.5 70.62 7.0
S 73 58.12 5.7 8.25 74 59.12 5.8 8.5 88.5 73.62 7.2 8.75 123.5 108.62 10.7
9 195 180.12 17.7 9.25 479 464.12 45.7 9.5 910.5 895.62 88.2 9.75 334.5 319.62 31.5
10 196 181.12 17.8

F-14
Table F.ll (continued)
Core Position
(in.)
Region of Interest (counts)
ROI Bkg. (counts)
Activity (nCi/cm3)
10.25 116.5 101.62 10.0 10.5 54 39.12 3.9
Piece 3 10.75 167.5 152.62 15.0 11 215.5 200.62 19.7
11.25 213.5 198.62 19.6 11.5 205.5 190.62 ; 18.8
11.75 159 144.1?. 14.2 12 148.5 133.62 13.2
12.25 130 115.12 11.3 12.5 116.5 101.62 10.0 13.5 128.5 113.62 11.2 14.5 99.5 84.62 8.3 15.5 114.5 99.62 9.8 16.5 108.5 93.62 9.2 17.5 125 110.12 10.8 18.5 113 98.12 9.7
18.75 106.5 91.62 19 120.5 105.62 ' 10.4
19.25 118 103.12 10.2 19.5 113 98.12 9.7
Piece 4 19.75 83.5 68.62 6.8 20 38.5 23.62 2.3
20.25 41.5 26.62 2.6 20.5 36.5 21.62 2.1 21.5 44 29.12 2.9
22.75 38 23.12 2.3 23 40.5 25.62 2.5
23.25 33 18.12 1.8 23.5 48 33.12 3.3 23.75 47 32.12 3.2
Piece 5 24 80 65.12 6.4 24.25 85.5 70.62 7.0 24.5 92 77.12 7.6 24.75 110.5 95.62 9.4 25.75 84.5 69.62 6.9

F-15
Table F.ll (continued)
Core Position
(in.)
Region of Interest (counts)
ROI Bkg. (counts)
Activity (nCi/cm3)
26.75 104.5 89.62 8.8 28.75 108 93.12 9.2 31.75 106.5 91.62 9.0 35.75 96 81.12 8.0 38.75 93.5 78.62 7.7 40.75 118 103.12 10.2 42.75 114.5 99.62 9.8 43.75 75 60.12 5.9 44.75 133 118.12 11.6 45.5 120.5 105.62 10.4 45.75 84 69.12 6.8
46 80.5 65.62 6.5 46.25 44 29.12 2.9 46.5 51 36.12 3.6 46.75 72 57.12 5.6

F-16
Table F.12. Analytical results for TLD strings in the cell
String No. Elev from H, Rate H,, Rate • Bottom (ft) (mrem/h) (mrem/h)
1 14.5 0.5 0.4 12.5 0.6 0.6 10.5 0.6 0.5 8.5 0.6 0.6 6.5 0.7 0.9 4.5 0.9 0.7 3.5 1.4 0.9 2.5 2.1 1.0 1.5 3.1 1.2 0.5 2.8 1.2
2 14.5 1.6 1.4 12.5 2.0 1.6 10.5 2.4 2.3 8.5 2.3 1.9 6.5 2.8 2.7 •»\.5 2.4 2.0
; 3.5 2.5 2.1 2.5 2.8 2.2 1.5 4.5 2.8 0.5 5.2 2.7
3 14.5 8.9 5.9 12.5 98.3 16.7 10.5 70.2 18.4 8.5 90.4 24.2 6.5 78.8 19.3 4.5 47.9 12.4 3.5 32.5 9.1 2.5 33.1 7.8 1.5 35.5 7.0 0.5 12.0 4.8
4 14.5 3.4 3.4 12.5 4.6 4.6

F-17
Table F.ll (continued)
String No. Elev from H. Rate Hd Rate Bottom (ft) (mrem/h) (mrem/h)
10.5 5.8 5.6 8.5 5.8 5.7 6.5 4.9 5.2 4.5 4.1 3.7 3.5 4.1 4.1 2.5 4.0 4.0 1.5 4.7 3.5 0.5 3.1 2.5

ORNL/ER/Sub/87-99053/72
DISTRIBUTION
1. H. L. Boston 2. K L . Brady 3. T. W. Burwinkle 4. S. L. Cross 5. J. H. Hooyman 6. R. L. JefFers 7. L. L. Kaiser
8-12. G. J. Mandry 13-15. D. M. Matteo
16. P. E. Moor 17-18. P. T. Owen '
19. G. A. Person 20. A. W. Saulsbury 21. P. A. Schrandt
22-23. I. Smith 24. P. S. Wood 25. ORNL ER Document Management Center 26. Central ER Document Management Center 27. Laboratory Records Department 28. ORNL Patent Section 29. Central Research Library 30. M. R. Jugan, DOE Oak Ridge Operations Office, P.O. Box 2001, Oak Ridge, TN
37831-8541 31. A. P. Kelsey, Bechtel National, Inc., 151 Lafayette Drive, Oak Ridge, TN 37830 32. W. H. Snedaker, Ensercn Environmental, 111 Union Valley Road, Oak Ridge, TN
37830 33. Office of Assistant Manager for Energy Research and Development, DOE Oak
Ridge Operations Office, P.O. Box 2001, Oak Ridge, TN 37831-8600 34-35. Office of Scientific and Technical Information, P.O. Box 62, Oak Ridge, TN 37831

1 I
MIL ROOFING CM CORRUGATED NTL~M)OFING
NORTH ELEVATION
SOUTH elevation

EAST ELEVATION
WEST ELEVATION

NOTES I . THESE DRAWINGS ARE BASED ON ORNL DESIGN
DRAWINGS AND FIELD OBSERVATIONS. THEV ARE NOT INTENDED TO BE INTERPRETED AS EXACT AS-BUILT DRAWINGS, RATHER TO INDICATE GENERAL LOCATION, BUILDING SIZE, AND CONFIGURATION. PRECISE SIZE AND CONFIGURATION OF STRUCTURAL ELEMENTS "CKPECIALLY THOSE BELOW GRADE) IS NO" KNOWN.
o
REFERENCE DRAWINGS ORNL DRAWING D--36076
ORNL DRAWING D' -36080
ORNL DRAWING D -36276
ORNL DRAWING D -36277

• r- jvjr:^ • *
sou™ ELEVATION
1 I I il m ti il I I 3/8

NIL STAIR I HANDRAIL TYP-
H I ROOFING ON *OOD ROOF FRAMING
:onc BLOCK WALLS "YPICM. E GALLERY
STEEL FRAMING M PLATFORM
CORRUGAIEO MIL ROOFING ON MR FRAMING —
WEST ELEVATION
3/8 i i r i m i n 10 II 12 13 H

REFERENCE DRAWINGS ORNL DRAWING D-36076
ORNL DRAWING D-36080
ORNL DRAWING D-36276
"ORNL DRAWING D-36277
o
SCALE '/a" = 1/-0"
BECHTEL ENVIRONMENTAL INC. OAK RIDGE, TENNESSEE
OAK RIDGE NATIONAL LABORATORY REMEDIAL INVESTIGATION/ FEASIBILITY STUDY BUILDING 3506 SITE CHARACTERIZATION
EXISTING CONDITIONS - EXTERIOR ELEVATIONS
m JOB NO.
19118
SHEET 2 OF 2
F I G U R E 2 . 1 I ? X 2 2