Singapore and the New Regionalism: Bilateral Economic Relations with Japan and the US
60
Discussion Paper No. 0122 Adelaide University SA 5005, AUSTRALIA Singapore and the New Regionalism: Bilateral Economic Relations with Japan and the US Ramkishen S. Rajan, Rahul Sen and Reza Siregar June 2001
Transcript of Singapore and the New Regionalism: Bilateral Economic Relations with Japan and the US

Discussion PaperNo. 0122
Adelaide University
SA 5005, AUSTRALIA
Singapore and the New Regionalism:Bilateral Economic Relations with Japan
and the US
Ramkishen S. Rajan, Rahul Sen andReza Siregar
June 2001

CENTRE FOR INTERNATIONAL ECONOMIC STUDIES
The Centre was established in 1989 by the Economics Department of the AdelaideUniversity to strengthen teaching and research in the field of international economicsand closely related disciplines. Its specific objectives are:
• to promote individual and group research by scholars within and outside theAdelaide University
• to strengthen undergraduate and post-graduate education in this field
• to provide shorter training programs in Australia and elsewhere
• to conduct seminars, workshops and conferences for academics and for thewider community
• to publish and promote research results
• to provide specialised consulting services
• to improve public understanding of international economic issues, especiallyamong policy makers and shapers
Both theoretical and empirical, policy-oriented studies are emphasised, with aparticular focus on developments within, or of relevance to, the Asia-Pacific region.The Centre’s Executive Director is Professor Kym Anderson ([email protected]) and Deputy Director, Dr Randy Stringer ([email protected]).
Further details and a list of publications are available from:Executive AssistantCIESSchool of EconomicsAdelaide UniversitySA 5005 AUSTRALIATelephone: (+61 8) 8303 5672Facsimile: (+61 8) 8223 1460Email: [email protected]
Most publications can be downloaded from our Home page athttp://www.adelaide.edu.au/cies/
ISSN 1444-4534 series, electronic publication

CIES DISCUSSION PAPER 0122
Singapore and the New Regionalism: BilateralEconomic Relations with Japan and the US
Ramkishen S. Rajan, Rahul Sen*andReza Siregar**
School of Economics and CIES
Adelaide University, SA 5005, AUSTRALIA and
the Institute of Southeast Asian Studies, Singapore.
E-mail: [email protected]
*Department of Economics, National University of Singapore.
E-mail: [email protected]
**Department of Economics, National University of Singapore.
E-mail: [email protected]
June 2001
Copyright 2001 Ramkishen S. Rajan, Rahul Sen and Reza Siregar

Abstract
SINGAPORE AND THE NEW REGIONALISM:BILATERAL TRADE LINKAGES WITH JAPAN AND THE US
Free Trade Areas (FTAs) have recently become an integral part of Singapore
trade policy. This paper discusses the reasons behind Singapore’s recent
embracement of “new regionalism” with particular reference to the proposals
to form FTAs with Japan and the US. The paper goes on to examine various
aspects of Singapore’s trade linkages with the two economic superpowers in
some detail. Popular discussion of FTAs gives one the appearance that such
a trade policy is entirely benign. The paper sounds a cautionary note,
highlighting some reasons to be concerned with Singapore’s recent
embracement of the “new regionalism”.
Key words: APEC, ASEAN, Free Trade Areas (FTAs), Japan, regionalism, Singapore, US
JEL Classification: F30, F32, F34
Contact author:
Ramkishen S. RajanSchool of Economics and CIESAdelaide University, SA 5005E-mail: [email protected]

1. Introduction
Singapore has enjoyed one of the highest rates of growth in the world over
the past three decades, with its GDP appreciating at an annual average rate of about
8 percent during the period 1970-1999 (Table 1). A key component of the city-state’s
growth strategy has been its outward orientation, particularly its openness to trade
and investment flows. With a trade-to-GDP ratio of over 250 percent in 1999,
Krugman (1995) places the country in the league of “super-trading” nations.
Accordingly, Singapore has been a leading advocate of global trade liberalization and
the free flow of goods and services across international borders. Nonetheless,
recognizing that it has highly limited influence in the multilateral arena, where recent
progress on many important issues relating to trade and investment liberalization is
perceived to have been disappointingly slow and negotiations protracted and
cumbersome (Sager, 1997), Singapore has simultaneously pursued a second track
to liberalization via the regional route. Regionalism has involved both the Southeast
Asian region via the ten-member ASEAN grouping and the larger Asia and Pacific
region via the twenty-one members APEC grouping1.
However, the recent financial crisis has held up the pace if not commitment
by some of the ASEAN members to trade liberalization and appears to have depleted
the organization’s collective economic strength2; while APEC has become large and
unwieldy and appears ill-equipped to handle substantive trade and investment
liberalization issues effectively (Ravenhill, 2000). Accordingly, Singapore policy
1 ASEAN refers to the Association of Southeast Asian Nations and APEC refers to AsiaPacific Economic Cooperation. Chang and Rajan (1999) highlight the responses of ASEANand APEC to crisis-hit member economies.
2 As reportedly noted by Singapore Deputy Prime Minister, Lee Hsien Loong:the crisis caused some ASEAN countries to hold back from pushing aheadwith the ASEAN Free Trade Area (AFTA) and the ASEAN Investment Area(AIA), to give struggling domestic industries some breathing space…ASEANmembers who were doing relatively better -- such as Thailand, Malaysia,Singapore and Brunei -- should take the lead and work to put ASEANcooperation on track again (Business Times, Singapore December 1, 2000).

makers have underscored the need to explore alternative (i.e. third and fourth track)
liberalization paths. Free Trade Agreements (FTAs) have, therefore, become an
integral part of Singapore trade policy3.
FTAs appear to be increasingly regarded by policymakers around the world
as effective and expeditious instruments for achieving trade liberalization among “like
minded” trading partners (Schiff et al., 2000). Formation of bilateral FTAs among
such partners is also seen as a way to overcome the so-called “convoy problem”,
whereby the pace and depth of trade integration is held back by the “least willing
member”4. FTAs are viewed as a means of maintaining forward momentum towards
trade and investment liberalization, failing which it was feared that there might be a
lapse into protectionism, i.e. the so-called “bicycle theory” (Bergsten, 1998). To the
extent that contracting parties to an FTA agree to move beyond their respective WTO
commitments, there may be a demonstration effect that motivates future rounds of
broader multilateral negotiations under the auspices of the WTO. Since trade
agreements nowadays go well beyond trade in goods to encompass an increasing
number of areas and issues, FTAs could act as a “testing ground or pilot project for
exploring complex trade issues” and establish some sort of precedent or benchmark
for trade negotiations involving a larger number of countries, including one at the
multilateral level (Sager, 1997, p.242).
3 Given the definition of FTAs, Jagdish Bhagwati notes that term “preferential trade areas”(PTAs) is a more apt description. As he declares of such trade agreements (Bhagwati, 1995),they are:
two-faced: they embody both free trade and protection. Economistsinterested in the quality of public policy discourse should perhaps take apledge henceforth to rename free trade areas as “preferential” trade areas(p.2).
4 Or, as it is sometimes said, “those who can run faster should run faster and ought not to notbe held back by those who choose not to run or do so at a snail’s pace”. While the argumentthat negotiating regional trade pacts are easier to conclude and can be done at a faster pacethan global negotiations may not hold true as a general rule (Baldwin, 1997 and Bhagwati,1995), it does seem appropriate in the case of Singapore which sets strict deadlines forcompletion of discussions (though this may have its own problems; see Section 5).

A “first-mover advantage” in forming FTAs with a large number of different
countries early on takes the shape of a “hub” of overlapping arrangements
(Wonnacott and Lutz, 1989). Producers in the hub have cost advantages vis-à-vis
producers in the “spokes”, being able to obtain more of their intermediate goods at
lower prices. Further, since exports originating from Singapore are given preferential
access to a number of other markets (with which Singapore has trade pacts), this
may encourage the transshipment of goods through Singapore ports, hence fortifying
its already dominant role as an entrepot point. Of course, it is for this very reason that
FTAs have special provisions or rules of origin (ROOs) that are meant to prevent
goods being re-exported from the lower tariff country to the higher tariff country one
(i.e. trade deflection). However, this in turn may lead to a shift of export platforms
from other regional developing economies to Singapore in order to enjoy duty-free
market access5.
Singapore has already established a bilateral FTA with New Zealand and is in
the process of negotiating ones with Japan, the US, while trade pacts with Australia,
Chile, the European Free Trade Area (EFTA), and Mexico are also being seriously
considered. This paper examines the shift in Singapore trade policy towards FTAs in
general, with particular focus on the city-state’s bilateral trade relations and proposed
trade pacts FTAs with Japan and the US. Why are Singapore’s bilateral trade
initiatives with the US and Japan of particular significance? As will be discussed in
the following sections, Singapore’s interests in freer trade with Japan and the US
reflect its de facto close trade and investment linkages with and dependence on the
two markets. Entering into broad-ranging trade pacts with these two economic
superpowers is not only seen as a means of gaining greater market access (with
Japan in particular), but also as a way of avoiding the imposition of possible
protectionist measures in the future (with regard to the US in particular) and
5 Care must however be taken to ensure that ROOs are not manipulated in a way thatpartners gain de facto protection for their goods in the Singapore market.

managing future trade tensions (including establishing orderly dispute settlement
mechanisms). Being among the first few countries to establish a number of FTAs
with these two and other economically significant economies also ensures that
Singapore is not discriminated ex-post in the event that its “competitors” form FTAs
with third countries6.
While the US has signed a series of bilateral FTAs with Canada, Israel,
Mexico and Jordan, most recently, the announcement of the Singapore-US FTA is
considered especially significant as it is the first such one that the US may sign with
an Asian economy. It has also been suggested that Singapore’s bilateral trade pacts
with the US and New Zealand, along with anticipated ones with Australia and Chile,
may lead to a Pacific-5 or P-5 FTA, which itself could be a precursor to an APEC-
wide FTA. The announcement of a Singapore-Japan FTA is of significance as Japan
and Hong Kong have been the only two economies that have hitherto not participated
in any FTAs. A possible Singapore-Japan FTA is interpreted by some as an
important signal of Japan’s weakening adherence to non-discriminatory
multilateralism, not unlike the shift in the trade policy stance by the US in the 1980s,
which led to the proliferation of regional blocs. In addition, rightly or wrongly, the
Singapore-Japan FTA has been viewed as a precursor to the formation of an East
Asia-wide FTA between countries in Southeast Asia plus Japan, Korea and China
(ASEAN plus Three or APT) 7.
Having outlined the main rationale for Singapore’s recent surge in interest in
forming FTAs, the rest of this paper is organised as follows. Section 2 examines
various aspects of Singapore’s trade linkages with the two economic superpowers in
6 Analysis of trade patterns generally reveals that Taiwan, in particular, but also Malaysia,Korea and Hong Kong are among Singapore’s closest export competitors.
7 In a recent meeting in Singapore, it was agreed that the APT would explore the possibility ofholding an East Asian summit as well as consider the establishment of an APT FTA andinvestment area (Business Times, Singapore, November 25, 2000). The APT has taken someconcrete steps toward enhancing monetary and financial cooperation (Chang and Rajan,2001 and Rajan, 2001).

some detail. Section 3 considers the determinants of Singapore’s merchandise
exports to the US and Japan as well as estimates the impact of these exports on the
city-state’s overall aggregate demand. Recognizing that trade agreements (both
regional and global ones) are multifaceted, also encompassing services trade and
issues relating to investment (principles of national treatment and the right of
establishment), section 4 briefly discusses bilateral services trade and investment
linkages between the city-state and the two economic superpowers. Popular
discussion of FTAs gives one the appearance that such a trade policy is entirely
benign. Accordingly, section 5 concludes the paper by sounding a cautionary note,
highlighting some reasons to be concerned with Singapore’s recent embracement of
the “new regionalism”8. Two technical annexes (A and B), which show the
constructions of variables for the export demand functions and examine empirically
the impact of growth variations in the US and Japan on the city-state, follow the
main-text.
2. Merchandise Trade Linkages
It is important that pre-FTA trade patterns are carefully documented so as to
be able to investigate the changes attributable to Singapore’s FTAs with the US and
Japan in the future. This being said, the intention here is not to systematically
evaluate the welfare consequences for Singapore of these bilateral FTAs in the
conventional sense (i.e. trade creation versus trade diversion). Indeed, Singapore
has one of the most liberal trade and investment regimes in the world, and the near
zero tariff rates on most goods (and limited non-tariff barriers) implies that the scope
for trade diversion (i.e. replacement of lower cost suppliers from non-member
8The term “regionalism” is not meant to have any geographic connotation, referring to anytrade initiatives that are not multilateral in nature.

countries) from Singapore’s vantage point is quite small9.
2.1 Trade Flows
Charts 1 and 2 exhibit trends in Singapore’s total merchandise trade with the
US and Japan respectively over the period 1980-99. Together they constituted one
third of Singapore’s total merchandise trade (the US, 18 percent and Japan, 12
percent). While the share of Japan in Singapore’s overall trade has not varied by
much over the entire period under consideration, that with the US increased by over
8 percent in the early 1990s, declined slightly thereafter, but increased again from
1995 onwards. In contrast, trade with Singapore constituted a mere 2 percent of the
US’ global trade in 1999 and 3 percent in the case of Japan. Nevertheless, despite
the city-state’s microscopic physical size, it was the US’ tenth largest export market
and the twelfth largest source of imports in 1998. Singapore was the sixth largest
export market for Japanese goods and Japan’s thirteenth largest import source in
1999 (IMF, 2000).
While growth of Singapore’s exports to Japan has outpaced that to the US as
well as Singapore’s global trade as a whole, given the relatively lower base, exports
to Japan as a share of Singapore’s world exports declined from 11 percent in 1982 to
nearly 8 percent by 1999 (Chart 3). In contrast, the share of exports to the US
increased sharply from 13 percent in 1982 to nearly 20 percent of Singapore’s global
exports by 1999. Since Singapore is an entrepot economy, it is necessary to
disaggregate Singapore exports into its two component parts, viz. domestic exports
and re-exports (i.e. little or no value-added/transformation in Singapore) (Table 2).
Nearly a quarter of Singapore’s exports to the US included an entrepot component,
9 Assuming of course that the rules of origin (ROOs) are not prohibitive. ROOs are discussedin more detail in section 6. Ninety nine percent of Singapore’s imports are not dutiable. Tariffsare only imposed on alcoholic beverage imports while excise duties are imposed on tobaccoproducts, automobiles and gasoline. During the Uruguay Round, Singapore agreed to bind 70percent of its tariff lines.

this figure being about a third in the case of Singapore’s exports to Japan.
On average, Japan and the US respectively constituted about 20 and 15
percent of Singapore’s total imports. However, averages fail to capture the entire
picture. For instance, imports from the US have appreciated from 15 percent in 1995
to almost 20 percent in 1998, while those from Japan declined from 21 percent to 17
percent over the same period (Chart 4).
2.2 Trade Balances
Singapore has recorded a persistent and growing bilateral trade balance with
the US since the mid 1980s, peaking at slightly over US$ 3 billion in 1998-99 (Chart
1). These surpluses are a relatively low share of overall Singapore-US trade,
averaging about 9 percent). In contrast, Singapore has been running persistent
bilateral deficits with Japan which have been increasing both in magnitude as well in
terms of Singapore’s total trade with Japan, especially during the period 1985-94.
The deficit was around US$ 10 billion in 1999, constituting about 45 percent of
Singapore’s bilateral trade with Japan (Chart 2).
Persistent trade deficits with Japan might at least partly be a reflection of the
inability of foreign (including Singapore) exporters to penetrate the Japanese market
due to the maintenance of both official and (especially) unofficial nontariff barriers
(NTBs) (Lawrence, 1987). Indeed, these barriers have in turn often led to the
accusation that Japan “imports too little” from its trading partners (Takeuchi, 1989),
with a survey of Singapore exporters in the late 1980s revealing them to be
"generally overawed by the Japanese ‘closed market' image" (Lim, 1988, p.100). In
the context of a Singapore-Japan FTA, this factor could be of potential importance,
as a bilateral FTA ought to provide Singapore preferential access to the Japanese
market10. Conversely, given continued aggregate trade deficits faced by the US,
10 Since the focus of this paper is on Singapore, the potential welfare effects of possible tradediversion in the case of Japan (or the US) is not tackled here.

protectionist pressures in case of an economic slowdown may emerge in that
country. Thus, a Singapore-FTA might serve as an “insurance policy” against the
future imposition of US unilateral trade barriers11.
The assemble-and-export strategy, whereby Japanese multinationals in East
Asia import intermediate products and capital goods from Japan assemble them
locally and re-export the finished goods to the US and other third countries, is a
further reason for Japan's persistent bilateral trade surplus with Singapore as well as
the rest of East Asia12. On the other hand, US subsidiaries abroad have contributed
to the US trade deficit with East Asian economies as they exported relatively more
back to the US (i.e. “reverse imports”) than they sourced from it (Encarnation, 1992).
This phenomenon appears to be especially true in the case of Singapore, with early
studies suggesting that between 4 and 60 percent of output by US multinationals in
Singapore has been exported back to the US, while the corresponding figure in the
case of Japan is estimated at only around 5 percent (Hill and John, 1985)13. We
discuss investment linkages issues in more detail in section 4.
2.3 Commodity Composition of Merchandise Trade
The preceding analysis focuses only on broad trends in aggregate trade
relations. An examination of the commodity composition of trade is necessary to
obtain a fuller understanding of Singapore’s trade linkages with Japan and the US.
11 This being said, insofar as the bulk of Singapore's exports to the US have beenconcentrated in the SITC 76 and 84 categories (TDB, 1992), and most of US importrestrictions have generally fallen on those categories (DeRosa, 1986, p.180), Singapore maybe especially vulnerable to protectionist measures that might be imposed by the US.
12 It is this phenomenon which is thought to have contributed to an increase in Singapore’simports from Japan particularly after 1987-88, with Singapore being one of the largestrecipients of Japanese FDI due to various push factors in Japan (Rajan, 1996).
13 Julius (1990, p.75) has suggested that about 50 percent of the US imports from Singaporeand Malaysia were from US affiliates in Singapore.
Table 3 compares the composition of Singapore’s overall exports and exports
to the US and Japan specifically by commodity groups at the SITC 3-digit level in
1999. Singapore’s global exports are concentrated in five product categories, viz.
Electronics and petroleum refined products (SITC 776, 752, 759, 334 and 764),
which constituted nearly 60 percent of Singapore’s total world exports. Electronic
valves (SITC 776) itself accounted for about 20 percent of Singapore’s global exports
as well as exports to the US and Japan specifically, making it the second most
important Singapore export to both markets. Data Processing Machines (SITC 752),
which is the second most important Singapore export globally, but was the most
important one to both the US and Japan. This product accounted for nearly 20
percent of Singapore’s exports to Japan and 40 percent of Singapore’s exports to the
US. The top five product categories of Singapore’s overall exports noted above are
among the highest categories of Singapore’s exports to the US and Japan,
accounting for almost three-quarters and one half of the city state’s total exports to
both trading partners, respectively. In fact, seven of the top ten exports from
Singapore to both the US and Japan overlap, indicating a high degree of similarity in
commodity composition of Singapore’s exports to both countries14. Of these,
petroleum products are of relatively lower importance in Singapore’s exports to the
US compared to the former’s exports to Japan. This is true even if focus is limited to
Singapore’s domestic exports to these countries.
Table 4 documents the commodity composition of Singapore’s imports from
the US and Japan in 1999. While Electronic Valves (SITC 776) is the top ranked
product in Singapore’s overall imports, constituting nearly one-fifth of the total, the
import shares of other electronic products and refined petroleum products are much
smaller compared to their corresponding export shares. Seven commodity groups,
six of them in the categories of electrical and electronic goods and equipment, are
14 This result remains unaltered even if earlier periods before the crisis in 1997-98 areconsidered.

also among the top ten commodities of both Singapore’s overall exports and imports.
Four out of these seven product groups overlap in Singapore’s exports to and
imports from the US (SITC 776, 759, 752, and 772), and five in the case of
Singapore’s trade with Japan (SITC 334 and SITC 778, being the exceptions)15. All
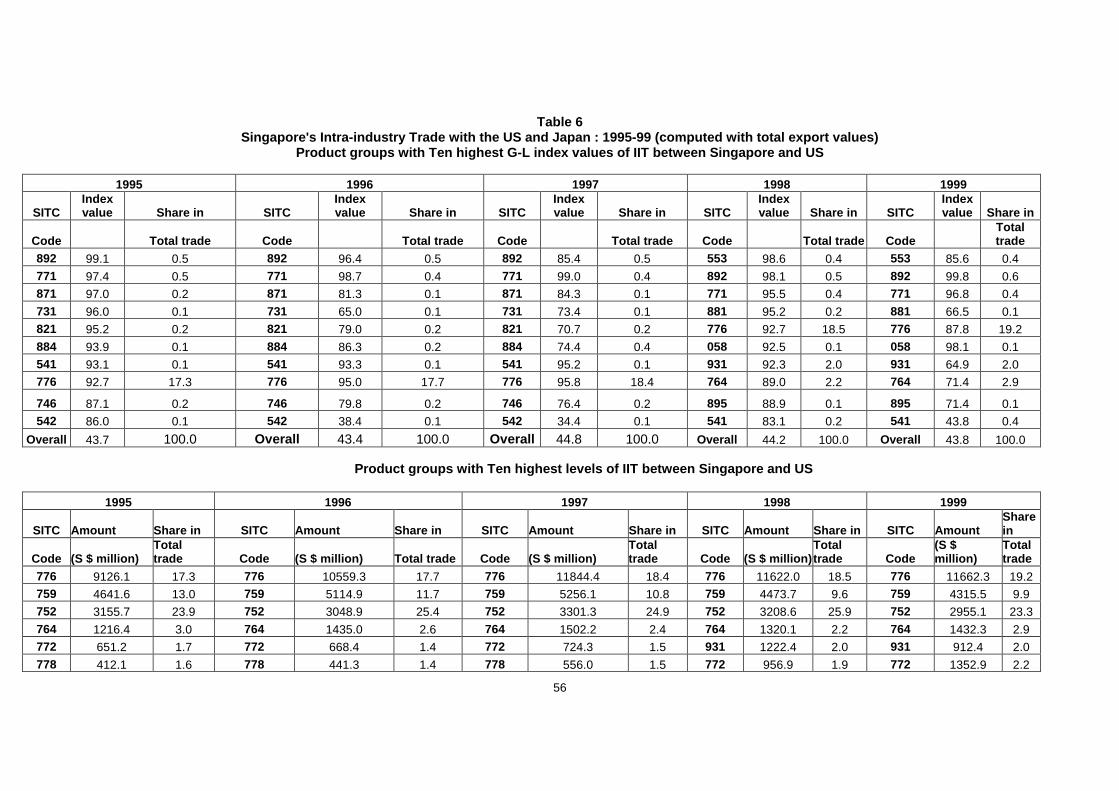
this suggests a priori a high presence of intra-industry trade (IIT)16.
3. Impact of Changes in Foreign Demand on the Singapore Economy viathe Export Channel
The section is divided into three parts. We first estimate a set of merchandise
export demand functions so as to ascertain whether foreign (i.e. US and Japanese)
incomes and prices (competitiveness factor) are statistically significant variables
impacting Singapore’s exports to the US and Japan. We then proceed to estimate an
a model which relates the aggregate demands of Singapore to the country’s exports
to the US and Japan. The objective here is to determine the statistical significance of
the contributions of these exports on the aggregate output performance of the
Singapore economy. To complement the formal tests undertaken in the first two parts
of the section, in the third part of this section we construct a “direct trade effect index”
a la Conway (2001) in order to quantify the economic impact of an economic
slowdown in Japan and the US on the Singapore economy.
15 For instance, SITC 752 (Data processing machines), which has constituted nearly 40 and20 percent of Singapore’s exports to US and Japan, respectively, is only 5 percent ofSingapore’s imports from the US and 4.2 percent from Japan. Refined petroleum products donot figure at all in the top ten items of imports from either country to Singapore.
16 In 1999, these seven commodity groups (i.e. SITC 776, 759, 752, 334, 764, 772 and 778)accounted for 63 percent of Singapore’s total exports and 46 percent of its total imports,respectively.

3.1 Export Demand Functions
There are two primary determinants of export demand (Dornbusch, 1988 and
Hooper and Marquez, 1993). First, is the foreign income variable (Yus and Yjpn).
Second, is the relative price variable / terms of trade (competitiveness factor) with
respect to the US products (Psgus) and the Japanese products (Psgjpn) (Annex A)).
A recent study by Forbes (2001) has emphasized that price and income effects are
among the most important determinants explaining trade fluctuations between
economies. In addition, sharp gyrations in the foreign exchange markets in the last
decade (Bird and Rajan, 2001) necessitate that we explicitly take into account
exchange rate volatility as another explanatory variable in the export demand
function (Chowdhury, 1993, Chou, 2000, Daly, 1998 and McKenzie, 1998). We do so
by constructing a volatility index (Vus and Vjpn)17.
Descriptions of the variables and sources of the data are presented in Table 5
and Annex A. ∆ denotes the first difference of the log forms of the variables. Before
constructing an empirical model, it is necessary to examine the basic unit-root
properties of the relevant variables. Based on the ADF-statistics, we conclude that all
the variables are integrated of order 1 or are I(1), with the exception of the volatility
index of the real exchange rate which is I(0) (Table 6). In order to discount the
possibility of the regressions capturing spurious movements in the variables, we
construct the export demand functions in the following manner18:
17 See Annex A for the constructions of volatility index.
18 Since the variables Xsgus, Xsgjpn, Yus, Yjpn, Psgus, Psgjpn are integrated of order 1 (i.e.their means and variances do not fluctuate around a constant), while the variables Vus andVjpn are stationary (constant mean and variance), the results of the regressions of thesevariables in levels may represent a totally spurious relationship. The R-square may be high,but more often than not, we will find the Durbin-Watson to be very low (indicating thepresence of serial correlations). To address this problem, we regress the relevant variables interms of first differences as shown in eqs. 1 and 2.

tititititt DuXsgusVusPsgusYusXsgus 115141312111 εβββββα ++∆+∆+∆+∆+=∆ −−−− (1)
tititititt DuXsgjpnVjpnPsgjpnYjpnXsgjpn 225242322212 εβββββα ++∆+∆+∆+∆+=∆ −−−− (2)
Following Chowdhury (1993) and Daly (1998), we also include a lag variable of
change in exports (∆Xsgust-i and ∆Xsgjpnt-i). The inclusion of this variable is meant to
capture the impact of past export growth on current exports, i.e. a so-called
“adjustment factor” a la Goldstein and Khan (1976).
It is important to note that the Monetary Authority of Singapore (MAS)
switched to a policy of a steady appreciation of the local currency against its key
trading partners’ currencies in the early 1980s, culminating with the recession in
1985-86 (Rajan and Siregar, 2000). Accordingly, we include a Dummy variable (Du)
to capture the impacts of the shift in this exchange rate policy and the 1985-86
recession. This variable is equal to 0 from quarter 1, 1981 to quarter 4, 1986;
otherwise it is equal to 1. ε1t and ε2t are error terms, while α1 and α2 are constant
terms.
a) Theoretical Preliminaries
A priori we expect the coefficient estimates for β11 and β 21 to be positive, as
rising aggregate demand (income) in Japan and the US ought to stimulate
Singapore’s exports to the respective markets. As for the coefficient estimates for β12
and β22, the signs are expected to be negative. The rise in the price of the domestic
good relative to the foreign good worsens the competitiveness of, and therefore the
demand for the local (Singapore) good in the foreign markets (Japan and the US).
The coefficient of the Volatility index (β13 and β23) can either be positive or negative
(Bailey, 1987, Daly, 1998 and Giovannini, 1988). If firms are risk-averse, exchange
rate volatility acts as a negative shock, causing the export price to rise and the export
volume to fall. On the other hand, risk-neutral firm with export prices invoiced in
domestic currency may cut prices in response to exchange rate volatility, hence
causing the export demand (volume) to rise. The coefficient estimates for β14 and β 24
are expected to be negative as high growth in export demands during the period (t-i)
will, in all likelihood, lead to weaker export demand at period (t).
Our observation period covers the time prior to the breakout of the 1997/1998
East Asian crisis (quarter 1, 1980 to quarter 2, 1997). We conduct the standard OLS
tests on both equations. Following the commonly used process of general-to-specific
methodology (see Hendry, 1974 and 1977), we include four-quarter lags (t-4) of the
key explanatory variables in the first stage of the OLS test. On the next sequential
stages, we drop all the insignificant lags and only consider the significant ones for the
final stage of the estimating equation19.
b) Results
The main results of the regressions are as follows (Tables 7 and 8). The
coefficient estimates for the determinant variables (income, price and volatility index
variables (for the Japan case)) are statistically significant and theoretically consistent.
We dropped the Dummy variable due to low t-statistics. The F-statistics and the R-
square confirm the overall soundness of the model, in the sense that all the
explanatory variables in each equation contribute significantly in explaining the
variations in the export demands of Singapore to Japan and US. In addition, we are
able to reject any presence of serial correlation problems in both regressions on the
bases of the Durbin-Watson and the Arch-LM test statistics (eqs. 1 and 2).
The roles of both the US and Japanese aggregate demands (incomes) are
statistically significant explanatory variables in the performance of the Singapore’s
19 We tried to go beyond four quarters-lag, but none of those extra lags is found to besignificant. This process of “general-to-specific” methodology was introduced by Hendry(1974, 1977) and has since become commonplace (for instance, see Chowdhury, 1993 andDaly, 1998).

exports to the respective markets. The estimated coefficients for the foreign income
variable for each export function are found to be the largest among all the
explanatory variables. The relative price (competitiveness) factors also play an
important role in Singapore’s exports to both Japan and to US. In addition, we find an
increase in the volatility of the real exchange rate impedes exports of Singapore to
Japan and US. Based on the t-statistics of the coefficient estimates, the volatility
index appears more significant in the case the Singapore’s exports to Japan than in
the case of the Singapore’s exports to the US market.
3.2 Significance of Foreign Exports to Aggregate Demand in Singapore
Having formally confirmed the significance of the US and the Japanese
incomes in explaining the performance of Singapore’s merchandise exports to both
markets, we proceed to evaluate the role of these exports in explaining the
performance of Hong Kong’s and Singapore’s economy. To formally capture this
second link, we will test the following empirical model20:
ttjitt XFYsg εα ++= → )( )( (3)
where: F(.) represents a general functional form; Ysg denotes aggregate demand of
Singapore. )( )( tjiX → are exports of Singapore to US and Japan (Xsgust and Xsgjpnt );
tα and tε are respectively an intercept and an error term.
20 From the standard text-book construction of the aggregate demand (income) of an openeconomy, we can express the aggregate demand function from the expenditure approach:
Y = C + I + G + (X - M)
where: Y is the aggregate demand; C is the household’s consumption; I is the investmentvariable; G is the government expenditure; X is total exports; and M is total imports. Since ourmain interest is to estimate the role of export in explaining the performance of the aggregatedemand, our general empirical model can be simplified as in eq 3.

a) Long Run Relationships
Since all the relevant variables in eq. (3) are integrated of order 1 or I(1), we
proceed to test the possible existence of long run or cointegrating relationship
between the three variables in question (using log forms). The Johansen Maximum
Likelihood test results are summarised in Table 9. We conclude that there exists one
cointegrating relationship between these three variables. Furthermore, from the
normalised coefficient estimates, we can further confirm that the variables Xsgus and
Xsgjpn contribute significantly and positively to the overall fluctuations of Singapore’s
aggregate demand/output during the period of quarter 2, 1982 to quarter 2, 1997.
b) Error Correction Model: Short Run Scenario
We proceed to examine the case of the short run. To understand the short
run impact of Xsgus and Xsgjpn on Singapore’s output, we test the following error
correction model (ECM):
∆Ysgt = δ11 ∆Xsgust-i + δ12∆Xsgjpnt-i + δ13Du + δ14 ECMt-1 + δ1t (4)
The definitions of the variables have all been fully described earlier. Du is the same
dummy variable used in eqs. 1 and 2. The variable ECMt-1 represents a long run
relationship (Ysg(t-1) – Y�
sg(t-1))21 . As in the case of the export function tests (eqs. 1
and 2), we begin with four quarters lag (t-4) and drop all the insignificant variables.
The OLS test results are posted in Table 10.
Consistent with the previous results reported for the two export demand
functions, we find the dummy variable to be an insignificant explanatory variable in
explaining the performance of the Singapore’s GDP and was dropped in the final
estimating equilibrium. We find that both Xsgus and Xsgjpn contribute positively and
21 Y
�
sg is an estimated level of aggregate demand. It is derived using the coefficient

significantly to the changes in the aggregate demand variable (Ysg) even in the short
run. In addition, the significance of coefficient δ14 confirms the presence of a long run
relationship between the three variables (Xsgus, Xsgjpn and Ysg). As in the case of
export functions, we do not find more than four quarters lag variables to be
significant.
3.3. Direct Trade Effects of a US and Japan Slowdown on the SingaporeEconomy
In the preceding analysis we have established the statistical significance of
foreign demands on Singapore’s exports to the US and Japan and the city-state’s
overall income. It would be useful to determine the economic significance of the
findings. In other words, to what extent is Singapore affected by an economic
slowdown in Japan and the US via the merchandise exports channel? To answer this
question, we select two recent periods of economic slowdown in Japan and the US
and compute the direct trade effect estimates a la Conway 2001 (the index is detailed
in Annex B). Before proceeding, it is important to keep in mind that this index, while
insightful, does not capture the possibility of third country or indirect trade effects.
Direct trade effect only explains a relatively smaller portion of the global effects that
may be captured in a more “black box” structural VAR model approach that focuses
on long-run relationships.
We consider two cases. First, we look at the US economic downturn in 1990.
The US economy experienced a sharp slowdown in 1990, growing at less than 2
percent compared to a year before. We weigh the decline in the growth of US/Japan-
bound exports by the contribution it makes to the Singapore economy. Our estimates
suggest that a 2 percent slowdown in the US economy would have reduced
Singapore’s GDP by about 2 percent as well. More or less similar results are found in
our second case which focuses on the impact of a slowdown in Japan during the
estimates reported in Table 9.

early 1990s on the Singapore economy. Specifically, with the bursting of the bubble
economy in the late 1980s, Japan’s GDP growth rate dropped substantially in early
1990s and continued to be weak for the whole decade of 1990s. Japan’s GDP
growth rate fell below 4 percent in 1991 from more than 5 percent a year earlier.
Consequently, Singapore’s merchandise exports to Japan contracted by almost two
percent. The poor performance of the exports to Japan transmitted the adverse
consequences of the fall in the GDP growth rate in Japan (by about 1.3 percent) into
an equal percentage drop in the Singapore GDP growth rate in 1991 (Table 11).
Certainly, the magnitudes of direct-trade effect index will depend on the periodical
cases of economic slowdowns that we select. However, based on the recent cases of
1990 (for the US) and 1991 (for Japan), we might be able to conclude that the direct
trade effects from economic slowdowns in the two economic powers would have
adverse consequences on the economy of Singapore. A key driving factor here is the
high trade dependence that Singapore has on the two markets, reflected by high
export shares in the overall Singapore’s GDP.
4. Trade in Services and Direct Investment
The focus has hitherto been on merchandise trade linkages. The revolutions
brought about by the introduction of innovations in information technology and
telecommunications that has been a vital factor in increasing the importance of
service transactions in the global economy. Thus, in many countries, including
Singapore, Japan, and the US, the services sector has become the largest
contributor to GDP (between 60 and 70 percent) (World Bank, 2000). Unfortunately
data problems in services trade are especially acute; available data are not
comprehensive, timely or internationally comparable. A detailed empirical
examination study is therefore not possible. Nonetheless, it is recognized that the
services sector has become increasingly important in international transactions. In
1996, commercial services accounted for nearly one-fifth of world trade and an
estimated three-fifth of global Foreign Direct Investment (FDI) inflows. Investments in
the services sector play a major role in the area of trade cooperation, an issue which
we now briefly turn to.
4.1 Singapore’s Investment Linkages with the US and Japan
Singapore’s ability to attract substantial Foreign Direct Investment (FDI) flows
has turned it into an important manufacturing base for foreign multinationals and a
major international financial, logistics, trading and transportation hub. The stock of
Singapore’s direct inward equity investment increased more than five-fold from US$
14 billion in 1987 to US$ 76 billion by 1997. Among the major countries that invested
in Singapore, the US, Japan and the EU together accounted for over half of total
inward direct investment in 1997 (Table 12a). Among the major contributors of FDI in
Singapore, the US was the largest single foreign investor in terms of investment
commitments in both Singapore's manufacturing and services sectors.
Focusing on latest available data, in 1999, manufacturing investments from
the US were US$ 2 billion or nearly 45 percent of total manufacturing commitments
for the year (Table 12b). For services, the investment commitments from the US in
1999 were US$ 320 million, over one third of total services commitments (Chart 5).
Japan is the second largest investor in Singapore’s manufacturing sector. In 1999,
Japanese investments amounted to U.S $700 million, constituting nearly 15 percent
of total investment commitments in that sector, and almost one-fifth of the total
foreign investment inflows in the sector (Table 12b). Japan’s investments in the
services sector were only about US$ 47 million in the same year, or only 5 percent of
the total investment commitments in this sector (Chart 5).
In terms of overall composition of FDI into Singapore, the majority of the
investments in the manufacturing sector in 1999 were directed towards the
Electronics industry that accounted for 42 percent of total investment commitments,
followed by Chemicals (33 percent) and Engineering (17 percent) (EDB, 2000). In the

services sector, headquarter services accounted for 36 percent of total investments,
followed by the ICT and media sector (32 percent) and Logistics/Supply chain
management related services (21 percent) (Chart 6).
On the other hand, the US was the sixth largest host country of Singapore's
direct investment abroad; Singapore companies invested a total of U.S$ 1.8 billion in
the US in 1997 or about 5 percent of Singapore’s total direct investment overseas
that year. The majority of Singapore companies' investment activities in the US were
in the financial, commerce, real estate and manufacturing sectors. Singapore’s
investments in Japan have been relatively low at about US $ 300 million during this
period, less than 1 percent of the total outward investments from Singapore (Table
13). This is more a reflection of the relatively less open nature of the Japanese
market to FDI.
The preceding indicates that Singapore’s investment linkages with the US
have been stronger than that with Japan. As previously noted, both manufacturing
and trade, particularly between Singapore and US have been FDI-driven. Therefore,
bilateral trade pacts ought also to focus on steps to ease existing barriers to
investment flows, especially in view of the fact that little progress has been made on
the investment liberalization front in the multilateral arena.
5. Singapore and the New Regionalism: Some Concluding, CautionaryNotes
The preceding sections have highlighted the existence of pronounced trade
and investment linkages between Singapore and the two largest economies in the
world, Japan and the US. In some ways, proposed bilateral trade pacts by Singapore
with these two economies is a formalization of the de facto extensive and deep
linkages that already exist. In other words, it might be argued that such FTAs are
essential “market-driven”. The reasons for Singapore’s recent turn to the “New
regionalism” have been discussed in some detail. Among the most important are the
continued weaknesses in the neighbouring Southeast Asian economies, and
Singapore’s consequent need to diversify its economic linkages. As noted, despite
the fact that Singapore already has low tariffs and other barriers implies that a
number of negative conventional welfare effects may be of limited relevance to
Singapore, it would certainly be a leap of faith to conclude that there are no ill effects
whatsoever. What are some potential concerns of Singapore’s recent eagerness to
form FTAs?
While we have noted that trade diversion may be expected to be minimal from
Singapore’s standpoint given its low tariffs (and ignoring the issue of ROOs),
conversely, the gains from discriminatory liberalization vary inversely with the
preunion tariff levels (Panagariya, 1998)22. The proliferation of a number of
overlapping FTAs also raises many technical problems with respect to the
implementation of ROOs (Krueger, 1997). Even with a single FTA, a concern is that
ROOs with a particular country, say the US, may be sufficiently prohibitive so as to
induce Singapore exporters to source their inputs from US than some other
developing country in Asia (such as Korea, for instance). In other words, the US
exports its external tariffs to Singapore. This appears to have been the case with
NAFTA, where the US negotiated a ROO on Mexican assemblers of automobiles.
ROOs also give rise to significant costs due to the need for administrative
surveillance and implementation (see Krueger, 1995, 1997, Lloyd, 1993, Schiff et al.,
2000 and Wonnacott, 1996a,b). In practice, ROOs are particularly complex - they are
almost two hundred pages in case of NAFTA and eighty pages of small print in the
case of the EU’s agreement with Poland (Schiff et al., 2000) - as they have to take
into account tariffs on imported intermediate goods used in products produced within
the FTA. The bookkeeping and related costs rise sharply as production gets more
22 In addition, in the case of its FTA with Japan, some East Asian economies may actually beworse off. This is so as Japan has provided extensive trade preferences to a number of EastAsian economies on a GSP (Generalised Preference System of Preferences) basis, and withan FTA, these benefits may be revoked along with a lowering of tariffs (Panagariya, 1998).

integrated internationally.
Apart from the issue of ROOs, a large number of FTAs may leave investors
confused as to which rules, obligations and incentives correspond to which partner.
Worse still, there is the possibility that membership in multiple trade pacts may create
“obligations made in one that contradict those made by others” (Schiff et al., 2000).
Bergsten (2000) highlights this point in the context of compatibility of subregional
agreements with the APEC’s goals of regionwide trade liberalization (i.e. the Bogor
declaration of free and open trade by 2010/2020). As he notes of the blueprint on the
Singapore-Japan proposed FTA:
it states that Japan is unwilling to liberalize agricultural trade, even in adeal with Singapore where there is no agricultural trade. In otherwords, they do not accept the principle. They can argue, as thisblueprint does, that it is perfectly compatible with the WTO. The WTOsays you must substantially cover all trade. If there is no agriculturaltrade, you do not have to include it to meet the WTO test. But theAPEC test, which was hammered out after much debate in both Bogorand Osaka, states that trade liberalization must be comprehensive -no sectors can be excluded. APEC was consciously being WTO+ andthe Japan-Singapore agreement, if that study result becomes theactual outcome, would violate its precepts…Moreover, the report saysnothing about completion by 2010. That deadline is a commitment forcountries in the APEC context…Japan and Singapore should beasked how their new agreement is compatible with APEC (p.5).
Time and efforts spent on negotiating and implementing a series of bilateral
and trilateral FTAs may divert scarce resources from the multilateral rounds.
Potentially more important than the direct impact of this “scarce negotiator resources
argument” to Singapore is the fact that, by being involved in a number of FTAs,
Singapore must accept at least partial responsibility for diverting attention of trade
partners away from multilateral negotiations. For instance, the US Trade
Representative (USTR) paying more attention to a number of bilateral FTAs will
mean that much less attention at the margin being paid to the WTO or APEC.
Singapore appears to be willing and able to negotiate FTAs fairly quickly.
However, this rapid pace apparently hinges on Singapore’s readiness to accept a
number of conditions in the context of the bilateral pacts set forth by the larger
partners, such as labour and environmental standards, in the case of the FTA with
the US (said to be modelled after the US-Jordan agreement), or exclusion of
agriculture in the case of the FTA proposals with Japan (as noted above)23. While
acceptance of these conditions may not be problematic in the case of Singapore
(given its high environmental standards and negligible agricultural sector), if they are
eventually included in the agreements, Singapore may be doing a disservice to
developing economy interests in multilateral negotiations at large. Bhagwati’s (1995)
discussion of the US FTA strategy during NAFTA negotiations is prescient:
NAFTA’s passage..was subject to Mexico’s acceptance ofsupplemental agreements on environmental and labourstandards…(W)hy should such agreements be a precondition for freertrade?..(The) US was a superpower bargaining one-on-one with avastly inferior power. In turn, those supplemental agreements haveencouraged the environmental and labour lobbies to argue thatbecause NAFTA required them, so must the WTO…In short, NAFTAhas made the WTO’s business more complex, not less..(T)he UnitedStates can first force Mexico to buckle under to those demands andthen tell Chile and others, “This is how NAFTA is, so you must acceptthese ‘nontrade’ terms and conditions if you wish to come onboard.”…(T)hat “Take-them-one-by-one’ strategy works so muchbetter than trying to impose extraneous, indeed harmful, conditionsthrough multilateral trade negotiations where all countries facing suchdemands negotiate together and have more bargaining power (pp.12-3).
More narrowly, such supplemental agreements may not be as readily
acceptable to other ASEAN members. Accordingly, Singapore-based FTAs may not
be an appropriate model for future agreements by other Asian nations, and could
make these FTAs de facto exclusionary to other ASEAN members despite
“assurances” by Singapore policy makers that the FTAs would be left open for others
to join (Chua, 2000)24. Further, by Singapore unilaterally signing on to such terms
23 See Perroni and Whalley (1994) who formally show how large countries have dominatednegotiations with FTAs with smaller countries (i.e. the former has the bargaining power inFTAs).
24 Paradoxically, as noted, while it may be in Singapore’s best interest to remain as a hub witha number of other spokes it may be in the best interests for other countries not to join anexisting Singapore-based FTA. Wonnacott (1996a,b) caution that while spokes are certainly

and conditions (such as linking trade with labor standards), that might preclude
ASEAN from taking a common and credible stand on these and other issues (since
ASEAN follows a policy of consensus).
worse off in a hub-and-spoke regime compared to a “full” or complete FTA, it is unclear as towhether hubs are better or worse off. This is so, as the collective incomes of a hub-and-spokearrangement tends to be smaller (given the inefficiencies caused by overlapping FTAs), theshare of benefits accruing to the hub is larger than a full FTA.

Annex A: Data Constructions for the Export Demand Functions
Export quantity / volume: The most accessible data on exports are in value
rather than in quantity terms. However, the theory suggests that volume or quantity is
the appropriate dependent variable rather than value (Learner and Stern (1970)). To
get the export volume or quantity, we divide the value series by a measure of price to
obtain the proper dependent variable. For an example, the volume of Singapore’s
exports to US is calculated in the following way:
t
USt
t XPXVALXsgus = A1
where Xsgus is the quantity of export to US, USXVAL is the value of export to US,
and XP is the country’s export price. The same step is used to calculate the quantity
of Singapore’s exports to Japan.
Terms of Trade: The variable is constructed as the ratio of Singapore’s export
price to the US export price (to capture the proxy for import price of Singapore from
the US ) where both prices are denominated in US dollar,
USt
tt XP
XPPsgus = A2
where Psgus is the terms of trade with US, tXP is Singapore’s export price, and
UStXP is the US export price.
Real exchange rate volatility is constructed by the moving sample standard
deviation of the growth rate of the real exchange rate:
Vt = [ (1/m) =
m
i 1
(log Q t+i-1 - Q t+i-2)2]1/2
A3
where Q is the real exchange rate and m = 8 quarters. This index has been used in
previous studies including Kenen and Rodrik (1986), Koray and Lastrapes (1989)

and Chowdhury (1993).
As for income variables, real GDP of the US and Japan are considered as
proxies for Yus and Yjpn.
Annex B: The Direct Trade Effect Index
The Direct effect of a US slowdown on the exports of Singapore to US can be
calculated in the following manner (Conway, 2001):
( )XXXXUS
NS
US
S
USUS�� −=∆ 0 (B1)
∆ denotes the first difference of the log forms of the variables. The above measures
the change in Singapore’s exports to US where X US0 denotes exports from
Singapore to US in period 0 , and ( )XXUS
NS
US
S�� − denotes the difference in the growth
rate of exports in the event of a slowdown (denoted by subscript “S”) and a non-
slowdown (denoted by subscript “NS”)
The effect of exports to US on Singapore’s GDP growth is given by
�
��
�
� −−
���
��
�
� −∆−∆ =
•
YYY
YYXYY
US
0
01
0
01 (B2)
where Y0 denotes Singapore’s GDP in period 0 and Y1 denotes the same in period 1.
Substituting (A1) in (A2), one gets
( )XXYXY
US
NS
US
S
US
�� −−∆ =•
0
0 (B3)

which implies that the impact of a slowdown of Singapore’s exports to US depends
on the differences in the growth rate of exports between a slowdown and a non-
slowdown period, weighted by the shares of Singapore’s exports to US in
Singapore’s GDP. The direct impact on Singapore due to a slowdown in Japan is
calculated in the same manner. Thus, this measure shows that higher the share of
Singapore’s exports to its trading partner (US/Japan), the adverse impact of a
slowdown in growth in either of them on Singapore’s GDP growth is more likely.

References
Abeysinghe, T. and Forbes, K. (2001), “Trade Linkages and Output-Multiplier Effects:A structural VAR approach with a focus on Asia”, mimeo (March).
Bailey, M. (1987). “The Impact of Exchange Rate Volatility on Export Growth: SomeTheoretical Considerations and Empirical Results”, Journal of Policy Modeling, 9,pp.225-243.
Baldwin, R. (1997). “The Causes of Regionalism”, The World Economy, 20, pp.865-88.
Bergsten, F. (1998). “Fifty Years of the GATT/WTO: Lessons from the Past forStrategies for the Future”, Working Paper No.98-3, Institute for InternationalEconomics.
Bergsten, F. (2000). “Back to the Future” APEC Looks at Subregional TradeAgreements to Achieve Free Trade Goals”, speech given at the Pacific BasinEconomic Council luncheon, Washington, DC (October 31).
Bhagwati, J. (1995). “U.S. Trade Policy: The Infatuation with Free Trade Areas”, inThe Dangerous Drift to Preferential Trade Agreements, Washington, DC: The AEIPress.
Bird, G. and R. Rajan (2001). “International Currency Taxation and CurrencyStabilisation in Developing Countries”, Journal of Development Studies, 37, pp.21-38.
Chang, L.L. and R. Rajan (1999). “East Asian Cooperation in Light of the RegionalCrises: A Case of Self-Help or No-Help?”, Australian Journal of International Affairs,53, pp.261-81.
Chang, L.L. and R. Rajan (2001). “The Economics and Politics of MonetaryRegionalism in Asia”, ASEAN Economic Bulletin, 18, pp.103-18.
Chou, W. (2000). “Exchange Rate Variability and China’s Exports”, Journal ofComparative Economics, 28, pp.61-79.
Chowdhury, A. (1993). “Does Exchange Rate Volatility Depress Trade Flows?Evidence from Error-Correction Models”, The Review of Economics and Statistics,75, pp.700-6.
Chua, L. (2000). “Third Parties Can Join Bilateral Free-Trade Pacts”, The StraitsTimes, (Singapore), November 24.
Conway, Paul (2001), “US Slowdown: Implications for the New Zealand andAustralian Business Cycles”, Occasional Paper, Westpac Institutional Bank,Wellington, New Zealand (April).
Daly, K. (1998). “Does Exchange Rate Volatility Impede the Volume of Japan’sBilateral Trade?”, Japan and the World Economy, 10, pp.333-348.
DeRosa, D. (1986). “ASEAN-US Trade Relations”, ASEAN Economic Bulletin, 3,pp.169-88.

Dornbusch, R. (1988). Exchange Rates and Inflation, The MIT Press, Cambridge.
Encarnation, D. (1992). Rivals Beyond Trade: America Versus Japan in GlobalCompetition, Ithaca, NY: Cornell University Press.
Forbes, K. (2001). “Are Trade Linkages Important Determinants of CountryVulnerability To Crises?”, Working Paper 8194, NBER.
Giovannini, A. (1988). “Exchange Rates and Traded Goods Prices”. Journal ofInternational Economics, 24, pp.45-68.
Goldstein, M. and Khan, M. (1976). ”Large versus Small Prices Changes in theDemand for Imports”, International Monetary Fund Staff Paper, 23, pp.200-25.
Hendry, D. (1974). “Stochastic Specification in an Aggregate Demand Model of theUnited Kingdom”, Econometrica, 42, pp. 559-78.
Hendry, D. (1977). “On Time Series Approach to Econometric Model Building”, in C.Sims (ed.), New Methods in Business Cycle Research, Federal Reserve Bank ofMinneapolis, MN.
Hill, H. and B. John. (1985). “The Role of Foreign Direct Investment in DevelopingEast Asian Countries”, ASEAN-Australia Working Papers No.8, ASEAN-AustraliaJoint Research Project, Kuala Lumpur, Malaysia.
Hooper, P. and J. Marquez (1995). "Exchange Rates, Prices, and ExternalAdjustment in the United States and Japan", in P. Kenen (ed.), UnderstandingInterdependence: The Macroeconomics of the Open Economy, Princeton, N.J.:Princeton University Press.
International Center for the Study of East Asian Development (ICSEAD) (2000), EastAsian Economic Perspectives: Recent Trends and Prospects for Major AsianEconomies, 11, February.
International Monetary Fund (2000), Direction of Trade Statistics Yearbook, variousissues.
Julius, D. (1990). Global Companies and Public Policy: The Growing Challenge ofForeign Direct Investment, London: Pinter Publishers.
Kenen, P. and D. Rodrik (1986). “Measuring and Analyzing the Effects of Short-TermVolatility in Real Exchange Rates”, The Review of Economics and Statistics, 68,pp.311-5.
Koray, F. and W. Lastrapes (1989). “Real Exchange Rate Volatility and U.S. BilateralTrade: A VAR Approach”, The Review of Economics and Statistics, 71, pp.708-12.
Krueger, A. (1995). “NAFTA: Strengthening or Weakening the International TradingSystem?”, in The Dangerous Drift to Preferential Trade Agreements, Washington,DC: The AEI Press.
Krueger, A. (1997). “Problems with Overlapping Free Trade Area”, in T. Ito and A.Krueger (eds.), Regionalism versus Multilateral Trade Arrangements, Chicago: TheUniversity of Chicago Press.

Krugman, P. (1995). “Growing World Trade: Causes and Consequences”, BrookingsPapers on Economic Activity, 1, pp.327-62.
Lawrence, R. (1987). “Imports in Japan: Closed Markets or Minds?”, BrookingsPapers on Economic Activity, 2, pp.517-58.
Learner, E. E. and R.M. Stern (1970). Quantitative International Economics. Boston:Allyn and Bacon.
Lim, H. (1988). “Singapore-Japan Trade Frictions”, in ASEAN-Japan RelationshipTowards the 21st Century, Japanese University Graduates Association of Singapore,pp.91-121.
Lloyd, P. (1993). “A Tariff Substitute for Rules of Origin in Free Trade Areas”, TheWorld Economy, 16, pp.699-712.
McKenzie, M. (1998). “The Impact of Exchange Rate Volatility on Australian TradeFlows”, Journal of International Financial Markets, Institutions and Money, 8, pp.21-38.
Panagariya, A. (1998). “East Asia and the New Regionalism”, The World Economy,17, pp.817-39.
Perroni, C. and J. Whalley (1994). “The New Regionalism: Trade Liberalization orInsurance?”, Working Paper No.4626, NBER.
Rajan, R. (1996). “Singapore’s Merchandise Trade Linkages with Japan and theUnited States: Trends, Patterns and Comparisons”, Asian Economic Journal, 10,pp.133-63.
Rajan, R. (2001). “Collapse and Recovery in East Asia: International Financial Flowsand Regional Financial Safeguards”, mimeo (May).
Rajan, R. and R. Siregar (2000). “The Vanishing Intermediate Regime and the Taleof Two Cities: Singapore Versus Hong Kong”, Discussion Paper No.0031, Centerfor International Economic Studies (CIES), Adelaide.
Ravenhill, J. (2000). “APEC Adrift: Implications for Econoimic Regionalism in Asiaand the Pacific”, The Pacific Review, 13, pp.319-33.
Sager, M. (1997). “Regional Trade Agreements: Their Role and the Economic Impacton Trade Flows”, The World Economy, 20, pp.239-52.
Schiff, M. and A. Winters (1998). “Regional Integration, Security, and Welfare”, inRegionalism and Development, European Commission Studies Series No.1,Washington, DC: The World Bank.
Schiff et al. (2000). Trade Blocs, Washington, DC: The World Bank.
Singapore Economic Development Board (2000). “Promoting Singapore as thepremier HQ location”, Singapore Investment News, April 30.
Singapore Trade Development Board. Singapore Trade Statistics, various issues.

Takeuchi, K. (1989). “Does Japan Import Less than it Should?: A Review of theEconometric Literature”, Asian Economic Journal, 3, pp.138-70.
Wonnacott, R. (1996a). “Free-Trade Agreements: For Better or Worse?”, AmericanEconomic Review, 86, pp.62-6.
Wonnacott, R. (1996b). “Trade and Investment in a Hub-and-Spoke System Versus aFree Trade Area”, The World Economy, 19, pp.237-52.
Wonnacott, R. and M. Lutz (1989). “Is there a Case for Free Trade Areas?”, in J.Schott (ed.), Free Trade Areas and US Trade Policy, Washington, DC: Institute forInternational Economics.
World Bank (2000). World Development Report 1999/2000, New York: OxfordUniversity Press.

52
Table 1
Singapore : Major Macroeconomic Indicators 1970 -99
1970 1980 1990 1995 1999 1970-99 1970-80 1980-90 1990-95 1995-99Real GDP growth (%) 14.6 9.7 9.0 8.7 5.4 8.0 9.4 7.6 8.7 5.9 Exports growth (%) 0.32 33.98 9.29 13.70 5.73 14.1 23.2 11.4 11.7 5.8 Imports growth (%) 20.70 33.90 13.36 12.74 7.57 12.9 22.2 10.7 10.6 4.1 Inflation rate (%) 1.7 8.5 3.5 1.7 0.0 3.7 6.7 2.9 2.7 1.0 Source: The World Bank, World Development Indicators CD-Rom
Table 2 Growth performance of Singapore and other East Asian economies
(GDP growth (% per annum)
Average Average 1981-90 1991-95 1996 1997 1998 1999 2000
Singapore 7.3 8.7 7.5 8.0 1.5 5.5 6.0 Malaysia 6.0 8.7 8.6 7.7 -6.8 4.9 5.2 Thailand 7.9 8.4 5.5 -0.4 -8.0 4.2 5.0 Indonesia 5.4 7.8 8.0 4.6 -13.7 -0.1 3.8 Korea 9.1 7.5 7.1 5.5 -5.5 9.2 6.5 Japan 4.0 1.4 5.0 1.4 -2.8 n.a. n.a. Sources : IMF, World Economic Outlook and The Economist (January, 2000)

53
Table 3 Singapore's Domestic Exports to US and Japan , 1984-99
Total Total Total Share of Share of
Year Domestic Annual Domestic Annual Domestic Annual total DUx in total DJx in Exports to Growth Exports to Growth Exports to Growth in total in total the World Singapore Singapore (DWx) rate (%) US (DUx) rate (%) Japan (DJx) rate (%) Domestic exports Domestic exports
1984 15517 3718 1862 24.0 12.0 1985 14807 -4.6 3709 -0.3 1755 -5.7 25.0 11.8 1986 14707 -0.7 4356 17.4 1515 -13.6 29.6 10.3 1987 18517 25.9 5801 33.2 1966 29.8 31.3 10.6 1988 24654 33.1 7769 33.9 2426 23.4 31.5 9.8 1989 28334 14.9 8479 9.1 2851 17.5 29.9 10.1 1990 34671 22.4 9212 8.6 3431 20.4 26.6 9.9 1991 38222 10.2 9525 3.4 3493 1.8 24.9 9.1 1992 40723 6.5 10787 13.2 3135 -10.3 26.5 7.7 1993 46661 14.6 11907 10.4 3591 14.5 25.5 7.7 1994 57962 24.2 14225 19.5 4556 26.9 24.5 7.9 1995 69476 19.9 17083 20.1 6386 40.2 24.6 9.2 1996 73465 5.7 18219 6.6 6942 8.7 24.8 9.4 1997 72424 -1.4 18082 -0.7 5358 -22.8 25.0 7.4 1998 63287 -12.6 16598 -8.2 4151 -22.5 26.2 6.6 1999 68628 8.4 16858 1.6 5303 27.8 24.6 7.7
Source : Computed from Singapore Trade Development Board, Singapore Trade Statistics, Singapore and IMF, Direction of Trade Statistics Yearbook, various issues

54
Table 4
Singapore's Leading Product Groups of Exports to the World, US, and Japan in 1999 (SITC 3-digit level)
Exports to the world Rank Product Code Product Description Share (%)
1 776 Electronic Valves 20.1 2 752 Data Processing Machines 17.3 3 759 Parts For Office & D/P Machines 8.8 4 334 Petroleum Products Refined 7.5 5 764 Telecommunications Equipment 4.5 6 772 Electrical Circuit Apparatus 2.5 7 778 Electrical Machinery 2.1 8 898 Musical Instrument & Parts 1.7 9 515 Organo-inorganic Compounds 1.4
10 931 Special Transactions 1.1
Table 4 (Contd.)
Exports to US
Rank Product Code Product Description Share (%) 1 752 Data Processing Machines 39.3 2 776 Electronic Valves 20.0 3 759 Parts For Office & D/P Machines 12.7 4 764 Telecommunications Equipment 3.5 5 772 Electrical Circuit Apparatus 1.8 6 515 Organo-inorganic Compounds 1.7 7 334 Petroleum Products Refined 1.5 8 845 Apparel Articles Of Textile 1.5 9 931 Special Transactions 1.2
10 874 Measuring Instruments 1.1 Exports to Japan Rank Product Code Product Description Share (%)
1 752 Data Processing Machines 20.8 2 776 Electronic Valves 16.1 3 898 Musical Instrument & Parts 10.3 4 759 Parts For Office & D/P Machines 7.7 5 334 Petroleum Products Refined 5.2 6 764 Telecommunications Equipment 2.6 7 931 Special Transactions 2.4 8 112 Alcoholic Beverages 2.3 9 772 Electrical Circuit Apparatus 1.5 10 716 Electric Plant & Parts 1.4
Source : Singapore Trade Development Board, Singapore Trade Statistics, December 1999

55
Table 5
Singapore's Leading Product Groups of Imports from the World, US, and Japan in 1999 (SITC 3-digit level)
Imports from the world
Rank Product Code Product Description Share (%) 1 776 Electronic Valves 19.9 2 759 Parts For Office & D/P Machines 7.9 3 333 Petroleum Crude 4.8 4 752 Data Processing Machines 4.7 5 334 Petroleum Products Refined 4.2 6 764 Telecommunications Equipment 3.9 7 772 Electrical Circuit Apparatus 3.0 8 778 Electrical Machinery 2.5 9 792 Aircraft 2.0 10 874 Measuring Instruments 1.9 Imports from US
Rank Product Code Product Description Share (%) 1 776 Electronic Valves 18.2 2 792 Aircraft 8.9 3 759 Parts For Office & D/p Machines 6.7 4 874 Measuring Instruments 5.5 5 898 Musical Instrument & Parts 4.8 6 752 Data Processing Machines 4.6 7 723 Civil Engineering Equipment&Parts 4.5 8 728 Specialized Machinery. 3.3 9 931 Special Transactions 3.0 10 772 Electrical Circuit Apparatus 2.7 Imports from Japan
Rank Product Code Product Description Share (%) 1 776 Electronic Valves 21.8 2 764 Telecommunications Equipment 5.3 3 759 Parts For Office & D/P Machines 5.1 4 778 Electrical Machinery 4.9 5 772 Electrical Circuit Apparatus 4.6 6 728 Specialized Machinery 4.3 7 752 Data Processing Machines 4.2 8 793 Ships & Boats 2.8 9 874 Measuring Instruments 2.5 10 882 Photographic Supplies 1.9
Source : Singapore Trade Development Board, Singapore Trade Statistics, December 1999
56
Table 6 Singapore's Intra-industry Trade with the US and Japan : 1995-99 (computed with total export values)
Product groups with Ten highest G-L index values of IIT between Singapore and US
1995 1996 1997 1998 1999
SITC Index value Share in SITC
Index value Share in SITC
Index value Share in SITC
Index value Share in SITC
Index value Share in
Code Total trade Code Total trade Code Total trade Code Total trade Code Total trade
892 99.1 0.5 892 96.4 0.5 892 85.4 0.5 553 98.6 0.4 553 85.6 0.4 771 97.4 0.5 771 98.7 0.4 771 99.0 0.4 892 98.1 0.5 892 99.8 0.6 871 97.0 0.2 871 81.3 0.1 871 84.3 0.1 771 95.5 0.4 771 96.8 0.4 731 96.0 0.1 731 65.0 0.1 731 73.4 0.1 881 95.2 0.2 881 66.5 0.1 821 95.2 0.2 821 79.0 0.2 821 70.7 0.2 776 92.7 18.5 776 87.8 19.2 884 93.9 0.1 884 86.3 0.2 884 74.4 0.4 058 92.5 0.1 058 98.1 0.1 541 93.1 0.1 541 93.3 0.1 541 95.2 0.1 931 92.3 2.0 931 64.9 2.0 776 92.7 17.3 776 95.0 17.7 776 95.8 18.4 764 89.0 2.2 764 71.4 2.9
746 87.1 0.2 746 79.8 0.2 746 76.4 0.2 895 88.9 0.1 895 71.4 0.1 542 86.0 0.1 542 38.4 0.1 542 34.4 0.1 541 83.1 0.2 541 43.8 0.4
Overall 43.7 100.0 Overall 43.4 100.0 Overall 44.8 100.0 Overall 44.2 100.0 Overall 43.8 100.0
Product groups with Ten highest levels of IIT between Singapore and US
1995 1996 1997 1998 1999
SITC Amount Share in SITC Amount Share in SITC Amount Share in SITC Amount Share in SITC Amount Share in
Code (S $ million) Total trade Code (S $ million) Total trade Code (S $ million)
Total trade Code (S $ million)
Total trade Code
(S $ million)
Total trade
776 9126.1 17.3 776 10559.3 17.7 776 11844.4 18.4 776 11622.0 18.5 776 11662.3 19.2 759 4641.6 13.0 759 5114.9 11.7 759 5256.1 10.8 759 4473.7 9.6 759 4315.5 9.9 752 3155.7 23.9 752 3048.9 25.4 752 3301.3 24.9 752 3208.6 25.9 752 2955.1 23.3 764 1216.4 3.0 764 1435.0 2.6 764 1502.2 2.4 764 1320.1 2.2 764 1432.3 2.9 772 651.2 1.7 772 668.4 1.4 772 724.3 1.5 931 1222.4 2.0 931 912.4 2.0 778 412.1 1.6 778 441.3 1.4 778 556.0 1.5 772 956.9 1.9 772 1352.9 2.2

57
Table 6 (Continued) Product groups with Ten highest levels of IIT between Singapore and US
1995 1996 1997 1998 1999
SITC Amount Share in SITC Amount Share in SITC Amount Share in SITC Amount Share in SITC Amount Share in
Code (S $ million) Total trade Code (S $ million) Total trade Code (S $ million)
Total trade Code (S $ million)
Total trade Code
(S $ million)
Total trade
334 385.8 1.0 334 516.9 1.0 334 533.5 0.9 874 698.3 2.4 874 814.3 3.1 931 359.0 1.2 931 411.9 1.3 931 801.5 1.7 778 664.3 1.6 778 701.9 1.7 741 349.0 0.7 741 340.5 0.7 741 388.7 0.7 792 441.7 4.7 792 389.3 4.4 872 326.4 0.8 872 368.7 0.7 872 400.9 0.7 334 408.9 0.8 334 780.4 1.4
Overall 52940.66 100.0 Overall 60512.61 100.0 Overall 66034.438 100.0 Overall 62506.64 100.0 Overall 64088.4 100.0
Product groups with Ten highest degrees of IIT between Singapore and US
1995 1996 1997 1998 1999
SITC Index value Share in SITC Index value Share in SITC Index value Share in SITC Index value Share in SITC Index value
Share in
Code Total trade Code Total trade Code Total trade Code
Total trade Code
Total trade
892 99.1 0.5 892 96.5 0.5 892 87.2 0.5 553 98.6 0.4 553 87.4 0.4 771 97.5 0.5 771 98.7 0.4 771 99.0 0.4 892 98.1 0.5 892 99.8 0.6 871 97.1 0.2 871 84.3 0.1 871 86.4 0.1 771 95.7 0.4 771 96.9 0.4 731 96.2 0.1 731 74.1 0.1 731 79.0 0.1 881 95.4 0.2 881 74.9 0.1 821 95.4 0.2 821 82.7 0.2 821 77.4 0.2 776 93.2 18.5 776 89.1 19.2 884 94.2 0.1 884 87.9 0.2 884 79.6 0.4 058 93.0 0.1 058 98.1 0.1 541 93.5 0.1 541 93.7 0.1 541 95.4 0.1 931 92.9 2.0 931 74.0 2.0 776 93.2 17.3 776 95.2 17.7 776 96.0 18.4 764 90.1 2.2 764 77.7 2.9 746 88.6 0.2 746 83.2 0.2 746 80.9 0.2 895 90.0 0.1 895 77.8 0.1 542 87.7 0.1 542 61.9 0.1 542 60.4 0.1 541 85.5 0.2 541 64.0 0.4
Overall 62.0 100.0 Overall 63.3 100.0 Overall 64.2 100.0 Overall 63.8 100.0 Overall 63.3 100.0

58
Table 6 (continued)
Product groups with Ten highest G-L index values of IIT between Singapore and Japan
1995 1996 1997 1998 1999
SITC Index value Share in SITC Index value Share in SITC Index value Share in SITC Index value Share in SITC Index value
Share in
Code Total trade Code Total trade Code Total trade Code
Total trade Code
Total trade
894 97.9 0.5 894 99.3 0.6 893 99.4 0.5 892 96.8 0.2 885 96.1 0.7 761 91.8 0.8 792 96.6 0.1 931 98.3 1.2 759 87.6 6.0 516 93.9 0.1 885 85.4 0.5 885 94.7 0.7 773 96.4 0.5 893 85.5 0.5 792 91.5 0.3 931 79.3 1.0 893 94.0 0.4 553 96.1 0.2 516 83.6 0.1 893 86.3 0.4 553 77.6 0.2 553 86.3 0.2 761 88.9 0.5 931 83.0 1.7 931 85.9 1.3 762 77.1 0.8 762 85.2 0.7 885 85.8 0.9 899 80.6 0.1 761 84.7 0.5 792 75.2 0.1 761 81.0 0.8 762 82.7 0.5 792 77.4 0.3 541 84.4 0.1 893 73.3 0.4 931 79.7 1.0 892 80.6 0.3 894 77.2 0.3 884 84.0 0.3 872 70.6 0.4 773 75.1 0.6 516 80.2 0.1 885 74.8 1.0 759 81.9 5.9 515 69.2 0.3 872 70.9 0.5 775 69.1 0.2 541 72.4 0.1 892 81.2 0.3
Overall 31.1 100.0 Overall 36.1 100.0 Overall 36.2 100.0 Overall 40.8 100.0 Overall 39.8 100.0
Product groups with Ten highest levels of IIT between Singapore and Japan 1995 1996 1997 1998 1999
SITC Amount Share in SITC Amount Share in SITC Amount Share in SITC Amount Share in SITC Amount Share
in
Code (S $ million) Total trade Code (S $ million) Total trade Code (S $ million) Total trade Code
(S $ million)
Total trade Code
(S $ million)
Total trade
776 4482.9 21.7 776 5218.2 19.9 776 4550.6 18.2 776 4099.8 19.1 776 4645.7 20.0 752 2901.0 9.6 752 2938.8 10.4 752 3175.3 9.9 752 2926.0 10.5 752 2648.3 9.5 764 1044.5 6.2 759 1442.0 4.2 759 1627.0 4.9 759 2128.7 6.0 759 2207.8 5.9 759 962.1 3.1 764 869.4 5.0 764 919.9 4.7 764 782.5 4.8 898 1132.7 4.5 763 568.9 1.9 931 366.9 1.0 931 540.4 1.2 898 683.9 2.4 764 757.7 4.4 931 406.0 1.0 772 351.0 3.3 898 521.0 2.2 931 587.4 1.7 931 522.0 1.3 761 359.5 0.8 771 350.6 1.1 772 399.6 3.4 716 421.6 1.7 772 422.8 3.6

59
Table 6 (continued) Product groups with Ten highest levels of IIT between Singapore and Japan
1995 1996 1997 1998 1999
SITC Amount Share in SITC Amount Share in SITC Amount Share in SITC Amount Share in SITC Amount Share
in
Code (S $ million) Total trade Code (S $ million) Total trade Code (S $ million) Total trade Code
(S $ million)
Total trade Code
(S $ million)
Total trade
772 330.3 3.5 761 325.4 0.8 716 368.5 1.5 772 382.6 3.6 716 393.6 1.4 771 323.9 1.1 763 307.0 1.2 885 361.4 0.9 885 316.2 1.0 771 325.0 1.2 762 310.5 0.8 885 303.5 0.7 771 349.5 1.2 771 291.7 1.2 885 321.7 0.7
Overall 26132 100.0 Overall 28909 100.0 Overall 26249 100.0 Overall 24179 100.0 Overall 28841.0 100.0
Product groups with Ten highest degrees of IIT between Singapore and Japan
1995 1996 1997 1998 1999
SITC Index value Share in SITC Index value Share in SITC Index value Share in SITC Index value Share in SITC Index value Share in
Code Total trade Code Total trade Code Total trade Code Total trade Code
Total trade
894 97.9 0.5 894 99.3 0.6 893 99.4 0.5 892 96.9 0.2 885 96.3 0.7 761 92.4 0.8 792 96.7 0.1 931 98.4 1.2 759 89.0 6.0 516 94.3 0.1 885 87.3 0.5 885 95.0 0.7 773 96.5 0.5 893 87.3 0.5 792 92.2 0.3 931 82.8 1.0 893 94.4 0.4 553 96.3 0.2 516 85.9 0.1 893 87.9 0.4 553 81.7 0.2 553 88.0 0.2 761 90.0 0.5 931 85.5 1.7 931 87.6 1.3 762 81.3 0.8 762 87.1 0.7 885 87.6 0.9 899 83.7 0.1 761 86.8 0.5 792 80.2 0.1 761 84.1 0.8 762 85.2 0.5 792 81.6 0.3 541 86.5 0.1 893 78.9 0.4 931 83.2 1.0 892 83.8 0.3 894 81.4 0.3 884 86.2 0.3 872 77.3 0.4 773 80.0 0.6 516 83.5 0.1 885 79.9 1.0 759 84.7 5.9 515 76.5 0.3 872 77.5 0.5 775 76.4 0.2 541 78.4 0.1 892 84.2 0.3
Overall 67.5 100.0 Overall 71.5 100.0 Overall 69.0 100.0 Overall 71.3 100.0 Overall 73.0 100.0
Source : Singapore Trade Development Board, Singapore Trade Statistics, various issues.

60
Table 7
Singapore's Intra-industry trade with US and Japan : 1995-99 (computed with domestic export values) Product groups with Ten highest G-L index values of IIT between Singapore and US
1995 1996 1997 1998 1999
SITC Index value Share in SITC Index value Share in SITC Index value Share in SITC Index value Share in SITC Index value Share in Code Total trade Code Total trade Code Total trade Code Total trade Code Total trade 892 98.4 0.6 892 94.6 0.6 892 84.5 0.6 892 97.0 0.6 892 98.1 0.6 731 97.6 0.1 731 64.7 0.2 731 70.6 0.1 541 84.4 0.2 541 44.1 0.5 541 97.4 0.1 541 90.9 0.1 541 96.5 0.1 776 83.1 16.8 776 86.8 17.0 764 91.9 2.6 764 77.1 2.1 764 56.0 2.0 629 75.4 0.1 629 81.1 0.1 746 89.8 0.3 746 81.8 0.2 746 80.9 0.2 759 74.8 10.1 759 68.1 10.5 821 88.2 0.2 821 72.6 0.2 821 64.9 0.2 334 73.2 0.9 334 83.0 1.6 884 86.3 0.1 884 70.0 0.2 884 67.9 0.2 771 71.2 0.4 771 69.1 0.3 542 82.9 0.1 542 32.8 0.1 542 30.7 0.1 764 70.0 1.7 764 96.3 2.3 776 82.1 15.3 776 77.5 15.4 776 81.9 16.7 884 67.3 0.3 884 61.1 0.4 642 75.7 0.2 642 56.0 0.2 642 45.1 0.2 872 66.7 1.0 872 72.5 0.9
Overall 39.4 100.0 Overall 36.8 100.0 Overall 38.3 100.0 Overall 37.9 100.0 Overall 39.9 100.0
Product groups with Ten highest levels of IIT between Singapore and US
1995 1996 1997 1998 1999 SITC Amount Share in SITC Amount Share in SITC Amount Share in SITC Amount Share in SITC Amount Share in
Code (S $
million) Total trade Code (S $
million) Total trade Code (S $
million) Total trade Code (S $
million) Total trade Code (S $ million) Total trade 776 6358.4 15.3 776 6677.3 15.4 776 8210.2 16.7 776 8268.4 16.8 776 8939.8 17.0 759 4641.6 13.8 759 5114.9 12.3 759 5256.1 11.2 759 4473.7 10.1 759 4315.5 10.5 752 3155.7 25.0 752 3048.9 26.8 752 3301.3 26.2 752 3208.6 27.6 752 2955.1 24.9 764 1216.4 2.6 764 900.8 2.1 764 670.1 2.0 772 778.7 2.1 772 1133.6 2.3 772 491.1 1.7 772 537.5 1.4 772 584.2 1.5 764 710.6 1.7 764 1329.8 2.3

61
Table 7 (continued)
Product groups with Ten highest levels of IIT between Singapore and US
1995 1996 1997 1998 1999 SITC Amount Share in SITC Amount Share in SITC Amount Share in SITC Amount Share in SITC Amount Share in
Code (S $
million) Total trade Code (S $
million) Total trade Code (S $
million) Total trade Code (S $
million) Total trade Code (S $ million) Total trade 334 371.8 1.1 334 516.9 1.1 334 511.8 1.0 874 638.9 2.7 874 743.1 3.5 872 326.4 0.9 872 368.7 0.8 872 400.9 0.7 334 408.9 0.9 334 780.4 1.6 892 301.9 0.6 892 302.7 0.6 892 296.2 0.6 872 386.7 1.0 872 404.6 0.9 741 271.9 0.8 741 277.6 0.7 741 313.1 0.8 892 349.0 0.6 892 368.9 0.6 898 265.5 2.4 898 165.4 2.8 898 191.6 2.2 792 346.9 5.3 792 269.7 4.9
Overall 48426.06 100.0 Overall 51378.27 100.0 Overall 53698.64 100.0 Overall 55556.8 100.0 Overall 57147.6 100.0
Product groups with Ten highest degrees of IIT between Singapore and US
1995 1996 1997 1998 1999
SITC Index value Share in SITC Index value Share in SITC Index value Share in SITC Index value Share in SITC Index value Share in Code Total trade Code Total trade Code Total trade Code Total trade Code Total trade 892 98.4 0.6 892 94.9 0.6 892 86.6 0.6 892 97.1 0.6 892 98.2 0.6 731 97.7 0.1 731 73.9 0.2 731 77.3 0.1 541 86.5 0.2 541 64.1 0.5 541 97.5 0.1 541 91.7 0.1 541 96.6 0.1 776 85.6 16.8 776 88.3 17.0 764 92.5 2.6 764 81.4 2.1 764 69.4 2.0 629 80.2 0.1 629 84.1 0.1 746 90.7 0.3 746 84.6 0.2 746 83.9 0.2 759 79.9 10.1 759 75.8 10.5 821 89.4 0.2 821 78.5 0.2 821 74.0 0.2 334 78.9 0.9 334 85.5 1.6 884 88.0 0.1 884 76.9 0.2 884 75.7 0.2 771 77.6 0.4 771 76.4 0.3 542 85.4 0.1 542 59.8 0.1 542 59.1 0.1 764 76.9 1.7 764 96.4 2.3 776 84.8 15.3 776 81.6 15.4 776 84.7 16.7 884 75.4 0.3 884 72.0 0.4 642 80.5 0.2 642 69.4 0.2 642 64.5 0.2 872 75.0 1.0 872 78.4 0.9
Overall 60.0 100.0 Overall 59.7 100.0 Overall 60.6 100.0 Overall 60.8 100.0 Overall 62.3 100.0

62
Table 7 (Continued) Product groups with Ten highest G-L index values of IIT between Singapore and Japan
1995 1996 1997 1998 1999
SITC Index value Share in SITC Index value Share in SITC Index value Share in SITC Index value Share in SITC Index value Share in Code Total trade Code Total trade Code Total trade Code Total trade Code Total trade 761 88.8 0.8 893 87.7 0.4 761 89.4 0.6 892 97.9 0.2 516 94.8 0.1 821 83.1 0.1 761 82.3 0.9 752 86.1 8.7 752 92.3 9.0 762 93.6 0.3 872 75.8 0.4 821 81.5 0.1 892 85.3 0.3 762 84.3 0.3 892 84.3 0.3 893 69.9 0.4 872 76.0 0.5 893 80.9 0.4 515 76.5 0.3 761 84.3 0.6 515 69.3 0.4 762 75.6 0.7 516 79.2 0.1 516 72.2 0.1 752 83.4 7.9 752 65.5 9.6 892 69.9 0.3 515 69.8 0.4 759 71.2 6.0 513 75.8 0.4 098 63.9 0.3 752 67.0 10.1 762 68.6 0.5 899 69.4 0.1 893 75.7 0.4 762 63.0 0.8 515 65.2 0.4 098 66.7 0.3 898 68.8 2.7 541 73.0 0.1 892 60.3 0.4 098 60.2 0.3 872 66.4 0.5 893 67.1 0.5 759 71.1 6.1 512 56.4 0.1 597 57.4 0.2 821 66.0 0.1 512 59.2 0.1 872 69.0 0.6
Overall 23.8 100.0 Overall 26.7 100.0 Overall 26.6 100.0 Overall 30.5 100.0 Overall 30.1 100.0
Product groups with Ten highest levels of IIT between Singapore and Japan
1995 1996 1997 1998 1999 SITC Amount Share in SITC Amount Share in SITC Amount Share in SITC Amount Share in SITC Amount Share in
Code (S $
million) Total trade Code (S $
million) Total trade Code (S $
million) Total trade Code (S $
million) Total trade Code (S $ million) Total trade 752 2901.0 9.6 776 3146.6 19.6 752 3175.3 8.7 752 2926.0 9.0 752 2648.3 7.9 776 2776.7 21.7 752 2938.8 10.1 776 2370.5 17.9 776 2081.2 19.0 776 2436.3 20.0 759 722.6 3.1 759 945.5 4.1 759 1095.5 4.9 759 1509.3 6.0 759 1755.8 6.1 764 660.8 6.4 764 565.8 5.1 764 574.0 4.9 898 667.6 2.7 898 1132.7 5.1 761 338.7 0.8 761 325.4 0.9 898 492.6 2.5 764 528.0 5.1 764 420.1 4.6 772 266.0 3.8 772 282.3 3.6 772 309.8 3.7 772 270.3 3.9 772 262.4 3.9 763 257.0 1.7 898 265.5 2.3 716 263.7 1.6 716 250.7 1.7 761 210.2 0.6 898 230.2 1.8 762 225.5 0.7 761 226.8 0.6 931 148.6 1.0 872 171.4 0.6

63
Table 7 (continued) Product groups with Ten highest levels of IIT between Singapore and Japan
1995 1996 1997 1998 1999
SITC Amount Share in SITC Amount Share in SITC Amount Share in SITC Amount Share in SITC Amount Share in
Code (S $
million) Total trade Code (S $
million) Total trade Code (S $
million) Total trade Code (S $
million) Total trade Code (S $ million) Total trade 762 227.7 0.8 334 187.4 3.8 778 179.3 3.5 778 135.4 3.8 334 166.5 2.1 334 206.2 2.8 716 183.9 1.7 893 146.7 0.4 874 121.8 1.6 931 158.4 0.8
Overall 18101.14 100.0 Overall 19578.28 100.0 Overall 15911.43 100.0 Overall 13894.17 100.0 Overall 17977.4 100.0
Product groups with Ten highest degrees of IIT between Singapore and Japan
1995 1996 1997 1998 1999 SITC Code Index value Share in SITC Code Index value Share in SITC Code Index value Share in SITC CodeIndex value Share in SITC Code Index value Share in
Total trade Total trade Total trade Total trade Total trade 761 90.0 0.8 893 89.0 0.4 761 90.4 0.6 892 97.9 0.2 516 95.0 0.1 821 85.6 0.1 761 85.0 0.9 752 87.8 8.7 752 92.8 9.0 762 94.0 0.3 872 80.5 0.4 821 84.4 0.1 892 87.2 0.3 762 86.4 0.3 892 86.4 0.3 893 76.9 0.4 872 80.6 0.5 893 84.0 0.4 515 81.0 0.3 761 86.4 0.6 515 76.5 0.4 762 80.4 0.7 516 82.8 0.1 516 78.3 0.1 752 85.7 7.9 752 74.3 9.6 892 76.9 0.3 515 76.8 0.4 759 77.6 6.0 513 80.5 0.4 098 73.5 0.3 752 75.2 10.1 762 76.1 0.5 899 76.6 0.1 893 80.5 0.4 762 73.0 0.8 515 74.2 0.4 098 75.0 0.3 898 76.2 2.7 541 78.7 0.1 892 71.6 0.4 098 71.5 0.3 872 74.9 0.5 893 75.2 0.5 759 77.6 6.1 512 69.6 0.1 597 70.1 0.2 821 74.6 0.1 512 71.0 0.1 872 76.3 0.6
Overall 62.1 100.0 Overall 64.6 100.0 Overall 61.5 100.0 Overall 62.2 100.0 Overall 64.3 100.0
Source: Singapore Trade Development Board, Singapore Trade Statistics, various issues

64
Table 8
Variable Description
(quarter 1, 1981 - quarter 4, 1996) Variable Descriptions Source
Ysg Gross Domestic Product of Singapore IFS CD-Rom
Xsgus Export of Singapore to the US market IMF, Direction of trade statistics
Yus Gross Domestic Product of the US IFS CD-Rom
Psgus Terms of Trade of Singapore’s products against the US products.
Authors’ own calculations. The primary data to construct the index are from IFS CD-Roam.
Xsgjpn Export of Singapore to the Japanese market IMF, Direction of trade statistics
Yjpn Gross Domestic Product of Japan IFS CD-Rom
Psgjpn Terms of Trade of Singapore’s products against the US products.
Authors’ own calculations. The primary data to construct the index are from IFS CD-Rom.
Vus Real Exchange Rate Volatility Index of the Singapore dollar against the US dollar.
Authors’ own calculations.
Vjpn Real Exchange Rate Volatility Index of the Singapore dollar against the Japanese Yen.
Authors’ own calculations.

65
Table 9 ADF Unit-Root Test
∆∆∆∆Xt = δδδδ1 + δδδδ2 t + δδδδ3 Xt-1 + �=
k
i 1
ββββi ∆∆∆∆Xt-i + εεεεt
Variablea ADF-statistics (Xt) ADF-statistics (Xt - Xt-1)
Ysg c -1.1124 (lags = 2)b -5.2012 (lags = 2)
Xsgus c -1.2475 (lags = 2) -6.2064 (lags = 2)
Yus c -2.9938 (lags = 2) -3.7485 (lags = 2)
Psgus c -1.5363 (lags = 4) -5.1177 (lags = 4)
Xsgjpn c -2.7714 (lags = 1) -7.3959 (lags = 1)
Yjpn c -2.5202 (lags = 2) -3.7049 (lags = 2)
Psgjpn c -2.2834 (lags = 4) -3.9561 (lags = 4)
Vusd -3.9965 (lags = 1) -- not relevant --
Vjpnd -4.1253 (lags = 2) -- not relevant -- a/All variables are in the log-forms. b/The number of lags is determined by Akaike Information Criterion (AIC). c/These variables are found to be an integrated of order 1 series (I(1)) at 5% critical value. d/These variables are found to be an integrated of order 0 series ((I(0)) at 5% critical value.

66
Table 10
Export Function Model (For Singapore - the US)
Dependent Variable: ∆Xsgust Sample Period: Quarter 1, 1980 - Quarter 2, 1997
Variable Coefficient t-statistics
∆Xsgust-1 -0.321 -2.8317
∆Yust-2 1.508 1.6274
∆Psgust-1 -0.556 -1.8865
∆Vust-2 -0.036 -1.2826
Constant 0.033 2.7902
R-squared = 0.2051; F-statistics = 4.2574; Durbin-Watson = 2.0834; ARCH-LM = 0.7605 (Probability of no serial correlation = 0.3832)

67
Table 11
Export Function Model (For Singapore - Japan)
Dependent Variable: ∆Xsgjpnt Sample Period: Quarter 1, 1980 - Quarter 2, 1997
Variable Coefficient t-statistics
∆Xsgjpnt-1 -0.348 -3.1347
∆Yjpnt-2 2.222 1.8592
∆Psgjpnt-2 -0.731 -1.7075
∆Vjpnt-4 -0.112 -1.7107
Constant -0.003 -0.1576
R-squared = 0.2242; F-statistics = 4.696; Durbin-Watson = 1.8049; ARCH-LM = 0.0628 (Probability of no serial correlation = 0.8021)

68
Table 12
Cointegration Test
Sample Period: Quarter 1, 1982 - Quarter 2, 1997 Eigen value Likelihood Ratio 5 Percent Critical Value
0.2792 31.05a 29.68
0.1612 10.69 15.41
0.0004 0.316 3.76
a/ Likelihood Ratio test indicates 1 cointegrating equation at 5% significance level. Normalized Cointegrating Coefficients: Yt = 6.219 + 0.4936 Xsgjpnt + 0.4138 Xsgust (0.1885) (0.1763) ( ) represents the standard errors
Table 13 OLS test on the Error Correction Model
Dependent Variable: ∆Yt (GDP of Singapore)
Sample Period: Quarter 2, 1982 - Quarter 2, 1997
Variable Coefficient t-Statistics
∆Xsgjpnt 0.0461 2.4436
∆Xsgust 0.0986 3.2558
ECMt-1 -0.0307 -2.1038
Constant 0.0139 4.6695
R-squared = 0.2240; F-statistics = 5.4849; Durbin-Watson statistics = 2.0546 ARCH-LM = 1.0762 Probability (of no serial correlations) = 0.5838).

69
Table 14a
Singapore : Inward stock of Foreign Direct Equity investment by country (US $ billion.)
1987 1992 1995 1997 1987 1992 1995 1997 1987-92 1992-95 1995-97 Amount Shares in total (%) C.A.G.R
US 3.8 5.9 10.0 14.0 26.6 17.0 16.9 18.4 9.4 19.2 18.0 EU 3.0 8.0 12.2 15.4 20.8 23.1 20.6 20.3 22.1 15.1 12.0
Japan 2.2 8.1 12.0 13.7 15.3 23.3 20.1 18.1 30.1 13.9 7.0 ASEAN 0.8 1.9 4.0 4.6 5.4 5.4 6.7 6.0 19.5 28.9 6.9
Total Direct equity investment 14.2 34.8 59.3 75.8 19.6 19.5 13.0 C.A.G.R : Compound Annual Growth rates Source : Calculated from Yearbook of Statistics, Singapore, various issues
Table 14b Singapore's Investment commitments in Manufacturing by US and Japan
(US $ billion)
Country 1992 1993 1994 1995 1996 1997 1998 1999 United States 0.7 0.9 1.6 1.5 1.7 1.6 1.4 2.1
(43.96) (45.71) (56.66) (42.78) (40.33) (40.62) (43.98) (57.32) Japan 0.5 0.5 0.6 0.8 1.4 1.4 1.1 0.7
(31.39) (24.53) (21.12) (23.75) (33.88) (34.07) (34.95) (18.86) Total Foreign Direct Investment 1.7 2.0 2.8 3.4 4.1 4.0 3.1 3.7
Total Direct Investment 2.1 2.4 3.8 4.8 5.7 5.7 4.7 4.7
Source: Calculated from Singapore International Chamber of Commerce, Annual Report 1999-2000
Note : Figures in parentheses indicates shares in total Foreign Direct Investment (FDI)

70
Table 15
Singapore : Stock of Foreign Direct Equity investment abroad by country (US $ billion.) 1992 1995 1997 1992 1995 1997 Amount Shares in total US 1.0 1.5 1.8 9.0 5.3 4.9 EU 0.9 2.7 5.0 8.3 9.9 13.9 Japan 0.0 0.3 0.3 0.4 1.0 0.9 Hong Kong 1.9 3.8 3.8 17.2 13.8 10.5 Malaysia 2.4 5.4 4.2 22.1 19.7 11.7 ASEAN 3.0 9.2 9.0 27.6 33.2 24.8 Total Direct equity investment 10.9 27.6 36.2 Nominal Exchange rate (S $ / US $) 1.63 1.42 1.48 Source : Calculated from Yearbook of Statistics, Singapore, various issues

71

1
Chart 1Singapore's merchandise trade with the U.S
-10
0
10
20
30
40
50
19801982
19841986
19881990
19921994
19961998
YearTotal trade Exports Imports Trade balance
C
Source : IMF, Direction of Trade Statistics Yearbook, various issues
Chart 2Singapore's merchandise trade with Japan
-20
-10
0
10
20
30
40
19801982
19841986
19881990
19921994
19961998
Year
U.S
$ b
illio
n
Total trade Exports Imports Trade balance
Source : Calculated from IMF, Direction of Trade Statistics Yearbook, various issues

2
Chart 3Singapore's merchandise exports to U.S and Japan
0
5
10
15
20
25
30
19801982
19841986
19881990
19921994
19961998
Year
%
Share of US in Singapore exportsShare of Japan in Singapore exports
Source : Calculated from IMF, Direction of Trade Statistics Yearbook, various issues
Chart 4Singapore's merchandise imports from U.S and Japan
0
5
10
15
20
25
19801982
19841986
19881990
19921994
19961998
Year
%
Share of US in Singapore importsShare of Japan in Singapore imports
Source : Calculated from IMF, Direction of Trade Statistics Yearbook, various issues

3
Chart 5Singapore's merchandise trade intensities with U.S and Japan
0.00
0.50
1.00
1.50
2.00
2.50
19801982
19841986
19881990
19921994
19961998
YearTrade intensity with US Trade intensity with JapanExport intensity with US Export intensity with Japan
Source : Calculated from IMF, Direction of Trade Statistics Yearbook, various issues
Chart 6U.S and Japan's merchandise trade intensities with Singapore
0.00
0.50
1.00
1.50
2.00
2.50
3.00
3.50
19801982
19841986
19881990
19921994
19961998
YearUS's Trade intensity with Singapore Japan's Trade intensity with SingaporeUS's Export intensity with SingaporeJapan's Export intensity with Singapore
Source : Calculated from IMF, Direction of Trade Statistics Yearbook, various issues

4
Chart 7Services Investment Commitments by Region (1999)
34%
32%
26%
5% 3%
USA Singapore Europe Japan Others
Source : Singapore Economic Development Board
Chart 8Services Investment Commitments by Cluster (1999)
11%
36%
21%
32%
Education & Healthcare
Headquaters services
Logistics/Supply Chain Mangement
Information & Media
.
Source : Singapore Economic Development Board
CIES DISCUSSION PAPER SERIES
The CIES Discussion Paper series provides a means of circulating promptly papers ofinterest to the research and policy communities and written by staff and visitors associatedwith the Centre for International Economic Studies (CIES) at the Adelaide University. Itspurpose is to stimulate discussion of issues of contemporary policy relevance among non-economists as well as economists. To that end the papers are non-technical in nature andmore widely accessible than papers published in specialist academic journals and books.(Prior to April 1999 this was called the CIES Policy Discussion Paper series. Since then theformer CIES Seminar Paper series has been merged with this series.)
Copies of CIES Policy Discussion Papers may be downloaded from our Web site athttp://www.adelaide.edu.au/cies/ or are available by contacting the Executive Assistant,CIES, School of Economics, Adelaide University, SA 5005 AUSTRALIA. Tel: (+61 8) 83035672, Fax: (+61 8) 8223 1460, Email: [email protected]. Single copies are free onrequest; the cost to institutions is US$5.00 overseas or A$5.50 (incl. GST) in Australia eachincluding postage and handling.For a full list of CIES publications, visit our Web site at http://www.adelaide.edu.au/cies/or write, email or fax to the above address for our List of Publications by CIES Researchers,1989 to 1999 plus updates.0122 Rajan, Ramkishen S., Rahul Sen and Reza Siregar, "Singapore and the New
Regionalism: Bilateral Economic Relations with Japan and the US", May 2001.0121 Anderson, Kym, Glyn Wittwer and Nick Berger, "A Model of the World Wine
Market", May 2001.0120 Barnes, Michelle, and Shiguang Ma, "Market Efficiency or not? The Behaviour
of China’s Stock Prices in Response to the Announcement of Bonus Issues,"April 2001.
0119 Ma, Shiguang, and Michelle Barnes, "Are China’s Stock Markets Really Weak-form Efficient?" April 2001.
0118 Stringer, Randy, "How important are the 'non-traditional' economic roles agriculturein development?" April 2001.
0117 Bird, Graham, and Ramkishen S. Rajan, "Economic Globalization: How Far andHow Much Further?" April 2001. (Forthcoming in World Economics, 2001.)
0116 Damania, Richard, "Environmental Controls with Corrupt Bureaucrats," April 2001.0115 Whitley, John, "The Gains and Losses from Agricultural Concentration," April 2001.0114 Damania, Richard, and E. Barbier, "Lobbying, Trade and Renewable Resource
Harvesting," April 2001.0113 Anderson, Kym, " Economy-wide dimensions of trade policy and reform," April
2001. (Forthcoming in a Handbook on Developing Countries and the Next Round ofWTO Negotiations, World Bank, April 2001.)
0112 Tyers, Rod, "European Unemployment and the Asian Emergence: Insights from theElemental Trade Model," March 2001. (Forthcoming in The World Economy, Vol.24, 2001.)
0111 Harris, Richard G., "The New Economy and the Exchange Rate Regime," March2001.
0110 Harris, Richard G., "Is there a Case for Exchange Rate Induced ProductivityChanges?", March 2001.
0109 Harris, Richard G., "The New Economy, Globalization and Regional Trade

Agreements", March 2001.0108 Rajan, Ramkishen S., "Economic Globalization and Asia: Trade, Finance and
Taxation", March 2001. (Forthcoming in ASEAN Economic Bulletin, 18(1), April2001.)
0107 Chang, Chang Li Lin, Ramkishen S. Rajan, "The Economics and Politics ofMonetary Regionalism in Asia", March 2001. (Forthcoming in ASEAN EconomicBulletin, 18(1), April 2001.)
0106 Pomfret, Richard, "Reintegration of Formerly Centrally Planned Economies into theGlobal Trading System", February 2001. (Forthcoming in ASEAN EconomicBulletin, 18(1), April 2001).
0105 Manzano, George, "Is there any Value-added in the ASEAN Surveillance Process?"February 2001. (Forthcoming in ASEAN Economic Bulletin, 18(1), April 2001).
0104 Anderson, Kym, "Globalization, WTO and ASEAN", February 2001. (Forthcoming inASEAN Economic Bulletin, 18(1): 12-23, April 2001).
0103 Schamel, Günter and Kym Anderson, "Wine Quality and Regional Reputation:Hedonic Prices for Australia and New Zealand", January 2001. (Paper presented atthe Annual Conference of the Australian Agricultural and Resource EconomicsSociety, Adelaide, 23-25 January 2001.)
0102 Wittwer, Glyn, Nick Berger and Kym Anderson, "Modelling the World Wine Marketto 2005: Impacts of Structural and Policy Changes", January 2001. (Paperpresented at the Annual Conference of the Australian Agricultural and ResourceEconomics Society, Adelaide, 23-25 January 2001.)
0101 Anderson, Kym, "Where in the World is the Wine Industry Going?" January 2001.(Opening Plenary Paper for the Annual Conference of the Australian Agriculturaland Resource Economics Society, Adelaide, 23-25 January 2001.)
0050 Allsopp, Louise, "A Model to Explain the Duration of a Currency Crisis", December2000.(Forthcoming in International Journal of Finance and Economics)
0049 Anderson, Kym, "Australia in the International Economy", December 2000.(Forthcoming as Ch. 11 in Creating an Environment for Australia's Growth, editedby P.J. Lloyd, J. Nieuwenhuysen and M. Mead, Cambridge and Sydney: CambridgeUniversity Press, 2001.)
0048 Allsopp, Louise, " Common Knowledge and the Value of Defending a FixedExchange Rate", December 2000.
0047 Damania, Richard, Per G. Fredriksson and John A. List, "Trade Liberalization,Corruption and Environmental Policy Formation: Theory and Evidence", December2000.
0046 Damania, Richard, "Trade and the Political Economy of Renewable ResourceManagement", November 2000.
0045 Rajan, Ramkishen S., Rahul Sen and Reza Siregar, "Misalignment of the Baht,Trade Imbalances and the Crisis in Thailand", November 2000.
0044 Rajan, Ramkishen S., and Graham Bird, "Financial Crises and the Composition ofInternational Capital Flows: Does FDI Guarantee Stability?", November 2000.
0043 Graham Bird and Ramkishen S. Rajan, "Recovery or Recession? Post-DevaluationOutput Performance: The Thai Experience", November 2000.