Ray-Casting Time-varying Volume Data Sets with Frame-to-frame coherence
Upload
independentCategory
view
3download
0
Simultaneous detection of landmarks and key-frame in cardiacperfusion MRI using a joint spatial-temporal context model
Xiaoguang Lu1∗, Hui Xue1, Marie-Pierre Jolly1, Christoph Guetter1,Peter Kellman2, Li-Yueh Hsu2, Andrew Arai2, Sven Zuehlsdorff3,
Arne Littmann4, Bogdan Georgescu1, and Jens Guehring1
1 Siemens Corporate Research, Princeton NJ, USA2 National Institutes of Health, Bethesda MD, USA3 Siemens Medical Solutions USA, Chicago IL, USA
4 Siemens AG, Healthcare Sector, H IM MR PLM-AW CARD, Erlangan, Germany
ABSTRACT
Cardiac perfusion magnetic resonance imaging (MRI) has proven clinical significance in diagnosis of heart dis-eases. However, analysis of perfusion data is time-consuming, where automatic detection of anatomic landmarksand key-frames from perfusion MR sequences is helpful for anchoring structures and functional analysis ofthe heart, leading toward fully automated perfusion analysis. Learning-based object detection methods havedemonstrated their capabilities to handle large variations of the object by exploring a local region, i.e., context.Conventional 2D approaches take into account spatial context only. Temporal signals in perfusion data presenta strong cue for anchoring. We propose a joint context model to encode both spatial and temporal evidence. Inaddition, our spatial context is constructed not only based on the landmark of interest, but also the landmarksthat are correlated in the neighboring anatomies. A discriminative model is learned through a probabilisticboosting tree. A marginal space learning strategy is applied to efficiently learn and search in a high dimensionalparameter space. A fully automatic system is developed to simultaneously detect anatomic landmarks and keyframes in both RV and LV from perfusion sequences. The proposed approach was evaluated on a database of373 cardiac perfusion MRI sequences from 77 patients. Experimental results of a 4-fold cross validation showsuperior landmark detection accuracies of the proposed joint spatial-temporal approach to the 2D approach thatis based on spatial context only. The key-frame identification results are promising.
Keywords: C ardiac perfusion MRI, landmark detection, key-frame identification, context model, learning-based object detection
1. INTRODUCTION
Myocardial first-pass perfusion cardiovascular magnetic resonance imaging (MRI) has significantly advancedover the last decade and shown a great deal of values in clinical applications for diagnosis and prognosis in heartdiseases.1,2 However, one of the major limitations in clinical routine applications of cardiac perfusion MRI istime-consuming manual process and analysis.
Precise information on both morphology and functions of the left ventricle (LV) and right ventricle (RV) isessential in cardiology. Anatomic landmarks can be used for anchoring these structures of interest. For example,LV blood pool center indicates the location of the left ventricle; anchoring RV insertion (intersection between RVouter boundary and the LV epicardium) helps analyze LV functions according to AHA myocardial segmentationmodels.3 In perfusion sequences, identifying a key-frame in a consistent manner provides a reference frame tocomputationally compensate cardiac motions caused by respiration, irregular heart rates, and imperfect cardiacgating.4,5 A typical cardiac perfusion MR sequence is presented in Fig. 1.
Landmark detection can be formulated into an object detection framework. Learning based object detectionapproaches have been demonstrated successful in real applications.6 Due to large anatomy shape and appearancevariations across populations along with different acquisition parameters, e.g. capturing at the different locations
∗Corresponding author ([email protected]).

Figure 1. Perfusion cardiac MR sequence. Frame index is annotated at the upper-left corner.
of the heart (base, middle, or apex), perfusion sequences poses a great challenge to automatic landmark andkey-frame detection. Fig. 2 provides a few MIP (maximum intensity projection) perfusion images calculatedfrom the original perfusion sequences along with the three target landmarks in our experiments.
Figure 2. Intensity variations shown in MIP (maximum intensity projection) images calculated from perfusion sequencesalong with the target landmarks annotated, i.e., RV insertion landmarks (orange circle) and LV center (cyan plus).
Context of a target is considered as its local evidence such as shape and appearance. In perfusion data,both spatial (within slice) and temporal context provide cues for landmark detection. Instead of utilizing spatialcontext only or both spatial and temporal contexts but separately, we propose a joint spatial-temporal contextmodel under a learning-based object detection framework to automatically detect anatomic landmarks andidentify the key-frames (key-frame could be different for different heart chambers) simultaneously. The proposedcontextual model is applied to a three-dimensional volume reconstructed from the original perfusion sequence.In addition, because each individual landmark has limited local evidence to identify, we construct context not
only based on individual landmarks, but also the landmarks that are correlated to the target. Taking intoaccount correlations among landmarks and across the temporal dimension includes more evidence and enhancesdiscriminative capabilities of the context model. Our experiments were focused on motion-compensated perfusionsequences, which were obtained through an automatic algorithm proposed in.5 The target landmarks includeRV insertion points and LV center. And the key-frames are identified for both RV and LV.
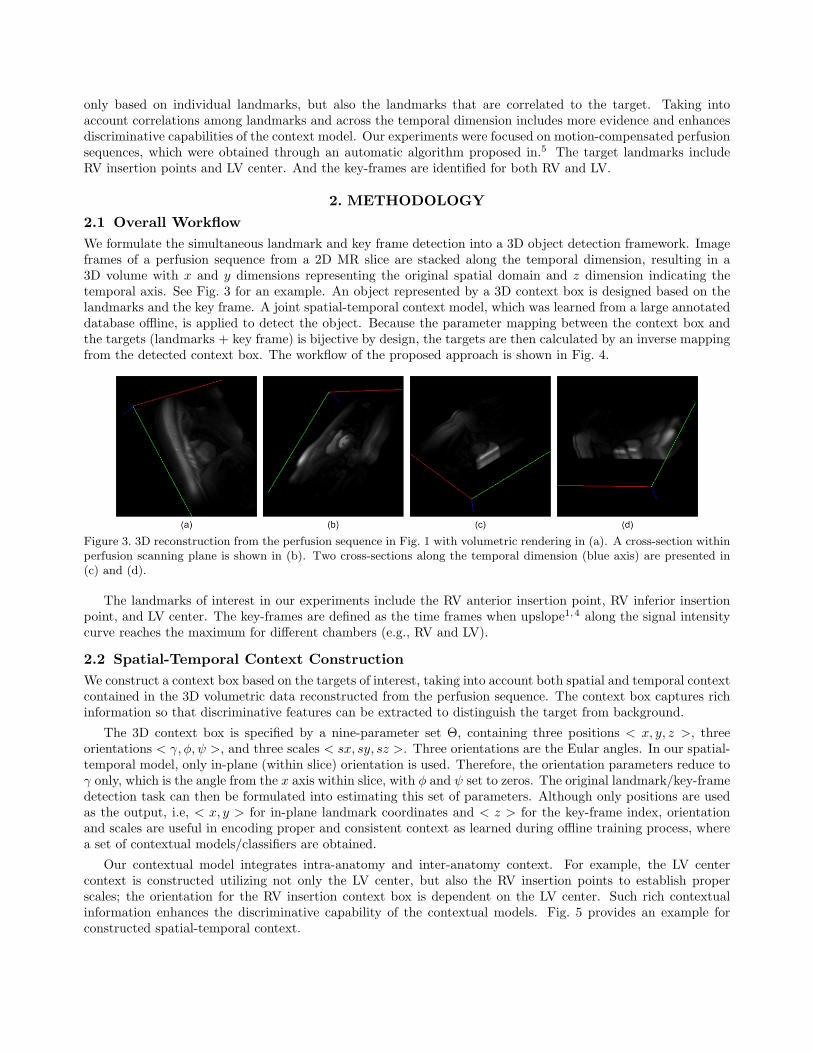
2. METHODOLOGY2.1 Overall WorkflowWe formulate the simultaneous landmark and key frame detection into a 3D object detection framework. Imageframes of a perfusion sequence from a 2D MR slice are stacked along the temporal dimension, resulting in a3D volume with x and y dimensions representing the original spatial domain and z dimension indicating thetemporal axis. See Fig. 3 for an example. An object represented by a 3D context box is designed based on thelandmarks and the key frame. A joint spatial-temporal context model, which was learned from a large annotateddatabase offline, is applied to detect the object. Because the parameter mapping between the context box andthe targets (landmarks + key frame) is bijective by design, the targets are then calculated by an inverse mappingfrom the detected context box. The workflow of the proposed approach is shown in Fig. 4.
Figure 3. 3D reconstruction from the perfusion sequence in Fig. 1 with volumetric rendering in (a). A cross-section withinperfusion scanning plane is shown in (b). Two cross-sections along the temporal dimension (blue axis) are presented in(c) and (d).
The landmarks of interest in our experiments include the RV anterior insertion point, RV inferior insertionpoint, and LV center. The key-frames are defined as the time frames when upslope1,4 along the signal intensitycurve reaches the maximum for different chambers (e.g., RV and LV).
2.2 Spatial-Temporal Context ConstructionWe construct a context box based on the targets of interest, taking into account both spatial and temporal contextcontained in the 3D volumetric data reconstructed from the perfusion sequence. The context box captures richinformation so that discriminative features can be extracted to distinguish the target from background.
The 3D context box is specified by a nine-parameter set Θ, containing three positions < x, y, z >, threeorientations < γ, φ, ψ >, and three scales < sx, sy, sz >. Three orientations are the Eular angles. In our spatial-temporal model, only in-plane (within slice) orientation is used. Therefore, the orientation parameters reduce toγ only, which is the angle from the x axis within slice, with φ and ψ set to zeros. The original landmark/key-framedetection task can then be formulated into estimating this set of parameters. Although only positions are usedas the output, i.e, < x, y > for in-plane landmark coordinates and < z > for the key-frame index, orientationand scales are useful in encoding proper and consistent context as learned during offline training process, wherea set of contextual models/classifiers are obtained.
Our contextual model integrates intra-anatomy and inter-anatomy context. For example, the LV centercontext is constructed utilizing not only the LV center, but also the RV insertion points to establish properscales; the orientation for the RV insertion context box is dependent on the LV center. Such rich contextualinformation enhances the discriminative capability of the contextual models. Fig. 5 provides an example forconstructed spatial-temporal context.

Figure 4. Overall workflow for joint landmark detection and key-frame identification. RV insertion landmarks (cyan plus)are used as an example.
Figure 5. Example of constructed spatial-temporal context model for RV insertion (green) and LV center (blue).
2.2.1 Joint model for RV insertion
For RV insertion, the anterior and inferior landmarks are identified through the following context modeling.Let < xan, yan > and < xin, yin > denote the true positions of the RV insertion anterior and RV insertioninferior, respectively. The time frame indices for the key frame and the peak frame4 of RV are represented astRV and tpRV , respectively. The contextual parameter set for RV insertion is: positions {(xan + xin)/2, (yan +yin)/2, tRV }; orientations {γ: orthogonal to the line segment connecting RV insertion anterior and RV insertion
inferior, and pointing toward the LV, φ = 0, ψ = 0}; and scales {sins, sins, (tpRV − tRV ) ∗ α}, where sins =√(xan − xin)2 + (yan − yin)2 ∗ β. α and β are factors that can be used to adjust the contextual range, which
are set to 2.4 and 1.5, respectively, in our experiments. Selection of α and β is a tradeoff between rich contextand noise. The scale setting for the z (temporal) dimension is designed to cover the foot-to-peak range.4
2.2.2 Joint model for LV center
For LV center, let < xc, yc > denote the position of the LV center. tLV and tpLV represent the key frame and peakframe indices of LV. The contextual parameter set for the LV center is constructed as: positions {xc, yc, tLV };orientations {γ: orthogonal to the line segment connecting the two RV insertion points, and pointing towardthe RV, φ = 0, ψ = 0}; and scales {sLV C , sLV C , (tpLV − tLV ) ∗ ρ}, where sLV C = (
√(yin − yc)2 + (xin − xc)2 +√
(yan − yc)2 + (xan − xc)2) ∗ ω. ρ and ω are set to 2.4 and 1.5.
2.3 Learning-Based Detection
To utilize context for object detection, we build a discriminative model to differentiate the true object frombackground by calculating the probability of given context (of a candidate) being a target object, which isformulated as a two-category classification problem, i.e., true object vs. background. Discriminative featuresfrom context are extracted and learned by a machine algorithm based on the experts’ annotations, resulting ina probabilistic model for each target (landmarks+key-frame) context. The online detection algorithm searchesthrough multiple hypotheses in the parameter space to identify the ones with high probabilities.
Context-based detection is to estimate the parameter set, Θ, of an object target from a given volume. Thereare seven parameters for each context in our framework, including 3 positions (x, y, z), 1 orientation (γ), and 3scales along each axis (sx, sy, sz). Because exhaustively searching in this seven-dimensional space is prohibitivefor online applications, we applied a marginal space learning based approach.7
The detectors are trained using positive samples based on the position, orientation, and size of the annotatedobject context, while the negative set is generated by extracting sub-volumes that are further from the positivesamples in the parameter space.
For each learning/classification task, we use a probabilistic boosting tree (PBT)8 as the classifier. Theclassifier is a tree-based structure with which the posterior probabilities of the presence of the target are calculatedfrom candidate context in given volumes. Following the marginal space learning strategy, we designed a series ofclassifiers that estimate parameters at a number of sequential stages in the order of complexity, i.e., translation,orientation, and scale. Different stages utilize different features computed from image intensities. Multiplehypotheses are maintained between algorithm stages, which quickly removes false hypotheses at the earlierstages while propagates the right hypothesis to the final stage. Only one hypothesis is selected as the finaldetection result.
Each detector selects a set of discriminative features that are used to distinguish the positive target fromnegatives from a large pool of features. For the classifiers at the translation stage, we choose Haar wavelet-like features,6 which are calculated efficiently using integral image-based techniques. For the classifiers at theorientation and scale search stages, steerable features7 are applied, because their computation does not requirevolume rotation and re-scaling, which are computationally expensive.
3. EXPERIMENTS
We collected a total of 373 perfusion series from 77 patient studies, among which 83 series were captured usingTrueFISP perfusion imaging sequences and 290 were with GRE-EPI. For each series, a spatial-temporal 3Dvolume was constructed. The spatial coordinates < x, y > of the three landmarks (two RV insertion pointsand the LV center) were manually labeled. The temporal key frame < z > was annotated. These annotationswere used as ground truth for quantitative evaluation. For comparison purposes, the MIP image was calculatedfor each perfusion series and the spatial context model was applied to detect the landmarks without temporalcontext.
We applied our joint spatial-temporal context model to detect the objects of ‘RV insertion’ and ‘LV center’,denoted as the ’2D+t’ approach. With each object detected, corresponding landmarks are inferred based on

reverse object/context modeling process, i.e., calculating landmark positions from the detected parameterizedbounding box. The model with spatial context only was applied to the MIP counterpart of each perfusionseries to detect the landmarks, as the ’2D’ approach. We computed Euclidean distance between the detectedlandmark position and its corresponding ground truth as the detection error for each landmark, which was usedas the metric to evaluate the system performance on spatial landmark detection. For the ’2D+t’ approach, thesimultaneously detected key-frame (index) was compared with ground truth to compute the absolute differencein terms of number of frames, which was used as performance valuation metric. Both ’2D+t’ and ’2D’ approacheswere fully automatic.
A 4-fold cross-validation scheme was applied for evaluation. The entire database was randomly partitionedinto four quarters. No data from the same patient is partitioned into different quarters. For each fold evaluation,three quarters were combined for training and the remaining one quarter was used as unseen data for testing.This procedure was repeated four times so that each series was used once for testing. Performance is summarizedbased on all 4 folds. For landmark detection, both ‘2D+t’ and ‘2D’ approaches are evaluated under the sameexperimental protocol with the same spatial context parameters. It shows that ‘2D+t’ outperforms ‘2D’ inboth RV and LV landmark detections, which demonstrates the advantage of the proposed joint spatial-temporalcontext model. Landmark detection performance is provided in Table 1 and Fig. 6. Table 2 and Fig. 7 showkey-frame detection results of the joint spatial-temporal model (‘2D+t’ approach).
Table 1. Statistics of the distance of the detected landmarks from ground truth positions by a 4-fold cross validation.Distances are in unit of mm.
(a) RV insertion.
Mean Std Median3D (2D+t) 5.0 3.0 4.3MIP (2D) 6.2 4.6 4.9
(b) LV center
Mean Std Median3D (2D+t) 2.2 1.2 2.0MIP (2D) 3.4 4.1 2.9
Figure 6. Landmark evaluation results of 4-fold cross validation on the proposed joint spatial-temporal model (2D+t),in comparison with a 2D approach (spatial only), which was applied on the MIP images calculated from each perfusionsequence. Each curve shows the percentage of cases whose distance of the automatic detection results from ground truthis less than an error distance threshold.
Table 2. Statistics of the distance of the detected key-frame from ground truth by a 4-fold cross validation. Distance ismeasured in the number of frames.
Mean Std MedianRV 0.77 0.55 0.51LV 0.62 0.77 0.45

Figure 7. Key-frame identification results of 4-fold cross validation. Each curve shows the percentage of cases whoseabsolute distance of the automatically detected key frame index from ground truth is less than an error distance threshold.
4. CONCLUSIONS
We have proposed a joint spatial-temporal context model based approach that is integrated into a learning-based object detection framework. We have developed a fully automatic system to detect landmarks fromcardiac MRI perfusion series, along with the key-frame identified simultaneously. In our experiments, the targetlandmarks include the RV insertion points and the LV center, which facilitate fully automated segmental analysison perfusion data.9 The proposed approach is not limited to these landmarks.
REFERENCES[1] Jerosch-Herold, M., Muehling, O., and Wilke, N., “MRI of myocardial perfusion,” Seminars in Ultrasound,
CT, and MRI 27(1), 2–10 (2006).[2] Gerber, B., Raman, S., Nayak, K., Epstein, F., Ferreira, P., Axel, L., and Kraitchman, D., “Myocardial
first-pass perfusion cardiovascular magnetic resonance: history, theory, and current state of the art,” Journalof Cardiovascular Magnetic Resonance 10, 1–18 (2008).
[3] Cerqueira, M., Weissman, N., Dilsizian, V., Jacobs, A., Kaul, S., Laskey, W., Pennell, D., Rumberger,J., Ryan, T., and Verani, M., “Standardized myocardial segmentation and nomenclature for tomographicimaging of the heart,” Circulation , 105–539 (2002).
[4] Xue, H., Zuehlsdorff, S., Kellman, P., Arai, A., Nielles-Vallespin, S., Chefdhotel, C., Lorenz, C. H., andGuehring, J., “Unsupervised inline analysis of cardiac perfusion MRI,” in [Proc. MICCAI ], 741–749 (2009).
[5] Chefd’hotel, C., Hermosillo, G., and Faugeras, O., “Flows of diffeomorphisms for multimodal image registra-tion,” in [Proc. IEEE ISBI ], 753–756 (2002).
[6] Viola, P. and Jones, M. J., “Robust real-time face detection,” International Journal of Computer Vi-sion 57(2), 137–154 (2004).
[7] Zheng, Y., Barbu, A., Georgescu, B., Scheuering, M., and Comaniciu, D., “Fast automatic heart chambersegmentation from 3D CT data using marginal space learning and steerable features,” in [Proc. ICCV ],(2007).
[8] Tu, Z., “Probabilistic boosting-tree: Learning discriminative models for classification, recognition, and clus-tering,” in [Proc. ICCV ], 1589–1596 (2005).
[9] Jolly, M.-P., Xue, H., Lu, X., Guetter, C., Kellman, P., Hsu, L.-Y., Arai, A. E., Zuehlsdorff, S., and Guehring,J., “Automatic per-segment analysis of myocardial perfusion MRI,” in [SCMR/Euro CMR Joint ScientificSessions ], (2011).
Copyright © 2022 FDOKUMEN