Simulation of Polycentric Urban Growth Dynamics Through Agents
18
Chapter 15 SIMULATION OF POLYCENTRIC URBAN GROWTH DYNAMICS THROUGH AGENTS Model concept, application, results and validation Wolfgang Loibl, Tanja Tötzer, Mario Köstl, Klaus Steinnocher ARC systems research GmbH - Austrian Research Centers; Vienna Abstract: In contrast to typical urban regions, dominated by a core city located in the region’s centre and a suburban fringe, the Austrian Rhine Valley, selected as study area, can be described as a peri-urban region with some medium-sized centres and various rural villages all developing in different ways. Thus, a simulation approach has to be applied that allows for different settlement growth and densification velocities in order to reach model results which come close to real land-use transitions. The urban growth model presented here is based on a multi-agent system which simulates location decisions of households and company start-ups within a cellular landscape driven by regional and local attractiveness patterns. The model has been applied to generate control runs for the past decade and validated by comparing its results with observed land-use changes at municipality level and at raster cell level. Scenario runs for the future have been conducted assuming suspended zoning regulations leading to a different actor’s behaviour. Key words: land-use change simulation, urban growth, polycentric development, driving forces, attractiveness criteria, multi-agent systems 1. INTRODUCTION Spatial planning requires reliable scenario results for decision making to foresee the effects of spatial planning strategies. A rather new approach to simulate possible future land-use changes is offered by multi agent simulation (MAS) models that consider the spatial behaviour of individual agents as a basic driver. This approach leads to very detailed, local results and thus provides the information needed by local authorities and inhabitants interested in information about future land-use change consequences for their own neighbourhoods.
-
Upload
austrianinstituteoftechnology -
Category
Documents
-
view
1 -
download
0
Transcript of Simulation of Polycentric Urban Growth Dynamics Through Agents
Chapter 15
SIMULATION OF POLYCENTRIC URBAN GROWTH DYNAMICS THROUGH AGENTS Model concept, application, results and validation
Wolfgang Loibl, Tanja Tötzer, Mario Köstl, Klaus Steinnocher ARC systems research GmbH - Austrian Research Centers; Vienna
Abstract: In contrast to typical urban regions, dominated by a core city located in the region’s centre and a suburban fringe, the Austrian Rhine Valley, selected as study area, can be described as a peri-urban region with some medium-sized centres and various rural villages all developing in different ways. Thus, a simulation approach has to be applied that allows for different settlement growth and densification velocities in order to reach model results which come close to real land-use transitions. The urban growth model presented here is based on a multi-agent system which simulates location decisions of households and company start-ups within a cellular landscape driven by regional and local attractiveness patterns. The model has been applied to generate control runs for the past decade and validated by comparing its results with observed land-use changes at municipality level and at raster cell level. Scenario runs for the future have been conducted assuming suspended zoning regulations leading to a different actor’s behaviour.
Key words: land-use change simulation, urban growth, polycentric development, driving forces, attractiveness criteria, multi-agent systems
1. INTRODUCTION
Spatial planning requires reliable scenario results for decision making to foresee the effects of spatial planning strategies. A rather new approach to simulate possible future land-use changes is offered by multi agent simulation (MAS) models that consider the spatial behaviour of individual agents as a basic driver. This approach leads to very detailed, local results and thus provides the information needed by local authorities and inhabitants interested in information about future land-use change consequences for their own neighbourhoods.
2 Chapter 15
Application of MAS models in the spatial sciences started in the mid- 1990s (cf. Wegener and Spiekerman 1997, Portugali 2000, Torrens 2001, Batty et al. 2003). MAS models, initiated from sciences like psychology, sociology and biology, did not originally treat space explicitly. The application of MAS in spatial sciences has re-shaped agents’ activities from immobile decision making and communication to mobile action within a virtual space, like movement through a landscape or along roads. In land-use change modelling hybrid models, combining MAS and Cellular Automata (CA) approaches, have often been developed (see Benenson and Torrens 2004). The MAS models the actor´s behaviour which is the driving force for land-use change while CA applies the land-use change based on a cell-by-cell transition function not directly considering actors as drivers. Cells in MAS are applied as entities whose state changes not (only) because of neighbourhood characteristics but also because of agent behaviour changing the state of the underlying cell actively. Both MAS and CA approaches address time through iterative steps, executing state changes of single cells or destination search cycles of single agents, which both perform steady land-use changes inside the study region.
As polycentric regions show differences in settlement development speed, one has to consider agents’ destination preferences leading to different choice frequencies where certain municipalities are selected more often as home towns than others. To model these different growth patterns, regional characteristics influencing actors’ regional scale choice behaviour have to be investigated in addition to local influences (Loibl and Kramar 2001; Loibl and Tötzer, 2003). The more information regarding actors’ behaviour and their spatial consequences effects is available, the more accurate the simulation results will be.
The MAS approach described in this chapter simulates decisions of several agent classes reacting differently on regional and local characteristics, driving a polycentric settlement development.
2. MODEL CONCEPT AND REALIZATION
2.1 Overview
MAS-based land-use change models are frequently market- and neighbourhood-oriented (see Portugali 2000, Wadell et al. in this book) and focus on the urban local scale. They tend to concentrate on steady growth within a particular city. The model described here does not consider market

15. Simulation of polycentric urban growth dynamics through agents 3 aspects explicitly. It is assumed that the real estate market ‘works’ as an intrinsic general function of regional property development.
The model takes a behavioural approach, where land-use change is the result of many actors’ activities in response to general spatial conditions and personal circumstances. The environment is perceived and judged by actors who live in it and who, according to their perceptions, desires and (financial) circumstances, behave differently. Here emphasis is placed on the simulation of actors’ moving and settling decisions to trigger the growth speeds of different settlements. A typology of relevant actor groups is derived and deployed as model’s agent classes equipped with certain behaviour rules. Six agent classes are defined: four household-classes searching for new residences and two entrepreneur-classes planning company start-ups. The model simulates only decisions of actors causing the construction of new built-up area or the densification of existing ones. The moving of households or employees in a way of ‘exchanging’ houses or workplaces without effect on land use is not considered.
To simulate the agents’ behaviour properly it is important to proof and quantify the causal relation of the actors’ behaviour with the attractiveness criteria that influence the actors’ decisions aiming in built-up area growth or densification (Loibl and Kramar 2001; Loibl and Tötzer, 2003). Therefore the behaviour rules are verified and thus quantified by relating statistical data describing population and workplace dynamics to spatial attractiveness criteria and to built-up area growth summarized for municipalities.
The model region where the agents act and finally determine land-use change is a cellular landscape realized as a digital land-use raster layer (with 50 metre by 50 metre cells) derived from satellite images and stratified into a set of land-use classes. Additional raster cell layers provide further information like zoning regulations, landscape attractiveness and other characteristics that explicitly relate to local and regional attractiveness. One important layer contains the municipality delineation of the entire model area to enable and control the choice of a certain municipality as part of the destination search process.
2.2 Model concept and structure
The built-up area growth simulation is based on agents’ decisions to settle down or to establish a company. These decisions are driven by regional and local attractiveness criteria; regional attractiveness influences agents’ municipality choice resulting in different development speeds between settlements; local attractiveness influences the decisions of actors’ on the final residential or commercial start-up location within the selected municipality.
4 Chapter 15
During the model initialization, the general increase of household and workplace numbers within the model region is defined, as well as the iteration frequency of the agent classes. The iteration frequency of the four household- and two entrepreneur-agents is firstly calibrated during the models’ control runs to achieve results, matching the observed distribution and composition of actors. For future scenario runs the frequency has to be adapted according to the regional development assumptions.
The location of each household and entrepreneur agent is performed by a search routine of two subsequent tasks: (1) municipality choice; and (2) local target area search. The regional and local attractiveness information for the agent’s search has to be provided in advance.
The municipality choice refers to the observation that certain municipalities are selected more often as destinations than others, assumed to be driven by certain regional attractiveness criteria. The preference of each agent for a certain destination municipality is controlled by regional choice probability distributions. They are derived in advance applying linear regression models explaining increase of household and company numbers (using workplaces as proxy for business start-ups) in the municipalities with attractiveness variables. The municipality’s absolute growth numbers for households and workplaces, generated by the regression functions, are transformed into relative growth frequencies which are finally applied as municipality choice probability distributions. The municipality selection of the agents is conducted by a random choice of a municipality out of the agent classes’ choice probability distribution.
After the selection of a destination municipality, the local area search takes place in the cellular landscape within the municipality considering local attractiveness for housing or for commercial area usage. The search starts in a random cell from where the agent moves to the nearest residential (or commercial) area and, if inside a settlement area, he moves to the cell with the lowest density. Agents accepting higher density settlement areas consider only cells with densities above a certain threshold. The appropriate land-use class (as criterion for a transition into built-up area to be possible) and built-up area zoning (if zoning regulations are considered by the certain scenario) are pre-conditions for further location decisions. To take into account further local attractiveness criteria, additional data layers are integrated. The most attractive cell among the alternatives is selected within neighbourhood through multi-criteria evaluation, considering the respective cell values from all attractiveness layers. If the selected cell is still open space, a land-use state change to built-up area will take place. If no appropriate cell is found (e. g. because of too high population - or workplace density in the neighbourhood), further search attempts are conducted and if they fail too, a new target municipality is selected.
15. Simulation of polycentric urban growth dynamics through agents 5
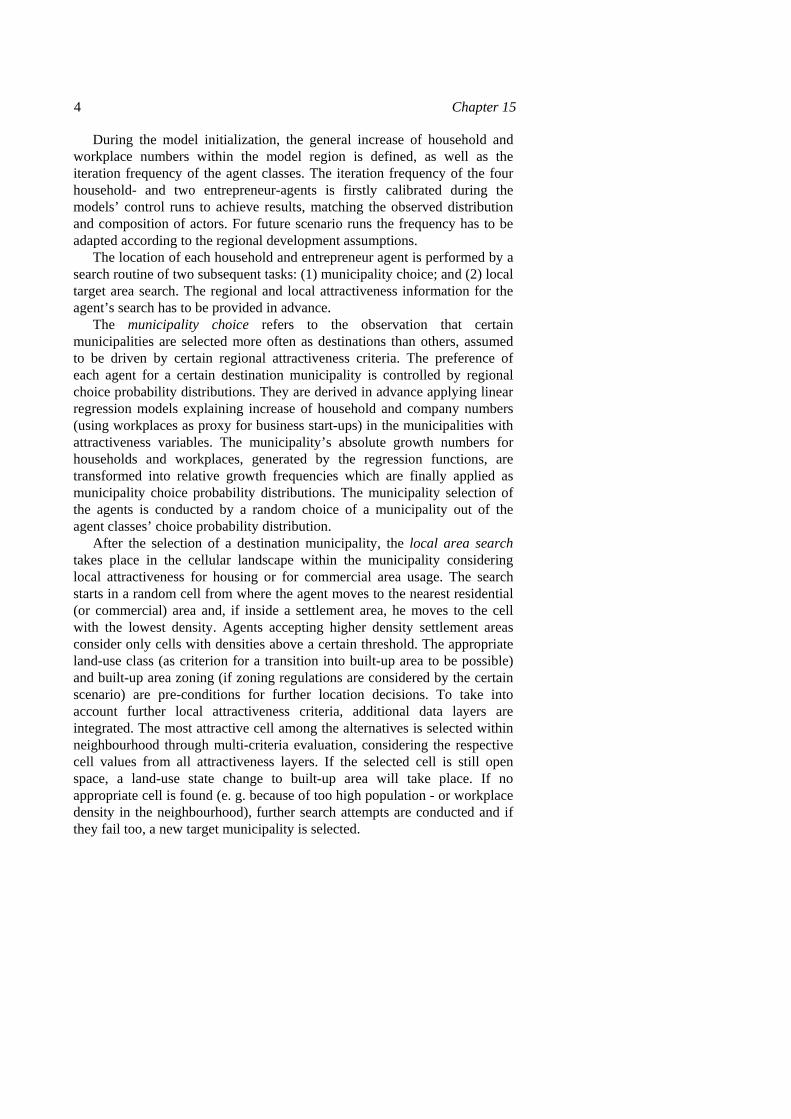
The additional persons of the moving household or the additional workplaces of the new enterprise are accumulated to the current numbers of the selected cell and additionally to the numbers of the respective municipality. Figure 15-1 gives an overview of the model structure.
Figure 15-1. Model overview
The model performs the simulation on an agent by agent basis and thus continuously drives land-use change and change in spatial attractiveness due to growth of building land and increases in cell occupation density. Thus each agent influences behaviour of subsequent agents. The iterative process introduces temporal aspects and makes the decisions of later settlers dependent on the behaviour of previous ones.
The first MAS model development took place in 2001 using MS Visual Basic as the compiler supports graphical user interface creation and object oriented programming as well accommodating the authors’ FORTRAN programming experience. In 2004, more interactive control has been added to the model relating to for example: parameter adjustment for ‘on-the-fly’ model run adaptation and the exchange of input and output data.
6 Chapter 15 3. MODEL APPLICATION
3.1 Study area and land-use change drivers
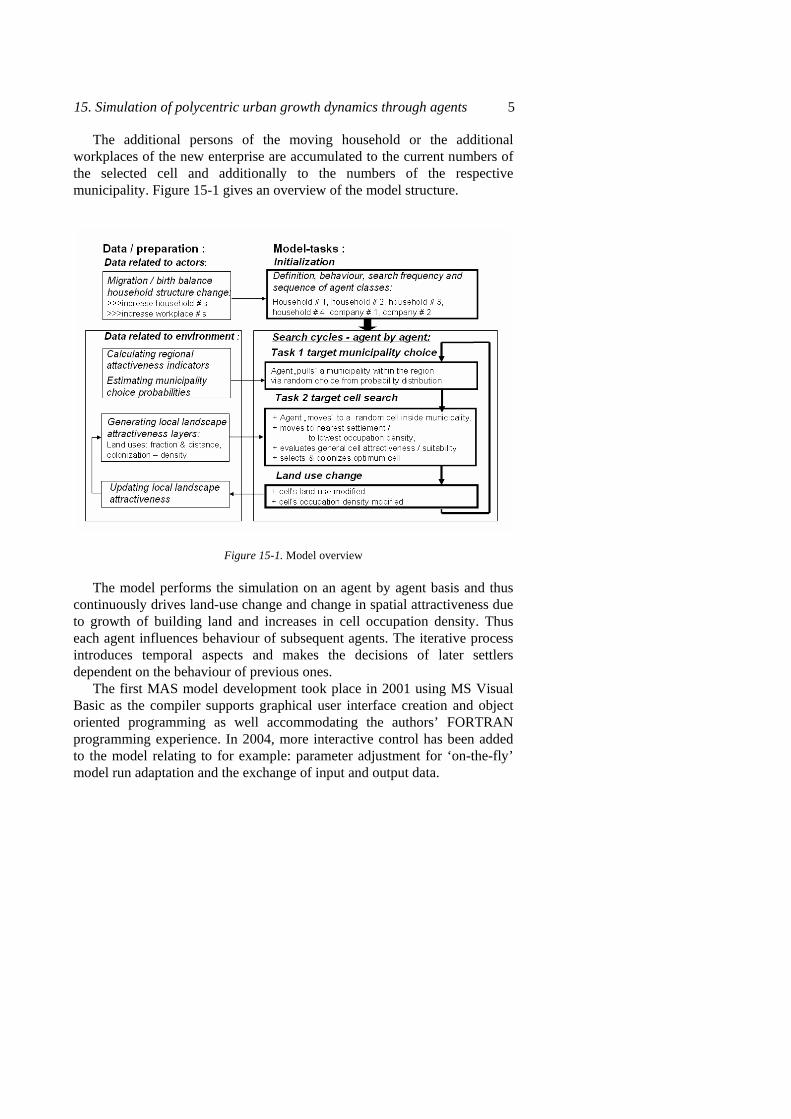
The presented model application simulates settlement development within the Austrian Rhine Valley, a peri-urban region with various medium- and small-sized municipalities, south of Lake Constance. Figure 15-2 shows the extent of the Austrian Rhine Valley study area and the observed development of the built-up area between 1990 and 2000.
Figure 15-2. Settlement growth in Austria’s Rhine Valley, 1990-2000, overview and detail (Satellite images: LANDSAT TM, SPOT; Land-use classification: ARC systems research).
The model must be adapted for each region to which it is applied in order to achieve a high ‘prediction quality’. This quality can be obtained by calibrating, or tuning, the model with actual observations. Thus an initial model application, or ‘control run’, applying prior data has to be carried out. As start and end of the control-run period we selected the years 1990 and 2000 for which the necessary data sets are available. These data sets include: a land-use raster layer, population-, household- and workplace numbers per municipality as well as density raster layer related to building land. The actual simulation results are discussed in Section 4. Here we concentrate on describing how the model is adapted to the study area, which input data are
15. Simulation of polycentric urban growth dynamics through agents 7 provided and how the model is calibrated to achieve best results for the control run, to provide a reliable model framework for future scenario runs.
The built-up area within the model region (7,330 hectares) was occupied in 1991 by 250,000 inhabitants in 86,000 households and by 97,000 workplaces. The population growth of 15,000 in this period is related to a birth-surplus that more than compensates the negative migration balance. The increase of 630 hectares (+10%) of the housing area and 110 hectares (13%) of the commercial area by 2001 is caused by an increase of 16,000 households and 17,000 workplaces. This household-number growth is mainly caused by changing household structure. The share of single and two-person households increased from 22% and 23 % in 1991 to 28% and 27 % respectively in 2000. The remaining share of larger households decreased. To consider the new household size structure for the destination year, a separation of 13.000 inhabitants from their original households has to be carried out: The inhabitant numbers of the municipalities were reduced by the certain people amount to achieve the assumed household size average. This population reduction is distributed to each municipality’s housing area cell to reduce the cell’s population density and household size: The number of person per municipality that have left their former household, are divided by the municipality’s housing area cells. The person number of each housing area cell is reduced by this share and added to the movers’ pool which encompasses 38.000 persons. The 16.000 new households resulting from this movers’ pool are divided into the 4 household agent classes to achieve a certain future household structure.
The impact of an increase in workplaces on settlement growth and densification will be modelled without considering prior workplace losses, taking two entrepreneur agent classes, one that establishes small company start-ups (with few workplaces, accepting densely built up area) and one establishing larger company start-ups with more workplaces demanding new building land along the municipalities settlement borders.
3.2 Attractiveness definition
As described in Section 2.2 the simulation of each agent’s action consists of two tasks - municipality choice and local area search. Both tasks are triggered by attractiveness criteria which have to be defined, generated and its effect quantified in advance: regional attractiveness triggers municipality choice, local attractiveness controls decision to select a final destination cell.
8 Chapter 15 3.2.1 Regional attractiveness criteria
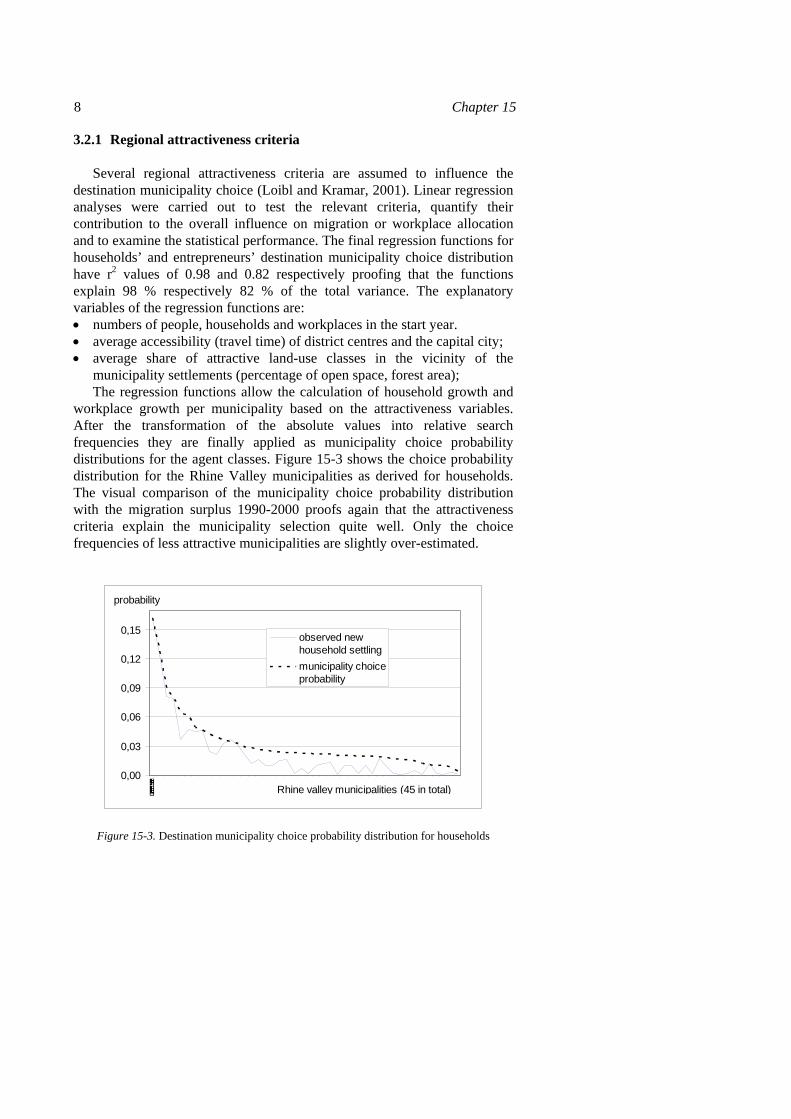
Several regional attractiveness criteria are assumed to influence the destination municipality choice (Loibl and Kramar, 2001). Linear regression analyses were carried out to test the relevant criteria, quantify their contribution to the overall influence on migration or workplace allocation and to examine the statistical performance. The final regression functions for households’ and entrepreneurs’ destination municipality choice distribution have r2 values of 0.98 and 0.82 respectively proofing that the functions explain 98 % respectively 82 % of the total variance. The explanatory variables of the regression functions are: • numbers of people, households and workplaces in the start year. • average accessibility (travel time) of district centres and the capital city; • average share of attractive land-use classes in the vicinity of the
municipality settlements (percentage of open space, forest area); The regression functions allow the calculation of household growth and
workplace growth per municipality based on the attractiveness variables. After the transformation of the absolute values into relative search frequencies they are finally applied as municipality choice probability distributions for the agent classes. Figure 15-3 shows the choice probability distribution for the Rhine Valley municipalities as derived for households. The visual comparison of the municipality choice probability distribution with the migration surplus 1990-2000 proofs again that the attractiveness criteria explain the municipality selection quite well. Only the choice frequencies of less attractive municipalities are slightly over-estimated.
0,00
0,03
0,06
0,09
0,12
0,15 observed newhousehold settlingmunicipality choiceprobability
Rhine valley municipalities (45 in total)
probability
Figure 15-3. Destination municipality choice probability distribution for households

15. Simulation of polycentric urban growth dynamics through agents 9
This approach to model the municipality selection preferences via a set of regional attractiveness criteria allows the incorporation of the impact of large-scale changes in attractiveness; making it possible to simulate for example the change in migration and settlement patterns following the improved accessibility due to construction of a new motorway. The effects of different traffic-route alternatives can be tested easily by exchanging the travel-time variable and thus calculating new probabilities. The local search must also be performed as the housing area demand triggered by a new motorway must be confronted with the supply in the respective settlements regarding available new housing area or acceptance of densification.
3.2.2 Local attractiveness criteria
The calculation of local attractiveness is performed in advance on a cell by cell basis, using land-use raster maps and raster GIS functions to estimate the share of more or less attractive land-use classes in each cell’s neighbourhood. As part of these calculations Euclidean distances are estimated to the nearest area of the land-use classes that serve as attractions or obstacles for location choice and thus for land-use change and densification. The cell’s population, household and workplace density is calculated through an overlay of census entity polygons on built-up area cells and relating demographic and employment data from official statistics to the underlying built-up area cells to calculate every cell’s share on the respective census entity.
The following raster layers with 50 metre cell size have been prepared for the year 1990 to conduct the control run: • land-use layer with 10 use classes:
- three urban fabric classes: housing, mixed, industrial/commercial; - two semi-urban fabric classes: traffic facilities, urban green; - five open space classes: water-bodies, grassland, arable land, forest and natural land cover (wetland, pasture, rock, glacier); • distance to closest residential area, to closest industrial area; • distance to closest major road/motorway, to closest motorway exit; • household density and population density per residential area cell; • workplace density per settlement area cell; • zoning regulations: residential-mixed built-up-industrial area; and • nature conservation: central valley green space protection area.
Some additional layers are prepared for model validation and for future scenario runs: land-use in 2000, density in 2000 and proposed density in 2010. Municipality affiliation, municipality centres and settlement centre layers are also integrated as raster layers for the local search to check whether the agent is still moving inside the selected municipality.
10 Chapter 15 3.3 Agent initialization and parameter definition
3.3.1 Defining the agent composition
To adapt a model run for certain scenario assumptions, the number and composition of the agents’ municipality search frequency have to be defined. The agent classes have different behaviour patterns which are deduced from statistical data describing the actors’ structure and interactions. Due to limited data availability, agents’ stratification is kept simple and additional behaviour assumptions are derived from the literature dealing with migration and settlement motivations with respect to household characteristics (e.g. Bogue, 1969) or about entrepreneurs referring to colonization decisions.
At the start of a model run the search frequencies of four household agent classes (of 1, 2, 3 and 4 persons) and two entrepreneur agent classes (smaller and larger enterprises) are defined to achieve a certain future composition of household size classes, inhabitant- and workplace numbers. The agents’ different location preferences for low or higher density settlement areas lead to different search patterns leading to different local development. The search frequencies of the control run are defined in a way to match the observed population- and household distribution and the settlement growth for the destination year. The agents’ frequencies can be modified interactively to change the household structure even during the model run leading to different housing area demand and population density distribution.
3.3.2 Modifying the municipality choice probability distribution
The probability distributions that are based on current, observed attractiveness will provide a trend scenario; the control run results for the observation period will match the observed municipality growth pattern. But this probability can also be adjusted individually for each agent class to modify the decision behaviour according to alternative scenario conditions. A weighting and a shifting factor per agent class allow to flatten or widen the shape of the choice probability distribution; leading to different spatial behaviour. Flattening the shape reduces the chances of the attractive municipalities and raises the chances of the non-attractive municipalities; leading to equally distributed settlement growth. Raising the shape leads to further settlement growth concentration. Range thresholds for two regional attractiveness criteria per agent class allow modifying the municipality choice probability distributions by excluding certain municipalities to be selected as a destination.
15. Simulation of polycentric urban growth dynamics through agents 11 3.3.3 Modifying the local attractiveness criteria weights
Local cell search considers 10 local attractiveness criteria in a multi-criteria analysis. These attractiveness criteria have to be weighted differently for each agent class to increase or decrease the influence of the particular criteria and thus to modify the behaviour of the respective agent. Default weights are defined as result of the model calibration steps. The weights can be adjusted interactively, even during the simulation runs.
3.4 Simulation cycles
The simulation of settlement growth is conducted through single actions of households and company start-ups of entrepreneurs leading to densification and - in case of open space cells - to land-use change. Change takes place steadily and a destination year is not defined explicitly. It is stated implicitly through certain household-, population- and workplace- growth numbers, expected to be achieved within a certain time range.
3.4.1 Municipality selection
The first step of each search action is to decide on the destination municipality. The regional settling preference of each single agent is conducted by discrete choice: the agent picks by chance a destination municipality from the choice probability distribution. As described in 3.3.2 the probability distribution curvature can be modified to alter the agents’ behaviour reviewing the effects of those changes on settlement growth. Municipalities showing a higher selection probability are more attractive and will be selected more often than others. But a higher probability will only then lead to faster settlement growth in the selected municipality if the demand can be satisfied through appropriate supply, which is available building land or densification acceptance. While regional attractiveness is responsible for the spatial distribution of regional settlement growth, the consequence whether extensive sprawl or moderate growth and some densification will happen is dependent on local attractiveness and on local settlement growth regulations.
3.4.2 Local destination search
The local search takes place in the cellular model landscape. After a target municipality has been selected, the agent starts the final search from a random cell inside the selected municipality. The kind of search depends on the agent’s behaviour rules. Agents preferring a low cell density start
12 Chapter 15 searching in a random open space cell and move to the nearest settlement. Agents preferring higher density cells start from a settlement centre within the selected municipality and move outwards in random direction seeking for the cell with the lowest density (above a certain density threshold). Single and couple households and small business entrepreneurs show moderate preference for high density cells, while families with children do not except high density cells and show a high preference for low density cells or for vacant building land. The agent class preferences for lower and higher cell occupation densities are predefined through a certain density preference ratio.
Important for the initial local search inside a municipality are population density and distance to housing areas for households, and workplace density and distance to commercial areas for entrepreneurs. These layers can be imagined as elevation surfaces with ‘hills’ of higher density or greater distance and ‘valleys’ of low density or small distance, where the agents move along the ‘valleys’. The movement of the agents starting in open space is controlled by the distance to the nearest housing or commercial area. The agents follow the decreasing distance values in the cells through the cellular landscape to the outskirts of the next settlement. Inside the settlement the densities of the built-up area cells are examined to perform the further search. After detecting the cell with the lowest density, reaching the ‘basin-bottom’ inside the ‘density valley’ system, further alternatives within a neighbourhood are evaluated considering all attractiveness criteria through multi-criteria evaluation (cf. Jankowski, 1995). The weighted linear combination of all criteria allows ranking and selection of the optimal cell; the cell with the highest weighted attractiveness total is finally selected. (cf. Loibl, 2004).
3.4.3 Cell density, land-use and local attractiveness change
The successful agent locates and causes a density change: the household agent increases household density in the respective cell by 1 and the cell’s population density by the number of household members; the entrepreneur agent establishes a number of workplaces which increases workplace density in the respective cell. If the cell is unoccupied, the land-use class will be changed to residential, mixed built-up or industrial/commercial land use, depending on the acting agent class, current land use and zoning regulations. Some local attractiveness criteria (land use, density and built-up area distance) are modified steadily when the cells are occupied. As each agent’s action changes the local attractiveness, each agent influences the decision of future moving agents.
15. Simulation of polycentric urban growth dynamics through agents 13
If the search fails (e.g. because the densities in the neighbourhood exceed the density acceptance threshold for the particular agent), up to 10 additional search attempts are conducted, starting again from a new random cell inside the selected municipality. If the search remains unsuccessful, a different municipality is picked from the probability distribution and the agent’s search starts again.
A ‘common search memory’ allows simple communication between agents that have already moved and agents searching for a new location within the same municipality: new movers read the entry for their selected municipality on the memory board and search, in the first instance, near cells where the last movers have located successfully. This ‘communication’ leads to faster search cycles and to a less stochastic and thus less scattered pattern of newly occupied lots. After some 10 successful location actions within one municipality, the memory content for the respective municipality will be erased to avoid too much clustering.
4. RESULTS AND VALIDATION
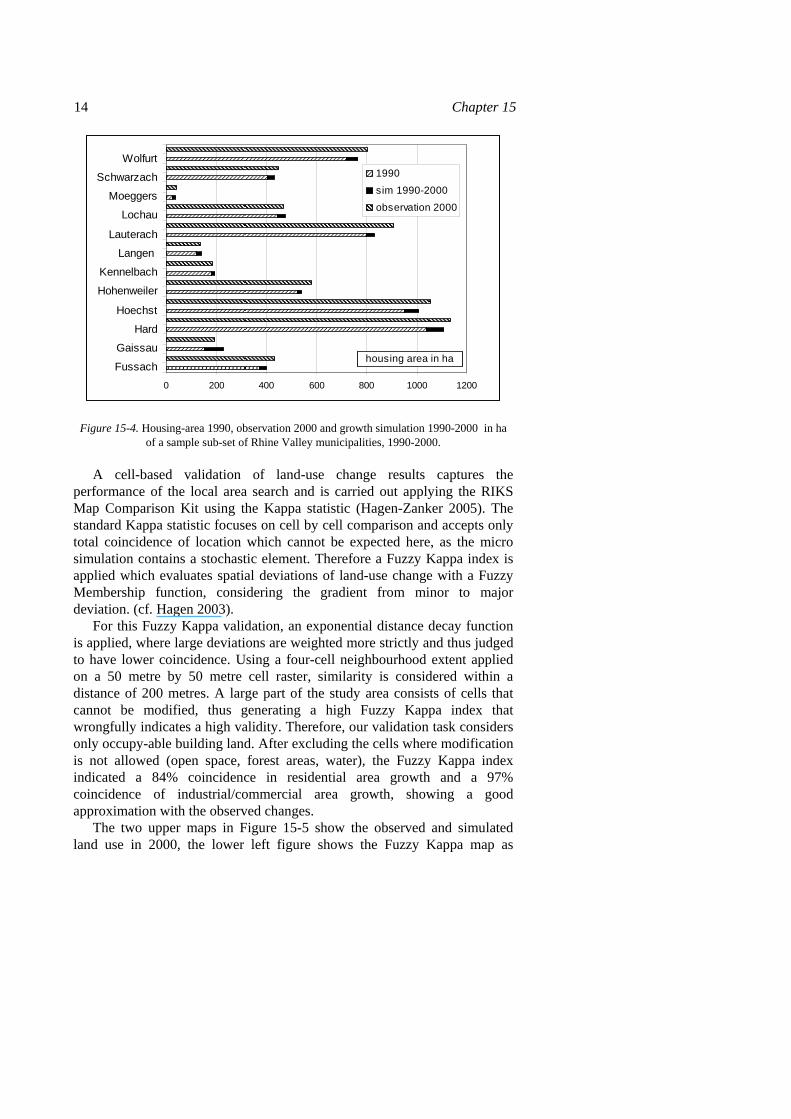
To describe the performance of the applied land-use model we carried out a validation on the results relating to municipality choice and local area search. Figure 15-4 allows comparing the modelled and the observed housing cell growth between 1990 and 2000 for a sample of the Rhine Valley municipalities.
The housing area in each municipality as observed in 1990 and 2000 is shown by hatched bars. The simulated housing area growth in the 1990-2000 period is presented by the black extension of the 1990-bar. The high coincidence of the length of the bars showing the simulated and observed housing area in 2000 indicate that the model is delivering valid results and conducting polycentric development with different settlement growth speeds. It is clear that the good match of simulation and observation owes much to the fact that the calibration and validation of the model are based on the same data and period. In calibrating the model we used regional macro-scale data to ‘tune’ the behaviour of the individual agents. The subsequent complex interactions of the individuals, also containing a stochastic element at the local scale, are however to some extent unpredictable. Capturing this part of the model performance, although not a validation in the strict sense, is considered interesting as it assesses the potential performance of the micro-simulation approach. This part of the validation, in our opinion proves that micro simulation is a suitable technique to model the land use related effects of complex choice behaviour of a large group of individuals.
14 Chapter 15
0 200 400 600 800 1000 1200
Fussach
Gaissau
Hard
Hoechst
Hohenweiler
Kennelbach
Langen
Lauterach
Lochau
Moeggers
Schwarzach
Wolfurt1990
sim 1990-2000
observation 2000
housing area in ha
Figure 15-4. Housing-area 1990, observation 2000 and growth simulation 1990-2000 in ha of a sample sub-set of Rhine Valley municipalities, 1990-2000.
A cell-based validation of land-use change results captures the performance of the local area search and is carried out applying the RIKS Map Comparison Kit using the Kappa statistic (Hagen-Zanker 2005). The standard Kappa statistic focuses on cell by cell comparison and accepts only total coincidence of location which cannot be expected here, as the micro simulation contains a stochastic element. Therefore a Fuzzy Kappa index is applied which evaluates spatial deviations of land-use change with a Fuzzy Membership function, considering the gradient from minor to major deviation. (cf. Hagen 2003).
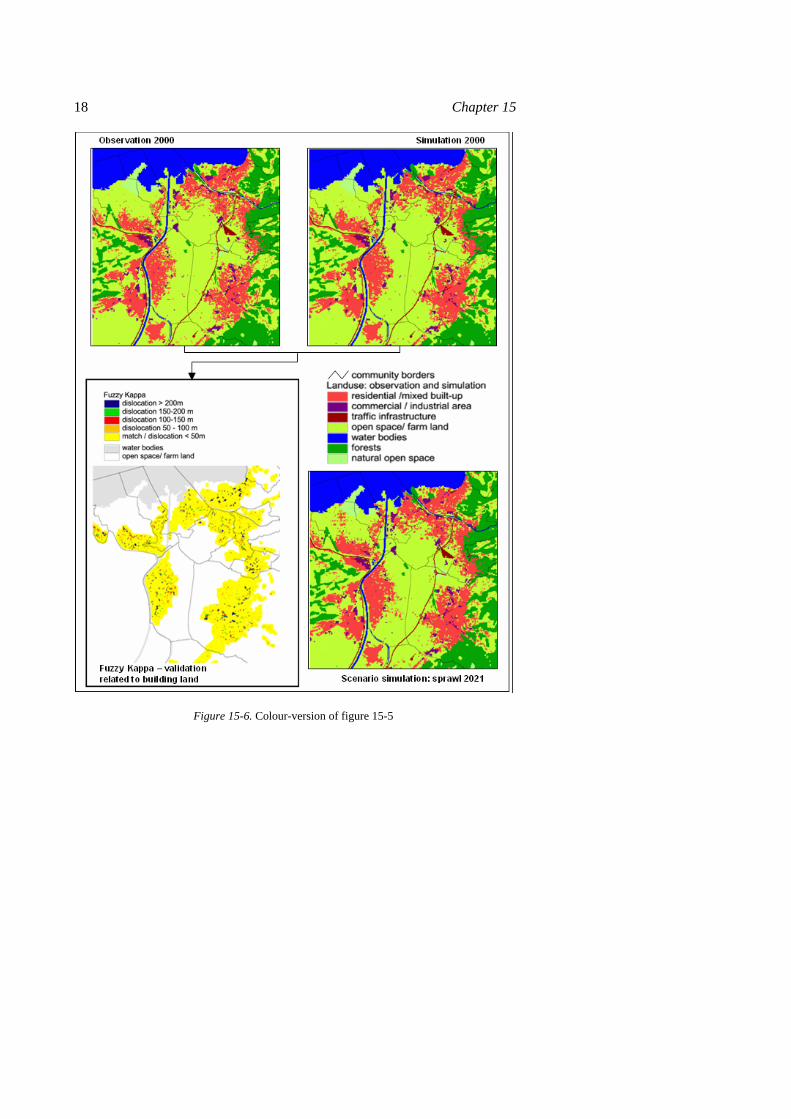
For this Fuzzy Kappa validation, an exponential distance decay function is applied, where large deviations are weighted more strictly and thus judged to have lower coincidence. Using a four-cell neighbourhood extent applied on a 50 metre by 50 metre cell raster, similarity is considered within a distance of 200 metres. A large part of the study area consists of cells that cannot be modified, thus generating a high Fuzzy Kappa index that wrongfully indicates a high validity. Therefore, our validation task considers only occupy-able building land. After excluding the cells where modification is not allowed (open space, forest areas, water), the Fuzzy Kappa index indicated a 84% coincidence in residential area growth and a 97% coincidence of industrial/commercial area growth, showing a good approximation with the observed changes.
The two upper maps in Figure 15-5 show the observed and simulated land use in 2000, the lower left figure shows the Fuzzy Kappa map as
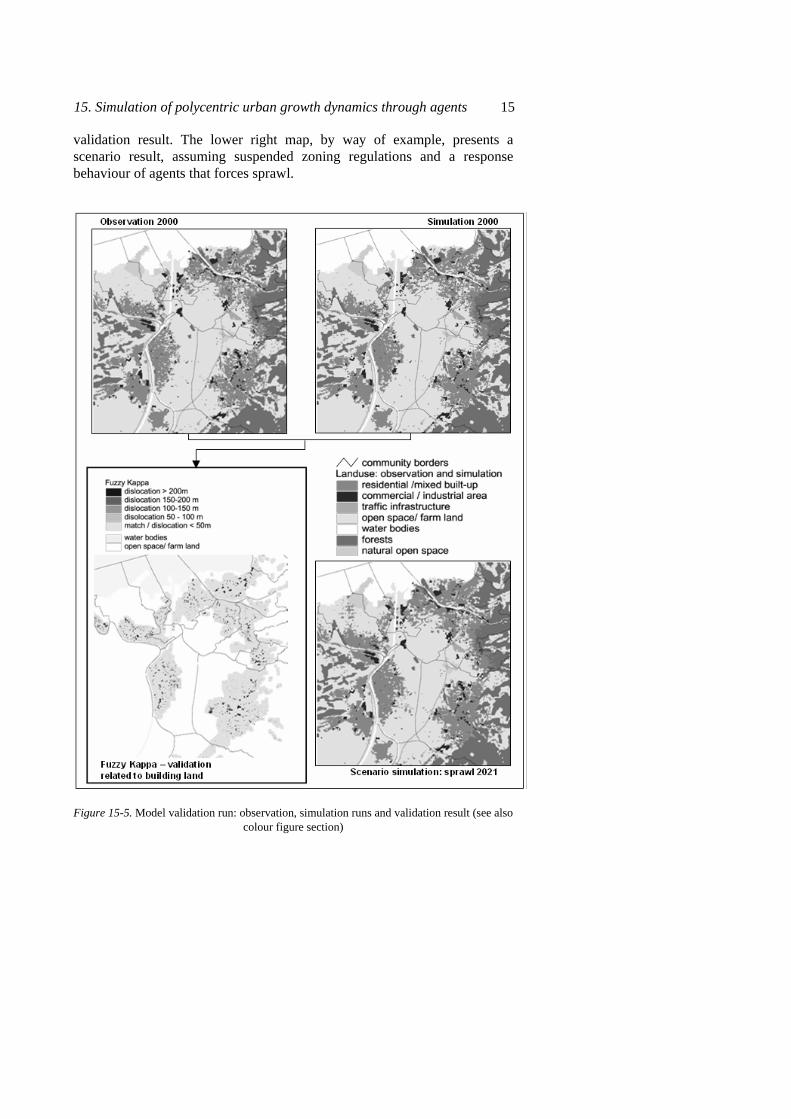
15. Simulation of polycentric urban growth dynamics through agents 15 validation result. The lower right map, by way of example, presents a scenario result, assuming suspended zoning regulations and a response behaviour of agents that forces sprawl.
Figure 15-5. Model validation run: observation, simulation runs and validation result (see also colour figure section)
16 Chapter 15 5. CONCLUSION
The applied micro-simulation approach shows a high spatial correspondence with the observed changes in the same period, for both municipality choice and local area search. The settlement growth patterns show very stable conditions during many, repeated model runs as they refer to the observed migration target municipality choice probabilities.
As the current model calibration forces stable results and a high local accuracy it is not easy to provide scenarios that deviate strongly from the current developments, which is an advantage as non-experienced users are not able to deliver odd results. Sensitivity analysis shows that only a strong modification of the probability distribution shape provokes clear changes in volume and speed of urban sprawl. As the model is developed to simulate the effects of population- and household growth following current socio-economic conditions, it has limited ability to incorporate scenarios with radical population changes, e.g. a population decline due to strong ageing. This would, however, call for model-modifications that can neither be calibrated nor validated from observed past developments..
To achieve accurate local results it is important to apply the appropriate attractiveness criteria to quantify the “true” migration behaviour characteristics at the local scale. Here further sensitivity analysis is necessary to adapt the weights and parameters in order to achieve proper results. Until now the goal was to apply variables and adapt the weights in a ways to meet the observed development pattern.
Further model-development is focussed on the inclusion of interactive control, for example aiming at: the modification of regional attractiveness criteria leading to a direct recalculation of the probability distributions and the introduction of specific spatial interventions (e.g. new roads or zoning plans) that affect local attractiveness.
ACKNOWLEDGEMENTS
The model application for the Rhine Valley test case has been conducted within the ‘geoland’ project, coordinated by Infoterra GmbH, Friedrichshafen, and Medias France, Toulouse, funded by the European Commission in the context of the GMES (Global Monitoring for Environment and Security) initiative of the 6th Framework Programme. Co-funding has been provided by the Austrian Research Centers, Vienna.
15. Simulation of polycentric urban growth dynamics through agents 17 REFERENCES
Batty, M., Besussi, E., Chin, N. (2003) Traffic, urban growth and suburban sprawl, CASA Working Paper Series No.70, Centre for Advanced Spatial Analysis,University College London. http://www.casa.ucl.ac.uk/working_papers/paper70.pdf.
Benenson, I. and Torrens, P.M. (2004) Geosimulation: Automata-based Modeling of Urban Phenomena, Wiley, Chichester.
Bogue, D. J. (1969) Principles of Demography, Springer, Berlin. Hagen, A. (2003) Fuzzy set approach to assessing similarity of categorical maps,
Iinternational Journal of Geographical Information Science, 17(3): 235–249. Hagen-Zanker, A. et al. (2005) Map Comparison Kit 2 RIKS BV - Research Institute for
Knowledge Systems, Maastricht. http://www.riks.nl/mck/. Jankowski P. (1995) Integrating geographical information systems and multiple criteria
decision making methods, International Journal of Geographical Information Science, 9(3): 251-273.
Loibl, W. and Kramar, H. (2001) Standortattraktivität und deren Einfluss auf Wanderung und Siedlungsentwicklung, in Strobl, J., Blaschke, T. and Griesebner G. (eds) Angewandte Geographische Informationsverarbeitung XIII, Wichmann Verlag, Heidelberg, pp. 309-315.
Loibl, W. and Tötzer, T. (2003) Modeling growth and densification processes in suburban regions – simulation of landscape transition with spatial agents, Environmental Modelling and Software, 18 (6): 485-593.
Loibl, W. (2004) Simulating suburban migration: moving households, social characteristics and driving forces on migration behaviour, in Feichtinger G. (ed.) Vienna Year of Population Research 2004, Austrian Academy of Sciences Press, Wien, pp. 201-223.
Portugali, J. (2000) Self Organization and the City, Springer, Berlin. Torrens, P.M. (2001) Can Geocomputation Save Urban Simulation? Throw some agents into
the mixer, simmer and wait ..., CASA Working Paper Series No.32, Centre for Advanced Spatial Analysis, University College London. http://www.casa.ucl.ac.uk/ working_papers/paper32.pdf.
Wegener, M. and Spiekermann K. (1997) The potential of micro-simulation for urban modelling, in Proceedings of the International Workshop on Application of Computers in Urban Planning, Kobe University, Kobe, Japan, pp.129-143.
18 Chapter 15
Figure 15-6. Colour-version of figure 15-5