
Simulation of multimodal vibration damping of a plate structure using a modal SSDI-Max technique
16
http://jim.sagepub.com/ Structures Journal of Intelligent Material Systems and http://jim.sagepub.com/content/early/2012/03/02/1045389X12437891 The online version of this article can be found at: DOI: 10.1177/1045389X12437891 published online 4 March 2012 Journal of Intelligent Material Systems and Structures Aïda Chérif, Claude Richard, Daniel Guyomar, Saâd Belkhiat and Mounir Meddad Simulation of multimodal vibration damping of a plate structure using a modal SSDI-Max technique Published by: http://www.sagepublications.com can be found at: Journal of Intelligent Material Systems and Structures Additional services and information for http://jim.sagepub.com/cgi/alerts Email Alerts: http://jim.sagepub.com/subscriptions Subscriptions: http://www.sagepub.com/journalsReprints.nav Reprints: http://www.sagepub.com/journalsPermissions.nav Permissions: What is This? - Mar 4, 2012 OnlineFirst Version of Record >> by AIDA CHERIF on March 7, 2012 jim.sagepub.com Downloaded from
-
Upload
independent -
Category
Documents
-
view
6 -
download
0
Transcript of Simulation of multimodal vibration damping of a plate structure using a modal SSDI-Max technique

http://jim.sagepub.com/Structures
Journal of Intelligent Material Systems and
http://jim.sagepub.com/content/early/2012/03/02/1045389X12437891The online version of this article can be found at:
DOI: 10.1177/1045389X12437891
published online 4 March 2012Journal of Intelligent Material Systems and StructuresAïda Chérif, Claude Richard, Daniel Guyomar, Saâd Belkhiat and Mounir Meddad
Simulation of multimodal vibration damping of a plate structure using a modal SSDI-Max technique
Published by:
http://www.sagepublications.com
can be found at:Journal of Intelligent Material Systems and StructuresAdditional services and information for
http://jim.sagepub.com/cgi/alertsEmail Alerts:
http://jim.sagepub.com/subscriptionsSubscriptions:
http://www.sagepub.com/journalsReprints.navReprints:
http://www.sagepub.com/journalsPermissions.navPermissions:
What is This?
- Mar 4, 2012OnlineFirst Version of Record >>
by AIDA CHERIF on March 7, 2012jim.sagepub.comDownloaded from
Article
Journal of Intelligent Material Systemsand Structures0(0) 1–15� The Author(s) 2012Reprints and permissions:sagepub.co.uk/journalsPermissions.navDOI: 10.1177/1045389X12437891jim.sagepub.com
Simulation of multimodal vibrationdamping of a plate structure using amodal SSDI-Max technique
Aıda Cherif1,2, Claude Richard1, Daniel Guyomar1, Saad Belkhiat2 andMounir Meddad1,2
AbstractModal synchronized switch damping on inductor control is a vibration damping technique that combines the advantagesof both semiactive and active control techniques based on a modal strategy. This method allows targeting any unwantedvibration mode of a structure while using a semiactive autonomous synchronized switch damping on inductor dampingtechnique. This article presents a performance analysis of an improved modal synchronized switch damping on inductorapproach called ‘‘SSDI-Max.’’ The particularity of this new approach is to maximize the self-generated voltage amplitude bya proper definition of the switch instants (voltage inversion) according to the chosen targeted mode. Following the basicmodal synchronized switch damping on inductor technique, the switch is synchronized with the chosen modal coordinateextremum. In the investigated approach, the voltage is increased by waiting for the next voltage extremum followingimmediately any targeted modal coordinate extremum in a given time window. This article presents simulations per-formed on a model representative of a clamped plate. The damping results are given in the case of multimodal, pulse, ornoise excitations. This article analyzes the performance of the observer used to focus on a given mode and the influenceof the control time window on the damping performance of the system. The results show that substantial dampingincrease can be obtained with a very slight modification of the control architecture and the same control energy.
KeywordsPiezoelectric, smart structures, modal control, semiactive control, SSDI-Max, modal observer
Introduction
Vibration control is a real scientific and technologicalchallenge in a growing number of areas such as auto-motive, construction, aerospace, and instrumentation.In recent years, several studies have shown the interestof vibration damping techniques using piezoelectricmaterials in these application fields. The main advan-tages of these materials are their solid-state character,ability to operate as actuator or sensor, and low profilewhen used as plane patches embedded on plane or platestructures. Another advantage is the simplicity of theiractivation which consists only in the control of the elec-tric field. The main drawback is the relative weaknessof the attainable coupling coefficient in the case of freeboundary configurations.
Three types of vibration control using piezoelectricinserts are pointed out in the literature:
1. The passive techniques (Eielsen and Fleming,2010; Forward, 1979; Hagood and Von Flotow,1991) consist of connecting a passive electrical
network (usually an inductive network) to thepiezoelectric insert(s). The effect of this networkis to set up an electromechanical resonance filterallowing energy dissipation for a given frequencyor frequency band; usually this filter has to betuned to an unwanted resonance frequency. Inthese passive systems, there is neither externalactivation energy nor control energy. It shouldbe mentioned that however simple in the princi-ple, these techniques can be difficult to imple-ment: attainable trade-off between performanceand bandwidth or feasibility of the requiredinductor are the usual drawbacks (Wu andBicos, 1997).
1LGEF – INSA-Lyon – Universite de Lyon, INSA-Lyon, Villeurbanne,
France2DAC HR Laboratory, Ferhat Abbas University, Setif, Algeria
Corresponding author:
Aıda Cherif, LGEF, INSA-Lyon, Universite de Lyon, Villeurbanne, F69621,
France.
Email: [email protected]
by AIDA CHERIF on March 7, 2012jim.sagepub.comDownloaded from

2. The active techniques (Fuller and Jones, 1987;Meyer and Collet, 2011; Preumont et al., 2002;Snyder and Hansen, 1991) consist of a controlsystem with actuators supplied by a controlledelectric field usually generated by an amplifierdriven by a feedback loop using sensors andaccording to a given control theory approach. Itis a very powerful and global technique allowinga diversity of strategies. In these techniques,there is an external source supplying both thecontrol energy for the control loop circuitry andthe operative energy delivered by the poweramplifier.
3. Semiactive techniques (Clark, 2000; Cunefare andHoldhusen, 2004; Niederberger et al., 2004; Petitet al., 2004; Richard et al., 2000) are techniquesusing no external operative energy. They rely onswitches allowing management of the piezoele-ment electrostatic energy and/or electric bound-ary conditions. The control switching sequence isdefined following a strategy implemented by acontrol circuitry externally supplied.
Among these vibration damping techniques are syn-chronized switch damping (SSD) techniques originallydeveloped by Richard and Guyomar. The overall prin-ciple is to introduce, using a proper switching sequence,strong nonlinearities in the voltage generated by thepiezoelectric inserts, which have the effect of modifyingsignificantly the voltage amplitude and phase, resultingin increased dissipation and mode damping. They areclassified as semiactive because they require no or verylittle external energy source but nevertheless performsmart processing of the voltage. Among these methods,synchronized switch damping on inductor (SSDI) con-sists in inverting the piezovoltage each time it reachesan extremum. The voltage inversion is implemented bya brief oscillating discharge controlled by an electronicswitch. This method is not readily suitable for broad-band excitations, which are, however, the most com-mon case in industrial applications. Vibration reductionmust involve several resonances or a given targetedmode in a broadband vibration spectrum. The difficultyin this case is to have a significant voltage developingwith the proper phase. Many attempts were made toaddress this problem. A probabilistic approach fordetermining the optimal switching times have beendeveloped (Guyomar and Badel, 2006), which maxi-mizes the energy dissipation and generates a dampingeffect on several modes. According to this method, thevoltage is inverted only when it exceeds a significant butstatistically probable value Vmin. For this purpose, thesensor voltage is observed for a certain time span, withthe assumption that the voltage distribution function iseither invariant or varying slowly over the time.
Another way to address the multimodal problem isthe so-called modal SSDI control developed by Harari
et al. (2009). The principle is to combine the advantagesof both the active control techniques and the semiactiveSSD damping. Relying on a modal model of the struc-ture, this method allows controlling a given targetedmode. The principle is to shape the piezoelement vol-tage nearly out of phase with the targeted modal speed.To do so, the technique relies on a modal filter allowingthe computation of the modal coordinates of thevibrating structure and on an SSDI switch device syn-chronized with the extremum of the targeted modalcoordinate.
However, it was also noted that the damping perfor-mance is still a function of the piezoelement voltage, andin the case where the targeted mode amplitude is lowerthan the nontargeted ones, the damping obtained maybe low due to the fact that the voltage is not optimal. Toincrease the performance of the technique, it is necessaryto increase as much as possible the self-generated piezoe-lement voltage. An improvement of the modal SSDIcontrol was proposed by Richard et al. (2009); the pur-pose of this latter technique called ‘‘SSDI-Max’’ is to usepart of the energy of the nontargeted mode to improvethe piezoelement voltage. The inversion is scheduled atthe maxima of the target modal coordinate, unless thevoltage varies with the corresponding slope at thatmoment. In this case, switching occurs at the subsequentlocal extremum of the piezoelectric element voltage sig-nal. This technique has been further implemented in thestudy by Neubauer et al. (2011), where a novel switchinglaw for bimodal vibrations is presented using a modalobserver. An enhanced voltage synchronous with thefirst mode is generated using the vibration energy of thesecond mode.
In any kind of control using piezoelectric elements,the drive energy corresponding to the electrostaticenergy is the so-called operative energy. The exchangerate of this operative energy is mainly reactive electricalpower and is the operative power. In active controltechniques (force feedback, stiffness control, etc.), high-voltage amplifiers or power amplifiers are used to con-trol adequately this power. A control architecture hasto be implemented for a proper tuning of this powerflow according to a given strategy. The particularity ofthe proposed semiactive technique is that this operativeenergy is generated from the structure itself and con-trolled using a simple switch sequence. Now, even ifthey increase the level of complexity, the control toolsderived from active control strategies can be efficientlyimplemented to enhance the switch sequence for a bet-ter use of the global energy of the structure by eitherfocusing this energy on a specific mode or improvingthe extracted energy. The objective of this study is toapproach performances that are classically achievableby active techniques, without the use of external opera-tive power. Moreover, it was shown that this approachis inherently stable and robust (Harari et al., 2009)since no energy is input in the controlled structure.
2 Journal of Intelligent Material Systems and Structures 0(0)
by AIDA CHERIF on March 7, 2012jim.sagepub.comDownloaded from
This article presents an analysis of the performanceof the SSDI-Max damping technique with a plate struc-ture. It relies on simulations, made with the MATLAB–Simulink� environment, using a realistic model of aplate structure previously identified. For this structure,the piezoelement coupling coefficient is not optimal andvery representative of a real-target application struc-ture. Moreover, compared to the beam case, the modefrequencies are rather close to each other. The proposedmethod aims at maximizing the amplitude of the piezo-electric actuator by the definition of an optimal switch-ing time according to the targeted mode chosen. Amodal filter is set up using a modal observer in order todefine accurately the time where the chosen modalcoordinate is maximum. Starting at this time, an algo-rithm is implemented to wait for the next voltage extre-mum within a given time window.
The smart-structure modeling along with the platestructure investigated is first described. Then the defini-tion and the setup of the modal observer are examined.In particular, the sensitivity of the observer to the pre-cision of the structure modal identification is quantifiedin the case of the considered clamped plate. The SSDI-Max strategy is then exposed. The performances of theSSDI-Max method for the control of single or multiplemodes of the structure are described in the case of sinu-soidal, pulse, and white noise excitations. Finally, theinfluence of the delay time window used is describedagain for various types of excitations.
Smart-structure definition
Smart-structure modeling
The aim of the method presented here is to control astructure submitted to a broadband excitation with aminimum of actuators and sensors. Its principle isbased on modal control, and the type of control chosento eliminate operative power energy and amplifier isSSDI control. The control of energy quantity due toonly the kinetic energy of the structure is often limited,particularly in the field of transportation structures.Modal control makes it possible to concentrate thisenergy on targeted mode in order to increase modaldamping. So, a modal modeling of the smart structureis thus necessary.
The electromechanical behavior equations of a smartstructure using usual assumption are as follows (Harariet al., 2009)
m€d + c _d + kE d = � aV + bF ð1Þ
I = a _d� C0_V ð2Þ
With d the nodal displacement vector, m, c, and kE
are the mass, damping, and stiffness matrices, respec-tively, when the piezoelectric patches are in short cir-cuit, a is the electromechanical coupling matrix, V is
voltage vector of the i piezoelectric patches, I is the elec-tric current vector, and C0 is the diagonal capacitancematrix. F is the force applied to the system.
Using the following variable change where f is themode shape matrix limited to n modes and q the modaldisplacement vector:
d = fq ð3Þ
The equations (1) and (2) can be well represented bythe projection in the modal basis by
M€q + C _q + KE q = � uV + bF ð4Þ
I = ut _q� C0_V ð5Þ
where u is the modal electromechanical coupling matrixwith a [n,i] matrix size. u is defined as follows
u = fta ð6Þ
where M, C, and KE are the mass, damping, and stiff-ness modal matrices, respectively. The structure isassumed to be lightly damped, with proportional damp-ing and decoupled modes. Equation (4) is normalized inorder to have the modal mass matrix equal to identity.The modal matrices can therefore be written as a func-tion of j the modal damping vector, vE the short-circuitfrequency vector, and vD the open circuit frequencyvector as follows
M = Id ; C = 2 diag jð Þ diag vD� �
; KE = diag vE
� �2� �
ð7Þ
By separating the actuators and sensor voltages,namely, Va and Vs, respectively, equation (4) becomes
M€q + C _q + KE q = � ua Va� us Vs + bF ð8Þ
In an open circuit or when the sensor voltage is mon-itored with a voltage amplifier, sensor intensity is null,therefore
utsq� C0s Vs = 0 ð9Þ
And by reintroducing equation (9) in equation (8)
M€q + C _q + KE + us C0sð Þ�1
uts
� �q = � ua Va + bF ð10Þ
Linear systems (10) and (9) can be written in modalstate under form
_x = Ax + Bu
y = Cx
�x =
q
_q
� �ð11Þ
With x being the state vector, u = F, Va½ � is the con-trol vector, y = q, _q, Vs½ � is the output vector, and A, B,and C are the state matrices
Cherif et al. 3
by AIDA CHERIF on March 7, 2012jim.sagepub.comDownloaded from

A =0 Id
�M�1 KE + us C�10s ut
s
� ��M�1 C
� �,
B =0
+ M�1b �M�1ua
� �, C =
Id 0
0 Id
C�10s ut
s 0
0@
1A ð12Þ
Va is calculated by the following relation:
Va = C�10a ut
a q ð13Þ
C0a is the capacity of actuator, and the matrix C0s iscapacity sensors.
Smart-structure definition
The structure that will be used in the following simula-tions and analyses is a clamped steel plate equippedwith four P188 piezoelectric inserts. Its dimensions andphysical properties are given in Tables 1 and 2. Thisplate is clamped on all four sides. Figure 1 illustratesthis plate, which is a representative of a protectivepanel. This structure has been identified according tothe previously described model. The measurement pro-cess and parameter identification are described in thestudy by Richard (2007).
Table 3 summarizes the frequencies of the fourmodes considered in the model. Due to the position ofthe various piezoelectric patches, and according to sym-metry conditions, only the symmetric modes are effi-ciently electromechanically coupled. As a result, on thelowest part of the frequency spectrum, only a fewmodes are significantly coupled, which means that theycan be targeted effectively by the proposed control ifthe patches are used as actuators, and it also means that only these modes can produce a significant
response if the patches are used as sensors. It is thesemodes that are taken into account by the model used inthe simulations.
SSDI-Max control
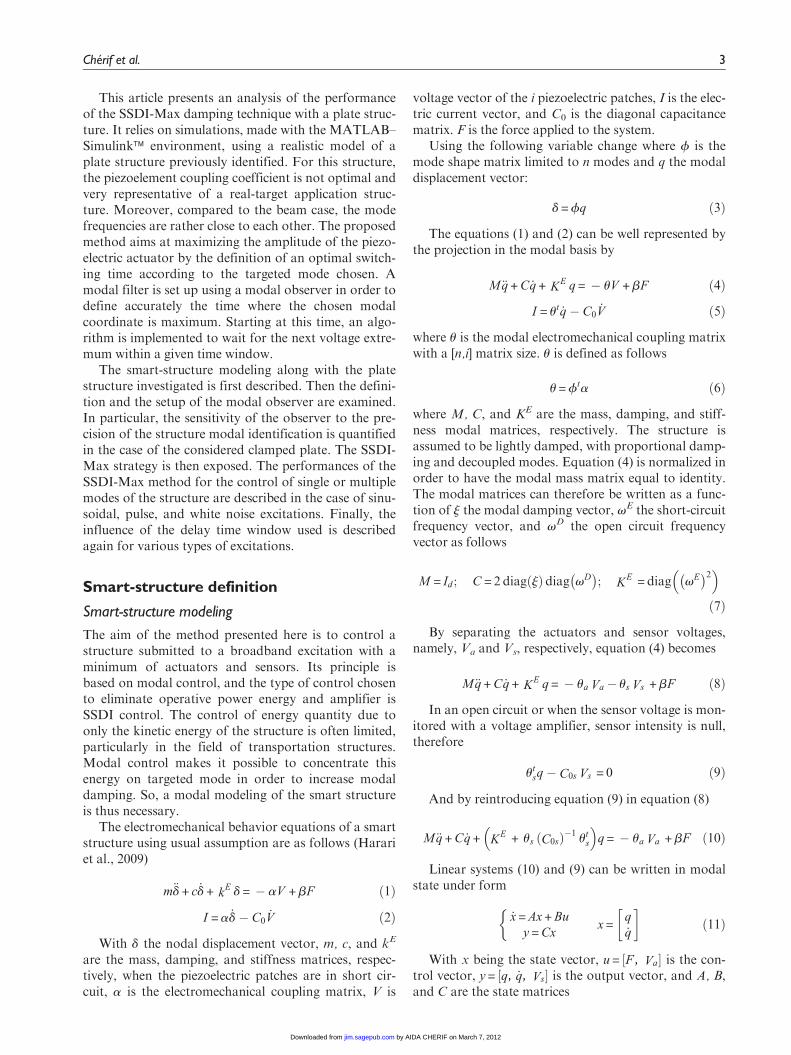
The proposed control is based on the SSDI techniquethat is fully described in the study by Harari et al.(2009). The principle can be easily recalled in the caseof a sinusoidal excitation corresponding to a resonantfrequency of the structure. The piezoelectric patch isconnected to an electrical circuit consisted of a switchand an inductance L in series (Figure 2(a)). The switchis almost always open, and the voltage and strain varyproportionally during this step. When a voltage extre-mum occurs, the switch is closed, until the voltage onthe piezoelectric element has been reversed (Figure2(b)). The inversion is possible, thanks to the capaci-tance C0 of the piezoelectric patch and the inductance,which constitutes an oscillator network. The inversiontime corresponds to a half-period of the oscillating cir-cuit zoom in (Figure 2(c)). The voltage inversion is notperfect because a part of the energy stored in the
Figure 1. Protective panel structure used in the simulations.The plate is clamped on all four sides. Each four piezoelectricelements are 12 cm 3 4 cm and 600 mm thick.
Table 2. Characteristics of PZT P189 piezoelectric inserts.
Properties Symbol Value
Density r 7650 Kg�m3
Compliances short-circuit sE11 10.66 3 10212 Pa21
sE12 23.34 3 10212 Pa21
sE13 24.52 3 10212 Pa21
sE33 13.25 3 10212 Pa21
Permittivity eT33 10.17 nF�m21
Piezoelectric coefficient d13 2108 pC�N21
Source: Richard (2007).
Table 3. Frequencies of the four simulated modes of the plateembedded.
Modes Frequency (Hz)
1 962 1753 2044 228
Source: Richard (2007).
Table 1. Characteristics of the plate.
Length 0.6 mWidth 0.4 mThickness 1 mmYoung modulus 210 GPaPoisson ratio 0.345Density 7500 Kg/m3
Source: Richard (2007).
4 Journal of Intelligent Material Systems and Structures 0(0)
by AIDA CHERIF on March 7, 2012jim.sagepub.comDownloaded from
piezoelectric element capacitance is lost mainly in theinductance.
The voltage inversion imperfection is due to losses inthe inversion network, the reversed voltage Vafter islower than the voltage prior the inversion Vprior. Aninversion factor g is defined as
Vafter = � gVprior ð14Þ
This g coefficient is related to the electrical qualityfactor of the (L, C0) oscillating network.
Modal SSDI control
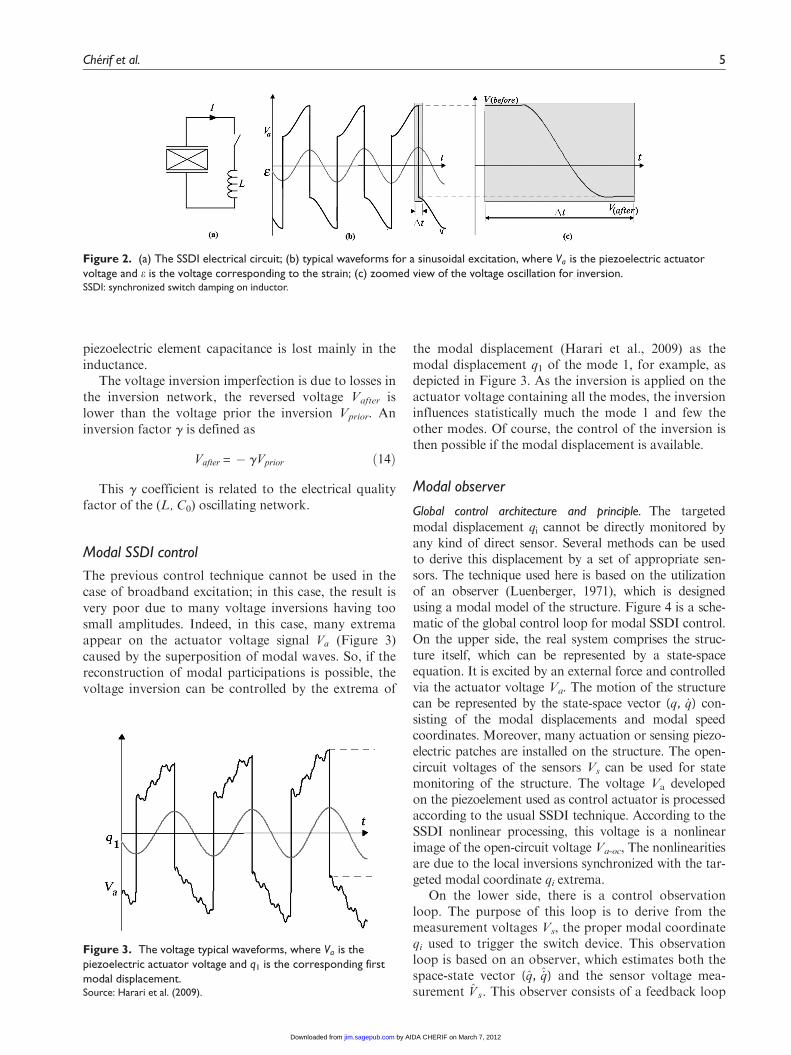
The previous control technique cannot be used in thecase of broadband excitation; in this case, the result isvery poor due to many voltage inversions having toosmall amplitudes. Indeed, in this case, many extremaappear on the actuator voltage signal Va (Figure 3)caused by the superposition of modal waves. So, if thereconstruction of modal participations is possible, thevoltage inversion can be controlled by the extrema of
the modal displacement (Harari et al., 2009) as themodal displacement q1 of the mode 1, for example, asdepicted in Figure 3. As the inversion is applied on theactuator voltage containing all the modes, the inversioninfluences statistically much the mode 1 and few theother modes. Of course, the control of the inversion isthen possible if the modal displacement is available.
Modal observer
Global control architecture and principle. The targetedmodal displacement qi cannot be directly monitored byany kind of direct sensor. Several methods can be usedto derive this displacement by a set of appropriate sen-sors. The technique used here is based on the utilizationof an observer (Luenberger, 1971), which is designedusing a modal model of the structure. Figure 4 is a sche-matic of the global control loop for modal SSDI control.On the upper side, the real system comprises the struc-ture itself, which can be represented by a state-spaceequation. It is excited by an external force and controlledvia the actuator voltage Va. The motion of the structurecan be represented by the state-space vector (q, _q) con-sisting of the modal displacements and modal speedcoordinates. Moreover, many actuation or sensing piezo-electric patches are installed on the structure. The open-circuit voltages of the sensors Vs can be used for statemonitoring of the structure. The voltage Va developedon the piezoelement used as control actuator is processedaccording to the usual SSDI technique. According to theSSDI nonlinear processing, this voltage is a nonlinearimage of the open-circuit voltage Va-oc, The nonlinearitiesare due to the local inversions synchronized with the tar-geted modal coordinate qi extrema.
On the lower side, there is a control observationloop. The purpose of this loop is to derive from themeasurement voltages Vs, the proper modal coordinateqi used to trigger the switch device. This observationloop is based on an observer, which estimates both thespace-state vector (q, _q) and the sensor voltage mea-surement V s. This observer consists of a feedback loop
Figure 2. (a) The SSDI electrical circuit; (b) typical waveforms for a sinusoidal excitation, where Va is the piezoelectric actuatorvoltage and e is the voltage corresponding to the strain; (c) zoomed view of the voltage oscillation for inversion.SSDI: synchronized switch damping on inductor.
Figure 3. The voltage typical waveforms, where Va is thepiezoelectric actuator voltage and q1 is the corresponding firstmodal displacement.Source: Harari et al. (2009).
Cherif et al. 5
by AIDA CHERIF on March 7, 2012jim.sagepub.comDownloaded from
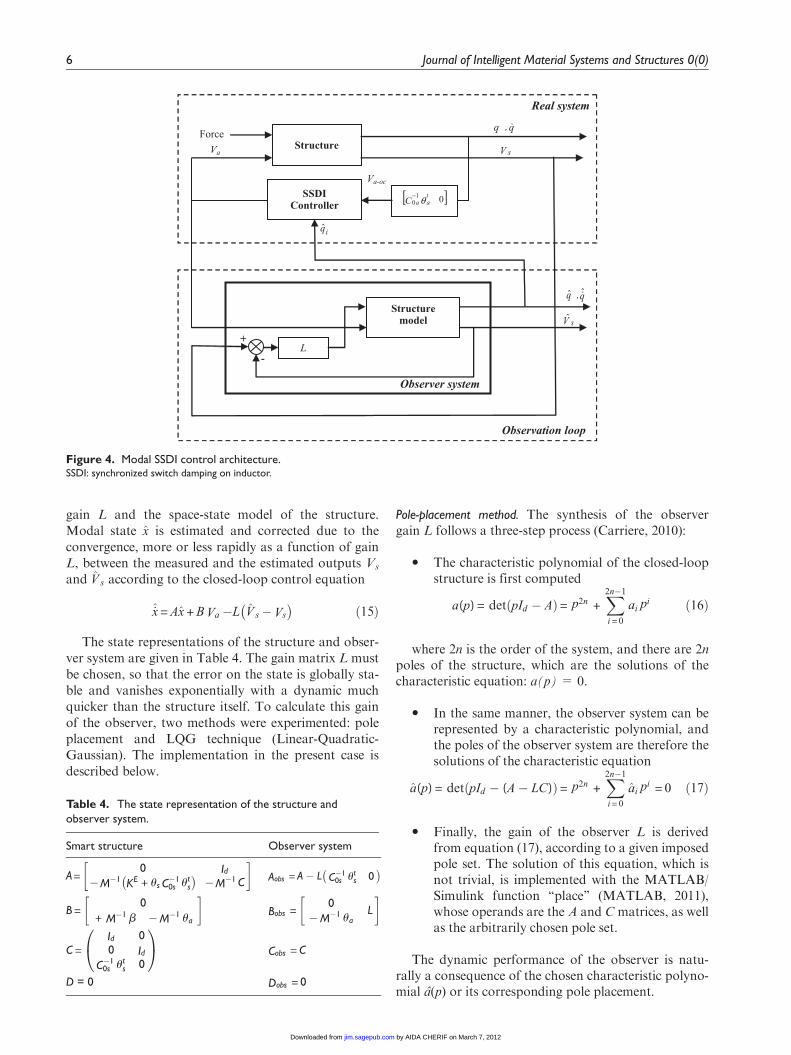
gain L and the space-state model of the structure.Modal state x is estimated and corrected due to theconvergence, more or less rapidly as a function of gainL, between the measured and the estimated outputs Vs
and V s according to the closed-loop control equation
_x = Ax + B Va�L V s�Vs
� �ð15Þ
The state representations of the structure and obser-ver system are given in Table 4. The gain matrix L mustbe chosen, so that the error on the state is globally sta-ble and vanishes exponentially with a dynamic muchquicker than the structure itself. To calculate this gainof the observer, two methods were experimented: poleplacement and LQG technique (Linear-Quadratic-Gaussian). The implementation in the present case isdescribed below.
Pole-placement method. The synthesis of the observergain L follows a three-step process (Carriere, 2010):
� The characteristic polynomial of the closed-loopstructure is first computed
a(p) = det pId � Að Þ= p2n +X2n�1
i = 0
ai pi ð16Þ
where 2n is the order of the system, and there are 2npoles of the structure, which are the solutions of thecharacteristic equation: a(p) = 0.
� In the same manner, the observer system can berepresented by a characteristic polynomial, andthe poles of the observer system are therefore thesolutions of the characteristic equation
a(p) = det pId � (A� LC)ð Þ= p2n +X2n�1
i = 0
ai pi = 0 ð17Þ
� Finally, the gain of the observer L is derivedfrom equation (17), according to a given imposedpole set. The solution of this equation, which isnot trivial, is implemented with the MATLAB/Simulink function ‘‘place’’ (MATLAB, 2011),whose operands are the A and Cmatrices, as wellas the arbitrarily chosen pole set.
The dynamic performance of the observer is natu-rally a consequence of the chosen characteristic polyno-mial a(p) or its corresponding pole placement.
qiˆ
Structure
SSDI Controller
Va V s
Va-oc
q,q &
Real system
Structuremodel
Observer system
q,q ˆˆ &
[ ]010 θ taaC−
V sˆ
L+
-
Observation loop
qiˆ
Force
Figure 4. Modal SSDI control architecture.SSDI: synchronized switch damping on inductor.
Table 4. The state representation of the structure andobserver system.
Smart structure Observer system
A=0 Id
�M�1 KE + us C�10s ut
s
� ��M�1 C
� �Aobs = A� L C�1
0s uts 0
� �
B =0
+ M�1 b �M�1 ua
� �Bobs =
0�M�1 ua
L
� �
C =Id 00 Id
C�10s ut
s 0
0@
1A Cobs = C
D = 0 Dobs = 0
6 Journal of Intelligent Material Systems and Structures 0(0)
by AIDA CHERIF on March 7, 2012jim.sagepub.comDownloaded from
In order to ensure a good decoupling between thecontrolled system and the observer, the closed-loopobserver system poles must be chosen in order to resultin a much faster response than the system. In the imple-mented case, the observer poles are chosen five timesgreater than the system poles, in order to allow theobserver to converge five times faster than the system.
But this approach neglects the effect of uncertaintyon the model and the presence of noise. It could quicklybecome unstable.
LQG method. The LQG regulator consists of an optimalstate-feedback controller and a Kalman state estimator.This enables to specify and define the trade-off betweenregulation performance and control effort while takinginto account both the system disturbance and the mea-surement noises (Franklin, 1990).
Given the continuous state equation of the system
_x = Ax + Bu + Hw
y = Cx + vð18Þ
where w and v stand for the disturbance and the mea-surement noises, respectively.
These noises w(t) and v(t) are zero-mean Gaussiannoise with uniform power spectrum defined as
Sw (v) = QN ; Sv (v) = RN
As the noises are supposed to be uncorrelated, thecross-correlation power spectrum Sw, v (v) = NN = 0.
The estimation error e can be defined by the stateequation:
_e = A� LCð Þe + Hw� Lv ð19Þ
Defining the optimal LQG response consists of find-ing the matrix gain L that minimizes the asymptoticexpected value of the estimation error JLQG
JLQG = limt!‘
E e(t)k k2j k
ð20Þ
This gain L is defined by
L = PCT R�1N ð21Þ
where P is the unique positive-definite solution to thefollowing Algebraic Riccati Equation:
AP + PAT + H QN HT � PCT R�1N CP = 0 ð22Þ
The observer gain L has been practically computedfollowing this general LQG approach by using the‘‘Kalman’’ function in the MATLAB/Simulink envi-ronment (MATLAB, 2011). The operands of this func-tion are the system definition and the noise covariancedata.
In the implemented case, the system is defined by thematrices given in Table 4, and H is set to a null matrix.Various choices of RN, QN, and NN are possible. Forsake of simplicity, NN was set to a null matrix (uncorre-lated noises), whereas QN and RN have been definedfollowing a trial-and-error process to ensure properconvergence.
According to this method, the noise matrices usedare
QN = Id , and RN = 0:000013 Id
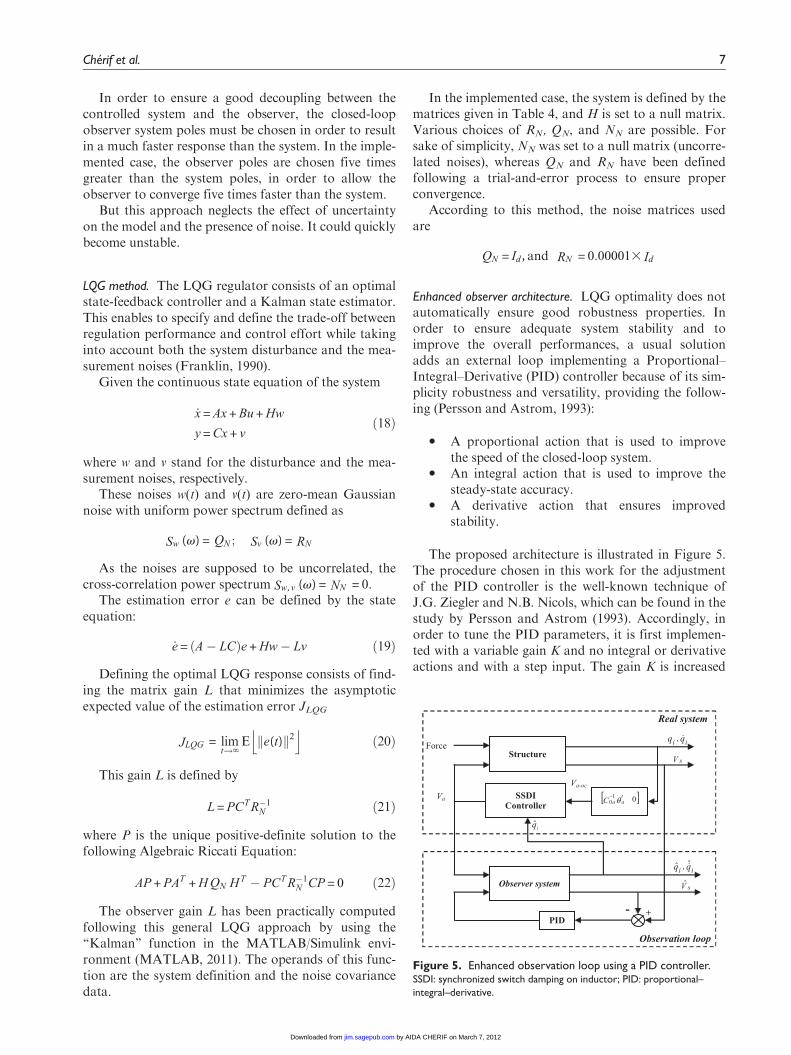
Enhanced observer architecture. LQG optimality does notautomatically ensure good robustness properties. Inorder to ensure adequate system stability and toimprove the overall performances, a usual solutionadds an external loop implementing a Proportional–Integral–Derivative (PID) controller because of its sim-plicity robustness and versatility, providing the follow-ing (Persson and Astrom, 1993):
� A proportional action that is used to improvethe speed of the closed-loop system.
� An integral action that is used to improve thesteady-state accuracy.
� A derivative action that ensures improvedstability.
The proposed architecture is illustrated in Figure 5.The procedure chosen in this work for the adjustmentof the PID controller is the well-known technique ofJ.G. Ziegler and N.B. Nicols, which can be found in thestudy by Persson and Astrom (1993). Accordingly, inorder to tune the PID parameters, it is first implemen-ted with a variable gain K and no integral or derivativeactions and with a step input. The gain K is increased
StructureForce
SSDI Controller
Va
V s
Va-oc
q,q ii &
Real system
Observer system
Observation loop
q,q iiˆˆ &
[ ]010 θ taaC−
V sˆ
PID- +
qiˆ
Figure 5. Enhanced observation loop using a PID controller.SSDI: synchronized switch damping on inductor; PID: proportional–
integral–derivative.
Cherif et al. 7
by AIDA CHERIF on March 7, 2012jim.sagepub.comDownloaded from
up to a gain Ku, which induces an oscillating responsewith a period Tu. The PID corrector is then tuned withthe following parameters:
� Kp = 0.6Ku
� Ti = 0.5Tu
� Td = 0.125Tu
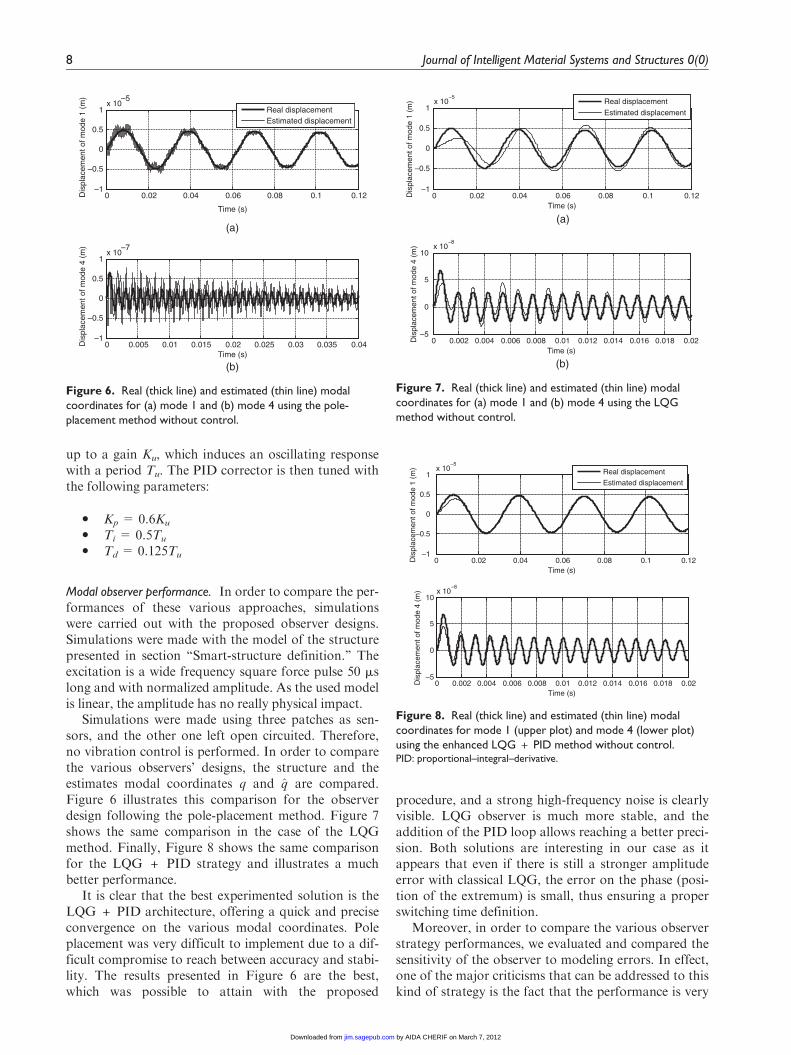
Modal observer performance. In order to compare the per-formances of these various approaches, simulationswere carried out with the proposed observer designs.Simulations were made with the model of the structurepresented in section ‘‘Smart-structure definition.’’ Theexcitation is a wide frequency square force pulse 50 mslong and with normalized amplitude. As the used modelis linear, the amplitude has no really physical impact.
Simulations were made using three patches as sen-sors, and the other one left open circuited. Therefore,no vibration control is performed. In order to comparethe various observers’ designs, the structure and theestimates modal coordinates q and q are compared.Figure 6 illustrates this comparison for the observerdesign following the pole-placement method. Figure 7shows the same comparison in the case of the LQGmethod. Finally, Figure 8 shows the same comparisonfor the LQG + PID strategy and illustrates a muchbetter performance.
It is clear that the best experimented solution is theLQG + PID architecture, offering a quick and preciseconvergence on the various modal coordinates. Poleplacement was very difficult to implement due to a dif-ficult compromise to reach between accuracy and stabi-lity. The results presented in Figure 6 are the best,which was possible to attain with the proposed
procedure, and a strong high-frequency noise is clearlyvisible. LQG observer is much more stable, and theaddition of the PID loop allows reaching a better preci-sion. Both solutions are interesting in our case as itappears that even if there is still a stronger amplitudeerror with classical LQG, the error on the phase (posi-tion of the extremum) is small, thus ensuring a properswitching time definition.
Moreover, in order to compare the various observerstrategy performances, we evaluated and compared thesensitivity of the observer to modeling errors. In effect,one of the major criticisms that can be addressed to thiskind of strategy is the fact that the performance is very
0 0.02 0.04 0.06 0.08 0.1 0.12–1
–0.5
0
0.5
1x 10
–5
Time (s)
(a)
(b)
Dis
plac
emen
t of m
ode
1 (m
)
0 0.005 0.01 0.015 0.02 0.025 0.03 0.035 0.04–1
–0.5
0
0.5
1x 10
–7
Time (s)
Dis
plac
emen
t of m
ode
4 (m
)
Real displacementEstimated displacement
Figure 6. Real (thick line) and estimated (thin line) modalcoordinates for (a) mode 1 and (b) mode 4 using the pole-placement method without control.
0 0.02 0.04 0.06 0.08 0.1 0.12–1
–0.5
0
0.5
1x 10
–5
Time (s)
(a)
(b)
Dis
plac
emen
t of m
ode
1 (m
)
0 0.002 0.004 0.006 0.008 0.01 0.012 0.014 0.016 0.018 0.02–5
0
5
10x 10
–8
Time (s)
Dis
plac
emen
t of m
ode
4 (m
)
Real displacement
Estimated displacement
Figure 7. Real (thick line) and estimated (thin line) modalcoordinates for (a) mode 1 and (b) mode 4 using the LQGmethod without control.
0 0.02 0.04 0.06 0.08 0.1 0.12–1
–0.5
0
0.5
1x 10
–5
Time (s)
Dis
plac
emen
t of m
ode
1 (m
)
0 0.002 0.004 0.006 0.008 0.01 0.012 0.014 0.016 0.018 0.02–5
0
5
10x 10
–8
Time (s)
Dis
plac
emen
t of m
ode
4 (m
)
Real displacement
Estimated displacement
Figure 8. Real (thick line) and estimated (thin line) modalcoordinates for mode 1 (upper plot) and mode 4 (lower plot)using the enhanced LQG + PID method without control.PID: proportional–integral–derivative.
8 Journal of Intelligent Material Systems and Structures 0(0)
by AIDA CHERIF on March 7, 2012jim.sagepub.comDownloaded from
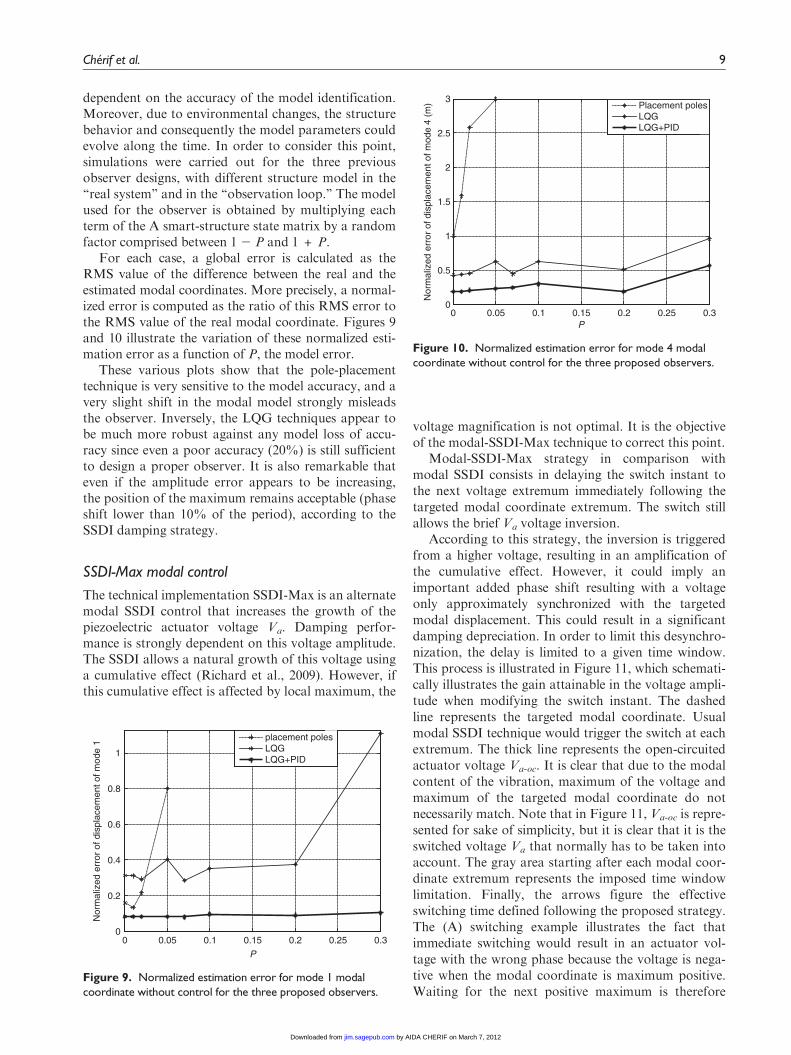
dependent on the accuracy of the model identification.Moreover, due to environmental changes, the structurebehavior and consequently the model parameters couldevolve along the time. In order to consider this point,simulations were carried out for the three previousobserver designs, with different structure model in the‘‘real system’’ and in the ‘‘observation loop.’’ The modelused for the observer is obtained by multiplying eachterm of the A smart-structure state matrix by a randomfactor comprised between 1 2 P and 1 + P.
For each case, a global error is calculated as theRMS value of the difference between the real and theestimated modal coordinates. More precisely, a normal-ized error is computed as the ratio of this RMS error tothe RMS value of the real modal coordinate. Figures 9and 10 illustrate the variation of these normalized esti-mation error as a function of P, the model error.
These various plots show that the pole-placementtechnique is very sensitive to the model accuracy, and avery slight shift in the modal model strongly misleadsthe observer. Inversely, the LQG techniques appear tobe much more robust against any model loss of accu-racy since even a poor accuracy (20%) is still sufficientto design a proper observer. It is also remarkable thateven if the amplitude error appears to be increasing,the position of the maximum remains acceptable (phaseshift lower than 10% of the period), according to theSSDI damping strategy.
SSDI-Max modal control
The technical implementation SSDI-Max is an alternatemodal SSDI control that increases the growth of thepiezoelectric actuator voltage Va. Damping perfor-mance is strongly dependent on this voltage amplitude.The SSDI allows a natural growth of this voltage usinga cumulative effect (Richard et al., 2009). However, ifthis cumulative effect is affected by local maximum, the
voltage magnification is not optimal. It is the objectiveof the modal-SSDI-Max technique to correct this point.
Modal-SSDI-Max strategy in comparison withmodal SSDI consists in delaying the switch instant tothe next voltage extremum immediately following thetargeted modal coordinate extremum. The switch stillallows the brief Va voltage inversion.
According to this strategy, the inversion is triggeredfrom a higher voltage, resulting in an amplification ofthe cumulative effect. However, it could imply animportant added phase shift resulting with a voltageonly approximately synchronized with the targetedmodal displacement. This could result in a significantdamping depreciation. In order to limit this desynchro-nization, the delay is limited to a given time window.This process is illustrated in Figure 11, which schemati-cally illustrates the gain attainable in the voltage ampli-tude when modifying the switch instant. The dashedline represents the targeted modal coordinate. Usualmodal SSDI technique would trigger the switch at eachextremum. The thick line represents the open-circuitedactuator voltage Va-oc. It is clear that due to the modalcontent of the vibration, maximum of the voltage andmaximum of the targeted modal coordinate do notnecessarily match. Note that in Figure 11, Va-oc is repre-sented for sake of simplicity, but it is clear that it is theswitched voltage Va that normally has to be taken intoaccount. The gray area starting after each modal coor-dinate extremum represents the imposed time windowlimitation. Finally, the arrows figure the effectiveswitching time defined following the proposed strategy.The (A) switching example illustrates the fact thatimmediate switching would result in an actuator vol-tage with the wrong phase because the voltage is nega-tive when the modal coordinate is maximum positive.Waiting for the next positive maximum is therefore
0 0.05 0.1 0.15 0.2 0.25 0.30
0.5
1
1.5
2
2.5
3
P
Nor
mal
ized
err
or o
f dis
plac
emen
t of m
ode
4 (m
) Placement polesLQGLQG+PID
Figure 10. Normalized estimation error for mode 4 modalcoordinate without control for the three proposed observers.
0 0.05 0.1 0.15 0.2 0.25 0.30
0.2
0.4
0.6
0.8
1
P
Nor
mal
ized
err
or o
f dis
plac
emen
t of m
ode
1 placement polesLQGLQG+PID
Figure 9. Normalized estimation error for mode 1 modalcoordinate without control for the three proposed observers.
Cherif et al. 9
by AIDA CHERIF on March 7, 2012jim.sagepub.comDownloaded from
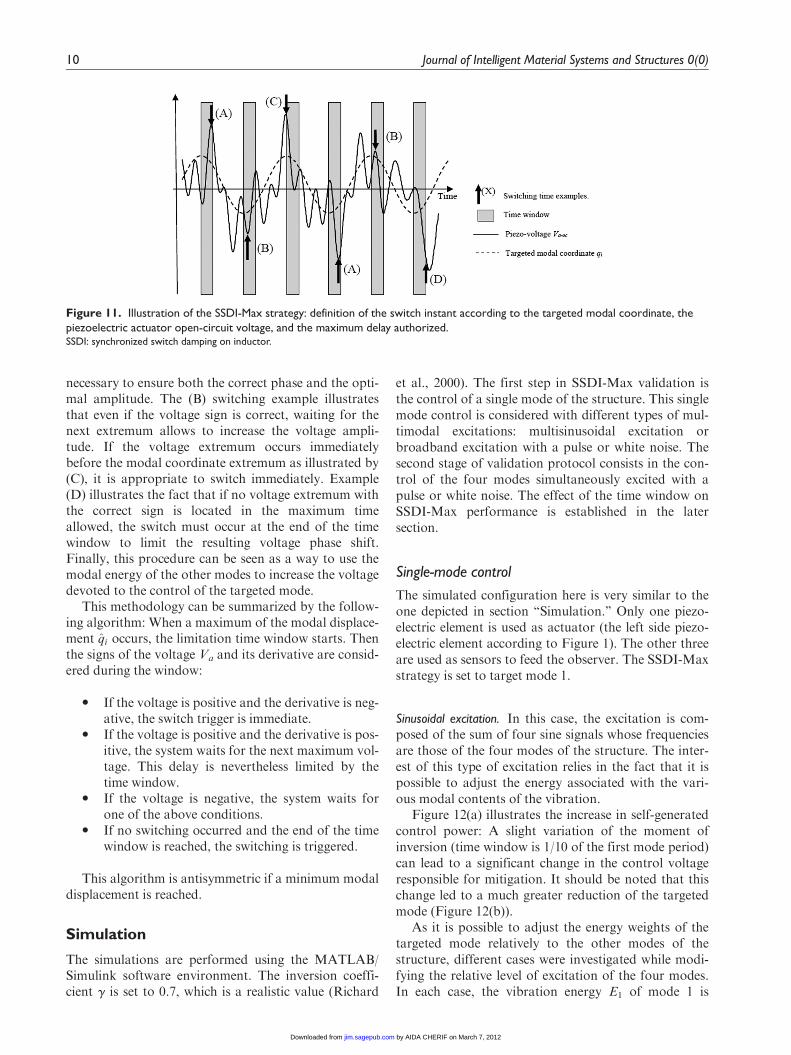
necessary to ensure both the correct phase and the opti-mal amplitude. The (B) switching example illustratesthat even if the voltage sign is correct, waiting for thenext extremum allows to increase the voltage ampli-tude. If the voltage extremum occurs immediatelybefore the modal coordinate extremum as illustrated by(C), it is appropriate to switch immediately. Example(D) illustrates the fact that if no voltage extremum withthe correct sign is located in the maximum timeallowed, the switch must occur at the end of the timewindow to limit the resulting voltage phase shift.Finally, this procedure can be seen as a way to use themodal energy of the other modes to increase the voltagedevoted to the control of the targeted mode.
This methodology can be summarized by the follow-ing algorithm: When a maximum of the modal displace-ment qi occurs, the limitation time window starts. Thenthe signs of the voltage Va and its derivative are consid-ered during the window:
� If the voltage is positive and the derivative is neg-ative, the switch trigger is immediate.
� If the voltage is positive and the derivative is pos-itive, the system waits for the next maximum vol-tage. This delay is nevertheless limited by thetime window.
� If the voltage is negative, the system waits forone of the above conditions.
� If no switching occurred and the end of the timewindow is reached, the switching is triggered.
This algorithm is antisymmetric if a minimum modaldisplacement is reached.
Simulation
The simulations are performed using the MATLAB/Simulink software environment. The inversion coeffi-cient g is set to 0.7, which is a realistic value (Richard
et al., 2000). The first step in SSDI-Max validation isthe control of a single mode of the structure. This singlemode control is considered with different types of mul-timodal excitations: multisinusoidal excitation orbroadband excitation with a pulse or white noise. Thesecond stage of validation protocol consists in the con-trol of the four modes simultaneously excited with apulse or white noise. The effect of the time window onSSDI-Max performance is established in the latersection.
Single-mode control
The simulated configuration here is very similar to theone depicted in section ‘‘Simulation.’’ Only one piezo-electric element is used as actuator (the left side piezo-electric element according to Figure 1). The other threeare used as sensors to feed the observer. The SSDI-Maxstrategy is set to target mode 1.
Sinusoidal excitation. In this case, the excitation is com-posed of the sum of four sine signals whose frequenciesare those of the four modes of the structure. The inter-est of this type of excitation relies in the fact that it ispossible to adjust the energy associated with the vari-ous modal contents of the vibration.
Figure 12(a) illustrates the increase in self-generatedcontrol power: A slight variation of the moment ofinversion (time window is 1/10 of the first mode period)can lead to a significant change in the control voltageresponsible for mitigation. It should be noted that thischange led to a much greater reduction of the targetedmode (Figure 12(b)).
As it is possible to adjust the energy weights of thetargeted mode relatively to the other modes of thestructure, different cases were investigated while modi-fying the relative level of excitation of the four modes.In each case, the vibration energy E1 of mode 1 is
Figure 11. Illustration of the SSDI-Max strategy: definition of the switch instant according to the targeted modal coordinate, thepiezoelectric actuator open-circuit voltage, and the maximum delay authorized.SSDI: synchronized switch damping on inductor.
10 Journal of Intelligent Material Systems and Structures 0(0)
by AIDA CHERIF on March 7, 2012jim.sagepub.comDownloaded from

computed (kinetic and elastic energies are obtainedfrom the mass and stiffness matrices along with thestate vector). In the same way E2 is the sum of theenergies of the other three modes of the structure.Figure 13 shows the RMS value of the targeted modalcoordinate, with modal SSDI control (thin line) ormodal SSDI-Max control (thick line), as a function ofthe energy ratio E1/E2.
It appears that when mode 1 energy is predominant,very few improvement results from SSDI-Max since
there is very few energy transferred from the othermode (i.e. very few voltage growth). Inversely, whenthe targeted mode energy and the remaining energy aresimilar, there is a voltage magnification resulting inimproved damping. It is clearly visible for energy ratiolying between 0 and 220 dB that the damping is rein-forced by this control energy transfer process. Finally,when the energy of the targeted mode is too low, theobserver has difficulty in reconstructing the modal dis-placement q1, since it is strongly contaminated with theother. If this ratio decreases too much, mode 1 can beeven amplified.
Pulse excitation. The excitation is a wide frequencysquare force pulse 50 ms long and with normalizedamplitude. This signal is applied on the structure space-state block force input shown in Figure 4.
Figure 14 illustrates the simulation results in thetime domain in the case of mode 1 targeting. A clearstrong improvement of damping using SSDI-Max isclearly visible. The voltage buildup improvement is illu-strated in Figure 15 showing that small shifts in theswitch instants result in the amplification of the self-generated control voltage. This result is remarkablesince the reference that corresponds to the structurecontrolled using modal SSDI is already a well damped.
White noise excitation. In this case, the plate model isexcited with a white noise of normalized amplitudeapplied on the structure space-state block force inputshown in Figure 4. Like a pulse, this type of broadbandexcitation results in vibration energy shared on all thefour considered modes of the model.
Figure 16 shows a comparison of the modal SSDIand modal SSDI-Max damping performances. It shows
2.02 2.03 2.04 2.05 2.06 2.07 2.08–400
–200
0
200
400
Time (s)
(a)
(b)
Act
uato
r vo
ltage
(V
)
2.02 2.03 2.04 2.05 2.06 2.07 2.08–4
–2
0
2
4x 10
–4
Time (s)
Mod
al d
ispl
acem
ent
(m)
SSDI-Max
SSDI
No control
Figure 12. (a) Modal displacement and (b) the piezoelectricactuator voltage for a single-mode control (mode 1) and in thecase of multisine excitation. The ratio of the controlled modeenergy to the structure vibrational energy is E1/E2 = 23.8 dB.SSDI: synchronized switch damping on inductor.
–25 –20 –15 –10 –5 0 5 10 15 20–110
–105
–100
–95
–90
–85
–80
–75
–70
–65
–60
E1/E2 (dB) – uncontrolled structure
The
RM
S d
ispl
acem
ent o
f mod
e 1
(dB
)
SSDI-Max
SSDI
Figure 13. Comparison of SSDI and SSDI-Max techniques:RMS modal displacement q1 versus the modal energy E1/E2ratio in the case of a sinusoidal excitation of the four modesand when mode 1 is targeted.SSDI: synchronized switch damping on inductor.
0.45 0.5 0.55 0.6 0.65 0.7 0.75 0.8 0.85 0.9–5
0
5x 10
–8
Time (s)
0.45 0.5 0.55 0.6 0.65 0.7 0.75 0.8 0.85 0.9–5
0
5x 10
–8
Time (s)
Mod
al c
oord
inat
e of
mod
e 1
(m)
0.45 0.5 0.55 0.6 0.65 0.7 0.75 0.8 0.85 0.9–5
0
5x 10
–8
Time (s)
No control
SSDI
SSDI-Max
Figure 14. Simulation of the mode 1 modal coordinate with apulse excitation in the case of mode 1 control.SSDI: synchronized switch damping on inductor.
Cherif et al. 11
by AIDA CHERIF on March 7, 2012jim.sagepub.comDownloaded from
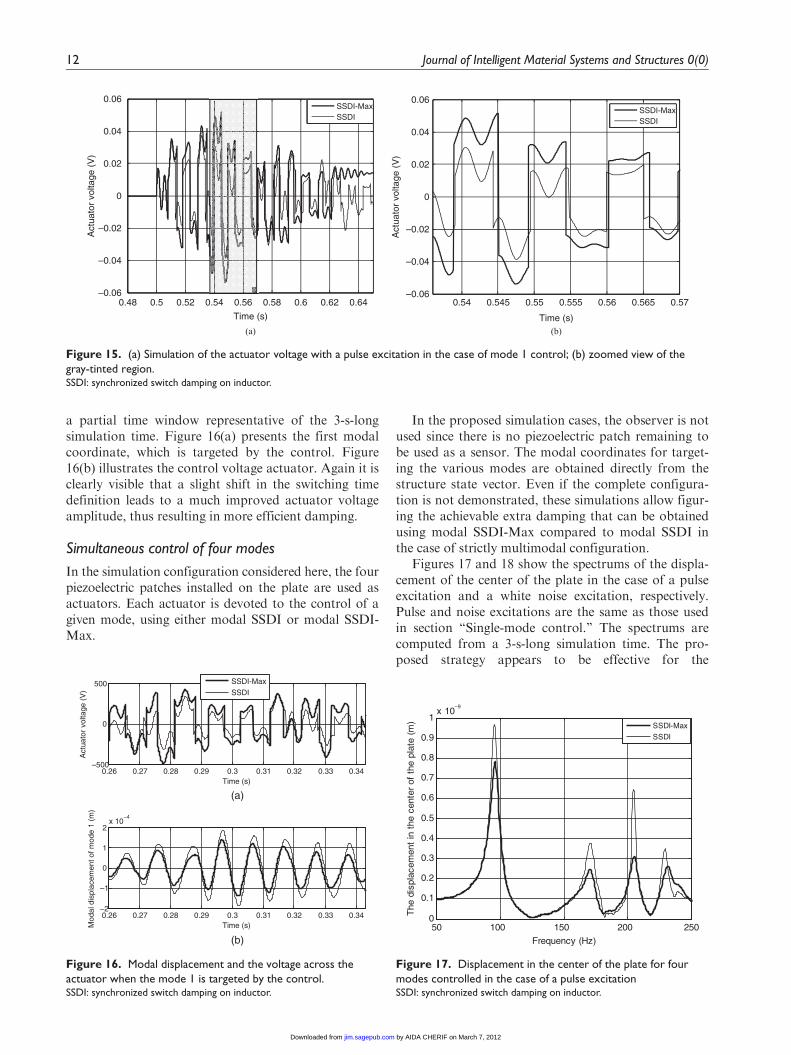
a partial time window representative of the 3-s-longsimulation time. Figure 16(a) presents the first modalcoordinate, which is targeted by the control. Figure16(b) illustrates the control voltage actuator. Again it isclearly visible that a slight shift in the switching timedefinition leads to a much improved actuator voltageamplitude, thus resulting in more efficient damping.
Simultaneous control of four modes
In the simulation configuration considered here, the fourpiezoelectric patches installed on the plate are used asactuators. Each actuator is devoted to the control of agiven mode, using either modal SSDI or modal SSDI-Max.
In the proposed simulation cases, the observer is notused since there is no piezoelectric patch remaining tobe used as a sensor. The modal coordinates for target-ing the various modes are obtained directly from thestructure state vector. Even if the complete configura-tion is not demonstrated, these simulations allow figur-ing the achievable extra damping that can be obtainedusing modal SSDI-Max compared to modal SSDI inthe case of strictly multimodal configuration.
Figures 17 and 18 show the spectrums of the displa-cement of the center of the plate in the case of a pulseexcitation and a white noise excitation, respectively.Pulse and noise excitations are the same as those usedin section ‘‘Single-mode control.’’ The spectrums arecomputed from a 3-s-long simulation time. The pro-posed strategy appears to be effective for the
0.48 0.5 0.52 0.54 0.56 0.58 0.6 0.62 0.64–0.06
–0.04
–0.02
0
0.02
0.04
0.06
Time (s)
Act
uato
r vo
ltage
(V
)
SSDI-MaxSSDI
0.54 0.545 0.55 0.555 0.56 0.565 0.57–0.06
–0.04
–0.02
0
0.02
0.04
0.06
Time (s)
Act
uato
r vo
ltage
(V
)
SSDI-MaxSSDI
(a) (b)
Figure 15. (a) Simulation of the actuator voltage with a pulse excitation in the case of mode 1 control; (b) zoomed view of thegray-tinted region.SSDI: synchronized switch damping on inductor.
0.26 0.27 0.28 0.29 0.3 0.31 0.32 0.33 0.34–500
0
500
Time (s)
(a)
(b)
Act
uato
r vo
ltage
(V
)
0.26 0.27 0.28 0.29 0.3 0.31 0.32 0.33 0.34–2
–1
0
1
2x 10
–4
Time (s)Mod
al d
ispl
acem
ent o
f mod
e 1
(m)
SSDI-Max
SSDI
Figure 16. Modal displacement and the voltage across theactuator when the mode 1 is targeted by the control.SSDI: synchronized switch damping on inductor.
50 100 150 200 2500
0.1
0.2
0.3
0.4
0.5
0.6
0.7
0.8
0.9
1x 10
–9
Frequency (Hz)
The
dis
plac
emen
t in
the
cen
ter
of t
he p
late
(m
) SSDI-Max
SSDI
Figure 17. Displacement in the center of the plate for fourmodes controlled in the case of a pulse excitationSSDI: synchronized switch damping on inductor.
12 Journal of Intelligent Material Systems and Structures 0(0)
by AIDA CHERIF on March 7, 2012jim.sagepub.comDownloaded from
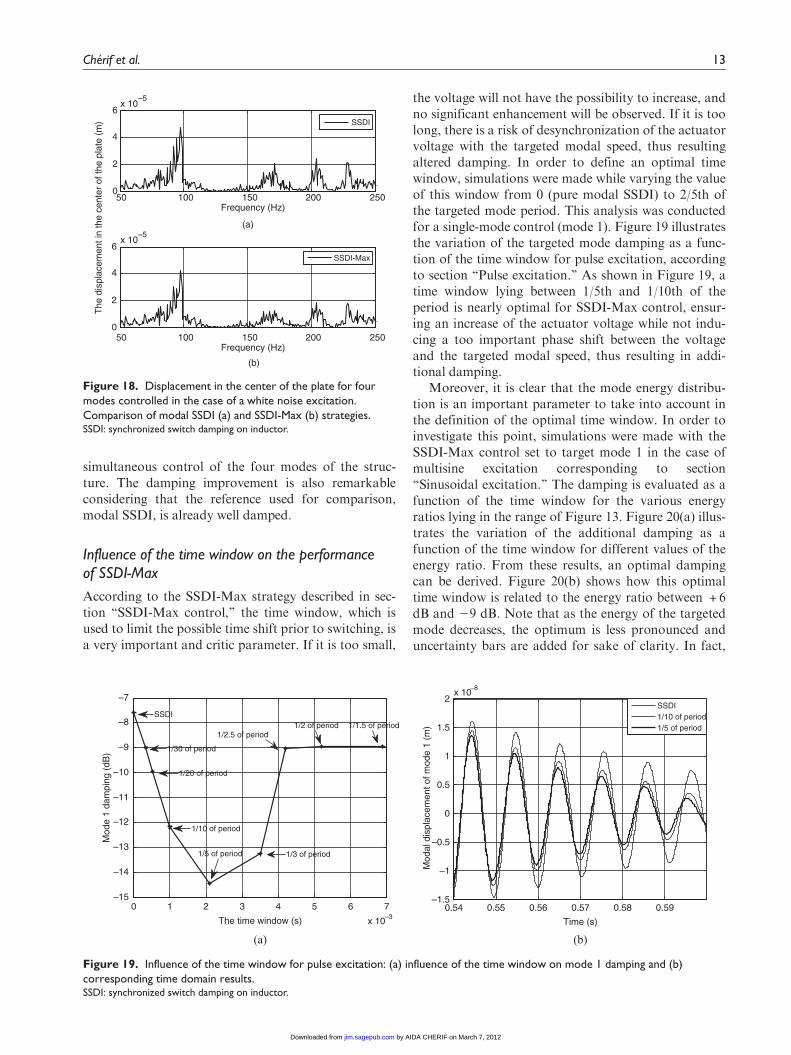
simultaneous control of the four modes of the struc-ture. The damping improvement is also remarkableconsidering that the reference used for comparison,modal SSDI, is already well damped.
Influence of the time window on the performanceof SSDI-Max
According to the SSDI-Max strategy described in sec-tion ‘‘SSDI-Max control,’’ the time window, which isused to limit the possible time shift prior to switching, isa very important and critic parameter. If it is too small,
the voltage will not have the possibility to increase, andno significant enhancement will be observed. If it is toolong, there is a risk of desynchronization of the actuatorvoltage with the targeted modal speed, thus resultingaltered damping. In order to define an optimal timewindow, simulations were made while varying the valueof this window from 0 (pure modal SSDI) to 2/5th ofthe targeted mode period. This analysis was conductedfor a single-mode control (mode 1). Figure 19 illustratesthe variation of the targeted mode damping as a func-tion of the time window for pulse excitation, accordingto section ‘‘Pulse excitation.’’ As shown in Figure 19, atime window lying between 1/5th and 1/10th of theperiod is nearly optimal for SSDI-Max control, ensur-ing an increase of the actuator voltage while not indu-cing a too important phase shift between the voltageand the targeted modal speed, thus resulting in addi-tional damping.
Moreover, it is clear that the mode energy distribu-tion is an important parameter to take into account inthe definition of the optimal time window. In order toinvestigate this point, simulations were made with theSSDI-Max control set to target mode 1 in the case ofmultisine excitation corresponding to section‘‘Sinusoidal excitation.’’ The damping is evaluated as afunction of the time window for the various energyratios lying in the range of Figure 13. Figure 20(a) illus-trates the variation of the additional damping as afunction of the time window for different values of theenergy ratio. From these results, an optimal dampingcan be derived. Figure 20(b) shows how this optimaltime window is related to the energy ratio between + 6dB and 29 dB. Note that as the energy of the targetedmode decreases, the optimum is less pronounced anduncertainty bars are added for sake of clarity. In fact,
(b)(a)
0 1 2 3 4 5 6 7
x 10–3
–15
–14
–13
–12
–11
–10
–9
–8
–7
The time window (s)
Mod
e 1
dam
ping
(dB
)
SSDI
1/30 of period
1/20 of period
1/10 of period
1/5 of period 1/3 of period
1/2.5 of period1/2 of period 1/1.5 of period
0.54 0.55 0.56 0.57 0.58 0.59–1.5
–1
–0.5
0
0.5
1
1.5
2x 10
–8
Time (s)
Mod
al d
ispl
acem
ent o
f mod
e 1
(m)
SSDI1/10 of period1/5 of period
Figure 19. Influence of the time window for pulse excitation: (a) influence of the time window on mode 1 damping and (b)corresponding time domain results.SSDI: synchronized switch damping on inductor.
50 100 150 200 2500
2
4
6x 10
–5
Frequency (Hz)
(a)
(b)
The
dis
plac
emen
t in
the
cent
er o
f the
pla
te (
m)
50 100 150 200 2500
2
4
6x 10
–5
Frequency (Hz)
SSDI-Max
SSDI
Figure 18. Displacement in the center of the plate for fourmodes controlled in the case of a white noise excitation.Comparison of modal SSDI (a) and SSDI-Max (b) strategies.SSDI: synchronized switch damping on inductor.
Cherif et al. 13
by AIDA CHERIF on March 7, 2012jim.sagepub.comDownloaded from
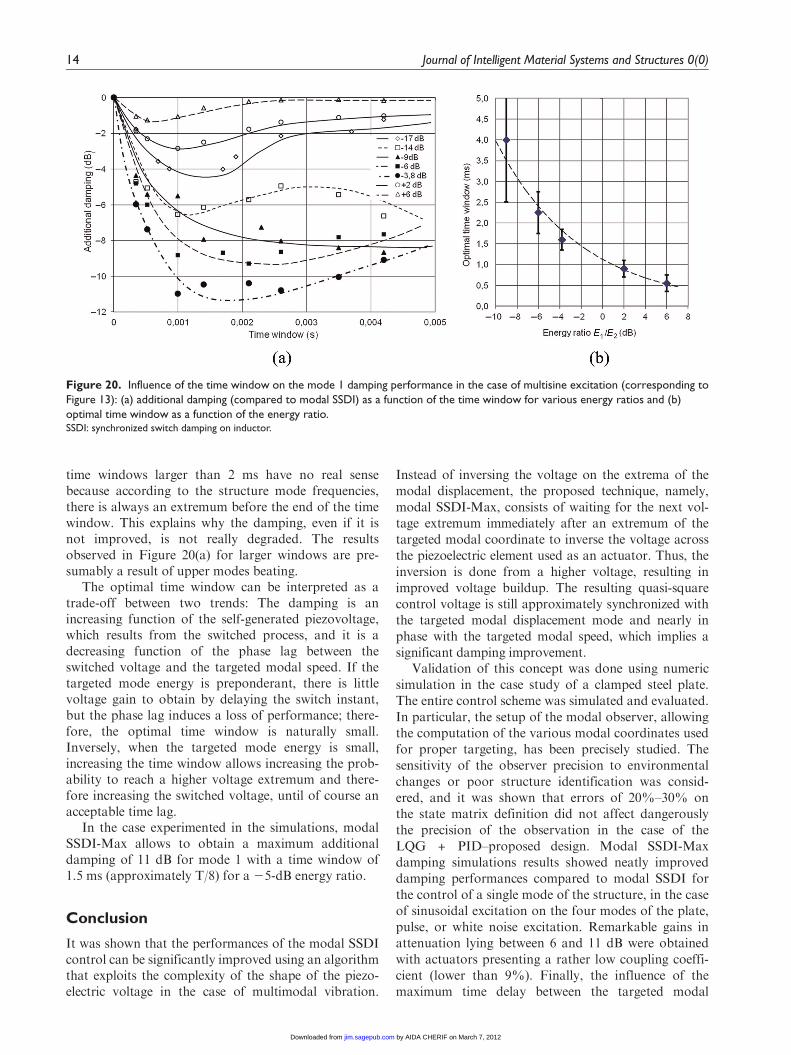
time windows larger than 2 ms have no real sensebecause according to the structure mode frequencies,there is always an extremum before the end of the timewindow. This explains why the damping, even if it isnot improved, is not really degraded. The resultsobserved in Figure 20(a) for larger windows are pre-sumably a result of upper modes beating.
The optimal time window can be interpreted as atrade-off between two trends: The damping is anincreasing function of the self-generated piezovoltage,which results from the switched process, and it is adecreasing function of the phase lag between theswitched voltage and the targeted modal speed. If thetargeted mode energy is preponderant, there is littlevoltage gain to obtain by delaying the switch instant,but the phase lag induces a loss of performance; there-fore, the optimal time window is naturally small.Inversely, when the targeted mode energy is small,increasing the time window allows increasing the prob-ability to reach a higher voltage extremum and there-fore increasing the switched voltage, until of course anacceptable time lag.
In the case experimented in the simulations, modalSSDI-Max allows to obtain a maximum additionaldamping of 11 dB for mode 1 with a time window of1.5 ms (approximately T/8) for a 25-dB energy ratio.
Conclusion
It was shown that the performances of the modal SSDIcontrol can be significantly improved using an algorithmthat exploits the complexity of the shape of the piezo-electric voltage in the case of multimodal vibration.
Instead of inversing the voltage on the extrema of themodal displacement, the proposed technique, namely,modal SSDI-Max, consists of waiting for the next vol-tage extremum immediately after an extremum of thetargeted modal coordinate to inverse the voltage acrossthe piezoelectric element used as an actuator. Thus, theinversion is done from a higher voltage, resulting inimproved voltage buildup. The resulting quasi-squarecontrol voltage is still approximately synchronized withthe targeted modal displacement mode and nearly inphase with the targeted modal speed, which implies asignificant damping improvement.
Validation of this concept was done using numericsimulation in the case study of a clamped steel plate.The entire control scheme was simulated and evaluated.In particular, the setup of the modal observer, allowingthe computation of the various modal coordinates usedfor proper targeting, has been precisely studied. Thesensitivity of the observer precision to environmentalchanges or poor structure identification was consid-ered, and it was shown that errors of 20%–30% onthe state matrix definition did not affect dangerouslythe precision of the observation in the case of theLQG + PID–proposed design. Modal SSDI-Maxdamping simulations results showed neatly improveddamping performances compared to modal SSDI forthe control of a single mode of the structure, in the caseof sinusoidal excitation on the four modes of the plate,pulse, or white noise excitation. Remarkable gains inattenuation lying between 6 and 11 dB were obtainedwith actuators presenting a rather low coupling coeffi-cient (lower than 9%). Finally, the influence of themaximum time delay between the targeted modal
Figure 20. Influence of the time window on the mode 1 damping performance in the case of multisine excitation (corresponding toFigure 13): (a) additional damping (compared to modal SSDI) as a function of the time window for various energy ratios and (b)optimal time window as a function of the energy ratio.SSDI: synchronized switch damping on inductor.
14 Journal of Intelligent Material Systems and Structures 0(0)
by AIDA CHERIF on March 7, 2012jim.sagepub.comDownloaded from

coordinate extremum and the switch instant was evalu-ated, and the results emphasize the importance of theenergy of the targeted mode compared to the othermodes of the structure on the definition of the optimaltime window. Simulations showed that a maximumdelay lying between 1/10th and 1/5th of the targetedmode period is nearly optimal for the considered cases.Further works aim at implanting and validating experi-mentally the proposed concept.
References
Carriere MS (2010) Crossed synthesis of controllers and observ-ers for robust control of synchronous machine. PhD thesis,University of Toulouse, Toulouse, France.
Clark WW. (2000) Vibration control with state-switchingpiezoelectric materials. Journal of Intelligent Material and
Structures 11: 263–271.Cunefare KA and Holdhusen M (2004) Optimization of a
state-switched absorber applied to a continuous vibratingsystem. In: Proceedings of the SPIE Conference, passive
damping and isolation.Eielsen AA and Fleming AJ (2010) Passive shunt damping of
a piezoelectric stack nanopositioner. In: Proceedings of theAmerican Control Conference, Marriott Waterfront, Balti-more, MD, USA June 30-July 02, 2010, 4963–4968.
Forward RL. (1979) Electronic damping of vibrations in opti-cal structures. Applied Optics 18(5): 690–697.
Franklin GF, Powell JD and Workman ML (1990) Digital
Control of Dynamic Systems. 2nd ed. London, UK: Addi-son-Wesley, pp. 742.
Fuller CR and Jones JD (1987) Experiments on reduction ofpropeller induced interior noise by active control of cylin-der vibration. Journal of Sound and Vibration 112(2): 398–395.
Guyomar D and Badel A (2006) Nonlinear semi-passive multi-modal vibration damping: an efficient probabilistic approach.Journal of Sound and Vibration 294(1–2): 249–268.
Hagood NW and Von Flotow A (1991) Damping of struc-tural vibrations with piezoelectric materials and passiveelectrical networks. Journal of Sound and Vibration 146(2):243–268.
Harari S, Richard C and Gaudiller L (2009) New semi-activemulti-modal vibration control using piezoceramic compo-nents. Journal of Intelligent Material Systems and Struc-
tures 20: 1603–1613.
Luenberger DG. (1971) An introduction to observers. IEEE
transactions on automatic control, 16(6): 596–602.MATLAB (2011) Control Toolbox Documentation. The Math-
works Corporation, Natick Massachusetts USA.Meyer Y and Collet M (2011) Active vibration isolation of
electronic components by piezocomposite clamped–
clamped beam. Mechanical Systems and Signal Processing
25: 1687–1701.Neubauer M, Han X and Schwarzendahl SM (2011)
Enhanced switching law for synchronized switch damping
on inductor with bimodal excitation. Journal of Sound and
Vibration 330: 2707–2720.Niederberger D, Morari M and Pietrzko S (2004) A new con-
trol approach for switching shunt damping. In: Proceed-
ings of the SPIE Conference, passive damping and isolation,
vol. 5386, pp. 426–437. San Diego, CA, USA.Persson P and Astrom KJ (1993) PID control revised. In: Pro-
ceedings of the IFAC 12th World Congress, Sydney, Aus-
tralia 18–23 July.Petit L, Lefeuvre E, Richard C, et al. (2004) A broadband
semi-passive piezoelectric technique for structural damp-
ing. In: Proceedings of the SPIE SSM conference, damping
and isolation. San Diego, CA, vol. 5386, pp. 414–425.Preumont A, Francxois A, Bossens A, et al. (2002) Force feed-
back versus acceleration feedback in active vibration isola-
tion. Journal of Sound and Vibration 257(4): 605–613.Richard C, Guyomar D, Audigier D, et al. (2000) Enhanced
semi passive damping using continuous switching of a
piezoelectric device on an inductor. SPIE Smart Structures
and Materials Conference. Passive Damping and Isolation
3689: 288–299.Richard C, Harari S and Gaudiller L (2009) Enhanced piezo-
electric voltage build-up for semi-active control of smart
structures. Proceedings of SPIE Smart Structures and
Materials 7288(1): 72881Y.Richard T (2007) Diminution du coefficient de transmission
acoustique d’une paroi a l’aide d’amortisseurs piezoelectri-
ques semi-passifs. These de doctorat, Institut National des
Sciences Appliquees de Lyon – 2007ISAL0112.Snyder SD and Hansen CH (1991) Mechanisms of active
noise control by vibration sources. Journal of Sound and
Vibration 147(3): 519–525.Wu S and Bicos AS (1997) Structural vibration damping
experiments using improved piezoelectric shunts. Proceed-
ings of the SPIE 3045: 40–50.
Cherif et al. 15
by AIDA CHERIF on March 7, 2012jim.sagepub.comDownloaded from