Simulation of front end loader bucket–soil interaction using discrete element method
16
INTERNATIONAL JOURNAL FOR NUMERICAL AND ANALYTICAL METHODS IN GEOMECHANICS Int. J. Numer. Anal. Meth. Geomech., 2007; 31:1147–1162 Published online 3 January 2007 in Wiley InterScience (www.interscience.wiley.com). DOI: 10.1002/nag.594 Simulation of front end loader bucket–soil interaction using discrete element method Erfan G. Nezami } , Youssef M. A. Hashash* ,y,z , Dawei Zhao } and Jamshid Ghaboussi } Department of Civil and Environmental Engineering, University of Illinois at Urbana-Champaign, IL 61801, U.S.A. SUMMARY The design of earthmoving equipment requires reliable estimates of resisting forces from the soil or rock to be manipulated. A series of discrete element simulations with polyhedral particles designed to replicate a series of bucket–soil interaction experiments are presented. The experiments involve manipulation of a pile of gravel, consisting of angular and sub-rounded particles, with a prototype of a front end loader bucket. The geometry of the soil pile and the trajectory of the bucket from each experiment are simulated using discrete element method (DEM). A single set of DEM model properties, including inter-particle contact friction angle estimated from the initial configuration of the soil pile prior to the start of the experiments, are used for all simulations. The total soil reaction forces acting on the bucket in both horizontal and vertical directions are calculated from each simulation and are compared to measured forces from the corresponding experiment. The results show both qualitative and quantitative agreement between simulations with polyhedral particles and experiments with angular and sub-rounded particles. The major source of discrepancy is attributed to the large particle sizes in the simulation compared to the experiments. Using smaller particles improves the results and provides a better match with the experiments. Other sources of discrepancy are also discussed. The simulations demonstrate that DEM with polyhedral particles can be used to reliably simulate bucket–soil interaction and to estimate force feedback into earthmoving equipment. Copyright # 2007 John Wiley & Sons, Ltd. Received 11 August 2006; Revised 9 November 2006; Accepted 9 November 2006 KEY WORDS: discrete element method; earthmoving equipment; soil–tool interaction *Correspondence to: Youssef M. A. Hashash, 2230c Newmark Civil Engineering Laboratory, 205 North Mathews Avenue, Urbana, IL 61801, U.S.A. y E-mail: [email protected] z Associate Professor. } Graduate Student. } Emeritus Professor. Contract/grant sponsor: National Science Foundation; contract/grant number: CMS-0113745 Copyright # 2007 John Wiley & Sons, Ltd.
-
Upload
independent -
Category
Documents
-
view
0 -
download
0
Transcript of Simulation of front end loader bucket–soil interaction using discrete element method

INTERNATIONAL JOURNAL FOR NUMERICAL AND ANALYTICAL METHODS IN GEOMECHANICSInt. J. Numer. Anal. Meth. Geomech., 2007; 31:1147–1162Published online 3 January 2007 in Wiley InterScience (www.interscience.wiley.com). DOI: 10.1002/nag.594
Simulation of front end loader bucket–soil interactionusing discrete element method
Erfan G. Nezami}, Youssef M. A. Hashash*,y,z, Dawei Zhao}
and Jamshid Ghaboussi}
Department of Civil and Environmental Engineering, University of Illinois at Urbana-Champaign,IL 61801, U.S.A.
SUMMARY
The design of earthmoving equipment requires reliable estimates of resisting forces from the soil or rock tobe manipulated. A series of discrete element simulations with polyhedral particles designed to replicate aseries of bucket–soil interaction experiments are presented. The experiments involve manipulation of a pileof gravel, consisting of angular and sub-rounded particles, with a prototype of a front end loader bucket.The geometry of the soil pile and the trajectory of the bucket from each experiment are simulated usingdiscrete element method (DEM). A single set of DEM model properties, including inter-particle contactfriction angle estimated from the initial configuration of the soil pile prior to the start of the experiments,are used for all simulations. The total soil reaction forces acting on the bucket in both horizontal andvertical directions are calculated from each simulation and are compared to measured forces from thecorresponding experiment. The results show both qualitative and quantitative agreement betweensimulations with polyhedral particles and experiments with angular and sub-rounded particles. The majorsource of discrepancy is attributed to the large particle sizes in the simulation compared to the experiments.Using smaller particles improves the results and provides a better match with the experiments. Othersources of discrepancy are also discussed. The simulations demonstrate that DEM with polyhedralparticles can be used to reliably simulate bucket–soil interaction and to estimate force feedback intoearthmoving equipment. Copyright # 2007 John Wiley & Sons, Ltd.
Received 11 August 2006; Revised 9 November 2006; Accepted 9 November 2006
KEY WORDS: discrete element method; earthmoving equipment; soil–tool interaction
*Correspondence to: Youssef M. A. Hashash, 2230c Newmark Civil Engineering Laboratory, 205 North MathewsAvenue, Urbana, IL 61801, U.S.A.yE-mail: [email protected] Professor.}Graduate Student.}Emeritus Professor.
Contract/grant sponsor: National Science Foundation; contract/grant number: CMS-0113745
Copyright # 2007 John Wiley & Sons, Ltd.

1. INTRODUCTION
Discrete element method (DEM) simulation of laboratory or full-scale experiments has been thesubject of numerous publications. At the micro-level, evolution of parameters such as contactnormal and contact force orientations [1, 2], mechanisms of relative displacement of particles[3, 4], and developments of shear bands [5–7] have been studied in detail. At the macro-level,DEM has been used to simulate geotechnical laboratory experiments such as biaxial and triaxialtests [8], as well as industrial and mining applications including dragline excavation andcentrifugal mills [9], and underground structures [10].
Most of such DEM simulations are qualitatively in agreement with results from experiments.However, improvement and enhancement of the discrete element codes require quantitativemeasurements on industrial equipment. The measurement of forces acting on differentcomponents allows extensive comparison of simulations and experiments. Such quantitativecomparisons are reported in Moakher et al. [11] and Laurent and Cleary [12] for simulation ofgranular flow in tumbling blenders and mixers using spherical particles, and in Matsushimaet al. [13] for direct shear tests using particles consisting of connected spheres.
This paper describes DEM simulations with polyhedral particles designed to replicate a seriesof bucket–soil experiments. The usage of DEM with polyhedral particles in this field providespossibilities for the optimization of the design and the operating conditions for earthmovingequipment. The use of polyhedral particles avoids the need for using clusters of spherical orellipsoidal particles commonly employed in many current DEM applications. The polyhedralshapes more closely resemble particles’ shapes of gravel piles encountered by earthmovingequipment. Experiments involve manipulation of a pile of granular materials including thrustinginto the pile and loading and lifting with a bucket prototype of a front end loader. The forcesand displacements are monitored throughout the experiments and are used as the basis forevaluating the performance of the DEM simulations.
2. EXPERIMENT SETUP
The soil bin facility at Caterpillar Inc. soil laboratory, in Peoria, IL, is designed to test thebehaviour of scaled models of heavy earthmoving equipments, such as front end loaders andbulldozers, and to measure the forces acting on those equipments by the soil under variousoperating conditions.
A series of bucket–soil interaction experiments are conducted using an existing 112
scaledbucket of a 988G Caterpillar front end loader as illustrated in Figure 1. The bucket–soilexperiments are conducted in a 1.25m wide, long, bin with 0.70m high side walls (Figure 2).A frame installed above the bin holds the bucket system in position and allows movement of thebucket along the length of the bin. A vertical arm connects the bucket to the frame and controlsthe vertical movement of the bucket. A horizontal mechanical arm controls the rotation of thebucket along its long axis. Three load cells measure the forces acting on the bucket in horizontal(along the soil bin), vertical, and lateral (perpendicular to the side walls) directions. A manualjoystick connected to the setup frame controls the motion of the bucket during the experiment.The data acquisition system collects the corresponding force measurements from the load cellsat a rate of up to 100Hz.
E. G. NEZAMI ET AL.1148
Copyright # 2007 John Wiley & Sons, Ltd. Int. J. Numer. Anal. Meth. Geomech. 2007; 31:1147–1162
DOI: 10.1002/nag

In order to generate the pile in the soil bin, two plates are initially positioned normal to the soilbin walls to form a box 0.95m long. Soil particles are dropped from a height of approximately1.00m above the soil bin into the box until the required pile height is obtained. Then, one of theplates is quickly removed allowing the particles to form a slope as shown in Figure 2.
Figure 1. The 988G Caterpillar front end loader: (a) full size; and (b) 112scaled bucket used in experiments.
Bucket
Soil
Horizontal arm
Load cells
Attached tothe frame
Soil bin
Vertical arm
0.70
m
(a)
(b)
Figure 2. Bucket–soil experiment setup: (a) photo of the soil bin and the soil slope; and (b) schematiccross-section of soil bin and bucket prototype.
SIMULATION OF FRONT END LOADER BUCKET–SOIL INTERACTION 1149
Copyright # 2007 John Wiley & Sons, Ltd. Int. J. Numer. Anal. Meth. Geomech. 2007; 31:1147–1162
DOI: 10.1002/nag
Experiments are performed with dry uniform clean washed gravel from local quarries inPeoria, IL, with the grain size distribution shown in Figure 3. Two gravel particle shapes,angular and sub-rounded, both identified as GP in Unified Soils Classification System (USCS),are employed in these experiments and a few of which shown in Figure 4 on a 10 cm� 10 cmgrid. The corresponding bulk density and the slope angle of the piles are measured to be14.0 kN/m3 and 318, respectively, for angular particles and 14.2 kN/m3 and 298 for sub-roundedparticles. Experiments are performed with two different initial pile heights H ¼ 0:31 and 0.23m,as illustrated in Figure 5. For H ¼ 0:31 m; the bucket is located at five different initial elevationsh ¼ 0:04; 0.08, 0.12, 0.16, and 0.23m. For H ¼ 0:23 m; four initial elevations h ¼ 0:04; 0.08,0.12, and 0.16m are chosen. An operator controls the motion of the bucket during thesimulation using a joystick. A typical trajectory of the bucket is shown in Figure 5. The bucket isfirst displaced horizontally from its initial position into the pile until the horizontal force acting
0
20
40
60
80
100
1
Perc
ent f
iner
10 100
SimulationExperiment
Grain (particle) size (mm)
Figure 3. Grain size distribution.
Figure 4. Gravel particles used in the experiments, horizontal and vertical scales are in centimetres:(a) sub-rounded particles; and (b) angular particles.
E. G. NEZAMI ET AL.1150
Copyright # 2007 John Wiley & Sons, Ltd. Int. J. Numer. Anal. Meth. Geomech. 2007; 31:1147–1162
DOI: 10.1002/nag

on the bucket by soil reaches the maximum capacity of the system in horizontal direction(roughly 200N). At this point, the operator rotates and lifts the bucket up to collect a load ofsoil.
A series of experiments are conducted using combinations ofH, h and particle shape as shownin Table I. A letter ‘A’ or ‘S’ following the experiment number indicates whether that experimentis performed with angular or sub-rounded particles, respectively. For each case shown inTable I, the experiment is repeated at least three times to characterize scatter in experimentaldata and verify repeatability of measured forces. As an example, horizontal and vertical forcesacting on the bucket are shown in Figure 6(a) and (b) for three repeated experimentscorresponding to experiment series 3A (angular particles with H ¼ 0:23 m; h ¼ 0:12 m) and 3S(sub-rounded particles, H ¼ 0:23 m; h ¼ 0:12 m). Individual experiments in each experimentseries are identified with a, b, c added to the label of the experiment series. For each case, time 0corresponds to the first contact between the soil particles and the bucket.
In all three experiments the bucket follows similar trajectories. Horizontal forces increaserapidly as the bucket penetrates into the soil pile, and reduce to zero as the bucket movesupward and separates from the soil. Vertical forces increase as more particles enter the bucket.Note that positive values in vertical direction indicate downward forces. Therefore, the verticalforce at the end of each test, where the bucket is separated from the main pile, is equal to theweight of the soil inside the bucket. The discrepancies between the three experiments can bemainly attributed to small differences in the trajectory of the bucket in each experiment.Occasional sharp spikes can be seen in the measured forces such as at t ¼ 12 and 14 s forexperiment 3Aa; and t ¼ 10 for experiment 3Ac (Figure 6). Such sharp spikes in the forces,especially when accompanied by vibrations in the hydraulic system attached to the bucket, are
h
0.23 m0.16 m0.12 m0.08 m0.04 mH
0.31 m0.23 m
α=29° ~31°
Figure 5. Bucket–soil experiment layout, a is the pile slope angle.
Table I. Experiment series for various values of H and h.
H ¼ 0:23 m H ¼ 0:31 m
h Angular Sub-rounded Angular Sub-rounded
0.04 #1A #1S #5A #5S0.08 #2A #2S #6A #6S0.12 #3A #3S #7A #7S0.16 #4A #4S #8A #8S0.23 } } #9A #9S
SIMULATION OF FRONT END LOADER BUCKET–SOIL INTERACTION 1151
Copyright # 2007 John Wiley & Sons, Ltd. Int. J. Numer. Anal. Meth. Geomech. 2007; 31:1147–1162
DOI: 10.1002/nag

indications of a scatter in the recorded data and hence the data are less suitable for comparisonswith simulations. In the case of Figure 6(a), experiment 3Ab is selected to represent theexperiment series 3A. For the same reason experiment 3Sb is chosen in Figure 6(b).
The measured forces for experiments with angular and sub-rounded particles are very similar.Such similarity is expected because both angular and sub-rounded particles have identical grainsize distributions (Figure 3), very similar bulk densities (14.0 kN/m3 for angular particles vs14.2 kN/m3 for sub-rounded particles) and similar friction angles reflected in the similar initialsoil pile slope angles. The slight difference in angularity of the particles does not substantiallyaffect the results of the experiments.
Once the representative experiment in each experiment series and for each particle shape isselected, the corresponding trajectory of the bucket and the forces acting on it are used in theevaluation of DEM simulations.
3. DEM COMPUTER PROGRAM BLOKS3D
Over the last several years the authors have developed the discrete element code BLOKS3D [14]for simulation of granular particles flow. The code can be used to simulate large-scale movementof 3D polyhedral particles of any size. Some features of the program include:
Vertical
Vertical
Horizontal
Horizontal
Forc
e (N
)
-50
0
50
100
150
200
250
300
0 4 8 12 16 20
3Aa3Ab3Ac
time (sec)
time (sec)
time (sec)
time (sec)
-50
0
50
100
150
200
0 4 8 12 16 20
Forc
e (N
)
-50
0
50
100
150
200
250
300
0 4 8 12 16 20
3Sa3Sb3Sc
-50
0
50
100
150
200
0 4 8 12 16 20
(a)
(b)
Figure 6. Three different experiments corresponding to experiment series 3: (a) experiment series 3A,angular particles; and (b) experiment series 3S, sub-rounded particles.
E. G. NEZAMI ET AL.1152
Copyright # 2007 John Wiley & Sons, Ltd. Int. J. Numer. Anal. Meth. Geomech. 2007; 31:1147–1162
DOI: 10.1002/nag

Particle library: BLOKS3D uses a particle library in which a description of available particleprototypes is stored. The particle dimensions in the library are scaled in such a way that eachprototype has a unit volume. The library can be edited, expanded, or reduced by the user tomeet a range of simulation requirements. Prior to any simulation, the user determines the sizedistribution of particles and their geometries. Size distribution is defined by specifying as manypoints on the desired grain size distribution curve as needed. Particle geometries are determinedby specifying associated identification numbers of prototypes in the library. For each particle tobe generated for the simulation, the program randomly chooses a particle prototype amongthose specified by the user, and then assigns a volume to it according to the grain sizedistribution curve.
Neighbour search method: A two-level-search (TLS) scheme based on space decompositionand bounding spheres is developed and implemented in BLOKS3D. The method is an enhancedversion of the neighbour search algorithm implemented in 3DEC [15]. The whole space ofinterest is discretized into numbered cubic ‘boxes’. The first level search providesa preliminary list of candidate pairs of particles that touch the same box. The second levelsearch further reduces the number of candidates by checking their bounding spheres. TLSalgorithm belongs to the category of hashing algorithms and has O(N) performance, where N isthe total number of particles. Detailed description of the algorithm and its performance can befound in [14].
Contact detection method: Detailed contact detection is performed between a pair of particlesonly if there is an overlap between their sphere bounding volumes. Shortest link method (SLM)[16] has been implemented for contact detection in BLOKS3D. This algorithm is based on thecommon plane (CP) concept introduced by Cundall [15]. A CP is a virtual plane that bisects thespace between two particles, whereby the particle–particle contact detection problem issimplified to an easier particle–plane contact detection problem. For more details on CP methodsee [15, 17].
4. DEM SIMULATION MODEL REPRESENTATION
A series of numerical simulations are performed with BLOKS3D to replicate the bucket–soilexperiments. A single set of DEM model properties, including particle–particle contact frictionangle estimated from the initial configuration of the soil pile prior to the start of theexperiments, is used for all simulations. These properties are selected prior to performing thesimulations and are not adjusted later to obtain a better match with measurements of bucket–soil interaction.
4.1. Overall model
A careful review of the videos taken during the experiments reveals that only the particles at adistance about 0.10m on each side of the bucket are influenced by the bucket motion. Soilparticles outside this 0.10m margin are practically unaffected by the motion of the bucket. As aresult, the walls of the soil bin are simulated with two frictional plates 0.60m apart, compared to1.25m in the experiment, with the 0.31m bucket located in the middle of the bin. This results in0.15m of soil between the bucket and the wall on each side of the bucket.
SIMULATION OF FRONT END LOADER BUCKET–SOIL INTERACTION 1153
Copyright # 2007 John Wiley & Sons, Ltd. Int. J. Numer. Anal. Meth. Geomech. 2007; 31:1147–1162
DOI: 10.1002/nag
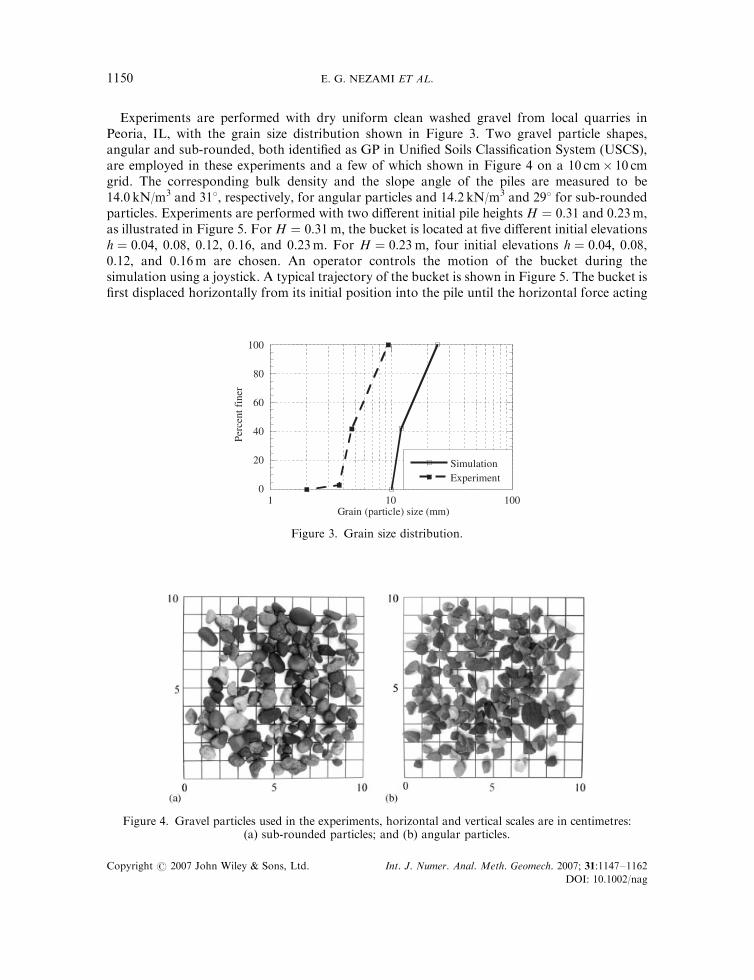
4.2. Soil particles and soil pile
Six different particle shapes are used in each simulation as shown in Figure 7 with equal numberof particles for each shape. Such particle shapes are an approximation of the actual gravelparticle shapes shown in Figure 4. The polyhedral particles provide a better representation ofthe geometry of the gravel particles than spherical particles or clusters. In the future, it might bepossible to scan a representative sample of the particles and develop polyhedral particle shapesthat more closely match these gravel particles [18].
The particle size distribution is shown in Figure 3. The particles dimensions in the simulationsare about 3 times larger than those in the experiments. Larger particles are used to reduce thenumber of particles in the simulation and keep the computational effort manageable. Thesimulations are intended to approximate the mass behaviour of the soil and hence high fidelityreproduction of particle interactions is of secondary importance, thus making the use of largerparticles an acceptable approximation.
Normal and shear contact stiffness of the particles are set to 1.30� 105N/m and 1.02� 105N/m,respectively. Small values are deliberately chosen to increase the DEM time step and reduce thecomputational effort. In DEM, the resultant contact forces are governed by global equilibriumconsiderations. Hence contact stiffness values in the current application do not affect the overallmacro-mechanical behaviour as long as the stiffness is high enough to prevent any large inter-penetration of particles. The corresponding discrete element time step dt is 0.0001216 s.
The inter-particle friction angle and the damping ratios cannot be measured directly from theexperiment. The air resistance for the simulation is considered negligible, hence global dampingratio, ad, is set to zero. The inter-particle friction angle f is adjusted to match the measuredinitial pile slope of 298 to 318 prior to commencing the experiment. Contact damping ratio bd ischosen to be 0.02. DEM model properties are summarized in Table II.
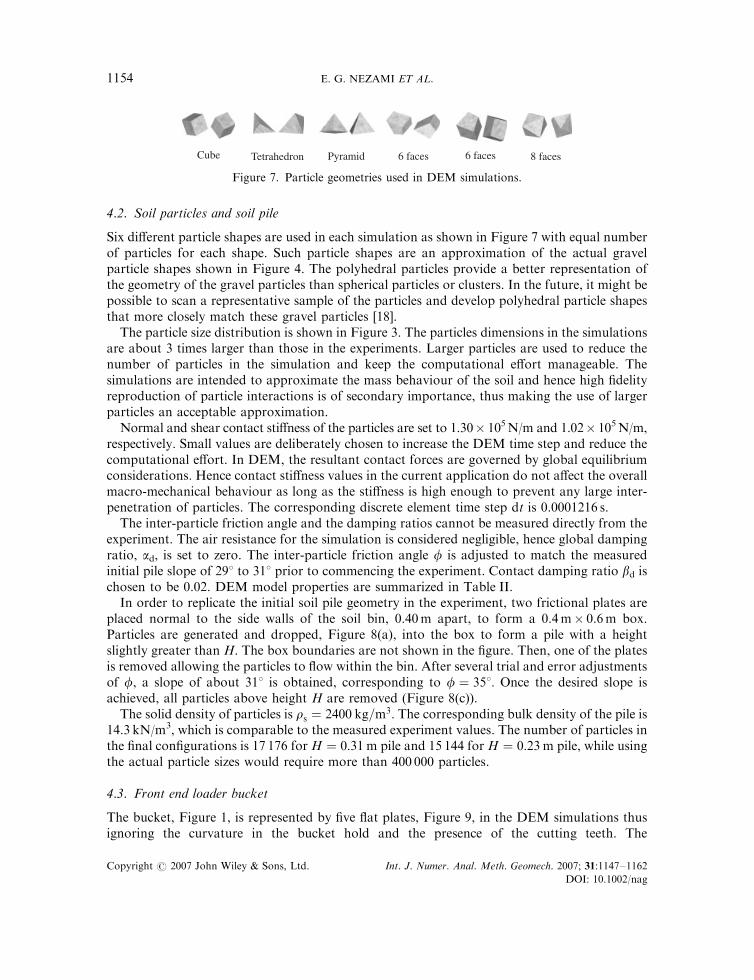
In order to replicate the initial soil pile geometry in the experiment, two frictional plates areplaced normal to the side walls of the soil bin, 0.40m apart, to form a 0.4m� 0.6m box.Particles are generated and dropped, Figure 8(a), into the box to form a pile with a heightslightly greater than H. The box boundaries are not shown in the figure. Then, one of the platesis removed allowing the particles to flow within the bin. After several trial and error adjustmentsof f, a slope of about 318 is obtained, corresponding to f ¼ 358: Once the desired slope isachieved, all particles above height H are removed (Figure 8(c)).
The solid density of particles is rs ¼ 2400 kg=m3: The corresponding bulk density of the pile is14.3 kN/m3, which is comparable to the measured experiment values. The number of particles inthe final configurations is 17 176 for H ¼ 0:31 m pile and 15 144 for H ¼ 0:23 m pile, while usingthe actual particle sizes would require more than 400 000 particles.
4.3. Front end loader bucket
The bucket, Figure 1, is represented by five flat plates, Figure 9, in the DEM simulations thusignoring the curvature in the bucket hold and the presence of the cutting teeth. The
Cube Tetrahedron Pyramid 6 faces 6 faces 8 faces
Figure 7. Particle geometries used in DEM simulations.
E. G. NEZAMI ET AL.1154
Copyright # 2007 John Wiley & Sons, Ltd. Int. J. Numer. Anal. Meth. Geomech. 2007; 31:1147–1162
DOI: 10.1002/nag
simplification is necessary to facilitate model development. The plates have the same contactproperties as particles used to represent the soil. For each of the simulated experiments, thetrajectory of the bucket, measured from the corresponding physical experiment, is imposed inthe simulation.
Table II. Model properties used in all DEM simulations.
Description Symbol Value
Friction angle between particles f 358Friction angle between soil particles and bin plates 358Normal contact stiffness KN 1.30� 105N/mShear contact stiffness KS 1.02� 105N/mGlobal damping ad 0Contact damping bd 0.02Material density rd 2400 kg/m3
Time step dt 0.0001216 s
H
(a) (b) (c)
Figure 8. Soil pile generation in DEM simulations: (a) dropping particles; (b) wall removal and particleflow; and (c) removal the top of the pile before starting the experiment.
0.31 m 0.10 m
0.07 m
0.14 m
0.16 m
Figure 9. Loader bucket geometry representation.
SIMULATION OF FRONT END LOADER BUCKET–SOIL INTERACTION 1155
Copyright # 2007 John Wiley & Sons, Ltd. Int. J. Numer. Anal. Meth. Geomech. 2007; 31:1147–1162
DOI: 10.1002/nag
5. RESULTS AND DISCUSSION
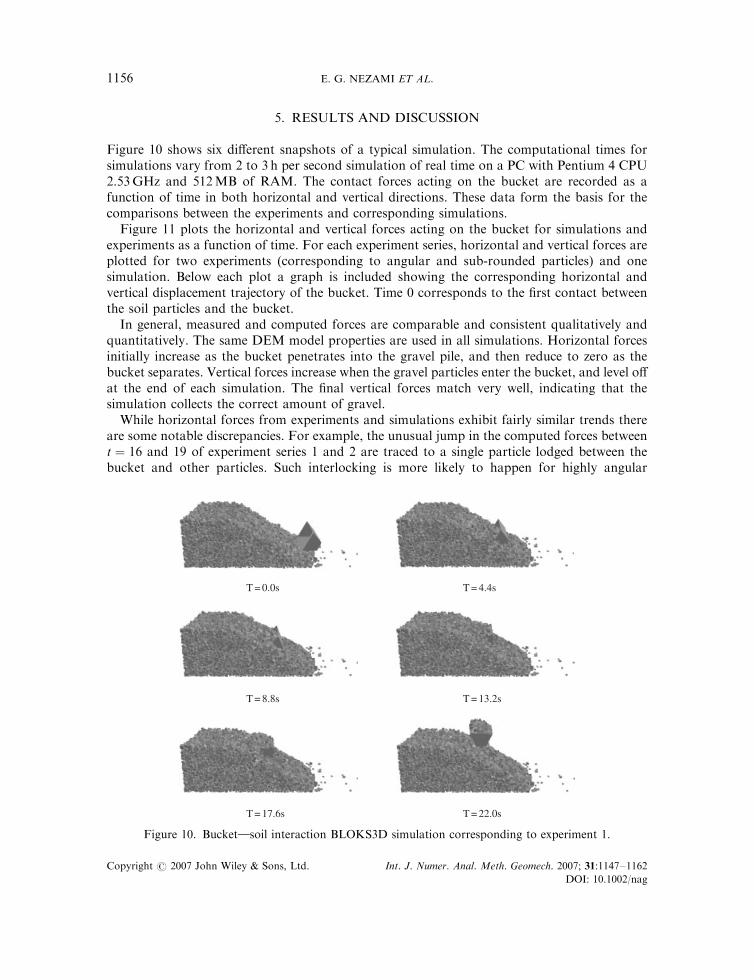
Figure 10 shows six different snapshots of a typical simulation. The computational times forsimulations vary from 2 to 3 h per second simulation of real time on a PC with Pentium 4 CPU2.53GHz and 512MB of RAM. The contact forces acting on the bucket are recorded as afunction of time in both horizontal and vertical directions. These data form the basis for thecomparisons between the experiments and corresponding simulations.
Figure 11 plots the horizontal and vertical forces acting on the bucket for simulations andexperiments as a function of time. For each experiment series, horizontal and vertical forces areplotted for two experiments (corresponding to angular and sub-rounded particles) and onesimulation. Below each plot a graph is included showing the corresponding horizontal andvertical displacement trajectory of the bucket. Time 0 corresponds to the first contact betweenthe soil particles and the bucket.
In general, measured and computed forces are comparable and consistent qualitatively andquantitatively. The same DEM model properties are used in all simulations. Horizontal forcesinitially increase as the bucket penetrates into the gravel pile, and then reduce to zero as thebucket separates. Vertical forces increase when the gravel particles enter the bucket, and level offat the end of each simulation. The final vertical forces match very well, indicating that thesimulation collects the correct amount of gravel.
While horizontal forces from experiments and simulations exhibit fairly similar trends thereare some notable discrepancies. For example, the unusual jump in the computed forces betweent ¼ 16 and 19 of experiment series 1 and 2 are traced to a single particle lodged between thebucket and other particles. Such interlocking is more likely to happen for highly angular
T = 0.0s
T = 8.8s
T = 17.6s
T = 4.4s
T = 13.2s
T = 22.0s
Figure 10. Bucket}soil interaction BLOKS3D simulation corresponding to experiment 1.
E. G. NEZAMI ET AL.1156
Copyright # 2007 John Wiley & Sons, Ltd. Int. J. Numer. Anal. Meth. Geomech. 2007; 31:1147–1162
DOI: 10.1002/nag

VerticalHorizontal
Experiment series 1: H = 0.23 m; h = 0.04 m
Experiment series 2: H = 0.23 m; h = 0.08 m
Experiment series 3: H = 0.23 m; h = 0.12 m
Dis
pl.(
m)
Forc
e(N
)
0.000.100.200.300.40
050
100150200250300
0 4 8 12 16 20 24
angular
simulationsub rounded
-0.050.000.050.100.15
-100-50
050
100150200
Dis
pl.(
m)
Forc
e(N
)
0.000.100.200.300.40
050
100150200250300
0 4 8 12 16 20 24-0.050.000.050.100.15
-100-50
050
100150200
0 4 8 12 16 20 24
0 4 8 12 16 20 24
Dis
pl.(
m)
Forc
e (N
)
0.000.100.200.300.40
050
100150200250300
0 4 8 12 16 20 24-0.050.000.050.100.15
-100-50
050
100150200
0 4 8 12 16 20 24
Time (s)Time (s)
Figure 11. Computed and measured bucket forces and bucket displacement trajectory.
SIMULATION OF FRONT END LOADER BUCKET–SOIL INTERACTION 1157
Copyright # 2007 John Wiley & Sons, Ltd. Int. J. Numer. Anal. Meth. Geomech. 2007; 31:1147–1162
DOI: 10.1002/nag

Vertical Horizontal
Experiment series 4: H = 0.23 m; h = 0.16 m D
ispl
.(m
)Fo
rce
(N)
050
100150200250300
0 4 8 12 16 20 240.00
0.10
0.20
0.30
0.40
-0.050.00
0.050.10
0.15
-100-50
050
100150200
0 4 8 12 16 20 24
Experiment series 5: H = 0.31 m; h = 0.04 m
Dis
pl.(
m)
Forc
e (N
)
0.00
0.100.20
0.300.40
050
100150200250300
0 4 8 12 16 20 24-0.050.00
0.050.100.15
-100-50
050
100150200
0 4 8 12 16 20 24
Experiment series 6: H = 0.31 m; h = 0.08 m
Dis
pl.(
m)
Forc
e (N
)
0.00
0.100.200.30
0.40
050
100150200250300
0 4 8 12 16 20 24-0.050.00
0.050.10
0.15
-100-50
050
100150200
0 4 8 12 16 20 24
Time (s)Time (s)
Figure 11. Continued.
E. G. NEZAMI ET AL.1158
Copyright # 2007 John Wiley & Sons, Ltd. Int. J. Numer. Anal. Meth. Geomech. 2007; 31:1147–1162
DOI: 10.1002/nag

VerticalHorizontalExperiment series 7: H = 0.31 m; h = 0.12 m
Dis
pl.(
m)
Forc
e (N
)
0.000.100.200.300.40
050
100150200250300
0 4 8 12 16 20 24-0.050.000.050.100.15
-100-50
050
100150200
0 4 8 12 16 20 24
Experiment series 8: H = 0.31 m ; h = 0.16 m
Dis
pl.(
m)
Forc
e (N
)
0.000.100.200.300.40
050
100150200250300
0 4 8 12 16 20 24-0.050.000.050.100.15
-100-50
050
100150200
0 4 8 12 16 20 24
Experiment series 9: H = 0.31 m ; h = 0.23 m
Dis
pl.(
m)
Forc
e (N
)
0.000.100.200.300.40
050
100150200250300
0 4 8 12 16 20 24-0.050.000.050.100.15
-100-50
050
100150200
0 4 8 12 16 20 24Time (s)Time (s)
Figure 11. Continued.
SIMULATION OF FRONT END LOADER BUCKET–SOIL INTERACTION 1159
Copyright # 2007 John Wiley & Sons, Ltd. Int. J. Numer. Anal. Meth. Geomech. 2007; 31:1147–1162
DOI: 10.1002/nag
particles in the simulation, especially the tetrahedron and the pyramid shown in Figure 7, and isresponsible for local jumps in the computed forces
The discrepancy between experiments and simulations is more pronounced for vertical forces.In almost all the cases, as long as the bucket is in contact with the pile, the simulation develops avertical force smaller than that of the experiment. This discrepancy vanishes at the end of thesimulations where the bucket separates from the soil pile. A primary contributor to thisdiscrepancy is the particle size difference between experiments and simulations. As the bucketcuts into the soil, new contacts develop between the soil particles and the bottom blade of thebucket. The number of particles inside the bucket is relatively small therefore most of thecontacts develop on the underside of the blade, resulting in a net upward (negative) force in bothsimulation and experiment. This negative vertical force can be observed in Figure 11 at the verybeginning of all experiments. In the experiments, particles can quickly rotate and move to adjusttheir positions, reducing the negative force. However, the large mass and moment of inertia ofparticles in the simulations make their rearrangement very slow, especially for more confinedparticles located underneath the bucket. As a result, when the bucket moves horizontally intothe pile it experiences a negative vertical force which is considerably more negative thanmeasured in the experiments. The discrepancy in the vertical forces is greater when the buckettrajectory remains horizontal or dips slightly downwards as in experiment series 1 (time 16–19 s),2, 3 (12–14 s), 8 and 9 (1–2 s) which amplifies the effects of the larger particle sizes. Otherexperiments, particularly experiment series 4 and 6 whereby the bucket moves verticallyupwards throughout the experiment, show a better match between the computed and measuredvertical forces.
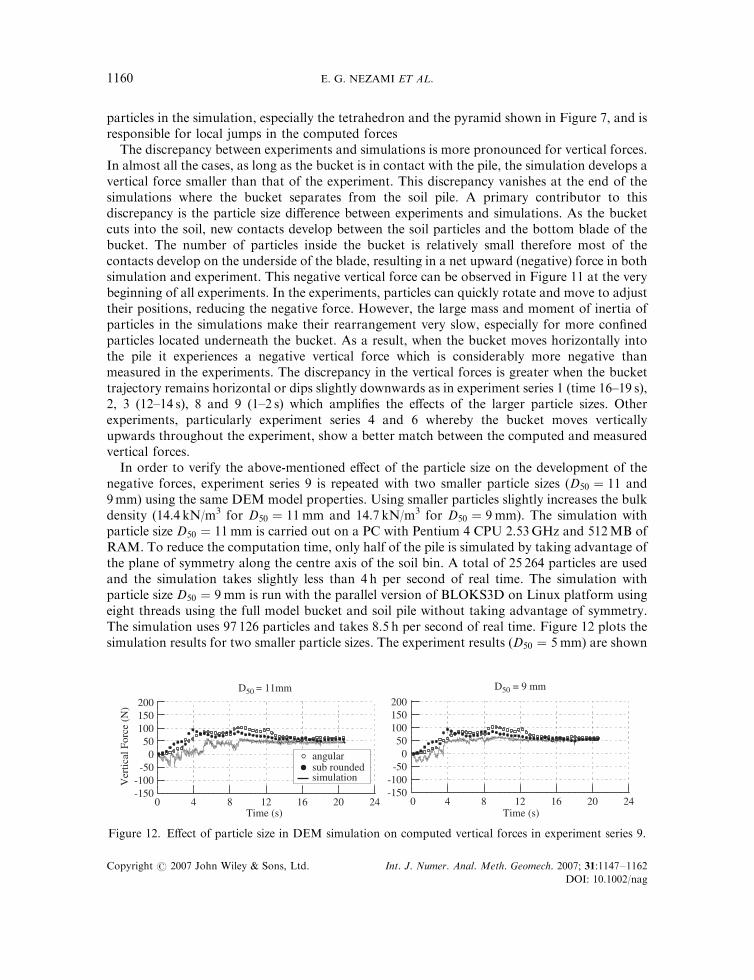
In order to verify the above-mentioned effect of the particle size on the development of thenegative forces, experiment series 9 is repeated with two smaller particle sizes (D50 ¼ 11 and9mm) using the same DEM model properties. Using smaller particles slightly increases the bulkdensity (14.4 kN/m3 for D50 ¼ 11 mm and 14.7 kN/m3 for D50 ¼ 9 mm). The simulation withparticle size D50 ¼ 11 mm is carried out on a PC with Pentium 4 CPU 2.53GHz and 512MB ofRAM. To reduce the computation time, only half of the pile is simulated by taking advantage ofthe plane of symmetry along the centre axis of the soil bin. A total of 25 264 particles are usedand the simulation takes slightly less than 4 h per second of real time. The simulation withparticle size D50 ¼ 9 mm is run with the parallel version of BLOKS3D on Linux platform usingeight threads using the full model bucket and soil pile without taking advantage of symmetry.The simulation uses 97 126 particles and takes 8.5 h per second of real time. Figure 12 plots thesimulation results for two smaller particle sizes. The experiment results (D50 ¼ 5 mm) are shown
D50 = 11mm D50 = 9 mm
Ver
tical
For
ce (
N)
simulation
angularsub rounded
-150-100-50
050
100150200
0 4 8 12 16 20 24-150-100-50
050
100150200
0 4 8 12 16 20 24Time (s) Time (s)
Figure 12. Effect of particle size in DEM simulation on computed vertical forces in experiment series 9.
E. G. NEZAMI ET AL.1160
Copyright # 2007 John Wiley & Sons, Ltd. Int. J. Numer. Anal. Meth. Geomech. 2007; 31:1147–1162
DOI: 10.1002/nag

in all graphs for reference. The simulation results approach the experiment results withdecreasing particle size. The negative vertical force at the initial stage of simulation drops from100N (for D50 ¼ 14 mm; Figure 11) to 50N (for D50 ¼ 11 mm) to 35N (for D50 ¼ 9 mm).
In addition to the particle size, the following factors likely contribute to the observeddiscrepancies between the simulations and the experiments:
* The polyhedral particles used in the DEM simulations do not accurately represent thegeometry of the particles in the experiments. Further refinement in the selected range ofparticle shapes might further enhance the numerical simulation results.
* None of the particle contact properties, sometimes referred to as micro-mechanicalproperties, required in DEM, such as inter-particle friction angle, damping ratio, contactstiffness, and material density, are available from the physical experiments. Instead theyare either calculated or estimated from the bulk density and the slope angle of the pile priorto the simulations. They were not adjusted to obtain a better fit with the experiments.Errors in estimations of those properties are a possible source of discrepancy.
* The bucket in the simulation is represented by five flat plates, and the curvature in thebucket hold and presence of cutting teeth are neglected (compare Figures 1 and 9). Also, allinterface properties of the bucket in the simulation are assumed to be identical to those ofthe gravel particles which is not necessarily accurate.
Regardless of these discrepancies, the simulations demonstrate that DEM is a reliable tool forcapturing the interaction between soil and earthmoving equipment and can be used in therefinement of equipment design.
6. CONCLUDING REMARKS
The paper presents the results of a series of discrete element simulations. Each simulationreplicates an experiment performed to measure the forces acting on the bucket of a front endloader during typical soil manipulation. Overall the simulations provide results consistent withmeasurements demonstrating the reliability of DEM simulations for characterizing forcefeedback during soil–tool interaction. The differences between the measured and calculatedvertical forces are mostly attributed to large particle sizes used in the simulation. The use ofsmaller particles and hence larger number of particles mitigate the observed differences. Use oflarger number of particles is currently computationally demanding but will likely be lessof a limitation as even faster computers become available.
ACKNOWLEDGEMENTS
This work is sponsored by the National Science Foundation under Grant no. CMS-0113745. Any opinions,findings, conclusions, or recommendations expressed in this material are those of the authors and do notnecessarily reflect the views of the National Science Foundation. The authors would like to thankMr Thomas Congdon in the soil laboratory in Caterpillar, Inc. for assisting with experiments, andDr Frank Huck and Keven W. Hofstetter of Caterpillar, Inc. for their continued support of this effort.The authors would also like to thank Mr Ibrahim Mohammad for developing the visualization programVisDEM3D.
SIMULATION OF FRONT END LOADER BUCKET–SOIL INTERACTION 1161
Copyright # 2007 John Wiley & Sons, Ltd. Int. J. Numer. Anal. Meth. Geomech. 2007; 31:1147–1162
DOI: 10.1002/nag

REFERENCES
1. Rothenburg L, Bathurst RJ. Analytical study of induced anisotropy in idealized granular materials. Geotechnique1989; 39(4):601–614.
2. Cundall PA, Strack OLD. Modeling of micromechanics in granular material.Mechanics of Granular Materials: NewModels and Constitutive Relations. Elsevier: Amsterdam, 1983.
3. Bathurst RJ, Rothenburg L. Micromechanical aspects of isotropic granular assemblies with linear contactinteractions. Journal of Applied Mechanics 1988; 55(3):17–23.
4. Shodja HM, Nezami EG. A micromechanical study of rolling and sliding contacts in assemblies of oval granules.International Journal for Numerical and Analytical Methods in Geomechanics 2003; 27(5):403–424.
5. Bardet JP, Proubet J. A numerical investigation of the structure of persistent shear bands in granular media.Geotechnique 1991; 41(4):599–613.
6. Iwashita K, Oda M. Micro-deformation mechanism of shear banding process based on modified distinct elementmethod. Powder Technology 2000; 109(1–3):192–205.
7. Oda M, Iwashita K. Study on couple stress and shear band development in granular media based on numericalsimulation analyses. International Journal of Engineering Science 2000; 38(15):1713–1740.
8. Lin X, NG TT. A three-dimensional discrete element model using arrays of ellipsoids. Geotechnique 1997; 47(2):319–329.
9. Cleary PW. DEM simulation of industrial particle flows: case studies of dragline excavators, mixing in tumblers andcentrifugal mills. Powder Technology 2000; 209(1–3):83–104.
10. Morris JP, Rubin MB, Blair SC, Glenn LA, Heuze FE. Simulations of underground structures subjected to dynamicloading using the distinct element method. Engineering Computations 2004; 21(2–4):384–408.
11. Moakher M, Shinbrot T, Muzzio FJ. Experimentally validated computations of flow, mixing and segregation ofnon-cohesive grains in 3D tumbling blenders. Powder Technology 2000; 109(1–3):58–71.
12. Laurent BFC, Cleary PW. Comparative study of DEM and experimental results of flow patterns in a ploughsharemixer. Third International Conference on Discrete Element Methods, Santa Fe, NM. ASCE: New York, 2002.
13. Matsushima T, Saomoto H, Matsumoto M, Toda K, Yamada Y. Discrete element simulation of an assembly ofirregularly shaped grains: quantitative comparison with experiments. 16th ASCE Engineering Mechanics Conference,University of Washington, Seattle. ASCE: New York, 2003.
14. Zhao D, Nezami EG, Hashash YMA, Ghaboussi J. Three-dimensional discrete element simulation for granularmaterials. Engineering Computations 2006; 23(7):749–770.
15. Cundall PA. Formulation of a three-dimensional distinct element model}part I: a scheme to detect and representcontacts in a system composed of many polyhedral blocks. International Journal of Rock Mechanics and MiningSciences and Geomechanics Abstracts 1988; 25(3):107–116.
16. Nezami EG, Hashash YMA, Zhao D, Ghaboussi J. Shortest link method for contact detection in discrete elementmethod. International Journal for Numerical and Analytical Methods in Geomechanics 2006; 30(8):783–801.
17. Nezami E, Hashash YMA, Zhao D, Ghaboussi J. A fast contact detection algorithm for 3-D discrete elementmethod. Computers and Geotechnics 2004; 31:575–587.
18. Tutumluer E, Huang H, Hashash YMA, Ghaboussi J. Imaging based discrete element modeling of granularassemblies. Multiscale and Functionally Graded Materials Conference 2006 (FGM2006), Honolulu, HI, 2006.
E. G. NEZAMI ET AL.1162
Copyright # 2007 John Wiley & Sons, Ltd. Int. J. Numer. Anal. Meth. Geomech. 2007; 31:1147–1162
DOI: 10.1002/nag