
Simulation of Energy and Media Demand of Beverage Bottling ...
21
sustainability Article Simulation of Energy and Media Demand of Beverage Bottling Plants by Automatic Model Generation Raik Martin Bär 1, * , Michael Zeilmann 1 , Christoph Nophut 1 , Joachim Kleinert 2 , Karsten Beyer 2 and Tobias Voigt 1 Citation: Bär, R.M.; Zeilmann, M.; Nophut, C.; Kleinert, J.; Beyer, K.; Voigt, T. Simulation of Energy and Media Demand of Beverage Bottling Plants by Automatic Model Generation. Sustainability 2021, 13, 10089. https://doi.org/10.3390/ su131810089 Academic Editor: Biagio Bianchi Received: 15 July 2021 Accepted: 4 September 2021 Published: 9 September 2021 Publisher’s Note: MDPI stays neutral with regard to jurisdictional claims in published maps and institutional affil- iations. Copyright: © 2021 by the authors. Licensee MDPI, Basel, Switzerland. This article is an open access article distributed under the terms and conditions of the Creative Commons Attribution (CC BY) license (https:// creativecommons.org/licenses/by/ 4.0/). 1 Chair of Brewing and Beverage Technology, Technical University of Munich, 85354 Freising, Germany; [email protected] (M.Z.); [email protected] (C.N.); [email protected] (T.V.) 2 SimPlan AG, 01217 Dresden, Germany; [email protected] (J.K.); [email protected] (K.B.) * Correspondence: [email protected] Abstract: Facing environmental challenges, high energy costs and a growing public awareness, the global brewing industry is increasingly publishing ambitious targets toward a more sustainable production. Small and medium-sized enterprises of the brewing and beverage industry cannot ensure energy and media efficiency mainly due to capital and knowledge inadequacy. This article addresses this problem and presents a pragmatic method to determine the energy and media demand. Accordingly, a modeling editor as well as a standardized data structure and automatic simulation parameter determination tools were developed to implement the method. A given production plant can be modeled with adequate details using the presented editor. Based on a configuration file, a holistic simulation model can be generated automatically in a simulation environment. A beverage bottling plant was studied, and the necessary datasets were obtained for implementing the proposed editor and, thereby, the method. It was confirmed that the simulated values of electrical energy and compressed air consumption match the measured empirical data. The measures to increase energy and media efficiency were also found effective. Using the presented method, enterprises of the brewing and beverage industry can easily uncover avenues for potential savings, test the effectiveness of optimization strategies, and substantiate possible investment decisions. Keywords: bottling; modeling; simulation; energy and media demand; validation 1. Introduction For a clean and sustainable production, the brewing and beverage industry is chal- lenged to optimize its energy efficiency [1]. Facing environmental challenges, high energy costs and a growing public awareness, including the United Nations sustainable develop- ment goals [2], the global brewing industry is required to produce more sustainably. Large brewery groups, in particular, publish ambitious targets regarding a more sustainable production [3–5]. When discussing sustainable production, different issues, which should be considered at the same time, must be taken into account [6]. In addition to the material efficiency of the materials of the primary production, energy efficiency plays a particularly important role [7,8]. The material efficiency requires knowledge of the previous production processes. With the help of a simulation, which is also mentioned as a tool for optimization in the course of the digital factory [9,10], the energy efficiency can be improved [11]. The simulation is primarily used for the holistic analysis of complex production systems and is suitable for uncovering the optimization potential without interrupting the ongoing production [12,13]. The beverage industry is challenged by the conflicting demands of high product quality and diversity and cost-effective production. Increasing energy ef- ficiency and flexible production can sustainably reduce costs and consequently increase competitiveness [14,15]. However, simulation studies are usually associated with high costs and require a high level of expertise, especially for modeling complex systems [16]. In addition, a comprehensive database is essential for the success of simulation studies [12]. Sustainability 2021, 13, 10089. https://doi.org/10.3390/su131810089 https://www.mdpi.com/journal/sustainability
-
Upload
khangminh22 -
Category
Documents
-
view
0 -
download
0
Transcript of Simulation of Energy and Media Demand of Beverage Bottling ...

sustainability
Article
Simulation of Energy and Media Demand of Beverage BottlingPlants by Automatic Model Generation
Raik Martin Bär 1,* , Michael Zeilmann 1, Christoph Nophut 1, Joachim Kleinert 2, Karsten Beyer 2
and Tobias Voigt 1
�����������������
Citation: Bär, R.M.; Zeilmann, M.;
Nophut, C.; Kleinert, J.; Beyer, K.;
Voigt, T. Simulation of Energy and
Media Demand of Beverage Bottling
Plants by Automatic Model
Generation. Sustainability 2021, 13,
10089. https://doi.org/10.3390/
su131810089
Academic Editor: Biagio Bianchi
Received: 15 July 2021
Accepted: 4 September 2021
Published: 9 September 2021
Publisher’s Note: MDPI stays neutral
with regard to jurisdictional claims in
published maps and institutional affil-
iations.
Copyright: © 2021 by the authors.
Licensee MDPI, Basel, Switzerland.
This article is an open access article
distributed under the terms and
conditions of the Creative Commons
Attribution (CC BY) license (https://
creativecommons.org/licenses/by/
4.0/).
1 Chair of Brewing and Beverage Technology, Technical University of Munich, 85354 Freising, Germany;[email protected] (M.Z.); [email protected] (C.N.); [email protected] (T.V.)
2 SimPlan AG, 01217 Dresden, Germany; [email protected] (J.K.); [email protected] (K.B.)* Correspondence: [email protected]
Abstract: Facing environmental challenges, high energy costs and a growing public awareness, theglobal brewing industry is increasingly publishing ambitious targets toward a more sustainableproduction. Small and medium-sized enterprises of the brewing and beverage industry cannotensure energy and media efficiency mainly due to capital and knowledge inadequacy. This articleaddresses this problem and presents a pragmatic method to determine the energy and media demand.Accordingly, a modeling editor as well as a standardized data structure and automatic simulationparameter determination tools were developed to implement the method. A given production plantcan be modeled with adequate details using the presented editor. Based on a configuration file, aholistic simulation model can be generated automatically in a simulation environment. A beveragebottling plant was studied, and the necessary datasets were obtained for implementing the proposededitor and, thereby, the method. It was confirmed that the simulated values of electrical energyand compressed air consumption match the measured empirical data. The measures to increaseenergy and media efficiency were also found effective. Using the presented method, enterprisesof the brewing and beverage industry can easily uncover avenues for potential savings, test theeffectiveness of optimization strategies, and substantiate possible investment decisions.
Keywords: bottling; modeling; simulation; energy and media demand; validation
1. Introduction
For a clean and sustainable production, the brewing and beverage industry is chal-lenged to optimize its energy efficiency [1]. Facing environmental challenges, high energycosts and a growing public awareness, including the United Nations sustainable develop-ment goals [2], the global brewing industry is required to produce more sustainably. Largebrewery groups, in particular, publish ambitious targets regarding a more sustainableproduction [3–5]. When discussing sustainable production, different issues, which shouldbe considered at the same time, must be taken into account [6]. In addition to the materialefficiency of the materials of the primary production, energy efficiency plays a particularlyimportant role [7,8]. The material efficiency requires knowledge of the previous productionprocesses. With the help of a simulation, which is also mentioned as a tool for optimizationin the course of the digital factory [9,10], the energy efficiency can be improved [11]. Thesimulation is primarily used for the holistic analysis of complex production systems andis suitable for uncovering the optimization potential without interrupting the ongoingproduction [12,13]. The beverage industry is challenged by the conflicting demands ofhigh product quality and diversity and cost-effective production. Increasing energy ef-ficiency and flexible production can sustainably reduce costs and consequently increasecompetitiveness [14,15]. However, simulation studies are usually associated with highcosts and require a high level of expertise, especially for modeling complex systems [16].In addition, a comprehensive database is essential for the success of simulation studies [12].
Sustainability 2021, 13, 10089. https://doi.org/10.3390/su131810089 https://www.mdpi.com/journal/sustainability

Sustainability 2021, 13, 10089 2 of 21
However, these data are subject to uncertainty. This presents insurmountable barriersfor a sustainable production for small and medium-sized enterprises (SME) [17,18]. Thebeverage industry, whose production is very energy- and media-intensive [1], is charac-terized by small companies: 90% of the German brewing landscape consists of small andmedium-sized breweries [19]. About 30% of the electrical energy demand and about 25%of the thermal energy demand can be attributed to bottling/packaging [1,12]. Accordingly,this complex and multi-layered area holds a potential for increasing energy and mediaefficiency. Osterroth et al. [20] provides a detailed overview of the consumption structurein beverage bottling plants.
An overview of the simulation and other methods for increasing energy efficiencyin batch-oriented processes and the discrete packaging area in the beverage industry isgiven by Bär and Voigt [12]. Publications in the bottling area consider a wide variety ofaspects [21–24], mostly with a focus on increasing efficiency, but not on energy and mediaconsumption [25–28]. Approaches considering an increase in energy and media efficiencyare limited with regard to various factors. To enable simple, quick, and cost-effectiveanalyses and optimizations for SMEs, these barriers must be overcome.
To map real behavior, the entire beverage bottling plant, with its interlinkages, mustbe considered [29]. Few approaches deal only with partial areas or machines or selectedtypes of energy and media. Dilay et al. [30] describe the detailed optimization of a tunnelpasteurizer by investigating the energy impact of various input parameters. As a result,various concepts were presented regarding a structural modification of the machine toachieve considerable savings of thermal and electrical energy. In their green breweryconcept, Muster-Slawitsch et al. [31] describe the increase of energy efficiency and the useof renewable energy sources in the brewery—inter alia, in the bottling area. The reuseof thermal energy through hot water management is investigated and optimized. Thesimulation of water flows in a dairy is used by Marchini et al. [32]. The impact of the plantlayout on water consumption is investigated using two use cases, and savings of 7.2% areachieved in theory. Using the integration of life-cycle assessment in a discrete-event basedsimulation, Johansson et al. [33] simulate an aseptic packaging line for fruit juices. Theentire plant is examined in terms of its emissions and waste, and a validation is carried outby comparing with real consumption values. It is shown that discrete-event simulation is asuitable tool for the rapid and cost-effective estimation of optimizations.
The complexity of the methods poses another challenge with respect to their ease ofuse. Hubert et al. [34] present a simulation based on reference networks. An approach foroptimizing wastewater production by scheduling processes in a beverage bottling plant ispresented. Compared to a genetic algorithm approach, 10% of wastewater could be savedand water demand reduced accordingly. A validation based on real data is not carried out,which is another cornerstone of the approaches described in the literature. Furthermore,water consumption is simulated with regard to chemical oxygen demand, a criterion ofwater quality [35]. A validation with real data shows the good fit of the simulation. Basedon an extensive database, Osterroth et al. [36] analyzed the electrical energy consumptionof the machines at a beverage bottling plant in detail. The operating state depended onthe consumption behavior of the individual units and is proven, and time-dependentconsumption levels within the states are introduced. An extensive validation underpinsthe method, which, however, covers only electrical energy. Forster [37] describes a holisticapproach to the modeling and simulation of beverage bottling plants with regard to energyand media consumption. The discrete-event simulation environment Plant Simulation isused, and a model is represented by predefined components. Various energy and mediaconsumptions are machine-specifically simulated using state models, and the results areoutlined by way of example. However, no detailed insight is given into how energyand media consumption are mapped. The validation is also insufficiently presented anddoes not provide any information about the suitability of the method. Information onthe framework conditions, such as the production process, is not given. The inclusionof a production plan enables a description of the energy consumption during inactive

Sustainability 2021, 13, 10089 3 of 21
production times [38]. Hubert [39] describes in a comprehensive work a simulation basedon reference networks of a beverage bottling plant over a period of one week regardingthe electrical and thermal ernergy demand as well as the water consumption. The failurebehavior of certain aggregates of the plant is described by a Weibull distribution for theoperation and the failure, and, furthermore, the start-up as well as the production andthe final phase of the bottling process are described. It is shown that the bottling area isone of the main consumers of the above-mentioned energy and media types and thereforerepresents an enormous potential for improving energy and media efficiency. Simulationstudies for the entire brewery, based on the variation of production schedules by adjustingthe start times of the respective recipes, were carried out to reduce the electric peakloads. Savings in the double-digit percentage range were achieved. The work describesan interesting holistic approach, whereas no validation with real data takes place. Toovercome the mentioned barriers, user-friendly modeling and the automatic generation ofsimulation models are recommended.
However, the available database, which is usually insufficient, poses a challenge, inparticular for validation [40,41]. There are numerous applications for validating simula-tions, such as the comparison with other models or with recorded data [42]. The choice ofthe appropriate validation technique depends on the degree of subjectivity [42,43]. Oster-roth et al. [36] use the average percentage deviation (APD) and Theil’s inequality coefficient(TIC) for the statistical validation of the simulation results, which tests the credibility of themodel. This method is also used in some other publications [44–47]. Al-Hawari et al. [25]and Johansson et al. [33] both use the simple comparison of simulation results with theresults of reality for the validation of their model.
The barriers listed are taken up in this work, and a method for the automatic genera-tion of simulation models for the holistic simulation of energy and media consumption forbeverage bottling plants is developed. Figure 1 shows an overview of the approach in itsmajor steps. For a simple and fast modeling of complex production systems, an alreadypresented modeling concept, implemented in a user-friendly software, was used [48]. Withan extensive database, it was possible to model and parameterize beverage bottling plantswith regard to the physical plant, the articles, and the production plan. The simulationmodel is automatically generated via an extensible markup-language (XML)-based config-uration file in a time-discrete simulation environment. A holistic production plant withregard to all energy and media demands, including a production plan, could be simulated.The methodology is validated in detail and use cases are applied in this work.
Sustainability 2021, 13, x FOR PEER REVIEW 3 of 23
given into how energy and media consumption are mapped. The validation is also insuf-ficiently presented and does not provide any information about the suitability of the method. Information on the framework conditions, such as the production process, is not given. The inclusion of a production plan enables a description of the energy consumption during inactive production times [38]. Hubert [39] describes in a comprehensive work a simulation based on reference networks of a beverage bottling plant over a period of one week regarding the electrical and thermal ernergy demand as well as the water consumption. The failure behavior of certain aggregates of the plant is described by a Weibull distribution for the operation and the failure, and, furthermore, the start-up as well as the production and the final phase of the bottling process are described. It is shown that the bottling area is one of the main consumers of the above-mentioned energy and media types and therefore represents an enormous potential for improving energy and media efficiency. Simulation studies for the entire brewery, based on the variation of production schedules by adjusting the start times of the respective recipes, were carried out to reduce the electric peak loads. Savings in the double-digit percentage range were achieved. The work describes an interesting holistic approach, whereas no validation with real data takes place. To overcome the mentioned barriers, user-friendly modeling and the automatic generation of simulation models are recommended.
However, the available database, which is usually insufficient, poses a challenge, in particular for validation [40,41]. There are numerous applications for validating simula-tions, such as the comparison with other models or with recorded data [42]. The choice of the appropriate validation technique depends on the degree of subjectivity [42,43]. Oster-roth et al. [36] use the average percentage deviation (APD) and Theil's inequality coeffi-cient (TIC) for the statistical validation of the simulation results, which tests the credibility of the model. This method is also used in some other publications [44–47]. Al-Hawari et al. [25] and Johansson et al. [33] both use the simple comparison of simulation results with the results of reality for the validation of their model.
The barriers listed are taken up in this work, and a method for the automatic gener-ation of simulation models for the holistic simulation of energy and media consumption for beverage bottling plants is developed. Figure 1 shows an overview of the approach in its major steps. For a simple and fast modeling of complex production systems, an already presented modeling concept, implemented in a user-friendly software, was used [48]. With an extensive database, it was possible to model and parameterize beverage bottling plants with regard to the physical plant, the articles, and the production plan. The simu-lation model is automatically generated via an extensible markup-language (XML)-based configuration file in a time-discrete simulation environment. A holistic production plant with regard to all energy and media demands, including a production plan, could be sim-ulated. The methodology is validated in detail and use cases are applied in this work.
Figure 1. Overview of the main steps of the approach.
Figure 1. Overview of the main steps of the approach.
2. Beverage Bottling Plant Investigated and Database
The subject of the study is an industrial refillable glass beverage bottling plant formineral water and soft drinks of one of the 10 largest mineral water companies in Germany(according to sales) [49]. The main product of the plant includes mineral waters, whichare distributed nationwide. The plant is shown in simplified form in Figure 2 and gen-erally represents the schematic structure of this type of plant. The plant is divided into
Sustainability 2021, 13, 10089 4 of 21
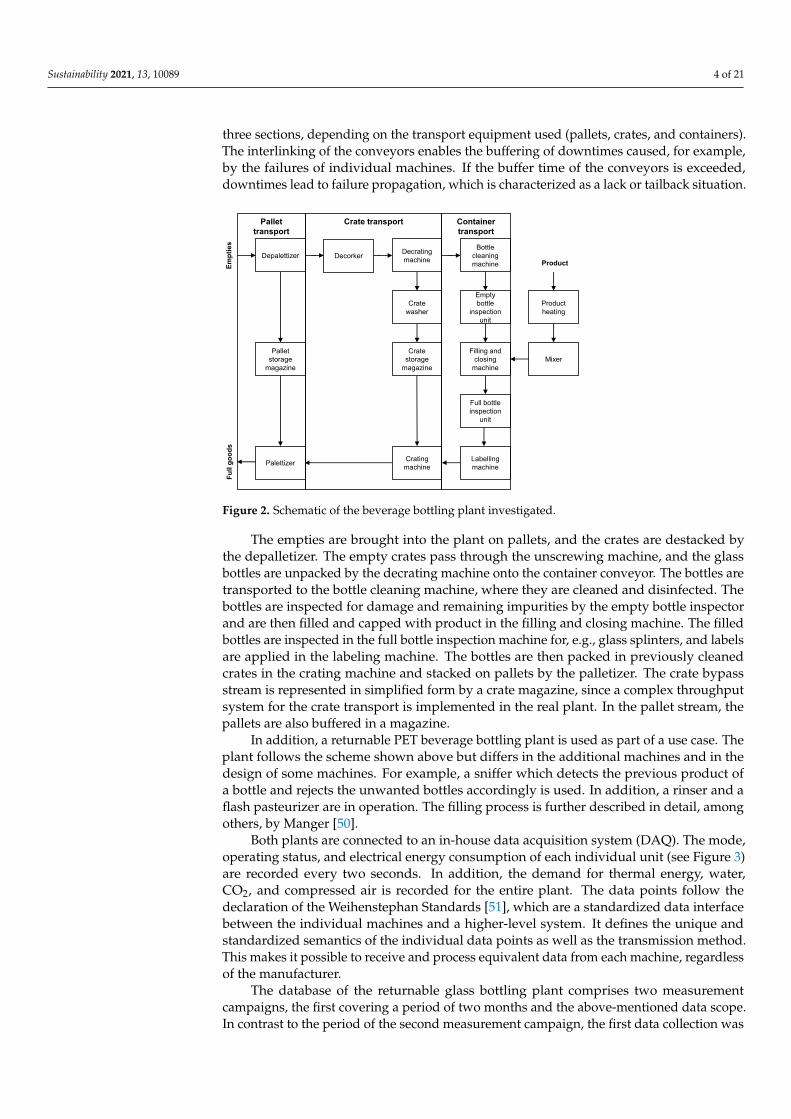
three sections, depending on the transport equipment used (pallets, crates, and containers).The interlinking of the conveyors enables the buffering of downtimes caused, for example,by the failures of individual machines. If the buffer time of the conveyors is exceeded,downtimes lead to failure propagation, which is characterized as a lack or tailback situation.
Sustainability 2021, 13, x FOR PEER REVIEW 4 of 23
2. Beverage Bottling Plant Investigated and Database The subject of the study is an industrial refillable glass beverage bottling plant for
mineral water and soft drinks of one of the 10 largest mineral water companies in Ger-many (according to sales) [49]. The main product of the plant includes mineral waters, which are distributed nationwide. The plant is shown in simplified form in Figure 2 and generally represents the schematic structure of this type of plant. The plant is divided into three sections, depending on the transport equipment used (pallets, crates, and contain-ers). The interlinking of the conveyors enables the buffering of downtimes caused, for example, by the failures of individual machines. If the buffer time of the conveyors is ex-ceeded, downtimes lead to failure propagation, which is characterized as a lack or tailback situation.
Figure 2. Schematic of the beverage bottling plant investigated.
The empties are brought into the plant on pallets, and the crates are destacked by the depalletizer. The empty crates pass through the unscrewing machine, and the glass bottles are unpacked by the decrating machine onto the container conveyor. The bottles are trans-ported to the bottle cleaning machine, where they are cleaned and disinfected. The bottles are inspected for damage and remaining impurities by the empty bottle inspector and are then filled and capped with product in the filling and closing machine. The filled bottles are inspected in the full bottle inspection machine for, e.g., glass splinters, and labels are applied in the labeling machine. The bottles are then packed in previously cleaned crates in the crating machine and stacked on pallets by the palletizer. The crate bypass stream is represented in simplified form by a crate magazine, since a complex throughput system for the crate transport is implemented in the real plant. In the pallet stream, the pallets are also buffered in a magazine.
In addition, a returnable PET beverage bottling plant is used as part of a use case. The plant follows the scheme shown above but differs in the additional machines and in the design of some machines. For example, a sniffer which detects the previous product of a bottle and rejects the unwanted bottles accordingly is used. In addition, a rinser and a flash pasteurizer are in operation. The filling process is further described in detail, among others, by Manger [50].
Both plants are connected to an in-house data acquisition system (DAQ). The mode, operating status, and electrical energy consumption of each individual unit (see Figure 3) are recorded every two seconds. In addition, the demand for thermal energy, water, CO2, and compressed air is recorded for the entire plant. The data points follow the declaration of the Weihenstephan Standards [51], which are a standardized data interface between
Depalettizer Decorker Decratingmachine
Bottlecleaningmachine
Empty bottle
inspectionunit
Filling and closing
machine
Full bottleinspection
unit
Labellingmachine
CratingmachinePalettizer
Cratestorage
magazine
Cratewasher
Palletstorage
magazine
Pallettransport
Crate transport Container transport
Productheating
Mixer
Product
Full
good
sEm
ptie
s
Figure 2. Schematic of the beverage bottling plant investigated.
The empties are brought into the plant on pallets, and the crates are destacked bythe depalletizer. The empty crates pass through the unscrewing machine, and the glassbottles are unpacked by the decrating machine onto the container conveyor. The bottles aretransported to the bottle cleaning machine, where they are cleaned and disinfected. Thebottles are inspected for damage and remaining impurities by the empty bottle inspectorand are then filled and capped with product in the filling and closing machine. The filledbottles are inspected in the full bottle inspection machine for, e.g., glass splinters, and labelsare applied in the labeling machine. The bottles are then packed in previously cleanedcrates in the crating machine and stacked on pallets by the palletizer. The crate bypassstream is represented in simplified form by a crate magazine, since a complex throughputsystem for the crate transport is implemented in the real plant. In the pallet stream, thepallets are also buffered in a magazine.
In addition, a returnable PET beverage bottling plant is used as part of a use case. Theplant follows the scheme shown above but differs in the additional machines and in thedesign of some machines. For example, a sniffer which detects the previous product ofa bottle and rejects the unwanted bottles accordingly is used. In addition, a rinser and aflash pasteurizer are in operation. The filling process is further described in detail, amongothers, by Manger [50].
Both plants are connected to an in-house data acquisition system (DAQ). The mode,operating status, and electrical energy consumption of each individual unit (see Figure 3)are recorded every two seconds. In addition, the demand for thermal energy, water,CO2, and compressed air is recorded for the entire plant. The data points follow thedeclaration of the Weihenstephan Standards [51], which are a standardized data interfacebetween the individual machines and a higher-level system. It defines the unique andstandardized semantics of the individual data points as well as the transmission method.This makes it possible to receive and process equivalent data from each machine, regardlessof the manufacturer.
The database of the returnable glass bottling plant comprises two measurementcampaigns, the first covering a period of two months and the above-mentioned data scope.In contrast to the period of the second measurement campaign, the first data collection was

Sustainability 2021, 13, 10089 5 of 21
characterized by an almost continuous production (apart from the weekend). For externalreasons, the beverage bottling plant was in operation for only about 3 days per week duringthe second period (4 weeks). The individual units were equipped with measuring devicesfor recording the demand for compressed air and were connected to the DAQ. Further,units such as the empty bottle inspector, the full bottle inspector, and the decorker wereadded to the current measurement. The only consumer of thermal energy and water isthe bottle cleaning machine, as its warm wastewater is used for the crate washer. Thefilling machine is the only unit requiring CO2 for the production of certain articles. Amanufacturing execution system (MES) served as a source, for both plants, for detailedplans, which includes the production times, quantities of the articles produced, and longdowntimes, caused by failures as well as maintenance and cleaning. The database for thereturnable PET bottling plant comprises a period of 2 months, including data points suchas the mode, the operating state, as well as the electrical energy demand of all machines.
Sustainability 2021, 13, x FOR PEER REVIEW 5 of 23
the individual machines and a higher-level system. It defines the unique and standardized semantics of the individual data points as well as the transmission method. This makes it possible to receive and process equivalent data from each machine, regardless of the man-ufacturer.
Figure 3. Layout and units of the simulated beverage bottling plant in the modeling editor (detailed version as presented by Bär et al. [48]).
The database of the returnable glass bottling plant comprises two measurement cam-paigns, the first covering a period of two months and the above-mentioned data scope. In contrast to the period of the second measurement campaign, the first data collection was characterized by an almost continuous production (apart from the weekend). For external reasons, the beverage bottling plant was in operation for only about 3 days per week dur-ing the second period (4 weeks). The individual units were equipped with measuring de-vices for recording the demand for compressed air and were connected to the DAQ. Fur-ther, units such as the empty bottle inspector, the full bottle inspector, and the decorker were added to the current measurement. The only consumer of thermal energy and water is the bottle cleaning machine, as its warm wastewater is used for the crate washer. The filling machine is the only unit requiring CO2 for the production of certain articles. A man-ufacturing execution system (MES) served as a source, for both plants, for detailed plans, which includes the production times, quantities of the articles produced, and long down-times, caused by failures as well as maintenance and cleaning. The database for the re-turnable PET bottling plant comprises a period of 2 months, including data points such as the mode, the operating state, as well as the electrical energy demand of all machines.
The measured data from the DAQ are converted to a uniform data structure, which also serves as the structure for the data generated by the simulation. The data within the structure are divided into interval data, which include information such as the mode and operating state, and timestamp data, which cover all data, such as consumption values.
Figure 3. Layout and units of the simulated beverage bottling plant in the modeling editor (detailed version as presented byBär et al. [48]).
The measured data from the DAQ are converted to a uniform data structure, whichalso serves as the structure for the data generated by the simulation. The data within thestructure are divided into interval data, which include information such as the mode andoperating state, and timestamp data, which cover all data, such as consumption values.The corresponding machines as well as data points are referenced via keys, which allowsfor an easy extension of the data structure.
3. Energy Consumption Behavior
Based on the findings of Osterroth et al. [36], the operating state-related consumptionbehavior of packaging machines is used in the modeling and simulation and assignedto the following energy and media types: electrical energy, thermal energy, compressedair, water, and CO2. The time-dependent intermediate-level application is omitted due

Sustainability 2021, 13, 10089 6 of 21
to the granularity of the modeling on the unit level (see Chapter 5). In the definitionof the consumption levels, the operating mode (WS_Cur_Mode) and the operating state(WS_Cur_State) [51], which is described by a state model, are used. Table 1 shows theassignment of the individual modes and states, which appear in the real data, to theconsumption levels.
OL is described by the off-mode (inactive) in the data point WS_Cur_Mode. This ispresent in standstill, e.g., on a weekend in which no production is planned. It is proventhat most of the units also have a demand for energy and media in this case [36]. Duringproduction, the listed operating states (WS_Cur_State) can be present. These are basicallydivided into the normal operation of the machine (CL), a lack or tailback situation (DL1), aswell as failure situations (DL2).
Table 1. Assignment of the consumption levels according to WS_Cur_State/Mode (Mode/State and Integer coding).
Consumption Level Description Value of WS_Cur_State Value of WS_Cur_Mode
OL Off-level (Inactive) - Off (1)
DL1 Downlevel in Lack/Tailback
Prepared (04)
Automatic (4)
Lack (08)Tailback (16)
Lack_Branchline (32)Tailback_Branchline (64)
CL Consumption Level in Operating Operating (128)Idle (32768)
DL2 Downlevel in Failure
Equipment_Failure (1024)External_Failure (2048)Emergency_Stop (4096)
Held (16384)
4. Determination of Simulation-Relevant Parameters
For an automatic determination of simulation parameters, such as consumption levelsas well as parameters for the description of the failure behavior, an evaluation softwarewas developed. The parameters can be specific to various evaluation criteria, such asarticle-based, container type-based, or based on any time periods.
The mean consumption levels of the individual energy and media types are calculatedin the intervals in which the same operating state is present. In addition to the machine-specific determination of the total consumptions, a detailed statistical evaluation of theconsumption values (weighted mean value, standard deviation, variance, standard error,and 95% confidence interval) is performed.
Failure behavior is determined using the operating state of a machine [22]. The TTR(Time To Repair) refers to the duration of downtime, while the downtime-free runningtime between two successive downtimes is defined as TBF (Time Between Failures). Todetermine the TTR, the times of the states of the DL2 are combined, and for the TBF, thestates of the DL1 as well as CL are combined (see Table 1). The availability results are shownin Formula (1).
Availability = MTBF/(MTBF + MTTR) (1)
In addition, the operating and downtimes are examined with regard to the distributioncurve of the failure behavior. The suitability of the Weibull, negative exponential, andlognormal distributions was examined by Voigt [22], whereby the Weibull and exponentialdistribution achieve the best fit. This could be confirmed graphically by means of his-tograms and QQ-plots, including the chi-square test. The neg. exponential distribution isused in this work because random failures with a constant failure rate are assumed, andthis describes the behavior sufficiently accurately. Moreover, the exponential distributioncan only be described by one variable (β) [22].

Sustainability 2021, 13, 10089 7 of 21
Apart from the data from the DAQ, it is necessary to determine further parametersdirectly in the plant. Therefore, the topological data of the plants as well as all machines andtransport equipment were determined as part of performance analyses in accordance withDIN 8743 [52]. The set performance of all individual units was analyzed using measuringlight barriers and manually by means of a minimum triple determination. Further, thecapacities per filling article of the individual units as well as the global rejection rates ofinspection machines were determined. All buffer sections were investigated with regard totheir buffer capacities and times.
5. Modeling Approach
Since modeling is one of the biggest barriers for SMEs, a modeling editor, presented byBär et al. [48], was used. The editor was developed with special attention to a user-friendlyand simple application to enable modeling for users without a specific pre-qualification.This was successfully validated and demonstrated by using a systematic test and exemplarysimulation studies. The holistic modeling of production systems with respect to their energyand media consumption is made possible by the use of context-free modeling columns.The editor generates a standardized XML-based configuration file, which contains allrequired simulation-relevant parameters and structures of the columns, for any subsequentsimulation environment. The parameters must be entered manually in the modelingeditor. Numerous help functions support the user, and the modeling can be simplifiedand accelerated. The modeling approach implements existing standardizations, such asANSI/ISA S88 [53]. The modeling columns consist of a physical model to represent realexisting plants, a process model to represent batch production processes by an articlemodel and a production plan model. The modeling depth of the editor is to the unit level(e.g., the filling machine). This is mainly related to the scope of the required parameters aswell as to the complexity and accuracy of the models and is sufficiently discussed by Bäret al. [48]. If the batch-oriented production process is modeled, the process model, whichdescribes the energy and media consumption behavior at the process operation level, isused. The article model allows for the modeling of different filling articles, which canbe produced on the process cells of the physical model. Each unit can be parameterizedwith regard to its consumption and performance-describing parameters, but also withregard to the container type, as well as the packaging ratios. The production plan modeldescribes the production to be processed in the simulation. It comprises, inter alia, a shiftplan for the definition of the production and non-production times [52], e.g., a weekend,when no production is planned. Further, a sequence plan, which determines the sequenceof the articles and quantities to be produced, is defined. In a matrix table, the requiredchangeover and cleaning times, which are required between the articles in the sequencemodel, are determined.
6. Simulation Environment
All simulation studies were carried out using the “PacSi” simulation environment [54]developed by SimPlan AG, Dresden, Germany. The software follows a discrete-timeapproach with regard to the applied simulation method and is based on a simulationof the material flow. The simulation environment is further described by Römisch andWeiß [55] and was used for various applications [21,56]. Model creation within the softwareis based on building blocks, which differ fundamentally in functionality, the separationand merging of material flows, and parameter sets. The individual units are assigneda stochastic failure behavior, and failure propagation is achieved by the chaining of themachines by transport devices.
Failure behavior is described by the variation, by means of a random number generator,of the seed key, which initializes a random number stream. Thus, these streams for theMTTR and MTBF are newly generated according to the distribution function (negativeexponential) with each simulation run, and the times and durations of the failures are varied.Therefore, different results are obtained with each simulation run, whereby statistical

Sustainability 2021, 13, 10089 8 of 21
certainty can be achieved over long simulation durations, on the one hand, and multiplerepetitions of the experiments, on the other.
In the scope of this work, the simulation environment was extended by numerousfunctions. The most important extension is the automatic generation of simulation modelsbased on the configuration file of the modeling editor. The different specific buildingblocks of the modeling editor are therefore mapped to the existing ones of the simulationenvironment. By using a coordinate system as well as the edges of the elements in themodeling editor, the topology and logical structure can be reformulated in the simulationenvironment. During simulation model creation, the parameter sets of all units are loadedfrom the configuration file and reformulated if necessary, and the simulation model isparameterized. A special feature here is the integration of a production plan, i.e., theshift plan, the sequence of different recipes and articles, as well as the changeover matrix.This is mainly solved by sources, elements in which material is released in the simulation,by storing the non-production times as well as the times between the recipes/articlesand their specific article number. This indexing allows for an element-specific parameterchange and thus enables a recipe/article-specific simulation within the production plan.Non-production times defined by the shift model are also a special feature, as the newlyimplemented off-consumption level (OL) is active in this time. Consumption in the produc-tion times is described by the respective operating state. The simulation results, which aregenerated every second, are stored in a SQLite database.
7. Evaluation, Verification, and Validation
The aim of verification and validation is to reduce the erroneous statements of simula-tion studies and thus to minimize the risk of the resulting wrong decisions. Verificationinvolves the transformation of a model from one type of representation to another. In thepresent case, the correct transformation of the model from the modeling editor to a simu-lation model is meant. Validation, in turn, is to ensure the correct behavior of the modelin relation to the original model. The validity of the model for the specific applicationpurpose is checked [42].
For validation, the corresponding periods were simulated with 10 repetitions. Thesimulation results of the cumulative consumption of the entire plant and the individualunits were each statistically examined. The mean values were compared with the corre-sponding real values, and the percentage deviations were calculated. Furthermore, theconsumption values with regard to the individual filling orders were determined andcompared with the real values. The production counter of the filling machine constitutesthe reference point for the end or start of a filling order. In parallel, the production quan-tities and times were determined and compared with the real values. Use cases should,among other things, reveal the optimization potential with regard to the energy and mediaefficiency of the beverage bottling plants investigated in the validation periods presented.The savings achieved should be higher than the deviations determined in the validation toavoid erroneous statements.
8. Results8.1. Validation Periods and Parameter Determination
Two different time periods considering different factors are available for validation.Validation period 1 comprises the electrical energy demand of the units, and an extensiveproduction schedule including non-production times such as a weekend is simulated.Validation period 2 includes the full energy and media demand of the units of the beveragebottling plant, but a shorter time period with only two articles is included.
Consumption parameters were article-specifically determined for period 1 and container-type specifically for period 2, due to the insufficient article-specific database here. Accordingto Sargent [57], the orders of the articles produced within the validation periods were notincluded in the periods of consumption parameter determination. The values describingthe failure behavior of the machines were determined specifically for the corresponding

Sustainability 2021, 13, 10089 9 of 21
orders in the validation periods. A detailed overview of the validation periods with regardto the articles produced as well as the production times and quantities is given in Table 2.
Table 2. Validation periods including produced articles (quantities and times) as well as the extent of the consumptionparameter determination.
ValidationPeriod Article Article Information Output
(Bottles) Duration [h]Changeover
Time (to NextArticle) [min]
Extent of ConsumptionParameter
Determination [h]
1; (193.2 h)
1 Mineral water sparkling; 12 ×0.5 L 417,521 21.8 46 19.60
2 Mineral water low sparkling;12 × 0.5 L 425,552 20.4 99 35.72
3 Mineral water still, 12 × 0.5 L 377,060 19.7 252 18.974 Mineral water still, 12 × 0.75 L 1,339,097 79.2 - 347.81
2; (61.9 h) 4 Mineral water still, 12 × 0.75 L 1,248,702 59.0 80380.835 Lemonade 12 × 0.75 L 35,285 1.7 -
The real data recorded by the DAQ of the production plan were converted to thepresented data structure, and the simulation-relevant parameters were determined auto-matically by executing a self-programmed software in MATLAB 2020b. This resulted in atotal of approximately 1250 parameters for all five articles. Table A1 (Appendix A) showsthe state-related energy and media-specific mean consumption data for each consumptionlevel, including the 95% confidence interval, and the failure behavior data (within thevalidation period) exemplary for article 4. The correct operating status reports of theindividual units were randomly checked during operation. The changeover times betweenthe individual articles for possible required conversions or cleaning were taken from thevalidation periods of the real data. The basis for this is the production counter of the fillingmachine (no increment over a longer period means a changeover). Due to the lack ofrepetitions, it was not possible to consider several changeover periods.
8.2. Model of a Beverage Bottling Plant
The beverage bottling plant investigated in this work was modeled in the describededitor (Figure 3) and is a more detailed version, as already presented by Bär et al. [48]. Themain differences are due to the representation of further units, such as inspection machines,decorker, etc., which could be examined within the scope of the additional data acquisition.The main material flow (thick arrows) starts with the main source at the top left and runsclockwise to the source at the bottom left. The two secondary flows (thin arrows) for palletsand crates are located on the left side and in the middle, respectively. The articles producedin the validation periods were modeled with article-specific parameters in each case.
The present model covers a much larger scope than already presented, since numerousarticles, including their article- or container-specific parameters, are modeled. In addition,the schedule within the production plan was parameterized with the articles and produc-tion quantities per filling order listed in Table 2. The changeover times were transferred tothe matrix to define the times between the individual articles. The shift times for validationperiod 1 could be determined from the real data (non-production from Saturday 08:30 amto Monday 07:00 am) and were parameterized in the modeling editor.
8.3. Verification and Validation8.3.1. Model and Simulation Verification
A verification of the model creation and the function of the simulation environmentwas performed by hand in three steps. Therefore, the configuration file from the modelingeditor was loaded in the simulation environment, and the model was generated auto-matically. The topology of the beverage bottling plant and the correct connection of theelements were successfully checked. After a simulation run is started, the respective unit-and article-specific parameters are loaded. By regularly stopping the simulation to check

Sustainability 2021, 13, 10089 10 of 21
all articles, the parameters were successfully compared with those of the model in themodeling editor. A verification of the correct functioning of the simulation environmentwas performed using the result data, which were analyzed, on the one hand, using theopen source software HeidiSQL_11, which allows access to, and the viewing of the SQLitedatabases; and, on the other hand, via the described evaluation tool. In particular, theapplication of the correct consumption levels with regard to the operating status of theindividual unit was checked. In addition, the main source, which is the origin of the mainflow and thus represents the production plan, was checked for correct functioning withregard to production quantities and changeover times. In all cases, the verification wascarried out continuously with the development process of the simulation environment andwas successfully completed.
8.3.2. Validation of Energy and Media Demand in Period 1
The focus in the first period is on electrical energy consumption and on the complexproduction plan. Figure 4 shows the measured and simulated electrical energy consump-tion of the beverage bottling plant. The subdivision shows the four articles, which differby a distinct total power requirement, as well as the production-free weekend, whichrepresents idle time (duration 46.25 h) [52].
Sustainability 2021, 13, x FOR PEER REVIEW 11 of 23
Figure 4. Total current electrical consumption in kW (blue: measured values; red: simulated values) of the beverage bottling plant in validation period 1 (193.2 h); Subdivision in articles (1–4) as well as a weekend (idle time).
Table 3 shows the mean values of the simulated data and the percentage deviation of these data from the real data for the entire period, as well as the individual production periods of the articles. Starting with the entire plant, the individual units are listed in de-scending order of their electrical energy demand. No measured data are available for the decorker, empty bottle inspector, and full bottle inspector, as these could only be included in validation period 2. The bottle cleaning machine, the crate conveyors, and the mixer could be clearly identified as the main consumers of electrical energy. These account for about 70% of the total amount of electrical energy and consistently show a very small percentage of deviation from the measured data. The bottom 50% of the units account for only 12.3% of the total amount of electrical energy. Over the entire period, a percentage deviation of 0.33% for the electrical energy demand of the entire plant could be deter-mined. In the article-specific validation, it is noticeable that units such as the filling ma-chine, the pallet transport, and the depalletizer show quite high deviations. The large de-viations at article 4 are due to a long downtime (lack of staff in the plant and in the supply) at the beginning of the article, which can be explained by the malfunction reports. Since long downtimes only occur very rarely due to the failure behavior distribution, the simu-lated production runs faster and reaches the planned production quantity earlier.
Table 3. Consumption of electrical energy in kWh (measured value (Measured), mean simulated value (M), 95% confi-dence interval (95% CI), percentage deviation between measured and simulated (PD [%])) in validation period 1 as well as the article production periods.
Machine Total Validation Period 1 Article 1 Article 2 Article 3 Article 4
[kWh] Simulated Measured M 95% CI PD [%] PD [%] PD [%] PD [%] PD [%]
Total 20,282.1 20,349.8 26.67 0.33 −4.83 −5.3 −5.45 −8.42 Bottle cleaning machine 7070.0 7060.9 5.64 −0.13 −9.45 −7.07 −8.06 −7.69
Crate transport 3686.0 3690.9 26.94 0.13 8.31 2.32 −3.72 −15.79 Mixer 2967.0 3171.5 0.46 6.89 −2.8 −8.97 4.72 −5.18
Container transport 1437.8 1471.6 5.59 2.35 4.73 8.89 8.39 5.24 Filling machine 1450.0 1342.0 0.71 −7.45 −23.53 −8.54 −23.97 −9.84 Crate washer 1216.2 1186.2 0.86 −2.47 −10.04 −20.26 −8.56 −6.48
Labelling machine 510.9 537.2 0.22 5.14 −9.42 −9.15 −2.34 −0.82 Decorker - 498.6 0.26 -- - - - -
0 1 2 3 4 5 6 7Time [s] 105 sec
0
20
40
60
80
100
120
140
160
180
Cur
rent
elec
trica
lcon
sum
ptio
n[k
Wh]
MeasuredSimulated
1 2 3 4 4Weekend
Figure 4. Total current electrical consumption in kW (blue: measured values; red: simulated values)of the beverage bottling plant in validation period 1 (193.2 h); Subdivision in articles (1–4) as well asa weekend (idle time).
The production quantities of all articles show a deviation of less than ±0.1% comparedto the real production counter of the filling machine. The production times of article1 and 2 are within a range of approx. −6–8% compared to the determined real-time periods.Article 3 shows a deviation of approx. −4.5%. Article 4 shows a total deviation of −11.2%,i.e., an accelerated production within the simulation.
Table 3 shows the mean values of the simulated data and the percentage deviationof these data from the real data for the entire period, as well as the individual productionperiods of the articles. Starting with the entire plant, the individual units are listed indescending order of their electrical energy demand. No measured data are available for thedecorker, empty bottle inspector, and full bottle inspector, as these could only be includedin validation period 2. The bottle cleaning machine, the crate conveyors, and the mixercould be clearly identified as the main consumers of electrical energy. These account forabout 70% of the total amount of electrical energy and consistently show a very smallpercentage of deviation from the measured data. The bottom 50% of the units account foronly 12.3% of the total amount of electrical energy. Over the entire period, a percentage

Sustainability 2021, 13, 10089 11 of 21
deviation of 0.33% for the electrical energy demand of the entire plant could be determined.In the article-specific validation, it is noticeable that units such as the filling machine, thepallet transport, and the depalletizer show quite high deviations. The large deviations atarticle 4 are due to a long downtime (lack of staff in the plant and in the supply) at thebeginning of the article, which can be explained by the malfunction reports. Since longdowntimes only occur very rarely due to the failure behavior distribution, the simulatedproduction runs faster and reaches the planned production quantity earlier.
Table 3. Consumption of electrical energy in kWh (measured value (Measured), mean simulated value (M), 95% confidenceinterval (95% CI), percentage deviation between measured and simulated (PD [%])) in validation period 1 as well as thearticle production periods.
Machine
Total Validation Period 1 Article 1 Article 2 Article 3 Article 4
[kWh] Simulated
Measured M 95% CI PD [%] PD [%] PD [%] PD [%] PD [%]
Total 20,282.1 20,349.8 26.67 0.33 −4.83 −5.3 −5.45 −8.42Bottle cleaning machine 7070.0 7060.9 5.64 −0.13 −9.45 −7.07 −8.06 −7.69
Crate transport 3686.0 3690.9 26.94 0.13 8.31 2.32 −3.72 −15.79Mixer 2967.0 3171.5 0.46 6.89 −2.8 −8.97 4.72 −5.18
Container transport 1437.8 1471.6 5.59 2.35 4.73 8.89 8.39 5.24Filling machine 1450.0 1342.0 0.71 −7.45 −23.53 −8.54 −23.97 −9.84Crate washer 1216.2 1186.2 0.86 −2.47 −10.04 −20.26 −8.56 −6.48
Labelling machine 510.9 537.2 0.22 5.14 −9.42 −9.15 −2.34 −0.82Decorker - 498.6 0.26 – - - - -
Pallet transport 473.0 473.8 1.19 0.17 36.48 30.29 −19.76 −26Palletizer 440.8 423.9 0.31 −3.83 −6.76 −3.9 −8.44 −12.24
Depalletizer 407.1 370.4 0.04 −9.03 −12.35 −30.4 −16.47 −17.33Crating machine 315.7 315.3 0.33 −0.14 −8.57 −8.55 14.72 −6.03
Decrating machine 307.6 306.3 0.09 −0.43 −9.09 −8.28 −6.91 −5.86Empty bottle inspector - 148.1 0.00 - - - - -
Full bottle inspector - 85.3 0.01 - - - - -
Figure 5 shows the consumptions of water and CO2 within validation period 1. Sincearticles 3 and 4 are “mineral water still”, no CO2 is required. The total consumption showsa deviation of approximately 5% compared to the measured value. The water consumptionof the bottle cleaning machine shows an overall deviation of −11%.
Sustainability 2021, 13, x FOR PEER REVIEW 12 of 23
Pallet transport 473.0 473.8 1.19 0.17 36.48 30.29 −19.76 −26 Palletizer 440.8 423.9 0.31 −3.83 −6.76 −3.9 −8.44 −12.24
Depalletizer 407.1 370.4 0.04 −9.03 −12.35 −30.4 −16.47 −17.33 Crating machine 315.7 315.3 0.33 −0.14 −8.57 −8.55 14.72 −6.03
Decrating machine 307.6 306.3 0.09 −0.43 −9.09 −8.28 −6.91 −5.86 Empty bottle inspector - 148.1 0.00 - - - - -
Full bottle inspector - 85.3 0.01 - - - - -
Figure 5 shows the consumptions of water and CO2 within validation period 1. Since articles 3 and 4 are “mineral water still”, no CO2 is required. The total consumption shows a deviation of approximately 5% compared to the measured value. The water consump-tion of the bottle cleaning machine shows an overall deviation of –11%.
(a) (b)
Figure 5. Comparison of the consumption of water [m3] (a) and CO2 [kg] (b) in validation period 1 (measured value, mean simulated value, 95% confidence interval) as well as the four production article periods.
8.3.3. Validation of Energy and Media Demand in Period 2 Validation period 2 is primarily used to validate the compressed air and thermal en-
ergy consumption. The parameters determined were also used in validation period 1. The production quantities of both articles (4 & 5) show a deviation of less than ±0.1% compared to the real production counter. The production times of articles 4 and 5 show a small de-viation of approx. −3 to −3.5% compared to the production times required in reality. Figure 6 shows the current electrical energy demand and Figure 7 the current demand for com-pressed air of the bottling plant (measured versus simulated). In each figure, a downtime (approximately 5 h) due to a technical defect can be seen at the beginning as well as at the end. During the remaining production period of article 4, the output of the filling machine was increased, while the filling machine in the simulation runs with the parameterized set performance. The changeover to article 5 (production time 1.7 h) can be seen toward the end of the simulation.
Total 1 2 3 4
0
100
200
300
400
500
600
700
800
900
Con
sum
ptio
n of
wat
er [m
³]
Simulated Measured
Total 1 2 3 4
0
1000
2000
3000
4000
Con
sum
ptio
n of
CO
2 [kg]
Simulated Measured
Figure 5. Comparison of the consumption of water [m3] (a) and CO2 [kg] (b) in validation period1 (measured value, mean simulated value, 95% confidence interval) as well as the four productionarticle periods.
8.3.3. Validation of Energy and Media Demand in Period 2
Validation period 2 is primarily used to validate the compressed air and thermalenergy consumption. The parameters determined were also used in validation period1. The production quantities of both articles (4 & 5) show a deviation of less than ±0.1%

Sustainability 2021, 13, 10089 12 of 21
compared to the real production counter. The production times of articles 4 and 5 showa small deviation of approx. −3 to −3.5% compared to the production times requiredin reality. Figure 6 shows the current electrical energy demand and Figure 7 the currentdemand for compressed air of the bottling plant (measured versus simulated). In eachfigure, a downtime (approximately 5 h) due to a technical defect can be seen at the beginningas well as at the end. During the remaining production period of article 4, the output of thefilling machine was increased, while the filling machine in the simulation runs with theparameterized set performance. The changeover to article 5 (production time 1.7 h) can beseen toward the end of the simulation.
Sustainability 2021, 13, x FOR PEER REVIEW 13 of 23
Figure 6. Total current electrical consumption in kW (blue: measured values; red: simulated values) of the beverage bottling plant in validation period 2 (61.9 h); Subdivision in articles (4 & 5).
Figure 7. Total consumption of compressed air in Nm3/h (blue: measured values; red: simulated values) of the beverage bottling plant in validation period 2 (61.9 h); Subdivision in articles (4 & 5).
Table 4 shows the electrical energy consumption in validation period 2. An overall good fit with a percentage deviation of 0.14% is achieved, as the largest consumers show a small deviation (about ± 3%). Units such as the depalletizer and palletizer, together with the container transport, show the largest deviations. The deviations (electrical energy and compressed air) of the time period of article 4 correspond to the values of the entire period. The deviations for article 5 are noticeably higher, as the article covers only 2.7% of the total time and is therefore strongly affected by the delimitation method of the articles.
0 0.5 1 1.5 2Time [s] 105 sec
0
20
40
60
80
100
120
140
160
180
200
Cur
rent
elec
trica
lcon
sum
ptio
n[k
W]
4 5
0 0.5 1 1.5 2Time [s] 105 sec
0
50
100
150
200
250
Cur
rent
cons
umpt
ion
ofco
mpr
esse
dai
r[N
m³/h
] 4 5
Figure 6. Total current electrical consumption in kW (blue: measured values; red: simulated values)of the beverage bottling plant in validation period 2 (61.9 h); Subdivision in articles (4 & 5).
Sustainability 2021, 13, x FOR PEER REVIEW 13 of 23
Figure 6. Total current electrical consumption in kW (blue: measured values; red: simulated values) of the beverage bottling plant in validation period 2 (61.9 h); Subdivision in articles (4 & 5).
Figure 7. Total consumption of compressed air in Nm3/h (blue: measured values; red: simulated values) of the beverage bottling plant in validation period 2 (61.9 h); Subdivision in articles (4 & 5).
Table 4 shows the electrical energy consumption in validation period 2. An overall good fit with a percentage deviation of 0.14% is achieved, as the largest consumers show a small deviation (about ± 3%). Units such as the depalletizer and palletizer, together with the container transport, show the largest deviations. The deviations (electrical energy and compressed air) of the time period of article 4 correspond to the values of the entire period. The deviations for article 5 are noticeably higher, as the article covers only 2.7% of the total time and is therefore strongly affected by the delimitation method of the articles.
0 0.5 1 1.5 2Time [s] 105 sec
0
20
40
60
80
100
120
140
160
180
200
Cur
rent
elec
trica
lcon
sum
ptio
n[k
W]
4 5
0 0.5 1 1.5 2Time [s] 105 sec
0
50
100
150
200
250
Cur
rent
cons
umpt
ion
ofco
mpr
esse
dai
r[N
m³/h
] 4 5
Figure 7. Total consumption of compressed air in Nm3/h (blue: measured values; red: simulatedvalues) of the beverage bottling plant in validation period 2 (61.9 h); Subdivision in articles (4 & 5).
Table 4 shows the electrical energy consumption in validation period 2. An overallgood fit with a percentage deviation of 0.14% is achieved, as the largest consumers show asmall deviation (about ±3%). Units such as the depalletizer and palletizer, together withthe container transport, show the largest deviations. The deviations (electrical energy andcompressed air) of the time period of article 4 correspond to the values of the entire period.The deviations for article 5 are noticeably higher, as the article covers only 2.7% of the totaltime and is therefore strongly affected by the delimitation method of the articles.

Sustainability 2021, 13, 10089 13 of 21
Table 4. Electrical energy consumption in kWh (measured value, mean simulated value (n = 10), 95% confidence inter-val (95% CI), percentage deviation between measured and simulated) of the validation period 2 as well as the articleproduction periods.
Machine
Total Validation Period 2 Article 4 Article 5
[kWh] Simulated
Measured M 95% CI PD [%] PD [%] PD [%]
Total 8766.5 8779.1 10.15 0.14 0.42 13.54Bottle cleaning machine 3052.4 2958.4 3.89 −3.08 −6.04 5.01
Mixer 1459.2 1517.3 0.00 3.98 −0.69 28.61Crate transport 1524.1 1493.0 6.63 −2.04 −5.64 15.74Crate washer 490.7 538.1 0.11 9.68 5.68 34.02
Container transport 467.7 530.2 2.41 13.38 10.00 9.20Filling machine 527.6 504.7 0.12 −4.33 −6.83 0.69
Labelling machine 221.1 233.1 0.12 5.45 1.50 9.49Decorker 190.4 183.5 0.21 −3.63 −3.14 −2.86Palletizer 179.7 162.4 0.12 −9.60 −12.40 53.08
Pallet transport 149.0 159.9 0.67 7.31 7.31 −16.03Depalletizer 164.9 149.2 0.05 −9.57 −12.19 5.22
Crating machine 117.6 120.6 0.20 2.58 −3.22 8.97Decrating machine 111.5 115.6 0.07 3.64 0.03 30.05
Empty bottle inspector 53.0 51.9 0.02 −2.09 −4.29 2.83Product heating 29.5 32.5 0.00 9.86 14.30 11.50
Full bottle inspector 28.3 28.7 0.00 1.60 −2.32 −29.63
Table 5 shows the consumption of compressed air for validation period 2. The fourlargest consumers account for about 70% of the total compressed air demand. The smalldeviations between the simulated and measured data of these units result in a small overalldeviation. For units such as the decorker and the cycle-based depalletizers and palletizers,there are large deviations. Due to the small share of the consumption of the product heating,the high deviations are not decisive to a good agreement of the total consumption.
Table 5. Consumption of compressed air [Nm3] (measured value, mean simulated value (n = 10), 95% confidence interval(95% CI), percentage deviation between measured and simulated) of the validation period 2 as well as the article production periods.
Machine
Total Validation Period 2 Article 4 Article 5
[Nm3] Simulated
Measured M 95% CI PD [%] PD [%] PD [%]
Total 9348.3 9354.3 8.39 0.06 −1.26 8.22Labelling machine 1962.7 2006.5 1.02 2.23 −1.62 −4.76Crating machine 1740.1 1665.4 4.20 −4.29 −9.53 54.95Filling machine 1548.0 1546.7 0.08 −0.08 −2.69 6.23
Empty bottleinspector 1162.6 1179.2 0.03 1.43 −1.09 9.50
Decorker 573.4 703.8 5.36 22.74 −5.03 −17.87Full bottle inspector 562.7 568.7 0.00 1.07 −2.16 1.50Decrating machine 575.8 555.5 0.14 −3.52 −11.95 6.93
Palletizer 475.3 415.4 0.49 −12.62 −14.80 51.23Depalletizer 369.3 319.9 0.26 −13.38 −15.37 −11.48
Bottle cleaningmachine 318.2 314.0 0.24 −1.35 −5.11 10.32
Product heating 35.1 43.3 0.00 23.36 20.76 7.53Mixer 30.5 31.0 0.00 1.71 2.41 27.07
Crate washer 5.3 5.0 0.00 −7.43 −10.96 31.19
A comparison of the CO2 consumption values is not useful, as CO2 is needed only forarticle 5. The values of the thermal energy demand deviate by a total of +13.61% and thevalues of the water consumption by +6.14%. These occasionally large deviations are due tothe relatively short validation period.
8.4. Application of the Method in Use Cases
In one use case, the replacement of the main consumer, the bottle cleaning machine(year of construction 2012), was analyzed. During parameter determination, it was as-certained that the consumption values for thermal energy and water significantly exceed

Sustainability 2021, 13, 10089 14 of 21
the values during the warranty acceptance test after the completion of the plant. Waterdemand was determined to be 284 mL/bottle (originally 140 mL/bottle) and the thermalenergy demand 15.5 Wh/bottle (originally 9.5 Wh/bottle). In addition, the availability ofthe bottle cleaning machine has noticeably decreased, from 90% to 86%. The background tothe changes is unclear. To be able to examine the effects on the overall system in validationperiod 2, the consumption levels of the individual operating states and performance valueswere adjusted according to the original values. These values agree with the currentlycommon values determined by Osterroth et al. [20], as well as with the authors’ own em-pirical values. The adjusted model was simulated with a tenfold repetition and comparedwith the total values of the validation. As shown in Table 6, enormous savings of thermalenergy and water demand were determined. Since the bottle washer is the sole consumerof these types of energy and media, there is a direct connection. The demand for electricalenergy of the entire system is also influenced. The water savings alone correspond to a costsaving per year in the mid five-digit range (at an average water price of 2 € per m3 and aproduction time of 5 days for 50 weeks a year). Added to this are the sustainable aspects ofreduced wastewater production and the required purification of the water.
Table 6. Consumption values and savings of the thermal, electrical, and water demand of thebeverage bottling plant before and after the adjustment of the consumption values of the bottlecleaning machine.
SimulationRun
Time [h]Consumption of
Thermal Energy[kJ*103] Water [m3]
Electrical Energy[kWh]
Original 61.9 68,100 347 8600Adjusted 58.7 40,452 175 8284
Savings [%] 5.1 40.6 49.6 3.67
In a further simulation study, the suitability of the method is shown with regard tothe simulation of multiple beverage bottling plants. For this purpose, the returnable glassand the PET bottling plant were modeled with specific articles and production plans overa period of 8 days. The load profile for, e.g., electrical energy can be determined by thesimultaneous simulation of both plants. This information can be of considerable interest inthe design of supply facilities, such as the electricity supply, for example, in order to beable to make an efficient and cost-effective investment. Figure 8 shows the operation of thetwo beverage filling plants and their total electric energy consumption in validation period1 (including a weekend as an off-period).
Sustainability 2021, 13, x FOR PEER REVIEW 16 of 23
Figure 8. Current electrical energy consumption of the bottling plants and their total in kW.
9. Discussion The simulation-relevant parameters were determined using the presented evaluation
method. Due to the extensive database, the article- and container-type-specific parameters could be defined. Overall, they show very small confidence intervals (see Table A1).
The use of the described data structure could be an opportunity for SMEs and ma-chine manufactures. If data are available in this format, the evaluation tool enabling a fast, easy, and flexible determination of simulation parameters as well as the evaluation of sim-ulation experiments can be used. This can sustainably overcome the barriers for modeling and encourage SMEs to expand their data collection. The modeling editor proved to be a good support by modeling the plant as well as all articles and the production plan in a structured and standardized way via modeling columns. Thus, errors in simulation model generation can be avoided.
For the first time, a simulation environment incorporates a detailed production plan including non-production times and an associated off-consumption level. In addition, ar-ticles can be simulated with specific parameter sets, and the times required for changeo-vers can be specified. The automated simulation model generation based on the configu-ration file could be demonstrated and successfully verified in the example of a simulation environment. Since it contains all simulation-relevant parameters and information and is clearly structured, this could also be implemented in other simulation environments. The combination of the modeling editor and the simulation environment opens up a great flexibility with regard to the mapping of production systems and has already been demonstrated [48]. Compared to a time-consuming manual parameter determination and simulation model creation, which can take several days, depending on its complexity, the present models could be created within a few hours using the modeling editor, and an executable simulation model including all aspects could be generated. However, this re-quires the availability of data according to the presented data structure. A fast model gen-eration represents a decisive advantage for companies of any size.
Based on two production periods of a beverage bottling plant, the extensive valida-tion is intended to underpin the suitability of the entire method with regard to several factors. A comparison of the measured and simulated values was conducted. The focus in the first validation period is primarily on the production schedule with different articles and non-production times as well as the electrical energy consumption. The production quantities determined in the simulation match those of reality.
0 1 2 3 4 5 6Time [s] 105
0
50
100
150
200
250
300
350
400
PET bottling plantGlass bottling plantSum
Figure 8. Current electrical energy consumption of the bottling plants and their total in kW.

Sustainability 2021, 13, 10089 15 of 21
9. Discussion
The simulation-relevant parameters were determined using the presented evaluationmethod. Due to the extensive database, the article- and container-type-specific parameterscould be defined. Overall, they show very small confidence intervals (see Table A1).
The use of the described data structure could be an opportunity for SMEs and machinemanufactures. If data are available in this format, the evaluation tool enabling a fast, easy, andflexible determination of simulation parameters as well as the evaluation of simulation experi-ments can be used. This can sustainably overcome the barriers for modeling and encourageSMEs to expand their data collection. The modeling editor proved to be a good support by mod-eling the plant as well as all articles and the production plan in a structured and standardizedway via modeling columns. Thus, errors in simulation model generation can be avoided.
For the first time, a simulation environment incorporates a detailed production planincluding non-production times and an associated off-consumption level. In addition, arti-cles can be simulated with specific parameter sets, and the times required for changeoverscan be specified. The automated simulation model generation based on the configurationfile could be demonstrated and successfully verified in the example of a simulation environ-ment. Since it contains all simulation-relevant parameters and information and is clearlystructured, this could also be implemented in other simulation environments. The combi-nation of the modeling editor and the simulation environment opens up a great flexibilitywith regard to the mapping of production systems and has already been demonstrated [48].Compared to a time-consuming manual parameter determination and simulation modelcreation, which can take several days, depending on its complexity, the present modelscould be created within a few hours using the modeling editor, and an executable simula-tion model including all aspects could be generated. However, this requires the availabilityof data according to the presented data structure. A fast model generation represents adecisive advantage for companies of any size.
Based on two production periods of a beverage bottling plant, the extensive validationis intended to underpin the suitability of the entire method with regard to several factors.A comparison of the measured and simulated values was conducted. The focus in the firstvalidation period is primarily on the production schedule with different articles and non-production times as well as the electrical energy consumption. The production quantitiesdetermined in the simulation match those of reality.
An explicit validation of the off-periods (e.g., the weekend in validation period 1) doesnot take place. The graphical comparison (see Figure 4) illustrates a similar consumption inthis period, but could be improved. The deviations in the electrical energy demand of theentire plant in the first validation period are very low and are achieved by the good fit ofthe main consumers. Machines such as the de-/palletizer and the mixer show the largestdeviations. This reflects the findings of Osterroth et al. [36], as the operating state-relatedconsumption behavior does not fit perfectly for these units. No adjustment was made dueto suitability for the remaining units.
The accelerated production in the simulation has two causes. On the one hand, thestart-up times of the plant in the event of a changeover cannot be represented well enoughin the simulation. In particular, the individual changeover work on individual units mustbe mentioned here, as the changeover time is related only to the filling machine. Duringflying changeovers, various articles are usually active on the plant. This explains the greaterdeviations of the article-specific consumptions. A more precise assessment is possible onlyif each machine provides information on the subject of articles as well as on the currentprogram. In addition, it is not possible to model or simulate any lower outputs of the unitsin the start-up and shutdown phases. On the other hand, due to the neg. exponentialfailure behavior, long failure times occur only rarely in the simulation and are difficultto reproduce. Together with all the delays that occurred during real changeovers, thissituation corresponds approximately to the time difference between the measured andthe simulated total time. The long downtimes that occurred in real production must bedocumented to make deviations comprehensible.

Sustainability 2021, 13, 10089 16 of 21
The deviations in CO2 demand are within acceptable limits, and a consumption behaviorrelated to the operating condition can be confirmed. Water demand deviates strongly for article2, which in turn strongly influences the overall deviation. This can be explained due to thecyclical filling of the baths of the bottle cleaning machine. However, the deviation of article 4,which has the largest database, is in an acceptable range of about −6%.
Validation period 2 includes the simulation of all energy and media types, but fora shorter period. Here, too, the deviations in production times can be traced throughfault logs. The deviations in the required electrical energy quantities mirror the findingsof period 1. Due to the extensive database, an overall very low deviation is achieved,especially for compressed air. Here, the consumption parameters were determined inrelation to the container type. For the depalletizer, palletizer, and decorker, very highdeviations were found and the operating-condition-related consumption behavior can bedoubted, due to the low confidence intervals of the parameters. The deviations in thethermal energy demand of the bottle washer are relatively high and can be attributed tothe short period as well as to the cyclical heating of the caustic and should continue to beinvestigated more deeply.
One use case investigates a theoretical reduction in energy and media demand. Mod-ernizing the bottle cleaning machine achieves savings significantly higher than the devia-tions in the total values within validation period 2. A second use case shows the simulationresults of two different beverage bottling plants to illustrate the breadth of applicationof the method. The simulation studies underpin the suitability of the overall method.Nevertheless, human intelligence is needed to evaluate the simulation results and decideon the next steps that will ultimately affect system efficiency [58].
In comparison with Osterroth et al. [36], the operating-state-related consideration ofconsumption without the application of time-dependent intermediate levels provides asimilar or a sufficient accuracy of the validation results. Particularly when consideringcomplex overall systems, the simplified application facilitates the creation of the model,and the consideration at unit level satisfies the requirements.
10. Conclusions
To perform quick and easy forecasts of the energy and media demand of holisticbeverage bottling plants, especially for SMEs, an approach for modeling and automaticsimulation model generation was presented. This can be a chance for SMEs to reach a moresustainable production. This is made possible by a modeling approach implemented ina user-friendly editor. In combination with a standardized data format and evaluationsoftware, simulation-relevant parameters such as consumption and failure behavior datacan be determined automatically. The prerequisite for this, however, is a sufficiently largedatabase. The approach was applied to a beverage bottling plant and a model with variousarticles, and, for the first time, a detailed production plan was modeled. Based on anXML-based configuration file, the simulation model was automatically generated. Thisrepresents an enormous time saving compared to manual model creation.
The detailed validation of the entire method by comparing the simulated consumptionvalues of two different time periods to the measured values shows that the approach is wellsuited to provide reliable forecasts. The respective main consumers of the energy and mediatypes are decisive, which confirms the granularity chosen in the modeling environment.This is also underpinned by Hubert [39]. Therefore, units such as the depalletizer, palletizer,mixer, and decorker, which sometimes show strong deviations compared to the measuredvalues, can be mostly neglected depending on their share in the total consumption. Forthe first time, a detailed, machine-related compressed air consumption was determinedand analyzed. The compressed air consumption, as well as the consumption of waterand CO2, follow the consumption behavior presented. Furthermore, the validation of thethermal energy demand does not show a good fit, which means that the consumptionbehavior approach should be expanded. Further deviations in the validation can beexplained with the help of fault logs. A recording of the current program of the machines

Sustainability 2021, 13, 10089 17 of 21
as well as the extension for mapping start-up/shut-down ramps and the improvement ofchangeovers in the simulation environment would further increase the accuracy. Simulationstudies support the validation of the method, in which savings exceeding the deviationsof the validation results could be achieved. One challenge is the epistemic uncertainty,i.e., the lack of knowledge on how to interpret the results and how to design further steps,e.g., simulation experiments, and also the imprecise and coarsedata and information for themodeling and parameterization of simulation models. Decision models can help here [59].
The method proved to be suitable for creating models of complex bottling plants andautomatically generating simulation models. In the future, it is intended that SMEs willonly use the presented modeling editor [48] to apply the method. Starting from this, themodel of the production system to be simulated is automatically passed on to a cloud-based simulation environment, where the simulation is performed, and the results of thesimulation are reported back. The only points of contact are the modeling editor and theoutput data, which can be processed, e.g., with the help of the evaluation tool, and a deeperknowledge of XML and the simulation method will not be required. If, in addition, theproduction data is available in the presented data structure, the barrier of the data basis isovercome, and the simulation parameters can be determined automatically. The overallsolution is intended to reduce the personnel and cost effort, and thus enable SMEs to testoptimization strategies and make possible sound investment decisions. The approachprovides an opportunity to improve energy efficiency and, as a result, product efficiency.To extend the approach and to include, in this case, the material efficiency, the next logicalstep is the mapping and simulation of a holistic production plant, such as a brewery. Achallenge here is the mapping of the batch-oriented operation of the process area and theassociated different energy consumption behaviors. A combination of both areas would,for example, allow for the investigation of recuperative energy use as well as overallconsumption profiles. This represents an opportunity to save energy and media and toreduce raw materials and waste accordingly, and is a step toward sustainable production.
Author Contributions: Conceptualization, R.M.B.; methodology, R.M.B. and M.Z.; software, R.M.B.,M.Z., C.N., J.K. and K.B.; validation, R.M.B.; investigation, R.M.B.; resources, J.K. and K.B.; datacuration, C.N., J.K. and K.B.; writing—original draft preparation, R.M.B.; writing—review and editing,T.V.; visualization, R.M.B.; supervision, T.V.; project administration, R.M.B.; funding acquisition, T.V.All authors have read and agreed to the published version of the manuscript.
Funding: This research was funded by the Bayerische Forschungsstiftung (AZ-1217-16).
Data Availability Statement: Data not available due to legal restrictions.
Acknowledgments: Many thanks to Sebastian Schmid and Karl Glas, Technical University ofMunich—Chair of Food Chemistry and Molecular Sensory Science, for the elicitation and provisionof the measured data.
Conflicts of Interest: The authors declare no conflict of interest.

Sustainability 2021, 13, 10089 18 of 21
Appendix A
Table A1. Parameters for article 4; (1 container-specific parameter determination from the second measurement period; 2 specific parameters for transport equipment: length, transportspeed, capacity; 3 determined in the validation period).
UnitSet
Performance[b/h]
Capacity [bt] MTBF [s] 3 MTTR [s] 3 Availability[%]
Electric Consumption [kW] Compressed Air Consumption [Nm3/h] 1
CL DL1 DL2 OL CL DL1 DL2 OL
MW 95% KI MW 95% KI MW 95% KI MW 95% KI MW 95% KI MW 95% KI MW 95% KI MW 95% KI
Depalletizer 40,039 108 396 44 89.9 3.36 0.012 1.38 0.012 1.41 0.025 1.13 0.04 7.99 0.024 1.98 0.025 3.25 0.053 0.12 0.062
Decorker 1 32,280 12 600 12 98.0 3.65 0.051 3.3 0.024 3.3 0.033 0 0 24.82 0.056 24.82 0.016 0.52 0.021 0 0
Decrating machine 31,147 96 821 34 96.0 2.13 0.006 1.39 0.006 0.97 0.019 0.9 0.019 12.73 0.026 1.52 0.019 0.7 0.116 0.27 0.167
Bottle cleaning machine 30,640 9425 471 104 81.9 50.42 0.058 40.03 0.11 40.4 0.21 2.00 2.33 4.91 0.012 5.51 0.053 5.59 0.042 4.34 0.794
Thermal energy consumption [kW] 33,403 2706 2227 4507 282.05 5.353 20.69 13.419
Water consumption [m3/h] 7.52 002 0.01 0004 0.03 0.006 0 0
Empty bottle inspector 128,998
1433 68 86.4
0.93 0.005 0.61 0.006 0.61 0.009 0.64 0.075 20.73 0.022 14.84 0.025 14.59 0.038 14.18 0.271
Filling and Closingmachine 120 8.95 0.021 6.28 0.02 5.97 0.045 3.72 0.221 26.96 0.04 20.12 0.089 19.93 0.137 7.03 0.6
CO2 consumption [kg/h](article 1) 10,628 1765 6273 4378 60.97 4.599 1.37 1.692
Full bottle inspector 1 33,197 1 2465 18 99.3 0.49 0.001 0.40 0 0.4 0.001 0.4 0.001 9.21 0.003 9.14 0.003 9.14 0.007 9.17 0.002
Labelling machine 33,197 30 1423 40 97.3 4.39 0.017 2.28 0.014 1.71 0.053 0.49 0.07 41.33 0.049 10.88 0.228 8.33 0.665 0.261 0.267
Crating machine 34,354 96 270 44 86.1 2.35 0.009 1.31 0.01 1.24 0.012 0.96 0.02 33.57 0.066 17.22 0.074 13.06 0.262 0.65 0.368
Palletizer 34,165 108 170 36 82.4 3.2 0.013 1.65 0.015 1.73 0.033 1.24 0.015 9.1 0.041 2.61 0.029 3.33 0.110 0.15 0.092
Crate washer 40,000 1 247 6 97.7 10.64 0.005 4.78 0.048 5.11 0.123 0.26 0.06 0.08 0.003 0.08 0.002 0.08 0.012 0.01 0
Mixer 36,000 1 - - - 25.78 0.206 23.47 0.135 1.92 1.412 0.97 1.365 0.45 0.011 0.03 0.004 0.07 0.064 0.1 0.022
Product heating 1 36,000 1 - - - 1.83 0.015 0.995 0.024 0.995 0.024 0 0 0.7 0.128 0.7 0.128 0.7 0.128 1.23 0.197
Container transport 2 - - - - - 12.32 1.794 - - 1.95 1.385 1.24 0.066 - - - - - - - -
Crate transport 2 - - - - - 25.36 0.245 - - 19.749 0.707 2.97 0.515 - - - - - - - -
Pallet transport 2 - - - - - 3.30 0.091 - - 2.35 0.119 1.03 0.087 - - - - - - - -

Sustainability 2021, 13, 10089 19 of 21
References1. Olajire, A.A. The brewing industry and environmental challenges. J. Clean. Prod. 2020, 256, 102817. [CrossRef]2. United Nations Department of Economic and Social Affairs. Sustainable Development Goals. Available online:
https://sdgs.un.org/ (accessed on 18 August 2021).3. AB INBEV. Sustainability Goals. Available online: https://www.ab-inbev.com/sustainability/2025-sustainability-goals/
(accessed on 18 August 2021).4. Heineken. Sustainability and Responsibility. Available online: https://www.theheinekencompany.com/sustainability-and-
responsibility (accessed on 18 August 2021).5. China Resources Breweries. Environmental Protection. Available online: https://www.crbeer.com.hk/home/socialres/
environmental/ (accessed on 18 August 2021).6. Ullah, A.M.M.S.; Akamatsu, T.; Furuno, M.; Chowdhury, M.A.K.; Kubo, A. Strategies for Developing Milling Tools from the
Viewpoint of Sustainable Manufacturing. Int. J. Autom. Technol. 2016, 10, 727–736. [CrossRef]7. Ullah, A.S.; Hashimoto, H.; Kubo, A.; Tamaki, J.I. Sustainability analysis of rapid prototyping: Material/resource and process
perspectives. IJSM 2013, 3, 20. [CrossRef]8. Ullah, A.M.M.S.; Fuji, A.; Kubo, A.; Tamaki, J. Analyzing the Sustainability of Bimetallic Components. Int. J. Autom. Technol. 2014,
8, 745–753. [CrossRef]9. Mourtzis, D.; Doukas, M.; Bernidaki, D. Simulation in Manufacturing: Review and Challenges. Procedia CIRP 2014, 25, 213–229.
[CrossRef]10. Bracht, U.; Geckler, D.; Wenzel, S. Digitale Fabrik; Springer: Berlin/Heidelberg, Germany, 2018; ISBN 978-3-662-55782-2.11. Hibino, H.; Sakuma, T.; Yamaguchi, M. Evaluation System for Energy Consumption and Productivity in Manufacturing System
Simulation. Int. J. Autom. Technol. 2012, 6, 279–288. [CrossRef]12. Bär, R.; Voigt, T. Analysis and Prediction Methods for Energy Efficiency and Media Demand in the Beverage Industry. Food Eng.
Rev. 2019, 11, 200–217. [CrossRef]13. Smith, J.S. Survey on the use of simulation for manufacturing system design and operation. J. Manuf. Syst. 2003, 22, 157–171.
[CrossRef]14. Schröter, M.; Weißfloch, U.; Buschak, D. Energieeffizienz in der Produktion—Wunsch Oder WIRKLICHKEIT? Energieeinspar-
potenziale und Verbreitungsgrad Energieeffizienter Techniken. Available online: http://hdl.handle.net/10419/29650 (accessedon 15 January 2019).
15. Thollander, P.; Backlund, S.; Trianni, A.; Cagno, E. Beyond barriers—A case study on driving forces for improved energy efficiencyin the foundry industries in Finland, France, Germany, Italy, Poland, Spain, and Sweden. Appl. Energy 2013, 111, 636–643.[CrossRef]
16. O’Kane, J.; Papadoukakis, A.; Hunter, D. Simulation usage in SMEs. J. Small Bus. Enterp. Dev. 2007, 14, 514–527. [CrossRef]17. Sorrell, S.; Mallett, A.; Nye, S. Barriers to Industrial Energy Efficiency: A Literature Review; United Nations Industrial Development
Organization: Vienna, Austria, 2011.18. Barlas, P.; Heavey, C. Automation of input data to discrete event simulation for manufacturing: A review. Int. J. Model. Simul. Sci.
Comput. 2016, 7, 1630001. [CrossRef]19. Statistisches Bundesamt. Finanzen und Steuern—Brauwirtschaft. Available online: https://www.destatis.de/DE/Themen/
Staat/Steuern/Verbrauchsteuern/Publikationen/Downloads-Verbrauchsteuern/brauwirtschaft-2140922197004.pdf?__blob=publicationFile (accessed on 11 August 2020).
20. Osterroth, I.; Holm, A.; Voigt, T. State of the Art Survey of the Energy and Media Demand of German Beverage-bottling Plants.Brew. Sci. 2017, 89–99. [CrossRef]
21. Rädler, T.; Weisser, H. Stochastische Modellierungvon Abfüllinien. Chem. Ing. Tech. 2000, 2000, 627–630. [CrossRef]22. Voigt, T. Neue Methoden für den Einsatz der Informationstechnologie bei Getränkeabfüllanlagen. Ph.D. Dissertation, Technische
Universität München, Weihenstephan, Freising, Germany, 2004.23. Kadachi, M. Simulationsgestützte Planung und Nutzung von Getränke-Abfüllanlagen. Doctoral Dissertation, Technische
Universität München, Garching, Germany, 2001.24. Bernhard, J.; Kahe, T. Simulation und Modellmanagement in der Getränkeindustrie. Adv. Simul. Prod. 2008, 199–208.25. Al-Hawari, T.; Aqlan, F.; Al-Buhaisi, M.; Al-Faqeer, Z. Simulation-Based Analysis and Productivity Improvement of a Fully
Automatic Bottle-Filling Production System: A Practical Case Study. In Proceedings of the 2010 Second International Conferenceon Computer Modeling and Simulation 2010, Sanya, China, 22–24 January 2010; pp. 195–199. [CrossRef]
26. Dolgui, A.; Eremeev, A.; Kolokolov, A.; Sigaev, V. A Genetic Algorithm for the Allocation of Buffer Storage Capacities in aProduction Line with Unreliable Machines. J. Math. Model. Algorithms 2002, 1, 89–104. [CrossRef]
27. Spinellis, D.D.; Papadopoulos, C.T. A simulated annealing approach for buffer allocation in reliable production lines. Ann. Oper.Res. 2000, 93, 373–384. [CrossRef]
28. Phanden, R.K.; Chhabra, J.; Chaudhary, T.; Kaliramna, A. Improvements in Production Line Using ProModel© SimulationSoftware: A Case Study of Beer Beverage Company in India. In Advances in Industrial and Production Engineering: Select Proceedingsof FLAME 2020, 1st ed.; Phanden, R.K., Mathiyazhagan, K., Kumar, R., Paulo Davim, J., Eds.; Springer: Singapore, 2021; pp. 9–21.ISBN 978-981-334-320-7.
29. Voigt, T.; Flad, S.; Struss, P. Model-based fault localization in bottling plants. Adv. Eng. Inform. 2015, 29, 101–114. [CrossRef]

Sustainability 2021, 13, 10089 20 of 21
30. Dilay, E.; Vargas, J.; Amico, S.C.; Ordonez, J.C. Modeling, simulation and optimization of a beer pasteurization tunnel. J. Food Eng.2006, 77, 500–513. [CrossRef]
31. Muster-Slawitsch, B.; Weiss, W.; Schnitzer, H.; Brunner, C. The green brewery concept—Energy efficiency and the use of renewableenergy sources in breweries. Appl. Therm. Eng. 2011, 31, 2123–2134. [CrossRef]
32. Marchini, D.; Rinaldi, M.; Montanari, R.; Bottani, E.; Solari, F. Performance Analysis of the Water Supply System of a DairyCompany by Means of an Advanced Simulation Tool. Int. J. Food Eng. 2014, 10. [CrossRef]
33. Johansson, B.; Stahre, J.; Berlin, J.; Östergren, K.; Sundström, B.; Tillmann, A.-M. Discrete Event Simulation with LifecycleAssessment Data At A Juice Manufacturing System. In Proceedings of the FOODSIM 2008 Conference, Dublin, Ireland, 26–28June 2008.
34. Hubert, S.; Pettigrew, L.; Helmers, T.; Mießner, U.; Groß, F.; Räbiger, N.; Delgado, A. Simulation-based optimisation of wastewaterflow and composition for on-site treatment in the food and beverage industry utilising reference nets in combination with geneticalgorithms. Proc. Appl. Math. Mech. 2014, 14, 811–812. [CrossRef]
35. Hubert, S.; Baur, F.; Delgado, A.; Helmers, T.; Rabiger, N. Simulation modeling of bottling line water demand levels usingreference nets and stochastic models. In Proceedings of the 2015 Winter Simulation Conference (WSC), Huntington Beach, CA,USA, 6–9 December 2015; pp. 2272–2282. [CrossRef]
36. Osterroth, I.; Klein, S.; Nophut, C.; Voigt, T. Operational state related modelling and simulation of the electrical power demand ofbeverage bottling plants. J. Clean. Prod. 2017, 162, 587–600. [CrossRef]
37. Forster, T. Modellierung und Simulation von Getränkeabfüll- und Verpackungsanlagen unter Berücksichtigung von Energie-und Medienverbräuchen. In Simulation in Produktion und Logistik; Entscheidungsunterstützung von der Planung bis zur Steuerung;Dangelmaier, W., Laroque, C., Klaas, A., Paderborn, Eds.; October 2013; pp. 197–206.
38. Lees, M.; Ellen, R.; Brodie, P.; Steffens, M. A real-time Utilities Management System for optimising cleaning operations in abrewery. In Proceedings of the 2009 IEEE International Conference on Industrial Technology—(ICIT), Churchill, Australia, 10–13February 2009; IEEE: Piscataway, NJ, USA, 2009; pp. 1–6, ISBN 978-1-4244-3506-7.
39. Hubert, S.R. Unternehmensweite Modellierung und Simulation von Produktionssystemen der Prozessindustrie am Beispiel von Brauereien;FAU University Press: Boca Raton, FL, USA, 2018; ISBN 978-3-96147-130-0.
40. Reinhardt, H.; Weber, M.; Putz, M. A Survey on Automatic Model Generation for Material Flow Simulation in DiscreteManufacturing. Procedia CIRP 2019, 81, 121–126. [CrossRef]
41. Bergmann, S.; Strassburger, S. Challenges for the automatic generation of simulation models for production systems. InProceedings of the 2010 Summer Computer Simulation Conference, Ottawa, ON, Canada, 11–14 July 2010; pp. 545–549.
42. Rabe, M.; Spiekermann, S.; Wenzel, S. Verifikation und Validierung für die Simulation in Produktion und Logistik; Springer:Berlin/Heidelberg, Germany, 2008; ISBN 978-3-540-35281-5.
43. Law, A.M.; Kelton, W.D. Simulation Modeling and Analysis, 2nd ed.; McGraw-Hill: New York, NY, USA, 1991; ISBN 0-07-036698-5.44. Chen, J. Comparison analysis for validating methods of system simulation models. In Proceedings of the International Conference
on Electric Information and Control Engineering (ICEICE), Wuhan, China, 15–17 April 2011; IEEE: Piscataway, NJ, USA, 2011; pp.232–235, ISBN 978-1-4244-8036-4.
45. Hu, Y.; Ma, P.; Yang, M.; Wang, Z. Validation and optimization of modular railgun model. In Proceedings of the 16th InternationalSymposium on Electromagnetic Launch Technology, Beijing, China, 15–19 May 2012; IEEE: Piscataway, NJ, USA, 2012; pp. 1–6,ISBN 978-1-4673-0305-7.
46. Netter, F.; Gauterin, F.; Butterer, B. Real-Data Validation of Simulation Models in a Function-Based Modular Framework. InProceedings of the IEEE Sixth International Conference on Software Testing, Verification and Validation, Luxembourg, 18–22March 2013; IEEE: Piscataway, NJ, USA, 2013; pp. 41–47, ISBN 978-0-7695-4968-2.
47. Song, J.; Wei, L.; Ming, Y. A Method for Simulation Model Validation Based on Theil’s Inequality Coefficient and PrincipalComponent Analysis. In AsiaSim 2013; Tan, G., Yeo, G.K., Turner, S.J., Teo, Y.M., Eds.; Springer: Berlin/Heidelberg, Germany,2013; pp. 126–135. ISBN 978-3-642-45036-5.
48. Bär, R.M.; Voigt, T.; Bär, R.M.; Voigt, T. A metamodelling approach for the simulation of energy and media demand for thebrewing industry//A metamodeling approach for the simulation of energy and media demand for the brewing industry. J. Adv.Manuf. Process. 2021, 3. [CrossRef]
49. Kelch/Hohmann Getränke-Info. Umsatz der Führenden Mineralbrunnen in Deutschland im Jahr 2020 (in Millionen Euro),2021. Lebensmittel Zeitung, 22. Available online: https://de.statista.com/statistik/daten/studie/155904/umfrage/umsatz-der-groessten-mineralbrunnen-deutschland/ (accessed on 18 August 2021).
50. Manger, H.-J. Füllanlagen für Getränke: Ein Kompendium zur Reinigungs-, Füll- und Verpackungstechnik für Einweg- undMehrwegflaschen, Dosen, Fässer und Kegs; 1. Aufl.; VLB: Berlin, Germany, 2008; ISBN 978-3-921690-60-4.
51. Kather, A.; Haufe, C.; Voigt, T. Weihenstephan Weihenstephan Standards for Production Data Acquisition: WS Pack Specification of theInterface Content (Part 2); Technische Universität München: Freising, Germany, 2020.
52. DIN Deutsches Institut für Normung e. V. Verpackungsmaschinen und Verpackungsanlagen—Kennzahlen zur Charakterisierung desBetriebsverhaltens und Bedingungen für deren Ermittlung im Rahmen eines Abnahmelaufs; Beuth Verlag GmbH: Berlin, Germany, 2014.
53. American National Standards Institute. ANSI-ISA-88.00.01-2010: Batch Control Part 1: Models and Terminology; ISA: ResearchTriangle Park, NC, USA, 2010; ISBN 978-1-936007-75-2.

Sustainability 2021, 13, 10089 21 of 21
54. SimPlan AG. PacSi: Das Simulationssystem für Verarbeitungs- und Verpackungsanlagen. Available online: https://www.pacsi.de/(accessed on 17 August 2021).
55. Römisch, P.; Weiß, M. Projektierungspraxis Verarbeitungsanlagen; Springer Fachmedien Wiesbaden: Wiesbaden, Geramny, 2014;ISBN 978-3-658-02358-4.
56. Henning, J.; Weiß, M. Simulative Optimierung von Verpackungsanlagen mit PacSI/ISSOP. In Experiences from the Future: NewMethods and Applications in Simulation for Production and Logistics; Tagungsband 11. ASIM-Fachtagung “Simulation in Produktionund Logistik”, Berlin, 4–5 October 2004; Mertins, K., Ed.; Fraunhofer-IRB-Verl.: Stuttgart, Germany, 2004; ISBN 3-8167-6640-4.
57. Sargent, R.G. Verification and validation of simulation models. In Proceedings of the 2010 Winter Simulation Conference,Baltimore, MD, USA, 5–8 December 2010; pp. 166–183. [CrossRef]
58. Saiga, K.; Ullah, A.S.; Kubo, A. A Sustainable Reverse Engineering Process. Procedia CIRP 2021, 98, 517–522. [CrossRef]59. Shahinur, S.; Ullah, A.S.; Noor-E-Alam, M.; Haniu, H.; Kubo, A. A decision model for making decisions under epistemic
uncertainty and its application to select materials. AIEDAM 2017, 31, 298–312. [CrossRef]