Simulation of artificial vision: II. Eccentric reading of full-page text and the learning of this...
14
Simulation of artificial vision: II. Eccentric reading of full-page text and the learning of this task J€ org Sommerhalder * , Benjamin Rappaz, Raoul de Haller, Ang elica P erez Fornos, Avinoam B. Safran, Marco Pelizzone Ophthalmology Clinic, Geneva University Hospitals, 1211 Geneva 14, Switzerland Received 3 June 2003; received in revised form 13 January 2004 Abstract Reading of isolated words in conditions mimicking artificial vision has been found to be a difficult but feasible task. In particular at relatively high eccentricities, a significant adaptation process was required to reach optimal performances [Vision Res. 43 (2003) 269]. The present study addressed the task of full-page reading, including page navigation under control of subject’s own eye movements. Conditions of artificial vision mimicking a retinal implant were simulated by projecting stimuli with reduced infor- mation content (lines of pixelised text) onto a restricted and eccentric area of the retina. Three subjects, na € ıve to the task, were trained for almost two months (about 1 h/day) to read full-page texts. Subjects had to use their own eye movements to displace a 10°· 7° viewing window, stabilised at 15° eccentricity in their lower visual field. Initial reading scores were very low for two subjects (about 13% correctly read words), and astonishingly high for the third subject (86% correctly read words). However, all of them significantly improved their performance with time, reaching close to perfect reading scores (ranging from 86% to 98% correct) at the end of the training process. Reading rates were as low as 1–5 words/min at the beginning of the experiment and increased signi- ficantly with time to 14–28 words/min. Qualitative text understanding was also estimated. We observed that reading scores of at least 85% correct were necessary to achieve ‘good’ text understanding. Gaze position recordings, made during the experimental sessions, demonstrated that the control of eye movements, especially the suppression of reflexive vertical saccades, constituted an important part of the overall adaptive learning process. Taken together, these results suggest that retinal implants might restore full-page text reading abilities to blind patients. About 600 stimulation contacts, distributed on an implant surface of 3 · 2 mm 2 , appear to be a minimum to allow for useful reading performance. A significant learning process will however be required to reach optimal per- formance with such devices, especially if they have to be placed outside the foveal area. Ó 2004 Elsevier Ltd. All rights reserved. Keywords: Visual prosthesis; Simulation; Reading performance; Eccentric reading; Learning 1. Introduction Visual prostheses for the blind are currently being developed by several research groups (Chow & Chow, 1997; Dobelle, 2000; Humayun, 2001; Normann, May- nard, Rousche, & Warren, 1999; Rizzo & Wyatt, 1997; Veraart et al., 1998; Zrenner, 2002). Technological ad- vances are impressive, but several fundamental con- straints have to be seriously considered before one can hope to restore useful vision. For example, retinal prosthesis will be implanted at a fixed location in the eye and they will, in all likelihood, subtend only a fraction of the entire visual field. Furthermore, all envisioned prosthesis will consist of a finite number of discrete stimulation contacts. The implications of these con- straints need to be investigated, in order to establish minimum requirements for useful artificial vision before using such devices on patients. We use simulations of artificial vision on normal subjects to investigate this important issue. Pixelised images are projected in a restricted viewing area, posi- tioned at a fixed location in the visual field. In a previous study (Sommerhalder et al., 2003), we demonstrated that the amount of information conveyed by about 250– 300 pixels (or distinct stimulation spots in a retinal prosthesis) is sufficient to allow close to perfect reading of isolated four-letter words, if the stimulus is projected in the central visual field. When the same images were * Corresponding author. Tel.: +41-2238-28420; fax: +41-2238- 28382. E-mail address: [email protected] (J. Sommerhalder). 0042-6989/$ - see front matter Ó 2004 Elsevier Ltd. All rights reserved. doi:10.1016/j.visres.2004.01.017 Vision Research 44 (2004) 1693–1706 www.elsevier.com/locate/visres
Transcript of Simulation of artificial vision: II. Eccentric reading of full-page text and the learning of this...

Vision Research 44 (2004) 1693–1706
www.elsevier.com/locate/visres
Simulation of artificial vision: II. Eccentric reading of full-pagetext and the learning of this task
J€org Sommerhalder *, Benjamin Rappaz, Raoul de Haller, Ang�elica P�erez Fornos,Avinoam B. Safran, Marco Pelizzone
Ophthalmology Clinic, Geneva University Hospitals, 1211 Geneva 14, Switzerland
Received 3 June 2003; received in revised form 13 January 2004
Abstract
Reading of isolated words in conditions mimicking artificial vision has been found to be a difficult but feasible task. In particular
at relatively high eccentricities, a significant adaptation process was required to reach optimal performances [Vision Res. 43 (2003)
269]. The present study addressed the task of full-page reading, including page navigation under control of subject’s own eye
movements. Conditions of artificial vision mimicking a retinal implant were simulated by projecting stimuli with reduced infor-
mation content (lines of pixelised text) onto a restricted and eccentric area of the retina. Three subjects, na€ıve to the task, were
trained for almost two months (about 1 h/day) to read full-page texts. Subjects had to use their own eye movements to displace a
10� · 7� viewing window, stabilised at 15� eccentricity in their lower visual field. Initial reading scores were very low for two subjects
(about 13% correctly read words), and astonishingly high for the third subject (86% correctly read words). However, all of them
significantly improved their performance with time, reaching close to perfect reading scores (ranging from 86% to 98% correct) at the
end of the training process. Reading rates were as low as 1–5 words/min at the beginning of the experiment and increased signi-
ficantly with time to 14–28 words/min. Qualitative text understanding was also estimated. We observed that reading scores of at least
85% correct were necessary to achieve ‘good’ text understanding. Gaze position recordings, made during the experimental sessions,
demonstrated that the control of eye movements, especially the suppression of reflexive vertical saccades, constituted an important
part of the overall adaptive learning process. Taken together, these results suggest that retinal implants might restore full-page text
reading abilities to blind patients. About 600 stimulation contacts, distributed on an implant surface of 3· 2 mm2, appear to be a
minimum to allow for useful reading performance. A significant learning process will however be required to reach optimal per-
formance with such devices, especially if they have to be placed outside the foveal area.
� 2004 Elsevier Ltd. All rights reserved.
Keywords: Visual prosthesis; Simulation; Reading performance; Eccentric reading; Learning
1. Introduction
Visual prostheses for the blind are currently beingdeveloped by several research groups (Chow & Chow,
1997; Dobelle, 2000; Humayun, 2001; Normann, May-
nard, Rousche, & Warren, 1999; Rizzo & Wyatt, 1997;
Veraart et al., 1998; Zrenner, 2002). Technological ad-
vances are impressive, but several fundamental con-
straints have to be seriously considered before one can
hope to restore useful vision. For example, retinal
prosthesis will be implanted at a fixed location in the eyeand they will, in all likelihood, subtend only a fraction
* Corresponding author. Tel.: +41-2238-28420; fax: +41-2238-
28382.
E-mail address: [email protected] (J. Sommerhalder).
0042-6989/$ - see front matter � 2004 Elsevier Ltd. All rights reserved.
doi:10.1016/j.visres.2004.01.017
of the entire visual field. Furthermore, all envisioned
prosthesis will consist of a finite number of discrete
stimulation contacts. The implications of these con-straints need to be investigated, in order to establish
minimum requirements for useful artificial vision before
using such devices on patients.
We use simulations of artificial vision on normal
subjects to investigate this important issue. Pixelised
images are projected in a restricted viewing area, posi-
tioned at a fixed location in the visual field. In a previous
study (Sommerhalder et al., 2003), we demonstratedthat the amount of information conveyed by about 250–
300 pixels (or distinct stimulation spots in a retinal
prosthesis) is sufficient to allow close to perfect reading
of isolated four-letter words, if the stimulus is projected
in the central visual field. When the same images were

2 Text is drifting as a single line horizontally over a visualisation
screen. Thus the reader does not have to jump from one line to another
and can keep his gaze position quite stable.3 A CCTV consists of a video camera equipped with a magnifying
lens and connected to a TV monitor. The reader can thus only see a
few characters at a time and has to move the video camera over the
1694 J. Sommerhalder et al. / Vision Research 44 (2004) 1693–1706
projected in eccentric areas, reading performance de-
creased dramatically with increasing eccentricity. Even
when using high pixel resolutions, reading was almost
impossible for eccentricities beyond 10�.It is important to investigate the effect of stimulus
eccentricity on performance, because the anatomo-
physiology of the retina does not favour a foveal loca-
tion for retinal prostheses (see e.g. Sj€ostrand, Olsson,Popovic, & Conradi, 1999). Retinal implants are pri-
marily designed to stimulate neurons of the inner retinal
layers (bipolar and/or ganglion cells) in cases of blind-
ness due to photoreceptor loss (e.g. retinitis pigmen-
tosa). In the central fovea, these neurons are not present.
In the parafovea, they are arranged in several superim-
posed layers that make it difficult to activate them in
predictable patterns. The best sites, potentially preserv-ing retinotopic activation without major distortion, are
located at an eccentricity of 10� and more. This means
that the vision of future users of retinal prosthesis will
probably be restricted to small peripheral areas of their
visual field. Our ability to identify objects in the
periphery is however poor. Especially reading words of
several letters is very difficult due to contour interaction,
the so-called ‘crowding effect’ (see e.g. Toet & Levi,1992).
Although our acute experiments at 15� eccentricity
had shown very poor reading of isolated four-letter
words, performance could be improved impressively
upon systematic training (about 1 h/day for about 1
month––Sommerhalder et al., 2003). Whether this
promising result was due to the better control of unde-
sirable reflexive eye movements or to a decrease of the‘crowding effect’ 1 was unclear, but it suggests that re-
tinal prostheses might successfully restore some reading
abilities in blind patients, even if the implant has to be
placed outside the fovea.
So far, our experiments were conducted using isolated
four-letter words and not full pages of text. They did not
require page navigation during reading. This means that
subjects did not have to move their gaze from one wordto the other and from the end of one line to the begin-
ning of the next one. Page navigation implies not only
the stabilisation of the gaze on a particular point of
interest, but also micro-saccades to read lines of text as
well as larger saccades to jump from the end of one line
to the beginning of the next one. In previous literature,
page navigation has essentially been studied in connec-
tion with the use of special field of view magnifiers, in-tended as reading aids for low vision patients.
Beckmann and Legge (1996) measured reading rates of
normal and of low vision subjects in two conditions:
1 For a more detailed discussion about ‘crowding’, attention and
perceptual learning, see also Sommerhalder et al. (2003) and citations
therein.
with horizontally drifting text 2 requiring no page nav-
igation and with a closed-circuit television magnifier
(CCTV) 3 requiring ‘manual’ page navigation. Manual
page navigation resulted in significantly lower reading
rates. This effect was more pronounced on normal
subjects than on low vision patients, suggesting that
overall reading performance was reduced in these pa-
tients because of limitations due to other visual factors.A second comparative study of the same research group
(Harland, Legge, & Luebker, 1998), including RSVP 4
text presentation and ‘mouse’-controlled page naviga-
tion, confirmed their previous findings. The use of RSVP
and drifting text presentation resulted in better reading
performance than the use of CCTV or ‘mouse’ naviga-
tion. Interestingly, they did not observe significant dif-
ferences in reading rates across the four methods of textpresentation in a group of patients with central field
loss, i.e. for subjects who were forced to use eccentric
fixation for reading.
It is difficult to predict from these data how patients
using retinal prosthesis would cope with the page navi-
gation problem. The most advanced retinal prostheses,
envisioned at present, are devices, which will transform
in situ, light falling on the retina into electrical stimu-lation currents. Such an implant design has the funda-
mental advantage that the user can scan his/her
environment using eye movements, even if the implant
might need to be placed extra-foveally. An additional
benefit is also the fact that these devices do not require
the use of an extra-ocular camera, avoiding the delicate
issue of wired connections to the rapidly moving eye.
Neither horizontally drifting text nor RSVP do realis-tically mimic text reading using such retinal implants,
since both methods are expressively intended to mini-
mise eye movements. 5 ‘Mouse’-controlled and CCTV
reading are both quite unnatural conditions, because
they rely on manual page navigation.
In this study we used simulations to address the issue
of full-page text reading in conditions mimicking artifi-
cial vision provided by a retinal implant.On one hand, full-page text reading can be expected
to be more difficult than deciphering isolated words,
lines of text.4 Rapid serial visual presentation, involving no page navigation and
very few eye movements.5 For other types of retinal implants, which are conceived to use an
external camera to capture the stimuli, eye movements will have to be
replaced by head movements.

6 Comit�e d’Etique de la Recherche sur l’Etre Humain (CEREH) des
Hopitaux Universitaires de Gen�eve.
J. Sommerhalder et al. / Vision Research 44 (2004) 1693–1706 1695
because successful reading of several lines of text re-
quires page navigation abilities, i.e. well-controlled eye
movements, which can be difficult to achieve with a
restricted viewing area, located at a fixed position in the
visual field, especially if eccentric retinal locations are
used. Future users of retinal implants will have to ref-
erence reading eye movements to a non-foveal retinal
locus. Patients with central field loss develop one orseveral preferred retinal loci (PRL), in attempt to
compensate for the missing fovea. Fletcher and Schu-
chard (1997) studied the locations of PRLs relative to
the macular scotoma, and how their patients managed
to use these PRLs (fixation, pursuit and saccadic abil-
ity). 54% of them showed some pursuit ability; 57% of
them were able to stabilise a stationary target within a
discrete retinal area; 77% of them were able to movetheir PRL to separate targets. Most of them made
however several saccades when moving from one target
to another, having also difficulties with a stable target
fixation. Foveating saccades have shorter initiation
latencies and are faster than non-foveating saccades.
Whittaker, Cummings, and Swieson (1991) compared
the saccadic eye movements of patients with macular
degeneration with those of normal subjects. They foundout, that even if patients were capable to consistently
direct images to their PRL, their saccades still kept the
characteristics of non-foveating saccades, suggesting
that patients with macular scotoma suppress rather
than adapt the foveating saccade mechanism. There is
very little literature concerning the time course of
saccadic adaptation to a non-foveal location. Heinen
and Skavenski (1992) studied this issue on monkeys.They introduced bilateral foveal lesions in three adult
animals and found that new PRLs were stable within
two days, while the saccadic system did not stabilize for
at least two weeks. Two of the three animals were not
capable to bring the target directly to the new fixation
locus.
On the other hand, full-page text reading might be
expected to be easier than deciphering isolated words,because subjects can make use of context information to
facilitate reading. We are better at reading meaningful
sentences than random words (Fine & Peli, 1996; La-
tham & Whitaker, 1996). The benefits of context are
however controversial when it comes to peripheral vi-
sion. It has been suggested that readers with central field
loss would be less efficient in using context to facilitate
reading (see Baldasare & Watson, 1986 or Latham &Whitaker, 1996). But this hypothesis is contradicted by
other studies. For example, Fine and Peli (1996) com-
pared reading rates for meaningful sentences to reading
rates for random words for normally sighted subjects
and for subjects with central field loss, they found that
speed gains due to context were present and equivalent
for both groups of subjects when using RSVP and
scrolled text presentation.
2. Methods
We conducted two successive experiments. In the first
experiment, subjects were asked to read pixelised full-
page texts using a viewing area, stabilised on the fovea.
In the second experiment, subjects were asked to per-
form the same task, but using a viewing area stabilised
at 15� eccentricity. In both experiments, we expectedthat the subjects might adapt progressively to the task
and perform better with time. Thus, experimental ses-
sions were repeated daily, until we were sure that scores
were stable. In the first experiment, reading scores as-
ymptoted within a few sessions. In the second experi-
ment, an important learning process was observed. A
period of almost two months was necessary until
eccentric reading scores asymptoted.
2.1. Subjects
Three young subjects (AD, female, 24 years old; DV,
female, 23 years old; DS, male, 30 years old), working at
the Geneva Eye Clinic, participated in both experiments.All of them had normal or corrected to normal vision as
well as a normal ophthalmologic status. They were na-
tive French speakers and they were familiar with the
purpose of the study. All of them knew that two daily
sessions over a time period of several weeks would be
necessary to complete the experiment. They did not
participate in any of the previous studies on eccentric
reading.All experiments were conducted according to the
ethical recommendations of the Declaration of Helsinki,
and were approved by local ethical authorities. 6
2.2. Experimental procedure
To simulate the visual percepts produced by a retinal
prosthesis (in our case a retinal implant, which trans-
forms in situ incident light into electrical stimulation
signals), images were projected on a defined and stabi-
lised area of the retina. Briefly, the position and content
of the stimulus were generated on a fast computer dis-
play used in association with a SMI EyeLink gazetracking system (Senso Motoric Instruments GmbH,
Teltow/Berlin, Germany) for online monitoring of the
gaze position. Gaze position data were used to move a
small viewing window over a screen displaying full-page
text (Fig. 1). The position of the viewing window relative
to the gaze position could be offset arbitrarily. The
viewing window was thus projected either onto the
central retina (no offset between viewing window andgaze position) or onto a defined eccentric area of retina

8 http://www.letemps.ch/9
Fig. 1. The experimental set-up used to simulate full-page text reading
in conditions mimicking vision with a retinal prosthesis. The subject
was asked to read a page of pixelised text, using her own eye move-
ments to move a restricted viewing window on the computer screen.
1696 J. Sommerhalder et al. / Vision Research 44 (2004) 1693–1706
(constant non zero offset). The experimental set-up was
described in detail in a previous paper (Sommerhalderet al., 2003).
From previous experiments, we knew that a sampling
density of 286 pixels, distributed over an area corre-
sponding to 10� · 3.5� of the visual field, would allow for
close to perfect recognition of isolated words. We ob-
served however, that the height of such a viewing win-
dow was limiting page navigation, because it did not
allow to see the preceding or the following line of thetext. Therefore, we conducted pilot experiments in cen-
tral vision to determine a more adequate height of the
viewing window. We found that doubling the height of
the viewing window to 7� allowed to visualise two lines
of the text at once, and this was found to be greatly
helpful to orient page navigation. When increasing the
viewing area height to 10�, more than two lines were
visible simultaneously, but this was not experienced as afurther improvement by the subjects. We therefore
decided to use a 10� · 7� viewing window for the present
experiments. Using the same pixel density as in our
previous studies, this resulted in an area containing 572
pixels. 7 Such a viewing area would correspond to a
surgically manageable implant size of 3 · 2 mm2 as well
as to a technically feasible contact to contact spacing of
about 100 lm.
2.3. Generation and presentation of the stimuli
Stimuli were pre-pixelised bitmap images. The texts
used to generate these images were extracted from the
Swiss newspaper ‘‘Le Temps’’. This newspaper is written
in common French language. It is a good representative
7 This value represents an array of 28.6· 20 pixels, using the same
pixel density as used for our previous study (Sommerhalder et al.,
2003).
of a common information newspaper, being neither too
elementary, nor too sophisticated. One hundred small
articles of diverse contents (culture, politics, economics,
sports, etc.) were downloaded from the website of the
journal. 8
The texts of these articles were presented on the
screen using a Helvetica (i.e. Arial) font size as in our
previous experiments on single word recognition. At aviewing distance of 57 cm, the height of the small letter
‘x’ corresponded to a visual angle of 1.8�. In these
conditions, a segment of seven successive lines of text
could be displayed on the screen, and about six succes-
sive letters could be visualised at once in the 10� width of
the viewing window. Hyphenation was used to allow for
the presentation of a maximum of words, resulting in an
average of about 25 words per text segment. Each articlewas divided into such successive segments and pixe-
lised 9 using commercial software (Adobe Photoshop�
5.5). Fig. 2a shows an example of such a stimulus.
Subjects were tested monocularly using their domi-
nant eye. During the experiment, they were comfortably
seated facing the stimulation screen, and wearing the
headband mounted SMI eye tracking system. At the
beginning of each session the eye to screen distance waschecked, and a standard nine-point calibration of the
eye-tracker was performed. Subjects were requested not
to move during the session. Then, the first segment of an
article, randomly chosen out of the 100-article library,
was presented on the stimulation screen. The subjects
could use their own eye movements to scan the stimu-
lation screen, but only a small part of the entire text
segment was visible through the 10� · 7� window (seeFig. 2b). During each session, subjects had to read aloud
the first four initial text segments (about 100 words) of
an article. Their voice and gaze position were recorded
for further analysis. After the presentation of each text
segment, the calibration was checked for possible drifts
or artefactual movements, and if necessary, slightly
corrected to insure an exact control of the viewing
window position during the entire experimental session.In very rare cases, these controls revealed a significant
drift, meaning that the position of the viewing window
was not stable during the presentation of the text seg-
ment. The results from this segment were discarded and
an additional text segment was read. At the end of each
session (i.e., after reading four successive text segments),
a qualitative comprehension test was performed by
questioning the subject on the content of the article.
Mosaic pixelisation (i.e., square pixels of uniform grey level) was
used. Such simple patterns were adequate to simulate the reduced
information content (e.g. finite quantisation) of the stimuli, but do not
pretend to mimic exactly percepts elicited by electrical activation of the
retina.

10 Note that the %-correct to rau transformation is dependent of
sample size (in our case the total number of words used in one session).
Therefore, our approximate %-correct scales are based on the average
number of words computed across all session presented on the graphs.11 We used such an uncommon four-level scale, because it is much
easier to judge first if a subject understood the main issue of a text and
then to ask some questions to determine whether the subjects grasped
some parts of the text or if the subject really had a detailed
understanding.
Fig. 2. (a) A segment of pixelised full-page text as presented on the
computer screen. The tree dots, at the beginning and at the end,
indicate a text segment situated somewhere in the body of an article.
Texts were not justified. (b) The screen viewed by the subject. Only a
small part of the test could be seen through a 10� · 7� viewing window.
The rest of the screen was blanked by an uniform grey foreground. The
gaze position was constantly monitored by the system and the viewing
window moved accordingly on the screen. The content of the viewing
window was thus permanently projected on the same retinal area at an
eccentricity 0� for experiment 1 and, as illustrated, at an eccentricity of
15� for experiment 2. For illustration purposes only, the whole text
segment was made slightly visible in this figure. This was not the case
during the experiments.
J. Sommerhalder et al. / Vision Research 44 (2004) 1693–1706 1697
A different article was used in each session. None of thesubjects read an article twice.
In experiment 1, several sessions were conducted
using a centrally located viewing window. This experi-
ment lasted until subjects became familiar with the task
of reading pixelised text, using a small viewing window
for page navigation. A stable percentage of correctly
read words was used as criterion to stop the experiment.
Experiment 2, testing eccentric reading, began onlywhen the subjects had adapted to central reading. To
investigate for possible learning effects, experimental
sessions were performed repeatedly for a period of al-
most two months. In general, two sessions were con-
ducted each working day of the week (5 days per week).
The regular daily flow of sessions was interrupted for
weekends, and exceptionally for brief vacations. The
duration of each experimental session was variable
throughout the experiment, but it never exceeded 30
min. Two sessions represented therefore less than 1 h ofdaily training. This experiment was stopped when
reading scores asymptoted. Between 55 and 68 sessions
per subject were necessary to achieve this criterion.
2.4. Data analysis and statistics
Reading performance was measured in terms of
reading scores (expressed in percentage of correctly read
words per session) and in terms of reading rate (ex-
pressed in number of correctly read words per minute
during each session).
Reading scores, expressed on a proportional per-
centage scale are, however, not suitable for statisticalanalysis. It is well known that with proportional scales,
variance is not correlated with the mean. In other words,
the data are not normally distributed around the mean
and scale values are not linear in relation to the test
variability. This problem can be solved by using an
arcsine transformation. Studebaker (1985) proposed to
use so-called ‘‘rationalised arcsine units’’ (rau), values
that are numerically close to the original percentagerange, while retaining all of the desirable properties of
the arcsine transform. Therefore, reading scores were
statistically analysed using scores expressed in rau. For
better clarity however, an approximate %-correct
scale 10 is indicated on the right ordinates of the graphs.
Qualitative comprehension of the text was judged by
two examiners using an arbitrary four-grade scale:
‘None’ meaning that the text was not understood at all;‘insufficient’ meaning very partial comprehension,
insufficient to understand the issue reported in the text;
‘good’ meaning that the main issue was grasped but not
all details; ‘excellent’ meaning a perfect and detailed
comprehension of the text. 11 After each reading session,
the subjects had to describe what they had read and were
then questioned by the two examiners, who had no
difficulties to attribute one of the four comprehensionlevels. Subjects reported spontaneously to be satisfied,
when they reached ‘excellent’ or ‘good’ levels of

AD
100110120
90
100
DV
Wor
ds c
orre
ctly
read
[rau
]
100110120
Wor
ds c
orre
ctly
read
[%]
90
100
DS
0 2 4 6 8 10 12 14 16
100110120
90
100
1698 J. Sommerhalder et al. / Vision Research 44 (2004) 1693–1706
comprehension, associated with a reading rate of about
20 words per minute. From a clinical point of view,
these two later levels might be considered as a gratifying
and useful performance on full-page text reading.
‘Learning curves’ were established on the basis of the
evolution of reading performance versus time. Data
were fitted using the non-linear regression function
y ¼ y0 þ að1 � e�bxÞ:We used a simple linear correlation (Pearson’s cor-
relation) to determine if training (expressed as the
number of sessions) had a statistically significant effect
on performance.
Session #(a)
(b)
AD
6080100120
DV
Rea
ding
rate
[wor
ds/m
in]
6080100120
DS
Session #0 2 4 6 8 10 12 14 16
6080100120
Fig. 3. Reading performance during experiment 1 for three subjects
(AD, DV and DS). Full-page texts were read using central vision
(10� · 7� viewing window containing 572 pixels). (a) Reading scores as
well as (b) reading rates versus session number. The solid lines indicate
the best fits to the data.
3. Experiment 1: central reading of full-page text
Experiment 1 was dedicated to familiarise normal
subjects with the unusual task of reading pixelised full-
page text, using a small viewing window for page navi-
gation. For this easier experiment, subjects read six textsegments per session instead of the four segments per
session used in the more difficult experiment 2.
Fig. 3 presents reading performance in central vision
versus session number for each subject. All three sub-
jects performed immediately very well. Perfect, or close
to perfect reading scores (i.e. >95% correct) were already
achieved in the first sessions. No significant learning
effect was observed in the analysis of reading scoresversus time.
Reading rates improved with time for all three sub-
jects. Analysis of the experimental data, using the
exponential function presented in Section 2, revealed
that the average reading rate almost doubled from 71 to
122 words per minute for AD. It improved from 65 to 89
words per minute for DV, and from 60 to 72 words per
minute for DS. This improvement was however statis-tically significant only for subject AD (Pearson’s corre-
lation: r ¼ 0:78, p ¼ 0:003). Interestingly, subject AD
achieved at the end of this experiment reading rates,
which were quite superior to those of the two other
subjects. These reading rates can be compared to those
achieved by the same subjects in ‘normal’ conditions.
Reading rates were measured to be significantly higher,
ranging between 160 and 180 words per minute, forarticles directly read from the same journal.
In conclusion, experiment 1 clearly demonstrates that
useful full-page text reading can be obtained under
conditions mimicking artificial vision in the central vi-
sual field. The relevant information for reading could be
transmitted and captured by the visual system. The in-
creased difficulty of page navigation using a restricted
viewing window, and the fact, that this viewing windowcontained pixelised stimuli, resulted in reading rates,
significantly below normal values, but almost all words
were correctly deciphered.
4. Experiment 2: eccentric reading of full-page text
Experiment 2 was started when subjects had adapted
to perform the task in central vision. Based on our
previous results on eccentric reading of isolated words
(Sommerhalder et al., 2003), we expected that eccentric
reading of full-page text might also require significant
adaptation to reach maximum performance.
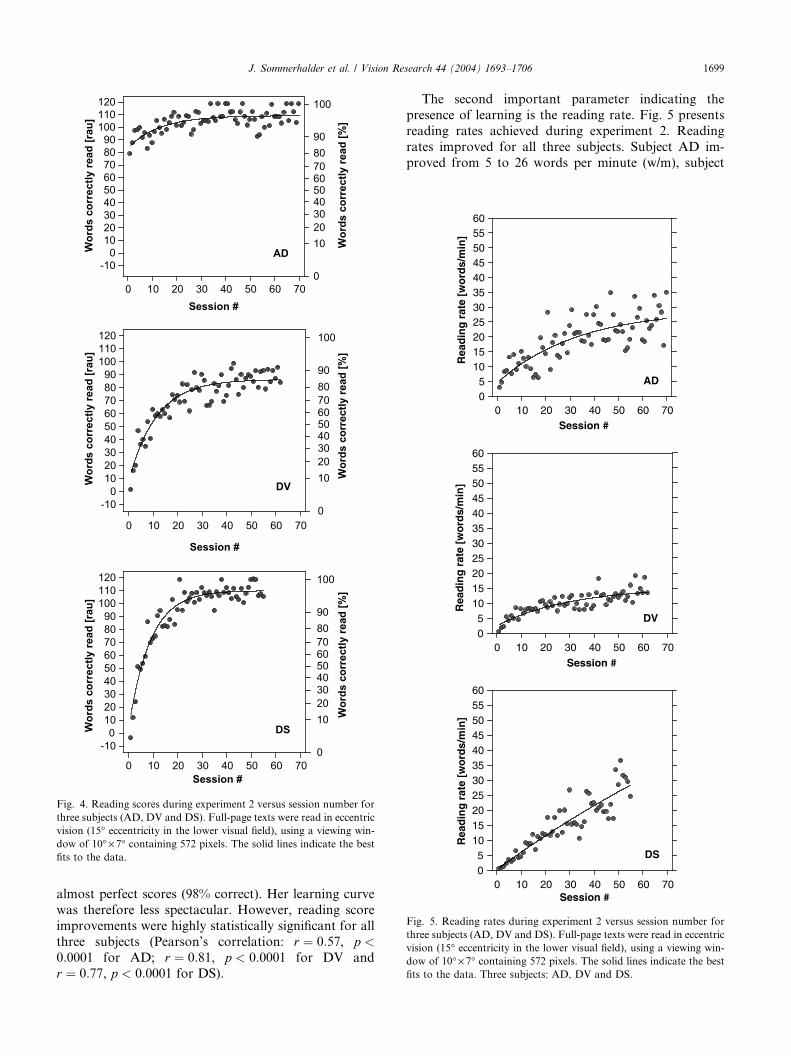
Fig. 4 presents individual reading scores versus ses-sion number for full-page text reading at 15� eccentric-
ity. Experimental data were fitted with the exponential
function presented in Section 2, to average session-to-
session variability. The performances of two out of the
three subjects tested showed massive improvements
during the course of the experiment. At the beginning of
the experiment, the subjects DV and DS were able to
identify only about 13 % of the words and they ended upwith scores of 86% and 98% correct respectively. In
contrast, subject AD already performed very well in the
initial sessions (about 85% correct), and ended up with
AD
Session #0 10 20 30 40 50 60 70
Wor
ds c
orre
ctly
read
[rau
]
-100102030405060708090100110120
Wor
ds c
orre
ctly
read
[%]
0
102030405060708090
100
DV
Session #
0 10 20 30 40 50 60 70
Wor
ds c
orre
ctly
read
[rau
]
-100102030405060708090100110120
Wor
ds c
orre
ctly
read
[%]
0
102030405060708090
100
DS
Session #0 10 20 30 40 50 60 70
Wor
ds c
orre
ctly
read
[rau
]
-100102030405060708090100110120
Wor
ds c
orre
ctly
read
[%]
0
102030405060708090
100
Fig. 4. Reading scores during experiment 2 versus session number for
three subjects (AD, DV and DS). Full-page texts were read in eccentric
vision (15� eccentricity in the lower visual field), using a viewing win-
dow of 10� · 7� containing 572 pixels. The solid lines indicate the best
fits to the data.
AD
Session #0 10 20 30 40 50 60 70
Rea
din
g r
ate
[wo
rds/
min
]
05
1015202530354045505560
DV
Session #0 10 20 30 40 50 60 70
Rea
din
g r
ate
[wo
rds/
min
]
05
1015202530354045505560
DS
Session #0 10 20 30 40 50 60 70
Rea
din
g r
ate
[wo
rds/
min
]
05
1015202530354045505560
Fig. 5. Reading rates during experiment 2 versus session number for
three subjects (AD, DV and DS). Full-page texts were read in eccentric
vision (15� eccentricity in the lower visual field), using a viewing win-
dow of 10� · 7� containing 572 pixels. The solid lines indicate the best
fits to the data. Three subjects: AD, DV and DS.
J. Sommerhalder et al. / Vision Research 44 (2004) 1693–1706 1699
almost perfect scores (98% correct). Her learning curve
was therefore less spectacular. However, reading score
improvements were highly statistically significant for all
three subjects (Pearson’s correlation: r ¼ 0:57, p <0:0001 for AD; r ¼ 0:81, p < 0:0001 for DV andr ¼ 0:77, p < 0:0001 for DS).
The second important parameter indicating the
presence of learning is the reading rate. Fig. 5 presents
reading rates achieved during experiment 2. Reading
rates improved for all three subjects. Subject AD im-
proved from 5 to 26 words per minute (w/m), subject

All subjects
Words correctly read [rau]0 20 40 60 80 100 120
Text
com
preh
ensi
on [a
rbitr
ary
units
]
none
insufficient
good
excellent
Words correctly read [%]0 20 40 60 80 100
Reading rate [words/min]0 10 20 30 40
none
insufficient
good
excellent
Fig. 7. Text comprehension estimates versus reading scores and
reading rate. All the data collected on the three subjects were merged.
Box plots indicate median values, 25th and 75th percentile values (grey
box) as well as 10th and 90th percentile values (vertical bars). Circles
indicate outliners.
1700 J. Sommerhalder et al. / Vision Research 44 (2004) 1693–1706
DV from 3 to 14 w/m, and subject DS from 1 to 28 w/m.
In spite of a large session-to-session variability (espe-
cially for subject AD), reading rate improvements were
statistically significant for all three subjects (Pearson’s
correlation: r ¼ 0:74, p < 0:0001 for AD, r ¼ 0:81,
p < 0:0001 for DV and r ¼ 0:90, p < 0:0001 for DS). At
the end of experiment 2, reading rates for eccentric
reading were still significantly below values obtained insimilar conditions for central reading, and of course
below normal reading rates, but they were remarkable
when compared to what subjects achieved at the
beginning of experiment 2. It is also important to note
that reading rates continued to improve after almost two
months of training, (i.e. at the time we terminated the
experiment because reading scores had asymptoted).
This suggests that higher reading rates could still havebeen achieved with further practice.
Word recognition scores and reading rates can be
measured accurately, and are therefore helpful experi-
mental values to demonstrate changes in performance,
but they do not reflect to which degree the content of the
text was understood. Text comprehension is not easy to
quantify, but we tried to assess this parameter using a
qualitative four-level scale (see Section 2). Fig. 6 pre-sents the evolution of text comprehension on the three
subjects throughout experiment 2. During initial ses-
sions, subjects DV and DS had experienced major
problems to understand the texts they read. ‘Good’
understanding could only be achieved after 16 sessions
or more. In contrast, subject AD achieved ‘good’ to
‘excellent’ text comprehension from the beginning. At
the end of experiment 2, subjects AD and DS system-atically achieved ‘excellent’ text comprehension, but not
subject DV. These results fit well with the performance
curves in Figs. 4 and 5 where subject AD achieved high
reading scores from the beginning and subject DV fin-
ished with the lowest performances.
AD
noneinsufficient
goodexcellent
DV
Text
com
preh
ensi
on [a
rbrit
ary
units
]
noneinsufficient
goodexcellent
DS
Session #0 10 20 30 40 50 60 70
noneinsufficient
goodexcellent
Fig. 6. Text comprehension estimates during experiment 2 versus
session number for the three subjects (AD, DV and DS).
It is interesting to plot the results of text compre-
hension versus reading scores and reading rates (Fig.
7). Reading scores of 85% correct or more were re-
quired to reach ‘excellent’ or ‘good’ levels of text
comprehension. Below 60% correct, text understanding
seemed to be impossible. The distribution of compre-hension levels versus reading rates was more variable.
For example, ‘excellent’ or ‘good’ comprehension levels
were reached over a large range of reading rates, and
even occasionally at reading rates below 10 w/m. Good
text comprehension appeared thus to be more closely
associated to high reading scores than to high reading
rates.
Taken together, results from experiment 2 demon-strate that an important learning process occurred for
eccentric reading of full-page text. This process was
however expressed differently across subjects. Subject
DS, for example, improved impressively in each of the
three measured parameters throughout the experiment.
In contrast, subject AD begun the experiment with rel-
atively high reading scores and good text comprehen-
sion. In her case, the learning process was best expressedby a major improvement of reading rates. Both subjects,
AD and DS, achieved clearly functionally useful eccen-
tric full-page reading after almost two months of daily
training. Subject DV, while showing significant
improvements in all aspects, did not achieve the same
level of performance in the same period of time.
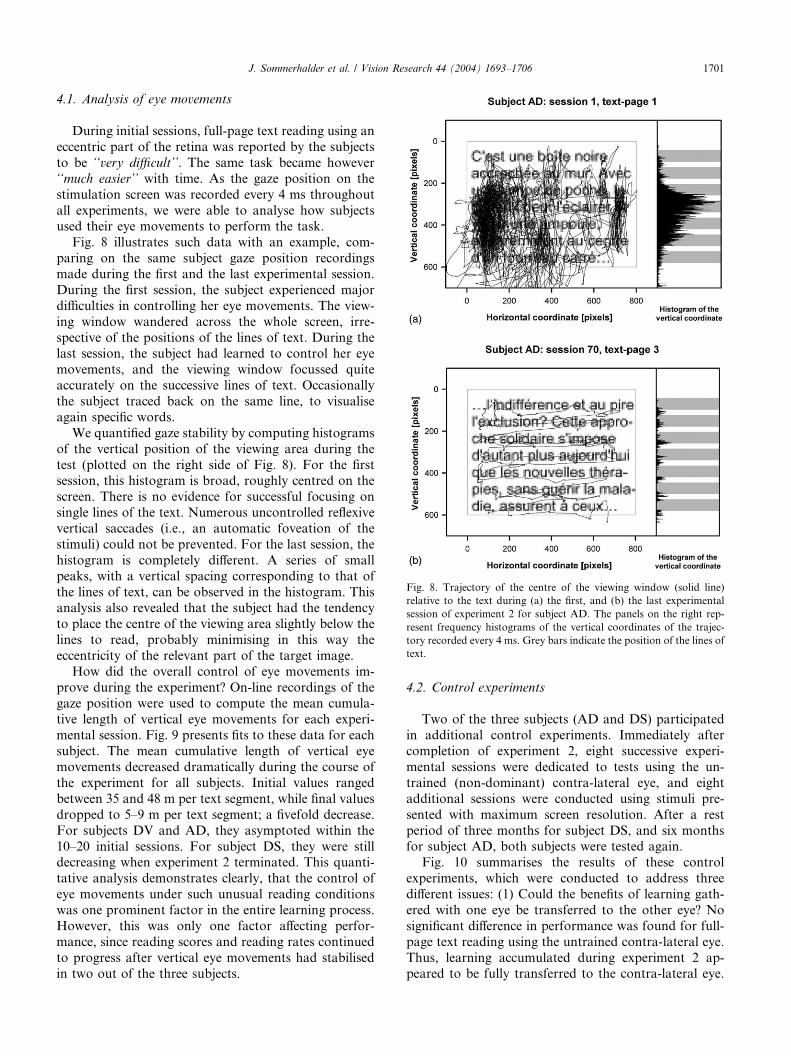
Fig. 8. Trajectory of the centre of the viewing window (solid line)
relative to the text during (a) the first, and (b) the last experimental
session of experiment 2 for subject AD. The panels on the right rep-
resent frequency histograms of the vertical coordinates of the trajec-
tory recorded every 4 ms. Grey bars indicate the position of the lines of
text.
J. Sommerhalder et al. / Vision Research 44 (2004) 1693–1706 1701
4.1. Analysis of eye movements
During initial sessions, full-page text reading using an
eccentric part of the retina was reported by the subjects
to be ‘‘very difficult’’. The same task became however
‘‘much easier’’ with time. As the gaze position on the
stimulation screen was recorded every 4 ms throughout
all experiments, we were able to analyse how subjectsused their eye movements to perform the task.
Fig. 8 illustrates such data with an example, com-
paring on the same subject gaze position recordings
made during the first and the last experimental session.
During the first session, the subject experienced major
difficulties in controlling her eye movements. The view-
ing window wandered across the whole screen, irre-
spective of the positions of the lines of text. During thelast session, the subject had learned to control her eye
movements, and the viewing window focussed quite
accurately on the successive lines of text. Occasionally
the subject traced back on the same line, to visualise
again specific words.
We quantified gaze stability by computing histograms
of the vertical position of the viewing area during the
test (plotted on the right side of Fig. 8). For the firstsession, this histogram is broad, roughly centred on the
screen. There is no evidence for successful focusing on
single lines of the text. Numerous uncontrolled reflexive
vertical saccades (i.e., an automatic foveation of the
stimuli) could not be prevented. For the last session, the
histogram is completely different. A series of small
peaks, with a vertical spacing corresponding to that of
the lines of text, can be observed in the histogram. Thisanalysis also revealed that the subject had the tendency
to place the centre of the viewing area slightly below the
lines to read, probably minimising in this way the
eccentricity of the relevant part of the target image.
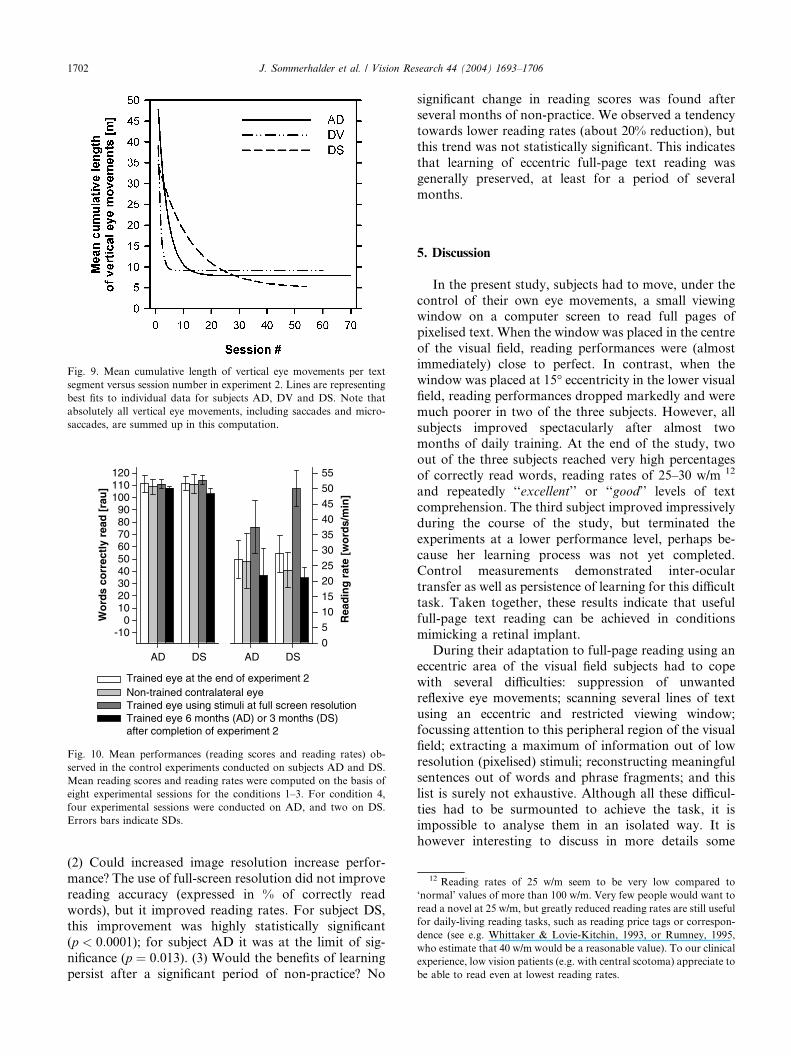
How did the overall control of eye movements im-
prove during the experiment? On-line recordings of the
gaze position were used to compute the mean cumula-
tive length of vertical eye movements for each experi-mental session. Fig. 9 presents fits to these data for each
subject. The mean cumulative length of vertical eye
movements decreased dramatically during the course of
the experiment for all subjects. Initial values ranged
between 35 and 48 m per text segment, while final values
dropped to 5–9 m per text segment; a fivefold decrease.
For subjects DV and AD, they asymptoted within the
10–20 initial sessions. For subject DS, they were stilldecreasing when experiment 2 terminated. This quanti-
tative analysis demonstrates clearly, that the control of
eye movements under such unusual reading conditions
was one prominent factor in the entire learning process.
However, this was only one factor affecting perfor-
mance, since reading scores and reading rates continued
to progress after vertical eye movements had stabilised
in two out of the three subjects.
4.2. Control experiments
Two of the three subjects (AD and DS) participated
in additional control experiments. Immediately after
completion of experiment 2, eight successive experi-
mental sessions were dedicated to tests using the un-
trained (non-dominant) contra-lateral eye, and eight
additional sessions were conducted using stimuli pre-
sented with maximum screen resolution. After a rest
period of three months for subject DS, and six monthsfor subject AD, both subjects were tested again.
Fig. 10 summarises the results of these control
experiments, which were conducted to address three
different issues: (1) Could the benefits of learning gath-
ered with one eye be transferred to the other eye? No
significant difference in performance was found for full-
page text reading using the untrained contra-lateral eye.
Thus, learning accumulated during experiment 2 ap-peared to be fully transferred to the contra-lateral eye.
12 Reading rates of 25 w/m seem to be very low compared to
‘normal’ values of more than 100 w/m. Very few people would want to
read a novel at 25 w/m, but greatly reduced reading rates are still useful
for daily-living reading tasks, such as reading price tags or correspon-
dence (see e.g. Whittaker & Lovie-Kitchin, 1993, or Rumney, 1995,
who estimate that 40 w/m would be a reasonable value). To our clinical
experience, low vision patients (e.g. with central scotoma) appreciate to
be able to read even at lowest reading rates.
Fig. 9. Mean cumulative length of vertical eye movements per text
segment versus session number in experiment 2. Lines are representing
best fits to individual data for subjects AD, DV and DS. Note that
absolutely all vertical eye movements, including saccades and micro-
saccades, are summed up in this computation.
AD DS
Wo
rds
corr
ectl
y re
ad [
rau
]
-100
102030405060708090
100110120
Trained eye at the end of experiment 2Non-trained contralateral eyeTrained eye using stimuli at full screen resolutionTrained eye 6 months (AD) or 3 months (DS)after completion of experiment 2
AD DS
Rea
din
g r
ate
[wo
rds/
min
]
0
5
10
15
20
25
30
35
40
45
50
55
Fig. 10. Mean performances (reading scores and reading rates) ob-
served in the control experiments conducted on subjects AD and DS.
Mean reading scores and reading rates were computed on the basis of
eight experimental sessions for the conditions 1–3. For condition 4,
four experimental sessions were conducted on AD, and two on DS.
Errors bars indicate SDs.
1702 J. Sommerhalder et al. / Vision Research 44 (2004) 1693–1706
(2) Could increased image resolution increase perfor-
mance? The use of full-screen resolution did not improve
reading accuracy (expressed in % of correctly read
words), but it improved reading rates. For subject DS,
this improvement was highly statistically significant
(p < 0:0001); for subject AD it was at the limit of sig-
nificance (p ¼ 0:013). (3) Would the benefits of learning
persist after a significant period of non-practice? No
significant change in reading scores was found after
several months of non-practice. We observed a tendency
towards lower reading rates (about 20% reduction), but
this trend was not statistically significant. This indicates
that learning of eccentric full-page text reading was
generally preserved, at least for a period of several
months.
5. Discussion
In the present study, subjects had to move, under the
control of their own eye movements, a small viewingwindow on a computer screen to read full pages of
pixelised text. When the window was placed in the centre
of the visual field, reading performances were (almost
immediately) close to perfect. In contrast, when the
window was placed at 15� eccentricity in the lower visual
field, reading performances dropped markedly and were
much poorer in two of the three subjects. However, all
subjects improved spectacularly after almost twomonths of daily training. At the end of the study, two
out of the three subjects reached very high percentages
of correctly read words, reading rates of 25–30 w/m 12
and repeatedly ‘‘excellent’’ or ‘‘good’’ levels of text
comprehension. The third subject improved impressively
during the course of the study, but terminated the
experiments at a lower performance level, perhaps be-
cause her learning process was not yet completed.Control measurements demonstrated inter-ocular
transfer as well as persistence of learning for this difficult
task. Taken together, these results indicate that useful
full-page text reading can be achieved in conditions
mimicking a retinal implant.
During their adaptation to full-page reading using an
eccentric area of the visual field subjects had to cope
with several difficulties: suppression of unwantedreflexive eye movements; scanning several lines of text
using an eccentric and restricted viewing window;
focussing attention to this peripheral region of the visual
field; extracting a maximum of information out of low
resolution (pixelised) stimuli; reconstructing meaningful
sentences out of words and phrase fragments; and this
list is surely not exhaustive. Although all these difficul-
ties had to be surmounted to achieve the task, it isimpossible to analyse them in an isolated way. It is
however interesting to discuss in more details some

J. Sommerhalder et al. / Vision Research 44 (2004) 1693–1706 1703
factors potentially contributing to the learning process
as well as others, limiting reading performance.
5.1. Analysis of the learning process
Monitoring of eye movements throughout the learn-
ing process indicated clearly that an important part of
the overall learning process could be attributed to pro-
gressive suppression of uncontrolled reflexive eye
movements. Subjects learned to reference their eye
movements for reading to a non-foveal and even highly
eccentric retinal locus. The temporal evolution of verti-cal saccades (Fig. 9) was however not perfectly corre-
lated with the evolution of other measures, such as
reading scores (Fig. 4), reading rate (Fig. 5), or text
comprehension (Fig. 6). This is most evident for subject
DV. While she could already control her vertical eye
movements after about five sessions, her reading scores
required more than 30 sessions to asymptote and both,
her reading rate and her text comprehension still pro-gressed slightly after 60 sessions. This mismatch, also
observed for the two other subjects, suggests that other
factors were influencing reading performance during the
overall learning process.
In a previous study, we observed significant learning
effects for eccentric reading of pixelised isolated words
(Sommerhalder et al., 2003). Similar to the present re-
sults, these improvements took a time period of about70 experimental learning sessions. These experiments
did not require page navigation, which implies that one
important component of the overall learning process
seems to be independent of the accurate control of eye
movements and that it is likely to be associated with
performance improvements in deciphering eccentric
low-resolution stimuli. Crist, Li, and Gilbert (2001)
suggested that this kind of perceptual learning isaccompanied by a concomitant decrease of the
‘‘crowding effect’’. The decrease of crowding has been
found to be related to attention (Leat, Li, & Epp, 1999),
which in turn can be improved by learning (see e.g.
Sireteanu & Rettenbach, 2000). This would mean that a
significant decrease of the ‘‘crowding effect’’ is very
likely to be an important part of the overall learning
process.
5.2. Text comprehension and influence of context
It is interesting to retain that subjects had to achieverelatively high reading scores above 85% of correctly
read words, to reach ‘‘good’’ or ‘‘excellent’’ text com-
prehension levels, i.e. to achieve useful text comprehen-
sion. Lower reading scores were almost always paired
with insufficient text comprehension. This finding, based
on a very simple qualitative comprehension test, has to
be considered with prudence, but it indicates that
reading scores, which can be measured in a quantitative
way, have to be at high levels to allow for useful reading.
The influence of context information on performance
remains a difficult issue to assess. The comparison of the
present data on full-page text reading to those of our
previous study using isolated words is interesting in this
respect. After training, we observed mean reading scores
of about 75% correct for isolated words (two subjects inSommerhalder et al., 2003) and mean reading scores of
about 94% correct for full-page text reading (three
subjects in this study). While this difference is not sta-
tistically significant for such a small number of subjects,
it is in agreement with the results reported by Fine and
Peli (1996) and Fine, Hazel, Latham, and Rubin (1999),
supporting the hypothesis that the use of context
information helps reading performance, even in eccen-tric reading.
5.3. Eccentric versus central full-page text reading
At the end of experiment 2, all subjects had reachedrelatively efficient full-page text reading. It was therefore
interesting to compare, quantitatively and qualitatively,
their performances to those achieved with central read-
ing in similar experimental conditions.
Table 1 compares ‘final’ reading performances,
averaged across the last four sessions of experiment 1
(central reading) to those averaged across the last four
sessions of experiment 2 (eccentric reading). Finalreading scores across the two conditions were not sta-
tistically different for two of the three subjects. Only
subject DV presented significantly lower scores for
eccentric reading (p ¼ 0:0004). The pattern of results
was however quite different for reading rates. Average
reading rates using eccentric vision were considerably
lower (by a factor of 2.5–5.8) than those achieved with
central vision, confirming that target eccentricity wasone major factor limiting the reading rate. Other au-
thors already reported low reading rates for eccentric
vision. Wensveen, Bedell, and Loshin (1995), for
example, found that simulated central scotoma pro-
duced dramatic decrements of reading rates. Simulated
8� central scotomata resulted in a threefold reduction of
the reading rates for their younger subjects. The expe-
rimental conditions in their study were however mark-edly different from those used in the present study. It is
therefore difficult to compare results quantitatively. In
this context should also be noted, that, when experiment
2 was terminated, reading rates had not really asymp-
toted. We believe, however, that only subject DS would
have been able to further increase his reading rate with
prolonged training (see Fig. 5).
It is also interesting to compare, for the same subject,eye movements when scanning full-page text using either
a central or an eccentric viewing window. Fig. 11 pre-
sents the trajectory of the centre of the viewing area

Table 1
Mean reading scores and reading rates at the end of experiment 1 (central vision) compared to those at the end of experiment 2 (eccentric vision)
Subject Central vision Eccentric vision (15�)
Mean reading scores rau % rau % p
AD 116.5 99.9 113.0 99.3 ns
DV 113.6 99.4 89.8 88.2 0.0004
DS 117.8 100 109.1 98.2 ns
Mean reading rates
words/min words/min p
AD 117.7 27.6 <0.0001
DV 87.4 14.9 0.0002
DS 71.8 29.0 <0.0001
Means are calculated on the basis of the four last experimental sessions in each condition. p values indicate the statistical significance for the
difference between means.
ns: non-significant.
Fig. 11. Trajectory of the centre of the viewing window (solid line)
relative to the text during the last experimental session of experiment 1
(central reading) for subject AD. The panel on the right represents the
frequency histogram of the vertical coordinate of the gaze position
recorded every 4 ms. Grey bars indicate the position of the lines of text.
1704 J. Sommerhalder et al. / Vision Research 44 (2004) 1693–1706
relative to the lines of text during the last session of
experiment 1 (central reading) for subject AD. Equiva-
lent data on the same subject, but collected for eccentric
reading at the end of experiment 2 were presented in Fig.
8b. While similitudes are striking, there are noticeable
differences. The subject traced backwards much lessfrequently when using a central viewing area, the verti-
cal gaze position was better controlled, and finally, the
viewing window appeared to be more accurately centred
on the lines, not slightly below.
Central reading remained obviously more efficient
than eccentric reading, even after a prolonged two-
month period of adaptation to the task. This difference
might have several foundations.The width of the viewing window used in this study
limited the maximum visual span to about 6 letters.
Legge, Mansfield, and Chung (2001) proposed that the
average visual span shrinks from at least 10 letters in
central vision to about 1.7 letters at 15� eccentricity; this
low value being however increased upon prolonged
observation times. As a consequence, the visual span
experienced by the subjects was artificially limited to 6
letters in central vision, thus reducing reading rates for
central vision. At 15� eccentricity, this effect was even
more pronounced, not because of this experimentallimitation, but because of the ‘natural’ reduction of the
visual span at high eccentricity. Subjects had therefore
either to increase the number of saccades to decipher a
given word, or to increase fixation time to extend the
visual span; both strategies leading to lower reading
rates, which is consistent with our experimental obser-
vations.
Finally, one can wonder to which extent lower read-ing rates, observed with eccentric vision, could be
attributed to the decreased spatial resolution in perip-
heral regions of the retina. The visual acuity at an
eccentricity of 15� is expected to be about 20/125 (Co-
wey & Rolls, 1974; Daniel & Whitteridge, 1961). Whit-
taker and Lovie-Kitchin (1993) proposed to use font
sizes, several times bigger than the acuity threshold, to
reach optimal reading rates. Bowers and Reid (1997)suggested print sizes of at least four times the acuity
threshold. The character size we used corresponds to a
visual acuity of about 20/400. This size was thus just
adequate, and did not, in our view, significantly limit
reading rates for eccentric reading in this study.
5.4. Other factors limiting reading performance
At the end of experiment 1 (central reading), subjectsachieved reading rates ranging between 72 and 118 w/m,
which was considerably lower than the 160–180 w/m,
they achieved when reading the same newspaper under
‘normal’ reading conditions. This speed reduction of
about a factor two must be associated with constraints
of the experimental set-up.
One probable reason for this reduction of reading
rates is the spatial limitation of the viewing window.Several authors, such as Fine, Kirschen, and Peli (1996)
or Beckmann and Legge (1996), have reported that the
reading rate in central vision can increase for visual

J. Sommerhalder et al. / Vision Research 44 (2004) 1693–1706 1705
spans up to 13–14 characters. As stated above, the visual
span was artificially limited to a maximum of about six
letters in this study. This is considerably smaller than the
optimal visual span required to achieve maximum
reading rates with central vision. Additionally, the use of
a restricted viewing window was certainly also affecting
page navigation since peripheral vision was not available
to orient saccades, which probably also contributed to afurther decrease of reading rates.
Another experimental factor reducing reading rates
was certainly the use of target pixelisation. The pixel
resolution we used for our experiments (572 pixels in a
viewing window of 10� · 7�) was high enough to trans-
mit the necessary information for full-page text reading.
This was demonstrated by close to perfect reading scores
in central vision. However, one of our control mea-surements, conducted at 15� eccentricity, revealed that
the use of non-pixelised text could significantly improve
the reading rate (see Fig. 10). This implies that per-
forming this task using pixelised stimuli, containing a
close to threshold information content (which is perti-
nent in view of the development of retinal prosthesis),
does put some significant load on the visual system in
order to extract the relevant information. Using stimulilargely exceeding this lowest limit does facilitate reading,
probably through the use of redundancy. One could
relate this issue to findings, obtained by Legge, Ahn,
Klitz, and Luebker (1997) when using low contrast text,
or to those of Whittaker and Lovie-Kitchin (1993) or
Bowers and Reid (1997) who suggested that print size
and contrast should be at least several times the
threshold values to achieve optimal reading rates.Finally, it is important to recall, that on the 22
00PC
monitor we used in this study, the pages of text consisted
of seven lines, made of two to five words per line.
Scanning such a text is certainly less optimal than scan-
ning normal text in a newspaper. However, such optimal
conditions are unfortunately difficult to conceive in the
present stage of development of retinal implants.
6. Conclusion
On the basis of the results reported in the present
work, we can conclude that retinal implants might beable to restore full-page text reading abilities to blind
patients. About 600 electrodes equally distributed on an
implant surface of 3 · 2 mm2, appear to be a minimum
to restore useful function. 13 A significant learning pro-
cess will however be required to reach optimal perfor-
mance with such devices, especially if the implant has to
be placed outside the fovea. Future users of retinal im-
13 Prototypes of highly integrated retinal prosthesis, reaching this
level of contact density, have already been realised by Zrenner et al.
(1997) and Peyman et al. (1998).
plants will wear their prosthesis permanently in daily
life. They will have much more time to adapt to their
new vision than the normal subjects who participated in
these simulation experiments. One might therefore ex-
pect them to benefit even more from learning, as well as
from other possible brain plasticity mechanisms. Our
present results are in this respect very encouraging for
the future.Additional research using similar simulations to as-
sess the potential feasibility of other important visual
tasks, such as spatial orientation (mobility) and spatial
localisation (visuo-motor coordination) are required to
get a more complete picture of the potential benefits that
could be derived from retinal prostheses. Multidisci-
plinary research is also needed to determine, if prototype
chips can actually reach the required spatial selectivity inneural excitation, as well as if they can preserve to some
extent retinotopic mapping.
Acknowledgements
This work was supported by the Swiss National
Foundation for Scientific Research (grant 3100-
61956.00 and grant 3152-063915.00) and the ProVisu
Foundation.
References
Baldasare, J., & Watson, G. (1986). Observations from the psychology
of reading relevant to low vision research. In G. C. Woo (Ed.), Low
vision principles and applications (pp. 272–286). New York:
Springer Verlag.
Beckmann, P. J., & Legge, G. E. (1996). Psychophysics of reading.
XIV. The page navigation problem in using magnifiers. Vision
Research, 36, 3723–3733.
Bowers, A. R., & Reid, V. M. (1997). Eye movements and reading with
simulated visual impairment. Ophthalmic and Physiological Optics,
17, 392–402.
Chow, A. Y., & Chow, V. Y. (1997). Subretinal electrical stimulation
of the rabbit retina. Neuroscience Letters, 225, 13–16.
Cowey, A., & Rolls, E. T. (1974). Human cortical magnification factor
and its relation to visual acuity. Experimental Brain Research, 21,
447–454.
Crist, R. E., Li, W., & Gilbert, C. D. (2001). Learning to see:
experience and attention in primary visual cortex. Nature Neuro-
science, 4, 519–525.
Daniel, P. M., & Whitteridge, D. (1961). The representation of the
visual field on the cerebral cortex in monkey. Journal of Physiology,
159, 203–221.
Dobelle, W. H. (2000). Artificial vision for the blind by connecting a
television camera to the visual cortex. ASAJO Journal, 46, 3–9.
Fine, E. M., & Peli, E. (1996). The role of context in reading with
central field loss. Optometry and Vision Science, 73, 533–539.
Fine, E. M., Kirschen, M. P., & Peli, E. (1996). The necessary field of
view to read with an optimal stand magnifier. Journal of the
American Optometric Association, 67, 382–389.
Fine, E. M., Hazel, C. A., Latham, K., & Rubin, G. S. (1999). Are
benefits of sentence context different in central and peripheral
vision? Optometry and Vision Science, 76, 764–769.

1706 J. Sommerhalder et al. / Vision Research 44 (2004) 1693–1706
Fletcher, D. C., & Schuchard, R. A. (1997). Preferred retinal loci.
Relationship to macular scotomas in a low-vision population.
Ophthalmology, 104, 632–638.
Harland, S., Legge, G. E., & Luebker, A. (1998). Psychophysics of
reading. XVII. Low-vision performance with four types of electron-
ically magnified text. Optometry and Vision Science, 75, 183–190.
Heinen, S. J., & Skavenski, A. A. (1992). Adaptation of saccades and
fixation to bilateral foveal lesions in adult monkey. Vision
Research, 32, 365–373.
Humayun, M. S. (2001). Intraocular retinal prosthesis. Transcations of
the American Ophtalmological Society, 99, 271–300.
Latham, K., & Whitaker, D. (1996). A comparison of word recogni-
tion and reading performance in foveal and peripheral vision.
Vision Research, 36, 2665–2674.
Leat, S. J., Li, W., & Epp, K. (1999). Crowding in central and eccentric
vision: the effects of contour interaction and attention. Investigative
Ophthalmology and Visual Science, 40, 504–512.
Legge, G. E., Ahn, S. J., Klitz, T. S., & Luebker, A. (1997).
Psychophysics of reading. XVI. The visual span in normal and low
vision. Vision Research, 37, 1999–2010.
Legge, G. E., Mansfield, J. S., & Chung, S. T. L. (2001). Psychophysics
of reading XX. Linking letter recognition to reading speed in
central and peripheral vision. Vision Research, 41, 725–743.
Normann, R. A., Maynard, E. M., Rousche, P. J., & Warren, D. J.
(1999). A neural interface for a cortical vision prosthesis. Vision
Research, 39, 2577–2587.
Peyman, G., Chow, A. Y., Liang, C., Chow, V. C., Perlman, J. I., &
Peachey, N. S. (1998). Subretinal semiconductor microelectrode
array. Opththalmic Surgery and Lasers, 29, 234–241.
Rizzo, J. F., & Wyatt, J. (1997). Prospects for a visual prosthesis. The
Neuroscientist, 3, 251–262.
Rumney, N. J. (1995). Using visual thresholds to establish vision
performance. Ophthalmic & Physiological Optics, 15, S18–S24.
Sireteanu, R., & Rettenbach, R. (2000). Perceptual learning in visual
search generalizes over tasks, locations, and eyes. Vision Research,
40, 2925–2949.
Sj€ostrand, J., Olsson, V., Popovic, Z., & Conradi, N. (1999).
Quantitative estimations of foveal and extra-foveal retinal circuitry
in humans. Vision Research, 39, 2987–2998.
Sommerhalder, J., Oueghlani, E., Bagnoud, M., Leonards, U., Safran,
A. B., & Pelizzone, M. (2003). Simulation of artificial vision: I.
Eccentric reading of isolated words, and perceptual learning. Vision
Research, 43, 269–283.
Studebaker, G. A. (1985). A rationalized arcsine transform. Journal of
Speech and Hearing Research, 28, 455–462.
Toet, A., & Levi, D. M. (1992). The two-dimensional shape of spatial
interaction zones in the parafovea. Vision Research, 32, 1349–1357.
Veraart, C., Raftopoulos, C., Mortimer, J. T., Delbeke, J., Pins, D.,
Michaux, G., Vanlierde, A., Parrini, S., & Wanet-Defalque, M. C.
(1998). Visual sensations produced by optic nerve stimulation using
an implanted self-sizing spiral cuff electrode. Brain Research, 813,
181–186.
Wensveen, J. M., Bedell, H. E., & Loshin, D. S. (1995). Reading rates
with artificial central scotoma with and without special remapping
of print. Optometry and Vision Science, 72, 100–114.
Whittaker, S. G., Cummings, R. W., & Swieson, L. R. (1991). Saccade
control without a fovea. Vision Research, 31, 2209–2218.
Whittaker, S. G., & Lovie-Kitchin, J. (1993). Visual requirements for
reading. Optometry and Vision Science, 70, 54–65.
Zrenner, E., Miliczek, K. D., Gabel, V. P., Graf, H. G., Guenther, E.,
Haemmerle, H., Hoefflinger, B., Kohler, K., Nisch, W., Schubert,
M., Stett, A., & Weiss, S. (1997). The development of subretinal
microphotodiodes for replacement of degenerated photoreceptors.
Ophthalmic Research, 29, 269–280.
Zrenner, E. (2002). Will retinal implants restore vision? Science, 295,
1022–1025.