Simulation of a Model for International Traveler's Check-In ...
10
Engineering, 2021, 13, 125-134 https://www.scirp.org/journal/eng ISSN Online: 1947-394X ISSN Print: 1947-3931 DOI: 10.4236/eng.2021.133010 Mar. 11, 2021 125 Engineering Simulation of a Model for International Traveler’s Check-In Process Using Arena Software Tool J. L. Obetta, O. O. Olusanyan, M. O. Oyediran * , W. B. Wahab, A. T. Olusesi, A. W. Elegbede Department of Electrical/Electronics and Computer Engineering, Bells University of Technology, Ota, Ogun State, Nigeria Abstract With the current situation of insecurity in Nigeria and the worsening condi- tion of Nigerian roads, there is increasing demand for air travel. This in- creasing demand for airline services amidst limited resources results in pas- senger dissatisfaction and reduction of revenue for airports and airlines. The dynamics of service demand and resource supply result in check-in is- sues for all the stakeholders in the commercial aviation industry. Hence, this research simulated the developed model for travelers’ check-in process at the “D Wing” of the Departure Section of Murtala Muhammed International Airport (MMIA), Ikeja, using Arena Software Tool. The simulation of the developed model was carried out by varying five different configurations of the servers with respect to the baggage weighing machines and passenger profiling devices to obtain the minimum average check-in time (ACT) for the process, with each configuration undergoing 133 completions of simula- tion runs. The result of the experimentation revealed that the 3 × 3 × 4 configuration of servers produced the smallest ACT of 18.25 minutes. This translates to a difference of about 58 minutes from the 76.16 minutes ACT of the real system; representing about 76% improvement in the check-in time of passengers. This study contributed to knowledge by revealing that the main choke points in the MMIA check-in system occur at the baggage weighing and passenger profiling areas as against the check-in counter sub-section as ad- vanced by previous works. Furthermore, the research added value to know- ledge by creating a balance between customer satisfaction and cost of opera- tions thereby accommodating the interests of the passenger and the operator who are the two main stakeholders in the commercial aviation industry. Keywords Modelling, Check-In Process, Arrival Rate, Service Rate, Average Check-In How to cite this paper: Obetta, J.L., Olusanyan, O.O., Oyediran, M.O., Wahab, W.B., Olusesi, A.T. and Elegbede, A.W. (2021) Simulation of a Model for Internation- al Traveler’s Check-In Process Using Arena Software Tool. Engineering, 13, 125-134. https://doi.org/10.4236/eng.2021.133010 Received: January 28, 2021 Accepted: March 8, 2021 Published: March 11, 2021 Copyright © 2021 by author(s) and Scientific Research Publishing Inc. This work is licensed under the Creative Commons Attribution International License (CC BY 4.0). http://creativecommons.org/licenses/by/4.0/ Open Access
-
Upload
khangminh22 -
Category
Documents
-
view
0 -
download
0
Transcript of Simulation of a Model for International Traveler's Check-In ...

Engineering, 2021, 13, 125-134 https://www.scirp.org/journal/eng
ISSN Online: 1947-394X ISSN Print: 1947-3931
DOI: 10.4236/eng.2021.133010 Mar. 11, 2021 125 Engineering
Simulation of a Model for International Traveler’s Check-In Process Using Arena Software Tool
J. L. Obetta, O. O. Olusanyan, M. O. Oyediran*, W. B. Wahab, A. T. Olusesi, A. W. Elegbede
Department of Electrical/Electronics and Computer Engineering, Bells University of Technology, Ota, Ogun State, Nigeria
Abstract With the current situation of insecurity in Nigeria and the worsening condi-tion of Nigerian roads, there is increasing demand for air travel. This in-creasing demand for airline services amidst limited resources results in pas-senger dissatisfaction and reduction of revenue for airports and airlines. The dynamics of service demand and resource supply result in check-in is-sues for all the stakeholders in the commercial aviation industry. Hence, this research simulated the developed model for travelers’ check-in process at the “D Wing” of the Departure Section of Murtala Muhammed International Airport (MMIA), Ikeja, using Arena Software Tool. The simulation of the developed model was carried out by varying five different configurations of the servers with respect to the baggage weighing machines and passenger profiling devices to obtain the minimum average check-in time (ACT) for the process, with each configuration undergoing 133 completions of simula-tion runs. The result of the experimentation revealed that the 3 × 3 × 4 configuration of servers produced the smallest ACT of 18.25 minutes. This translates to a difference of about 58 minutes from the 76.16 minutes ACT of the real system; representing about 76% improvement in the check-in time of passengers. This study contributed to knowledge by revealing that the main choke points in the MMIA check-in system occur at the baggage weighing and passenger profiling areas as against the check-in counter sub-section as ad-vanced by previous works. Furthermore, the research added value to know-ledge by creating a balance between customer satisfaction and cost of opera-tions thereby accommodating the interests of the passenger and the operator who are the two main stakeholders in the commercial aviation industry.
Keywords Modelling, Check-In Process, Arrival Rate, Service Rate, Average Check-In
How to cite this paper: Obetta, J.L., Olusanyan, O.O., Oyediran, M.O., Wahab, W.B., Olusesi, A.T. and Elegbede, A.W. (2021) Simulation of a Model for Internation-al Traveler’s Check-In Process Using Arena Software Tool. Engineering, 13, 125-134. https://doi.org/10.4236/eng.2021.133010 Received: January 28, 2021 Accepted: March 8, 2021 Published: March 11, 2021 Copyright © 2021 by author(s) and Scientific Research Publishing Inc. This work is licensed under the Creative Commons Attribution International License (CC BY 4.0). http://creativecommons.org/licenses/by/4.0/
Open Access
J. L. Obetta et al.
DOI: 10.4236/eng.2021.133010 126 Engineering
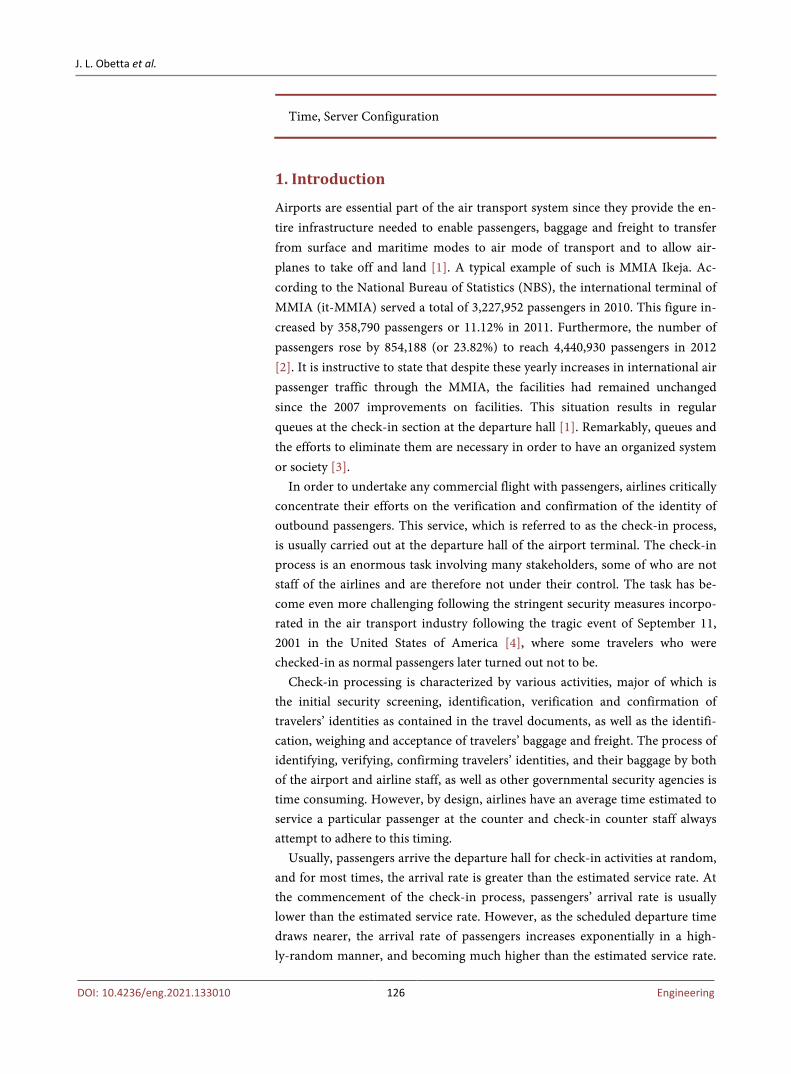
Time, Server Configuration
1. Introduction
Airports are essential part of the air transport system since they provide the en-tire infrastructure needed to enable passengers, baggage and freight to transfer from surface and maritime modes to air mode of transport and to allow air-planes to take off and land [1]. A typical example of such is MMIA Ikeja. Ac-cording to the National Bureau of Statistics (NBS), the international terminal of MMIA (it-MMIA) served a total of 3,227,952 passengers in 2010. This figure in-creased by 358,790 passengers or 11.12% in 2011. Furthermore, the number of passengers rose by 854,188 (or 23.82%) to reach 4,440,930 passengers in 2012 [2]. It is instructive to state that despite these yearly increases in international air passenger traffic through the MMIA, the facilities had remained unchanged since the 2007 improvements on facilities. This situation results in regular queues at the check-in section at the departure hall [1]. Remarkably, queues and the efforts to eliminate them are necessary in order to have an organized system or society [3].
In order to undertake any commercial flight with passengers, airlines critically concentrate their efforts on the verification and confirmation of the identity of outbound passengers. This service, which is referred to as the check-in process, is usually carried out at the departure hall of the airport terminal. The check-in process is an enormous task involving many stakeholders, some of who are not staff of the airlines and are therefore not under their control. The task has be-come even more challenging following the stringent security measures incorpo-rated in the air transport industry following the tragic event of September 11, 2001 in the United States of America [4], where some travelers who were checked-in as normal passengers later turned out not to be.
Check-in processing is characterized by various activities, major of which is the initial security screening, identification, verification and confirmation of travelers’ identities as contained in the travel documents, as well as the identifi-cation, weighing and acceptance of travelers’ baggage and freight. The process of identifying, verifying, confirming travelers’ identities, and their baggage by both of the airport and airline staff, as well as other governmental security agencies is time consuming. However, by design, airlines have an average time estimated to service a particular passenger at the counter and check-in counter staff always attempt to adhere to this timing.
Usually, passengers arrive the departure hall for check-in activities at random, and for most times, the arrival rate is greater than the estimated service rate. At the commencement of the check-in process, passengers’ arrival rate is usually lower than the estimated service rate. However, as the scheduled departure time draws nearer, the arrival rate of passengers increases exponentially in a high-ly-random manner, and becoming much higher than the estimated service rate.
J. L. Obetta et al.
DOI: 10.4236/eng.2021.133010 127 Engineering
Since passengers’ arrival rate is random and therefore unpredictable, this leads to a build-up of a queue of passengers waiting to be served. When passengers’ queue build-up, the problem of prolonged waiting on the line arises. At this point, passengers’ start becoming agitated for fear of missing their flights as this has various implications. As the situation continues, it sometimes leads to de-layed flights with the associated consequences on airlines, passengers and airport management. Eventually, the series of delays result to problems for both the air-lines and their esteemed passengers, leading to loss of revenues, travel time and passenger dissatisfaction.
Recognizing the existence of queues and its impact on organizations, various researchers have sought ways to address the queue problem. A major effort in this regard was proposed by Agner Krarup Erlang, a Danish engineer who worked for the Copenhagen Telephone Exchange [5]. Furthermore, Winston (1991) described queueing theory as a branch of mathematics that studies and models the act of waiting in lines. Similarly, [6], described queueing theory as the theory behind what happens when you have lots of jobs, scarce resources, and subsequently, long queues and delays. The consequences of this include wastage of scarce resources, customer dissatisfaction, and most times, unexe-cuted businesses.
In an attempt to address the queue problem, [7] were of the opinion that doubling service demand in queue situations does not necessarily require re-sources increase to achieve better performance. Another group of researchers, [8], investigated the number of critical resources at the first two phases of the airport departure operations and found that most passengers are not satisfied with the services received at the airport check-in process. Similarly, [9], applied the Discrete Event Simulation (DES) model to evaluate how arrival patterns of passengers to the airport departure hall affects international terminal operations such as check-in, security screening and immigration control. The researcher found that arrival pattern is a major factor responsible for overcrowding at the check-in section of airports. [3], investigated traveler’s flow process in both the MMIA and Nnamdi Azikiwe International Airport (NAIA), Abuja and recom-mended multiple server multiple queue structure to address airport check-in problem at the check-in counter sub-section as a way of addressing passenger dissatisfaction. [1] adopted the Spearman Rank correlation method using weighted average and Gap analysis to examine the relationship between passen-gers’ satisfaction and service quality in MMIA. Yet, [4], proposed the integration of a biometric system into the check-in process to enhance the airport operators’ performance. The researcher built a model of a medium-sized airport and ana-lyzed the model using the Simio simulation environment and used it to evaluate the expected performance of the Biometric Single Token Identification (BST ID). The result of the simulation models reported more than 90% decrease in check-in time from 47.98 minutes for manual check-in passengers to 3.6 mi-nutes for BST ID compliant passengers. This research simulated the developed check-in process model at the international terminal of MMIA, Ikeja with a view
J. L. Obetta et al.
DOI: 10.4236/eng.2021.133010 128 Engineering
to proposing an improved model that will address the airport check-in process queue problem, as well as effectively handle higher airport passenger traffic us-ing cost effective option.
Although check-in process at the airports is generally regarded as activities that take place at the airline check-in counter, the process actually starts at the airport departure hall entrance and terminates at the airline check-in counter. Thus, this research covers the activities that take place at the four distinct sections of the airport check-in section, which includes departure hall access/security screening gates, baggage weighing sub-section, passenger profiling sub-section, and airline check-in counter sub-section. Also, this study revealed that the main choke points in the MMIA check-in system occur at the baggage weighing and passenger profiling areas as against the check-in counter sub-section as ad-vanced by previous works.
2. Methodology
The developed model was subjected to simulation (experimentation) having undergone validation stage and it was confirmed that the developed model represented the real-life system under study.
Due to the complex nature of international air travel, passengers at the inter-national terminal of the MMIA are usually subjected to different processes be-fore getting to the airline check-in counter point. These processes can be gener-ally categorized into four (4) main service activities: initial security screening at the entrance gates, baggage weighing, passenger profiling and check-in counter activities, all leading to the issuance of boarding pass to the passenger. At the MMIA Departure Hall, each of these sub-sections is characterized by a unique process that is serviced by designated servers. It was further observed that Emi-rates airline uses six check-in counters; one each for first and Business class pas-sengers while four check-in counters are allocated to Economy class passengers. Field work also revealed that both the first and Business class passengers do not witness delays during check-in, while delays are evident with the Economy class group. Thus, the focus of this research is on the Economy class passen-gers’ check-in processing which is usually characterized by delays leading to queues and long waiting times. Generally, and also for the purpose of this study, airport check-in starts at the departure hall entrance and terminates at the air-line check-in counter after the boarding pass has been issued to the passenger. Check-in is therefore assumed to be completed immediately after the boarding pass is issued to the passenger.
Following the positive result from the developed model, simulation experi-ments were carried out by varying the resources at the baggage weighing and passenger profiling sub-sections. This was used to determine the best combina-tion of resources that would give the smallest ACT for passengers. Thus, it was observed that the resource combination of 3 × 3 × 4 servers resulted in the smal-lest ACT of 18.25 minutes.
J. L. Obetta et al.
DOI: 10.4236/eng.2021.133010 129 Engineering
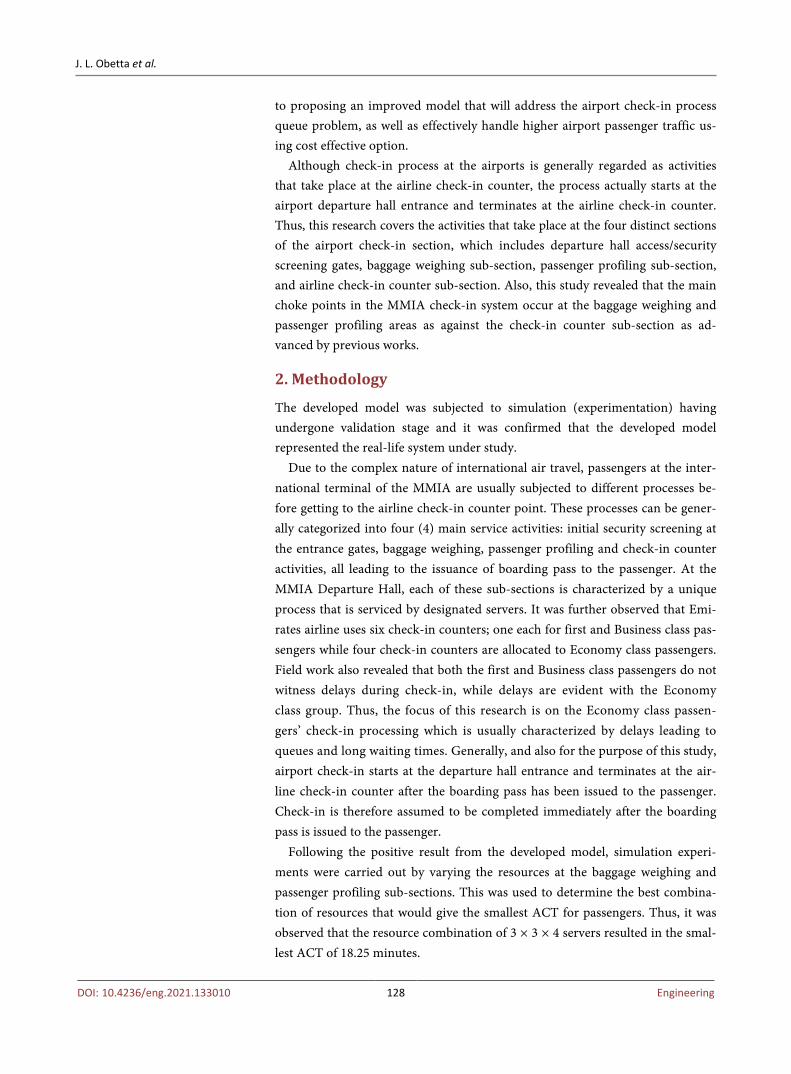
Evaluation is the process of experimenting with the developed model by vary-ing some parameters of the model with a view to testing its performance. It will be recalled that the number of check-in counters allocated to Emirates Economy class is four (4). Thus, the evaluation process maintained the same number of counters. For this study, the 2 sub-sections whose parameters were varied are the baggage weighing and passenger profiling areas. The servers’ configuration for the real-life system and also the modelled system is 1 × 1 × 4 servers. Simulation was therefore performed on each addition of a server and corresponding result was obtained. The block diagram of the modified International Traveler’s Check-in Process (ITCP) Model is shown in Figure 1. The four coloured boxes represent the resources (2 weighing machines and 2 profiling devices, together with the human resource to operate the equipment), that were introduced into the system during experimentation to evaluate the performance of the model. Figure 2 is the modified ITCP Model for the MMIA.
3. Results and Discussion
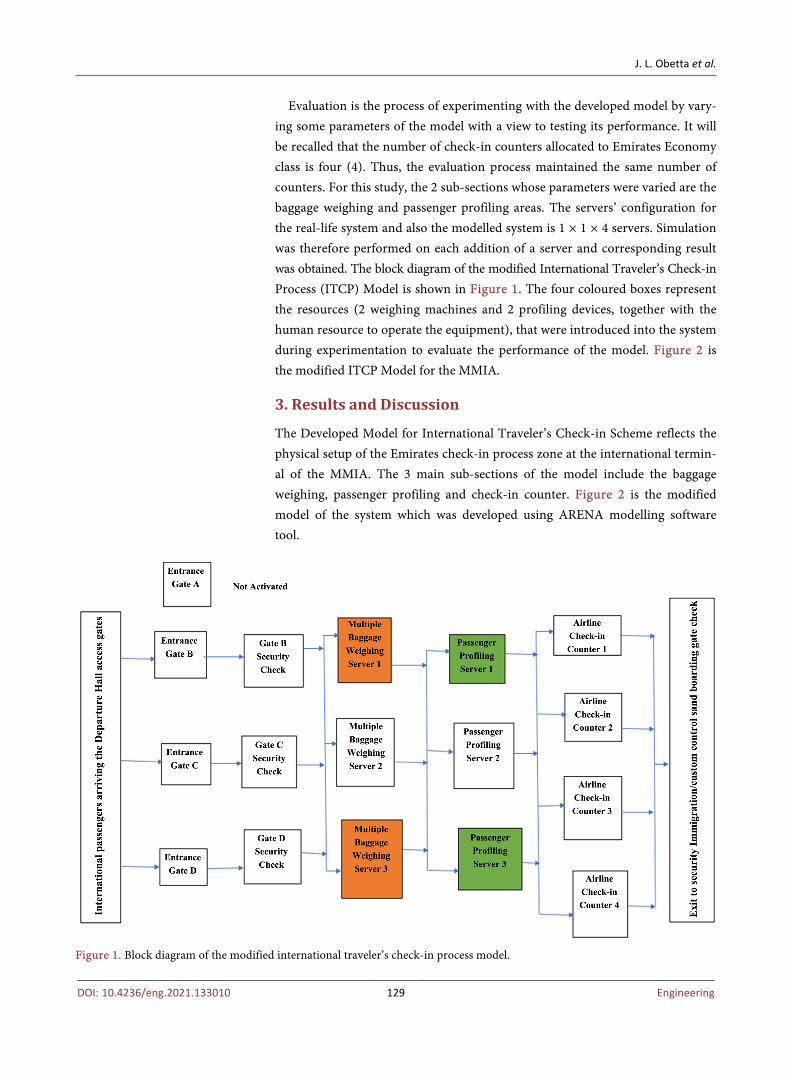
The Developed Model for International Traveler’s Check-in Scheme reflects the physical setup of the Emirates check-in process zone at the international termin-al of the MMIA. The 3 main sub-sections of the model include the baggage weighing, passenger profiling and check-in counter. Figure 2 is the modified model of the system which was developed using ARENA modelling software tool.
Figure 1. Block diagram of the modified international traveler’s check-in process model.
J. L. Obetta et al.
DOI: 10.4236/eng.2021.133010 130 Engineering
Figure 2. The modified international traveler’s check-in process model for MMIA (Table 1). Table 1. Labelling legend for Figure 2.
Entity Number Entity Acronym Meaning
1 Gate B Entrance B
2 Gate C Entrance C
3 Gate D Entrance D
4 SCQ_1 Security Check Queue1
5 SCQ_2 Security Check Queue2
6 SCQ_3 Security Check Queue3
7 SC_1 Is Security Check-in_1 successful?
8 SC_2 Is Security Check-in_2 successful?
9 SC_3 Is Security Check-in_3 successful?
10 R1_1 Remediation1 for Security Check Queue1
11 R1_2 Remediation1 for Security Check Queue2
12 R1_3 Remediation1 for Security Check Queue3
13 BWQ1 Baggage Weighing Queue1
14 BWQ2 Baggage Weighing Queue2
15 BWQ3 Baggage Weighing Queue3
16 R2_1 Remediation2 for Baggage Weighing Queue1
17 R2_2 Remediation2 for Baggage Weighing Queue2
18 R2_3 Remediation2 for Baggage Weighing Queue3
19 WO1 Is Weight Ok for Baggage Weighing Queue1?
20 WO2 Is Weight Ok for Baggage Weighing Queue2?
21 WO3 Is Weight Ok for Baggage Weighing Queue3?
22 PPQ1 Passenger Profiling Queue1

J. L. Obetta et al.
DOI: 10.4236/eng.2021.133010 131 Engineering
Continued
23 PPQ2 Passenger Profiling Queue2
24 PPQ3 Passenger Profiling Queue3
25 R3_1 Remediation3 for Passenger Profiling Queue1
26 R3_2 Remediation3 for Passenger Profiling Queue2
27 R3_3 Remediation3 for Passenger Profiling Queue3
28 PO1 Is Profiling Ok for Queue1?
29 PO2 Is Profiling Ok for Queue2?
30 PO3 Is Profiling Ok for Queue3?
31 CCQ1 Check-in Counter Queue1
32 CCQ2 Check-in Counter Queue2
33 CCQ3 Check-in Counter Queue3
34 CCQ4 Check-in Counter Queue4
35 IVCC1 Is information Valid for Check-in Counter 1
36 IVCC2 Is information Valid for Check-in Counter 2
37 IVCC3 Is information Valid for Check-in Counter 3
38 IVCC4 Is information Valid for Check-in Counter 4
39 R4_1 Remediation4 for Check-in Counter 1
40 R4_2 Remediation4 for Check-in Counter 2
41 R4_3 Remediation4 for Check-in Counter 3
42 R4_4 Remediation4 for Check-in Counter 4
43 SA Seat Allotted
44 APBP Agent Processes Boarding Pass
45 BC Is Baggage Check-in?
46 BPP Boarding Pass printed
47 BMHS Baggage Moves to Handling Section
48 TCBP Traveler Collects Boarding Pass
49 FT Flight Takeoff
During the simulation experiments, the number of servers in both the baggage
weighing and passenger profiling sub-sections were varied between one unit to three units in order to determine the effect of the variations on the average check-in time of passengers. It should be noted that the number of Check-in Counters (CCs) remained constant at 4, being the total number of counters reg-ularly activated for Emirates airline for Economy Class check-in processing. It is also important to note that with respect to time function, passengers are catego-rized into 2: those with baggage for check-in and those without baggage; desig-nated in the report as “b” and “a” respectively. The following are 6 combinations of the servers used in simulation experiments:
1) 1 × 1 × 4 servers representing 1 WM, 1 PD and 4 CC.
J. L. Obetta et al.
DOI: 10.4236/eng.2021.133010 132 Engineering
2) 2 × 1 × 4 servers representing 2 WM, 1 PD and 4 CC. 3) 3 × 1 × 4 servers representing 3 WM, 1 PD and 4 CC. 4) 2 × 2 × 4 servers representing 2 WM, 2 PD and 4 CC. 5) 3 × 2 × 4 servers representing 3 WM, 2 PD and 4 CC. 6) 3 × 3 × 4 servers representing 3 WM, 3 PD and 4 CC.
where: WM = Weighing Machine. PD = Profiling Device. CC = Check-in Counter. The results were therefore used to determine the average check-in time for a
passenger. Mathematically, the average check-in time (TAC) is modelled as:
TAC = 1/3 (TQ + TR + TS).
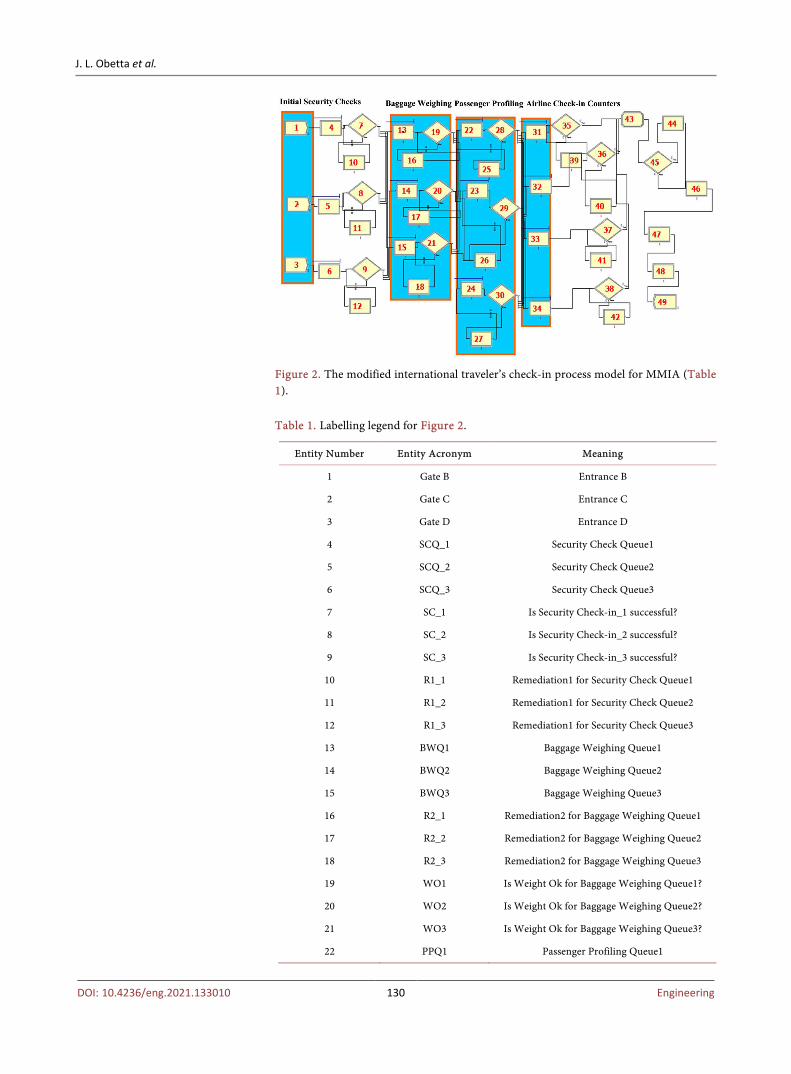
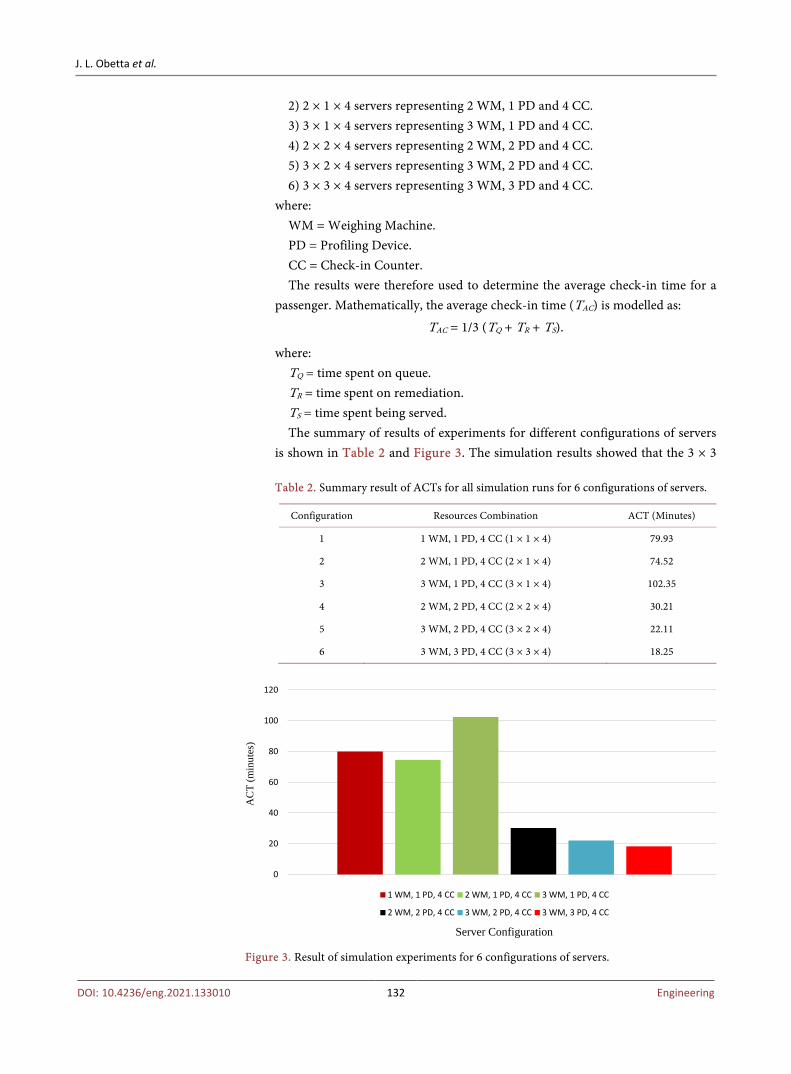
where: TQ = time spent on queue. TR = time spent on remediation. TS = time spent being served. The summary of results of experiments for different configurations of servers
is shown in Table 2 and Figure 3. The simulation results showed that the 3 × 3 Table 2. Summary result of ACTs for all simulation runs for 6 configurations of servers.
Configuration Resources Combination ACT (Minutes)
1 1 WM, 1 PD, 4 CC (1 × 1 × 4) 79.93
2 2 WM, 1 PD, 4 CC (2 × 1 × 4) 74.52
3 3 WM, 1 PD, 4 CC (3 × 1 × 4) 102.35
4 2 WM, 2 PD, 4 CC (2 × 2 × 4) 30.21
5 3 WM, 2 PD, 4 CC (3 × 2 × 4) 22.11
6 3 WM, 3 PD, 4 CC (3 × 3 × 4) 18.25
Figure 3. Result of simulation experiments for 6 configurations of servers.
0
20
40
60
80
100
120
1 WM, 1 PD, 4 CC 2 WM, 1 PD, 4 CC 3 WM, 1 PD, 4 CC
2 WM, 2 PD, 4 CC 3 WM, 2 PD, 4 CC 3 WM, 3 PD, 4 CC
Server Configuration
AC
T (m
inut
es)
J. L. Obetta et al.
DOI: 10.4236/eng.2021.133010 133 Engineering
× 4 combination of servers decreased the ACT per passenger from 76.16 minutes to 18.25 minutes; which is very significant. Thus, this combination will ensure optimum customer satisfaction as it offers little delay during the check-in process and is therefore proposed as an improvement to the existing model.
4. Conclusion, Recommendation and Future Work
In this work, a model for international traveler’s check-in process was developed for the international terminal of the MMIA, Ikeja. The developed model yielded an ACT of 18.25 minutes as against ACT of 76.16 minutes for the real system. This represents a difference of 58 minutes from that of the real system; translat-ing to about 76% improvement on the ACT of the real system. The experimental result showed that the developed model is valid and is therefore useful for airline decision makers to manage passengers’ check-in problem as a way of reducing passengers’ waiting time, improving the quality of service, enhancing overall customer experience, as well as boosting organizational revenue. Furthermore, the validity of the model indicates that the present facilities of the case study are inadequate to cater for the finite population of passengers. The developed model showed that the main choke points in airport check-in system occur at the bag-gage weighing and passenger profiling sub-sections. This is contrary to previous research findings that presented the check-in counters as the main choke points. This finding is considered a novel contribution to knowledge. Future work on the airport check-in process problem may look into a system that will ensure that arrival of passengers to the airport is not at random; which ultimately will discourage overcrowding at the check-in section.
Conflicts of Interest
The authors declare no conflicts of interest regarding the publication of this paper.
References [1] Adeniran, A.O. and Fadare, S.O. (2018) Relationship between Passengers’ Satisfac-
tion and Service Quality in Murtala Muhammed International Airport, Lagos, Ni-geria. International Journal of Research in Industrial Engineering, 7, 349-369.
[2] National Bureau of Statistics (2018) Air Transportation Data, 4th Quarter and Full Year 2017.
[3] Alamutu, S.A. (2018) Application of Queuing Model to Ease Traveler’s Flow in Ni-gerian International Airports. Journal of Business and Management, 20, 17-28.
[4] Patel, V. (2018) Airport Passenger Processing Technology: A Biometric Airport Journey. Master’s Degree Thesis, Embry-Riddle Aeronautical University, Prescott, 5-12.
[5] Heyde, C.C., Heyde, C.C., Seneta, E., Crépel, P., Fienberg, S.E., Gani, J. and Erlang, A.K. (2001) Statisticians of the Centuries. Springer, New York, 328-330. https://doi.org/10.1007/978-1-4613-0179-0_70
[6] Harchol-Balter, M. (2013) Performance Modeling and Design of Computer Sys-
J. L. Obetta et al.
DOI: 10.4236/eng.2021.133010 134 Engineering
tems: Queueing Theory in Action. Cambridge University Press, Cambridge.
[7] Enciso, J., Vargas, J. and Martinez, P. (2016) Modeling and Simulation of Passenger Traffic in a National Airport. 14th LACCEI International Multi-Conference for En-gineering, Education, and Technology, San Jose, 20-22 July 2016, 1-8. https://doi.org/10.18687/LACCEI2016.1.1.217
[8] Adacher, L., Flamini, M., Guaita, M. and Romano, E. (2017) A Model to Optimize the Airport Terminal Departure Operations. Transportation Research Procedia, 27, 53-60. https://doi.org/10.1016/j.trpro.2017.12.151
[9] Alodhaibi, S.S., Burdett, R.L. and Yarlagadda, P.K. (2019) Impact of Passen-ger-Arrival Patterns in Outbound Processes of Airports. Proceedia Manufacturing, 30, 323-330. https://doi.org/10.1016/j.promfg.2019.02.046