Simple mathematical law benchmarks human confrontations
6
Simple mathematical law benchmarks human confrontations Neil F. Johnson 1 , Pablo Medina 2 , Guannan Zhao 1 , Daniel S. Messinger 3 , John Horgan 4 , Paul Gill 5 , Juan Camilo Bohorquez 2 , Whitney Mattson 3 , Devon Gangi 3 , Hong Qi 1 , Pedro Manrique 1 , Nicolas Velasquez 6 , Ana Morgenstern 6 , Elvira Restrepo 6 , Nicholas Johnson 1 , Michael Spagat 7 & Roberto Zarama 2 1 Department of Physics, University of Miami, Coral Gables, FL33124 U.S.A., 2 CEIBA Complex Systems Research Center and Department of Industrial Engineering, Universidad de Los Andes, Bogota, Colombia, 3 Department of Psychology, University of Miami, Coral Gables, FL33146 U.S.A., 4 Center for Terrorism & Security Studies, University of Massachusetts, Lowell, MA01854 U.S.A., 5 Department of Security and Crime Science, University College London, WC1H 9EZ U.K., 6 Department of International Studies, University of Miami, Coral Gables, FL33124 U.S.A., 7 Department of Economics, Royal Holloway College, Egham, TW20 0EX U.K. Many high-profile societal problems involve an individual or group repeatedly attacking another – from child-parent disputes, sexual violence against women, civil unrest, violent conflicts and acts of terror, to current cyber-attacks on national infrastructure and ultrafast cyber-trades attacking stockholders. There is an urgent need to quantify the likely severity and timing of such future acts, shed light on likely perpetrators, and identify intervention strategies. Here we present a combined analysis of multiple datasets across all these domains which account for .100,000 events, and show that a simple mathematical law can benchmark them all. We derive this benchmark and interpret it, using a minimal mechanistic model grounded by state-of-the-art fieldwork. Our findings provide quantitative predictions concerning future attacks; a tool to help detect common perpetrators and abnormal behaviors; insight into the trajectory of a ‘lone wolf’; identification of a critical threshold for spreading a message or idea among perpetrators; an intervention strategy to erode the most lethal clusters; and more broadly, a quantitative starting point for cross-disciplinary theorizing about human aggression at the individual and group level, in both real and online worlds. H uman confrontations 1–25 from one-on-one fights 3–5 through to collective protests 6–10 , mass violence 11–23 and even online acts of aggression 24–25 , are of great societal importance. However our understanding of the dynamics at the event-by-event level remains limited (e.g. a child’s repeated cry-attacks against a par- ent 3–5 ) where each side (‘Red’ and ‘Blue’) is engaged in a complex cat-and-mouse game of adaptation and counter- adaptation, and where agility and secrecy (e.g. of Red) can enhance the ability to launch attacks 8,9,20–23 (e.g. against Blue). While ‘big data’ approaches to non-confrontational human activities have revealed new patterns 26–33 , the presence of aggression and danger means that event records for a particular confrontation run the risk of being incomplete or biased 15 . These considerations motivate us to analyze a broad spectrum of heterogeneous event- level datasets drawn from independent sources across multiple disciplines, not limited to armed conflict 16–19 , crossing from local to global geographic scales and in both real and online worlds. Our data sources are listed in the Supplementary Information (SI). We find that in all these systems, the distribution of the severity of events and the trend in the timing of events, are each described by a power-law function of the form ‘‘AB 2C ’’. Results Each point in Fig. 1 results from the maximum likelihood fitting of the power-law Ms 2a to the tail in the distribution of the severity of individual events within a given confrontation, where s is the severity of an individual event which, in the case of violent conflict, is the number killed or injured in an attack. a is the power-law exponent, M is the normalizing factor, and p is the goodness-of-fit 16–18 . Figure 1A inset illustrates this power-law tail distribution, while full details of the statistical fitting procedure are described in the cited references of the Methods section. We can analyze event severities and timings separately since they show no systematic cross-correlation, as illustrated in the SI. Specifically, while the event severity distribution is stationary OPEN SUBJECT AREAS: COMPLEX NETWORKS APPLIED PHYSICS Received 28 August 2013 Accepted 25 November 2013 Published 10 December 2013 Correspondence and requests for materials should be addressed to N.F.J. (njohnson@ physics.miami.edu) SCIENTIFIC REPORTS | 3 : 3463 | DOI: 10.1038/srep03463 1
Transcript of Simple mathematical law benchmarks human confrontations
Simple mathematical law benchmarkshuman confrontationsNeil F. Johnson1, Pablo Medina2, Guannan Zhao1, Daniel S. Messinger3, John Horgan4, Paul Gill5,Juan Camilo Bohorquez2, Whitney Mattson3, Devon Gangi3, Hong Qi1, Pedro Manrique1,Nicolas Velasquez6, Ana Morgenstern6, Elvira Restrepo6, Nicholas Johnson1, Michael Spagat7
& Roberto Zarama2
1Department of Physics, University of Miami, Coral Gables, FL33124 U.S.A., 2CEIBA Complex Systems Research Center andDepartment of Industrial Engineering, Universidad de Los Andes, Bogota, Colombia, 3Department of Psychology, University ofMiami, Coral Gables, FL33146 U.S.A., 4Center for Terrorism & Security Studies, University of Massachusetts, Lowell, MA01854U.S.A., 5Department of Security and Crime Science, University College London, WC1H 9EZ U.K., 6Department of InternationalStudies, University of Miami, Coral Gables, FL33124 U.S.A., 7Department of Economics, Royal Holloway College, Egham, TW200EX U.K.
Many high-profile societal problems involve an individual or group repeatedly attacking another – fromchild-parent disputes, sexual violence against women, civil unrest, violent conflicts and acts of terror, tocurrent cyber-attacks on national infrastructure and ultrafast cyber-trades attacking stockholders. There isan urgent need to quantify the likely severity and timing of such future acts, shed light on likely perpetrators,and identify intervention strategies. Here we present a combined analysis of multiple datasets across all thesedomains which account for .100,000 events, and show that a simple mathematical law can benchmark themall. We derive this benchmark and interpret it, using a minimal mechanistic model grounded bystate-of-the-art fieldwork. Our findings provide quantitative predictions concerning future attacks; a tool tohelp detect common perpetrators and abnormal behaviors; insight into the trajectory of a ‘lone wolf’;identification of a critical threshold for spreading a message or idea among perpetrators; an interventionstrategy to erode the most lethal clusters; and more broadly, a quantitative starting point forcross-disciplinary theorizing about human aggression at the individual and group level, in both real andonline worlds.
Human confrontations1–25 from one-on-one fights3–5 through to collective protests6–10, mass violence11–23
and even online acts of aggression24–25, are of great societal importance. However our understanding of thedynamics at the event-by-event level remains limited (e.g. a child’s repeated cry-attacks against a par-
ent3–5) where each side (‘Red’ and ‘Blue’) is engaged in a complex cat-and-mouse game of adaptation and counter-adaptation, and where agility and secrecy (e.g. of Red) can enhance the ability to launch attacks8,9,20–23 (e.g. againstBlue). While ‘big data’ approaches to non-confrontational human activities have revealed new patterns26–33, thepresence of aggression and danger means that event records for a particular confrontation run the risk of beingincomplete or biased15. These considerations motivate us to analyze a broad spectrum of heterogeneous event-level datasets drawn from independent sources across multiple disciplines, not limited to armed conflict16–19,crossing from local to global geographic scales and in both real and online worlds. Our data sources are listed inthe Supplementary Information (SI). We find that in all these systems, the distribution of the severity of eventsand the trend in the timing of events, are each described by a power-law function of the form ‘‘AB2C’’.
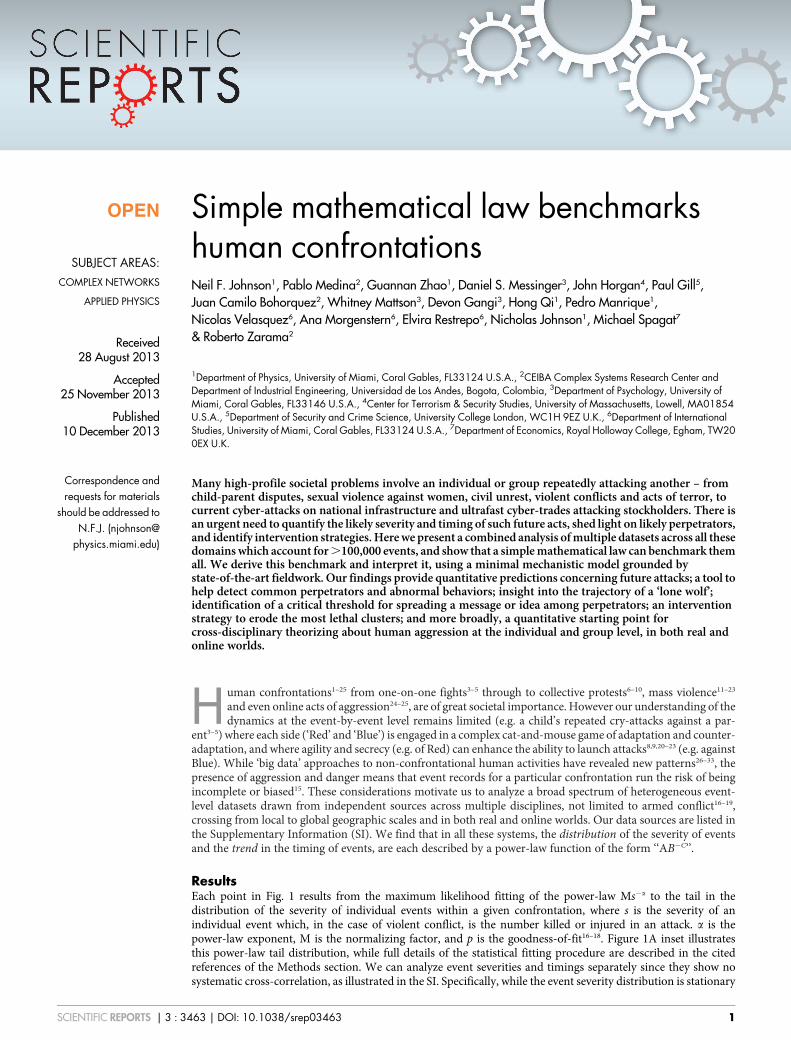
ResultsEach point in Fig. 1 results from the maximum likelihood fitting of the power-law Ms2a to the tail in thedistribution of the severity of individual events within a given confrontation, where s is the severity of anindividual event which, in the case of violent conflict, is the number killed or injured in an attack. a is thepower-law exponent, M is the normalizing factor, and p is the goodness-of-fit16–18. Figure 1A inset illustratesthis power-law tail distribution, while full details of the statistical fitting procedure are described in the citedreferences of the Methods section. We can analyze event severities and timings separately since they show nosystematic cross-correlation, as illustrated in the SI. Specifically, while the event severity distribution is stationary
OPEN
SUBJECT AREAS:COMPLEX NETWORKS
APPLIED PHYSICS
Received28 August 2013
Accepted25 November 2013
Published10 December 2013
Correspondence andrequests for materials
should be addressed toN.F.J. (njohnson@
physics.miami.edu)
SCIENTIFIC REPORTS | 3 : 3463 | DOI: 10.1038/srep03463 1
throughout the confrontation to a good approximation, the timing ofindividual events is a non-stationary process with periods of initialescalation or de-escalation.
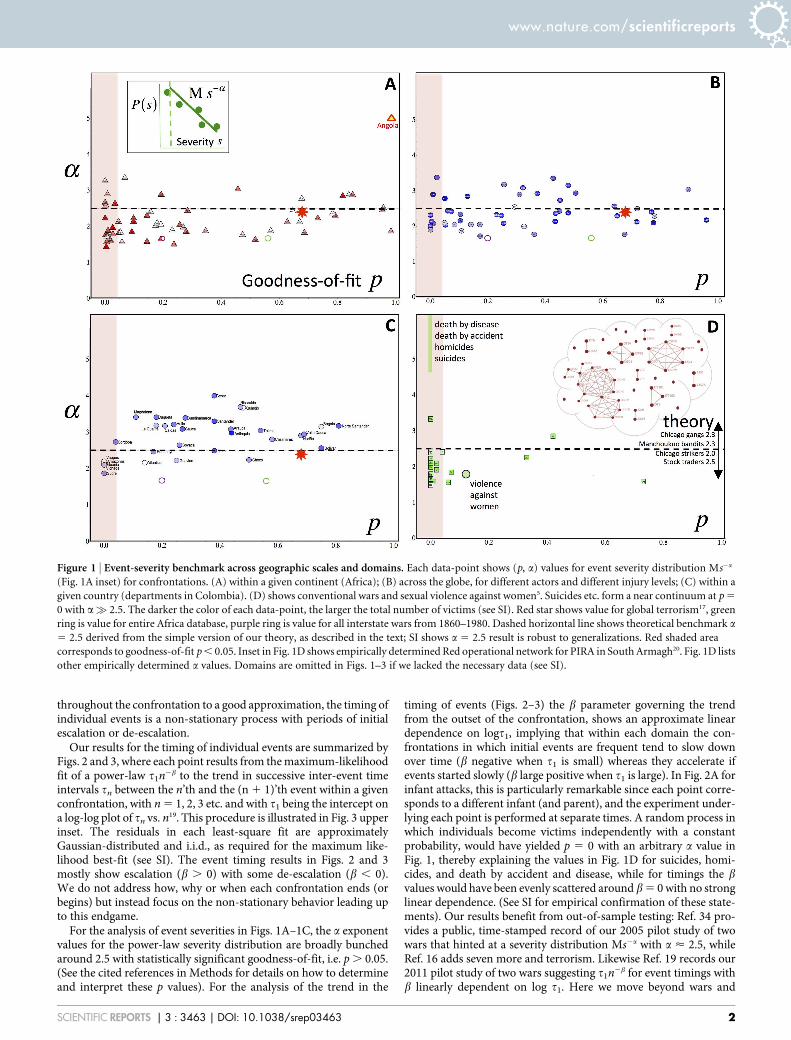
Our results for the timing of individual events are summarized byFigs. 2 and 3, where each point results from the maximum-likelihoodfit of a power-law t1n2b to the trend in successive inter-event timeintervals tn between the n’th and the (n 1 1)’th event within a givenconfrontation, with n 5 1, 2, 3 etc. and with t1 being the intercept ona log-log plot of tn vs. n19. This procedure is illustrated in Fig. 3 upperinset. The residuals in each least-square fit are approximatelyGaussian-distributed and i.i.d., as required for the maximum like-lihood best-fit (see SI). The event timing results in Figs. 2 and 3mostly show escalation (b . 0) with some de-escalation (b , 0).We do not address how, why or when each confrontation ends (orbegins) but instead focus on the non-stationary behavior leading upto this endgame.
For the analysis of event severities in Figs. 1A–1C, the a exponentvalues for the power-law severity distribution are broadly bunchedaround 2.5 with statistically significant goodness-of-fit, i.e. p . 0.05.(See the cited references in Methods for details on how to determineand interpret these p values). For the analysis of the trend in the
timing of events (Figs. 2–3) the b parameter governing the trendfrom the outset of the confrontation, shows an approximate lineardependence on logt1, implying that within each domain the con-frontations in which initial events are frequent tend to slow downover time (b negative when t1 is small) whereas they accelerate ifevents started slowly (b large positive when t1 is large). In Fig. 2A forinfant attacks, this is particularly remarkable since each point corre-sponds to a different infant (and parent), and the experiment under-lying each point is performed at separate times. A random process inwhich individuals become victims independently with a constantprobability, would have yielded p 5 0 with an arbitrary a value inFig. 1, thereby explaining the values in Fig. 1D for suicides, homi-cides, and death by accident and disease, while for timings the bvalues would have been evenly scattered around b 5 0 with no stronglinear dependence. (See SI for empirical confirmation of these state-ments). Our results benefit from out-of-sample testing: Ref. 34 pro-vides a public, time-stamped record of our 2005 pilot study of twowars that hinted at a severity distribution Ms2a with a < 2.5, whileRef. 16 adds seven more and terrorism. Likewise Ref. 19 records our2011 pilot study of two wars suggesting t1n2b for event timings withb linearly dependent on log t1. Here we move beyond wars and
Figure 1 | Event-severity benchmark across geographic scales and domains. Each data-point shows (p, a) values for event severity distribution Ms2a
(Fig. 1A inset) for confrontations. (A) within a given continent (Africa); (B) across the globe, for different actors and different injury levels; (C) within a
given country (departments in Colombia). (D) shows conventional wars and sexual violence against women5. Suicides etc. form a near continuum at p 5
0 with a? 2.5. The darker the color of each data-point, the larger the total number of victims (see SI). Red star shows value for global terrorism17, green
ring is value for entire Africa database, purple ring is value for all interstate wars from 1860–1980. Dashed horizontal line shows theoretical benchmark a
5 2.5 derived from the simple version of our theory, as described in the text; SI shows a 5 2.5 result is robust to generalizations. Red shaded area
corresponds to goodness-of-fit p , 0.05. Inset in Fig. 1D shows empirically determined Red operational network for PIRA in South Armagh20. Fig. 1D lists
other empirically determined a values. Domains are omitted in Figs. 1–3 if we lacked the necessary data (see SI).
www.nature.com/scientificreports
SCIENTIFIC REPORTS | 3 : 3463 | DOI: 10.1038/srep03463 2

terrorism with Figs. 1–3 providing blind test results for every datasetmade available to us in the interim years.
DiscussionThe confrontations that follow the benchmark behavior generallyfeature an actor (Red, e.g. cyber-hackers, insurgents, terrorists, pro-testors, ultrafast traders, infant) who is in principle weaker than itsBlue opposition (respectively, the national infrastructure, incumbentarmy, security forces, ruling government, global stock holders, par-ent), yet who manages to inflict a series of attacks that typicallyescalates (b . 0 in Figs. 2–3). We develop our explanatory modelby referring to the most recent and detailed fieldwork available ofsuch a Red group20: PIRA (the Provisional IRA) who inflicted anescalating number of attacks against the stronger British governmentforces (Blue) in Northern Ireland from 1969 onwards20. PIRA’soperational network shown in Fig. 1D inset, has a decentralizedstructure consistent with jihadist operational networks9,21,23 and withother clandestine and illicit groups, e.g. online gold farmers35. Itsresources – which in Fig. 1D inset are people but for more generalRed may include technology, predatory algorithms (Figs. 2C–D) or
even abstract cognitive processes for the case of infant (Fig. 2A)3,4 –are partitioned into clusters (‘cells’ or ‘units’) where a cluster’s com-ponents do not have to be spatially close, just coordinated in someway (e.g. by phone). In short, network connections indicate empiricalevidence of some coordinated activity, not spatial proximity.
Clusters can begin to coordinate together over time (i.e. clusterscoalesce)9,20–22,29 but can also lose internal coordination (cluster frag-ments) under conditions of external or internal stress9,20–22,29, just as acluster of animals disperses if in danger or a start-up company dis-solves if it loses common purpose36. Adding the empirical findingthat larger social clusters show more churn than smaller ones29, yieldsthe simplest form of our dynamical cluster theory whose exact solu-tion (see SI) is a Red cluster-size distribution of the form Ms2a with a5 2.5, consistent with Fig. 1D inset, with gang sizes in Asia andChicago (a 5 2.3)12 and with cyber-crowds of traders through theproxy of trade size (a 5 2.5)31. Following recent empirical findingslinking size to lethality14,18, we take a cluster’s size as proportional tothe severity of an event in which it participates, hence reproducingthe severity distribution Ms2a with a 5 2.5. We explored manygeneralizations of this theory but find that Ms2a with a < 2.5 is
Figure 2 | Event-timing benchmark across domains. (A) Each point denotes a unique infant-parent pair, obtained using analysis in Fig. 3 upper inset.
Underlying events are cry-face attacks by infant (Red) against parent (Blue). The experiment is described in Ref. 4. (B) Each point denotes a unique
geographic location. Underlying events are street protests by anti-government groups (Red) against Polish government (Blue). (C) Each point denotes a
unique sector of national cyber-infrastructure. Underlying events are cyber-attacks by foreign group (Red) against indicated sector’s defenses (Blue). (D)
Each point denotes a particular U.S. financial institution stock. Underlying events are attacks by ultrafast predatory traders (Red) against the remaining
market of slower global investors (Blue). We can reject the null hypothesis that these linear fits emerge by chance, by randomizing event times and then
comparing probability distribution of R2 fits to the real value R2real in order to generate p significance values (Fig. 2A, R2
real~0:74, p 5 0.0089; Fig. 2B,
R2real~0:82, p 5 5.6 3 1025; Fig. 2C, R2
real~0:91, p 5 0.036; Fig. 2D, R2real~0:80, p 5 0.0087). See SI for more details.
www.nature.com/scientificreports
SCIENTIFIC REPORTS | 3 : 3463 | DOI: 10.1038/srep03463 3

remarkably robust (see SI). Changing the rigidity of larger Red clus-ters successively from more rigid to less rigid, moves the a valuesfrom below 2 to above 3, hence providing an interpretation for indi-vidual confrontations in Figs. 1A–C. Restricting connectivitybetween Red clusters to physical contact on a two-dimensional gridlike an urban street setting or battlefield, pushes a toward 1.9 with aweaker power-law (p R 0) hence explaining most of the conven-tional wars in Fig. 1D and the a 5 2.0 value for Chicago strikes10.
The notion that Red’s self-organized, decentralized cluster struc-ture (Fig. 1D inset) helps it adapt faster and/or better than Blue, isconsistent with recent findings that organic structures are more con-ducive to innovation than bureaucratic ones36. Indeed, ultrafast tra-ders (Red, Fig. 2D) carry out their attacks in under a second. Weintroduce x(n) to represent Red’s relative advantage over Blue fol-lowing the last (n’th) attack, where x(n) follows a general stochasticprocess. For simplicity, we set the instantaneous rate of Red attacks asproportional to x(n) when x(n) . 0 (i.e. when Red has a relativeadvantage) and zero when x(n) , 0 (i.e. when Blue has a relativeadvantage) though this can be generalized. The rate of Red attacks ina confrontation that is generally escalating, then scales as x(n)jrms /nb9 (see SI) where b9 characterizes the correlations in x(n) (b9 5 0.5for an uncorrelated process). The time between attacks, which isapproximately the inverse rate, is therefore proportional to n2b9
enabling us to identify b9 5 b. This explains why t1n2b describesthe attack timings and implies that if b . 0.5, Red’s lead over Bluefollows a positively correlated process, while it follows a negativelycorrelated one if 0 , b , 0.5. Confrontations that de-escalate (i.e. b, 0) can be treated similarly. Our theory then reproduces the lineardependence between b and log t1 if we introduce coupling between
the underlying x(n) processes. Such coupling could arise if the sameRed entity underlies attacks in different places, e.g. in Fig. 2B thesame social movement underlies protests in different locations.
Figures 1–3 reveal surprising dynamical equivalences betweenconfrontations and hence offer novel data proxies and cross-domaininsights: The escalation of events in Magdalena, Colombia (blackoval ring) is representative of all confrontations in Fig. 3; the relativeposition of General Electric (GE) in Fig. 2D makes predatory tradeattacks on it akin to cyber-attacks on the Hi-tech Electronics sector(Fig. 2C) which in turn mimic specific infant-parent dyads (Fig. 2A)and protest locations (Fig. 2B); and the conflict in Sierra Leone,Africa, has the same (p, a) in Fig. 1 as the narco-guerilla war inAntioquia, Colombia. Deviations from the benchmark behavior actas a novel alert mechanism for abnormalities in Red and/or Bluebehavior, e.g. Angola in Fig. 1A, which serves to warn researchersagainst using such a confrontation as representative. The time-inter-val abnormality in Fig. 3 (upper inset) turns out to straddle the‘Bloody Sunday’ attack by Blue on civilians on 30 January 1972,implying that neighboring points offer insight into the build-up to,and consequences of, an extreme Blue intervention. InterestinglyBloody Sunday appears as the culmination of escalating PIRAattacks, not their trigger, hence raising new questions about its stra-tegic importance. The fact that Belfast’s (t1, b) values in Fig. 3 (lowerinset) destroy any linear dependence, is consistent with the recentfieldwork finding20 that Belfast’s PIRA network is quite distinct toFig. 1D inset. The fact that sexual attacks against women do notappear as an outlier in Fig. 1, hints at some hidden clustering (likeFig. 1D inset) of attackers or attacks.
We have shown that both the severities and the timings of eventsin a wide range of systems, follow a power-law functional form.There are various practical prediction tools and policies that followfrom our work, as we now discuss. Suppose some sporadic attackshave been observed in a given location or sector in the real or onlineworld. If the trend in successive time-intervals between attacks isfound to follow t1n2b, this suggests a single Red-Blue process(x(n)) underlies them. Assuming Red dominates the Red-Bluedynamic x(n) (i.e. Blue has not yet counter-adapted), this points toa single attacking Red individual or group. If attacks then emerge indifferent locations or sectors, detecting an approximate linear rela-tionship in b vs. log t1 points to this same Red operating in thesedifferent places. Figure 2C hence supports media speculation thatcurrent cyber-attacks against different sectors of US infrastructurecome from a single Red entity24. Likewise, Fig. 2D suggests that acommon set of predatory algorithms and/or trading firms (Red) mayunderlie recent ‘flash’ instabilities in different stocks25. For Fig. 2A,the independence of the participants suggests that this linear patternis revealing a new innate feature of how infants and parents interact.
Now imagine the scenario in which two attacks occur in a newlocation that was previously quiet, and that this same Red is sus-pected. An estimate for b in this new location can be read off from theexisting b vs. log t1 plot by inputting this single inter-event time as anestimate for t1. Future attack times can then be estimated using t1n2b
(see SI for examples).Next consider the severities of events as they begin to emerge in a
given sector. Suppose a crude Ms2a distribution is found with a < 2.5and p . 0.05. This points to Red having a similar delocalized clusterstructure to our model. Indeed, even without any observed eventsand hence without any event severities from which to estimate thedistribution, the weight of evidence in Fig. 1 suggests that any futureconfrontation involving a similarly structured Red will produce aseverity distribution Ms2a with a < 2.5 and p . 0.05. The expectednumber of victims in a future attack is therefore approximately [(a 2
1)/(a 2 2)]smin where smin is the cut-off in the maximum-likelihoodfit37. Taking a < 2.5 as in Fig. 1 and smin < 1, this expected number is3, which happens to coincide with the recent Boston marathonattack. The probability the next attack will be twice as lethal, is
Figure 3 | Event-timing benchmark focusing on violent confrontations.For a given symbol, each data-point shows the (t1, b) values obtained from
fitting trend in inter-event times (upper inset) within a confrontation in a
unique region or city within a given country, mostly in Africa but also
including Middle East and South America. SI contains key to symbols.
Several best-fit lines are shown as a guide. Separate symbols for attacks
against government forces, and against civilians. Red star shows result for
global terrorism. Upper inset shows escalation of Red attacks in Belfast.
Lower inset shows Belfast (solid red square) is abnormal compared to
Armagh and Down (red squares with yellow centers).
www.nature.com/scientificreports
SCIENTIFIC REPORTS | 3 : 3463 | DOI: 10.1038/srep03463 4
(s/smin)12a < (s/smin)21.5 with s 5 6, giving 0.07 (i.e. 7%). The severityof the most fatal attack will grow as the number of attacks n grows,following n1/(a21) < n0.67. Dividing attacks equally into less violent andmore violent, the fraction of victims falling in the most violent half isgiven by 22(a22)/(a21) 5 0.8 meaning that a few attacks will producethe majority of the victims. Another relevant consequence of ourclustering theory is that the ongoing coalescence-fragmentation pro-cess means that a ‘lone wolf’ actor is only truly alone for short periodsof time, which is again consistent with recent field studies22, andprovides an estimate for how long ago contact was made with otherRed clusters.
The stability of a in Fig. 1 throughout a given confrontation (seeSI) suggests that the corresponding Red group self-organizes rapidlyafter its inception, as confirmed by our model’s dynamics, and hencelatent Red groups that have not yet launched any attacks may alreadyhave a structure resembling Fig. 1D inset. More generally, althoughthe overall command structure of a present or future Red might behierarchical, or publicly portrayed as so, our theory aligns with recentempirical findings9,20,21,23 in predicting that operationally Red willself-organize into a far flatter, clustered structure similar to Fig. 1Dinset. As a corollary, our clustering theory also identifies a novel‘Achilles Heel’ for such a Red: The self-organized nature of the clus-tering means that Blue can avoid having to find and destroy thelargest (i.e. most lethal) Red clusters, by instead regularly breakingup smaller (i.e. less powerful) ones. The mathematics specifies con-ditions required to keep formation of large (lethal) clusters below adesired rate, and so reduce the threat level of large future attacks. Italso warns that if Blue is insufficiently active in counter-measures,and hence the overall rate at which it fragments Red clusters becomestoo small (nf rag= N ln Nð Þ{1 where N is an estimate of Red’s size38)then Red will grow exponentially fast into one super-cluster of max-imum possible lethality. Finally, our clustering theory predicts anecessary condition39 nfragp/ncoalq . 1 that must be met before acovert message or doctrine can spread within Red, where ncoal isthe cluster coalescence rate, p is the transmission rate of the messagebetween two people in a Red cluster, and q is the rate at which thismessage gets forgotten or corrupted.
MethodsThe power-law analysis that we use to obtain our results in Fig. 1 for the tail in thedistribution of the severity of individual events, follows exactly the state-of-the-arttesting procedure described in Refs. 16–18 and firmly established in Ref. 40. Ouranalysis of the trend in the timings of individual events follows exactly the methodpresented in Ref. 19. Our proposed model of cluster coalescence-fragmentation forRed, which reproduces the 2.5 power-law result for the severity distribution, com-prises a population of objects (agents) that self-organize into clusters according to thestated rules of cluster coalescence and fragmentation. The mathematical derivation ofthe 2.5 result is given in the SI. We have also investigated many variants of thiscoalescence-fragmentation cluster model and found (see SI) that most retain a power-law with exponent near 2.5. For the trend in the timings of attacks, a null modelcomparison showing the statistical significance of our benchmark result is given inthe SI, together with the derivation of our stochastic model for Red’s relativeadvantage over Blue which reproduces this timings benchmark.
1. Lazer, D. et al. Computational Social Science. Science 323, 721–723 (2009).2. Vespignani, A. Predicting the behavior of techno-social systems. Science 325,
425–428 (2009).3. Cohn, J. F. & Tronick, E. Z. Mother–infant face-to-face interaction: Influence is
bidirectional and unrelated to periodic cycles in either partner’s behavior. Dev.Psychol. 24, 386–392 (1988).
4. Ekas, N., Haltigan, J. D. & Messinger, D. S. The Dynamic Still-Face Effect: DoInfants Decrease Bidding Over Time When Parents are Not Responsive? Dev.Psychol. 49, 1027–35 (2013).
5. Kappler, K. E. & Kaltenbrunner, A. The Power Laws of Violence against Women:Rescaling Research and Policies. PLoS ONE 7, e40289 (2012).
6. Spirling, A. Scale invariance in political science: http://www.people.fas.harvard.edu/,spirling/documents/powerlawSend.pdf (Date of access: 03-24-2013).
7. Lichbach, M. I. Nobody cites nobody else: mathematical models of domesticpolitical conflict. Defence Econ. 3, 341–357 (1992).
8. Francisco, R. A. Dynamics of Conflict (Springer, New York, 2009).
9. Kenney, M. From Pablo to Osama: Trafficking and Terrorist Networks,Government Bureaucracies, and Competitive Adaptation (University ofPennsylvania Press, Philadelphia, 2007).
10. Biggs, M. Strikes as forest fires: Chicago and Paris in the late nineteenth century.Am. J. of Sociol., 110, 1684–1714 (2005).
11. Spagat, M., Mack, A., Cooper, T. & Kreutz, J. Estimating War Deaths: An Area ofContestation. J. Confl. Resolut. 53, 934–950 (2009).
12. Richardson, L. F. Statistics of Deadly Quarrels (Boxwood Press, London, 1960).13. Riddihough, G. et al. Human conflict. Science 336, 819 (2012).14. Asal, V. & Rethemeyer, R. K. The nature of the beast: Organizational structures
and the lethality of terrorist attacks. J. Polit. 70, 437–449 (2008).15. Johnson, N. F. et al. Bias in Epidemiological Studies of Conflict Mortality. J. Peace
Res. 45, 653–659 (2008).16. Bohorquez, J. C. et al. Common ecology quantifies human insurgency. Nature
462, 911–914 (2009).17. Clauset, A., Young, M. & Gleditsch, K. S. On the frequency of severe terrorist
events. J. Confl. Resolut. 51, 58–87 (2007).18. Clauset, A. & Gleditsch, K. The Developmental Dynamics of Terrorist
Organizations. PLoS One 7, e48633 (2012).19. Johnson, N. F. et al. Pattern in escalations in insurgent and terrorist activity.
Science 333, 81–84 (2011).20. Horgan, J. et al. From Bomb to Bomb-maker: A Social Network Analysis of the
Socio-Psychological and Cultural Dynamics of the IED Process - Final Report.Arlington, Virginia: Office of Naval Research Code 30. Available at http://www.icst.psu.edu/ResearchProject/B2B.shtml (Date of access: 03-24-2013).
21. Kilcullen, D. The Accidental Guerrilla: Fighting Small Wars in the Midst of a BigOne. (Oxford University Press, London, 2009).
22. Gill, P., Horgan, J. & Deckert, P. Tracing the motivations and antecedentbehaviors of lone-actor terrorism: http://www.icst.psu.edu/docs/3.ExecSum/ICST.LoneActor.ExecSumm.pdf (Date of access: 07-25-2013).
23. Kenney, M. et al. Organisational adaptation in an activist network: Socialnetworks, leadership, and change in al-Muhajiroun. Appl. Ergon. 44, 739e747(2013).
24. Exposing One of China’s Cyber Espionage Units, Mandiant (2013). Available athttp://intelreport.mandiant.com/Mandiant_APT1_Report.pdf (Date of access: 3-19-2013).
25. Beddington, J. Foresight: The Future of Computer Trading in Financial Markets(2012) Final Project Report. The Government Office for Science, London: http://www.bis.gov.uk/foresight/our-work/projects/published-projects/computer-trading (Date of access: 07-24-2013).
26. Song, C., Qu, Z., Blumm, N. & Barabasi, A. L. Limits of Predictability in HumanMobility. Science 327, 1018–1021 (2010).
27. Wuchty, S., Jones, B. F. & Uzzi, B. The increasing dominance of teams inproduction of knowledge. Science 18, 1036–9 (2007).
28. Gonzalez, M. C., Hidalgo, C. A. & Barabasi, A. L. Understanding individualhuman mobility patterns. Nature 453, 779–782 (2008).
29. Palla, G., Barabasi, A. L. & Vicsek, T. Quantifying social group evolution. Nature446, 664–667 (2007).
30. Preis, T., Schneider, J. J. & Stanley, H. E. Switching processes in financial markets.Proc. Natl. Acad. Sci. U.S.A. 108, 7674–7678 (2011).
31. Gabaix, X., Gopikrishnan, P., Plerou, V. & Stanley, H. E. Institutional investorsand stock market volatility. Quart. J. Econ. 461, 461–504 (2006).
32. Malmgren, R. D., Stouffer, D. B., Campanharo, A. S. & Amaral, L. A. Onuniversality in human correspondence activity. Science 325, 1696–700 (2009).
33. Axtell, R. What Economic Agents do: How Cognition and Interaction Lead toEmergence and Complexity. Rev. Austr. Econ. 20, 105–122 (2007).
34. Johnson, N. F. et al. From old wars to new wars and global terrorism. arxiv.org/abs/physics/0506213 (2005).
35. Keegan, B. et al. Dark Gold: Statistical Properties of Clandestine Networks inMassively Multiplayer Online Games. Proc. 2nd Int. Conf. on Social Computing,IEEE Computer Society, (2010). ISBN 978-0-7695-4211-9. p. 201–208.
36. Fleming, L. et al. The Emergence of Organizations and Markets (PrincetonUniversity Press, Princeton, 2012).
37. Newman, M. E. J. Power laws, Pareto distributions and Zipf’s law. Contemp. Phys.46, 323–351 (2005).
38. Xie, Y. et al. Finite-size effect in the Eguiluz and Zimmermann model of herdformation and information transmission. Phys. Rev. E 65, 046130 (2002).
39. Zhao, Z. et al. Effect of social group dynamics on contagion. Phys. Rev. E 81,056107 (2010).
40. Clauset, A., Shalizi, C. & Newman, M. Power-Law Distributions in EmpiricalData. SIAM Rev. 51, 661–703 (2009).
AcknowledgmentsN.F.J. acknowledges support from the Office of Naval Research (ONR) under grantN000141110451 and from the Intelligence Advanced Research Projects Activity (IARPA)via Department of Interior National Business Center (DoI/NBC) contract numberD12PC00285. The U.S. Government is authorized to reproduce and distribute reprints forGovernmental purposes notwithstanding any copyright annotation thereon. The views andconclusions contained herein are those of the authors and should not be interpreted asnecessarily representing the official policies or endorsements, either expressed or implied,
www.nature.com/scientificreports
SCIENTIFIC REPORTS | 3 : 3463 | DOI: 10.1038/srep03463 5

of ONR, IARPA, DoI/NBE or the U.S. Government. P.M. (Medina) and J.C.B. acknowledgesupport from COLCIENCIAS through their doctoral funding program. DSM acknowledgessupport from the National Institute of General Medical Sciences (1R01GM105004), theNational Institute of Child Health and Human Development (R01 HD047417) and theNational Science Foundation (1052736). NFJ thanks O. Antony for help with compilingthe SOM data files.
Author contributionsN.F.J., P.M., G.Z., D.S.M., J.H., P.G., J.C.B., W.M., D.G., H.Q., P.M., N.V., A.M., E.R., N.J.,M.S., R.Z. worked on the data and data analysis, and were involved in discussionsconcerning the model. N.F.J. wrote the paper but all authors participated in associateddiscussions.
Additional informationSupplementary information accompanies this paper at http://www.nature.com/scientificreports
Competing financial interests: The authors declare no competing financial interests.
How to cite this article: Johnson, N.F. et al. Simple mathematical law benchmarks humanconfrontations. Sci. Rep. 3, 3463; DOI:10.1038/srep03463 (2013).
This work is licensed under a Creative Commons Attribution-NonCommercial-NoDerivs 3.0 Unported license. To view a copy of this license,
visit http://creativecommons.org/licenses/by-nc-nd/3.0
www.nature.com/scientificreports
SCIENTIFIC REPORTS | 3 : 3463 | DOI: 10.1038/srep03463 6