Significance of Use of Clay Soil Mixed with Cow Dung to produce Bricks for Low Cost Buildings
32
Katale et al. USEP: Journal of Research Information in Civil Engineering, 10(1), 2013 340 Significance of Use of Clay Soil Mixed with Cow Dung to Produce Bricks for Low Cost Buildings D. Katale 1 , V. S. Kamara 2 and A. A. Adedeji 3 1, 2 Department of Civil Engineering, School of Engineering and Information Technology, Namibia University of Science and Technology (Fmr Polytechnic of Namibia), Windhoek, Namibia [email protected] 1 , [email protected] 2 3 Department of Civil Engineering, Faculty of Engineering and Technology, University of Ilorin, Ilorin, Nigeria [email protected] 3 Abstract This study was conducted to investigate the significance of clay bricks mixed with cow dungs to construct sustainable and environmentally friendly buildings. The clay soil was collected at about 5km South of Okahandja, and the cow dung was obtained from Rietfontein in the Omaheke region of Namibia. Analysis of all the test samples suggest that the California Bearing Ration (CBR) decreases as the amount of cow dung is increased across the entire sample. The cow dung has been added as reinforcing agent in different proportions. The results suggest that an increase in cow dung reduces the maximum dry unit weight, and increases the optimum moisture content. The compression test outcome suggests that at the addition of 20% cow dung the sample had the highest compressive strength. It was observed that the tested samples take a longer period to fail as the cow dung percentages increased. Keywords: Clay soil, cow dung, sustainable bricks, CBR, compressive strength 1. Introduction With the increasing demand for low cost housing and high cost of building material, there is a need to explore sustainable approaches to the needs of the building industry. Bricks as the core material in
Transcript of Significance of Use of Clay Soil Mixed with Cow Dung to produce Bricks for Low Cost Buildings

Katale et al. USEP: Journal of Research Information in Civil Engineering, 10(1), 2013
340
Significance of Use of Clay Soil Mixed with Cow Dung to Produce Bricks for Low Cost
Buildings
D. Katale1, V. S. Kamara2 and A. A. Adedeji3 1, 2 Department of Civil Engineering, School of Engineering and
Information Technology, Namibia University of Science and Technology (Fmr Polytechnic of Namibia), Windhoek, Namibia
[email protected], [email protected] 3 Department of Civil Engineering, Faculty of Engineering and
Technology, University of Ilorin, Ilorin, Nigeria [email protected]
Abstract This study was conducted to investigate the significance of clay bricks mixed with cow dungs to construct sustainable and environmentally friendly buildings. The clay soil was collected at about 5km South of Okahandja, and the cow dung was obtained from Rietfontein in the Omaheke region of Namibia. Analysis of all the test samples suggest that the California Bearing Ration (CBR) decreases as the amount of cow dung is increased across the entire sample. The cow dung has been added as reinforcing agent in different proportions. The results suggest that an increase in cow dung reduces the maximum dry unit weight, and increases the optimum moisture content. The compression test outcome suggests that at the addition of 20% cow dung the sample had the highest compressive strength. It was observed that the tested samples take a longer period to fail as the cow dung percentages increased. Keywords:
Clay soil, cow dung, sustainable bricks, CBR, compressive strength
1. Introduction With the increasing demand for low cost housing and high cost of building material, there is a need to explore sustainable approaches to the needs of the building industry. Bricks as the core material in

Katale et al. USEP: Journal of Research Information in Civil Engineering, 10(1), 2013
341
building construction can be produced by clay which is processed either through sundried or burned. The latter however is expensive and technically exhausting whereas sundried bricks can be produced by the layman. In order to ensure the durability and optimal strength output with sundried clay bricks, fibrous materials is believed to enhance such characteristics. This study intends to explore how cow dung can be used to enhance the quality of clay bricks that can be used for low cost building construction in various communities around Namibia. Clay bricks have been used since 4300BC and are still widely used today (Krakowiak et al., 2011). Next to concrete and steel, masonry is the most used construction material on Earth. Clay has the property of forming a coherent sticky mass when mixed with water, being readily mouldable when wet but if dried retains its shape (Okolode, et al, 2012). The brick making technology is driven by using the soil onsite or near to site, and then a certain amount of fibre is mixed into the soil, depending on the characteristics of the soil, and then stabilized by compaction, so as to improve the engineering properties of the produced bricks. (Makunza, 2006) This research is driven by the objective of making extensive use of raw earth, containing a natural component of clay, as the main building material, aided by a fibrous material, which in this case is cow dung. This is to develop technologies that are energy saving, eco-friendly and sustainable (Okolode et al., 2012). The scope of this report presents the fundamental investigation and procedures for the manufacture of the clay brick of which the constituents are clay, cow dung, sand, silt and water. The principal processes and procedures for forming the bricks areresearched, tested, analysed and discussed, and appropriate conclusions and recommendations are drawn. The specific objectives of this study are as follows:
1. To determine the strength characteristics of the soil samples using California Bearing Ratio (CBR) and compression tests

Katale et al. USEP: Journal of Research Information in Civil Engineering, 10(1), 2013
342
2. To use the compaction test in order to determine the maximum dry unit weight and optimum moisture content of the respective samples;
3. To use sieve analyses to classify the soil and cow dung, to know which characteristics are being dealt with;
4. To use the different outcomes of the tests conducted to produce the bricks, which themselves are cured for 14 days in direct sunlight, 30 days and 90 days under controlled conditions respectively;
5. To analyze the outcomes of the tests conducted and use them to draw conclusions.
2. Soil Stabilization The main aim of stabilizing soil is to stabilize silt and clay against water and to give it lasting properties when moisture is added. Three procedures are done for soil stabilization. These are shown in Table 1. Table 1: Methods of stabilization Method Principle Actions
Mechanical A compaction in soil.
Results in an increase in density and mechanical strength.
Results in an increase in water resistance.
The effect is a decrease in permeability and porosity.
Physical Adding or removing aggregates corrects the texture of the soil.
Coarse particles are removed by sieving.
Improvement in texture by mixing different soils together
Gravel or sand is added for reinforcement
Clay is added as a binder.
chemical
The soil is mixed with processed products (which active materials) like chemicals.
They aid in binding the soil together.
(http://www.earth-auroville.com) The improvement of soil for building material is done by adding stabilizers. Soils which have been treated through stabilization,

Katale et al. USEP: Journal of Research Information in Civil Engineering, 10(1), 2013
343
consolidation, which are well-graded, sufficiently moisturized, mixed, and cured will produce bricks that are strong, stable, waterproof and long-lasting. The stabilizers in soil has the following effects 1)The soil particles are bound together resulting in a stronger product; 2)Water proofing causes a reduction in the amount of voids and water absorbed; and 3)The shrinkage and swelling properties are reduced; and the tensile strength is increased (Makunza, 2006). 2.1 Stabilizers Sandy soils require cement stabilization, but also for the general achievement of quick higher strength. Clay containing soil requires lime, although this technique takes longer to harden and to give strong blocks. Eithercement or lime stabilisation results in an increase in strength and the ability of the stabilised earth to beexposed or submerged in water. Compression which results in the densification of soils such as in rammed earth and Compressed Stabilized Earth Bricks (CSEB), or by the addition of water such as for shaped, cob, adobe, and wattle & daub gives the bricks a greateramount of cohesion and resistance, although they should not be exposed to water for long. The thermal behaviour of earthen walls is referred to as hydro-thermal behaviour, which means that if clay is only stabilised and not burnt, it retains the ability to absorb and release moisture through evaporation and condensation. This happens when there is moisture/temperature difference between the outside and inside. This behaviour is called “latent heat” and is a daily and season to season occurrence. This occurs as follows: If there is a higher external temperature, then the walls will
evaporate moisture, causing the wall to cool down resulting in the inside of the building being cooler.
If there is a lower external temperature, then the walls will condense moisture, creating heat in the wall and consequently the inside of the building.(http://www.earth-auroville.com)
2.2 Clay Namibia has seven soil clay mineral regions, of which many individualclay mineral assemblages occur in fluvial, pan, cave and

Katale et al. USEP: Journal of Research Information in Civil Engineering, 10(1), 2013
344
other environments. Clay minerals are the most common components of all sediments and soils. Figure 1 shows clay mineral provinces in Namibia.
Figure 1: Clay mineral provinces of Namibia. Inset map shows southern Africa perennial rivers (Heine and Völkel, 2010)
Seven clay mineral regions in Namibia consist of clay mineral compositions containing quartz, feldspars, Fe-oxides (goethite), calcite, dolomite and a small amount of other non-clay species. In other words and as indicated in Figure 1: Regions (1) contains
Legend:
ABF: Angola-Benguela-Front;
AC: Angola Current;
BCC: Benguela Coastal Current;
BOC: Benguela Oceanic Current;
R: Rossing Cave;
T: Tinkas Cave.

Katale et al. USEP: Journal of Research Information in Civil Engineering, 10(1), 2013
345
kaolinite and smectite; (2) has a composition of smectite (55%), illite (20%) kaolinite (15%), and illite/smectite/mixed-layer clay minerals (10%); (3) is composed ofillite (10–60%), smectite (40–70%), palygorskite (15–30%), chlorite (10%) and mixed-layer clay minerals (5%); (4) is made up of Illite (ca. 40%), smectite (ca. 40%) and kaolinite (ca. 20%); (5) comprises of Illite (40 to 70%), Chlorite(ca. 25%), Smectite (up to 25%), kaolinite (up to 5%) and Palygorskite (Up to 10%); (6) has a make up of illite (20–50%), smectite (15–30%), kaolinite(10–15%), a mixed-layer (up to15%), and Palygorskite and sepiolite (up to 30%); and (7) is composed of illite (30–35%) and smectite (30–60%) dominate, Kaolinite and chlorite (up to 10%), amixed-layer clay minerals (chlorite-smectite-forms) (a few percent), Palygorskite (35%) (Heine and Völkel, 2010). Dung and straw offers similar advantages, where dung is added to additionally repel insects. Traditionally lime-based cement is used for the plaster to protect against rain damage (Dirk, 2012). 2.3.1 Thermal properties The wall of adobe bricks can serve as a heat reservoir because of its thermal properties inherent in the massive walls typical in adobe construction. Areas that have hot days and cool nights allow the high thermal mass of adobe to level out the heat transfer through the wall to the living space. The walls require a large and long input of heat from the sun (radiation) and from the surrounding air (convection) before they warm through to the inside of the building and begin to transfer heat to the living space. When temperature drops after sun set, the warm wall then continues to transfer heat to the interior for several hours due to the time lag effect. Therefore an adobe wall of the appropriate thickness is very effective at controlling interior temperature through the daily fluctuations which contributes to its longevity as a building material (Dirk, 2012). Rammed earth can contribute to the overall energy-efficiency of buildings. The density, thickness and thermal conductivity of rammed earth make it a particularly suitable material for passive solar heating. Warmth takes almost 12 hours to work its way through a wall 35 cm thick (Dirk 2012).
Katale et al. USEP: Journal of Research Information in Civil Engineering, 10(1), 2013
346
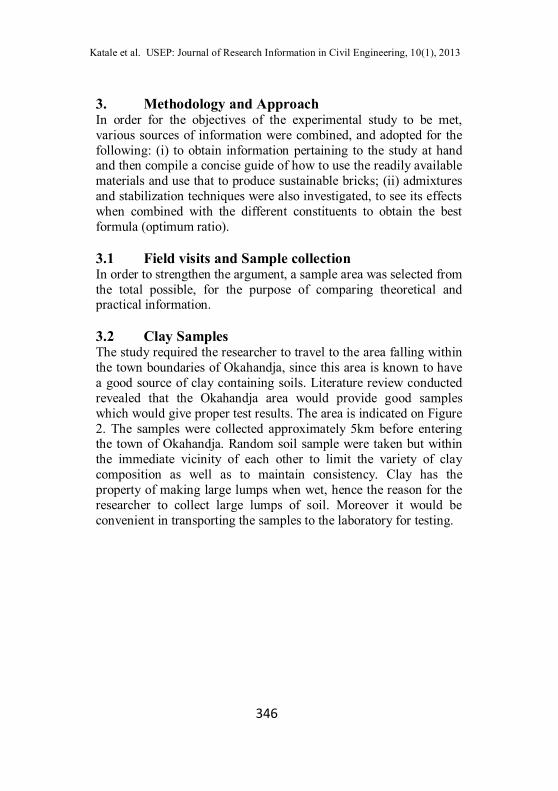
3. Methodology and Approach In order for the objectives of the experimental study to be met, various sources of information were combined, and adopted for the following: (i) to obtain information pertaining to the study at hand and then compile a concise guide of how to use the readily available materials and use that to produce sustainable bricks; (ii) admixtures and stabilization techniques were also investigated, to see its effects when combined with the different constituents to obtain the best formula (optimum ratio). 3.1 Field visits and Sample collection In order to strengthen the argument, a sample area was selected from the total possible, for the purpose of comparing theoretical and practical information. 3.2 Clay Samples The study required the researcher to travel to the area falling within the town boundaries of Okahandja, since this area is known to have a good source of clay containing soils. Literature review conducted revealed that the Okahandja area would provide good samples which would give proper test results. The area is indicated on Figure 2. The samples were collected approximately 5km before entering the town of Okahandja. Random soil sample were taken but within the immediate vicinity of each other to limit the variety of clay composition as well as to maintain consistency. Clay has the property of making large lumps when wet, hence the reason for the researcher to collect large lumps of soil. Moreover it would be convenient in transporting the samples to the laboratory for testing.

Katale et al. USEP: Journal of Research Information in Civil Engineering, 10(1), 2013
347
Figure 2: The Okahandja town area in the Otjozondjupa region
where the soil samples were collected (Google Earth, 2012). 3.3 Cow Dung Collection The cow dung was retrieved from eastern Namibia in the Omaheke region, namely the Rietfontein rural communal farm area. The cow dung was from the Brahman herd of cattle which is frequent in this area. The area is indicated by Figure 2.

Katale et al. USEP: Journal of Research Information in Civil Engineering, 10(1), 2013
348
Figure 3: Epukiro, the rural communal area in the Omaheke region
where the cow dung was collected (Google Earth, 2012). The cow dung was collected in two forms, namely fresh cow dung which had just been dropped from the animal, and dry cow dung which had been dropped but which was not older than 2 weeks (14 days). Both of the sample groups were described as ‘fresh’. Cows are kept for two weeks in camps and then rotated thereafter. This controlled process ensured that the correct cow dung was collected. The wet cow dung was collected by the cattle herder within minutes after dropping, wrapped in several bags which was done to ensure that the moisture content of the samples were kept as close to the original as possible by keeping the temperature low and the bacterial activity to a minimum, hence any losses can be considered negligible. The collected moist samples were used within 5 days in order to maintain consistency.

Katale et al. USEP: Journal of Research Information in Civil Engineering, 10(1), 2013
349
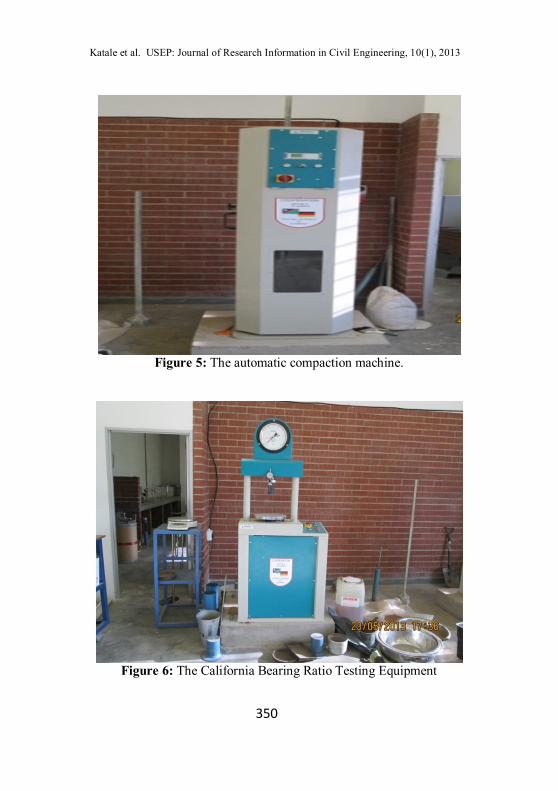
3.4 Experimental Procedure 3.4.1 Test on Soil Samples The sieve analysis was conducted for both mixing ingredients namely the clay containing soil and the dry cow dung. The particle size classification for this project was done using the classification developed by the American Association of State Highway and Transportation Officials (AASHTO).The sieve sizes used were in accordance with AASHTO. Sizes of 2.00mm, 1.18mm, 0.600mm, 0.425mm, 0.300mm, 0.150mm, 0.075mm and the bottom collection pan were used. Figure 4 shows the sieve analysis equipment and balance for weighing of samples. Other tests conducted were liquid limit, plastic limit, plasticity index, compaction test and CBR test. Figures 5 and 6 show the automatic compaction and CBR testing equipment used.
Figure 4 The sieves on the electrical and balance used to weigh the
sample
Katale et al. USEP: Journal of Research Information in Civil Engineering, 10(1), 2013
350
Figure 5: The automatic compaction machine.
Figure 6: The California Bearing Ratio Testing Equipment

Katale et al. USEP: Journal of Research Information in Civil Engineering, 10(1), 2013
351
3.4.2 The brick production process The bricks were made in the laboratory using a standard production machine of which the individual brick mould dimensions were 230mm x 110mm x 85mm. Thus all the bricks produced in this press were of the same initial size before treatment and exposure. The samples for each of the mix ratios were then placed in the mould. The bricks made were then left to nature. This was done by placing the bricks in direct sunlight or leaving the bricks under more controlled conditions. Figure 7 shows the compression testing equipment used to measure the compressive strength of the respective samples, while Figure 8 shows the brick making mould to produce the brick testing sample.
Figure 7 Compression testing equipment used to measure the
compressive strength of the respective samples.

Katale et al. USEP: Journal of Research Information in Civil Engineering, 10(1), 2013
352
Figure8: the brick making mould to produce the brick testing
samples.
Figure 9 The brick test sample after production and during
curing.period

Katale et al. USEP: Journal of Research Information in Civil Engineering, 10(1), 2013
353
Figure 10a Brick test sample after failure by the compression
machine.
Figure 10b Brick test sample after failure by the compression
machine.

Katale et al. USEP: Journal of Research Information in Civil Engineering, 10(1), 2013
354
Figure 10c Brick test sample after failure by the compression
machine. 4. Experimental Results Figures 9 and 10 show a brick test sample after production and at different failure modes respectively. The stress-strain curve was drawn for each of the main sample mixtures, as well as the sub-mixes separated by the moisture content, on a natural scale, i.e. the load readings were plotted against the depth of penetration. The loads were read off at 2.54mm, 5.08mm and 7.62mm points of penetration. The readings obtained were then expressed as a percentage of the California Standard for that penetration, as described in Table 3. The percentage obtained is therefore called the California Bearing Ratio (CBR) at the particular depth of penetration, where the CBR at 2.54mm penetration is generally used for assessing the quality of materials. However a combination of all three is used to gain an overall view of the behavior of the soil and cow dung mixtures. Tables 3 and 4 show the relationship of depth of penetration with the California Standard to determine CBR (TMH1-A8). Results of CBR are shown in Figures 11 and 12 respectively.

Katale et al. USEP: Journal of Research Information in Civil Engineering, 10(1), 2013
355
Table 3 Relationship of depth of penetration with theCalifornia Standard to determine CBR (TMH1-A8)
Table 4 Laboratory readings of the California Bearing Ratio (CBR)
of the clay control sample
0.127 mm Penetration
Dry (first trial)
100ml 220ml 650ml (first trial)
Dry (first trial)
370ml 520ml
650ml (seco
nd trial)
0.000 0.000 0.000 0.000 0.025 0.000 0.000 0.000 0.000
0.635 0.625 0.075 1.500 0.050 0.000 1.050 0.025 0.050
1.270 0.950 0.500 3.100 0.050 0.050 1.450 0.050 0.075
1.905 1.775 1.150 4.425 0.050 0.225 2.175 0.075 0.100
2.54 2.325 1.975 5.275 0.075 0.525 2.950 0.125 0.150
3.175 2.650 2.675 5.800 0.100 0.925 3.800 0.150 0.150
3.810 2.825 3.250 6.225 0.125 1.425 4.650 0.200 0.200
4.445 2.950 3.700 6.625 0.125 1.925 5.450 0.225 0.200
5.080 3.025 4.025 6.800 0.150 2.375 6.150 0.300 0.225
5.715 3.050 4.300 7.100 0.150 2.750 6.725 0.350 0.275
6.35 3.050 4.450 7.350 0.175 3.000 7.225 0.400 0.300
6.985 3.050 4.600 7.550 0.175 3.200 7.625 0.500 0.350
7.620 3.050 4.650 7.775 0.175 3.375 7.925 0.600 0.400
8.255 3.050 4.650 8.000 0.200 3.475 8.150 0.650 0.450
8.890 3.050 4.650 8.200 0.200 3.625 8.400 0.750 0.450
9.525 3.050 4.650 8.400 0.225 3.700 8.575 0.850 0.500
Penetration (mm) California Standard (kN)
2.54 13.344
5.08 20.016
7.62 25.354

Katale et al. USEP: Journal of Research Information in Civil Engineering, 10(1), 2013
356
Figure 11: The California Bearing Ratio (CBR) graph (Load vs. Penetration) of Sample 0 at 0 ml of water added (control test)
0.0
0.5
1.0
1.5
2.0
2.5
3.0
3.5
0.0 2.0 4.0 6.0 8.0 10.0 12.0
Load
(kN
)
Depth of Penetration (mm)

Katale et al. USEP: Journal of Research Information in Civil Engineering, 10(1), 2013
357
Figure 12: The California Bearing Ratio (CBR) graph (Load vs.
Penetration) of Sample 0 at 100ml of water added Figures 13 and 14 show the California Bearing Ratio (CBR) graph (Load vs. Penetration) of Sample 0 at 220ml of water added and Tables 5 shows also CBR peak values at their corresponding penetration values. Figure 15 is a summary of CBR values for all the samples. Table 6 shows comparison of weights of the three clay samples
0.0
0.5
1.0
1.5
2.0
2.5
3.0
3.5
4.0
4.5
5.0
0.0 2.0 4.0 6.0 8.0 10.0 12.0
Load
(kN
)
Depth of Penetration (mm)

Katale et al. USEP: Journal of Research Information in Civil Engineering, 10(1), 2013
358
Figure 13: the California Bearing Ratio (CBR) graph (Load vs. Penetration) of Sample 0 at 220ml of water added .
Table 5a: The peak CBR values
0.0
1.0
2.0
3.0
4.0
5.0
6.0
7.0
8.0
9.0
0.0 2.0 4.0 6.0 8.0 10.0 12.0
Load
(kN
)
Depth of Penetration (mm)
Penetration (mm) CBR Values
2.54 5.275
5.08 6.800
7.62 7.750

Katale et al. USEP: Journal of Research Information in Civil Engineering, 10(1), 2013
359
Figure14: The California Bearing Ratio (CBR) graph (Load vs. Penetration) of Sample 0 at 0ml of water added (second trial run)
Table 5b: The peak CBR values
0.0
0.5
1.0
1.5
2.0
2.5
3.0
3.5
4.0
0.0 2.0 4.0 6.0 8.0 10.0 12.0
Load
(kN
)
Depth of Penetration (mm)
Penetration (mm) CBR Values
2.54 0.525 5.08 2.375 7.62 3.375

Katale et al. USEP: Journal of Research Information in Civil Engineering, 10(1), 2013
360
Figure 15: A summary of the CBR values for all the Samples
Table 6: Sample Weights comparison of three clay samples Quantity Sample 1 Sample 2 Sample 3
Initial Sample Weight (g) 1000 1000 1000 Final Sample Weight (g) 987.642 993.717 991.662 Wastage/Unaccounted for (g) 12.358 6.283 8.338
Table 7: Particle size characterization Effective Size (D10) 0.060
Uniformity Coefficient (Cu) 5.667
Coefficient of gradation (Cz) 1.255
0
1
2
3
4
5
6
7
8
9
0 2 4 6 8
CB
R o
btai
ned
at re
spec
tive
pene
tratio
ns
Optimum Moisture Content (%)
CBR at 2.54mmPenetration:CBR at 5.08mmPenetration:

Katale et al. USEP: Journal of Research Information in Civil Engineering, 10(1), 2013
361
Table 8: particle size characterization Effective Size (D10) 0.135 Uniformity Coefficient (Cu) 3.889 Coefficient of gradation (Cz) 1.146
5. Analysis of Results Particle size distribution analysis can be used to determine the following parameters for a given soil:
Effective size (D10): this is the diameter in the particle-size distribution curve relating to 10% finer.
Uniformity coefficient (Cu): this is defined as Cu = D60/D10, where D60 = diameter corresponding to 60% finer.
Coefficient of gradation (Cz): this is defined as Cz = D2
30/(D60 x D10) Tables 7 and 8show the particle size characterization of clay and cow dung for sample 1. Using AASHTO the following analysis is made as shown in Table 9 shows sample data
Table 9: Sample data Grain Size (mm) Soil Type Sample
1 Sample
2 Sample
3
Size limits greater than 4.75mm Gravel 0 0 0
Size limits between 4.75mm and 0.075mm Sand 85.16 92.78 94.59
Size limits less than 0.075mm Silt or Clay 14.84 7.22 5.41
From Table 9, it can be established that the soil samples test of a sand. It is considered that the outcome of sample 3 would be taken as a guide for classification, due to the fact that it represents the desk review and literature the best about the soil in the Okahandja area having about 5% of clay content. The composition of the sample would therefore be taken as sandy-silty soil. Also for the particle size distribution curves the following was determined as shown in Table 10

Katale et al. USEP: Journal of Research Information in Civil Engineering, 10(1), 2013
362
Table 10: Sample data D10 D30 D60 Cu Cz Sample 1 0.06 0.16 0.34 5.67 1.255 Sample 2 0.08 0.185 0.37 4.625 1.156 Sample 3 0.088 0.165 0.34 3.864 0.9099
The specific gravity of the clay sample was measured to be 2.57, which can be rounded off to 2.6. If the specific gravity is 2.6 then from the particle size analysis one can determine on average which minerals is found in the soil sample. Therefore the soil sample contains Illite, Potassium feldspar, Chlorite and Feldspar. (Table 11)
Table 11: Soil classification Liquid Limit Plastic Limit Plasticity Index
17.5 15.8 3.2
GI -1.93, hence GI = 0
Results: Silty or Clayey gravel and Sand
Inorganic Soil of Low Plasticity
Unified Soil Classification System:
coarse gained soil
Poorly graded sand and also inorganic silt
5.1 Compaction Test – Modified Proctor Test The results are shown in Table 1.
Table 12: Compaction Energy comparison for brick making machine
Quantity Modified Proctor Test
Brick Mould
Volume of Mould (m3) 0.00234 0.0021 Specific Gravity 1.72 Number of Blows: 62 50 No. of Layers: 3 3 Weight of Hammer (kN): 0.025 0.072 Height of Hammer (m): 0.30 0.12 The compaction energy for unit volume of soil in Modified test:

Katale et al. USEP: Journal of Research Information in Civil Engineering, 10(1), 2013
363
Figure16 The Optimum Moisture Content (%) and Maximum Dry
Density (kN/m3) of sample 0 – the clay control sample 5.2 The Brick Production Results The results of are shown in Figures 17 to 19 after 14 to 90days of curing – sun dried
16.5
17
17.5
18
18.5
19
19.5
20
20.5
0 5 10 15
Dry
Uni
t Wei
ght (
kN/m
3 )
Moisture Content (%)
Compactionof Clay…

Katale et al. USEP: Journal of Research Information in Civil Engineering, 10(1), 2013
364
Figure 17: After 14 days of curing – sun dried
Figure 18: After 30 days of curing – under shaded area
0
0.5
1
1.5
2
2.5
3
3.5
4
4.5
10 30 50 70 90
Com
pres
sive
Str
engt
h (M
Pa)
Clay Content Proportion (%)
0
1
2
3
4
5
6
7
10 30 50 70 90
Com
pres
sive
Str
engt
h (M
Pa)
Clay Content Proportion (%)

Katale et al. USEP: Journal of Research Information in Civil Engineering, 10(1), 2013
365
Figure 19 After 90 days of curing – under shaded area
6. Discussion and Recommendations 6.1 Samples with California Bearing Ratio (CBR) Test The outcome of the results obtained suggests that the CBR is highest, when the sample is in the region of optimum moisture content and maximum dry unit weight. A further analysis of all the test samples and the associated tables suggest that the CBR decreases as the amount of cow dung is increased across the entire sample. The cow dung has been added as a reinforcing agent; however too much of it has the effect of reducing the bearing capacity of the final brick product. 6.2 Samples after Compression Test The test outcome revealed by tables31, Table 32 and Table 33, suggests the sample with 20% cow dung content had the greatest compressive strength. The trend than shows that when more reinforcement was added, while the clay containing soil was reduced, the compressive strength also reduced as illustrated by Figure 26, Figure 27 and Figure 28. The figures show the general behavior of the samples throughout their different curing periods and curing environments, with the exception of 20% cow dung and
0
1
2
3
4
5
6
7
10 30 50 70 90
Com
pres
sive
Str
engt
h (M
Pa)
Clay Content Proportion (%)

Katale et al. USEP: Journal of Research Information in Civil Engineering, 10(1), 2013
366
80% clay containing soil, which illustrated best behavior of the mix ratios, between all the samples. 6.3 Samples after Compaction Test The analysis of table 29 until table 128, together with figure 34 until figure 152, suggests that an increase in cow dung reduces the maximum dry unit weight, and increases the optimum moisture content. The clay containing soil is by weight approximately twice as heavy as the cow dung, and by volume the cow dung is approximately twice as volumetric as the clay containing soil. 6.4 Soil and Cow Dung Classification The results reflected by tables 15 until table 24, and figure 21 until figure 24, suggests that the clay containing soil and the cow dung are very similar by particle definition although the effective size of the cow dung is slightly larger than the clay containing soil. Furthermore the soil due to its low silt or clay content is thus called clay containing soil and not a clay soil, since the clay is not the defining It is also defined as a coarse grained, poorly graded sand, and inorganic silt soil of low plasticity. 6.5. Sample Bricks The compressive strength of the bricks decreases as more cow dung is added to the mix and the clay content decrease. The more cow dung is added to the mix the longer it takes for the brick to reach its peak strength. The bricks behave like a sponge where the brick retained a large portion of the initial brick form after the bricks have been crushed which is the absolute reverse of the clay brick which completely crumbles. Samples after 14 days The sample was completely dry when the test was conducted. This could be due to the fact that the moisture escaped too quickly, and hence negatively affected the strength and bonding character of the clay and cow dung. This could mean that if the bricks were placed in an oven then the strength character could have performed worse.

Katale et al. USEP: Journal of Research Information in Civil Engineering, 10(1), 2013
367
Samples after 30 days The samples still had some moist patches present in it when crushed. The presence of moisture present in the brick reduced the overall strength of the brick which could have been more.The overall compressive strength of the bricks is however more in comparison to the other trial periods. Samples after 90 days It should be noted that even though the sample was completely dry when tested as opposed to the 30day test samples, the strength was relatively less in comparison. This could mean that the moisture (at a low percentage) does not affect the ultimate compressive strength of the respective sample, or it means that if the bricks are made with wet cow dung as opposed to dry cow dung, then the wet cow dung in its state allows for the bricks to have greater strength. 7. Conclusion and Recommendations The compression test outcome suggests that the addition of 20%
cow dung to the sample gave the greatest compressive strength. The control with 0% cow dung had the largest recorded
compressive strength, but since the study is about clay containing soil and a reinforcing fibre provided by the cow dung this value is not considered.
The results indicated that from the control, with 0% cow dung, the more the reinforcement was added, and the clay containing soil to reduced the compressive strength also reduced.
Of the three testing environments and periods, the 14 days test performed worse. The other two tests alternated between best and second best.
The 30 days test had the better average results from 0% cow dung content until 40 % cow dung content (with the exception of 30% cow dung content which had a lower average result), whereas the 90 days test had better results from 50% cow dung content onwards.
The average values are compared since the tests were conducted at random for the specific time test (30 days test for example) hence the individual points cannot be compared with the other.

Katale et al. USEP: Journal of Research Information in Civil Engineering, 10(1), 2013
368
However by comparing the lowest and highest values, it could be seen that the 90days test had a better sample performance.
This could mean that the samples have not reached their full strength potential at the time of testing and that the samples have an increase in strength as the time progresses, having an ultimate strength for the respective mix ratio.
It could also mean that the sample becomes more stable as time progresses, leading to a stable final structure.
To see how the mix ratio performs, the test could be done with more varied testing conditions, with a longer testing period such as six months or a year. One can also introduce or produce a different testing environment, such as a more humid environment which could mimic tropical environments. It would also allow for avenues of improvement by seeing what the setbacks are.
Further analysis that were not recorded during this study are information relating to the stress strain characteristics of the bricks and also the time it takes for the sample to fail. With regards to the latter, it was observed that the sample takes a longer period to fail as the fibre reinforcement is increased per sample, but no comparative data is available to compare the different samples. Sample information that was not recorded was the moisture content at which the sample failed, because by observation, some samples still had a bit of moisture when the compressive tests were conducted.
Another recommendation is that more varied tests could be introduced such as the hydrometer test, due to the fact that the soil sample had a lot of fines, which could not be defined by the sieve analyses tests conducted.
Another test worth adding is the shear box test to see how the samples behave under shear forces.
Then lastly a thermal test to see how the heat dissipates through the sample. An international claim when it comes to clay bricks is that the bricks are good thermal conductors. Thus the heat retention and the period can be established through further test.

Katale et al. USEP: Journal of Research Information in Civil Engineering, 10(1), 2013
369
References Campbell, J. W. P., & Pryce, W., (2003). Brick, A World History, Thames and Hudson, New York. Dirk Bouwens (2012) internet source: http://www.greenhomebuilding.com/QandA/adobe/localities.htm DasB.M., (2005), Fundamentals of Geotechnical Engineering, 2nd Edition, Thomson, Canada Government of the Republic of Namibia – Support to NEPAD– CAADP Implementation - TCP/NAM/2903 (I) - (NEPAD Ref. 05/38 E) - Volume II of VII, Bankable Investment Project Profile - Infrastructure Upgrade of Rural Water Supply (July 2005) Fom, P.B., Uche, A.O. &Lagasi, J.E. (2011) Effect of Cement-cow Dung on the Compressive Strength of Lateric Bricks, Journal of Science and Management, 1 (1), 31 -34. Gultrone, G., De la Torre, M.J., Sebastian, E.M., Cazalla, O. & Rodriguez-Navarro, C. (2000) Behaviour of Brick Samples in Aggressive Environments, Water, Air and Soil Pollution, 199 (1), 191 – 207. Heine, K. &Volkel, J. (2010), Soil Clay Minerals in Namibia and their Significance for the Terrestrial and Marine Past Global Change Research, African Study Monographs, Supplement 40: 31-50. Krakowiak, K.J., Lourenco & P.B., Ulm, J.F. (2011) Multitechnique Investigation of Extruded Clay Brick Microstructure, Journal of American Ceramic Society, 94 (9), 3012 – 3022. Liew, A.G., Indris, A., Samad, A., Wong, C.H.K, Jaafar, M.S. &Baki, A.M. (2004) Reusability of Sewage Sludge in Clay Bricks, Journal of Mater Cycles Waste Management, 6 (1), 41 – 47. Lopez-Arce, P., Benavente, D. & Garcia-Guinea, J. (2005) Durability Improvement of Ancient Bricks by Cementation of

Katale et al. USEP: Journal of Research Information in Civil Engineering, 10(1), 2013
370
Porous Media, Journal of American Ceramic Society, 88 (9), 2564 – 2573. Makunza, J. (2006) Strengths of Natural Soil Bricks. University of Dares Salaam, Tanzania. Okolode, O.S., Aiyedun, P.O., Raheem, D.M., Owoeye, F.T., Anyanwu, B.U. (2012), Production and Characterization of Clay-cow Dung Insulating Fire-Bricks, Research Journal of Engineering, Technology and Innovation, 1 (7), 162 – 167. Rat’kova, V.P., Yatsenko, N.D., Ivanyuta, G.N. and Necheav, P.B. (2004) Optimization of Clay Properties for Selecting Brick Moulding Method, Glass and Ceramics, 61 (2), 379 – 381. Savage, S.D., Wilson, M.A., Carter, M.A., McKay, B. and Hoff, W.D. (2008) Mass Gain due to the Chemical Recombination of Water in Fired Clay Brick, Journal of Communications of the American Ceramic Society, 91 (10), 3396 – 3398. Von Amsterdam, E. (1999), Construction Materials for Civil Engineering, Juta publishers, ISBN 0-7021-5213-7 Wienecke, M.A. (2006), The Design of the Habitat Research & Development Centre (HRDC), Windhoek. Internet Sources http://environmentdesignguide.com.au/media/EDG_66_MSa.pdf http://www.rammedearthconstructions.com.au/index.php?mp_id=1 http://ramtec.com.au/faq.php http://www.yourhome.gov.au/technical/pubs/fs513.pdf http://www.sandberg.co.uk/construction-materials/sulphate-
attack.html http://www.ebaa.asn.au/links.html#osbt http://www.dab.uts.edu.au/ebrf/ http://www.concreteconstruction.net/concrete-strength/properties-
of-hardened-concrete.aspx http://www.staff.city.ac.uk/earthquakes/MasonryAdobe/ImprovedA
dobe.htm http://www.bmrl.com.au/brick-and-block-testing http://www.sustainable.com.au/energy-efficient-construction.html

Katale et al. USEP: Journal of Research Information in Civil Engineering, 10(1), 2013
371
http://www.earth-auroville.com/ http://www.ics.trieste.it/media/137420/df4373.pdf http://www.earth-auroville.com/maintenance/uploaded_pics/02-
vikas-community-en.pdf http://www.adobebuilder.com/# http://www.gobrick.com/portals/25/docs/technical%20notes/tn9a.pd
f http://civil.iisc.ernet.in/ksnseminar.pdf http://www.radioaustralia.net.au/international/radio/onairhighlights/
adobe-house http://www.ebuk.uk.com/docs/Dissertation_Clare_Lax.pdf http://ubrisa.ub.bw:8080/jspui/handle/10311/890?mode=full http://www.riverinarammedearth.com.au/information.htm http://www.motherearthnews.com/green-homes/making-adobe-
bricks-zmaz81mazraw.aspx ftp://ftp.fao.org/docrep/fao/008/af313e/af313e00.pdf http://earthquake.usgs.gov/earthquakes/world/namibia/map.php http://www.clay-house-project.org http://www.yazd.com/ http://www.allempires.com/ http://www.buildingconservation.com/articles/earth/earth.htm www.eartha.org.uk