sc/civ. 6 and 7/2018 in the supreme court of sierra leone (civil ...
Upload
khangminh22Category
view
1download
0
Document of The World Bank
FOR OFFICIAL USE ONLY
Report No. 115408-SL
REPUBLIC OF SIERRA LEONE
PRIORITIES FOR SUSTAINABLE GROWTH AND POVERTY REDUCTION
SYSTEMATIC COUNTRY DIAGNOSTIC (SCD)
February 6, 2018
International Development Association Country Department AFCW1 Africa Region
International Finance Corporation Sub-Saharan Africa Department Multilateral Investment Guarantee Agency
Sub-Saharan African Department
Pub
lic D
iscl
osur
e A
utho
rized
Pub
lic D
iscl
osur
e A
utho
rized
Pub
lic D
iscl
osur
e A
utho
rized
Pub
lic D
iscl
osur
e A
utho
rized

i
REPUBLIC OF SIERRA LEONE
GOVERNMENT FISCAL YEAR
January 1 – December 31
CURRENCY EQUIVALENTS
(Exchange Rate Effective as of October 31, 2017)
Currency Unit = Sierra Leonean Leones
US$1.00 = 7,645.5
LIST OF ABBREVIATIONS
ABC Agricultural Business Center ACC Anti-Corruption Commission ACE Africa Coast to Europe AD Asset Declaration AfDB African Development Bank AfP Agenda for Prosperity AIDI AfDB’s Infrastructure Development Index AML Anti-money Laundering APC All People’s Congress BSL Bank of Sierra Leone CCKP Climate Change Knowledge Portal CFSVA Comprehensive Food Security and Vulnerability Analysis CFT Combating the Financing of Terrorism CSIRO Commonwealth Scientific and Industrial Research Organization DEO District Education Offices DHS Demographic and Health Survey DTIS Diagnostic Trade Integration Study EIA Environmental Impact Assessment EITI Extractive Industries Transparency Initiative EPA Environmental Protection Act ESIA Environmental and Social Impact Assessment FAO Food and Agriculture Organization FBO Farmer Based Association FDI Foreign Direct Investment FGM Female Genital Mutilation FIU Financial Intelligence Unit GBV Gender-based Violence

ii
GDP Gross Domestic Product GPI Gender Parity Index GST Goods and Services Tax ICT Information and Communication Technology IFPRI International Food Policy Research Institute IMF International Monetary Fund LC Local Council LFS Labor Force Survey MAFFS Ministry of Agriculture, Forestry, and Food Security MIROC Model for Interdisciplinary Research on Climate MCAS Mining Cadaster Administrative System MDAs Ministries, Departments, and Agencies MEST Ministry of Education, Science and Technology MMA Mines and Minerals Act MPR Monetary Policy Rate MWR Ministry of Water Resources NGO Nongovernmental Organization NMA National Minerals Agency NPL Nonperforming Loan NRA National Revenue Authority OTC Over the Counter PCR Primary Completion Rate PEFA Public Expenditure and Financial Accountability PFM Public Financial Management RUF Revolutionary United Front SCD Systematic Country Diagnostic SLIHS Sierra Leone Integrated Household Survey SLPP Sierra Leone People’s Party TDSF Transformational Development Stabilization Fund UNICEF United Nations Children’s Fund WDI World Development Indicators WDR World Development Report
Regional Vice President, IDA Makhtar Diop Vice President, IFC Sergio Pimenta Vice President, MIGA Keiko Honda Country Director, IDA Henry G. R. Kerali Regional Director, IFC Cheikh Oumar Seydi
MFM Poverty Governance Senior Directors Carlos Felipe Jaramillo Carolina Sanchez-Paramo Deborah Wetzel Directors Paloma Anos Casero James Brumby Practice Managers Abebe Adugna Andrew Dabalen George Larbi Task Team Leaders Mamadou Ndione Kristen Himelein Kastelic Deborah Isser

iii
ACKNOWLEDGEMENTS This report was prepared by a team led by Kristen Himelein (Senior Economist/Statistician, GPV07); Deborah Isser (Lead Governance Specialist, GGO19); and Mamadou Ndione (Senior Economist, GMF01), with additional contributions from Elizabeth Foster (Consultant, GPV07); Inder Sud (Consultant); and Cyrus Talati (Senior Economist, OPSPQ). The team gratefully acknowledges the overall guidance of Henry Kerali (Country Director, AFCW1); Parminder Brar (Country Manager for Sierra Leone, AFCW1); Andrew Dabalen (Practice Manager, GPV07); Abebe Adugna (Practice Manager, GFM01); Kathleen Beegle (Program Leader, AFCW1); Errol Graham (Program Leader, AFCW1); and Ivo Imparato (Program Leader, AFCW1). The table below identifies the full list of team members that have provided written comments to the Systematic Country Diagnostic. The peer reviewers were Kevin Carey (Lead Economist, GMF07); Ruth Hill (Senior Economist, GPV01); and Edouard Al Dahdah (Senior Public Sector Specialist, GGOOS).
Table of Input Providers
Global Practice/ Cross Cutting Solutions Area
Input Providers
Agriculture Hardwick Tchale Education Peter Darvas, Andaleeb Jahan Alam, Kaliope Huck-Aziz,
Ibironke Folashade Oyatoye Energy and Extractives Daniele La Porta, Jianping Zhao, Nash Fiifi Eyison Environment and Natural Resources Jingjie Chu Finance and Markets Nicholas Smith, Cari Votava, Michael Corlett Governance Don Mphande, Helene Marie Grandvoinnet Health, Nutrition, and Population Shiyong Wang, Francisca Ayodeji Akala Macroeconomic and Fiscal Management Kemoh Mansaray, Sona Varma, Santiago Herrera, and
Kevin Carey Poverty Ambar Narayan, Ruth Hill, Elizabeth Foster Social Protection and Labor Stefano Paternostro, Suleiman Namara, Nina Rosas Raffo Trade and Competitiveness Kaliza Karuretwa Transport and ICT Olatunji Ahmed Social, Urban, Rural and Resilience Gregory Wilson Myers, Linus Potts Water Dominick Revell de Waal Fragility, Conflict, and Violence Luigi Giovine, Vishal Ashvin Patel, Neelam Nizar Verjee Public-Private Partnerships Climate Zhihong Zhang Gender Daniel Kirkwood, Niklas Buehren Jobs IFC Frank Ajilore, Giima Mabel Lavaly

iv
TABLE OF CONTENTS
Executive Summary ...................................................................................................................................vii
Introduction.................................................................................................................................................. 1
Chapter 1: Country Context ....................................................................................................................... 3 Geography and Natural Resources ............................................................................................................ 3 The People of Sierra Leone ....................................................................................................................... 3 Governance and Institutions ...................................................................................................................... 4
The Resilience of the Patrimonial Political Settlement ......................................................................... 4 The Challenge of Public Sector Institutions ........................................................................................ 11
Chapter 2: Progress on Shared Prosperity ............................................................................................. 17 National Development Strategy ............................................................................................................... 17 Trends in Poverty ..................................................................................................................................... 17
Chapter 3: Drivers of Growth and Risk to Sustainability ..................................................................... 24 Postwar Drivers of Growth ...................................................................................................................... 24 Risk to Sustainability of Current Economic Growth and Poverty Reduction Patterns ........................... 27
Chapter 4: Future of Shared Prosperity ................................................................................................. 29 Strengthening the Productivity of the Agricultural Base ......................................................................... 29
Opportunities ....................................................................................................................................... 29 Constraints ........................................................................................................................................... 30
Diversifying the Economy and Creating Poverty-Alleviating Jobs......................................................... 33 Constraints ........................................................................................................................................... 36 Opportunities ....................................................................................................................................... 45
Strengthening the Management of Mineral Resources ............................................................................ 50 Increasing Human Capital for New Opportunities .................................................................................. 54
Opportunities ....................................................................................................................................... 55 Constraints ........................................................................................................................................... 56
Chapter 5: Prioritization ........................................................................................................................... 71 Criteria for Selection ................................................................................................................................ 71 Foundational Issues ................................................................................................................................. 72 Mitigating the Impact of Governance Constraints on Development ....................................................... 72 Fiscal Constraints..................................................................................................................................... 73 Possible Policy Interventions ................................................................................................................... 74 Foundational issues .................................................................................................................................. 75
Mitigating Overarching Governance Constraints ................................................................................ 75 Alleviating Fiscal Constraints.............................................................................................................. 76
Specific Priority Areas ............................................................................................................................. 76 Strengthening the Productivity of the Agricultural Base ..................................................................... 76 Diversifying the Economy and Creating Poverty-Alleviating Jobs..................................................... 79 Strengthening the Management of Mineral Resources ........................................................................ 83 Increasing Human Capital for New Opportunities .............................................................................. 85

v
Chapter 6: Risks ........................................................................................................................................ 89 Fragility.................................................................................................................................................... 89 Political Risks .......................................................................................................................................... 90 Environmental Risks ................................................................................................................................ 90
Chapter 7: Knowledge Gaps ..................................................................................................................... 92
Annex 1: Recent World Bank Group Reports and Papers on Sierra Leone ....................................... 94
Annex 2: Recent Reports and Academic Papers from Outside the World Bank Group .................... 98
Annex 3: Government Documents ......................................................................................................... 102
Annex 4: Poverty Headcount and Distribution of the Poor, 2011 ....................................................... 103
LIST OF FIGURES
Figure 1: Evolution of Urbanization in Sierra Leone, 1967 to 2015 ............................................................. 4 Figure 2: 2017 WDR, Conceptual Framework .............................................................................................. 7 Figure 3: Governance Indicators ................................................................................................................. 11 Figure 4: World Governance Indicators ...................................................................................................... 12 Figure 5: Percentage of Respondents Reporting They Paid a Bribe for Access to Service in the Past 12 Months ......................................................................................................................................................... 13 Figure 6: Percentage of Respondents Who Feel that ‘Most’ or ‘All’ People in These Institutions Are Corrupt ......................................................................................................................................................... 13 Figure 7: Poverty Headcount (2003 and 2011) ............................................................................................ 18 Figure 8: Sectoral Contribution to Poverty Reduction (percentage points) ................................................ 19 Figure 9: Imported Rice Prices, International Prices, and the Exchange Rate ............................................ 19 Figure 10: Imputed Poverty at the Subdistrict Level (2015) ....................................................................... 21 Figure 11: Estimated Change in Poverty Since 2011 .................................................................................. 21 Figure 12: Projected Reductions in Poverty, 2011 to 2016 ......................................................................... 22 Figure 13: Mean Per Adult Equivalent Consumption by Decile ................................................................. 23 Figure 14: World Price of Iron Ore (US$ per MT) ..................................................................................... 24 Figure 15: Per Capita GDP Growth (Annual %) ......................................................................................... 26 Figure 16: Per Capita GDP for Selected Countries (US$ Current) ............................................................. 26 Figure 17: Contribution to GDP Growth by Sector ..................................................................................... 26 Figure 18: Decomposition of Agricultural Growth by Land Use and Productivity .................................... 26 Figure 19: Contribution to Economic Growth by Factor Input (average 2001–2014) ................................ 27 Figure 20: Labor Productivity (Value Added Per Worker) Growth by Sector ............................................ 27 Figure 21: GDP per Capita and Value Added per Worker (projection 2016–2030) ................................... 28 Figure 22: Value Added per Worker by Sector (projection 2016–2030) .................................................... 28 Figure 23: Cereal Yield, Average 2010–2014 (kg/ha) ................................................................................ 30 Figure 24: Constraints Reported by Farmers ............................................................................................... 31 Figure 25: Yield under Climate Change of Rain Fed Rice .......................................................................... 33 Figure 26: Relative Share of Renewable and Nonrenewable Resources (average 2001–2016) .................. 34 Figure 27: Relative Share in Renewable Resource Sector (average 2001–2016) ....................................... 34 Figure 28: Labor Market by Type of Employment ..................................................................................... 34

vi
Figure 29: Labor Market Employment by Sector ........................................................................................ 34 Figure 30: Composition of the Service Sector (average 2002–2015).......................................................... 36 Figure 31: Employment in Western Area by Sector (average 2002–2015) ................................................. 36 Figure 32: Evolution of Exports, Revenue, and Expenditure (in % of GDP) ............................................. 37 Figure 33: Evolution of Inflation Rate and Depreciation Rate (year-on-year basis) ................................... 37 Figure 34: Evolution of Credit to Government and Private Sector ............................................................. 37 Figure 35: Evolution of Interest Rates Applied by Commercial Banks ...................................................... 37 Figure 36: Infrastructure Development Index ............................................................................................. 38 Figure 37: Credit to Private Sector in Percentage of GDP (average 2011–2015) ....................................... 43 Figure 38: Most Problematic Factors for Doing Business ........................................................................... 44 Figure 39: Evolution of Rice Balance Sheet (in tons of milled rice)........................................................... 48 Figure 40: Change in Exchange Rate and Evolution of Market Share for Rice Imports ............................ 48 Figure 41: Mining Value Added and Income Paid to Non-residents (% of GDP) ...................................... 51 Figure 42: Potential and Actual Revenue from Mining (% of GDP) .......................................................... 51 Figure 43: Volatility of Selected Macroeconomic Variables, Measured as Standard Deviation Calculated in 2006–2015 ............................................................................................................................................... 53 Figure 44: GDP per Capita and Human Development Index ...................................................................... 55 Figure 45: Gross Primary Enrollment Ratio ................................................................................................ 57 Figure 46: Gross Secondary Enrollment Ratio ............................................................................................ 57 Figure 47: Attendance Gaps ........................................................................................................................ 59 Figure 48: Infant Mortality Rate (per 1,000 live births) .............................................................................. 61 Figure 49: Under-five Mortality Rate (per 1,000 live births) ...................................................................... 61 Figure 50: Life Expectancy at Birth ............................................................................................................ 61 Figure 51: Maternal Morality Ratio (per 100,000 live births) ..................................................................... 61 Figure 52: Health Expenditure, Public and Private, 2014 (% of GDP) ....................................................... 62 Figure 53: Health Spending by Expenditure Category ................................................................................ 63 Figure 54: Evolution of the Dependency Ratio for Selected Countries ...................................................... 64 Figure 55: Probability of Enrollment (by Gender) and Probability of Pregnancy ...................................... 68 Figure 56: Percentage of Women Agreeing that Wife Beating Is Justified for Any of Five Reasons ........ 69 Figure 57: Government Resources (% of GDP) .......................................................................................... 73
LIST OF BOXES
Box 1: Key Concepts from the 2017 WDR, Governance and the Law ......................................................... 7 Box 2: The Demographics of Democracy ..................................................................................................... 8 Box 3: Ebola in Sierra Leone ....................................................................................................................... 16 Box 4: Compliance with International AML/CFT Obligations ................................................................... 43 Box 5: Illegal, Unreported, and Unregulated Fishing Activities in Sierra Leone ....................................... 49
LIST OF TABLES
Table 1: Summary of Fiscal Regime in Sierra Leone .................................................................................. 52 Table 2: Summary of Key Policy Interventions by Thematic Area ............................................................ 74

vii
EXECUTIVE SUMMARY
1. The objective of this Systematic Country Diagnostic (SCD) is to describe the current development challenges facing Sierra Leone and offer a set of priority areas of intervention to accelerate growth and help achieve the World Bank Group twin goals of reducing extreme poverty and boosting shared prosperity. In the 15 years since the end of the civil war in 2002, there has been notable progress. The return to peace and stability and the ample availability of fertile land facilitated recovery and growth in agriculture. Urban areas have become local trading and commercial centers, and the capital of Freetown has seen many sources of new wealth and development. Poverty significantly declined from 66 percent in 2003 to 53 percent in 2011, and access to basic services improved, particularly in education and health. The Government has also been successful in attracting large-scale foreign investment in mining and agriculture, though the overall contribution of these sectors to fiscal revenue and job creation has remained limited. Despite this progress, Sierra Leone’s economic system remains vulnerable, with large imbalances in the distribution of resources, political power, and knowledge. This SCD looks beyond the standard growth and poverty reduction narratives and takes a holistic approach to identify the underlying causes of previous poor growth performances, drawing on both the history of Sierra Leone in the post-colonial period and the conceptual framework developed in the 2017 World Development Report (WDR): Governance and the Law. The result is a proposed set of priority areas to promote sustainable and inclusive growth that synthesize the latest evidence, economic theory, and the current political realities in Sierra Leone.
2. The SCD is an evidence driven exercise that draws together diverse findings into a comprehensive country diagnostic. As part of the process, the SCD team undertook a comprehensive data and literature review covering both quantitative and qualitative evidence (see annexes 1 through 3.) Where gaps were identified, the SCD team attempted to add to the evidence base through new analysis on primary data or by drawing lessons from comparable countries. The SCD process also involved stakeholder consultations with government, civil society, private sector, and citizens of Sierra Leone to incorporate their perspectives. Throughout the process, the SCD team worked closely with World Bank Group sector experts to understand better complex relationships within or between sectors. Those areas in which the team still found the evidence base incomplete have been identified as priority areas for future research and are discussed in the Knowledge Gaps section.
3. The SCD argues that, without taking into account the two main foundational constraints—governance and fiscal space, it is unlikely that the proposed technical solutions will make a substantial impact on the twin goals. Many of the technical solutions that are proposed in this document have been tried in multiple variations over the last 60 years by government, donor partners, and other stakeholders, but the results have been meager. Despite favorable geography and abundant resources, and after hundreds of millions of dollars in soft loans and grants, smart consultants, sound technical approaches, Sierra Leone continues to have development outcomes that rate among the worst in the world. This SCD argues that unless governance constraints are understood and mitigated this situation is unlikely to change very much. It further takes into account severe fiscal constraints in proposing ways to alleviate this while also avoiding reforms that require substantial financial outlays. If the two foundational issues are appropriately addressed, the priority technical interventions proposed here have the potential to unlock growth, reduce poverty, and improve the lives of the Sierra Leonean population.
Sierra Leone’s main assets are abundant resources and a young and dynamic population.
4. Sierra Leone has a highly advantageous geography and abundant renewable and nonrenewable natural resources. The country possesses significant renewable natural resource endowments in land, forests, and fisheries. Almost 75 percent of the total land area is arable, and rainfall and sunlight are abundant. The country’s rainfall, soil, sunlight, and river basins endow the country with

viii
land of high natural fertility, considered suitable for a wide variety of food and cash crops with potentially high crop yields. With more than 400 km of coastline, Sierra Leone has abundant and varied fish resources. The country is also well-endowed with mineral resources. There are extensive alluvial and kimberlitic diamonds, bauxite, rutile, and gold deposits, as well as large quantities of iron ore.
5. The country’s population is young, diverse, urbanizing, and rapidly growing. According to the 2015 census, the population of Sierra Leone is approximately 7.1 million, with 45.8 percent of the population under the age of 15, and 74.8 percent below the age of 35. The share of the population living in urban areas almost doubled from 21 percent in 1967 to almost 40 percent in 2015, with a high concentration in the capital Freetown, which has grown to a population of more than 1 million. Sierra Leone has a diverse population for its size. There are 16 ethnic groups in the country, though two-thirds of the population belongs to the two main ethnic groups: the Temné, which comprise about 35 percent of the population, live in the north; and the Mendé, with 31 percent population share, live in the south and east.
Contemporary governance and institutions reflect path dependencies and a persistent logic of neopatrimonialism.
6. Despite the shocks of independence, authoritarianism, and civil war (1991–2002), there is marked continuity in the political settlement that underlies the nature of governance and institutions and their ability to deliver development outcomes. British control of the Sierra Leone Colony relied on a system of indirect rule that manipulated customary governance structures to promote paramount chiefs charged with maintaining social order, collecting taxes, and allocating land and resources, to facilitate the extractive colonial regime. Independent Sierra Leone inherited an overly centralized, bureaucratically weak state and mass rural poverty. The preservation of the ‘traditional’ authority structure was a form of elite bargain that helped extend the reach and authority of the state to the interior through patrimonial relations. With a weak central state, paramount chiefs were able to accumulate considerable power as political brokers, which they used to grant their supporters access to residence and land use. Both main political parties—the Sierra Leone People’s Party (SLPP) and the All People’s Congress (APC)—have cultivated a mutually beneficial patronage system with local elites, with the SLPP dominating in the largely ethnic Mendé southern and eastern regions, and the APC dominating in the Temné/Limba majority north and west. This patronage and identity-based party system enables politicians to rely on a comfortable base of popular support, undermining the potential effect of electoral competition and collective action.. At the same time, strategies to appease a young and underemployed urban population call for short-term clientelism in the form of suboptimal—and unsustainable—subsidies. This basic logic survived the period of APC authoritarian rule, economic collapse, and the ensuing civil war.
7. The reestablishment of democracy and maintenance of a stable peace since 2002 is a remarkable achievement. While there are important signs of institutional development, incentives to govern and establish a social contract based on a long-term commitment to the public good have yet to emerge. Decentralization, launched in 2004 as a flagship initiative to shift key policy arenas away from the sharp ethnic divide of national politics and to correct the severe pre-war power imbalances and regional inequalities, has fallen short of critical aims. Elected Local Councils (LCs) have been established, but their ability to deliver decentralized services is compromised by incomplete reform efforts, their politicization, and the continued power of paramount chiefs and other local elites. Strengthening accountability for public resource management and building the foundations for an effective public administration have made some inroads, but are frequently met with resistance. Sierra Leone ranks well below the regional average on indicators of government effectiveness, regulatory quality, rule of law and control of corruption (WGI 2016). Sierra Leone ranks 130 out of 137 economies on the Global Competitiveness Index 2017.Modernization of legislative frameworks for mining, procurement, and anti-corruption has progressed, but implementation lags far behind. (Global Integrity, Africa Integrity Indicators 2017). The power asymmetries that account for continuing inability of the state credibly to commit to needed land and

ix
fiscal reforms, and to induce the coordination and cooperation needed effectively to deliver on its promised free maternal health care initiative is perhaps best evidenced by the appalling outcomes in these sectors.
Poverty has decreased in Sierra Leone in the postwar period.
8. The most recent household survey, the 2011 Sierra Leone Integrated Household Survey (SLIHS), estimated the incidence of poverty to be 53.8 percent. This represents a 12.6 percentage point decrease from 66.4 percent in 2003, the first statistic available following the end of the civil war. However, the number of poor remained nearly constant, at around 3.3 million, over this period due to high population growth. Despite a decrease from 79 percent in 2003 to 66 percent in 2011, poverty in Sierra Leone remains disproportionately rural, with more than three-quarters of the poor living in rural areas in 2011. The decline in rural poverty was mainly driven by gains made by agricultural households, though a small percentage of nonagricultural rural households experienced greater poverty reduction. The largest changes in poverty headcount occurred in urban areas outside of the capital Freetown, where rates declined from 70.9 percent in 2003 to 39.9 percent in 2011. Half of the overall decline (6.5 of the 12.6 percentage points) was recorded in ‘other urban’ areas, excluding Freetown. These areas contributed almost the same to the overall national poverty reduction as rural areas, although they had only one-third of the population. Freetown was the only area to experience a significant increase in poverty between 2003 and 2011, from 14 to 21 percent, but poverty rates remain well below the rest of the country. The increase in poverty in Freetown is believed to have been mainly driven by three factors: in-migration, the slow creation of well-paid jobs, and inflation.
9. Economic growth between 2003 and 2011 was pro-poor, but higher growth or higher pass-through of growth to poverty reduction are needed to meet future poverty reduction targets. As evidenced by a comparison of annualized growth rates for per capita expenditure adjusted for purchasing power parity, the growth rate was the highest for the poorest decile of the distribution and steadily declined toward the wealthiest decile. Overall inequality fell between 2003 and 2011 with the Gini coefficient declining from 0.39 to 0.32 over the period. The overall decrease in inequality can largely be attributed to the measured fall in prosperity in Freetown and by rural areas catching up with urban areas. Despite this, higher growth rates or higher pass-through of growth to poverty reduction are required to meet the Government’s national development targets. Starting from a baseline of 2011, poverty would have to be reduced at a rate of 14 percent per year to achieve the target of 3 percent in 2030. At the current predicted levels of the pass-through of gross domestic product (GDP) growth to poverty reduction, this would require growth of almost 15 percent per year, which is well above the current forecasts of 5–6 percent for the next several years. Therefore, to meet its poverty reduction objectives, Sierra Leone must accelerate growth and continue to ensure that growth benefits the poor.
There was steady growth in the postwar period until 2014, after which there was a severe contraction due to the collapse of iron ore production and the impact of Ebola on Sierra Leone.
10. Sierra Leone experienced a steady increase in income per capita from 2001 to 2014, its longest period since independence in 1961. Per capita GDP went from stagnating in the period from independence to the civil war and contracting 3.4 percent on average per year between 1991 and 2001 (civil war) to increasing 5.9 percent on average per year from 2002 to 2014 (post-civil war period). Economic growth was driven mainly by agriculture. Between 2001 and 2014, agriculture (including livestock, forestry, and fisheries) grew by an average of 8 percent per year, contributing almost 50 percent to the total increase in real GDP over this period. According to Food and Agriculture Organization (FAO) data, crop production increased by an average of 12.5 percent per year during the period, driven mainly by an increase in land use and, to a lesser extent, improvement in yield per hectare. Industry was the second largest contributor to growth, driven mainly by two large-scale iron ore mining projects that began production in 2011. Services increased by 5.8 percent per year during this period.

x
11. Sierra Leone’s period of steady growth ended in 2015, as the country was severely affected by the twin shocks of the Ebola outbreak and the downturn in international iron ore prices. The economy contracted by more than 20 percent due to the spread of the Ebola epidemic and after both iron ore mining operations ceased production due to low international prices. Iron production declined by 84 percent in 2014 and growth in the rest of the economy slowed to near zero, with the services sector being particularly hard-hit. Growth resumed in 2016 following the end of the Ebola outbreak and the return to operation of the largest iron ore mine.
There are four pathways and two foundational areas by which Sierra Leone can accelerate growth and reduce poverty. The four pathways are: (a) strengthening the productivity of the agricultural base; (b) diversifying the economy and creating poverty-alleviating jobs; (c) strengthening the management of mineral resources; and (d) increasing human capital for new opportunities. The two foundational areas are: (i) mitigating overarching governance constraints; and (ii) alleviating fiscal constraints. The pathways and foundational areas should be seen as a whole and not as stand-alone separated parts. There are several linkages between them that reflect the existing complementarities.
Strengthening the Productivity of the Agricultural Base
12. Agriculture is the main source of livelihood in Sierra Leone, particularly for the poor, and therefore improving agricultural outcomes for food security and rural income generation is at the core of poverty alleviation. Agriculture also employs more than half of the country’s formal and informal workforce and accounts for about half of GDP. The recent Diagnostic Trade Integration Study highlighted a competitive advantage for import substitution of rice and palm oil production if productivity could be increased, as well as potential expansion of processed cassava cash crop production for export markets. Therefore, increasing the productivity of the agricultural sector provides direct channels for both economic growth and poverty reduction.
13. Productivity is constrained by failures in input markets. Yields are well below their productive frontier for the climatic conditions and soil fertility due to low uptake of modern seeds, chemical and organic fertilizers, and mechanization. The cause of low uptake is a combination of ineffective and inefficient intervention by the Government in input markets, a lack of access to credit, and nonexistent insurance markets to lower risk. This leads to increases in the overall costs of production, reduced farmer margins on sales, and insufficient production to meet both household consumption and commercialization objectives. The traditional system of land tenure is also unequal, with women, youth, and migrants from outside the community less able to access land, and perceived to reduce tenure security, impeding long-term investment.
14. Output markets are not sufficient to promote sales and rural income. Less than 40 percent of rice-growing households sold any of their crop during the 2014/2015 agricultural season. Sales are constrained by poor storage, a lack of rural roads linking rural areas to Freetown and other urban centers, and insufficient processing facilities. Farmers also face competition from inexpensive imported food, particularly during boom periods in the mining sector when the appreciation of the Leone makes imports comparatively less expensive. Even when the exchange rate is not an issue, tariff waivers for rice—put in place during the 2008 food crisis—keep imported prices artificially low, further damaging competitiveness of local agriculture produce.
Diversifying the Economy and Creating Poverty-alleviating Jobs
15. To boost shared prosperity, Sierra Leone must create poverty-alleviating nonfarm jobs outside the mineral sector, especially for youth and women. Each year, more than a hundred thousand people move from rural to urban areas in search of employment and better living conditions. In the absence

xi
of well-paid formal manufacturing and services jobs, almost nine in ten of these Sierra Leoneans end up in the highly vulnerable informal sector. Employment growth in the formal sector is slowed by a myriad of constraints in doing business, including high macroeconomic volatility, low access to electricity, high transportation and communication costs, competition from imports and state-owned enterprises, lack of access to credit, and an unfavorable regulatory environment, while productivity is extremely low in the informal sector.
16. Decisions made by private enterprises are influenced by several macroeconomic variables, such as the aggregated demand, the inflation rate, the exchange rate, tax rates, and the interest rate. As the single largest purchaser of goods and services, the state is a vital source of business for companies in Sierra Leone. However, because of the uncertain contribution of the mining sector to government revenue, public expenditures have been traditionally volatile, making market projections and investment planning at the level of the firm very difficult. In addition to the high volatility of aggregate demand, the exchange rate policy makes it more difficult for local firms to compete with imports.
17. Sierra Leone’s infrastructure deficit in energy, transport, and information and communication technology (ICT) impedes private sector investment by increasing costs and preventing links between internal and external markets. According to the African Development Bank (AfDB), the country’s infrastructure compares poorly to the rest of Sub-Saharan Africa, and it was ranked 46 out of 54 countries on the AfDB’s Infrastructure Development Index (AIDI) in 2016. Access to electricity is currently only about 10 percent of the total population, of which 95 percent is located in Freetown. The transport system consists of an estimated 11,311 km of roads, with only 1,325 km of paved roads, representing 11.5 percent of the total road network. Mobile phone use is rapidly growing in Sierra Leone, increasing from 34.8 mobile cellular subscriptions per 100 people in 2010 to 89.5 per 100 in 2015. The 2015 Comprehensive Food Security and Vulnerability Analysis (CFSVA) estimated that 56 percent of households had at least one mobile phone, an increase from 39 percent of households as recorded by the 2011 SLIHS.
18. Access to capital appears to be a binding constraint to the entry of new entrepreneurs as well as for existing businesses. Only 15 percent of the adult population has an account with a formal institution, which is lower than the average of 24 percent in Sub-Saharan Africa and low-income countries while only 6 percent of the adult population has received a loan from a formal institution, which is in line with the regional average but lower than the 11 percent average for low-income countries.
19. Sierra Leone lacks adequate and relevant labor policy and legislation, and there are no comprehensive regulations for labor market operations in the country. Many of the important laws regulating the labor market in Sierra Leone date back to 1960, a year before independence, and need to be modernized to provide greater flexibility. These include the Employers and Employed Ordinance and the Trade Unions Ordinance.
Strengthening the Management of Mineral Resources
20. Despite employing only 1.5 percent of the workforce, the mining sector plays an important role in Sierra Leone’s economy. From 2012 and 2014, the extractive industry boomed in Sierra Leone to represent 14 percent of GDP on average per year, up from 3.7 percent in 2009–2011, and accounts for 70 of merchandize exports, up from 38 percent in 2009–2011. These performances were mainly driven by the starting of operation in two large-scale iron ore companies attracted by the high level of iron ore prices and the reform of the mining sector. Sierra Leone modernized the legislative framework for the mining sector, which improved the overall governance in the sector.

xii
21. However, the boom did not translate into commensurate welfare improvement of Sierra Leone citizens. Not only the share of the mining sector remained low in total employment (1.5 percent), but the Government revenue mobilized from the extractive industry remained well below potential. If Sierra Leone’s fiscal regime for the mining sector was fully implemented, revenue collected between 2012 and 2014 would have reached 11.8 percent of GDP, more than triple the actual revenue collected in the period (3.7 percent of GDP). This could have financed better growth, higher social spending and built stronger resilience. For example, higher revenue from mining could have increased public expenditures on education and health by more than 40 percent. Most of the counter-performance reflects the weakness remaining in the legal and regulatory framework. The 2009 Mines and Minerals Act (MMA) and 2011 Petroleum Act are rife with inconsistencies, leaving the Government and license holders to rely on highly interpretive and often personalized agreements on operating terms. In such a weak governance environment, this leaves the door wide open to corruption.
22. In addition, the recent evolution of the mining sector has increased the volatility of the economy. Sierra Leone is one of the most volatile economies in the world. Between 2013 and 2015, GDP growth fluctuated from −21.1 percent to +20.7 percent, inflation rate ranged from −35 percent to +22 percent, and exchange rate depreciation varied from −0.2 percent to +17.5 percent, while Government current expenditure ranged from 10 percent to 21 percent of GDP. These ranges are much wider in Sierra Leone than in Liberia or Guinea (the two neighboring countries impacted by the twin shocks).
Increasing Human Capital for New Opportunities
23. To create the conditions for economic growth and poverty reduction, Sierra Leone must invest in its people, particularly the poor. Improving human capital, however, will require a dramatic increase in the quality of public services. Better public service delivery has impacts on poverty and income in the short, medium, and long term. In the short term, better public service provision will free up household resources previously used to purchase these services in the private sector, allowing for increased consumption or for productive investments. This alone can improve outcomes, as lack of funding or capital was identified as the main reason for not sending children, particularly girls, to school and a key reason for not starting or expanding businesses and farming activities. In the medium term, an increase in human capital resources on the national level will improve the business climate, boosting the output of private sector activities and the attractiveness of Sierra Leone for future investment. Improved health also reduces days lost to illness, increasing the supply of labor for agriculture or informal nonfarm enterprises. Better services in rural areas can also reduce migration to urban areas that are already under pressure to provide basic services and jobs. In the long term, a healthy and educated population will constitute an attractive workforce for new foreign direct investment (FDI) in the manufacturing and service industries or increased domestic entrepreneurial activities. In parallel to the development of the public sector, there is also scope for more effective Government engagement with non-state actors who are providing primary health and basic education services, with the Government potentially playing a catalyzing role in coordinating across stakeholders in health and education as well as leading policy and standards.
24. In the education sector, there are issues of both access and quality. One in three Sierra Leonean children is out of school, and gaps in access remain for those in rural areas and for girls at higher levels. Access is not the only issue; quality and relevance of instruction are lacking. Scores on international tests show very low levels of achievement, even when compared to regional neighbors and countries with comparable income levels. A recent higher education study concluded that links between higher education institutions and employers were weak and often ad hoc. Private sector stakeholders have difficulties in finding ‘employable’ graduates, and there is an acute shortage of technicians, such as auto repair mechanics and welders; health professionals, including doctors, nurses, birth attendants, and other health workers; science and math teachers; and those with skills in applied sciences, technology, and engineering.

xiii
25. Health outcomes are among the worst in the world despite high levels of private spending. Sierra Leone has the lowest life expectancy at birth in the world (at 50 years) and the worst maternal and child mortality rates in the world, with one death for every 100 births. Poor health affects economic growth as well as the ability of households to increase their incomes. Insufficient access to contraception, along with lower levels of female education, job opportunities, and empowerment, results in high fertility, which leads to a vicious cycle, as it strains public service delivery, constrains women’s time and empowerment, and limits the resources available to invest in individual children. Labor lost to poor health lowers farm productivity, particularly in labor-intensive agricultural activities, and poor access to health has been identified as one of the major reasons for the high prevalence of food and nutrition insecurity in Sierra Leone. Health shocks also limit households’ ability to save and invest, including in income-generating assets. In addition, Sierra Leone has extremely high out-of-pocket expenditures. This burden falls disproportionately on the poor, as out-of-pocket health payments are regressive and the poor are more likely to forgo health care.
26. Progress in the water and sanitation sectors has been mixed. Access to improved water increased nationally in the postwar period but has seen a decline in urban areas in recent years. Access to improved sanitation in Sierra Leone has been constant, at 13 percent of the population in the postwar period (UNICEF and WHO 2015), which is low compared to other countries in the region; open defecation is prevalent in the country, particularly in rural areas and fecal sludge disposal remains a major issue, particularly in Freetown. Poor sanitation, combined with food insecurity; inadequate caregiving resources at the maternal, household, and community levels; and limited access to health services leads to high levels of malnutrition and stunting among Sierra Leonean children. The consequences of stunting in young children include delayed schooling, poor educational performance, and less years of completed education, which increases the chances of them having low incomes and becoming trapped in poverty later in life.
Prioritization
The SCD identifies two foundational areas and nine sectoral priority areas for Sierra Leone to accelerate growth, and support poverty reduction and shared prosperity.
27. In selecting a set of strategic priorities, the SCD uses four main considerations. The first assesses the level of each potential intervention’s expected impact on the twin goals of eliminating extreme poverty and promoting shared prosperity. The second assesses the potential impact of each intervention on medium- to long-term growth acceleration. The third assesses complementarity, that is, the degree to which progress on a given objective will positively influence other objectives. The fourth evaluates the feasibility of specific priorities in terms of the possibility that the political, financial, and social constraints could be sufficiently addressed. In line with the 2017 WDR, this consideration takes into account the potential for the policy arena to be reshaped through the levers of contestability; elite incentives; and the ideas, preferences, and beliefs of participants in the policy arena. It also takes account of how, over time, policy outcomes might alter the underlying distribution of power to allow for a broader range of policy options in future.
Foundational Areas
28. The SCD argues that progress on the pathways to development must take into account two foundational issues: governance and fiscal space. The former must be understood as a long-term condition, rather than as a time-bound constraint. The shift from extractive to inclusive institutions (Acemoglu and Robinson, 2012) will take place over time in response to a variety of endogenous and exogenous shocks. In the meantime, the challenge is to identify opportunities to promote outcomes that in turn can reshape a developmental link between demand and incentives of those in power. The constraint of fiscal space manifests in a time-bound way, given the dependence of the country on natural resource

xiv
revenues, but is the result of underlying fiscal and economic policy failures. The SCD highlights key dimensions of and priority interventions to mitigate these constraints, while they are also carried through in the analysis of the specific sectoral priorities.
Mitigating Overarching Governance Constraints
29. The perverse incentives and poor equilibrium in governance are a major determinant of policy effectiveness. These incentives are the product of historical path dependencies that have been self-reinforcing, creating a logic of centralist, patrimonial methods of exercising power and managing relations between state and society. As documented by several scholars, these conditions disincentivize the need to invest in a capable bureaucracy and the provision of public services and corruption is entrenched as part of the rent distribution that keeps the political settlement intact.1 Mitigating governance constraints will require efforts to institutionalize rule-based mechanisms while enhancing the endogenous demand for a more inclusive social contract. Tackling public sector reform directly requires an adaptive, incremental, and opportunity-driven approach. Over time, progress on these technical areas may serve to shift incentives and promote accountability, and while this may elicit resistance, sustained incremental efforts on select reform priorities will pay off.
Priority 1: Strengthen accountability and contestability in key sectors. Elite capture and corruption happens at all levels and can be reduced by increasing the risk of exposure and strengthening accountability in institutions. Some forms of corruption are ‘transactional’ in nature—in other words, they are inherent to the political settlement. Others are ‘predatory’, or opportunistic in nature, making efforts to mitigate them more feasible. On the latter, it is important to improve the collection of information, the capacity to analyze it, and share results in the public domain. Also critical is the creation of spaces for participation, deliberation, and contestation in ways that can level the playing field and counter power asymmetries. Sierra Leone has already experimented with social accountability and legal and paralegal services on a relatively small scale and has developed a few important entry points for scaling up and institutionalizing these services, through the Legal Aid Act and the National Land Policy, for example. Targeted investments to enable citizen collective action and increase transparency and accountability could serve to change incentives in ways that improve results and equity in agriculture input markets, health service delivery, and land acquisition processes.
Priority 2: Incentivize functional solutions to improve public administration and effective local governance. While initial expectations of LCs have been dampened by a series of policy decisions, the incomplete transfer of authority and resources, and the re-institutionalization of the chieftaincy, local governance remains an important site for increasing accountability and service provision to citizens. Incremental reforms to increase the effectiveness of LCs by deepening administrative and fiscal decentralization should be complemented by efforts functionally to improve coordination between LCs and chieftaincy and accountability of local officials for the provision of public goods. Building on promising evidence that increasing voter information can break down traditional partisan voting patterns, efforts to increase accountability to citizens can not only improve the provision of public goods but could also begin to reshape the social contract. Engaging in these
1 See for example, Van de Walle, Nicolas (2005). Democratic Reform in Africa. United States: Lynne Rienner Publishers. Regarding Sierra Leone in particular, see Robinson, James A. 2008. Governance and Political Economy Constraints to World Bank CAS Priorities in Sierra Leone. Washington, DC: World Bank.

xv
generative dynamics at the local level may yield results more immediately than pushing formal reforms from the top down.
Alleviating Fiscal Constraints
30. Sierra Leone’s Government faces huge fiscal constraints. Fiscal space is narrow because of: (a) the low level of tax revenue (below 12 percent of GDP in 2016, mining royalties included) extracted from a narrow tax base, as agriculture and mining, the two biggest sectors of the economy, are not appropriately taxed, and widespread exemptions further limit the tax base; (b) the declining level of aid as a share of GDP (from 5.2 percent in 2015 to 2.5 percent in 2016), as donors perceive the country as suffering from weak governance and widespread corruption; (c) the small domestic banking and financial sector, which limits domestic borrowing; and (d) the high level of nondiscretionary spending, which absorbs almost all domestic revenue (for example, 60 percent of all tax revenues goes to salaries). Alleviating fiscal constraints is critical for the improvement of the country’s macroeconomic framework, and has been identified as one of the constraints to economic diversification and poverty-alleviating job creation (Pathway 2).
Priority 1: Strengthen Domestic Revenue Mobilization. Getting to and sustaining high investments in human and physical capital is difficult to achieve without an enhanced domestic revenue mobilization. Mobilizing more domestic revenues is the long-term solution to creating fiscal space, and the process has already started in Sierra Leone with the creation of the National Revenue Authority (NRA). However, there are few opportunities that could generate additional revenue in the short to medium term. These include reducing the generous level of tax exemptions and tapping of the existing mineral sector. However, this is unlikely to happen unless the country significantly improves the overall governance of the mining sector, including adopting and enforcing credible legal, administrative, and institutional frameworks through amendments to the mining code. While this may be politically difficult, it is an opportunity to align key incentives to increase domestic revenues in the currently constrained fiscal space.
Priority 2: Improve efficiency of public spending and value for money. Bottlenecks in public financial management (PFM) and procurement lead to inefficient public spending in priority sectors. Greater efficiencies and higher value for money can be achieved through improvements in budgeting (enhanced allocative efficiency), procurement, and financial management, including reporting and oversight. Sierra Leone has built a good legal and regulatory framework that serves as the foundation for PFM. However, the country’s financial management systems continue to operate in an inadequately reliable manner because of weak implementation. A new PFM framework was enacted in 2016 and became effective in January 2017. To better implement the new act, there are several issues that would need to change to render the desired impact. There needs to be considerable institutional change and capacity development across central government and requisite ministries, departments, and agencies (MDAs). On procurement, the Government has decided to implement e-procurement to increase. While resistance to reform can be expected, the approach should be to focus sustained incremental efforts initially on areas that do not directly threaten vested interests and on systematically promoting practical implementation.
Priority Areas
31. The SCD has identified nine priority areas of potential intervention to address the binding constraints to increased economic growth and poverty reduction in Sierra Leone. Many of the suggested interventions have arguably been tried and tested in the past, with disappointing results. The two foundational areas discussed earlier should be considered critical to the success of the technical interventions listed below. The priorities are listed one through nine for presentation purposes, but the order

xvi
does not reflect their relative importance or suggested sequencing. They should be seen as a whole since many are interrelated.
Priority 1: Reforming the role of the Ministry of Agriculture, Forestry, and Food Security (MAFFS) in the provision of agricultural services. To boost productivity and encourage the widespread adoption of modern, high-quality agricultural inputs, a new role should be defined for MAFFS. A main constraint to increased utilization is a state-led delivery system, mainly through MAFFS, that is inefficient, subject to corruption, and crowds out the private sector. A shift to the private sector in input delivery will free up resources to be redirected to quality control of imported inputs, to take the lead on a national campaign of research and development for products better tailored to Sierra Leone, and to expand agricultural extension services.
Priority 2: Improve market opportunities for producers. Expanded use of modern inputs has the potential of lowering production costs, increasing margins and drawing new participants into the market, but further intervention is necessary to realize the full potential. Improving rural incomes requires increased sales and profit for farmers. For import substitution to occur, farmers must be able to process and transport their crops to urban consumers. Processing facilities are limited, and anecdotal evidence suggests that elite capture is rife. In addition, a more extensive network of rural roads is required to reduce transportation costs to Freetown and other regional centers from poorer and more remote rural areas. Beyond decreasing production and marketing costs, higher and more stable prices will increase incomes for sellers. A plan to reduce and eventually remove the tariff waivers for imported rice is key to increasing producer prices and the long-term health of domestic production, but it must be coupled with further investments in domestic production and offsetting social transfers to mitigate the short- and medium-term poverty impacts.
Priority 3: Strengthening macroeconomic stability. The fluctuations in growth, inflation, exchange rate, government spending, and aggregate demand are very high in Sierra Leone and significantly affect the enterprises’ decision making and prevent optimal allocation of resources. Most of this volatility emanates from the mining sector. A stabilization fund is the most common mechanism used by governments and/or central banks in resource-rich countries to insulate the domestic economy from large fluctuation in revenue. The principal motivation is maintaining a steady and predictable path of government expenditure that is commensurate with existing absorption capacity, which fosters macroeconomic stability and sustainability. The Government has taken steps in this direction but it could go further. The new PFM Act (2016) created a Transformational Development Stabilization Fund (TDSF), which now needs to be implemented. Also, the Government should completely eliminate its interventions, particularly in the period of higher influx of mineral revenue, that tend to further appreciate the local currency. In addition, Goods and Services Tax (GST) exemption on electricity was eliminated and import duty, excise tax, and GST on fuel were reinstated after a long period of fixed fuel retail prices that eroded the collected taxes. The Government should now let the retail prices of fuel float to protect the tax base and put the Government fiscal position on a sustainable footing.
Priority 4: Improving access to infrastructure (energy, transport, and ICT) and credit and improving labor market regulations. Diversifying the Sierra Leonean economy and creating poverty-alleviating jobs will require substantial improvement of the country’s business environment. Enterprises face huge constraints when doing business in Sierra Leone, including poor access to electricity, roads, ICT, and credit. Revenue from the mining sector should be invested in priority areas to update the infrastructure platform of the country while deepening financial intermediation could boost access to credit and stimulate private sector growth.
xvii
Priority 5: Promote vertical diversification. Sierra Leone should also tap its potential for vertical diversification by promoting the development of rice and fish value chains. An attractive price policy plays a critical role in developing the rice value chain in Sierra Leone. A first step toward developing the value chain is to provide a good incentive package for private sector involvement both upstream and downstream of the value chain. One element of the incentive package could be the reduction and eventual elimination of the tariff waiver on imported rice (15 percent) to increase the competitiveness of locally produced rice. In addition, the Government should maintain an exchange rate policy that does not harm the agriculture sector by making cheaper imported food compared to locally produced agricultural products. In addition, the Government could reinforce the feeder road network. Farmers have limited access to transportation facilities because of inadequate level of all-weather rural roads to enable easy delivery of produce to processing centers or markets.
Priority 6: Maximize revenue from the mining sector in a sustainable way. Sierra Leone should review its legal and regulatory framework for the mining sector. The revision of the legal and regulatory framework, matched with human and institutional capacity development and practical strategic planning are required for efficient management of the sector and adequate revenue mobilization. In particular, the fiscal regime of the extractive sector should be grouped under one piece of legislation, preferably the tax code. This would clarify the tax rates applied to mining companies and increase the transparency of the fiscal regime. Based on the revised legal framework, Sierra Leone would be able to renegotiate existing mining contracts to reduce tax exemptions.
Priority 7: Manage the volatility from the mining sector. Overall, public expenditures should be rooted in a sound macro-fiscal framework to avoid the deleterious effects of commodity price volatility and to prevent real exchange rate appreciation and non-targeted subsidies or investment spending boom not modulated to the absorptive capacity of the economy. As proposed earlier, a stabilization fund is the most common mechanism to ensure a predictable path of government expenditure that is consistent with existing absorption capacity. The TDSF should be made quickly operational with clear fiscal rules, to make the country ready for saving during the next commodity boom cycle. Sierra Leone should also develop its Public Investment Management Framework so that investment projects will be well prepared and implemented in a transparent and cost-effective manner.
Priority 8: Improving quality and access to health care. Sierra Leoneans need better access to quality health care, particularly maternal and child health services. Though health outcomes have improved in the postwar period, Sierra Leone still ranks as the worst in the world in maternal mortality, child mortality, and overall life expectancy. The inability of the health system to provide quality health care to the population leads to both poor outcomes and high expenditures on over-the-counter (OTC) drugs and private care. Given the current fiscal constraints, however, investments should focus on improving the efficiency of spending (including reducing staffing absenteeism, reducing corruption, and better coordination within public sector but also with the nonpublic sector providers of health services, such as nongovernmental organizations (NGOs); overall quality improvements (including preventing drug stock outages); and regulation (including quality controls on imported OTC medication). Supporting infrastructure such as rural roads, electricity, reliable mobile networks, and clean water supplies and sanitation are also important components to improving health systems. In addition, improving the systems for disease surveillance, pandemic preparedness, and rapid response would not only protect individual lives but may also bolster investor confidence by decreasing perceived risk.

xviii
Priority 9: Improve quality and access to education. Better schools, better access for marginalized groups, and a more relevant curriculum are the key priorities in the education sector. Learning outcomes indicate that nearly all schools suffer from issues related to quality (not only public schools). As with health, there is a sizable presence of nongovernment schools, and the Government needs to engage with non-state actors to raise and maintain standards. Large gaps between urban and rural areas still exist, as does the gender gap at the secondary and tertiary levels. In addition, technical skills are at the core of improving individuals’ employment outcomes and increasing countries’ productivity and growth, and both the education and vocational training systems should be better aligned with the needs of employers. Interventions that can have maximum impact on quality of learning are improved supervision and accountability mechanisms (including those to reduce teacher absenteeism) and incentives to improve school and teacher performance, updating and realigning the curriculum, enhancing pedagogical skills for teachers, better measurement and dissemination of school and student performance, and strengthening the links to employers for higher education and the technical and vocational education and training (TVET) network.

xix
Objective: Boost inclusive economic growth and poverty reduction
Pathways
Diversifying the economy and
creating poverty-alleviating jobs
• Strengthen macroeconomic stability
• Improve business environment
• Promote vertical diversification
Strengthening the management of
mineral resources
• Maximize revenue from the mining sector in a sustainable way
• Manage the volatility from the mining sector
Increasing human capital for new opportunities
• Improve quality and access to health care
• Improve quality and access to education
Foundational Issue 1: Mitigating the impact of governance constraints
Foundational Issue 2: Alleviating fiscal constraints
Poverty Reduction and Shared Prosperity
Strengthening the productivity of the agricultural base
• Reform the role of the MAFFS in provision of agricultural services
• Improve market opportunities for producers
Constraints
• Instability in macroeconomic climate and poor business environment
• Limited physical infrastructure and human capital
• Lack of efficiency and accountability in public sector
Opportunities
• Highly advantageous geography • Abundant renewable and nonrenewable natural
resources • Young, diverse, and urbanizing population

1
INTRODUCTION
1. The objective of this Systematic Country Diagnostic (SCD) is to describe the current development challenges facing Sierra Leone and offer a set of priority areas of intervention to further the twin goals of reducing extreme poverty and boosting shared prosperity. In the 15 years since the end of the civil war, there has been notable progress. The return to peace and stability and the ample availability of fertile land facilitated recovery and growth in agriculture. Urban areas have become local trading and commercial centers, and the capital of Freetown has seen many sources of new wealth and development. Poverty declined significantly in this period, falling from 67 percent in 2003 to 53 percent in 2011. Access to basic service provision, including education and health, has improved following a substantial injection of donor resources but remains among the poorest in the world. The Government has also been successful in attracting some large-scale foreign investment in mining and agriculture, though less than neighboring Liberia and the overall contribution of these sectors to fiscal revenue and job creation has remained limited. Despite this progress, Sierra Leone’s economic system remains vulnerable, with large imbalances in the distribution of resources, power, and knowledge. As in the first two decades after independence, economic growth in the postwar period continues to be volatile. Output, employment, exports, imports, and government revenue fluctuate with the production and price of minerals, particularly diamonds and iron ore. This has led to a complex relationship between stakeholders and trapped the country in a low growth-poor governance equilibrium. At the same time, poverty rates remain high, with the majority of the population being unable to meet minimum standards of living. Previous diagnostics have focused on technocratic solutions to individual issues or sectors and have been largely unsuccessful in fostering durable growth. This SCD takes a more holistic approach to identify the drivers of previous poor growth performances, drawing on the history of Sierra Leone in the post-colonial period, and proposes a set of priority areas to promote durable and inclusive growth.
2. The SCD relied on the existing literature, new analysis, and diverse consultations to define and refine the priorities for Sierra Leone. The SCD is designed to be an evidence driven exercise that draws together diverse findings into a comprehensive country diagnostic. As part of the process, the team reviewed scores of documents, including survey findings, reports, project documents and journal papers, written by the World Bank, the International Monetary Fund, other bilateral and multilateral donors, think tanks, civil society organizations, non-governmental organizations, and academia, covering both quantitative and qualitative evidence. (See annexes 1 through 3 for a list.) Where gaps were identified, the team attempted to add to the evidence base through new analysis on primary data or by drawing lessons from comparable countries. The SCD process also involved stakeholder consultations with government, civil society, private sector, and citizens of Sierra Leone to incorporate their perspectives. Throughout the process the SCD team worked closely with World Bank sector experts to better understand complex relationships within or between sectors. Those areas in which the team still found the evidence base incomplete have been identified as priority areas for future research and are discussed in the Knowledge Gaps section.
3. Sierra Leone’s state of economic development and prospects for shared prosperity need to be understood as a function of its unique country context. From a technical perspective, traditional constraints on growth and poverty reduction are well-rehearsed and common to other countries in the region of similar income level. As this SCD will highlight, a range of priority reforms can help alleviate those constraints and put the country on a path toward greater diversification and productivity to manage macro-fiscal volatility and improve human development outcomes. Unleashing these reforms, however, will require addressing the overarching constraint of governance—that is, the path dependencies, incentives, and elite power relations that shape the country’s ability to commit to needed reforms and induce the coordination and cooperation needed to carry them out. This SCD applies the framework developed in the 2017 World Development Report (WDR): Governance and the Law to analyze ways that governance constrains progress toward the twin goals, to explain the strong persistence of these constraints, and to identify possible entry

2
points for promoting reform in light of these constraints, to shift to a governance arrangement conducive for achieving the country’s development goals.

3
CHAPTER 1: COUNTRY CONTEXT
4. Sierra Leone’s current economic development and poverty dimensions are shaped by the country’s geography and natural resources, its people and demography, and the interaction of these two with the governance and political institutions that have evolved since independence. This section provides an overview of these three key elements, as they are key to understanding the country’s current development context.
GEOGRAPHY AND NATURAL RESOURCES
5. Sierra Leone has a highly advantageous geography and abundant natural resources. The country is located on the west coast of Africa and is bordered on the north and northeast by the Republic of Guinea, on the east and southeast by the Republic of Liberia, and on the west and southwest by the Atlantic Ocean. It has access to one of the largest and deepest harbors in the world. The country possesses significant renewable natural resource endowments in land, forests, and fisheries. Almost 75 percent of the total land area of about 72,300 km2 is arable. Rainfall is abundant and is highest at the coast, 3,000–5,000 mm per year, and decreases progressively inland to 2,000–2,500 mm at the eastern border. There is an average of 2,187 hours of sunlight per year or an average of 6 hours of sunlight per day. The country contains 12 river basins, including Kolente, Kaba, Rokel, Pampana, Sewa, Moa, and Mano. Internal renewable water resources are estimated at 160 km3 per year, with surface water accounting for 150 km3 per year. Rainfall, soil, sunlight, and river basins endow the country with land of high natural fertility, considered suitable for a wide variety of food and cash crops and high crop yields. With more than 400 km of coastline, Sierra Leone has abundant and varied fish resources and is endowed with diverse species of finfish, shellfish, and wetland resources.
6. The country is also well-endowed with mineral resources. Extensive alluvial and kimberlitic diamond deposits as well as bauxite, rutile, and gold have been found in the east and south of the country. Gold, iron ore, and more recently bauxite have also been discovered and exploited in the north. Known mineral deposits include approximately 14.5 billion MT of iron ore, 4.7 billion MT of magnetite, 108 million MT of bauxite, 867 million MT of rutile, 11.2 million carats of diamonds, and 4.5 million ounces of gold (Sierra Leone National Mineral Agency, February 2017). According to the last Extractive Industries Transparency Initiative (EITI) report (February 2016), Sierra Leone produced 654,000 MT of bauxite in 2013, 3,700 ounces of gold, 10.6 million MT of iron ore, 32,500 MT of ilmenite, 1,22,400 MT of rutile, 158,500 MT of zirconium, and 612,400 carats of diamonds. Though this level of diamond production represents a substantial decline from the estimated 40 million carats that were either exported or smuggled out of Sierra Leone in the three years preceding independence, it remains an important resource, particularly for artisanal mining.
THE PEOPLE OF SIERRA LEONE
7. Sierra Leone has a diverse population for its size. Although there are 16 ethnic groups in the country, two-thirds of the population belongs to two ethnic groups of roughly equal size. The Temné, which comprise about 35 percent of the population, live in the north, and the Mendé, with 31 percent population share, live in the south and east. The Western area, including the capital Freetown is more diverse, due to in-migration and urbanization.
8. Urbanization has been a continuing trend over the last five decades. The share of the population living in urban areas almost doubled from 21 percent in 1967 to almost 40 percent in 2015, with a high concentration in the capital Freetown, which currently has 15 percent of the total population. From 127,000 people (6 percent of the total population) in 1963, the population of Freetown exceeded 1 million in 2015, with a density exceeding 3,000 people per km2. District populations have generally been increasing steadily

4
since independence, with the exception of Kono, which has experienced a decrease in its population in light of the decline in artisanal mining.
9. The country’s population is young and growing rapidly. According to the 2015 census, the population of Sierra Leone is approximately 7.1 million. This represented an average annual increase of 3.2 percent between 2004 and 2015, higher than the 1.8 percent growth rate observed between 1985 and 2004, though this period included the civil war (1991–2002). The population is 49 percent male and 51 percent female. Currently, 45.8 percent of the population is under the age of 15 and 74.8 percent below the age of 35, leading Sierra Leone’s dependency ratio to be the 26th highest among 194 countries in the world. The 2013 Demographic and Health Survey (DHS) recorded an average of 4.9 births per woman, though for the poorest women, the numbers were substantially higher with 6.1 births per woman for those in the lowest wealth quintile.
Figure 1: Evolution of Urbanization in Sierra Leone, 1967 to 2015
Source: World Bank Group World Development Indicators (WDI) (2016).
GOVERNANCE AND INSTITUTIONS
The overarching constraint to Sierra Leone’s achievement of development outcomes relates to the incentive structures that underlie the process of governance. These developed as the independent government sought to build a state shaped by a deep colonial legacy that produced a highly centralized but weak bureaucracy, mass poverty, and regional inequalities. The patrimonial system that emerged governs through networks of elites, including the chieftaincy, and clientelistic strategies have hindered investment in a capable bureaucracy and long-term public goods. The postwar period has seen remarkable success in the establishment of a peaceful democracy. But conditions have not yet sufficiently changed to shift governance toward more developmental strategies. Instead, the danger is that the country is locked in a recursive dynamic whereby power and poverty are self-reproducing. Until this changes, reform strategies will need to be incremental and opportunistic.
The Resilience of the Patrimonial Political Settlement
10. The historical antecedents of Sierra Leone’s socioeconomic and institutional evolution are important to understand contemporary governance and institutions. The interplay between structural factors—in particular demographics of ethnicity, the urban-rural divide, and a primarily agrarian economy overlaid by mineral extraction—and sociopolitical institutions, comprising ‘traditional’ (chieftaincy)

5
systems and a formal state government, have created strong path dependencies that continue to shape the contemporary policy arena. The neo-patrimonial patterns through which the state has exercised political power and managed the state-society relationship—initially in the absence of a viable alternative—have proven resilient, surviving the transition to independence, the civil war, and the more recent institutionalization of electoral democracy. While there are important signs of institutional development, incentives to govern and establish a social contract based on a long-term commitment to the public good have yet to emerge.
11. Sierra Leone was founded in the late eighteenth century as a safe haven for freed and escaped slaves. The settlement of Freetown and its immediate peninsular area were brought under direct British control in 1808 as the Sierra Leone Colony. The settlers, the Krios, were at first detached from the peoples of the interior, but a trading relationship developed between them, resulting in other forms of societal interaction. At that time, customary laws, enforced by local chiefs over relatively decentralized tribal groups, governed social and economic activities in Sierra Leone. In 1896, Britain declared the colony’s hinterlands a protectorate, delineating the greater country’s boundaries.
12. The colonial period was marked by a division between the ‘colony’ of greater Freetown and the protectorate. The colonial state structure was largely extractive and relied on a system of indirect rule that manipulated customary governance structures, fostering both north-south and urban-rural divisions. The colony was ruled by a locally elected council and a governor representing the monarch, with formal government institutions and a commercialized economy. The protectorate was subject to ‘indirect rule’, whereby a district commissioner was responsible for the district administration in close collaboration with traditional authorities. From the early days of colonial rule, traditional authorities were given influence over the population by institutionalizing paramount chiefs. These district chiefs were elected for life from designated ruling houses and made responsible for maintaining social order, collecting taxes, and allocating land and resources (Acemoglu, Chaves, Osafo-Kwaako and Robinson 2014). This system undermined traditional checks and balances and downward accountability of the imperfect traditional chieftaincy by combining the executive, legislative, and judicial power in the paramount chiefs and instrumentalizing them to enhance central control. Particularly in diamond mining areas, the chiefs’ control of access to land created patrimonial dependencies that entrenched a generational divide, where youths were an exploitable labor source for the elders. This system was self-replicating: youth depended on the decisions of elders for economic opportunities rather than their own agency; questioning leadership of elders meant possible loss of livelihood (Fanthorpe, Lavali and Sesay 2011).
13. Unlike in many other post-colonial African countries, colonial methods in Sierra Leone survived independence and were adapted to underpin the governing strategy of the independent government. General elections gave the interior the upper hand over the small economically strong Krio community of Freetown and its surroundings. The Sierra Leone People’s Party (SLPP) rose to power by appealing to this larger base, institutionalizing a symbiotic relationship with chiefs and their ability to exercise control—and now deliver votes—of their constituents. Specifically, when Milton Margai, Head of the SLPP, was elected the first prime Minster of the country following independence, his power base was almost entirely the paramount Chieftaincy (Acemoglu, Chaves, Osafo-Kwaako, and Robinson 2013). Even today, the country outside of Western Area is divided into 190 chiefdoms.2 In sum, independent Sierra Leone inherited an overly centralized, bureaucratically weak state and mass rural poverty. The preservation of the ‘traditional’ authority structure was a form of elite bargain that helped extend the reach and authority of the state to the interior through patrimonial relations. It also enabled chiefs to accumulate considerable power as political brokers, which served to suppress mass political mobilization. Chiefs used their power to grant their supporters access to residence and land use. In addition, local customary courts operated based on uncodified customary law and made arbitrary rulings (Zhou 2009).
2 In July 2017, the President de-amalgamated a number of chiefdoms, increasing the total number from 149 to 190.

6
14. While the SLPP cultivated its base among the southern Mendé groups, the All People’s Congress (APC) arose a few years later on a populist platform that decried SLPP cronyism and neglect of the relatively deprived north. Yet, the APC adopted similar tactics, cultivating its base among the Temné and Limba from the north and controlling the trade of alluvial diamonds mined in the Kono District in the east through alliances with the local chiefs. The APC also developed strong links to commercial interests—primarily the Lebanese—in Freetown. Furthermore, the party made use of state power to co-opt the security forces, judiciary, and the press to service its own interests. The state became an instrument of wealth accumulation and political disloyalty was punished with exclusion. Exhibiting increasingly authoritarian tendencies, APC leader Siaka Stevens became the Executive President of the Republic of Sierra Leone in 1971. He abolished local governments the following year and accentuated the entrenchment of clientelism through preferential treatment of individuals with power bases, including paramount chiefs who supported him. In 1978, a referendum approved Stevens’ proposal for a new, one-party constitution.
15. The combination of authoritarian centralization of power in Freetown, regional inequalities, increasingly arbitrary and predatory behavior of some paramount chiefs, and severe economic contraction paved the way to increased grievances, culminating in the 1991–2002 civil war. The depletion of Kono diamonds in the 1980s diminished revenues and destabilized the patronage system, accompanied by a series of attempted coups. The exchange rate became massively overvalued, creating a black market and a ‘shadow state’ (Reno 1995). Gross domestic product (GDP) per capita fell almost monotonically from the early 1970s, and civil servants, teachers, and even chiefs were not being paid by the late 1980s. Corruption was widespread, with the governing elite in Freetown seen to be profiting greatly at the expense of the rural outlying areas, and the authoritarian tendencies of state actors and chiefs magnified popular discontent (Robinson 2008). A climate of insecurity developed, leading to a strengthening of the state security forces and other state-sponsored militias. In 1991, civil war was ignited by the Revolutionary United Front (RUF), a rebel army led by a former army corporal, Foday Sankoh, and backed by the Liberian militia leader, Charles Taylor. Initially comprising a small group of people disgruntled by state and economic contraction—former government workers, secondary school dropouts, and workers in the parallel economy—the RUF conscripted—often by force—significant numbers of rural youths. The conflict that followed continued for 11 years, fueled by notorious ‘blood diamonds’, and was characterized by acts of extreme brutality, an estimated 50,000 deaths, and widespread displacement.
16. Under the auspices of the Economic Community of Western African States Monitoring Group, multiparty democracy was restored with the election of the SLPP in 2002 and the peaceful transfer of power to the APC in 2007. The two main political parties reemerged in the postconflict period, with Ahmad Tejan Kabbah of the SLPP reelected President in 2002.3 In 2007, a significant benchmark of democracy was reached, as the opposition leader Ernest Bai Koroma of the APC was elected and took office through a peaceful transition of power. Despite localized political violence between SLPP and APC supporters in the 2009 and 2011 local and parliamentary elections, the 2012 poll which reelected President Koroma was widely regarded as free and fair by international observers.
3 Technically, multiparty democracy was restored by the 1991 Constitution. Kabbah’s SLPP was elected in 1996, ousted by the Armed Forces Revolutionary Council coup in 1997, and restored to power in 1998. There was a formal declaration of peace in January 2002 and Kabbah was reelected the following May.

7
Box 1: Key Concepts from the 2017 WDR, Governance and the Law
The 2017 WDR addresses the questions of why governments fail to adopt and implement technically required policies despite knowing them and why first best policies may fail to achieve their intended goals. The report argues that policy effectiveness is a function of governance—that is, the process by which actors with different relative power and incentives bargain over the ways resources, responsibilities, and rights will be distributed in what the report calls ‘the policy arena’. Both de jure rules as well as de facto and informal norms, shaped by the interaction between socioeconomic conditions and the evolution of political institutions, determine who has a seat at the table and what their incentives are. It will be difficult to deliver on policies aimed at the general public good as long as the policy arena is characterized by the exclusion of key groups, dominance of certain elites who capture policies to promote their narrow interests, or clientelist strategies whereby elites ‘buy’ their hold on power. Specifically, short-term interests of maintaining power and stability may limit the ability of governments to credibly commit to longer-term policies and induce coordination and cooperation among those needed to implement change. As the framework diagram shows in Figure 2, the relationship between outcomes, which shape power, and the creation of development policies is highly endogenous and persistent (right side of the diagram), but it is not static. History is full of instances in which societies have improved rules, institutions, and processes that have helped them move closer to reaching their development goals (left side of the diagram). Change happens by shifting the incentives of those with power, reshaping their preferences and beliefs in favor of positive outcomes, and taking into account the interests of previously excluded participants, thereby increasing contestability. These changes can be brought about as shocks and gradual structural changes reshape power relations and incentives, by agency of elites who strike power bargains, through greater citizen engagement, as well as through international actors whose efforts can influence the relative ability of domestic coalitions to push for reforms.
Figure 2: 2017 WDR, Conceptual Framework
17. While the postwar period has been marked by important progress and reforms, power asymmetry, capture, and clientelism limit the functional ability to deliver on needed change and lock the country into a low-growth and poor-governance equilibrium. The civil war was devastating, and the restoration of peace and democracy was a truly remarkable achievement. However, the civil war was not driven by previous or present elites but rather by an external rebel movement that failed to capture the consciousness of the people, who instead were largely victims of looting and atrocities. While there is some evidence that the war has led to an increase in political engagement, the continued underdevelopment of robust social organization and the absence of sophisticated economic systems have muted demand for a new social contract. Thus, more striking than the changes in the postwar political system is the resilience of political incentives for centralist, patrimonial methods of exercising power and managing relations between state and society (Robinson 2008). This situation reflects the classic ‘politician’s dilemma’ (Geddes 1994) between improving development performance and ensuring political survival. From a politician’s perspective, investing in long-term policies and autonomous capacity to deliver public goods does not pay off in the short term. Instead, the prevailing incentive is to shore up support through strategies that are clientelistic, which reinforces the existing power balance in the society.

8
Box 2: The Demographics of Democracy
The overwhelming dominance of two political parties, the APC and SLPP, which continue to be heavily aligned with ethnicity, undermines the performance of Sierra Leone’s ‘political market’. In all three of the postconflict presidential and parliamentary elections, the dominant pattern has been that constituencies in both rural and urban areas vote in proportion to their ethnic makeup.
Figure B2.1: Election Results by District (2002, 2007, and 2012)
Source: Calculations based on data from the National Elections Commission.
As demonstrated in Figure B2.2, elections of Members of Parliament follow the same pattern as Presidential elections. This is facilitated by the fact that MPs are elected on a single member plurality vote (first past the post) in constituencies that until recently were entirely contiguous with chiefdoms. Nor has decentralization broken partisan politics, as was its initial promise. The theory was that in areas that are relatively homogenous, candidates would have to compete based on their ability to perform. However, the decision that candidates must affiliate with political parties, coupled with the lack of transparency in the candidate selection process, has made local government mirror that of the center.

9
Figure B2.2: Share of Vote in Member of Parliament, LC, and Presidential Elections, 2012
Source: Calculations based on data from the National Elections Commission. These ethnic/region-party alignments are not, however, completely immutable. In 2002, the charismatic SLPP candidate, Tejan Kabbah, who had also been President during the war, carried a few northern and western districts with majority Temné/Limba (and hence traditional APC supporter) population. Disaffection within and with the ruling party has also made a difference. In 2007, a third party, People’s Democratic Movement for Change (PDMC), split the vote with the SLPP in a few districts in the first round of Presidential elections. Significantly, there is some evidence from the 2012 LC elections that increasing voter information about candidates can relax ethnic and party loyalty. These findings indicate that where electoral competition is more intense, politicians respond with increased provision of local public goods (Casey 2015).4 The extent to which increased transparency and voter information can break the current identity-based equilibrium remains an open question.
18. The two political parties continue to be strongly identified with their regional ethnic base even though ethnicity was not a fault line during the conflict (Bangura 2004) (Box 2). Instead, the ethnic dimension is perhaps a proxy for more nuanced networks of local-center bargains, cultivated through the instruments of indirect rule and underpinned by the dependency of the agrarian population on local elites. The vast majority of rural Sierra Leoneans still obtain primary rights of residence, land use, and political representation as natives of chiefdoms rather than citizens of the state (Fanthorpe 2005). Significantly, research shows that despite the perceived role of chiefs in unleashing the civil war, rural citizens by and large consider their chiefs to be legitimate, especially relative to ‘strangers’—that is, those not native to the locality (Fanthorpe, Lavali, and Sesay 2011). This relative local trust enables parties to rely on a comfortable base of popular support based on identity, undermining the potential effect of electoral competition and collective action. It facilitates the continued reliance of central politicians on the chieftaincy as a means of extending power and control as well as the regional divide between the APC and SLPP. This in turn provides disincentives for the need to invest in a capable bureaucracy and the provision of public services.
19. Launched as a flagship initiative to correct the severe prewar power imbalances and regional inequalities, the decentralization program has struggled to deliver. The program had strong momentum when it was launched in 2004, as it was bolstered by an alignment between government incentives to reestablish control over the country and strong donor support for shifting power away from central authority, identity politics, and unaccountable chiefs and toward locally elected councils. By 2007, Sierra
4 These findings are in line with Khemani 2016.

10
Leone had a fully functional tier of 19 elected LCs, comprising 13 districts and 6 cities that were funded by an intergovernmental fiscal transfer system and responsible for 80 functions to be devolved over time. Three elections for local councilors have taken place, resulting in the election of several women as well as members of smaller ethnic groups, such as Kono, Loko, and Sherbo.
20. There is scant evidence of improvements in service delivery. A large part of the problem is the partial implementation, in which planning and administrative functions are retained by central ministries, intergovernmental transfers are unreliable and even when they do flow there is very little discretionary funding, and Local Councils lack direct revenue sources. In addition, from 2009, however, a series of measures undermined the effectiveness of LCs, including the freeze and then drastic reduction in the transfer of chiefdom revenues to LCs, the reintroduction of district officers and consequent demotion of LCs from political authorities to development authorities, the retention of planning and administrative functions by central ministries, the unreliable flow of intergovernmental transfers, and the appointment of paramount chiefs as chairs and members of Parliament as members of ward development committees. The inability of LCs to meet local demands has led to allegations of corruption. Donors have also largely stepped back, citing the lack of government commitment as the reason.
21. Local governance has emerged as a highly-contested space of power and resource allocation. Rather than using the decentralization process to displace or reform the chieftaincy, the Government reinforced the power and role of the chiefs. This deliberately created tensions and incoherence at the local level, which in turn facilitated continued centralized control (Acemoglu, Robinson, and Verdier 2004; Fanthorpe, Lavali, and Sesay, 2011). The decision to have LCs elected on party lines is further evidence of central control and reduces the space for the emergence of a new class of leaders. As such, decentralization may also be a factor in maintaining stability as it mitigates the zero-sum game at the center, extends the possibility of patronage, and provides the opposition with a continued stake in the game. Whether deliberate or not, this has generated a sense of commitment that keeps the key stakeholders in the system rather than outside (Conteh 2017).
22. Decentralization has thus made substantial contributions to state building while falling short of critical aims. To the extent that the country is stable and largely free of violent political conflict, Sierra Leone has made tremendous progress over the past decade of postconflict recovery, graduating from a society torn by strife to one of the more stable democracies in the region. Decentralization has been used effectively as a tool for building the capacity of the state, establishing the legitimacy of institutions, and improving the effectiveness of the public sector. However, political decentralization and stability were not the only goals of the postconflict stabilization strategy. Indeed, Sierra Leone’s progress is threatened by the lingering ailment of the inefficient and horizontally unequal distribution of critical social services. Formal implementation of decentralization is incomplete. This is expected, as major redistribution of power will face resistance. This contestation plays out in different ways in different areas: local councilors have succeeded in obtaining resources from the central government for improving service delivery (with scant evidence of actual improvement), citizen collective action has sometimes been effective in directing resource allocation, and chiefs and LCs have sometimes worked in complementary ways to deliver public goods (Fanthorpe, Lavali, and Sesay, 2011). The future impact of decentralization may depend on understanding and fostering the conditions under which accountability to citizens can be expanded in this fraught space.
23. In urban areas, with a concentrated population of unemployed (and underemployed), the logic of governance is somewhat different. The APC has tried to win support by investing in public services—notably roads and electricity—and offering a combination of public sector employment, fuel subsidies, and lower cost of imported rice through tariff waivers and an overvalued exchange rate. Even though having some people vote based on government performance can be interpreted as a good sign, the fact that they are concentrated in Freetown raises the specter of a reinforced urban bias (Robinson 2008)

11
These public initiatives have emerged in part to appease the underemployed urban youth, which might pose the greatest threat to stability (see Bates 1980). Enabled by the 2009 commodity boom, these subsidies have come at the expense of both macroeconomic and fiscal stability and investment in rural development. The 2016 austerity measures, instituted as a response to the sharp loss in revenues from both the Ebola crisis and the fall in commodity prices, have required substantial cuts in expenditure, increases in electricity and water tariffs, and the removal of the petroleum subsidy. These measures have been met with outrage in urban areas, raising concerns about unrest and possible widespread rioting.5
24. At the same time, the pressure to deliver effective services and policies is compromised by a low information environment, absence of informed debate, and limited ability on the part of citizenry to hold government accountable. Sierra Leone passed a Right to Information Law in 2013, which is assessed as among the top ten laws globally by the Global Right to Information Rating. Implementation, however, has lagged, with citizens reporting lack of government responsiveness to requests. On media freedom, Sierra Leone has been assessed as ‘problematic’, with ratings declining from 72 out of 180 in 2014, to 86 out of 180 in 2016. Where information is available, there are few intermediaries to help the public make an informed assessment of this data. Moreover, in light of economic dependency on local elites, a culture of dissension and challenge is lacking (Fanthorpe 2011).
The Challenge of Public Sector Institutions
25. The overarching governance dynamics have shaped what is a challenging and problematic public sector. While Sierra Leone does well on political stability and democracy indicators relative to other low income and Sub-Saharan African countries, it performs poorly on government effectiveness, regulatory quality, corruption, and rule of law (Figure 3 and Figure 4). The logic of patrimonialism sees bureaucracy as a potential source of political opposition and is therefore kept weak and incoherent. Corruption may even be encouraged, as it serves as a source of rent distribution and keeps bureaucrats beholden to their patrons (Robinson 2008).
Figure 3: Governance Indicators
Source: World Justice Project.
5 Economic Intelligence Unit, Country Risk Service, Sierra Leone March 2017.

12
Figure 4: World Governance Indicators
Source: World Governance Indicators. Note: World Governance Indicators are based on 30 underlying data sources used to generate six composite indicators. The bars indicate the percentile rank (among approximately 200 countries) and the lines indicate the margin of error. Further details on the methodology are available at http://info.worldbank.org/governance/wgi/#doc.

13
26. Corruption in Sierra Leone is perceived to be widespread and increasing. The Global Competitiveness Index 2016–2017 ranks Sierra Leone 132 out of 138 countries on its measure of irregular payments and bribes and 116 on diversion of public funds. Results of a survey conducted for the 2015 Global Corruption Barometer show that 41 percent of respondent public service users reported paying a bribe in the past 12 months, the fourth highest rate of the 29 African countries surveyed. Half of all respondents perceive most, if not all, public officials as corrupt, with the police ranking highest in perceived corruption (59 percent) and traditional leaders the lowest (35 percent). About 58 percent of respondents believe that corruption has increased a lot since the previous year, and an additional 12 percent believe it increased a little. The Auditor General’s 2015 report on the use and management of Ebola funds revealed major lapses that led to loss of one-third of the funds scrutinized.
Figure 5: Percentage of Respondents Reporting They Paid a Bribe for Access to Service in the Past 12 Months
Source: Transparency International, People and Corruption: Africa Survey 2015, Global Corruption Barometer. Figure 6: Percentage of Respondents Who Feel that ‘Most’ or ‘All’ People in These Institutions Are Corrupt
Source: Transparency International, People and Corruption: Africa Survey 2015, Global Corruption Barometer.
27. The performance of the Anti-Corruption Commission has been improving although perception of corruption remains high. The Anti-Corruption Commission (ACC) was established to provide a framework for implementation of a National Anti-Corruption Strategy (NACS). ACC has powers to independently investigate and prosecute its cases without recourse to the offices of the Attorney General and Ministry of Justice. This reform led to an increase in the number of cases prosecuted from 2008 to 2014 and a success in monetary recoveries, with a total of over Le10 billion paid back to the Consolidated Fund between 2008 and 2012. Despite this improvement, the perception of corruption remains relatively high.
0 10 20 30 40 50 60 70
Public Schools
Public Hospitals
ID, Voter's Card, permit
Utilities
Police
Courts
0 10 20 30 40 50 60 70
Traditional Leaders
Judges and Magistrates
President
Local Councillors
Tax Officials
Members of Parliament
Public Sector Average
Government Officials
Police

14
The country is ranked 119th out of 167 countries in the Transparency International Corruption Perception Index (CPI) for 2015, compared with 134th out of 178 countries in 2010.
28. Sierra Leone has made gradual progress on implementing international Anti-money Laundering (AML)/Combating the Financing of Terrorism (CFT) obligations by stepping up effectiveness of its Financial Intelligence Unit (FIU) and supporting interagency coordination and cooperation. This has been evident in the FIU’s recent completion of a National AML/CFT Risk Assessment, which is leading to a National Risk Assessment Report and National Risk Assessment Action Plan identifying priority actions that will improve effectiveness of complying with international AML/CFT obligations. While these documents are of high quality, implementation will be challenged by weak compliance inspection systems and the lack of systems to impose effective sanctions (monetary penalties) for compliance deficiencies.
29. Public financial management (PFM) capacity and commitment remain a major concern.6 There has been gradual improvement in fiscal control mechanisms and public investment management in the last few years, but significant problems remain. Despite making serious efforts in establishing sound PFM systems through the rollout of the integrated financial information management system (IFMIS) to 30 sites, there are still serious lapses in the existing financial controls. The Auditor General has consistently articulated these lapses in the annual audit reports. In some agencies, capacities continue to erode because there are no sanctions for noncompliance with the law. Furthermore, Public Expenditure and Financial Accountability (PEFA) assessments show that budget credibility is a serious problem. Unforeseen events, such as the Ebola outbreak, or unbudgeted expenditure demands, such the increase in fuel subsidies, have consumed government resources. However, expenditure overruns stem not only from exogenous shocks or insufficient forecasting capacity, but also from weak internal controls and cash management. The Ministry of Finance and Economic Development requires restructuring to be incrementally effective and efficient, but there are continued shortcomings in fiscal reporting for compliance with international standards. Strengthening the impact of legislative scrutiny on both the annual budget law (ex ante) and the ex post review of budget implementation could translate into significant improvements in overall PFM. Progress was made toward a comprehensive cash management strategy with the establishment of a single Treasury Account System, but its implementation has been problematic and cash is not available in the system. Unless these issues are confronted head-on, there is the potential of further deterioration in the overall PFM environment, with further deleterious effects on growth and poverty reduction.
30. There is a serious disconnect between the public procurement system’s legal and regulatory framework and actual practices, with 40 percent of public procurements not being subject to open competitive bidding. Procurement is by far the largest non-payroll government expenditure and is viewed by the public as a major source of fraud and corrupt practices, which is a principal reason for the country’s low ranking on Transparency International’s Corruption Perceptions Index. Inadequate segregation of duties, poorly trained procurement staff, and weak record-keeping cause poor internal controls. Moreover, a significant proportion of procurements are not subjected to any process, and flouting of procurement legislation is widespread (Auditor General of Sierra Leone 2011, 2012, 2013; ASSL 2015). This is of particular concern given the recent increase in domestically financed capital expenditures in the budget. Procurement laws and practices were also suspended during the Ebola crisis, which may have been necessary given the urgent situation. However, they need to be reestablished now that the crisis has passed. Relatively small improvements in the procurement process could have a major impact on growth and poverty reduction.
31. Sierra Leone has advanced greatly in the reforms necessary to improve governance in the mining sector but has yet to deliver on the sector’s potential. Given its importance, and wanting to capitalize on the benefits from the exploitation of its extractive industries, Sierra Leone made a 6 Sierra Leone: Public Expenditure and Financial Accountability Assessment, 2014.

15
commendable start with respect to modernizing the legislative framework for the sector. The Ministry of Mines and Minerals remains the responsible government agency for policy making and the management of the minerals sector; the Petroleum Directorate of the Office of the President regulates oil and natural gas. The newly established National Minerals Agency (NMA), playing the role of an independent regulator, with a clear emphasis on technical strengths, serves as the lead technical group to implement all Government geological survey, mining cadaster, and inspectorate functions. The 2009 Mines and Minerals Act (MMA) and 2011 Petroleum Act provided legislative grounding for sector operations but in today’s market context are rife with inconsistencies, leaving the Government, license holders, and citizens to rely on highly interpretive and often personalized agreement on operating terms. In the present context, the Government recognizes that without regulatory reform and attendant capacity building, it will be impossible to effectively manage the sector and to adequately capture revenues, safeguard the environment, and ensure long-term benefits to the country. Continued policy, legal, and institutional reform matched with human and institutional capacity building and practical strategic planning are required if sustained extractive industries’ growth is to be leveraged. There remain certain implementation areas that will benefit from clarified institutional oversight, including the promotion of investment and handling of grievances.
32. Sierra Leone’s policy arena remains hampered by incentives that constrain the ability of the Government to commit to difficult and needed reforms, coordinate efforts to improve productivity and service delivery, and limit corruption. The combination of the weak governance mechanisms in place and the inability to sanction politicians via the ballot box results in policies and a public resource allocation that often entrench rather than alleviate distortions to address poverty and promote diversification. Instead, it perpetuates a poverty and poor governance trap. Indeed, the analysis in preparation of this SCD revealed this crosscutting governance issue as a drag on economic growth and poverty reduction. As a result, it imposes serious constraints on the country, ranging from management of natural resource revenues and the provision of basic services to rural and urban productivity.
33. Progress has largely been made in areas aligned with elite incentives and supported by substantial donor engagement. This accounts for the early success of decentralization in natural resource management (including the establishment of the NMA), as enhancing state revenues was critical to several political programs. Progress has also been made on several institutional, legal, and regulatory reforms, particularly at the de jure level. However, many of these reforms are plagued by significant implementation gaps and rollbacks, as they clash with vested interests and informal rules and norms. The literature and experience is clear that challenges to the equilibrium will be met with resistance, reversals, and the need for adaptation.
34. Promoting shared prosperity will require a combination of strategies to account for governance constraints. Over time, structural changes, such as accelerated urbanization, exogenous shocks, and changing social organization, may lead to changes in the dynamics of the policy arena. This process may create growing demand for public services and a changed social contract. Importantly, history shows that while such changes can be generative, they can also be deeply conflictual. Sierra Leone will need to manage such a transition through adaptation, without resorting to coercive tactics that might inflame tensions. In the meantime, one strategy is to foster a sustained, incremental approach to addressing specific capacity, policy, and institutional constraints as opportunities arise. This involves focusing on ‘dysfunctions by default’—that is, reforms that do not directly challenge core incentives (as opposed to ‘dysfunctions by design’, which are there to serve current elite interests). A second strategy is to increase the contestability of the policy arena by promoting citizen collective action and participation in policy making and resource allocation through enhanced information, transparency, and social accountability mechanisms. For this to have a meaningful effect, it will need to have an impact on political accountability. This will require fostering voter behavior that breaks through the current partisan loyalty.

16
Box 3: Ebola in Sierra Leone
The outbreak of the Ebola Virus Disease in West Africa began in rural Guinea in December 2013. Over the next two years, nearly 30,000 cases and more than 11,000 deaths from Ebola were recorded in Guinea, Liberia, and Sierra Leone. Sierra Leone reported the highest number of cases of the three most affected countries, with 14,124 infections and 3,956 deaths, before the country was officially declared Ebola-free in March 2016. The Ebola crisis underscored the extremely weak state of health systems in Sierra Leone. In addition to those who were directly affected by falling ill from Ebola, there were also widespread economic implications, resulting from domestic and international disease containment measures. International trade and travel were severely disrupted due to restrictions on individuals from Ebola-affected areas entering many countries. As a result, both expatriate workers and well-educated Sierra Leoneans left the country. Domestic travel restrictions, including limitations on the movement of people and goods and full quarantines of certain areas, were in place for long periods. Schools and markets were closed. Non-Ebola health services, including maternal health care, declined, as medical facilities were requisitioned to serve as Ebola treatment centers and patients avoided hospitals and clinics for fear of encountering infected persons. After an initial delay, hundreds of millions of dollars came into Sierra Leone as part of the international response effort, such as US$131 million from the World Bank through the Ebola Emergency Response project and a restructuring of an existing health project. These funds were channeled through the Ministry of Health and supported critical response activities, including surveillance, contact tracing, social mobilization, deployment of international medical staff, hazard pay to all response and health workers, food distribution to quarantined and Ebola-affected populations, and staffing and management of the National Ebola Response Center. While the donor response is generally considered to have been integral to halting the spread of Ebola, the International Federation of Red Cross and Red Crescent Societies found widespread evidence of corruption and mismanagement of funds during post-crisis audits, resulting in the loss of more than US$1 million from their projects alone7, and other organizations have reported similar findings.
Figure B3.1: Number of New Ebola Infections
Source: World Health Organization Ebola Situation Reports.
7 https://reliefweb.int/report/sierra-leone/ifrc-statement-fraud-ebola-operations
0
100
200
300
400
500
600

17
CHAPTER 2: PROGRESS ON SHARED PROSPERITY
NATIONAL DEVELOPMENT STRATEGY
35. Sierra Leone’s vision is to become a middle-income country by 2035. The Government’s Agenda for Prosperity (AfP) presents its priority interventions for 2013–2018. It follows the Agenda for Change, the second Poverty Reduction Strategy Paper, which covered 2008–2012. The AfP includes eight pillars covering (a) Diversified Economic Growth, (b) Managing Natural Resources, (c) Accelerating Human Development, (d) International Competitiveness, (e) Labor and Employment, (f) Social Protection, (g) Governance and Public Sector Reform, and (h) Gender and Women’s Empowerment.
36. The implementation of the AfP was disrupted by the Ebola outbreak that temporarily shifted the country’s priorities toward health and social protection. With the outbreak of the Ebola Virus Disease, the Government adopted the National Ebola Response Plan to eradicate the disease, restore basic socioeconomic services across the country, and lift economic growth rates. The plan focused on three sequential steps: (a) reaching and maintaining zero new cases of Ebola; (b) implementing immediate recovery priorities, including restoring health services, reopening schools, ensuring food security, and expanding water and sanitation services; and (c) transitioning back to the AfP, which remains the country’s overall development strategy. The implementation of the plan has led to the completion of the first two steps. On June 20, 2016, Sierra Leone launched the President’s Recovery Priorities that aimed to accelerate the country’s transition back to the AfP. In addition to health and education, the priorities include agriculture, fisheries, and access to water and energy.
TRENDS IN POVERTY
37. The most recent household survey, the 2011 Sierra Leone Integrated Household Survey (SLIHS), estimated the incidence of poverty to be 53.8 percent8 at the national poverty line of Le 1,587,746 (Annex 4). This represents a 12.6 percentage point decrease from 66.4 percent in 2003, the first statistic available following the end of the civil war. However, the number of poor remained nearly constant, at around 3.3 million, over this period.
38. The largest changes in poverty headcount occurred in urban areas outside of the capital Freetown, where rates declined from 70.9 percent in 2003 to 39.9 percent in 2011 (Figure 7). Half of the overall decline (6.5 of the 12.6 percent) was recorded in ‘other urban’—urban areas excluding Freetown. These areas contributed almost the same to the overall national poverty reduction as rural areas, although they had only one-third of the population. All sectors of the labor market contributed to the decline in poverty (Figure 8), reflecting that much of this reduction was linked to the postwar recovery in the economy. The largest contribution was from the agricultural sector at 63.9 percent, followed by the self-employment sector at 20.5 percent, which is roughly on par with its share of the population of household heads. Wage earnings contributed 12.5 percent and those not working 4 percent. Furthermore, a majority (62 percent) of
7 Note that this value differs slightly from the 52.9 percent figure previously calculated from the 2011 SLIHS. The difference reflects the district-level population shifts captured by the 2015 census.
After a protracted and destructive civil war, Sierra Leone made a transition to peace in 2002. Between 2003 and 2011 (when the last official poverty statistics were measured), the poverty rate fell. This chapter assesses the evolution of monetary poverty and compares across groups and geographies following the return to peace, focusing on monetary well-being. It also uses imputation to predict progress since the last household survey, a period in which shocks, such as the fall in commodity prices and the Ebola outbreak, may have reversed some of the post-2011 progress.

18
the self-employed were engaged in trade activities, followed by ‘other services’, manufacturing, and mining (mainly artisanal).
Figure 7: Poverty Headcount (2003 and 2011)
Source: Statistics Sierra Leone based on 2003 and 2011 Sierra Leone Integrated Household Surveys.
39. Poverty in Sierra Leone remains disproportionately rural, with more than three-quarters of the poor living in rural areas in 2011. The decline in rural poverty was mainly driven by gains made by agricultural households (Figure 8). These gains were driven by postwar recovery in the agricultural sector, with farmers returning to their land and steadily increasing the area under cultivation. The small percentage of nonagricultural rural households, however, experienced greater poverty reduction. The poverty gap and squared poverty gap, which indicates poverty severity, followed a similar trend. Despite a decrease in rural poverty from 79 percent in 2003 to 66 percent in 2011, the gap between urban and rural areas remains large. With the exception of slightly higher values in the Moyamba and Tonkolili Districts, regional poverty rates ranged from 51 to 62 percent in 2011. Surprisingly, excluding Freetown, headcount poverty remains relatively high and similar across provinces. This is in contrast to many countries in the region where there are distinct lagging regions.
40. The majority, 55 percent, of the reduction in poverty for rural households took place in the eastern region, which was mainly linked to the postwar recovery. The eastern region, comprising the Kailahun, Kenema, and Kono Districts, includes many of the diamond producing areas that were severely affected by the war. Kailahun and Kenema were also the last two districts to begin disarmament. The recovery brought about an increase in the size of cultivated land, from an average of 2.4 to 3.1 hectares per household, despite an increase in the number of overall households due to high population growth. Although yields for rice, the main staple crop, increased threefold on average for agricultural households nationally, the increase in the eastern region was 450 percent. Nearly all the remaining rural agricultural poverty reduction, 38 percent, was in the southern region, which experienced a strong surge in the production of palm oil, a leading cash crop.
0 10 20 30 40 50 60 70 80 90 100
WesternSouthernNorthern
Eastern
RuralOther urban
Freetown
national
Poverty headcount (%)
2003 2011

19
Figure 8: Sectoral Contribution to Poverty Reduction (percentage points)
Source: World Bank calculations based on SLIHS (2003 and 2011).
41. Although poverty rates remain well below the rest of the country, Freetown was the only area to experience a significant increase in poverty between 2003 and 2011, from 14 to 21 percent. The capital is the largest urban center, with more than 15 percent of the total population, and is the commercial and administrative center of the country. The increase in poverty is believed to have been driven by mainly three factors. The first was in-migration, which increased the population by more than 25 percent between 2005 and 2015, as rural migrants moved to Freetown seeking jobs and better services. The second factor was the slow creation of jobs, reflecting the anemic growth of the formal manufacturing and services sectors. Jobs are scarce and those available are low skilled and low paying. The last factor was inflation. Higher prices eroded the purchasing power of the limited household incomes, particularly during the food and fuel price hikes (Figure 9). Higher staple prices, especially of rice, are likely to have a large impact on poorer households because they spend higher shares of their income on food.
Figure 9: Imported Rice Prices, International Prices, and the Exchange Rate
Source: World Bank calculations based on CPI data by SSL and MOFED.
13 12
-5
31
-10
0
10
20
30
40
National Rural Freetown Other urban
Wage work Agriculture work Self-employed Out of labor market / unemployed
0
50
100
150
200
250
300
350
2007 2008 2009 2010 2011 2012 2013
international rice price (USD/kg) import rice price (Le/kg) exchange rate (Le/USD)
January 2007 = 100

20
42. It is difficult to estimate the current poverty levels in Sierra Leone given the lack of recent household survey data. For the SCD analysis, an imputation exercise was conducted by the World Food Programme in 2015 using two nationally representative household datasets: the 2011 SLIHS data and the Comprehensive Food Security and Vulnerability Analysis (CFSVA) survey. This imputation estimated the poverty levels for 2015 by building a model between consumption and poverty using the 2011 SLIHS data and then applying that model to the 2015 CFSVA data. This process relied on the assumption that the relationship between the characteristics used in the imputation model and consumption levels have remained constant between 2011 and 2015. This is a strong assumption in any context but particularly so in the case of Sierra Leone, which experienced a period of ‘boom and bust’ in the commercial mining sector and a national health and economic crisis during the Ebola outbreak. At the same time, hundreds of millions of dollars flowed into the country during the Ebola crisis in the form of aid and emergency assistance, and the crisis response created temporary employment opportunities even in remote rural areas. Therefore, the estimates from the imputation should only be considered as suggestive of trends.
43. The imputation model suggests that the sharpest drops in poverty took place in Tonkolili and the western rural districts (Figure 11). Subdistrict-level imputed poverty shows the lowest poverty in Freetown, coastal Bonthe, and in the urban centers, while isolated rural areas show the highest poverty (Figure 11). The sharp declines in Tonkolili, and to a lesser extent Moyamba, are unsurprising given that these districts were the centers of iron ore mining. Although only a few thousand jobs were directly created by the mines, substantial spillovers into the neighboring communities could be expected, creating a ready market for agricultural goods following an increase in demand for support services and food. The decline in the western rural areas is most likely related to the fact that they are steadily becoming more like western urban areas, as urbanization increases and Freetown expands into previously rural areas. There was also a small predicted decline in poverty in Freetown itself, reversing the trend between 2003 and 2011, although this prediction might not be robust given the strong assumptions necessary for the imputation. The model also predicts increases in poverty in the Kenema, Bombali, Kono, Pujehun, and Bo Districts, though the theory for these changes is less straightforward. Kenema was one of the early epicenters of the Ebola outbreak and therefore received a substantial influx of aid. However, Kailahun was in a similar situation but experienced a decrease in poverty. Overall, the urban areas outside of Freetown showed an increase in poverty since 2011. Based on cell phone surveys conducted during the Ebola outbreak, urban areas were disproportionately affected by the disease, as their economies depend largely on informal trade, which was the sector most disrupted by the travel and transport restrictions. This may have led to the sharp increase in poverty. It is also possible that biases have been introduced into the results and that these trends will not be borne out by additional data collection since the model assumes pre-Ebola relationships but applies them to post-Ebola data. It will, therefore, be necessary to wait for more detailed evidence provided in the next round of the SLIHS, which is expected to begin in 2017.

21
Figure 10: Imputed Poverty at the Subdistrict Level (2015)
Source: Calculations based on 2011 SLIHS and 2015 CFSVA.
Figure 11: Estimated Change in Poverty Since 2011
Source: Calculations based on 2011 SLIHS and 2015 CFSVA.
0 10 20 30 40 50 60 70 80 90
WESTERN URBAN
BONTHE
KOINADUGU
WESTERN RURAL
KAMBIA
PORT LOKO
KAILAHUN
BO
PUJEHUN
TONKOLILI
KONO
MOYAMBA
BOMBALI
KENEMA
2011 2015

22
44. Higher growth rates or higher pass-through of growth to poverty reduction are required to meet the Government’s AfP targets. Starting from a baseline of 2011 and using the current predicted levels of the pass-through from change in GDP to change in poverty level, growth of almost 15 percent per year would be necessary to achieve the AfP target of 3 percent poverty rate in 2030. This is well above the current forecasts of 5–6 percent for the next several years. Therefore, to meet its poverty reduction objectives, Sierra Leone must accelerate growth and continue to ensure that growth benefits the poor (Figure 12).
Figure 12: Projected Reductions in Poverty, 2011 to 2016
Source: Calculations based on SLIHS (2011) and GDP values and estimates.
45. Economic growth in Sierra Leone has been pro-poor. As evidenced by a comparison of annualized growth rates for per capita expenditure adjusted for purchasing power parity, the growth rate was the highest for the poorest decile of the distribution (6 percent) and steadily declined toward the wealthiest decile (0.5 percent). With regard to shared prosperity, measured as the consumption growth of the bottom 40 percent of the population and used as an indicator of the inclusiveness of growth, the annualized growth rate was 5.1 percent compared with 2.9 percent at the mean (Figure 13).
46. Overall inequality fell between 2003 and 2011, as evidenced by the decrease in the Gini coefficient from 0.39 to 0.32 over the period. This is reflective of the pro-poor nature of growth, particularly in rural areas. Between 2003 and 2011, the poor (those below the 53rd percentile) experienced above-average growth in consumption, with the highest growth experienced by those in the bottom decile. The lowest consumption growth was experienced by the top percentiles of the distribution. At the subnational level, inequality decreased in both Freetown and rural areas, increasing only in urban areas outside of Freetown. The overall decrease in inequality can largely be attributed to the measured fall in prosperity in Freetown and by rural areas catching up with urban areas. The largest remaining inequality is within urban areas and within rural areas.
0
10
20
30
40
50
60
70
2003 2011 2012 2013 2014 2015 2016
pove
rty
head
coun
t
AfT targets

23
Figure 13: Mean Per Adult Equivalent Consumption by Decile
Source: Calculations based on SLIHS (2011).
47. Larger households, those involved in agriculture, and those with lower levels of education are more likely to be poor. Analysis based on the 2011 SLIHS identified a number of household characteristics that were associated with higher likelihoods of being poor. Larger households, particularly those with higher numbers of dependents, were more likely to be poor. Higher levels of education of the household head were associated with lower likelihoods of being poor. In rural areas, the likelihood of being in poverty decreased from 84 percent for a household in which the head has no education to 7 percent for those with post-secondary education. The equivalent for urban areas was a fall from 33 percent with no education to 13 percent with post-secondary education. In rural areas, households in agriculture were 15 percent more likely to be poor than rural nonagricultural households, while in urban areas, having a household enterprise decreased the likelihood of being poor.
0%
1%
2%
3%
4%
5%
6%
0
1
2
3
4
5
6
1 2 3 4 5 6 7 8 9 10
Annu
alize
d gr
owth
rate
PPP
(200
5)
Decile
National
0%1%2%3%4%5%6%7%8%9%
012345678
1 2 3 4 5 6 7 8 9 10
Annu
alize
d gr
owth
rate
PPP
(200
5)
Decile
Rural
-4%
-3%
-2%
-1%
0%
012345678
1 2 3 4 5 6 7 8 9 10
Annu
alize
d gr
owth
rate
PPP
(200
5)
Decile
Freetown
0%1%2%3%4%5%6%7%8%9%
012345678
1 2 3 4 5 6 7 8 9 10
Annu
alize
d gr
owth
rate
PPP
(200
5)
Decile
Other urban

24
CHAPTER 3: DRIVERS OF GROWTH AND RISK TO SUSTAINABILITY
Sierra Leone’s economy expanded significantly in the postwar period, driven by agriculture and mining, with sizable increase in employment, investment, and productivity fueled by the return to peace. However, the peace dividend has been exhausted, putting at the risk the sustainability of the current growth path. This chapter assesses the economic growth in the postwar period and the risks to its sustainability in the medium to long term.
POSTWAR DRIVERS OF GROWTH
48. Sierra Leone enjoyed a steady increase in income per capita from 2002 to 2014, its longest period since independence in 1961. Per capita GDP went from stagnating in the period from independence to the civil war and contracting by 3.4 percent on average per year between 1991 and 2001 (civil war) to increasing by 5.9 percent on average per year from 2002 to 2014. In nominal terms, income per capita quintupled in about a decade and half, rising from US$157 in 2000 to US$794 in 2014. With this exceptional growth performance, Sierra Leone has reached a per capital income level similar to Rwanda and Nepal and well above Guinea and Liberia.
49. Economic growth was driven mainly by agriculture. In the postwar period, agriculture (including livestock, forestry, and fisheries) grew by 8 percent on average per year between 2001 and 2014, contributing by almost half to the increase in real GDP. According to the Food and Agriculture Organization (FAO) data, crop production increased by 12.5 percent on average during the period, driven mainly by an increase in land use (9.1 percent per year) and, to a lesser extent, an improvement in yield per hectare (3.3 percent per year). The industry was the second largest contributor to economic growth (one-third) mainly because of two large-scale iron ore mining projects that became operational in 2011. The mining sector was the fastest growing sector with an average increase of 44 percent per year between 2001 and 2014, but it experienced high volatility in production and prices. Production of services increased by 5.8 percent per year, contributing one-fifth to GDP growth between 2001 and 2014.
50. Sierra Leone’s longest growth period ended in 2015, as the country was severely hit by the twin shocks of the Ebola outbreak and the downturn in international iron ore prices (Figure 14). The economy contracted by 21.1 percent with the cessation of iron ore production, the country’s main export commodity (70 percent of exports in 2013), and the spread of the Ebola epidemic. In 2015, iron production declined by 96.5 percent while growth in the non-iron ore economy slowed from 5.6 percent in 2013 to 0.9 percent in 2014 and 1.4 percent in 2015, with the services sector bearing the brunt of the adjustment.
Figure 14: World Price of Iron Ore (US$ per MT)
Source: World Bank Global Economic Monitoring Database.

25
51. Economic growth restarted when the country was declared free of Ebola in March 2016. The recovery started earlier in the primary sector, which showed some signs of resilience, and the service sector, which benefited from fewer restrictions on mobility and trade and a normalizing business environment. However, growth in the industry dominated by iron ore mining was subdued by continued low commodity prices. The largest iron ore producer, the Shandong Iron and Steel Group, resumed activity in February 2016 after being closed since December 2014. However, production remained well below potential while operations were suspended at the Timis Mining Corporation, the country’s other large mining company. Overall, real GDP growth is estimated at 6.1 percent in 2016, spurred by an increase in household consumption, growth in agriculture, and a resumption of iron ore exports.
52. Despite the resumption of iron ore production, the country continues to face balance of payment challenges. The current account deficit is widened from 17.5 percent of GDP in 2015 to 19.9 percent in 2016 despite improvements in the trade balance, net services, and net income. The decline in current transfers, including foreign aid to manage the Ebola crisis, annihilated the gains from iron ore exports, the decline in service imports related to the Ebola outbreak, and lower factor income payments in the mining sector. With growing pressures on international reserves, the Bank of Sierra Leone (BSL) reduced its intervention in the foreign exchange market. As a result, the exchange rate depreciated by 26 percent in 2016 after 12 percent in 2015. This flexibility, together with growing foreign direct investment (FDI) inflows to the agriculture and food processing sectors, higher portfolio investment to cover incurred losses in the mining sector, and higher use of International Monetary Fund (IMF) resources, helped the country maintain foreign reserves slightly below three months of imports.
53. On the fiscal side, revenue mobilization remains a challenge in the context of declining aid and weak recovery in manufacturing and services. Despite an increase of 1.5 percent of GDP in domestic revenue, total revenue and grants decreased from 16.2 percent of GDP in 2015 to 15.0 percent of GDP in 2016, as foreign aid fell to its pre-Ebola level. Budget support grants dropped from 3.0 in 2015 to 0.8 percent of GDP in 2016, while project grants remained broadly unchanged at 2.4 of GDP, leading to a cumulative decline in revenue of 2.7 percent of GDP. In late 2016, the Government responded by eliminating tax exemptions for fuel and electricity, but the full effects are expected in 2017. Despite lower revenue, total expenditures and net lending increased from 20.8 percent of GDP in 2015 to 23.4 percent of GDP 2016. As a result, the fiscal deficit widened from 4.6 percent of GDP in 2015 to 8.3 percent of GDP in 2016, forcing domestic financing to exceed the ceiling of 2 percent of GDP on which the Government’s medium-term fiscal program is anchored. This, together with the depreciation of the Leone, resulted in an increase of total public debt to 55.9 percent of GDP in 2016, up from 45.3 percent of GDP in 2015.
54. Monetary policy was initially loosened to support the economic recovery but was later tightened to respond to growing inflation pressures. The BSL increased the monetary policy rate (MPR) by 100 basis points, or 10.5 percent, in September 2016 and by an additional 50 basis points, or 11 percent, in December 2016. Nevertheless, the inflation rate increased from 8.8 percent in December 2015 to 17.4 percent in December 2016. Domestic credit increased by 26 percent year-on-year in December 2016, reflecting a 32.7 percent increase in the claim on the central government and 16.7 percent increase in credit to the private sector while money and quasi-money (M3) grew by 17.9 percent year-on-year in December 2016.

26
Figure 15: Per Capita GDP Growth (Annual %)
Source: World Bank Group WDI (2016).
Figure 16: Per Capita GDP for Selected Countries (US$ Current)
Source: World Bank Group WDI (2016).
Figure 17: Contribution to GDP Growth by Sector
Source: World Bank Group WDI (2016).
Figure 18: Decomposition of Agricultural Growth by Land Use and Productivity
Source: FAO data (2016).
55. Employment, private investment, and productivity increased significantly in the postwar period. Economic growth was driven by an increase in employment between 2002 and 2009 and by an increase in private investment between 2010 and 2014. Between 2002 and 2009, employment grew by 4.2 percent per year and occurred mainly in agriculture, as the displaced population returned to the farms after the war. Investment grew between 2010 and 2014 by 10.7 percent per year, as the mining sector saw the emergence of two big iron ore companies. Total factor productivity also increased in the two periods, though at a slower pace for 2009–2014 (6.1 percent in 2002–2009 versus 3.5 percent in 2010–2014). However, if adjusted from external trade fluctuations, total factor productivity declined by 3.5 percent between 2009 and 2014, as the added investment boosted exports and not domestic absorption.
56. Labor productivity increased significantly in the postwar period. Between 2002 and 2015, value added per worker increased by 2.8 percent on average per year in two different distinguishable phases in the postwar period. In the first phase (2002–2010), labor productivity increased by 3.8 percent per year compared to a contraction of 3.5 percent on average per year during the civil war (1991–2001). Productivity growth in the first period was driven by agriculture (5.7 percent per year) while sectors labor productivity in the industry and services growth remained modest at 2.3 and 1.4 percent on average per year. In the second phase (2011–2015), the rate of increase in value added per worker declined to 1.6 percent per year, driven by the boom and bust of iron ore production. Labor productivity increased by 8.8 percent on average

27
per year between 2011 and 2014, driven by productivity growth in industry (56.6 percent), before declining by 22 percent in 2015, as productivity in industry collapsed by 75 percent with the falling iron ore prices.
57. Labor productivity remains the lowest in agriculture. Value added per worker in agriculture increased in real terms from US$455 in 2002 to US$1,105 in 2015. However, in 2014, labor productivity in agriculture was about one-third lower than the average national labor productivity, 20 percent lower than labor productivity in services, and only 12 percent of labor productivity in industry. Labor productivity in the mining sector was driven by a sharp increase in capital per worker and a large influx of FDI between 2009 and 2013. However, the increase in value added per worker did not translate into equivalent improvement in the welfare of miners.
Figure 19: Contribution to Economic Growth by Factor Input (average 2001–2014)
Source: Penn World Table (2015). Note: TFP = Total factor productivity.
Figure 20: Labor Productivity (Value Added Per Worker) Growth by Sector
Source: World Bank Group WDI (2016).
RISK TO SUSTAINABILITY OF CURRENT ECONOMIC GROWTH AND POVERTY REDUCTION PATTERNS
58. Without policy changes, Sierra Leone’s economy is expected to continue growing but at a slightly lower pace. If the current trends in labor productivity are maintained in the next fifteen years, total value added would increase by 5.0 percent on average per year for the period 2016–2030 down from 5.3 percent on average per year between 2002 and 2015, reflecting slower growth in agriculture and services that will offset the effects of the higher growth in industry driven by the extractive sector. Under these hypotheses, value added per worker increases by 2.6 percent on average per year to reach US$1,830 in real terms (2010 constant US$) by 2030, up from US$1,235 in 2015. Considering the declining share of the non-working-age population, GDP per capita would increase 3.1 percent on average per year in the period, to reach US$770 in real terms by 2030.

28
Figure 21: GDP per Capita and Value Added per Worker (projection 2016–2030)
Source: World Bank Group WDI (2016) and staff projection.
Figure 22: Value Added per Worker by Sector (projection 2016–2030)
Source: World Bank Group WDI (2016) and staff projection.
59. However, there are high risks to the sustainability of this growth path. First, it is very likely that the expected growth in value added per worker and GDP per capita will not be translated into faster poverty reduction. In fact, as in 2011–2014, it can be expected that labor productivity growth will be driven mainly by the mining sector, provided that the commodity prices, mainly iron ore, stay at a relatively high level (above current US$80 per MT). However, the sector does not create enough jobs for a direct access to and a wider sharing of the generated prosperity. Second, without significant change in agricultural policy, labor productivity will continue to grow slowly in the sector, keeping the majority of the population in poverty. Third, without significant improvement in the business environment, labor productivity in the non-resource sectors (industry excluding mining and services) will continue to stagnate or decline. Recent demographic trends suggest that rural to urban migration would continue in the coming decade and it is very likely that the majority of the new urban dwellers will find jobs in the low productive informal sector.

29
CHAPTER 4: FUTURE OF SHARED PROSPERITY
60. Sierra Leone needs to find new drivers of growth to meet future obligations and create shared prosperity. In the postwar period, economic growth and poverty reduction have relied primarily on mining and agriculture. However, as the country pursues long-term sustainable growth, it can find new drivers of inclusive growth by (a) strengthening the productivity of the agricultural base, (b) diversifying the economy and creating poverty-alleviating jobs, (c) strengthening the management of mineral resources, and (d) increasing human capital for new opportunities.
STRENGTHENING THE PRODUCTIVITY OF THE AGRICULTURAL BASE
61. Agriculture employs more than half of the country’s formal and informal workforce and accounts for about half of GDP. According to the 2014 Labor Force Survey, nearly 60 percent of employed individuals ages 15–64 work in agricultural self-employment. In addition, achieving a self-sufficient equilibrium in food production is crucial to free up household resources for investment and to reduce foreign exchange spending on imports. Agriculture also represents the most direct channel for the population to harness the benefits of the country’s natural resources. Though the Government plays a role in facilitating improvements in the sector, agricultural development happens mainly at the farm level and therefore outside of the direct control of the public sector. Since necessary funding is not channeled directly through the Government (as in education and health services), it is therefore less vulnerable to weaknesses in public administration.
62. Improving agricultural output offers a direct path to poverty reduction. More than two-thirds of poor households cited agriculture as their primary source of livelihood in 2011, and high agricultural production offers poor households increased food security and higher potential incomes. Approximately 20 percent of agricultural households grew cash crops, the majority of which were in the eastern region. However, food crops accounted for most of the farmers’ land use, particularly among poor households. Rice is the main food crop and was produced by more than 90 percent of agricultural households in 2011. A majority of those households indicated that their stocks were not sufficient, peaking at 60 percent in August before a new harvest. Furthermore, in 2011 nearly 60 percent of rice growers were net purchasers (SLIHS 2011). While there has not been a new survey since that time that can update the percentage of net purchasers, the 2015 CFSVA showed that 96 percent of rice farmers were still food insecure at least part of the year, most commonly in the two months prior to the harvest when stocks from the previous season are depleted.
Opportunities
63. The 2013 Diagnostic Trade Integration Study (DTIS) identifies a number of potential opportunities in agriculture for Sierra Leone. The study specifically cites improving productivity on staple crops, increasing cash crop production and returns, improving access to markets, and moving up the value chain as mechanisms to improve agricultural sector. It identifies rice and palm oil production as
Agriculture is the main source of livelihood in Sierra Leone, particularly for the poor, and therefore improving agricultural outcomes for food security and rural income generation is at the core of poverty alleviation. The sector is constrained, however, by compounding failures in both the input and output markets. Yields are well below their productive frontier due to low uptake of modern seeds, chemical fertilizers, and mechanization. This leads to high overall costs of production and reduces farmer margins on sales. Access to credit is also minimal, insurance markets are nonexistent, and perceived insecure tenure impedes long-term investment. Furthermore, sales are constrained by low prices, poor infrastructure, and a lack of modern processing facilities.

30
having a competitive advantage for import substitution if productivity could be increased. Furthermore, switching to high yielding seeds could increase yields from the current 1.7 MT per ha to 3 MT per ha and could further increase to 8 MT per ha with the appropriate use of inorganic fertilizer (DTIS 2013). As 30 percent of the total rice consumption in Sierra Leone is supplied by imports, there is a substantial unmet domestic demand as well as future export potential. Cassava and cocoa were also identified as having export potential. Cassava, when processed into gari, has high potential as it grows well in Sierra Leone’s climate, production does not require inorganic inputs, and there is high demand in the subregion. The production of cocoa, the main cash crop, has the potential to expand, as current yields (361 kg per ha) are below the Western Africa average (437 kg per ha) (FAOSTAT 2013). The DTIS also identified the opportunity for Sierra Leone to diversify its exports to include rubber, cashew, sugarcane, and ginger (Figure 23).
Figure 23: Cereal Yield, Average 2010–2014 (kg/ha)
Source: FAOSTAT. Note: SSA = Sub-Saharan Africa; CAR = Central African Republic.
Constraints
64. According to data collected in the 2015 CFSVA, the most commonly cited constraint by farmers was the lack of access to improved seeds. Overall, when asked to identify the top three constraints to increasing agricultural production, 45.0 percent of farmers cited the unavailability of improved seeds, 41.5 cited a lack of access to credit, 39.0 percent cited the Ebola outbreak, 31.5 percent cited insufficient household labor, 27.7 percent cited pests or crop disease, 24.7 percent cited a lack of tools, and 19.1 percent cited the unavailability of fertilizers (Figure 24).
14221710
3735
0
1000
2000
3000
4000
5000
6000
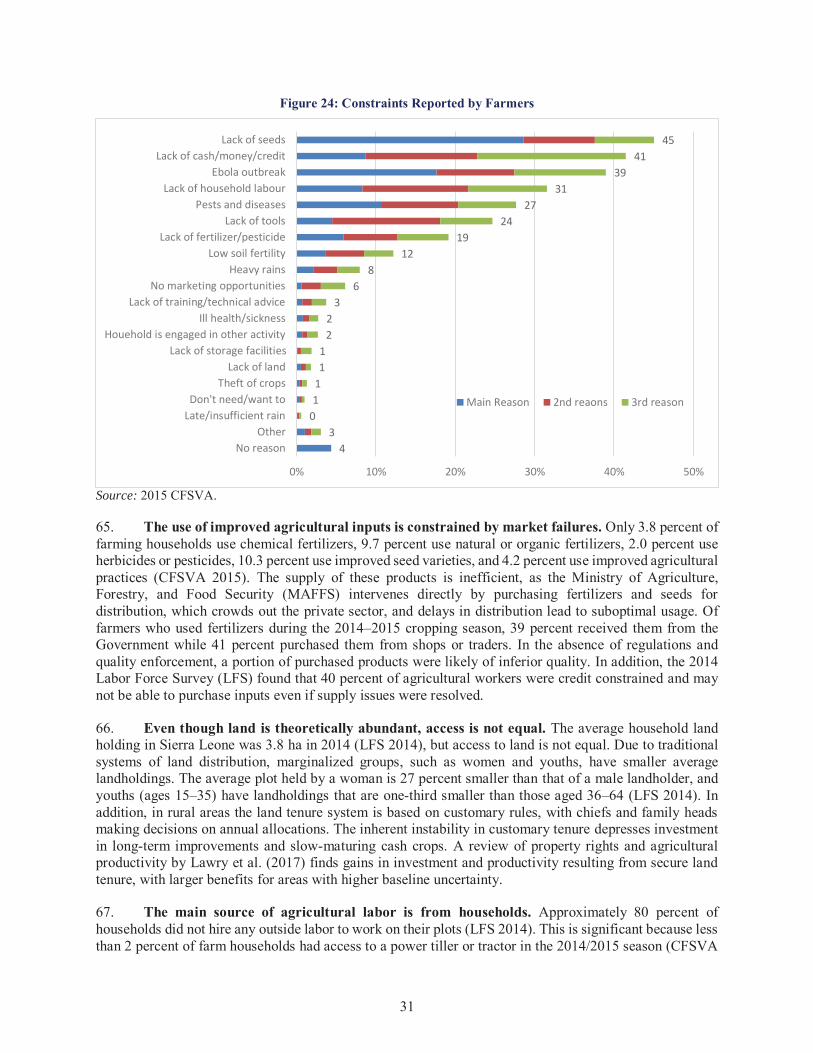
31
Figure 24: Constraints Reported by Farmers
Source: 2015 CFSVA.
65. The use of improved agricultural inputs is constrained by market failures. Only 3.8 percent of farming households use chemical fertilizers, 9.7 percent use natural or organic fertilizers, 2.0 percent use herbicides or pesticides, 10.3 percent use improved seed varieties, and 4.2 percent use improved agricultural practices (CFSVA 2015). The supply of these products is inefficient, as the Ministry of Agriculture, Forestry, and Food Security (MAFFS) intervenes directly by purchasing fertilizers and seeds for distribution, which crowds out the private sector, and delays in distribution lead to suboptimal usage. Of farmers who used fertilizers during the 2014–2015 cropping season, 39 percent received them from the Government while 41 percent purchased them from shops or traders. In the absence of regulations and quality enforcement, a portion of purchased products were likely of inferior quality. In addition, the 2014 Labor Force Survey (LFS) found that 40 percent of agricultural workers were credit constrained and may not be able to purchase inputs even if supply issues were resolved.
66. Even though land is theoretically abundant, access is not equal. The average household land holding in Sierra Leone was 3.8 ha in 2014 (LFS 2014), but access to land is not equal. Due to traditional systems of land distribution, marginalized groups, such as women and youths, have smaller average landholdings. The average plot held by a woman is 27 percent smaller than that of a male landholder, and youths (ages 15–35) have landholdings that are one-third smaller than those aged 36–64 (LFS 2014). In addition, in rural areas the land tenure system is based on customary rules, with chiefs and family heads making decisions on annual allocations. The inherent instability in customary tenure depresses investment in long-term improvements and slow-maturing cash crops. A review of property rights and agricultural productivity by Lawry et al. (2017) finds gains in investment and productivity resulting from secure land tenure, with larger benefits for areas with higher baseline uncertainty.
67. The main source of agricultural labor is from households. Approximately 80 percent of households did not hire any outside labor to work on their plots (LFS 2014). This is significant because less than 2 percent of farm households had access to a power tiller or tractor in the 2014/2015 season (CFSVA
43
01111
22
36
812
1924
2731
3941
45
0% 10% 20% 30% 40% 50%
No reasonOther
Late/insufficient rainDon't need/want to
Theft of cropsLack of land
Lack of storage facilitiesHouehold is engaged in other activity
Ill health/sicknessLack of training/technical advice
No marketing opportunitiesHeavy rains
Low soil fertilityLack of fertilizer/pesticide
Lack of toolsPests and diseases
Lack of household labourEbola outbreak
Lack of cash/money/creditLack of seeds
Main Reason 2nd reaons 3rd reason

32
2015). The lack of mechanization makes farming labor intensive, particularly during land clearing. Though labor is abundant in rural Sierra Leone, with 29 percent of workers in rural areas being classified as underemployed (LFS 2014), farmers are constrained in the amount of land that can be cleared and planted without the resources to hire outside labor. The 2014 LFS found that the value of output from farms that used outside labor was more than double that of those that relied on household labor, though these farmers also tend to have larger plots and fewer credit constraints.
68. Output markets are not sufficient to promote sales and rural income. The 2015 CFSVA found that 39 percent of rice-growing households sold at least some of their crop. This represents a dramatic increase from the 26 percent reported in the 2011 SLIHS, though some percentage of the 2015 sales were likely distress sales during the Ebola outbreak. Sales are constrained by poor storage and a lack of feeder roads linking rural areas to Freetown and other urban centers. Processing facilities are also insufficient. During the 2014/2015 cropping season, only 11 percent of farmers accessed a rice mill and less than 5 percent accessed a cassava grater (CFSVA 2015). These assets were most often communally held as opposed to being owned individually or accessed through a private company or the Government, with substantial anecdotal evidence of local elites capturing assets for themselves. Similarly, palm oil is widely consumed in Sierra Leone but must be processed before being sold. However, current manual processing methods are expensive and inefficient, hurting the competitiveness of domestic production. In sum, these constraints both increase the cost of marketing products and prevent farmers from moving up the value chain.
69. Low human capital also plays a part in low productivity in agriculture. More than 85 percent of rural household heads who indicated their primary profession was agriculture have never been to school, compared to 70 percent of those outside agriculture (SLIHS 2011). Increasing the skill levels of farmers increases domestic value added to agriculture, stimulates off-farm job creation for rural populations and, alleviates liquidity constraints of small producers by generating incomes (Bamber, Abdulsamad, and Gereffi 2014).
70. High production and marketing costs reduce domestic competitiveness compared to inexpensive imported food. This is particularly an issue during boom periods in the mining sector when the appreciation of the leone makes imports comparatively less expensive. Even when the exchange rate is not an issue, tariff waivers for rice keep imported prices artificially low, damaging competitiveness.
71. The low term impact of climate change on agricultural production is currently unknown. An analysis of the historical temperature data from the World Bank’s Climate Change Knowledge Portal (CCKP) shows that the average monthly temperature is statistically significantly higher in the last ten years (2006-2015) that it was during the period from 1901 to 2005 in 10 of 12 months. The magnitude of the difference, however, is 0.5 degrees Celsius or less. Rainfall shows a slightly lower total annual rainfall in the last ten years, but the difference is marginal. Of the 16 climate change models including in the CCKP, the estimates of average annual rainfall in the 2020-2039 period range from a decrease of 50 percent to an increase of 50 percent, with a high degree of variation between the extremes. Finally, the two main models presented in the Second National Communication on Climate Change, Commonwealth Scientific and Industrial Research Organization (CSIRO) and the Model for Interdisciplinary Research on Climate (MIROC), give differing predicted impacts of the changes in yield due to climate change. Figure 25 below shows the variation in expectations between the two models.

33
Figure 25: Yield under Climate Change of Rain Fed Rice
Source: Second National Communication on Climate Change.
DIVERSIFYING THE ECONOMY AND CREATING POVERTY-ALLEVIATING JOBS
72. Sierra Leone’s work force continues to grow faster than the total population but a large majority of the population is employed in low productivity sectors. According to the 2015 United Nations World Population Prospects, the number of children under 15 years that each worker supports will fall from 2.7 in 2015 to 2.5 in 2025, assuming the employment rate is maintained at 65 percent of the working age population, unemployment rate remains below 5 percent, and the declining trend in fertility is maintained. The country’s ability to benefit from this demographic trend depends on its capacity to modify the structure of the economy to generate more productive and better paid jobs in the manufacturing and services. The percentage of population living in urban areas increased from 35 percent 2001 to almost 40 percent in 2015, with a high concentration in the capital Freetown, which hosts 15 percent of the total population in only 0.02 percent of the total area of the country, and the trend is poised to continue. According to the last UN World Urbanization Prospect (2014), 57 percent of the population of Sierra Leone will live in urban areas by 2050. The share of youth between 20 and 34 years is expected to increase from 24 percent in 2015 to 25.5 percent in 2050.
73. However, Sierra Leone’s economy remains heavily dependent on natural resources (agriculture, livestock, fisheries, forestry, and mining) and the rate of dependence is increasing. From 2001 to 2014, the share of the natural resources sector in the economy increased from 46.8 percent to 64.8 percent before falling back to 61.5 percent in 2016, reflecting the downturn in iron ore production and prices. The resources sector is dominated by the renewables, which represented on average 90 percent of the sector in the postwar period. The renewable sector is dominated by crop production which represented 63 percent of the sector on average between 2001 and 2016. The share of nonrenewable resources increased
To boost shared prosperity, Sierra Leone must create poverty-alleviating nonfarm jobs outside the mineral sector. Each year, more than a hundred thousand people move from rural to urban areas in search of employment and better living conditions. In the absence of well-paid formal manufacturing and services jobs, almost nine in ten of these Sierra Leoneans end up in the highly vulnerable informal sector. Employment growth in the formal sector is slowed by a myriad of constraints, including low access to electricity, high transportation and communication costs, high competition from imports and state-owned enterprises, lack of access to credit, and an unfavorable regulatory environment, and low productivity in the informal sector limits income generation.

34
significantly with the starting of the large-scale mining projects to reach a peak of 27.7 percent in 2013 before declining to 6.8 percent in 2016. These trends contrast with the population dynamics. With the increasing urbanization rate, more and more people are leaving agriculture, which is the fastest growing sector, to take a job in the modestly growing informal manufacturing or services sectors in urban areas. The share of agriculture in total employment declined from 68.5 in 2004 to 61.1 percent in 2014, while the share of services in total employment increased from 25 percent in 2004 to 33.4 percent in 2014. Despite the coming on stream of the two large-scale mining companies, the share of the industry in total employment decreased from 6.5 percent in 2004 to 5.5 percent in 2014.
Figure 26: Relative Share of Renewable and Nonrenewable Resources (average 2001–2016)
Source: Statistics Sierra Leone and World Bank Group.
Figure 27: Relative Share in Renewable Resource Sector (average 2001–2016)
Source: Statistics Sierra Leone and World Bank Group.
Figure 28: Labor Market by Type of Employment
Source: Labor Force Survey 2014.
Figure 29: Labor Market Employment by Sector
Source: Labor Force Survey 2014.
74. Sierra Leone could generate better jobs and more income by promoting its formal manufacturing and services sectors and increasing the productivity of its informal sector. Economic growth is a prerequisite for job creation. With the absence of a capital market in Sierra Leone, economic growth reaches most people through labor income. Therefore, boosting employment will require targeting sectors with the greatest job creation potential. In Sierra Leone, the manufacturing and services sectors offer a great potential for economic growth, employment, and income diversification, but they are constrained

35
by several factors. Increasing productivity in the informal sector is also important for poverty reduction, as the level of productivity sets a limit on the level of income generated and the living standards individual workers and their families can expect.
75. Sierra Leone’s future is in developing manufacturing and services. The manufacturing sector comprises small-scale enterprises producing beverages, textiles, footwear, cement, paints, soft drinks, mineral water, and cigarettes and sells manufactured commodities to the domestic market. Between 2002 and 2014, the manufacturing sector grew by 4 percent on average per year, slower than the total GDP, leading to a decrease in its share of the economy from 3.2 percent to 1.6 percent. Jobs in manufacturing and utilities represent less than 3 percent of the total workforce, the majority of which are concentrated in Freetown, and more than 80 percent of which are either informal (72 percent) or unpaid (8 percent). The performance of the sector has been very volatile, reflecting the small number of enterprises as well as regular variation in demand and access to key inputs such as electricity and credit. Commercial banks overdrafts, loans, and advances to the industry increased by 20 percent per year between 2009 and 2013.
76. The services sector is more diversified. The sector represented 30 percent of GDP in 2001 but its relative share in the economy declined to 20 percent in 2015, reflecting a slower growth than in agriculture and mining. Informal trade dominates the services with 41 percent, followed by transport (12 percent), real state (10 percent), and telecommunication (9 percent). The banking, insurance, and tourism sectors, which are composed almost exclusively by the formal enterprises, private or owned by the state, remain underdeveloped. Despite its declining weight on the economy, the service sector, including tourism, has the potential to grow and create jobs in the future. The sector accounted for 33 percent of the labor force in 2014, including 87 percent of Freetown. Jobs in the service sector include traders (42 percent), transportation (12 percent), real estate (10 percent), communication (9 percent), banking (7 percent), insurance (2 percent), tourism (2 percent) and other services (16 percent). Most of the public sector employees are included in the service sector, though they represent only 4.2 percent of the total work force, of which 2.8 percent work for the central government. Within the service sector, 78 percent are self-employed, nearly all of which are informal. The small number of formal jobs are concentrated in the public sector, banking, insurance, and tourism industries. Underemployment, defined as fewer working hours than desired, is also high, particularly in Freetown.

36
Figure 30: Composition of the Service Sector (average 2002–2015)
Source: Statistics Sierra Leone.
Figure 31: Employment in Western Area by Sector (average 2002–2015)
Source: 2014 Sierra Leone LFS.
Constraints
77. Three categories of constraints affect growth and employment generation in manufacturing and services: (a) macroeconomic stability and the general external environment of the firm; (b) access to infrastructure (roads, energy, and ICT), labor, and credit; and (c) interaction with public officials.
Macroeconomic Stability and the Environment of the Firm
78. Decisions by private enterprises are influenced by several macroeconomic variables, such as the aggregated demand, the inflation rate, the exchange rate, tax rates, and interest rates. In Sierra Leone, the level of public expenditures is the most significant single component of the aggregate demand. However, because of the uncertain contribution of the mining sector to government revenue, public expenditures have been traditionally volatile, making market projections and investment planning at the level of the firm very difficult. According to the last PEFA report (2014), the aggregate government expenditure outturn exceeded the original approved budget by 30.7 percent in 2010, 16.3 percent in 2011, and 23.7 percent in 2012, thus reducing tremendously the PEFA indicator PI-1 on the credibility of the budget, which was rated D against a B in the PEFA 2010. The expenditure overrun generated also unpaid bills and arrears compared to the private sector. In 2011 and 2016, the level of arrears accumulated exceeded 1 percent of GDP. Recent experience shows also that when bank financing of the fiscal deficit exceeds 2 percent of GDP, interest rate increases and credit available to finance the private sector decreases.
79. In addition to the high volatility of the aggregate demand, the exchange rate policy makes it more difficult for the local firm to compete with imports. Since the effectiveness of the monetary policy in curbing inflation is very limited (credit to private sector is below 5 percent of GDP with only 15 percent of the adult population having an account with a formal institution, against 24 percent on average for Sub-Saharan Africa), the Government often intervenes in the foreign exchange market to limit price increase in the domestic market. As a result, the volatility of the exchange rate is amplified, with sharp deviations from the long period average (8 percent depreciation is the 10-year average). For example, the exchange rate depreciated by only 2.7 percent on average per month year-on-year basis, between January 2011 and June 2014, during the mineral boom, while it was at 15 percent on average per month between January 2009 and December 2010 and between July 2014 and September 2016, when inflow of mineral revenue was lower. Though this policy generally benefits the consumer temporarily, mainly those residing in Freetown and other urban areas, it typically has an adverse effect on the local producers operating in the tradable sectors

37
(agriculture and manufacturing). In addition, when mining revenues are low, the fiscal policy stance shifts to mobilizing revenue by adding new taxes or eliminating exemptions as part of its fiscal consolidation efforts, increasing the burden on the small number of tax payers in the economy, and/or increases domestic borrowing, which increases the interest rate and crowds out the private sector. For example, from July 2013 to September 2016, net credit to the central government increased by 40.2 on average per month (year-on-year) compared to 5.3 percent only for the credit to the private sector.
Figure 32: Evolution of Exports, Revenue, and Expenditure (in % of GDP)
Source: World Bank WDI (2016).
Figure 33: Evolution of Inflation Rate and Depreciation Rate (year-on-year basis)
Source: Statistics Sierra Leone.
Figure 34: Evolution of Credit to Government and Private Sector
Source: Bank of Sierra Leone.
Figure 35: Evolution of Interest Rates Applied by Commercial Banks
Source: Bank of Sierra Leone.
Access to Infrastructure (Energy, Transport, and ICT); Credit; and Labor
80. Sierra Leone’s infrastructure deficit in energy, transport, and ICT impedes private sector investment by increasing production and marketing costs and preventing links between internal and external markets. According to the African Development Bank (AfDB), the country’s infrastructure

38
compares poorly to the rest of Sub-Saharan Africa, and it was ranked 46 out of 54 countries on the AfDB’s Infrastructure Development Index (AIDI)9 in 2016 (Figure 36).
Figure 36: Infrastructure Development Index
Source: African Development Bank 2016.
Energy
81. One of the major binding constraints to growth and poverty reduction in Sierra Leone is lack of reliable and affordable energy (electricity) supply services. According to the Government, only about 10 percent of the total population, one of the lowest in the world, of which 95 percent is located in Freetown, is connected to the power network operated by the public utility ‘EDSA’. The rest of the population has no access to electricity service. In Freetown, the power is primarily supplied by the 50 MW Bumbuna hydropower plant, which could only supply 10 MW in the dry season. The existing network and system infrastructure is outdated and far from adequate, and the system is characterized by high technical and commercial losses of 35–38 percent and very low reliability. The lack of dependable capacity and poor network result in very unreliable, even quite unpredictable, power supply to consumers. According to the utility company, the estimated average interruption occurs almost daily and interruption frequency per year is 183 days whereas the average duration could easily go above 10 hours. This results in high supply cost and frequent interruptions to commercial and industrial entities that either have to resort to high-cost diesel generators for backup or align their business and production activities with the power supply schedule. In the vast area of the country where 90 percent of the population have no access to electricity, people are deprived of the opportunity to improved health, education, and other basic services. The lack of electricity also significantly reduces the likelihood for famers to move up in the agricultural chain from cultivation to the processing and marketization. As EDSA starts to purchase more value-added food-processing business,
9 The AIDI is based on four major components: (a) Transport, (b) Electricity, (c) ICT, and (d) Water and Sanitation. These components are disaggregated into 9 indicators that have a direct or indirect impact on productivity and economic growth. The methodology is presented in the AIDI of May 2013.

39
the social and economic cost of inadequate and unreliable power supply is huge as it constitutes as a major barrier to the country’s economic recovery and poverty reduction ambition.
82. Sierra Leone has the opportunity to improve its electricity supply services and expand its coverage to a wider population but also face many challenges. On the one hand, the country needs to accelerate the development of low-cost power like hydro, to provide affordable power. On the other hand, it needs to improve the performance of the Government and public institutions, to improve the efficiency of existing generation and network assets. The institutional framework and procedures for developing and implementing private power projects need to be streamlined and made more transparent, predictable, and genuinely competitive. The cost reduction in renewable energy like solar provides the opportunity for affordable power for local communities, small business, and households through decentralized development modalities. But the institutional model and policy framework to mobilize and incentivize the private sector and local communities are yet to be developed.
83. Adopting a least-cost development approach is critical to sustainable growth of the sector. Sierra Leone has little from fossil resources such as oil, gas, and coal but is endowed with abundant renewable energy resources, particularly hydropower and solar energy. While liquid fuel fired power plants generally have lower capital requirement and short implementation period, they have very high operating costs because of their dependency on imported fuel, which constitutes a foreign exchange drain from the country. International fuel prices also are subject to significant fluctuation as witnessed in the recent past. If capital and operating costs are added, liquid fuel fired power plants are in general much more expensive than renewable energy plants. Internationally very few countries are developing large number of liquid fuel fired power plants to meet electricity needs. Therefore, Sierra Leone needs to develop and implement the least-cost sector expansion plan which would identify the lowest possible electricity to the economy and move the sector toward a sustainable development path. As hydropower requires more preparation work and takes longer to implement, the Government should devote more resources, including donor resources, for up-front preparation work. in the coming years, its financial position could deteriorate quickly if not managed well, which could have major fiscal implication for the Government. While the public utility is struggling with electricity supply in Freetown, there are no institutional and policy mechanisms to promote private sector and local communities to provide electricity service through the development of renewable energy resources for businesses and households in small towns and rural areas.
84. A transparent, predictable, and genuinely competitive process is the key to sustainable private sector participation. There are growing private sector interests in investing in Serra Leone’s power generation sector. Currently, projects are mostly initiated by interest groups without Government solicitation and are not selected following a least-cost expansion approach. Despite the Public Procurement Act, no genuine competitive procurement process has been followed in selecting the developers. The Government’s institutional framework for review and approval of projects is not transparent and its time frame is unpredictable. All these factors significantly increase risks and costs and lead to very few successes. The Government needs to streamline the entire process from project selection and procurement to award, develop world-class standard documents, and implement risk-sharing measures aligned to the country’s risk profile.
85. While promoting renewable energy resources (hydropower and solar energy), Sierra Leone should mitigate the potential impact of climate change. According the Sierra Leone Climate Action Report (CAR-2015) The average annual temperature has increased in Sierra Leone by 0.8C degrees since 1960 and projections suggest an increase in annual temperature by 1.0 to 2.6C degrees by 2060 (at least 0.18C per decade). The average annual rainfall has decreased since 1960 with significant decadal variability, leading to more frequent flooding and droughts. Therefore, climate variability and change pose significant challenges to the availability and quality of the country’s extensive water resources. Seasonal variations in river flows are already significant, with minimal discharges occurring during the dry season,

40
affecting water availability and the hydropower generated from it. For example, most of the electricity distributed in the country is supplied by the 50 MW Bumbuna hydropower plant, which can only supply 10 MW in the dry season. An estimated 40 percent of the country’s protected water points suffer water shortages in the dry season.
Transport
86. The country’s national road network remains underdeveloped despite considerable rehabilitation efforts over the past decade. The road transport system10 consists of an estimated 11,555 km of which 8,555 km are classified as class A (primary), B (secondary), or F (feeder) roads, including 3,000 km of local and township roads. The country has 1,325 km of paved roads, representing 11.5 and 34 percent of the total and core (primary and secondary) road networks, respectively (SLRA, 2017). However further progress has been made over the years to improve the overall condition of the primary road network. According to the National Rural Feeder Roads Policy, 39 percent of the primary road network is in good condition, with 33 percent and 28 percent considered to be in a fair and poor condition, respectively, whereas less than 20 percent of feeder roads are in good to fair condition. Consequently, the poor state of feeder roads and the lack of regular transport services present an impediment to personal travel and evacuation of agricultural products.
87. The current state of the road network constrains the development of the agricultural sector. Road access from productive agricultural lands to urban markets remains poor. Only 21 percent of the rural population lives within 2 km of an all-season road. As a result, new investments in roads are needed, particularly in the less accessible areas of the southeast. Sierra Leone would need to add about 5,000 km of road to provide access to land that accounts for 80 percent of the country’s agricultural value. Furthermore, feeder roads are not being graded regularly, adding to the cost of moving agricultural products to markets, with some roads becoming impassable during the rainy season. For example, the cost of transportation from the breadbasket district of Kailahun to Kenema increases by one-third during the rainy season. Transit time by truck increases from one day in the dry season to three days or more in the rainy season, severely limiting market access at the time of year when household food security indicators are the weakest.11 More recently, the poor road conditions significantly hampered the Ebola response efforts. The ability to reach health and laboratory services was significantly affected due to the poor conditions and lack of roads.
88. Intermodal connectivity has the potential to improve internal mobility and support regional integration. There are about 800 km of rivers and waterways in Sierra Leone, of which 600 km are navigable all year round. If developed, water transport offers lower-cost alternatives to road transport. At present, mobility in Freetown is severely impaired due to poor infrastructure, poor management of road space, inadequate public transport, a national vehicle fleet which is in poor condition, and a weak institutional and regulatory framework. The congestion within the city and loss in man-hour time is a great loss to the economy. However, the potential to use water transportation between the western and eastern parts of Freetown could potentially reduce congestion and travel times in Freetown metropolis. There is already one important waterway being used for transportation: the estuary crossing between Freetown and the international airport at Lungi. The estuary crossing by vessel is about 30 minutes compared to three hours by car. However, the different existing modes of crossing the estuary (for example, water taxi, ferries, and country boats) are either unsafe, unreliable, expensive, or a combination of these factors. As the potential of using waterways is largely unexplored, the Government could conduct a systematic review of the waterway transport strategy and develop the most viable options. It is very critical to improve Freetown
10 Infrastructure and Growth in Sierra Leone, AfDB 2011.

41
Port connectivity by improving port access roads as well as truck parking to improve the efficiency at the port.
89. As for the agriculture and energy, the transportation sector is vulnerable to climate change. With the increased variability, and increase in the intensity of rainfall is expected in the coming decades. This is expected to exacerbate the existing impacts of floods, including damage to critical service and transport infrastructure. Floods account for 85 percent of disaster-related mortality in the country, followed by landslides and storms. Recurrent flash flooding in urban areas and coastal flooding are common and occur every year during the rainy season.
ICT
90. The ICT sector has shown robust growth in terms of mobile telephony, though progress on high-speed Internet has been slow. As in the rest of Africa, mobile phone use is growing in Sierra Leone, increasing from a penetration rate of 41.9 percent in 2010 to 66.4 percent 2014. However, the rapid growth was stunted in 2014, as the mobile market consolidated. Today, mobile phones offer a significant platform for the delivery of services in the country. High-speed Internet use in the country increased from only 0.1 percent in 2010 to roughly 11.5 percent in 2014. However, the uptake of broadband remains a work in progress despite its positive trend.
91. Sierra Leone has created a broadband infrastructure, but further actions are needed. In 2013, Sierra Leone connected with Africa Coast to Europe (ACE), an undersea communications cable linking West Africa with Europe, bringing high-speed Internet to the country. The ACE landing in Sierra Leone is currently operated as a government-managed monopoly, affecting both the price and coverage of telecommunications services in the country. The Government is building terrestrial fiber networks to carry Internet traffic to urban and rural centers throughout the country. However, to provide the populace with access to affordable, reliable, and high-quality Internet, the Government will need to continue to facilitate infrastructure development by collaborating with the private sector and advocating for a policy of open access and competition.
92. The bottlenecks to the growth of the ICT sector in Sierra Leone stem from their policy and regulatory processes. In addition, the NRA’s recent shift in focus from the declining mining sector to the ICT sector is another cause for concern. The recent liberalization of the international gateway has given rise to new policy decisions which may inadvertently reverse the perceived benefits of liberalization. Both the National Telecommunications Commission (NATCOM) and NRA are exploring options to ensure that the risk of fraud is minimized while also ensuring an acceptable level of revenue assurance. The creation of a new dominant structure in the form of Sierra Leone Cable Company (SALCAB) has already started to diminish the expected benefits of competition. The Government’s decision to combine all Government-owned wholesale telecommunications infrastructure projects (for example, the ECOWAN fiber backbone network and other backbone assets) that are nearing completion into the SALCAB entity is potentially creating a dominant operator.
Access to Credit
93. The country’s financial system faces substantial challenges. The banking sector includes 13 banks with US$1.1 billion in assets, the majority (10) of which are foreign owned but two state-owned commercial banks continue to play a key role. There are 17 community banks (with total assets around US$7 million) and 10 micro-finance institutions (only one deposit taking), but the growth of these institutions is limited, as they suffer from poor governance, weak internal controls, limited infrastructure, and lack of ICT. There are also two discount houses that focus mostly on government security transactions (with total assets of around US$4 million) and 39 foreign exchange bureaus that mostly service Freetown.

42
There is one mandatory social security/pension fund, the National Social Security and Insurance Trust (NASSIT), with assets of around US$150 million in 2013, but its development has been stifled by poor governance, a lack of accountability and transparency, a series of dubious property investments, and high administration costs, probably rendering it underfunded and posing significant fiscal risk for the Government.
94. Despite the entrance of a number of international banks over the past decade, the three domestically owned banks remain the most significant lenders, with 44 percent of loans to the private sector and Government at the end of December 2014. A major challenge in the financial sector is the weak financial positions of the two state-owned banks that hold 33 percent of the assets in the system, and poor asset quality in several other banks. An audit financed the World Bank Group concluded that both institutions have negative equity and their nonperforming loans (NPLs) exceed 75 percent of gross loans in 2016. A crucial first step in improving the soundness of the banking sector will be to forcefully restructure the two banks. Previous efforts to address the situation, including recapitalization with pension funds, though have not been successful. An effective resolution is therefore needed, though its fiscal cost would be significant.
95. Low profitability further affects the ability of institutions to absorb shocks. Returns on assets fell from 3.7 percent in December 2012 to 1.8 percent in September 2014 and June 2015, while return on equity fell from 17.2 to 9.8 and 9.4 percent, respectively, over the same period. The decline in commercial bank profitability is predominantly due to a substantial accumulation of short-term government securities (over 60 percent of domestic lending at end-December 2015 compared with 35 percent in 2011) and the sharp decline in yields on government securities (3-month bill yield down from over 25 percent in 2011 to around 2 percent at end-2015). The trend increase in nonperforming private sector loans and the rising cost of sustaining branch networks with little access to basic infrastructure also contributed to declining profitability. While the assets of commercial banks grew by 80 percent between 2011 and 2015, private sector lending grew only a third of this rate, while lending to the central government expanded at three times this rate. Private sector credit levels remain low at 10 percent of GDP compared to more 20 percent in the Economic Community of West African States (ECOWAS) region, reflecting crowding out from public borrowing.
96. Access to capital appears to be a binding constraint to the entry of new entrepreneurs as well as for existing businesses. According to the 2014 LFS, over half (56 percent) of the unemployed who were not searching for work wanted to start their own businesses but lacked the capital or resources to do so. Similarly, nearly half (47 percent) of household enterprises reported that they were unable to borrow the necessary capital for their businesses. The initial level of capital invested in household enterprises is positively correlated with enterprise size, revenues, and profits, indicating that difficulties in obtaining capital may be limiting the growth and productivity of firms. Many households seek to bypass the formal credit market by borrowing start-up capital from family and friends (40 percent of those able to borrow), suggesting that the market is indeed constrained.
97. Only 15 percent of Sierra Leoneans have access to financial services, which is due in part to banking sector weaknesses but also to an array of other factors such as limited geographical outreach and high cost of branches, the cost of credit, poor financial sector infrastructure, and the crowding out of credit to the private sector. The extension of financial services to the rural population (60 percent of the population) is inherently limited by the concentration of financial institutions in urban areas. Additionally, only 1 percent of individuals are covered by the BSL’s credit registry, which means that banks are unable to properly check individuals’ credit histories, which increases the risk of lending. Despite progress, the country’s payment system infrastructure (including mobile money) is underdeveloped. Finally, outreach of the microfinance and community banking sectors is limited by poor governance and communication technology.
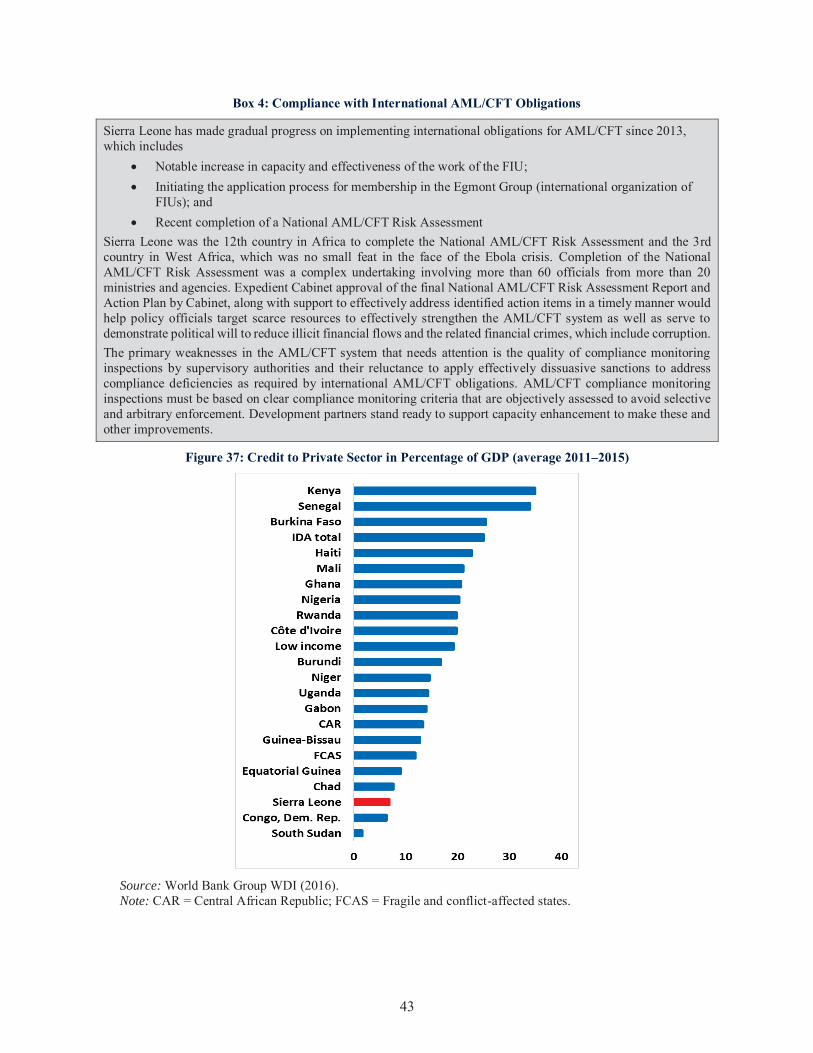
43
Box 4: Compliance with International AML/CFT Obligations
Sierra Leone has made gradual progress on implementing international obligations for AML/CFT since 2013, which includes
Notable increase in capacity and effectiveness of the work of the FIU; Initiating the application process for membership in the Egmont Group (international organization of
FIUs); and Recent completion of a National AML/CFT Risk Assessment
Sierra Leone was the 12th country in Africa to complete the National AML/CFT Risk Assessment and the 3rd country in West Africa, which was no small feat in the face of the Ebola crisis. Completion of the National AML/CFT Risk Assessment was a complex undertaking involving more than 60 officials from more than 20 ministries and agencies. Expedient Cabinet approval of the final National AML/CFT Risk Assessment Report and Action Plan by Cabinet, along with support to effectively address identified action items in a timely manner would help policy officials target scarce resources to effectively strengthen the AML/CFT system as well as serve to demonstrate political will to reduce illicit financial flows and the related financial crimes, which include corruption. The primary weaknesses in the AML/CFT system that needs attention is the quality of compliance monitoring inspections by supervisory authorities and their reluctance to apply effectively dissuasive sanctions to address compliance deficiencies as required by international AML/CFT obligations. AML/CFT compliance monitoring inspections must be based on clear compliance monitoring criteria that are objectively assessed to avoid selective and arbitrary enforcement. Development partners stand ready to support capacity enhancement to make these and other improvements.
Figure 37: Credit to Private Sector in Percentage of GDP (average 2011–2015)
Source: World Bank Group WDI (2016). Note: CAR = Central African Republic; FCAS = Fragile and conflict-affected states.

44
Labor Regulation
98. Sierra Leone lacks adequate and relevant labor policy and legislation, and there are no comprehensive regulations for labor market operations in the country. Many of the important laws regulating the labor market in Sierra Leone date back to 1960, a year before independence. These include the Employers and Employed Ordinance and the Trade Unions Ordinance. The labor laws are currently being revised in Sierra Leone. While a comprehensive labor policy is still lacking, the minimum wage for public sector workers increased in mid-2015 from Le 480,000 per month to Le 550,000 (about US$80). While there are existing regulations on end-of-service benefits, the country has yet to roll out programs from its National Employment Policy, which launched in 2012. Despite this, the country remains a signatory to all eight fundamental conventions of the International Labor Organization regarding freedom of association, elimination of compulsory labor, elimination of discrimination, and abolition of child labor.
Interaction with Public Officials
99. The country suffers from a poor private sector business environment, which is constraining both domestic and foreign investment. Sierra Leone is experiencing stagnation and deterioration in its business environment and is struggling to regain and sustain reform momentum. In the World Bank’s Doing Business 2017, Sierra Leone ranked 148 out of 190 countries, which was a drop from 145th place the previous year. Besides poor infrastructure and access to finance, investors face a number of regulatory and administrative barriers. The major issues cited by businesses include corruption, tax rates, and workforce education (Figure 38).
Figure 38: Most Problematic Factors for Doing Business
Source: World Economic Forum, Executive Opinion Survey 2016.
100. A further constraint to accelerated growth and poverty reduction is the continued overwhelming interference of Government in the economy. The large role of state-owned enterprises is a legacy of post-independence history and so are their inefficiencies, reflecting weak management and frequent political interference in their operations. The most critical inputs to the production and commercialization process (electricity, water, transportation, loans and credits, and so on) are currently provided by state-owned enterprises that are characterized by low productivity and poor financial performance.

45
101. Efforts to liberalize state-owned enterprises have been hampered by the political and economic environment. In 2002, a National Commission for Privatization was established with the objectives to (a) serve as the policy and decision-making body with regard to the divestiture and reform of public enterprises and (b) ensure the management of all public enterprises and eliminate the interference in the management of public enterprises from line ministries, thereby ensuring transparency, corporate governance, and avoidance of conflict of interest in the affairs of public enterprises. A total of 24 public enterprises were listed for divestiture in the first schedule of the act. The Commission’s plan was to privatize all loss-making enterprises engaged in production or trade in services and operating in competitive markets and improve the efficiency of the large public enterprises, especially utility companies since outright sale was not financially or politically feasible in the short term. In the meantime, management contracts, performance contracts, and joint venture leases would be offered while the legal, organizational, managerial, and financial aspects of such enterprises were being restructured before they were to be offered for sale. However, the plan was not implemented and the Government continues to heavily distort the domestic market and constrain private sector development. The Government should focus on creating a level playing field and suppressing the noncompetitive behavior of some state-owned enterprises by reducing its direct operation in competitive markets. It should also increase autonomy and efficiency of the large public enterprises that are slated to remain in the public domain, especially utility companies.
Opportunities
102. There are few targeted interventions that could yield quick results in terms of economic growth and job creation while also improving the overall business environment. Current efforts to improve the business environment will only yield effects in the medium to long term. In the meanwhile, Sierra Leone could implement targeted interventions to increase the productivity of the informal sector and encourage private investment in select value chains, such as food processing for rice and fish.
Productivity Increase in the Informal Sector
103. Despite their low productivity, informal enterprises are a significant source of nonfarm employment and income in Sierra Leone. With the absence of significant social safety net programs, most adults must work to survive. There is a widespread assumption that the informal economy expands during economic downturns and contracts during periods of economic growth, making it countercyclical. Though it may expand during economic downturns, there is no evidence that the informal sector contracts during periods of economic growth. On the contrary, the recent economic growth experienced during the postwar period was associated with an increase in informal employment. This may signal a failure of the formal sector to respond to the growing aggregate demand or a complementarity between the formal and informal sector, especially between formal whole sales and informal retail trade.
104. Facilitating access to credit and training programs for a targeted number of informal entrepreneurs could have significant productivity spillover effects. Other than their own labor, informal enterprises have less valuable factors of production, such as capital and technology, compared to formal businesses. Informal enterprises also have less bargaining power to demand an adequate share of the value added generated in the value chain they operate in, but the level of competition between informal firms is generally high, making the diffusion of new technology more likely. For example, a World Bank-supported employment program in Sierra Leone increased overall employment and the likelihood of starting a small enterprise, gains which increased household consumption and built resilience to shocks from the Ebola crisis. The program induced changes in the perceptions of nonfarm self-employment. Impacts were higher for lower ability youths who received skills training, suggesting that simple noncognitive tests may be useful for targeting employability programs aimed at the urban youth.

46
Food Processing Value Chains
105. In addition to the improvement of the overall business environment to create conditions for the emergence of new enterprises, Sierra Leone should also tap into its potential for vertical diversification by promoting the development food value chains, especially rice and fisheries. The food processing value chain transforms the raw commodities produced by farmers into the foods purchased and eaten by consumers. The costs of storage, transportation, and processing are an integral part of food price formation. Since the producer and consumer are often different individuals, commodities are owned by different actors before reaching the final consumer. This process of exchange that takes place in markets is conducted only when a price has been agreed on between buyer and seller. Therefore, price policy plays a critical role in developing food value chains.
Rice Processing
106. Sierra Leone is still a net importer of many food commodities, including rice, the most consumed staple food. Domestic consumption increased by 5.7 percent on average per year between 2001 and 2015, driven mainly by local production, which increased by 10.4 percent on average per year. Rice imports continue to increase by 3.4 percent per year, a slower pace than local production, leading to a decline of its market share to 20 percent in 2015, down from 56 percent in 2001. In 2015, total consumption was estimated at 1,00,000 tons of milled rice, with 800,000 tons of local production and 200,000 tons of imports. A large proportion of the imported rice is consumed in Freetown and to a lesser extent in the other urban areas. Only a small proportion of imported rice is consumed in rural areas, mainly in July and August during the lean season when the stock of locally produced rice is the lowest.
107. Given, the country’s natural comparative advantage in rice production, developing the rice value chain is a plausible policy. Pursuing import substitution policy can benefit both rice producers and consumers, improve food security and save the country’s scarce foreign exchange (more than US$100 million per year since 2012, or one-fifth of the international foreign reserves). For this to happen, there is a need to improve the productivity and the competitiveness of domestic rice, including the regulatory framework that would attract strong private sector investment in rice milling and trading.
108. There are two rice value chains that can be distinguished in Sierra Leone, a traditional value chain and an emerging modern value chain. According to Fornah, Spencer, and Wilson12 (2014), about 187,000 metric tons of paddy rice are marketable surplus of rice in Sierra Leone, representing 10 to 15 percent of the domestic production. A large part of this surplus goes through the traditional value chain which accounts for 85 to 90 percent of the marketable surplus. The traditional rice value chain starts with domestic production by smallholder farmers and ends with supply of rice of relatively poor quality (raw milled or parboiled, with over 35 percent broken grains and containing small black stones) to both rural and urban consumers. A very small part of this production reaches Freetown, the largest city of the country. Only a small part, 10 to 15 percent, is channeled through the emerging modern rice value chain. The modern rice value chain starts with production from smallholders as well as large-scale producers who market rice through institutional buyers such as the World Food Programme and the Sierra Leone Produce Marketing Company (SLPMC) or through large rice mills (Agricultural Business Centers [ABCs], Farmer Based Associations [FBOs], Mountain Lion) who process and market their own produce as well as produce by neighboring farmers. The modern value chain markets rice of similar quality as imported rice to consumers.
109. Increasing the share of the modern value chain could create better jobs, especially for youth and women, in rural and other urban areas. According to Spencer et al. (2014), there were 401 rice mills
12 Value-chain analysis in the rice sector in Sierra Leone, World Bank background paper (2014) http://www.eds-sl.com/docs/ValueChainAnalysisinTheRiceSectorofSierraLeone22.09.14.pdf.

47
in Sierra Leone in 2014, of which 71.2 percent were small with capacity below 0.5 ton per hour, 26.1 percent were medium with capacity between 0.5 ton and 1 ton per hour and 2.7 percent were large, with capacity above 1 ton per hour. Among the 401 rice mills, 42 (10 percent) were not operational, including the 11 large rice mills. Among the operating rice mills, only 27 percent were privately owned while the remaining 73 percent were created by donor-supported projects that encouraged the creation of FBOs, which owned 30 percent of the rice mills, and ABCs, which owned the remaining 43 percent. Out of the 11 large rice mills that are not operating, 6 were state owned and in various stages of privatization. Most the workers in the formal rice milling companies are young men, while women, especially for the parboiling, dominate the employment in ABCs.
110. The number of nonfarm jobs generated by the rice mills is important but further development of the value chain is constrained by the competition from subsidized rice imports. Currently, the tariff on rice imports (15 percent) is waived while the exchange rate is often manipulated to reduce import prices. Figure 39 shows the relationship between the change in the exchange rate and the evolution of the share of imported rice in the consumption. When the exchange rate appreciates, the share of imports in total consumption of rice increases and when the exchange rate depreciates, the share of imports in total consumption of rice diminishes.
111. The Economic Community of West African States (ECOWAS)’s regional offensive to boost rice production offers the opportunity for Sierra Leone to transform it rice sector. As in Sierra Leone, rice is a strategic commodity for food security in West Africa. Regional consumption of milled rice has grown rapidly over time as a result of population growth, urbanization, and increasing purchasing power. According to the International Food Policy Research Institute (IFPRI)13, consumption of rice is expected to increase from 44 kilograms on average per capita in 2011 to 53 kilograms per capita in 2025. Total rice consumption is projected to increase by 74 percent to reach 24 million metric tons by 2025. The required average annual increase in production to achieve the self-sufficiency goal by 2025 is estimated at 8 percent per annum, twice the expected consumption growth of 4 percent. Dependency on imported rice exposes the region to external shocks stemming from the global market. Given its economic and social importance, the ECOWAS is actively supportive of national strategies under a regional offensive to boost rice production and meet the challenge of rice self-sufficiency in the region by 2025. In October 2013, the ECOWAS created a customs union by adopting the final structure of the ECOWAS Common External Tariff (CET), which established a fifth band of 35 percent to enter into force in January, 2015. Given the strategic role of rice, many stakeholders (mainly farmers’ organizations) expected rice to be classified into the fifth tariff band (35 percent), but the final structure of the ECOWAS CET has classed it in the categories of 5, 10 and 20 percent depending on the types of imported rice. Nevertheless, the creation of the regional market creates new export potentials for Sierra Leone, which possesses comparative advantage in rice production.
13 “Impact Simulation of ECOWAS Rice Self-Sufficiency Policy”. IFPRI Discussion Paper 01405. http://ebrary.ifpri.org/cdm/ref/collection/p15738coll2/id/128894

48
Figure 39: Evolution of Rice Balance Sheet (in tons of milled rice)
Source: World Rice Statistics, FAO, United States Department of Agriculture (USDA), World Bank Group, World Trade Organization (WTO).
Figure 40: Change in Exchange Rate and Evolution of Market Share for Rice Imports
Source: World Rice Statistics, FAO, United States Department of Agriculture (USDA), World Bank Group, World Trade Organization (WTO).
Fish Processing
112. Sierra Leone has a valuable marine ecosystem able to support populations of demersal fish and crustaceans and attract large and small pelagic stocks shared with regional countries. Total production from the industrial and artisanal fisheries is estimated at about 200,000 metric tons per year, representing a nominal value of Le 2,750 billion (about US$541 million per annum), or 12 percent of GDP in 2015. Fish is a major source of animal protein for over 80 percent of the country’s population and the

49
sector currently employs thousands of Sierra Leoneans, with women at the forefront of many activities (particularly fish processing and marketing).
113. There is scope for increasing profitability in artisanal fishing. Promoting artisanal fishing offers an attractive path for economic development since the sector is labor intensive and therefore able to generate much needed jobs. Furthermore, it has a ready domestic market (80 percent of Sierra Leone’s protein requirements are met with fish) with a future export potential, and it offers opportunities to move up the value chain with improved processing. The necessary steps to improve the sector are also relatively well-known and studied. First, effective environmental protections need to be put in place to safeguard the long-term health of the industry. Second, post-catch facilities need to be improved to offset any reduction in total catch. Fishery products are generally not well handled due to limited cold storage available onboard fishing vessels and after landing. The poor sanitary conditions and hygiene of canoes and landing sites lead to further deterioration of the quality of the catch, which results in a high spoilage rate, estimated at over 30 percent of the catch. Market access is also limited because of poor infrastructure and insufficient sanitary controls by authorities. Finally, there are almost no processing facilities in Sierra Leone that are capable of meeting export standards.
114. Due to excess industrial fishing effort, the fish resources are deteriorating and the sector’s sustainability is threatened. As in many other countries, fisheries in Sierra Leone is characterized by overcapacity and overexploitation of fish resources. Based on the recent analysis of available information, the level of fishing effort of both industrial and artisanal sectors is currently too high relative to the estimated level that ensures biological sustainability with highest yield (maximum sustainable yield [MSY]). That is, unless fishing effort is reduced, the stocks would approach depletion and potential collapse. However, the analysis is based on reported rather than observed or actual catches. It is widely believed that there is considerable underreporting of fish catches and as a result, the actual pressure on the resources by the current fishing effort is likely much higher. It is therefore crucial that the Government takes actions to control all fishing effort.
115. The root cause of the excess fishing effort is the weak governance of the fisheries sector. The current arrangements encourage individual vessels to fish as much and as fast as possible before others do. Introduction of institutional arrangements that align individual fisher incentives to limit the aggregate fishing effort to an optimal level is prerequisite for achieving the potential that the rich natural renewable asset offers the country. There is also a need to consider alternative monitoring arrangements that would allow more reliable observers on vessels to monitor and report fish catch.
Box 5: Illegal, Unreported, and Unregulated Fishing Activities in Sierra Leone
Greenpeace and Sierra Leonean authorities inspected and boarded seven vessels during a four-day joint surveillance of Sierra Leonean seas. More than half of the inspected vessels are suspected of illegal fishing activity. Three vessels have been arrested for infringements of Sierra Leone fishing legislation, including possessing or using illegal fishing nets on board, no visible marking, and a lack of required paperwork, including logbooks and authorization for unloading catch. Fishing authorities ordered the vessels to return to Freetown port for further investigation. According to the Greenpeace Africa Oceans campaigner, the findings from just four days of surveillance in Sierra Leone are further evidence that West Africa needs to strengthen its fisheries management. The region’s marine resources are being depleted at alarming rates, mainly due to too many boats competing for too few fish and high rates of illegal, unreported, and unregulated fishing. This ongoing plunder is a threat to millions of people in the region who depend on the oceans for their food. Currently, 140 vessels are licensed to operate in Sierra Leonean waters, including tuna purse seiners, demersal and shrimp trawlers, and shrimps and mid-water trawlers targeting pelagic fish like sardinella and mackerel. Nearly half of all the vessels in the country’s waters are owned by Chinese companies and 40 percent by European Union companies.

50
Nearly 1 million of Sierra Leone’s population of 7 million depend on fish as a main part of their income and diet. Overfishing and illegal fishing are a direct threat to their food security and livelihoods. Greenpeace is demanding a stronger fisheries management to help put an end to overfishing and illegal fishing in West Africa. Governments of coastal states and fishing nations must take more responsibility and work together to manage both foreign and local fishing activities and ensure the environmentally sustainable and socially equitable distribution of these resources.
Source: http://www.greenpeace.org/africa/en/Press-Centre-Hub/4-illegal-fishing-cases-found-Sierra-Leone/.
STRENGTHENING THE MANAGEMENT OF MINERAL RESOURCES
116. Despite employing only 1.5 percent of the workforce, the mining sector plays an important role in Sierra Leone’s economy. Sierra Leone’s known mineral deposits include approximately 14.5 billion MT of iron ore, 4.7 billion MT of magnetite, 108 million MT of bauxite, 867 million MT of rutile, 11.2 million carats of diamonds, and 4.5 million ounces of gold (Sierra Leone National Mineral Agency, February 2017). From 2012 to 2014, the extractive industry boomed in Sierra Leone to represent 14 percent of GDP on average per year, up from 3.7 percent on average in the period 2009–2011, and account for 70 of merchandize exports, up from 38 percent in 2009–2011. These performances were mainly driven by the starting of operations of two large-scale iron ore companies attracted by the high level of iron ore prices and the reform of the mining sector. Sierra Leone modernized the legislative framework for the mining sector which improved the overall governance in the sector. The 2009 MMA and 2011 Petroleum Act provided legislative grounding for sector operations while the establishment of the NMA created technical and regulation capacity.
117. However, the boom did not translate into commensurate welfare improvement of a large number of Sierra Leonean citizens. Not only did the share of the mining sector remain low in total employment (1.5 percent), but the Government revenue mobilized from the extractive industry remained well below potential. If Sierra Leone’s fiscal regime (see Table 1) for the mining sector was fully applied, revenue collected between 2012 and 2014 would have reached 11.8 percent of GDP, more than triple of the actual revenue collected in the period (3.7 percent of GDP). Most of the counter-performance partially reflects the discretionary weaknesses remaining in the legal and regulatory framework. The 2009 MMA and 2011 Petroleum Act are rife with allowances for discretionary practices, leaving the Government and license holders to rely on highly interpretive and often personalized agreement on operating terms. Without correction, including in strengthening the regulatory capacity of the sector, it will be challenging to effectively manage the sector and to adequately capture revenues, safeguard the environment, and ensure long-term benefits to the country.
Sierra Leone’s main opportunity for accelerated development and economic transformation lies in the strategic management of its abundant mineral resource rents. This requires not only translating the exhaustible mineral assets into physical and human capital but also strengthening transparency and accountability in the decision making processes, ensuring environmental sustainability, and managing the macroeconomic volatility created by the mining sector.

51
Figure 41: Mining Value Added and Income Paid to Non-residents (% of GDP)
Source: Statistics Sierra Leone, BSL, IMF, and World Bank Group.
Figure 42: Potential and Actual Revenue from Mining (% of GDP)
Source: Ministry of Finance and Economic Development and World Bank Group.
118. The challenge for sustainable mining is to remove the impediments to sectoral growth and lower the country risk while at the same time establishing high environmental standards and community inclusion. Challenges spawned by mining development are numerous—the central one being governance. Meeting these challenges requires well-developed and strong institutions. In this regard, the country has made a commendable start with respect to modernizing the legislative framework for the sector and in improving transparency. Mining in Sierra Leone was previously considered to be highly secretive. According to the EITI, more than 50 percent of diamond miners were unlicensed in 2004. However, in the past five years the government reformed the public administration of mining licenses and started implementing an electronic mining cadastre system. Since 2015, licenses and payments are published on an online repository accessible to the public14. That has been complemented through the establishment of an independent regulator with a clear emphasis on technical strengths—the NMA). A new Minerals Policy (MP) and Artisanal Mining policy (AMP) have been prepared. Despite these improvements, the decision-making process to award large mining contracts remains opaque and leave large discretionary power to the negotiators.
119. The main constraint to maximizing revenue from the mining sector is the lack of or arbitrary application of the legal framework governing the mining sector, including the fiscal regime. The fiscal regime for the extractive sector is defined in the Income Tax Act (2000) and its regulations and amendments, the 2009 MMA, and the Finance Act (2015). Other legislations within the mining fiscal regime include the Customs Act and Tariffs, the Excise Act 1982 governing the excise duties including those on fuel, and the Goods and Services Tax Act 2009 (GSTA). The main fiscal tools are corporate income tax and mineral royalty. Corporate income tax rate is set at 30 percent of corporate profits. When chargeable income is below 7 percent of turnover in a year, and additional 3.5 percent is applied on turnover. In addition to corporate tax and mineral royalty, other revenue streams for the mining sector include exploration license; mining license; surface rental; Environmental Impact Assessment (EIA) fees; EIA monitoring fees; Agricultural Development Fund/Community Development Fund; and taxes levied on consumption such as value added taxes, personal income taxes, and sales taxes. However, the overall fiscal regime is not always applied because of the prevalence of special agreements in place. As a result, the corporate income tax rate varies among mining companies. While it is 30 percent for the majority of the contracts, it is fixed at 25 percent for African Minerals Ltd., 6 percent for London Mining Ltd. during the
14 The Online Repository draws data directly from the Mining Cadaster Administration System (MCAS) used by the National Minerals Agency. The Online Repository cas be accessed at sierraleone.revenuesystems.org.

52
first three years of operation, 25 percent the next seven years, and 30 percent thereafter. At the same time, Sierra Rutile enjoyed tax holidays for corporate income tax, import duties, and dividend withholding tax between 2005 and 2014.
Table 1: Summary of Fiscal Regime in Sierra Leone
Source: Sierra Leone EITI 2014 report (December 2016).
120. In addition, the recent evolution of the mining sector has increased the volatility of the economy. Sierra Leone is one of the most volatile economies of the world. Between 2013 and 2015, GDP growth fluctuated from −21.1 percent to +20.7 percent, yielding a standard deviation of 10.8 compared to an average growth of 5.2 percent between 2006 and 2015. The fluctuation in GDP growth in Sierra Leone was more than double the variance of growth in neighboring countries such as Guinea and Liberia that faced similar variation in the terms of trade with the collapse of the international prices of iron ore in 2015. Compared with a list of benchmark countries using other macroeconomic variables such as the inflation rate, the exchange rate or the Government expense confirms the relatively high volatility of the Sierra Leonean economy.

53
Figure 43: Volatility of Selected Macroeconomic Variables, Measured as Standard Deviation Calculated in 2006–2015
Source: World Bank Group WDI (2016). Note: CAR = Central African Republic; DRC = Democratic Republic of Congo; FCAS = Fragile and conflict-affected states; SSA = Sub-Saharan Africa.
121. While maximizing the revenue derived from extractives, Sierra Leone should also avoid past pitfalls. The pitfalls associated with large influx of mineral revenue have been termed as the natural resource curse. They often manifest themselves in different ways, including (a) increase in volatility due to oscillating commodity prices in world markets that harm private investment and economic growth over time; (b) real appreciation of the local currency that increases the relative price of non-tradable sectors compared to tradable sectors, reallocates resources from the tradable sector to the non-tradable sector, and undermines the competitiveness of the domestic enterprises for both exports and import substitution; (c) increase in rent seeking that results in socially inefficient spending and allocation of resources preventing widespread sharing of resource rents; and (d) false sense of security that leads to an underinvestment in human and physical capital.
122. To avoid these mistakes, Sierra Leone should adopt a prudent fiscal rule when spending its mineral revenues. Sierra Leone could combine the ‘bird-in-hand rule’ with the permanent income approach in the management of its natural resources wealth. In the application of the ‘bird-in-hand rule’, the country would save all mineral revenue as financial assets and spend only up to what has been accumulated (in hand). This approach gives privilege to building buffers to create enough delay for adjustment in the case of large fluctuation in influx of revenue. The ‘bird-in-hand’ rule is usually seen as

54
the most conservative and prudent way to manage natural resources revenues. The permanent income rule restricts spending from mineral revenue funds to a level that can be maintained over a long period. It essentially entails saving in boom periods and dissaving in bust periods by calculating a stream of income that is equal in net present value to the projected revenues. Permanent income is relatively unresponsive to commodity prices and mineral production and insulates the expenditure from current shocks.
123. Alongside larger-scale extractives activity, there is a need to develop artisanal and small-scale mining (ASM). ASM accounts for 40 percent of the total export earnings from the mining sector and up to 70 percent of the diamond exports. The activity takes place in every district and in 80 out of the 149 chiefdoms. The industry is characterized by limited skills, low capital investment, absence of infrastructure, low understanding of reserves, and short implementation time. At the same time, artisanal mining poses many environmental and social challenges, including environmental degradation, pollution, and destruction of vegetation, other land uses, and use of child labor. For the sector to thrive and effectively provide benefits to mining communities and to the economy, there is a need to change the way the subsector operates. This could be done by focusing on (a) ensuring adequate legal, institutional, and regulatory capacity to manage the industry; (b) better understanding of mineral resources for more efficient mining; (c) improving mining productivity and safety through adoption of improved mining techniques that directly affect the working environment and the quality of life in the mining fields; (d) building or rehabilitating regional infrastructure linking the mining fields to markets and basic services; (e) maximizing use of legitimate marketing channels; (f) creating opportunities for value-added cutting, polishing, and jewelry manufacture of semiprecious stones; and (g) encouraging general economic links from mining activities. A new Artisanal Mining Policy (AMP) has been prepared to guide sector development and strengthen governance.
124. Environmental impacts must also be managed. The Environmental Protection Act (EPA 2008) regulates the environmental activities in the mining sector. If mining activities, either commercial or artisanal, were to pollute the land or water, or if water resources were diverted for industrial purposes, the consequences on a largely agrarian economy could be dire. The negative externalities would be compounded by the customary land system used in much of Sierra Leone which would make it difficult for households to relocate outside of traditional family areas.
125. In addition, there is a need to build Sierra Leone’s geological knowledge infrastructure to fully comprehend and measure the country’s mineral potential. There is an overall consensus that lack of knowledge about mineral resources potential hinders the development of resource-rich countries, preventing them from getting the best value out of their resource endowment.
INCREASING HUMAN CAPITAL FOR NEW OPPORTUNITIES
To create the conditions for economic growth and poverty reduction, Sierra Leone must invest in its people, particularly the poor. The country’s public service delivery is currently inadequate to meet the population’s basic needs and develop human capital. It is therefore critical that Sierra Leone improves its human capital to be able to take advantage of new opportunities in an increasingly information-based global economy.
126. Sierra Leone is one of the poorest countries within Sub-Saharan Africa and globally, with a GDP per capita of US$684 in 2015. It ranked 179 out of 188 countries on the United Nations 2016 Human Development Index, below the average for countries with similar GDP per capita (Figure 44).

55
Figure 44: GDP per Capita and Human Development Index
Source: World Bank WDI and UNDP Human Development Index.
Opportunities
127. Beyond its natural resources, Sierra Leone’s most substantial asset is its young and dynamic population. Like natural resources, this resource must be properly developed to be an asset for economic growth. The difference between a potentially detrimental youth bulge and a beneficial, dynamic young workforce is the level of a country’s human capital, particularly as it relates to health and education.
128. Improving human capital to promote growth will require a dramatic increase in the quality of public services. In the short term, better public service provision will free up household resources previously used to purchase similar services in the private sector, allowing for increased consumption or for productive investments. This alone can improve outcomes, as lack of funding or capital was identified as the main reason for not sending children, particularly girls, to school and a key reason for not starting or expanding businesses and farming activities (2014 LFS). In the medium term, an increase in human capital resources on the national level will improve the business climate, boosting the output of private sector activities and the attractiveness of Sierra Leone for future investment. Improved health also reduces days lost to illness, increasing the supply of labor for agriculture or informal nonfarm enterprises. Furthermore, quality education has been shown to improve the uptake of modern farming practices and allow fishermen and fish traders to move up the value chain (Bamber, Abdulsamad, and Gereffi 2014). This offers two channels for poverty reduction. First, it directly increases the income of the poor, as agriculture and fishing are key sectors of employment for this group. Second, higher production of rice (staple grain) and fish (main protein source) would reduce their prices and increase consumption, thereby improving food security and nutrition for poor households. Better services in rural areas can also reduce migration to urban areas that are already under pressure to provide basic services and jobs. In the long term, healthy and educated people living in stable conditions will constitute a ready workforce for new FDI in the manufacturing and service industries or increased domestic entrepreneurial activities.

56
Constraints
Education
129. There are both supply- and demand-side constraints to the acquisition of skills in Sierra Leone. The country’s uneducated workforce prevents the economy from evolving into areas requiring higher skills, depressing demand and incentives for individuals to seek out training opportunities. On the supply side, constraints to skills acquisition include an outdated curriculum that is not aligned with labor market needs; insufficient capacity (financial, organizational, and infrastructure) of providers in technical vocational education and training and higher education; limited links with industry; poor quality of instruction and instructors; and limited responsiveness to training and skills development needs in the informal sector.
130. Increasing enrollment in the postwar period indicates a high demand for education, but the out-of-school population is still high. There has been substantial progress in increasing enrollment rates for primary and secondary education, particularly in the postwar period (Figure 45 and Figure 46). The primary completion rate (PCR) increased from 55 percent in 2004 to 70 percent in 2013, slightly down from the peak of 75 percent in 2011. The current PCR is slightly above the average of Sub-Saharan Africa (69 percent) and well above that of its neighbors Guinea (62 percent) and Liberia (59 percent). There has also been substantial progress in the enrollment rates for post-primary education (Figure 45 and Figure 46). Despite these gains, however, one in three school-age children in Sierra Leone remains out of school, which is higher than the regional average of one in four, and according to the 2013 DHS, 28 percent of women ages 15–24 and 18 percent of men ages 15–24 have never attended school. Repetition rates in primary schools are also above the regional average, 13 percent in 2015 in Sierra Leone compared to the average of 8 percent for Sub-Saharan Africa. In addition, the overall education indicators for Sierra Leone show that the country’s progress remains insufficient to reach the Education for All and Sustainable Development Goal targets.
131. There are significant inequities in access by education level. While enrollment rates for primary and lower secondary in Sierra Leone are high among comparator countries, they are lower than regional neighbors Guinea and Liberia for preprimary and upper secondary. A major contributing factor to this deficit is that primary schools constitute 73 percent of all schools. For every preprimary, lower secondary, and upper secondary school, there are 7, 6, and 18 primary schools, respectively. The supply of preprimary and upper secondary schools is also highly concentrated—the Western region comprises 44 percent of all preprimary schools, compared to 14 percent of all primary schools, while the next five largest cities (Kenema, Bonthe, Makeni, Bo, and Koidu) comprise 20 percent of all preprimary schools, compared to 7 percent of all primary schools. These trends are similar for upper secondary schools. In addition, 35 percent of preprimary schools and 38 percent of and upper secondary schools are owned by private proprietors that do not receive any government funding, compared to 6 percent of primary schools. This has implications for affordability as these schools must charge higher fees to fund operations.

57
Figure 45: Gross Primary Enrollment Ratio
Figure 46: Gross Secondary Enrollment Ratio
Source: WDI. Note: SSA = Sub-Saharan Africa.
132. The quality of education in Sierra Leone is generally poor. Recent studies show 87 percent of pupils in second grade were unable to read any part of a short passage given to them in the Early Grade Reading Assessment compared to 40, 30, and 53 percent in Gambia, Liberia, and Uganda, respectively. Furthermore, by the end of third grade, more than 50 percent of children could not write their name. Poor learning outcomes persist throughout the school lifecycle. Only 9 percent of students who took the West African Senior School Certificate Examination obtained a credit in math compared to 48 and 61 percent of students in Ghana and Nigeria, respectively. Even worse, only 3 percent of students in Sierra Leone who took the Basic Education Certificate Examination obtained a credit in math.
133. Teacher accountability and management are weak. Almost one-half of the teachers in the workforce are not qualified for their level and position. In addition, many teachers, even if trained, lack the content knowledge, pedagogical skills, and mastery of the language of instruction to deliver quality instruction. Previous research in Sierra Leone does not show significantly better student learning outcomes between teachers with and without qualifications, raising concerns about the initial entry level expected of pre-service teacher training candidates and the nature of the training being offered. There are also substantial disparities across districts in the allocation of qualified teachers. In Freetown, there is 1 qualified teacher for every 30 pupils, while in Pujehun the ratio is 1 to 84. Schools in certain districts, including Pujehun, Kono, and Port Loko, show lower than expected numbers of teachers compared to the size of the
020406080
100120140160
1 9 8 0 1 9 8 5 1 9 9 0 1 9 9 5 2 0 0 0 2 0 0 5 2 0 1 0 2 0 1 1 2 0 1 2 2 0 1 3 2 0 1 4 2 0 1 5
Sierra Leone Guinea Liberia Chad
Mauritania Haiti Nepal SSA
0
10
20
30
40
50
60
70
80
1 9 8 0 1 9 8 5 1 9 9 0 1 9 9 5 2 0 0 0 2 0 0 5 2 0 1 0 2 0 1 1 2 0 1 2 2 0 1 3 2 0 1 4 2 0 1 5

58
school, compared with Bonthe, Kenema, and Port Loko, where the size of schools more closely determines the number of teachers assigned there. Even when schools are adequately staffed, incentives and accountability mechanisms for improving teacher performance are not well-functioning, and absenteeism is high (20 percent). A pilot payroll cleaning exercise conducted in January 2017 in two districts showed that only 62 percent of officially approved teachers were found teaching in the school where they are authorized to teach by the ministry, while 24 percent of officially approved teachers could not be found at all during the exercise.
134. Decentralization in education remains incomplete. The failure to fully decentralize has been caused by a combination of a lack of will at the central level and implementation constraints at the local level. Most decisions remain centralized in the Ministry of Education, Science, and Technology (MEST), including school approval, teacher recruitment and reallocation, and teacher training. The MEST systems for decentralization are not yet fully in place. A focal person for decentralization of education in MEST has yet to be appointed and an office has yet to be established. The necessary work to fully align the Education Act and the Local Government Act has not been carried out. Similarly, quarterly meetings of MEST and the Ministry of Local Government has not yet commenced and neither has a Clearing House for decentralization disputes been established. The Ebola crisis brought about new priorities for education and decentralization has not been on the list of priorities in the last three years. Instead the post-Ebola recovery work has brought about a new focus on strengthening District Education Offices (DEOs). The rationale is that DEOs are best placed to take implementation decisions at the local/decentralized level. DEO staff comprise of deputy directors, inspectors and supervisors, and report to the Director of the Inspectorate Department. The budget for the DEOs is shared between the LCs and the MEST. There is, however, widespread anecdotal evidence that there are substantial delays in release of funds to schools and DEOs which are routed through the LCs. For example, supervisors that were supported to be recruited through LC budget had to be recruited and paid from MEST budget because LC funding did not materialize. Similarly, LCs are responsible for purchase and distribution of teaching and learning materials, yet many primary schools report not having received necessary materials at any regular basis. Disbursement delays have also led the MEST to request that fee subsidies and grants were going to schools through LCs instead be deposited directly into school bank accounts by the Accountant General.
135. The country needs to improve the quality of its workforce to meet the needs of the private sector. The vast majority of the 120,000 new entrants to the labor force each year face few good prospects and often become absorbed into rural agriculture or self-employment in the urban informal sector. Many modern employers are generally dissatisfied with the quality of Sierra Leone’s workforce, pointing to the lack of basic literacy and numeracy skills among young graduates. The lack of an educated workforce was cited as the fifth most problematic factor for doing business in Sierra Leone, followed closely by a ‘poor work ethic’, which is symptomatic of deficiencies in noncognitive (soft) skills. The Global Competitiveness Index has also consistently ranked the country’s higher education and training as one of the worst performing in the world. Private sector stakeholders engaged during SCD consultations almost universally referred to difficulties in finding ‘employable’ graduates and an acute shortage of technicians, such as auto mechanics and welders. There is also recognition by the general population of the poor state of education as it was ranked as “the most important problem facing [Sierra Leone] that the government should address” by the 2015 Afrobarometer survey, ahead of the management of the economy, unemployment, infrastructure, and health. There is an undersupply of skills in the growth areas of applied sciences, technology, and engineering. Sierra Leone also needs skilled doctors, other health workers, science and math teachers, engineers, technicians, managers, and other professionals to support areas critical to economic growth and provide basic human services. A higher education study carried out in 2013 concluded that links between higher education institutions and employers were weak and often ad hoc. Stakeholder consultations also revealed poor basic education as the root cause of the poor quality of higher education.

59
136. Data on returns to education though are mixed. The 2014 LFS showed the average wage increased with higher levels of education but only at the lowest and highest levels. Expected median labor earnings nearly doubled for persons with at least some primary education compared to those with no education and more than tripled for those with completed post-secondary education compared to those with completed secondary education, but there is almost no difference in income levels between incomplete primary and complete secondary education. The lack of returns to education, however, could reflect a lack of quality in the education system rather than a low demand for skills in the workforce if the returns are low because of low skills acquisition.
137. Gaps in access to education threaten the future of shared prosperity. Gender parity in access has been achieved at the primary level (1.0) and is being bridged at the lower secondary level (greater than 0.90); however, gender inequities are salient at the post-basic level. Inequality in access to education are primarily found along socioeconomic and geographic lines. Specifically, residents living in urban areas receive an average of 6.8 years of schooling (as high at 7.9 in the major cities) compared to only 2 years on average for the country’s rural population. Sierra Leone’s student population can be divided into the most advantaged (wealthiest quintile of urban students whose heads of household have a secondary or higher education) and the least advantaged (poorest quintile of rural students whose heads of household have no education) (Figure 47). Nearly all the most advantaged boys and girls enter primary school, and there is no gender gap until the last year of primary school. The gender gap widens across lower-secondary and upper-secondary school, as attendance rates for both groups decline. By the last year of secondary school, only 35 percent of boys and 25 percent of girls are still enrolled. For the least advantaged, only 51 percent of boys and 41 percent of girls ever attend school, and less than 15 percent of the most disadvantaged boys and less than 9 percent of the most disadvantaged girls enter lower-secondary school. Finally, almost no one enters upper-secondary school. Post-secondary rates are low for the most advantaged and effectively zero for the most disadvantaged. These patterns contribute to intergenerational poverty traps and threaten prospects for pro-poor growth and shared prosperity.
Figure 47: Attendance Gaps
Source: Calculations based on SLIHS (2011).
0102030405060708090
100
1 2 3 4 5 6 7 8 9 1 0 1 1 1 2 1 3 1 4 1 5
P R I M A R Y L O W E R S E C O N D A R Y
U P P E R S E C O N D A R Y
P O S T S E C O N D A R Y
SCHO
OL A
TTEN
DANC
E
Poorest rural girls --head no education
Richest urban girls --head secondary +
Poorest rural boys--head no education
Richest urban boys--head secondary +

60
Health
138. Poor health affects economic growth as well as the ability of households to increase their incomes. In agrarian areas, labor lost to poor health lowers farm productivity, and the World Food Program identified poor access to health services as one of the major underlying reasons for the high prevalence of food and nutrition insecurity in Sierra Leone. Health shocks also limit households’ ability to save and invest, including in income-generating assets. Beyond the microeconomic consequences of poor health for household income, the disease environment and the ability to combat disease outbreaks are critical to overall economic growth. In Sierra Leone, economic growth dropped sharply in 2014 partially because of the Ebola outbreak, which was estimated to have caused a 3.3 percentage point loss of GDP (World Bank 2014g). Furthermore, the World Competitiveness Report for 2012–2013 listed malaria as a key threat to business in the country.
139. The health status of the population has improved significantly since 2002 but remains below comparator countries with similar per capita income. Between 1990 and 2013, infant mortality decreased from 158 per 1,000 live births to 107 (Figure 48), under-five mortality declined from 267 per 1,000 live births to 160 (Figure 49), maternal mortality decreased from 2,630 to 1,460 (Figure 51), and life expectancy increased from 37 to 50 years (Figure 50). Despite these significant improvements, however, Sierra Leone remains below its comparator countries with similar levels of per capita income.

61
Figu
re 4
8: In
fant
Mor
talit
y R
ate
(per
1,0
00 li
ve b
irth
s)
Figu
re 4
9: U
nder
-fiv
e M
orta
lity
Rat
e (p
er 1
,000
live
bir
ths)
Figu
re 5
0: L
ife E
xpec
tanc
y at
Bir
th
Figu
re 5
1: M
ater
nal M
oral
ity R
atio
(per
100
,000
live
bir
ths)
So
urce
: Wor
ld B
ank
WD
I dat
abas
e (2
016)
.
020406080100
120
140
160
180
1980
1985
1990
1995
2000
2005
2010
2011
2012
2013
2014
2015
050100
150
200
250
300
350
1980
1985
1990
1995
2000
2005
2010
2011
2012
2013
2014
2015
01020304050607080
1980
1985
1990
1995
2000
2005
2010
2011
2012
2013
2014
0
200
400
600
800
1000
1200
1400
1600
1800
2000
1990
1995
2000
2005
2010
2011
2012
2013
2014
2015

62
140. The poor health situation in Sierra Leone exists despite high levels of public and private health spending. While Sierra Leone’s public health expenditures are about the same as that of comparator countries, its out-of-pocket expenditures are the highest among its comparators, with only Liberia approaching the same level of expenditures (Figure 52). The large share of private health expenditures points to inefficiencies in public health spending and private resources substituting for public services. However, the overall poor outcomes despite higher public and private expenditures imply that households are not getting value for money in both public and out-of-pocket spending. These inefficiencies are a major societal burden, particularly when the country is highly constrained in terms of fiscal resources. The burden of these inefficiencies falls disproportionately on the poor, as out-of-pocket health payments are regressive and the poor are more likely to forgo health care (Fabricant et al. 1999). The 2013 DHS finds that two-thirds (67 percent) of women did not get necessary health care due to costs, and this is markedly higher among the poorest quintile (76 percent). There is also substantially lower utilization of key services such as births in health care facilities for the bottom two quintiles compared to the top two (more than a 10-percentage point gap).
Figure 52: Health Expenditure, Public and Private, 2014 (% of GDP)
Note: SSA = Sub-Saharan Africa. Source: World Bank Group WDI (2016).
141. Over-the-counter (OTC) drugs comprised the largest component of individual health spending for all age groups, according to the 2011 SLIHS. The average individual living in a poor household spent 69 percent of the household’s total health budget on OTC drugs compared to 60 percent of individuals living in non-poor households. The percentage spent on OTC drugs was significantly higher in rural areas (68 percent) than Freetown and other urban areas (both approximately 58 percent). Transportation costs also comprised a larger percentage of spending in rural areas (8 percent) compared to Freetown (3 percent) and other urban areas (6 percent). Spending on contraception was also substantial during prime childbearing years, reaching a maximum of 28 percent (combined for both genders) at age 28.
142. The high spending on OTC drugs likely reflects a mixture of supply and demand constraints for medical services. Supply constraints are linked to the absence of health facilities or the low quality of health services, and demand constraints are linked to the high perceived cost of medical treatment and the high rates of self-diagnosis and self-treatment. Only when patients become extremely sick do they seek out formal medical care. According to the 2011 SLIHS, the average household spent 10 percent of their total consumption on health expenditures whereas 13 percent spent more than one-quarter. In addition to
0
2
4
6
8
10
12
Chad Mauritania SSA Guinea Nepal Haiti Liberia Sierra Leone
public private

63
spending on basic health services, more than three-quarters of households also had expenses for hospitalization, which represented a median of 5 percent of total consumption for these households.
143. More research is required to understand the stark disparity between health policies and spending and outcomes. Decentralization was introduced in 2004 to improve accountability to citizens in public service delivery, and health was one of the first and most fully devolved functions. A free health care initiative was launched in 2010 to address the challenges related to the health care needs of vulnerable citizens, such as under-five-year-olds, pregnant women, and lactating mothers. Yet, Sierra Leone’s maternal and child mortality rates remain the highest in the world. Capacity and infrastructure deficits surely contribute to these results, but a preliminary analysis points to leakage, capture, and lack of accountability throughout the chain of service delivery. The Ministry of Health has been involved in several corruption scandals, most notably the inability to account for billions of Leones intended to combat the spread of Ebola.15 An inconsistent legal framework blurs the lines of responsibility and accountability in a system that requires coordination among multiple actors—government, private, communities, and NGOs. This has enabled the ministry to resist sharing power with LCs and use the health service system to extend patronage. At the local level, a performance-based pay system has mitigated irregularities of service, but many citizens are still charged illicit fees (Conteh 2016).
Figure 53: Health Spending by Expenditure Category
144. Poor maternal health and a lack of adequate family planning limit women’s full economic participation. These issues are present throughout women’s lives. The median age for the first birth in Sierra Leone is 19 years and the average woman has five children. Sierra Leone has one of the highest rates of maternal mortality in the world, which, combined with the high number of births, leads to average odds of 1 in 20 that a woman will die from complications during childbirth. Outcomes are also unequally distributed among women though, with women in the poorest quintile having more than double the number of children than those in the least-poor quintile, increasing their exposure to risk. In addition, many live in rural areas with more limited access to health services than urban areas. The 2013 DHS showed that the use of contraceptives had doubled since 2006, but 25 percent of married women who would like to access contraceptives are still not able to do so. At a macro level, the high dependency ratio prevents Sierra Leone from benefitting from a ‘demographic dividend’, which occurs when there is a boost in productivity due to a relatively higher share of working-age people compared to dependents and was associated with periods
15 ASSL 2015.
0%10%20%30%40%50%60%70%80%90%
100%
0 5 10 15 20 25 30 35 40 45 50 55 60 65 70
Consultation Transport Medicines OTC medicines
Under-5 vaccination Pre/Postnatal costs Contraception

64
of high growth in Latin America and East Asia. At the micro level, the lack of adequate family planning coupled with traditional norms of early marriage lead to high dropout rate for girls once they reach childbearing age. This constrains women’s time and empowerment, limits their educational attainment, and reduces their future employment possibilities. In addition, continued high levels of fertility limit the resources available to invest in individual children, particularly among poor households that generally have higher numbers of children, and lead to the perpetuation of intergenerational poverty. High fertility strains public service delivery in education, health, water, and sanitation, and there is the potential risk for an increase in instability and crime if job growth cannot keep up population growth in the long term.
Figure 54: Evolution of the Dependency Ratio for Selected Countries
(Population Ages 0–14 in % of total)
Source: World Bank Group WDI (2016). Note: SSA = Sub-Saharan Africa.
145. Poor child health limits educational achievement and make it more difficult to combat poverty and increase economic growth. Malnutrition is due to a combination of food insecurity, inadequate caregiving resources at the maternal, household, and community levels, and limited access to health services and a safe and hygienic environment. According to the 2013 DHS, approximately 35 percent of children in Sierra Leone aged 6-59 months are stunted (two or more standard deviations below the average height at a given age) and 10 percent are severely stunted (three or more standard deviations below). Outcomes are even worse for poor children. The 2013 DHS showed more than twice the incidence of stunting in the poorest quintile compared to the least poor. The poor sanitation conditions further compounds food insecurity—more than 11 percent of children under-five had a diarrheal episode in the two weeks leading up to the 2013 DHS. This leads to high levels of stunting even in the agricultural productive districts of the country, such as Kenema (41 percent) and Kailahun (42 percent), which is considered critical by the WHO, or in areas with comparatively low levels of poverty. The highest number of children who are stunted live in Freetown and the nearby district of Port Loko, each with over 300,000 stunted children. The prevalence of underweight and stunting in Sierra Leone’s population has not changed significantly since 2003 despite substantial poverty reduction. The consequences of stunting in young children include delayed schooling, poor educational performance, and less years of completed education, which increases the

65
changes of them having low incomes and becoming trapped in poverty later in life (Galasso and Wagstaff 2016). Naudeau et al. (2012) estimated that a country in Africa could collect a dividend of up to 10 percent of GDP by eliminating stunting.
146. The weak health system was a major contributing factor to the severity of the Ebola outbreak. The estimated cost of Ebola to Sierra Leone’s economy was 3.3 percent of GDP (World Bank, 2015). In addition, there was a major cholera outbreak in Freetown in 2012 with over 20,000 reported cases and more than 300 deaths. While the cholera outbreak has passed and Sierra Leone has been declared Ebola free, the outbreaks exposed potential catastrophic consequences of the weak health system. Therefore, building resilience in the health system can be viewed as a protection against economy-wide shocks in addition to improving individual health outcomes.
147. Climate change has the potential to bring additional health risks. The Second National Communication on Climate Change notes the higher prevalence of diarrheal diseases and toxic algae blooms leading to seafood poisoning that accompany higher average temperatures. Higher rainfall totals can lead to an expanded breeding locations and seasons for mosquitos, which are carriers of malaria and dengue, among other diseases. In addition, flooding increases the risk of cholera and other water-borne diseases. These emerging challenges, along with a growing population, are likely to increase stress on the health sector in the future.
Social Protection
148. Vulnerability to recurrent shocks has the potential to hamper gains in achieving the twin goals. In the last 15 years, Sierra Leone has experienced a series of major shocks including four floods, global economic shocks such as the 2007/2008 food, fuel, and financial crisis, and the Ebola crisis, among others. These shocks induce households to deplete their human and physical assets, for example, to sell their livestock or pull their children out of school. They also increase vulnerability to food insecurity: according to the 2015 CFSVA, almost half (49.8 percent) of the population is food insecure, and this figure is higher for those who experienced a shock. The effects are felt the most by the poorest who are highly dependent on agricultural activities.
149. Sierra Leone has made substantial progress in building a robust social protection (SP) system, but the poorest are still vulnerable to recurrent shocks. In recent years, the Government has made significant advances in establishing an SP system, in particular putting in place safety nets to shield the poorest from shocks. This has included setting up robust delivery systems (for example, the Social Protection Registry for Integrated National Targeting and independent payment and accountability mechanisms), committing and channeling resources toward safety nets in the national budget despite constrained fiscal space, and putting in place a national SP Strategy and an SP Policy, and ongoing efforts toward enacting an SP Bill in 2017. Coverage, however, remains limited. While precise estimates are not available, administrative data indicates coverage is less than 5 percent of the population, while more than half of the population is poor and 14 percent live in extreme poverty and are vulnerable to frequent shocks. The Ebola crisis was able though to demonstrate the technical feasibility of rapidly scaling up the basic social safety net during a crisis situation. Proposed plans for potential further removal of fuel subsidies and tariff waivers on imported staple foods may also require a short-term mitigation measure—such as cash transfers—to offset the short-term impact on household welfare.
150. In a context of high demand-side constraints to accessing social services, a safety net system is also needed to ensure the poorest can invest in human capital and benefit from growth. As discussed above, a major reason that poor and vulnerable households do not access health care facilities is the inability to pay. There are similar cost constraints to education: the 2014 LFS data show that among Sierra Leoneans who never attended school 40 percent did not attend because they could not afford it. Insights from

66
behavioral economics also suggest that economic scarcity could drive the poorest to focus on survival over long-term investments in human capital. An adequate safety net is also critical for promoting inclusion of the poorest in opportunities to enhance their productive investments, for example, linking them to agricultural extension services and enabling them to take risks in existing and new income-generating activities.
Water and Sanitation
151. Access to improved water increased nationally in the postwar period but has seen a decline in urban areas in recent years. Today, 63 percent of the population has access to improved water sources. Most progress has been made in rural areas where over 20,000 hand-pumps, stand posts, protected wells, and springs were installed with the support of NGOs and United Nations agencies. However, the increased access has not kept up with the demands of a growing urban population, resulting in a sharp drop in the proportion of households with access to piped water and an increase in the use of protected wells and springs mainly provided by NGOs. Freetown witnessed most of the decline in access to piped water.
152. Progress on improving sanitation has been mixed. Access to improved sanitation in Sierra Leone has been constant at 13 percent of the population in the postwar period, which is low compared to other countries in the region (JMP 2015). Efforts to improve rural sanitation through community-led total sanitation programs have been slow, and many initiatives backed by NGOs have only had a marginal impact on improving coverage rates or reversing the growing practice of open defecation, particularly among the bottom three quintiles. Though there has been a significant increase in access to on-site sanitation facilities in urban areas, little progress has been made on developing options for emptying, transporting, disposing, and treating fecal sludge in a safe and sustainable manner. The combination of poor fecal sludge management and the shift from piped water sources to wells has greatly increased the risk factors that led to over 20,000 reported cases and over 300 deaths in the 2012 cholera outbreak—the epicenter of which was Freetown.
153. Decentralization in the water sector has been partial, and has failed to sustain progress made. The Government, in collaboration with development partners, have generated over 20,000 water points since 2002, but these initial wins are challenged by sustainability of both water points and behavior change. Due to the local nature of water facilities, and the need for continued care and maintenance, sustainability will require increasing capacity of and funding available at decentralized levels of government to back-stop community level management of services. In 2016, intergovernmental transfers to local councils recorded in the national budget amount to approximately US$250,000 a year, but only half this is amount is being received by district water engineers. These transfers were financed by the Decentralized Service Delivery Program which is due to come to an end in 2017, after which transfers are likely to fall further. At present these funds are managed by district water engineers, appointed by the Ministry of Water Resources (MWR). The lack of greater decentralization is in part being held back by the MWR, despite the comparative advantage of local government to carry out the monitoring of rural water points, development of spare-parts chain, and coordination of new investment by non-state actors. Local government also has a role to sustain gains in sanitation and hygiene behavior change that requires recurrent financing - though latrine construction is financed by households.
Gender Dimensions
154. There has been substantial progress in recent years in enhancing gender equality in Sierra Leone, but gaps remain. In education, the literacy rate among women aged 15-24 increased from 25 percent in 2005 to 48 percent in 2010 and further to 62 percent in 2013. However, significant disparities among wealth quintiles and age groups are still evident: the literacy rate of women aged 15-49 is 35.5 percent but is 65 percent for the richest quintile and only 17 percent for women from the poorest households.

67
In employment, the 2014 LFS found that, holding all other characteristics constant, men earn three times more than women in wage employment, 2.5 times more in self-employment, and nearly double in agriculture. The 2011 SLIHS, however, showed slightly lower poverty rates among female-headed households.
155. Even though the country has narrowed the gender gap in primary education, gender disparities persist at the secondary and tertiary levels. The gender parity index (GPI) for gross primary attendance is 1.06, indicating a slightly higher enrollment rate for girls. However, girls begin to drop out at higher rates at the age of 13, widening the gap to a GPI of 0.85 at the secondary level and even higher at the tertiary level. The reason for the gap is likely a combination of cultural and financial considerations. There are societal preferences for early marriage and childbirth for girls, but the decline in GPI may also be rooted in deeper cultural issues that result in girls’ education being less valued. The 2014 LFS found that women were more likely than men to respond that they did not go to school because their family did not allow it (34 percent vs. 28 percent) or because education was not valued (17.6 percent vs. 14.6 percent)—though financial constraints were the main reason for both sexes. The financial hypothesis is supported by the increase in girls’ enrollments and the gender parity ratio after the Government began providing tuition support for girls at the junior secondary level, though female students comprise only about one-third of tertiary enrollments despite government scholarships to female students who are admitted into science-related fields at public universities. The favoring of sons at higher levels may reflect an economic decision by households based on the reality that there are fewer economic opportunities even for educated women. With high private returns to tertiary education, this has important implications for poverty reduction.
156. Early marriage and childbearing widen the gender gap. While the legal minimum age for marriage is 18, a loophole in the 2009 Registration of Customary Marriage and Divorce Act allows underage customary marriages if the parents provide their consent (CARL, 2012). The 2013 DHS shows that 16.4 percent of girls were married by the age of 15 compared to just 1.3 percent of boys. By 18 years old, 50.2 and 8.8 percent of females and males were married, respectively. The median age for first birth was 19 years. There is also clear evidence of the adverse effects of early childbearing on women’s ability to lift themselves and their families out of poverty. The 2011 SLIHS shows a strong inverse relationship between the probability of pregnancy and school enrollment (Figure 55). The 2014 LFS also finds that working-age women who were teenage mothers had an average of 1 year less of education and went on to earn an average 25 percent less than women who were not teenage mothers. The impact of early childbearing on girls’ education and economic prospects has also been exacerbated by the Government’s recent decision to ban pregnant girls from attending school.

68
Figure 55: Probability of Enrollment (by Gender) and Probability of Pregnancy
Source: Calculations based on SLIHS (2011).
157. Most agricultural plots are controlled by men, with women’s plots being smaller and less productive. The 2011 SLIHS showed that 75 percent of plots were controlled by men. The average size of a male-controlled plot was 3.7 acres compared to 2.5 acres for a woman. The area under cultivation for annual crops (including staple crops like rice and cassava as well as garden crops) was nearly 25 percent higher for male-controlled plots. In terms of crops planted, men were more likely to grow staple crops, such as rice and cassava, and perennial cash crops, such as coffee, cocoa, and oil palm. Women were more likely to grow garden crops, including groundnuts, beans, leafy vegetables, and pepper. Women also had smaller yields and were less likely to use improved inputs.
158. Women are disadvantaged in accessing land. The Constitution of Sierra Leone prohibits discrimination based on sex but includes an exemption for matters of, “adoption, marriage, divorce, burial, devolution of property on death or other interests of personal law.” Additionally, while the Devolution of Estates Act (2007) provides women and men with the same inheritance rights, there is an exception that widows cannot inherit family or community property. This is an important distinction since the majority of land outside of the Freetown peninsula is held in such traditional arrangements. Moreover, lack of knowledge of the law means that even those protections that exist are rarely enforced (USDS, 2012). It is estimated that only 12.7 percent of widows inherited the majority of their spouses’ assets in 2008 (Chronic Poverty Research Centre, 2011). Customary practices, however, are not uniform across the country, so while women in the North and West can own plots of land, women in the South and East can access land only through their husbands or other male family members (Action Aid, 2012). Limits on access to land have a significant impact on economic opportunities, as the majority of the poor population works in agriculture, and there is strong evidence of a link between land tenure security and productive investments in land. In Ghana, Goldstein and Udry (2008) found that women’s less secure land rights impede their ability to leave land fallow, an essential investment in land quality. In Rwanda, an impact evaluation study found that a land tenure reform program that simply clarified existing land rights made participating households 10 percentage points more likely to make soil conservation investments, with almost double the impact on households headed by women (Ali et al. 2014). In Uganda, an analysis of the impacts of the 1998 Land Act, which nullified customary provisions that discriminated against women, highlighted positive impacts on long-term investment, soil conservation investments, productivity, and land value (Deininger et al. 2006).
0
0
0
0
0
1
5 6 7 8 9 10 11 12 13 14 15 16 17 18 19 20 21 22
age
probability of being enrolled (boys)
probability of being enrolled (girls)
probability of having ever been pregnant (girls)

69
159. Sierra Leone has signed and ratified a number of international protocols on gender, and there are strong domestic laws upholding gender equality and protecting women against gender-based violence (GBV), but the implementation of these laws and policies remains weak. Societal attitudes toward sexual violence and women’s economic dependence on men mean that in practice offenders often enjoy impunity. For example, the proportion of women who say that wife beating is justified for one of five reasons given in the DHS is higher in Sierra Leone (63 percent) than for any other group of comparator countries, including post conflict Côte d’Ivoire (48 percent) (Figure 56). Both the acceptance and prevalence of domestic violence is higher in the northern regions of the country (ICF 2014; USDS 2014). According to a 2012 report, between January and September of that year only 112 out of 4,000 reported cases of domestic violence resulted in a conviction. Aside from being a serious human rights issue, there are economic costs associated with violence against women, which will constrain Sierra Leone’s ability to reduce poverty. These costs include service provision for treating victims of GBV, reduced human capital of survivors, lost income, and decreased productivity. For example, a recent multi-country study by the World Bank estimates that productivity losses from domestic violence range from 1.2 percent of GDP in Brazil and Tanzania to 2 percent in Chile—without taking into account long-term emotional and intergenerational impacts (Duvvury et al. 2013).
160. The incidence of female genital mutilation (FGM) has decreased in recent years but remains an acute problem in Sierra Leone. According to the 2013 DHS, 74 percent of women ages 15–19 have been circumcised compared to more than 95 percent of women ages 30 and older. Only Mali and Guinea have higher rates in West Africa (Gupta, 2013). The most common health consequences of FGM in Sierra Leone include are excessive bleeding or hemorrhaging, pain, and a delay in wound healing, as well as fever and infection for girls younger than 10 (Bjälkander et al. 2012). Long-term consequences of FGM can also include complications in childbirth, including an “increased risk of Caesarean section, post-partum hemorrhage, recourse to episiotomy, difficult labor, obstetric tears/lacerations, instrumental delivery, prolonged labor, and extended maternal hospital stay” (WHO 2017). Given the limited access to skilled delivery attendants in Sierra Leone, complications from FGM likely contribute to high maternal mortality rates.
Figure 56: Percentage of Women Agreeing that Wife Beating Is Justified for Any of Five Reasons
Source: DHS (2013).
161. In the near term, the main gender priorities for Sierra Leone are related to human development and legal rights rather than economic. Closing the gender gap in agriculture or wage employment, the areas were the inequities are most pronounced, would likely make only a small difference to the overall economy. Since the agricultural sector as a whole is of limited productivity, and most of the plots are currently controlled by men, the benefits of bringing the average farmer closer to the productivity frontier are far greater than bringing the average female farmer up to the productivity of the average male
16
29
4348
58 6063
B E N I N T O G O L I B E R I A C O T E D ' I V O I R E U G A N D A N I G E R S I E R R A L E O N E

70
farmer. For wage employment, the share of the overall labor force in this sector is small, and therefore there is limited scope to make a large contribution to the overall economy. There is more possibility for impact in non-agricultural self-employment, which has been identified as an important component of the diversification pathway, but since women comprise a substantial portion of small enterpreneurs, they are likely to benefit from general improvements to the sector. Areas which are priorities for gender equity include improving health and education outcomes and strengthening women’s legal rights. The urgency of the maternal health care crisis is evident given the extreme mortality risks faced by women during child birth. Education will become increasing important as the economy progresses, particularly since women are traditionally excluded from jobs in construction and mining, the current highest paid unskilled sectors. Promoting girls education also expands the pool from which Sierra Leone can fill critical gaps in health care, education, and the formal service sector. Finally strengthening the legal framework will be increasingly important as agricultural productivity increases and financial incentives for men and elites to control large landholdings therefore also increase. With a fixed amount of land, the most vulnerable, including widows and women generally, are the most likely to be negatively impacted.
Access to Justice
162. Sierra Leone’s justice system suffers from corruption and inefficiencies. According to the Afrobarometer, few Sierra Leoneans have contact with formal courts but among those who do, 65 percent report paying bribes, which is the highest (by 11 percent) among the 36 countries surveyed. With one professional judge or magistrate to about 143,000 Sierra Leoneans, compared to the Sub-Saharan average of 1 judge or Magistrate to about 22,000–33,000 people, formal courts are physically hard to access for much of the population. The judiciary faces chronic underfunding, case backlog, administrative failures, limited coverage, lack of public confidence, and inadequate staffing in terms of numbers and competencies.16 Even more so, they are financially inaccessible and offer a ‘foreign’ concept of justice often deemed unsuitable by citizens seeking reconciliation and compensation. The Local Courts Act of 2011 formally integrated the chiefs’ courts into the state judiciary with the aim of improving access and oversight. However, these courts are largely seen as problematic, lacking capacity and standards. Court staff have not been paid since falling under the Ministy of Justice. Being accused of a criminal offense is the most common reason for being in contact with the justice system. However, even those accused of minor crimes are commonly detained, resulting in high numbers of detainees who wait months and sometimes years for further processing. This is not only a violation of due process but also cuts into livelihoods as petty traders and motobikers are commonly detained, often by policemen seeking illicit fees. It is estimated that more than 80 percent of disputes never reach the formal courts but are managed by a range of local and traditional dispute resolution mechanisms that vary considerably in quality and fairness, leaving many family and land disputes unsatisfactorily resolved.
163. The country has been a pioneer in introducing community paralegals to provide a range of representation, mediation, and navigation services. The Legal Aid Act of 2012 recognized the role of these services and provided for the institutionalization and scale-up of legal services under the guidance of the Legal Aid Board, which was established in 2015. The Legal Aid Board has vastly expanded services for the remand population and has sought to help prevent detention at the outset. A number of civil society organizations have been providing localized paralegal services for civil cases—mostly family and land issues—with some pilot programs aimed at supporting accountability around health services and land acquisition processes. Ensuring that a sustainable system of legal and paralegal services can reach Sierra Leoneans in rural areas will make an important difference in promoting accountable services.
16 Sierra Leone Judiciary Strategic Plan, 2016–2021.

71
CHAPTER 5: PRIORITIZATION
164. The principal purpose of this SCD is to identify the most critical priorities to accelerate growth, reduce poverty, and promote shared prosperity. Sierra Leone’s main opportunities for economic growth and poverty reduction are based on the productive use of its vast stock of natural resources. This includes both mineral resources, including iron ore, diamond, rutile, bauxite, and gold, and renewable resources, including its abundant and rich ecosystems suitable to agriculture, livestock, and forestry and its long coastline that is conducive to fishing. These opportunities are contrasted against the foundational constraints of governance and fiscal space, in addition to the many proximate constraints in human capital development, infrastructure, and business climate. For growth to be inclusive and sustainable, Sierra Lone must mobilize all its available resources in a coherent and mutually reinforcing way. Learning from past failures, the challenge for the SCD process was therefore to identify the most critical—yet feasible—areas of intervention that would help put the country on a sustainable and inclusive development path that would accelerate economic growth and poverty reduction. The prioritization exercise was particularly difficult in Sierra Leone because the country ranks near the bottom of nearly every key development indicator. Due to the interconnectedness of the drivers of growth, all the topics discussed in this SCD could be considered binding constraints. Therefore, the criteria used to select the priorities are the size of the impact on poverty alleviation and growth, feasibility, and the possible positive externalities.
165. The prioritization effort seeks to balance short- and long-term objectives. As changing the development narrative in Sierra Leone is a long-term process that will require both improved governance and economic reforms, the prioritization exercise focused on interventions that could alleviate bottlenecks in the five-year time horizon of the SCD but were also essential to creating a fertile space for long-term development.
CRITERIA FOR SELECTION
166. A set of criteria was developed in consultation with the Government and other key stakeholders to assess and prioritize possible interventions. The most weight was given to outcomes that advance the World Bank’s twin goals of eliminating extreme poverty and promoting shared prosperity, with significant weight also attached to feasibility. The evaluation criteria are the following:
Impact on the twin goals: This criterion assesses the level of each potential intervention’s expected impact on extreme poverty and shared prosperity. Higher scores reflect interventions that would likely have a larger positive impact on both goals, while a medium score reflects a lower positive impact on both goals or only a positive impact on one of the twin goals.
Growth acceleration: This criterion assesses the potential impact of each intervention on medium- to long-term economic growth. The intervention is assessed independently to its impact on the twin goals. An intervention may have high score on growth acceleration but low or moderate impact on the twin goals.
Complementarities: This criterion quantifies the degree to which progress on a given objective would positively influence other objectives, even if it is not strictly necessary to achieve them.
Feasibility: This criterion evaluates specific priorities against the foundational issues of governance and fiscal space. It assesses the realistic possibility that the political, financial, and social constraints to a given priority area could be addressed to the extent that the necessary policies and reforms could move forward. Given the limited resources of the state, the current high public sector wage bill, limited administrative capacity, and widespread leakage, potential

72
interventions are also evaluated on the size of new spending that would be required. In line with the 2017 WDR, this consideration takes into account the potential for the policy arena to be reshaped through the levers of contestability; elite incentives; and the ideas, preferences; and beliefs of participants in the policy arena. It also takes account of how, over time, policy outcomes might alter the underlying distribution of power to allow for a broader range of policy options in future.
FOUNDATIONAL ISSUES
167. The argument of this SCD is that progress on the pathways to development must take into account two foundational issues: governance and fiscal space. The former must be understood as a long-term condition, rather than as a time-bound constraint. The shift from extractive to inclusive institutions (Acemoglu and Robinson 2006) will take place over time in response to a variety of endogenous and exogenous shocks. In the meantime, the challenge is to identify and endorse opportunities to promote outcomes that in turn can reshape a developmental link between demand and incentives of those in power. The constraint of fiscal space manifests in a time-bound manner, given the dependence of the country on natural resource revenues, but it is the result of underlying fiscal and economic policy failures. Here, we highlight key dimensions of these constraints. In the following section, we identify priority interventions to mitigate these constraints, while they are also carried through in the analysis of the specific sectoral priorities.
MITIGATING THE IMPACT OF GOVERNANCE CONSTRAINTS ON DEVELOPMENT
168. As highlighted in the 2017 WDR, the nature of governance institutions and the balance of power are key determinants of development policies and outcomes. In Sierra Leone, the centralist, patrimonial method of exercising power and managing relations between state and society is the product of historical path dependencies that have been self-reinforcing. The incentive structures underlying this dynamic limits the ability of Sierra Leone to commit to and implement needed reforms. From a politician’s perspective, investing in long-term policies and autonomous capacity to deliver public goods does not pay off in the short term. The prevailing incentives are thus to shore up support through strategies that are clientelistic, which reinforces the existing power balance in the society. This manifests in an apparent urban bias, unsustainable fiscal policies, poor public sector management, and broken service delivery systems.
169. Improvements in shared prosperity will require a combination of strategies to mitigate governance constraints. Over time, structural changes, such as accelerated urbanization, exogenous shocks, and changing social organization, may lead to changes in the dynamics of the policy arena. This process may create a growing demand for public services and result in a changed social contract. Importantly, history shows that while such changes can be generative, they can also be deeply conflictual. Research shows that on average, low- and middle-income countries undergo violent regime change every eight years due to the inability to adapt to changing circumstances (Cox, North, and Weingast 2015). Sierra Leone will need to manage such a transition without resorting to coercive tactics that might inflame tensions. Investing in mechanisms to improve communications and feedback channels between citizens and the state can help foster adaptive institutions. This can work by both improving citizen trust in public institutions and providing necessary information on demographic and social changes and demands to the state so that it can anticipate needs.
170. Tackling governance constraints directly requires an adaptive, incremental, and opportunity-driven approach. Resistance to reform will be strongest where it directly threatens vested interests—this can be called ‘dysfunction by design’. But there are several areas in need of reform that do not pose direct threats and may be amenable to technical support—these can be called ‘dysfunctions by default’ (Srivastava and Larizza 2012). Over time, progress on these technical areas may serve to shift

73
incentives and promote accountability, and while this may elicit resistance, sustained incremental efforts on select reform priorities will pay off. Another strategy is to prioritize clearly identified development areas to which the Government is committed and develop ‘pockets of effectiveness.’ An example of this is the establishment of the NMA. Given its potential to unlock smallholder potential, enable foreign investment, and free up land for Government projects, land administration should be prioritized. Significant progress has already been made with the adoption of the 2015 National Land Policy, which, if implemented, would not only improve efficiency but would also promote inclusivity.
FISCAL CONSTRAINTS
171. The Government faces enormous fiscal constraints. Its narrow fiscal space is the result of (a) the low level of tax revenue (below 12 percent of GDP in 2016, mining royalties included) extracted from a narrow tax base, as agriculture and mining, the two biggest sectors of the economy, are not appropriately taxed and duty exemptions are granted on the major imported commodities including petroleum products and milled rice; (b) the declining level of aid as share of GDP (from 5.2 percent in 2015 to 2.5 percent in 2016), as donors perceive the country as suffering from weak governance and widespread corruption; (c) the small domestic banking and financial sector, which limits domestic borrowing; (d) the domestic borrowing limit of 2 percent of GDP approved by the IMF to avoid crowding out the private sector; and finally (e) the high level of nondiscretionary spending, which absorbs almost all domestic revenue (for example, 60 percent of all tax revenues goes to salaries).
Figure 57: Government Resources (% of GDP)
Source: MOFED, IMF, and World Bank Group.
172. Sierra Leone’s borrowing capacity has increased, but the country remains at moderate risk of debt distress over the medium term, leaving limited room for sustainable external borrowing. Sierra Leone’s total public debt-to-GDP ratio is estimated to increase to 47.6 percent in 2016. The restart of iron ore production and related export receipts as well as the improved fiscal revenue profile are expected to ease the country’s fiscal vulnerabilities over the medium term. According to a simulation conducted in the most recent Debt Sustainability Analysis (June 2016), all the debt ratios are expected to remain below their respective thresholds throughout the projection period (2016–2036), assuming the price of iron ore continues to recover, long-term growth stays above 5 percent, the primary fiscal deficit falls below 1 percent

74
of GDP in the long term, and the current account balance falls below 8 percent of GDP in the long term. However, the outlook in the iron ore sector remains uncertain and constitutes a major downside risk to the Debt Sustainability Analysis. Furthermore, the high current account deficit (16 percent in 2016) continues to keep the economy vulnerable to nominal depreciation.
173. The country is caught in vicious cycle of low growth of taxable sector narrow fiscal space low human and physical capital low growth. In addition to the reduction in the level of the tax
exemptions, the mining sector offers a unique opportunity to break this vicious cycle since FDI can be attracted and revenue generated independently from the rest of the economy. The country succeeded in attracting large investments in the iron ore sector, but their effect on domestic revenue has been limited. Mining royalties and licenses increased from 0.2 percent of GDP on average per year in 2005–2010 to 1 percent of GDP on average per year in 2011–2016. However, the contribution of the sector to direct and indirect taxes has been limited by generous exemptions granted during negotiations. For example, in 2013, the iron ore sector alone represented 15 percent of value added and 70 percent of export value, but its contribution to Government revenue was at 1.3 percent of GDP, leaving the Government with less than one-tenth of the value added generated by the sector. With a hypothesis of 40 percent of rent (value added) captured by the country, revenue would have been 6 percent of GDP. This is equivalent to double of the external aid received and half of the domestic revenue mobilized in 2013.
POSSIBLE POLICY INTERVENTIONS
Table 2: Summary of Key Policy Interventions by Thematic Area
Foundations and Pathways
Priority Area Impact on the Twin
Goals
Growth Acceleration
Complementarities Feasibility
Alleviating fiscal constraints
Strengthen Domestic Revenue Mobilization High High High Moderate
Improve efficiency of public spending and value for money Substantial Substantial High Moderate
Mitigating overarching governance constrains
Strengthen accountability and contestability in key sectors High High High Moderate
Incentivize functional solutions to improve public administration and local governance
Substantial Low Moderate Moderate
Strengthening the productivity of the agricultural base
Reform the role of the MAFFS in the provision of agricultural services
High Substantial High Moderate
Improve market opportunities for producers Substantial Substantial High Moderate
Facilitate new investment by addressing access to credit and risk management issues
Substantial Moderate Substantial Moderate
Land tenure reform for improved productivity and diversification
Moderate Moderate Moderate Low
Diversifying the economy and creating poverty-alleviating jobs
Strengthen macroeconomic stability
High High High Moderate
Improving access to infrastructure (energy, transport, and ICT); credit; and
Substantial Substantial Substantial Moderate

75
Foundations and Pathways
Priority Area Impact on the Twin
Goals
Growth Acceleration
Complementarities Feasibility
improving labor market regulations Promote vertical diversification Substantial Moderate Substantial Moderate
Increase productivity of the urban informal sector High High High Low
Strengthening the management of mineral resources
Maximize revenue from the mining sector in a sustainable way
High Substantial High Moderate
Manage the volatility from the mining sector High Substantial High Moderate
Improve transparency in the mobilization and use of mining resources
Moderate Moderate Substantial Substantial
Mitigate the environmental effects of the mining sector Substantial Moderate Substantial Moderate
Increasing human capital for new opportunities
Improving quality and access to health care High Substantial Substantial Moderate
Improve quality and access to education High Substantial Substantial Moderate
Expand coverage of social assistance programs Substantial Low Moderate Low
Build local capacity to install and maintain water and sanitation services
Substantial Moderate Moderate Moderate
FOUNDATIONAL ISSUES
Mitigating Overarching Governance Constraints
Priority 1: Strengthen accountability and contestability in key sectors
174. Efforts to improve the governance of critical sectors, such as agriculture and service delivery, should incorporate accountability and transparency measures. Elite capture and corruption happens at all levels and can be reduced by increasing the risk of exposure and strengthening accountability in institutions. Some forms of corruption are ‘transactional’ in nature—in other words, they are inherent to the political settlement. Others are ‘predatory’, or opportunistic in nature, making efforts to mitigate them more feasible. On the latter, it is important to improve the collection of information, the capacity to analyze it, and share results in the public domain. Also critical is the creation of spaces for participation, deliberation, and contestation in ways that can level the playing field and counter power asymmetries. Sierra Leone has already experimented with social accountability and legal and paralegal services on a relatively small scale and has developed a few important entry points for scaling up and institutionalizing these services, through the Legal Aid Act and the National Land Policy, for example. Targeted investments to enable citizen collective action and increase transparency and accountability could serve to change incentives in ways that improve results and equity in agriculture input markets, health service delivery, and land acquisition processes.
Priority 2: Incentivize functional solutions to improve public administration and local governance

76
175. Decentralization should be seen as a space of ongoing contestation with potential to improve services and shift the current equilibrium. While initial expectations of LCs have been dampened by a series of policy decisions, the incomplete transfer of authority and resources, and the reinstitution of the chieftaincy, they will remain a key component of the policy arena. The Constitutional Reform Commission has proposed amendments aimed at strengthening the political and administrative roles of LCs, and these will be considered for adoption later in 2017. Incremental reforms to increase the effectiveness of LCs by deepening administrative and fiscal decentralization should be complemented by efforts to understand positive deviance—that is, examples where despite the convoluted structures, local authorities have been successful in obtaining resources and used them to improve outcomes and/or increased political contestability. Building on promising evidence that increasing voter information can break down traditional partisan voting patterns, efforts to increase accountability to citizens can not only improve the provision of public goods but could also begin to reshape the social contract. Engaging in these generative dynamics at the local level may yield results more immediately than pushing formal reforms from the top down.
Alleviating Fiscal Constraints
Priority 1: Strengthen Domestic Revenue Mobilization
176. Accelerating growth and poverty reduction require removing infrastructure bottlenecks and enhancing human capital. Getting to and sustaining high investments in human and physical capital is difficult to achieve without an enhanced domestic revenue mobilization. Mobilizing more domestic revenues is the long-term solution to creating fiscal space and the process has already started in Sierra Leone with the creation of the NRA. However, these are opportunities that could generate additional revenue in the short to medium term. These include reducing the generous level of tax exemptions and tapping of the existing mineral sector. However, this is unlikely to happen unless the country adopts and enforces credible legal, administrative, and institutional frameworks, including adopting the amendments to the mining code.
Priority 2: Improve efficiency of public spending and value for money
177. Building human and physical capital for growth and poverty reduction would also require significant improvement in the efficiency of public spending. Bottlenecks in PFM and procurement lead to inefficient public spending in priority sectors. Greater efficiencies and higher value for money can be achieved through improvements in budgeting (enhanced allocative efficiency), procurement, and financial management, including reporting and oversight. Sierra Leone has built a fairly solid legal and regulatory framework that serves as the foundation for PFM. However, the country’s financial management systems continue to operate in an ineffective manner because of weak implementation. A new PFM Act has been approved in 2016 and became effective in January 2017. To better implement the new act, there are a number of issues that would need to change to achieve the desired impact. There needs to be considerable institutional change and capacity development across central government and requisite MDAs. On procurement, the Government has decided to implement e-procurement to increase transparency in procurement processes.
SPECIFIC PRIORITY AREAS
Strengthening the Productivity of the Agricultural Base
Top Priorities
Priority 1: Reform the role of the MAFFS in the provision of agricultural services

77
178. Improving productivity requires market liberalization to encourage the widespread adoption of modern agricultural inputs. Currently, less than 15 percent of agricultural households use modern agricultural inputs such as improved seed varieties, inorganic fertilizer, pesticides, or mechanized tools (CFSVA 2015). A main constraint to increased utilization is a state-led delivery system, mainly through the MAFFS, that is inefficient, subject to corruption, and crowds out the private sector. Removing state interference and instead channeling subsidies through the private sector will encourage the expansion of the network, creating a sustainable system for the timely availability of inputs. For the poorest households, which cannot afford to purchase inputs, it is possible to link input access to the social protection system, for example, by providing complementary basic cash transfers or relying on a common targeting platform through the existing Social Protection Registry for Integrated National Targeting.
179. With a shift to the private sector, there is an increased need for quality control for imported fertilizers, pesticides, and seeds. Reducing the activities of the MAFFS in the direct provision of inputs will free up resources to be redirected to quality control of imported inputs. With the expanded role of the private sector, there is an increased risk of unscrupulous business practices in the provision of fake, mislabeled, low-quality, or diluted agricultural inputs. This increases the need for certification and verification.
180. There is scope for public-private partnerships in research and development for agricultural inputs tailored to the Sierra Leonean context. Due to the low uptake of improved variety of seeds and inorganic fertilizers, there has been limited demand for inputs specifically tailored to the Sierra Leonean climate and soil. The combination of sporadic heavy rains and the naturally productive soil means that many standard combinations of inputs are not the correct match to the conditions. Similarly, high-yielding variety of seeds specifically for Sierra Leone have not yet been developed. Increased opportunities to sell inputs to a wider customer base will encourage entrepreneurs to seek out more effective products. This can be further supported by a national campaign of research and development to increase productivity.
181. Agricultural extension services to demonstrate the correct use of new products are needed. Without the necessary complementary agricultural extension services and demonstration farms, it is unlikely that farmers will be able to realize full potential yields even with the use of modern inputs, particularly given the low levels of education and literacy. Only 4.6 percent of agricultural workers live in households that have access to agricultural extension services. Anecdotal evidence confirms that only a limited number of extension agents are operating in Sierra Leone and there is the need to retrain and expand this network.
182. There are both political and technical feasibility constraints to reforming the MAFFS. On the political side, there is always resistance to change in ministerial functions, which in this case may be compounded by concerns that lucrative opportunities for rents may be lost. On the technical side, the new activities proposed for the MAFFS in quality control, research and development, and expansion of extension services require a different skill mix from the current staff, necessitating retraining or new hiring strategies. In terms of financial feasibility, the reforms would be either cost neutral or a net improvement to the balance sheet in anticipation of efficiency gains from shifting input provision to the private sector.
Priority 2: Improve market opportunities for producers
183. Improving rural incomes requires increased sales and profit for farmers. While improved yields will reduce poverty and food insecurity, for agriculture to be the engine of rural development, households must also generate income from their crops. Higher incomes from agriculture can provide households with resources to educate children, start nonfarm enterprises, and make other productive investments. Currently, only a minority of agricultural households sell even part of their harvest. Expanded

78
use of modern inputs will lower production costs, increasing margins and drawing new participants into the market, but further intervention is necessary to realize the full potential.
184. New processing facilities and better rural transportation networks are required. Sierra Leone currently imports up to 20 percent of its food supply, particularly for rice. For import substitution to occur, farmers must be able to process and transport their crops to urban consumers. This applies to rice, as well as to gari, which is made from cassava, and to palm oil. Currently processing facilities are limited, with only 11 percent of farmers reporting access during the 2014/15 agricultural season (CFSVA 2015). In addition to expanding access, it is also necessary to expand equity. Anecdotal evidence suggests that there is capture of both agriculture inputs and outputs that benefits local elites at the expense of farmers. To realize poverty reducing impacts from processing, the poor must also be able to access these facilities. In addition, a more extensive network of feeder roads is required to reduce transportation costs to Freetown and other regional centers.
185. Higher prices also increase profitability and market participation though at the cost of higher short-term poverty. Beyond decreasing production and marketing costs, higher and more stable prices will increase incomes for sellers. Farmers currently have difficulty competing with cheap rice imports. Imported prices are low partially due to a tariff waiver introduced during the 2008 food crisis, though farmers have also been hurt historically by an overvalued exchange rate during boom periods in mineral production. Politically, reinstating the tariff or taking other measures to protect domestic production are difficult due to the negative consequences on politically vocal urban residents, as well as the poverty impacts on the share of the rural population that are net consumers. While the removal of the tariff is a necessary priority for the long-term growth of the agricultural sector, it must be coupled with further investments in domestic production and offsetting social transfers to mitigate the short- and medium-term poverty impacts.
186. There are substantial financial and political feasibility constraints to improving market opportunities. On the financial side, improving infrastructure for producers, including processing facilities and rural feeder roads, requires new spending, which is difficult under the current fiscal conditions. Political feasibility may, however, pose larger challenges. At the national level, keeping prices low for the main staple crop is politically popular, particularly among urban residents and other net consumers. The challenge would be compounded by the upcoming presidential election, scheduled for early 2018. At the local level, there are political feasibility constraints regarding elite capture of processing facilities and perhaps with regard to land itself if agricultural profitability increases markedly.
Secondary Priorities
Priority 3: Facilitate new investment by addressing access to credit and risk management issues
187. For farmers to capitalize on modern inputs and sales opportunities, constraints in access to credit must be addressed. Farming by its nature requires a large-scale up-front expenditure on inputs many months before profits can be realized. For subsistence farmers seeking to expand or diversify production, the inability to borrow is a serious constraint, cited after only access to seeds as the main constraint to improving productions (CFSVA 2015). Key interventions in this area may include developing a rural banking network or reducing borrowing costs through a system of risk sharing. Also promoting the overall health of the commercial banking sector would be beneficial as this would also affect borrowing costs.
188. Sierra Leone has no formal system of crop insurance. The inability of farmers to manage risk discourages investment in new, and therefore risky, methods. This is particularly the case in a time of increased volatility due to climate change.

79
189. There are large technical constraints to increasing access to credit and decreasing risk for farmers. Credit and insurance markets require reliable means of identifying and pricing different levels of risk, and the lack of information results in prices that are too high even for low risk farmers. While there are examples of these issues being addressed in other parts of Africa and the developing world, research and experimentation would be necessary to design an appropriate set of products for Sierra Leone.
Priority 4: Land tenure reform for improved productivity and diversification
190. Traditional land tenure systems may hold back long-term investment in agriculture. Land is the main asset for most rural households. While there is broad consensus that the traditional land allocation system works well for subsistence agriculture, uptake of long-term investments, such as those required for slow-maturing cash crops, is low. Anecdotal evidence from the agriculture sector cites the perceived instability of land tenure as a major contributing factor. The root cause of these perceptions may be rooted in governance issues and concerns regarding elite capture, but further research is needed to more fully understand these issues.
191. Encroachment from mining and commercial agriculture could present problems in the future. Only a small percentage of the total land area is used for commercial purposes, but this may expand in the future as mining and agribusiness development are key growth sectors for the economy. A number of conflicts, in some of which people were injured or killed, have already taken place along boundary areas. In addition, the CFSVA (2015) recorded a small number of farmers who cited pollution from mining as a major constraint to increasing their production. The National Land Policy adopted in 2015 provides a good basis for promoting more equitable land acquisition and citizen engagement processes to mitigate such conflicts and improve local benefits from investment. This will require developing a system of consultations and advisory services to level the playing field and enhance negotiations between companies and host communities.
192. Land tenure reform has a very low feasibility due to political constraints. Land tenure reform would require a completely new system of land allocation and tenure registration for all areas of Sierra Leone outside of the Freetown peninsula. There would undoubtedly be strong opposition from local elites, in particular paramount chiefs who derive their power from the right to allocate land. In turn, there would be opposition from national political parties that count a reciprocating patronage system for votes. A less controversial alternative may be to expand the scope to ‘professionalize’ paramount chiefs through training in equitable allocation and fair resolution of disputes.
Diversifying the Economy and Creating Poverty-Alleviating Jobs
Top Priorities
Priority 1: Strengthen macroeconomic stability
193. These interventions proposed to strengthen macroeconomic stability are expected to have high impact on the twin goals, high impact on the medium- to long-term economic growth, and high degree of complementarity with the other interventions. The adoption and implementation of the proposed interventions could raise some political challenges but they are technically and financially feasible.
194. Diversifying the Sierra Leonean economy and creating poverty-alleviating jobs require substantial improvement of the country’s macroeconomic environment to better anchor expectations and improve firms’ decision making. The fluctuations in growth, inflation, exchange rate, government spending, and aggregate demand are very high in Sierra Leone; significantly affect the enterprises’ decision

80
making; and prevent optimal allocation of resources. Most of this volatility emanated from the mining sector. The only way of avoiding the wild fluctuations in government spending, inflation, and exchange rates that Sierra Leone has experienced repeatedly since independence is to resist the temptation to spend the large influx of mineral revenue in periods of boom. A stabilization fund is the most common mechanism used by governments and/or central banks in resource-rich countries to insulate the domestic economy from large fluctuation in revenue. The principal motivation is maintaining a steady and predictable path of government expenditure that is commensurate with existing absorption capacity, which fosters macroeconomic stability and sustainability. The Government has taken steps in this direction but it could go further. The new PFM Act (2016) created a Transformational Development Stabilization Fund (TDSF) and an Intergenerational Savings Fund. The political feasibility of the fund may be challenging.
195. Flexible exchange rate policy should also be maintained. With the downturn in iron ore prices, the Government has implemented several policy measures that helped the economy adjust. The BSL has reduced its interventions in the foreign exchange market from US$20 million to US$3 million in weekly auctions between 2014 and 2016, and greater exchange rate flexibility has allowed the currency to depreciate by almost 40 percent between 2014 and 2016. The Government should completely eliminate its interventions, particularly in the period of higher influx of mineral revenue, that tend to further appreciate the local currency.
196. Strengthening domestic revenue mobilization is key for fiscal stability. While expanding the tax base and tapping into the mineral resource rents are the most significant way to mobilize revenue in the long term, there are a few actions Sierra Leone could implement to strengthen revenue in the short to medium term. In late 2016, the Government succeeded in eliminating some tax exemptions, though ending other existing waivers (tariff on rice imports) appears difficult. For example, GST exemptions on electricity was eliminated and import duty, excise tax, and GST on fuel were reinstated in November 2016 after a long period of fixed fuel retail prices that eroded the collected taxes. Letting the retail prices of fuel float is the best way to protect the tax base. Renegotiating existing mining contracts could also generate additional revenue from the mining sector.
197. Expenditure policy should be reoriented toward investment in infrastructure (electricity roads). With the elimination of implicit subsidies, additional fiscal space would be available for capital spending. In addition, the Government has also taken steps to better manage its payroll, including by better enforcing the mandatory retirement age. These fiscal consolidation efforts and the new path of fiscal spending they have created should be maintained even in the case of sudden large influx of mineral revenue.
198. Domestic financing of the fiscal deficit should be maintained at a reasonable level to avoid crowding out of credit to the private sector. For example, from July 2013 to September 2016, net credit to the central government increased by 40.2 on average per month (year-on-year) compared to 5.3 percent only for the credit to the private sector. By September 2016, more than 60 percent of the domestic credit was given to the central government versus only 24 percent to the private sector.
Priority 2: Improving access to infrastructure (energy, transport, and ICT); credit, and improving labor market regulations
199. These interventions proposed to improve access infrastructure, credit, and labor are expected to have substantial impact on the twin goals, substantial impact on the medium- to long-term economic growth, and substantial degree of complementarity with the other interventions. While the proposed interventions will have strong political support, their technical and financial feasibility will be challenging given the fiscal constraints the country is facing. However, the Government has prioritized these sectors in its strategic development plan.

81
200. Diversifying the Sierra Leonean economy and creating poverty-alleviating jobs require substantial improvement of the country’s business environment. Enterprises face huge constraints when doing business in Sierra Leone. Access to key inputs; infrastructure (energy, transport, and ICT); and factors of production (labor and capital) is very poor. Increasing access to electricity is critical for improving productivity and reducing production cost. Improving the quality of electricity supply, by reducing the frequency of interruptions (currently 183 per year) and the average duration of outages (currently 10 hours) could free up capacity in the manufacturing (including food processing) and services sectors (formal and informal). Sierra Leone has little fossil resources (oil, gas and coal) but is rich with renewable energy resources, particularly hydropower and solar energy. The country needs to develop and implement a least-cost sector expansion plan which would determine the lowest possible electricity cost to the economy and move the sector toward a sustainable development path. The Government’s institutional framework for review and approval of electricity project is highly opaque and unpredictable. The Government needs to streamline the entire process from project selection, procurement to award, develop world-class standard documents, and implement risk-sharing measures aligned to the country’s risk profile.
201. The quality of the road network, including feeder roads, should be improved. The development of a national transportation network enabling movement of goods and people to build an integrated economy that is resilient to shocks and create jobs is a prerequisite for modernizing agriculture and developing tourism. Agriculture development is limited partly due to inadequate access to all-weather feeder roads for easy evacuation of farm produce and link of smallholder farmers to either processing centers or market places. Access to social services such as schools, markets, and hospitals is important for the economic growth of a nation. While construction and rehabilitation of roads are common, there is no arrangement for their maintenance. The institutional structure requires strengthening for proper coordination between the implementation agency and funding administration.
202. Higher access and reduced cost of ICT is also critical for productivity growth and job creation. The use of ICTs facilitates the flow of information along the value chains and helps link producers to markets. Factors such as high illiteracy rate, financial constraints, poor communication means, and lack of access to information limit producers’ access to markets and the benefits they derive from having it. The Government of Sierra Leone is preparing sector strategy and five-year strategic plan which will be critical in shaping the ICT sector’s move forward. The West Africa Regional Communications Infrastructure Program (WARCIP) project is providing support to remove the bottlenecks in the sector through the commissioning of studies that will inform the sectoral strategy and plan.
203. Diversifying the economy and boosting job creation in Sierra Leone requires greater access to credit and financial services. Deepening financial intermediation, particularly stimulating the growth in private sector credit by banks, will necessitate (a) addressing the crowding out impact of government fiscal financing; (b) resurrecting monetary instruments for sterilization objectives; (c) establishing a stable and positive yield curve; and (d) enhancing financial sector supervision and overcoming structural/risk impediments to credit growth. Improving financial sector supporting infrastructure and prudential supervision is also critical to support a broadening of the market, including expanding bank branches and community banks. In this respect the Government will need to address the poor performance of the two state banks and NASSIT, the latter important for the development of the longer-term securities’ and capital markets. With limited commercial bank outreach, digital financial services could help fill the gap, leveraging the country’s high mobile coverage to expand financial inclusion17. Other measures would include a more extensive credit bureau, leasing framework, and collateral registry. The country also needs to improve AML/CFT supervision and compliance monitoring across the financial subsectors and tailoring
17 According to the National Strategy for Financial Inclusion 2017–2020, mobile agents make up 90 percent of the country’s financial access points.

82
AML/CFT obligations in a risk-based approach to ensure that internal controls do not impede financial inclusion aims.
204. Lastly, boosting poverty-alleviating jobs also requires a reform of the labor code to facilitate hiring in the formal sector. Sierra Leone’s laws regulating the labor market date back to 1960 but the laws are currently being revised. The country needs to increase the flexibility of its employment regulations to facilitate hiring and firing of workers and reduce the cost of labor. The country has adopted the National Employment Policy in 2012. The policy was launched in 2016 together with its implementation plan covering 2015–2018.
Priority 3: Promote vertical diversification
205. These interventions proposed to promote vertical diversification are expected to have substantial impact on the twin goals, moderate impact on the medium- to long-term economic growth, and substantial degree of complementarity with the other interventions. The Government has prioritized the development the rice value chain and fisheries sector. However, providing the right incentive to the producers in the sector will be politically challenging though technically and financially feasible.
206. To diversify the economy and create better jobs, Sierra Leone should also tap into its potential for vertical diversification by promoting the development of rice and fish value chains. An attractive price policy plays a critical role in developing the rice value chain in Sierra Leone. A first step toward developing the value chain is to provide a good incentives package for private sector involvement both upstream and downstream of the value chain. The overall incentive package could be include the reduction or elimination of the waiver on the import tariff of rice (15 percent) to promote competition between imported and locally produced rice, although this may negatively affect households that are net buyers. In addition, the Government should maintain an exchange rate policy that does not harm the agriculture sector. In addition, the Government could reinforce the feeder road network. Farmers have limited access to transportation facilities because of inadequate level of all-weather feeder roads to enable easy evacuation of produce to processing centers or markets. Given Sierra Leone’s comparative advantage in rice production, stronger integration in the ECOWAS rice market may generate expanded export opportunities for the country.
207. Corrective policies in the fisheries sector could also create better jobs and make growth more inclusive and sustainable. Sierra Leone should control and limit the access to its marine resources by reducing the number of licensed foreign vessels. One of the reasons so many licenses are being issued is the extremely low license fee. Sierra Leone receives only an estimated US$193 per fishing day per 200 Gross Registered Tonnage (GRT) trawler while the ex-vessel value is estimated at US$2,500 per day, implying license fees at only 0.8 percent of the ex-vessel value, compared to 10 percent charged in Liberia and international norms of 5 to 8 percent. With an increase of the license fee, Sierra Leone could generate the same level of revenue (US$7 million) with a smaller number of 30 trawlers instead of more than 90. There is also insufficient capacity in the Ministry of Fisheries and Marine Resources (MFMR) to monitor and enforce permissible catch under fishing licenses. In addition to limiting the fishing capacity, the Government could encourage private investment through public-private partnerships and focus public investment on providing the basic infrastructure such as landing facilities.
Secondary Priorities
Priority 4: Increase the productivity of the urban informal sector
208. Increasing productivity in the informal sector has high impact on economic growth and the twin goals and would also complement interventions in other sectors. However, there is limited

83
knowledge on how productivity could be improved in the informal sector, making its technical feasibility very low. There are a few pilot projects in several countries, but the overall cost seems to be high.
209. Productivity could be improved by facilitating access to credit and training programs for a select number of informal entrepreneurs. The informal sector is often considered as a burden for development because of its low productivity. However, the contribution of the informal sector to job creation and income is significant. Therefore, developing policies to encourage productivity in the informal sector should be encouraged. Targeted interventions (including training, advising, incubation, and funding) offered to small enterprises could generate wide spillover effects.
Strengthening the Management of Mineral Resources
210. Only a few developing countries have succeeded in managing natural resource rents in a way that creates a fair and equal sharing of wealth in the population. Many resource-rich African countries make poor use of their wealth. Instead of creating prosperity, resources have too often fostered corruption, undermined inclusive economic growth, incited armed conflict, and damaged the environment. Many resource-rich countries get poor scores on indexes measuring transparency and accountability. The high revenues increase state power and enable the ruling elite to buy off rivals and manipulate state institutions. However, there are few countries, such as Botswana, that efficiently use their natural resources revenue.
Top Priorities
Priority 1: Maximize revenue from the mining sector in a sustainable way
211. Maximizing revenue from the mining sector could have high impact on the twin goals, substantial impact on economic growth, and high spillover effects to other sectors. The proposed interventions are technically feasible and are expected to have positive fiscal impact but would require strong political commitment.
212. For a country to be resource blessed, a range of ‘good enough’ institutions is crucial. On the one hand, institutions for efficient rent extraction from the mining ministry such as the contracting arrangements and tax authorities are needed. But to handle the revenues properly, and to distribute these in a fair and developmentally oriented manner, institutions of revenue management and distribution are essential. These must be fully established and have adequate administrative and professional capacity before the resource revenues start flowing. Good use of revenues depends on institutions of oversight and control and vertical accountability in the form of strong civil society and media organizations.
213. To maximize revenue from extractives, Sierra Leone should review its legal and regulatory framework for the mining sector. The 2009 MMA and 2011 Petroleum Act include inconsistencies that leave huge discretionary power to the government agencies leading to personalized agreement, including provisions related to the fiscal regime. The revision of the legal and regulatory framework matched with human and institutional capacity and practical strategic planning are required for efficient management of the sector and adequate revenue mobilization. In particular, the fiscal regime of the extractive sector should be grouped in one piece of legislation, preferably the tax code. This would allow alignment of the tax rates applied to mining companies and increase the transparency of the fiscal regime. Based on the revised legal framework, Sierra Leone could renegotiate some existing mining contracts to reduce tax exemptions.
Priority 2: Manage the volatility from the mining sector
214. A successful management of the volatility emanating from the mining sector is expected to have high impact on the twin goals, substantial impact on economic growth, and high spillover effects

84
to other sectors. The proposed interventions are also technically feasible and are expected to have positive fiscal impact but would require strong political commitment.
215. Macro policy slippages occurred in several countries with high natural resources windfalls. When the country starts exploiting mineral resources, people hope for development and better living standards, as the economic outlook becomes promising. Unfortunately, most of the time, the country starts implementing expansionary fiscal policy financed by high mineral revenue expectations and driven by a large wage bill and generously granted subsidies, thus putting the country’s medium-term prospects at risk. Overall, public expenditures should be rooted in a sound macro-fiscal framework to avoid the deleterious effects of commodity price volatility and to prevent real exchange rate appreciation from non-targeted subsidies or investment spending boom not modulated to the absorptive capacity of the economy. A stabilization fund is the most common mechanism used by governments and/or central banks to maintain a steady and predictable path of government expenditure that is commensurate with existing absorption capacity. The new PFM Act (2016) created a TDSF and an Intergenerational Savings Fund. It should be made quickly operational with clear fiscal rule, to make the country ready for saving during the next commodity boom cycle. Sierra Leone should also development its Public Investment Management Framework so that investment projects will be well prepared and implemented in a transparent and cost-effective manner.
Secondary Priorities
Priority 3: Improve transparency in the mobilization and use of mining resources
216. Improving the general transparency of the sector by increasing access to mineral information is also critical to foster accountability but is expected to have only moderate impact on growth and the twin goals. According to the latest EITI report, “Sierra Leone received US$58 million in revenue in 2014 from its extractive industry operations, 85 percent of these revenues came from the mining sector, with the rest mainly stemming from exploration activities in the petroleum sector. Revenues were mainly collected through mineral royalties (57 percent), mining licenses (9 percent) and signature bonuses from the award of oil blocks (7 percent).”18 Information on companies’ shareholding structures is now available in its online Mining Cadaster Administrative System (MCAS). However, the Government of Sierra Leone does not have a contract disclosure policy.
Priority 4: Mitigate the environmental effects of the mining sector
217. Sierra Leone should mitigate the negative effects that the mining sector could cause to the environment to ensure sustainability and equitable distribution of the benefits. In a bid to ensure compliance with the provisions of the EPA, 2008, as amended in 2010, and its regulations and environmental guidelines, the Environmental Protection Agency established an environmental assessment compliance system to be adhered to by developers/proponents with EIA licenses. The Environmental Protection Agency ensures that operational procedures and guidelines on environmental inspections, environmental audits, and manual for field operations are followed by environment officers of both the agency and companies with EIA licenses. The Environmental Protection Agency also ensures that routine monitoring and inspections exercises are undertaken in collaboration and full participation with MDAs, NGOs, civil society, and community-based organizations to ensure transparency and accountability in the protection and management of the environment and use of natural resources. The new version of MCAS already includes some information on beneficial ownership as information on company ownership was already a requirement for industrial mining licenses. Some challenges still remain with regard to the management of the extractives industry. However, there is considerable effort toward improving
18 https://eiti.org/sierra-leone.

85
transparency in the allocation of mining permits and concessions, and the Government is gradually moving toward a transparent system of capturing and managing the use of mineral rents for socioeconomic development. Also, the Environmental Protection Agency ensures that all Environmental and Social Impact Assessment (ESIA) reports are disclosed to interested and affected parties to verify that relevant stakeholders were highly consulted in the preparation of the report. Also, the agency makes the ESIA reports public and conducts radio, community, and TV sensitization campaigns on the level of compliance by companies and manufacturers and actions taken against defaulters.
Increasing Human Capital for New Opportunities
Top Priorities
Priority 1: Improving quality and access to health care
218. Sierra Leoneans need better access to quality health care. The inability of the public health system to provide quality health care to the population leads to both poor outcomes and high expenditures on OTC drugs and private care. Given the current fiscal constraints, however, a large expansion of the provider network is not possible in the near term. Moreover, analysis from the health sector indicates that some areas in fact now have more health facilities than are required and that issues of the distribution of facilities and the quality of care are more salient currently. Therefore, future investments in the sector should focus on improving the efficiency of health sector spending (including reducing staffing absenteeism, reducing corruption, and better coordination within public sector but also with the nonpublic sector providers of health services, such as NGOs) and overall quality improvements (including preventing drug stock outages). Finally, supporting infrastructure, such as rural roads, electricity, reliable mobile networks, and clean water supplies are also important components to improving health systems.
219. Maternal and child health are key areas for accelerated improvements. Though maternal health outcomes have improved since the 2010 Free Health Care Initiative, and dependency ratios are slowly declining, Sierra Leone still ranks among the worst in the world in these measures. Improving these outcomes requires meeting the unmet need for contraceptives, encouraging greater uptake of prenatal care, and increasing the percentage of deliveries at health facilities, in particular for high-risk pregnancies. Furthermore, projects supporting girls’ education, better nutrition for pregnant women, and reducing the incidence of malaria and other diseases, which can lead to pregnancy complications, can support improvements in outcomes. Beyond maternal health, infant and child health outcomes could be strengthened though interventions to encourage women to complete pre and postnatal wellness visits; closing remaining gaps in vaccination coverage; improving nutrition, with emphasis on prenatal and early years nutrition to booster childhood development outcomes; expanding access to basic supplies and remedies, such as insecticide treated nets and oral rehydration solution; and generally improving access to water and sanitation facilities.
220. Sierra Leone remains vulnerable to infectious diseases and must improve resilience to public health emergencies. The outbreak of Ebola in 2014 and 2015 clearly highlighted the weaknesses in the Sierra Leonean health system to provide adequate disease surveillance and to treat victims. Between May 2014 and March 2016, the country lost 7 percent of its doctors, nurses, and midwives, reducing the total to 1,074 for a country of 7 million. Though the country was declared Ebola-free in March 2016, the 2016 Joint External Evaluation on fulfillment of the 2005 International Health Regulations, led by the World Health Organization and the United States Center for Disease Control, revealed that Sierra Leone has very low overall disease outbreak preparedness capacity and no capacity in zoonotic disease prevention. Should another infectious disease outbreak hit Sierra Leone, the 2014/5 crisis could be repeated.

86
221. Strengthening the health care system has substantial political feasibility but faces technical and potentially financial constraints. Since improved access to quality health care is an uncontroversial good, the incentives of various stakeholders should be aligned to improve outcomes; yet, results remain poor. This points to technical constraints in improving the allocation of facilities, training of staff, and preventing leakage of supplies. Determining the specific technical constraints is further discussed in the Chapter 7. In addition, there may be financial constraints if addressing the technical issues requires additional funding.
Priority 2: Improve quality and access to education.
222. Better schools, as opposed to more schools, is the key priority in the education sector. Though severe overcrowding is an issue in about one-quarter of schools, learning outcomes indicate that nearly all schools suffer from issues related to performance. There is a shortage of qualified teachers with adequate skills, instructional time is insufficient, and availability and use of pedagogical materials is low. There are high rates of teacher absenteeism due to poor incentives and weak accountability mechanisms. Education service delivery in Sierra Leone is provided by a mix of government and nongovernment agencies receiving varying levels of government assistance. Only 16 percent of all schools are government owned; the remaining are owned and operated by nongovernment agencies including mission/religious institutions (40 percent), communities (32 percent), and private proprietors (12 percent). A substantial share, however, of schools owned and operated by these nongovernment agencies receive some form of government assistance. Among schools owned and operated by nongovernment actors, 57 percent have at least one teacher paid by the Government, but only 21 percent had all teachers paid by the Government. Acknowledging that there is a diverse set of actors in the sector, high achieving schools should be rewarded with performance-based school grants, regardless of their status as approved and unapproved schools. Similarly, there is the need to strengthen supervision and accountability over school performance and use of school grants, including better measurement of school performance, dissemination of school performance information, and community engagement, across all schools. In addition, the quality of instruction can be improved by improving teacher management systems, including screening and recruitment of teachers, preparation and training, licensing, deployment, pay and promotion, performance management, aligning of incentives, and upgrading of qualifications of in-service teachers.
223. Where greater access is needed, initiatives should be well-targeted, focusing on underserved levels of education in underserved locations and underserved demographics. Approximately 10 percent of rural school-age children were more than an hour from a primary school, and 57 percent were more than an hour from a secondary school, compared to 2 percent and 8 percent of urban school-age children, respectively. Increasing supply of schools (thereby increasing access) should be targeted to school levels (preprimary and upper secondary) and locations where there is a discernible supply deficit but high expected demand, using a combination of approaches as appropriate: school upgrading, school consolidation, public-private partnership models, low-cost construction methods, and/or new construction. Decisions around establishment of new schools must also consider the issue of availability of competent teachers and fiscal consequences. Additionally, while the gender gap has closed for lower levels of education, gaps still remain at higher levels. Given the positive impacts of higher-level education for girls on income and fertility, expanding financial/nonfinancial interventions to encourage enrollment and retention for secondary and tertiary education would have positive externalities across a number of sectors. For poor and vulnerable households, issues related to cost (including opportunity costs) of schooling for households remain a significant barrier, exacerbated by informal fees charged by schools in the absence of adequate and predictable flow of fee subsidies to schools from government. Complementary investments, such as expanding access to preprimary schools and early learning, can boost school readiness and improve learning outcomes, counteracting the perceived low value of education by children and parents that inhibits efforts to increase quality.

87
224. More targeted training opportunities and better curriculum materials are needed to increase the quality and relevance of skills for Sierra Leone’s workforce. Skills are at the core of improving individuals’ employment outcomes and increasing countries’ productivity and growth, and both the education and vocational training systems should be better aligned with the needs of employers. In addition to the urgent need to improve foundational skills like numeracy and literacy (see the previous paragraph), the ‘skills’ sector in terms of post-basic vocational or technical training needs numerous improvements. On the demand side, both school-based and on-the-job training programs are expensive, and poaching externalities deter firms from investing in skills. Small- and medium-size firms also lack knowledge on skills training options and importance of standards in training. On the supply side, training is supply driven—curricula and instructional methods are outdated and not aligned with labor market needs. Skills development is limited to the vocational and technical parts without providing additional services needed for results (coaching, job placement, technology, social, and so on). There is insufficient capacity (financial, organizational, infrastructure) of skill providers; the quality of instruction and instructors is poor; and links with industry are limited as is responsiveness to training and skills development needs in the informal sector. Credit market failures and liquidity constraints also prevent providers from modernizing. Coordination challenges are significant. There are multiple public, private, and NGO sector agencies involved in training and skills development (with private providers dominating the landscape), but there is no coherent, cohesive vision or policy on skills, and financing and quality assurance systems are lacking. To maximize impacts, efforts to develop sustainable policies, systems, and institutions should be accompanied by delivery of competency-based certified skills programs by qualified providers, with strong private sector engagement, in target sectors (and selective occupations therein) where skill deficits are the highest.
225. The feasibility assessment of improving access to education is similar to health though with a greater likelihood of facing financial constraints.
Secondary Priorities
Priority 3: Expand coverage of social assistance programs
226. Expanding social protection coverage could have multiple positive externalities if adequate fiscal space can be found in the budget. There is evidence from economics literature that safety net programs can be effective at building resilience to shocks, promote utilization of social services, have positive impacts on consumption, and increase uptake of health and nutrition services, including the use of antenatal care among pregnant women and increasing likelihood that young children receive timely preventive health care. Evidence from Sierra Leone itself indicates that even short-run cash transfers programs can have positive effects on spending on medicine and on utilization of health services. This evidence also shows that these programs can have productive impacts: by providing a source of capital and mitigating household risk, they have been found to crowd-in labor and allow households to make productive investments (for example, livestock assets) and improve living conditions. Finally, there is emerging evidence from Sierra Leone showing that interventions combining capital and skills interventions can help increase employment, entrepreneurship, and incomes, with noncognitive skills as a key channel of impact. Despite the potential benefits, given the current constrained fiscal space in Sierra Leone due to the economic slowdown, it is unlikely that Sierra Leone would be able to extend social safety nets to wide sections of the population in the near future. Priorities within the sector should therefore focus on minimum investments in basic social safety net systems that can facilitate rapid scale-up in the unfortunate event of future disease outbreaks or fiscal programs (such as subsidy reductions), which result in Government demand for mitigation efforts for the poor.
227. The main constraint to expanding the social safety net is financial feasibility. As the current system has demonstrated that it can be scaled up and respond quickly in a crisis situation, technical and

88
political concerns are present but likely nonbinding. In the current financial situation, however, it is not financially possible to scale up the safety net in a sustainable manner.
Priority 4: Build local capacity to install and maintain water and sanitation services
228. Expanding access to clean water and improved sanitation services would reinforce gains in the health sector. The potential key areas of policy intervention would be in (a) expanding production and distribution while working toward full cost recovery at Guma Valley Water Company (Freetown service provider) and the Sierra Leone Water Company (SALWACO); (b) investing in Freetown’s fecal sludge disposal and treatment facilities while developing the fecal sludge management chains; and (c) increasing access to basic services while building district capacity to sustain rural water supply and sanitation investments.
229. The main feasibility constraints in the water and sanitation sectors are technical and financial. There needs to be an expansion of skills at the local level to maintain equipment in a financially sustainable manner.

89
CHAPTER 6: RISKS
230. There are several risks to sustainable growth and poverty reduction in Sierra Leone. The country’s current economic system is not sustainable on either a social, political, or environmental level. Imbalances in the system produced a long political contest that culminated in a civil conflict in which several lives were lost, property and productive assets destroyed, and natural resources wasted. While significant progress has been made in the return to democracy and organization of peaceful elections, the recent cycle of rent growth, rent capture, and rent collapse is reminiscent of the prewar period, which was marked by non-inclusive public policies and weakened legitimacy of the state. Today, the economy remains dual (Freetown versus the rest of the country) and fragmented (agriculture remains isolated), and there is limited coordination, links, or synergies.
FRAGILITY
231. While some of the underlying conditions and grievances that fueled the civil war remain, general consensus is that renewed violence is highly unlikely. The kind of violence initiated in the civil war was to a large extent driven by external parties, and there is little risk of a relapse. But fragility and episodes of unrest are likely to continue to mark the country. As laid out in this SCD, although multi-party democracy and basic economic stability has been restored, neopatrimonialism, corruption and exploitative chiefs still characterize governance today. The EVD epidemic was a stark reminder of institutional weakness: it had a devastating impact on basic service delivery, unveiled institutional corruption, set back economic growth, and deepened mistrust of the government. And the second shock of falling commodity prices has further contributed to a state of satisfaction and occasional unrest.19
232. A youthful population and increasing urbanization brings risks as well as opportunities to the country. The trend in urbanization in Sierra Leone has continued throughout the post-independence period, including through boom and bust periods and through the civil war. The perceived influx of wealth associated with large-scale iron ore mining is likely to increase expectations and accelerate urbanization in the coming years, particularly among the youth. This raises the risk of instability if expectations are not met. According to the LFS, the youth unemployment rate in Freetown was 14 percent in 2014, with a further 51 percent of workers classified as underemployed. There have been recent sporadic incidents of violence, including reports by the Sierra Leonean media of rioting by disaffected youth in Kabala (Koinadugu District) and eastern Freetown, in August and September 2016, and in Bo, in March 2017.20 Youth marginalization constitutes a significant risk for long-term stability, and the Bertelsmann Transformation Index sees a “persistent threat to the country’s security”21 stemming from these issues. The threat of insecurity is not only related to a relapse into conflict, which most observers consider unlikely, but also increased violence and crime, particularly in Freetown.
233. Necessary fiscal reform can contribute to instability. Given the austerity budget situation following the recent contraction of the economy, the Government has had to scale back subsidies and other benefits during a time of high inflation and when fewer economic opportunities exist for the population. There have already been recent increases in prices of water, electricity, fuel, and transportation. Though there have been calls to protest, “the authorities have restricted political freedoms and swiftly cracked down on public protests” (Sierra Leone Risk and Resilience Assessment, 2017). Continued economic pressure or
19 Sierra Leone Risk and Resilience Assessment Update January 2017. 20 “3 Killed in Kabala Riot in Sierra Leone” http://sierraexpressmedia.com/?p=79103. Accessed 28 April 2017; “Angry youths rioting in the East of Freetown Sierra Leone” http://www.thesierraleonetelegraph.com/?p=13781. Accessed 28 April 2017; “Sierra Leone district of Bo under siege—one student shot dead” http://www.thesierraleonetelegraph.com/?p=15689. Accessed 28 April 2017. 21 Bertelsmann Foundation 2012.

90
political repression does have the potential, however, to lead to a violence, particularly in urban areas, which are more exposed to price changes.
234. Concessions and development of land have destabilizing and potentially conflict-inducing effects. Efforts to develop land whether through increasing productivity of smallholders or increasing FDI projects in mining and agribusiness come with payoffs as well as risks. Given that land represents the primary asset of much of the population, as well as a major opportunity for rent-seeking, increasing its value will likely also trigger struggles for control over the rents. The current system of land tenure and administration is ill-equipped to manage these transitions from traditional usage to commercialization and monetization of land. Land acquisition processes are poorly understood by both landowners and investors and are easily subject to manipulation by local elites. Payments are distributed to the elder males of land-owning families, often with a significant mediating role for chiefs, and neither women nor youth have influence over decisions regarding that money. In addition, migrants who may have farmed the land for generations but hold no formal or traditional rights over the land are excluded from payments and also lose access to farmland. Generational tensions are of the greatest concern as a key structural driver of the civil war was the failure of the patron-client system, wherein elders failed in their traditional responsibility to provide resources to young males who then had no reason to uphold their own responsibilities as clients. (RRA 2017) Mitigating these risks requires both efforts to improve the land administration system, including through implementation of the National Land Policy, over the medium term, and efforts to foster institutional mechanisms that level the playing field for smallholders and the vulnerable to protect their interests in land acquisition transaction.
POLITICAL RISKS
235. With elections set for March 2018, political tensions may increase with possible unrest and violence. All of Sierra Leone’s presidential elections have been characterized by some degree of violence, but over the three postwar elections, this has consecutively reduced from strategies of deliberate intimidation in 2007 to isolated episodes of violence in 2012.
236. More broadly, as described in this report, political polarization coincides with ethnic divides, the underlying basis for a struggle over the control of resources, and areas of influence. Rampant corruption, nepotism, and elite rent-seeking have weakened trust in government legitimacy and aggravated grievances. Corrupt practices are manifold, ranging from misappropriation of public funds to the provision of public services driven by electoral, ethnic, and political considerations, and the prevalence of patrimonial practices for jobs, contracts, and political appointments. The continuing ethno-regional division of Sierra Leone’s politics leaves the system vulnerable to suboptimal equilibria. By placing Freetown as the tie-breaker in the power balance between the two main political parties, there are incentives to continue to enact policies that favor Freetown over the districts, including an artificially high exchange rate and price subsidies for food and fuel. It also decreases the incentive for the Government to be responsive to the needs of the majority, entrenching patronage, elite capture, and rent-seeking behaviors.
ENVIRONMENTAL RISKS
237. Sierra Leone is prone to natural disasters, mainly in the form of recurrent floods, drought, and landslides, which are likely to be exacerbated by climate change. The Notre Dame Global Adaption Index ranks Sierra Leone 158th out of 182 countries and territories in terms of vulnerability to climate change.22 With 13 percent of its area and more than 35 percent of the population at risk, the country is considered to be at a relatively high mortality risk from multiple hazards. In the last 15 years, Sierra Leone has experienced four major floods that affected over 220,000 people, causing severe economic damage in
22 http://index.gain.org/ranking/vulnerability.

91
addition to loss of lives. Exposure to natural disasters is likely to worsen in the coming years, given the low level of development and capacity to cope with extreme events, as well as Sierra Leone’s vulnerability to the adverse effects of climate variability. The Second National Communication on Climate Change notes that more than 2.3 million people, many on the Freetown peninsula, live in areas that would be inundated by a 1-meter rise in sea levels, which is expected by 2100. Many more could be threatened due to contamination of fresh water sources by sea water.
238. Sierra Leone also faces several environmental challenges related to unsustainable development practices. Specifically, human activity has the potential to harm the relevant ecosystem that may result in depletion of the country’s natural wealth. As it is a highly agrarian society, pollution and soil depletion could have substantial negative impacts on the country’s food system and livelihoods in both urban and rural areas. Unsustainable mining practices are associated with environmental degradation, and the true cost of exploiting mineral and hydrocarbon deposits is often not fully considered because of a potential disconnect between the direct beneficiaries—government and operating companies—and those who are adversely affected—the local farming population. The environmental costs from mining include pollution, social displacement, and loss of agricultural productivity and livelihoods. Emerging agribusiness industries, such as palm oil cultivation, and unsustainable fishing practices could also have profound environmental costs if not sustainably managed. In addition, increasing population and urbanization poses challenges. Despite having a population of over 1 million, Freetown does not have a wastewater or fecal sludge treatment site, and consequently, all liquid waste is released into the environment untreated. There is therefore a huge need to establish new liquid and solid waste management sites to protect the local fishing industry from pollution and improve health and sanitary conditions in the capital.
239. The country’s track record on the environment is not encouraging. It ranked 173 out of 178 countries on the Environment Policy Index, a measure of human health impacts from biological impacts and the protection of ecosystems. It performs worse than regional comparators on nearly every indicator, with particularly low scores on water resource use, water and sanitation, and protection of forests. Environmental management is hindered by numerous institutional obstacles, including weak technical capacity, poor coordination and monitoring, and little oversight and enforcement capacity. Institutional impediments are rife across the range of state institutions involved in managing the environment.

92
CHAPTER 7: KNOWLEDGE GAPS
240. Sierra Leone lacks updated socioeconomic statistics related to poverty levels and their determinants. The last SLIHS was conducted in 2011 and the next is planned for 2017. This represents a gap of six years—double the international recommendation of three-year intervals for poverty surveys. It is particularly critical to have updated data in the wake of the Ebola crisis as research conducted using cell phone surveys during the crisis indicated disproportionate impacts on urban areas, which had previously been comparatively better-off. If such a shift has persisted post the crisis, there could be important policy implications for the national poverty reduction strategy. Overall, the national statistical system is uneven, being mainly opportunistic and donor driven rather than following a strategic development plan.
241. Geological data work related to the extractive industry is incomplete. Many junior and mid-tier mining companies are unaware of the country’s full mineral potential, largely as a result of incomplete coverage of geological mapping at the required scale and associated geochemical and geophysical surveys. More detailed analytical and geological data interpretation work is necessary to fully understand the geology, assess mineral potential, and undertake a new approach to engaging investors on investment opportunities at all the stages of the mineral development cycle. Better knowledge of the geological potential would reduce the asymmetry of information that currently leaves governments in a disadvantaged position while mining companies have superior geological mapping datasets that give them an edge when negotiating concessions. Improving Sierra Leone’s geological infrastructure will support not only the mining sector but also land use planning, environmental management, civil works, water management, risk hazard management, forestry, agriculture, and energy.
242. There is limited information available on the rate of sustainable exploitation of the renewable sectors. While some information has been compiled on the agricultural sector by the World Bank and other donors, there are important gaps related to forests and fisheries. Understanding the maximum yield potential and the levels of reserves for the various renewable resources in Sierra Leone is a key input to develop a coherent and sustainable resource-led growth strategy.
243. Substantial knowledge gaps need to be addressed to effectively prioritize interventions within the agricultural sector. While the critical actions to boost productivity are well known, including increasing the use of mechanization and modern inputs, numerous interventions since independence have failed to achieve large scale transformative results. A detailed study is needed to understand farmer incentives and constraints, as well as weak points in institutions and along value chains. The study should investigate anecdotal evidence of elite capture of productive resources and explore the degree to which vulnerable populations are excluded from traditional systems. In addition, a careful review of the conditions in which there was successful uptake of modern practices by small holders, or in which farmers were able to produce and sell surplus crop, are needed to identify effective areas for scale up and to determine the degree to which the poor will be able to benefit from proposed interventions. Also, the expected impact of climate change on agriculture is largely unknown, either in terms of overall magnitude or in variation across crops and climate zones. Finally, the role of producer prices needs to be explored in depth. Reinstating rice import tariffs has the potential to both generate substantial government revenue and promote long term growth in a sector in which Sierra Leone has a comparative advantage. At the same time, there are short and medium term poverty impacts on urban populations and rural net consumers. Therefore, the issue should be carefully studied and a mitigation strategy developed prior to any changes.
244. There is limited evidence of the specific reasons for functional failures in service delivery, particularly in the health sector. Anecdotal evidence and some preliminary field research efforts point to leakages, misuse of funds, and elite capture at various points of the delivery chains, accounting for a range of failures, including medicines not reaching health posts, and citizens paying extensive out-of-pocket expenses for health services with poor outcomes. Detailed knowledge of the weak points along delivery

93
chains, relevant incentives, institutional capabilities, and possible entry points for increased accountability is critical to designing effective support that can functionally improve outcomes.

94
ANNEX 1: RECENT WORLD BANK GROUP REPORTS AND PAPERS ON SIERRA LEONE
Boakye, Daniel, Sebastien Dessus, Yusuf Foday, and Felix Oppong. 2012. “Investing Mineral Wealth in Development Assets: Ghana, Liberia and Sierra Leone.” Policy Research Working Paper 6089, World Bank, Washington, DC. http://elibrary.worldbank.org/doi/book/10.1596/1813-9450-6089.
Cortez, Rafael, Adam Leive, Armin Fidler, Nicole Klingen, Patrick Eozenou, Aaka Pande, Marc Smitz, and Ece Ozcelik. 2013a. “Sierra Leone - Macro-Fiscal Context and Health Financing Factsheet.” World Bank. http://documents.worldbank.org/curated/en/2013/01/18127939/sierra-leone-macro-fiscal-context-health-financing-factsheet.
Cortez, Rafael, Aaka Pande, Patrick Eozenou, Adam Leive, Marc Smitz, Ece Ozcelik, Armin Fidler, and Nicole Klingen. 2013b. “Sweden - Macro-Fiscal Context and Health Financing Factsheet.” World Bank. http://documents.worldbank.org/curated/en/2013/01/18120448/sweden-macro-fiscal-context-health-financing-factsheet.
Fanthorpe, Richard, and Christopher Gabelle. 2013. Political Economy of Extractives Governance in Sierra Leone. Washington, DC: World Bank. http://hdl.handle.net/10986/16726.
Hatløy, Anne, Tewodros Kebede, Huafeng Zhang, and Ingunn Bjørkhaug. 2012. Perceptions of Good Jobs: Analytical Report—Port Loko and Freetown, Sierra Leone. Washington, DC: World Bank. http://hdl.handle.net/10986/12128.
IFC (International Finance Corporation). 2011. Rebuilding Business and Investment in Post-Conflict Investment in Post-Conflict Sierra Leone. World Bank. http://www.ifc.org/wps/wcm/connect/619dcd80484a917e9a65be5f4fc3f18b/SierraLeone_RabiReportFinal.pdf?MOD=AJPERES.
Laure, Alexandre H., Richard Fanthorpe, and Christopher C. Gabelle. 2014. Growth Poles Program: Political Economy of Social Capital. World Bank. http://documents.worldbank.org/curated/en/2014/04/19658037/growth-poles-program-political-economy-social-capital.
Martin, Andrea, and Nina Rosas. 2014a. Improving Program Efficiency and Reducing Leakages through Community Involvement and E-Solutions in Sierra Leone. World Bank.
———. 2014b. Using Smartphones to Improve Delivery of Safety Nets Programs in Sierra Leone. World Bank.
Molinas Vega, Jose R., Richardo Paes de Barros, Jaime Chanduvi Saavedra, Marcelo Giugale, Louise J. Cord, Carola Pessino, and Amer Hasan. 2012. Do Our Children Have a Chance? A Human Opportunity Report for Latin America and the Caribbean. Washington, DC: World Bank. http://hdl.handle.net/10986/2374.
Ovadiya, Mirey, and Giuseppe Zampaglione. 2009. Escaping Stigma and Neglect: People with Disabilities in Sierra Leone. Washington, DC: World Bank. http://hdl.handle.net/10986/5950.
Pifferetti, Nadia. 2014. Fragility Risk Resilience Rapid Assessment for the EVD Countries, Preliminary Draft. Washington, DC: World Bank.

95
Pushak, Nataliya, and Vivien Foster. 2011. “Sierra Leone’s Infrastructure: A Continental Perspective.” Policy Research Working Paper 5713, World Bank, Washington, DC. http://elibrary.worldbank.org/doi/book/10.1596/1813-9450-5713.
Rebosio, Michelle, Ekaterina Romanova, Danielle Christophe, and Crystal Corman. 2013. Understanding Youth Violence: Cases from Liberia and Sierra Leone. Washington, DC: World Bank. http://documents.worldbank.org/curated/en/2013/06/19330631/understanding-youth-violence-cases-liberia-sierra-leone.
Thompson, Darrell, Meike van Ginneken, and Anthony Bennett. 2011. Sierra Leone - Public Expenditure Review for Water and Sanitation 2002 to 2009. Washington, DC: World Bank. http://documents.worldbank.org/curated/en/2011/07/15978024/sierra-leone-public-expenditure-review-water-sanitation-2002-2009.
Weedon, Emily, and Serdar Yilmaz. 2014. Decentralization, Accountability and Local Services in Sierra Leone: Situation Analysis, Key Challenges and Opportunities for Reform. Washington, DC: World Bank. http://documents.worldbank.org/curated/en/2014/04/19337504/decentralization-accountability-local-services-sierra-leone-situation-analysis-key-challenges-opportunities-reform.
World Bank. 2010a. Sierra Leone - Public Expenditure and Financial Accountability (PEFA): Performance Assessment Report 2010: Sub-National Governments (Local Councils). Washington, DC: World Bank. http://documents.worldbank.org/curated/en/2010/12/16344283/sierra-leone-public-expenditure-financial-accountability-pefa-performance-assessment-report-2010-sub-national-governments-local-councils.
———. 2010b. Sierra Leone - Public Expenditure Review. Washington, DC: World Bank. http://documents.worldbank.org/curated/en/2010/10/13159456/sierra-leone-public-expenditure-review.
———. 2010c. The Republic of Sierra Leone: Public Financial Management Performance Assessment Report. http://hdl.handle.net/10986/13061.
———. 2010d. West Africa Mineral Sector Strategic Assessment (WAMSSA): As Environmental and Social Strategic Assessment for the Development of the Mineral Sector in the Mano River Union. Washington, DC: World Bank. http://documents.worldbank.org/curated/en/2010/03/12739741/west-africa-mineral-sector-strategic-assessment-wamssa-environmental-social-strategic-assessment-development-mineral-sector-mano-river-union.
———. 2011a. Sierra Leone - Nutrition at a Glance. Washington, DC: World Bank. http://documents.worldbank.org/curated/en/2011/04/17695152/sierra-leone-nutrition-glance.
———. 2011b. Sierra Leone - Reproductive Health at a Glance. Washington, DC: World Bank. http://documents.worldbank.org/curated/en/2011/04/14667558/sierra-leone-reproductive-health-glance.
———. 2011c. Water Supply and Sanitation in Sierra Leone: Turning Finance into Services for 2015 and Beyond. Washington, DC: World Bank. http://documents.worldbank.org/curated/en/2011/01/19123431/water-supply-sanitation-sierra-leone-turning-finance-services-2015-beyond.

96
———. 2012a. Africa Program for Fisheries. Washington, DC: World Bank. http://documents.worldbank.org/curated/en/2012/01/17917266/africa-program-fisheries.
———. 2012b. Health Equity and Financial Protection Datasheet: Sierra Leone. Washington, DC: World Bank. http://documents.worldbank.org/curated/en/2012/08/17570436/health-equity-financial-protection-datasheet-sierra-leone.
———. 2012c. Republic of Sierra Leone: Assessment of National Public Procurement System Based on OECD/DAC Benchmarking Tool. Washington DC: World Bank. https://openknowledge.worldbank.org/handle/10986/11905.
———. 2013a. “Fiscal Risk Assessment.” Sierra Leone Diagnostic and Policy Notes. Washington, DC: World Bank.
———. 2013b. Management and Functional Review - Update. Washington, DC: World Bank.
———. 2013c. “Public Investment Management.” Sierra Leone Diagnostic and Policy Note. Washington, DC: World Bank.
———. 2013d. “Republic of Sierra Leone Higher and Tertiary Education Sector Policy Note.” Washington DC: World Bank. http://hdl.handle.net/10986/16787.
———. 2013e. Sierra Leone Gender Portfolio Review.
———. 2013f. Sierra Leone - Social Protection Assessment. Washington, DC: World Bank. http://documents.worldbank.org/curated/en/2013/06/18523529/sierra-leone-social-protection-assessment.
———. 2013g. Trading towards Prosperity: Sierra Leone Diagnostic Trade Integration Study Update.
———. 2014a. Digital Identity Toolkit: A Guide for Stakeholders in Africa. http://www.planetbiometrics.com/creo_files/upload/article-files/digital_id_toolkit_for_africa_2014_(english_final).pdf.
———. 2014b. Fisheries Governance Diagnostic Study: Sierra Leone. Washington, DC: World Bank.
———. 2014c. Republic of Sierra Leone Beyond Broadband Access: Opportunities in Innovation and Content Development Using ICT for Improving Basic Services. Washington, DC: World Bank.
———. 2014d. Sierra Leone Agriculture Sector Review.
———. 2014e. Sierra Leone Poverty Assessment.
———. 2014f. “World Bank Group Assistance to Low-Income Fragile and Conflict-Affected States.” Independent Evaluation Group. Accessed October 2, 2014. http://ieg.worldbankgroup.org/evaluations/fcs.
———. 2014g. “The economic impact of the 2014 Ebola epidemic: short and medium term estimates for West Africa.” Washington, DC: World Bank Group. http://documents.worldbank.org/curated/en/524521468141287875/The-economic-impact-of-the-2014-Ebola-epidemic-short-and-medium-term-estimates-for-West-Africa

97
———. 2015. Sierra Leone Basic Agricultural Public Expenditure Diagnostic Review (2003–12).
———. n.d. Integrated Transport Policy, Strategy and Investment Plan. http://rmfa.sl/linked/integrated%20transport%20policy,%20strategy%20and%20investment%20plan.pdf.
Zhou, Yongmei. 2009. Decentralization, Democracy, and Development: Recent Experience from Sierra Leone. Washington, DC: World Bank. http://hdl.handle.net/10986/2672.
98
ANNEX 2: RECENT REPORTS AND ACADEMIC PAPERS FROM OUTSIDE THE WORLD BANK GROUP
Acemoglu, Daron, Tristan Reed, and James Robinson. 2013. Chiefs: Elite Control of Civil Society and Economic Development in Sierra Leone. Cambridge, MA: National Bureau of Economic Research. http://www.nber.org/papers/w18691.pdf.
Acemoglu, Daron, and James Robinson. 2012. Why Nations Fail: The Origins of Power, Prosperity and Poverty. New York: Crown Business.
Acemoglu, Daron, Isaias N. Chaves, Philip Osafo-Kwakiutl and James Robinson. 2014. Indirect Rule and State Weakness in Africa: Sierra Leone in Comparative Perspective. Cambridge: NBER.
Adam Smith International. 2013. Local Content Assessment Report.
African Development Bank. 2014. Grain Fish Money: Financing Africa’s Green and Blue Revolutions. The African Development Bank.
Bamber, Penny, Ajmal Abdulsamad, and Gary Gereffi. 2014. “Burundi in the Agribusiness Global Value Chain.” http://cggc.duke.edu/pdfs/2014_02_28_Duke_CGGC_BurundiAgribusinessGVC.pdf
Hoffman. 2013. Political Economy of Rice in Sierra Leone, http://www.aaae2016.org/resources/AAAE%20Rice%20in%20Sierra%20Leone.pdf
Barrie, Ousman, Joanna Esteves Mills, Abdul Nashiru, Apollos Nwafur, and Richard Watts. n.d. Financing of the Water, Sanitation and Hygiene Sector in Sierra Leone. Water Aid. http://www.wateraid.org/uk/~/media/Files/UK/Keeping-Promises-case-studies/Sierra-Leone-the-financing-of-the-water-sanitation-and-hygiene-sector.pdf?la=en-GB
Bates, Robert H. 1981. Markets and States in Tropical Africa. Berkeley: University of California Press.
Baxter, Joan. 2013. Who Is Benefitting? The Social and Economic Impact of Three Large-Scale Land Investments in Sierra Leone: A Cost-Benefit Analysis. Christian Aid.
Bellows, John, and Edward Miguel. 2009. “War and Local Collective Action in Sierra Leone.” Journal of Public Economics 93, no. 11–12 (December): 1144–57. doi:10.1016/j.jpubeco.2009.07.012.
Bertone, Maria Paola, and Sophie Witter. 2013. The Development of HRH Policy in Sierra Leone, 2002–2012 - Report on Key Informant Interviews. ReBuild Consortium 2013.
Binns, Paul, Ernest Guevarra, Mohamed Jalloh, and Melrose Tucker. 2014. “Blockages to Preventing Malnutrition in Kambia, Sierra Leone: A Semi-Quantitative Causal Analysis.” Working Paper. Secure Livelihoods Research Consortium, Overseas Development Institute 2014.
Bjälkander, Owolabi, Laurel Bangura, Bailah Leigh, Vanja Berggren, Staffan Bergström, and Lars Almroth. 2012. “Health complications of female genital mutilation in Sierra Leone.” International Journal of Women’s Health 4(1): 321-331.
Casey, Katherine. 2015. Crossing Party Lines: The Effects of Information on Redistributive Politics. American Economic Review, 105(8): 2410-2448

99
Christian Aid. 2014. “Losing Out: Sierra Leone’s Massive Revenue Losses from Tax Incentives.” Accessed October 2, 2014. http://www.eurodad.org/Entries/view/1546196/2014/04/24/Losing-Out-Sierra-Leone-s-massive-revenue-losses-from-tax-incentives.
Conteh, Felix Marco. 2016: The Promise and Reality of Decentralization: a critical appraisal of Sierra Leone's Primary Health Care System. Critical African Studies.
Conteh, Felix Marco. 2017. Politics, development and the instrumentalisation if (de) centralization in Sierra Leone.
Cox, Gary W., Douglass C. North, and Barry Weingast. 2015. The Violence Trap: A Political-Economic Approach of the Problems of Development. Working Paper, Hoover Institution, Stanford University, Stanford, CA.
De Vries, Jaco. 2013. Sierra Leone Resource Port Siting Study. Pretoria: Aurecon.
Duvvury, Nata, Aoife Callan, Patrick Carney, and Srinivas Raghavendra. 2013. “Intimate partner violence: Economic costs and implications for growth and development." Women’s Voice, Agency, & Participation Research 3.
DFID (U.K. Department for International Development). 2014. Planning and Costing for the Acceleration of Actions for Nutrition: Experiences of Countries in the Movement for Scaling Up Nutrition. DFID 2014.
Economist Intelligence Unit. 2013. Report on Sierra Leone. London: Economist Intelligence Unit.
———. 2014. Country Risk Service. London: Economist Intelligence Unit.
______Sierra Leone Climate Action Report For 2015: https://www.irishaid.ie/media/irishaidpublications/SLE-Country-Climate-Action-Reports-Sierra-Leone-2015.pdf
Fabricant, Stephen J., Clifford W. Kamara, and Anne Mills. 1999. “Why the poor pay more: household curative expenditures in rural Sierra Leone.” International Journal of Health Planning and Management. 14(3): 179-199.
Fanthorpe, Richard. 2005. On the Limits of the Liberal Peace: Chiefs and Democratic Decentralization in Post-War Sierra Leone. African Affairs 105:1-23.
Fanthorpe, Richard, Andrew Lavali, and Mohamed Gibril Sesay. 2011. Decentralization in Sierra Leone. DFID. http://r4d.dfid.gov.uk/PDF/Outputs/Mis_SPC/DecentralizationResearchReportFINAL.pdf.
Fofana, Goundan, Domgho. 2014. “Impact Simulation of ECOWAS Rice Self-Sufficiency Policy”. IFPRI Discussion Paper 01405. http://ebrary.ifpri.org/cdm/ref/collection/p15738coll2/id/128894
Gupta, Geeta Rao. 2013. “Female Genital Mutilation/Cutting: A statistical overview and exploration of the dynamics of change.” Reproductive Health Matters. 21(42): 184-190.

100
Harris, Daniel, Michelle Kooy, and Gibrill Jalloh. 2012. “The Political Economy of the Urban Water-Pricing Regime in Freetown, Sierra Leone.” Working Paper 348, Overseas Development Institute. http://www.odi.org/sites/odi.org.uk/files/odi-assets/publications-opinion-files/7668.pdf.
Insight Technologies (SL) Ltd. 2013. ICT Policy Landscape Survey/Research. Insight Technologies (SL) Ltd.
Lawry, Steven, Cyrus Samii, Ruth Hall, Aaron Leopold, Donna Hornby, and Farai Mtero. 2017. “The impact of land property rights interventions on investment and agricultural productivity in developing countries: a systematic review.” Journal of Development Effectiveness 9(1): 61-81. doi:10.1080/19439342.2016.1160947
McPake, Barbara, Sophie Witter, Tim Ensor, Suzanne Fustukian, David Newlands, Tim Martineau, and Yotamu Chirwa. 2013. “Removing Financial Barriers to Access Reproductive, Maternal and Newborn Health Services: The Challenges and Policy Implications for Human Resources for Health.” Human Resources for Health 11 (1): 46. doi:10.1186/1478-4491-11-46.
Medical Research Centre, Government of Sierra Leone, University of Sierra Leone, Text to Change, Royal Tropical Institute, and Mannion Daniels. 2011. Technical Brief: mHealth for Maternal and Newborn Health in Resource-Poor and Health System Settings. Sierra Leone. http://r4d.dfid.gov.uk/PDF/Outputs/Misc_MaternalHealth/technicalbrief-mhealth-SierraLeone.pdf.
Moore Stephens LLP. 2013. Sierra Leone Extractive Industries Transparency Initiative: Reconciliation Report for the Year 2011. Moore Stephens LLP. http://eiti.org/files/SLEITI%20Reconciliation%20Report%202011%20-%20Final.pdf.
NACE (National Advocacy Coalition on Extractives). 2009. Sierra Leone at the Crossroads: Seizing the Chance to Benefit from Mining. National Advocacy Coalition On Extractives (NACE).
Njoro, Joyce, Nyahabeh Anthony, Iris de Hoogh, Jessica Fanzo, Nawal Chahid, Fornah Daniel, Matthew L. S. Gboku, et al. 2013. An Analysis of the Food System Landscape and Agricultural Value Chains for Nutrition: A Case Study from Sierra Leone. http://www.fao.org/3/a-as566e.pdf.
Peligal, Rona, and Human Rights Watch (Organization). 2014. Whose Development? Human Rights Abuses in Sierra Leone’s Mining Boom. New York, NY: Human Rights Watch. http://www.hrw.org/sites/default/files/reports/sierraleone0214_ForUpload.pdf.
Robinson, James. 2008. Governance and Political Economy Constraints to World Bank CAS Priorities in Sierra Leone.
Spencer, Fornah and Wilson. 2014, Value Chain Analysis in the Rice Sector in Sierra Leone, A Case study from Sierra Leone. http://www.eds-sl.com/docs/ValueChainAnalysisinTheRiceSectorofSierraLeone22.09.14.pdf
Srivastava, Vivek and Marco Larizza. 2012. Working with the Grain for Reforming the Public Service: A live example from Sierra Leone. World Bank Policy Research Working Paper 6152.
Statistics Sierra Leone (SSL), and ICF International. 2014. Sierra Leone Demographic and Health Survey 2013. Freetown, Sierra Leone and Rockville, Maryland, USA: Statistics Sierra Leone (SSL) and ICF International. http://dhsprogram.com/pubs/pdf/FR297/FR297.pdf.

101
Transparency International. 2014. “Global Corruption Barometer 2013.” Issuu. Accessed October 2, 2014. http://issuu.com/transparencyinternational/docs/2013_globalcorruptionbarometer_en.
UNICEF (United Nations Children’s Fund). 2014a. Evaluation of the WASH Sector Strategy "Community Approaches to Total Sanitation” (CATS). http://www.unicef.org/evaluation/files/Evaluation_of_the_WASH_Sector_Strategy_FINAL_VERSION_March_2014.pdf.
———. 2014b. “Statistics.” UNICEF. Accessed October 2, 2014. http://www.unicef.org/infobycountry/sierraleone_statistics.html.
Wangel, Marcus, and Hans Blomkvist. 2013. “Rural Forest Management in Sierra Leone: The Role of Economic (In)Equality in Facilitating Collective Action.” Journal of Development Studies 49 (11): 1564–78. doi:10.1080/00220388.2013.800860.
Williamson, John, and Lynne Cripe. 2012. Assessment of DCOF-Supported Child Demobilization and Reintegration Activities in Sierra Leone. Washington, DC: USAID. http://pdf.usaid.gov/pdf_docs/pnacq873.pdf.
WHO (World Health Organization). 2012. WHO | Sierra Leone Service Availability and Readiness Assessment (SARA). WHO. http://apps.who.int/healthinfo/systems/datacatalog/index.php/ddibrowser/27/download/103.
———. 2013. WHO | World Malaria Report 2013. WHO. Accessed October 2, 2014. http://www.who.int/malaria/publications/world_malaria_report_2013/report/en/.
———. 2017. WHO | Health risks of female genital mutilation (FGM). Accessed April 10, 2017. http://www.who.int/reproductivehealth/topics/fgm/health_consequences_fgm/en/.
Wurie, Haja R., and Sophie Witter. 2014. In Depth Interviews of Health Workers in Sierra Leone Report. ReBuild Consortium.

102
ANNEX 3: GOVERNMENT DOCUMENTS
Auditor General of Sierra Leone. 2011. Report on the Public Accounts of Sierra Leone.
———. 2012. Report on the Public Accounts of Sierra Leone.
———. 2013. Report on the Public Accounts of Sierra Leone.
ASSL (Audit Service Sierra Leone). 2007–10, 2012. Audit Report on Embassies.
———. 2013. Audit Report on Allocation of State Land.
———. 2014a. Audit Report on Rehabilitation and Maintenance of Rural Feeder Roads and the Sierra Leone Roads Authority.
———. 2014b. Audit Report on Management of Municipal Solid Waste.
———. 2015. Audit Report on Management of Ebola Funds. Freetown: ASSL
Bank of Sierra Leone. 2009. The Financial Sector Development Plan. Bank of Sierra Leone.
———. 2013. Annual Report.
Government of Sierra Leone. 2012. The Agenda for Prosperity: Road to Middle Income Status. Government of Sierra Leone.
———. 2013. Sierra Leone Growth Poles Program: A Development Approach for Agenda for Prosperity. Government of Sierra Leone, Office of the President.
———. 2014a. Civil Registration and Identity Management in Sierra Leone. Government of Sierra Leone, Ministry of Health and Sanitation.
———. 2014b. National Policy on Civil Registration Reform in Sierra Leone. Government of Sierra Leone.
Government of Sierra Leone, Global Environment Facility, and United Nations Development Fund. 2012. Second National Communication on Climate Change. Accessed June 21, 2017. http://unfccc.int/resource/docs/natc/slenc2.pdf.
MAFFS (Ministry of Agriculture, Forestry and Food Security). 2009. National Sustainable Agriculture Development Plan 2010–2030: Sierra Leone’s Comprehensive African Agriculture Development Programme. Government of Sierra Leone.
Rokel Commercial Bank Ltd. 2013. Financial Statements.
Sierra Leone Commercial Bank Ltd. 2013. Financial Statements.

103
ANNEX 4: POVERTY HEADCOUNT AND DISTRIBUTION OF THE POOR, 2011
Poverty
Headcount* (%) Share of
Population (%) Number of Poor (%) Number of Poor
National 53.8 100.0 100.0 3,339,157 Rural 66.3 63.6 78.4 2,618,043 Urban 31.9 36.4 21.6 721,114
Freetown 20.7 15.1 5.8 194,706
Other Urban 39.9 21.3 15.8 526,408 District
Kailahun 60.9 7.4 8.3 278,164
Kenema 61.6 9.1 10.4 348,768 Kono 61.3 7.0 8.0 266,949 Bombali 57.9 8.5 9.1 303,783
Kambia 53.9 5.1 5.1 169,689
Koinadugu 54.3 5.6 5.7 189,598
Port Loko 59.9 8.9 9.9 329,774
Tonkolili 76.4 7.3 10.4 347,395
Bo 50.7 8.6 8.1 269,237
Bonthe 51.4 2.8 2.7 90,502
Moyamba 70.8 4.8 6.3 209,447
Pujehun 54.1 4.8 4.8 160,846
Western Rural 57.1 5.1 5.4 180,298
Western Urban 20.7 15.1 5.8 194,706 Gender of Household Head
Male 54.9 73.9 75.5 2,519,772
Female 50.6 26.1 24.5 819,385 Education of Household Head
No education 61.7 68.4 78.5 2,620,781
Primary 48.6 8.1 7.3 244,605
Junior 37.9 8.0 5.7 189,265
Secondary 30.3 7.7 4.4 145,459
Post-secondary 29.1 7.6 4.1 138,223 Source: Authors’ calculations based on the SLIHS (2011). * Note: These numbers differ slightly from those presented in the report for the 2011 Sierra Leone Integrated Household Survey. The difference is due to a re-weighting applied based on the number from the 2015 Population Census. There is little difference in the headcount percentages but the number of poor statistics are more accurate with the updated weights.

104
Agricultural Self-
Employment
Nonagricultural Self-
Employment
Wage Employment
Unpaid Labora
Agriculture, Fishing, and
Forestry
Mining and Extractive Industries
Manufacturing and Utilities
Construction
Services
Ove
rall
59.2
31
.3
9.5
6.5
61.1
1.
5 2.
8 1.
2 33
.4
You
th (A
frica
) 58
.8
31.9
9.
3 7.
5 61
.1
1.2
3.1
1.3
33.2
M
en
59.7
24
.8
15.5
6.
6 62
.2
3.0
5.6
2.7
26.6
W
omen
58
.7
36.8
4.
5 6.
4 60
.1
0.2
0.5
0.1
39.2
D
isab
led
61.9
30
.7
7.5
6.6
62.5
0.
1 4.
6 0.
6 32
.2
Not
Dis
able
d 59
.1
31.4
9.
6 6.
5 61
.0
1.5
2.8
1.3
33.4
M
igra
nt
27.0
48
.3
24.7
4.
3 28
.8
5.4
3.5
3.3
59.0
N
ot M
igra
nt
64.9
28
.4
6.8
6.9
66.6
0.
8 2.
7 0.
9 29
.0
Nev
er W
ent t
o Sc
hool
69
.8
27.7
2.
5 6.
5 71
.4
1.3
1.7
0.7
24.9
In
com
plet
e Pr
imar
y 52
.4
40.4
7.
2 8.
5 54
.5
1.9
4.5
1.4
37.6
C
ompl
eted
Prim
ary
47.8
41
.5
10.7
9.
3 50
.9
1.3
6.7
2.6
38.5
C
ompl
eted
Low
er
Seco
ndar
y 35
.0
44.8
20
.2
5.5
37.7
1.
8 4.
9 1.
8 53
.8
Com
plet
ed U
pper
Se
cond
ary
21.8
36
.9
41.4
3.
1 23
.5
2.5
4.6
3.6
65.8
Tech
Deg
rees
and
C
ertif
icat
es
9.0
17.0
74
.1
1.6
8.8
1.2
2.9
3.2
83.9
Terti
ary
Deg
ree
0.0
10.3
89
.7
0.0
1.3
1.7
0.3
2.3
94.3
U
rban
Fre
etow
n 0.
5 59
.0
40.5
2.
6 0.
6 0.
1 6.
5 6.
1 86
.6
Oth
er U
rban
21
.3
56.8
21
.8
5.1
24.0
4.
1 4.
3 2.
1 65
.6
Rur
al
72.9
23
.5
3.6
7.1
74.4
1.
1 2.
2 0.
5 21
.7
East
ern
71.8
22
.5
5.6
3.3
72.5
3.
1 1.
9 1.
1 21
.4
Nor
ther
n 66
.5
28.9
4.
6 6.
1 67
.7
0.3
2.7
0.8
28.5
So
uthe
rn
56.7
32
.9
10.4
11
.8
61.5
2.
4 2.
5 0.
4 33
.1
Wes
tern
Are
a 3.
4 59
.2
37.5
2.
4 3.
6 0.
2 6.
1 5.
7 84
.4

105
Not
e: B
ecau
se o
f mis
sing
info
rmat
ion,
som
e in
divi
dual
s cou
ld n
ot b
e as
sign
ed to
a su
bpop
ulat
ion.
In th
ese
case
s, th
e su
m o
f the
subp
opul
atio
ns is
less
than
the
over
all p
opul
atio
n, a
nd th
e st
atis
tics
on th
ese
subp
opul
atio
ns re
fer t
o in
divi
dual
s who
repo
rt th
e in
form
atio
n; in
divi
dual
s on
who
m d
ata
is m
issi
ng a
re e
xclu
ded
from
the
calc
ulat
ions
. a.
Unp
aid
labo
r is n
ot c
onsi
dere
d em
ploy
men
t in
the
ILO
def
initi
ons;
so, t
he sh
ares
of j
ob ty
pes a
mon
g IL
O-r
ecog
nize
d em
ploy
men
t (ag
ricul
tura
l and
no
nagr
icul
tura
l sel
f-em
ploy
men
t and
wag
e em
ploy
men
t) su
ms
up to
100
per
cent
. The
dat
a on
unp
aid
labo
r rep
rese
nt th
e nu
mbe
r of u
npai
d w
orke
rs a
s a
perc
enta
ge o
f the
tota
l num
ber o
f em
ploy
ed (I
LO) w
orke
rs.

106
Real
sect
or: G
row
th b
y se
ctor
Sour
ce: S
SL a
nd W
orld
Ban
k
2002
2003
2004
2005
2006
2007
2008
2009
2010
2011
2012
2013
2014
2015
2016
1. A
gric
ultu
re, F
ores
try
and
Fish
ing
31.7
9.5
8.8
6.8
6.0
13.3
6.7
4.0
3.5
4.9
3.8
4.6
0.8
2.0
5.4
1.1
Cro
ps36
.59.
27.
24.
67.
718
.38.
74.
93.
85.
84.
35.
10.
72.
46.
4
1.1
1 R
ice
16.4
14.2
11.1
13.7
4.4
31.3
6.9
5.7
3.7
7.5
4.9
7.3
0.5
5.0
9.0
1
.12
Frui
ts&
Veg
etab
le1.
71.
61.
63.
33.
01.
22.
42.
52.
52.
52.
52.
52.
62.
03.
0
1.1
3 C
assa
va45
.610
.91.
814
.310
.512
.617
.45.
94.
45.
42.
72.
40.
60.
16.
0
1.1
4 G
roun
d N
ut13
8.9
2.2
8.3
-31.
111
.49.
94.
12.
63.
75.
76.
65.
80.
50.
14.
0
1.1
5 M
aze
61.2
0.7
8.4
94.8
24.4
28.5
3.0
6.4
4.8
3.4
4.6
5.2
1.1
0.2
2.0
1
.16
Swee
t Pot
ato
20.1
68.8
59.1
5.0
5.0
14.6
7.4
5.3
6.1
6.0
6.6
4.0
0.6
0.1
2.0
1
.17
Cas
h cr
ops
(coc
oa, c
offe
e, p
alm
oil,k
olan
ut,e
ct)
40.2
21.2
2.8
22.1
13.3
12.0
15.7
3.6
1.7
2.5
4.6
5.1
-0.6
0.9
2.0
1.
2 Li
vest
ock
39.2
7.4
15.1
18.7
3.9
0.0
2.8
2.3
4.7
4.3
4.3
4.5
0.8
1.6
3.0
1.
3 Fo
rest
ry2.
93.
03.
04.
04.
53.
53.
82.
83.
62.
73.
43.
30.
90.
83.
0
1.4
Fish
ery
49.7
18.5
19.1
14.2
1.5
5.4
1.5
1.3
1.9
2.5
1.8
2.6
1.1
1.0
3.0
2. In
dust
ry31
.325
.611
.30.
75.
92.
2-1
0.4
-4.9
12.3
10.2
127.
497
.513
.5-7
4.1
21.6
2
.1 M
inin
g an
d Q
uarr
ying
61.1
54.8
19.2
-3.0
3.7
5.2
-30.
1-1
.215
.71.
829
6.7
134.
116
.8-8
4.0
36.6
2
.11
Dia
mon
d67
.360
.020
.5-5
.1-1
3.7
2.6
-36.
85.
19.
2-1
4.3
32.5
22.6
2.3
2.0
4.0
2
.12
Iron
Ore
0.
00.
00.
00.
00.
00.
00.
00.
00.
00.
05,
471.
417
9.4
19.2
-96.
517
0.0
2
.13
Oth
er m
iner
als
(rut
ile, b
auxi
te,G
old,
etc
)0.
00.
00.
00.
06,
502.
221
.8-2
1.6
-15.
140
.712
.3-1
6.4
12.3
11.5
5.0
8.0
2
.14
Qua
rryi
ng27
.217
.66.
517
.515
.31.
22.
7-1
1.0
19.8
24.8
13.8
10.9
-3.9
1.5
3.0
2
.2 M
anuf
actu
ring
and
Han
dicr
afts
12.8
-1.1
1.1
3.5
16.4
1.1
1.5
-6.8
9.1
15.0
4.0
2.4
-7.1
-5.0
3.0
2
.3 E
lect
ricity
and
Wat
er S
uppl
y10
.80.
6-1
1.9
-29.
2-3
.2-3
7.6
187.
8-8
.82.
73.
95.
6-1
8.6
5.5
2.8
4.2
2.31
Ele
ctric
ity14
.4-3
.0-1
8.8
-35.
1-2
4.1
-27.
733
0.0
-11.
32.
86.
66.
1-2
4.1
6.3
3.0
4.0
2.32
Wat
er1.
411
.25.
4-1
7.8
29.2
-46.
513
.52.
62.
7-6
.73.
27.
33.
02.
05.
0
2.4
Con
stru
ctio
n25
.917
.314
.021
.81.
64.
12.
8-8
.313
.224
.112
.06.
2-7
.62.
04.
43.
Ser
vice
s19
.75.
93.
92.
41.
22.
38.
14.
16.
77.
46.
16.
22.
01.
33.
0
3.
1 T
rade
and
Tou
rism
28
.713
.39.
75.
30.
93.
41.
83.
48.
512
.15.
57.
92.
50.
33.
03.
1.1
Who
lesa
le &
reta
il30
.713
.510
.16.
11.
13.
61.
93.
78.
412
.15.
47.
93.
60.
93.
03.
1.2
Hot
els
and
rest
aura
nts
5.8
9.7
3.9
-7.1
-2.6
-0.4
-0.6
-1.7
11.8
11.5
8.6
6.6
-19.
4-1
5.0
2.0
3.2
Tra
nspo
rt, S
tora
ge a
nd C
omm
unic
atio
n13
.361
.14.
24.
1-2
.112
.324
.38.
84.
05.
35.
84.
8-2
.81.
53.
0
3
.21
Tra
nspo
rt13
.359
.8-5
.69.
30.
32.
223
.98.
33.
55.
96.
84.
6-8
.11.
03.
0
3
.22
Com
mun
icat
ion
13.3
63.4
21.7
-3.1
-5.7
29.1
24.8
9.4
4.6
4.4
4.5
5.0
4.4
2.0
3.0
3.3
Fin
ance
, Ins
uran
ce a
nd R
eal E
stat
e
14.6
7.9
8.0
-1.3
2.3
-6.6
-3.0
5.4
4.1
3.0
4.2
3.2
1.4
0.0
2.2
3.3
1 B
anki
ng25
.618
.616
.8-2
.8-8
.4-1
9.6
-2.1
11.1
5.7
2.1
4.5
2.9
1.6
1.0
2.0
3.3
2 In
sura
nce
-9.1
13.6
45.0
-15.
150
.55.
812
.87.
45.
15.
97.
85.
8-2
.42.
72.
7
3
.33
Rea
l Est
ate
1.7
5.4
-2.0
3.3
3.0
1.2
2.4
2.5
2.5
2.5
2.5
2.5
2.6
-2.0
2.0
3.3
4 O
ther
Fin
anci
al In
stitu
tions
77.3
-14.
5-3
.0-2
.98.
7-6
.0-5
3.3
-9.1
8.1
7.6
7.6
3.0
1.5
5.1
5.1
3.4
Adm
inis
trat
ion
of P
ublic
Ser
vice
s-6
.336
.62.
134
.59.
2-6
.4-1
2.6
3.2
22.4
16.8
15.9
14.0
5.6
3.0
3.0
3.5
Oth
er S
ervi
ces
1.7
1.6
1.6
3.3
3.0
1.2
2.4
2.5
2.5
2.5
2.5
2.5
1.1
-0.6
2.0
3.6
Edu
catio
n87
.3-4
2.7
-13.
8-1
7.3
-9.4
20.2
56.0
-6.1
5.1
6.7
4.2
5.0
2.5
3.0
5.0
3
.7 H
ealth
5.3
-4.4
12.6
-3.9
2.2
1.4
3.3
3.3
4.8
3.2
4.1
2.8
6.7
3.0
4.0
3.8
NPI
SH-0
.20.
2-7
.2-2
1.2
-0.4
-7.3
16.2
11.0
2.6
4.4
5.6
5.3
5.9
3.0
2.0
4. F
ISIM
29.9
28.0
55.7
-1.5
-1.5
3.9
9.4
9.2
6.5
3.0
5.7
2.1
3.3
2.0
5.2
5. T
otal
Val
ue A
dded
at B
asic
Pri
ces
(1+2
+3-4
)26
.49.
36.
64.
54.
28.
15.
43.
25.
36.
315
.721
.44.
8-2
1.7
6.2
6.T
axes
less
Sub
sidi
es o
n Pr
oduc
ts26
.49.
36.
64.
54.
28.
15.
43.
25.
36.
15.
35.
60.
9-5
.03.
07.
Gro
ss D
omes
tic
Pro
duct
at M
ark
et P
rice
s (5
+6)
26.4
9.3
6.6
4.5
4.2
8.1
5.4
3.2
5.3
6.3
15.2
20.7
4.6
-21.
16.
08.
Non
-iro
n or
e G
DP
26
.49.
36.
64.
54.
28.
15.
43.
25.
36.
15.
35.
60.
91.
44.
3

107
Real
sect
or: C
ompo
sitio
n of
GD
P (in
% o
f nom
inal
GD
P)
Sour
ce: S
SL a
nd W
orld
Ban
k
2002
2003
2004
2005
2006
2007
2008
2009
2010
2011
2012
2013
2014
2015
2016
1. A
gric
ultu
re, F
ores
try
and
Fish
ing
46.2
46.3
48.5
49.4
50.3
52.2
53.7
55.3
52.9
54.6
50.6
48.2
52.5
58.7
59.0
1.1
Cro
ps26
.429
.331
.131
.232
.534
.435
.737
.734
.234
.030
.429
.731
.335
.135
.5
1.1
1 R
ice
9.9
10.1
12.0
13.2
12.2
13.3
15.6
17.5
15.7
15.8
13.1
12.4
12.3
14.0
14.5
1
.12
Frui
ts&
Veg
etab
le5.
64.
94.
84.
54.
44.
34.
34.
44.
34.
13.
73.
33.
53.
83.
8
1.1
3 C
assa
va3.
66.
75.
85.
58.
16.
25.
15.
65.
35.
24.
96.
27.
98.
99.
0
1.1
4 G
roun
d N
ut5.
25.
36.
04.
84.
66.
86.
66.
04.
94.
84.
53.
83.
94.
24.
2
1.1
5 M
aze
0.8
0.7
0.7
1.2
1.3
1.5
1.4
1.5
1.5
1.5
1.6
1.4
1.4
1.5
1.4
1
.16
Swee
t Pot
ato
0.2
0.5
0.7
0.7
0.6
0.6
0.5
0.5
0.4
0.4
0.7
1.0
1.0
1.1
1.2
1
.17
Cas
h cr
ops
(coc
oa, c
offe
e, p
alm
oil,k
olan
ut,e
ct)
1.1
1.2
1.2
1.2
1.3
1.8
2.1
2.3
2.2
2.0
1.8
1.5
1.3
1.4
1.4
1.
2 Li
vest
ock
2.8
2.7
2.5
2.8
2.5
2.5
2.5
2.5
2.9
2.9
2.8
2.4
2.3
2.6
2.5
1.
3 Fo
rest
ry9.
57.
56.
96.
46.
56.
67.
07.
46.
97.
67.
66.
97.
48.
17.
9
1.4
Fish
ery
7.5
6.9
7.9
9.0
8.7
8.6
8.4
7.7
9.0
10.1
9.8
9.2
11.5
13.0
13.1
2. In
dust
ry8.
810
.311
.811
.310
.49.
77.
86.
57.
87.
914
.521
.314
.95.
66.
2
2.1
Min
ing
and
Qua
rryi
ng2.
54.
66.
56.
35.
45.
13.
62.
94.
04.
111
.118
.512
.22.
63.
2
2.1
1 D
iam
ond
2.2
4.0
5.6
5.5
4.0
3.6
2.5
2.0
2.7
2.6
2.6
2.4
1.7
1.6
1.7
2
.12
Iron
Ore
0.
00.
00.
00.
00.
00.
00.
00.
00.
00.
26.
814
.99.
60.
20.
6
2.1
3 O
ther
min
eral
s (r
utile
, bau
xite
,Gol
d, e
tc)
0.0
0.0
0.0
0.0
0.8
0.9
0.7
0.6
0.9
0.9
1.2
0.9
0.7
0.6
0.6
2
.14
Qua
rryi
ng0.
30.
60.
80.
80.
60.
50.
40.
30.
40.
40.
40.
40.
30.
20.
2
2.2
Man
ufac
turin
g an
d H
andi
craf
ts3.
22.
82.
62.
52.
62.
52.
42.
12.
22.
32.
01.
61.
61.
71.
8
2.3
Ele
ctric
ity a
nd W
ater
Sup
ply
0.6
0.7
0.5
0.4
0.4
0.3
0.2
0.2
0.2
0.2
0.2
0.2
0.2
0.2
0.2
2.31
Ele
ctric
ity0.
40.
50.
20.
10.
20.
20.
10.
10.
10.
10.
10.
10.
10.
10.
1
2.
32 W
ater
0.3
0.3
0.3
0.3
0.2
0.2
0.1
0.1
0.1
0.1
0.1
0.1
0.1
0.1
0.1
2
.4 C
onst
ruct
ion
2.4
2.2
2.2
2.1
1.9
1.8
1.6
1.3
1.4
1.2
1.2
1.0
0.9
1.0
1.0
3. S
ervi
ces
40.2
38.8
36.0
36.2
35.6
34.7
35.1
34.6
35.3
35.3
32.6
28.2
29.8
32.3
31.5
3.1
Tra
de a
nd T
ouris
m
9.4
9.3
9.3
9.3
8.7
8.7
8.8
8.9
9.2
9.8
9.1
8.1
8.2
8.8
8.5
3.1.
1 W
hole
sale
& re
tail
8.7
8.6
8.7
8.8
8.3
8.3
8.4
8.5
8.8
9.4
8.7
7.8
7.8
8.4
8.2
3.1.
2 H
otel
s an
d re
stau
rant
s0.
70.
70.
60.
50.
50.
40.
40.
30.
40.
40.
40.
30.
40.
30.
3
3
.2 T
rans
port
, Sto
rage
and
Com
mun
icat
ion
6.0
6.7
6.7
6.3
6.2
6.1
6.3
6.4
5.7
5.4
4.4
3.8
3.8
4.1
4.0
3.2
1 T
rans
port
3.9
4.3
3.9
3.8
3.9
3.4
3.6
3.6
3.2
3.0
2.5
2.2
2.1
2.2
2.1
3.2
2 C
omm
unic
atio
n2.
12.
42.
82.
42.
32.
62.
72.
82.
52.
31.
91.
61.
81.
91.
9
3.
3 F
inan
ce, I
nsur
ance
and
Rea
l Est
ate
6.
35.
96.
05.
65.
65.
14.
84.
64.
74.
64.
13.
64.
14.
54.
4
3
.31
Ban
king
2.3
2.4
2.6
2.3
2.0
1.6
1.5
1.7
1.7
1.6
1.5
1.3
1.4
1.6
1.6
3.3
2 In
sura
nce
0.1
0.1
0.2
0.2
0.6
0.7
0.7
0.4
0.4
0.4
0.4
0.3
0.6
0.7
0.7
3.3
3 R
eal E
stat
e3.
12.
72.
62.
52.
42.
42.
42.
42.
42.
32.
11.
81.
92.
02.
0
3
.34
Oth
er F
inan
cial
Inst
itutio
ns0.
80.
60.
60.
50.
50.
50.
20.
20.
20.
20.
20.
20.
20.
20.
2
3
.4 A
dmin
istr
atio
n of
Pub
lic S
ervi
ces
3.0
3.6
3.5
4.3
4.4
4.0
3.5
3.5
4.1
4.6
4.7
4.2
4.9
5.5
5.4
3.5
Oth
er S
ervi
ces
5.2
4.7
4.5
4.4
4.1
4.0
4.1
4.1
4.0
3.9
3.5
3.1
3.2
3.4
3.3
3.6
Edu
catio
n4.
33.
02.
62.
22.
02.
12.
92.
52.
32.
32.
11.
81.
82.
01.
9
3.7
Hea
lth3.
73.
71.
73.
23.
13.
63.
43.
34.
33.
73.
32.
72.
73.
02.
9 3
.8 N
PISH
2.1
1.9
1.7
1.0
1.4
1.1
1.3
1.4
1.0
1.1
1.3
0.9
0.9
1.0
1.0
4. F
ISIM
-0.9
-1.0
-1.5
-1.4
-1.3
-1.3
-1.4
-1.5
-1.5
-1.5
-1.4
-1.2
-1.3
-1.4
-1.4
5. T
otal
Val
ue A
dded
at B
asic
Pri
ces
(1+2
+3-4
)94
.394
.594
.795
.595
.095
.395
.294
.994
.596
.396
.396
.595
.995
.295
.36.
Tax
es le
ss S
ubsi
dies
on
Prod
ucts
5.7
5.5
5.3
4.5
5.0
4.7
4.8
5.1
5.5
3.7
3.7
3.5
4.1
4.8
4.7
7. G
ross
Dom
esti
c P
rodu
ct a
t Mar
ket
Pri
ces
(5+6
)10
0.0
100.
010
0.0
100.
010
0.0
100.
010
0.0
100.
010
0.0
100.
010
0.0
100.
010
0.0
100.
010
0.0
8. N
on-i
ron
ore
GD
P
100.
010
0.0
100.
010
0.0
100.
010
0.0
100.
010
0.0
100.
099
.893
.285
.190
.499
.899
.4

108
Real
sect
or: C
ompo
sitio
n of
the
Dem
and
(in %
of n
omin
al G
DP)
Sour
ce: S
SL a
nd W
orld
Ban
k
2002
2003
2004
2005
2006
2007
2008
2009
2010
2011
2012
2013
2014
2015
2016
Fina
l con
sum
ptio
n10
9.6
106.
810
2.3
100.
498
.099
.610
2.6
104.
486
.610
6.3
99.6
99.2
101.
412
5.4
110.
6Pr
ivat
e95
.795
.092
.090
.587
.990
.993
.093
.976
.296
.289
.490
.591
.011
3.798
.8Go
vern
ment
13.9
11.8
10.4
9.910
.18.6
9.710
.510
.410
.110
.38.7
10.4
11.7
11.8
I
ndiv
idua
l5.0
3.83.6
3.02.9
2.82.6
2.42.2
2.22.1
1.71.8
2.12.3
C
ollec
tive
8.98.0
6.86.9
7.25.9
7.18.1
8.27.8
8.27.0
8.69.6
9.5Ca
pita
l for
mat
ion
11.7
11.2
10.3
11.3
10.1
9.5
9.6
10.0
31.1
41.9
27.9
15.2
11.3
9.9
9.7
Gros
s Fixe
d Ca
pita
l For
matio
n10
.910
.89.9
10.9
9.79.1
9.29.6
30.7
41.5
24.7
14.0
12.3
11.2
10.8
Priv
ate
10.2
9.88.5
9.48.5
8.08.2
8.730
.040
.924
.213
.611
.910
.810
.5Go
vern
ment
0.71.0
1.41.4
1.21.1
1.00.9
0.80.6
0.50.4
0.40.4
0.3Ch
ange
s in
inve
ntor
ies0.8
0.40.4
0.40.4
0.40.4
0.40.4
0.43.1
1.2-1
.0-1
.2-1
.1Ex
port
s of G
oods
and S
ervic
es8.
513
.916
.517
.616
.915
.613
.513
.516
.816
.332
.944
.744
.06.
06.
4Go
ods
5.59.2
12.2
12.8
14.6
13.5
11.1
11.1
14.5
14.0
30.8
42.7
41.8
3.53.9
Serv
ices
3.14.8
4.24.7
2.32.1
2.52.4
2.32.2
2.11.9
2.22.5
2.5Im
port
s of G
oods
and S
ervic
es29
.832
.029
.129
.325
.024
.725
.727
.934
.564
.460
.459
.156
.741
.426
.7Go
ods
23.4
25.2
22.7
23.8
20.5
20.2
20.7
22.9
28.9
49.9
46.4
39.9
35.8
35.8
21.2
Serv
ices
6.46.8
6.45.5
4.64.5
5.05.0
5.614
.514
.019
.120
.95.6
5.5To
tal d
eman
d (ne
t)10
0.0
100.
010
0.0
100.
010
0.0
100.
010
0.0
100.
010
0.0
100.
010
0.0
100.
010
0.0
100.
010
0.0

109
Bala
nce
of p
aym
ents
(in
% o
f nom
inal
GD
P)
Sour
ce: S
ourc
e: B
SL, S
SL, W
BG, a
nd IM
F
2002
2003
2004
2005
2006
2007
2008
2009
2010
2011
2012
2013
2014
2015
2016
Cur
rent
Acc
ount
-1.5
-3.5
-4.3
-5.2
-4.2
-4.2
-8.9
-6.3
-19.
7-4
4.7
-31.
8-1
7.5
-18.
5-1
7.4
-19.
7T
rade
Bal
ance
, Net
-10.
3-1
0.6
-6.2
-9.0
-5.0
-4.4
-7.8
-7.6
-20.
1-4
2.3
-24.
0-0
.6-6
.9-1
8.0
-17.
4Ex
port
of G
oods
(USD
)10
.111
.912
.913
.014
.613
.110
.911
.114
.113
.127
.531
.526
.413
.718
.0Ex
port
of G
oods
| d
iam
onds
(USD
)7.
78.
111
.010
.37.
87.
85.
94.
34.
95.
24.
33.
84.
33.
74.
4Ex
port
of G
oods
| ir
on o
re (U
SD)
0.0
0.0
0.0
0.0
0.0
0.0
0.0
0.0
0.0
0.0
9.4
21.7
15.0
1.8
3.8
Impo
rt o
f Goo
ds (U
SD)
-20.
4-2
2.5
-19.
1-2
1.9
-19.
6-1
7.4
-18.
7-1
8.7
-34.
2-5
5.4
-51.
6-3
2.1
-33.
3-3
1.6
-35.
4Im
port
of G
oods
(USD
) iro
n or
e0.
00.
00.
00.
00.
00.
00.
00.
0-4
.6-1
8.6
-10.
3-5
.1-5
.5-1
.40.
0Im
port
of G
oods
| o
il (U
SD)
-2.9
0.0
-4.1
-4.5
-5.7
-4.9
-6.0
-3.8
-5.0
-7.3
-6.7
-6.8
-6.3
-3.7
-5.0
Ser
vice
s (n
et U
SD
)-3
.4-2
.0-2
.2-0
.8-2
.4-2
.6-2
.5-2
.6-5
.8-9
.6-9
.2-9
.7-2
0.8
-8.0
-8.1
Expo
rt o
f Ser
vice
s3.
14.
84.
34.
72.
32.
12.
42.
12.
35.
44.
84.
64.
24.
15.
4Im
port
of S
ervi
ces
-6.5
-6.8
-6.4
-5.5
-4.6
-4.7
-5.0
-4.7
-8.2
-15.
1-1
4.0
-14.
3-2
5.0
-12.
1-1
3.6
Inco
me
(net
)-1
.2-2
.4-4
.3-3
.8-3
.1-1
.6-3
.0-1
.4-1
.9-1
.2-4
.8-1
1.4
-7.6
-2.6
-3.2
o/w
Gen
eral
gov
ernm
ent
-2.1
-1.6
-1.5
-1.5
-1.3
-0.2
-0.2
-0.2
-0.2
-0.2
-0.2
-0.1
-0.2
-0.2
-0.3
Cur
rent
tran
sfer
s (n
et)
13.4
11.6
8.3
8.3
6.2
4.4
4.4
5.3
8.2
8.4
6.2
4.1
16.8
11.2
9.0
Off
icia
l Cur
rent
Tra
nsfe
rs, N
et5.
54.
35.
45.
24.
02.
73.
13.
46.
33.
82.
51.
014
.28.
25.
6O
ffic
ial g
rant
s (n
et)
5.5
4.3
5.4
5.2
4.0
2.7
3.1
3.4
6.3
3.8
2.5
1.0
14.2
8.2
5.6
Bud
get g
rant
s5.
54.
35.
45.
24.
02.
73.
13.
46.
32.
92.
00.
72.
93.
01.
2O
ther
Aid
(inc
l. Eb
ola)
0.0
0.0
0.0
0.0
0.0
0.0
0.0
0.2
0.2
1.0
0.5
0.3
11.4
5.2
4.3
Oth
er s
ecto
rs (n
et)
7.9
7.3
2.8
3.1
2.2
1.7
1.3
1.9
1.8
4.6
3.7
3.1
2.6
3.0
3.4
0.0
0.0
0.0
0.0
0.0
0.0
0.0
0.0
0.0
0.0
0.0
0.0
0.0
0.0
0.0
Cap
ital
and
Fin
anci
al A
ccou
nt6.
22.
19.
29.
712
.44.
76.
25.
217
.047
.931
.111
.612
.611
.717
.4C
apit
al A
ccou
nt4.
05.
15.
74.
111
.621
.91.
92.
93.
84.
33.
22.
01.
73.
21.
9G
ener
al G
over
nmen
t | p
roje
ct s
uppo
rt1.
71.
21.
11.
12.
21.
11.
62.
22.
73.
32.
31.
81.
22.
31.
8Fi
nanc
ial A
ccou
nt2.
2-3
.13.
65.
60.
8-1
7.2
4.3
2.3
13.3
43.6
27.9
9.6
10.9
8.5
15.5
Dire
ct in
vest
men
t0.
80.
64.
35.
53.
14.
52.
33.
013
.736
.516
.67.
47.
86.
213
.4Po
rtfo
lio in
vest
men
t0.
00.
00.
00.
00.
00.
00.
10.
2-0
.72.
12.
00.
20.
00.
00.
0O
ther
inve
stm
ent (
net)
1.4
-3.7
-0.7
0.1
-2.3
-21.
71.
9-0
.90.
35.
19.
32.
03.
12.
32.
2Li
abili
ties
0.7
-3.7
-1.4
0.2
-1.2
-20.
01.
9-0
.20.
65.
35.
92.
12.
20.
81.
7M
onet
ary
auth
oriti
es0.
00.
00.
40.
60.
20.
00.
05.
20.
00.
00.
00.
00.
00.
00.
0C
omm
erci
al b
anks
0.1
0.0
0.4
0.0
-1.1
-2.1
0.0
-0.9
-0.9
-1.7
0.1
-0.1
1.0
0.5
-0.6
Oth
er s
ecto
rs0.
00.
01.
20.
00.
00.
70.
00.
2-0
.50.
11.
30.
00.
00.
00.
0Sh
ort-
term
liab
ilitie
s0.
00.
00.
00.
00.
00.
00.
00.
00.
00.
00.
00.
00.
00.
00.
0G
ener
al g
over
nmen
t0.
7-3
.7-3
.0-0
.4-1
.5-2
0.7
1.9
2.2
1.6
2.4
3.2
2.1
1.2
1.8
1.6
Dis
burs
emen
ts o
f loa
ns5.
32.
93.
82.
20.
90.
92.
22.
32.
22.
83.
61.
81.
72.
32.
4A
mor
tizat
ion
of lo
ans
-4.6
-6.6
-6.8
-2.6
-2.3
-21.
7-0
.3-0
.4-0
.9-0
.4-0
.4-0
.4-0
.5-0
.5-0
.80.
00.
00.
00.
00.
00.
00.
00.
00.
00.
00.
00.
00.
00.
00.
0O
vera
ll b
alan
ce-2
.1-6
.3-2
.3-1
.95.
81.
4-1
.04.
4-1
.01.
00.
91.
81.
6-4
.3-2
.7C
hang
e in
Res
erve
s, N
et-2
.30.
2-2
.8-2
.0-9
.5-1
.41.
0-4
.41.
0-1
.0-0
.9-1
.0-0
.83.
62.
7C
hang
e in
Res
erve
s, G
ross
-2.7
1.3
-4.1
-2.7
-0.8
-1.4
0.2
-5.2
-0.3
-1.3
-1.0
-1.1
-1.6
-0.6
0.0
Net
use
of F
und
cred
its a
nd lo
ans
0.4
-1.1
1.3
0.7
-8.7
0.0
0.7
0.8
1.3
0.3
0.1
0.1
0.8
2.4
1.8
Purc
hase
s/di
sbur
sem
ents
2.9
1.4
2.9
1.3
0.7
0.0
0.7
0.8
1.4
0.5
0.2
0.3
1.1
3.1
1.8
Rep
urch
ases
/rep
aym
ents
-2.5
-2.5
-1.6
-0.5
-9.4
0.0
0.0
0.0
-0.1
-0.2
-0.1
-0.1
-0.3
-0.7
0.0
Cha
nge
in o
ther
rese
rve
liabi
litie
s0.
00.
00.
00.
00.
00.
00.
00.
00.
00.
00.
00.
00.
00.
00.
0Ex
cept
iona
l Fin
anci
ng2.
42.
62.
21.
91.
80.
00.
00.
00.
00.
00.
00.
00.
00.
70.
0D
ebt f
orgi
vene
ss1.
93.
62.
92.
01.
80.
00.
00.
00.
00.
00.
00.
00.
00.
00.
0O
f whi
ch: D
ebt F
orgi
vene
ss b
y th
e IM
F0.
00.
00.
00.
09.
30.
00.
00.
00.
00.
00.
00.
00.
00.
70.
0Fi
nanc
ing
gap
0.0
0.0
0.0
0.0
0.0
0.0
0.0
0.0
0.0
0.0
0.0
0.0
0.0
0.0
0.0
0.0
0.0
0.0
0.0
0.0
0.0
0.0
0.0
0.0
0.0
0.0
0.0
0.0
0.0
0.0
Erro
rs a
nd O
mis
sion
s0.
00.
00.
00.
00.
00.
00.
00.
00.
00.
00.
00.
80.
80.
0-0
.1G
DP
in U
S$
mil
lion
1,25
0.0
1,38
0.0
1,43
8.8
1,64
9.1
1,88
4.4
2,15
8.8
2,51
1.4
2,45
4.0
2,57
8.2
2,94
2.6
3,80
1.9
4,89
5.9
4,93
5.2
4,26
0.9
3,71
9.7

110
Sele
cted
eco
nom
ic in
dica
tors
Sour
ce: M
OFE
D, B
SL, S
SL, a
nd W
DI
2002
2003
2004
2005
2006
2007
2008
2009
2010
2011
2012
2013
2014
2015
2016 Es
t.N
atio
nal A
ccou
nts
(gro
wth
rat
es, %
)A
gric
ultu
re31
.79.
58.
86.
86.
013
.36.
74.
03.
54.
93.
84.
60.
82.
05.
4In
dust
ry31
.325
.611
.30.
75.
92.
2-1
0.4
-4.9
12.3
10.2
127.
497
.513
.5-7
4.1
21.6
Serv
ices
19.7
5.9
3.9
2.4
1.2
2.3
8.1
4.1
6.7
7.4
6.1
6.2
2.0
1.3
3.0
GD
P at
mar
ket p
rices
26.4
9.3
6.6
4.5
4.2
8.1
5.4
3.2
5.3
6.3
15.2
20.7
4.6
-21.
16.
0R
eal p
er c
apita
GD
P21
.74.
31.
90.
50.
95.
33.
00.
93.
14.
012
.918
.52.
4-2
3.3
3.8
Ann
ual a
vera
ge in
flatio
n (%
)-3
.37.
614
.212
.19.
511
.7-3
5.8
9.3
16.6
16.2
12.9
9.8
8.3
9.0
11.5
Nat
iona
l Acc
ount
s (%
GD
P a
t cur
rent
fact
or c
ost)
Agr
icul
ture
48.2
49.0
49.1
51.2
51.7
53.0
54.7
56.3
58.2
56.0
56.7
52.5
49.9
54.8
61.7
Indu
stry
8.4
9.3
10.9
12.4
11.8
10.9
10.1
8.2
6.9
8.2
8.2
15.1
22.1
15.5
5.8
Serv
ices
43.4
41.7
40.0
36.4
36.5
36.1
35.1
35.4
34.9
35.7
35.1
32.4
28.0
29.7
32.5
Gro
ss d
omes
tic in
vest
men
t10
.210
.910
.89.
910
.99.
79.
19.
29.
630
.741
.524
.714
.012
.311
.2G
ross
dom
estic
sav
ings
-9.6
-6.8
-2.3
-0.4
2.0
0.4
-2.6
-4.4
13.4
-6.3
0.4
0.8
-1.4
-25.
4-1
0.6
Gro
ss n
atio
nal s
avin
gs2.
62.
31.
74.
05.
13.
2-1
.2-0
.619
.61.
01.
8-6
.57.
8-1
6.9
-4.8
Bal
ance
of P
aym
ents
(% G
DP
at c
urre
nt m
ark
et p
rice
s)C
urre
nt a
ccou
nt b
alan
ce (i
nclu
ding
cur
rent
off
icia
l tra
nsfe
rs)
-1.5
-3.5
-4.3
-5.2
-4.2
-4.2
-8.9
-6.3
-19.
7-4
4.7
-31.
8-1
7.5
-18.
5-1
7.4
-19.
7C
urre
nt a
ccou
nt b
alan
ce (e
xclu
ding
cur
rent
off
icia
l tra
nsfe
rs)
-9.1
-12.
7-9
.9-9
.5-9
.7-9
.4-1
2.9
-9.0
-22.
8-4
8.1
-38.
1-2
1.4
-20.
9-1
8.4
-34.
0G
ross
Off
icia
l Res
erve
s in
mon
ths
of im
port
s2.
52.
23.
34.
54.
64.
34.
44.
12.
01.
82.
22.
14.
13.
83.
3D
ebt I
ndic
ator
s (e
nd o
f per
iod)
Tot
al P
ublic
Deb
t to
GD
P15
4.0
150.
114
5.5
129.
410
2.9
42.2
41.8
44.1
45.2
44.0
37.2
32.1
34.5
41.9
54.8
Exte
rnal
Pub
lic D
ebt
118.
011
8.7
119.
010
6.4
83.0
24.5
24.2
28.2
30.4
32.4
25.8
21.3
22.9
29.3
36.8
Dom
estic
Pub
lic D
ebt
36.0
31.4
26.5
23.0
19.9
17.7
17.6
15.9
14.8
11.6
11.4
10.8
11.6
12.6
18.0
Gov
ernm
ent f
inan
ce (%
GD
P a
t cur
rent
mar
ket
pri
ces)
Cur
rent
reve
nues
9.1
8.8
9.1
8.7
8.9
8.3
9.2
9.1
9.9
11.5
12.2
12.6
11.0
10.8
12.2
Cur
rent
exp
endi
ture
s16
.815
.414
.713
.812
.810
.311
.412
.012
.512
.613
.612
.113
.213
.015
.0o/
w w
ages
and
sal
arie
s5.
44.
94.
54.
84.
94.
64.
54.
85.
25.
36.
15.
97.
27.
47.
7C
apita
l exp
endi
ture
s3.
33.
53.
44.
33.
82.
74.
85.
47.
79.
08.
26.
36.
07.
58.
6O
vera
ll fis
cal b
alan
ce e
xclu
ding
gra
nts
(com
mit.
bas
is)
-11.
0-1
0.0
-9.0
-9.4
-7.8
-4.7
-7.0
-8.4
-10.
3-1
0.1
-9.6
-4.9
-8.9
-9.9
-11.
3O
vera
ll fis
cal b
alan
ce in
clud
ing
gran
ts (c
omm
itmen
t bas
is)
-4.9
-4.5
-2.4
-2.0
-1.6
20.0
-3.5
-2.3
-5.0
-4.6
-5.5
-1.9
-4.1
-4.5
-8.2
Exte
rnal
bor
row
ing
(net
)5.
52.
12.
81.
30.
5-2
0.7
1.9
1.9
1.6
2.4
3.4
1.6
1.3
1.6
1.7
Dom
estic
bor
row
ing
(net
)0.
01.
4-1
.50.
20.
21.
72.
10.
63.
52.
12.
20.
32.
63.
06.
5M
onet
ary
indi
cato
rsB
road
mon
ey (M
3) (%
ann
ual g
row
th)
31.2
27.8
18.7
32.7
19.6
27.4
24.8
31.5
29.5
22.2
22.4
17.1
16.8
5.8
17.9
Net
Cla
ims
on C
entr
al G
over
nmen
t (%
ann
ual g
row
th)
63.2
6.2
20.4
-3.2
46.6
55.4
32.7
Cre
dit t
o th
e ec
onom
y (%
ann
ual g
row
th)
24.6
62.3
64.5
45.2
17.8
18.5
39.4
56.8
31.5
21.8
-6.9
11.9
5.4
9.1
16.7
Cre
dit t
o th
e ec
onom
y (in
% o
f GD
P)2.
22.
93.
53.
33.
44.
15.
57.
27.
77.
55.
85.
55.
25.
35.
7V
eloc
ity (G
DP/
M2;
end
of p
erio
d)7.
27.
07.
06.
56.
35.
75.
34.
54.
34.
44.
65.
14.
64.
23.
9M
emo:
GD
P a
t cur
rent
mar
ket
pri
ces
(Le
bill
ion)
2,63
1.3
3,25
4.3
3,91
3.4
4,76
9.8
5,58
46,
444
7,47
18,
308
10,2
5612
,798
16,5
1521
,232
22,3
6421
,627
23,8
69N
on ir
on-o
re G
DP
at c
urre
nt m
ark
et p
rice
s (L
e bi
llio
n)2,
631.
33,
254.
33,
913.
44,
769.
85,
584
6,44
47,
471
8,30
810
,256
12,7
6815
,386
18,0
7420
,216
21,5
8123
,725
GD
P a
t cur
rent
mar
ket
pri
ces
(US
D m
illi
on)
1,25
0.0
1,38
0.0
1,43
8.8
1,64
9.1
1,88
42,
159
2,51
12,
454
2,57
82,
943
3,80
24,
896
4,93
54,
261
3,72
0

111
Gov
ernm
ent f
isca
l tab
le
Sour
ce: M
OFE
D
2000
2001
2002
2003
2004
2005
2006
2007
2008
2009
2010
2011
2012
2013
2014
2015
2016 Es
t.T
otal
rev
enue
and
gra
nts
12.5
14.0
15.2
14.4
15.7
16.1
15.1
33.0
12.7
15.1
15.2
17.0
16.3
15.6
15.8
16.2
15.2
Tot
al R
even
ue7.
49.
69.
18.
89.
18.
78.
98.
39.
29.
19.
911
.512
.212
.611
.010
.812
.2T
ax r
even
ue6.
89.
18.
78.
48.
57.
77.
87.
48.
18.
09.
010
.811
.511
.710
.310
.011
.4Pe
rson
al in
com
e ta
x1.
11.
61.
21.
11.
21.
01.
01.
11.
51.
52.
03.
13.
73.
63.
13.
03.
9C
orpo
rate
inco
me
tax
0.8
0.9
1.1
1.2
1.2
1.3
1.2
0.8
0.8
0.7
0.9
0.6
1.3
1.5
1.3
1.1
1.4
Goo
ds a
nd s
ervi
ces
tax
0.2
0.5
0.4
0.4
0.5
0.5
0.5
0.5
0.6
0.6
2.4
2.8
2.7
2.4
2.3
2.7
2.8
Exci
ses
0.9
1.2
1.2
1.3
1.2
1.0
1.3
0.7
1.1
1.4
1.4
0.4
0.6
1.2
1.1
1.0
0.8
Cus
tom
s an
d ot
her i
mpo
rt d
utie
s3.
74.
84.
64.
44.
23.
63.
53.
93.
83.
61.
92.
21.
51.
51.
41.
51.
6M
inin
g ro
yalti
es a
nd li
cens
es0.
10.
10.
10.
10.
20.
20.
30.
30.
20.
20.
21.
61.
41.
30.
90.
40.
7O
ther
taxe
s
0.0
0.0
0.0
0.0
0.0
0.0
0.0
0.0
0.0
0.0
0.3
0.2
0.1
0.1
0.2
0.2
0.3
Non
-tax
reve
nue
0.6
0.5
0.4
0.4
0.6
1.0
1.1
0.9
1.1
1.1
0.9
0.6
0.7
0.9
0.7
0.8
0.7
Gra
nts
5.2
4.4
6.1
5.5
6.6
7.4
6.2
24.7
3.5
6.0
5.3
5.6
4.1
3.0
4.7
5.4
3.1
Bud
get s
uppo
rt g
rant
s4.
32.
64.
54.
55.
35.
34.
023
.61.
93.
82.
62.
22.
10.
93.
43.
00.
8Pr
ojec
t gra
nts
0.8
1.7
1.6
1.1
1.4
2.1
2.2
1.1
1.6
2.2
2.7
3.4
2.0
2.1
1.4
2.4
2.3
Tot
al e
xpen
ditu
re a
nd le
ndin
g m
inus
rep
aym
ent
16.0
19.1
20.1
18.8
18.1
18.1
16.7
13.0
16.2
17.5
20.2
21.6
21.8
17.5
19.9
20.7
23.5
Cur
rent
exp
endi
ture
12.1
15.8
16.8
15.4
14.7
13.8
12.8
10.3
11.4
12.0
12.5
12.6
13.6
12.1
13.2
13.0
15.0
Wag
es a
nd s
alar
ies
4.3
5.2
5.4
4.9
4.5
4.8
4.9
4.6
4.5
4.8
5.2
5.3
6.1
5.9
7.2
7.4
7.7
Goo
ds a
nd s
ervi
ces
2.8
6.3
5.9
5.9
4.9
4.2
3.7
2.4
3.8
4.2
4.2
3.1
3.0
2.9
3.4
3.2
4.8
Subs
idie
s an
d tr
ansf
ers
0.9
1.0
1.5
1.0
1.2
1.3
1.3
1.5
1.5
1.7
1.6
2.2
2.6
1.7
1.5
1.6
1.7
Inte
rest
pay
men
ts4.
13.
44.
03.
54.
13.
42.
91.
71.
61.
21.
62.
01.
91.
71.
10.
80.
9D
omes
tic2.
52.
01.
92.
02.
72.
01.
61.
51.
51.
11.
41.
81.
61.
50.
90.
60.
6Fo
reig
n1.
61.
32.
01.
61.
41.
41.
30.
20.
20.
20.
20.
20.
20.
20.
20.
20.
3C
apit
al e
xpen
ditu
re3.
33.
33.
33.
53.
44.
33.
82.
74.
85.
47.
79.
08.
26.
36.
07.
58.
6Fo
reig
n fin
ance
d3.
02.
62.
52.
52.
83.
73.
12.
13.
84.
24.
26.
25.
24.
03.
14.
54.
4D
omes
tic fi
nanc
ed0.
30.
70.
80.
90.
70.
60.
80.
61.
01.
33.
52.
83.
02.
32.
83.
04.
2N
et le
ndin
g0.
60.
00.
00.
00.
00.
10.
00.
00.
00.
00.
00.
00.
0-0
.90.
10.
0-0
.6C
onti
ngen
cy s
pend
ing
(Ebo
la)
0.0
0.0
0.0
0.0
0.0
0.0
0.0
0.0
0.0
0.0
0.0
0.0
0.0
0.0
0.7
0.3
0.5
Ove
rall
bal
ance
incl
. gra
nts
-3.5
-5.1
-4.9
-4.5
-2.4
-2.0
-1.6
20.0
-3.5
-2.3
-5.0
-4.6
-5.5
-1.9
-4.1
-4.5
-8.2
Ove
rall
bal
ance
exc
l. gr
ants
-8.6
-9.5
-11.
0-1
0.0
-9.0
-9.4
-7.8
-4.7
-7.0
-8.4
-10.
3-1
0.1
-9.6
-4.9
-8.9
-9.9
-11.
3D
omes
tic
prim
ary
bala
nce
-4.0
-5.6
-6.5
-5.9
-4.8
-4.3
-3.4
-2.4
-3.0
-4.0
-5.9
-3.7
-4.2
-0.7
-5.5
-5.3
-6.7
Tot
al F
inan
cing
3.5
5.1
4.9
4.5
2.4
2.0
1.6
-20.
03.
52.
35.
04.
65.
51.
94.
14.
58.
2Fo
reig
n B
orro
win
g4.
028
.85.
52.
12.
81.
30.
5-2
0.7
1.9
1.9
1.6
2.4
3.4
1.6
1.3
1.6
1.7
Dom
estic
Bor
row
ing
1.7
-22.
20.
01.
4-1
.50.
20.
21.
72.
10.
63.
52.
12.
20.
32.
63.
06.
5
Pov
erty
red
ucin
g ex
pend
itur
es0.
00.
00.
00.
00.
00.
03.
32.
54.
44.
42.
74.
25.
64.
96.
15.
85.
3P
ubli
c de
bt15
4.0
150.
115
4.0
150.
114
5.5
129.
410
2.9
42.2
41.8
44.1
45.2
44.0
37.2
32.1
34.5
41.9
54.8

112
Growth accounting
Source: Penn World Table, version 9.0
YearChance in
employmentChange in
capital stockChange in TFP
Change in welfare adjusted TFP
1981 1.7 3.9 1.3 -1.01982 1.6 2.6 -0.3 -2.31983 2.0 2.3 -2.8 -7.21984 1.9 1.3 1.8 -1.91985 2.6 1.1 -0.1 -0.11986 2.6 1.1 -0.4 -1.61987 2.7 0.2 1.9 2.11988 3.0 1.0 -0.5 1.61989 2.2 1.7 0.5 0.01990 1.0 0.6 2.8 -2.51991 -0.3 0.9 -8.4 -5.71992 -0.6 1.3 -10.2 -10.61993 -1.0 -1.6 0.3 -0.21994 -1.0 0.3 2.9 4.11995 -0.5 -1.4 -10.2 -10.91996 -0.4 -0.8 -24.6 -24.21997 0.2 -2.7 -17.3 -14.91998 1.0 -2.3 -1.1 -4.01999 1.8 -2.7 -8.4 -8.32000 3.0 -1.4 2.4 24.52001 4.0 -0.7 16.3 20.92002 4.3 0.0 23.6 21.92003 4.9 0.5 6.4 3.42004 13.0 0.3 -1.0 -4.72005 -0.7 1.4 3.8 2.62006 3.5 1.0 1.3 -1.62007 3.1 0.9 5.4 4.72008 2.7 1.2 3.0 5.82009 2.7 1.5 1.5 6.52010 2.8 15.9 -3.7 1.62011 2.6 19.7 -5.0 14.02012 2.8 8.3 8.8 -6.62013 2.8 4.9 15.0 -4.12014 2.6 4.7 2.6 -22.2

113
Employment and productivity
Source: World Bank WDI
Year Working age population
Parcitipation rate
Employment rate
Agriculture Industry Services Total Agriculture Industry Services TotalVA per capital
1960 61.2 67.7 96.81961 61.1 67.6 96.71962 61.1 67.5 96.71963 61.1 67.4 96.71964 61.3 67.3 96.7 274.1 74.1 491.3 839.6 383.4 912.6 4,047.5 915.0 364.91965 61.4 67.2 96.7 261.0 81.7 563.5 906.2 362.3 997.2 4,387.4 973.6 388.41966 61.2 67.1 96.7 265.4 80.8 573.5 919.7 367.7 983.0 4,249.7 979.4 388.81967 61.0 67.0 96.7 269.0 77.1 574.4 920.5 371.3 933.6 4,051.9 970.1 383.61968 60.9 66.9 96.7 273.5 74.6 588.1 936.3 375.5 898.6 3,949.1 975.0 384.51969 60.9 66.8 96.7 280.6 80.8 641.3 1,002.7 382.8 965.1 4,098.7 1,030.4 405.41970 60.9 66.7 96.7 286.3 89.1 703.5 1,078.9 387.7 1,054.9 4,279.2 1,092.6 429.11971 60.6 66.6 96.7 288.9 90.3 737.6 1,116.8 389.7 1,064.8 4,291.7 1,119.0 436.51972 60.3 66.5 96.7 290.3 87.6 754.9 1,132.9 389.4 1,026.3 4,198.5 1,120.9 434.71973 60.1 66.4 96.7 291.6 86.8 784.6 1,163.0 388.4 1,007.5 4,168.8 1,134.5 437.81974 59.9 66.3 96.7 295.0 87.7 820.2 1,202.8 389.7 1,008.6 4,162.0 1,155.5 443.91975 59.8 66.2 96.7 305.1 87.0 837.8 1,229.8 399.3 990.6 4,060.5 1,162.3 444.61976 59.3 66.1 96.7 320.8 81.4 843.8 1,246.0 417.8 921.4 3,924.7 1,163.2 441.11977 59.0 66.0 96.7 361.3 72.9 840.6 1,274.8 467.2 817.8 3,747.7 1,173.1 441.61978 58.7 65.9 96.7 432.1 66.5 825.7 1,324.4 554.1 739.6 3,526.3 1,199.7 448.81979 58.5 65.8 96.7 477.5 68.0 839.0 1,384.5 606.8 748.0 3,432.2 1,233.6 458.81980 58.2 65.7 96.7 481.7 72.0 893.0 1,446.7 606.3 784.1 3,500.3 1,267.4 468.71981 57.8 65.6 96.6 501.9 66.7 975.6 1,544.2 628.2 720.5 3,680.4 1,335.2 489.41982 57.5 65.5 96.6 521.2 64.6 1,033.7 1,619.5 648.3 692.6 3,752.9 1,381.1 502.31983 57.1 65.4 96.6 536.5 63.2 1,017.7 1,617.3 662.2 672.2 3,552.6 1,358.4 490.61984 56.9 65.3 96.6 637.8 66.8 1,063.7 1,768.3 779.4 701.9 3,563.1 1,458.9 523.71985 56.7 65.2 96.6 603.8 60.4 888.4 1,552.6 728.2 625.3 2,848.8 1,254.6 447.91986 56.3 65.1 96.6 606.0 66.3 860.6 1,533.0 721.2 677.2 2,642.3 1,212.9 429.51987 56.0 65.0 96.6 643.0 65.1 867.4 1,575.5 752.8 653.0 2,543.3 1,216.8 427.91988 55.8 64.9 96.6 646.9 67.2 890.6 1,604.6 745.6 662.3 2,496.4 1,210.4 423.31989 55.7 64.8 96.6 643.4 73.4 936.5 1,653.4 733.5 715.1 2,522.1 1,223.6 426.31990 55.7 64.7 96.6 964.0 143.5 578.9 1,686.4 1,093.6 1,388.3 1,507.6 1,232.0 429.01991 55.5 64.5 96.7 1,000.5 151.1 569.8 1,721.5 1,194.1 1,474.1 1,336.1 1,259.4 436.31992 55.4 64.5 96.6 683.8 182.8 417.1 1,283.7 815.6 1,843.4 995.3 946.2 326.71993 55.4 64.4 96.6 661.7 171.8 456.5 1,290.0 791.0 1,797.8 1,111.6 960.7 331.31994 55.5 64.3 96.6 695.3 171.3 408.4 1,275.0 832.2 1,859.8 1,014.0 958.4 330.41995 55.6 64.2 96.6 626.7 143.1 396.7 1,166.6 748.4 1,606.7 1,000.8 881.8 304.01996 55.6 64.1 96.6 590.7 151.0 418.5 1,160.3 702.0 1,750.8 1,069.9 879.8 302.71997 55.6 64.1 96.6 769.5 139.7 330.0 1,239.3 904.0 1,662.3 849.3 936.1 322.41998 55.7 64.1 96.6 827.7 131.2 324.5 1,283.3 954.5 1,592.2 835.0 959.1 330.91999 55.8 64.0 96.7 877.2 111.9 300.7 1,289.9 984.9 1,374.8 767.3 945.6 326.62000 55.8 64.1 96.6 945.6 117.6 312.6 1,375.8 1,024.8 1,451.8 784.2 981.1 338.82001 55.7 64.2 96.7 590.7 106.3 519.3 1,216.3 609.9 1,303.6 1,264.2 832.6 288.22002 55.8 64.3 96.7 778.2 139.5 618.0 1,535.7 759.3 1,686.6 1,448.4 1,000.9 347.32003 55.8 64.4 96.6 851.9 175.0 651.7 1,678.6 784.0 2,084.8 1,467.9 1,039.7 361.22004 55.9 66.0 96.7 926.8 194.9 664.3 1,786.0 778.2 1,725.1 1,528.4 1,027.3 366.72005 56.1 66.2 96.7 990.0 196.7 677.0 1,863.7 802.3 1,688.0 1,438.6 1,023.4 367.52006 56.1 66.4 96.7 1,049.1 208.3 713.1 1,970.5 829.0 1,750.8 1,415.6 1,043.6 375.82007 56.1 66.6 96.7 1,188.1 212.9 728.8 2,129.8 920.2 1,762.4 1,359.5 1,093.3 395.12008 56.2 66.8 96.7 1,267.5 190.8 786.5 2,244.9 965.1 1,560.9 1,383.9 1,120.2 406.52009 56.3 67.0 96.6 1,318.5 178.6 852.2 2,349.3 988.8 1,446.4 1,418.3 1,141.7 416.02010 56.5 67.1 96.7 1,364.9 200.6 909.2 2,474.7 1,005.5 1,604.5 1,428.3 1,167.8 428.42011 56.6 67.2 96.7 1,431.6 221.0 940.8 2,593.4 1,039.5 1,751.9 1,400.7 1,192.4 438.92012 56.8 67.3 96.6 1,486.7 502.6 998.2 2,987.6 1,064.5 3,951.4 1,410.1 1,338.7 494.42013 57.1 67.3 96.6 1,554.4 992.6 1,061.1 3,608.1 1,096.8 7,734.3 1,422.0 1,574.4 583.92014 57.3 67.4 96.6 1,566.9 1,127.0 1,079.6 3,773.4 1,087.7 8,691.1 1,371.0 1,600.6 597.52015 57.6 67.4 96.6 1,615.9 281.2 1,096.6 2,993.7 1,105.6 2,150.8 1,322.7 1,236.4 463.9
Employment Value added per worker (2010 constant USD)Value added (constant 2010 US$ million)

114
Rice balance sheet
Source: FAO and USDA
Year Production Imports Total supply Consumption Surplus-deficit (before imports)
Surplus-deficit (before imports) in % of production
1961 176.1 4.2 180.3 180.4 -4.3 -2.41962 210.1 15.2 225.3 191.7 18.4 8.81963 220.8 21.3 242.1 224.3 -3.5 -1.61964 248.8 0.6 249.3 229.0 19.8 7.91965 266.1 21.1 287.3 270.5 -4.4 -1.61966 289.5 41.2 330.6 302.2 -12.7 -4.41967 312.2 30.5 342.6 314.6 -2.4 -0.81968 284.2 20.9 305.1 323.4 -39.2 -13.81969 338.2 12.8 351.0 320.0 18.2 5.41970 300.2 50.2 350.3 328.1 -27.9 -9.31971 309.5 27.4 336.9 331.3 -21.8 -7.01972 319.5 5.2 324.7 340.5 -21.0 -6.61973 319.5 37.3 356.8 354.7 -35.2 -11.01974 346.0 42.3 388.3 362.9 -17.0 -4.91975 380.6 0.0 380.6 371.6 9.0 2.41976 386.9 0.9 387.7 376.3 10.5 2.71977 400.2 11.0 411.2 391.0 9.2 2.31978 413.5 18.5 432.0 398.7 14.9 3.61979 333.5 91.9 425.4 405.2 -71.7 -21.51980 342.2 62.1 404.3 397.2 -55.1 -16.11981 333.5 53.1 386.6 396.7 -63.2 -18.91982 349.2 85.3 434.5 390.3 -41.1 -11.81983 307.0 31.3 338.2 388.5 -81.5 -26.61984 336.3 28.0 364.3 389.1 -52.8 -15.71985 286.8 92.2 379.0 400.1 -113.3 -39.51986 350.2 90.2 440.3 410.1 -59.9 -17.11987 310.6 97.7 408.3 422.7 -112.1 -36.11988 328.8 96.7 425.5 437.5 -108.7 -33.11989 345.4 99.5 444.9 446.3 -101.0 -29.21990 336.0 123.7 459.7 457.8 -121.8 -36.31991 336.0 141.1 477.1 460.2 -124.3 -37.01992 319.2 107.2 426.4 461.8 -142.6 -44.71993 324.4 110.0 434.4 457.8 -133.4 -41.11994 270.3 231.6 501.9 454.1 -183.8 -68.01995 237.1 243.2 480.3 448.2 -211.1 -89.01996 261.3 209.0 470.3 445.2 -183.9 -70.41997 274.3 150.0 424.3 443.9 -169.6 -61.81998 219.0 150.0 369.0 438.8 -219.9 -100.41999 164.9 150.0 314.9 440.4 -275.5 -167.12000 132.8 100.0 232.8 448.9 -316.1 -238.02001 200.1 125.0 325.1 459.2 -259.1 -129.52002 281.5 130.2 411.7 471.5 -190.0 -67.52003 297.2 141.2 438.4 478.1 -180.8 -60.82004 361.5 18.0 379.5 482.6 -121.1 -33.52005 492.3 80.7 572.9 524.3 -32.0 -6.52006 708.6 112.4 820.9 552.0 156.5 22.12007 392.2 112.3 504.5 603.4 -211.2 -53.92008 453.6 196.2 649.8 611.4 -157.8 -34.82009 592.6 106.3 698.8 637.6 -45.0 -7.62010 684.8 103.5 788.3 708.0 -23.2 -3.42011 719.0 163.7 882.7 722.4 -3.4 -0.52012 719.0 231.1 950.1 994.0 -275.0 -38.22013 791.0 259.4 1,050.4 1,071.0 -280.0 -35.42014 728.0 220.0 948.0 948.0 -220.0 -30.22015 801.0 200.0 1,001.0 1,001.0 -200.0 -25.0
Copyright © 2022 FDOKUMEN