Sidelobe Suppression Featuring the Phase Coherence Factor ...
11
730 N.S. NIK ANWAR, M. Z. ABDULLAH, SIDELOBE SUPPRESSION FEATURING THE PHASE COHERENCE FACTOR IN 3-D … DOI: 10.13164/re.2016.0730 APPLICATIONS OF WIRELESS COMMUNICATIONS Sidelobe Suppression Featuring the Phase Coherence Factor in 3-D Through-the-Wall Radar Imaging Nik Syahrim NIK ANWAR 1 , Mohd Zaid ABDULLAH 2 1 School of Electrical and Electronic Engineering 2 Collaborative Microelectronic Design Excellence Centre (CEDEC) Universiti Sains Malaysia, Engineering Campus, 14300 Nibong Tebal, Penang, Malaysia [email protected], [email protected] Manuscript received June 29, 2015 Abstract. Through-the-Wall Radar Imaging (TWRI) could be performed by beamforming of the signals from an array of ultrawideband (UWB) antennas. Preferably the imaging is done in 3-D so that both the position and the height of the target are revealed. This is possible with planar array antenna geometry. However, implementing this technique that fulfills Nyquist criterion leads to a large number of antennas while sparse array suffers from an increase of the sidelobe level. In this work, the Phased Coherence Factor (PCF) is applied to conventional delay and sum (DAS) beamformer to suppress the sidelobe of a sparse planar antenna array. The performance of the proposed technique is experimentally evaluated in terms of the target-to-clutter ratio (TCR), and the separation resolution. It is discovered that PCF is effective in reducing the sidelobe’s artifacts, resulting in TCR of greater than 10 dB and a separation resolution of 20 cm at 2.5 m range. Keywords Through-wall, radar, sidelobe, suppression, sparse array, phase coherence factor 1. Introduction TWRI is crucial in many practical applications like the search-and-rescue operation, urban sensing, surveil- lance and tactical missions [1]. Radar technology is usually adapted for this purpose due to the ability of electromag- netic wave to penetrate visually obscure walls. Conven- tionally, the image is reconstructed using signal processing technique such as beamforming in which the signals re- ceived by an antenna array are coherently summed [2]. In achieving higher resolution, an array with large aperture size is usually preferred. However, this requires many sensors in order to fulfill the Nyquist sampling crite- rion. In sensing, this means the element spacing must be equal or less than /2. Therefore, a large number of anten- nas is needed in order to meet this criterion especially when the resolution in both x and y directions need to be main- tained at relatively the same degree of accuracy. On the other hand, designing an array with fewer sensors with spacing exceeding /2 produces spatial ambiguities in the form of grating lobes [2]. However, for a wideband system, the grating lobes spread over a large region and their amplitudes are signifi- cantly lower than the main lobe [3]. Grating lobes also do not build up in a UWB pulse-based system due to the com- pactness and low number of oscillations of the pulses i.e. the pulses only interfere near the focal point [4]. Unfortu- nately, sidelobes still exist due to the finite aperture length and finite number of elements [3], [4]. An increase in the sidelobe ratio increases the apparent background level thus decreasing the image contrast [5]. When the beam is steered, a point target will be detected in several consecu- tive beams, leading to the broadening of the target extent in the crossrange. Meanwhile, the main lobe-to-sidelobe ratio determines the image’s dynamic range [3]. Human sensing behind the wall was investigated by means of the Moving Target Indicator (MTI) utilizing the Change Detection (CD) technique [6], [7]. These proce- dures eliminate the need to use the scene’s background information, and the image is reconstructed from two con- secutive or non-consecutive coherently subtracted radar profiles. However, the residual clutter still exists due to the grating/side lobe artifact [8]. This is in addition to other inherent artifacts like wall reflection [7], and the multipath scattering [9]. Therefore suppressing the grating and side lobes will bring significant enhancement to the perfor- mance of a CD based MTI. In recent years, a lot of research have been performed to minimize grating or sidelobe of antenna arrays either through synthetic operation [10], virtual [11], [12] or fixed aperture arrays [13], [14]. However managing a high num- ber of elements requires a complex system and design. Similarly, a lot of work have also been performed to en- hance TWRI’s image via image processing like the use of statistical methods [15], fuzzy logic [16], filtering [17], autofocusing [18], and multi-location image fusion [19]. However, these techniques are less effective since they do not directly address the artifacts caused by the grating and sidelobe interferences. Moreover, most of the previous work employed a scanner based measurement technique,
-
Upload
khangminh22 -
Category
Documents
-
view
0 -
download
0
Transcript of Sidelobe Suppression Featuring the Phase Coherence Factor ...

730 N.S. NIK ANWAR, M. Z. ABDULLAH, SIDELOBE SUPPRESSION FEATURING THE PHASE COHERENCE FACTOR IN 3-D …
DOI: 10.13164/re.2016.0730 APPLICATIONS OF WIRELESS COMMUNICATIONS
Sidelobe Suppression Featuring the Phase Coherence Factor in 3-D Through-the-Wall Radar Imaging
Nik Syahrim NIK ANWAR1, Mohd Zaid ABDULLAH2
1School of Electrical and Electronic Engineering 2Collaborative Microelectronic Design Excellence Centre (CEDEC)
Universiti Sains Malaysia, Engineering Campus, 14300 Nibong Tebal, Penang, Malaysia
[email protected], [email protected]
Manuscript received June 29, 2015
Abstract. Through-the-Wall Radar Imaging (TWRI) could be performed by beamforming of the signals from an array of ultrawideband (UWB) antennas. Preferably the imaging is done in 3-D so that both the position and the height of the target are revealed. This is possible with planar array antenna geometry. However, implementing this technique that fulfills Nyquist criterion leads to a large number of antennas while sparse array suffers from an increase of the sidelobe level. In this work, the Phased Coherence Factor (PCF) is applied to conventional delay and sum (DAS) beamformer to suppress the sidelobe of a sparse planar antenna array. The performance of the proposed technique is experimentally evaluated in terms of the target-to-clutter ratio (TCR), and the separation resolution. It is discovered that PCF is effective in reducing the sidelobe’s artifacts, resulting in TCR of greater than 10 dB and a separation resolution of 20 cm at 2.5 m range.
Keywords Through-wall, radar, sidelobe, suppression, sparse array, phase coherence factor
1. Introduction TWRI is crucial in many practical applications like
the search-and-rescue operation, urban sensing, surveil-lance and tactical missions [1]. Radar technology is usually adapted for this purpose due to the ability of electromag-netic wave to penetrate visually obscure walls. Conven-tionally, the image is reconstructed using signal processing technique such as beamforming in which the signals re-ceived by an antenna array are coherently summed [2].
In achieving higher resolution, an array with large aperture size is usually preferred. However, this requires many sensors in order to fulfill the Nyquist sampling crite-rion. In sensing, this means the element spacing must be equal or less than /2. Therefore, a large number of anten-nas is needed in order to meet this criterion especially when the resolution in both x and y directions need to be main-tained at relatively the same degree of accuracy. On the
other hand, designing an array with fewer sensors with spacing exceeding /2 produces spatial ambiguities in the form of grating lobes [2].
However, for a wideband system, the grating lobes spread over a large region and their amplitudes are signifi-cantly lower than the main lobe [3]. Grating lobes also do not build up in a UWB pulse-based system due to the com-pactness and low number of oscillations of the pulses i.e. the pulses only interfere near the focal point [4]. Unfortu-nately, sidelobes still exist due to the finite aperture length and finite number of elements [3], [4]. An increase in the sidelobe ratio increases the apparent background level thus decreasing the image contrast [5]. When the beam is steered, a point target will be detected in several consecu-tive beams, leading to the broadening of the target extent in the crossrange. Meanwhile, the main lobe-to-sidelobe ratio determines the image’s dynamic range [3].
Human sensing behind the wall was investigated by means of the Moving Target Indicator (MTI) utilizing the Change Detection (CD) technique [6], [7]. These proce-dures eliminate the need to use the scene’s background information, and the image is reconstructed from two con-secutive or non-consecutive coherently subtracted radar profiles. However, the residual clutter still exists due to the grating/side lobe artifact [8]. This is in addition to other inherent artifacts like wall reflection [7], and the multipath scattering [9]. Therefore suppressing the grating and side lobes will bring significant enhancement to the perfor-mance of a CD based MTI.
In recent years, a lot of research have been performed to minimize grating or sidelobe of antenna arrays either through synthetic operation [10], virtual [11], [12] or fixed aperture arrays [13], [14]. However managing a high num-ber of elements requires a complex system and design. Similarly, a lot of work have also been performed to en-hance TWRI’s image via image processing like the use of statistical methods [15], fuzzy logic [16], filtering [17], autofocusing [18], and multi-location image fusion [19]. However, these techniques are less effective since they do not directly address the artifacts caused by the grating and sidelobe interferences. Moreover, most of the previous work employed a scanner based measurement technique,

RADIOENGINEERING, VOL. 25, NO. 4, DECEMBER 2016 731
synthesizing a large number of densely spaced antenna elements, which is impractical for a real implementation due to large data volume, long sampling time and high cost.
A conventional method in reducing the sidelobes is through tapering by introducing weighting factors to each sensor channel in expense to the widening of main lobe’s width and consequently poorer spatial resolution [2]. Popu-lar technique includes the adaptive weighting which is effective in sidelobe suppression but requires intensive computation [20]. In addition, a method based on correla-tion of adjacent signals like the delay, multiple and sum (DMAS) algorithm, has also been applied [21]. Though effective to a certain extent, however, this algorithm is less efficient due to the large number of multiplication opera-tions involved. Moreover, methods based on multiplication of the beamformer’s output with a weighting factor like the Coherence Factor (CF) [22], the Phase Coherence Factor (PCF), and the Sign Coherence Factor (SCF) [3] have also been reported. Image enhancement resulting from the application of CF is discussed in [23], [24]. Meanwhile, PCF was also applied for reducing the sidelobe’s artifact in the frequency domain [8]. However, the analysis was only performed in 2-D and no resolution analysis was reported.
In this work, we investigate the application of PCF to suppress the sidelobes of a time domain Delay-And-Sum (DAS) beamforming in combination with a sparse planar array. The investigation is extended to TWRI in 3-D that would reveal not only positions but also the target’s height. The ability to sense in the third dimension is vital for en-hancing target identification. The system is intended for short range and high accuracy applications. We analyze the performance of the technique in terms of clutter reduction and resolution. Firstly, the through-the-wall signal model and the concept of instantaneous phase are presented. Sec-ondly, the working principle of PCF is addressed. Finally, experimental results are presented and discussed from which the conclusion are drawn.
2. Signal Model Firstly, we study the travel path of a TWRI signal for
one antenna pair in multistatic configuration. For clarity reason, we first consider 2-D plane as shown in geometry in Fig. 1(a). The 3-D representations could easily be de-rived by including the orthogonal plane of this figure. This figure shows a signal from the m-th transmitter TXm propa-gating through the wall with thickness Dw and homogenous permittivity of εw. Upon exiting the wall, it is reflected at a point scatterer, F, passing through the wall again before being received by the n-th receiver RXn.
The backscattered signal at point F, YFm,n can be mod-
elled as follows:
F total, ,m n m nY t A t (1)
where A(t) and total,m n are the signal’s envelope and total time
delay respectively. In this case, total,m n is given by:
(a) (b)
Fig. 1. The geometry for (a) 2-D TWRI multistatic signal, (b) signal after the wall.
total, stand wall air
stand,1 stand,2 wall,1 wall,2 air,1 air ,2
w
( ) ( ) ( )
/
m n
L L L L L L
c cc
(2)
where τstand is the time delay due to the stand-off between the antenna and the wall, τwall and τair are time delays in air and wall respectively. Meanwhile, Lstand, Lwall, and Lair are distances corresponding to the propagation of the signal in stand-off region, wall and air respectively. In this case, Lstand is assumed known, while Lair is calculated based on the distance to the points in the region of interest. Assum-ing known wall’s permittivity and thickness, therefore, Lwall can be calculated based on the position of the target with respect to the antenna using Snell’s law [25]. While c rep-resents the speed of light.
Equation (1) represents an ideal signal for a sidelobe free and single scatterer case. In the presence of sidelobes, however, the reflection from other scatterers particularly those located in proximity to the focal point F will also be sensed by the receivers. This effect is illustrated in Fig. 1(b) which shows a scatterer P located close to point F. In this figure, only three reflected signals due to P are shown as illustration. They are recorded at three receivers, i.e: RXn, RXn + 1, and RXn + 2. Apparently, the reflections from P follow different paths as compared to F. This leads to a difference in the propagation time delay, Δ total
,m n , for
each transceiver pair. The out of focus signal from P can be represented as follows:
P total total, , ,m n m n m nY t A t . (3)
YPm,n can be re-focused to the intended focal point F by
applying the focusing delay yielding:
P' total, ,m n m nY t A t . (4)
From (3) and (4), we could deduce that if a point P lies in the main lobe, then Δ total
,m n = 0. In this case, YPm,n = YF
m,n
TXmDW
WALL
x
RXn
x
AIR
Lstand,1
Lstand,2
Lwall,2
Lwall,1
Lair,1
Lair,2
F
AIR
732 N.S. NIK ANWAR, M. Z. ABDULLAH, SIDELOBE SUPPRESSION FEATURING THE PHASE COHERENCE FACTOR IN 3-D …
and represents a point with a good focusing quality. In contrast, if a point lies outside the main lobe, then Δ total
,m n ≠ 0 and varies across the aperture. Resultantly, the
focal point F has a poor focusing quality due to the side-lobe interference and hence blurry reconstruction. The amount in which a signal is out-of-focus can be assessed by calculating the instantaneous phase [3]. This is discussed in Sec. 3.1.
3. Proposed Method In order to suppress the signals at the sidelobes, we
manipulate the phase information across the aperture. Sig-nals reflected by a scatterer outside the focus point produce a substantial phase shift across the aperture. Hence, multi-plying PCF with DAS beamformer’s output would theo-retically reduce cluttering due to sidelobes. Consequently, a much more accurate image reconstruction is produced.
3.1 Phase Coherence Factor
The instantaneous phase is available from direct in-phase, I and quadrature, Q sampling. However for a time domain technique, this information is unavailable. In this work the instantaneous phase, φm,n is estimated by firstly, shifting the measured backscattered signal, Ym,n(t), by , and secondly, applying the Hilbert transform [3]. Mathematically:
,1,
,
tan m nm n
m n
H Y tt
Y t
(5)
where ⋅ denotes the Hilbert transform.
The simplest way to detect whether or not the scat-terer lies in the main lobe is by examining the variation of φm,n for example by using standard deviation. However, arctangent produces φm,n in wrap around values that vary from –π to +π. This causes the variation to be slightly larger than the actual value especially near ±π. In order to overcome the ambiguity of the phase function, it is recom-mended to deal with the complex function, exp(j(φm,n(t)). By omitting the element and time indices, the standard deviation of the complex function, exp(jφ), can be written as the square root of the sum of the variances of the real and imaginary parts [26]:
std exp var cos var sinj . (6)
Then, PCF is calculated from the standard deviation as follows:
21 std expPCF j . (7)
From (7) it can be inferred that aperture signals with constant phase produce zero standard deviation and there-fore maximum PCF value. In contrast, aperture signals with high phase dispersion yield low PCF value and hence suppressed.
3.2 PCF Weighted DAS
The desired output is achieved by multiplying the weighting factor, PCF, with the beamformer’s output as given in (8). Here, M and N denote the total number of transmitter and receiver respectively. The corrected output is then squared and integrated over a time window, W, giving the energy value at the focus point, En(F). The length of W is set to match the pulse width in order to eliminate late arriving clutter.
2
,1 10
dW M N
m nm n
En F Y PCF t
. (8)
The CD operation can be described as follows:
2 1, , ,Δ m n m n m nY t Y t Y t (9)
where Y1m,n and Y2
m,n are the first and second snapshot re-spectively. These snapshots can be captured consecutively or at different times. Meanwhile, ΔY’
m,n is the time shifted version of ΔYm,n. By taking the difference between two snapshots, therefore, the stationary signatures are elimi-nated while simultaneously highlighting the moving targets.
A CD image is generated by applying (8) to all voxels in the region of interest. The implementation of the algorithm is summarized graphically in Fig. 2.
The sidelobe suppression capability of PCF can be visualized by the following Point Spread Function (PSF) in Fig. 3. The PSF is calculated from a simulated data using
Fig. 2. DAS algorithm with PCF weighted output.
Fig. 3. The PSF of a square shaped target calculated from
FDTD simulation.
-80 -60 -40 -20 0 20 40 60 80-50
-40
-30
-20
-10
0
Scan angle in degree
Am
plit
ud
e in
dB
PSF from FDTD simulation
DASPCFDAS*PCF

RADIOENGINEERING, VOL. 25, NO. 4, DECEMBER 2016 733
Finite Difference Time Domain (FDTD) technique with a metallic square shaped target of size 30 cm 30 cm and located at the broadside (scan angle = 0º) of the array. The average sidelobe level for DAS is –18 dB. After multipli-cation with PCF, the average sidelobe level reduces to –43 dB. Clearly, the angular resolution is not only pre-served but also improved as evident in Fig. 3.
4. Experimental Validation and Setup The data acquisition system is composed of a 16-ele-
ments antenna array connected to a 2-port Vector Network Analyzer (VNA) via a multiplexer. A laptop with Labview program was used to synchronize the multiplexing of the transmitting and receiving channels, providing 240 multi-static signals per snapshot. The VNA is set to sweep from 1 GHz to 5 GHz in 5 MHz discrete step. It takes approxi-mately 0.5 s to completely record the signal from a single transceiver pair. This is equivalent to an imaging rate of about 2 min per frame. Hence, the system is suitable for visualizing slow moving targets which are common in many TWRI applications. Operation at higher speeds will require major developments in data acquisition electronics. The time domain signal is obtained through Inverse Fast Fourier Transform function with 800 data points over 70 ns duration each. The electrical delays due to cables and am-plifiers have been measured and accounted for in the meas-urements. Two identical UWB amplifiers with 29 dB gain were used to amplify the transmitted and received signals. The maximum transmitted power of 13.5 dBm (22.4 mW) is obtained after considering the coaxial cable loss. This is almost equivalent to half of the power of a commercial Wifi system.
The configuration of the sparse antenna array is shown in Fig. 4. It has a mean spacing, d of 30 cm with non-uniform randomization of each element over d/4 in order to reduce the sidelobes. Further reduction is possible by using larger randomization distance like d/2. However, this would cause some elements being impractically too close, resulting in the decrease of signal-to-noise ratio due to the increase of capacitive coupling effect [27]. The an-tennas are the biconical type which have attractive features like small size and wideband characteristic [28]. The an-tenna measures 10 mm in height and 45° in cone angle, and is fabricated from copper. Each antenna is sequentially operated as transmitter and receiver. The array is mounted directly onto the wall’s surface in order to maximize antenna-wall coupling.
Fig. 4. The geometrical configuration of the sparse antenna array. Each filled dot represents the antenna location.
Meanwhile, the wall is made up of typical residential grade bricks with 10 cm thickness, 2 m tall and 2.2 m long. A homogeneous permittivity value of 3.8 was assumed for the wall material. The wall is located at a minimum dis-tance of 4 meters from the surrounding sidewalls and ceil-ing. A layer of 12 inches pyramidal absorbers was placed on the floor in the vicinity of the wall to mitigate floor reflections.
4.1 Sidelobe Suppression
To evaluate the performance of the algorithm in sup-pressing the sidelobes, we consider an experiment with two targets moving side by side away from the wall with a displacement of 50 cm as illustrated in Fig. 5.
Two rectangular metallic sheets with width 30 cm and height 170 cm were used as targets. A few objects such as a wood plank, metal bucket, and chair were randomly placed in the scene in order to study the effect of cluttering on the image reconstruction algorithm. These objects re-main stationary throughout the measurement. The experi-mental set-up is shown in Fig. 6.
The targets are assumed to be very slow as compared to the acquisition time so that they appear stationary during the snapshot [6], [29], [30]. This was done by taking the snapshots with the targets stationary at each position. CD image from the snapshots is reconstructed using the pro-posed technique. For comparison purpose, the same image is also reconstructed using original and tapered DAS beam-former with Chebyshev weighting [2], [31].
Fig. 5. Scene layout and positions of targets.
Fig. 6. Experimental set-up.

734 N.S. NIK ANWAR, M. Z. ABDULLAH, SIDELOBE SUPPRESSION FEATURING THE PHASE COHERENCE FACTOR IN 3-D …
4.2 Image Spatial Resolution
In addition to sidelobe suppression’s performance, in-vestigations were also performed to study the effect of the algorithm on image resolution. In any imaging modality, resolution is an ambiguous concept which takes different definitions and metrics. In this work, the resolution is de-fined as the ability of the system to resolve two targets separated by s and located at a specific distance from the wall as illustrated in Fig. 7. The objective is to find smin, which is the minimum distance before the targets become completely indistinguishable. Only the crossrange resolu-tion is considered in this case. The measurements were performed at three positions - P1, P2 and P3.
The limit of the separation resolution is determined by the resolution ratio, r, from the 1-D cross section of the reconstructed image taken on a line passing through the center of the targets:
min
max
Ur
U (10)
where Umin is the minimum pixel value between the two targets, and Umax is the maximum pixel value on the 1-D cross-sectional image. Figure 8 illustrates an example of the determination of r from an arbitrary generated image.
In this case, the highest threshold limit for r generally equals to 0.81 [27]. If r > 0.81, then the targets are com-pletely indistinguishable. The value of s where r is closest to 0.81 is chosen as the minimum separation distance, smin. This value is compared with the value calculated analyti-cally. Although the separation resolution has never been
Fig. 7. The experimental layout for determining the separation
resolution.
(a) (b)
Fig. 8. (a) Arbitrary generated image of two targets. (b) The 1D-cross-sectional image through the targets center.
Fig. 9. The geometry for calculation of the theoretical cross-
range resolution at an arbitrary point, P.
scientifically proven to be equal to the theoretical resolu-tion, however, this metric provides a good estimation of the system’s resolution and has been used by other researchers [32].
The radiation pattern of a focused beam in the near field is same as the radiation pattern in the far field [33]. Therefore, the 3-dB beamwidth, ΔΦ3dB, for a UWB non-sinusoidal pulse-based beamformer with an array length, L, and in scan direction, θ, from the array normal can be esti-mated by the following far field formula:
3dB cos
b T c
L
(11)
where T and b are the effective pulse duration and a con-stant respectively [34]. In general, b is fixed to 0.886 in the calculation of the beamwidth of a conventional and unta-pered DAS beamformer near the broadside where the beamwidth is narrowest [35]. The formula for the theoreti-cal crossrange resolution, δcr, is then given by the arc length of the beamwidth over the target’s range, Rp. Mathematically:
cr P 3dBΔ R . (12)
The geometry for calculation of δcr is visualized in Fig. 9.
5. Results and Discussion Fig. 10(a) shows the measured reflection coefficient
of the biconical antenna indicating a bandwidth from 2.25 GHz to 5 GHz (maximum sweeping frequency) as defined by the frequency range where S11 < –10 dB. This figure confirms the wideband characteristic of this antenna which exceeds 3 GHz. This bandwidth is sufficient for TWRI for most applications.
Meanwhile, Fig. 10(b) shows the transmission co-efficients S21 measured from one pair of the antennas using VNA. The solid curve represents the response without targets. The responses in the presence of targets are su-perimposed as dashed lines in the figure, however, they can only be clearly seen at points where the reflection signals from the targets arrived at positions marked as P1, P2 and P3 respectively. A close examination of Fig. 10(b) shows
0 10 20 30 40 500
0.2
0.4
0.6
0.8
1d s i
Umax
Umin
y

RADIOENGINEERING, VOL. 25, NO. 4, DECEMBER 2016 735
(a)
(b)
(c)
(d)
Fig. 10. S-parameters measured using VNA (a) the reflection coefficient, S11, (b) the transmission coefficient, S21, in time-domain (c) the instantaneous phase calculated using (5) for m = 9 and n = 11, (d) the instantaneous phase of (c) plotted in unit circles.
the presence of other unwanted signals due to cluttering and multiple reflections. The biggest clutters appear at around t = 15 ns and slowly decreasing until t = 20 ns. These clutters can be associated with the multiple reflec-tions from the wall and direct reflection from the floor.
These early arriving clutters are common for TWRI and harmless if mapping of the region very close to the wall could be avoided. However, the clutter increases again almost at the same time as signal P3, this time due to the sidewalls of the laboratory. As can be seen, the magnitude of the targets reflection signals decreases from 9 dB at P1, to 6 dB at P2 and only 2 dB at P3. Evidently, the magni-tude of the signal decreases as the distance from the wall increases. Additionally, the clutter interference causes a smaller increase in the amplitude in the presence of the targets, and consequently a further degradation of the sig-nal as evident from Fig. 10(b) at P3.
Figure 10(c) shows an example of the instantaneous phase calculated using (5) for m = 9 and n = 11. Mean-while, Figure 10(d) shows the alternative representation of Fig. 10(c) as unit circles. It can be seen from this figure there is a smooth transition of φm,n when it is represented as exp(j(φm,n)).
5.1 Sidelobe Suppression
The CD images of two targets with separation dis-tance, s = 40 cm located at P1 moving away from the wall are shown in Fig. 11. The original DAS image in Fig. 11(a) shows strong ring artifacts, shadowing the two targets making them unresolvable. This artifact appears as though the target images being replicated at multiple points along the arc due to the sidelobes. The intensity of replication, however, starts to decrease as the beamformer is steered away from the targets. Clearly in this case, the CD failed to minimize the sidelobe artifacts. Nevertheless, it is efficient in removing the influence from the foreign objects placed in the scene due to their invariant positions during the two snapshot’s interval.
Figures 11b(i-iii) show CD images with tapered beamformer using Chebyshev weighting technique [2], [31]. For this purpose, we reconstruct the image with dif-ferent values of attenuation factors ranging from 5 dB to 50 dB. The best clutter suppression is achieved by using weighting with an attenuation factor of 25 dB as displayed in Fig. 11(b)(i). Nevertheless, it is not possible to correctly distinguish the two targets. A higher or lower attenuation factor leads to an increase in the ring artifact again as can be seen in Fig. 11(b)(ii) and Fig. 11(b)(iii). For a tapered beamformer, the main lobe’s width is strongly coupled with the value of the attenuation factor. As expected, the randomization of the elements in the array and tapering with Chebyshev are insufficient to reduce the sidelobe. Hence, the image distinguishability remains relatively low as these results indicated.
In this case, the PCF weighting produces much accurate reconstruction compared to conventional DAS and Chebyshev weighted as clearly visualized in Fig. 11(c). The two targets at two different positions, appear more distinct compared to Fig. 11(a) and Fig. 11(b). It can also be seen that the image intensity at P2 is substantially much weaker than P1 due to the increase in the downrange distance.
1 2 3 4 5
x 109
-25
-20
-15
-10
-5
Frequency (Hz)
Mag
nit
ud
e (d
B)
S11
1 2 3 4 5
x 10-8
0
2
4
x 10-3
Time (s)
Mag
nit
ud
e
S21 (Time domain)
Without targetsWith targets
0 1 2 3 4 5 6 7
x 10-8
-6
-4
-2
0
2
4
6
Inst Phase vs time
time in sec
Ph
ase
in r
ad
02
46
x 10-8-0.5
00.5
-0.5
0
0.5
Instantaneous unit circles vs time
time in sCos(φ)

736 N.S. NIK ANWAR, M. Z. ABDULLAH, SIDELOBE SUPPRESSION FEATURING THE PHASE COHERENCE FACTOR IN 3-D …
(a)
(i)
(ii)
(b)
(iii)
(c)
Fig. 11. CD images of two slow moving targets located 50 cm away from the starting point P1. The images are reconstructed using (a) conventional DAS [24], (b) Chebyshev weighted [2], [31] with different attenuation factors - (i) 25 dB taper, (ii) 40 dB taper, and (iii) 10 dB taper, and (c) PCF weighted. The small and large dotted line boxes in Fig. 11(a) show the example of the target and clutter areas respectively needed in the TCR calculations.
To quantitatively assess the suppression of the side-
lobes, the target-to-clutter ratio (TCR) is used. TCR is the ratio between the maximum pixel value of the target to the average pixel value in the clutter region. Mathematically:
Target
10
Clutter1
max10log
1 N
n
En pTCR
En pN
(13)
where EnTarget(p) is the pixel value in the target area, EnClutter(p) the pixel value in the cluttered area and N is the number of pixels in the cluttered area. The cluttered area is the region where no target is present. This area was chosen just next to the target area where the ring artifact is the strongest. Examples of the target and cluttered areas are shown in Fig. 11(a). In this case, the areas enclosed by solid and dotted boxes represent the target and cluttered areas respectively
Applying (13) to the images in Fig. 11 gives TCR val-ues which are summarized in Tab. 1. It can be observed from this table that the TCR calculated from the proposed DAS-PCF is much higher compared to other image recon-struction techniques. In this case, DAS-PCF resulted in TCR of approximately 11 dB compared to 5.5 dB of the original DAS (Ori. DAS), 6.6 dB, 5.3 dB and 3.6 dB of Chebesyev weighted (Cheb. Wt.) corresponding to attenu-ation factors of 25 dB, 40 dB and 10 dB respectively. The use of PCF has resulted in the increase in the TCR value by more than two folds compared to other methods. This ex-plains the significant improvement in the overall quality of the reconstructed image that this method produced.
Algorithm Ori. DAS
Cheb. Wt.
25 dB
Cheb. Wt
40 dB
Cheb. Wt.
10 dB
DAS- PCF
TCR (dB) 5.5 6.6 5.3 3.6 10.9
Tab. 1. TCR values calculated from images in Fig. 11, com-paring PCF and standard approaches.
RADIOENGINEERING, VOL. 25, NO. 4, DECEMBER 2016 737
In general, the effectiveness of PCF in suppressing the sidelobes has been demonstrated by the improvement in visual quality and quantitive TCR. The effect of the algorithm on the spatial resolution is discussed in the following paragraph.
5.2 Spatial Resolution
The resolutions were evaluated at positions P1, P2 and P3. In this case, two metallic sheets of the same size were used as targets. For this purpose, we use background subtracted images, where the snapshots of the scene with-out target are subtracted from the scene with targets. Back-ground subtraction is possible under surveillance mode where the information of the empty scene is available. Furthermore, the background subtraction is based on the same principle as CD, in which the snapshots captured at
different time are subtracted coherently.
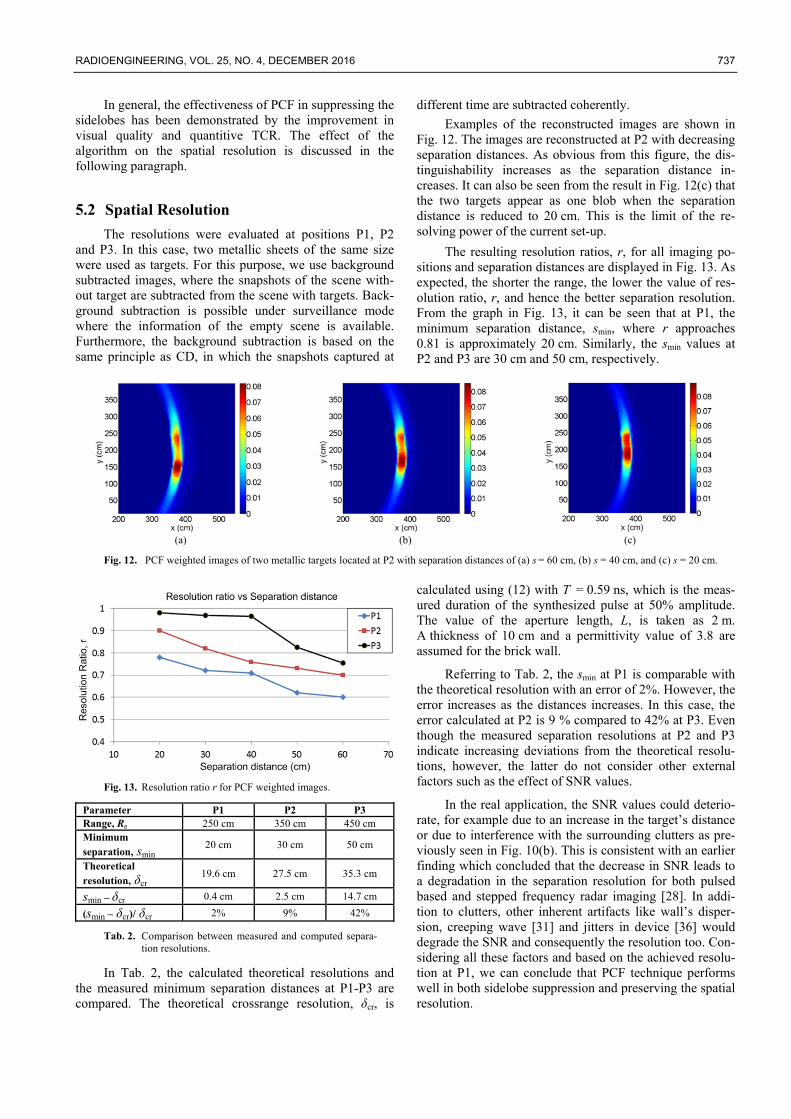
Examples of the reconstructed images are shown in Fig. 12. The images are reconstructed at P2 with decreasing separation distances. As obvious from this figure, the dis-tinguishability increases as the separation distance in-creases. It can also be seen from the result in Fig. 12(c) that the two targets appear as one blob when the separation distance is reduced to 20 cm. This is the limit of the re-solving power of the current set-up.
The resulting resolution ratios, r, for all imaging po-sitions and separation distances are displayed in Fig. 13. As expected, the shorter the range, the lower the value of res-olution ratio, r, and hence the better separation resolution. From the graph in Fig. 13, it can be seen that at P1, the minimum separation distance, smin, where r approaches 0.81 is approximately 20 cm. Similarly, the smin values at P2 and P3 are 30 cm and 50 cm, respectively.
(a) (b) (c)
Fig. 12. PCF weighted images of two metallic targets located at P2 with separation distances of (a) s = 60 cm, (b) s = 40 cm, and (c) s = 20 cm.
Fig. 13. Resolution ratio r for PCF weighted images.
Parameter P1 P2 P3 Range, Rp 250 cm 350 cm 450 cm Minimum separation, smin
20 cm 30 cm 50 cm
Theoretical resolution, δcr
19.6 cm 27.5 cm 35.3 cm
smin – δcr 0.4 cm 2.5 cm 14.7 cm
(smin – δcr)/ δcr 2% 9% 42%
Tab. 2. Comparison between measured and computed separa-tion resolutions.
In Tab. 2, the calculated theoretical resolutions and the measured minimum separation distances at P1-P3 are compared. The theoretical crossrange resolution, δcr, is
calculated using (12) with T = 0.59 ns, which is the meas-ured duration of the synthesized pulse at 50% amplitude. The value of the aperture length, L, is taken as 2 m. A thickness of 10 cm and a permittivity value of 3.8 are assumed for the brick wall.
Referring to Tab. 2, the smin at P1 is comparable with the theoretical resolution with an error of 2%. However, the error increases as the distances increases. In this case, the error calculated at P2 is 9 % compared to 42% at P3. Even though the measured separation resolutions at P2 and P3 indicate increasing deviations from the theoretical resolu-tions, however, the latter do not consider other external factors such as the effect of SNR values.
In the real application, the SNR values could deterio-rate, for example due to an increase in the target’s distance or due to interference with the surrounding clutters as pre-viously seen in Fig. 10(b). This is consistent with an earlier finding which concluded that the decrease in SNR leads to a degradation in the separation resolution for both pulsed based and stepped frequency radar imaging [28]. In addi-tion to clutters, other inherent artifacts like wall’s disper-sion, creeping wave [31] and jitters in device [36] would degrade the SNR and consequently the resolution too. Con-sidering all these factors and based on the achieved resolu-tion at P1, we can conclude that PCF technique performs well in both sidelobe suppression and preserving the spatial resolution.

738 N.S. NIK ANWAR, M. Z. ABDULLAH, SIDELOBE SUPPRESSION FEATURING THE PHASE COHERENCE FACTOR IN 3-D …
5.3 3-D TWRI Capability
Finally, to demonstrate the capability of the proposed technique in 3-D, the images corresponding to two metal sheets of different heights located at 2.5 m from the wall are reconstructed. The heights of the first and second metal sheets are 150 cm and 170 cm respectively. This experi-ment is repeated using a real human target with height 165 cm standing at 3 m from the wall. The results are shown in Fig. 14. In this case, the images are reconstructed in x-y, y-z and iso-surface planes. The iso-surface is gener-ated from the voxels with energy value 70% from the maximum energy. All are reconstructed using PCF weighted DAS. Again, the targets have been accurately localized as evident from Fig. 14(a)(i) and Fig. 14(b)(i). However, the heights are less accurately reconstructed, with absolute errors ranging from 20 to 30 cm as can be seen in Fig. 14(a)(ii). This is mainly due to the shorter aperture length in the vertical direction, and hence, limited resolution along the z-axis. Nevertheless, a close examina-tion of Fig. 14(a)(ii) reveals that it is possible to distinguish the two targets of different heights. A slight improvement in distinguishing the object based on height is visualized through the iso-surface image in Fig. 14(a)(iii). Meanwhile, the height profile of the human target produces an absolute error of 40 cm as can be seen in Fig. 14(b)(ii) and Fig. 14(b)(iii). The image appears noisy and cluttered. This
is due to the fact that average adult human poses a smaller radar cross section as compared to the metallic sheet. Also, both targets appear as though that they are in the air 50 cm above the floor. This artifact is due the characteristic of the biconical antennas in which the power in elevation plane decreases as the elevation angle increases. Therefore, the antenna is less sensitive to the reflection coming from the direction of the floor resulting in a reduced energy intensity at the lower edges.
6. Conclusions From the experimental results, it is evident that the
proposed technique is effective in suppressing the clutter due to the sidelobes arising from a sparse antenna array. The TCR value for the CD image has been significantly improved using PCF corrected beamformer outputs, thereby improving the localization of two closely located targets. Compared to conventional beamtapering tech-niques, PCF produces a better sidelobe suppression while preserving the spatial resolution. This is proven by the achieved separation resolution at a range of 2.5 m, which is comparable with the theoretical value. With the proposed technique, it is possible to perform 3D TWRI utilizing a sparse planar antenna array with reduced effect of the sidelobes.
(i)
(ii)
(iii)
(iv)
(a)
(i)
(ii)
(iii)
(iv)
(b)
Fig. 14. PCF reconstructions of (a) metallic, and (b) human targets (i) reconstructed images x-y plane, (ii) reconstructed images y-z plane, (iii) reconstructed images in iso-surface, and (iv) real images.
Acknowledgments This work is funded by USM research grant 6071222.
The first author acknowledges the Education Ministry of Malaysia and Universiti Teknikal Malaysia Melaka for scholarship.

RADIOENGINEERING, VOL. 25, NO. 4, DECEMBER 2016 739
References [1] INC, M. A. S. Through-the-Wall Sensors for Law Enforcement -
Market Survey. U.S Department of Justice, U.S2012.
[2] MANOLAKIS, D. G., INGLE, V. K., KOGON, S. M. Statistical and Adaptive Signal Processing: Spectral Estimation, Signal Modeling, Adaptive Filtering, and Array Processing. McGraw-Hill Boston, 2000.
[3] CAMACHO, J., PARRILLA, M., FRITSCH, C. Phase coherence imaging. IEEE Transactions on Ultrasonics, Ferroelectrics, and Frequency Control, 2009, vol. 56, no. 5, p. 958–974. DOI: 10.1109/TUFFC.2009.1128
[4] SCHWARTZ, J. L., STEINBERG, B. D. Ultrasparse, ultrawideband arrays. IEEE Transactions on Ultrasonics, Ferroelectrics, and Frequency Control, 1998, vol. 45, no. 2, p. 376–393. DOI: 10.1109/58.660149
[5] STEINBERG, B. D. Microwave Imaging with Large Antenna Arrays: Radio Camera Principles and Techniques. New York: Wiley-Interscience, 1983. 323 p. ISBN: 0471891738
[6] AMIN, M. G., AHMAD, F. Change detection analysis of humans moving behind walls. IEEE Transactions on Aerospace and Electronic Systems, 2013, vol. 49, no. 3, p. 1410–1425. DOI: 10.1109/TAES.2013.6557995
[7] MOULTON, J., KASSAM, S., AHMAD, F., et al. Target and change detection in synthetic aperture radar sensing of urban structures. In IEEE Radar Conference RADAR '08. Adelaide (Australia), 2008, p. 1–6. DOI: 10.1109/RADAR.2008.4721104
[8] LU, B., SUN, X., ZHAO, Y., et al. Phase coherence factor for mitigation of sidelobe artifacts in through-the-wall radar imaging. Journal of Electromagnetic Waves and Applications,2013, vol. 27, p. 716–725. DOI: 10.1080/09205071.2013.774111
[9] MARTONE, A., RANNEY, K., INNOCENTI, R. Automatic through the wall detection of moving targets using low-frequency ultra-wideband radar. In IEEE Radar Conference. Arlington (USA), 2010, p. 39–43. DOI: 10.1109/RADAR.2010.5494655
[10] AHMAD, F., AMIN, M. G., KASSAM, S. A. Synthetic aperture beamformer for imaging through a dielectric wall. IEEE Transactions on Aerospace and Electronic Systems, 2005, vol. 41, p. 271–283. DOI: 10.1109/TAES.2005.1413761
[11] WANG, W.-Q. Virtual antenna array analysis for MIMO synthetic aperture radars. International Journal of Antennas and Propagation, 2012, 10 p. DOI: 10.1155/2012/587276
[12] RALSTON, T. S., CHARVAT, G. L., PEABODY, J. E. Real-time through-wall imaging using an ultrawideband multiple-input multiple-output (MIMO) phased array radar system. In 2010 IEEE International Symposium on Phased Array Systems and Technology (ARRAY). Boston (USA), 2010, p. 551–558. DOI: 10.1109/ARRAY.2010.5613314
[13] LIAO, C.-H., CHANG, D.-C. A large aperture UWB antenna array for real beam radar imaging. International Journal of Antennas and Propagation, 2012, 7 p. DOI: 10.1155/2012/639603
[14] BROWNE, K. E., BURKHOLDER, R. J., VOLAKIS, J. L. Through-wall opportunistic sensing system utilizing a low-cost flat-panel array. IEEE Transactions on Antennas and Propagation, 2011, vol. 59, no. 3, p. 859–868. ISSN: 0018-926X. DOI: 10.1109/TAP.2010.2103015
[15] VERMA, P. K., GAIKWAD, A. N., SINGH, D., et al. Analysis of clutter reduction techniques for through wall imaging in UWB range. Progress In Electromagnetics Research B, 2009, vol. 17, p. 29–48. DOI: 10.2528/PIERB09060903
[16] RIAZ, M. M., GHAFOOR, A. Principle component analysis and fuzzy logic based through wall image enhancement. Progress In Electromagnetics Research, 2012, vol. 127, p. 461–478. DOI: 10.2528/PIER12012702
[17] YOON, Y.-S., AMIN, M. G. Spatial filtering for wall-clutter mitigation in through-the-wall radar imaging. IEEE Transactions on Geoscience and Remote Sensing, 2009, vol. 47, no. 3, p. 3192 to 3208. DOI: 10.1109/TGRS.2009.2019728
[18] LIANLIN LI., WENJI ZHANG, FANG LI. A novel autofocusing approach for real-time through-wall imaging under unknown wall characteristics. IEEE Transactions on Geoscience and Remote Sensing, 2010, vol. 48, no. 1, p. 423–431. DOI: 10.1109/TGRS.2009.2024686
[19] AHMAD, F., AMIN, M. G. Multi-location wideband synthetic aperture imaging for urban sensing applications. Journal of the Franklin Institute, 2008, vol. 345, no. 6, p. 618–639. DOI: 10.1016/j.jfranklin.2008.03.003
[20] YOON, Y.-S., AMIN, M. G., AHMAD, F. MVDR beamforming for through-the-wall radar imaging. IEEE Transactions on Aerospace and Electronic Systems, 2011, vol. 47, no. 1, p. 347 to 366. DOI: 10.1109/TAES.2011.5705680
[21] HOOI BEEN LIM, NGUYEN THI TUYET NHUNG, ER-PING LI, et al. Confocal microwave imaging for breast cancer detection: Delay-multiply-and-sum image reconstruction algorithm. IEEE Transactions on Biomedical Engineering, 2008, vol. 55, no. 6, p. 1697–1704. DOI: 10.1109/TBME.2008.919716
[22] HOLLMAN, K. W., RIGBY, K. W., O'DONNELL, M. Coherence factor of speckle from a multi-row probe. In Proceedings of 1999 IEEE Ultrasonics Symposium. Caesars Tahoe (USA), 1999, vol. 2, p. 1257–1260. DOI: 10.1109/ULTSYM.1999.849225
[23] BURKHOLDER, R. J., BROWNE, K. E. Coherence factor enhancement of through-wall radar images. Antennas and Wireless Propagation Letters, 2010, vol. 9, p. 842–845. DOI: 10.1109/LAWP.2010.2069078
[24] ANWAR, N. S. N., ABDULLAH, M. Z. Clutter suppression in through-the-wall radar imaging using enhanced delay-and-sum beamformer. In Proceedings of the IEEE International Conference on Imaging Systems and Techniques (IST). Santorini (Greece), 2014, p. 179–183. DOI: 10.1109/IST.2014.6958469
[25] ANWAR, N. S. N., ABDULLAH, M. Z. Three dimensional through-the-wall imaging using ultrawideband (UWB) sensors with enhanced delay-and-sum algorithm. In The 8th International Conference on Robotic, Vision, Signal Processing & Power Appli-cations. Chapter 48 in Lecture Notes in Electrical Engineering, vol. 291, p. 419–425. Eds. H. A. Mat Sakim and M. T. Mustaffa. Singapore, 2014. DOI: 10.1007/978-981-4585-42-2_48
[26] CAMACHO, J., FRITSCH, C. Adaptive Beamforming by Phase Coherence Processing. INTECH Open Access Publisher, 2011.
[27] LIN, S., YANG, S., FATHY, A. E., et al. Development of a novel UWB Vivaldi antenna array using SIW technology. Progress In Electromagnetics Research, 2009, vol. 90, p. 369–384. DOI: 10.2528/PIER09020503
[28] TIANG, S. S., SADOON, M., ZANOON, T. F., et al. Radar sensing featuring biconical antenna and enhanced delay and sum algorithm for early stage breast cancer detection. Progress In Electromagnetics Research B, 2012, vol. 46, p. 299–316. DOI: 10.2528/PIERB12102201
[29] BUONANNO, A., D’URSO, M., PRISCO, G., et al. A new measurement method for through-the-wall detection and tracking of moving targets. Measurement, 2013, vol. 46, no. 6, p. 1834–1848. DOI: 10.1016/j.measurement.2012.12.021
[30] SOLDOVIERI, F., SOLIMENE, R., PIERRI, R. A simple strategy to detect changes in through the wall imaging. Progress In Electromagnetics Research M, 2009, vol. 7, p. 1–13. DOI: 10.2528/PIERM09030902
[31] AHMAD, F., FRAZER, G. J., KASSAM, S. A., et al. Design and implementation of near-field, wideband synthetic aperture beam-formers. IEEE Transactions on Aerospace and Electronic Systems, 2004, vol. 40, p. 206–220. DOI: 10.1109/TAES.2004.1292154
740 N.S. NIK ANWAR, M. Z. ABDULLAH, SIDELOBE SUPPRESSION FEATURING THE PHASE COHERENCE FACTOR IN 3-D …
[32] GILMORE, C., MOJABI, P., ZAKARIA, A., et al. On super-resolution with an experimental microwave tomography system. IEEE Antennas and Wireless Propagation Letters, 2010, vol. 9, p. 393–396. DOI: 10.1109/LAWP.2010.2049471
[33] SKOLNIK, M. I. Introduction to Radar. Vol. 2, 1962.
[34] HUSSAIN, M. G. Ultra-wideband impulse radar - an overview of the principles. IEEE Aerospace and Electronic Systems Magazine, 1998, vol. 13, no. 9, p. 9–14. DOI: 10.1109/62.715515
[35] MAILLOUX, R. J. Phased Array Antenna Handbook. Boston: Artech House, 2005. ISBN-13: 978-1580536899
[36] ZHU, G., HU, J., JIN, T., ZHOU, Z. Effect and compensation of timing jitter in through-wall human indication via impulse through-wall radar. Radioengineering, 2014, vol. 23, no. 1, p. 20 to 29.
About the Authors... N. S. N. ANWAR received his B.Sc and M.Sc in Germany, from FH Heilbronn in 2006 and FH Aachen in 2010, re-spectively. He is affiliated to Universiti Teknikal Malaysia Melaka, UTeM as a lecturer and currently doing intensive
research on through-wall imaging for his Ph.D. at Univer-siti Sains Malaysia, USM.
M. Z. ABDULLAH graduated from University Sains Ma-laysia (USM) with a B. App. Sc. degree in Electronic in 1986 before joining Hitachi Semiconductor as a Test Engi-neer. In 1989 he commenced an MSc in Instrument Design and Application at UMIST. He remained in Manchester conducting research in Electrical Impedance Tomography at the same university, and received his PhD degree in 1993. He joined USM in the same year. His research inter-ests include microwave tomography, digital image pro-cessing, computer vision and ultrawideband sensing. He has published numerous research articles in international journals and conference proceedings. One of his papers was awarded The Senior Moulton medal for the best article published by the Institute of Chemical Engineering in 2002. From 2006 to 2015, he was a professor and a dean of the USM’s School of Electrical and Electronic Engineer-ing. Currently he is a director of the Collaborative Micro-electronic Excellence Design Centre (CEDEC).