CWEEL, University and Business Showcase Panels - Leaders ...
Upload
khangminh22Category
view
2download
0
water
Article
A Framework for Sustainable Planningand Decision-Making on Resource Recoveryfrom Wastewater: Showcase for São Paulo Megacity
Mariana C. Chrispim 1,2 , Fernanda de M. de Souza 2, Miklas Scholz 1,3,4,*and Marcelo A. Nolasco 2
1 Division of Water Resources Engineering, Faculty of Engineering, Lund University, John Ericssons väg 1,P.O. Box 118, 22100 Lund, Sweden; [email protected]
2 School of Arts, Sciences and Humanities, University of São Paulo, Arlindo Bettio Avenue 1000,São Paulo 03828-000, Brazil; [email protected] (F.d.M.d.S.); [email protected] (M.A.N.)
3 Department of Civil Engineering Science, School of Civil Engineering and the Built Environment,University of Johannesburg, Kingsway Campus, P.O. Box 524,Auckland Park 2006, Johannesburg, South Africa
4 Civil Engineering Research Group, School of Science, Engineering and Environment, The University ofSalford, Newton Building, Peel Park Campus, Salford M5 4WT, UK
* Correspondence: [email protected]; Tel.: +46-703-435-270
Received: 30 October 2020; Accepted: 2 December 2020; Published: 9 December 2020�����������������
Abstract: Currently, it is important to develop strategic frameworks to support the selectionof sustainable resource recovery solutions. This study applies a new framework for planning,implementation, and assessment of resource recovery strategies for a full-scale wastewater treatmentplant (WWTP) in São Paulo megacity. The framework comprises several steps based on casestudy-specific data and information from current literature. Data were collected from various sources:a survey with a wastewater treatment utility, national and regional databases, and review of localregulations and international literature. Treatment configuration, wastewater and by-productscomposition, potential demand (for water, energy, and phosphorus), stakeholder identification,and local legislation were thoroughly discussed regarding decision-making on resource recovery.Scenario analysis was used to explore suitable nutrient and energy recovery measures based onindicators. Biogas recovery and sewage sludge composting showed more favorable conditions dueto similar experiences in the area and robust legislation. The proposed framework is a simplifiedtool, and its application can support managers to get information on resource recovery and how toplan such initiatives in easier ways to facilitate wiser decision-making, and better operation andmanagement. The results on framework use and refinement can guide potential applications in othercontexts and stimulate public policy formulation and further research.
Keywords: decision-support system; resource-oriented sanitation; sewage; integrated process;water–energy–food nexus; dense urban areas; developing countries; energy recovery
1. Introduction
The scarcity of natural resources is a driver for initiatives of resource recovery and reuse, byproducing biogas, fertilizer, and water that can be returned to the market. Recovering valuablecompounds of municipal wastewater includes several important aspects for the planning process,decision-making, and implementation.
Due to the increase of global urbanization, cities are special places for recovery of resources,and wastewater treatment plants (WWTP) are sites where such processes can take place. Wastewater
Water 2020, 12, 3466; doi:10.3390/w12123466 www.mdpi.com/journal/water
Water 2020, 12, 3466 2 of 35
treatment facilities are part of the cities’ metabolism and the local region; thus, resource recoveryprocesses should be planned in an integrated way. For instance, how the treatment plant couldcontribute with potential resources to the local industries clusters or agriculture. WWTP should beintegrated within the local community and economic activities [1]. Thus, cities have great potential tosupport the progress towards regional sustainable development [2].
Sustainable Development Goal 11 focuses on making cities inclusive, safe, resilient, and sustainable,and with the inclusion of policies and plans towards resource efficiency, and by 2030, to reduce theadverse environmental impacts of cities with particular attention to waste management [3]. In thiscontext, cities require efficient management of natural resources in the face of growing demands andchanging environmental conditions [4].
The incorporation of resource recovery solutions (e.g., water reuse, nutrient and energy recovery)can improve the overall performance of WWTP [5] and contribute to the circular economy in wastewatertreatment and urban sustainability [6]. The benefits provided by resource recovery implementation arehigher in areas that face stress and low availability or high consumption of resources (e.g., water) [7].Conservation of water resources should be a priority especially for megacities in developing countries,which face water shortages, water pollution, lack of infrastructure and public services, and a lackof provision of clean water and safe disposal of wastewater and stormwater [8,9]. Megacities,where large WWTP are usually in operation, can improve resource recovery with economic efficiencyand profitability while generating environmental benefits such as improvement of surface water qualityand mitigation of eutrophication issues [10,11].
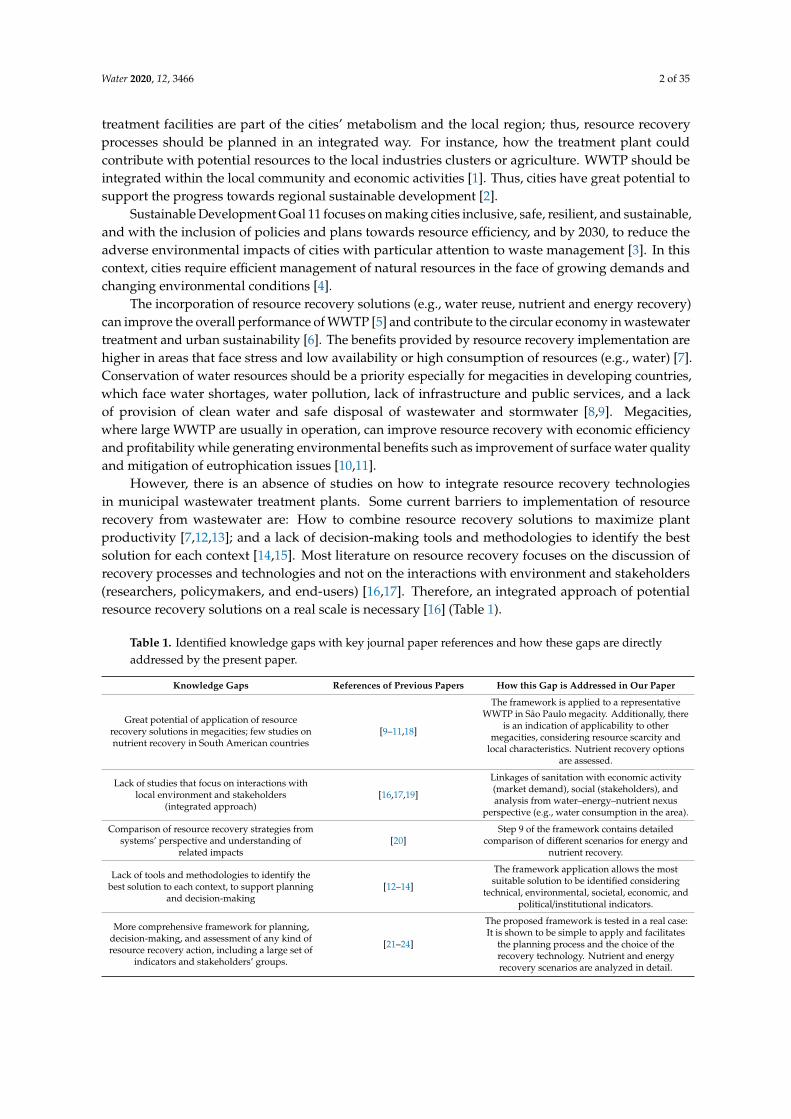
However, there is an absence of studies on how to integrate resource recovery technologiesin municipal wastewater treatment plants. Some current barriers to implementation of resourcerecovery from wastewater are: How to combine resource recovery solutions to maximize plantproductivity [7,12,13]; and a lack of decision-making tools and methodologies to identify the bestsolution for each context [14,15]. Most literature on resource recovery focuses on the discussion ofrecovery processes and technologies and not on the interactions with environment and stakeholders(researchers, policymakers, and end-users) [16,17]. Therefore, an integrated approach of potentialresource recovery solutions on a real scale is necessary [16] (Table 1).
Table 1. Identified knowledge gaps with key journal paper references and how these gaps are directlyaddressed by the present paper.
Knowledge Gaps References of Previous Papers How this Gap is Addressed in Our Paper
Great potential of application of resourcerecovery solutions in megacities; few studies onnutrient recovery in South American countries
[9–11,18]
The framework is applied to a representativeWWTP in São Paulo megacity. Additionally, there
is an indication of applicability to othermegacities, considering resource scarcity and
local characteristics. Nutrient recovery optionsare assessed.
Lack of studies that focus on interactions withlocal environment and stakeholders
(integrated approach)[16,17,19]
Linkages of sanitation with economic activity(market demand), social (stakeholders), andanalysis from water–energy–nutrient nexus
perspective (e.g., water consumption in the area).
Comparison of resource recovery strategies fromsystems’ perspective and understanding of
related impacts[20]
Step 9 of the framework contains detailedcomparison of different scenarios for energy and
nutrient recovery.
Lack of tools and methodologies to identify thebest solution to each context, to support planning
and decision-making[12–14]
The framework application allows the mostsuitable solution to be identified considering
technical, environmental, societal, economic, andpolitical/institutional indicators.
More comprehensive framework for planning,decision-making, and assessment of any kind ofresource recovery action, including a large set of
indicators and stakeholders’ groups.
[21–24]
The proposed framework is tested in a real case:It is shown to be simple to apply and facilitates
the planning process and the choice of therecovery technology. Nutrient and energyrecovery scenarios are analyzed in detail.

Water 2020, 12, 3466 3 of 35
Decision-making on urban water infrastructure projects is complex, since it should consider theinteractions between infrastructure (e.g., technological options), environmental, institutional, economic,and social characteristics [19]. Several decision-making parameters can be evaluated to choose theoptimum recovery technology such as costs (capital and operational expenditures), recovery rate (%),environmental impacts (heavy metals and organic contaminants), wastewater composition, and marketfor the recovered product (e.g., phosphate fertilizer) [25]. These parameters should be considered asearly as possible, such as at the design stage [23].
Local context characteristics should be carefully examined and considered in the planning processfor resource recovery [7,26]. Especially in developing countries, there is insufficient planning toinclude efficient sanitation systems [27]. Many technical options are available to recover resources fromwastewater and sludge; however, some technologies might not be suitable for developing countries,because of the costs and requirements on treatment processes and energy demand [28].
Besides the costs, local legislation can also influence the selection of resource recovery measures [14].In some cases, legislation can act as a barrier and changes are required, while in others legislationand standards can be drivers for resource recovery implementation. Then, identifying legal andinstitutional challenges related to resource recovery can assist in the planning of wastewater treatmentplants to support strategic decisions.
It is important to develop strategic frameworks to support society (policymakers and generalpublic) in the selection of resource recovery solutions, such as sustainable options for sewage sludgemanagement [22,29]. According to Romeiko [20], it is necessary to compare environmental performancesof resource recovery-based wastewater treatment plants to support the design and implementation ofresource recovery strategies from system perspectives. This comparison can include several indicators.As a result, a better understanding of resource recovery technologies will allow for the design of futuresystems [30].
A proposed framework as a tool to stimulate/support planning and decision-making on resourcerecovery from wastewater treatment was presented by Chrispim et al. [31]. As the next step, thispaper presents how this framework can be applied, offers significant suggestions for improvement,and addresses research gaps in the field (Table 1). The aim was to showcase the new frameworkfor planning, implementation, and assessment of resource recovery strategies for a representativeWWTP. The specific objectives were to apply all the steps of the proposed framework to supportdecision-making on resource recovery strategies; to recommend operational and technological strategiesof resource recovery (nutrients and energy) to be applied in this representative facility, consideringeconomic, technical, environmental, societal, and political indicators; and to identify strengths andpotential improvements of the framework.
In this paper, the case study was a large WWTP in São Paulo megacity and the authorsidentified current practices and opportunities for improvement of this facility, including processesand technologies for resource recovery. Based on real data from a practice system, it was possible topropose innovations, and to support the implementation of new strategies and more effective solutionsfor resource recovery from wastewater. Understanding and testing the framework application was animportant task to prioritize future data collection efforts.
The results could contribute to the creation of technical and scientific knowledge and a betterunderstanding of planning, retrofitting, and upgrading of municipal WWTP with resource recovery, andto support the development of public policies or regional programs in this area. Wider applicability ofthe results for other cities is suggested for better wastewater management practices and for supportingresource recovery implementation. Through the framework application, it is possible to address whatneeds to change to achieve or optimize the resource recovery initiatives. Some key questions addressedin our paper are: What resources are available in the waste streams in the studied plant; what marketdemand there might be for them; how they could be recovered; what the linkages with local legislationare; and who the key stakeholders are.

Water 2020, 12, 3466 4 of 35
2. Methods
2.1. Developed Framework
The methodology applied in this paper was based on a framework developed to supportthe planning and decision processes about resource recovery strategies in wastewater treatmentplants [31]. In the cited paper, the framework was just outlined (briefly introduced). The present papercontains novel aspects: The first application in a real situation, suggestions of improvements andnew arrangements of the framework, potential impact of its application in world’s megacities, andestimation of potential resource recovery solutions for the study region. The framework (Figure 1) wasapplied in a case study of a wastewater treatment plant in the São Paulo megacity (or the metropolitanregion of São Paulo). Wider applicability of the framework is suggested in Table 2.
Figure 1. Framework applied in this study (adapted from [31]).
Table 2. Indication of the framework applicability in megacities similar to São Paulo (New York isshown for comparison purposes).
Megacity Level ofApplicability
ReliabilityLevel
Similarityof
WastewaterTreatment
Characteristics
Demand forPotentialResources
WaterDemand;
Water Scarcity
EnergyDemand
PhosphorusDemand
ExpectedImpact of
FrameworkApplication
São Paulo high high high high high high medium highMexico City high medium high high high high medium highJohannesburg high medium high high high high low medium
Cairo medium medium medium medium high low low highChengdu medium low low medium medium high low mediumShanghai medium low medium medium high medium low medium
Delhi high low high high high high high highNew York low medium high low low medium low low
Notes: Based on expert’s judgement of the authors (after consulting with local experts in the area and urbansustainability indexes; Sustainable Cities Water Index [32], Blue City Index [33], and SDEWES Index [34]).The assessment considered not only the demand (and use) for water, energy, and phosphorus, but also if there hasbeen an increase in the resource consumption (e.g., electricity), its current availability, and if it represents a key issuefor the city. São Paulo, Mexico City, Cairo, and Delhi refer to their metropolitan areas, Johannesburg, Chengdu,and New York to urban agglomerations, and Shanghai is the city proper (based on classification from the UnitedNations [35]).

Water 2020, 12, 3466 5 of 35
2.2. Studied WWTP
The information regarding the plant was gathered with the support of the São Paulo State WaterSupply and Sewerage Company (SABESP), who owns and operates this facility. The wastewatertreatment plant ABC is located in São Paulo city (23◦36′41.58′’ S and 46◦35′9.24′’ W) (Figure 2).This facility treats sewage from six cities, totalizing an approximate population equivalent of1.4 million inhabitants.
Figure 2. Map of the study area.
This plant started up in 1998, with a maximum treatment capacity of 3 m3/s, and it is foreseento increase this capacity (Section 3.1.1). The mean wastewater inflow rate was 2.33 m3/s during theanalyzed period (07/2016 to 06/2017). The treatment processes for liquid and solid phases are illustratedin Figure 3. A detailed description of treatment stages is given in Section 3.1.1. Detailed informationabout the study area is presented in Section 3.1.2.
Figure 3. Diagram of the wastewater treatment plant ABC with all the treatment processes and flows.Notes: Wide arrows: Liquid state; dashed arrows: Solid state; thin arrows: Gaseous state. On the final

Water 2020, 12, 3466 6 of 35
arrows that do not have continuity in another unit operation: Final effluent, part is discharged in theriver, part is conducted to a non-potable water reservoir, and part is sent to the Aquapolo Project;scum from settling tanks is conducted to digesters or disposed in landfill.
The motivation for the choice of this plant was based on the availability of data, its completeness,representativeness (in terms of scale, treatment flow, and treatment processes compared to otherlarge-scale WWTPs of São Paulo megacity), and because this plant already applies one measure ofresource recovery: Water reuse. It is noted that Cornejo et al. [36] also used similar criteria to chooseWWTP in their study.
2.3. Data Collection for Application of The Framework in the Case Study
The input data to achieve steps 1, 3, and 4C of the framework (treatment configuration; qualitativeand quantitative characterization of effluent and by-products; and identification of internal demand)were obtained with the managers and engineers of the plant (WWTP ABC). For this, a list of thenecessary primary data (general data, characteristics of the treatment processes used, monitoring data,by-products, and environmental indicators) was prepared (Supplementary Material S1).
For characterization purposes (step 3), the substances considered for analysis were: Water,phosphorus, nitrogen, and organic matter. The water (treated effluent, reclaimed water, and waterconsumed by the WWTP) represents a relevant local resource for the context of the study area.Phosphorus (P) is a resource that is globally limited, and it presents actual scale recovery processesimplemented in several countries where it is considered economically viable. In addition, P canbe recovered from different units of wastewater treatment processes. Nitrogen is an importantconstituent (in quantitative terms) of municipal sewage, as well as P, and has potential as fertilizer.Organic matter is source for recovery of many products (e.g., energy from biogas and soil conditioner).Further information on research design is presented in the Supplementary Material S2 (2A).
The temporal boundary of the analysis comprised a period of one year (from 07/01/2016 to06/30/2017). The definition of this period followed the recommendation of Brunner and Rechberger [37],and it was considered a reasonable period to determine reliable average values, since the period shouldbe enough to counterbalance momentary instabilities of the analyzed system and seasonal variations.The analysis included all processes and unit operations of the WWTP ABC from the arrival of rawwastewater until the discharge of treated effluent (Figure 3).
The data to achieve the other steps of the framework were collected from various sources,consulting the related legislations on water reuse, sludge recycling (in the form of organic fertilizerand soil conditioner) and energy recovery, technical reports, regional databases, journal articles,and planning documents for the study area. For step 4, in order to complement the data (estimatedvolume and price of reclaimed water for non-potable uses in urban areas), we contacted the plantmanagers of WWTP that commercialize reclaimed water and the responsible secretaries of the citycouncil of study area cities.
The comparison of recovery technologies options (step 9) considered evidence from the literatureabout the respective technologies. Scenario analysis was used to explore some possible resourcerecovery measures for the studied plant. Detailed information for each attribute/indicator can be foundin the Supplementary Material S3.
2.4. Data Analysis
After data collection, both qualitative and quantitative data were organized into data spreadsheetsfor comparison purposes. Based on the collected raw data about the plant, mean concentrations,organic and nutrient loads, and removal efficiencies for the main parameters chemical oxygen demand(COD), biochemical oxygen demand (BOD), nitrogen (N) and P were calculated. In general, the resultswere represented as tables and graphs. The final step was the comparison between the recovery optionsaccording to the indicators. The outlook (recovery scenarios) was a result of the different assessmentindicators given in this work (educated guesses) and based on the literature.

Water 2020, 12, 3466 7 of 35
3. Results and Discussion
3.1. Application of the Proposed Framework for Resource Recovery in a WWTP in São Paulo Megacity
The results are organized and discussed according to each step of the proposed framework.Further information on each step is in Supplementary Material S2B–H.
3.1.1. Step 1—Existing Treatment Configuration
The first step of the framework included liquid and solid phases and the analysis of all theexisting treatment units in the plant (Figure 3) as well as the expected upgrades for this facility.Detailed characteristics of all treatment units are summarized in Supplementary Material S2B.
Future upgrades of the studied plant are changes to increase its treatment capacity. The expectedupgrades are to increase to 6 m3/s, and a further stage to upgrade the settling tanks to increase thetreatment capacity to 8.5 m3/s. Currently, it is foreseen that there will be an increase of the treatmentcapacity to 4 m3/s in 2023. It is important to take it into account when planning resource recoverystrategies since the increase of the plant’s capacity will imply increase of generated by-products(e.g., sludge) and will have effects on characterization (effluent and sludge quality).
3.1.2. Step 2—The Surrounding Areas of the WWTP
Understanding the local context is a crucial step to support future decisions about which resource(s)to recover. Firstly, we defined the area nearby the WWTP. The named group 1 includes the municipalitiesof the Great ABC Region (Santo Andre, São Bernardo do Campo, São Caetano do Sul, Diadema, Maua,Ribeirao Pires, and Rio Grande da Serra) and São Paulo city. Furthermore, a broader area (group 2)was considered, including four other municipalities of the metropolitan region of São Paulo (MRSP)(Biritiba-Mirim, Mogi das Cruzes, Salesópolis, and Suzano) due to their importance to agriculturalactivity (high values added to agriculture among the cities of the MRSP). Figure 2 shows the studyarea, comprising cities of groups 1 and 2. The main economic sectors correspond to those with thehighest contribution to gross domestic product in the study region (groups 1 and 2). Figure 4 showsthe distribution of the main economic activities in terms of the number of facilities in the study region.
Figure 4. Predominance of agricultural and industrial activities in the surrounding area of thewastewater treatment plant. Notes: (a) Based on the Brazilian Institute of Geography and Statistics(IBGE) [38]; data refer to 2017; (b) it includes planted and native forests; (c) based on [39]; data referto January to September of 2019; the automobile sector is not included. Other sectors were notincluded because they are not highlighted in the Great ABC region [40]. Other sectors correspondto the mechanical industry; electrical and communications industry; transport material industry;wood and furniture industry; paper, cardboard, editorial, and graphic industry; and footwear industry(23,390 facilities in total); (d) manufacturing of materials such as cement; (e) industries such aspharmaceutical, veterinary, perfumery, and others; (f) smoke, leather, fur, and similar industries.
Water 2020, 12, 3466 8 of 35
In the group 1 region, there is a predominance of processing industries and other services(transport, post office; accommodation and food; information and communication; private education;health; among others) [41]. The main processing industries are automobile industries, chemicalindustries, metallurgy industries, rubber and plastic production, food industries, and textile [40].
Agriculture and livestock are not significant economic activities in the group region 1. Nevertheless,in the small city of Rio Grande da Serra, there is considerable agricultural activity (fruit and vegetableproduction and farms for chicken production) [42]. In quantitative terms, there are 5064 unitsconsidering agriculture, forestry, plant extractivism, and livestock in group 2 (considering the12 municipalities) [39]. It is worth adding that in the rural zone of São Paulo city, there are about428 units of agricultural production, particularly in the southern region, for fruit, ornamental, and leavecrops [43].
In the analyzed region (group 2), the quantity of settlements is higher in horticulture andfloriculture [38]. In addition, there are initiatives such as: Urban agriculture programs in Diademaand Santo Andre, community gardens in São Paulo city [44], and vertical farming. The products ofhorticulture in the region are diverse, but the crops linked to the highest number of farms are lettuce,cabbage, and coriander [45]. Therefore, this diagnostic (step 2) can support the identification of thelocal area needs and the potential demand for resources that could be recovered by the studied WWTP,which is discussed in step 4.
3.1.3. Step 3—Qualitative and Quantitative Characteristics of the Treated Effluent and by-Products
This step allows for the support of decisions on what recovery measures would be feasible fora specific facility. It is possible to identify resources that are present in which treatment stages andin what quantities. The analysis was based on the volumes of wastewater, consumption of inputs,and generation of waste in the period of one year. All treatment processes are summarized in Figure 3.
Regarding quantitative data, the average daily raw wastewater flow rate that entered the plantwas 2.33 m3/s. The total volume of the raw wastewater inflow rate during the analyzed period was73,720,195 m3 and the total volume of treated effluent was 71,266,865 m3 per annum. Part of the treatedeffluent by the plant was discharged into the river nearby, another part was directed to the AquapoloProject (423 L/s during the monitored period), and a third part went to an internal reclaimed waterfacility. This reclaimed water was used internally for washing of streets and installations, sealing ofpumps, cooling equipment, and foam breaking.
The Aquapolo Project is the largest wastewater reuse facility in the southern hemisphere, and thefifth largest of its kind in the world. In the Aquapolo Project, the advanced treatment processes usedare disk filters (400 microns), membrane bioreactor (0.05 microns), and reverse osmosis [46]. After thistreatment, the reclaimed water is pumped to a Petrochemical Complex, mainly for cleaning of coolingtowers and boilers [46]. The current capacity is to provide up to 650 L/s of water to the industrialcomplex [47].
Steps 3B and 3C (Figure 1) comprise the qualitative monitoring of the treated effluent and theby-products (Tables 3 and 4) to identify potential resources to be recovered. The removed grit andscreening material are currently sent to landfills. The annually removed amount was about 765,755 kgof grit and 152,641 kg of screening material. The generation of screening material was 2.07 kg per1000 m3 of raw wastewater (plant influent) and 10.38 kg of grit per 1000 m3. The generation of screeningmaterial was lower than the findings of a previous study [48]: Average of 6 kg per 1000 m3, but inother WWTP in the São Paulo state. It is worth noting that the data on generated screening materialand grit (of our studied plant) were underestimated due to maintenance of the equipment during partof the monitored period, which can explain the lower value.

Water 2020, 12, 3466 9 of 35
Table 3. Quantitative data of by-products of the wastewater treatment plant (WWTP) andpotential resources.
Unit Material Quantity b Unit Resources with Potentialto be Recovered
Screening Screening material a 554.55 kg/day Energy
Grit chamber Grit 3175 kg/day Grit
Primary settling Sludge 1093.8 m3/day Energy
Scum 0.864 m3/day Energy
Secondary clarifier Sludge - - -
Scum 9.09 m3/day Energy
Gravity thickenersFlotation thickeners
Thickened sludge 748.7 m3/day Nutrients
Thickened sludge 250.36 m3/day Nutrients
Digesters Digested sludge 1215.75 m3/day Nutrients
Biogas 3036 c Nm3/day Energy
Chemical conditioningand dewatering of
sludge
Digested and driedsludge 112.9 ton/day Fertilizer (P or biosolids)
Energy
Notes: a It includes screening with fine, medium, and course screens; b data referring to the period between 1 July2016 and 30 June 2017; for grit and screening material quantities there were missing data for some months due tomaintenance; and c data from December 2017. Cells with “-”: data not available or not measured by the wastewatertreatment plant operators.
Table 4. Mean concentration of main parameters at different sampling points.
Parameter Influent (RawWastewater) a
Final Effluent(Treated) b
Thickeners(by Gravity)Supernatant
Thickeners(by Flotation)Supernatant
DewateringCentrate
COD (mg/L) 462.2 66.0 6970.0 118.3 1250.0
Dissolved COD(mg/L) 124.8 83.3 - - -
BOD5,20 241.0 30.3 - - -
Total Phosphorus(mg/L) 14.8 3.9 23.9 3.8 6.1
Dissolvedphosphorus (mg/L) 2.4 1.8 10.0 2.1 4.4
Total nitrogen(mg/L) 33.2 25.1 - - -
Notes: a Sampling point located at the entrance of the ABC WWTP (before grit chamber); b effluent of secondaryclarifier. “-”: data not available due to no measurement.
The total amount of produced dewatered sludge (or biosolids, which refer to stabilized sewagesludge) was 41,190 tons in the analyzed period (one year). The WWTP ABC had higher sludgeproduction compared to a similar study [49], which obtained 2894 tons annually of biosolids producedin a WWTP in USA with a flow rate of 0.541 m3/s using activated sludge process. However, it isemphasized that the amount of sludge produced depends on the treatment flow rate, the treatmentprocesses used, and the composition of sewage.
In the anaerobic digestion of sewage sludge (of WWTP ABC), the mean biogas compositionwas 69.79% of CH4 (methane), 27% of CO2 (carbon dioxide), 2.7% of N2 (nitrogen), 0.59% of O2
(oxygen), and <30 ppm of H2S (hydrogen sulfide). The methane production was about 2118.8 Nm3/day.Estimates regarding electric power generation from methane production are discussed in Section 3.1.7.
In the studied plant, the removal efficiencies were: 85.7% COD, 24.5% total N, and 73.5% total P.The COD load was 93,350 kg/day. The total P load that entered the plant during the analyzed periodwas 2997 kg/d, which totalized around 1094 tons/year. The total N load that entered the WWTP ABCwas 6707 kg/day, or 2448 tons/year. Considering that 73.5% of the P total load was removed by the

Water 2020, 12, 3466 10 of 35
studied plant, which ended up in the sewage sludge, the content of P was estimated to be around2.2 tons P per day in the sludge.
Analyzing the waste stream composition is essential to the selection of suitable resource recoverytechnologies. Different technologies may have strengths and weaknesses in targeting specificwastewater components [23]. Data for P concentration (Table 4) in secondary streams allow fortechnology options for recovery to be defined. The highest P concentration was observed in thesupernatant from the gravity thickeners. There was no monitoring of P concentration in the supernatantof digesters. In the case where the nutrient concentration was below 20 mg/L, it was recommendedto apply accumulation techniques such as: Wetland or microalgae cultivation, and physicochemicaltreatment [50]. There was no monitoring for nutrient content in sludge for the studied facility. However,a recent study [51] reported the mean value of 16.4 ± 2.1 (g P/kg of dewatered sludge) for the studiedplant (ABC).
Characterization of influent and effluent quality of WWTP provided useful information fordesigning strategies and selecting processes for resource recovery [5,52]. The next steps aimed to guideon how the WWTP could be improved, defining strategies for recovering resources.
3.1.4. Step 4—Mapping the Demand for Recovered Resources
This step aimed to identify the needs for resources (water, nutrient, and energy) in the local contextas well as potential customers (e.g., industries, farmers, and households) for recovered products.Consumption of water, electricity, and fertilizers in the surrounding area and internally in the plant ispresented in Table 5.
Table 5. Estimated demand for the wastewater treatment plant and nearby locations for resources.
Demand Sector Water (m3/month)Electricity
(kWh/month)Fertilizer P2O5
(kg)
External
Processingindustries
1,124,786 (food andbeverage); 1,020,714(chemical); 436,314
(textile); 367,722(metallurgy); 247,293
(rubber); 206,790(non-metallic mineralproducts); and 168,714
(automobile) a
50,450 e -
Agriculture 761,271 b - 132,139 g;93,961 h
Urban purposes 5450 c
222 (households),23,210 (publiclighting), 2352(stores/shops) f
-
Internal WWTP analyzed 6622 d 2,598,708 -
Notes: a Based on [53], referring to 2015 and the study region (12 municipalities), considering only predominantindustrial sectors; b data refer to 2015; based on [54] (data not available for four cities without predominantagricultural practices); c data from [55]; referring to November 2019; d potable water consumption (June 2016 toJuly 2017); e mean consumption per industry in São Caetano do Sul city; for all types of industries [56]; f meanconsumption per unit in São Caetano do Sul city [56]; g total fertilizer sold per planted area in the study area (datanot available for five cities, which do not have predominant agriculture activity); based on [57] referring to 2014;h total fertilizer used in the studied area (data not available for five cities as mentioned) based on [58], referring to2015, planted area obtained from [59] and referring to 2016; “-” not applicable.
In Brazil, the highest water demand from industries is in São Paulo state (59.7 m3/s). The industriesof manufacturing of food products, beverages, cellulose and paper, petroleum products, biofuels,chemical products, and metallurgy correspond to 90% of the flow of the water consumption by thenational industry [60]. The quality required for industrial uses is highly variable, depending on the

Water 2020, 12, 3466 11 of 35
sector and level of process sophistication. A further step could be to analyze the quality of the treatedeffluent to find out if it could meet the specific quality requirements of one industry or a group of themin the same sector. Then, it is possible to evaluate the need for additional treatment to water reuse.
In quantitative terms, in some sectors such as paper and cellulose, chemical products, textile,and cement industries, the water consumed for cooling (non-contact) can represent up to 94%, 95%,57%, and 82% of the total water consumption, respectively [61,62]. It is worth noting that industriesof chemical and textile sectors are predominant in the studied region and represent high waterconsumption rates (Figure 4 and Table 5).
Other important water use is agricultural irrigation. In Brazil, the south-eastern region correspondsto the largest irrigated area for agriculture; 34% of the total irrigated area [63]. Reclaimed water couldbe used for irrigation in agriculture, but currently there is not yet local regulation for water reuse foragricultural irrigation in the state of São Paulo.
The demand for non-potable urban purposes (irrigation of parks, squares, public cleaning, clearingof rainwater galleries, and sewage networks) was based on the volume reported by one plant ascommercialized to urban purposes in São Paulo city (Table 5). Comparing the total water demand forthe predominant industries, agriculture and urban use (4,339,054 m3/month) (Table 5) and the treatedeffluent flow that is discharged into the river (4,341,600 m3/month) by the studied plant, if directed toreuse, this flow would be sufficient to supply all the water demand for these corresponding purposes.
Electricity consumption data were collected for São Caetano do Sul city, which is close to theWWTP (Table 5) [56]. Regarding the internal demand of the plant, the average energy consumption ofWWTP ABC was about 2.6 GWh/month (consumption for all processes). Considering the volume oftreated sewage, the energy consumption corresponds to 0.42 kWh/m3 of treated sewage.
In this paper, the local market value (of phosphate fertilizer, water, and electricity) was estimatedto make the analysis more complete. The price for potable water is dependent on the consumedvolume. Based on SABESP (service provider), the current fee for potable water in São Paulo city variesfrom 3.6 € per m3 (for consumption higher than 50 m3/month) to 9.3 € per month (for consumptionlower than 10 m3/month) in commercial, industrial, and public sectors [64]. This value varies amongthe cities. Regarding the reclaimed water, there is no standard price for the reclaimed water fromtreated effluent. According to information from one WWTP in São Paulo city, which sells reclaimedwater, the price varies from 0.4 €/m3 and 1 €/m3, depending on the consumed volume and type ofcontract [55]. The price of phosphate fertilizers (monoammonium phosphate (MAP)) was estimated as315 € per ton in 2017 [65] and superphosphate was 214 € per ton in 2019 [66].
Regarding other megacities, Table 2 provides an indication on which resources (water, energy, orP) are scarce in each megacity, supporting the identification on where resource recovery technologiescould be more beneficial. Moreover, detailed sustainability assessments considering stresses based onlocal data are necessary to identify the most suitable technologies to each context [7].
3.1.5. Step 5—Relevant Legal and Regulatory Framework
In Brazil, legislation (regulation, quality standards, and requirements) related to wastewatertreatment focuses more on standards for discharging the treated effluent than on standards forwater reuse. In this section, current legislations related to water reuse, energy and nutrient recoveryare addressed.
At a national level in Brazil, there are two national regulations for non-potable reuse: NationalWater Resources Council (CNRH) 54/2005 and CNRH 121/2010. The first defines general criteriafor non-potable direct reuse, while the second establishes guidelines for non-potable direct reuse inagriculture and forestry. The states and municipalities may have more restrictive laws and regulationsthan the national ones [67].
In the state of São Paulo, where this study took place, the joint resolutions SES/SMA/SSRH n.1(2017) and SES/SIMA n.1 (2020) govern the non-potable direct reuse of water for urban purposes,originated from WWTP, and establish guidelines and general criteria. There are quality standards

Water 2020, 12, 3466 12 of 35
for uses (e.g., landscape irrigation, washing of streets and other public and private spaces, and civilconstruction). Irrigation for agricultural uses, grazing and forestry is not included. The WWTP musthave at least secondary treatment, disinfection, and filtration, and meet the quality standards and amicrobiological characterization of the treated effluent [68,69].
In the state of São Paulo, there is also a decree (48138/2003), which determines some measures forthe rational use of water, among which is the prohibition of use of potable water for cleaning streets,squares, and sidewalks, except in specific cases [70]. The Environmental Agency of the State of SãoPaulo (CETESB) has guidelines for irrigation in agriculture with treated effluent. The application ispermitted for fruit gardens, raw uneaten crops, forage (except for direct grazing), reforestation areas,and forest plantations, and establishes some restrictions regarding areas of application and effluentmonitoring (heavy metal concentration, thermotolerant coliforms, helminth eggs, sodium adsorptionratio, and electrical conductivity) [71,72]. At the city level, some legislations to promote water reusefrom treated effluents for urban non-potable purposes are mentioned in Supplementary Material S2F.
The main barriers to water reuse projects are: No federal program or financial incentives forplanning and implementation of water reuse projects (e.g., loan guarantees, tax-free); there are nonationally or locally defined goals (e.g., no obligations or incentives for industries to reuse); the criteriafor urban reuse adopted (resolutions n.1/2017 and n.1/2020) in the state of São Paulo are perceived as veryrestrictive, do not consider agricultural irrigation, and hinder urban reuse [67]. Appropriate policiesand the establishment of water quality regulations are required to encourage the creation of marketsand the development of water reuse technologies [19].
Regarding energy recovery, the relevant legal and regulatory framework is discussed below.There is a regulation (SMA-079/2009) from the Environment Secretary of the State of São Paulo, whichprovides guidelines and conditions for operation of thermal treatment of solid waste for energyrecovery (e.g., incineration of biosolids) [73]. The Brazilian Electricity Regulatory Agency (ANEEL)establishes the general conditions for the access of microgeneration and mini-generation to the electricitydistribution systems (resolution 482/2012). In the case of self-producer, the electricity generated is tomeet, partially or totally, the consumption needs of the producer, although the sale of eventual surplusenergy may be authorized by ANEEL (law 9427/1996, [74–76]).
In Brazil, biomethane from wastes is an emerging biofuel, and the legal framework for biogas andbiomethane recovery has been developed, especially for the state of São Paulo [77]. The regulationsin the state of São Paulo about biomethane production are in Supplementary Material S2F. The statedecrees n. 60,001 (2013) and 60,298 (2014) provide economic benefits (tax deductions) to utilities thatrecover biogas or biomethane [78,79].
The national regulation (CONAMA 498/2020) [80] defines the criteria and requirements forproduction and application of treated municipal sewage sludge (biosolids) in soil. Some requirementsare environmental permission, treatment processes, criteria for application, and frequent monitoring ofthe biosolids quality depending on application. This regulation also defines conditions for cultivation offood crops consumed raw and crops whose edible part has contact with the soil as well as for pasture andforages, food crops that are not consumed raw, fruit trees, and non-food crops [80]. This regulation [80]has been recently published and has updated the previous regulation [81]. It expands opportunities foruse of sewage sludge, and in general is more flexible than the previous regulation (in terms of frequencyof analyses, guidelines for application, and permitted uses). Therefore, it is expected that this newpractice of biosolids for agricultural use will be more widespread in the national territory, contributingto organic matter and nutrient recycling. Biosolids as a product to be applied in soil for agriculturemust be registered in the Brazilian Ministry of Agriculture, Livestock and Food Supply (MAPA). It isalso possible (based on standard n. 06/2016 of MAPA) [82] to register sewage sludge as a raw material,and to send it externally to a fertilizer or soil conditioner production process. More detailed informationabout standards on biosolids fertilizer and soil conditioner are in Supplementary Material S2F.
Besides legislation, regional planning documents were consulted (Master Plan of Great ABCregion, Municipal Master Plans, Municipal Plan of Sanitation, and others) to identify whether they

Water 2020, 12, 3466 13 of 35
mention resource recovery from wastewater and/or set goals for implementation. The Policy onClimate Change of the State of São Paulo encourages the methane recovery from anaerobic digester ofWWTP [83]. The Action Plan on Climate Change in the Great ABC mentions as strategic the biogasrecovery from wastewater treatment plants to reduce GHG emissions. In addition, this plan states thatsludge generated by the plants is disposed in landfills and has not explored its energy potential [84].Municipal master plans (Mogi das Cruzes and São Caetano do Sul cities) mention, as one of theirguidelines for the promotion and stimulation through tax incentives, the reuse from WWTP-treatedeffluent. The Municipal Plan of Sanitation of São Paulo states that new arrangements of reuse ofsewage sludge for agriculture and civil construction as well as energy recovery from biogas are studiedand highlight the potential of expansion of water reuse from treated effluent [85].
The analysis of the local institutional environment (addressed in step 5) allows for checkingwhether there is legal compliance and availability of supportive incentives [86]. Consequently, theseresults support the definition of resource recovery scenarios.
3.1.6. Step 6—Stakeholders Identification
The stakeholders (groups and institutions) are those interested in resource recovery measures, thepotential beneficiaries, those who may be impacted by these measures, and the ones that have power toinfluence the process [29,87]. In our framework, stakeholders were divided into groups (Figure 1) basedon their main roles. The stakeholders for assistance with recovery technology, research, and innovationinclude universities and research institutes as well as private companies in the region. We consideredstakeholders mainly in the municipalities close to the plant: São Paulo city, São Caetano do Sul,Santo Andre, São Bernardo do Campo, and Diadema. Some stakeholders identified were universitiesthat offer undergraduate and postgraduate courses in environmental science and engineering fieldsand conduct scientific research in related topics, research groups, and private companies on resourcerecovery technologies. Another group of stakeholders is the potential customers or end-users for therecovered product. It includes the main local farmer associations, trade and industrial associations ofthe study area, and others. All the mapped stakeholders are listed in Supplementary Material S2G.
The identification of stakeholders should also consider governmental agencies active in the field(e.g., water, energy, and agriculture sectors) that act as intermediary and have control on operation [88].Thus, stakeholders regarded with political and legal support should be considered such as localgovernments, authorities, and environmental regulatory organizations. Some examples are waterresources managers and the river basin committees, municipal secretaries of environment, and theSecretary of Agriculture. Additional stakeholders could be mapped such as the ones to providefunding or stakeholders supporting public awareness activities related to resource recovery acceptance(e.g., non-governmental organizations (NGO)).
During this process (step 6), potential roles and responsibilities should be assigned to differentstakeholders and how they can engage and collaborate in the framework application towards resourcerecovery implementation. Some examples of key roles for universities and research institutes are toperform laboratorial analysis to ensure the quality of the product, to perform risk analyses, life-cycleassessments, and experimental studies, while NGO or public authorities could assist by awarenessraising and promotion of resource recovery approach among the public. The company in charge ofproviding wastewater treatment services owns the studied plant and their plant managers or board ofdirectors are important stakeholders. In our case study of the framework application, it was consideredhypothetically that the water and sanitation provider would manage and coordinate the resourcerecovery system. We highlight that the list of stakeholders (Supplementary Material S2G) is notexhaustive and can be updated in the future.
All the identified relevant stakeholders could contribute with their opinions and participate activelyin the resource recovery project formulation, which would result in an acceptable solution within thelocal context. Thus, design strategies could incorporate the stakeholders into the decision-makingprocess for a better governance [22,89]. In step 6, it is expected that representatives of the mapped

Water 2020, 12, 3466 14 of 35
stakeholders’ groups have regular meetings. It could include interactive workshops (group learning,discussion of the current state, and strategies and pathways, as proposed by Iwaniec et al. [90]). In thesecollaborative meetings, the stakeholders could provide practical recommendations for overcomingsome of the barriers to planning and implementation of resource recovery target solutions [91].
Results from Laura et al. [22] corroborate with our findings regarding the lack of contact amongthe stakeholder’s groups. For instance, WWTP managers and local authorities have very littlecollaboration with scientific experts and negligible relationships with NGOs, causing an absenceof technical support to WWTP. Some measures to address this barrier are visits to universities fordemonstration of technologies/studies related to resource recovery, pilot-scale projects in WTTP toincrease the collaboration with research universities, benchmarking of successful operational practicesin other contexts, and the regular stakeholders’ meetings (as suggested previously).
3.1.7. Steps 7 to 9—Comparison between Resource Recovery Technologies Options
Previous steps of the framework assisted decision-making about which resource is worth beingrecovered. Based on this diagnosis (steps 1 to 6), the energy recovery and sludge management(e.g., nutrient recycling) seem to have higher potential and to be priorities according to consultedregional planning documents, and based on a previous study [31], when these options were reportedas an area of interest by plant managers. The choice of recovery technologies considered the existingtechnology set-up in the plant, the level of development of the technology, and the availability of athorough data basis for analysis. Only processes at full-scale (reported in the literature) were considered.
The scenario evaluation captured the necessary infrastructure updates, operational changes,and reuse applications [92]. Our purpose was not to produce an exhaustive evaluation of all possibletechnological alternatives that could be employed to recover resources. Instead, we focused on themost appropriated ones based on the previous steps of the framework and on previous literature.
The evaluated scenarios are listed as follows (Table 6):
A: Struvite production from supernatant obtained from thickeners and digesters, and sludgedewatering centrate. Crystallization of struvite with magnesium (Mg) and pH increase via NaOH(sodium hydroxide). Examples: Fluidized bed reactor Pearl®, Struvia®, and others.
B: Organic fertilizer and soil conditioner production from windrow co-composting of dewateredsludge. Pre-treatment by mixing different types of wastes (e.g., sawdust/wood chips, choppedurban pruning, sugarcane bagasse, and eucalyptus husk) to achieve the C/N ratio of 20:1 to30:1 [93,94]. During composting, the temperature of sludge rises to about 50–60 ◦C, which reducesthe pathogen content. After composting, screening using sieves.
C: Energy recovery from biogas of anaerobic digesters. Co-digestion with food waste from streetmarkets. Optimum temperature: 35–36 ◦C [95,96]. Otto cycle engine to generate electricity [97].
D: Energy recovery by co-processing of sludge as raw material and fuel in kilns for cement industry.Pre-treatment for extra drying of sewage sludge (e.g., fluidized bed dryers and rotary dryers,solar drying, or by recovering residual heat from the cement kiln) until moisture content is lessthan 30%–25% [98–100]. The sewage sludge should be fed to a kiln system from the main burner,kiln inlet, or pre-calciner [99].

Water 2020, 12, 3466 15 of 35
Table 6. Assessment of the recovery technology options against the indicators (step 9 of the framework). Further explanations are in Supplementary Material 3 (SM3). [102–152].
Resource Recovery Technology Options
Indicator A. Phosphorus (StruviteRecovery)
B. Nutrients and Organic Matter (SewageSludge Co-composting)
C. Energy (Biogas from Co-digestionwith Food Waste)
D. Energy (Co-processing of Sludgein Cement Industries)Technical and Environmental
Recovery potential
10%–40% from WWTP influentP and 85%–95% of P input of the
recovery process 1
Estimate for the studied plant 2:About 532.6 kg of P/day (in
struvite)
Organic matter content in dewatered sewagesludge (50%–70%), N (3.4%–4%), P
(0.5%–2.5%) and micronutrients [118–120].Compost composition: organic carbon 224.5,P 16.7, TKN 28.1 (g/Kg) [121]. Estimate: 2.02
ton P/day in the dewatered sludge 11
Co-digestion (an increase of 20% of organicloading rate) causes an increase of
21%–50% of methane yield compared tosewage sludge mono-digestion [95,130].
Current methane production: 2118.8Nm3/day; with co-digestion: 2565.9–3178.2
Nm3/day. Estimated electric power:8877.7–10,996.4 kWh/day 13
Typical higher heating value (energycontent) of dried sewage sludge is
11.10–22.10 MJ/Kg (mean value: 16.05)[141].
Estimate for the studied plant:599,786.9MJ/day (thermal energy
recovered) [11]
Technology maturity Full-scale, but TRL 5 in Brazil 3
[15,107]Full-scale, similar initiative already taking
place in Brazil (TRL 9)12
Full-scale biogas recovery initiativesalready take place in Brazil, including one
plant with co-digestion in Paraná state(20,000 m3 of biogas/day) (TRL 9) [131]
Full-scale, few applied in Brazil (sewagesludge corresponds to 0.4% of the total
amount of co-processed wastes bycement companies in Brazil) [142] (TRL 9)
Resource utilization (e.g.,energy
and chemical consumption)
Electricity: 4.9–6.6 kWh/kg Prec., reactants consumption:
MgCl2*6H2O 7.7–8.5 kg/kg Prec. and NaOH: 0.2–0.22 kg/kg
P rec. 4 [103]
Low energy demand and low demand forreagents for composting (it may require
micronutrient addition and additives to theproduct) [22]
Electricity consumption for pre-treatment:35 kWh per ton of organic waste [132].
Electricity consumed by Otto cycle engine:2% of the total generated (up to 219.9
kWh/day) [133].Water consumption: 0.37 m3 per ton of
waste (in pre-treatment) [134]
Energy consumption for sewage sludgedrying: 30 to 1400 kWh per ton ofevaporated water (depends on theprocess) [143,144]. Estimate for the
studied plant: 34,577.88 kWh/day [11]
Need for additional skilledlabor
Require a high degree ofoperator skill to maximize therecovery efficiency, additional
labor and maintenancerequirements [108,109]
Additional personnel for operation ofcomposting [22] (middle), simple operation12
Additional personnel for operation ofbiogas recovery system and of
pre-treatment of food waste (middle,authors’ estimation) [135,136]
Low (authors’ assumption). No need ofadditional skilled personnel for sludgeco-processing, especially in industrieswhich already perform co-processing
Quality of effluent and sludge(removal of pollutants) and
environmental concern
Low concentrations ofphosphate and ammonia in thefinal effluent, P concentration infinal effluent (around 0.4 mg/L)5 [110], reduced energy demand(for returning side-streamsflows and for aeration[101,103]), no need forreduction of heavy metals, andno organic micropollutants inthe product, less production ofsurplus sludge [111,112]
Biosolids’ land application avoids excessnutrients entering the environment becauseof their low nutrient contents compared withfossil fuel-based fertilizers [12], globalwarming impact is reduced [122], presence ofheavy metals and persistent pollutants in thesludge and compost should be investigated[123], low gas emissions, possible generationof leachate [22,124]
Reduction of greenhouse gas emissions(52.4%–63.2% kgCO2eq. per ton of wasteand sludge) when comparing withdigesting sewage sludge as single feedstock[134]. Considering a WWTP with a scalesimilar to the studied plant (2.29 m3/s),biogas recovery would provide a reductionof 146.1 tons of CO2eq./month [137].The digestate could be used in agriculture
Release of contaminant gases [141]; noneed of specific treatment for ashes [99];significant reduction in sludge volume tobe disposed of; replacement of fossil fuels;the ashes recovery causes a reduction ofuse of raw material [145]; reduction ingreenhouse gas emissions; loweremissions of CO2 and NOx [146,147]

Water 2020, 12, 3466 16 of 35
Table 6. Cont.
Resource Recovery Technology Options
Indicator A. Phosphorus (StruviteRecovery)
B. Nutrients and Organic Matter (SewageSludge Co-composting)
C. Energy (Biogas from Co-digestionwith Food Waste)
D. Energy (Co-processing of Sludgein Cement Industries)Technical and Environmental
Economic
Investment cost 4.4 to 10 EUR/kg P rec. 6
[102,103]88,565 EUR [125]; 1.69 million EUR [94];150–310 EUR/ton DM (dry matter) [126]
750,000 EUR (for pre-treatment of foodwaste, considering 10 ton/day) [95];348,519–394,323 EUR (equipment totalcosts) [135,138]
11,704–45,016 EUR/(ton of sludge/day)[148]; sludge co-processing does notdemand high investments [149]
Operation and maintenance cost 1.6 EUR/kg P rec. 7 [102]22,546 EUR/year [125], 894–1254 EUR/month;97,000 EUR/year [127]
50 EUR/ton of treated waste [95];0.003–0.005 EUR per kWh per year (repairand maintenance); 0.006 EUR per m3 ofbiogas (biogas treatment); 2691 EUR/year(other maintenance costs) [135]
10–40 EUR/ton of dewatered sludge [150];or 90–100 EUR/ton of dried sludge [127](includes also investment costs).
Revenue from recovery
Price of struvite 0.3–1 EUR/kg P[101], profit from struviteproduction: EUR -0.04 to 0.46per kg of struvite recoveredeach day [113], there are savingsdue to the avoidance ofunwanted struvite encrustationsin pipes and pumps [103]
Profit from compost sales, price of organicfertilizer: 14.5–17 EUR/ton [125,128]
Considering the electricity price (0.06EUR/kWh) and the mean power generatedby the WWTP, the avoided costs would be185,641.6–229,944.2 EUR per year14.Avoidance of transport and disposal costsof organic waste to landfill (EUR 12.2/ton ofwaste per month) [139]
Reduces production, operational andmaintenance costs of cement industries[93]; the saving out of using a 7.5% wetsludge in one kiln normally consuming6.3 t/h of dry pet-coke (1% moisture)reach 8.0 EUR/h [151]; reduction of 66%of fossil fuel consumption [145]
Logistics (necessary changes)
Product is easy to transport[114], transportation untilend-users necessary, installationof reactor for struviteproduction 8
Requires transportation until end-users,space demand for composting and forstorage of the compost, partnership withproviders of other organic wastes necessary 8,it may require further sludge drying priorcomposting [93]
Requires storage, transportation, andpre-treatment of food waste (e.g., wheelloaders, crusher) [140]; biogas collection,transport, and storage system; biogastreatment (desulfurization); energyrecovery unit; monitoring unit [135]
Pre-treatment of sludge drying necessary;transport of sewage sludge until cementindustries; dosing and feeding systemmight be needed [99]; possibility ofadaptations in the kiln exhaust system[152]
Societal
Acceptance4 (high) 9, struvite is not awell-known fertilizer amonglocal farmers
3 (medium), may cause bad odour, moreacceptable if the composting facility islocated adjacent to the WWTP [116,129]
4 (high) (authors’ assumption), interest inbiogas recovery is reported in localplanning documents
5 (high), considering cement industriesperception on sewage sludge forco-processing [100]

Water 2020, 12, 3466 17 of 35
Table 6. Cont.
Resource Recovery Technology Options
Institutional and political
Accordance with policies andlegal requirements
Possible, but national legislation(e.g., quality criteria of theproduct) needs to be developedto facilitate struvite recoveryoptions 10
Yes, there are sufficient regulations andpolicies 10
Yes, there are sufficient regulations andpolicies, and incentives (tax deductions) toutilities that recover biogas 10
Yes, there are national and statelegislations that regulate co-processing ingeneral 10
Notes: P: Phosphorus; N: Nitrogen; TKN: Total Kjeldahl nitrogen; TRL: Technology readiness level; MgCl2*6H2O: Magnesium chloride; NaOH: Sodium chloride; CO2: Carbon dioxide,NOx: Nitrogen oxides; EUR: Euros; 1: Considering processes from liquid phase, based on [102,103]; 2: Based on [104–106] and monitoring data from the plant; 3: TRL in Brazil wasestimated by the authors; 4: Considering the process Ostara Pearl®; P rec.: Recovered phosphorus; 5: P concentration in the final effluent was estimated by the authors; 6: Consideringprocesses Ostara®, DHV®, PRISA®, P-RoC®, and Nuresys®; 7: Considers Nuresys® process; 8: Authors’ assumption based on site visit and observation; 9: Estimated by authors basedon [115–117]; 10: Based on consulted legislations and regulations valid in the study region (authors’ assumption); 11: Explanation in SM3; 12: Based on authors’ experience; Biosolids:Compost; 13: Explanation in the text (Section 3.1.7); 14: Authors’ estimation based on electricity price [135] and estimated generated power from co-digestion.

Water 2020, 12, 3466 18 of 35
Technologies for P recovery based on sludge ashes were not included among the scenarios, becausethe plant does not perform sludge incineration and it is not a common route in Brazil (for municipalsewage sludge). The existing sludge disposal route in the plant is an important variable that influencesthe cost [101].
Existing P recovery techniques (e.g., struvite crystallization) are economically feasible with high Pconcentration streams (>50 mg-P/L), such as sludge liquors obtained from anaerobic digestion [153,154].The recovery potential of struvite was estimated for the case study. Based on Jansen et al. [104], it wasestimated that the thickeners’ supernatant flow corresponded to 1%–2% of the raw wastewater flow,which approximately equaled to 35.1 L/s. The digester supernatant flow was around 29.23 L/s (0.5%–2%of raw wastewater flow), and the reject water from dewatering was 8.2 L/s. These side streams could bedirected to a reactor for P recovery-precipitation, and about 10%–40% of P in the raw wastewater couldbe recovered [104]. There were no data for P concentration in the digester supernatant for our casestudy, but according to literature, sludge liquor (thickener supernatant, dewatering centrate, and theanaerobic digestion side streams) had total P concentrations between 110 and 289 mg/L [105,106].Considering the flow of the P-enriched streams (72.53 L/s), a mean P concentration (100 mg/L), and theaverage rate of recovery of 85% from P influent (supernatant), the estimated P recovered would be532.6 kg/day in the studied plant. This value would be enough to meet the annual fertilizer demand(P2O5) in the study area (Table 5).
However, for the removal of lower P concentrations, both operational and investment costswould be higher [102]. The studied WWTP does not have enhanced biological phosphorus removal(EBPR); thus, it could be a limitation for struvite recovery processes from the liquid phase [106].The polyphosphate contained in P-accumulating organisms (PAOs) can be released as orthophosphatewhen EBPR sludge is digested [155], facilitating struvite recovery [156]. By combining EBPR and Pprecipitation, a great percentage of P in solution could be recovered as struvite [157]. If the studied plantapplied EBPR, the P content in sludge would increase, consequently allowing for a higher recovery.
Regarding scenario B, a previous study [158] in another WWTP in Brazil showed that thecomposting process was enough to produce a compost that complied with the national qualitystandards (from the National Environmental Council) for heavy metals and pathogens. Thus,we expect that the composting scenario will be suitable to meet the quality requirements, but furtherregular analyses of the sewage sludge composition for the studied plant are necessary. A recentstudy by Nascimento et al. [51] investigated the quality of dewatered sludge generated in severalplants in São Paulo state and assessed the suitability of the sludges for agricultural applications.Considering the results for São Paulo megacity plants, all sludge samples complied with the thresholdvalues from CONAMA standards (National Environmental Council [81]), except for samples from twoplants where Zn exceeded the maximum permitted. The authors considered the sludge promisingas agricultural correctives to soils due to their high pH and micronutrient contents (Fe, Zn, and Mn).Regarding organic contaminants (e.g., pharmaceuticals and persistent organic pollutants) in sewagesludge, in Brazil, this research field is incipient so far. Souza et al. [123] evaluated aromatic polycyclichydrocarbons (APH) in sewage sludge in Porto Alegre (Brazil) and found that the concentrationwas lower than the limits established by the European Union for APH. Another study [159] showeddegradation of antibiotics during co-composting of sewage sludge with vegetable wastes (in Morocco).
Co-digestion with fruit and vegetable wastes was chosen for scenario C because it canimprove biogas yield [160]. In addition, anaerobic sludge digesters are usually oversizeddue to low organic sludge loading, indicating capacity to receive other substrates, enablingco-digestion [97,161]. Considering methane production, the lower calorific value of methane(9.97 kWh.Nm-3CH4) [139], and assuming an electric conversion efficiency of 38% [135], the generatorpower capacity would be 405–501.7 kW. In addition, considering 8000 operating hours per annumby the motor-generator [135,162], the annual and daily power generation capacities were estimated(Supplementary Material S3 and Table 6).

Water 2020, 12, 3466 19 of 35
A low temperature in digesters (22 ◦C) was noted for our case study. Thus, the followingimprovements in operation conditions were suggested: The increase of temperature of digesters,and frequent measurement of biogas flow and its composition. These matters (digesters operation)are currently under consideration by SABESP (wastewater treatment company). It is also possible tosuggest the implementation of a co-generation system to recover thermal energy from exhaust gases ofthe engine for heating the digesters, which would increase the efficiency of the process [163].
For scenario D, the following aspects should be considered. The dewatered sludge in the studiedplant contained humidity between 60.6% and 74.5%; thus, it would be necessary to dry the sludgebefore forwarding it to cement industries. Supplementary Material S2H contains some drying options.Another relevant aspect when exploring sewage sludge as fuel for co-processing is the proximitybetween the WWTP and cement industries. There are cement industries across the state of São Paulo,which makes it a possible alternative. However, in Brazil, fossil fuels represent 82% of calorific valuein cement industries [142], and the use of sewage sludge for co-processing is irrelevant, being justsome tests until the present moment. Sewage sludge corresponded to 0.4% of the total amount ofco-processed wastes by cement companies in Brazil [142]. However, it is expected that it will increasesignificantly, particularly in south-eastern and southern regions in 2030 [164].
In developing countries, the most common routes for sludge disposal are landfilling andagricultural application [27]. These countries usually have little or no waste management infrastructure;therefore, properly controlled co-processing can be a practical, cost-effective, and more sustainableoption instead of landfill and incineration [165]. In the metropolitan region of São Paulo, the sewagesludge is disposed in landfill [31]. In the studied plant, 113 tons of dewatered sludge was produced perday. Thus, scenarios B and D represent promising sustainable solutions to sewage sludge management.
Based on their quality, the fertilizer or soil conditioner products (scenarios A and B) could be usedfor several applications such as landscaping in agriculture to restore degraded land or to cultivatecrops, especially sugarcane, eucalyptus, ornamental plants, and in some cases, coffee and vegetables,following the existing standards (step 5). The electricity produced by scenario C would be used tosupply part of the internal demand in the WWTP (about 10%–13% of the total electricity consumeddaily). For scenario D, the recovered energy would be used by cement industries. Considering twocement industries with kilns for clinker production (about 134 and 115 km of the WWTP ABC) [166],the thermal energy recovered by scenario D could meet about 2.3% of its total thermal energy demandannually (Supplementary Material S2H).
Social acceptance depends on the context and issues can be more critical for facilities in a denselypopulated region rather than in a nearly inhabited area [150]. One of the most influential factorsassociated with public acceptance in wastewater sector is the level of contact [167]. For scenarios Cand D (energy recovery), the social acceptance is not truly relevant since these solutions do not directlyaffect the local population (no contact). Differently, the acceptance of plant managers and cementindustries for these options could be aspects for further investigation.
In addition, concerns about environmental risks and human health associated with resourcerecovery measures can affect acceptance. For struvite recovery in agriculture, low acceptance can beattributed to low environmental awareness, lack of knowledge of public, and few scientific studies onthis topic [168]. Until the present moment, struvite granules have been unknown by local fertilizersconsumers in the São Paulo metropolitan region [18].
Regarding acceptance of compost from sewage sludge, there is a positive example in Jundiaicity (60 km from São Paulo city) where the acceptance of the product is very good, and it does notrepresent a barrier. According to the technical director, responsible for composting facility, they havenot done any prior acceptance studies, but they conducted initiatives such as promotion of visitsto their plant, lectures, dissemination of information, sales offers, and participation in events withfarmers. There was no resistance to the use of the product due to its origin (sewage sludge as rawmaterial). The quality of the produced compost meets the standards (e.g., heavy metal concentrationand pathogens-thermotolerant coliforms, Salmonella sp., and helminth eggs) [128]. In our scenario B,

Water 2020, 12, 3466 20 of 35
the composting plant could be built inside the WWTP area to reduce transportation costs, then onlythe compost volume (final product) would have to be transported.
As addressed in Table 6, all scenarios require further changes and demand necessary training foroperators of the recovery processes. Further aspects that contribute to a better decision on recoverystrategies are analysis of the final products and estimation of the market size [126]. However, concerningthe economic indicators, cost calculations and estimates related to recovery processes are challenging,since there is no market for the recovered products in some cases. Indeed, the development of themarket can occur in parallel to the implementation of resource recovery solutions in the WWTP.
The selected example WWTP already performs water reuse. Thus, in the future, other measuresthat could take place in parallel with the increase of its treatment capacity would be the expansion ofwater reuse for internal purposes, industrial supply and for other sectors such as irrigation, non-potableurban purposes, and for indirect potable reuse through discharging of the treated effluent in waterreservoirs (of water supply systems).
The different scenarios (step 9) can provide new insights in the design of sustainable valuechains. Delanka–Pedige et al. [169] have proposed the wastewater infrastructure attributes thatsupport sustainability: Reuse-quality of water recovered from wastewater; safe pathogen reductionfrom wastewater; energy use and recovery in wastewater treatment; biofertilizer recovery fromwastewater; and emission (direct and indirect) reduction in wastewater treatment. The recoveryscenarios proposed (Table 6), together with the existing water reuse practice contribute to sustainabilityin all these attributes.
The proposed framework supports the application of a circular economy at a regional level,through the integration of production and consumption systems. In practice, the success of a circulareconomy approach in the water and sanitation sector will depend on some factors such as partnershipsamong stakeholders, user engagement, and overcoming of existing barriers [170]. In this context,there is a need for tools that enable the translation of scientific results to create an evidence base thatsupports decision-makers to act [171,172]. The proposed framework can be an example of tools that fitto this purpose.
Considering all indicators (Table 6 and Figure 5) for the studied plant, scenario B seems to be themost favorable for nutrient recovery due to low costs, high recovery potential, and a lesser requirementfor skilled labor. For energy recovery, biogas recovery seems more favorable considering the setof indicators. In terms of institutional and political indicator, the biogas recovery scenario is themost favorable.
Figure 5. Comparison of resource recovery scenarios. (A) Struvite recovery; (B) co-composting ofsewage sludge; (C) biogas recovery from co-digestion; (D) energy recovery from co-processing of

Water 2020, 12, 3466 21 of 35
sewage sludge. Green corresponds to more favorable conditions, when the value of the attribute underevaluation is not problematic (it is considered positive); yellow represents intermediate situations;and red is used when the value of attribute raises a potential problem (it could represent a negativesituation). Gray: Not applicable. More information on assessment and quantitative values are in SM4.
Steps 10 and 11 were not considered in this paper, since the resource recovery solutionimplementation was not part of this research, and decision-making depended on wastewater treatmentplant managers’ and local stakeholders’ preferences. For instance, they could assign a high weightto one of the sets of indicators (e.g., economic or environmental), which would influence the finalchoice about the best solution among the defined scenarios [26]. Depending on stakeholders’ anddecision-makers’ preferences, more than one scenario could be chosen, or they could be combined.
Overall, prior to a decision on implementation of any resource recovery technology (e.g., nutrientrecovery), it is recommended that quantitative flows and qualitative data should be more thoroughlyanalyzed (e.g., nutrient content in the supernatants and in sludge, and other relevant parameters suchas contaminants).
3.2. Strengths and Potential Improvements of the Framework
3.2.1. Strengths of the Proposed Framework and Comparison with Similar Studies
Some frameworks related to urban water management have been proposed and can play animportant role to enable sustainability assessments, planning, and decision-making at differentscales [173]. Frameworks can be useful to multiple purposes: To enable the diagnosis of a specificcurrent situation, to be a management tool, to assess opportunities of improvement, and to facilitatestakeholder engagement and communication [173]. The framework tested in our study fits allthese purposes.
Previous studies have developed frameworks for water reuse [21] and sludge management [22].Papa et al. [21] developed a tool for evaluating the water reuse from technical and economic sustainability.Their framework aimed to judge the feasibility of wastewater reuse and considered the ratingof the WWTP, hydraulic system (required for transportation), and the final user. The need foradditional/polishing treatment of the effluent to satisfy quality criteria, and an increase of the costs(e.g., for plant upgrade, water distribution system, and the monitoring of reuse system) were consideredas constraints to water reuse [21].
Laura et al. [22] created a framework to guide decision-making towards selecting sustainableoptions to handle sewage sludge. It included the evaluation of possible scenarios and considered fourdimensions: Economic, environmental, social, and technical. Similarities with our study were theinclusion of stakeholder analysis (mapping), characterization data of sewage sludge, and analysis oflocal regulation.
O’Dwyer et al. [23] created a framework focusing on the optimization of design schemes oftreatment plants and transport networks. In their assessment, environmental impacts and financialcosts were considered for each scenario. Kehrein et al. [24] presented a framework for designing andplanning of WWTP towards resource recovery activities. Some similarities compared to our frameworkare market analysis for recovered resources, inclusion of stakeholders, treatment performance analysis,and techno-economic and environmental assessment.
In our study, the proposed framework is not restricted to water reuse or sludge scenarios andserves for assessing other resource recovery measures, including more indicators and involving avariety of stakeholders. Thus, compared to previous developed frameworks, our framework is morecomprehensive and offers descriptive instructions on how to approach each step. Another highlight isthe final step of implementation and monitoring, which allows to optimize the recovery process and/orrestart the framework application to combine with other resource recovery solutions.
One advantage of the proposed framework is that it could be easily presented to third partieswith no specific technical background. Operationalization of the framework may be complicated and

Water 2020, 12, 3466 22 of 35
complex especially in data-scarce regions, but applying the framework in a collaborative way with keystakeholders (representatives of different groups/sectors) could facilitate the process and contribute toan increase in managers’ and policy-makers’ understanding of the subject (resource recovery).
Planning in the sanitation sector in developing countries should consider a multi-sectoral approachrecognizing the interrelations between sanitation and other sectors such as water supply and solid wastemanagement [174]. Van der Kooij et al. [17] highlighted the importance of making connections betweenwastewater treatment systems, agri-food systems, and ecological aspects to find more suitable recoveryoptions. In our study, the application of the framework allowed us to identify these interactions andcontributed to a better knowledge on recovery options.
Our framework aimed to capture context-specific characteristics to make a better decision.This addressed the future research needed mentioned by Diaz–Elsayed et al. [7] about the analysis ofdemand for resources and potential resources that can be recovered within design and local conditions.By applying our framework, it would be possible to identify potential challenges in the selectionand implementation of resource recovery process configurations (e.g., water, energy, and nutrients),and as an additional step it was possible to restart the framework application (from step 7) to combinetechnologies to recover different resources. This should facilitate decision-making on integratedresource recovery since the previous steps were already concluded. Thus, the new framework had apractical value and allowed for plant managers to think about new potential solutions by providingrelevant information. The proposed framework could also be complementary to the City BlueprintFramework, which is a tool that evaluates urban water management in a city [33].
3.2.2. Practical Challenges as well as Future Directions and Perspectives
After testing the framework with the case study, suggestions for improvements were evaluated.Step 7 (the choice of resource to be recovered) could be placed before step 6. Then, based on the targetresource potential, key stakeholders could be mapped. This could make conducting step 6 easier andquicker; i.e., narrow down the number of stakeholders. Other suggestions for future applications of theframework were to limit the scale of analysis, for instance, to a smaller geographical area (at a city levelor a neighborhood), or to a specific sector as an end-user (industry or agriculture). We believe that itcould reduce the complexity of analysis and reduce the amount of data required, and, consequently,the challenges related to data collection and availability, despite losing the holistic perception ofrecovery alternatives and the view of the interactions at different scales.
Another possibility could be to start the framework application at step 6 (identifying stakeholders),particularly for contexts and places where data are scarce. It would likely facilitate (reduce timedemand) the process to gather data needed for applying the other steps of the framework. For instance,if stakeholders from a local environmental agency/government were involved from the beginning,they could assist in the identification of the relevant legal and regulatory frameworks.
In this study, the authors considered the application of the framework for recovering of water,energy, and nutrients, although it is highlighted that the framework could be adapted for applicationeven in different contexts (e.g., WWTP in urban or rural areas) and for other target resources.
The planning process requires detailed and accurate data and information. In step 9, in order toperform more accurate evaluations, it is recommended to replace qualitative limits by quantitativevalues as mentioned by a previous study [22]. This could be done in future studies, depending ondata availability.
3.3. Limitations
The presented findings captured only a snapshot in time, conveying the current developments ofrecovery technologies and providing the framework application considering the data collected duringa specific period. But the study region is very dynamic. Therefore, some aspects and data continuallychange in short or long terms (e.g., price of recovery technology, demand, and regulations), and theanalysis through the proposed framework should be updated or restarted. According to Van der Hoek

Water 2020, 12, 3466 23 of 35
et al. [14], many external factors may change over time due to technological, environmental, economic,and market developments, and these uncertainties can influence the possibilities of resource recoveryimplementation. Other limitations noticed during application of the proposed framework was the lackof availability of some input data (e.g., some parameter concentration of treated effluent and sludgecomposition data, and costs for struvite precipitation in the Brazilian context).
Finally, we would like to emphasize that integrated evaluations at large-scale are characterized bya high degree of complexity (as mentioned by Papa et al. [21]). This was the case for our study, becausewe considered a large area, and the steps of the framework considered several types of data. The resultsof framework application depend on the overall availability of input data. Therefore, it highlightsthe need for improvement of monitoring practices either in a wastewater treatment plant or beyond(in other sectors; for example, water consumption in urban uses). There is uncertainty associatedwith secondary data used in the framework. For instance, although we considered the most updatedavailable data, in some cases, they came from various sources.
4. Conclusions and Recommendations
Through the framework application, local context was deeply analyzed and the demand for water,energy, and P was identified. Some scenarios were recommended, and opportunities for improvementof existing processes were proposed.
Based on the results, all scenarios could be feasible for the studied WWTP, especially biogas recoveryfrom co-digestion and sludge co-composting considering all the technical, environmental, societal,and political/institutional indicators. Local legislations seem to be favorable to implementation in allscenarios, except for struvite recovery, which needs further development. In addition, we recommendtests at pilot scale in the study region before applying struvite at full-scale WWTP. The suggestedscenarios have potential to provide environmental benefits such as improvement of effluent quality(scenario A), low CO2 emissions, reduction in global warming potential, and reduction of wastegeneration (scenarios B, C, and D).
With increasing demands for water, energy and food, particularly in urban areas, recoveringresources from sewage is an important strategy. Considering only one WWTP in São Paulo megacity,the authors showed there is a potential to meet all the current demand for phosphorus fertilizer andnon-potable water (main industries and agriculture) in the study region. Therefore, in quantitativeterms, water reuse from the treated effluent could meet the current water demand for industrial andagricultural uses; and P recovery potentials from recovery scenarios could supply all the currentdemand for phosphate fertilizer in agriculture in the study region.
In summary, the strengths of the proposed framework are addressing the complexities of dynamicsystems and integrating with relevant sectors and stakeholders, while the main limitations includethe need of some data, which may not be available. The methodology used in this paper might beapplied to other contexts, and the data from the case study (effluent and by-product characterizationand potential demand) could be compared to other studies/regions. In addition, the comparison ofrecovery scenarios based on indicators and literature (Table 6) can be used as a basis for further studiesunder the circular economy perspective.
This paper provided a simple tool as a structuring mechanism to support resource recoveryimplementation from wastewater treatment, which is useful to managers and decision-makers.The results can help the elaboration of resource recovery projects. The framework refinement and use(presented here) can guide potential applications in other contexts.
In future studies, as soon as the market for recovered products develops, it is possible to calculateeconomic indicators using detailed local prices, and the social acceptance evaluation after consultingstakeholders and survey with the local community. Further studies could also explore stakeholderengagement and cooperation during framework application. Other relevant and necessary themes arethe monitoring of sludge quality, removal of persistent organic pollutants in sewage sludge composting,analysis of risks to environment and human health from its application in soil, monitoring of P in

Water 2020, 12, 3466 24 of 35
reject water (thickeners, digester supernatants and dewatering centrate), development of local businessmodels for resource recovery, multi-sectoral engagement approaches, and testing of the frameworkapplication in other cities.
Supplementary Materials: The following are available online at http://www.mdpi.com/2073-4441/12/12/3466/s1,Supplementary Materials S1–4. Supplementary Material S1: List of data collected for the wastewater treatmentplant; Supplementary Material S2 (2A–H): Further information concerning framework application; SupplementaryMaterial S3: Further explanation regarding Table 6; Supplementary Material S4: Further explanation to Figure 5.References [175–210] are cited in the Supplementary Materials S2 to S4.
Author Contributions: Conceptualization, M.C.C., M.S., M.A.N.; methodology, M.C.C.; formal analysis, M.C.C.;investigation, M.C.C., F.d.M.d.S.; data curation, M.C.C., F.d.M.d.S.; writing—original draft preparation, M.C.C.;writing—review and editing, M.C.C., F.d.M.d.S., M.S., M.A.N.; visualization, M.C.C.; supervision, M.S., M.A.N.All authors have read and agreed to the published version of the manuscript.
Funding: This study was funded by the Coordenação de Aperfeiçoamento de Pessoal de Nível Superior (BrazilianFederal Agency for Support and Evaluation of Graduate Education), Brazil (CAPES), finance code 001, through ascholarship granted to the double degree doctoral student Mariana Cardoso Chrispim.
Acknowledgments: The authors thank the staff of SABESP (water and sanitation company) for kindly providingthe requested data about the studied wastewater treatment plant. We acknowledge the support received fromlocal experts concerning the selected megacities for their contribution by providing related data. We are alsograteful to the student Karla Mesquita for assisting in part of the data collection (and the scientific initiationscholarship from Cnpq).
Conflicts of Interest: The authors declare no conflict of interest. The funders had no role in the design of thestudy; in the collection, analyses, or interpretation of data; in the writing of the manuscript; or in the decision topublish the results.
References
1. Bressani-Ribeiro, T.; Mota Filho, C.R.; de Melo, V.R.; Bianchetti, F.J.; de Lemos Chernicharo, C.A. Planningfor achieving low carbon and integrated resources recovery from sewage treatment plants in Minas Gerais,Brazil. J. Environ. Manag. 2019, 242, 465–473. [CrossRef]
2. Zhang, P.; Zhang, L.; Chang, Y.; Xu, M.; Hao, Y.; Liang, S.; Liu, G.; Yang, Z.; Wang, C. Food-energy-water(FEW) nexus for urban sustainability: A comprehensive review. Resour. Conserv. Recycl. 2019, 142, 215–224.[CrossRef]
3. United Nations. Goal 11: Sustainable Development Knowledge Platform. 2016. Available online: https://sustainabledevelopment.un.org/sdg11 (accessed on 10 September 2020).
4. Andersson, K.; Dickin, S.; Rosemarin, A. Towards “Sustainable” Sanitation: Challenges and Opportunities inUrban Areas. Sustainability 2016, 8, 1289. [CrossRef]
5. Zhang, Y.; Zhang, C.; Qiu, Y.; Li, B.; Pang, H.; Xue, Y.; Liu, Y.; Yuan, Z.; Huang, X. Wastewater treatmenttechnology selection under various influent conditions and effluent standards based on life cycle assessment.Resour. Conserv. Recycl. 2020, 154, 104562. [CrossRef]
6. Boiocchi, R.; Matafome, B.; Gargalo, C.L.; Carvalho, A.; Sin, G. Techno-economic analysis of resource recoverytechnologies for wastewater treatment plants. Comput. Aided Chem. Eng. 2017, 40, 1945–1950. [CrossRef]
7. Diaz-Elsayed, N.; Rezaei, N.; Ndiaye, A.; Zhang, Q. Trends in the environmental and economic sustainabilityof wastewater-based resource recovery: A review. J. Clean. Prod. 2020, 265, 121598. [CrossRef]
8. Khan, M.Z.H.; Karim, M.R.; Haque, A.A.M.; Hossain, M.Z. Water supply and sanitation: For mega cities.In Proceedings of the Conference 5th International Symposium on New Technologies for Urban Safety ofMega Cities in Asia (USMCA), Phuket, Thailand, 10–12 February 2006.
9. Chen, Z.; Wu, Q.; Wu, G.; Hu, H.Y. Centralized water reuse system with multiple applications in urban areas:Lessons from China’s experience. Resour. Conserv. Recycl. 2017, 117, 125–136. [CrossRef]
10. Kim, H.; Son, J.; Lee, S.; Koop, S.; van Leeuwen, K.; Choi, Y.; Park, J. Assessing Urban Water ManagementSustainability of a Megacity: Case Study of Seoul, South Korea. Water 2018, 10, 682. [CrossRef]
11. Bouzas, A.; Martí, N.; Grau, S.; Barat, R.; Mangin, D.; Pastor, L. Implementation of a global P-recovery systemin urban wastewater treatment plants. J. Clean. Prod. 2019, 227, 130–140. [CrossRef]
12. Mo, W.; Zhang, Q. Energy-nutrients-water nexus: Integrated resource recovery in municipal wastewatertreatment plants. J. Environ. Manag. 2013, 127, 255–267. [CrossRef]

Water 2020, 12, 3466 25 of 35
13. Puchongkawarin, C.; Gomez-mont, C.; Stuckey, D.C.; Chachuat, B. Optimization-based methodology forthe development of wastewater facilities for energy and nutrient recovery. Chemosphere 2015, 140, 150–158.[CrossRef]
14. Van Der Hoek, J.P.; De Fooij, H.; Struker, A. Wastewater as a resource: Strategies to recover resources fromAmsterdam’s wastewater. Resour. Conserv. Recycl. 2016, 113, 53–64. [CrossRef]
15. Chrispim, M.C.; Scholz, M.; Nolasco, M.A. Phosphorus recovery from municipal wastewater treatment:Critical review of challenges and opportunities for developing countries. J. Environ. Manag. 2019, 248,109268. [CrossRef] [PubMed]
16. Sarvajayakesavalu, S.; Lu, Y.; Withers, P.J.A.; Pavinato, P.S.; Pan, G.; Chareonsudjai, P. Phosphorus recovery:A need for an integrated approach. Ecosyst. Health Sustain. 2018, 4, 48–57. [CrossRef]
17. Van der Kooij, S.; Van Vliet, B.J.M.; Stomph, T.J.; Sutton, N.B.; Anten, N.P.R.; Hoffland, E. Phosphorus recoveredfrom human excreta: A socio-ecological-technical approach to phosphorus recycling. Resour. Conserv. Recycl.2020, 157, 104744. [CrossRef]
18. Sánchez, A.S. Technical and economic feasibility of phosphorus recovery from wastewater in São Paulo’sMetropolitan Region. J. Water Process. Eng. 2020, 38, 101537. [CrossRef]
19. Wilcox, J.; Nasiri, F.; Bell, S.; Rahaman, M.S. Urban water reuse: A triple bottom line assessment frameworkand review. Sustain. Cities Soc. 2016, 27, 448–456. [CrossRef]
20. Romeiko, X.X. Comprehensive water footprint assessment of conventional and four alternative resourcerecovery based wastewater service options. Resour. Conserv. Recycl. 2019, 151, 104458. [CrossRef]
21. Papa, M.; Bertanza, G.; Abbà, A. Reuse of wastewater: A feasible option, or not? A decision support systemcan solve the doubt. Desalin. Water Treat. 2016, 57, 8670–8682. [CrossRef]
22. Laura, F.; Tamara, A.; Müller, A.; Hiroshan, H.; Christina, D.; Serena, C. Selecting sustainable sewage sludgereuse options through a systematic assessment framework: Methodology and case study in Latin America.J. Clean. Prod. 2020, 242, 1–12. [CrossRef]
23. O’Dwyer, E.; Chen, K.; Wang, H.; Wang, A.; Shah, N.; Guo, M. Optimisation of wastewater treatmentstrategies in eco-industrial parks: Technology, location and transport. Chem. Eng. J. 2020, 381. [CrossRef]
24. Kehrein, P.; van Loosdrecht, M.; Osseweijer, P.; Garfí, M.; Dewulf, J.; Posada, J. The SPPD-WRF Framework:A Novel and Holistic Methodology for Strategical Planning and Process Design of Water Resource Factories.Sustainability 2020, 12, 4168. [CrossRef]
25. Thornberg, D.; Jorgensen, P. Working towards P-recovery from sludge ash in Copenhagen. In Proceedings ofthe IWA Sweden, BIOFOS, Malmö, Sweden, 11 April 2018; pp. 1–16.
26. Woltersdorf, L.; Zimmermann, M.; Deffner, J.; Gerlach, M.; Liehr, S. Benefits of an integrated water andnutrient reuse system for urban areas in semi-arid developing countries. Resour. Conserv. Recycl. 2018, 128,382–393. [CrossRef]
27. Gallego-Schmid, A.; Tarpani, R.R.Z. Life cycle assessment of wastewater treatment in developing countries:A review. Water Res. 2019, 153, 63–79. [CrossRef]
28. Otoo, M.; Drechsel, P. Resource Recovery from Waste: Business Models for Energy, Nutrient and Water Reuse inLow- And Middle-Income Countries; Routledge: Abingdon, UK, 2018.
29. Cordell, D.; Rosemarin, A.; Schröder, J.J.; Smit, A.L. Towards global phosphorus security: A systemsframework for phosphorus recovery and reuse options. Chemosphere 2011, 84, 747–758. [CrossRef]
30. Ma, X.C.; Xue, X.; González-Mejía, A.; Garland, J.; Cashdollar, J. Sustainable water systems for the city oftomorrow-A conceptual framework. Sustainability 2015, 7, 12071–12105. [CrossRef]
31. Chrispim, M.C.; Scholz, M.; Nolasco, M.A. A framework for resource recovery from wastewater treatmentplants in megacities of developing countries. Environ. Res. 2020, 188, 109745. [CrossRef]
32. Arcadis. Sustainable Cities Water Index–Which Cities are Best Placed to Harness Water for Future Success?Available online: https://www.arcadis.com/media/4/6/2/%7B462EFA0A-4278-49DF-9943-C067182CA682%7DArcadisSustainableCitiesWaterIndex_003.pdf (accessed on 4 December 2020).
33. Feingold, D.; Koop, S.; van Leeuwen, K. The City Blueprint Approach: Urban Water Management andGovernance in Cities in the U.S. Environ. Manag. 2018, 61, 9–23. [CrossRef]
34. SDEWES Centre. SDEWES Index. Available online: https://www.sdewes.org/sdewes_index.php (accessed on4 December 2020).
35. United Nations. The World’s Cities in 2018. Available online: https://www.un.org/en/events/citiesday/assets/pdf/the_worlds_cities_in_2018_data_booklet.pdf (accessed on 10 September 2019).

Water 2020, 12, 3466 26 of 35
36. Cornejo, P.K.; Zhang, Q.; Mihelcic, J.R. How Does Scale of Implementation Impact the EnvironmentalSustainability of Wastewater Treatment Integrated with Resource Recovery? Environ. Sci. Technol. 2016, 50,6680–6689. [CrossRef]
37. Brunner, P.H.; Rechberger, H. Practical Handbook of Material Flow Analysis, 1st ed.; CRC Press: Boca Raton, FL,USA, 2004.
38. IBGE/SIDRA. Tabela 6778–Número de Estabelecimentos Agropecuários (Table 6778—Number of AgriculturalEstablishments). 2017. Available online: https://sidra.ibge.gov.br/tabela/6778#resultado (accessed on11 October 2019).
39. Ministério do Trabalho e Emprego (MTE) (Ministry of Labor and Employment). CadastroGeral de Empregados e Desempregados—Perfil do Munícipio (General Register of Employed andUnemployed—Profile of the Municipality), 2019. Available online: http://bi.mte.gov.br/bgcaged/caged_perfil_municipio/index.php (accessed on 12 October 2019).
40. Certi (Reference Center in Innovative Technologies). Planejamento e Modelagem do ParqueTecnológico de Santo André (Planning and Modeling of the Santo André Technology Park).Available online: http://www3.santoandre.sp.gov.br/parquetecnologico/wp-content/uploads/2019/08/CERTI-Etapa-2-Ecossistema-ABC-compactado.pdf (accessed on 10 October 2019).
41. IBGE. Produto Interno Bruto dos Municípios—Tabelas 2010–2017 (Gross Domestic Product ofMunicipalities—Tables 2010–2017). Available online: https://www.ibge.gov.br/estatisticas-novoportal/economicas/contas-nacionais/9088-produto-interno-bruto-dos-municipios.html?=&t=resultados(accessed on 8 February 2019).
42. Xavier, M.L.P.; Souza, A.N.C.; Rodrigues, J.P.; Bresciani, L.P. O novo perfil econômico do Grande ABC (Thenew economic profile of the Great ABC Region). Rev. Organ. Contexto 2007, 6, 103–122.
43. Sao Paulo City Council. Cadastramento de Unidades Produtivas (Registration of Production Units).Available online: https://ligueospontos.prefeitura.sp.gov.br/agricultura-familiar/cadastro/ (accessed on2 November 2019).
44. Caisan (Intersecretary Chamber of Food and Nutritional Security of São Paulo). 1oPlano Municipal de Segurança Alimentar e Nutricional (1st Municipal Food and NutritionalSecurity Plan). Available online: https://www.prefeitura.sp.gov.br/cidade/secretarias/upload/trabalho/
PLAMSANVERSAOFINALcompleta.pdf.%0A (accessed on 25 March 2020).45. IBGE/SIDRA. Tabela 6953—Número de Estabelecimentos com Horticultura (Table 6953—Number of
Establishments with Horticulture). Available online: https://sidra.ibge.gov.br/tabela/6953#resultado%0A(accessed on 20 November 2019).
46. Aquapolo. Sobre o Aquapolo (About Aquapolo). Available online: http://www.aquapolo.com.br/quem-somos/sobre-o-aquapolo/%0A (accessed on 1 March 2018).
47. Hildebrand, A.; Silva, P.C. SABESP: Relatório de Sustentabilidade 2019 (2019 SustainabilityReport). Available online: http://site.sabesp.com.br/site/uploads/file/relatorios_sustentabilidade/Relatorio_Sustentabilidade_2019_port.pdf (accessed on 5 May 2020).
48. Borges, N.B. Aproveitamento dos Resíduos Gerados no Tratamento Preliminar de Estações de Tratamentode Esgoto (Utilization of the Waste Generated in the Preliminary Treatment of Sewage Treatment Plants).Ph.D. Thesis, University of São Paulo, São Carlos, Brazil, 2014.
49. Cornejo, P.K. Environmental Sustainability of Wastewater Treatment Plants Integrated with Resource Recovery:The Impact of Context and Scale. Ph. D. Thesis, University of South Florida, Tampa, FL, USA, 2015.
50. Mehta, C.M.; Khunjar, W.O.; Nguyen, V.; Tait, S.; Batstone, D.J. Technologies to Recover Nutrients fromWaste Streams: A Critical Review. Crit. Rev. Environ. Sci. Technol. 2015, 45, 385–427. [CrossRef]
51. Nascimento, A.L.; de Souza, A.J.; Oliveira, F.C.; Coscione, A.R.; Viana, D.G.; Regitano, J.B. Chemical attributesof sewage sludges: Relationships to sources and treatments, and implications for sludge usage in agriculture.J. Clean. Prod. 2020, 258, 120746. [CrossRef]
52. Sun, Y.; Chen, Z.; Wu, G.; Wu, Q.; Zhang, F.; Niu, Z.; Hu, H. Characteristics of water quality of municipalwastewater treatment plants in China: Implications for resources utilization and management. J. Clean. Prod.2016, 131, 1–9. [CrossRef]

Water 2020, 12, 3466 27 of 35
53. National Water Agency. Demanda Hídrica na Indústria de Transformação em 2015-Resultados por UF, Municípioe Tipologia Industrial-Planilha (Water Demand in the Manufacturing Industry in 2015-Results by FU, Municipalityand Industrial Typology-Spreadsheet). Available online: https://metadados.ana.gov.br/geonetwork/srv/pt/main.home?uuid=c3cd1505-0a96-4b79-9604-4f69f8cec225%0A (accessed on 10 December 2019).
54. National Water Agency. Atlas Irrigação: Uso da Água na Agricultura Irrigada. Demanda Hídrica porTipologia, por Município e Unidade da Federação (Water use in Agriculture Irrigation. Water Demand perTypology, Municipality and Federation Unit). Available online: https://metadados.ana.gov.br/geonetwork/
srv/pt/main.home?uuid=c639ac44-8151-421d-a1ed-c333392d76a9%0A (accessed on 30 November 2019).55. Costa, E.F. Água de Reúso ETE (Reclaimed Water). Unpublished results. Sao Paulo, Brazil. Personal
communication, 2019.56. Secretary of Infrastructure and Environment. Consumo de Energia no Estado de São Paulo (Energy
Consumption in the State of São Paulo). Available online: http://dadosenergeticos.energia.sp.gov.br/Portalcev2/Municipios/ranking/index.html (accessed on 12 October 2019).
57. IBGE Indicadores de Desenvolvimento Sustentável: Tabela 768—Quantidade Comercializada de Fertilizantespor Área Plantada, Segundo o Tipo de Nutriente (Sustainable Development Indicators: Table 768—Amount ofFertilizers Traded by Planted Area, According to). Available online: https://sidra.ibge.gov.br/Tabela/768%0A(accessed on 1 December 2019).
58. IBGE. Produção Agrícola Municipal: Tabela 770—Utilização de Fertilizantes por Unidade de Área por Tipode Nutriente (Municipal Agricultural Production: Table 770—Use of Fertilizers Per Unit Area Per Type ofNutrient). Available online: https://www.ibge.gov.br/estatisticas-novoportal/economicas/contas-nacionais/9088-produto-interno-bruto-dos-municipios.html?=&t=resultados%0A (accessed on 2 August 2019).
59. IBGE. Produção Agrícola Municipal: Tabela 5457—Área Plantada ou Destinada à Colheita, Área Colhida,Quantidade Produzida, Rendimento Médio e Valor da Produção das Lavouras Temporárias e Permanentes(Municipal Agricultural Production: Table 5457—Area Planted). Available online: https://sidra.ibge.gov.br/tabela/5457%0A (accessed on 20 November 2019).
60. National Water Agency. Água na Indústria: Uso e Coeficientes Técnicos (Water in Industry: Use and TechnicalCoefficients). Available online: https://www.ana.gov.br/noticias/estudo-da-agencia-nacional-de-aguas-aborda-uso-da-agua-no-setor-industrial/agua-na-industria-uso-e-coeficientes-tecnicos-versao-final.pdf(accessed on 12 May 2019).
61. Kollar, K.L.; Macauley, P. Water requirements for industrial development (USA). J. Am. Water Works Assoc.1980, 71, 2–9. [CrossRef]
62. Federation of Industries of the State of São Paulo (FIESP). O Uso Racional da Água no Setor Industrial(Rational Water Use in Industrial Sector), 2nd ed.; Federation of Industries of the State of São Paulo, NationalConfederation of Industry: Brasilia, Brazil, 2017.
63. National Water Agency. Atlas Irrigação: Uso da Água na Agricultura Irrigada (Atlas Irrigation: Water Usein Irrigated Agriculture). Available online: https://arquivos.ana.gov.br/imprensa/publicacoes/AtlasIrrigacao-UsodaAguanaAgriculturaIrrigada.pdf (accessed on 12 May 2019).
64. SABESP. Conheça as Nossas Tarifas (Know our Rates—Sabesp). Available online: https://www9.sabesp.com.br/agenciavirtual/pages/template/siteexterno.iface?idFuncao=13%0A (accessed on 20 December 2019).
65. IEA. Mercado de Fertilizantes (Fertilizer Market). Available online: http://www.iea.sp.gov.br/out/TerTexto.php?codTexto=14447%0A (accessed on 13 November 2019).
66. Companhia Nacional de Abastecimento (National Company of Supply). Insumos Agropecuários(Agricultural Inputs). Available online: https://consultaweb.conab.gov.br/consultas/consultaInsumo.do?d-6983528-p=1&uf=SP&d-6983528-o=1&ano=2019&method=acaoListarConsulta&idSubGrupo=71&btnConsultar=Consultar&jcaptcha=rcu3&d-6983528-s=1&idGrupo=27 (accessed on 20 May 2005).
67. Ministry of Cities and IICA. Elaboração de Proposta do Plano de Ação Para Instituir Uma Políticade Reúso de Efluente Sanitário Tratado no Brasil: Produto VI—Plano de Ações/Política de Reúso(RF) (Preparation of a Proposal for the Action Plan to Institute a Policy for the Reuse of).Available online: https://antigo.mdr.gov.br/images/stories/ArquivosSNSA/interaguas/reuso/produto4_avaliacao_do_potencial_de_reuso.pdf (accessed on 4 December 2020).
68. Sao Paulo State Government. Resolução Conjunta SES/SMA/SSRH n◦ 1 (Joint Resolution 01); Sao Paulo StateGovernment: Sao Paulo, Brazil, 2017.
Water 2020, 12, 3466 28 of 35
69. Sao Paulo State Government. Resolução Conjunta SES/SIMA n◦ 1 (Joint Resolution 01); Sao Paulo StateGovernment: Sao Paulo, Brazil, 2020.
70. Sao Paulo State Government. Decreto n◦ 48.138 (Decree No. 48138); Assembléia Legislativa do Estado de SãoPaulo: Sao Paulo Brazil, 2003.
71. Cetesb (Environmental Agency of the State of Sao Paulo).Orientação Para Apresentação de Projeto Visando aAplicação de Água de Reuso Proveniente de Estação de Tratamento de Esgoto Doméstico na Agricultura(Guidance for Project Presentation Aiming at the Application of Reuse Water From Domestic SewageTreatment Plant in Agriculture). 2006. Available online: https://cetesb.sp.gov.br/aguas-subterraneas/publicacoes-e-relatorios/ (accessed on 20 February 2020).
72. Ministry of Cities and IICA. Elaboração de Proposta do Plano de Ação Para Instituir Uma Política de Reúso deEfluente Sanitário Tratado no Brasil: Produto III—Critérios de Qualidade da Água (RP01B) (Preparation of aProposal for the Action Plan to Institute a Policy for the Reuse o). Available online: https://arquivos.ana.gov.br/interaguas/MCID_Reuso_Produto3-CriteriosdeQualidadedaAguadeReuso.pdf (accessed on 15 May 2020).
73. Sao Paulo State. Government Resolução SMA no 079 (Joint Resolution 079); Environmental State Secretariat: SaoPaulo, Brazil, 2009.
74. Brazil. Lei no. 9.427 (Law No. 9.427); Government of Brazil: Brasilia, Brazil, 1996.75. PNUD and MMA. Produto 6—Resumo Executivo: Estudo Sobre o Potencial de Geração de Energia a partir
de Resíduos de Saneamento (Lixo, Esgoto), Visando Incrementar o Uso de Biogás Como Fonte Alternativade Energia Renovável (Product 6—Executive Summary: Study on the Potential for Energy Generation fromSanitation Waste (Garbage, Sewage), Aiming to Increase the Use of Biogas as an Alternative Source ofRenewable Energy). [WWW Document]. 2010. Available online: https://www.mma.gov.br/estruturas/164/
_publicacao/164_publicacao10012011033201.pdf (accessed on 3 March 2020).76. Agência Nacional de Energia Elétrica. Resolução Normativa n◦ 482 (Joint Resolution 482); Agência Nacional de
Energia Elétrica: Brasilia, Brazil, 2012.77. Joppert, C.L.; Perecin, D.; Santos, M.M.; Coelho, S.T.; Camacho, J.L.P. A short-cut model for predicting
biomethane availability after biogas upgrading. J. Clean. Prod. 2018, 200, 148–160. [CrossRef]78. Sao Paulo State Government. Decreto n◦ 60.001 (Decree No. 60001); Legislative Assembly of the State of Sao
Paulo: Sao Paulo, Brazil, 2013.79. Sao Paulo State Government. Decreto n◦ 60.298 (Decree No. 60298); Legislative Assembly of the State of Sao
Paulo: Sao Paulo, Brazil, 2014.80. National Environment Council (CONAMA). Resolução CONAMA 498 (Regulation CONAMA 498); National
Environment Council (CONAMA): Brasilia, Brazil, 2020.81. National Environment Council (CONAMA). Resolução CONAMA 375 (Regulation CONAMA 375); National
Environment Council (CONAMA): Brasilia, Brazil, 2006.82. MAPA (Ministério da Agricultura, Pecuária e Abastecimento or Ministry of Agriculture, Livestock and Supply).
Instrução Normativa N◦ 6 (Normative Instruction No. 6); MAPA: Brasilia, Brazil, 2016.83. Sao Paulo State Government. Lei n◦ 13.798 (Law No. 13798); Sao Paulo State Government: Sao Paulo, Brazil, 2009.84. Consórcio Intermunicipal Grande ABC (Intermunicipal Consortium Grande ABC). Plano de Ação de
Enfrentamento às Mudanças Climáticas do Grande ABC (Greater ABC Climate Change Action Plan). 2017.Available online: http://consorcioabc.sp.gov.br/imagens/noticia/Plano%20de%20Acao%20de%20Enfrentamento%20as%20Mudancas%20Climaticas%20do%20Grande%20ABC.pdf (accessed on 1 January 2020).
85. Sao Paulo. Plano Municipal de Saneamento Básico de São Paulo (Municipal Basic Sanitation Plan of SãoPaulo). 2019. Available online: https://gestaourbana.prefeitura.sp.gov.br/wp-content/uploads/2019/05/
PMSB_Caderno_Completo_-final-para-impressa%CC%83o.pdf (accessed on 2 May 2020).86. SSWM (Sustainable Sanitation and Water Management Toolbox). Week 4: Analyse the Institutional
Environment. 2019. Available online: https://sswm.info/iwmi-business-development/module-2-scanning-business-environment/m2-%E2%80%93-week-4%3A-analyse-the-institutional-environment (accessed on23 November 2019).
87. Lienert, J.; SSWM (Sustainable Sanitation and Water Management Toolbox). Stakeholder Identification.2019. Available online: https://sswm.info/planning-and-programming/exploring-tools/stakeholder-analysis/stakeholder-identification (accessed on 15 October 2019).

Water 2020, 12, 3466 29 of 35
88. De Boer, M.A.; Romeo-Hall, A.; Rooimans, T.; Slootweg, J. An Assessment of the Drivers and Barriers for theDeployment of Urban Phosphorus Recovery Technologies: A Case Study of The Netherlands. Sustainability2018, 10, 1790. [CrossRef]
89. McConville, J.R.; Künzle, R.; Messmer, U.; Udert, K.M.; Larsen, T.A. Decision Support for RedesigningWastewater Treatment Technologies. Environ. Sci. Technol. 2014, 48, 12238–12246. [CrossRef]
90. Iwaniec, D.M.; Metson, G.S.; Cordell, D. P-Futures: Towards urban food & water security throughcollaborative design and impact. Curr. Opin. Environ. Sustain. 2016, 20, 1–7. [CrossRef]
91. Harris-Lovett, S.; Lienert, J.; Sedlak, D. Towards a New Paradigm of Urban Water Infrastructure: IdentifyingGoals and Strategies to Support Multi-Benefit Municipal Wastewater Treatment. Water 2018, 10, 1127.[CrossRef]
92. Fang, L.L.; Valverde-Pérez, B.; Damgaard, A.; Plósz, B.G.; Rygaard, M. Life cycle assessment as developmentand decision support tool for wastewater resource recovery technology. Water Res. 2016, 88, 538–549.[CrossRef]
93. Andreoli, C.V.; Sperling, M.V.; Fernandes, F. Sludge Treatment and Disposal; IWA Publishing: London, UK, 2007.94. Tarpani, R.R.Z.; Azapagic, A. Life cycle costs of advanced treatment techniques for wastewater reuse and
resource recovery from sewage sludge. J. Clean. Prod. 2018, 204, 832–847. [CrossRef]95. Bolzonella, D.; Battistoni, P.; Susini, C.; Cecchi, F. Anaerobic codigestion of waste activated sludge and
OFMSW: The experiences of Viareggio and Treviso plants (Italy). Water Sci. Technol. 2006, 53, 203–211.[CrossRef] [PubMed]
96. Matheri, A.N.; Ndiweni, S.N.; Belaid, M.; Muzenda, E.; Hubert, R. Optimising biogas production fromanaerobic co-digestion of chicken manure and organic fraction of municipal solid waste. Renew. Sustain.Energy Rev. 2017, 80, 756–764. [CrossRef]
97. Brazil, National Secretary of Environmental Sanitation. Probiogás, 2015. Guia Técnico de AproveitamentoEnergético de Biogás em Estações de Tratamento de Esgoto (Technical Guide for Energy Use of Biogas inSewage Treatment Plants). Available online: https://www.giz.de/en/downloads/probiogas-guia-etes.pdf(accessed on 21 March 2020).
98. Bennamoun, L.; Arlabosse, P.; Léonard, A. Review on fundamental aspect of application of drying process towastewater sludge. Renew. Sustain. Energy Rev. 2013, 28, 29–43. [CrossRef]
99. Li, Y.; Wang, H.; Zhang, J.; Wang, J.; Lan, O. Co-Processing Sewage Sludge in Cement Kiln in China. J. WaterResour. Prot. 2013, 05, 906–910. [CrossRef]
100. Pries, R.T.A. Uso do Lodo de Esgoto Para Coprocessamento em Fornos de Clínquer (Use of Sewage Sludgefor Co-Processing in Clinker Kilns). Master’s Thesis, University of Paraná, Curitiba, Parana, Brazil, 2018.
101. Nättorp, A.; Remmen, K.; Remy, C. Cost assessment of different routes for phosphorus recovery fromwastewater using data from pilot and production plants. Water Sci. Technol. 2017, 76, 413–424. [CrossRef][PubMed]
102. Desmidt, E.; Ghyselbrecht, K.; Zhang, Y.; Pinoy, L.; Van Der Bruggen, B.; Verstraete, W.; Rabaey, K.;Meesschaert, B. Global phosphorus scarcity and full-scale P-recovery techniques: A review. Crit. Rev.Environ. Sci. Technol. 2015, 45, 336–384. [CrossRef]
103. Egle, L.; Rechberger, H.; Krampe, J.; Zessner, M. Phosphorus recovery from municipal wastewater: Anintegrated comparative technological, environmental and economic assessment of P recovery technologies.Sci. Total Environ. 2016, 571, 522–542. [CrossRef]
104. Arvin, E.; Henze, M.; Harremöes, P. Wastewater Treatment Biological and Chemical Processes; Polyteknisk Forlag:Copenhagen, Denmark, 2019; ISBN 978-87-502-1150-1.
105. Münch, E.V.; Barr, K. Controlled struvite crystallisation for removing phosphorus from anaerobic digestersidestreams. Water Res. 2001, 35, 151–159. [CrossRef]
106. Zhou, K.; Barjenbruch, M.; Kabbe, C.; Inial, G.; Remy, C. Phosphorus recovery from municipal and fertilizerwastewater: China’s potential and perspective. J. Environ. Sci. 2017, 52, 151–159. [CrossRef]
107. Xavier, L.D.; Cammarota, M.C.; Yokoyama, L.; Volschan, I. Study of the recovery of phosphorus from struviteprecipitation in supernatant line from anaerobic digesters of sludge. Water Sci. Technol. 2014, 69, 1546–1551.[CrossRef] [PubMed]
108. Stratful, I.; Scrimshaw, M.D.; Lester, J.N. Removal of Struvite to Prevent Problems Associated with itsAccumulation in Wastewater Treatment Works. Water Environ. Res. 2004, 76, 437–443. [CrossRef] [PubMed]

Water 2020, 12, 3466 30 of 35
109. Sikosana, M.; Randall, D.G.; Petrie, D.J.; Oelofse, M.; Russo, V.; Von Blottnitz, H. Nutrient and Energy Recoveryfrom Sewage: Towards an Integrated Approach; WRC Report; Water Research Comission: Gezina, South Africa,2016; ISBN 9781431207862.
110. Le Corre, K.S.; Valsami-Jones, E.; Hobbs, P.; Parsons, S.A. Phosphorus Recovery from Wastewater by StruviteCrystallization: A Review. Crit. Rev. Environ. Sci. Technol. 2009, 39, 433–477. [CrossRef]
111. Amann, A.; Zoboli, O.; Krampe, J.; Rechberger, H.; Zessner, M.; Egle, L. Environmental impacts of phosphorusrecovery from municipal wastewater. Resour. Conserv. Recycl. 2018, 130, 127–139. [CrossRef]
112. Ye, Y.; Ngo, H.H.; Guo, W.; Chang, S.W.; Nguyen, D.D.; Zhang, X.; Zhang, J.; Liang, S. Nutrient recoveryfrom wastewater: From technology to economy. Bioresour. Technol. Reports 2020, 100425. [CrossRef]
113. Shu, L.; Schneider, P.; Jegatheesan, V.; Johnson, J. An economic evaluation of phosphorus recovery as struvitefrom digester supernatant. Bioresour. Technol. 2006, 97, 2211–2216. [CrossRef]
114. Ahmed, M.; Chowdhury, H.; Rahman, H.; Uddin, S.A. Prospects of Using Wastewater as a Resource- NutrientRecovery and Energy Generation Prospects of Using Wastewater as a Resource-Nutrient Recovery andEnergy Generation. Am. J. Environ. Sci. 2015, 11, 99–114. [CrossRef]
115. Oyama, C. Nutrientes da Urina Humana Como Fertilizante Agrícola: Análise de Viabilidade EconômicaSobre um Modelo de Produção Baseado na Economia Solidária e na Agricultura Familiar (Nutrients ofHuman Urine as Agricultural Fertilizer: Economic Feasibility Analysis on a Production Model Based onSolidarity Economy and Family Agriculture). Master’s Thesis, Technological Research Institute of the Stateof São Paulo, Sao Paulo, Brazil, 2013.
116. Bena-Filho, N.B. Estruvita: Identificação de Potenciais Perigos e Eventos Perigosos no Processo de Produção,Percepção e Aceitabilidade de Agricultores Quanto ao Seu Uso Agrícola (Struvite: Identification of PotentialHazards and Hazardous Events in the Production Process, Perception and Acceptability of Farmers RegardingTheir Agricultural Use). Master’s Thesis, Federal University of Espirito Santo, Vitoria, Brazil, 2019.
117. Lassen, J. Technologies in organic farming: Consumers? Values and acceptance. In Know Your Food;Wageningen Academic Publishers: Wageningen, The Netherlands, 2015; pp. 40–271. ISBN 978-90-8686-264-1.
118. Fytili, D.; Zabaniotou, A. Utilization of sewage sludge in EU application of old and new methods—A review.Renew. Sustain. Energy Rev. 2008, 12, 116–140. [CrossRef]
119. Tyagi, V.K.; Lo, S.-L. Sludge: A waste or renewable source for energy and resources recovery? Renew. Sustain.Energy Rev. 2013, 25, 708–728. [CrossRef]
120. Samolada, M.C.; Zabaniotou, A.A. Comparative assessment of municipal sewage sludge incineration,gasification and pyrolysis for a sustainable sludge-to-energy management in Greece. Waste Manag. 2014, 34,411–420. [CrossRef]
121. Sabesp. Uso de Lodo de Esgoto na Agricultura—Estudo de Caso: Produzindo Fertilizantes na Estaçãode Tratamento de Franca (Use of Sewage Sludge in Agriculture—Case Study: Producing Fertilizersat the Franca Treatment Station). Available online: http://www.sabesp.com.br/Sabesp/filesmng.nsf/DC466180BB9121BF8325760F006AEB08/$File/uso_lodo_esgoto_agricultura.pdf (accessed on 15 March 2020).
122. Shiu, H.-Y.; Lee, M.; Chiueh, P.-T. Water reclamation and sludge recycling scenarios for sustainable resourcemanagement in a wastewater treatment plant in Kinmen islands, Taiwan. J. Clean. Prod. 2017, 152, 369–378.[CrossRef]
123. Souza, R.A.S.; González, M.D.M.; Santos, J.L.; Aparício, I.; Bissani, C.A.; Alonso, E. Metais pesados ecompostos orgânicos tóxicos em lodo de esgoto e composto de lixo produzidos na cidade de Porto Alegre,RS (Heavy metals and toxic organic compounds from waste produced in Porto Alegre). In Proceedings ofthe XXXIII Congresso Brasileiro de Ciência do Solo, Uberlândia, Brazil, 31 July–5 August 2011.
124. Onwosi, C.O.; Igbokwe, V.C.; Odimba, J.N.; Eke, I.E.; Nwankwoala, M.O.; Iroh, I.N.; Ezeogu, L.I. Compostingtechnology in waste stabilization: On the methods, challenges and future prospects. J. Environ. Manag. 2017,190, 140–157. [CrossRef] [PubMed]
125. Visentin, R. Viabilidade econômica da compostagem de lodo de esgoto para fins agrícolas (Economic viabilityof composting sewage sludge for agricultural purposes). Master’s Thesis, Paulista State University, Botucatu,Brazil, 2019.
126. Kacprzak, M.; Neczaj, E.; Fijałkowski, K.; Grobelak, A.; Grosser, A.; Worwag, M.; Rorat, A.; Brattebo, H.;Almås, Å.; Singh, B.R. Sewage sludge disposal strategies for sustainable development. Environ. Res. 2017,156, 39–46. [CrossRef] [PubMed]

Water 2020, 12, 3466 31 of 35
127. Wei, Y.-S.; Fan, Y.-B.; Wang, M.-J. A cost analysis of sewage sludge composting for small and mid-scalemunicipal wastewater treatment plants. Resour. Conserv. Recycl. 2001, 33, 203–216. [CrossRef]
128. Oliveira, F.C. Compostagem de lodo (Sewage sludge composting). Tera Ambiental. Unpublished results.Sao Paulo, Brazil. Personal communication, 2020.
129. Delovitch, E.; Ringskog, K. Wastewater Treatment in Latin America: Old and New Options; The InternationalBank for Reconstruction and Development/The World Bank: Washington, DC, USA, 1997; Volume 1,ISBN 0821339699.
130. La Cour Jansen, J.; Gruvberger, C.; Hanner, N.; Aspegren, H.; Avärd, Å. Digestion of sludge and organicwaste in the sustainability concept for Malmö, Sweden. Water Sci. Technol. 2004, 49, 163–169. [CrossRef]
131. CS Bioenergia. Bioenergia (Bioenergy). Available online: http://csbioenergia.com.br/bioenergia/#processo(accessed on 15 April 2020).
132. Edelmann, W.; Engeli, H.; Gradenecker, M. Co-digestion of organic solid waste and sludge from sewagetreatment. Water Sci. Technol. 2000, 41, 213–221. [CrossRef]
133. Doehler, H.; Eckel, H.; Froeba, N. Faustzahlen Biogas (Rule of thumb biogas). Darmstadt: Kuratorium FürTechnik Und Bauwesen In der Landwirtschaft (Board of Trustees for Technology and Building in Agriculture).2013; 360.
134. Edwards, J.; Othman, M.; Crossin, E.; Burn, S. Anaerobic co-digestion of municipal food waste and sewagesludge: A comparative life cycle assessment in the context of a waste service provision. Bioresour. Technol.2017, 223, 237–249. [CrossRef]
135. Brazil, National Secretary of Environmental Sanitation. Probiogás, 2016. Análise da ViabilidadeTécnico-Econômica de Produção de Energia Elétrica em ETEs no Brasil a Partir do Biogás (Analysisof the Technical and Economic Feasibility of Producing Electricity in WWTPs in Brazil from Biogas).Available online: https://www.giz.de/en/downloads/Probiogas-EVTE-ETEs.pdf (accessed on 23 March 2020).
136. Wiese, J. Co-Digestion of Organic Waste on Wastewater Treatment Plants and Biogas Plants. In Proceedingsof the Summer School on Wastewater and Biosolids Management, Patras, Greece, 22–27 July 2019; p. 35.
137. Forbes, R.; Fortin, A.; de Andrade, B.H.; Sa, L. Exploring the Feasibility of Water Resource and RecoveryFacility (WRRF) Biogas Utilization in Brazil. Proc. Water Environ. Fed. 2018, 2018, 4090–4101. [CrossRef]
138. Felca, A.T.A.; Barros, R.M.; Tiago Filho, G.L.; dos Santos, I.F.S.; Ribeiro, E.M. Analysis of biogas produced bythe anaerobic digestion of sludge generated at wastewater treatment plants in the South of Minas Gerais,Brazil as a potential energy source. Sustain. Cities Soc. 2018, 41, 139–153. [CrossRef]
139. Ornelas-Ferreira, B.; Lobato, L.C.S.; Colturato, L.F.D.; Torres, E.O.; Pombo, L.M.; Pujatti, F.J.P.; Araújo, J.C.;Chernicharo, C.A.L. Strategies for energy recovery and gains associated with the implementation of asolid state batch methanization system for treating organic waste from the city of Rio de Janeiro—Brazil.Renew. Energy 2020, 146, 1976–1983. [CrossRef]
140. Krupp, M.; Schubert, J.; Widmann, R. Feasibility study for co-digestion of sewage sludge with OFMSW ontwo wastewater treatment plants in Germany. Waste Manag. 2005, 25, 393–399. [CrossRef]
141. Syed-Hassan, S.S.A.; Wang, Y.; Hu, S.; Su, S.; Xiang, J. Thermochemical processing of sewage sludge toenergy and fuel: Fundamentals, challenges and considerations. Renew. Sustain. Energy Rev. 2017, 80, 888–913.[CrossRef]
142. Associação Brasileira de Cimento Portland (ABCP, Brazilian Portland Cement Association). 2019. Panoramado Coprocessamento 2019—Ano Base 2017 (2019 Coprocessing Outlook—Base Year 2017). Available online:https://abcp.org.br/wp-content/uploads/2019/11/Panoramaco_processamento_2019_v2-bx.pdf (accessed on11 March 2020).
143. AFNOR. Caracterisation des Boues- Bonne Pratique pour le Séchage des Boues; Technical Report FD X33-047;AFNOR: Paris, France, 2008.
144. Arlabosse, P.; Ferrasse, H.; Lecomte, D.; Crine, M.; Dumont, Y.; Léonard, A. Efficient Sludge ThermalProcessing: From Drying to Thermal Valorization. In Modern Drying Technology; Wiley-VCH: Weinheim,Germany, 2012; Volume 4, pp. 295–329. ISBN 9783527631681.
145. Husillos Rodríguez, N.; Martínez-Ramírez, S.; Blanco-Varela, M.T.; Donatello, S.; Guillem, M.; Puig, J.; Fos, C.;Larrotcha, E.; Flores, J. The effect of using thermally dried sewage sludge as an alternative fuel on Portlandcement clinker production. J. Clean. Prod. 2013, 52, 94–102. [CrossRef]
146. Nadal, M.; Schuhmacher, M.; Domingo, J.L. Cost-benefit analysis of using sewage sludge as alternative fuelin a cement plant: A case study. Environ. Sci. Pollut. Res. 2009, 16, 322–328. [CrossRef] [PubMed]
Water 2020, 12, 3466 32 of 35
147. Lv, D.; Zhu, T.; Liu, R.; Lv, Q.; Sun, Y.; Wang, H.; Liu, Y.; Zhang, F. Effects of co-processing sewage sludge incement kiln on NO, NH3 and PAHs emissions. Chemosphere 2016, 159, 595–601. [CrossRef]
148. Xu, J.; Ping, L.; Cao, H.; Liu, W.; Gu, Y.; Lin, X.; Huang, J. Application status of co-processing municipalsewage sludge in cement kilns in China. Sustainability 2019, 11, 3315. [CrossRef]
149. Rulkens, W. Sewage sludge as a biomass resource for the production of energy: Overview and assessment ofthe various options. Energy Fuels 2008, 22, 9–15. [CrossRef]
150. Bertanza, G.; Baroni, P.; Canato, M. Ranking sewage sludge management strategies by means of DecisionSupport Systems: A case study. Resour. Conserv. Recycl. 2016, 110, 1–15. [CrossRef]
151. Zabaniotou, A.; Theofilou, C. Green energy at cement kiln in Cyprus-Use of sewage sludge as a conventionalfuel substitute. Renew. Sustain. Energy Rev. 2008, 12, 531–541. [CrossRef]
152. Kääntee, U.; Zevenhoven, R.; Backman, R.; Hupa, M. Cement manufacturing using alternative fuels and theadvantages of process modelling. Fuel Process. Technol. 2004, 85, 293–301. [CrossRef]
153. Cornel, P.; Schaum, C. Phosphorus recovery from wastewater: Needs, technologies and costs.Water Sci. Technol. 2009, 59, 1069–1076. [CrossRef]
154. Wong, P.Y.; Cheng, K.Y.; Kaksonen, A.H.; Sutton, D.C.; Ginige, M.P. A novel post denitrification configurationfor phosphorus recovery using polyphosphate accumulating organisms. Water Res. 2013, 47, 6488–6495.[CrossRef] [PubMed]
155. Batista, J.R.; Jeong, H. Prediction of struvite formation potential in EBPR digested sludges. In Proceedingsof the Water Environment Federation (WEFTEC 2006), Dallas, TX, USA, 22–25 October 2006; Volume 2006,pp. 5185–5196.
156. Kataki, S.; West, H.; Clarke, M.; Baruah, D.C. Phosphorus recovery as struvite from farm, municipal andindustrial waste: Feedstock suitability, methods and pre-treatments. Waste Manag. 2016, 49, 437–454.[CrossRef] [PubMed]
157. Tomei, M.C.; Stazi, V.; Daneshgar, S.; Capodaglio, A.G. Holistic Approach to Phosphorus Recovery fromUrban Wastewater: Enhanced Biological Removal Combined with Precipitation. Sustainability 2020, 12, 575.[CrossRef]
158. Moretti, S.M.L.; Bertoncini, E.I.; Vitti, A.C.; Alleoni, L.R.F.; Abreu-Junior, C.H. Concentration of Cu, Zn,Cr, Ni, Cd, and Pb in soil, sugarcane leaf and juice: Residual effect of sewage sludge and organic compostapplication. Environ. Monit. Assess. 2016, 188, 163. [CrossRef] [PubMed]
159. Khadra, A.; Ezzariai, A.; Merlina, G.; Capdeville, M.-J.; Budzinski, H.; Hamdi, H.; Pinelli, E.; Hafidi, M.Fate of antibiotics present in a primary sludge of WWTP during their co-composting with palm wastes.Waste Manag. 2019, 84, 13–19. [CrossRef] [PubMed]
160. Di Maria, F.; Sordi, A.; Cirulli, G.; Micale, C. Amount of energy recoverable from an existing sludge digesterwith the co-digestion with fruit and vegetable waste at reduced retention time. Appl. Energy 2015, 150, 9–14.[CrossRef]
161. Di Maria, F.; Sordi, A.; Cirulli, G.; Gigliotti, G.; Massaccesi, L.; Cucina, M. Co-treatment of fruit and vegetablewaste in sludge digesters. An analysis of the relationship among bio-methane generation, process stabilityand digestate phytotoxicity. Waste Manag. 2014, 34, 1603–1608. [CrossRef]
162. Rouhollahi, Z.; Ebrahimi-Nik, M.; Ebrahimi, S.H.; Abbaspour-Fard, M.H.; Zeynali, R.; Bayati, M.R. Farmbiogas plants, a sustainable waste to energy and bio-fertilizer opportunity for Iran. J. Clean. Prod. 2020, 253,119876. [CrossRef]
163. Uusitalo, A.; Uusitalo, V.; Grönman, A.; Luoranen, M.; Jaatinen-Värri, A. Greenhouse gas reduction potentialby producing electricity from biogas engine waste heat using organic Rankine cycle. J. Clean. Prod. 2016, 127,399–405. [CrossRef]
164. Visedo, G.; Marcelo, P.C. Roadmap Tecnológico do Cimento: Potencial de Redução das Emissões deCarbono da Indústria do Cimento Brasileira Até 2050 (Technological Cement Roadmap: Potential toReduce Emissions Carbon Emissions from the Brazilian Cement Industry by 2050). Available online:http://snic.org.br/noticias-ver.php?id=28 (accessed on 3 December 2019).
165. United Nations Environment Programme (UNEP). Technical guidelines on the environmentally sound coprocessing of hazardous wastes in cement kilns. In Proceedings of the Conference of the Parties to the BaselConvention on the Control of Transboundary Movements of Hazardous Wastes and Their Disposal Tenthmeeting, Cartagena, Colombia, 17–21 October 2011.

Water 2020, 12, 3466 33 of 35
166. CETESB (Environmental Agency of the State of Sao Paulo). Estudo de Baixo Carbono Para a Indústria de Cimentono Estado de São Paulo de 2014 a 2030 (Low Carbon Study for the Cement Industry in the State of São Paulo from2014 to 2030). 2018. Available online: URLhttps://cetesb.sp.gov.br/proclima/wp-content/uploads/sites/36/2018/09/
CIMENTO-PUBLICA%C3%87%C3%83O_on-line.pdf (accessed on 30 November 2020).167. Saad, D.; Byrne, D.; Drechsel, P. Social perspectives on the effective management of wastewater.
In Physico-Chemical Wastewater Treatment and Resource Recovery; InTech: London, UK, 2017; pp. 253–267.168. Martins, E.S.C.S. Efeito do Armazenamento Sobre as Características de Urina e Águas Amarelas (Effect of
Storage on Urine and Yellow Water Characteristics). Master’s Thesis, State University of Paraiba, CampinaGrande, Brazil, 2016.
169. Delanka-Pedige, H.M.K.; Munasinghe-Arachchige, S.P.; Abeysiriwardana-Arachchige, I.S.A.;Nirmalakhandan, N. Wastewater infrastructure for sustainable cities: Assessment based on UNsustainable development goals (SDGs). Int. J. Sustain. Dev. World Ecol. 2020, 1–7. [CrossRef]
170. Aguasan. Circular Economy—Transforming Waste into Resources: From Linear to Circular Water and SanitationModels; Swiss Agency ford Development and Cooperation: Spiez, Switzerland, 2017; pp. 1–6.
171. Kurian, M. The water-energy-food nexus. Environ. Sci. Policy 2017, 68, 97–106. [CrossRef]172. Andersson, K.; Otoo, M.; Nolasco, M. Innovative sanitation approaches could address multiple development
challenges. Water Sci. Technol. 2018, 77, 855–858. [CrossRef] [PubMed]173. Marttunen, M.; Mustajoki, J.; Sojamo, S.; Ahopelto, L.; Keskinen, M. A Framework for Assessing Water
Security and the Water–Energy–Food Nexus—The Case of Finland. Sustainability 2019, 11, 2900. [CrossRef]174. Ramôa, A.R.; McConville, J.; Lüthi, C.; Matos, J.S. Use of process guides for comprehensive urban sanitation
technology decision-making: Practice versus theory. Water Policy 2018, 20, 158–174. [CrossRef]175. Allesch, A.; Brunner, P.H. Material Flow Analysis as a Decision Support Tool for Waste Management: A
Literature Review. J. Ind. Ecol. 2015, 19, 753–764. [CrossRef]176. Yiougo, L.S.A.; Spuhler, D. SSWM (Sustainable Sanitation and Water Management Toolbox). Stakeholder
Identification. Available online: https://sswm.info/ar/sswm-university-course/module-4-sustainable-water-supply/
further-resources-water-sources-software/material-flow-analysis-%28mfa%29 (accessed on 5 May 2018).177. Krause, A.; Rotter, V.S. Linking energy-sanitation-agriculture: Intersectional resource management in
smallholder households in Tanzania. Sci. Total Environ. 2017, 590–591, 514–530. [CrossRef]178. Brazil. Resolução n◦ 687. (Joint Resolution No. 687). Brazil. 2015. Available online: https://microinversor.
com.br/resolucao-normativa-687-aneel/?v=9a5a5f39f4c7 (accessed on 7 July 2020).179. MAPA (Ministério da Agricultura, Pecuária e Abastecimento or Ministry of Agriculture, Livestock and
Supply). 2006. Instrução Normativa SDA n◦ 27. (Normative Instruction N. 27). Brazil. Available online:https://www.legisweb.com.br/legislacao/?id=76854 (accessed on 20 January 2020).
180. MAPA (Ministério da Agricultura, Pecuária e Abastecimento or Ministry of Agriculture, Livestockand Supply). 2009. Instrução Normativa SDA/MAPA n◦ 25. (Normative Instruction N. 25).Brazil. Available online: http://sistemasweb.agricultura.gov.br/sislegis/action/detalhaAto.do?method=
recuperarTextoAtoTematicaPortal&codigoTematica=1229186 (accessed on 20 January 2020).181. MAPA (Ministério da Agricultura, Pecuária e Abastecimento or Ministry of Agriculture, Livestock
and Supply). 2016. Instrução Normativa SDA n◦ 7. (Normative Instruction No. 7). Brazil.Available online: https://www.lex.com.br/legis_27129277_INSTRUCAO_NORMATIVA_N_7_DE_12_DE_ABRIL_DE_2016.aspx (accessed on 24 January 2020).
182. Ministry of the Environment. Resolução n◦ 153. (Joint Resolution No. 153). Brazil. 2013. Available online:http://www.cnrh.gov.br/aguas-subterraneas/1715-resolucao-153-recarga/file (accessed on 30 March 2019).
183. Miranda-Sampaio, L. Tendências recentes da espacialização das indústrias e serviços em São Paulo e no ABCpaulista (Recent trends in the spatial distribution of industries and services in São Paulo and ABC paulista).Econ. Soc. Territ. 2015, 15, 483–515.
184. National Agency for Petroleum, Natural Gas and Biofuels. Resolução n◦ 685 (Joint Resolution No. 685).Brazil. 2017. Available online: http://legislacao.anp.gov.br/?path=legislacao-anp/resol-anp/2017/junho&item=ranp-685--2017 (accessed on 10 March 2019).
185. National Water Agency (ANA). Resolução n◦ 744. (Joint Resolution No. 744). Brazil. 2017. Available online:http://arquivos.ana.gov.br/resolucoes/2017/744-2017.pdf. (accessed on 10 April 2019).
Water 2020, 12, 3466 34 of 35
186. Página Rural (Rural Page). SP: Agricultura Resiste no Grande ABC (SP: Agriculture Resists in Greater ABC)2005. Available online: http://www.paginarural.com.br/noticia/24485/sp-agricultura-resiste-no-grande-abc(accessed on 10 March 2019).
187. Rostichelli, M. Entre a Terra e o Asfalto: A região Metropolitana de São Paulo no contexto da AgriculturaUrbana (Between Earth and Asphalt: The Metropolitan Region of São Paulo in the context of UrbanAgriculture). Master’s Thesis, in Geography. University of Sao Paulo, São Paulo, 2013.
188. Sao Caetano do Sul City. Lei n◦ 5.316 (Law No. 5316). Brazil. 2015. Available online:https://leismunicipais.com.br/a/sp/s/sao-caetano-do-sul/lei-ordinaria/2015/531/5316/lei-ordinaria-n-5316-2015-aprova-o-plano-municipal-de-educacao-e-da-outras-providencias (accessed on 2 June 2019).
189. Sao Paulo City. Lei n◦ 16.174 (Law No. 16174). Brazil. 2015. Available online: https://www.legisweb.com.br/legislacao/?id=283663 (accessed on 15 February 2020).
190. Sao Paulo State Government. Decreto n◦ 58.107 (Decree No. 58107). Brazil. 2012. Available online: https://www.al.sp.gov.br/repositorio/legislacao/decreto/2012/decreto-58107-05.06.2012.html (accessed on 5 May 2019).
191. Sao Paulo State Water and Sewage Services Company (SABESP) Sustainability Report 2018.Available online: http://site.sabesp.com.br/site/uploads/file/relatorios_sustentabilidade/sabesp_rs_2018_portugues.pdf (accessed on 6 July 2019).
192. Tchobanoglous, G.; Stensel, H.D.; Tsuchihashi, R.; Burton, F.; Abu-Orf, M.; Bowden, G.; Pfrang, W. Metcalf &Eddy/AECOM: Tratamento de Efluentes e Recuperação de Recursos (Wastewater Treatment and Resource Recovery),5th ed.; AMGH Editora Ltd.: Porto Alegre, Brazil, 2015; p. 2008.
193. Brazil (National Environment Council-CONAMA). Resolution Number 499 of National EnvironmentCouncil of 6 October 2020. Licenciamento de co-processamento de resíduos em fornos rotativosde produção de clínquer (Licensing of co-processing of waste in rotary kilns for clinker production).Available online: https://www.in.gov.br/en/web/dou/-/resolucao-conama/mma-n-499-de-6-de-outubro-de-2020-281790575 (accessed on 1 November 2020).
194. Brazil Resolution number 316 of National Environment Council (CONAMA) of 29 October 2002. Dispõe SobreProcedimentos e Critérios Para o Funcionamento de Sistemas de Tratamento Térmico de Resíduos (Providesfor Procedures and Criteria for the Operation of Thermal Waste Treatment Systems). Available online:https://www.legisweb.com.br/legislacao/?id=98287 (accessed on 2 October 2019).
195. Brazil Resolution number 436 of National Environment Council of 22 December 2011. Estabelece os LimitesMáximos de Emissão de Poluentes Atmosféricos Para Fontes Fixas Instaladas ou Com Pedido de Licença deInstalação Anteriores a 02 de Janeiro de 2007 (Establishes Maximum limits for Emissions of AtmosphericPollutants). Available online: https://www.normasbrasil.com.br/norma/resolucao-436-2011_114141.html(accessed on 20 January 2020).
196. Cao, H.; Liu, J.; Xu, J.; Liu, W.; Huang, X.; Li, G. The Property of Lime Sewage Sludge and its Influence onCo-Processing in Cement Kilns. Pol. J. Environ. Stud. 2016, 25, 959–971. [CrossRef]
197. CETESB (Environmental Agency of the State of Sao Paulo). Norma Técnica n◦ P4. 263, de Dezembro de 2003(Technical Standard No. P4. 263 of December 2003). Procedimento para Utilização de Resíduos em Fornos deProdução de Clínquer (Procedure for Using Wastes in Kilns for Clinker Production). 2003. Available online:https://cetesb.sp.gov.br/camaras-ambientais/wp-content/uploads/sites/21/2013/12/P4_263.pdf (accessed on4 December 2020).
198. Favaro Junior, D. Co-Processamento de Resíduos Industriais em Fornos de Clínquer (Co-Processing of IndustrialWaste in Clinker Kilns); Cia de Cimento Itambé: Balsa Nova, Brazil, 2018.
199. Hannoun, G. Energetic potential and environmental assessment of solid wastes as alternative fuel for cementplants. Appl. Ecol. Environ. Res. 2019, 17, 15151–15168. [CrossRef]
200. Kim, H.-W.; Han, S.-K.; Shin, H.-S. The optimisation of food waste addition as a co-substrate in anaerobicdigestion of sewage sludge. Waste Manag. Res. 2003, 21, 515–526. [CrossRef] [PubMed]
201. Leite, T.A. Compostagem termofílica de lodo de esgoto: Higienização e produção de biossólido para usoagrícola (Thermophilic composting of sewage sludge: Cleaning and production of biosolids for agriculturaluse). Master’s Thesis, University of Sao Paulo, São Paulo, Brazil, 2015.
202. Leite, V.D.; Barros, A.J.M.; Menezes, J.M.C.; de Sousa, J.T.; Lopes, W.S. Codigestão anaeróbia de resíduosorgânicos. Rev. DAE 2017, 65, 35–46. [CrossRef]
203. Modaresi, Z.K.; Karimi, G.; Mowla, D. Study of co-combustion of dried sewage sludge with coke:Thermogravimetric assessment and gaseous emissions. J. Environ. Chem. Eng. 2019, 7, 102871. [CrossRef]

Water 2020, 12, 3466 35 of 35
204. Rahman, A.; Rasul, M.G.; Khan, M.M.K.; Sharma, S. Recent development on the uses of alternative fuels incement manufacturing process. Fuel 2015, 145, 84–99. [CrossRef]
205. Rizk, M.C.; Bergamasco, R.; Tavares, C.R.G. Anaerobic Co-digestion of Fruit and Vegetable Waste and SewageSludge. Int. J. Chem. React. Eng. 2007, 5. [CrossRef]
206. Sao Paulo (State). Resolution of Secretary of the Environment N. 38 of May 31, 2017; Secretary of Environment ofthe State of Sao Paulo: Sao Paulo, Brazil, 2017.
207. Sosnowski, P.; Klepacz-Smolka, A.; Kaczorek, K.; Ledakowicz, S. Kinetic investigations of methaneco-fermentation of sewage sludge and organic fraction of municipal solid wastes. Bioresour. Technol.2008, 99, 5731–5737. [CrossRef]
208. Udaeta, M.E.M.; Medeiros, G.A.; da Silva, V.O.; Galvão, L.C.R. Basic and procedural requirements for energypotential from biogas of sewage treatment plants. J. Environ. Manag. 2019, 236, 380–387. [CrossRef]
209. Flaga, A. The Aspects of Sludge Thermal Utilization. Available online: https://pdfs.semanticscholar.org/18ce/
db07850fd28afc5695ed1f8497a1c6687355.pdf (accessed on 9 February 2020).210. CSBio. Bioenergia (Bioenergy). 2019. Available online: http://csbioenergia.com.br/portfolio/videos/
(accessed on 30 November 2020).
Publisher’s Note: MDPI stays neutral with regard to jurisdictional claims in published maps and institutionalaffiliations.
© 2020 by the authors. Licensee MDPI, Basel, Switzerland. This article is an open accessarticle distributed under the terms and conditions of the Creative Commons Attribution(CC BY) license (http://creativecommons.org/licenses/by/4.0/).
Copyright © 2022 FDOKUMEN