Shooting Labels: 3D Semantic Labeling by Virtual Reality - arXiv
8
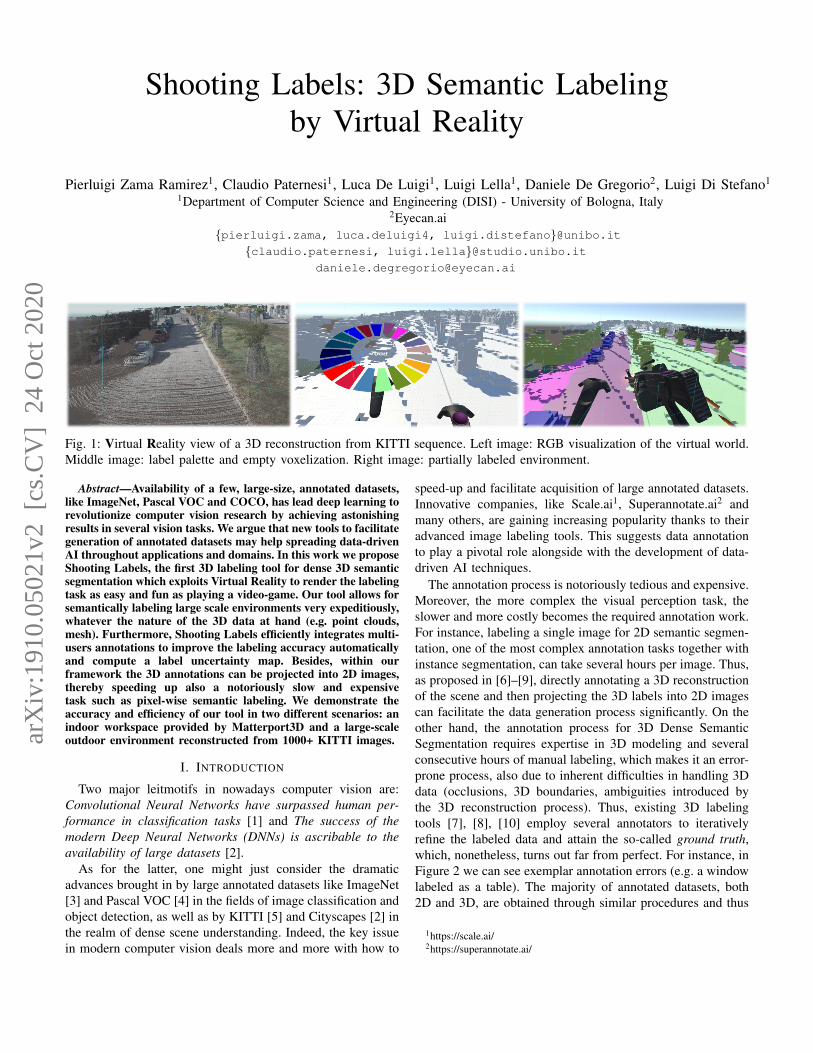
Shooting Labels: 3D Semantic Labeling by Virtual Reality Pierluigi Zama Ramirez 1 , Claudio Paternesi 1 , Luca De Luigi 1 , Luigi Lella 1 , Daniele De Gregorio 2 , Luigi Di Stefano 1 1 Department of Computer Science and Engineering (DISI) - University of Bologna, Italy 2 Eyecan.ai {pierluigi.zama, luca.deluigi4, luigi.distefano}@unibo.it {claudio.paternesi, luigi.lella}@studio.unibo.it [email protected] Fig. 1: Virtual Reality view of a 3D reconstruction from KITTI sequence. Left image: RGB visualization of the virtual world. Middle image: label palette and empty voxelization. Right image: partially labeled environment. Abstract—Availability of a few, large-size, annotated datasets, like ImageNet, Pascal VOC and COCO, has lead deep learning to revolutionize computer vision research by achieving astonishing results in several vision tasks. We argue that new tools to facilitate generation of annotated datasets may help spreading data-driven AI throughout applications and domains. In this work we propose Shooting Labels, the first 3D labeling tool for dense 3D semantic segmentation which exploits Virtual Reality to render the labeling task as easy and fun as playing a video-game. Our tool allows for semantically labeling large scale environments very expeditiously, whatever the nature of the 3D data at hand (e.g. point clouds, mesh). Furthermore, Shooting Labels efficiently integrates multi- users annotations to improve the labeling accuracy automatically and compute a label uncertainty map. Besides, within our framework the 3D annotations can be projected into 2D images, thereby speeding up also a notoriously slow and expensive task such as pixel-wise semantic labeling. We demonstrate the accuracy and efficiency of our tool in two different scenarios: an indoor workspace provided by Matterport3D and a large-scale outdoor environment reconstructed from 1000+ KITTI images. I. I NTRODUCTION Two major leitmotifs in nowadays computer vision are: Convolutional Neural Networks have surpassed human per- formance in classification tasks [1] and The success of the modern Deep Neural Networks (DNNs) is ascribable to the availability of large datasets [2]. As for the latter, one might just consider the dramatic advances brought in by large annotated datasets like ImageNet [3] and Pascal VOC [4] in the fields of image classification and object detection, as well as by KITTI [5] and Cityscapes [2] in the realm of dense scene understanding. Indeed, the key issue in modern computer vision deals more and more with how to speed-up and facilitate acquisition of large annotated datasets. Innovative companies, like Scale.ai 1 , Superannotate.ai 2 and many others, are gaining increasing popularity thanks to their advanced image labeling tools. This suggests data annotation to play a pivotal role alongside with the development of data- driven AI techniques. The annotation process is notoriously tedious and expensive. Moreover, the more complex the visual perception task, the slower and more costly becomes the required annotation work. For instance, labeling a single image for 2D semantic segmen- tation, one of the most complex annotation tasks together with instance segmentation, can take several hours per image. Thus, as proposed in [6]–[9], directly annotating a 3D reconstruction of the scene and then projecting the 3D labels into 2D images can facilitate the data generation process significantly. On the other hand, the annotation process for 3D Dense Semantic Segmentation requires expertise in 3D modeling and several consecutive hours of manual labeling, which makes it an error- prone process, also due to inherent difficulties in handling 3D data (occlusions, 3D boundaries, ambiguities introduced by the 3D reconstruction process). Thus, existing 3D labeling tools [7], [8], [10] employ several annotators to iteratively refine the labeled data and attain the so-called ground truth, which, nonetheless, turns out far from perfect. For instance, in Figure 2 we can see exemplar annotation errors (e.g. a window labeled as a table). The majority of annotated datasets, both 2D and 3D, are obtained through similar procedures and thus 1 https://scale.ai/ 2 https://superannotate.ai/ arXiv:1910.05021v2 [cs.CV] 24 Oct 2020
-
Upload
khangminh22 -
Category
Documents
-
view
1 -
download
0
Transcript of Shooting Labels: 3D Semantic Labeling by Virtual Reality - arXiv
Shooting Labels: 3D Semantic Labelingby Virtual Reality
Pierluigi Zama Ramirez1, Claudio Paternesi1, Luca De Luigi1, Luigi Lella1, Daniele De Gregorio2, Luigi Di Stefano1
1Department of Computer Science and Engineering (DISI) - University of Bologna, Italy2Eyecan.ai
{pierluigi.zama, luca.deluigi4, luigi.distefano}@unibo.it{claudio.paternesi, luigi.lella}@studio.unibo.it
Fig. 1: Virtual Reality view of a 3D reconstruction from KITTI sequence. Left image: RGB visualization of the virtual world.Middle image: label palette and empty voxelization. Right image: partially labeled environment.
Abstract—Availability of a few, large-size, annotated datasets,like ImageNet, Pascal VOC and COCO, has lead deep learning torevolutionize computer vision research by achieving astonishingresults in several vision tasks. We argue that new tools to facilitategeneration of annotated datasets may help spreading data-drivenAI throughout applications and domains. In this work we proposeShooting Labels, the first 3D labeling tool for dense 3D semanticsegmentation which exploits Virtual Reality to render the labelingtask as easy and fun as playing a video-game. Our tool allows forsemantically labeling large scale environments very expeditiously,whatever the nature of the 3D data at hand (e.g. point clouds,mesh). Furthermore, Shooting Labels efficiently integrates multi-users annotations to improve the labeling accuracy automaticallyand compute a label uncertainty map. Besides, within ourframework the 3D annotations can be projected into 2D images,thereby speeding up also a notoriously slow and expensivetask such as pixel-wise semantic labeling. We demonstrate theaccuracy and efficiency of our tool in two different scenarios: anindoor workspace provided by Matterport3D and a large-scaleoutdoor environment reconstructed from 1000+ KITTI images.
I. INTRODUCTION
Two major leitmotifs in nowadays computer vision are:Convolutional Neural Networks have surpassed human per-formance in classification tasks [1] and The success of themodern Deep Neural Networks (DNNs) is ascribable to theavailability of large datasets [2].
As for the latter, one might just consider the dramaticadvances brought in by large annotated datasets like ImageNet[3] and Pascal VOC [4] in the fields of image classification andobject detection, as well as by KITTI [5] and Cityscapes [2] inthe realm of dense scene understanding. Indeed, the key issuein modern computer vision deals more and more with how to
speed-up and facilitate acquisition of large annotated datasets.Innovative companies, like Scale.ai1, Superannotate.ai2 andmany others, are gaining increasing popularity thanks to theiradvanced image labeling tools. This suggests data annotationto play a pivotal role alongside with the development of data-driven AI techniques.
The annotation process is notoriously tedious and expensive.Moreover, the more complex the visual perception task, theslower and more costly becomes the required annotation work.For instance, labeling a single image for 2D semantic segmen-tation, one of the most complex annotation tasks together withinstance segmentation, can take several hours per image. Thus,as proposed in [6]–[9], directly annotating a 3D reconstructionof the scene and then projecting the 3D labels into 2D imagescan facilitate the data generation process significantly. On theother hand, the annotation process for 3D Dense SemanticSegmentation requires expertise in 3D modeling and severalconsecutive hours of manual labeling, which makes it an error-prone process, also due to inherent difficulties in handling 3Ddata (occlusions, 3D boundaries, ambiguities introduced bythe 3D reconstruction process). Thus, existing 3D labelingtools [7], [8], [10] employ several annotators to iterativelyrefine the labeled data and attain the so-called ground truth,which, nonetheless, turns out far from perfect. For instance, inFigure 2 we can see exemplar annotation errors (e.g. a windowlabeled as a table). The majority of annotated datasets, both2D and 3D, are obtained through similar procedures and thus
1https://scale.ai/2https://superannotate.ai/
arX
iv:1
910.
0502
1v2
[cs
.CV
] 2
4 O
ct 2
020

Fig. 2: Matterport 3D dataset. From left to right: RGB mesh, ground-truth provided by Matterport, Uncertainty map by multi-user integration, best results obtained with our tool. Circled in red we highlight the errors in the Matterport ground-truth (tableas furniture, windows as table) avoided by labeling with our tool. Circled in white we show high uncertainty labels (e.g. 3Dboundaries).
may show some mistakes, leading to biased rankings whenemployed to benchmark the accuracy of algorithms.
Based on these considerations, in this work we proposeShooting Labels, a novel tool based on Virtual Reality (VR) toease the dense 3D semantic labeling, so as to gather 3D and2D data endowed with semantic annotations. To the best of ourknowledge, ours is the first system which allows for handlingefficiently large-scale 3D semantic labeling processes, suchas labeling whole city blocks. Moreover, by exploiting VirtualReality to make the task of labeling as easy and fun as playinga video-game, our approach remarkably reduces the expertisenecessary to work with 3D semantic labeling tools. Theimmersive experience provided by VR technologies allows theuser to physically move around within the scenario she/he iswilling to label and interact with objects in a natural andengaging way. The user is transported into a large virtualenvironment represented as 3D meshes, where surfaces canbe “colored” semantically in a highly captivating way (see.Figure 1 for some in-game visualizations).
The full fledged gamification of our tool empowers a largercommunity to undertake this type of activity and enablesthe possibility to obtain much more annotated data. Forthis reason, our tool features a multi-player post-processingprocedure wherein we integrate results of several annotatorsto both improve accuracy and compute a labeling uncertaintymap which provides information about the reliability of theproduced ground truth.
The novel contributions of this paper can thus be summa-rized as follows:
• To the best of our knowledge, we propose the first 3Ddense labeling tool based on Virtual Reality.
• Our immersive game-style interface enables users withoutspecific expertise to label 3D data expeditiously.
• Our tool can work with the most common 3D data
structures and with large scale scenarios.• We propose an approach to integrate multi-player results
in order to extract information about the reliability ofthe generated ground truth. Thus, unlike existing tools,our provide both semantic labels and their associateduncertainty.
• We label a whole sequence of KITTI and an entire houseof Matterport3D and release annotations dealing withboth 3D data and 2D images.
Our open-source framework is based on Unity3, Blender4
and open3D [11]. Project page: https://github.com/pierlui92/Shooting-Labels.
II. RELATED WORKS
We review the literature concerning Semantic Segmentationdatasets and the user experience associated with 3D denseannotation.
Semantic Segmentation Datasets Several datasets featur-ing 2D images annotated with semantic labels are available.The most popular are KITTI [5] and Cityscapes [2], which,yet, contain a relatively small number of images semanticallyannotated by hand. They were two of the first datasets pro-posed in this area (urban outdoor), so the focus was more onthe data than on how to generate them. On the other hand, theMapillary dataset [12] includes many more images, thoughthe labeling was still performed manually image by image.The same is true for some indoor datasets, such as [13] and[14], in which, although smart graphical tools are used toproduce frame-by-frame annotations, the order of magnitudeof the available images is only slightly higher. Conversely, in[6] an efficient pipeline for indoor environments is proposed,which allows for scanning a room, reconstruct it in 3D and
3https://unity.com/4https://www.blender.org/

1. SPLIT 2. VOXELIZE
POINTCLOUD
MESH
4. EXPORT3. VR LABELING
5. MULTI-PLAYER INTEGRATION
.
.
.
6. FILLING
PRE-PROCESSING IN-GAME
POST-PROCESSING
Fig. 3: The six steps of the Shooting Labels pipeline. 1- Splitting 3D data (a mesh or point cloud) into chunks to optimizevisualization in the VR environment. 2- In case of point clouds, voxelization enables real-time rendering and reduces memoryfootprint 3- Semantic labeling by Virtual Reality. 4- Exporting annotated data into the original format 5- Integrating multi-playerresults to improve labeling and assess the reliability of the labels (optional). 6- Filling of unlabeled elements (optional).
then easily label the gathered 3D data rather than each singleimage. In [7] such procedure is formally extended with aprojection module which, based on known camera poses,brings the 3D labels into 2D. The label projection approachwas then exploited in other datasets, such as [15] and [9].It can be observed that, leveraging on 3D reconstruction andcamera tracking to facilitate labeling, may be thought of asshifting the cost of labeling each individual image towardthe complexity of the requirements necessary to obtain asuitable dataset (tracked camera). This benefit is even moreevident in synthetic datasets, such as [8], [16], [17], whereobviously both camera tracking and 3D reconstruction areno longer external elements but inherent to the renderingengine. Recently [18]–[20] have proposed large urban outdoor2D-3D datasets where the annotation task is performed onpoint clouds and semantically labeled images are attained byprojection.
User Experience As for “how to generate the data”, theuser experience associated with 3D Dense Annotation israrely addressed in literature. Indeed, this procedure typicallyinvolves professional software and 3D modeling experience.Some authors have expressly addressed this by proposingelegant, efficient solutions. In [21] the authors have proposedan interactive procedure by means of which the user canphysically touch the scene within a classical 3D reconstructionpipeline, so as to “color” large parts of the scene by exploitingregion growing techniques. In [22], instead, the authors builda physical device able to reproduce the pipeline while theuser navigates the environment in Augmented Reality, using alaser pointer to identify the homogeneous areas of the sceneand assign them a correct label. Differently, our proposalintroduces a Virtual Reality framework to navigate within thereconstructed environments, providing the user with a series ofgamification tools to “color” the world in a fast and intuitive

manner. To the best of our knowledge, ours is the first methodthat allows for labeling very-large-scale scenes in a short timeby a VR approach.
III. VR LABELING TOOL
In this section we describe the key features of our tool.Shooting Labels works with the most popular 3D representa-tions, such as point cloud and meshes, which can be obtainedby any kind of 3D reconstruction technique. Moreover, withour tool we can also load a 3D scene pre-labeled by anyother technique (e.g. a CNN for 3D semantic segmentation)in order to refine it. As shown in Figure 3, our pipeline canbe summarized into 6 main steps grouped into 3 stages, withthe first stage dealing with Pre-processing of the input 3DData, the second with In-Game labeling and the third withPost-processing of the labeled 3D data.
A. Pre-Processing of the Input 3D Data
Meshes and point clouds obtained by 3D reconstructiontechniques typically consist of millions of vertices which canhardly be rendered in real-time in a VR environment. Forthis reason, with both meshes and point clouds we employ aLevel Of Detail strategy to mitigate the computational demand.As illustrated in the first step of Figure 3, we split meshesand point clouds in several chunks, saving each chunk at 3different resolutions. During VR labeling session, objects closeto the player are loaded at a higher resolution than those faraway. Furthermore, as point clouds cannot be managed bythe Unity gaming engine, we voxelize them (see Figure 3)in order to obtain a friendly visualization both in terms oflight computation and user-experience during navigation. Toperform voxelization we set a discretization step and for eachposition of the dense 3D grid build a cube mesh if that volumecontains a minimum number of points (e.g. > 5).
B. In-Game Labeling
3D meshes are loaded into the Virtual World and theuser can explore and label the environment. The player canteleport or physically move around the scene to reach eachportion of the environment. The following features have beenimplemented to enhance and simplify the user experience:• Geometric and RGB visualization• Unlabeled Face Visualization• Level of Detail (LOD)• Labeling Granularity• Export of Final ResultsGeometric and RGB Visualization To assign a semantic
label to a mesh, the user paints on the geometric view ofthe object (Figure 1 middle picture). However, in the 3Dreconstruction objects may be difficult to disambiguate withoutcolor cues. To address this, in the case of meshes, we directlyvisualize the RGB version of the mesh if available. As forpoint clouds, we noticed that coarse RGB voxelizations canlead the user to misunderstand the scene. Thus, we visualizedirectly the RGB point cloud, building a mesh object for eachpoint to enable visualization of this type of data also within
the Unity rendering system (Figure 1 left image). We didnot employ this kind of visualization during labeling becausethe interaction with this type of data can be extremely slow.However, we obtain smooth rendering performances for onlythe visualization.
Unlabeled Face Visualization Reaching some portion ofthe 3D space can be hard (e.g small hidden faces), or the usermight wish to visualize the progress of its labeling. Thus, wekeep track of the faces labeled by the user and, at any moment,allow the user to visualize only the faces still unlabeled.
Level of Detail As already mentioned, we implementa Level Of Detail (LOD) optimization to enable real-timerendering of large-scale scenarios. For each chunk obtained bysplitting the mesh we keep 3 versions at different LOD anddynamically load at high resolution only the meshes within anaction range. The user can interact only with the meshes at thehighest resolution, those closest to him, thereby significantlyalleviating the overall computational burden.
Labeling Granularity A user may require different labelingresolution degrees so as to, e.g., colour either large surfacesor small details. Therefore, she/he can choose between a poolof different weapons which feature different action ranges,thereby enabling either a more precise or faster labeling. Theuser chooses the current label from a color palette (Figure 1,central picture) and when shooting toward a direction we coloreach face within the weapon action range of the first hit face.When hitting a face, in Unity we know only the hit face andwe must find each face up to a range. As analyzing all facesof the scene can be extremely slow, thus impractical for real-time rendering, we search between the faces belonging onlyto the same object chunk.
Exporting Final Results At the end of VR Labeling phasewe can save the progress or export the annotated mesh. Duringexport chunks are merged together into the original mesh. Incase the source data was a point cloud, we assign to each 3Dpoint the label of the corresponding voxel.
C. Post-Processing of the Labeled 3D Data
Once the labeled data have been exported, the tool offerssome optional post-processing step.
Multi-Player Integration The gamification process poten-tially enlarge the pool of possible users of our tool. Thus,we can exploit the redundancy of labeling to predict the mostconfident label for each face or point. Let us denote as S ourmesh or point cloud, composed of several elements, e, i.e.faces or points respectively. For each point or face e ∈ S wedefine as H its corresponding histogram of labels, as assignedto it by different players. We can assign to each element eits most confident label by simply finding the most frequentlabel:
e = argmax(H), e ∈ S (1)
Label Uncertainty Since the annotation process by a singleuser may contain errors, we might wish to assess upon theuncertainty associated with each label.

Play
er
Bed
Cei
ling
Cha
ir
Floo
r
Furn
iture
Obj
ect
Pict
ure
Sofa
Tabl
e
Wal
l
Win
dow
Perc
.Lab
eled
mIo
U
1 74.63 95.19 69.35 84.16 78.83 58.66 74.74 85.99 55.14 86.86 71.84 97.04 75.942 76.37 90.29 72.45 88.16 80.87 60.76 77.36 82.39 62.20 85.65 69.43 94.56 76.903 74.15 93.53 71.19 80.28 67.14 50.12 66.80 80.43 56.56 86.31 70.02 94.31 72.414 - 90.07 70.74 80.12 58.78 44.89 64.32 80.60 38.79 84.72 68.93 88.44 62.005 77.69 89.10 35.99 77.76 56.09 41.87 46.90 33.36 40.49 80.95 44.25 91.76 56.77
Integr. 81.46 94.80 77.34 87.02 79.46 64.27 75.35 89.68 57.70 89.83 74.93 94.47 79.26
TABLE I: Comparison between single player and multi-player results on the Matterport 3D dataset [9]. Best results in bold.
Play
er
Bed
Cei
ling
Cha
ir
Floo
r
Furn
iture
Obj
ect
Pict
ure
Sofa
Tabl
e
Wal
l
Win
dow
Perc
.Lab
eled
mIo
U
1 73.77 95.18 68.09 82.94 78.04 56.28 73.79 85.56 54.29 86.13 71.58 100 75.062 75.90 90.28 65.55 84.69 78.31 55.44 76.00 67.00 58.60 84.05 68.19 100 73.093 73.21 93.23 67.00 77.54 65.27 48.08 65.57 75.25 52.64 84.46 68.68 100 70.094 - 88.86 57.47 73.92 54.73 39.56 59.50 68.01 30.52 80.93 65.67 100 56.295 71.56 88.82 35.13 73.79 54.49 38.55 46.13 32.30 38.50 78.59 43.89 100 54.71
Integr. 80.33 94.70 70.27 83.00 77.90 57.98 74.51 82.94 53.86 87.85 73.85 100 76.11
Integr.0.5 80.36 94.71 70.30 83.02 77.94 57.99 74.58 82.86 53.95 87.87 73.86 100 76.13Integr.0.65 77.97 94.85 70.15 82.13 77.84 57.24 74.71 85.28 50.65 87.91 74.78 100 75.77Integr.0.8 75.17 94.40 68.62 81.10 77.91 55.62 73.21 81.91 47.40 87.13 70.27 100 73.89
TABLE II: Comparison between filling single users, multi-player integration and multi-player integration based on labeluncertainty on the Matterport 3D dataset [9]. Best results of filling without uncertainty in bold. Best result of filling integrationusing uncertainty in red.
Given n annotators we can easily get the label probabilitydistribution P = H
n for each element e. From the probabilitydistribution we can calculate its entropy:
E = −∑
p log p (2)
The entropy of that distribution can be treated as the un-certainty of the labeling for that element, ue. We can leveragethis uncertainty to decide which points should be considerednoisy ground truth in the annotation process. Moreover, wecould exploit it to refine only the high entropy elements bothmanually or by means of suitable algorithms.
Filling Some users may decide to label only partiallythe whole scenario. Moreover, during the pre-processing wemay lose information about few faces where no labels willbe available. For these reasons, Shooting Labels providesa function for automatic filling missing elements based ontheir neighborhood. We define Sunlabeled the set of elementswithout any label assigned and Slabeled the set of elementswith a label assigned such as S = Slabeled∪Sunlabeled. Givenone point sunlabeled ∈ Sunlabeled, we can find its K closestelements slabeled ∈ Slabeled and their labels, and build thehistogram H of labels of its neighborhood. Then we can easilyinfer its label:
y = argmax(H) (3)
In a multi-player setting we can leverage the uncertaintyinformation to further improve the precision and accuracyof the labeling by semantically filling also high uncertainty
elements by means of their neighborhood. More precisely,given a fixed uncertainty threshold thu, we consider unlabeledelements that have their uncertainty us above thu:
Slabeled = {s ∈ Slabeled|us > thu} (4)
Sunlabeled = Sunlabeled ∪ Slabeled (5)
For each sunlabeled ∈ Sunlabeled we can find its neighbor-hood composed of its K closest elements ek. For each ekwe know its labels yk and its uncertainty information uk.Thus, we can build a weighted histogram of labels for theconsidered neighborhood, Hu, collecting the votes for eachlabel multiplied by their own uncertainty.
At this point the label of sunlabeled will be y =argmax(Hu).
Obtaining 2D Segmentations We leverage the 3D segmen-tation to produce 2D segmentations of known RGB images. Ifa specific set of images comes along its intrinsic and extrinsiccamera parameters we can seamlessly render the segmentationthrough the Blender render engine.
IV. EXPERIMENTAL RESULTS
A. Efficiency and Accuracy of the Tool
To evaluate the efficiency and performance of our tool wetested it on the Matterport 3D dataset [10]. To perform theevaluation we considered the labeling provided by Matterportas our ground truth. Their labeling has been attained through a

Multi-Player Integration Multi-Player Integration and FillingLabel Uncertainty by Multi-Player
LabelingMulti-Player Integration and Filling Exploiting
Uncertainty
Fig. 4: Qualitative comparison of different combination of post-processing steps. From left to right: results after only themulti-player integration step; multi-player integration and filling steps without using label uncertainty; label uncertainty map;multi-player integration and uncertainty aware filling. We can notice that the fourth image has much smoother edges than thesecond one thanks to exploitation of the uncertainty map.
series of refinement steps based on several different tools andexpertises. They first produced a coarse annotation with a firsttool for planar surface labeling, then they used the ScanNetcrowd-sourcing interface by Dai et al. [7] to “paint” trianglesand name all object instances of the house. Finally a team of10 expert annotators refined, fixed and verified the quality ofthe final labeling. In ours tests we labeled an entire Matterporthouse5 made out of 6 rooms based on the 13 classes of objectsdefined in [23] (eigen13 categories). We exploit the mappingprovided by Matterport from their labeling to eigen13 to obtainground truths used for testing. They provide face-wise labelssince ground truth are meshes. Therefore, we evaluated ourresults using a mean intersection over union weighted on thearea of the faces:
IoU cfaces =
ATP
ATP +AFN +AFPwhere c ∈ Cl (6)
mIoUfaces =1
N
∑c∈Cl
IoU cfaces (7)
where Cl is the set of classes, N is the total number ofclasses, ATP , AFN , AFP represent the total area of the truepositive, false negative and false positive faces respectivelyfor a class c. Furthermore, we provide the percentage of areaof faces annotated Alabeled over the total area of the labeledground truth Atotal.
Perc.Area =Alabeled
Atotal% (8)
Single Player and Multi-Player Integration Results Weevaluated the annotation of 5 different players without anyexpertise in 3D modeling. The annotators are 16 to 60 yearsold, with little or no background in VR systems. We compared
5Matterport House ID: 2t7WUuJeko7
their results with the ground truth provided by Matterport. Theresults are shown in Table I. The average time needed forthe labeling was approximately 2.5 hours. Even though thereare users who achieved low labeling performances (player 4and 5), we notice that integrating results of all players yieldthe best overall performances of 79.26% mIoU, surpassing theaccuracy of each single user. As we wanted to analyze what arethe most common errors in labeling, we inspected qualitativelyeach single player results noticing that most frequent errors arecorrelated with 3D object boundaries and ambiguous object.Therefore, we manually investigate also the GT provided byMatterport finding the same types of errors. In Figure 2, wecircled in white the errors on object boundaries while in redthe completely mismatching object between our labeling andthe Matterport ground truth. In the second row we note that awindow (Blue Label) was labeled as a Table (Red Label) in theMatterport GT while with our tool we did not encounter thaterror. We also found a case of an ambiguous object where astool has been labeled as an Object (Light Blue Label) bythe Matterport ground truth while as a chair by our users(Green Label). These ambiguities and errors in both labelingmight be the main cause of achieving lower mIoU score in ourlabeling and therefore, discarding them with our uncertaintyinformation should lead to better overall performances.
Uncertainty Map Evaluation By integrating the results ofseveral users we computed the label uncertainty map shownin the third column of Figure 4 and Figure 2. As we wishto evaluate the quality of our labeling, we analyzed theperformances of our labeled mesh at different uncertaintythresholds. In Figure 5 we show the mIoU and the Perc.Arealabeled at different uncertainty thresholds. For each thresholdwe evaluated the mIoU only on the elements with lower uncer-tainty than the threshold. We see that the higher the thresholdthe lower the mIoU, symptom of a good uncertainty map.In Figure 2 the third column are the uncertainty maps of the

50,00
55,00
60,00
65,00
70,00
75,00
80,00
85,00
90,00
95,00
100,00
0,1 0,2 0,3 0,4 0,5 0,6
Uncertainty threshold
Perc.Area mIoU
Fig. 5: Evaluation at different threshold of uncertainty. Themore noisy labels we discard the higher mIoU wrt Matter-port3D ground truth.
labeling where warmer color represents higher uncertainty. Wenotice that while white circled error are always correlated tohigh uncertainty, red circled errors might have low uncertainty.This happens because there are object that the majority of theannotators labeled in the same way while they are labeleddifferent in Matterport ground truth which is correlated to anerror in the Matterport ground truth (Windows labeled as aTable).
Filling Results w/ or w/o Uncertainty Table II shows theresults of the filling step in various settings. The first five rowsreport the results obtained by applying filling immediatelyafter the single player annotation. These rows highlight thatwe were able to fill all the unlabeled faces obtaining Perc.Areaof 100% and slightly lower performance. We can see a similartrend also in multi-player integration results where we scorea 76.11% mIoU while gaining a +5.53% on the Perc.Arealabeled and losing only the 3.15% in mIoU with respect to theresults without filling. The last three rows report the results offilling by exploiting the uncertainty map and using differentthreshold levels, i.e. 0.5, 0.65 and 0.8 respectively, with thebest results of 76.13% mIoU attained with threshold 0.5. Thedecreasing trend with higher threshold can be explained think-ing that using a higher threshold corresponds with consideringgood a lot of uncertain elements making filling too difficultand noisy. Figure 4 depicts a qualitative comparison betweenfilling strategies. From left to right we can see the labeledmesh before the filling, the mesh filled without uncertainty, theuncertainty map and filling exploiting uncertainty. We high-light how, though the increase in performance in uncertaintyaware filling is small, the qualitative results highlight a muchsmoother labeling.
3D to 2D Projection Figure 6 illustrates qualitative resultsof the 2D labels obtained by projecting 3D labels. Giventhe availability of the RGB image (top left image) and itsassociated camera intrinsic and extrinsic parameters, we canconfigure the Blender rendering engine and position the virtualcamera in order to obtain the 2D render of the scene. Peculiarlyto our tool, we can also provide a 2D uncertainty map by
Fig. 6: Matterport3D: projection of 3D labels into 2D labels.Top Left: RGB image with known camera pose. Bottom Left:2D labels from a semantically filled mesh without exploitinguncertainty. Top Right: 2D uncertainty map. Bottom Right:2D labels from a semantically filled mesh by exploitinguncertainty.
projecting the 3D uncertainty map. Bottom left and rightimages are rendered from the filled mesh with (right) orwithout (left) exploiting uncertainty. We can notice that theright image has smoother edges and several blobs are lessnoisy. The render took place in approximately 1 second on aGTX 1080 Ti, much less than the hours needed by manualpixel-wise annotation.
Large Scale Outdoor Labeling We evaluated the effective-ness of our tool in a challenging outdoor scenario: the KittiOdometry Dataset [5]. We used the provided 3D Lidar dataof a static sequence6, consisting of more than 1000 imagesequipped with ground truth camera poses. We reconstructedthe point cloud, then voxelized and labeled it by our tool. Then,we were able to annotate the whole sequence in approximately8 hours, a much shorter time compared to other non-VR toolsuch as [20] which needed about 51 hours for each sequence.Moreover, we could obtain the 2D semantic segmentationassociated with the 1000 RGB input images in a few minutesof rendering. Figure 7 reports qualitative results dealing withour 3D labeling and examples of projected 3D labels.
V. CONCLUSIONS AND FUTURE WORKS
We have proposed the first 3D semantic labeling tool basedon Virtual Reality (VR). Our tool exploits VR alongside withgamification to ease and expedite 3D semantic labeling of largescale scenarios and enlarge the pool of possible annotatorsto people without any knowledge about 3D modeling. Thetool works with the most popular 3D data structures, such asmeshes and point clouds. Moreover, we have shown how tointegrate results from multiple users in order to achieve anoverall better performance as well as uncertainty map of thelabeling process. We have also demonstrated how to integratethe uncertainty map in the labeling process in order to furtherimprove the results.
6Kitti Sequence 2011_09_30_drive_0020_sync

Fig. 7: 3D and 2D Labeling from a Kitti sequence. Top Left: RGB point cloud. Bottom Left: labeled point cloud obtained byusing our tool. Right: RGB images and projected semantic labels
We argue that the label uncertainty information may alsobe leveraged while training deep neural networks for semanticsegmentation, e.g. so as to weight the labels in the loss basedon their associate uncertainty, as proposed in some recentworks dealing with stereo vision [24]. Moreover, availabilityof uncertainty maps may foster the design of novel perfor-mance evaluation metrics which would take into account theuncertainty of labels.
REFERENCES
[1] K. He, X. Zhang, S. Ren, and J. Sun, “Delving deep into rectifiers:Surpassing human-level performance on imagenet classification,” inProceedings of the IEEE international conference on computer vision,2015, pp. 1026–1034.
[2] M. Cordts, M. Omran, S. Ramos, T. Rehfeld, M. Enzweiler, R. Be-nenson, U. Franke, S. Roth, and B. Schiele, “The cityscapes datasetfor semantic urban scene understanding,” in Proceedings of the IEEEconference on computer vision and pattern recognition, 2016, pp. 3213–3223.
[3] O. Russakovsky, J. Deng, H. Su, J. Krause, S. Satheesh, S. Ma,Z. Huang, A. Karpathy, A. Khosla, M. Bernstein et al., “Imagenet largescale visual recognition challenge,” International journal of computervision, vol. 115, no. 3, pp. 211–252, 2015.
[4] M. Everingham, S. A. Eslami, L. Van Gool, C. K. Williams, J. Winn,and A. Zisserman, “The pascal visual object classes challenge: Aretrospective,” International journal of computer vision, vol. 111, no. 1,pp. 98–136, 2015.
[5] A. Geiger, P. Lenz, C. Stiller, and R. Urtasun, “Vision meets robotics:The kitti dataset,” The International Journal of Robotics Research,vol. 32, no. 11, pp. 1231–1237, 2013.
[6] B.-S. Hua, Q.-H. Pham, D. T. Nguyen, M.-K. Tran, L.-F. Yu, and S.-K.Yeung, “Scenenn: A scene meshes dataset with annotations,” in 2016Fourth International Conference on 3D Vision (3DV). IEEE, 2016, pp.92–101.
[7] A. Dai, A. X. Chang, M. Savva, M. Halber, T. Funkhouser, andM. Nießner, “Scannet: Richly-annotated 3d reconstructions of indoorscenes,” in Proceedings of the IEEE Conference on Computer Visionand Pattern Recognition, 2017, pp. 5828–5839.
[8] J. McCormac, A. Handa, S. Leutenegger, and A. J. Davison, “Scenenetrgb-d: Can 5m synthetic images beat generic imagenet pre-trainingon indoor segmentation?” in Proceedings of the IEEE InternationalConference on Computer Vision, 2017, pp. 2678–2687.
[9] A. Chang, A. Dai, T. Funkhouser, M. Halber, M. Niessner, M. Savva,S. Song, A. Zeng, and Y. Zhang, “Matterport3d: Learning from rgb-ddata in indoor environments,” International Conference on 3D Vision(3DV), 2017.
[10] A. Chang, A. Dai, T. Funkhouser, M. Halber, M. Niebner, M. Savva,S. Song, A. Zeng, and Y. Zhang, “Matterport3d: Learning from rgb-ddata in indoor environments,” in 2017 International Conference on 3DVision (3DV). IEEE, 2017, pp. 667–676.
[11] Q.-Y. Zhou, J. Park, and V. Koltun, “Open3D: A modern library for 3Ddata processing,” arXiv:1801.09847, 2018.
[12] G. Neuhold, T. Ollmann, S. Rota Bulo, and P. Kontschieder, “Themapillary vistas dataset for semantic understanding of street scenes,” inProceedings of the IEEE International Conference on Computer Vision,2017, pp. 4990–4999.
[13] N. Silberman, D. Hoiem, P. Kohli, and R. Fergus, “Indoor segmentationand support inference from rgbd images,” in European Conference onComputer Vision. Springer, 2012, pp. 746–760.
[14] S. Song, S. P. Lichtenberg, and J. Xiao, “Sun rgb-d: A rgb-d sceneunderstanding benchmark suite,” in Proceedings of the IEEE conferenceon computer vision and pattern recognition, 2015, pp. 567–576.
[15] I. Armeni, S. Sax, A. R. Zamir, and S. Savarese, “Joint 2d-3d-semanticdata for indoor scene understanding,” arXiv preprint arXiv:1702.01105,2017.
[16] A. Handa, V. Patraucean, V. Badrinarayanan, S. Stent, and R. Cipolla,“Understanding real world indoor scenes with synthetic data,” in Pro-ceedings of the IEEE Conference on Computer Vision and PatternRecognition, 2016, pp. 4077–4085.
[17] W. Li, S. Saeedi, J. McCormac, R. Clark, D. Tzoumanikas, Q. Ye,Y. Huang, R. Tang, and S. Leutenegger, “Interiornet: Mega-scale multi-sensor photo-realistic indoor scenes dataset,” in British Machine VisionConference (BMVC), 2018.
[18] X. Huang, X. Cheng, Q. Geng, B. Cao, D. Zhou, P. Wang, Y. Lin,and R. Yang, “The apolloscape dataset for autonomous driving,” in TheIEEE Conference on Computer Vision and Pattern Recognition (CVPR)Workshops, June 2018.
[19] T. Hackel, N. Savinov, L. Ladicky, J. D. Wegner, K. Schindler, andM. Pollefeys, “SEMANTIC3D.NET: A new large-scale point cloudclassification benchmark,” in ISPRS Annals of the Photogrammetry,Remote Sensing and Spatial Information Sciences, vol. IV-1-W1, 2017,pp. 91–98.
[20] J. Behley, M. Garbade, A. Milioto, J. Quenzel, S. Behnke, C. Stachniss,and J. Gall, “A dataset for semantic segmentation of point cloudsequences,” arXiv preprint arXiv:1904.01416, 2019.
[21] J. Valentin, V. Vineet, M.-M. Cheng, D. Kim, J. Shotton, P. Kohli,M. Nießner, A. Criminisi, S. Izadi, and P. Torr, “Semanticpaint: In-teractive 3d labeling and learning at your fingertips,” ACM Transactionson Graphics (TOG), vol. 34, no. 5, p. 154, 2015.
[22] O. Miksik, V. Vineet, M. Lidegaard, R. Prasaath, M. Nießner,S. Golodetz, S. L. Hicks, P. Perez, S. Izadi, and P. H. Torr, “Thesemantic paintbrush: Interactive 3d mapping and recognition in largeoutdoor spaces,” in Proceedings of the 33rd Annual ACM Conferenceon Human Factors in Computing Systems. ACM, 2015, pp. 3317–3326.
[23] C. Couprie, C. Farabet, L. Najman, and Y. Lecun, “Indoor semanticsegmentation using depth information,” in International Conference onLearning Representations (ICLR2013), April 2013, 2013.
[24] A. Tonioni, M. Poggi, S. Mattoccia, and L. Di Stefano, “Unsupervisedadaptation for deep stereo,” in Proceedings of the IEEE InternationalConference on Computer Vision, 2017, pp. 1605–1613.