Shirleen Mari Theisinger - Central University of Technology
211
i Bioaerosol Composition and Associated Hazards in a Prominent Fruit Beverage Production Facility by Shirleen Mari Theisinger Submitted in fulfilment of the requirements for the Degree Doctor of Philosophy: Environmental Health Centre for Applied Food Sustainability and Biotechnology (CAFSaB) Department of Life Sciences Faculty of Health and Environmental Sciences Central University of Technology, Free State BLOEMFONTEIN 2020 Dr O de Smidt (Promotor) Prof JFR Lues (Co-promotor) © Central University of Technology, Free State
-
Upload
khangminh22 -
Category
Documents
-
view
0 -
download
0
Transcript of Shirleen Mari Theisinger - Central University of Technology

i
Bioaerosol Composition and Associated Hazards in a Prominent Fruit
Beverage Production Facility
by
Shirleen Mari Theisinger
Submitted in fulfilment of the requirements for the Degree
Doctor of Philosophy: Environmental Health
Centre for Applied Food Sustainability and Biotechnology (CAFSaB)
Department of Life Sciences
Faculty of Health and Environmental Sciences
Central University of Technology, Free State
BLOEMFONTEIN
2020
Dr O de Smidt (Promotor)
Prof JFR Lues (Co-promotor)
© Central University of Technology, Free State
ii
Declaration
I, Shirleen Mari Theisinger, Identity Number: , (Student Number: ), hereby
declare that this research project, submitted to the Central University of Technology, Free State, for the
Degree Doctor of Philosophy in Environmental Health, is my own independent work. This work
complies with the code of Academic Integrity, as well as other relevant policies, procedures, rules and
regulations of the Central University of Technology, Free State and has not been submitted before to
any institution by myself or any other person for the attainment of qualification.
…………………………………….
Shirleen Mari Theisinger
2020
I certify that the above statement is correct.
……………………………………
Doctor O de Smidt (Promotor)
© Central University of Technology, Free State

iii
Dedication
I dedicate this thesis to my remarkable husband. Thank you for all your love, prayers and support.
I am blessed with you in my life.
© Central University of Technology, Free State
iv
Acknowledgements
Praise and gratitude are due to Almighty God for His love and grace.
I am sincerely grateful to my remarkable supervisor, Dr O. de Smidt (PhD), for her professional
guidance, understanding, availability and supervision during this study and manuscript preparation. I
also extend my gratitude to my co-supervisor, Prof. J.R.F. Lues, for his collaboration and useful
recommendations. Grateful appreciation is also expressed to Dr C. Swart for her advice and input.
A word of special thanks is extended to the Centre of Applied Food Security and Biotechnology
(CAFSaB), Faculty of Health and Environmental Sciences of the Central University of Technology, Free
State, and the NRF for their sponsorship of this programme.
My heartfelt gratitude is due to my beloved husband, Bernd Theisinger, for his support, love, prayers,
sacrifices and motivation.
Special words of thanks go to my children, Lisa, Brian and Emma Theisinger, and to Christo and Liedy
Coetzer, my parents, for their love, time, continuous encouragement and financial support. I am
indebted to my supportive sibling, Christie Small-Smith, for her love and support throughout this journey
and my life in general. I would also like to extend my warmest gratitude to my mother-in-law, Amanda
Knepscheld, for her continuous support.
© Central University of Technology, Free State

v
Table of Contents
Abbreviations.…………………………………………………………………………….…………………………………..…………………………..viii
Symbols.……………………………………………………………………………………………………….……………………………………………ix
List of Figures.……………………………………………………………………………………………………….………………………….………….x
List of Tables.…………………………………………………………………………………………………………………………………..………….xi
Abstract.………………………………………………………………………………………………………………………………….………………..xii
CHAPTER 1.………………………………………………………………………………………………………………………………………………..1
1.1. Background and Rationale.…………………………………………………………………………………………………………………………..1
1.2. Problem Statement.…………………………………………………………………………………………………………………………………..2
1.3. Aims and Objectives……………………………………………………………………………….…………………………………………………3
1.4. Chapter Layout………………………………………………………………………………………………………………………………………..3
1.5. References…………………………………………………………………………………………………………………………………………….6
CHAPTER 2………………………………………………………………………………………………………………………………………………...8
2.1. Introduction ................................................................................................................................................................................................ 9
2.2. The Fruit Juice Industry ........................................................................................................................................................................... 10
2.2.1. The history of fruit juice manufacturing………………………………………………………………………………………………………….10
2.2.2. Foodborne diseases associated with fruit juice………………………………………………………………………………………………..10
2.2.3. Consumer law and legislation associated with South African fruit juice industries……………………………………………………...…18
2.3. The Composition of Bioaerosols .............................................................................................................................................................. 19
2.3.1. Microbial components ........................................................................................................................................................................... 19 2.3.1.1. Spores ................................................................................................................................................................................................ 30
2.3.1.2. Toxins ................................................................................................................................................................................................ 30
2.3.1.3. Other components ............................................................................................................................................................................. 31
2.4. Bioaerosol Detection: Approaches and Challenges ................................................................................................................................ 31
2.4.1. Sampling methodologies....................................................................................................................................................................... 32 2.5. Bioaerosol Relevance in Food Manufacturing ......................................................................................................................................... 41
2.5.1. Food product related risks: spoilage or contamination ......................................................................................................................... 41
2.5.2. Risks associated with food handlers and occupational health threats ................................................................................................. 41 2.5.2.1. Allergenic and/or toxic agents ............................................................................................................................................................ 42
2.5.2.2. Infections ............................................................................................................................................................................................ 43
2.6. Relevant International and National Legislation Associated with Bioaerosols………………………………………………………………..43
2.7. Conclusion ............................................................................................................................................................................................... 48
2.8. References ............................................................................................................................................................................................... 49
CHAPTER 3………………. ............................................................................................................................................................................. 61
3.1. Introduction .............................................................................................................................................................................................. 62
3.2. Materials and Methods ............................................................................................................................................................................. 64
3.2.1. Sampling protocol ................................................................................................................................................................................. 64
3.2.2. Measurement of the variation in physical parameters .......................................................................................................................... 64 3.2.3. Culture-dependent sampling……………………………………………………………………………………………………………………..64
© Central University of Technology, Free State

vi
3.2.3.1. Passive sampling ............................................................................................................................................................................... 65
3.2.3.2. Active sampling .................................................................................................................................................................................. 65
3.2.4. Selection, enumeration and cryopreserving of the culturable fraction……………………………………………………………………….65
3.2.5. Statistical analyses ............................................................................................................................................................................... 67 3.3. Results and Discussion ............................................................................................................................................................................ 67
3.3.1. Recording of physical parameters ........................................................................................................................................................ 67
3.3.2. Comparison of findings for passive and active sampling ...................................................................................................................... 71
3.3.3. Bioaerosol concentrations in different seasons .................................................................................................................................... 72 3.4. Conclusion ............................................................................................................................................................................................... 79
3.5. References ............................................................................................................................................................................................... 82
CHAPTER 4… ................................................................................................................................................................................................ 89
4.1. Introduction .............................................................................................................................................................................................. 90
4.2. Materials and Methods ............................................................................................................................................................................. 91
4.2.1. Sampling ............................................................................................................................................................................................... 91
4.2.2. Culture medium composition used for microbe isolation, cultivation and enumeration ........................................................................ 93
4.2.3. Identification of the culturable fraction of bacteria, yeast and mould .................................................................................................... 93 4.3. Results and Discussion ............................................................................................................................................................................ 97
4.3.1. Culturable fraction identified during peak and off-peak sampling ......................................................................................................... 97
4.3.2. Classification of the bioaerosols that were detected........................................................................................................................... 103 4.3.2.1. Innocuous bioaerosols ..................................................................................................................................................................... 104
4.3.2.2. Useful bioaerosols that were detected ............................................................................................................................................. 108
4.3.2.3. Potentially harmful bioaerosols ........................................................................................................................................................ 113
4.4. Conclusion ............................................................................................................................................................................................. 126
4.5. References ............................................................................................................................................................................................. 128
CHAPTER 5…….. ......................................................................................................................................................................................... 149
5.1. A Critical Assessment……………………………………………………………………………………………………………………………..150
5.2. Materials and Methods ........................................................................................................................................................................... 152
5.2.1. Sampling ............................................................................................................................................................................................. 152
5.2.2. Strategies for the total community DNA extraction and PCR amplification ................................................................................. 153
5.2.3. Denaturing gradient gel electrophoresis ..................................................................................................................................... 155
5.2.4. DGGE profile analyses ................................................................................................................................................................ 156
5.2.4.1. Operational taxonomic units (OTU’s) .......................................................................................................................................... 156
5.2.4.2. Range weighted richness (Rr) ..................................................................................................................................................... 156
5.2.4.3. Shannon-Weaver diversity index (H) .......................................................................................................................................... 156 5.3. Results and Discussion .......................................................................................................................................................................... 157
5.3.1. Experimental design, sampling and gDNA extraction ........................................................................................................................ 157
5.3.2. PCR-DGGE analysis and bacterial diversity ....................................................................................................................................... 165
5.3.3. DGGE profile analyses ....................................................................................................................................................................... 171 5.4.Conclusion .............................................................................................................................................................................................. 179
5.5. References………………………………………………………………………………………………………………………………………….181
© Central University of Technology, Free State
vii
CHAPTER 6…….. ......................................................................................................................................................................................... 193
6.1. Introduction ............................................................................................................................................................................................ 193
6.2. Concluding Remarks………………………………………………………………………………………………………..……………………..193
6.3. Bioaerosol Monitoring Considerations………………………………………………………………………………………………………..….196
6.3.1. Sampling motivation……………………………………………………………………………………………………………………………..196
6.3.2. Sampling locality………………………………………………………………………………………………………………………………....196
6.3.3. Selection of bioaerosol components for measurement ……………………………………………………………………………………..197
6.3.4. Choice of equipment…………………………………………………………………………………………………………………………….197
6.3.5. Sample design and intervals between sampling……………………………………………………………………………………………..197
6.4. Closing Statements: Future Research, Recommendations to Industry………………………………………………………………………198
© Central University of Technology, Free State

viii
Abbreviations
ACGIH American Conference of Governmental Industrial Hygienists OPS off-peak season
Act Legislation OTU operational taxonomic unit
BDL Butanediol PCA plate count agar
bp Base pairs PCB polychlorinated biphenyl
BPA Baird-Parker agar PCR polymerase chain reaction
BLAST Basic Local Alignment Search Tool PS peak season
B. cereus Bacillus cereus PTFE polytetrafluoroethylene filters
CA Chloramphenicol Agar R reverse
DGGE Denaturing gradient gel electrophoresis RBC Rose Bengal Chloramphenicol agar
DNA Deoxyribonucleic acid rRNA ribosomal Ribonucleic Acid
dNTP Deoxyribonucleotide triphosphate SA South Africa
E. coli Escherichia coli SANS System Administration Networking and Security
e.g. or example S. aureus Staphylococcus aureus
EDTA Ethylenediaminetetraacetic acid sp. specie
etc. and other similar things spp. species
EMBL-EBI European Bioinformatics Institute SOP Standard operating procedure
et al. and others TAE Tris base, Acetic acid and EDTA
F Forward TLV threshold limit value
FAO Food and Agriculture Organization TNTC too numerous to count
FDA Food and Drug Administration TPC total plate count
HCD Health Centre Data UPGMA unweighted pair group method with arithmetic mean
i.e. in other words USA United States of America
IgE-mediated Immunoglobulin E-mediated UV ultraviolet
LOEL Lowest observed effect level VRB Violet Red Bile agar with MUG (4-Methylumbelliferyl-β-D-Glucuronide)
LPS Lipopolysaccharide Vs versus
NA not applicable WBGT wet bulb globe temperature
No. Number WHO World Health Organization
OELs Occupational exposure limits XLD Xylose Lysine Deoxycholate agar
© Central University of Technology, Free State

ix
Symbols
°C Celsius
cells.m-3 cells per square meter
CFU colony forming unit
Cfu/area colony forming unit per area
CFU.m-3 colony forming units per cubic meter
CFU.ml-1 colony forming units per millilitre
cu ft. min-1 cubic feet per minute
d Day
& And
gDNA genomic DNA
h hours
H Shannon-Weaver diversity index
KCI Potassium Chloride
ℓ.min-1 litre per minute
M molar
mM millimolar
m metre
mg.mˉ³ milligram per cubic metre
MgSO4 Magnesium sulphate
m.s-1 metre per second
min minutes
mℓ millilitre
mm millimetre
(NH4)2SO4 Ammonium sulphate
ng.mˉ³ nanogram per cubic metre
P Pearson’s Correlation Trademark symbol
r Pearson’s correlation coefficient
R2 R squared
Rr Range weighted richness
s second/s
SOP standard operating procedure
Tris-HCL Tris hydrochloride ™ Trademark symbol
µl microlitres
µM micromolar
µm micrometre
V Volt
v/v volume/volume
w/v weight/volume
@ At
% percentage
> more than
~ about
≈ almost equal to
© Central University of Technology, Free State
x
List of Figures
Figure Title Page
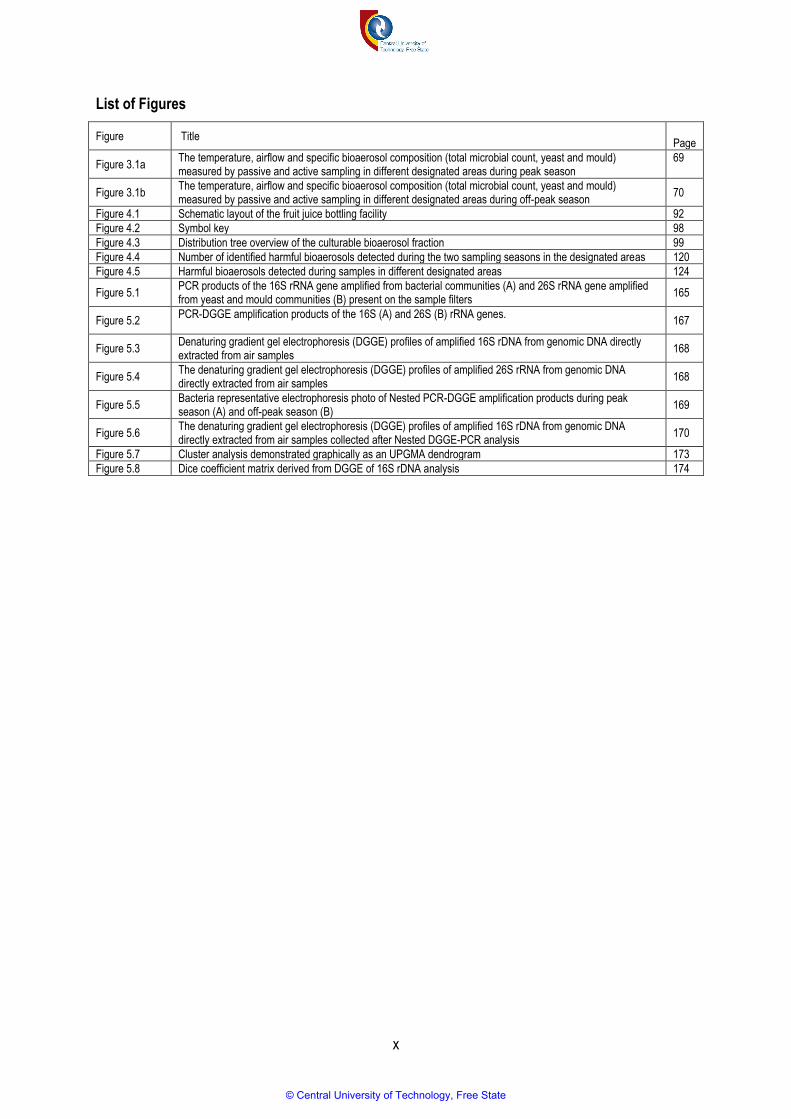
Figure 3.1a The temperature, airflow and specific bioaerosol composition (total microbial count, yeast and mould) measured by passive and active sampling in different designated areas during peak season
69
Figure 3.1b The temperature, airflow and specific bioaerosol composition (total microbial count, yeast and mould) measured by passive and active sampling in different designated areas during off-peak season
70
Figure 4.1 Schematic layout of the fruit juice bottling facility 92
Figure 4.2 Symbol key 98
Figure 4.3 Distribution tree overview of the culturable bioaerosol fraction 99
Figure 4.4 Number of identified harmful bioaerosols detected during the two sampling seasons in the designated areas 120
Figure 4.5 Harmful bioaerosols detected during samples in different designated areas 124
Figure 5.1 PCR products of the 16S rRNA gene amplified from bacterial communities (A) and 26S rRNA gene amplified from yeast and mould communities (B) present on the sample filters
165
Figure 5.2 PCR-DGGE amplification products of the 16S (A) and 26S (B) rRNA genes.
167
Figure 5.3 Denaturing gradient gel electrophoresis (DGGE) profiles of amplified 16S rDNA from genomic DNA directly extracted from air samples
168
Figure 5.4 The denaturing gradient gel electrophoresis (DGGE) profiles of amplified 26S rRNA from genomic DNA directly extracted from air samples
168
Figure 5.5 Bacteria representative electrophoresis photo of Nested PCR-DGGE amplification products during peak season (A) and off-peak season (B)
169
Figure 5.6 The denaturing gradient gel electrophoresis (DGGE) profiles of amplified 16S rDNA from genomic DNA directly extracted from air samples collected after Nested DGGE-PCR analysis
170
Figure 5.7 Cluster analysis demonstrated graphically as an UPGMA dendrogram 173
Figure 5.8 Dice coefficient matrix derived from DGGE of 16S rDNA analysis 174
© Central University of Technology, Free State
xi
List of Tables
Table Title Page
Table 2.1 Record outbreaks of human foodborne diseases from microorganisms traced to fruit juice during the period
1974 to 2019 11
Table 2.2 Different bacterial genera detected as bioaerosol components in food processing environment 21
Table 2.3 Different mould genera detected as bioaerosol components in food processing environment 27
Table 2.4 Available Impaction-based bioaerosols sampling devices 33
Table 2.5 Available Impingement-based bioaerosols sampling devices 37
Table 2.6 Available Filtration-based bioaerosols sampling devices 40
Table 2.7 Regulatory occupational exposure limits (OEL) for cotton, grain, wood, flour, organic dust and subtilisin 44
Table 2.8 Acceptable maximum bioaerosols limits allowed in different countries 46
Table 3.1 Media, incubation time and temperature 65
Table 3.2 Culturable bioaerosol fraction counts measured by SAMPL’AIR LITE in different designated areas 74
Table 3.3 Acceptable microbial limits for the food contact surfaces in the facility under study 75
Table 3.4 Singular comparisons between temperature observed during peak and off-peak season and microbial growth
using Pearson p scores calculated from R value 77
Table 3.5 Multiple comparisons between different microbial groups dearing peak and off-peak season using Pearson p
scores calculated from R value 78
Table 4.1 The Nucletide sequence of primers used in this study 95
Table 4.2 PCR workflow for bacteria, yeast and mould 96
Table 4.3 Innocuous bioaerosols detected classified alphabeticlly from order to specie 106
Table 4.4 Alphabetical classificiation of useful bioaerosols detected in the selected facility (peak and off-peak seasons) according to medical contribution, promoting and protecting plant growth and environmental contribution
109
Table 4.5 Harmful bioaerosols detected and classified alphabetically according to their pathogenicity and infection potenital, multidrug resistance, food poisioning and food spoilage
115
Table 5.1 Primers used in this study 154
Table 5.2 Reaction conditions for bacteria amplification 154
Table 5.3 Reaction conditions for yeast and mould amplification 155
Table 5.4 Different ambient air filters and extraction methods used since 2002 for DNA analysis of bioaerosols, arranged by type of extraction method
159
Table 5.5 Comparison of reccommended DNA extraction protocols for DNA analysis of bioaerosols 163
Table 5.6 Number of OTU, weighted richness and Shannon-Weaver diversity index observed in PCR-DGGE 175
© Central University of Technology, Free State

xii
Abstract
Bioaerosols are defined as aerosols that comprise particles of biological origin or activity that may affect
living organisms through infectivity, allergenicity, toxicity, or through pharmacological or other
processes. Interest in bioaerosol exposure has increased over the last few decades. This is mainly due
to the association of bioaerosols with a wide variety of adverse health effects that have a major public
health impact such as contagious infectious diseases, acute toxic effects, allergies, and cancer.
Exposure to bioaerosols may cause three major problems in the food industry, namely: (i)
contamination of food (spoilage); (ii) allergic reactions in individual consumers; or (iii) infection by
means of pathogenic microorganisms present in the aerosol. Unfortunately, there is limited information
available with regards to the specific organisms/biological agents involved in these processes and how
exactly these processes occur. This deficiency in knowledge can be attributed to a lack of research on
these processes, possibly because the importance of bioaerosols has not been considered.
Furthermore, international standards on acceptable maximum bioaerosol loads are not uniform, which
creates confusion as to what the acceptable limit of microorganisms in bioaerosols should be. There is
also a lack of standardised methods for the collection and analysis of bacterial and fungal bioaerosols,
making it difficult to compare the data released by various researchers.
According to the literature, controversy exists regarding: (i) the effect of the environment and season on
bioaerosols; (ii) types of sampling procedures; (iii) whether the detection of the culturable fraction of
bioaerosols is efficient; and (iv) whether these bioaerosols can in actual fact affect the product or cause
occupational health problems. The aim of this study was therefore to address the above-mentioned
questions by means of an investigation in a selected fruit juice production facility. The culturable and
non-culturable fraction of bioaerosols were collected in this facility by active sampling using SAMPL’AIR
LITE (AES Chemunex), a standard bioaerosol sampler, in different areas of the facility during the peak
and off-peak seasons.
It is noteworthy that the microbial counts observed during this study were high, with high total microbial
counts detected during both sampling periods. This indicates that the air in the selected facility created
ideal conditions for all types of bioaerosols. Traces of presumptive positive pathogens as well as yeast
and mould were observed in the samples collected from five designated areas. Several environmental
factors were analysed, but temperature was the only concrete environmental factor observed in the
facility during this study. However, statistical analyses indicated that temperature had no statistically
significant effect on the presence of bioaerosols in the facility. More than 380 bioaerosols were
detected during culturable identification, with 92 different species confirmed. A unique group of
© Central University of Technology, Free State

xiii
controversial bioaerosols was identified, ranging from highly probable pathogens such as Bacillus spp.,
Staphylococcus spp. and even Candida spp. Not only were harmful microorganisms identified in the
bioaerosols, but microorganisms that are capable of bio-diesel production, that possess anti-tumour
activities and that are capable of post-harvest control were also detected. Data obtained by PCR-
DGGE analysis were used to determine the similarity, richness and diversity of the bacterial
composition in the different areas of the facility during the two sampling seasons. The highest microbial
diversity and richness was obtained in the air of the area where the bottles were filled with the final
product and where a large number of personnel was present.
Data obtained during this study indicated high microbial counts and species diversity in the air of this
specific production facility. Even though this does raise concern, it is important to note that the dose-
relationship of microorganisms, even for pathogenic agents, has not yet been established. This is
mainly due to a lack of valid methods to qualitatively assess exposure. It is therefore clear that there is
still a need for the development of an environment/sample/facility sampler for bioaerosols in order to
facilitate the immediate evaluation of the specific health risks associated with a specific industry. The
information obtained by means of this study will be useful to address this gap in knowledge and will aid
the fruit juice industry to better understand and control bioaerosols in their facilities. This may also
relate to other industries where it is necessary for more specific, valid risk assessments and control of
bioaerosols in order to ensure product and occupational health safety.
© Central University of Technology, Free State
C h a p t e r 1
1
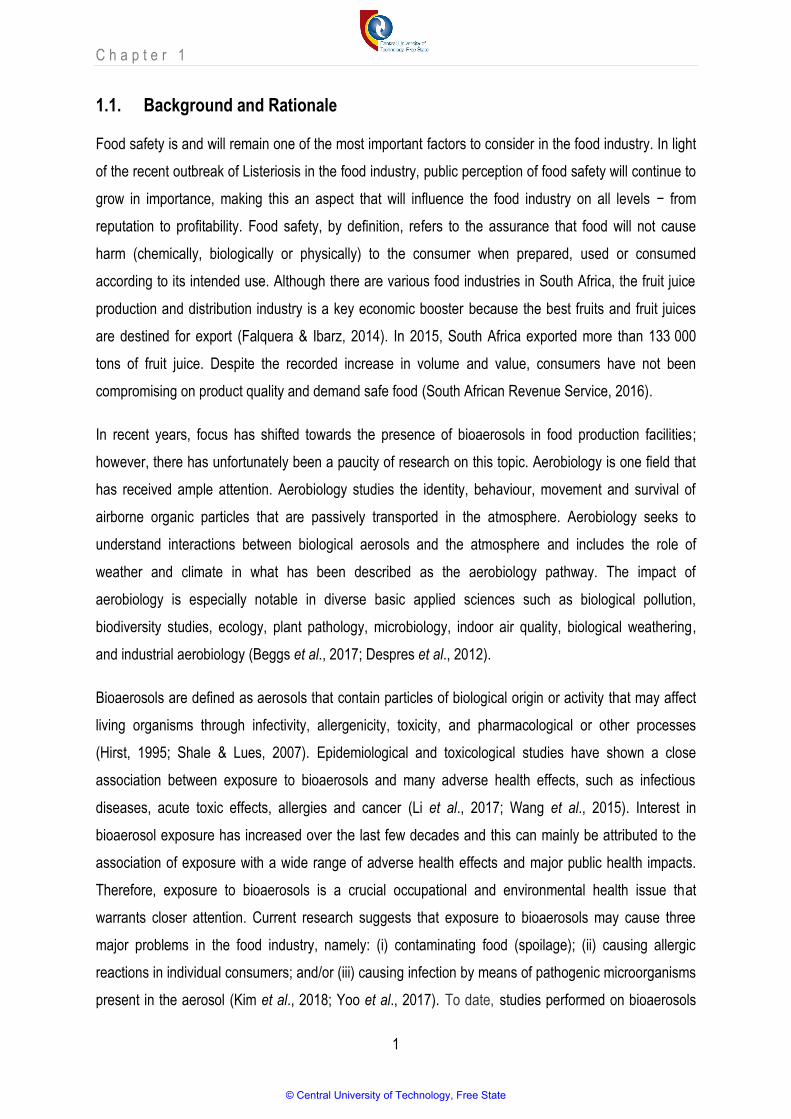
1.1. Background and Rationale
Food safety is and will remain one of the most important factors to consider in the food industry. In light
of the recent outbreak of Listeriosis in the food industry, public perception of food safety will continue to
grow in importance, making this an aspect that will influence the food industry on all levels − from
reputation to profitability. Food safety, by definition, refers to the assurance that food will not cause
harm (chemically, biologically or physically) to the consumer when prepared, used or consumed
according to its intended use. Although there are various food industries in South Africa, the fruit juice
production and distribution industry is a key economic booster because the best fruits and fruit juices
are destined for export (Falquera & Ibarz, 2014). In 2015, South Africa exported more than 133 000
tons of fruit juice. Despite the recorded increase in volume and value, consumers have not been
compromising on product quality and demand safe food (South African Revenue Service, 2016).
In recent years, focus has shifted towards the presence of bioaerosols in food production facilities;
however, there has unfortunately been a paucity of research on this topic. Aerobiology is one field that
has received ample attention. Aerobiology studies the identity, behaviour, movement and survival of
airborne organic particles that are passively transported in the atmosphere. Aerobiology seeks to
understand interactions between biological aerosols and the atmosphere and includes the role of
weather and climate in what has been described as the aerobiology pathway. The impact of
aerobiology is especially notable in diverse basic applied sciences such as biological pollution,
biodiversity studies, ecology, plant pathology, microbiology, indoor air quality, biological weathering,
and industrial aerobiology (Beggs et al., 2017; Despres et al., 2012).
Bioaerosols are defined as aerosols that contain particles of biological origin or activity that may affect
living organisms through infectivity, allergenicity, toxicity, and pharmacological or other processes
(Hirst, 1995; Shale & Lues, 2007). Epidemiological and toxicological studies have shown a close
association between exposure to bioaerosols and many adverse health effects, such as infectious
diseases, acute toxic effects, allergies and cancer (Li et al., 2017; Wang et al., 2015). Interest in
bioaerosol exposure has increased over the last few decades and this can mainly be attributed to the
association of exposure with a wide range of adverse health effects and major public health impacts.
Therefore, exposure to bioaerosols is a crucial occupational and environmental health issue that
warrants closer attention. Current research suggests that exposure to bioaerosols may cause three
major problems in the food industry, namely: (i) contaminating food (spoilage); (ii) causing allergic
reactions in individual consumers; and/or (iii) causing infection by means of pathogenic microorganisms
present in the aerosol (Kim et al., 2018; Yoo et al., 2017). To date, studies performed on bioaerosols
© Central University of Technology, Free State
C h a p t e r 1
2
have primarily focused on the chemical and biological composition of these compounds (Adams et al.,
2015).
It is speculated that the role of microbes in atmospheric processes is species-specific and potentially
depends on cell viability (Yoo et al., 2017), but little is known about the composition of bioaerosols in
the food industry and how it varies between locations and/or climate conditions. Airborne
microorganisms are very difficult to assess accurately in the field due to factors such as the collection
efficiency of the selected sampler, variations in the robustness of different species of microorganisms,
and the difficulty of differentiating strains of the same species (Adhikari et al., 2010). Limited knowledge
pertaining to the specific organisms involved in these processes is available. This gap can be attributed
to non-uniform international standards on acceptable maximum bioaerosol loads and the lack of
standardised methods for the collection and analysis of bacterial and fungal bioaerosols. Bioaerosol
monitoring is an area of interest that is rapidly emerging in industrial hygiene. Research that has
focused on the composition of bioaerosols in various industries, including the food industry, and that
has determined the hazards associated with these compounds, was of particular interest in the current
study.
1.2. Problem Statement
Food production facilities often devote ample resources towards ensuring and monitoring the microbial
safety of their products through on-site testing of the product and the production environment. The
specific fruit juice production facility, that was the study site, strives to produce a product that is 100%
contamination, spoilage and allergy free. It is therefore of the utmost importance for this facility to detect
all possible origins of possible contamination and to eliminate them. However, a few layout and design
weaknesses may influence their success rate. For example, the facility has no barriers between
clean/unclean areas and no air flow in accordance with the product flow, and these may possibly
contribute to the spreading of bioaerosols. All three production lines in the facility produce different
types of products; however, the lines are located in the same area and this implies that the
contamination of one product could affect another. Furthermore, this plant is not a closed and controlled
facility. The temperature inside the facility is not regulated and the origin of bioaerosols may vary,
rendering the control thereof problematic. Prior to the actual study, it was discovered that, other than
heterotrophic plate counts using a passive sampling method, no information existed about the
composition of bioaerosols in this facility.
© Central University of Technology, Free State
C h a p t e r 1
3
At the conception of this study, cognisance was taken of the fact that controversy exists regarding: (i)
the effect of the environment and season on bioaerosols; (ii) types of sampling procedures; (iii) whether
the detection method of the culturable fraction of bioaerosols is efficient (or whether there is a clear
need for the detection of the non-culturable fraction); and (iv) whether these bioaerosols really could
affect the product or impact the occupational health of personnel.
1.3. Aims and Objectives
The aim of this study was to address some of the above-mentioned questions in the selected fruit juice
production facility by monitoring and comprehensively characterising the composition of bioaerosols
sampled in different production areas. In order to achieve this aim, the objectives of the study were to:
(i) conduct a bioaerosol survey of the culturable fraction of the bioaerosols during peak and off-peak
seasons; (ii) determine whether the environment affected the growth of organisms in the bioaerosols in
this specific manufacturing industry using statistical analyses; (iii) characterise the culturable and non-
culturable fraction of the bioaerosols by using 16S and 26S rDNA PCR-sequencing and PCR-DGGE
analysis respectively; (iv) categorise the culturable bioaerosols as harmful, innocuous or even useful;
and, where possible, (v) compare the data obtained for culturable and non-culturable bioaerosols.
1.4. Chapter Layout
Chapter 1: Background to the study
This chapter provides a brief background to the study.
Chapter 2: Review of Related Literature
The importance of food safety in the fruit juice industry and the prevalence of related disease outbreaks
are discussed. Laws and legislation pertaining to food safety in the South African fruit juice industry are
elucidated, and literature related to bioaerosol investigations in the past four decades is reviewed. The
relevance of bioaerosols to the food industry is presented in relation to product contamination and risk
to food handler health. A comprehensive review of different sampling approaches, methods and
complications was conducted to illustrate the lack of standardised methods for collection and analysis
of bioaerosol samples. Sections of this chapter were published as a book chapter entitled: “Bioaerosols
in the food and beverage industry” in: Ideas and applications toward sample preparation for food and
beverage analysis (http://dx.doi.org/10.5772/65587).
© Central University of Technology, Free State
C h a p t e r 1
4
Chapter 3: Bioaerosols and related environmental parameters in a prominent fruit juice
manufacturing facility
The selected fruit juice industry devotes ample resources towards monitoring and ensuring microbial
safety of their products, with on-site testing of these products and the processing environment. The
mission of this specific industry is to strive towards a product that is 100% contamination, spoilage and
allergen free. During this study most of the culturable fraction of bioaerosols observed were outside
specifications for most of the facility during both seasons. Puzzling counts of presumptive coliforms,
namely E. coli, Salmonella spp. and Staphylococcus spp. were detected. These are microorganisms
that are all capable of developing biofilms on food processing surfaces and they have been associated
with foodborne disease outbreaks before. As no temperature control was observed in the facility, it is
argued that the recorded temperature was ideal for bioaerosol growth. Furthermore, almost no airflow
or ventilation systems were observed, and this may have had either a positive or negative impact on
the products produced in the facility.
Chapter 4: Enumeration, classification and categorisation of culturable bioaerosols in the fruit
juice manufacturing plant
The effect of bioaerosols on products and food handlers in the food industry remains controversial. The
prevalence of organisms in the air depends on the nature of the industry, the facility, the capacity of the
facility, as well as the season and the external environment (such as the location of nearby facilities).
Unfortunately, information regarding the types of bioaerosols and their effects is not abundant. Based
on the data that were obtained, the culturable fraction of the bioaerosols that were identified could be
characterised into three main groups, namely: 27 innocuous, 26 useful, and 39 harmful bioaerosols.
This study demonstrated that all types of culturable airborne microorganisms occurred ubiquitously and
were naturally part of the air environment of this facility.
Chapter 5: Culture independent analyses of fruit juice bioaerosol microbiome
Microorganisms may lose the ability to grow (i.e., to be cultured) during the sampling process due to the
damaging of cells during sampling, microbial competition, and unfavourable growth conditions. There is
a risk that the inability of microorganisms to grow (or to be cultured) may be incorrectly attributed to
underperforming bioaerosol samples, and this may result in underestimating their efficiency or impact.
Culture-independent analysis enables the examination of culturable as well as non-culturable
bioaerosols, viable and dead cells, and plant and animal fragments. Against this background, the
bacterial community structure was analysed using the PCR-DGGE method. Cluster, OTU, range
© Central University of Technology, Free State

C h a p t e r 1
5
weighted richness and the Shannon-Weaver diversity index were used to determine the richness and
diversity of the bioaerosols. The PCR-DGGE results indicated that the diversity of the detected bacteria
was moderately distributed. Three samples were significant: (i) Area 4 during peak season; (ii) Area 4
during off-peak season; and (ii) Area 5 during off-peak season. The data that are discussed in this
chapter indicate a clear need to establish the relationship between culture-dependent and culture-
independent approaches when studying bacterial diversity in bioaerosols.
Chapter 6: Conclusion
© Central University of Technology, Free State

C h a p t e r 1
6
1.5. References
ADAMS, R. I., BHANGAR, S., PASUT, W., ARENS, E.A., TAYLOR, J.W., LINDOW, S.E., NAZAROFF,
W.W. & BRUNS, T.D. 2015. Chamber bioaerosol study: outdoor air and human occupants as sources
of indoor airborne microbes. PLOS ONE 10(7), e0133221.
ADHIKARI, A., GUPTA, J., WILKINS, J.R., OLDS, R.L., INDUGULA, R., CHO, K.J., LI, C. &
YERMAKOV, M. 2010. Airborne microorganisms, endotoxin, and (1-3)-B-D-Glucan exposure in
greenhouses and assessment of respiratory symptoms among workers. Annual Occupational Hygiene
55, 272-285.
BEGGS, P.J., SIKOPARIJA, B. & SMITH, M. 2017. Aerobiology in the International Journal of
Biometeorology, 1957-2017. International Journal Biometeorology 61, 51-58.
DESPRES, V.R., HUFFMAN, J.A., BURROWS, S.M., HOOSE, C., SAFATOV, A.S., BURYAK, G.,
FROHLICH-NOWOISKY, J., ELBERT, W., ANDREAE, M.O., POSCHL, U. & JAENICKE, R. 2012.
Primary biological aerosol particles in the atmosphere: a review. Tellus B: Chemical and Physical
Meteorology 64, 3059.
FALGUERA, V. & IBARZ, A. 2014. Juice processing: Quality, safety and value-added opportunities.
Boca Raton, Florida, United States: CRC Press, Taylor & Francis Group. 6000 Broken Sound Parkway
NW, Suite 300.
HIRST, J.M. 1995. Handbook of bioaerosols: introduction, retrospect and prospect. Boca Raton, Florida,
United States: Lewis Publishers, 1-10.
KIM, K.H., KABIR, E. & JAHAN, S.A. 2018. Airborne bioaerosols and their impact on human health.
Journal of Environmental Sciences 67, 23-25.
LI, Y., LU, R., LI, W., XIE, Z. & SONG, Y. 2017. Concentrations and size distributions of viable
bioaerosols under various weather conditions in a typical semi-arid city of Northwest China. Journal of
Aerosol Science 106, 83-92.
SHALE, K. & LUES, J.F.R. 2007. The etiology of bioaerosols in food environments. Food Reviews
International 23, 73-90.
SOUTH AFRICAN REVENUE SERVICE. 2016. Available at: http://www.safja.co.za/GTIS
© Central University of Technology, Free State

C h a p t e r 1
7
WANG, C-H., CHEN, B.T., HAN, B-C., LIU, A, C-Y., HUNG, P-C., CHEN, C-Y. & CHAO H.J. 2015.
Field evaluation of personal sampling methods for multiple bioaerosols. PLOS ONE 10(3), 308-27.
YOO, K., LEE, T.K., CHOI, E.J., YANG, J., SHUKLA, S.K., HWANG, S. & PARK, J. 2017. Molecular
approaches for detection and monitoring of microbial communities in bioaerosols: a review. Journal of
Environmental Science 51, 234-47.
© Central University of Technology, Free State

8
CHAPTER 2
A SYNOPSIS OF MICROBIAL HAZARDS IN A PROMINENT SOUTH AFRICAN FRUIT
JUICE MANUFACTURING FACILITY: A REVIEW
This chapter was partially published with the title: Ideas and applications towards sample preparation
for food and beverage analysis. Available at: http://dx.doi.org/10.5772/65587
© Central University of Technology, Free State
9
2.1. Introduction
Microbes are ubiquitous in the environment and play key functional roles in nearly all ecosystems
(Jaenicke, 2005). Environmental bacteria, fungi and viruses are part of our natural environment as they
co-evolved with other living organisms, including humans. Airborne dissemination is a natural and
necessary part of the life cycle of many microbes (Morris et al., 2008). Bioaerosols originate from all
types of environments such as the atmosphere, soil, freshwater sources, and oceans. Their dispersal
into the air is temporarily and spatially variable. Recently, the prevalence of bioaerosols has emerged
as they are important yet poorly understood agents in atmospheric processes. Research on bioaerosols
has experienced, and continues to experience, stellar growth (Basinas et al., 2014).
In 1861, the first measurement of airborne microbes was reported by Louis Pasteur in the journal
Annales des Sciences Naturelles (Pasteur, 1861). A century later, research into the role of bioaerosols
in occupation-related diseases mainly focused on non-infectious diseases. Pepys and co-workers
(1963) first demonstrated that patients with existing diseases were more likely to suffer attacks of
farmer’s lung when inhaling spores from thermophilic Actinomycetes. Byssinosis among cotton workers
was also an important research topic during the 1970-80s. The most likely causative agents for this
disease were Gram-negative bacteria and the endotoxins located in their outer cell wall (Rylander,
1981). Interest in bioaerosol exposure has increased over the last few decades, and this is largely due
to the direct association of bioaerosols with a wide range of adverse health effects (Kim et al., 2018).
These effects can have major public health impacts such as contagious infectious diseases, acute toxic
effects, allergies, and cancer (Yoo et al., 2017). Furthermore, bioaerosols could potentially settle on
surfaces and equipment and contribute to safety or spoilage risks where food is prepared, processed or
packaged (Sutton, 2004).
Due to the presence of excessive quantities of organic matter, the release of bioaerosols can be very
high in certain industrial sectors such as in agriculture, all types of food industries, waste management
facilities, and textile and wood industries. Each bioaerosol sample is unique as the composition varies
in time and space (e.g., abundance and diversity of species and quantity of pro-inflammatory
components). This often leads not only to a high variation among samples from the same workplace
(which can be due to external factors), but also to the dynamic evolution of the colonised substrate and
the fast multiplication rate of many microbes.
This literature review elucidates bioaerosol composition, the relevance of bioaerosols to food
processing facilities (especially in the fruit juice industry), approaches to and complications associated
with the detection of bioaerosols, and approaches to the sampling of bioaerosols in industrial settings.
© Central University of Technology, Free State

10
2.2. The Fruit Juice Industry
2.2.1. The history of fruit juice manufacturing
According to Wolf et al. (2007), the first ‘modern’ fruit juice that was mass produced was lemonade.
This process was devised in the Middle East and products were imported to Italy during the sixteenth
century. In the eighteenth century, James Lind discovered that citrus fruit was useful for the prevention
of scurvy. More than a hundred years later, the Merchant Shipping Act of 1867 made it compulsory for
British vessels to carry citrus juice on ocean voyages. However, the journey of the industrial-scale
production of fruit juice only started in 1869 when Thomas Welch began bottling unfermented Concord
grape juice in Vineland (New Jersey) by applying the principle of heat sterilization (Brown et al., 1993).
Aseptic processing was introduced and commercialised on a large scale only in the early 1970s, which
was an essential breakthrough that allowed the fruit juice market to expand worldwide, thereby
ensuring the safety of juices and reducing the production and marketing expenses thereof (Morris,
2010).
The Codex Alimentarius (FAO/WHO, 2005) defines fruit juice as “the unfermented, but fermentable
liquid obtained from the edible part of sound, appropriately mature and fresh fruit or of fruit maintained
in sound conditions by suitable means”. In addition, the Codex also states that juice must be prepared
by suitable processes “that maintain the essential physical, chemical, organoleptic and nutritional
properties of the juice of the fruit from which it comes” (FAO/WHO, 2005).
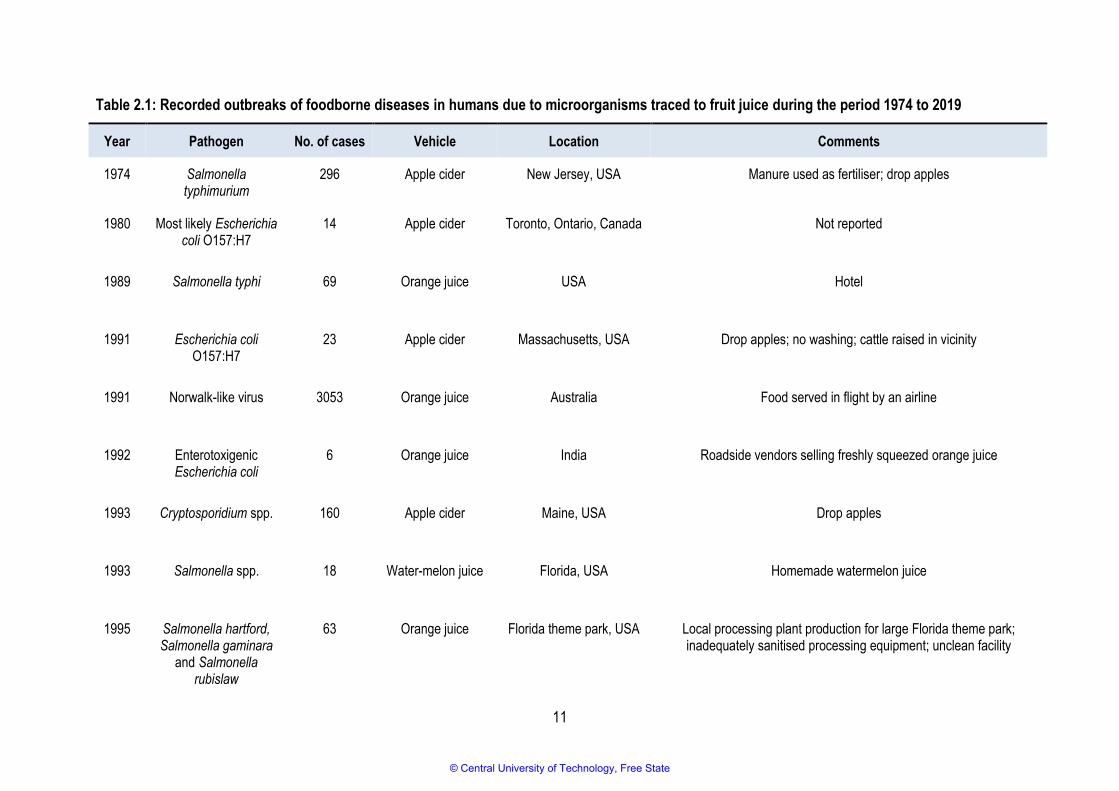
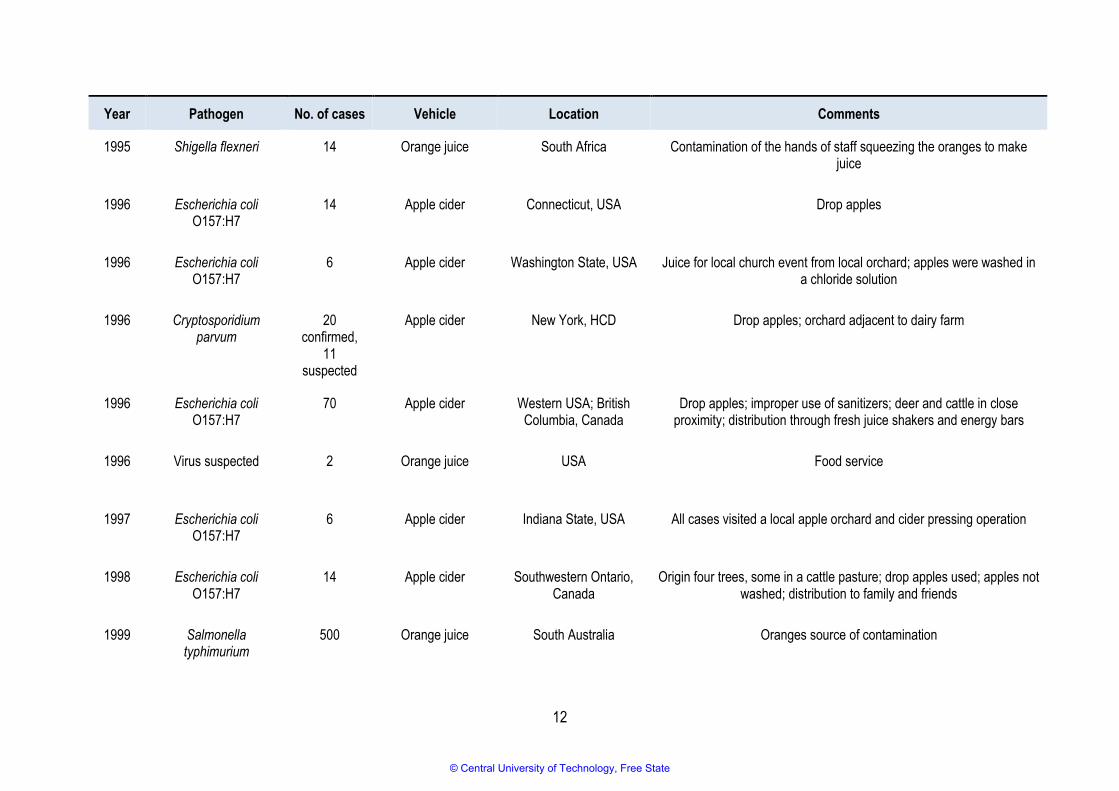
2.2.2. Foodborne diseases associated with fruit juice
Between 1974 and 2015, numerous outbreaks of illnesses associated with unpasteurised fruit juice and
cider were reported worldwide (Table 2.1) (Callejon et al., 2015; Danyluk et al., 2010; Mihajlovic et al.,
2013; Park et al., 2017). However, no such outbreaks were reported between 2015 and 2019. Eighteen
of the reported outbreaks were associated with apple juice or cider, fifteen implicated orange juice,
three were thought to be from mixed fruit juice, and the remainder implicated other types of fruit such as
watermelon, mamey, sugarcane, and guava.
© Central University of Technology, Free State
11
Table 2.1: Recorded outbreaks of foodborne diseases in humans due to microorganisms traced to fruit juice during the period 1974 to 2019
Year Pathogen No. of cases Vehicle Location Comments
1974 Salmonella typhimurium
296 Apple cider New Jersey, USA Manure used as fertiliser; drop apples
1980 Most likely Escherichia coli O157:H7
14 Apple cider Toronto, Ontario, Canada Not reported
1989 Salmonella typhi 69 Orange juice USA Hotel
1991 Escherichia coli O157:H7
23 Apple cider Massachusetts, USA Drop apples; no washing; cattle raised in vicinity
1991 Norwalk-like virus 3053 Orange juice Australia Food served in flight by an airline
1992 Enterotoxigenic Escherichia coli
6 Orange juice India Roadside vendors selling freshly squeezed orange juice
1993 Cryptosporidium spp. 160 Apple cider Maine, USA Drop apples
1993 Salmonella spp. 18 Water-melon juice Florida, USA Homemade watermelon juice
1995 Salmonella hartford, Salmonella gaminara
and Salmonella rubislaw
63 Orange juice Florida theme park, USA Local processing plant production for large Florida theme park; inadequately sanitised processing equipment; unclean facility
© Central University of Technology, Free State
12
Year Pathogen No. of cases Vehicle Location Comments
1995 Shigella flexneri 14 Orange juice South Africa Contamination of the hands of staff squeezing the oranges to make juice
1996 Escherichia coli O157:H7
14 Apple cider Connecticut, USA Drop apples
1996 Escherichia coli O157:H7
6 Apple cider Washington State, USA Juice for local church event from local orchard; apples were washed in a chloride solution
1996 Cryptosporidium parvum
20 confirmed,
11 suspected
Apple cider New York, HCD Drop apples; orchard adjacent to dairy farm
1996 Escherichia coli O157:H7
70 Apple cider Western USA; British Columbia, Canada
Drop apples; improper use of sanitizers; deer and cattle in close proximity; distribution through fresh juice shakers and energy bars
1996 Virus suspected 2 Orange juice USA Food service
1997 Escherichia coli O157:H7
6 Apple cider Indiana State, USA All cases visited a local apple orchard and cider pressing operation
1998 Escherichia coli O157:H7
14 Apple cider Southwestern Ontario, Canada
Origin four trees, some in a cattle pasture; drop apples used; apples not washed; distribution to family and friends
1999 Salmonella typhimurium
500 Orange juice South Australia Oranges source of contamination
© Central University of Technology, Free State

13
Year Pathogen No. of cases Vehicle Location Comments
1999 Salmonella muenchen 200 Orange juice 14 states in USA and two provinces in Canada (British Columbia and
Alberta)
Juice distributed in frozen and liquid form for commercial use in restaurants and hotels; products included 'smoothies’; detected in
samples taken from blenders and dispensers.
1999 Salmonella anatum 4 Orange juice Sarasota County, Florida, USA
Contamination most likely occurred during the manufacturing process
1999 Escherichia coli O157:H7
7 Apple cider Tulsa, Oklahoma, USA Contamination most likely occurred at apple orchard or cider-pressing operation
1999 Salmonella typhimurium
16 Mamey frozen puree Florida, USA Imported from Guatemala and Honduras
2000 Salmonella spp. 14 Orange juice Colorado, California, Nevada, USA
Unpasteurised citrus products produced by a juice company in California
2000 Salmonella enteritidis 88 Orange juice USA (6 states) Distributed through retail and food services
2002 Shigella sonnei 78 Mixed fruit Canada, USA, UK, British West Indies
Holiday Resort
2003 Cryptosporidium parvum
144 Apple cider Ohio, USA Ozone treatment was insufficient to inactivate pathogens
2004 Escherichia coli O111 and Cryptosporidium
parvum
213 Apple cider New York, USA Retail establishment
© Central University of Technology, Free State

14
Year Pathogen No. of cases Vehicle Location Comments
2004 Hepatitis A 351 Orange juice Egypt Juice contaminated during manufacturing process
2005 Escherichia coli O157:H7
4 Apple cider Ontario, Canada Juice produced and sold at a small local retail outlet
2005 Trypanosoma cruzi 25 Sugarcane juice Brazil Juice sold at a roadside kiosk; infected triatomine bugs and opossums were found in and around the kiosk
2005 Trypanosoma cruzi 27 Apple juice Brazil All cases consumed juice from a single sales outlet
2005 Salmonella typhimurium and
Salmonella saintpaul
157 Orange juice Multistate, USA ‘Freshly squeezed’ orange juice; outbreak was identified in 24 states
2006 Trypanosoma cruzi 94 Mixed fruit Brazil Not reported
2007 Trypanosoma cruzi 103 Guava juice Venezuela Outbreaks occurred at a school in Caracas; juice may have become contaminated with triatomine bugs during overnight storage outside
2007 Escherichia coli O157:H7
9 Apple cider Massachusetts, USA Not reported
2007 Hepatitis A 3 Mixed fruit USA Not reported
© Central University of Technology, Free State

15
Year Pathogen No. of cases Vehicle Location Comments
2008 Salmonella panama 15 Orange juice The Netherlands The causative Salmonella strain was able to survive under low pH conditions, such as those in the human stomach
2008 Escherichia coli O157:H7
7 Apple cider Iowa, USA Fair/festival; cider purchased from a temporary booth
2009 Norovirus 10 Orange juice Connecticut, USA Not reported
2009 Norovirus 189 Lemonade Illinois, USA Not reported
2010 Escherichia coli O157:H7
37 Fruit juice compote Winnipeg, Canada Not reported
2010 Escherichia coli O157:H7
7 Apple cider Maryland, USA Retail establishment
2010 Salmonella typhimurium
9 Mamey, frozen pulp USA Retail
2011 Norovirus 207 Juice Georgia, USA Not reported
2011 Norovirus 18 Orange juice California, USA Not reported
© Central University of Technology, Free State

16
Year Pathogen No. of cases Vehicle Location Comments
2011 Norovirus 80 Lemonade Georgia, USA Not reported
2011 Unknown 3 Apple cider Ohio, USA Not reported
2011 Cryptosporidium parvum, Escherichia
coli O111:NM
14 Apple cider Minnesota, USA Not reported
2011 Cryptosporidium parvum, Escherichia
coli O111:NM
4 Apple cider Ohio, USA Not reported
2011 Norovirus 14 Fruit punch Wisconsin, USA Not reported
2012 Escherichia coli O157:NM (H-)
3 Apple cider Michigan, USA Not reported
2013 Cryptosporidium 11 Apple cider Iowa, USA Not reported
2014 Escherichia coli O157 3 Apple cider Ontario, Canada Not reported
2015 Cryptosporidium and pathogenic Escherichia
coli (suspected)
30 Apple cider Illinois, USA Not reported
© Central University of Technology, Free State

17
Year Pathogen No. of cases Vehicle Location Comments
2015 Escherichia coli O111 7 Apple cider California, USA Not reported
© Central University of Technology, Free State
C h a p t e r 2
18
2.2.3. Consumer law and legislation associated with South African fruit juice industries
For a long time, the global food industry focused on the growing demand for food, often regardless of
the threat of pathogenic contamination. Nowadays, the global food industry is experiencing a
progressive shift towards a more complex system in which quality rather than quantity has become the
leading concept. Quality issues may be classified into six groups: nutritive value, organoleptic
properties, market trends, effects on health, impact on society, and impact on the environment
(Falguera et al., 2012). Emphasis has also shifted to the non-traditional attributes of food as consumers
have become concerned about the impact of their decisions on their own health and on the
environment (Falguera et al., 2012). Juice manufacturing processes now have to meet the new trends
in consumer demands that have led to technical, social, economic, and environmental changes. Fruit
juice industries are now obligated to use the best raw materials without (or with the minimum amount
of) pesticides and inorganic fertilizers, and therefore they have to develop new processing technologies
to maintain the original nutritive and organoleptic value of the fruit (Falquera & Ibarz, 2014). It is
important for all fruit juice industries to produce a product that is safe yet can be enjoyed by the
consumer. Moreover, the new consumer law encourages microbial and analytic testing of the
production facility as well as the fruit juice products they manufacture (South Africa, 2008). Suppliers
and distributors of fruit juice therefore spend an enormous amount of money on safety testing which
includes testing of equipment, surface swabs, hand swabs, air plates, water, and product testing (South
Africa, 2008).
Considering that South Africa’s best fruits and fruit juices are distributed to other countries, the fruit
juice industry constitutes a major economic boost for the country. However, South African fruit juice
manufacturers must constantly be aware of ever-changing national and international regulations,
especially those concerning the type of ingredients that may be added as well as labelling
specifications (Falquera & Ibarz, 2014). South African fruit juice manufacturers must also constantly
challenge themselves to develop new processing technologies that ensure the safety and freshness of
the juice whilst adhering to rigorous quality requirements (Falquera & Ibarz, 2014). In this context, food-
handling organisations must abide by relevant legal requirements and adhere to both national and
international standards for the safe handling of food. For example, these standards provide guidelines
for the hygienic design of buildings by describing the necessary requirements for all food industries,
including the processing of fruit juices. They also guide the production of safe and wholesome food
from specialised raw materials by outlining programmes that address food processing in terms of
effective pest and waste control (SANS, 10049).
© Central University of Technology, Free State
C h a p t e r 2
19
In industrialised nations and with reference to international trade agreements, every step of juice
manufacturing (from the cultivation of the raw materials to the marketing of the end product) is subject
to some form of regulatory control. Although some regulations can be onerous, burdensome and may
even be seen as unnecessary, there is a definite need to control commercial food items (Bates et al.,
2001). According to the regulations in the Foodstuffs, Cosmetics and Disinfectant Act No. 54 of 1972
(R692), no person in South Africa is allowed to sell fruit juice for consumption that has a total viable
colony count of more than 104 colony forming units (CFU) per 1.0 ml of the product. Further microbial
limits include a coliform organism count of <102 CFU.ml-1, and yeast and mould of <103 CFU.ml-1 with
no detectable E. coli/1 ml and Salmonella/25 ml (South Africa, 1972).
2.3. The Composition of Bioaerosols
An aerosol is a two-phase system of a gaseous phase (air) and particulate matter (dust, pathogens),
thus making it an important microbial vehicle. Bioaerosols are defined as “aerosols comprising of
particles of biological origin or activity which may affect living things through infectivity, allergenicity,
toxicity, [and] pharmacological or other processes” (Hirst, 1995; Shale & Lues, 2007). Bioaerosols are a
diverse collection of small pieces of material emitted directly from the biosphere into the atmosphere
(Oppliger, 2014).
Bioaerosols are globally ever-present and, in some cases, can dominate suspended particle
concentrations. They can be comprised of a diverse selection of particle types, including whole
organisms (bacteria, mould, fungi, yeast and algae), reproductive entities (pollen, spores from fungi,
bacteria, ferns, and mosses), biopolymers (DNA, chitin, cellulose and other polysaccharides), plant
debris, insect parts, and decaying biomass (Kim et al., 2018). The components of bioaerosols range in
size; e.g., pollens from anemophilous plants have a typical diameter of 17-58 µm, fungal spores are
typically 1-30 µm in diameter, bacteria are typically 0.25-8 µm in diameter, and viruses are typically
less than 0.3 µm in diameter. Fragments of plants and animals may vary in size. Apart from the fact
that bioaerosol particles can span several orders of magnitude in diameter, bacteria may also occur as
clusters of cells or may be dispersed into the air on plants or animal fragments, on soil particles, on
pollen, or on spores that have become airborne (Shaffer & Lighthart, 1997). All these characteristics
contribute to making accurate analyses of bioaerosols very challenging.
2.3.1. Microbial components
Microbes are ubiquitous in nature and are also present in the air as living cells that are able to infect or
contaminate the surface or tissue they settle in or upon. These airborne bacterial and fungal cells can
© Central University of Technology, Free State
C h a p t e r 2
20
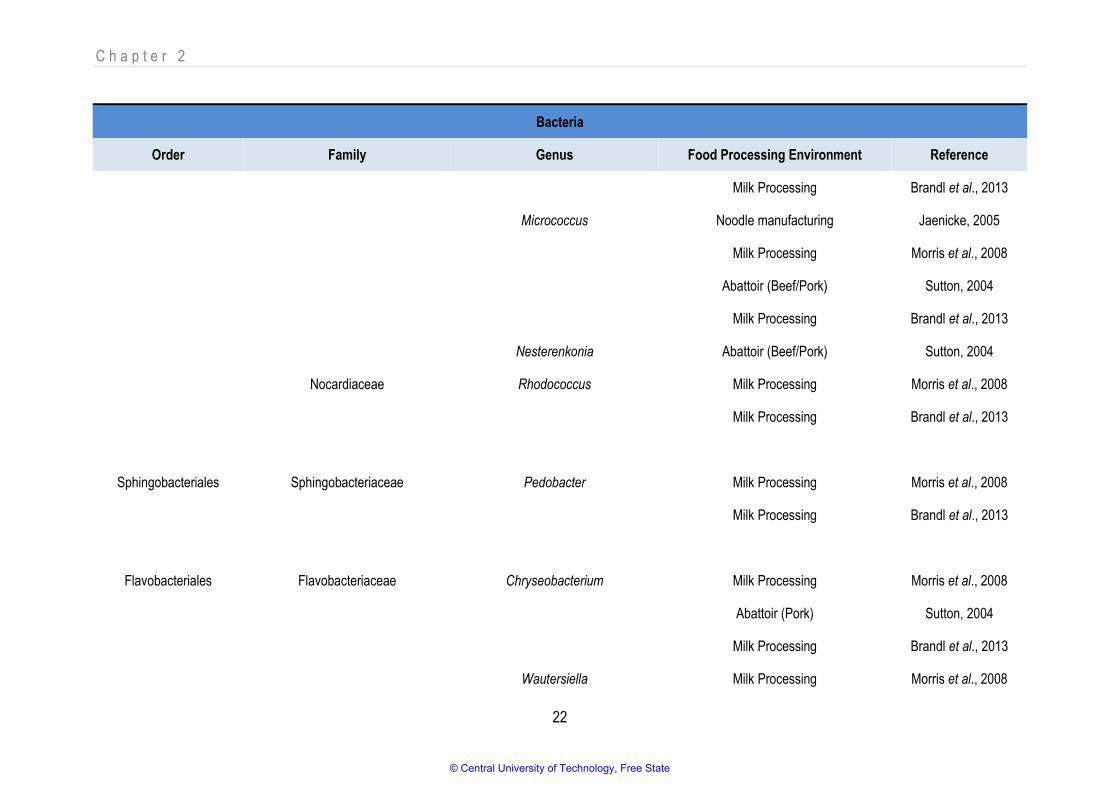
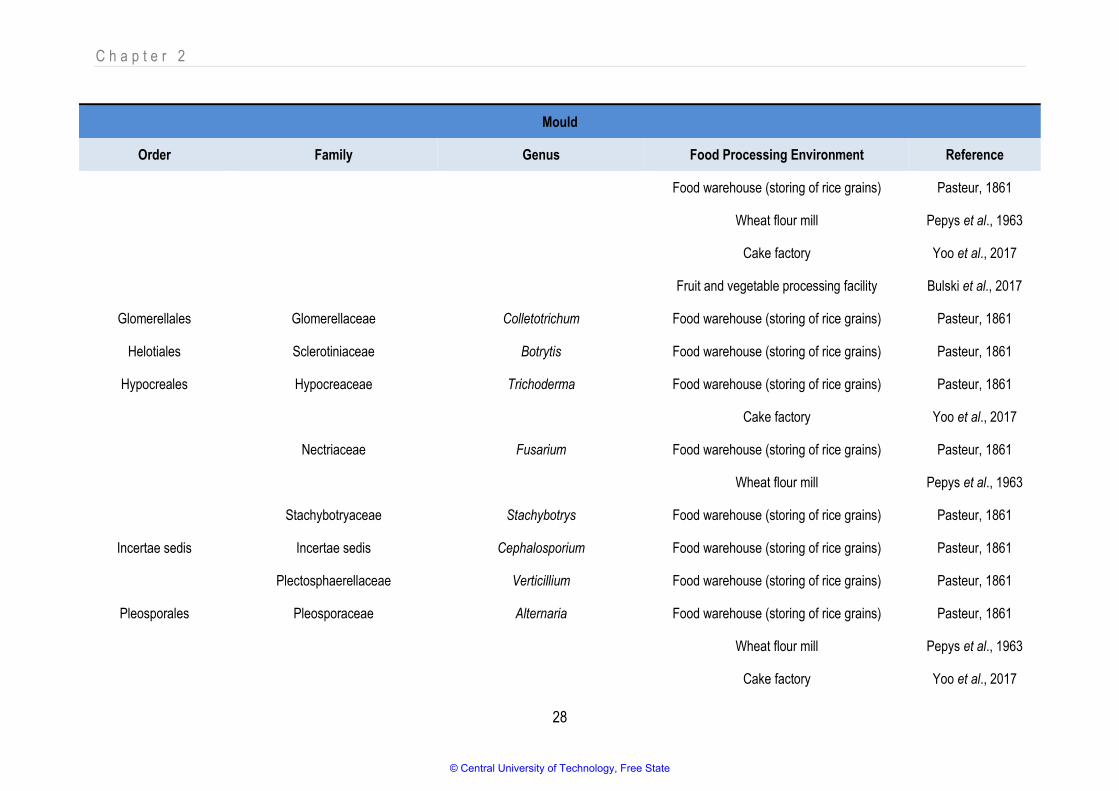
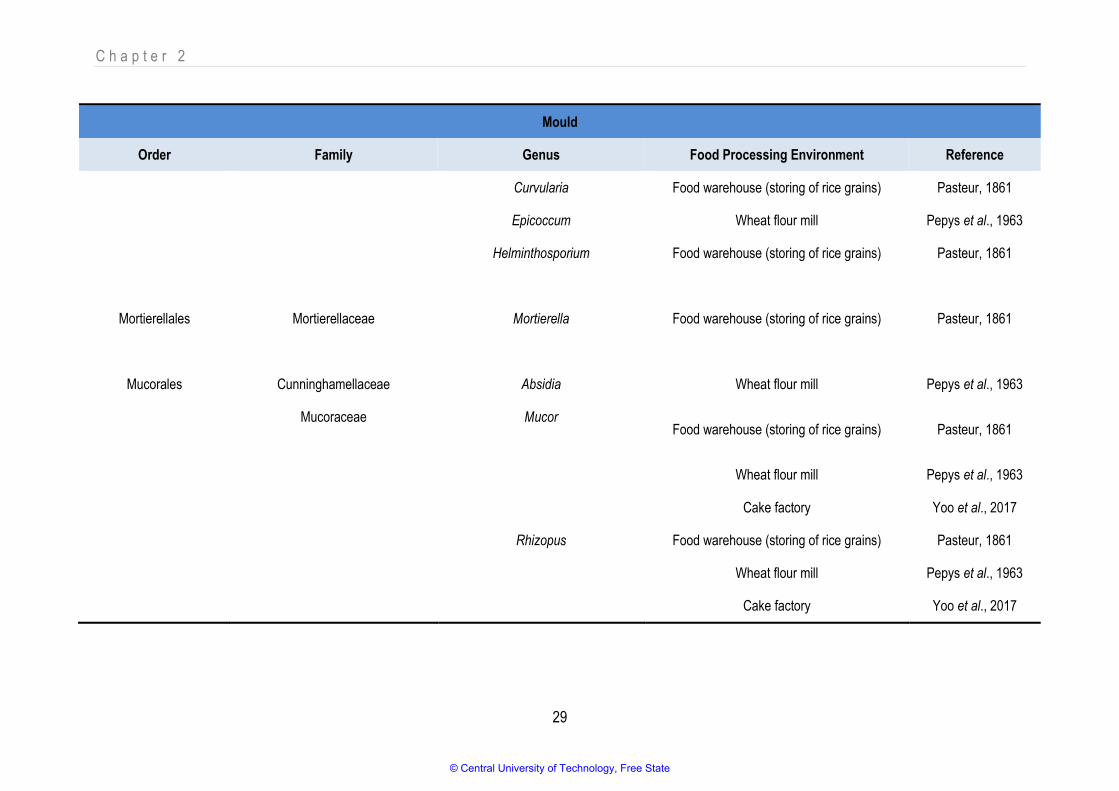
reach concentrations of 103 and 105 cells.m-3 respectively (Yoo et al., 2017). Table 2.2 and Table 2.3
list different bacterial and mould genera that have been detected as bioaerosol components in food
industries by noteworthy research since 2003. Although only a few results are available for yeast, it is
sampled and classified as yeast (Brandl et al., 2013; Hameed et al., 2010; Sutton, 2004; Zacharski et
al., 2018). The tables depict only data from food-related industries where microbial components were
detected and identified to at least genus level. The tabled research focused on viability testing only (i.e.,
total plate counts, total mould counts).
Despite the wide diversity that has been detected, not all microbial components have been directly
indicated as spoilers or contaminants of food or of being the causative agents of disease due to
bioaerosol exposure. Furthermore, not all species in a genus are necessarily harmful (which
emphasises the need for using appropriate sampling techniques and identification methods to suit the
objective for bioaerosol testing). Although all the microbes present in the air may not be harmful,
pathogens in their vegetative state, their spores, toxins, endospores, lipopolysaccharide (LPS) layer
and other constituents have been linked to disease and could pose a considerable risk to human
health.
© Central University of Technology, Free State

C h a p t e r 2
21
Table 2.2: Different bacterial genera detected as bioaerosol components in food processing environments
Bacteria
Order Family Genus Food Processing Environment Reference
Actinomycetales Brevibacteriaceae Brevibacterium Milk Processing Morris et al., 2008
Abattoir (Pork) Sutton, 2004
Milk Processing Brandl et al., 2013
Cellulomonadaceae Cellulomonas Abattoir (Pork) Sutton, 2004
Microbacteriaceae Curtobacterium Milk Processing Morris et al., 2008
Milk Processing Brandl et al., 2013
Frigoribacterium Milk Processing Morris et al., 2008
Milk Processing Brandl et al., 2013
Kocuria Milk Processing Morris et al., 2008
Abattoir (Beef/Pork) Sutton, 2004
Milk Processing Brandl et al., 2013
Microbacterium Milk Processing Morris et al., 2008
Abattoir (Beef/Pork) Sutton, 2004
Milk Processing Brandl et al., 2013
Micrococcaceae Arthrobacter Milk Processing Morris et al., 2008
© Central University of Technology, Free State
C h a p t e r 2
22
Bacteria
Order Family Genus Food Processing Environment Reference
Milk Processing Brandl et al., 2013
Micrococcus Noodle manufacturing Jaenicke, 2005
Milk Processing Morris et al., 2008
Abattoir (Beef/Pork) Sutton, 2004
Milk Processing Brandl et al., 2013
Nesterenkonia Abattoir (Beef/Pork) Sutton, 2004
Nocardiaceae Rhodococcus Milk Processing Morris et al., 2008
Milk Processing Brandl et al., 2013
Sphingobacteriales Sphingobacteriaceae Pedobacter Milk Processing Morris et al., 2008
Milk Processing Brandl et al., 2013
Flavobacteriales Flavobacteriaceae Chryseobacterium Milk Processing Morris et al., 2008
Abattoir (Pork) Sutton, 2004
Milk Processing Brandl et al., 2013
Wautersiella Milk Processing Morris et al., 2008
© Central University of Technology, Free State

C h a p t e r 2
23
Bacteria
Order Family Genus Food Processing Environment Reference
Milk Processing Brandl et al., 2013
Bacillales Bacillaceae Bacillus Milk Processing Morris et al., 2008
Food warehouse (storing of rice grains) Pasteur, 1861
Abattoir (Beef/Pork) Sutton, 2004
Milk Processing Brandl et al., 2013
Lysinibacillus Milk Processing Morris et al., 2008
Milk Processing Brandl et al., 2013
Listeriaceae Brochothrix Abattoir (Pork) Sutton, 2004
Paenibacillaceae Paenibacillus Abattoir (Beef) Sutton, 2004
Staphylococcaceae Macrococcus Milk Processing Morris et al., 2008
Milk Processing Brandl et al., 2013
Staphylococcus Noodle manufacturing Jaenicke, 2005
Milk Processing Morris et al., 2008
Broiler Chicken Barn Basinas et al., 2014
Food warehouse (storing of rice grains) Pasteur, 1861
© Central University of Technology, Free State

C h a p t e r 2
24
Bacteria
Order Family Genus Food Processing Environment Reference
Abattoir (Beef/Pork) Sutton, 2004
Milk Processing Brandl et al., 2013
Lactobacillales Leuconostocaceae Leuconostoc Milk Processing Morris et al., 2008
Milk Processing Brandl et al., 2013
Streptococcaceae Streptococcus Food warehouse (storing of rice grains) Pasteur, 1861
Burkholderiales Oxalobacteraceae Massilia Milk Processing Morris et al., 2008
Milk Processing Brandl et al., 2013
Caulobacterales Caulobacteraceae Brevundimonas Milk Processing Morris et al., 2008
Enterobacteriales Enterobacteriaceae Cedecea Abattoir (Beef/Pork) Sutton, 2004
Citrobacter Abattoir (Beef) Sutton, 2004
Enterobacter Food warehouse (storing of rice grains) Pasteur, 1861
Abattoir (Beef/Pork) Sutton, 2004
Escherichia Food warehouse (storing of rice grains) Pasteur, 1861
Abattoir (Beef/Pork) Sutton, 2004
Klebsiella Abattoir (Pork) Sutton, 2004
© Central University of Technology, Free State

C h a p t e r 2
25
Bacteria
Order Family Genus Food Processing Environment Reference
Kluyvera Abattoir (Beef/Pork) Sutton, 2004
Leclercia Abattoir (Pork) Sutton, 2004
Morganella Abattoir (Beef/Pork) Sutton, 2004
Rahnella Milk Processing Morris et al., 2008
Milk Processing Brandl et al., 2013
Salmonella Abattoir (Beef/Pork) Sutton, 2004
Shigella Abattoir (Beef/Pork) Sutton, 2004
Erwiniaceae Pantoea Abattoir (Beef/Pork) Sutton, 2004
Morganellaceae Proteus Food warehouse (storing of rice grains) Pasteur, 1861
Yersinaceae Serratia Abattoir (Pork) Sutton, 2004
Rhodospirillales Acetobacteraceae Roseomonas Milk Processing Morris et al., 2008
Milk Processing Brandl et al., 2013
Pseudomonadales Moraxellaceae Acinetobacter Milk Processing Morris et al., 2008
Abattoir (Beef) Sutton, 2004
Milk Processing Brandl et al., 2013
© Central University of Technology, Free State

C h a p t e r 2
26
Bacteria
Order Family Genus Food Processing Environment Reference
Moraxella Milk Processing Morris et al., 2008
Abattoir (Beef) Sutton, 2004
Milk Processing Brandl et al., 2013
Pseudomonadaceae Chryseomonas Abattoir (Beef/pork) Sutton, 2004
Flavimonas Abattoir (Beef/Pork) Sutton, 2004
Pseudomonas Milk Processing Morris et al., 2008
Food warehouse (storing of rice grains) Pasteur, 1861
Abattoir (Beef/Pork) Sutton, 2004
Milk Processing Brandl et al., 2013
Novosphingobium Milk Processing Morris et al., 2008
Milk Processing Brandl et al., 2013
Sphingomonadales Sphingomonadaceae Sphingomonas Milk Processing Morris et al., 2008
Milk Processing Brandl et al., 2013
Xanthomonadales Xanthomonadaceae Stenotrophomonas Abattoir (Beef/Pork) Sutton, 2004
© Central University of Technology, Free State

C h a p t e r 2
27
Table 2.3: Different mould genera detected as bioaerosol components in food processing environments
Mould
Order Family Genus Food Processing Environment Reference
Capnodiales Davidiellaceae Cladosporium Noodle manufacturing Jaenicke, 2005
Food warehouse (storing of rice grains) Pasteur, 1861
Wheat flour mill Pepys et al., 1963
Cake factory Yoo et al., 2017
Fruit and vegetable processing facility Bulski et al., 2017
Mycosphaerellaceae Cercospora Food warehouse (storing of rice grains) Pasteur, 1861
Eurotiales Trichocomaceae Aspergillus Noodle manufacturing Jaenicke, 2005
Food warehouse (storing of rice grains) Pasteur, 1861
Wheat flour mill Pepys et al., 1963
Cake factory Yoo et al., 2017
Fruit and vegetable processing facility Bulski et al., 2017
Eurotium Wheat flour mill Pepys et al., 1963
Penicillium Noodle manufacturing Jaenicke, 2005
© Central University of Technology, Free State
C h a p t e r 2
28
Mould
Order Family Genus Food Processing Environment Reference
Food warehouse (storing of rice grains) Pasteur, 1861
Wheat flour mill Pepys et al., 1963
Cake factory Yoo et al., 2017
Fruit and vegetable processing facility Bulski et al., 2017
Glomerellales Glomerellaceae Colletotrichum Food warehouse (storing of rice grains) Pasteur, 1861
Helotiales Sclerotiniaceae Botrytis Food warehouse (storing of rice grains) Pasteur, 1861
Hypocreales Hypocreaceae Trichoderma Food warehouse (storing of rice grains) Pasteur, 1861
Cake factory Yoo et al., 2017
Nectriaceae Fusarium Food warehouse (storing of rice grains) Pasteur, 1861
Wheat flour mill Pepys et al., 1963
Stachybotryaceae Stachybotrys Food warehouse (storing of rice grains) Pasteur, 1861
Incertae sedis Incertae sedis Cephalosporium Food warehouse (storing of rice grains) Pasteur, 1861
Plectosphaerellaceae Verticillium Food warehouse (storing of rice grains) Pasteur, 1861
Pleosporales Pleosporaceae Alternaria Food warehouse (storing of rice grains) Pasteur, 1861
Wheat flour mill Pepys et al., 1963
Cake factory Yoo et al., 2017
© Central University of Technology, Free State
C h a p t e r 2
29
Mould
Order Family Genus Food Processing Environment Reference
Curvularia Food warehouse (storing of rice grains) Pasteur, 1861
Epicoccum Wheat flour mill Pepys et al., 1963
Helminthosporium Food warehouse (storing of rice grains) Pasteur, 1861
Mortierellales Mortierellaceae Mortierella Food warehouse (storing of rice grains) Pasteur, 1861
Mucorales Cunninghamellaceae Absidia Wheat flour mill Pepys et al., 1963
Mucoraceae Mucor Food warehouse (storing of rice grains) Pasteur, 1861
Wheat flour mill Pepys et al., 1963
Cake factory Yoo et al., 2017
Rhizopus Food warehouse (storing of rice grains) Pasteur, 1861
Wheat flour mill Pepys et al., 1963
Cake factory Yoo et al., 2017
© Central University of Technology, Free State
C h a p t e r 2
30
2.3.1.1. Spores
Bioaerosols generally contain spores that are tougher, metabolically less active and often better
adapted to dispersal than other bioaerosol compounds. Spores are single or multicellular units
surrounded by a rigid cell wall and each spore is capable of reproducing the entire organism. Certain
bacteria can survive adverse environmental conditions for prolonged periods by producing a thick-
walled spore structure called an endospore. Endospores function to protect the bacterial DNA against
the conditions or substances in the environment that would lead to the destruction of non-endospore
forming bacteria (Agranovski, 2011). Bacillus cereus is one such spore-forming bacterium that naturally
occurs in many foods. B. cereus forms spores that are resistant to heating and dehydration and, when
food containing B. cereus spores are in the ‘temperature danger zone’, the spores germinate and the
bacteria grow and produce toxins that cause illness in humans. B. cereus can cause vomiting or
diarrhoea and even both, depending on the type of toxin it produces (Zukiewicz-Sobczak, 2013).
Mould spores are somewhat resistant to destruction and they are not usually pathogenic to humans.
Epidemiological and experimental studies have supported the fact that Aspergillus spp., for example,
are highly allergenic moulds. These moulds and their spores are known to cause two allergic diseases
of the respiratory system namely bronchial asthma and allergic rhinitis. Spore concentrations of above
50 CFU.m-3 have been associated with a high prevalence of ‘sick building syndrome’ (Kobayashi et al.,
2009; Mandal & Brandl, 2011).
2.3.1.2. Toxins
Endotoxins are composed of lipopolysaccharides and lipo-oligosaccharides associated with proteins
and lipids and are part of the exterior cell membrane of Gram-negative bacteria. Endotoxins consist of
components such as a core polysaccharide chain, O-specific polysaccharide side chains (O-antigen),
and a lipid component referred to as Lipid A, which is responsible for toxic effects (Kim et al., 2018).
Endotoxins are either present in the fragments of the cell wall or in the bacterial cell and are released
during bacterial lysis. Endotoxins are non-allergenic with strong pro-inflammatory properties. They are
present in many occupational environments, ambient air, and house dust (Ruzer & Harley, 2012).
Induction of airway inflammation and dysfunction can be attributed to the inhalation of endotoxins (Piriel
et al., 2003). Endotoxin exposure has been associated with the occurrence of respiratory disorders,
including asthma-like symptoms, chronic airway obstruction, bronchitis, increased airway
responsiveness, and byssinosis (Madsen, 2006). Unlike moulds, endotoxins have also been recognised
as a causative factor in the ethnology of occupational lung diseases, including non-allergic asthma and
organic dust toxic syndromes (Douwes et al., 2003).
© Central University of Technology, Free State

C h a p t e r 2
31
Fungi are also responsible for toxin production. During the nutrient degradation process, fungi release
secondary metabolites called mycotoxins. Mycotoxins are toxic fungal metabolites produced by moulds
in vegetal matrices and could potentially be detected in bioaerosols due to their adsorption into spores
and dust particles (Kim et al., 2018; Sorensen et al., 1984; Straumfors et al., 2010). Mycotoxins are
non-volatile compounds and will be found in the air only if the environment in which they are produced
is disturbed. These molecules act as a defence mechanism against other microbes, including other
fungi. A given fungal species may produce different toxins depending on the substrate and local
environmental factors. However, mycotoxins and their associated health effects through respiratory
exposure are not well known. One argument is that mycotoxins could be the causal agents of effects
following exposure to moulds. Reported symptoms include skin and mucous membrane irritation,
nausea, headaches, immune-suppression, and systemic effects such as dizziness and cognitive and
neuropsychological dysfunction (Goyer et al., 2001; Mandal & Brandl, 2011; Pearson et al., 2015).
2.3.1.3. Other components
Other bioaerosol components of microbial origin that are considered non-viable but bioactive may be
present in the air. For example, ß-(1-3)-D-glucan is a glucose polymer of high molecular weight found in
the cell walls of bacteria, moulds and plants (Goyer et al., 2001). They consist of glucose polymers with
variable molecular weight and degree of branching (Ruzer & Harley, 2012). ß-(1-3)-D-glucan is
associated with a dry cough, cough associated with phlegm, hoarseness and atopy and has been
reported as prevalent in indoor environments (Adhikari et al., 2010; Richter et al., 2015). Some of the
components of the cell wall of Gram-positive bacteria consist of peptidoglycans. With the inhalation of
Gram-positive bacteria, these peptidoglycans may be potential causative agents of lung inflammation
(Goyer et al., 2001).
During bacterial growth or cell death, proteins are normally secreted. These are bioactive molecules
called exotoxins. Exotoxins are usually associated with infectious diseases such as cholera, tetanus
and botulism. However, they can also be found on surfaces that can take on an aerosol form and could
support bacterial growth (Goyer et al., 2001).
2.4. Bioaerosol Detection: Approaches and Challenges
Bioaerosol monitoring is a rapidly emerging area of interest in industrial hygiene (Jensen, 1998).
Measurements include especially microbes in both indoor (e.g., industrial, office or residential) and
outdoor (e.g., agricultural and general air quality) environments (Yoo et al., 2017). It is necessary to
evaluate their presence quantitatively (by a count or a determination) and/or qualitatively (by identifying
© Central University of Technology, Free State
C h a p t e r 2
32
the genus and species) (Goyer et al., 2001). Each bioaerosol sample is unique as its composition
varies in time and space (e.g., abundance and diversity of species and the quantity of inflammatory
components such as endotoxins and ß-d-glucans). This often leads not only to high variation among
samples from the same workplace (which can occur due to external factors), but also to the dynamic
evolution of the colonized substrate and fast multiplication rate of microbes (Oppliger, 2014).
2.4.1. Sampling methodologies
A wide variety of bioaerosol sampling equipment is available; however, no standardised protocols have
yet been established. There are two primary methods for microbial air sampling, namely passive and
active monitoring. Passive monitoring, also referred to as settle plates or petri plates, requires petri
dishes containing agar or Petrifilm™ that are opened and exposed to the air for specified periods of
time. Microbes that settle on these plates from the ambient air can then be determined qualitatively.
This passive approach offers lengthy sampling periods at low cost, however, it does not take into
account air movement or airborne populations per volume of air and may miss critical microbes
(Moberg & Kornacki, 2015). Active monitoring requires a microbial air sampler to force air onto or into
collection media at a specific rate over a specified time period. This approach is less time consuming,
better for areas with low microbial loads, and allows for both quantitative and qualitative analyses.
However, vigorous air movement may cause injury to vegetative cells (Kornacki, 2014). Three
approaches can be used for active monitoring, namely impaction, impingement and filtration.
Impaction involves the use of an air pump to capture air over the surface of a petri dish containing agar.
The airflow over the agar is controlled by slits or holes that are arranged to distribute the airflow evenly
over the agar surface. Sampling equipment is easy to use and the consumable costs are relatively low.
Drawbacks may include loss of microbial cell viability due to impact stress and loss of recovery
efficiency due to the failure of microbes to adhere to agar surfaces. Competition for growth and the
influence of selective media choices should also be considered when planning a monitoring strategy
(Therkorn & Mainelis, 2013). Impaction is often the preferred active monitoring approach for bioaerosol
sampling in the food processing environment. Different sampler options are summarized in Table 2.4.
© Central University of Technology, Free State

C h a p t e r 2
33
Table 2.4: Available impaction-based bioaerosol sampling devices
Sampler
Information
Difficulty to Use
Flow Rate
References
Single-Stage Viable Andersen Cascade Impactor
• N6 microbial impactor
• Meets the specifications of the latest ACGIH Bioaerosol Committee
• EPA, OSHA and FDA referenced
• Sharp cut-off diametre of 0.65 μm.
Easy to use 28.3 ℓ. min-1 Burge, 1995; Chao et al., 2002; Goyer et al., 2001;
Kim et al., 2010; Li & Hou, 2003; Nunes et al., 2005;
Scott et al., 2011
Two-Stage Viable Andersen Cascade Impactor
• Multi orifice cascade impactor
• Whenever size distribution is not required
• When only respirable segregation or total counts are needed
• 95-100% of viable particles above 0.8 m
Easy to use 28.3 ℓ. min-1 Zhu et al., 2003
Six-Stage Viable Andersen Cascade Impactor
• Multi-orifice cascade impactor
• Measures the concentration and particle size distribution of aerobic bacteria and fungi
• Viable particles can be collected on a variety of bacteriological agar
• Calibrated to collect all particles (regardless of physical size, shape or density)
• Can be directly related to human lung deposition
Easy to use 28.3 ℓ. min-1 Benasconi et al., 2010; Dillon et al., 1996; Gilbert et al., 2010; Gorny, 2004; Gorny et al., 2002; Goyer
et al., 2001; Nasir & Colbeck, 2010; Niesler et
al., 2010; Wang et al., 2010; Zhenqian et al.,
2013
Mattson Garvin Slit-to-Agar • Accurate and quantitative
• Samples even the smallest of viable particles
• Collection on 150 mm x 15 mm disposable culture plate
Self-contained cu ft. min-1 Goyer et al., 2001
© Central University of Technology, Free State
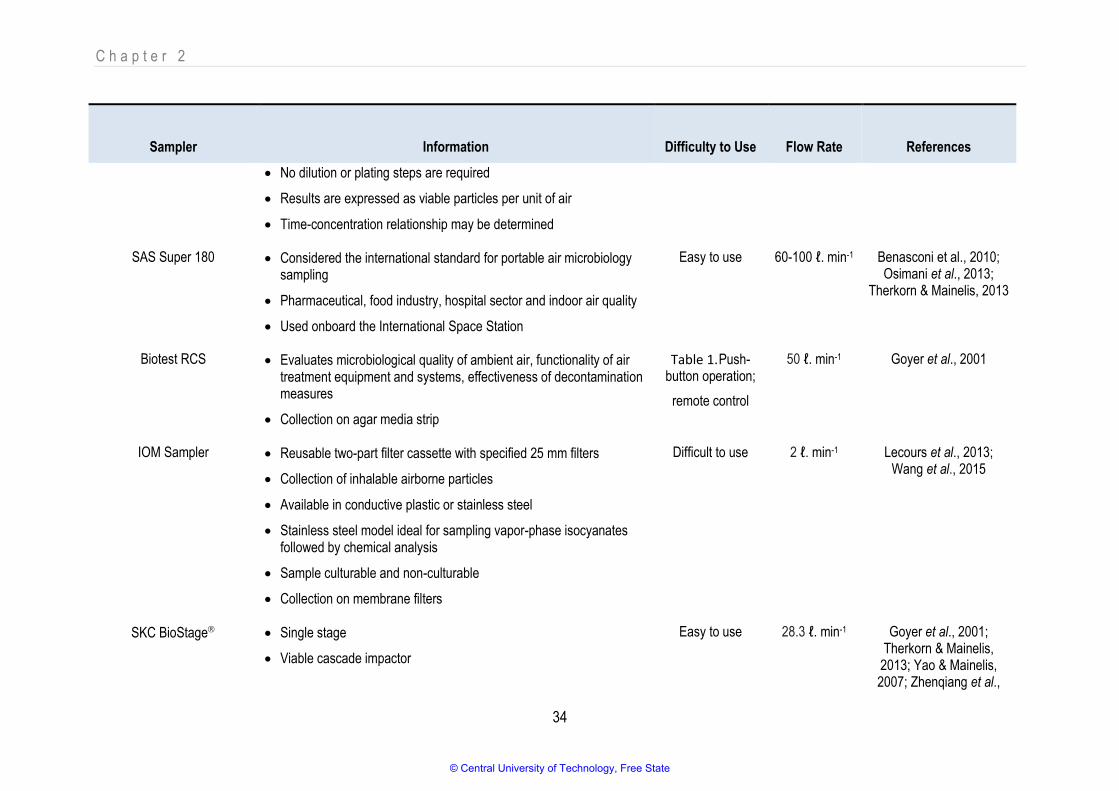
C h a p t e r 2
34
Sampler
Information
Difficulty to Use
Flow Rate
References
• No dilution or plating steps are required
• Results are expressed as viable particles per unit of air
• Time-concentration relationship may be determined
SAS Super 180
• Considered the international standard for portable air microbiology sampling
• Pharmaceutical, food industry, hospital sector and indoor air quality
• Used onboard the International Space Station
Easy to use 60-100 ℓ. min-1 Benasconi et al., 2010; Osimani et al., 2013;
Therkorn & Mainelis, 2013
Biotest RCS
• Evaluates microbiological quality of ambient air, functionality of air treatment equipment and systems, effectiveness of decontamination measures
• Collection on agar media strip
Table 1. Push-button operation;
remote control
50 ℓ. min-1 Goyer et al., 2001
IOM Sampler • Reusable two-part filter cassette with specified 25 mm filters
• Collection of inhalable airborne particles
• Available in conductive plastic or stainless steel
• Stainless steel model ideal for sampling vapor-phase isocyanates followed by chemical analysis
• Sample culturable and non-culturable
• Collection on membrane filters
Difficult to use 2 ℓ. min-1 Lecours et al., 2013; Wang et al., 2015
SKC BioStage • Single stage
• Viable cascade impactor
Easy to use 28.3 ℓ. min-1 Goyer et al., 2001; Therkorn & Mainelis,
2013; Yao & Mainelis, 2007; Zhenqiang et al.,
© Central University of Technology, Free State

C h a p t e r 2
35
Sampler
Information
Difficulty to Use
Flow Rate
References
• Meets NIOSH requirements and ACGIH recommendations
• Collection on standard-size agar plates
• SureLock positive seal ensures sample integrity
2013
SAMPL’AIR™
• 99% microbial collection rate
• High efficiency, even with the smallest particles
• Ideal for regular, thorough air quality control
Easy to use
Flexibility remote control
100 ℓ. min-1 Therkorn & Mainelis, 2013
MAS-100eco
• Sieve impaction systems
• Accurately regulates air flow in real time
• Collection media: 90-100 mm Petri dish or 55-60 mm contact plate
Easy to use 100 ℓ. min-1 Brandl et al., 2008; Haas et al., 2007; Kalogeraski et al., 2005; Uztan et al., 2010; Zorman & Jersek,
2008
RCS • Rotary Centrifugal Air Sampler
• Lightweight and portable
• Collection on agar strips
Easy to use 40 ℓ. min-1 Hargreaves et al., 2003
© Central University of Technology, Free State
C h a p t e r 2
36
Impingement of microbes in a liquid matrix requires particulate-laden air to accelerate as it is drawn
through the cassette’s tapered inlet slit from where it is directed towards a small slide containing the
collection media. Here the particles become impacted and the air flow continues out of the exit orifice.
By using this approach, it is possible to measure both the culturable and non-culturable components of
bioaerosols and it is ideal for aero-microbiology studies because the liquid matrix can be divided for
various analyses. Sampler options are listed in Table 2.5. However, the collection vials are usually
constructed of glass and they can be easily damaged or broken. This approach tends to be expensive
and may also present low capture rates, loss of collection fluid to evaporation and violent bubbling, low
capture rate of virus-sized particles, and loss of cell viability (Urbano et al., 2011).
© Central University of Technology, Free State

C h a p t e r 2
37
Table 2.5: Avialable impingement-based bioaerosol sampling devices
Sampler
Information
Ease of Use
Flow Rate
Reference
All-Glass (AGI-30) Impinger • High velocity impinger
• Can be used in heavily contaminated environments
• Sampling times up to 30 min (dilute impinge solution prior to use)
Easy to use 12-13 ℓ. min-1 Goyer et al., 2001
Burkard May Impinger • Since 1966
• Fraction collected gently into liquid where clumps separate into viable units
• Little danger of sample overload
• Sub-samples permit the use of a variety of culture methods
• Particle fraction (> 10 µm, 10-4 µm, < 4 µm)
Difficult to use 20 ℓ. min-1 Goyer et al., 2001
BioSampler® • Collection time up to 8 hours with sonic-flow Vac-U-Go Sampler
• Recommended for: infection control investigation in hospitals and veterinary clinics, biological research, infectious disease investigations in public buildings, and safety concerns in the food handling industry
Easy to use 12.5 ℓ. min-1 Goyer et al., 2001
Air-O-cell cassette • Use with any standard off-the-shelf area sampling pump (15 LPM open flow)
• Unique design for the rapid collection of a wide range of airborne aerosols including mould spores, pollen, insect parts, skin cell fragments, fibres (e.g., asbestos, fiberglass, cellulose, clothing fibers, etc.) and inorganic particulate, e.g., ceramic, fly ash, copy toner, etc.).
Easy to use 15 ℓ. min-1 Godwin & Batterman, 2007
© Central University of Technology, Free State

C h a p t e r 2
38
Sampler
Information
Ease of Use
Flow Rate
Reference
• Collects both viable and non-viable sample specimens
• Direct microscopic analysis can be performed immediately
• Collection media compatible with a wide range of biological stains and refractive index oils
• Direct quantitative analysis of organic and inorganic particulate possible
• Suitable for use in confined or restrictive spaces
Micro-Orifice Uniform Deposition Impactors™
(MOUDI™)
• 18 μm cut-point inlet stage
• Additional stages to size-fractionate aerosol particles: 8-stage (0.18 μm) and 10-stage (0.056 μm)
Difficult to use 30 ℓ. min-1 Urbano et al., 2011
© Central University of Technology, Free State
C h a p t e r 2
39
Filtration involves pumping air through a porous membrane filter to capture bioaerosols. This method
can be used to detect both culturable and non-culturable components and has been proven to be highly
efficient in trapping microbes larger than the chosen pore size of the filter surface. It does, however,
require expensive sampling equipment and sample processing and data analysis may require a high
level of expertise (Chen et al., 2010). Available cassettes for the filtration sampling of bioaerosols are
listed in Table 2.6.
© Central University of Technology, Free State
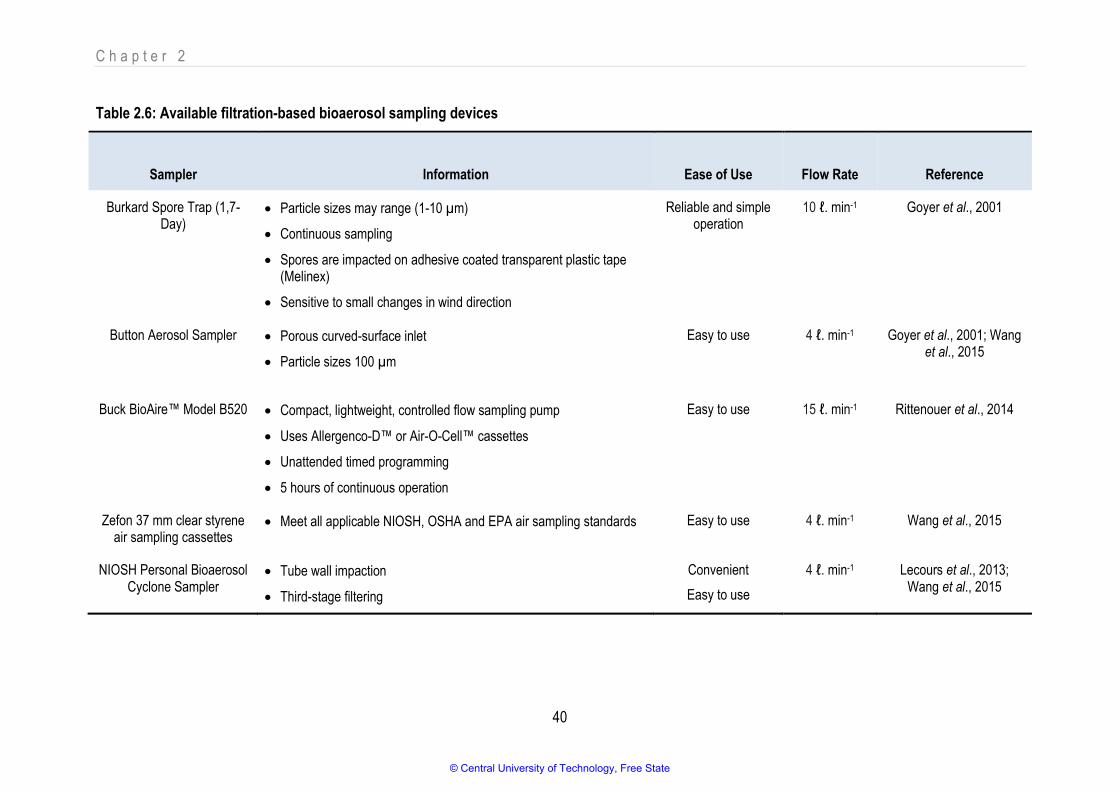
C h a p t e r 2
40
Table 2.6: Available filtration-based bioaerosol sampling devices
Sampler
Information
Ease of Use
Flow Rate
Reference
Burkard Spore Trap (1,7-Day)
• Particle sizes may range (1-10 µm)
• Continuous sampling
• Spores are impacted on adhesive coated transparent plastic tape (Melinex)
• Sensitive to small changes in wind direction
Reliable and simple operation
10 ℓ. min-1 Goyer et al., 2001
Button Aerosol Sampler • Porous curved-surface inlet
• Particle sizes 100 µm
Easy to use 4 ℓ. min-1 Goyer et al., 2001; Wang et al., 2015
Buck BioAire™ Model B520
• Compact, lightweight, controlled flow sampling pump
• Uses Allergenco-D™ or Air-O-Cell™ cassettes
• Unattended timed programming
• 5 hours of continuous operation
Easy to use 15 ℓ. min-1 Rittenouer et al., 2014
Zefon 37 mm clear styrene air sampling cassettes
• Meet all applicable NIOSH, OSHA and EPA air sampling standards Easy to use 4 ℓ. min-1 Wang et al., 2015
NIOSH Personal Bioaerosol Cyclone Sampler
• Tube wall impaction
• Third-stage filtering
Convenient
Easy to use
4 ℓ. min-1 Lecours et al., 2013; Wang et al., 2015
© Central University of Technology, Free State
C h a p t e r 2
41
2.5. Bioaerosol Relevance in Food Manufacturing
Airborne particles and bioaerosols are easily transported, transferred and displaced from one
environment to the other. Complex mixtures of bioaerosols such as fungi, allergens and bacteria, along
with non-biological particles (e.g., dust, smoke, particles generated by cooking, organic and inorganic
gases) are contained in indoor environments (Hargreaves et al., 2003). The bioaerosols and their
components could pose an environmental hazard when presented in high concentrations in indoor
environments, resulting in spoilage/contamination of food products or occupational health risks
(Stetzwnbach et al., 2004).
2.5.1. Food product related risks: spoilage or contamination
Even before spoilage becomes obvious, microbes have begun the process of breaking down food
molecules for their own metabolic needs, and this results in a variety of sensory cues such as off-
colours, off-odours, softening of fruits, and a slimy appearance. First, the sugars (carbohydrates) are
easily digested, after which plant pectins are degraded, proteins are attacked, and then volatile
compounds with characteristic smells such as amines, ammonia and sulphides are produced. Early
detection of food spoilage is advantageous in reducing food loss because various interventions could
halt or delay deterioration and decay. Several methods to determine the concentrations of spoilage
microbes or the volatile compounds produced by spoilage microbes have been devised. However,
many of these methods are considered ineffective as they are time-consuming; may not give constant,
reliable results; and are labour-intensive (Goyer et al., 2001).
Food can also be contaminated by the presence of harmful chemicals and microbes that can cause
illness when consumed. For this reason, traceability (i.e., source determination of contamination)
remains a relevant topic in food preservation research (Nerin et al., 2016). Bioaerosols implicated in
respiratory-associated hazards have received much attention; however, the potential that food-
associated microbes and foodborne pathogens in bioaerosols may cause food spoilage needs to be
clarified. Evidence exists that pathogenic microbes are found in the air and that these microbes can be
present in certain products. However, traceable evidence of bioaerosols as the causative agent of
spoilage or contamination of food products is not readily available.
2.5.2. Risks associated with food handlers and occupational health threats
Exposure to a high risk of biological hazards is a characteristic of certain industries such as health care,
agriculture, fishery, some food industries, construction, and mining. Workers employed in these
industries are known to have a high prevalence of respiratory diseases and airway inflammation (Wang
© Central University of Technology, Free State

C h a p t e r 2
42
et al., 2015). It is difficult to conduct a comprehensive evaluation of personal bioaerosol exposure in
occupational or indoor environments (Hansen et al., 2012) due to: (i) the complex composition of
bioaerosols; (ii) the human dose-response (Brooke et al., 2013); and (iii) a lack of standardised
sampling/analysis methods (Wang et al., 2015). Therefore, without appropriate personal exposure
assessment and standardised sampling/analysis methods, establishing dose relationships and relevant
exposure guidelines is difficult.
Exposure to bioaerosols in the occupational environment is associated with a wide range of health
effects such as infectious diseases, acute toxic effects, allergies, and cancer. For example, several
cases of pulmonary cancers have been reported in workers exposed to aflatoxins via the respiratory
route (Dvorackova, 1976; Hayes et al., 1984). These possibilities have been studied for the last 20
years, with data indicating that in Denmark, for example, an increase in the risk of liver cancer has been
reported for workers exposed to aflatoxins while processing livestock feed (Olsen et al., 1988). A study
by Larsson and co-workers (1988) also indicated that asymptomatic dairy farmers who had been
exposed to airborne mould dust had symptoms of immune-stimulation and inflammation in their alveolar
space. Thus farmers exposed to mould dust may exhibit signs of alveolitis (Larsson et al., 1988) and
severe toxic irritative reactions can occur after a single inhalation of high levels of spores (Poulsen et
al., 1995). Studies have suggested that inhalation exposure to mould spores is another cause of
organic dust toxic syndrome (Vogelzang et al., 1999).
Occupational biohazards of biological origin are grouped as follows: (i) occupational diseases of the
respiratory tract and skin caused by allergenic and/or toxic agents forming bioaerosols; and (ii) agents
causing zoonoses and other infectious diseases spread through various exposure vectors (Rim & Lim,
2014).
2.5.2.1. Allergenic and/or toxic agents
A wide range of agents may cause different types of allergies. Substances such as microbial enzymes
for food processing (e.g., α-amylase in commercial bakeries) and detergents are potent allergens that
can cause asthma and rhinitis (Ruzer & Harley, 2012). Many fungal species detected in bioaerosols in
the food industry, for example from the genera Penicillium, Aspergillus and Cladosporium (Chang et al.,
2001; Lee et al., 2006; Ma et al., 2015), are responsible for respiratory disease and allergies (Flannigan
et al., 2001). Fungi produce copious amounts of spores that are easily dispersed in polluted air and
dust (Zukiewicz-Sobczak, 2013). The genera Alternaria, Cladosporium, Aspergillus, Penicillium and
Fusarium are highly prone to cause allergy. Fungal allergy often appears as type I (immediate) IgE-
© Central University of Technology, Free State
C h a p t e r 2
43
mediated hypersensitivity. In the case of an allergic reaction, it can manifest as rhinitis or conjunctivitis,
asthma, urticarial, or atopic dermatitis. This is called a type II hypersensitivity reaction as is the case in
response to the mannan–polysaccharide of the cell wall of Candida and Aspergillus. An example of
type III hypersensitivity is allergic alveolitis and bronchopulmonary aspergillosis. Allergy to Aspergillus
fumigatus is common in atopic asthma. In a large part of the population, allergies occur in the form of
rhinitis, also accompanied by ocular signs (Zukiewicz-Sobczak, 2013). It is estimated that
approximately 2-6% of the general population in developed countries is allergic to fungi.
2.5.2.2. Infections
Currently, infectious diseases are regarded as the most frequently occurring occupational diseases.
Occupational biohazards are infectious agents or hazardous biological materials that exert harmful
effects on workers’ health, either directly through infection or indirectly through damage to the working
environment. Such materials can include medical waste or samples of a microbe, virus or toxin from a
biological source (Rim & Lim, 2014). Most agents responsible for respiratory infections are spread
through the air, primarily from person to person (anthroponoses), from animal to person (zoonoses),
through the abiotic environment (e.g., soil and water), and by means of decaying plant or animal matter
(sapronoses) (Ruzer & Harley, 2012). Inhalation is the most important and efficient route by which
infectious agents enter the human body and infections contracted by this route are the most difficult to
control. Transmission by air allows an infectious agent to reach a larger number of potential hosts than
would be possible if infected individuals had to come into direct contact to transfer microbes from
person to person (Ruzer & Harley, 2012).
2.6. Relevant International and National Legislation Associated with Bioaerosols
Insufficient occupational exposure limits (OELs) set by regulatory organisations and the diversity of
agents in occupational environments often complicate proper risk assessment of exposure to
bioaerosols. Regulatory OELs have been adopted for cotton, grain, wood, flour, organic dust and
subtilisins (Table 2.7) (TLVs® BELs®, 2010; LIA, 2011). However, these limits are based on dust levels
only and do not take specific components present in the dust into consideration. With the exception of
subtilisin, even the OEL for “particulates not otherwise regulated” serves as reference where OELs are
not specified (TLVs® BELs®, 2010). Furthermore, scientific evidence for certain set exposure limits,
such as ≈100 cells.m-3 allowed for fungi and actinomycetes, can be difficult to access (Eduard, 2006;
MAC, 1993). In some cases, warnings of the risk of infectious agents and guidance on health
surveillance and containment levels are provided (Directive, 2000), but no specific guidelines for
© Central University of Technology, Free State

C h a p t e r 2
44
bioaerosol concentration level limits are specified for either infectious or non-infectious biological
agents.
Table 2.7: Regulatory occupational exposure limits (OEL) for cotton, grain, wood, flour, organic
dust and subtilisin
Agent ACGIH Norway
Raw cotton dust 0.2 mg.mˉ³ 0.2 mg.mˉ³
Grain dust (oat, wheat, barley) 4 mg.mˉ³ none
Flour dust 0.5 mg.mˉ³ 3 mg.mˉ³
Wood dust 0.5 mg.mˉ³ 1-2 mg.mˉ³
Organic dust None 5 mg.mˉ³
Particulates not otherwise regulated 10 mg.mˉ³ 10 mg.mˉ³
Subtilisin (protease from Bacillus subtilis) 60 ng.mˉ³ 60 ng.mˉ³
Specific OELs are required to protect workers’ health. However, bioaerosol research has thus far only
resulted in proposed exposure limits for endotoxins and fungal spores. A criteria document based on
inflammatory respiratory effects (Eduard, 2006) proposes a lowest observed effect level (LOEL) of 104
m-3 for spores, non-pathogenic and non-mycotoxin producing fungal species. Several organisations
have also proposed guidelines for fungi in indoor environments, but the criteria were developed for
assessing indoor mould problems and are not health-based (Rao et al., 1996; WHO, 2009). For other
agents, risk assessment may be based on exposure-response associations found in relevant
epidemiological studies; e.g., β-(1→3)-glucans and allergens, but lack of standardisation of
measurement methods represents a great challenge (Douwes, 2005; Heederick, 2002).
There are no uniform international standards available on levels and acceptable maximum bioaerosol
loads (Table 2.8) (Mandal & Brandl, 2011; Kim et al., 2018). The American Conference of
Governmental Industrial Hygienists (ACGIH) stated in 2009 that “a general threshold limit value [TLV]
for culturable or countable bioaerosol concentrations is not scientifically supported” based on the lack of
data describing exposure-response relationships (ACGIH, 2009). However, no similar topic or related
legislation has been discussed since 2009. Furthermore, no uniform standardised method is available
for the collection and analysis of bacterial and fungal bioaerosols, which makes the establishment of
exposure limits challenging. Without scientifically proven standards and guidelines, arbitrary criteria
© Central University of Technology, Free State
C h a p t e r 2
45
may lead to inappropriate testing and test interpretations (Kim et al., 2018). Yet, regardless of these
gaps, neither air sampling techniques nor identification and cultivation methods have been
internationally standardised; therefore, the prospect of data comparison is still a nebulous area in this
field.
© Central University of Technology, Free State

C h a p t e r 2
46
Table 2.8: Acceptable maximum bioaerosol limits allowed in various countries/regions
Number of Culturable Organisms as CFU.m-3
Country Bacteria Yeast Mould Total Bioaerosols
(Bacteria + Yeast + Mould)
Reference
Brazil
750
de Aquino & de Goes Siqueira, 2004; Nunes
et al., 2005
Canada
150
50 (one species of mould)
100 (different mould species)
150 Bratlett et al., 2003; EC, 1989; Kim et al., 2018;
WHO, 1988
China* 2 500 - 7 000 Gorny, 2004
Finland 4 500 Nevalainen, 1989
Germany 10 000 10 000 IFA, 2001; IFA, 2004
Korea
800 Jo & Seo, 2005; Lee et
al., 2012
Portugal 500 Pegas et al., 2010
Netherlands 10 000 10 000 Heida et al., 1995
Russia** 2 000 - 10 000 Eduard, 2009
Switzerland 10 000 (aerobic
mesophilic)
Oppliger et al., 2005;
SUVA, 2007
© Central University of Technology, Free State

C h a p t e r 2
47
Number of Culturable Organisms as CFU.m-3
Country Bacteria Yeast Mould Total Bioaerosols
(Bacteria + Yeast + Mould)
Reference
1 000 (Gram-negative)
USA 1 000
AGCIH, 2009; OSHA,
2008
European Union
10 000 (private homes)
2 000 (non-industrial indoor locations)
10 000 (private home)
2 000 (non-industrial indoor
location)
Wanner & Gravesen 1994
* location dependent
** dependent on fungal species
© Central University of Technology, Free State
C h a p t e r 2
48
2.7. Conclusion
Bioaerosol sampling can be a useful tool to study occupational exposure, potential health hazards and
the transmission of infectious diseases in occupational and domestic environments. However,
bioaerosol sampling has significant limitations and these need to be considered when deciding whether
or not to collect bioaerosol samples. It is vital to prepare a sampling plan and to interpret the results
meaningfully. The first and most important limitation is the lack of standards and guidelines for
acceptable bioaerosol exposure limits. Although numerous studies have suggested a connection
between exposure to various bioaerosols and respiratory illnesses, exposure limits do not currently
exist. These limits have not been established largely because it is not possible to definitively state that
a particular bioaerosol concentration will or will not lead to adverse health outcomes. In addition to the
lack of exposure limits for bioaerosols, measuring and interpreting bioaerosol concentrations are more
complex than is often appreciated. In addition, bioaerosol concentrations can vary significantly from
location to location within a building. It is undeniable, however, that bioaerosol sampling can be
beneficial when done in an appropriate context and manner. It is also important to emphasise that
bioaerosols are ubiquitous environmental contaminants and, in the majority of cases, they are not an
integral part of the industrial process. It would therefore be inappropriate to sample merely ‘to-see-what-
is-in-the-air’ because the presence of microbes in the air can be expected. Moreover, bioaerosol
studies are still in their infancy and continued new technological advances are needed to successfully
address the questions that persist in this field.
© Central University of Technology, Free State
C h a p t e r 2
49
2.8. References
ADHIKARI, A., GUPTA, J., WILKINS, J.R., OLDS, R.L., INDUGULA, R., CHO, K.J., LI, C. &
YERMAKOV, M. 2010. Airborne microorganisms, endotoxin, and (1-3)-B-D-Glucan exposure in
greenhouses and assessment of respiratory symptoms among workers. Annual Occupational Hygiene
55, 272-285.
AGRANOVSKI, E. 2011. Aerosols: science and technology. Hoboken, New Jersey, United States:
Wiley & Sons, 69.
American Confrence of Governmental Industrial Hygienists (ACGIH). 2009. Threshold limit values
(TLVs) for chemical substances and physical agents and biological exposure indices (BEIs), Ohio,
United States, 223-226.
BASINAS, I., SIGSGAARD, T., ERLANDSEN, M., ANDERSEN, N.T., TAKAI, H., HEEDERIK, D.,
OMLAND, O., KROMHOUT, H. & SCHLUNSSEN, V. 2014. Exposure affecting factors of dairy farmers’
exposure to inhalable dust and endotoxin. Annual Occupational Hygiene 58(6), 707-23.
BATES, R.P., MORRIS, J.R. & CRANDALL, P.G. 2001. Principles and practices of small-and medium-
scale fruit juice processing. Food Sciences and Human Nutrition Department, University of Florida,
United States, 146.
BENASCONI, C., RODOLFI, M., PICCO, A.M., GRISOLI, P., DACARRO, C. & REMBGES, D. 2010.
Pyrogenic activity of air to characterize bioaerosol exposure in public buildings: a pilot study. Letters in
Applied Microbiology 50, 571-77.
BRANDL, H., FRICKER-FEER, C., ZIEGLER, D., MANDAL, J., STEPHAN, R. & LEHNER, A. 2013.
Distribution and identification of culturable airborne microorganisms in a Swiss milk processing facility.
Journal of Dairy Science 97, 240-46.
BRANDL, H., VON DANIKEN, A., HITZ, C. & KREBS, W. 2008. Short term dynamic patterns of
bioaerosol generation and distribution in an indoor environment. Aerobiologia 14, 203-09.
BRATLETT, K.H., LEE, K.S., STEPHENS, G., BLACK, W., BRAUER, M. & COPES, R. 2003.
Evaluating indoor air quality: Test standards for bioaerosol. Reports to the Workers’ Compensation
Board of British Columbia Research Secretariat 99, FS-64.
© Central University of Technology, Free State

C h a p t e r 2
50
BROOKE, R.J., KRETZSCHMAR, M., MUTTERS, N.T. & TEUNIS, P. 2013. Human dose response
relation for airborne exposure to Coxiella burnettii. BMC Infectious Disease 13(1), 488-95.
BROWN, M., KILMER, R.L. & BEDIGIAN, K. 1993. Overview and trends in the fruit juice processing
industry. In: S. Nagy, S.C. Chen, & P.E. Shaw (Eds.). 1993. Fruit Juice Processing Technology.
Auburndale, FL: Agricultural Science, 1-22.
BULSKI, K., OSTAFIN, M., FRACZEK, K., CHEMIEL, M.J., SUPROVYCH, T. & PUSTOVA, Z. 2017.
The microbiological air quality at the fruit and vegetable processing facility. Agronomy and Veterinary
Medicine 1(1), 54-64.
BURGE, H.A. 1995. Bioaerosol investigations. In: H.A. Burge (Ed.). Bioaerosols. Boca Raton, USA:
6000 Broken Sound Parkway NW, Suite 300, CRC Press, 1-23.
CALLEJON, R.M., RODRIGUEZ-NARANJO, M.I., UBEDA, C., HORNEDO-ORTEGA, R., GARCIA-
PARRILLA, M.C. & TRONCOSO, A.M. 2015. Reported foodborne outbreaks due to fresh produce in
the United States and European Union: Trends and causes. Foodborne Pathogens and Disease 12(1),
32-40.
CHAO, H.J., SCHWARTZ, J., MILTON, D.K. & BURGE, H.A. 2002. Populations and determinants of
airborne fungi in large office buildings. Environmental Health Perspective 110, 777-82.
CHANG, C.W., CHUNG, H., HUANG, C.F. & SU, H.J.J. 2001. Exposure of workers to airborne
microorganisms in open-air swine houses. Applied Environmental Microbiology 67, 155-61.
CHEN, Y.P., CUI, Y. DONG, J.G. 2010. Variation of airborne bacteria and fungi at Emperor Qin’s Terra-
Cotta Museum, Xi’an, China, during the “Oct 1” gold week period of 2006. Environmental Science
Pollution 17, 478-85.
DANYLUK, M.D., GOODRICH-SCHNEIDER, R.M., SCHNEIDER, K.R., HARRIS, L.J. & WOROBO,
R.W. 2010. Outbreaks of foodborne disease associated with fruit and vegetable juices. University of
Florida, IFAS Extension.
DE AQUINO NRTO, F.R. & DE GOES SIQUEIRA, L.F. 2004. Guidelines for indoor air quality in offices
in Brazil. Proceedings of Healthy Buildings 4, 549-54.
© Central University of Technology, Free State
C h a p t e r 2
51
DILLON, H.K., HEINSOHN, P.A. & MILLER, J.D. 1996. Field guide for the determination of biological
contaminants on environmental samples. Fairfax, VA: AIHA Publications.
Directive 2000/54/EC on the protection of workers from risks related to exposure to biological agents at
work. (n.d). Available at:
http://eurlex.europa.eu/LexUriServ/LexUriServ.do?uri=OJ:L:2000:262:0021:0045:EN:pdf .
DOUWES, J., THORNE, P., PEAARCE, N. & HEEDERIK, D. 2003. Bioaerosol health effects and
exposure assessment: Progress and prospects. Annual Occupational Hygiene 47, 187-200.
DOUWES, J. 2005. (1→3)-β-D-glucans and respiratory health: A review of the scientific evidence.
Indoor Air 15, 160-69.
DVORACKOVA, I. 1976. Aflatoxin inhalation and alveolar cell carcinoma. BMJ 1, 691.
ENVIRONMENT CANADA. 1989. Exposure guidelines for residential indoor air quality. Ontario,
Ottawa, Canada: Environment Canada.
EDUARD, W. 2006. Real-time PCR detection of toxigenic Fusarium in airborne and settled grain dust
and associations with trichothecere mycotoxins. Arbete och Halsa 21, 1-145. Available at:
http://gupea.ub.guse/dspace/bitstream/2077/4359/1/ah2006_21.pdf
EDUARD, W. 2009. Fungal spores: A critical review of the toxicological and epidemiological evidence
as a basis for occupational exposure limit setting. Critical Reviews in Toxicology 39, 799-864.
FALGUERA, V. & IBARZ, A. 2014. Juice processing: Quality, safety and value-added opportunities.
Boca Raton, Florida, United States: CRC Press, Taylor & Francis Group. 6000 Broken Sound Parkway
NW, Suite 300.
FALGUERA, V., ALIQUER, N. & FALGUERA, M. 2012. An integrated approach to current trends in
food consumption: Moving toward functional and organic products? Food Control 26, 274-81.
FAO/WHO. 2005. Codex general standards for fruit juices and nectars (Codex STAN 247-2005).
Available at: http://www.fao.org/input/download/standards/10154/CXS_247e.pdf
FLANNIGAN, B., SAMSON, R.A. & MILLER, J.D. 2001. Microorganisms in home and indoor work
environments. London and New York: Taylor & Francis.
© Central University of Technology, Free State

C h a p t e r 2
52
GILBERNT, Y., VEILLETTE, M. & DUCHAINE, C. 2010. Airborne bacteria and antibiotic resistance
genes in hospital rooms. Aerobiologia 26, 185-94.
GODWIN, C. & BATTERMAN, S. 2007. Indoor air quality in Michigan schools. Indoor Air 17, 109-21.
GORNY, R.L. 2004. Bilogiczne czynniki szkodliwe: normy, zalecenia I propozycje wartosci
dopuszczalnych. Podstawy I Metody Oceny SRodowiska Pracy 3, 17-39.
GORNY, R.L. & DUTKIEWICZ, J. 2002. Bacterial and fungal aerosols in indoor environments in Central
Eastern European countries. ANN Agricultural Environmental Medicine 9, 17-23.
GOYER, N., LAVOIE, J., LAZURE, L. & MARCHAND, G. 2001. Bioaerosols in the workplace:
Evaluation, control and prevention guide. Montreal: IRSST.
HAAS, D., HABIB, J., GALLER, H., BUZINA, W., SCHLACHER, R., MARTH, E. & REINTHALER, F.F.
2007. Assessment of indoor air in Austrian apartments with and without visible mould growth.
Atmospheric Environment 41, 5192-201.
HAMEED, A., AWARD, A., ELMORSY, T.H., TARWATER, P.M., GREEN, C.F. & GIBBS, S.G. 2010.
Air bio contamination in a variety of agricultural industry environments in Egypt: A pilot study.
Aerobiologia 26, 223-32.
HANSEN, V.M., MEYLING, N.V., WINDING, A., EILENBERG, J. & MADSEN, A.M. 2012. Factors
affecting vegetable growers’ exposure to fungal bioaerosols and airborne dust. Annual Occupational
Hygiene 56, 170-82.
HARGREAVES, M., PRAPPUKKARAN, S., MORAWSKA, L., HITVHINS, J., CONGRONG, H. &
GILBERT, D. 2003. A pilot investigation into associations between indoor airborne fungal and non-
biological particle concentrations in residential houses in Brisbane. Science Total Environment 312, 89-
101.
HAYES, R.B., VAN NIEUWENHUIXE, J.P., RAATGEVER, J.W. & TEN KATE, F.J. 1984. Aflatoxin
exposures in the industrial setting: an epidemiological study of mortality. Food Chemistry Toxicity 22(1),
39-43.
HEEDERIK, D. 2002. Health-based occupational exposure limits for high molecular weight sensitizers:
how long is the road we must travel? Annual Occupational Hygiene 46, 439-46.
© Central University of Technology, Free State
C h a p t e r 2
53
HEIDA, H., BARTMA, F., & VAN DER ZEE, S.C. 1995. Occupational exposure and indoor quality
monitoring in a composting facility. American Industrial Hygiene Association Journal 56, 39-43.
HIRST, J.M. 1995. Handbook of bioaerosols: introduction, retrospect and prospect. Boca Raton, Florida,
United States: Lewis Publishers, 1-10.
Institut fur Arbeitsschutz de Deutschen Gesetzlichen Unfallversicherung (IFA). 2001. Verfahren zur
Bestimmung der Schimmelpilzkonzentration in der Luft am Arbeitsplatz (9420#). Berlin, Germany: Erich
Schmidt Verlag.
Institut fur Arbeitsschutz de Deutschen Gesetzlichen Unfallversicherung (IFA). 2004. Verfahren zur
Bestimmung der Bakterienkonzentration in der Luft am Arbeitsplatz (9430#). Berlin, Germany: Erich
Schmidt Verlag.
JAENICKE, R. 2005. Abundance of cellular material and proteins in the atmosphere. Science 308(73),
14-21.
JENSEN, P.A. 1998. Sampling and characterization of bioaerosols. Dissertation. The National Institute
for Occupational Safety and Health, New York.
JO, W.K. & SEO, Y.J. 2005. Indoor and outdoor bioaerosol levels at recreation facilities, elementary
schools, and homes. Chemosphere 61, 1570-79.
KALOGERASKI, N., PASCHALI, D., LEKADITIS, V., PANTIDOU, A., ELEFTHERIADIS, K. &
LAZARIDIS, M. 2005. Indoor air quality: bioaerosol measurements in domestic and office premises.
Journal of Aerosol Science 36, 751-61.
KIM, K.H., KABIR, E. & JAHAN, S.A. 2018. Airborne bioaerosols and their impact on human health.
Journal of Environmental Sciences 67, 23-25.
KIM, K.Y., KIN, C.N. & KIM. D. 2010. Distribution characteristics of airborne bacteria and fungi in the
general hospitals of Korea. Industrial Health, 236-43.
KOBAYASHI, T., IIJIMA, K., RADHAKRISHNAN, S., METHA, V., VASSALLO, R., LAWRENCE, C.B.,
CYONG, J-C., PEASE, L.R., OGUCHI, K. & KITA, H. 2009. Asthma-related environmental fungus,
Alternaria, activates dendritic cells and produce potent Th2 adjuvant activity. Journal of Immunology
182, 2502-10.
© Central University of Technology, Free State

C h a p t e r 2
54
KORNACKI, J. 2014. An environmental sample approach to product risk assessment. Food Safety
Magazine, February.
LARSSON, K., MALMBERG, P., EKLUND, A., BELIN, L. & BLASCHKE, E. 1988. Exposure to
microorganisms, airway inflammatory changes and immune reactions in asymptomatic dairy farmers:
Bronchoalveolar lavage evidence of macrophage activation and permeability changes in the airways.
International Archives of Allergy and Immunology 87(2), 127-33.
LECOURS, P.B., VEILLETTE, M., MARSOLAIS, D. & DUCHAINE, C. 2013. Characterization of
bioaerosols from dairy barns: reconstructing the puzzle of occupational respiratory diseases by using
molecular approaches. Journal of Applied Environmental Monitoring 78, 3242-48.
LEE, S.A., ADHIKARI, A., GRINSHPUN, S.A., MC KAY, R., SHUKLA, R. & REPONEN, T. 2006.
Personal exposure to airborne dust and microorganisms in agricultural environments. Journal of
Occupational Environmental Hygiene 3, 118-30.
LEE, U.B., HONG, I.G., LEE, D.H., CHONG, E-S., JUNG, J.H., LEE, J.H., KIM, H.J. & LEE, I-S. 2012.
Bacterial Bioaerosol Concentrations in Public Restroom Environments. Aerosol and Air Quality
Research 12, 251-255.
LI, C.S. & HOU P.A. 2003. Bioaerosol characteristics in hospital clean rooms. Science Total
Environment 305, 169-76.
MA, Y., TIAN, G., TANG, F., YU. B., CHEN, Y., CUI, Y., HE, Q. & GAO, Z. 2015. The link between
mould sensitivity and asthma severity in a cohort of northern Chinese patients. Journal of Thoracic
Disease 4, 585-600.
MADSEN, A.N. 2006. Airborne endotoxin in different background environments and seasons. Annual
Agricultural Environmental Medicine 13, 81-86.
MANDAL, J. & BRANDAL, H. 2011. Bioaerosols in indoor environments: A review with special
reference to residential and occupational locations. The Open Environmental & Biological Monitoring
Journal 4, 83-96.
Maximum Allowable Concentrations of Harmful Substances in Workplace Air. 1993. Toksikologiceskij
Vestnik, July 1, Stat Committee for Hygiene and Epidemiological Surveillance, Russian, 38-44.
© Central University of Technology, Free State

C h a p t e r 2
55
MIHAJLOVIC, B., DIXON, B., COUTURE, H. & FARBER, J. 2013. Quality microbiological risk
assessment of unpasteurized fruit juice and cider. International Food Risk Analysis Journal 3, 1-19.
MOBERG, L. & KORNACJI, J.L. 2015. Microbiological monitoring of the food processing environment.
Chapter 3. In: SELFINGER, Y. & TORTORELLO, M.L. 2015. Compendium of methods for the
microbiological examination of foods, 5th edition. Washington, DC: American Public Health Association.
MORRIS, C.E., SANDS, D.C., BARDIN, M., JAENICKE, R., VOGAL, B. & LEYRONAS, C. 2008.
Microbiology and atmospheric processes: an upcoming era of research on bio-meterology.
Biogeoscience Discuss 5, 191-212.
MORRIS, R.A. 2010. The U.S. orange and grapefruit juice markets: History, development, growth and
change. EDIS document FE834. Gainesville, FL: Food and Resource Economics Department,
University of Florida.
NASIR, Z.A. & COLBECK I. 2010. Assessment of bacterial and fungal aerosol in different residential
settings. Water Air and Soil Pollution, 211, 367-77.
NERIN, C. AZAR, M. & CARRIZO, D. 2016. Food contamination during food processing. Food Science
& Technology 48, 63-68.
NEVALAINEN, A. 1989. Bacterial aerosols in indoor air. Dissertation, Helsinki, Finland, National Public
Health Institute.
NIESLER, A., GORNY, R.L. WIAZLO, A. & LAWNICZEK-WALCZYK, A. 2010. Microbial contamination
of storerooms at the Auschwitz-Birkenau Museum. Aerobiologia 26,125-33.
NUNES, Z.G., MARTINS, A.S., ALTOE, A.L.F., NISHIKAWA, M.M., LEITEM M.O., AGUIAR, P.F. &
FRACALANZZA, S.E.L. 2005. Indoor air microbial evaluation of offices, hospitals, industries and
shopping centres. Memorias do Instituto Oswaldo Cruz 100, 351-57.
Occupational Safety and Health Administration (OSHA). 2008. Indoor air quality investigation.
Technical Manual (OTM), Section II, Chapter 2. U.S. Department of Labor: www.osha.gov
OLSEN, J.H., DRAGSTED, L. & AUTRUP, H. 1988. Cancer risk and occupational exposure to
aflatoxins in Denmark. British Journal of Cancer 58, 392-96.
© Central University of Technology, Free State

C h a p t e r 2
56
OPPLIGER, A., RUSCA, S., CHARRIERE, N., DUC, T.V. & DROZ, P.O. 2005. Assessment of
bioaerosols and inhalable dust exposure in Swiss sawmills. Annual Occupational Hygiene 49, 385-91.
OPPLIGER, A. 2014. Advancing the science of bioaerosols’ exposure assessment. Annual
Occupational Hygiene 58(6), 661-63.
OSIMANI, A., AQUILANTI, L., TAVOLETTI, S. & CLEMENTI, F. 2013. Microbiological monitoring of air
quality in a university canteen: An 11-year report. Environmental Monitoring Assessment 185, 4765-74.
PARK, I.K., HA, J.W. & KANG, D.H. 2017. Investigation of optimum ohmic heating conditions for
inactivation of Escherichia coli O157:H7, Salmonella enterica serovar typhimurium, and Listeria
monocytogenes in apple juice. BMC Microbiology 17, 117-25.
PASTEUR, L. 1861. Annales des Sciences Naturelles 44, 5-98.
PEARSON, C., LITTLEWOOD, E., DOUGLAS, P., ROBERTSON, S. TIMOTHY, W.G. & HANSELL,
A.L. 2015. Exposure and health outcomes in relation to bioaerosol emissions from composting facilities:
a systematic review of occupational and community studies. Journal Toxicology and Environmental
Health 18, 43-69.
PEGAS, P.N., EVTUGINA, M.G., ALVES, C.A., NUNES, T., CERQUEIRA, M. & PIO, M.F.C. 2010.
Outdoor/indoor air quality in primary schools in Lisbon: a preliminary study. Quimica Nova 33, 1145-49.
PEPYS, J., JENKINS, P.A., FESTENSTEIN, G.N., GREGORY, P.H., LACEY, M.E. & SKINNER, F.A.
1963. Lancet 2, 607-11.
PIRIEL, R.S., COLLIE, D.D.S., DIXON, P.M. & Mc GORUM, B.C. 2003. Inhaled endotoxin and organic
dust particulates have synergistic proinflammatory effects in equine heaves (organic dust-induced
asthma). Clinical & Experimental Allergy 115, 797-802.
POULSEN, O.M., BREUM, N.O., EBBEHOJ, N., HANSEN, A.M., IVENS, U.I. & VAN LELIEVELDM D.
1995. Sorting and recycling of domestic waste: review of occupational health problems and their
possible causes. Science Total Environment 168(1), 33-56.
RAO, C.Y., BURGE, H.A. & CHANG, J.C. 1996. Review of quantitative standards and guideline for
fungi in indoor air. Journal of Air & Waste Management Association 46, 899-908.
© Central University of Technology, Free State

C h a p t e r 2
57
REGULATIONS GOVERNING MICROBIOLOGICAL STANDARDS FOR FOODSTUFFS AND
RELATED MATTERS R692. 1997.
RICHTER, J., SVOZIL, V., KRAL, V., DOBIASOVA, L.R. & VETVICKA, V. 2015. β-glucan affects
mucosal immunity in children with chronic respiratory problems under physical stress: clinical trials.
Annals of Translational Medicine 3 (4), 52-59.
RIM, K.T. & LIM, C.H. 2014. Biologically hazardous agents at work and efforts to protect workers’
health: a review of recent reports. Safety and Health at Work 5, 43-52.
RITTENOUR, W.R., CIACCIO, C.E. BARNES, C.S., KASHON, M.L., LEMONS, A.R., BEEZHOLD, D.H.
& GREEN, B.J. 2014. Internal transcribed spacer r RNA gene sequencing analysis of fungal diversity in
Kansas City indoor environments. Environmental Science Processes and Impacts 16, 33-43.
RUZER, L.S. & HARLET, N.H. 2012. Aerosol handbook: measurement, dosimetry and health effects.
2nd ed. Boco Raton, 6000 Broken Sound Parkway NW, Suite 300, CRC Press.
RYLANDER, R. 1981. Bacterial toxins and etiology of byssinosis. Chest 79, 34S-38S.
SCOTT, J.A., SUMMERBELL, R.C. & GREEN, B.J. 2011. Detection of indoor fungi bioaerosols, in
fundamentals of mould growth in indoor environments and strategies for healthy living. In: O.C.G Adan
& R.A. Samson (Eds.). Wageningen, The Netherlands: Wageningen Academic Publishers.
SHAFFER, B.T. & LIGHTHART, B. 1997. Survey of culturable airborne bacteria at four diverse
locations in Oregon: urban, rural, forest, and coastal. Microbial Ecology 34, 167-77.
SHALE, K. & LUES, J.F.R. 2007. The etiology of bioaerosols in food environments. Food Reviews
International 23, 73-90.
SORENSEN, W.G., JONES, W., SIMPSON, J. & DAVIDSON, J.I. 1984. Aflatoxin in respirable airborne
peanut dust. Journal of Toxicology and Environmental Health 14, 525-33.
SOUTH AFRICA. 1972. Foodstuffs, Cosmetics and Disinfectant Act No. 54 of 1972. Pretoria:
Government Printer.
SOUTH AFRICA. 2008. The Consumer Protection Act No. 68 of 2008. Pretoria: Government Printer.
© Central University of Technology, Free State

C h a p t e r 2
58
SOUTH AFRICAN NATIONAL STANDARDS 10049. 2012. Food safety management: requirements for
prerequisite programmes (PRPs). Published by SABS Standards Division. 1 Dr Lategan Road
Groenkloof, Pretoria, 0001. www.sabs.co.za
SRIKANTH, P., SUDHARSANAM, S. & STEINBERG, R. 2008. Bio-aerosols in indoor environments:
composition, health effects and analysis. Indian Journal of Medicine and Microbiology 26, 302-12.
STETZWNBACH, L.D., BUTTNER, L.D. & CRUZ, P. 2004. Detection and enumeration of airborne
contaminants. Centre for Applied Food Security and Biotechnology 15, 170-74.
STRAUMFORS, H.A., NORDY, K.C., SLETNER, K.S., ELEN, O., CLASEN, P.E. & EDUARD, W. 2010.
Toxigenic Fusarium spp. as a determinant of trichothecene mycotoxins in settled grain dust. Journal of
Occupational Environmental Hygiene 44, 1980-86.
SUTTON, G.H.C. 2004. Enumeration of total airborne bacteria, yeast and mould contaminants and
identification of Escherichia coli O157:H7, Listeria spp., Salmonella spp., and Staphylococcus spp. in a
beef and pork slaughter facility. Doctoral thesis, University of Florida, Florida, USA.
SUVA. 2007. Grenzwerte am Arbeitsplatz. Luzern, Switzerland.
NORWAY. LABOUR INSPECTION AUTHORITY. 2011. Guidance for administrative standards for
contamination of the work environment. Aug 16. Trondheim:
www.arbeidstilsynet.no/artikkel.html?tid=78880
THERKORN, J.H. & MAINELIS, G. 2013. Effect of agar plate volume on accuracy of culturable
bioaerosol impactors. Aerosol Science & Technology 47, 1353-62.
TLVs® & BEIs®. 2010. Cincinnati, OH, USA: ACGIH.
URBANO, R., PALENIK, B., GASTON, C.J. & PRATHER, K.A. 2011. Detection and phylogenetic
analysis of coastal bioaerosols using culture dependent and independent techniques. Biogeosciences
8, 301-09.
UZTAN, A.H., ATES, M., ABACI, O., GULBAHAR, O., ERDEM, N., CIFTCI, O. BOTACIOGLU, H. 2010.
Determination of potential allergenic fungal flora and its clinical reflection in suburban elementary
schools in Izmir. Environmental Monitoring Assessment 168, 691-702.
© Central University of Technology, Free State
C h a p t e r 2
59
VOGELZANG, P.F., VAN DER GULDEN, J.W., FOLGERING, H. & VAN SCHAYCK, C.P. 1999.
Organic dust toxic syndrome in swine confinement farming. American Journal of Industrial Medicine 35,
32-334.
WANG, C.C., FANG, G.C. & KUO, C.H. 2010. Bioaerosols as contributors to poor air quality in
Taichung City, Taiwan. Environmental Monitoring Assessment 166, 1-9.
WANG, C., CHEN, B.T., HAN, B., LIU, A.C., HUNG, P., CHEN, C., & CHAO, H.J. 2015. Field
evaluation of personal sampling methods for multiple bioaerosols. PLOS ONE, 1-19.
WANNER, H.U. & GRAVESEN, S. 1994. Biological particles in indoor environments: European
collaborative action “Indoor air quality and its impact on man”. Report no. 12. Luxembourg:
Commission of the European Communities.
WORLD HEALTH ORGANIZATION. 1988. Indoor air quality: biological contaminants. European Series
No. 31. World Health Organization Regional Office for Europe, Copenhagen. Available at:
www.euro.who.int/iris/handle/10665/260557
WORLD HEALTH ORGANIZATION. 2009. Guidelines for indoor air quality: dampness and mould.
WHO Regional Office for Europe. Available at:
www.euro.who.int/_data/assets/pdf_file/0017/43325/E92645.pdf.
WOLF, A., BRAY, G. A. & POKIN, B.M. 2007. A short history of beverages and how our body treats
them. Obesity Reviews 9, 151-64.
YAO, M. & MAINELIS, G. 2007. Analysis of potable impactor performance for enumeration of viable
bioaerosols. Journal of Occupational Environmental Hygiene 4, 514-24.
YOO, K., LEE, T.K., CHOI, E.J., YANG, J., SHUKLA, S.K., HWANG, S. & PARK, J. 2017. Molecular
approaches for detection and monitoring of microbial communities in bioaerosols: a review. Journal of
Environmental Science 51, 234-47.
ZACHARSKI, K.A., SOUTHERN, M., RYAN, A. & ADLEY, C.C. 2018. Evaluation of an environmental
monitoring program for the microbial safety of air and surfaces in a dairy plant environment. Journal of
Food Protection 81(7), 1108-16.
© Central University of Technology, Free State
C h a p t e r 2
60
ZHENQIANG, X., KAI, W., YAN, W., FANGXIA, S., QI, C., MINGZHEN, L. & MAOSHENG, Y. 2013.
Enhancing bioaerosol sampling by Andersen impactors using mineral-oil spread agar plate. PLOS ONE
8(2), 2-20.
ZHU, H., PHELAN, P.E., DUAN, T., RAUPP, G.B., FERNANDO, H.J.S. & CHE, F. 2003. Experimental
study of indoor and outdoor airborne bacterial concentrations in Tempe, Arizona, USA. Aerobiologia 19,
201-11.
ZORMAN, T. & JERSEK, B. 2008. Assessment of bioaerosol concentrations in different indoor
environments. Indoor Building Environment 17, 155-63.
ZUKIEWICZ-SOBCZAK, W.A. 2013. The role of fungi in allergic diseases. Postepy Dermatology and
Allergology 1, 42-45.
© Central University of Technology, Free State
61
CHAPTER 3
BIOAEROSOLS AND RELATED ENVIRONMENTAL PARAMETERS IN A
PROMINENT FRUIT JUICE MANUFACTURING FACILITY
For submission partially or in full to:
Journal of Aerosol Science. ISSN: 0021-8502
© Central University of Technology, Free State

C h a p t e r 3
62
3.1. Introduction
Food safety and quality control have become prominent focus areas in recent years, with legislation
forcing all food industries to comply with national and, in some cases, international standards. Due to
the competitive market faced by each of the different food industries, customer satisfaction has become
extremely important. The consumer is focused on personal preference, safety and quality and if one of
these elements is under the expected norm, consumer loyalty is easily lost forever. One of the main
factors that contributes to obtaining good quality food products is microbiological safety, which is a
basic requisite to ensure the integrity of the product and the safety of the product relating to the health
of the consumer (Osimani et al., 2013).
Fruit juice industries in South Africa play an important economic role because the production and
distribution of fruit juices are key contributors to the South African economy, especially as many of the
country’s fruits and fruit juices are exported to other countries. The consumption of fresh fruit and fruit
juices is constantly increasing as consumers strive to maintain healthy diets. Fruit juices contain natural
non-pathogenic, epiphytic microflora. However, during the cultivation and harvesting of fruit, as well as
during fruit juice processing and handling, contamination by pathogens from humans and other
elements is possible. It is thus important for all fruit juice industries to produce a product that the
consumer enjoys but that is also safe. The new consumer law encourages microbial and analytic
testing of fruit juice products as well as the monitoring of production facilities (South Africa, 2008).
Suppliers and distributors of fruit juices spend an enormous amount of money on safety testing with
particular focus on equipment and surface swabs, hand swabs, air plates, and water and product
testing (South Africa, 2008).
Even though there are many factors that can contribute to a product that is not satisfactory, in recent
years the focus has shifted towards the impact of bioaerosol exposure on various environments and the
probable health impacts this exposure could have. Although the importance of bioaerosols and their
impact on different industries and human health have been recognised, it remains difficult to accurately
describe their role in different environments (Kim et al., 2018). A problem faced by many fruit juice
processing facilities is successful risk assessment and the control of bioaerosols. Bioaerosols are
defined as “airborne particles that are living or originate from living organisms, such as microorganisms
and fragments of microorganisms, toxins and metabolites from living organisms” (Wang et al., 2015).
Exposure to naturally occurring bioaerosols has been shown to cause various adverse health effects
such as allergies and infections (Ruzer & Harley, 2012; Xu et al., 2013; Zukewicz-Sobczak, 2013).
Bioaerosols also have the potential to cause major problems in any food industry such as
© Central University of Technology, Free State

C h a p t e r 3
63
contamination of the food (spoilage), allergies in individuals (consumers), and infection by means of
pathogenic microorganisms.
The fruit juice facility that was selected as the study site is situated in Bloemfontein (Free State, South
Africa) and is located in an agricultural and food processing area. Bloemfontein is centrally situated in
the country and is therefore an excellent area for the production of various types of food products and
the distribution of these products to the rest of the country. At the time of the study, the selected facility
had approximately 250 employees and operated between 12 to 24 h per day. The selection criteria for
this facility were based on: (i) the product manufactured; (ii) its central location; and (iii) the type of fruit
juice (dairy blends, concentrate) that it manufactured. The selected fruit juice industry devotes ample
resources towards monitoring and ensuring microbial safety of its products with on-site testing of the
product and the processing environment. It is the mission of this specific industry to strive towards a
product that is 100% contamination, spoilage and allergen free. It is therefore very important to this
facility to find all possible origins of contamination and eliminate them.
However, upon visiting this facility, it was noted that it had no barriers between the clean and unclean
areas and no air flow according to the product flow. All three production lines in the facility produced
different types of products; however, the lines were located in the same area and this could potentially
cause the contamination of one product by another. Furthermore, this plant was not a closed and
controlled facility, and the temperature inside the facility was not regulated. The origin of bioaerosols
may vary, making the control thereof problematic. At the time of the study, bioaerosols that could have
contributed to contamination had not yet been characterised in this facility.
Bioaerosol samplers are increasingly being used to measure airborne microorganisms in occupational-
and food processing environments to assess bioaerosol exposure. The purpose of this chapter was
therefore three-fold: (i) to collect and analyse the culturable fraction of bioaerosols in this facility during
two different seasons in five different sites in the processing section, where the facility monitors the air
on a monthly basis; (ii) to determine the effect of basic environmental conditions in these five different
sites on the formation of bioaerosols; and (iii) to examine the correlation between different types of
bioaerosols.
© Central University of Technology, Free State
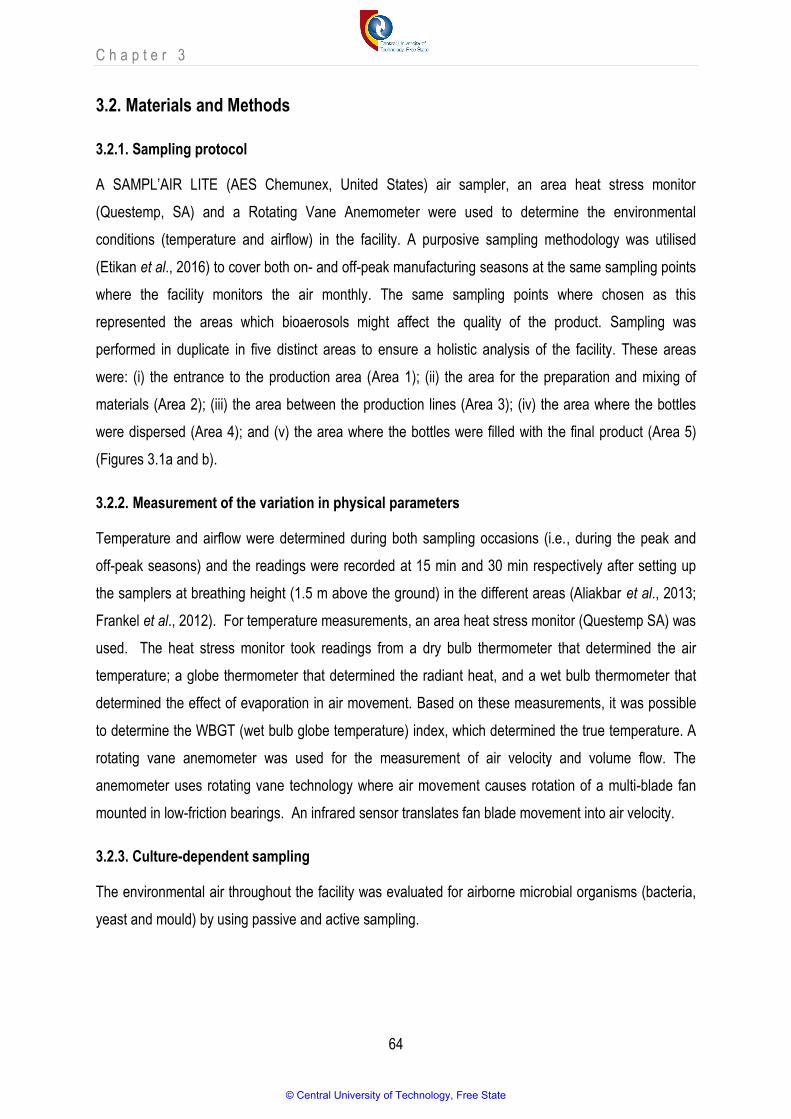
C h a p t e r 3
64
3.2. Materials and Methods
3.2.1. Sampling protocol
A SAMPL’AIR LITE (AES Chemunex, United States) air sampler, an area heat stress monitor
(Questemp, SA) and a Rotating Vane Anemometer were used to determine the environmental
conditions (temperature and airflow) in the facility. A purposive sampling methodology was utilised
(Etikan et al., 2016) to cover both on- and off-peak manufacturing seasons at the same sampling points
where the facility monitors the air monthly. The same sampling points where chosen as this
represented the areas which bioaerosols might affect the quality of the product. Sampling was
performed in duplicate in five distinct areas to ensure a holistic analysis of the facility. These areas
were: (i) the entrance to the production area (Area 1); (ii) the area for the preparation and mixing of
materials (Area 2); (iii) the area between the production lines (Area 3); (iv) the area where the bottles
were dispersed (Area 4); and (v) the area where the bottles were filled with the final product (Area 5)
(Figures 3.1a and b).
3.2.2. Measurement of the variation in physical parameters
Temperature and airflow were determined during both sampling occasions (i.e., during the peak and
off-peak seasons) and the readings were recorded at 15 min and 30 min respectively after setting up
the samplers at breathing height (1.5 m above the ground) in the different areas (Aliakbar et al., 2013;
Frankel et al., 2012). For temperature measurements, an area heat stress monitor (Questemp SA) was
used. The heat stress monitor took readings from a dry bulb thermometer that determined the air
temperature; a globe thermometer that determined the radiant heat, and a wet bulb thermometer that
determined the effect of evaporation in air movement. Based on these measurements, it was possible
to determine the WBGT (wet bulb globe temperature) index, which determined the true temperature. A
rotating vane anemometer was used for the measurement of air velocity and volume flow. The
anemometer uses rotating vane technology where air movement causes rotation of a multi-blade fan
mounted in low-friction bearings. An infrared sensor translates fan blade movement into air velocity.
3.2.3. Culture-dependent sampling
The environmental air throughout the facility was evaluated for airborne microbial organisms (bacteria,
yeast and mould) by using passive and active sampling.
© Central University of Technology, Free State

C h a p t e r 3
65
3.2.3.1. Passive sampling
The facility under study monitored air quality on a monthly basis by using passive monitoring (Haig et
al., 2016). Passive monitoring is also referred to as settle plates and is done by placing petri dishes
containing agar that are exposed to the air for 20 min in the area to be monitored. Microbes that settle
out of the ambient air can then be determined quantitatively. Petri dishes containing specific media for
total microbial (TPC or total plate count) and yeast and mould (CA - Chloramphenicol Agar) counts
were therefore used. Because the facility monitors the air on a monthly basis using this method, the
data that had been obtained at the time of the study were also used.
3.2.3.2. Active sampling
Active sampling was performed by using two SAMPL’AIR LITE (AES Chemunex) air samplers
simultaneously for each area (Roux et al., 2013; Yao et al., 2009). Active bioaerosol sampling systems
consist of five fundamental elements: (i) inlet into the sampling device; (ii) transport of the air sample
through the device; (iii) particle size selection; (iv) collecting medium; and (v) a pump and calibrated
flow monitor (Colbeck, 1998). Air samples were collected at a flow rate of 100 ℓ.min-1. The air samplers
were disinfected with ethanol between different sampling points in order to prevent cross contamination
of the samples. The samplers were turned on for two minutes prior to sampling to allow the ethanol to
evaporate, thus ensuring that the number of microorganisms recovered would not be affected. Air
samples were taken at a height of 1.5 m from the ground, which was the same level as the working
stations in the centre of each area (Shintani et al., 2004). Sterile petri dishes containing non-selective
and selective media were used. After five minutes, the samplers were turned off and the petri dishes
were removed, closed with a lid, and inverted. The petri dishes were stored and transported to a
laboratory at the Central University of Technology, Free State, for further analysis.
3.2.4. Selection, enumeration and cryopreserving of the culturable fraction
Active air samples collected on the petri dishes containing the non-selective and selective media were
incubated for a specific time at specific temperatures (Table 3.1).
Table 3.1: Media, incubation time and temperature
Enumeration Conditions for Different Microorganisms
Microorganisms Media Incubation Time Temperature
Total microbial load PCA (plate count agar) 72 h 30°C
Yeast and mould RBC (Rose Bengal Chloramphenicol 72 h 25°C
© Central University of Technology, Free State

C h a p t e r 3
66
agar)
Coliforms and E. coli VRB (Violet Red Bile agar) with MUG (4-
Methylumbelliferyl-β-D-Glucuronide) 24 h 37°C
Salmonella spp. XLD (Xylose Lysine Deoxycholate agar) 24 h 37°C
Staphylococcus spp. BPA (Baird-Parker agar) 48 h 37°C
The numbers of colony forming units (CFUs) on each plate were counted using a colony counter and
converted into airborne concentration (CFU.m-3). Microbial counts were performed using standard
guidelines adapted from The Compendium of Methods for the Microbiological Examination of Foods
(National Advisory Committee, 2018; Swanson et al., 1992). Counts above 300 CFUs per plate were
marked as too numerous to count (TNTC) and spreader colonies that exceeded 50% of the plate were
marked as ‘spreaders. TNTC and ‘spreader plates were not included in the statistical analyses. The
remaining samples were analysed for the presence of total microbial load, yeast and mould, coliforms,
presumptive positive Escherichia coli (E. coli), presumptive positive Salmonella spp., and presumptive
positive Staphylococcus spp. (including presumptive positive Staphylococcus aureus [S. aureus]). The
microbial counts were corrected as per instructions in the manual (SAMPL’AIR LITE, AES Chemunex),
using the positive hole conversion method based on Feller’s (1950) statistical correction equation
(Anderson, 1958; Lee et al., 2016). This equation is expressed as follows:
Where Pr is the statistically corrected count, N is the number of holes in the sampling head, and r
resembles each colony count (Anderson, 1958; Lee et al., 2016). The microbial concentration of the
bioaerosols was calculated using the following formula:
Where C is the bioaerosol concentration in CFU.m-3, N is the total bioaerosol count after the positive
hole conversion method, Q is the sampling flowrate or the viable sampler, and t is the sampling
duration (Anderson, 1958; Lee et al., 2016).
Individual colonies were selected with a sterile inoculation loop and bacteria were stored in 2 mℓ
Microbanks (ProLab, United States). These Microbanks were vortexed, labelled and stored at -80°C.
Yeast and mould colonies were stored in 1.5 mℓ CryoVials (Fisher Scientific, United States) containing
1 mℓ 15% glycerol. CryoVials were vortexed, labelled and stored at -80°C (De Paoli & Tedeschi, 2011).
© Central University of Technology, Free State

C h a p t e r 3
67
3.2.5. Statistical analyses
Pearson’s correlation technique was used to measure the relationship between different microbiota
across various areas within a selected season, with the rest of intrinsic and extrinsic parameters being
kept constant. Furthermore, the relationship between temperature and microbial counts was measured
using the same methodology (Table 3.3 and Table 3.4) with P≤0.05 considered to be statistically
significant. According to the correlation coefficient (r), the correlations were defined as none (± 0-0.3),
weak (± 0.3-0.5), moderate (± 0.5-0.7), and strong (±0.7-1.0) (Cramer, 1987; Li et al., 2011). All the
analyses were conducted using the Statistical Data Analysis software (2018).
3.3. Results and Discussion
3.3.1. Recording of physical parameters
Like all living organisms, bioaerosols also require a specific environment, nutrition and mode of
spreading to survive. This principle also applies to the bioaerosols in this specific fruit juice industry.
When the study was conducted, there were no previously recorded data of the physical factors
(temperature and airflow) during different seasons for this facility because it was not part of the quality
control department’s standard operating procedures to monitor these parameters. However, when the
study was conceptualised, two basic environmental parameters, namely temperature and airflow, were
selected as these are fundamental factors that bioaerosols require to survive and spread. Temperature
in particular is an important environmental factor that affects the growth and development of
microorganisms because certain microorganisms can only grow and proliferate at specific
temperatures. The effect of temperature on microorganisms was highlighted by Farrell and Rose as
early as 1967. Historically, the concept of airborne spread was first described in detail by Wells (1934,
1955), but to date little is known about the impact of airflow patterns on the spreading of bioaerosols (Li
et al., 2007; Seedorf & Schmidt, 2017).
Temperature and airflow sampling points were limited as the temperature and airflow were only
measured at the five specific points of interest. These points represented the five areas where the
facility monitors air quality as well as the areas where bioaerosols may effect the quality of the product.
The results that were obtained indicated no trend in the deviation of temperature and airflow observed
during the peak season (onset of summer) and off-peak season (onset of autumn). The average indoor
air temperature ranged between 18−22°C (±1.1C) and airflow between 0 to 4.4. m.s-1 as indicated in
Figures 3.1a and b. The lowest indoor temperature recorded was in Area 1 (the entrance of the
production facility) and varied between 19.79°C in the peak season and 18.28°C in the off-peak
© Central University of Technology, Free State

C h a p t e r 3
68
season. Therefore, regardless of the typically high outside temperatures (28°C) for the peak season,
these results indicated that the outside temperature had no significant effect on the temperature inside
the facility.
The maximum temperature was recorded in Area 5 (filling of bottles with final product) and ranged from
21.95°C during the peak season to 21.90°C during the off-peak season. Area 5 comprised mainly of
automated machinery that filled the bottles with the final product. However, the system did not function
in a completely automated manner as staff members still needed to assist with packing bottles before
filling, filling bottles, closing bottles after filling, labelling bottles, and packing filled bottles for shipment.
A further complication that was observed was the fact that more than one product could be filled
simultaneously. It was noted that the operating machinery and the presence of the personnel
contributed to a warm, compact atmosphere in this area, which was an observation that was also noted
by Wyon (2004).
The fact that nearly no airflow was recorded in Area 1 (the highest was an average of 4.4. m.s-1) implies
that the bioaerosol distribution in this facility was not dependant on air flow (Barberan et al., 2015);
therefore the lack of an air filtration system might have contributed to the continuous presence of
bioaerosols inside the facility.
© Central University of Technology, Free State
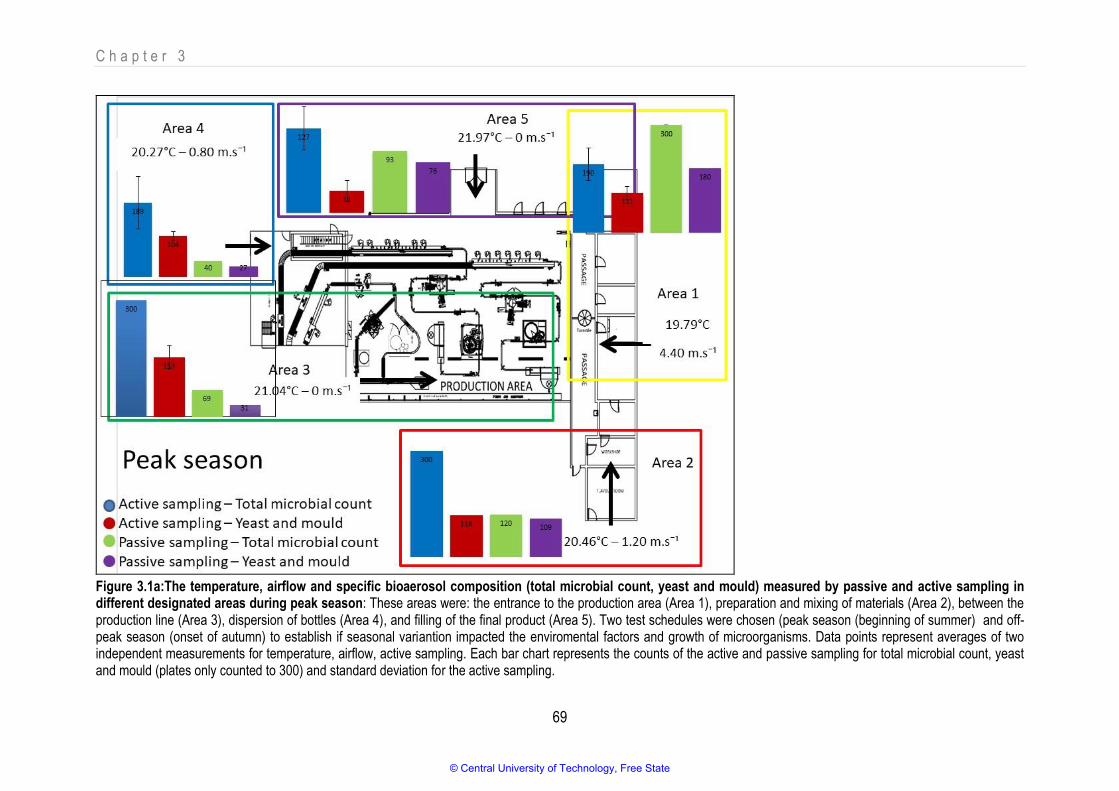
C h a p t e r 3
69
Figure 3.1a:The temperature, airflow and specific bioaerosol composition (total microbial count, yeast and mould) measured by passive and active sampling in different designated areas during peak season: These areas were: the entrance to the production area (Area 1), preparation and mixing of materials (Area 2), between the production line (Area 3), dispersion of bottles (Area 4), and filling of the final product (Area 5). Two test schedules were chosen (peak season (beginning of summer) and off-peak season (onset of autumn) to establish if seasonal variantion impacted the enviromental factors and growth of microorganisms. Data points represent averages of two independent measurements for temperature, airflow, active sampling. Each bar chart represents the counts of the active and passive sampling for total microbial count, yeast and mould (plates only counted to 300) and standard deviation for the active sampling.
© Central University of Technology, Free State

C h a p t e r 3
70
Figure 3.1b:The temperature, airflow and specific bioaerosol composition (total microbial count, yeast and mould) measured by passive and active sampling in different designated areas during off-peak season: These areas were: the entrance to the production area (Area 1), preparation and mixing of materials (Area 2), between the production line (Area 3), dispersion of bottles (Area 4), and filling of the final product (Area 5). Two test schedules were chosen (peak season (beginning of summer) and off-peak season (onset of autumn) to establish if seasonal variantion impacted the enviromental factors and growth of microorganisms. Data points represent averages of two independent measurements for temperature, airflow, active sampling. Each bar chart represents the counts of the active and passive sampling for total microbial count, yeast and mould (plates only counted to 300) and standard deviation for the active sampling.
© Central University of Technology, Free State

C h a p t e r 3
71
3.3.2. Comparison of findings for passive and active sampling
Various studies have examined the concentrations of airborne bacteria, yeast and mould in different
environments. For this type of investigation, it is important not only to understand what types of
microbes are present in the air, but also how many there are (Prussin et al., 2015). In some food
industries the resources and time to determine the presence of specific types of bioaerosol are not
always available, thus determining the number of bioaerosols is a quicker indication of potentially
unhygienic effects. Passive and active sampling methods have been used widely in the last decades to
assess bioaerosol concentrations in indoor environments (Canha et al., 2015; Napoli et al., 2012). The
passive sampling method appeals to most types of industries due to the fact that they are inexpensive,
easy to use, do not require electricity, and are small enough to be transported and deployed almost
anywhere. Some studies have revealed that passive sampling provides valid risk assessment as it
measures the harmful part of the airborne population that may fall on to a critical surface (Markovic et
al., 2015; Napoli et al., 2012).
When the study was conducted at this specific fruit juice industry, it was noted that it had a standard
operating procedure (SOP) for environmental monitoring that required passive bioaerosol monitoring
once a month in specific designated areas. Specific limits were set for the total microbial load (<100
CFU per plate) and for yeast and mould (<50 CFU per plate) as part of their standard operating
procedure. Although the SOP stipulated that, in the case of counts higher than their set limits, the
corrective action was to re-test twice in that specific month, this was not efficient as the root cause was
not determined and therefore no corrective action could be implemented to ensure that there were no
reoccurrences.
Several studies have attempted to compare the values of microbial loads obtained through both active
and passive sampling, but inconsistent results were obtained. In certain studies, significant correlations
were observed (Orpianesi et al., 1983; Perdelli et al., 2000; Whyte, 1986), while in others no
correlations could be reported (Petti et al., 2003; Sayer et al., 1972). Interestingly, international
standards offer different techniques (active or passive sampling) and different kinds of samples (living
or non-living components), thus leaving the choice of system open (Napoli et al., 2012). In this study,
the results from both sampling methods were compared and correlated to determine the reliability and
performance of the passive sampling method. Figures 3.1a and b indicate the counts for total microbial
load and for yeast and mould respectively in a bar chart. These results were obtained during the onset
of summer and autumn in five designated areas in the facility under study.
© Central University of Technology, Free State

C h a p t e r 3
72
It was expected that the active sampling method would detect increased microbial counts in every
designated area. Active microbiological air sampling physically draws a known volume of air through a
particle collection device. Active monitoring requires the microbial air sampler to force air onto or into
collection media at a specific rate over a specified time period (Colbeck, 1998; Kornacki, 2014; Roux et
al., 2013; Yao et al., 2009). For the total microbial load, the passive sampling method detected higher
total microbial counts during the peak and off-peak season in Area 1 (entrance to the facility) as well as
in Area 5 (filling of the final product) during off-peak season for total microbial counts. During the peak
season, higher counts of yeast and mould were detected using the passive sampling procedure in Area
1 (entrance to the facility) as well as in Area 5 (filling of the final product). This was contrary to what had
been found in previous research where the active sampler had detected higher counts (Markovic et al.,
2015). These results obtained in this study might have been due to the fact that sampling was not
performed on the same day.
The concentrations of yeast and mould observed during the two samplings differed, not only for the
reason that different techniques were used for the passive and active sampling of bioaerosols, but also
because two different growth mediums were used, namely CA for passive sampling and RBC for active
sampling. CA was developed for retrieval of yeast and mould in milk and milk products, while RBC was
developed for yeast and mould retrieval in food and environmental samples. The literature suggests
that RBC is superior to CA in terms of both number of colonies and number of genera isolated from the
air (Mentese et al., 2017). In the current study, higher counts of yeast and mould than of total microbial
load were observed in the off-peak season using active sampling methods in Area 1 (entrance to the
facility) and Area 5 (filling of final product). This was probably due to the fact that the media used for the
yeast and mould enumeration were specific for the growth of yeast and mould and that more yeast and
mould were identified on the selective media than on the non-selective media (Mentese et al., 2017).
However, overall, lower yeast and mould counts were observed compared to total microbial load during
peak season. This could be attributed to the overgrowth on selective media in the petri dishes that was
observed during the enumeration of mould, as this prevented accurate counting and isolation of other
moulds or yeast that could have been present (Beuchat & Mann, 2016; Douglas et al., 1979).
3.3.3. Bioaerosol concentrations in different seasons
Bioaerosols and their components could pose an environmental hazard when present in high
concentrations in indoor environments, as they result in spoilage/contamination of food products or they
may pose various occupational health risks (Stetzwnbach et al., 2004). Bioaerosol composition
depends on four main factors: (i) different environments (in the current study, these were areas in the
© Central University of Technology, Free State
C h a p t e r 3
73
facility); (ii) the season (Frankel et al., 2012; Heald & Sprancklen, 2009; Wu et al., 2017; Zhen et al.,
2017); (iii) the weather and environment-related variables (Jones & Harrison, 2004); and (iv)
temperature and water availability. At the time of the study, no data could be traced for the bioaerosol
composition in this specific fruit juice facility, and this made it difficult to determine which type of
bioaerosols needed to be analysed. Therefore, a broad range of bioaerosols was investigated in
different designated areas during different seasons to determine where the microbial high-risk areas in
the facility were (Table 3.2).
© Central University of Technology, Free State

C h a p t e r 3
74
Table 3.2: Culturable bioaerosol fraction counts measured by SAMPL’AIR LITE in different designated areas. Entrance to the production area (Area 1),
preparation and mixing of materials (Area 2), between the production lines (Area 3), in the area for the dispersion of bottles (Area 4), and in the area where the final product
was filled (Area 5). Two test schedules had been devised: one for the peak season (the onset of summer) and one for the off-peak season (the onset of autumn) to determine
whether seasonal variention impacted the growth of microorganisms in the facility. Plates with counts higher than 300 were recorded as >300. Data points represent averages
of two independent measurements.
Peak Season vs Off-Peak Season
Area
Peak Total
microbial load
Off-Peak Total
microbial load
Peak Yeast and
mould
Off-Peak Yeast and
mould
Peak Coliforms
and E. colia
Off-Peak Coliforms and
E. colia
Peak Salmonella
spp.
Off-Peak Salmonella
spp.
Peak Staphylococcus
spp.b
Off-Peak Staphylococcus
spp.b
Area 1 190 73 111 76 0 0 0 0 41 68
Area 2 >300 >300 118 >300 7 0 2 0 167 43
Area 3 >300 >300 153 >300 10 0 0 2 105 42
Area 4 189 >300 104 86 1 12 0 3 119 138
Area 5 127 52 33 90 6 18 2 12 11 23
a Not enough coliforms and E. coli to separate – counts combined. b No Staphylococcus aureus spp. were detected.
© Central University of Technology, Free State

C h a p t e r 3
75
Total microbial loads in the air are tested for one main reason, which is that the counts may indicate if
the environmental conditions are favourable for microbial growth. The higher the number of
microorganisms in a specific area, the greater the probability that the environment in that area is
suitable for the prevalence of hazardous microorganisms (Bottari et al., 2015). However, no uniform
international standard is available as a guide for acceptable maximum bioaerosol loads (Kim et al.,
2018; Madal & Brandl, 2011), and this makes it difficult to determine if the total microbial load detected
in the air poses a risk or not. What does assist, is that definite evidence has been recorded of the
connection between bacteria and spores found in the air and their effect on food-contact surfaces
(Bower et al., 1996; Di Ciccio et al., 2015). The standard operating procedure of the facility for
acceptable microbial limits (Table 3.3) on food contact surfaces was therefore used as a guideline to
determine which limits were acceptable for microorganisms found in the air (Di Ciccio et al., 2015;
Hennekinne et al., 2012).
Table 3.3: Acceptable microbial limits for food contact surfaces in the facility under study
Microbial Specifications for Food Contact Surfaces
Microorganisms
Specification
Total microbial load <100 CFU/area
Yeast and mould Not detected
Coliforms and E. coli Not detected
Salmonella spp. Not detected
Staphylococcus spp. Not detected
When comparing the results obtained with the specifications in the guideline used in this facility for food
contact surfaces, the total microbial load observed was beyond the specifications for all five areas
during the peak season (>100 CFU.m-3) as well as for Areas 2, 3 and 4 during the off-peak season
(>100 CFU.m-3). High counts were reported for all areas in the facility during the peak season as this
was the busiest season and the facility was running at full capacity. During the off-peak season,
personnel were only present in Area 2 where the preparation and mixing of materials occurred, in the
production line area (Area 3), and in the area where the bottles were dispersed (Area 4). The presence
of the workers was clearly associated with the high microbial counts observed in these areas. The
literature also indicates a correlation between microbial counts and the presence of personnel in
specific areas. Airborne microbial levels thus increase when areas are occupied by humans, which is
© Central University of Technology, Free State

C h a p t e r 3
76
not the case in unoccupied conditions. This finding was expected as humans have been reported to be
a source of bacteria and fungi in settled dust samples (Adams et al., 2015).
Yeast and mould counts were observed during the peak and off-peak seasons in all the designated
areas, but higher counts of yeast and mould were observed during the off-peak season in area 2, 3 and
5(an average of 160 CFU.m-3). This may have been due to seasonal variation, which has already been
described by several authors (Bonetta et al., 2010; Osimani et al., 2013). Yeast and mould are the
microorganisms most frequently responsible for spoilage problems in the fruit juice industry (Groot et
al., 2018; Tournas et al., 2006), which suggests that the counts observed in the facility exposed a threat
in these areas (Garnier et al., 2017). Conditions in fruit juice facilities and in the fruit juices themselves
(the raw materials used for fruit juice production, the low pH of the final product, high sugar
concentration, and low water activity) are ideal for the growth of yeast and mould, and this emphasises
the importance of a yeast- and mould-free environment in a fruit juice facility, especially because yeast
and mould have the ability to cause decay that can be detected in the development of off-flavours,
acidification, discolouration, and disintegration (Groot et al., 2018).
A detailed summary of the statistical analyses is represented in Table 3.4 and Table 3.5. The statistical
analyses revealed only three strong positive Pearson correlations that all occurred during the off-peak
season. These correlations were: (i) temperature and coliforms, presumptive E. coli (r=0.9451); (ii)
temperature and presumptive Salmonella spp. (r=0.9034); and (iii) the microbial growth between
coliforms, presumptive E. coli and presumptive Salmonella spp. (r=0.8874). Fruit juice has been
acknowledged as a frequent vehicle for transmitting pathogens such as E. coli and Salmonella spp.
since 1922 (Parish, 1998; Park et al., 2017), and with an established food safety management system
in place for this facility, low to no counts of coliforms, presumptive E. coli and presumptive Salmonella
spp. were expected. These microorganisms form part of the family Enterobacteriaceae and flourish in
the same environmental conditions (such as temperature), which confirms that the same temperature
and environment will promote the growth of the same type of microorganism (Park et al., 2017).
Pathogenic bioaerosols such as E. coli and Salmonella spp. have been recorded on food contact
surfaces, for example in abattoirs (Joseph et al., 2001) and wheat flour facilities (Villa-Rojas et al.,
2017). Although fruit juice is an acidic food (pH below 4.6), the foodborne pathogens E. coli O157:H7
and Salmonella spp. have been reported in foodborne disease outbreaks associated with fruit juice
(Iqbal et al., 2015; Oluwole et al., 2016; Tarifa et al., 2017; Vantarakis et al., 2011).
© Central University of Technology, Free State

C h a p t e r 3
77
Table 3.4: Singular comparisons between temperatures observed during the peak and off-peak seasons and microbial growth using Pearson p
scores calculated from R value.
Peak Season (temperature vs microbial growth) Off-Peak Season (temperature vs microbial growth)
Microorganisms r R2 p Microorganisms r R2 p
Total microbial load -0,1546 0,023901 0,8047 Total microbial load -0,2072 0,042932 0,73833
Yeast and mould -0,5645 0,31866 0,32203 Yeast and mould -0,4171 0,173972 0,48488
Coliforms and E. coli 0,4801 0,230496 0,41309 Coliforms and E. coli 0,9451 0,893214 0,01531*
Salmonella spp. 0,8397 0,705096 0,07516 Salmonella spp. 0,9034 0,816132 0,03551*
Staphylococcus spp. -0,3904 0,152412 0,51633 Staphylococcus spp. 0,0146 0,000213 0,98141
r - Pearson’s correlation coefficient (measure of the linear correlation between two variables X and Y).
R2 - R squared (proportion of the variance in the dependent variable that is predictable from the independent variable/s)
P - P-value (probability that would have been found for the current result if the correlation coefficient had in fact been zero [null hypothesis]). If this probability is lower than the conventional 5%
(p<0.05), the correlation coefficient is deemed statistically significant.
* - P≤0.05
© Central University of Technology, Free State

C h a p t e r 3
78
Table 3.5: Multiple comparisons between different microbial groups during the peak and off-peak seasons using Pearson p scores calculated from R
value
Peak Season (microbial growth)
Off-Peak Season (microbial growth)
Microorganisms r R2 P Microorganisms r R2 p
Total microbial vs yeast and mould 0,8582 0,73650724 0,062717 Total microbial vs yeast and mould 0,6594 0,43480836 0,22603
Total microbial vs coliforms and E. coli 0,7551 0,57017601 0,14002 Total microbial vs coliforms and E. coli -0,2564 0,06574096 0,67765
Total microbial vs Salmonella spp. -0,5729 0,32821441 0,31364 Total microbial t vs Salmonella spp. -0,4793 0,22972849 0,41432
Total microbial vs Staphylococcus spp. 0,7074 0,50041476 0,18143 Total microbial vs Staphylococcus spp. 0,3293 0,10843849 0,58843
Yeast and mould vs coliforms and E. coli 0,4462 0,19909444 0,45134 Yeast and mould vs coliforms and E. coli -0,6028 0,36336784 0,28272
Yeast and mould vs Salmonella spp. -0,0246 0,00060516 0,967748 Yeast and mould vs Salmonella spp. -0,4429 0,19616041 0,45613
Yeast and mould vs Staphylococcus spp. 0,6458 0,41705764 0,23915 Yeast and mould vs Staphylococcus spp. -0,3981 0,15848361 0,50697
Coliforms and E. coli vs Salmonella spp. -0,0247 0,00061009 0,96945 Coliforms and E. coli vs Salmonella spp. 0,8874 0,78747876 0,04458*
Coliforms and E. coli vs Staphylococcus spp. 0,2283 0,05212089 0,71187 Coliforms and E. coli vs Staphylococcus spp. 0,1218 0,01483524 0,8453
Salmonella spp. vs Staphylococcus spp. -0,6024 0,36288576 0,28272 Salmonella spp. vs Staphylococcus spp. -0,3277 0,10738729 0,59119
r - Pearson’s correlation coefficient (measure of the linear correlation between two variables X and Y).
R2 - R squared (proportion of the variance in the dependent variable that is predictable from the independent variable(s)).
P - P-value (probability that you would have found the current result if the correlation coefficient were in fact zero (null hypothesis). If this probability is lower than the conventional 5% (p<0.05)
the correlation coefficient is called statistically significant)
* - P≤0.05
© Central University of Technology, Free State

C h a p t e r 3
79
Staphylococcus aureus and some Staphylococcus spp. are extremely important in the fruit juice
industry for the following reasons: (i) They are pathogenic bacteria, capable of developing biofilms on
surfaces and food processing surfaces in fruit juice industries (Bentanzos-Cabrera et al., 2015; Iqbal et
al., 2015; Madsen et al., 2018); (ii) Staphylococcal food poisoning is one of the most common food-
borne diseases caused by fruit juice (Di Ciccio et al., 2015; Hennekinne et al., 2012; Oluwole et al.,
2016); (iii) Antibiotic resistance profiles of microbes have been found in fruit juice (Abraha et al,. 2018);
and (iv) They are frequently part of the microorganisms that cause occupational health risks (Goldstein
et al., 2014). No Staphylococcus aureus were detected during the study. High counts of
Staphylococcus spp. were observed in Areas 2, 3 and 4 during the peak season (>100 CFU.m-3) and in
Area 4 during the off-peak season (>100 CFU.m-3). Area 4 (dispersion of bottles) had poor ventilation
(the airflow recorded was 0 m.s-1) and was full of dust, making this a perfect environment for microbial
development as Staphylococcus spp. is ubiquitous in the environment and can be found in or on the air,
dust, sewage, water, environmental surfaces, humans and animals (Henneinne et al., 2012).
3.4. Conclusion
Fruit juice products have been documented as suitable growing environments for certain problematic
microorganisms. There is thus a clear need to ensure that the production environment, which includes
the air of the facility, is as clean as possible. To determine the risk of bioaerosols and how to control
them, different aspects of the facility under investigation needed to be determined during different
seasons with specific focus on: (i) environmental parameters (temperature, airflow and seasonal
impact); (ii) sampling devices; and (iii) bioaerosol concentration.
Temperature and airflow are basic environmental parameters and thus fundamental requirements for
bioaerosols to survive and spread. Just like all living organisms, bioaerosols need a conducive
environment, appropriate nutrition and a suitable mode of transportation to survive. Against this
background, the lack of temperature control in the facility under study was ideal for bioaerosol growth
as the average recorded temperature was 20.30 ±1.1C. Furthermore, almost no airflow (0 to 4.4. m.s-
1) or ventilation systems were observed which may have had either a positive or negative impact on the
facility. Because air flow as the main mode of bioaerosol spreading was not available, the bioaerosols
needed other means of transportation to spread through the facility, and this was probably facilitated by
human workers. Moreover, with no airflow or ventilation system in place, the bioaerosols were not
removed from the facility and might either have ended up in the products or could have contributed to
occupational diseases.
© Central University of Technology, Free State

C h a p t e r 3
80
To ensure a good and hazard-free fruit juice production system, measuring concentrations of
bioaerosols and the areas where they occur is important, as bioaerosol counts is a quick and effective
indication of potential risk effects. Two main sampling methods that are available for the quantification
of bioaerosols were discussed. First, passive sampling requires petri dishes containing agar. These
petri dishes are opened and exposed to the air and any bioaerosols that are present will settle in the
agar. Secondly, active sampling physically draws a known volume of air through a particle collection
device. In the industry under study, the passive sampling technique was habitually used as it was
inexpensive, easy to use, did not require electricity, and was small enough to be transported and
deployed almost anywhere. As had been expected, the quantities of bioaerosols that were detected by
the two methods differed considerably due to the different mechanisms that had been used for
sampling.
Although no well-defined association was observed between the two sampling methods used, it was
noticed that at least one of the bioaerosol counts observed using the active or passive sampling
method was outside the specification of the facility. As was stated before, no specific South African
guidelines are currently available for the detection of the concentration of bioaerosols; however, it was
deemed important for quality control in the facility and in terms of the products to determine the
bioaerosol growth potential and air quality. For this reason, the standard guideline for acceptable
microbial limits for food contact surfaces in this facility was used to estimate whether microorganisms
found in the air were within acceptable limits.
The data revealed that the total microbial counts were outside most of the specifications during both the
testing seasons. This might have been due to increased levels of airborne organisms in areas that were
frequented by the personnel. While yeast and mould were observed throughout the facility during the
peak and off-peak seasons, higher counts were observed during the off-peak season in specific areas,
which was possibly due to seasonal variation or contamination. The yeast and mould counts that were
observed could be problematic as they pointed to the fact that the facility had ideal conditions for the
growth of yeast and mould. Yeast and mould are the main microorganisms responsible for spoilage
problems in the food industry, and their control to limit counts is therefore essential. Puzzling counts of
the presumptive coliforms, E. coli, Salmonella spp. and Staphylococcus spp., were observed. These
are microorganisms that are capable of developing biofilms on food processing surfaces and they were
associated with foodborne disease outbreaks due to contaminated fruit juice before.
Even though bioaerosol exposure assessment is a rapidly evolving field with new sampling techniques
and procedures being developed almost daily, there is a clear need to be industry- and product-
© Central University of Technology, Free State

C h a p t e r 3
81
specific. Sampling techniques, types of bioaerosols, concentrations of bioaerosols and acceptable limits
will differ immensely among industries such as red meat abattoirs, the fruit juice industry, and
immunisation processing facilities. Therefore, based on the physical parameters observed in the facility
under study, there is a clear need for appropriate temperature control and suitable ventilation systems
in the fruit juice industry. Sampling methods could focus on: (i) lowering the acceptable limits for the
microorganisms observed during passive sampling and being microorganism specific; and/or (ii)
investing in active sampling equipment to gain a true representation of the microorganisms found in the
air of a specific facility.
© Central University of Technology, Free State

C h a p t e r 3
82
3.5. References
ABRAHA, H., HADISH, G., ALIGAZ, B., EYAS, G. & WORKELULE, K. 2018. Antimicrobial resistance
profile of Staphylococcus aureus isolated from raw cow’s milk and fresh fruit juice in Mekelle, Tigray,
Ethiopia. Journal of Veterinary Medicine and Animal Health 10(4), 106-13.
ADAMS, R. I., BHANGAR, S., PASUT, W., ARENS, E.A., TAYLOR, J.W., LINDOW, S.E., NAZAROFF,
W.W. & BRUNS, T.D. 2015. Chamber bioaerosol study: outdoor air and human occupants as sources
of indoor airborne microbes. PLOS ONE 10(7), e0133221.
ALIAKBAR, R., KAZEM, N. & ALLAHBAKHSH, J. 2013. Measurements of bioaerosols in the air around
the facilities of waste collection and disposal. Environment Protection Engineering 39, 105-12.
ANDERSON, P.W. 1958. Absence of diffusion in certain random lattices. Physical Review 109, 1492.
ANEJA, R.K., DHIMAN, R., AGGARWAL, N.K. & ANEJA, A. 2014. Emerging preservation techniques
for controlling spoilage and pathogenic microorganisms in fruit juices. International Journal of
Microbiology 2014, 1-15.
BARBERAN, A., DUNN, R.R., REICH, B.J., PACIFICI, K., LABER, E.B., MENNINGER, H.L., MORTON,
J.M., HENLEY, J.B., LEFF, J.W., MILLER, S.L. & FIERER, N. 2015. The ecology of microscopic life in
household dust. Proceedings of the Royal Society 282, 246-55.
BENTANZOS-CABRERA, G., MONTES-RUBIO, P.Y., FABELA-ILLESCAS, H.E., BELEFANT-MILLER,
H. & CANCINP-DIAZ, J.C. 2015. Antibacterial activity of fresh pomegranate juice against clinical strains
of Staphylococcus epidermidis. Food & Nutritional Research 59, 276-86.
BEUCHAT, L.R. & MANN, D.A. 2016. Comparison of new and traditional culture-dependent media for
enumerating foodborne yeasts and moulds. Journal of Food Protection 79 (1), 95-111.
BONETTA, S., BONETTA, S., MOSSO, S., SAMPO, S., CARRARO, E. 2010. Assessment of
microbiological indoor air quality in an Italian office building equipped with an HVAC system.
Environmental Monitoring Assessment 161, 473-83.
BOTTARI, B., SANTARELLI, M. & NEVIANI, E. 2015. Determination of microbial load for different
beverages and foodstuff by assessment of intracellular ATP. Trends in Food Science & Technology 44,
36-48.
© Central University of Technology, Free State
C h a p t e r 3
83
BOWER, C.K., MCGUIRE, J. & DAESCHEL, M.A. 1996. The adhesion and detachment of bacteria and
spores on food-contact surfaces. Trends in Food Science & Technology 7(5), 152-57.
CANHA, N., ALMEIDA, S.M., DO CARMO FREITAS, M. & WOLTERBEEK, H.T. 2015. Assessment of
bioaerosols in urban and rural primary schools using passive and active sampling methodologies.
Archives of Environmental Protection 41(4), 11-22.
COLBECK, I. 1998. Physical and chemical properties of aerosols. London: Blackie Academic &
Professional.
CRAMER, J.S. 1987. Mean and variance of R2 in small and moderate samples. Journal of
Econometrics 35, 253-66.
DE PAOLI, P. & TEDESCHI, R. 2011. Collection and preservation of frozen microorganisms. Methods
in Molecular Biology 675, 13-26.
DI CICCIO, P., VERGARAM A., FESTINO, A.R., PALDUI, D., ZANARDI, E., GHIDINI, S. & LANIERI, A.
2016. Biofilm formation by Staphylococcus aureus on food contact surfaces: relationship with
temperature and cell surfaces hydrophobicity. Food Control 50, 930-36.
DOUGLAS, A.K. DOUGLAS, J.R., HOCKING, A.D. & PITT, J.I. 1979. Dichloran-Rose Bengal medium
for enumeration and isolation of moulds from foods. Applied Environmental Microbiology 37(5), 959-64.
ETIAKN, I., MUSA, S.A. & ALKASSIM, R.S. 2016. Comparison of convenience sampling and purposive
sampling. American Journal of Theoretical and Applied Statistics 5(1), 1-4.
FARRELL, J. & ROSE, A. 1967. Temperature effects on microorganisms. Annual Review of
Microbiology 21, 101-20.
FRANKEL, M., BEKO, G., TIMM, M., GUSTAVSEN, S., HANSEN, E.W. & MADSEN, A. 2012.
Seasonal variation of indoor microbial exposures and their relations to temperature, relative humidity
and air exchange rates. Applied Environmental Microbiology 78(23), 8289-97.
GARNIER, I., VALENCE, F., PAWTOWSKI, A., AUHUSTSINAVA-GALEME I., FROTTE, N.,
BARONCELLI, R., DENIEL, F., COTON, E. MOUNIER, J. 2017. Diversity of spoilage fungi associated
with various French dairy products. International Journal of Food Microbiology 241, 191-97.
© Central University of Technology, Free State
C h a p t e r 3
84
GOLDSTEIN, R.E.R., MICALLEF, S.A., GIBBS, S.G., HE, X., GEORGE, A., SAPKOTA, A., JOSEPH,
W.S. & SAPKOTA, A.R. 2014. Occupational exposure to Staphylococcus aureus and Enterococcus
spp. among spray irrigation workers using reclaimed water. International Journal of Environmental
Research and Public Health 11(4), 4340-55.
GROOT, M.N., ABEE, T. & VAN BOKHORST-VAN DE VEEN, H. 2018. Inactivation of conidia from
three Penicillium spp. isolated from fruit juices by conventional and alternative mild preservation
technologies and disinfection treatments. Food Microbiology 9, 12-19.
HAIG, C.W., MACKAY, W.G., WALKER, J.T. & WILLIAMS, C. 2016. Bioaerosol sampling: sampling
mechanisms, bio-efficiency and field studies. Journal of Hospital Infection 93, 242-55.
HEALD, C.L. & SPRACKLEN, D.V. 2009. Atmospheric budget of primary biological aerosol particles
from fungal spores. Geophysical Research Letters 36, L09806
HENNEKINNE, J.A., DE BUYSER, M.L. & DRAGACCI S. 2012. Staphylococcus aureus and its food
poising toxins characterization and outbreak investigation. FEMS Microbiology 36, 815-36.
IQBAL, M.N., ANJUM, A.A., ALI, M.A., HUSSAIN, F., ALI, S., MUHAMMAD, A., IRFAN, M., AHMAD,
A., IRFAN, M. & SHABBIR, A. 2015. Assessment of microbial load of un-pasteurized fruit juices and in
vitro antibacterial potential of honey against bacterial isolates. The Open Microbiology Journal 9, 26-32.
JONES, A.M. & HARRISON, R.M. 2004. The effects of meteorological factors on atmospheric
bioaerosol concentrations: a review. Science of Total Environment 326, 51-180.
JOSEPH, B., OTTA, S.K., KARUNASAGAR, I. & KARUNASAGAR I. 2001. Biofilm formation by
Salmonella spp. on food contact surfaces and their sensitivity to sanitizers. International Journal of
Food Microbiology 64, 367-72.
KIM, K.H., KABIR, E. & JAHAN, S.A. 2018. Airborne bioaerosols and their impact on human health.
Journal of Environmental Sciences 67, 23-25.
KORNACKI, J. 2014. An environmental sample approach to product risk assessment. Food Safety
magazine, February.
LEE, B.U., LEE, G. & HEO, K.J. 2016. Concentration of culturable bioaerosols during winter. Journal of
Aerosol Science 94, 1-8.
© Central University of Technology, Free State
C h a p t e r 3
85
LI, M., QI, J., ZHANG, H., HUANG, S., LI, L. & GAO, D. 2011. Concentration and size distribution of
bioaerosols in an outdoor environment in the Qingdao coastal region. Science of Total Environment
409, 3812-19.
LI, Y., LEUNG, G.M., TANG, J.W., YANG, X., CHAO, C.Y.H., LIN, J.Z., LU, J.W., NIELSEN, P.V., NIU,
J., QIAN, H., SLEIGH, A.C., SU, H.J.J., SUNDELL, J., WONG, T.W. & YUEN, P.L. 2007. Role of
ventilation in airborne transmission of infection agents in the built environment: a multidisciplinary
systematic review. Indoor Air 17, 2-18.
MADSEN, A.M., MOSLEHI-JENABIAN, S., ISLAM, M.Z., FRANKEL, M., SPILAK, M. &
FREDERIKSEN, M.W. 2018. Concentrations of Staphylococcus species in indoor air as associated with
other bacteria, season, relative humidity, air change rate, and S. aureus positive occupants.
Environmental Research 160, 282-91.
MANDAL, J. & BRANDL, H. 2011. Bioaerosols in indoor environments: a review with special reference
to residential and occupational locations. The Open Environmental & Biological Monitoring Journal 4,
83-96.
MARKOVIC, M.Z., PROKOP, S., STAEBLER, R.M., LIGGO, J. & HARNER, T. 2015. Evaluation of the
particle infiltration efficiency of three passive samplers and the PS-1 active air sampler. Atmospheric
Environment 112, 289-203.
MENTESE, S., OTKUN, M.F. & PALAZ, E. 2017. Comparison of Dichloran-rose Bengal
chloramphenicol and Sabouraud dextrose agar with cycloheximide and chloramphenicol for airborne
mould sampling. Aerobiologia 2, 211-19.
NAPOLI, C. MARCOTRIGIANO, V. & MONTAGO, M.T. 2012. Air sampling procedures to evaluate
microbial contamination: a comparison between active and passive methods in operating theatres.
BMC Public Health 12, 594-600.
NATIONAL ADVISORY COMMITTEE ON MICROBIOLOGICAL CRITERIA FOR FOODS. 2018.
Response to questions posed by the Department of Defence regarding microbiological criteria as
indicators of process control or insanitary conditions. Journal of Food Protection 81(1), 115-41.
OLUWOLE, O.A., DAVID, O.M., FALEGAN, C.R., AWOJUYIGBE, B. & OLAJIDE, O.M. 2016.
Microbiological and physicochemical properties of commercial seal tampered refrigerated fruit juices.
International Journal of Biological Research 4(1), 21-24.
© Central University of Technology, Free State

C h a p t e r 3
86
ORPIANESI, C., CRESCI, A., LA ROSA, F., SALTALAMACCHIA, G. & TARSI, R. 1983. Evaluation of
microbial contamination in a hospital environment. Nuovi Ann Ig Microbiology 34, 171-85.
OSIMANI, A., AQUILANTI, L., TAVOLETTI, S. & CLEMENTI, F. 2013. Microbiological monitoring of air
quality in a university canteen: an 11-year report. Environ Monitoring Assessment 185, 4765-74.
PARISH, M.E. 1998. Coliforms, Escherichia coli and Salmonella Serovars associated with a citrus-
processing facility implicated in a Salmonellosis outbreak. Journal of Food Protection 61, 280-84.
PARK, I.K., HA, J.W. & KANG. DH. 2017. Investigation of optimum ohmic heating conditions for
inactivation of Escherichia coli O157:H7, Salmonella enterica serovar Typhimurium, and Listeria
monocytogenes in apple juice. BMC Microbiology 17, 117-25.
PERDELLI, F., SARTINI, M., ORLANDO, M., SECCHI, V. & CRISTINA, M.L. 2000. Relationship
between settling microbial load and suspended microbial load in operating rooms. Annals of Hygiene
12, 373-80.
PETTI, S., IANNAZZO, S. & TARSITANI, G. 2003. Comparison between different methods to monitor
the microbial level of indoor air contamination in the dental office. Annals of Hygiene 15, 725-33.
PRUSSIN, A.J., GARCIA, E.B. & MARR, L.C. 2015. Total virus and bacteria concentrations in indoor
and outdoor air. Environmental Science Technology Letter 2(4), 84-88.
ROUX, J., KASPARI, O., HEINRICH, R., HANSCHMANN, N. & GRUNOW, R. 2013. Investigation of a
new electrostatic sample for concentrating biological and non-biological aerosol particles. Aerosol
Science and Technology 47, 463-71.
RUZER, L.S. & HARLET, N.H. 2012. Aerosol handbook: measurement, dosimetry and health effects.
2nd edition. Broken Sound Parkway, Boca Raton, 6000 Broken Sound Parkway NW, Suite 300. CRC
Press.
SAYER, W.J., MACKNIGHT, N.M. & WILSON, H.W. 1972. Hospital airborne bacteria as estimated by
the Andersen sampler versus the gravity settling culture plate. American Journal of Clinical Pathology
58, 558-66.
SEEDORF, J. & SCHMIDT, R.G. 2017. The simulated air flow pattern around a moving animal
transport vehicle as the basis for a prospective biosecurity risk assessment. Heliyon 3(8), 358-76.
© Central University of Technology, Free State
C h a p t e r 3
87
SHINTANI, H., TANIAI, E., MIKI, A., KUROSU, S. & HAYASHI, F. 2004. Comparison of the collecting
efficiency of microbiological air samples. Journal of Hospital Infections 56, 42-48.
SOUTH AFRICA. 2008. The Consumer Protection Act No. 68 of 2008. Pretoria: Government Printer.
STETZWNBACH, L.D., BUTTNER, M.P. & CRUZ, P. 2004. Detection and enumeration of airborne
contaminants. Current Opinion in Biotechnology 15, 170-74.
SWANSON, K.M.J., BUSTA, F.F., PETERSON, E.H. & JOHNSON, M.G. 1992. Colony count methods.
In: C. Vanderzant & D.F. Splittstoesser (Eds.). Compendium of methods for the microbiological
examination of foods, 3rd edition. Washington DC, American Public Health Association, 75-95.
TARIFA, M.C., LOZANO, J.E., & BRUGNONI, L.I. 2017. Candida krusei isolated from fruit juices’
ultrafiltration membranes promotes colonization of Escherichia coli O157:H7 and Salmonella enterica
on stainless steel surfaces. Journal of Microbiology 55(2), 96-103.
TOURNAS, V.H., HEERES, J. & BURGESS, L. 2006. Moulds and yeasts in fruit salads and fruit juices.
Food Microbiology 23, 684-88.
VANTARAKIS, A., AFFIFFI, M., KOKKINOS, P., TSIBOUXI, M. & PAPAPETROPOULOU, M. 2011.
Occurrence of microorganisms of public health and spoilage significant in fruit juices sold in retail
markets in Greece. Anaerobe 17, 288-91.
VILLA-ROJAS, R., ZHU, M., PAUL, N.C., GRAY, P., XU, J., SHAH, D.H. & TANG, J. 2017. Biofilm
forming Salmonella strains exhibit enhanced thermal resistance in wheat flour. Food Control 73, 689-
95.
WANG, C., CHEN, B.T., HAN, B., LIU, A.C., HUNG, P., CHEN, C. & CHAO, H. 2015. Field evaluation
of personal sampling methods for multiple bioaerosols. PLOS ONE 10(3), 1-19.
WELLS, W.F. 1934. An airborne infection study: II-droplets and droplet nuclei. American Journal of
Hygiene 20, 619-27.
WELLS, W.F. 1955. Airborne contagion and air hygiene: an ecological study of droplet infection.
Cambridge, MA: Harvard University Press.
WHYTE, W. 1986. Sterility assurance and models for assessing airborne bacterial contamination.
Journal of Parental Science and Technology 40, 188-97.
© Central University of Technology, Free State
C h a p t e r 3
88
WU, B., MENG, K., WEI, L., CAI, Y. & CHAI, T. 2017. Seasonal fluctuations of microbial aerosol in live
poultry markets and the detection of endotoxins. Frontiers Microbiology, 69-78.
WYON, D. 2004. The effects of indoor air quality on performance and productivity. Indoor Air (14)7, 92-
101.
XU, Z., WEI, K., WU, YAN., SHEN, F., CHEN, Q., LI, M. & YAO, M. 2013. Enhancing bioaerosol
sampling by Andersen impactors using mineral oil-spread agar plates. PLOS ONE 8(2), 1-10.
YAO, M., ZHANF, H., DONG, S., ZHEN, S. & CHEN, X. 2009. Comparison of electrostatic collection
and liquid impinging methods when collecting airborne house dust allergens, endotoxin and (1, 3)-β-d-
glucans. Aerosol Science 40, 492-502.
ZHEN, Q., DENG, Y., WANG, Y., WANG, X., ZHANG, H., SUN, X. & OUYSNG, Z. 2017.
Meteorological factors had more impact on airborne bacterial communities than air pollutants. Science
of the Total Environment 601, 703-12.
ZUKIEWIC-SOBCZAK, W.A. 2013. The role of fungi in allergenic diseases. Postepy Dermatologii
Alergologii 1, 42-45.
© Central University of Technology, Free State

89
CHAPTER 4
ENUMERATION, CLASSIFICATION AND CATEGORISATION OF CULTURABLE
BIOAEROSOLS IN FRUIT JUICE MANUFACTURING
For submission partially or in full to:
PLOS ONE. ISSN: 1932-6203
© Central University of Technology, Free State

C h a p t e r 4
90
4.1. Introduction
Bioaerosols are defined as “aerosols comprising of particles of biological origin or activity which may
affect living things through infectivity, allergenicity, toxicity, [and] pharmacological or other processes”
(Hirst, 1995; Shale & Lues, 2007). Bioaerosols are emerging as important role players in atmospheric
processes, yet they are poorly understood. What is known and is universally accepted is that
bioaerosols originate from and may impact various environments. For example, bioaerosols are emitted
from terrestrial sources such as soil, forests and desert dust, and from agricultural and composting
activities. They are prevalent in urban areas, wetlands, as well as coastal and marine environments.
Moreover, they play a key role in the dispersal of reproductive units from plants and microbes where the
atmosphere enables their dissemination over geographic barriers and long distances. Bioaerosols are
thus highly relevant in the spread of organisms and they allow genetic exchange between habitats and
geographic shifts of biomes. These compounds are central elements in the development, evolution and
dynamics of ecosystems (Fröhlich-Nowoisky et al., 2016). Although bioaerosols may have beneficial
characteristics, the opposite is also possible, as the dispersal of plant, animal and human pathogens as
well as allergens has major implications for agricultural outcomes and public health. The negative
effects that bioaerosols may have on the human respiratory system are particularly well documented
(Despres et al., 2012).
Modern industrial activities (e.g., waste sorting, organic waste collection, composting, agricultural
production, food processing, raising of livestock, and wastewater treatment systems) emit large
quantities of bioaerosols, and this results in the release of abundant biological agents into the air.
Unfortunately, there is a paucity of evidence on the effects of these bioaerosols on the environment,
especially in terms of human health (Yoo et al., 2017), and thus the effects that bioaerosols may have
on products and food handlers in the food industry remain controversial. To exacerbate this situation,
no legislation is available regarding bioaerosols in the air of food industries in South Africa. Allowable
quantities of bioaerosols as proposed by the European Union have been disseminated, but there is no
set standard (Bulski et al., 2017). What makes the assembly of legislation for bioaerosols so difficult is
the fact that, in a specific industry, two or more manufacturing facilities might produce the same
product, but the environment, other industries in close proximity, the season, the structure of the facility,
and the raw materials used can differ to such an extent that the bioaerosol composition may vary
considerably among these facilities.
Monitoring bioaerosols in the food industry environment is one of the many tools that industrial quality
control managers can use in the assessment of indoor air quality, agricultural outcomes, and industrial
© Central University of Technology, Free State

C h a p t e r 4
91
health. The monitoring process should include: (i) sampling of bioaerosols using either passive or active
sampling methods; (ii) measurement of viable (culturable and non-culturable) and non-viable
bioaerosols; and (iii) the identification of bioaerosols. Identification of microbial taxa is a critical element
in the determination of the bioaerosol load in an industrial environment. Identification of bioaerosols can
be performed using a variety of available assessment strategies such as microscopy, immuno-assays
as well as various molecular-based assays (Afanou et al., 2015; Eduard et al., 2012; Rittenour et al.,
2012). The sensitivity and rapidity of molecular techniques have also led to their use for bioaerosol
monitoring in the determination of air quality and the detection of airborne pathogens (Yoo et al., 2017).
A standard method for the detection of microorganisms in environmental samples is the polymerase
chain reaction (PCR) assay. PCR-based approaches are promising because the organism is detected
by amplifying the target rather than the signal and it is therefore less susceptible to false positives. PCR
is usually followed by Sanger DNA sequencing, which is the most fundamental level of measuring one
of the major properties by which terrestrial life forms can be defined and differentiated from one
another. Over the years, innovations in sequencing protocols, molecular biology and automation have
increased the technological capabilities of sequencing while decreasing the cost and allowing the
reading of hundreds of base pairs DNA in length (Heather & Chain, 2016).
The air in food industries can be crowded with various airborne microorganisms that may include
bacteria, yeast and mould (Yassin & Almouqatea, 2010; Yoo et al., 2017). The compilation of
organisms in the air depends on the industry, the facility, the capacity of the facility, as well as the
season and the external environment. Airborne microorganisms are a potential source of a wide variety
of public and industrial health hazards; however, it is difficult to compile a set standard of acceptable
limits for a specific industry as information regarding the types of bioaerosols and their effects is not
abundant. Therefore, the aim of this study was to determine if the culturable fraction of bioaerosols
sampled during peak and off-peak seasons in a fruit juice manufacturing facility was harmful, innocuous
or potentially beneficial to the industry, the personnel and the environment.
4.2. Materials and Methods
4.2.1. Sampling
Two SAMPL’AIR LITE (AES Chemunex, United States) samplers were used to collect culturable
bioaerosols in a selected fruit juice manufacturing facility. A purposive sampling methodology was
utilised (Etikan et al., 2016) that was appropriate for the selected peak and off-peak manufacturing
seasons according to which the facility operated. All the sampling was performed in duplicate in five
© Central University of Technology, Free State

C h a p t e r 4
92
designated areas to represent a holistic analysis of the facility. These areas were the entrance to the
production area (Area 1), the preparation and mixing area of materials (Area 2), the area between the
production lines (Area 3), the area for the dispersion of bottles (Area 4), and the area where the bottles
were filled with the final product (Area 5) (see Figure 4.1).
The air samplers that were used operated at a flow rate of 100 litres per minute and were disinfected
with ethanol between the different sampling points. The samplers were turned on for two minutes prior
to sampling to allow the ethanol to evaporate, thereby avoiding interference with the quantities of
microorganisms recovered. Air samples were taken at a height of 1.5 meters from the ground (Aliakbar
et al., 2013; Frankel et al., 2012), which was the same level as the working stations in the centre of
each area. Sterile petri dishes containing either non-selective or selective media were used
appropriately for culture-dependent sampling. After a sampling time of five minutes, the samplers were
turned off and the petri dishes were removed and inverted in their covers. At least two independent
repeats were conducted to obtain culture-dependent bioaerosols in each environment.
Figure 4.1: Schematic layout of the fruit juice bottling facility: The figure indicates the different sampling areas: Area 1 (entrance to the production area); Area 2 (preparation and mixing of materials); Area 3 (between the production lines); Area 4 (dispersion of bottles); and Area 5 (filling of bottles with the final product).
Area 5
Area 1
Area 2
Area 3
Area 4
© Central University of Technology, Free State
C h a p t e r 4
93
4.2.2. Culture medium composition used for microbe isolation, cultivation and enumeration
The air samples collected in the petri dishes containing non-selective and selective media were
incubated for a specific time at specific temperatures, as was indicated in Table 3.1 (Chapter 3).
Selective media are predominantly used for the growth of selected microorganisms. Microbial counts
were performed using standard guidelines adapted from The Compendium of Methods for the
Microbiological Examination of Foods (National Advisory Committee, 2018; Swanson et al., 1992). After
incubation, the number of colonies on each plate was counted using the Scan 1200 high-resolution
automatic colour colony counter. The colony counts were adjusted using the positive hole correction
method (Anderson, 1958; Lee et al., 2016) and these colonies are reported as colony forming units per
cubic metre (CFU.m-3). Individual presumptive bacterial colonies were selected with a sterile inoculation
loop and preserved in 2 ml Microbanks (ProLab). The Microbanks were vortexed, labelled and stored at
80°C. Yeast and mould colonies were stored in 1.5 ml CryoVials (Fisher Scientific) containing 1 ml 15%
glycerol. The CryoVials were vortexed and the vials were labelled and stored at -20°C.
4.2.3. Identification of the culturable fraction of bacteria, yeast and mould
Pure cultures of bacteria, yeast and mould were selected from 18 to 72 h agar plates based on colony
colour, morphology and cell characteristics using a microscope (Barata et al., 2012; Montero et al.,
2016). The selected colonies were purified onto fresh agar plates. For analysis of bacterial diversity,
primer sets were used to target 1 300 bp of the 16S rRNA gene. Primers NL1 and NL4 were used for
the amplification of the D1/D2 domain of the 26S rRNA gene (600 bp) of yeasts. For mould
identification, a PCR-mediated reaction was performed targeting the internal transcribed spacer region
(ITS1, ITS2) and using primers ITS1 and ITS4 (600 bp) (Table 4.1).
Pure culture (20 µl) was used as template DNA. The PCR was carried out in a total volume of 50 µl,
containing 1X ThermoPol reaction buffer (20 mM Tris-HCI, 10 mM (NH4)2SO4, 10 mM KCI, 2 mM
MgSO4, 0.1% Triton®-X-100, pH 8.8 @ 25°C), 0.2 mM dNTPs, 0.52 µM of each primer and 1 unit of
Taq DNA polymerase (New England Biolabs). PCR reaction conditions for each primer set are
indicated in Table 4.2. PCR products were separated on a 1% agarose gel, stained with 0.05%
Ethidium bromide, and visualised using UV light. Digital images were captured with the Molecular
Imager® Gel Doc™ XR system (BioRad Laboratories Inc.).
After purification using the Diffinity RapidTip®2 (Sigma), forward and reverse primers were used for
sequencing in separate reactions (Frohlich-Nowoisky et al., 2016). Sequencing was performed using
the ABI Prism 3130 XL genetic analyser and the Big Dye® Terminator V3.1 Cycle Sequencing Kit
© Central University of Technology, Free State
C h a p t e r 4
94
(Applied Biosystems). DNA was precipitated with EDTA and ethanol. Contigs of forward and reverse
sequence results were assembled using DNA Baser sequence assembly software and compared with
sequences accessible in the GenBank database using the BLAST algorithm (megablast) (Altschul,
1997; Frohlich-Nowoisky et al., 2016). Sequences with high similarity were then subjected to multiple
sequence alignments using Clustal Omega (EMBL-EBI) for identification (Daugelaite et al., 2013). Only
similarities with a BLAST index of 97% and above were considered for identification (Wei et al., 2015).
All the analyses were performed at least in duplicate.
© Central University of Technology, Free State

C h a p t e r 4
95
Table 4.1: The Nucletide sequence of primers used in this study
Microorganisms Forward Primer Reverse Primer Reference
Bacteria 63F (5’-CAG GCC TAA CAC ATG CAA GTC-3’) 1387R (5’-GGG CGG WGT GTA CAA GGC-3’) Marchesi et al., 1998
Yeast NL1 (5’-GCA TAT CAA TAA GCG GAG GAA AAG-3’) NL4 (5’-GGT CCG TGT TTC AAG ACG G-3’) Kurtzman & Robnett, 1998; Yang et al., 2011
Mould ITS1 (5’-TCC GTA GGT GAA CCT GCG G-3’) ITS4 (5’-TCC TCC GCT TAT TGA TAT GC-3’) Davolos & Pietrangeli, 2007; Rojo et al., 2017 White et al., 1990
© Central University of Technology, Free State
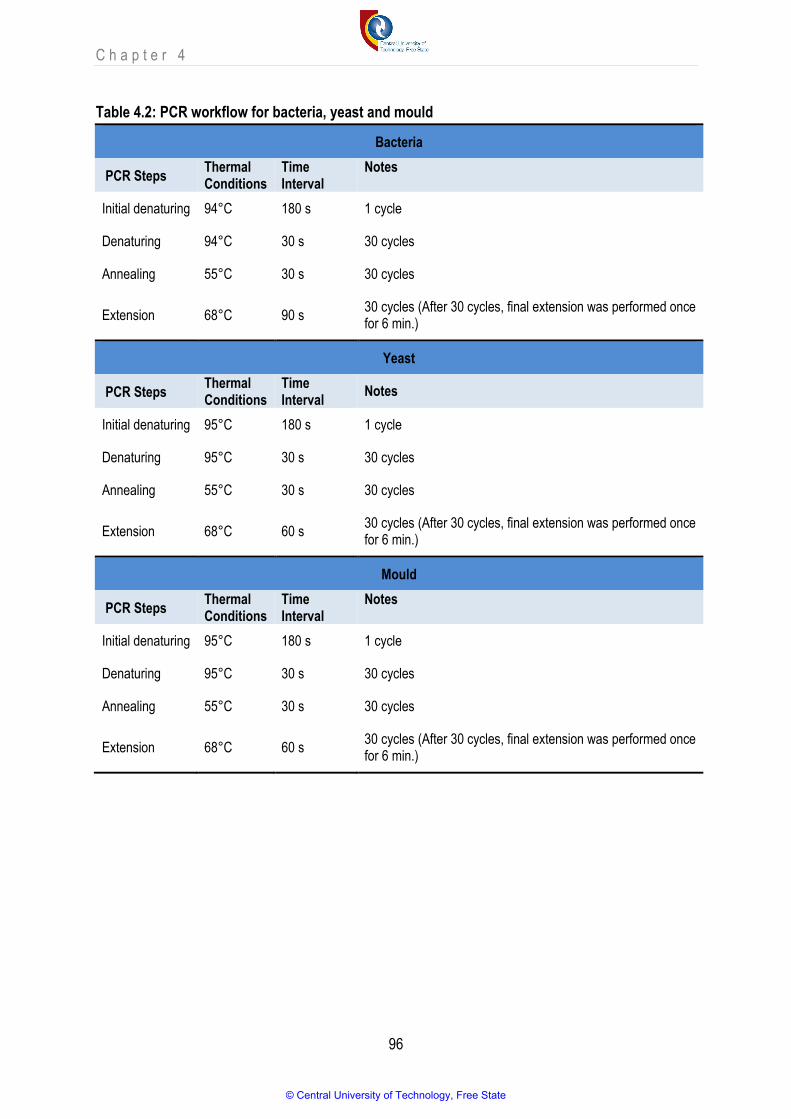
C h a p t e r 4
96
Table 4.2: PCR workflow for bacteria, yeast and mould
Bacteria
PCR Steps Thermal Conditions
Time Interval
Notes
Initial denaturing 94°C 180 s 1 cycle
Denaturing 94°C 30 s 30 cycles
Annealing 55°C 30 s 30 cycles
Extension 68°C 90 s 30 cycles (After 30 cycles, final extension was performed once for 6 min.)
Yeast
PCR Steps Thermal Conditions
Time Interval
Notes
Initial denaturing 95°C 180 s 1 cycle
Denaturing 95°C 30 s 30 cycles
Annealing 55°C 30 s 30 cycles
Extension 68°C 60 s 30 cycles (After 30 cycles, final extension was performed once for 6 min.)
Mould
PCR Steps Thermal Conditions
Time Interval
Notes
Initial denaturing 95°C 180 s 1 cycle
Denaturing 95°C 30 s 30 cycles
Annealing 55°C 30 s 30 cycles
Extension 68°C 60 s 30 cycles (After 30 cycles, final extension was performed once for 6 min.)
© Central University of Technology, Free State
C h a p t e r 4
97
4.3. Results and Discussion
4.3.1. Culturable fraction identified during peak and off-peak sampling
Airborne microorganisms occur ubiquitously in ambient air (Walser et al., 2017) and are naturally part of
the air in almost any environment. These microbes can originate, not only from humans, but are also
spawned by various indoor characteristics (such as ventilation, heating and air conditioning systems)
and outdoor environmental sources. Although airborne microorganisms encountered in indoor facilities
are still deemed innocuous for healthy individuals, they can cause adverse health effects when high
counts are ingested or inhaled (Brandl et al., 2014; Heo et al., 2017). Moreover, bioaerosols are easily
translocated from one ecosystem to another by wind and air currents, thus making them an important
vehicle for the spread of potentially pathogenic organisms (Wijnand et al., 2012). When associated with
dust particles or condensation droplets, these organisms can be dispersed among different areas in a
food processing unit. International food industries are required by authorities such as the Food and
Drug Administration (FDA) to take measures to reduce product contamination by airborne
microorganisms (Downes & Ito, 2001; FDA, 2017).
Bacteria, yeast and mould are the main groups of microorganisms categorised as potential pathogenic
airborne microorganisms. Bacteria, yeast and mould were identified more than 30 years ago in various
food industries as bioaerosols. These industries include dairy processing facilities (Kang & Frank,
1988), poultry-slaughtering facilities (Lutgring et al., 1996), automated chicken egg production facilities
(Venter et al., 2004), and bakeries (Saranraj & Geetha, 2011). In consideration of these earlier findings,
it was expected that bacteria, yeast and mould would be recovered during the peak and off-peak
seasons (sampling sessions) in the selected facility’s air environment.
The study detected a total of 239 bacteria and 41 yeasts and 43 moulds that were isolated from the air
in the production environment of the selected facility. An overview of these bioaerosols is presented as
a distribution tree where the bacteria, yeast and mould are classified into different phylogenetic orders
(Figure 4.2 and Figure 4.3). From the isolates obtained, 92 different species were identified from the
culturable fraction. These microorganisms belonged to 15 different taxonomic orders representing five
bacteria and ten yeast and mould orders.
.
© Central University of Technology, Free State
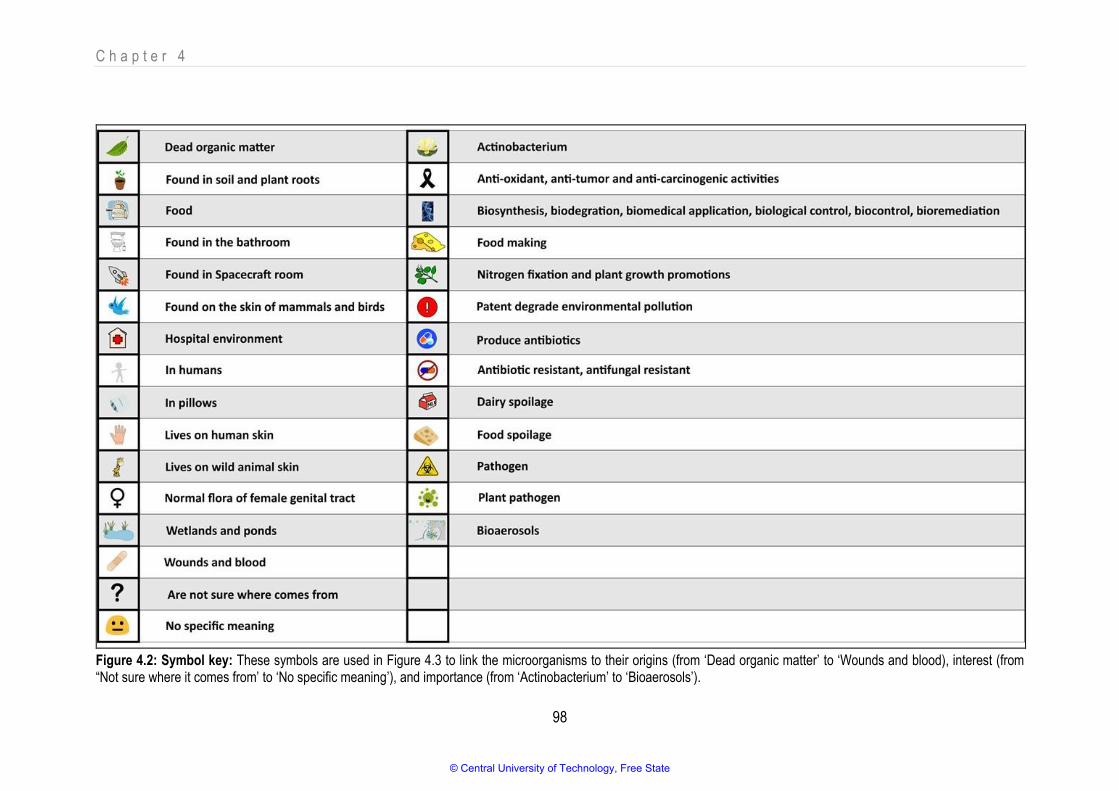
C h a p t e r 4
98
Figure 4.2: Symbol key: These symbols are used in Figure 4.3 to link the microorganisms to their origins (from ‘Dead organic matter’ to ‘Wounds and blood), interest (from “Not sure where it comes from’ to ‘No specific meaning’), and importance (from ‘Actinobacterium’ to ‘Bioaerosols’).
© Central University of Technology, Free State

C h a p t e r 4
99
© Central University of Technology, Free State
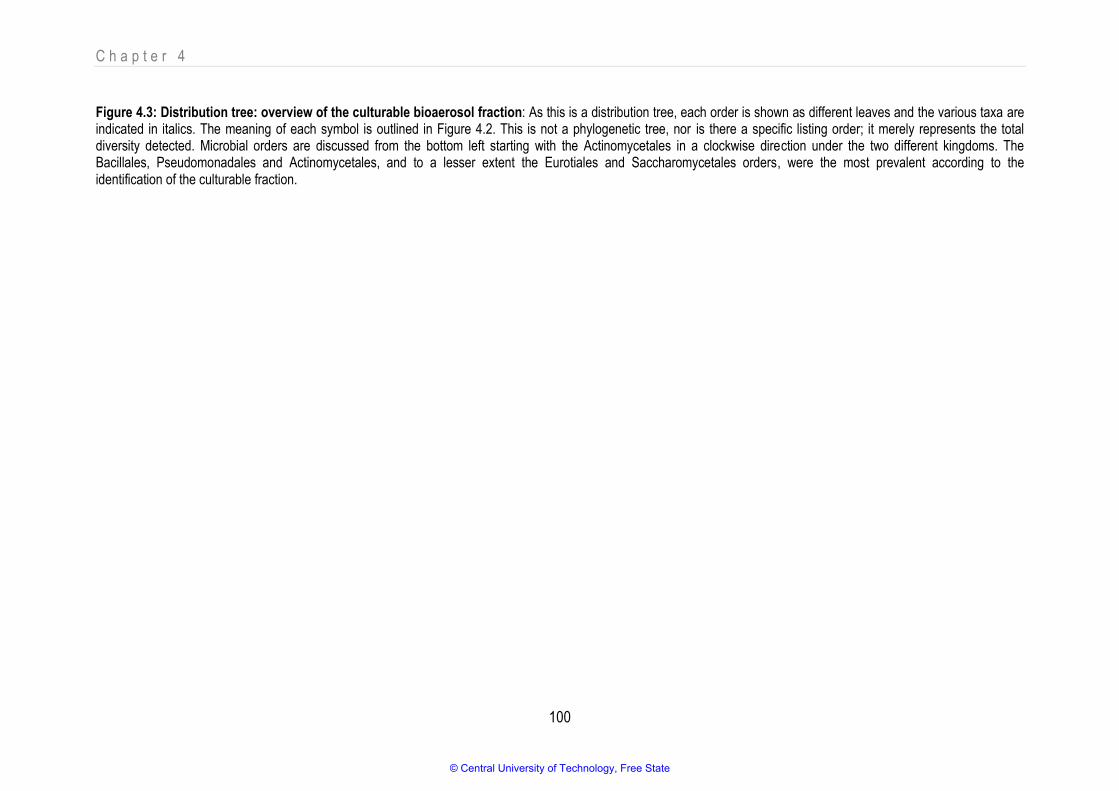
C h a p t e r 4
100
Figure 4.3: Distribution tree: overview of the culturable bioaerosol fraction: As this is a distribution tree, each order is shown as different leaves and the various taxa are indicated in italics. The meaning of each symbol is outlined in Figure 4.2. This is not a phylogenetic tree, nor is there a specific listing order; it merely represents the total diversity detected. Microbial orders are discussed from the bottom left starting with the Actinomycetales in a clockwise direction under the two different kingdoms. The Bacillales, Pseudomonadales and Actinomycetales, and to a lesser extent the Eurotiales and Saccharomycetales orders, were the most prevalent according to the identification of the culturable fraction.
© Central University of Technology, Free State

C h a p t e r 4
101
Bacteria are the most abundant and diverse group of organisms (Xia et al., 2015) and are ubiquitous in
every habitat on Earth. They can be present in soil, water and organic matter as well as in live bodies of
plants and animals. Their presence in indoor environments is mostly related to human occupancy and
type of indoor environment (Bragoszewska et al., 2016). Moreover, bacteria are abundant in the
atmosphere where they often represent a major portion of organic aerosols (Bowers et al., 2011). Even
though bacteria were represented by a smaller group of orders in this study, they represented 62
different species. When the study commenced, it was envisaged that a large number of bacterial
species would be detected because four different media types were used for cultivating bacteria.
What is immediately visible in Figure 4.3 is that many bioaerosols that were detected in the facility
probably originated from soil and plant roots ( ), wetlands and ponds ( ), and human skin ( ).
Many species that were detected had no specific significance ( ); however, a reasonable quantity
could be considered as pathogenic ( ), specifically in the order Bacillales that is antibiotic
resistant ( ). Mainly fungal isolates and one Pseudomonas have previously been described as
bioaerosols ( ). Only four fungal and two bacterial isolates have previously been associated with
food poisoning/spoilage ( ).
All of the species found in the order Actinomycetales are found in soil and plant roots. Of these species,
Micrococcus seems to be a predominant specie in indoor air (Bragoszewska et al., 2016; Kooken et al.,
2012). The order Pseudomonadales was represented by the genera Acinetobacter spp., Psychrobacter
spp. and Pseudomonas spp., most of which are found in soil, plant roots, wetlands and ponds.
Evidence indicates that bioaerosol agents such as Pseudomonas spp. cause occupational health
threats to immuno-compromised patients (Zemouri et al., 2017). Psychrobacter faecalis is one species
of this order that was discovered in a bioaerosol originating from pigeon faeces (Kampfer et al., 2002).
The order Lactobacillales represents a morphologically, metabolically and physiologically diverse group
of bacteria (Mekadim et al., 2019). In the current study, only one genus, Aerococcus spp., with two
different species was identified. Both these species are classified as pathogenic. They are prevalent in
hospital environments and can form biofilms (Rasmussen, 2016). The order Bacillales represents a
wide variety of different species with a wide variety of origins and interests. Genera from the order
Bacillales are frequently found to be part of bioaerosols, because genera such as Bacillus and
Paenibacillus can form highly tolerant endospores that can travel long distances (Bragoszewska et al.,
2016; Hara et al., 2015). Two main genera were identified, namely Bacillus and Staphylococcus, which
© Central University of Technology, Free State
C h a p t e r 4
102
are known for the fact that they form part of bioaerosols. Some of the species possess pathogenic
abilities and are resistant to antibiotics (Bragoszewska et al., 2016; Madsen et al., 2018; Wang et al.,
2015; Zemouri et al., 2017). From the Enterobacteriales order, three different genera were identified,
namely Enterobacter spp. and Pantoea spp. (both are found in soil and/or plant roots and in wounds
and blood) as well as Serratia spp. (which is mostly found in bathrooms). Pantoea agglomerans is
usually associated with plants and is seen as a bacterium of evil (causing opportunistic human
infections) and good (contributing to plant growth) (Dutkiwicz et al., 2016).
Eukaryotic cells are considerably more complicated than those of prokaryotic origin and are
characterised by a high degree of cellular complexity (lysosomes, peroxisomes, microtubules,
mitochondria, cytoskeleton, etc.), which makes the classification of these microorganisms quite difficult
(Spang et al., 2015). This may explain why yeast and mould could be classified in 10 different orders
whereas only 23 different species were identified. Overgrowth of mould in the petri dishes was
observed during the enumeration of the culturable fraction (Figures 3.1a and b) and lower yeast and
mould counts were observed compared to total microbial load. This may also have contributed to a
lower number of identified species (as the overgrowth may have prevented accurate isolation of other
moulds and yeasts that could have been present) (Beuchat & Mann, 2016; Douglas et al., 1979).
Pseudozyma, a yeast found mainly in soil and plant roots (Sajna et al., 2015), was the only genus
detected from the order Ustilaginales. Of the order Dothideales (microorganisms found mostly in soil,
plant roots, wetlands and ponds), only one of the species, Aureobasidium pullulans, was previously
classified as a bioaerosol (Castoria et al., 2001).
Pleosporales is the largest order in the Dothideomycetes species and it comprises a quarter of all the
detected Dothideomycetous species. Species in this order occur in various habitats, including
bioaerosols (Zhang et al., 2012). From the Pleosporales order, one genus was detected, namely an
uncultured Alternaria spp. that can originate from a large variety of environments such as soil plant
roots, wetlands and ponds. The Alternaria spp. is seen as a plant pathogen; however, reports have
stated that it is also prevalent in the food industry (Fernandez-Rodriquez et al., 2015). Of the order
Saccharomycetales, three well known genera were detected: (i) Candida spp. (one specific Candida
species, Candida pseudointermedia, was previously identified as a bioaerosol), that originates from soil
and plant roots and has the ability to cause invasive fungal infection that can have a significant impact
on public health (Sowiak et al., 2012; Trofa et al., 2008); (ii) Meyerozyma guilliermondii, which is known
for its ability to live on human skin and in wounds and blood and has spoilage abilities (Wrent et al.,
2015); and (iii) Wickerhamomyces anomalus, which is found in food and has pathogenic abilities (Miceli
© Central University of Technology, Free State

C h a p t e r 4
103
et al., 2011). The order Mucorales was represented by only one genus, namely a Rhizopus spp. This
genus is mostly found in dead organic matter and has pathogenic abilities (Spelberg, 2017).
Eurotiales are widespread and abundant fungi that include the well-known genus Penicillium.
Penicillium is recognised as one of the most abundant mould genera in indoor air (Bragoszewska et al.,
2016; Kobza et al., 2018; Sowiak et al., 2012). Similarly, in the order Sporobolales, only one species
was detected, namely Sporobolomyces nylandii, which is normally found in soil and/or plant roots
(Limtong & Nasanit, 2017). Cryptococcus spp., from the order Tremellales, were also identified. These
species are known to have either human or plant pathogenic abilities and have been identified as
bioaerosols (Huang et al., 2015; Sowiak et al., 2012). From the Hypocreales order three different
Trichoderma spp. were detected, and all originate from soil and/or plant roots (Azin et al., 2007; Du
Plessis et al., 2018; Ghorbani et al., 2015). From the Sporidiales order, one microorganism was
identified, namely Rhodotorula mucilaginosa. This organism is found in soil, plant roots, wetlands,
ponds, and in humans and on/in pillows. Rhodotorula mucilaginosa has been receiving increased
attention because it can be isolated from extreme ecosystems and has the capability to survive and
grow in many unfavourable conditions. It is also classified as a bioaerosol and a human pathogen
(Deligios et al., 2015).
Various microorganisms that were detected support the existing scientific literature that indoor exposure
to microorganisms poses a risk for asthma and allergies among occupants of indoor facilities (Lipsa et
al., 2016). It is undeniable that microbial contamination of a facility has the potential to affect the
product and places the occupants at risk of developing airway difficulties. Surprisingly, little research is
available with regards to these microorganisms in the food industry, especially in the fruit juice industry,
and therefore it was important to clearly classify the microorganisms that were identified. This will aid in
better understanding the prevalence and ecology of specific indoor airborne bioaerosols and will be a
useful tool in the management and prevention of both long- and short-term problems faced in the fruit
juice industrial setting (Bragoszewska et al., 2016).
4.3.2. Classification of the bioaerosols that were detected
Bacteria form a large part of airborne particles and comprise bacteria, fungi, viruses, pollen and
fragments of these or their metabolic products (endotoxins, mycotoxins). It is reiterated that bioaerosols
are of natural origin (such as rotting leaves and mould growth); are ubiquitous in natural environments;
play a key role in the dispersal of reproductive units from plants, microbes and organisms; and that they
are central elements in the development, evolution and dynamics of ecosystems. The actual identity,
© Central University of Technology, Free State

C h a p t e r 4
104
diversity and abundance of different types of bioaerosol particles, as well as their temporal and spatial
variability, are not well characterised. Overall, the role of bioaerosols in the atmosphere and their
interaction with other ecosystems are not well described and understood. This lack of knowledge is
particularly evident with regards to the assessment and prediction of bioaerosols (Frohlich-Nowoisky et
al., 2016).
Bioaerosols are generated via multiple sources such as different instruments, external environments,
and human activity. Bioaerosols have varying microbiological profiles depending on their origin and
reason of interest. Bioaerosols can be hazardous to both a product produced in an industry and the
workers (Zemouri et al., 2017), depending on the kind of bioaerosol that is involved. The literature
classifies bioaerosols into three groups, namely: (i) innocuous (Bonadonna et al., 2017); (ii) useful
(Fröhlich-Nowoisky et al., 2016); and (iii) harmful (Majchrzycka et al., 2017). After the identification of
the culturable fraction of bioaerosols in the current study, it was concluded that 27 innocuous, 26 useful
and 39 potentially harmful bioaerosols had been detected.
4.3.2.1. Innocuous bioaerosols
Innocuous microorganisms were classified in 1985 by the European Federation of Biotechnology as
“microorganisms that have never been identified as causative agents of disease in man and that offer
no threat to the environment” (Kuenzi et al., 1985a). For a microorganism to be described as
environmentally safe, it should meet the following criteria: (i) be non-pathogenic to humans, animals
and plants; (ii) must have a limited ability to compete; (iii) will not indirectly affect other species (by the
production of toxic metabolites or biogeochemical changes); (iv) is unable to irreversibly alter equilibria
between nutrients, microflora, and higher organisms; (v) is unable, in the open environment, to transfer
genetic traits that can be noxious in other species; and (vi) does not contribute to unwanted traits
(Frohlich-Nowoisky et al., 2016; Lelieveld et al., 1996).
During this study, 27 different microorganisms were identified as innocuous bioaerosols (Table 4.3). Of
these innocuous bioaerosols, two genera were dominant, namely Bacillus and Staphylococcus. The
genus Bacillus includes more than 200 species, is widespread in nature and is found in virtually every
environment (Hong et al., 2012). Although the Bacillus species are ostensibly well-known as
pathogens, the overwhelming majority are in actual fact non-pathogenic (Rooney et al., 2009). The
Staphylococcus species are reported as normal microbiota of mammals and birds; however, certain
species are important pathogens in humans and animals. It is noteworthy that little is known about the
Staphylococcus species that are non-pathogenic environmental microorganisms (Gomez et al., 2017).
© Central University of Technology, Free State

C h a p t e r 4
105
Only four innocuous yeasts and moulds were detected. Although yeast and mould are well-known for
their fermentation ability and pharmaceutical properties, it has been found that they are microorganisms
that do more harm than good in food and food-related industries (Goyer et al., 2001; Kobayaski et al.,
2009; Mandal & Brandl, 2011; Sorensen et al., 1984).
© Central University of Technology, Free State

C h a p t e r 4
106
Table 4.3: Innocuous bioaerosols detected and classified alphabetically from order to specie
Innocuous Bioaerosols – Bacteria
Order Family Genus and Specie Reference
Actinomycetales Brevibacteriaceae Agrococcus citreus Wieser et al., 1999
Actinomycetales Microbacteriaceae Microbacterium phylloshaerae Alcocer et al., 2007
Actinomycetales Micrococcaceae Arthrobacter koreensis Lee et al., 2003
Actinomycetales Micrococcaceae Micrococcus terreus Zhang et al., 2010
Bacillales Bacillaceae Bacillus eiseniae Hong et al., 2012
Bacillales Bacillaceae Bacillus horneckiae Vaishampayan et al., 2010
Bacillales Bacillaceae Bacillus humi Heyrman et al., 2005
Bacillales Bacillaceae Bacillus kochii Seiler et al., 2012
Bacillales Bacillaceae Bacillus oceanisediminis Zhang et al., 2010
Bacillales Bacillaceae Bacillus subtilis subsp. spizizenii Rooney et al., 2009
Bacillales Bacillaceae Exiguobacterium artemia Lopez-Cortes et al., 2006
Bacillales Paenibacillaceae Paenibacillus pabuli Jemli et al., 2007.
Bacillales Planococcaceae Sporosarcina luteola Tominaga et al., 2009
Bacillales Staphylococcaceae Jeotgalicoccus psychrophilus Yoon et al., 2003
Bacillales Staphylococcaceae Staphylococcus equorum Place et al., 2003
Bacillales Staphylococcaceae Staphylococcus jettensis De Bel et al., 2014
Bacillales Staphylococcaceae Staphylococcus saprophyticus subsp. bovis Hajek et al., 1996
Enterobacteriales Enterobacteriaceae Enterobacter xiangfangensis Chavda et al., 2016
Enterobacteriales Erwiniaceae Pantoea vagans Palmer et al., 2016
Pseudomonadales Moraxellaceae Psychrobacter faecalis Kamper et al., 2002
Pseudomonadales Pseudomonadaceae Pseudomonas lurida Behrendt et al., 2007
Pseudomonadales Pseudomonadaceae Pseudomonas vancouverensis Gupta & Prakash, 2014
Sphingomonadales Sphingomonadaceae Sphingomonas pseudosanguinis Kämpfer et al., 2007
© Central University of Technology, Free State

C h a p t e r 4
107
Innocuous Bioaerosols – Yeast and Mould
Order Family Genus and Specie Reference
Saccharomycetales Saccharomycetaceae Candida pseudointermedia Nakase et al., 1976
Hypocreales Hypocreaceae Trichoderma orientale Du Plessis et al., 2018
Sporiobolales Incertae sedis Sporobolomyces nylandii Limtong & Nasanit, 2017
Ustilaginales Ustilaginaceae Pseudozyma spp. Sajna et al., 2015
Although these microorganisms would have been innocuous to the products, the workers in the facility
and the environment, they were still part of the bioaerosols that were detected during bioaerosol
sampling. The high microbial counts that were observed during sampling immediately created the
inaccurate assumption that the air was contaminated with hazardous or unsafe bioaerosols (Viegas et
al., 2018). Therefore, simply analysing bioaerosols for total heterotrophic counts as specified by certain
countries (Table 2.8) to determine air quality could be considered a shortcoming.
© Central University of Technology, Free State

C h a p t e r 4
108
4.3.2.2. Useful bioaerosols that were detected
Useful microorganisms are generally: (i) environmentally beneficial; (ii) useful in food; (iii) making
positive medical contributions; and (iv) advantageous for technology and the future. For example, the
use of beneficial/useful microorganisms contributes positively towards environmentally safe agricultural
products. The modes of action of these useful microorganisms and their various benefits to plants
range from the simple occupation of biological empty spaces to ecological relationships such as
antibiosis, competition, predation, and symbiosis, among others (Figueiredo et al., 2016). Other
beneficial microorganisms represent an important biotechnological approach to decrease the
deleterious effects of stress in crops (Egamberdieva et al., 2013; Nadeem et al., 2014). Studies have
also indicated that the growth-promoting ability of some bacteria to synthesise extracellular
polysaccharides or exopolysaccharides has commercially significant applications (Nwodo et al., 2012).
The use of beneficial microorganisms can potentially revolutionise agriculture and food industries by: (i)
integrating crop health with better management practices for specific climatic conditions to improve
productivity and quality; (ii) using environmentally friendly approaches to control pests and pathogens,
thus reducing the use of chemical pesticides with environmental and health implications; (iii) producing
better quality food with less chemical contamination and allergens; and (iv) minimising losses by
improving crop fitness in extreme weather conditions (Singh & Trivedi, 2017).
One of the most exciting scientific advances in recent years has been the realisation that commensal
microorganisms play key roles in our physiology (including protection against infection) and in drug
metabolism, vitamin synthesis, nutrition, as well as in response to disease (Wischmeyer et al., 2016).
The beneficial influence of microorganisms is still on the border of its’ potential and a great deal of
future discoveries and technologies are anticipated. In the current study, the useful bioaerosols that
were detected during the selected sampling seasons were categorised into three groups, namely: (i)
medical contribution; (ii) promoting and protecting plant growth; and (iii) environmental contribution.
These benefits are listed in Table 4.4 for each identified microorganism.
© Central University of Technology, Free State

C h a p t e r 4
109
Table 4.4: Alphabetical classification of useful bioaerosols detected in the selected facility (peak and off-peak seasons) according to: medical
contribution, promoting and protecting plant growth and environmental contribution
Medical Contribution – Bacteria
Genus and Specie Benefit Reference
Acinetobacter radioresistens Purification and biochemical properties Briganti et al., 1997
Bacillus flexus Capable of synthesis of anisotropic silver nanoparticles Priyadharsshini et al., 2012
Bacillus megaterium Capable of biosynthesis of silver nanoparticles and have antibacterial activity on multi drug resistant clinical
pathogens Saravanan et al., 2011
Brevibacterium frigoritolerans Capable of producing silver nanoparticles Singh et al., 2015
Corynebacterium callunae Have the function for activity and stability of the enzyme Orthophosphate Mueller & Nidetzky, 2010
Microbacterium radiodurans UV radiation-tolerant bacterium Zhang et al., 2010
Micrococcus yunnanensis Anti-oxidative, anti-tumour-promoting, and anti-carcinogenic activities of adonirubin and adonixanthin Maoka et al., 2013
Medical Contribution – Yeast and Mould
Genus and Specie Benefit Reference
Meyerozyma guilliermondii Antifungal activity Coda et al., 2012
Penicillium corylophilum Antibacterial activity Silva et al., 2004
Penicillium spp. Capable of biosynthesis of silver nanoparticles Hemath et al., 2010
© Central University of Technology, Free State

C h a p t e r 4
110
Promoting and Protecting Plant Growth – Bacteria
Genus and Specie Benefit Reference
Bacillus aryabhattai Zinc-solubilizing abilities Ramesh et al., 2013
Brevibacterium casei Capable of promoting plant growth Plociniczak et al., 2016
Promoting and Protecting Plant Growth – Bacteria
Genus and Specie Benefit Reference
Microbacterium imperiale Capable of biodegradation of bromoxynil – to reduce its acute toxicity Pasquarelli et al., 2015
Paenibacillus polymyxa Capable of nitrogen fixation, plant growth promoting, soil phosphorus solubilisation and production of
exopolysaccharides, hydrolytic enzymes, antibiotics and cytokinin. Helps bioflocculation and the enhancement of soil porosity as well as capable of producing optically active 2,3-butanediol (BDL)
Lal & Tabacchioni, 2009
Pantoea agglomerans Capable of controlling post-harvest diseases on apples Nunes et al., 2002
Pseudomonas fluorescens Plant protection Rezzonico et al., 2005
Serratia marcescens Capable of biocontrol against avocado pathogens Granada et al., 2016
Promoting and Protecting Plant Growth – Yeast and Mould
Genus and Specie Benefit Reference
Aureobasidium pullulans Biotechnologically important yeast Chi et al., 2009
Penicillium citrinum Capable of producing plant growth by promoting metabolites Khan et al., 2008
Trichoderma longibrachiatum Help optimising culture conditions for agricultural purposes Azin et al., 2007
© Central University of Technology, Free State
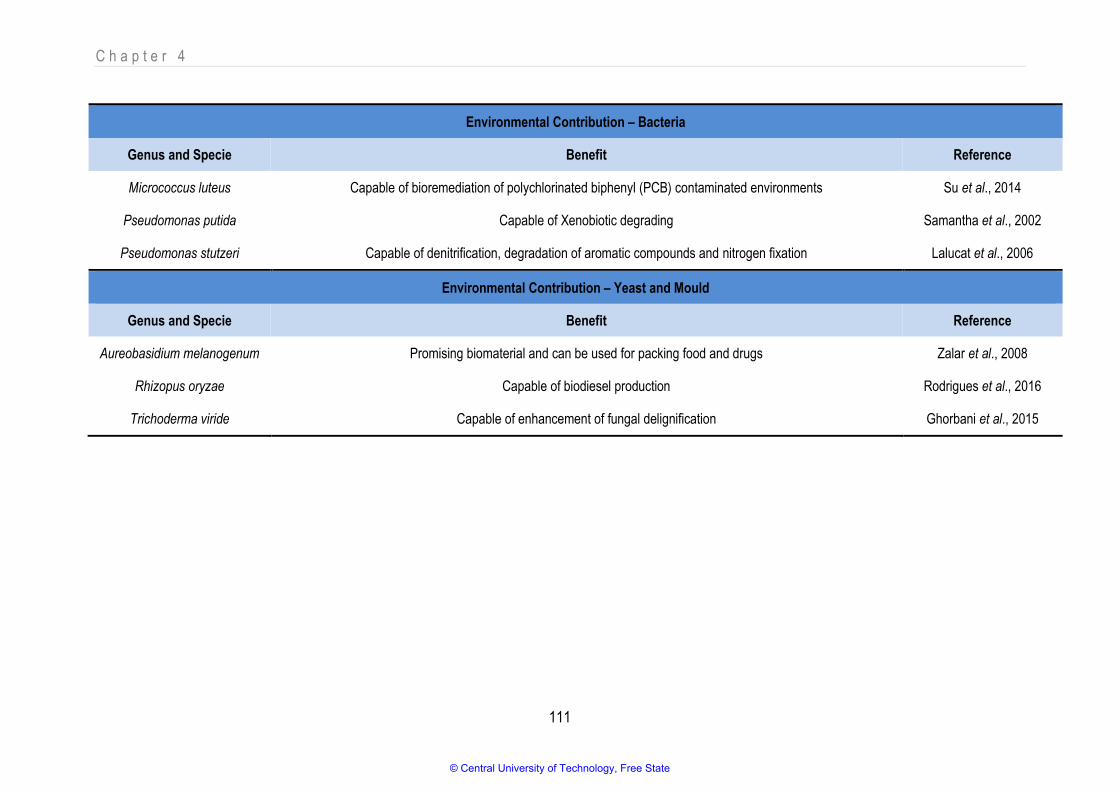
C h a p t e r 4
111
Environmental Contribution – Bacteria
Genus and Specie Benefit Reference
Micrococcus luteus Capable of bioremediation of polychlorinated biphenyl (PCB) contaminated environments Su et al., 2014
Pseudomonas putida Capable of Xenobiotic degrading Samantha et al., 2002
Pseudomonas stutzeri Capable of denitrification, degradation of aromatic compounds and nitrogen fixation Lalucat et al., 2006
Environmental Contribution – Yeast and Mould
Genus and Specie Benefit Reference
Aureobasidium melanogenum Promising biomaterial and can be used for packing food and drugs Zalar et al., 2008
Rhizopus oryzae Capable of biodiesel production Rodrigues et al., 2016
Trichoderma viride Capable of enhancement of fungal delignification Ghorbani et al., 2015
© Central University of Technology, Free State

C h a p t e r 4
112
Natural products (plants, animals and microorganisms) are essential, reputable resources that originate
from Earth’s bio-diverse flora and fauna. These natural products are encoded to be bioactive and have
been used as medicines for ages. Today, they continue to be a reservoir of potential resources (David
et al., 2014). Recently, the global threat of anti-microbial resistance has increased the need for urgent
therapeutic discoveries and the improvement of existing antimicrobial practices (Adukwe et al., 2016).
Numerous medical conditions are the focus of these efforts; however, one of the medical areas in which
microorganisms have contributed tremendously in the last few years is cancer research. Cancer is a
collective term used for diseases that are characterised by the loss of control of growth and the division
and the spread of cells that lead to primary tumours that invade and destroy adjacent tissues. Cancer is
undeniably one of the most serious health threats worldwide (Chen et al., 2014). By loading anti-cancer
drugs into nanoparticles, more favourable pharmacokinetics and adjustable biodistribution of
nanoparticles can increase the efficacy of the drug (Quinto et al., 2015). It is noteworthy that the current
study detected four microorganisms that have the capability of producing silver nanoparticles. Silver
nanoparticles are an arch product from the field of nanotechnology and have gained boundless interest
because of their unique properties such as chemical stability, good conductivity, catalytic properties
and, most importantly, antibacterial, anti-viral and antifungal activities (Ahmed et al., 2016).
The urgency of feeding the world’s growing population while at the same time combating soil pollution,
salinization and desertification has given plant and soil productivity research vital importance. It
requires suitable biotechnology not only to improve crop productivity, but also to improve soil health
through interactions of plant, root and soil microorganisms (Shrivastava & Kumar, 2014). Some plant
growth-promoting rhizobacteria may exert a direct stimulation on plant growth and development by
providing plants with fixed nitrogen, phytohormones and iron sequestered by bacterial siderophores
and soluble phosphate (Hayat et al., 2010). Others do this indirectly by protecting the plant against soil-
borne diseases (Lutgtenberg & Kamilova, 2009).
In order to make the environment healthier for human beings, contaminated water bodies and land
need to be rehabilitated to make them free from toxic waste, heavy metals and trace elements. With the
escalated growth of various industries, there has been a considerable increase in the discharge of
industrial waste into the air, soil and water, and this has led to the accumulation of heavy metals and
toxic waste in these environments, especially in urban areas. The use of microorganisms (Micrococcus
luteus for example) for remediation technologies and bioremediation to rehabilitate and re-establish the
natural condition of the environment is an emerging science (Dixit et al., 2015; Singh et al., 2013).
Other ways of environmental rehabilitation using microorganisms, such as fungal delignification
© Central University of Technology, Free State

C h a p t e r 4
113
(Trichoderma viride) (Thomsen et al., 2016) and biodiesel production (Rhizopus oryzae) (Aransiola et
al., 2014) have also been investigated during the last few years.
The 26 different innocuous species that were identified in the selected facility could all be extremely
beneficial in various fields of technology; however, not one of these microorganisms was likely to have
a direct impact on the product or the food handlers in the facility. Therefore, because there are still no
standards nor an implementation plan available (Crook et al., 2016), it is important to create awareness
of what needs to be monitored in each industrial environment. Moreover, these criteria should be
standardised.
Although innocuous and useful bioaerosols do not negatively influence human health, it is critical to
mention that the presence of innocuous and useful bioaerosols still serves as an indicator that an ideal
environment exists for possible harmful bioaerosols to emerge. In addition, any type of bioaerosol that
occurs in excess may have a negative influence on the food product and this should also be considered
(Adams et al., 2015; Crook et al., 2016; Frankel et al., 2012; Viegas et al., 2018.; Wu et al., 2017; Zhen
et al., 2017).
4.3.2.3. Potentially harmful bioaerosols
Various bioaerosols can have infectious, allergenic or toxic effects on living organisms and may impact
human and animal health and agricultural outcomes on a local, regional or global scale. Many plant,
animal and human pathogens are dispersed through the air (Fisher et al., 2012), and thus the
occupational health of workers is easily affected. Various major infectious diseases in humans such as
foot-and-mouth disease, tuberculosis, Legionnaire’s disease, influenza and measles can be spread by
airborne bacteria or viruses (Frohlich-Nowoisky et al., 2016; Lipsa et al., 2016). Moreover, the
inhalation of pathogenic, viable airborne fungi such as Aspergillus, Cryptococcus and Pneumocystis
spp. into the lungs can cause invasive infections associated with mortality rates of up to 95% in infected
populations (Brown et al., 2012; Lin et al., 2001; Lipsa et al., 2016; Yu et al., 2010).
Food safety is a complex issue that has an impact on multiple segments of society. Usually a food is
considered too adulterated if it contains a poisonous or otherwise harmful substance that is not an
inherent natural constituent of the food itself; if it poses a reasonable possibility of injury to health or is
presented in a substance that is an inherent natural constituent of the food itself; if it is not the result of
environmental, agricultural, industrial, or other contamination; and if is present in a quantity that
ordinarily renders the food injurious to health (Sowiak et al., 2012).
© Central University of Technology, Free State

C h a p t e r 4
114
Harmful microorganisms can: (i) be pathogenic/infectious; (ii) multidrug resistant; (iii) cause food
poisoning; (iv) cause food spoilage; (v) be used in biological warfare; and (vi) cause negative
occupational health effects. As was expected, no biological warfare microorganisms were detected in
the facility under study, but it was expected that a large number of allergenic and/or toxic agents
forming bioaerosols and causing occupational diseases of the respiratory tract and skin would be
present due to the layout (no airflow, production lines in close proximity to one another) and the type of
product the facility produced (Wang et al., 2015). Table 4.5 depicts the four types of 39 harmful
bioaerosols that were detected during the two sampling seasons.
© Central University of Technology, Free State

C h a p t e r 4
115
Table 4.5: Harmful bioaerosols detected and classified alphabetically according to their pathogenicity and infection potential, multidrug resistance,
food poisoning and food spoilage potential
Pathogenicity/Infection Potential – Bacteria
Genus and Specie Reference Genus and Specie Reference Genus and Specie Reference
Acinetobacter woffii Rosa et al., 2015 Pantoea agglomerans Dutkiewicz et al., 2016 Staphylococcus kloosii Mascarenhas dos Santos et al., 2018
Acinetobacter schindleri Wong et al., 2017 Pseudomonas oryzihabitans Choi et al., 2018 Staphylococcus pasteuri Savini et al., 2009
Aerococcus urinaeequi Rassmussen, 2015 Pseudomonas stutzeri Lalucat et al., 2006 Staphylococcus petrasii Pantucek et al.,
2013
Aerococcus viridans Mohan et al., 2017 Serratia marcescens Quinn et al., 2018 Staphylococcus saprophyticus Trivedl et al.., 2015
Bacillus licheniformis Ronning et al., 2015 Staphylococcus cohnii Garg, 2017 Staphylococcus simulans Shields et al., 2016
Brevibacterium casei Bal et al., 2015 Staphylococcus epidermidis Otto, 2013 Staphylococcus succinus Novakova et al.,
2006
Enterobacter hormaechei Rafferty et al., 2011 Staphylococcus haemolyticus Czekaj et al., 2015 Staphylococcus succinus
subsp. casei Novakova et al.,
2006
Paenibacillus glucanolyticus Athan, 2014 Staphylococcus hominis subsp
novobiosepticus Ahmed et al., 2017 Staphylococcus warneri
Dimitriadi et al., 2014
© Central University of Technology, Free State

C h a p t e r 4
116
Pathogenicity/Infection Potential – Yeast and Mould
Genus and Specie Reference Genus and Specie Reference Genus and Specie Reference
Alternaria spp. Fernandez-Rodriquez et
al., 2015 Cryptococcus albidus Huang et al., 2015 Rhodotorula mucilaginosa Dellgios et al., 2015
Aureobasidium pullulans Castoria et al., 2001 Cryptococcus uzbekistanensis Dehghan-Niri, et al., 2015 Wickerhamomyces anomalus Miceli et al., 2011
Candida intermedia Sheng-Yuan et al., 2010 Rhizopus oryzae Han et al., 2018
Candida parapsilosis Trofa et al., 2008 Rhizopus spp. Spellberg, 2017
Multidrug Resistance – Bacteria
Genus and Specie Reference Genus and Specie Reference Genus and Specie Reference
Staphylococcus arlettae Liu et al., 2017 Staphylococcus epidermidis Otto, 2013 Staphylococcus hominis subsp
novobiosepticus Ahmed et al., 2017
Staphylococcus cohnii Garg, 2017 Staphylococcus haemolyticus Czekaj et al., 2015 Staphylococcus succinus Novakova et al.,
2006
Food Poisoning − Bacteria
Genus and specie Reference Genus and specie Reference Genus and specie Reference
Bacillus licheniformis Ronning et al., 2015
© Central University of Technology, Free State

C h a p t e r 4
117
Food Poisoning – Yeast and Mould
Genus and Specie Reference Genus and Specie Reference Genus and Specie Reference
Penicillium commune Sosa et al., 2002 Penicillium crustosum Sonjak et al., 2005
Food Spoilage - Bacteria
Genus and Specie Reference Genus and specie Reference Genus and specie Reference
Pseudomonas fluorescens Andreani et al., 2014 Pseudomonas fragi Decimo et al., 2018
Food Spoilage – Yeast and Mould
Genus and Specie Reference Genus and Specie Reference Genus and Specie Reference
Meyerozyma guilliermondii Wrent et al., 2015 Penicillium commune Sosa et al., 2002 Penicillium crustosum Sonjak et al., 2005
© Central University of Technology, Free State

C h a p t e r 4
118
Staphylococcus spp. are indicators of the severity of air pollution and their presence may indicate the
further presence of pathogenic bacteria (Bragoszewska et al., 2016; Kim et al., 2007; Kubera et al.,
2015). In the current study, five Staphylococcus spp. (cohnii, epidermidis, haemolyticus, hominis subsp
novobiosepticus and succinus) were detected on more than ten occasions in different areas in peak
and off-peak air samples (Figure 4.4). Staphylococcus cohnii, epidermidis, haemolyticus, hominis subsp
novobiosepticus and succinus are coagulase-negative staphylococci that may be responsible for
bloodstream infections in immuno-suppressed patients (Ahmed et al., 2017; Czekaj et al., 2015; Garg,
2017; Novakova et al., 2006; Otto, 2013). Even though these species can only affect immuno-
suppressed individuals, their multidrug resistance capacity against available antimicrobial agents is
considered a problem and is the reason why these species are of clinical significance (Carvalhais et al.,
2015).
Although Staphylococcus spp. are opportunistic pathogens and rarely cause human infections, their
ability to form biofilms on different equipment surfaces had the potential to negatively influence the
hygiene of workers in this specific production facility. Despite the low pH as well as the water activity
and high sugar content that are characteristics of fruit juice, various Staphylococcus spp. have been
detected in fruit juice in earlier studies (Abraha et al., 2018; Bentanzos-Cabrera et al., 2015; Carvalhais
et al., 2015). Even with regards to infectious diseases only, no clear correlation was found between
concentrations of culturable microorganisms in the air and infection. One reason for this could be that
infection should be correlated with the dose-response rather than the concentration. Unfortunately,
dose-response relationships still have not been established for most biological agents (Bragoszewska
et al., 2015).
Yeast and mould have been used for centuries in the production of diverse foods and beverages. They
have also been shown to be involved in the spoilage of an extensive range of foods. Yeasts,
predominantly Saccharomyces and Zygosaccharomyces spp., are able to grow at low pH values in
foods with a high sugar content and at refrigeration temperature, making them potential spoilers of
refrigerated or concentrated fruit juices (Ferrario et al., 2015; Goyer et al., 2001; Rojo et al., 2017).
However, none of these yeasts were isolated during the two sampling seasons using this specific
sampling methodology. This suggests that they were possibly present but were not isolated; were not
present in the environmental air of the facility; or were not present in the environment of this facility at
all.
Fungal spoilage encompasses the decay of foods, including the development of off-flavours,
acidification, discolouration, and disintegration. Moulds that are typically isolated from fruit juice belong
© Central University of Technology, Free State

C h a p t e r 4
119
mainly to the Penicillium genus and have been identified in several earlier studies (Groot et al., 2018;
Lipsa et al., 2016). In the current study, Penicillium commune was detected on more than ten occasions
in peak and off-peak samples that had been collected in different areas (Figure 4.4). Fungal spoilage
endangers the health of humans by exposing consumers to toxic secondary metabolites such as
mycotoxins. The mycotoxin (Cyclopiazonic acid) producing ability displayed by this isolate is a
disturbing fact as it causes poisoning in humans when ingested. It is widely known that there is an
active metabolism and dissemination of hyaline fungal hyphae inside substrates before the formation of
visible colonies on the surface of food. In the interstitial period, there is a risk of consumer exposure to
mycotoxins (Wigmann, et al., 2015).
Microorganisms that have pathogenicity/infectious capacity, multidrug resistance and food
poisoning/spoilage abilities can be found in the air and they also form part of certain environments as
bioaerosols. Although the importance of bioaerosols and their impact on human health have been
recognised, it is still difficult to accurately describe their role in the initiation or worsening of diverse
symptoms and diseases. Diseases and food spoilage arise from exposure to biological agents through
the transmission of infectious agents by direct and/or indirect contact, airborne transmission, and
vector-borne transmission (Kim et al., 2018).
.
© Central University of Technology, Free State
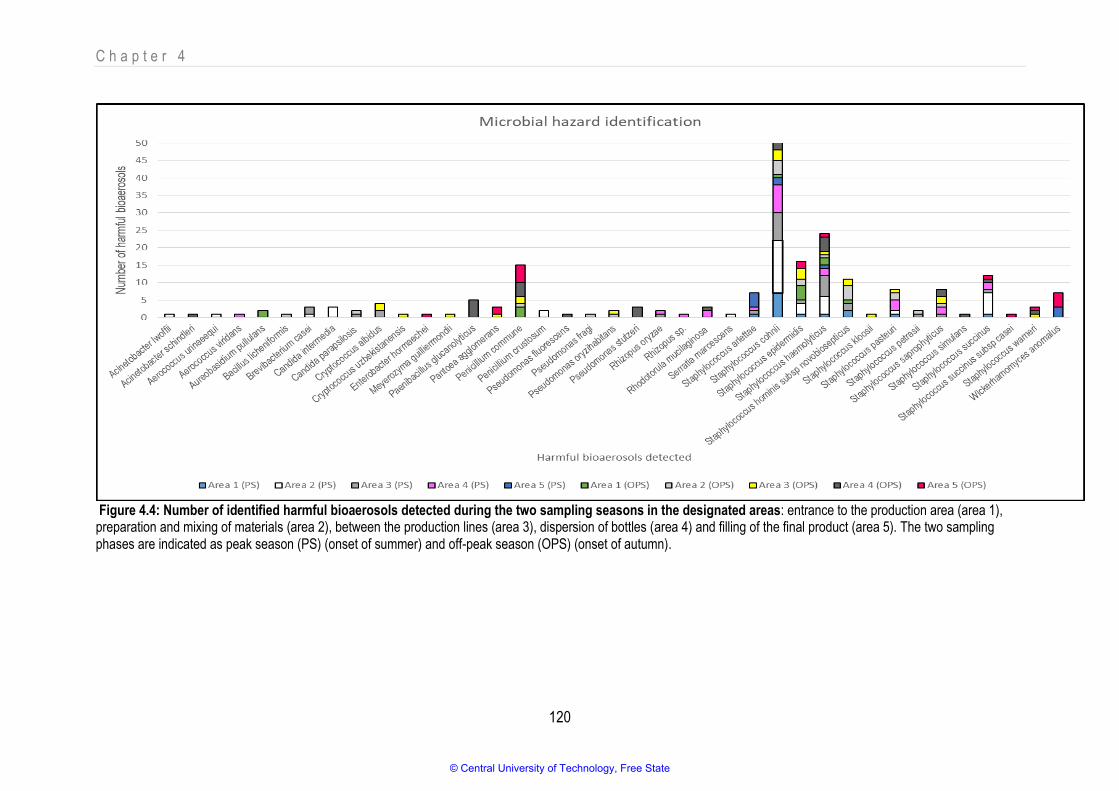
C h a p t e r 4
120
Figure 4.4: Number of identified harmful bioaerosols detected during the two sampling seasons in the designated areas: entrance to the production area (area 1), preparation and mixing of materials (area 2), between the production lines (area 3), dispersion of bottles (area 4) and filling of the final product (area 5). The two sampling phases are indicated as peak season (PS) (onset of summer) and off-peak season (OPS) (onset of autumn).
© Central University of Technology, Free State
C h a p t e r 4
121
The transmission of pathogens and other bioaerosols among humans has been a topic of research for
centuries as humans harbour diverse microbes (including pathogens) in and on their bodies. The
presence and activities of humans, particularly in indoor environments, can influence bioaerosol
concentrations negatively. This is depicted in Figure 4.4 where, in Area 5 (filling of final product), more
personnel were involved and thus higher and more diverse harmful bioaerosols were observed. The
emission of particles by breathing, sneezing, coughing, talking and movement, as well as from
resuspension of dust due to human activity, has been the focus of numerous indoor bioaerosol studies
(Adams et al., 2015; Bhangar et al., 2014, 2015; Castillo et al., 2012; Hospodsky et al., 2012; Meadow
et al., 2014, 2015; Morawska, 2006; Nazaroff, 2015; Noble, 1975; Qian et al., 2012, 2014; You, 2013).
The conditions in the fruit juice facility and of the fruit juices themselves (raw materials used in fruit juice
production, low pH of the final product, high sugar concentration, and low water activity) were ideal for
the growth of yeast, mould and fungal spore concentrations and also increased the risk of fungal
contamination. For example, mould spores are associated with ‘sick building syndrome’ and can cause
allergic reactions (Kobayaski et al., 2009). Toxic fungal metabolites such as mycotoxins (Sorensen et
al., 1984) can cause severe adverse health problems. Apart from the fact that Candida spp. and
Staphylococcus spp. are responsible for a substantial number of infections independently, there is
increasing evidence that they can be co-isolates in cases of biofilm associated infections (Zago et al.,
2015). Interestingly, in Area 2 and Area 3 where Candida spp. were detected, Staphylococcus spp.
were also observed (Figure 4.4). The clinical outcome of these mixed bacterial-fungal interactions is
that the resultant infections can correlate with an increased frequency or severity of diseases (Zago et
al., 2015).
Staphylococci constitute the main part of the human skin microbiome, and for this reason their role as
pathogens has been underestimated (Czekaj et al., 2015). The genus Staphylococcus is a major cause
of both hospital-acquired and community-onset infections and there is a clear need to control
antimicrobial-resistant staphylococci (Diekema et al., 2001; Madsen et al., 2018). The Pseudomonas
genus also observed in Figure 4.4 was classified as a human pathogen in 1972 (Gilardi, 1972).
Pseudomonas is one of the more diverse genera, and its taxonomy has undergone many changes
since earlier descriptions (Mulet et al., 2010). Today Pseudomonas spp. has established itself as one of
the most troublesome agents causing nosocomial infections (Shyamala & Rao, 2015).
Climatic conditions have a significant impact on the concentrations and diversity of airborne
microorganisms (Wu et al., 2017; Zhen et al., 2017). This study thus considered climatic conditions to
determine if seasonal variation influenced the diversity, distribution and occurrence of harmful
© Central University of Technology, Free State

C h a p t e r 4
122
bioaerosols, and they were in fact detected in the various designated areas in the facility during both
seasons (Figure 4.5). A clear trend was noted between Area 2 (preparation and mixing of materials),
Area 3 (between the production lines) and Area 4 (dispersion of bottles) with distinguished higher
diversity and representability of the same species in both seasons. In Area 5 (filling of final product),
where more personnel were involved, diverse harmful bioaerosols were detected, but the same species
were not present during both seasons as the lowest diversity and representability of the same species
were observed in Area 1 (entrance to the facility) during both seasons. During both seasons 39 different
species were detected; Staphylococcus spp. (13) and Pseudomonas spp. (4), and to a lesser extent
(with two species each) Aerococcus spp., Acinetobacter spp., Penicillium spp., Candida spp.,
Cryptococcus spp. and Rhizopus spp. were the most prevalently harmful bioaerosols that were
identified. Two of these prominent species, namely Aerococcus spp. and Rhizopus spp., were only
detected during the peak season whereas Acinetobacter spp., Penicillium spp., Candida spp. and
Cryptococcus spp. were detected during both the peak and off-peak seasons. The second most
prominent genera, Pseudomonas spp., with a prevalence of the species detected during the off-peak
season in Areas 2, 3 and 4, is the most frequently reported genus of the bacteria found after sanitation
of food processing surfaces across all types of food production. Pseudomonas spp. occur ubiquitously
as they are associated with a wide range of niches in food production environments with respect to
nutrients, temperature, surface materials, and stress factors. This genus has established itself on
stainless steel coupons placed in the processing environments of fruit juice related industries (Moretro
& Langsrud, 2017). Staphylococcus spp. is one of the most common Gram-positive genera found in
food production environments, and it came as no surprise that Staphylococcus spp. were the most
prominent genera detected in the current study. These genera were detected during both seasons and
were prevalent consistently throughout the facility in all high-risk areas. The biofilm-producing ability of
staphylococci may contribute to their persistence in food processing environments, which also occurs in
clinical environments (Moretro & Langsrud, 2017). Three Staphylococcus spp. (Staphylococcus cohnii,
haemolyticus and succinus) were found in all five designated areas.
In most studies, bacteria have been reported as the dominant microorganisms and they seem to have
dominated in most production environments. However, research has shown that in production
environments that are more ideal for eukaryotic microorganisms (dry environments and low water
activity), yeasts and moulds may be present in significant numbers (Calasso et al., 2016; Minervini et
al., 2015; Moretro & Langsrud, 2017). Four significant eukaryotic microorganisms were detected in this
study during both seasons, namely Cryptococcus albicans, Rhodotorula mucilaginosa,
Wickerhamomyces anomalus, and Penicillium commune.
© Central University of Technology, Free State

C h a p t e r 4
123
Even though research has indicated that seasons have an influence on the concentration and diversity
of microorganisms, any increase in temperature and air exchange rate will cause an increase in
airborne bacteria, yeast and mould (Frankel et al., 2012; Wu et al., 2017; Zhen et al., 2017). The
temperature in the production facility under study did not fluctuate significantly during the two study
seasons, and thus external seasonal variation did not influence the microbial concentration or diversity
in the different sampling areas. The only variation that was observed was that more personnel were
present during the off-peak season in all the areas, which might explain the additional species observed
during this season. Moreover, the airborne microbial levels increased significantly in the occupied areas
compared to the unoccupied areas. This finding supports the argument that humans are a source of
bacteria and fungi in settled dust samples (Adams et al., 2015).
© Central University of Technology, Free State
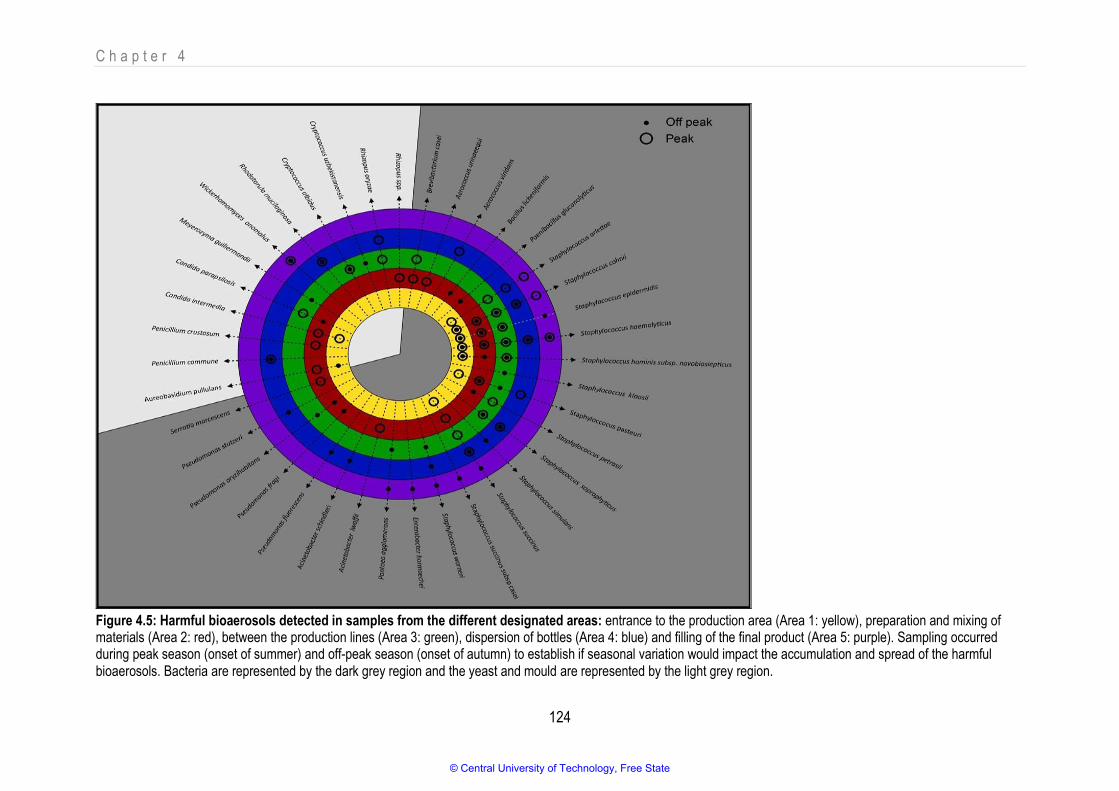
C h a p t e r 4
124
Figure 4.5: Harmful bioaerosols detected in samples from the different designated areas: entrance to the production area (Area 1: yellow), preparation and mixing of materials (Area 2: red), between the production lines (Area 3: green), dispersion of bottles (Area 4: blue) and filling of the final product (Area 5: purple). Sampling occurred during peak season (onset of summer) and off-peak season (onset of autumn) to establish if seasonal variation would impact the accumulation and spread of the harmful bioaerosols. Bacteria are represented by the dark grey region and the yeast and mould are represented by the light grey region.
© Central University of Technology, Free State
C h a p t e r 4
125
When comparing the densities of the harmful bioaerosols that were detected, only a small group of the
species (Table 4.5) had the potential ability to affect the products manufactured at the facility. Kim et al.
(2018) argue that although food poisoning and/or spoilage microorganisms are present in the air, it is
not guaranteed that they will cause harm as there are still factors that affect their capability to cause
harm (e.g., dose relationship, microbial competition and contact with host). With this in mind, it may
explain the fact that even though these food poisoning and/or spoilage microorganisms were present in
the air, there were no reports of these specific microorganisms influencing the products produced in this
fruit juice industry. A great number of pathogenic bioaerosols was detected, and these all had the
potential to impact the occupational health of the personnel in the facility negatively. This confirms the
argument that the measurement of bioaerosols should be performed according to a protocol that is
representative of exposure patterns and duration and that relates to the dose (Bragoszewska et al.,
2016). Therefore, estimating the dose of culturable bacteria that affect people who inhale it in a factory
seems to be important for future exposure analyses.
As studies will continue to examine the microbiology of indoor environments, we should maintain a
central focus on people, as human occupants are a major source of indoor bacteria. However, the type
of measurement tool we use should be carefully considered as measurement limitations continue to be
daunting (Nazaroff, 2014). For example, for easier interpretation of the results, the reference limit
values for bacteria, yeast and mould concentrations in the indoor air of the facility under study should
have been facility and product specific. The categorisation that is used in indoor bioaerosol studies
should also describe the parameters for interpretation of the investigated events. Moreover, research
that focuses on processes and that is framed in the context of well-established fact and research-based
knowledge can be a valuable way to proceed in this field.
Despite tremendous scientific progress globally, the body of knowledge about biologically originated
indoor air pollution seems to remain relatively narrow and insufficient. The reasons for this limited scope
could be attributed to: (i) a lack of modern sampling instrumentation (that is industry-bioaerosol
specific); (ii) common use of old methods to evaluate the microbiological quality of air; (iii) relatively high
costs of instrumental analyses for bacterial and fungal toxins and their markers; (iv) lack of common
approved criteria for assessing exposure to biological factors; and (v) a very low number of
institutions/organisations interested in (or obligated to perform) comprehensive environmental
monitoring of bioaerosols.
It has been argued that, although the complexity and importance of the subject of indoor bioaerosol
dynamics have been underscored by various studies, our understanding of this phenomenon is not yet
© Central University of Technology, Free State

C h a p t e r 4
126
mature. One might therefore anticipate fundamental paradigm shifts as knowledge grows and the ability
to ask and answer incisive questions improves. Therefore, because the gap between what we know
and what we would like to know is quite large, our current knowledge is insubstantial, and we need to
realise that we will probably never measure everything. Nevertheless, we need to accurately measure
what can reasonably be expected within scientifically determined parameters.
In light of the above arguments, the diversity and complexity of fruit juice facilities will continue to pose
great challenges for studies on indoor bioaerosol dynamics. This is because mere basic identification
and simply analysing bioaerosol concentrations in the air can lead to large misclassification errors of
aerosol sources, and misidentification can also lead to misattribution. In this context, the findings of the
current study may serve as a reference for future assessments and they may contribute to: (i) policy
reviews for product and occupational health; (ii) research efforts in the field to be more outcomes
specific; (iii) the implementation of preventative occupational health programs; (iv) the formulation of
recommendations aimed at providing healthier production and working environments; and (v) the
setting of a clear standard with scientifically established limits in order for facilities to operate within a
safe range concerning bioaerosols, the safety of employees, and product quality and safety.
4.4. Conclusion
Bacteria, yeast and mould are the main groups of microorganisms found in bioaerosols. The literature
has revealed that the actual identity, diversity and abundance of different types of bioaerosol particles,
as well as their temporal and spatial variability, have not been well characterised. Overall, the role of
bioaerosols in the atmosphere and their interaction with other ecosystems are not well described and
understood. This study thus attempted to fill this gap.
The analyses that were conducted isolated a total of 239 bacteria, 41 yeasts and 43 moulds from the
air in the selected fruit juice production environment. From the isolates that were obtained, 92 different
species were identified from the culturable fraction. These microorganisms belonged to 15 different
taxonomic orders that were divided into five orders representing bacteria and ten orders representing
yeast and mould. Based on the data elicited by the study, the culturable fraction of the bioaerosols
identified were categorised into three main groups, namely 27 innocuous, 26 useful and 39 harmful
bioaerosols.
In the innocuous bioaerosol group, two genera were dominant, namely the Bacillus and Staphylococcus
species, and only four innocuous yeasts and moulds were detected. Useful bioaerosols detected during
the sampling seasons were categorised into three different groups according to their known
© Central University of Technology, Free State

C h a p t e r 4
127
capabilities, namely: (i) medical contribution; (ii) promoting and protecting plant growth; and (iii)
environmental contribution. Although innocuous and useful bioaerosols do not negatively influence
human health, it is critical to mention that the presence of innocuous and useful bioaerosols serves as
an indicator that an ideal environment is present for the possible emergence of harmful bioaerosols. In
addition, any type of bioaerosol that is in excess will have a negative influence on the food product and
must also be considered a threat.
The fact that harmful bioaerosols were detected is reason for concern, especially as species such as
Staphylococcus spp., Pseudomonas spp., Penicillium spp. and Candida spp. were detected. These
species in particular have been reported extensively as problematic in the fruit juice industry as they are
harmful and have pathogenic/infectious, multidrug resistance, and food poisoning/spoilage abilities.
However, even though the air in this facility contained pathogenic/spoilage microorganisms, various
factors that affect their harmful capabilities (such as dose relationship, microbial competition and
contact with host) should be considered.
This study demonstrated that all types of culturable airborne microorganisms occur ubiquitously and are
naturally part of the air environment. It is therefore important that food processing facilities ensure that
measures are taken to reduce bioaerosols that may cause product contamination or even occupational
health issues. However, there is clearly a need to be more industry- and outcome-specific before
monitoring the prevalence of bioaerosols in a specific industry. Culture-dependent methods remain
important if information regarding the viability and metabolic activity of these organisms is to be
obtained. It is also important that the role that different microbes play in distinctive processes is
ascertained and that a clear standard with scientifically established limits be disseminated so that
facilities may operate within a safe range concerning bioaerosols. This is especially important in light of
the safety of employees and the quality and safety of reliable products.
© Central University of Technology, Free State
C h a p t e r 4
128
4.5. References
ABRAHA, H., HADISH, G., ALIGAZ, B., EYAS, G. & WORKELULE, K. 2018. Antimicrobial resistance
profile of Staphylococcus aureus isolated from raw cow’s milk and fresh fruit juice in Mekelle, Tigray,
and Ethiopia. Journal of Veterinary Medicine and Animal Health 10(4), 106-113.
ADAMS, R.I., BHANGAR, S., PASUT, W., ARENS, E.A., TAYLOR, J.W., LINDOW, S.E., NAZAROFF,
W.W. & BRUNS, T.D. 2015. Chamber bioaerosol study: outdoor air and human occupants as sources
of indoor airborne microbes. PLOS ONE 10, 29-41.
ADUKWE, E.C., BOWLES, M., EDWARDS-JONES, V. & BONE, H. 2016. Antimicrobial activity,
cytotoxicity and chemical analysis of lemongrass essential oil (Cymbopogon flexuosus) and pure citral.
Applied Microbiology Biotechnology 100, 9619-27.
AFANOU, K.A., STRAUMFORS, A., SKOGSTAD, A., NAYAK, A.P., SKAAR, I., HJELJORD, L.,
TRONSMO, A., EDUARD, W. & GREEN, B.J. 2015. Indirect immune detection of fungal fragments by
field emission scanning electron microscopy. Applied Environment Microbiology 81(17), 5794-803.
AHMED, N.H., BARUAH, F.K. & GROVER, R.K. 2017. Staphylococcus hominis subsp.
Novobiosepticus, an emerging multidrug-resistant bacterium, as a causative agent of septicaemia in
cancer patients. Indian Journal of Medical Research 146(3), 420-25.
AHMED, S., AHMAD, M., SWAMI, B.L. & IKRAM, S. 2016. A review on plants extract mediated
synthesis of silver nanoparticles for antimicrobial applications: a green expertise. Journal of Advanced
Research 7, 17-28.
ALCOCER, A.S., ORDAZ, N.R., RAMIREZ, C.J. & MAYER, J.G. 2007. Continuous biodegradation of
single and mixed chlorophenols by a mixed microbial culture constituted by Burkholderia sp.,
Microbacterium phyllospaerae and Candida tropicalis. Biochemical Engineering Journal 37(2), 201-11.
ALIAKBAR, R., KAZEM, N. & ALLAHBAKHSH, J. 2013. Measurements of bioaerosols in the air around
the facilities of waste collection and disposal. Environmental Protect Engineering 39, 105-12.
ALTSCHUL, S.F. 1997. Evaluating the statistical significance of multiple distinct local alignments.
Theoretical and computational methods in genome research, New York: Plenum Press, 1-14.
ANDERSON, P.W. 1958. Absence of diffusion in certain random lattices. Physical Review 109, 1492.
© Central University of Technology, Free State

C h a p t e r 4
129
ANDREANI, N.A., MARTINO, M.E., FASOLATO, L., CARRARO, L., MONTEMURRO, F., MIONI, R.,
BORDIN, P. & CARDAZZO, B. 2014. Tracking the blue: AMLST approach to characterise the
Pseudomonas fluorescens group. Food Microbiology 39, 116-26.
ARANSIOLA, E.F., OJUMU, T.V., OYEKOLA, O.O., MADZIMBAMUTO, T.F. & IKHU-OMOREGBE,
D.I.O. 2014. A review of current technology for biodiesel production: state of the art. Biomass and
Bioenergy 61, 276-97.
ATHAN, E. 2014. The characteristics and outcome of infective Endocarditis involving implantable
cardiac devices. Current Infectious Diseases Reports 16, 446-50.
AZIN, M., MORAVEJ, R. & ZAREH, D. 2007. Production of xylanase by Trichoderma longibrachiatum
on a mixture of wheat bran and wheat straw: optimization of culture condition by Taguchi method.
Enzyme and Microbial Technology 40, 801-5.
BAL, Z.S., SEN, S., KARAPINAR, D.Y., AYDEMIR, S. & VARDAR, F. 2015. The first reported catheter-
related Brevibacterium casei bloodstream infection in a child with acute leukaemia and review of
literature. Brazil Journal of Infectious Disease 19(2), 213-15.
BARATA, A., MALFEITO-FERREIRA, M. & LOUREIRO, V. 2012. The microbial ecology of wine grape
berries. International Journal of Food Microbiology 153, 243-59.
BEHRENDT, U., ULRICH, A., SCHUMANN, P., MEYER, J.M. SPROER, C. 2007. Pseudomonas lurida
sp. Nov., a fluorescent species associated with the phyllosphere of grasses. International Journal of
Systematic and Evolutionary Microbiology 57, 979-85.
BENTANZOS-CABRERA, G., MONTES-RUBIO, P.Y., FABELA-ILLESCAS, H.E., BELEFANT-MILLER,
H. & CANCINP-DIAZ, J.C. 2015. Antibacterial activity of fresh pomegranate juice against clinical strains
of Staphylococcus epidermidis. Food & Nutritional Research 59, 276-86.
BEUCHAT, L.R. & MANN, D.A. 2016. Comparison of new and traditional culture-dependent media for
enumerating foodborne yeasts and moulds. Journal of Food Protection 79(1), 95-111.
BHANGAR, S., ADAMS, R.I., PASUT, W., HUFFMAN, J.A., ARENS, E.A., TAYLOR, J.W., BRUNS,
T.D. & NAZAROFF, W.W. 2015. Chamber bioaerosol study: human emissions of size-resolved
fluorescent biological aerosol particles. Indoor Air, 19-26.
© Central University of Technology, Free State

C h a p t e r 4
130
BHANGAR, S., HUFFMAN, J.A. & NAZAROFF, W.W. 2014. Size-resolved fluorescent biological
aerosol particle concentrations and occupant emissions in a university classroom. Indoor Air 24, 604-
17.
BONADONNA, L., BRIANCESCO, R. & COCCIAM A.M. 2017. Analysis of microorganisms in hospital
environments and potential risks. Indoor Air Quality in Healthcare Facilities, 53-62.
BOWERS, R.M., SULLIVAN, A.P., COSTELLO, E.K., COLLETT, J.L., KNIGHT, R. & FIERER, N. 2011.
Source of bacteria in outdoor air across cities in the Midwestern United States. Applied Environmental
Microbiology 10, 498-511.
BRAGOSZEWSKA, E., MAINKA, A. & PASTUSZKA, J.S. 2016. Bacterial aerosols in an urban nursery
school in Gliwice, Poland: a case study. Aerobiology, 156-78.
BRAGOSZEWSKA, E., MAINKA, A. & PASTUSZKA, J.S. 2016. Bacterial and fungal aerosols in rural
nursery schools in southern Poland. Atmosphere 7(142), 16-32.
BRANDL, H., FRICKER-FEER, C., ZIEGLER, D., MANDAL, J., STEPHAN, R. & LEHNER, A. 2014.
Distribution and identification of culturable airborne microorganisms in a Swiss milk processing facility.
Journal of Dairy Science 97, 240-46.
BRIGANTI, F., PESSIONE, E., GIUNTA, C. & SCOZZAFAVA, A. 1997. Purification, biochemical
properties and substrate specificity of a catechol 1, 2-dioxygenase from a phenol degrading
Acinetobacter radioresistens. FEBS Letters 416, 61-64.
BROWN, G.D., DENNING, D.W., GOW, N.A.R., LEVITZ, S.M., NETEA, M.G. & WHITE, T.C. 2012.
Hidden killers: human fungal infections. Science Translated Medicine 4, 165-72.
BULSKI, K., OSTAFIN, M., FRACZEK, K., CHEMIEL, M.J., SUPROVYCH, T. & PUSTOVA, Z. 2017.
The microbiological air quality at the fruit and vegetable processing facility. Agronomy and Veterinary
Medicine 1(1), 54-64.
CALASSO, M., ERCOLINI, D., MANCINI, L., STELLATIO, G., MINERVINI, F., DI CAGNO, R., DE
ANGELIS, M., & GOBBETTIM, M. 2016. Relationships among house, rind and core microbiotas during
manufacture of traditional Italian cheeses at the same dairy plant. Food Microbiology 54, 115-26.
© Central University of Technology, Free State

C h a p t e r 4
131
CARVALHAIS, V., CERVEIRA, F., VILANOVA, M., CERCA, N. & VITORINO, R. 2015. An
immunoproteomic approach for characterization of dormancy within Staphylococcus epidermidis
biofilms. Molecular Immunology 65, 429-35.
CASTILLO, J.A., STATON, S.J.R., TAYLOR, T.J., HERCHES, P. & HAYES, M.A. 2012. Exploring the
feasibility of bioaerosol analysis as a novel fingerprinting technique. Analytical and Bioanalytical
Chemistry 403, 15-26.
CASTORIA, R., DE CURTIS, F., LIMA, G., CAPUTO, L., PACIFICO, S. & DE CICCO, V. 2001.
Aureobasidium pullulans (LS-30) an antagonist of postharvest pathogens of fruits: study on its modes
of action. Postharvest Biology and Technology 22, 7-17.
CHAVDA, K.D., CHEN, L., FOUTS, D.E., SUTTON, G., BRINKAC, L., JENKINS, S.G., BONOMO, R.A.,
ADAMS, M.D. & KREISWIRTH, B.N. 2016. Comprehensive genome analysis of carbapenemase-
producing Enterobacter spp.: new insights into phylgeny, population structure, and resistance
mechanisms. American Society for Microbiology 7(6), 2093-116.
CHEN, L., ZHANG, Q-Y., JIA, M., MING, Q-L., YUE, W., RAHMAN, K., QIN, L-P. & HAN, T. 2014.
Endophytic fungi with antitumor activities: their occurrence and anticancer compounds. Critical Review
of Microbiology, 1-20.
CHI, Z., WANG, F., CHI, Z., YUE, L., LIU, G. & ZHANG, T. 2009. Bioproducts from Aurobasidium
pullulans, a biotechnologically important yeast. Applied Microbiology and Biotechnology 82, 793-804.
CHOI, O., LEE, Y., KANG, B., BAE, J., KIM, S. & KIM, J. 2018. Aversion centre blackening of
muskmelon fruit caused by Pseudomonas oryzihabitans, an opportunistic pathogen of humans and
warm-blooded animals. International Journal of Food Microbiology 291, 1-4.
CODA, R., RIZZELLO, C.G., CAGNO, R.D., TRANI, A., CARDINALI, G. & GOBBETTI, M. 2012.
Antifungal activity of Meyerozyma guilliermondii: identification of active compounds synthesized during
dough fermentation and their effect on long-term storage of wheat bread. Food Microbiology 8, 184-96.
CROOK, B., GAWN, J.M. & SWAN, J.R.M. 2016. Bacteria, viruses and other bioaerosols in the
workplace. FLANNIGAN, B., SAMSON, R.A. & MILLER, J.D. 2017. In: Microorganisms in home and
indoor work environments. 2nd edition. New York: Boca Raton, 6000 Broken Sound Parkway NW, Suite
300, CRC Press.
© Central University of Technology, Free State
C h a p t e r 4
132
CZEKAJ, T., CISZEWSKI, M. & SZEWCZYK, M. 2015. Staphylococcus haemolyticus: an emerging
threat in the twilight of the antibiotics age. Microbiology 161, 2061-68.
DAUGELAITE, J., O’ DRISCOLL, A. & SLEATOR, R.D. 2013. Overview of multiple sequence
alignments and cloud computing in bioinformatics. ISRN Biomathematics, 16-30.
DAVID, B., WOLFENDER, J-L. & DIAS, D.A. 2014. The pharmaceutical industry and natural products:
historical status and new trends. Phytochemistry Review, 354-67.
DAVOLOS, D. & PIETERANGELI, B. 2007. DNA sequencing and phylogenetic analysis of allergen-
encoding genes from airborne moulds and yeast. Prev Oggi 3, 23-35.
DE BEL, A., SVEC, P., PTERAS, P., SEDLACEK, I., PANTUCEK, R., ECHAHIDI, F., PIERARD, D. &
VANDAMME, P. 2014. Reclassification of Staphylococcus jettensis De Bel et al. 2013 as
Staphylococcus petrasii subsp. jettensis subsp. nov. and emended description of Staphylococcus
petrasii Pantucek et al. 2013. Journal of Systematic and Evolutionary Microbiology 64, 4198-201.
DECIMO, M., CABEZA, M.C., ORDONEZ, J.A., DE NONI, I. BRASCA, M. 2018. Volatile organic
compounds associated with milk spoilage by psychotropic bacteria. International Journal of Dairy
Technology 71(3), 593-601.
DEHGHAN-NIRI, M., RAHLMLAN, H. & BABAELZAD, V. 2015. Cryptococcus uzbekistanensis causing
canker on stone fruit trees. New Disease Reports 31(13), 2044-45.
DELLGIOS, M., FRAUMENE, C., ABBONDIO, M., MANNAZZU, I., TANCA, A., ADDIS, M.F. & UZZAU,
S. 2015. Draft genome sequence of Rhodotorula mucilaginosa: an emerging opportunistic pathogen.
Genome Announcements 3(2), 201-15.
DESPRES, V.R., HUFFMAN, J.A., BURROWS, S.M., HOOSE, C., SAFATOV, A.S., BURYAK, G.,
FROHLICH-NOWOISKY, J., ELBERT, W., ANDREAE, M.O., POSCHL, U. & JAENICKE, R. 2012.
Primary biological aerosol particles in the atmosphere: a review. Tellus B: Chemical and Physical
Meteorology 64, 3059.
DIEKEMA, D.J., PFALLER, M.A., SCHMITZ, F.J., SMAYEVSKY, J., BELL, J., JONES, R.N., BEACH,
M. & SENTRY PARTICIPANTS GROUP. 2001. Survey of infections due to Staphylococcus species:
frequency of occurrence and antimicrobial susceptibility of isolates collected in the United States,
© Central University of Technology, Free State
C h a p t e r 4
133
Canada, Latin America, Europe, and the Western Pacific Region for the SENTRY Antimicrobial
Surveillance Program, 1997-1999. Clinical Infectious Diseases 32, 114-32.
DIMITRIADI, D., CHARITIDOU, C. & CHARVALOS, E. 2014. Urinary tract infection due to beta-
lactams-resistant Staphylococcus warneri: a case report. The International Arabic Journal of
Antimicrobial Agents 4(4), 760-65.
DIXIT, R.W., MALAVIYA, D., PNDIYAN, K., SINGH, U.B., SAHU, A., SHUKLA, R., SINGH, B.P., RAI,
J.P., SHARMA, P.K., LADE, H. & PAUL, D. 2015. Bioremediation of heavy metals from soil and aquatic
environments: an overview of principles and criteria of fundamental processes. Sustainability 7, 2189-
212.
DOUGLAS, A.K. Jr., HOCKING, A.D. & PITT, J.I. 1979. Dichloran-Rose Bengal medium for
enumeration and isolation of moulds from foods. Applied Environmental Microbiology 37(5), 959-64.
DOWNES, F.P. & ITO, K. 2001. Compendium of methods for the microbiological examination of foods.
4th edition. Washington, DC: American Public Health Association Press.
DU PLESSIS, I.L., DRUZHININA, I.S., ATANASOVA, L., YARDEN, O. & JACOBS, K. 2018. The
diversity of Trichoderma species from soil in South Africa, with five new additions. Journal of Mycologia
110(3), 559-83.
DUTKIEWICZ, J., MACKIEWICZ, B., LEMIESZEK, M.K., GOLEC, M. & MILANOWSKI, J. 2016.
Pantoea agglomerans: a mysterious bacterium of evil and good. Part III. Deleterious effects: infections
of humans, animals and plants. Annals of Agricultural and Environmental Medicine 23(2), 197-205.
EDUARD W., HEEDERIK, D., DUCHAINE, C. & GREEN, B.J. 2012. Bioaerosol exposure assessment
in the workplace: the past, present and recent advances. Journal of Environmental Monitoring 14(2),
334-39.
EGAMBERDIEVA, D., BERG, G., LINDSTROM, K. & RASANEN, L.A. 2013. Alleviation of salt stress of
symbiotic Galega officinalis L. (goat’s rue) by co-inoculation of Rhizobium with root-colonizing
Pseudomonas. Plant and Soil 369, 453-65.
ETIAKN, I., MUSA, S.A. & ALKASSIM, R.S. 2016. Comparison of convenience sampling and purposive
sampling. American Journal of Theoretical and Applied Statistics 5(1), 1-4.
FOOD CODE. 2017. US Public Health Service, Food and Drug Administration.
© Central University of Technology, Free State

C h a p t e r 4
134
FERNANDEZ-RODRIQUEZ, S., SADYS, M., SMITH, M., TORMO-MOLINA, R., SKJOTH, C.A., MAYA-
MANZANO, J.M., SILVA-PALACIOS, I. & GONZALO-GARIJO, A. 2015. Potential sources of airborne
Alternaria spp. spores in south-west Spain. Science of the Total Environment 533, 165-76.
FERRARIO, M., ALZAMORA, S.M. & GUERRERO, S. 2015. Study of the inactivation of spoilage
microorganisms in apple juice by pulsed light and ultrasound. Food Microbiology 46, 635-42.
FIGUEIREDO, M., BONIFACIO, A., RODRIGUES, A.C., DE ARAUJO, F.F. & STAMFORD, N.P. 2016.
Beneficial microorganisms: current challenge to increase crop performance. Bioformulations: for
Sustainable Agriculture, 41-54.
FISHER, M.C., HENK, D.A., BRIGGS, C.J., BROWNSTEIN, J.S., MADOFF, L.C., McCRAW, S.L. &
GURR, S.J. 2012. Emerging fungal threats to animal, plant and ecosystems’ health. Nature 484, 186-
94.
FRANKEL, M., BEKO, G., TIMM, M., GUSTAVSEN, S., HANSEN, E.W. & MADSEN, A. 2012.
Seasonal variation of indoor microbial exposures and their relations to temperature, relative humidity
and air exchange rates. Applied Environmental Microbiology 78(23), 8289-97.
FROHLICH-NOWOISKY, J., KAMP, C.J., WEBER, B., HUFFMAN, J.A., POHLKER, C., ANDREA,
M.O., LANG-YONA, N., BURROWS, S.M., GUNTHE, S.S., ELBERT, W., SU, H., HOOR, P., THINES,
E., HOFFMANN, T., DESPRES, V.R. & POSCHL, U. 2016. Bioaerosols in the Earth system: climate,
health, and ecosystem interactions. Atmospheric Research 182, 346-76.
GHORBANI, F., KARIMI, M., BIRIA, D., KARIMINIA, H.R. & JEIHANIPOUR, A. 2015. Enhancement of
fungal delignification of rice straw by Trichoderma viride sp. to improve its saccharification. Biochemical
Engineering Journal 101, 77-84.
GARG, S. 2017. Staphylococcus cohnii: not so innocuous. Journal of Acute Disease 6(5), 239-40.
GILARDI, G. L. 1972. Infrequently encountered Pseudomonas species causing infection in humans.
Annals of Internal Medicine 77, 211-15.
GOMEZ, P., CASADO, C., SAENZ, Y., RUIZ-RIPA, L., ESTEPA, V., ZARAZAGA, M. & TORRES, C.
2017. Diversity of species and antimicrobial resistance determinants of staphylococci in superficial
waters in Spain. FEMS Microbiology Ecology 93, 1-7.
© Central University of Technology, Free State

C h a p t e r 4
135
GOYER, N., LAVOIEM, J., LAZURE, L. & MARCHAND, G. 2001. Bioaerosols in the workplace:
evaluation, control and prevention guide. Montreal: IRRST.
GRANADA, S.D., BEDOYA-PEREZ, J.C., SCHERLACH, K. & HERTWECK, C. 2016. Serratia
marcescens metabolites are promising candidates for biocontrol of avocado pathogens. Planta Med 82,
1-381.
GROOT, M.N., ABEE, T. & VAN BOKHORST-VAN DE VEEN, H. 2018. Inactivation of conidia from
three Penicillium spp. isolated from fruit juices by conventional and alternative mild preservation
technologies and disinfection treatments. Food Microbiology 9, 12-19.
GUPTA, G.N. & PRAKASH, V. 2014. Isolation and Identification of a novel, cold active lipase producing
Psychrophilic Bacterium Pseudomonas vancouverensis. Trends in Biosciences 7(22), 3708-11.
HAJEK, V., MEUGNIER, H., BES, M., BRUN, Y., FIEDLER, F., CHMELA, Z., LASNE, Y., FLEURETTE,
J. & FRENEY, J. 1996. Staphylococcus saprophyticus subsp. bovis subsp. nov., isolated from bovine
nostrils. International Journal of Systematic Bacteriology 46(3), 792-96.
HAN, S., KIM, H., RYU, J.C., CHUNG, Y.W., SEO, J.A. & RYU, J.H. 2018. NOX2-mediated neutrophil
extracellular traps (NETs) are responsible for lung injury induced by Rhizopus Oryzae and Mucor
circinelloides infection. American Journal of Respiratory and Critical Care Medicine 197, 14-26.
HARA, K., ZHANG, D., MATSUSAKI, H., SADANAGA, Y., IKEDA, K., HANAOKA, S. & HATAKEYAMA,
S. 2015. UV-tolerant culturable bacteria in an Asian dust plume transported over the East China Sea.
Aerosol and Air Quality Research 15, 591-99.
HAYAT, R., ALI, S., AMARA, U., KHALID, R., & AHMED, I. 2010. Soil beneficial bacteria and their role
in plant growth promotion: a review. Annual Microbiology 60, 579-98.
HEATHER, J.M. & CHAIN, B. 2016. The sequence of sequencers: the history of sequencing DNA.
Genomics 107, 1-8.
HEMATH, N.K.S., GAURAV, K., KARTHIK, L. & BHASKARA, R.K.V. 2010. Extracellular biosynthesis of
silver nanoparticles using the filamentous fungus Penicillium spp. Archives of Applied Sciences
Research 2, 161-67.
HEO, K.J., LIM, C.E., KIM, H.B. & LEE, B.U. 2017. Effects of human activities on concentrations of
culturable bioaerosols in indoor air environments. Journal of Aerosol Science 104, 58-65.
© Central University of Technology, Free State

C h a p t e r 4
136
HEYRMAN, J., RODRIGUEZ-DIAZ, M., DEVOS, J., FELSKE, A., LOGAN, N.A. & DE VOS, P. 2005.
Bacillus arenosi sp. nov., Bacillus arvi sp. nov. and Bacillus humi sp. nov., isolated from soil.
International Journal of Systematic and Evolutionary Microbiology 55, 111-17.
HIRST, J.M. 1995. Handbook of bioaerosols: introduction, retrospect and prospect. Boca Raton, Florida,
United States: Lewis Publishers, 1-10.
HONG, S.W., PARK, J.M., KIM, S.J. & CHUNG, K.S. 2012. Bacillus eiseniae sp. nov.: a swarming,
moderately halotolerant bacterium isolated from the intestinal tract of an earthworm (Eisenia fetida L.).
International Journal of Systematic and Evolutionary Microbiology 62, 2077-83.
HOSPODSKY, D., QIAN, J., NAZAROFF, W.W., YAMAMOTO, N., BIBBY, K., RISMANI-YAZDI, H. &
PECCIA, J. 2012. Human occupancy as a source of indoor airborne bacteria. PLOS ONE 7, 31-43.
HUANG, Y-H., LIN, I-H., CHANG, T-C. & TSENG, S-H. 2015. Early diagnosis and successful treatment
of Cryptococcus albidus Keratitis. Medicine 94(19), 94-98.
JEMLI, S., MESSAOUD, E.B., AYADI-ZOUARI, D., NAILI, B., KHEMAKHEM, B. & BEJAR, S. 2007. Β-
cyclodextrin glycosyltransferase from a newly isolated Paenibacillus pabuli US132 strain: purification,
properties and potential use in bread-making. Biochemical Engineering Journal 34, 44-50.
KAMPER, P., ALBRECHT, A., BUCZOLITS, S. & BUSSE, H.J. 2002. Psychrobacter faecalis sp. nov., a
new species from a bioaerosol originating from pigeon faeces. System of Applied Microbiology 25, 31-
36.
KAMPFER, P., MEURER, U., ESSER, M., HIRSCH, T. & BUSSE, H.J. 2007. Spingomonas
pseudosanguinis sp. nov. isolated from the water reservoir of an air humidifier. International Journal of
Systematic and Evolutionary Microbiology 57, 1342-45.
KANG, Y. & FRANK, J.F. 1988. Biological aerosols: a review of airborne contamination and its
measurement in dairy processing plants. Journal of Food Protection 52(7), 512-24.
KHAN, S.A., HAMAYUN, M., YOON, H., KIM, H., SUH, S., HWANG, S., KIM, J., LEE, I., CHOO, Y.,
YOON, W., LEE, B. & KIM, J. 2008. Plant growth promotion and Penicillium citrinum. BMC Microbiology
8, 231-36.
KIM, K-H., KABIR, E., JAHAN, S.A. 2018. Airborne bioaerosols and their impact on human health.
Journal of Environmental Science 67, 23-35.
© Central University of Technology, Free State

C h a p t e r 4
137
KIM, N.Y., KIM, Y.R., KIM, M.K., CHO, D.W. & KIM, J. 2007. Isolation and characterization of airborne
bacteria and fungi in indoor environment of elementary schools. Korean Journal of Microbiology 43,
193-200.
KOBZA, J., PASTUSZKA, J.S. & BRAGOSZEWSKA, E. 2018. Does exposure to aerosols pose a risk
to dental professionals? Occupational Medicine 68, 454-58.
KOOKEN, J.M., FOX, K.F. & FOX, A. 2012. Characterization of Micrococcus strains isolated from
indoor air. Molecular Cell Probes 26(1), 1-5.
KOBAYASKI, T., IIJIMA, K., REDHAKRISJNAN, S., VASSALLO, V.M.R., LAWRENCE, C.B., CYONG,
J.C., PEASE, L.R., OGUCHI, K. & KITA, H. 2009. Asthma-related environmental fungus, Alternaria,
activates dendritic cells and produces potent Th2 adjuvant activity. Journal of Immunology 182(2),
2502-10.
KUBERA, L., STUDZINSKA, J., DOKLADNA, W., MALECKA-ADAMOWICZ, M. & DONDERSKI, W.
2015. Microbiological air quality in some kindergartens and antibiotic resistance of bacteria of the
Staphylococcus spp. genus. Medicine Press 66, 49-56.
KUENZI, M. & The Working Party on Safety in Biotechnology of the European Federation of
Biotechnology. 1985. Safe biotechnology: general considerations. Applied Microbiology Biotechnology
21, 1-6.
KURTZMAN, C.P. & ROBNETT, C.J. 1998. Identification and phylogeny of yeasts from analysis of
nuclear large subunit (26S) ribosomal DNA partial sequence. Antonie van Leeuwenhoek 73, 331-71.
LAL, S. & TABACCHIONI, S. 2009. Ecology and biotechnological potential of Paenibacillus polymyxa:
mini review. Indian Journal of Microbiology 49, 2-10.
LALUCAT, J., BENNASAR, A., BOSCH, R., GARCIA-VALDES, E. & PALLERONI, N.J. 2006. Biology of
Pseudomonas stutzeri. Microbiology and Molecular Biology Reviews, 510-47.
LEE, B.U., LEE, G. & HEO, K.J. 2016. Concentration of culturable bioaerosols during winter. Journal of
Aerosol Science 94, 1-8.
LEE, J.S., LEE, K.C., PYUN, Y.R., BAE, K.S. 2003. Arthrobacter koreensis sp. nov.: a novel
alkalitolerant bacterium from soil. International Journal of Systematic and Evolutionary Microbiology 53,
1277-80.
© Central University of Technology, Free State

C h a p t e r 4
138
LELIEVELD, H.L.M., BOON, B., BENNETT, A., BRUNIUS, G., CANTLEY, M., CHMIEL, A. & WERNER,
R.G. 1996. Safe biotechnology. 7. Classification of microorganisms on the basis of hazards. Applied
Microbiology Biotechnology 45, 723-29.
LIMTONG, S. & NASANIT, R. 2017. Phylloplane yeasts in tropical climates. Yeasts in Natural
Ecosystemes: Diversity, 199-223.
LIN, S.J., SCHRANZ, J. & TEUTSCH, S.M. 2001. Aspergillosis case-fatality rate: systematic review of
the literature. Clinical Infectious Disease 32, 358-66.
LIPSA, F.D., ULEA, E. & CHIRIAC, I.P. 2016. Monitoring of fungal aerosols in some educational
building from Lasi, Romania. Environmental Engineering and Management Journal 15(4), 801-07.
LIU, B.H., LEI, C.W., ZHANG, A.Y., PAN, Y., KONG, L.H., XIANG, R., WANG, Y.X., YANG, Y.X. &
WANG, H.N. 2017. Colocation of the multi resistance gene cfr and the Fosfomycin resistance gene
fosD on a Noel Plasmind in Staphylococcus arlettae from a chicken farm. Antimicrobial Agents and
Chemotherapy 61(12), 1388-97.
LOPEZ-CORTES, A., SCHUMANN, P., PUKALL, R. & STACKEBRADT, E. 2006. Exiguobacterium
mexicanum sp. nov. and Exiguobacterium artemiae sp. nov. isolated from the brine shrimp Artemia
franciscana. Systematic and Applied Microbiology 29(3), 183-90.
LUTGRING, K.R., LINTON, R.H., ZIMMERMAN, N.J., PEUGH, M. & HEBER, A.J. 1996. Distribution
and quantification of bioaerosols in poultry-slaughtering plants. Journal of Food Protection 60(7), 804-
10.
LUTGTENBERG, B. & KAMILOVA, F. 2009. Plant-growth-promoting rhizobacteria. Annual Review of
Microbiology 63, 541-56.
MADSEN, A.M., MOSLEHI-JENABIAN, S., ISLAM, M.Z., FRANKEL, M., SPILAK, M. &
FREDERIKSEN, M.W. 2018. Concentrations of Staphylococcus species in indoor air as associated with
other bacteria, season, relative humidity, air change rate, and S. aureus positive occupants.
Environmental Research 160, 282-91.
MAJCHRZYCKA, K., OKRASA, M., SZULC, J. & GUTSROWSKA, B. 2017. Safety of workers exposed
to harmful airborne bioaerosols: legal status and innovations. Biotechnology Food Science 81(2), 159-
68.
© Central University of Technology, Free State
C h a p t e r 4
139
MANDAL, J. & BRANDL, H. 2011. Bioaerosols in indoor environments: a review with special reference
to residential and occupational locations. The Open Environmental & Biological Monitoring Journal 4,
83-96.
MAOKA, T., YASUI, H., OHMORI, A., TOKUDA, H., SUZUKI, N., OSAWA, A., SHINDO, K. &
ISHIBASHI, T. 2013. Anti-oxidative, anti-tumour-promoting, and anti-carcinogenic activities of
adonirubin and adonixanthin. Journal of Oleo Science 62, 181-86.
MARCHESI, J.R., SATO, T., WEIGHTMAN, A.J., MARTIN, T.A., FRY, J.C., HIOM, S.J. & WADE, W.G.
1998. Design and evaluation of useful bacterium-specific PCR primers that amplify genes coding for
bacterial 16S rRNA. Applied and Environmental Microbiology 64(2), 795-99.
MASCARENHAS DOS SANTOS, A.C., JIE, R., GODOY, H.A., ALVES, M. & POMBERT, J-F. 2018.
Complete genome sequences of the potential zoonotic pathogens Staphylococcus felis and
Staphylococcus kloosii. American Society for Microbiology 6(20), 404-18.
MEADOW, J.F., ALTRICHTER, A.E., BATEMAN, A.C., STENSON, J., BROWN, G., GREEN, J.L. &
BOHANNAN, B.J.M. 2015. Humans differ in their personal microbial cloud. Peer Journal 3, 44-52.
MEADOW, J.F., ALTRICHTER, A.E., KEMBEL, S.W., KLINE, J., MHUIREACH, G., MORIYAMA, M.,
NORTHCUTT, D., O’CONNER, T.K., WOMACH, A.M., BROWN, G.Z., GREEN, J.L. & BOHANNAN,
B.J.M. 2014. Indoor airborne bacterial communities are influenced by ventilation, occupancy, and
outdoor air source. Indoor Air 24, 41-48.
MEKADIM, C., KILLER, J., PECHAR, R. & MRAZEK, J. 2019. Fragment of the aspartyl-tRNA
synthetase applicable as a shared classification and phylogenetic marker in particular representatives
of the order Lactobacillales. Folia Microbiologica 64(1), 113-20.
MICELI, M.H., DIAZ, J.A. & LEE, S.A. 2011. Emerging opportunistic yeast infections. Lancet Infectious
Disease 11, 142-51.
MINERVINI, F., LATTANZI, A., DE ANGELIS, M., CELANO, G. & GOBBETTI, M. 2015. House
microbiotas as sources of lactic acid bacteria and yeasts in traditional Italian sourdoughs. Food
Microbiology 52, 66-76.
MOHAN, B., ZAMAN, K., ANAD, N. & TANEJA, N. 2017. Aerococcus viridans: a rare pathogen causing
urinary tract infection. Journal of Clinical and Diagnostic Research 11 (1), 91-95.
© Central University of Technology, Free State
C h a p t e r 4
140
MONTERO, A., DUEKER, M.E. & MULLAN, G.D.O. 2016. Culturable bioaerosols along an urban
waterfront are primarily associated with coarse particles. Peer Journal 4, 18-36.
MORAWSKA, L. 2006. Droplet fate in indoor environments, or can we prevent the spread of infection?
Indoor Air 16, 335-47.
MORETRO, T. & LANGSRUD, S. 2017. Residential bacteria on surfaces in the food industry and their
implications for food safety and quality. Comprehensive Reviews in Food Science and Food Safety 16,
1022-42.
MUELLER, M. & NIDETZKY, B. 2010. Orthophosphate binding at the dimer interface of
Corynebacterium callunae starch phosphorylase: mutational analysis of its role for activity and stability
of the enzyme. BMC Biochemistry 11, 8-11.
MULET, M., LALUCAT, J. & GARCIA-VALDES, E. 2010. DNA sequence-based analysis of the
Pseudomonas species. Environmental Microbiology 12(6), 1513-30.
NADEEM, S.M., AHMAD, M., ZAHIR, Z.A., JAVAID, A. & ASHRAF, M. 2014. The role of mycorrhizae
and plant growth promoting rhizobacteria (PGPR) in improving crop productivity under stressful
environments. Biotechnology Advantages 32(2), 429-48.
NAKASE, T., KOMAGAT, K. & FUKAZA, Y. 1976. Candida pseudointermedia sp. nov., isolated from
‘Kamaboko’, a traditional fish-paste product in Japan. Journal of Genetic Applied Microbiology 22, 177-
82.
NATIONAL ADVISORY COMMITTEE ON MICROBIOLOGICAL CRITERIA FOR FOODS. 2018.
Response to questions posed by the Department of Defence regarding microbiological criteria as
indicators of process control or insanitary conditions. Journal of Food Protection 81(1), 115-41.
NAZAROFF, W.W. 2016. Indoor bioaerosol dynamics. Indoor Air, 61-78.
NOBLE, W.C. 1975. Dispersal of skin microorganisms. Br Journal Dermatology 93, 477-85.
NOVAKOVA, D., SEDLACEK, I., PANTUCEK, R., STETINA, V., SVEC, P. & PETRAS, P. 2006.
Staphylococcus equorum and Staphylococcus succinus isolated from human clinical specimens.
Journal of Medical Microbiology 55, 523-28.
© Central University of Technology, Free State

C h a p t e r 4
141
NUNES, C., USALL, J., TEIXIDO, N., FONS, E. & VINAS, I. 2002. Post-harvest biological control by
Patoea agglomerans (CPA-2) on Golden Delicious apples. Journal of Applied Microbiology 92, 247-55.
NWODO, U., GREEN, E. & OKOH, A. 2012. Bacterial EPS: functionality and prospects. International
Journal Molecular Science 13, 14002-015.
OTTO, M. 2013. Staphylococcus epidermidis Pathogenesis. Molecular Biology 1106, 17-31.
PALMER, M., DE MAAYER, P., POULSEN, M., STEENKAMP, E.T., VAN ZYL, E., COUTINHO, T.A. &
VENTER, S.N. 2016. Draft genome sequences of Pantoea vagans isolates associated with termites.
Standard in Genomic Sciences 11, 23-31.
PANTUCEK, R., SVEC, P., DAJCS, J.J., MACHOVA, I., CERNOHLAVKOVA, J., SEDO, O.,
GELBICOVA, T., MASLANOVA, I., DOSKAR, J., ZDRAHAL, Z., RUZICKOVA, V. & SEDLACEK, I.
2013. Staphylococcus petrasii sp. nov. including S. petrasii subsp. petrasii subsp. nov. and S.petrasii
subsp. croceilyticus subsp. nov., isolated from human clinical specimens and human ear infections.
Systematic and Applied Microbiology 36, 90-95.
PASQUARELLI, F., SPERA, A., CANTARELLA, L. & CANTARELLA, M. 2015. Biodegradation of
bromoxynil using the cascade enzymatic system nitrile hydratase/amidase from Microbacterium
imperial CBS 498-74. Comparison between free enzymes and resting cells. RSC Advances 46, 201-09.
PLACE, R.B., HIESTAND, D., GALLMANN, H.R. & TEUBER, M. 2003. Staphylococcus equorum
subsp. lines, subsp. nov.: a starter culture component for surface ripened semi-hard cheeses. System
Applied Microbiology 26, 30-37.
PLOCINICZAK, T., SINKKONEN, A., ROMANTSCHUK, M., SULOWICZ, S. & PIOTROWSKA-SEGET,
Z. 2016. Rhizospheric bacterial strain Brevibacterium casei MH8a colonizes plant tissues and enhances
Cd, Zn, Cu phytoextraction by white mustard. Frontiers in Plant Science 251-255.
PRIYADHARSSHINI, S., GOPINATH, V., PRIYADHARSSHINI, N.M., ALI, D.M. & VELUSAMY, P.
2012. Synthesis of anisotropic silver nanoparticles using novel strain Bacillus flexus and its biomedical
application. Colloids and Surfaces B: Biointerfaces 102, 232-37.
QIAN, J., HOSPODSKY, D., YAMAMOTO, N., NAZAROFF, W.W. & PECCIA, J. 2012. Size-resolved
emission rates of airborne bacteria and fungi in an occupied classroom. Indoor Air 22, 339-51.
© Central University of Technology, Free State

C h a p t e r 4
142
QIAN, J., PECCIA, J. & FERRO, A.R. 2014. Walking-induced particle resuspension in indoor
environments. Atmosphere Environment 89, 464-81.
QUINN, L., AILSWORTH, M., MATTHEWS, E., KELLAMS, A. & SHIRLEY, D-A. 2018. Serratia
marcesecens colonization causing pink breast milk and pink diapers: a case report and literature
review. Breastfeeding Medicine 13(5), 629-48.
QUINTO, C.A., MOHINDRA, P., TONG, S. & BAO, G. 2015. Multifunctional superparamagnetic iron
oxide nanoparticles for combined chemotherapy and hyperthermia cancer treatment. Nanoscale 0, 1-3.
RAFFERTY, B., DOLGILEVICH, S., KALACHIKOV, S., MOROZOVA, I., JU, J., WHITTIER, S.,
NOWYGROD, R. & KOZAROV, E. 2011. Cultivation of Enterobacter Hormaechei from human
atherosclerotic tissue. Journal of Atherosclerosis and Thrombosis 18(1), 72-82.
RAMESH, A., SHARMA, S.K., SHARMA, M.P., YADAV, N. & JOSHI, O.P. 2013. Inoculation of zinc
solubilizing Bacillus aryabhattai strains for improved growth, mobilization and biofortification of zinc in
soybean and wheat cultivated in Vertisols of central India. Applied Soil Ecology 73, 87-96.
RASSMUSSEN, M. 2016. Aerococcus: an increasingly acknowledged human pathogen. Clinical
Microbiology Infection 22, 22-27.
REZZONICO, F., BINDER, C., DEFAGO, G. & MOENNE-LOCCOZ, Y. 2005. The Type III secretion
system of biocontrol Pseudomonas fluorescens KD target the phytopathogenic chromista Pythium
ultimun and promotes cucumber protection. MPMI 9, 991-1001.
RITTENOUR, W.R., HAMILTON, R.G., BEEZHOLD, D.H. & GREEN, B.J. 2012. Immunologic,
spectrophotometric and nucleic acid based methods for the detection and quantification of airborne
pollen. Journal of Immunologic Methods 383(1-2), 47-53.
RODRIGUES, J., CANET, A., RIVERA, I., OSORIO, N.M., SANDOVAL, G., VALERO, F. & FEREIRA-
DIAS, S. 2016. Biodiesel production from crude Jatropha oil catalysed by non-commercial immobilized
heterologous Rhizopus oryzae and Carica papaya lipases. Bioresource Technology 213, 88-95.
ROJO, M.C., PALAZZOLO, C.T., CUELLO, R., GONZALEZ, M., GUEVARA, F., PONSONE, M.L.,
MERCADO, L.A., MARTINEZ, C. & COMBINA, M. 2017. Incidence of osmophilic yeasts and
Zygosaccharomyces rouxii during the production of concentrate grape juices. Food Microbiology 64, 7-
14.
© Central University of Technology, Free State
C h a p t e r 4
143
RONNING, H.T., MADSLIEN, E.H., ASP, T.N. & GRANUM, P.E. 2015. Identification and quantification
of lichenysin: a possible source of food poisoning. Food Additives & Contaminants: Part A 32(12),
2120-2130.
ROONEY, A.P., PRICE, N.P.J., EHRHARDT, C., SWEZEY, J.L. & BANNAN, J.D. 2009. International
Journal of Systematic and Evolutionary Microbiology 59, 2429-36.
ROSA, R., MILLS, J. & MUNOZ-PRICE, L.S. 2015. Clinical and microbiological characteristics of
Acinetobacter lwoffii Bacteremia compared with Acinetobacter baumannii. Open Forum Infectious
Diseases 2, 1780-90.
SAJNA, K.V., SUKUMARAN, R.K., GOTTUMUKKALA, L.D. & PANDEY, A. 2015. Crude oil
biodegradation aided by biosurfactants from Pseudozyma spp. NII 08165 or its culture broth.
Bioresource Technology 191, 133-39.
SAMANTA, S.K., SINGH, O.V. & JAIN, R.K. 2002. Polycyclic aromatic hydrocarbons: environmental
pollution and bioremediation. Trends in Biotechnology 20, 243-48.
SARANRAJ, P. & GEETHA, M. 2011. Microbial spoilage of bakery products and its control by
preservatives. International Journal of Pharmaceutical & Biological Archives 3(1), 38-48.
SARAVANAN, M., VEMU, A.K. & BARIK, S.K. 2011. Rapid biosynthesis of silver nanoparticles from
Bacillus megaterium (NCIM 2326) and their antibacterial activity or multi-drug resistant clinical
pathogens. Biointerfaces 88, 325-31.
SAVINI, V., CATVITELLO, C., BIANCO, A., BALBINOT, A. & ANTONIO, D.D. 2009. Epidemiology,
pathogenicity and emerging resistance in Staphylococcus pasteuri: from mammals and lamprey, to
man. Recent Patents on Anti-Infective Drug Discovery 4, 123-29.
SEILER, H., SCHMIDT, V., WENNING, M. & SCHERER, S. 2012. Bacillus kochii sp. nov., isolated from
food and pharmaceuticals manufacturing site. International Journal of Systematic and Evolutionary
Microbiology 62, 1092-97.
SHALE, K. & LUES, J.F.R. 2007. The etiology of bioaerosols in food environments. Food Reviews
International 23, 73-90.
SHENG-YUAN, R., JUNG-YIEN, C., YI-CHUNG, H. & PO-REN, H. Catheter-related fungemia caused
by Candida intermedia. International Journal of Infectious Diseases 14, 147-49.
© Central University of Technology, Free State
C h a p t e r 4
144
SHIELDS, B.E., TSCHETTERM, A.J. & WANAT, K.A. 2016. Staphylococcus simulans: an emerging
cutaneous pathogen. JAAD Case Reports 2(6), 428-30.
SHRIVASTAVA, P. & KUMAR, R. 2014. Soil salinity: a serious environmental issue and plant growth
promoting bacteria as one of the tools for its alleviation. Saudi Journal of Biological Sciences 22(2),
123-131.
SHYAMALA, R. & RAO, J. 2015. Incidence of Pseudomonas species in urinary tract infection in a
tertiary care hospital. Journal of Microbiology and Biotechnology Research 5(1), 11-13.
SILVA, M.G., FURTADO, N.A.J.C., PUPO, M.T., FONSECA, M.J.V., SAID, S., da SILVA FILHO, A.A. &
BASTON, J.K. 2004. Antibacterial activity from Penicillium corylophilum. Microbiological Research 159,
317-22.
SINGH, B.K. & TRIVED, P. 2017. Microbiome and the future for food and nutrient security. Microbial
Biotechnology 10(1), 50-53.
SINGH, P., KIM, Y.J., SINGH, H., WANG, C., HWANG, K.H., FARH, M.E-A. & YANG, D.C. 2015
Biosynthesis, characterization, and antimicrobial applications of silver nanoparticles. International
Journal of Nanomedicine 10, 2567-77.
SINGH, R., SINGH, P. & SHARMA, R. 2013. Microorganism as a tool of bioremediation technology for
cleaning environment: a review. Proceedings of the International Academy of Ecology and
Environmental Sciences 4(1), 1-6.
SONJAK, S., FRISVAD, J.C. & GUNDE-CIMERMAN, N. 2005. Comparison of secondary metabolite
production by Penicillium crustosum strains, isolated from Artic and other various ecological niches.
FEMS Microbiology Ecology 53(1), 51-60.
SORENSEN, W.G., JONES, W., SIMPSON, J. & DAVIDSON, J.I. 1984. Aflatoxin in respirable airborne
peanut dust. Journal of Toxicology and Environmental Health 14, 525-33.
SOSA, M.J., CORDOBA, J.J., DIAZ, C., RODRIGUEZ, M., BERMUDEZ, E., ASENSIO, M.A. & NUNEZ,
F. 2002. Production of Cyclopiazonic Acid by Penicillium commune isolated from dry-cured ham on a
meat extract-based substrate. Journal of Food Protection 65, 988-92.
© Central University of Technology, Free State

C h a p t e r 4
145
SOWIAK, M., BRODKA, K., KOZAJDA, A., BUCZYNSKA, A. & SZADKWOSKA-STANCZYK, I. 2012.
Fungal aerosol in the process of poultry breeding quantitative and qualitative analyses. Medycyna
Pracy 63(1), 1-10.
SPANG, A., SAW, J.H., JORGENSEN, S.L., ZAREMBA-NIEDZWIEDZKA, K., MARTIJIN, J., LIND,
A.E., VAN EIJK, R., SCHLEPER, C., GUY, L. & ETTEMA, T.J.G. 2015. Complex archaea that bridge
the gap between prokaryotes and eukaryotes. Nature 521, 173-79.
SPELLBERG, B. 2017. Mucormycosis pathogenesis: beyond Rhizopus. Virulence 8(8), 1481-82.
SU, X., ZHANG, Q., HU, J., HASHMI, M.Z., DING, L. & SHEN, C. 2014. Enhanced degradation of
biphenyl from PCB-contaminated sediments: the impact of extracellular organic matter from
Micrococcus luteus. Applied Microbiology and Biotechnology 99, 1989-2000.
SWANSON, K.M.J., BUSTA, F.F., PETERSON, E.H. & JOHNSON, M.G. 1992. Colony count methods.
In: C. Vanderzant & D.F. Splittstoesser (Eds.). Compendium of methods for the microbiological
examination of foods. 3rd edition. Washington, DC: American Public Health Association, 75-95.
THOMSEN, S.T., LONDONO, J.E.G., AMBYE-JENSEN, M., HEISKE, S., KADAR, Z. & MEYER, A.S.
2016. Combination of ensiling and fungal delignification as effective wheat straw pre-treatment.
Biotechnologies Biofuels 9(16) 24-34.
TOMINAGA, T., AN, S.Y., OYAIZU, H. & YOKOTA, A. 2009. Sporosarcina luteola sp. nov. isolated from
soy sauce production equipment in Japan. Journal of Genetic Applied Microbiology 55, 217-223.
TRIVEDL, M.K., BRANTON, A., TRIVEDL, D., NAYAK, G., MONDAL, S.C. & JANA, S. 2015.
Antimicrobial sensitivity, biochemical characteristics and biotyping of Staphylococcus saprophyticus: an
impact on biofield energy treatment. Journal of Women’s Health Care 4(6), 270-276.
TROFA, D., GACSER, A. & NOSANCHUK, J.D. 2008. Candida parapsilosis, an emerging fungal
pathogen. Clinical Microbiology Reviews 21, 606-625.
VAISHAMPAYAN, P., PROBST, A., KRISHNAMURTHI, S., GHOSH, S., OSMAN, S., MCDOWALL, A.,
RUCKMANI, A., MAYILRAJ, S. & VENKATESWARAN, K. 2010. Bacillus horneckiae sp. nov., isolated
for a spacecraft-assembly clean room. International Journal of Systematic and Evolutionary
Microbiology 60, 1031-37.
© Central University of Technology, Free State

C h a p t e r 4
146
VENTER, P., LUES, J.F.R. & THERON, H. 2004. Quantification of bioaerosols in automated chicken
egg production plants. Poultry Sciences 83, 1226-31.
VIEGAS, C., MONTEIRO, A., CAROLINE, E. & VIEGAS, S. 2018. Occupational exposure to bioburden
in Portuguese bakeries: an approach to sampling viable microbial load. Arh Hig Rada Toksikol 69, 250-
57.
WALSER, S.M., BRENNER, B., HEINZE, S., SZEWZYK, R., WOLTER, E. & HERR, C.E.W. 2017.
Environmental health relevance of airborne microorganisms in ambient and indoor air.
Bundesgesundheitsblatt 60(6), 618-24.
WANG, C-H., CHEN, B.T., HAN, B-C., LIU, A, C-Y., HUNG, P-C., CHEN, C-Y. & CHAO H.J. 2015.
Field evaluation of personal sampling methods for multiple bioaerosols. PLOS ONE 10(3), 308-27.
WEI, K., ZHENG, Y., LI, J., SHEN, F., ZOU, Z., FAN, H., LI, X., WU, C & YAO, M. 2015. Microbial
aerosol characteristics in highly polluted and near-pristine environments featuring different climatic
conditions. Scientific Bulletin 60(16), 1439-47.
WHITE, T.J., BRUNS, T., LEE, S. & TAYLOR, J.W. 1990. Amplification and direct sequencing of fungal
ribosomal RNA genes for phylogenetic PCR protocols: a guide to methods and applications, 315-22.
WIESER, M., SCHUMANN, P., MARTIN, K., ALTENBURGER, P., BURGHARDT, J., LUBITZ, W. &
BUSSE, H.J. 1999. Agrococcus citreus sp. nov., isolated from a medieval wall painting of the chapel of
Castle Herberstein (Austria). International Journal of Systematic Bacteriology 49, 1165-70.
WIGMANN, E.F., SACCOMORI, F., BERNARDI, A.O., FRISVAD, J.C. & COPETTI, M.V. 2015.
Toxigenic penicillia spoiling frozen chicken nuggets. Food Research International 67, 219-22.
WIJNAND, E., DICK, H., DUCHAINE, C. & GREEN, B.J. 2012. Bioaerosol exposure assessment in the
workplace: the past, present and recent advances. Journal of Environmental Monitoring 14, 334-39.
WISCHMEYER, P.E., Mc DONALD, D. & KNIGHT, R. 2016. Role of the microbiome, probiotics, and
symbiosis therapy in critical illness. Critical Care 22(4), 347-54.
WONG, D., NIELSEN, T.B., BONOMO, R.A., PANTAPALANGKOOR, P., LUNA, B. & SPELLBERG, B.
2017. Clinical and pathophysiological overview of Acinetobacter infections: a century of challenges.
American Society for Microbiology 30(1), 409-48.
© Central University of Technology, Free State

C h a p t e r 4
147
WRENT, P., RIVAS, E-M., GIL DE PRADO, E., PEINADO, J.M. & DE SILONIX, M-I. 2015. Assessment
of the factors contributing to the growth or spoilage of Meyerozyma guilliermondii in organic yoghurt:
comparison of methods for strain differentiation. Microorganisms 3, 428-40.
WU, B., MENG, K., WEI, L., CAI, Y. & CHAI, T. 2017. Seasonal fluctuations of microbial aerosol in live
poultry markets and the detection of endotoxins. Frontiers Microbiology, 69-78.
XIA, X., WANG, J., JI, J., ZHANG, J., CHEN, L. & ZHANG, R. 2015. Bacterial communities in marine
aerosols revealed by 454 pyrosequencing of the 16S rRNA gene. American Meteorological Society 72,
2997-3008.
YANG, Q., ANGLY, F.E., WANG, Z. & ZHANG, H. 2011. Wastewater treatment systems harbour
specific and diverse yeast communities. Biochemical Engineering Journal 58, 168-76.
YASSIN, M.F. & ALMOUQATEA, S. 2010. Assessment of airborne bacteria and fungi in an indoor and
outdoor environment. International Journal of Environmental Science Technology 7(3), 535-44.
YOO, K., LEE, T.K., CHOI, E.J., YANG, J., SHUKLA, S.K., HWANG, S. & PARK, J. 2017. Molecular
approaches for detection and monitoring of microbial communities in bioaerosols: a review. Journal of
Environmental Science 51, 234-47.
YOON, J.H., LEE, K.C., WEISS, N., KANG, K.H. & PARK, Y.H. 2003. Jeotgalicoccus halotolerans gen.
nov., sp. nov. and Jeotgalicoccus psychrophilus sp. nov. isolated from the traditional Korean fermented
seafood jeotgal. International Journal of Systematic Bacteriology 53, 595-602.
YOU, R. 2013. Measuring the short-term emission rates of particles in the “personal cloud” with
different clothes and activity intensities in a sealed chamber. Aerosol Air Quality Research 13, 911-21.
YU, O.H.Y., KEET, A.W.W., SHEPPARD, D.C. & BREWER, T. 2010. Articular aspergillosis: case report
and review of the literature. International Journal of Infected Diseases 14, 433-35.
ZAGO, C.E., SILVA, S., SANITA, P.V., BARBGLI, P.A., DIAS, C.M.I., LORDELLO, V.B. & VERGANI,
C.E. 2015. Dynamics of biofilm formation and the interaction between Candida albicans and Methicillin-
susceptible (MSSA) and Resistant Staphylococcus aureus (MRSA). PLOS ONE, 19-26.
ZALAR, P., GOSTINCAR, C., DE HOOG, G.S., URSIC, V., SUDHADHAM, M. & GUNDE-CIMERMAN,
N. 2008. Redefinition of Aurobasidium pullulans and its varieties. Studies in Mycology 61, 21-38.
© Central University of Technology, Free State
C h a p t e r 4
148
ZEMOURI, C., DE SOET, H., CRIELAARD, W. & LAHEIJ, A. 2017. A scoping review on bio-aerosols in
healthcare and the dental environment. PLOS ONE, 50-75.
ZHANG, J., WANG, J., FANG, C., SONG, F., XIN, Y., QU, L. & DING, K. 2010. Bacillus
oceanisediminis sp. nov., isolated from marine sediment. International Journal of Systematic and
Evolutionary Microbiology 60, 2924-29.
ZHANG, J.Y., LIU, X.Y. & LIU, S.J. 2010. Agrococcus terreus sp. nov. and Micrococcus terreus sp.
nov., isolated from forest soil. International Journal of Systematic and Evolutionary Microbiology 60,
1897-1903.
ZHANG, Y., CROUS, P.W., SCHOCH, C.L. & HYDE, K.D. 2012. Pleosporales. Fungal Diversity 53, 1-
221.
ZHEN, Q., DENG, Y., WANG, Y., WANG, X., ZHANG, H., SUN, X. & OUYSNG, Z. 2017.
Meteorological factors had more impact on airborne bacterial communities than air pollutants. Science
of the Total Environment 601, 703-12.
© Central University of Technology, Free State

149
CHAPTER 5
CULTURE-INDEPENDENT ANALYSES OF THE
BIOAEROSOL MICROBIOME IN FRUIT JUICE
© Central University of Technology, Free State
C h a p t e r 5
150
5.1. A Critical Assessment
The term ‘bioaerosols’ is used to refer to all the particles originating from a biological source that are in
suspension in the air. This includes microorganisms such as bacteria, fungi, viruses, protozoa and
algae as well as biomolecules such as aflatoxins, mycotoxins, and debris from membranes (Wery,
2014). One way of studying the identity, behaviour, movement and survival of such airborne organic
particles that are passively transported in the atmosphere is through the field of aerobiology.
Aerobiology seeks to understand interactions between biological aerosols and the atmosphere,
including the role of weather and climate in what has been described as the aerobiology pathway
(Beggs et al., 2017).The impact of aerobiology is especially notable in such diverse basic applied
sciences as allergology, bioclimatology, palynology, biological pollution, biological warfare and
terrorism, mycology, biodiversity studies, ecology, plant pathology, microbiology, indoor air quality,
biological weathering, industrial aerobiology, and cultural heritage (Despres et al., 2012).
Epidemiological and toxicological studies have indicated a close association between exposure to
bioaerosols and many adverse health effects such as infectious diseases, acute toxic effects, allergies
and cancer. Therefore, exposure to bioaerosols is a crucial occupational and environmental health
issue that warrants close attention (Li et al., 2017; Wang et al., 2015) not only through of aerobiological
studies, but also by finding novel ways of monitoring air quality and determining the specific risks
associated with bioaerosols detected in various industries.
Bioaerosol monitoring is useful for controlling air quality, assessing possible product exposure,
identifying emission sources, and estimating the performance of air cleaning devices (Park et al., 2015).
Bioaerosols can be isolated from the environment using various methods that either enumerate viable
bioaerosols (i.e., culture-dependent methods), or that involve the collection of viable but non-culturable
bioaerosols (i.e., culture-independent methods). Microorganisms may lose the ability to grow (or to be
cultured) during the sampling proses due to damaging of the cells during sampling, microbial
competition, and unfavourable growth conditions. There is a risk that the inability of microorganisms to
grow (or to be cultured) may be wrongly attributed to underperforming bioaerosol samplers, which may
result in their efficiency being underestimated. Therefore, culturability losses need to be determined to
give an improved overall picture (Zhao et al., 2011). A culture-based, colony-counting method is the
most widely used analytical technique for monitoring bioaerosols. However, this method requires
several days for colony formation, which is one of its most debilitating limitations. In addition, the
culture-based method is only applicable to: (i) microbes that are culturable using specific growth
conditions; (ii) culturable microbes that can divide at a sufficient rate to form colonies; and (iii) can
© Central University of Technology, Free State

C h a p t e r 5
151
survive the stress of aerosolization and sampling. The latter method could underestimate the number of
cells due to the presence of viable but non-culturable cells that have the ability to proliferate under more
favourable conditions (Alvarez et al., 1995; Tringe & Hugenholtz, 2008).
While culture-dependent methods must be used to isolate new strains of potential interest and give
quantitative counts of viable microorganisms, research has indicated that culture-dependent methods
may underestimate the overall diversity of the microbial community present in different ecosystems
(Motato et al., 2017). Culture-independent analysis enables the examination of culturable as well as
non-culturable bioaerosols, viable and dead cells, and plant and animal fragments. To analyse
biological aerosols with molecular genetic tools, bioaerosols need to be collected on appropriate air
filters and the deoxyribonucleic acid (DNA) needs to be extracted. The basis for most molecular
analysis techniques is the successful extraction of DNA. DNA extraction protocols vary according to the
type of tissue undergoing extraction and extractions are therefore performed using a method specific to
a particular organism or tissue type. Therefore, ambient samples, which include a mixture of many
types of biological material, may lead to the underestimation of some bioaerosols (Park et al., 2015).
Filtration is one of the most widely used atmospheric bioaerosol sampling methods; however, it has
various limitations for the collection of bioaerosols (Xu & Yao, 2013). On the other hand, the
SAMPL’AIR LITE air sampler has been extensively used to monitor bioaerosol concentrations (Gorny et
al., 1999; Kim & Kim, 2007; Meklin et al., 2002; Nasir & Colbeck, 2010; Sanchez-Monedero et al., 2005;
Xu & Yao, 2013). Although airborne microbes in certain environments have been reported,
comparisons among them are rather limited. Moreover, most of these studies were limited to the total or
culturable aerosol concentration while information about bioaerosol diversity in different environments is
lacking. Polymerase chain reaction denaturing gradient gel electrophoresis (PCR-DGGE) has been
widely used for profiling environmental or food-associated microbial ecosystems (Laforgue et al., 2009;
Osimani et al., 2016; Xie et al., 2018). These molecular methods have been successfully used to
describe the bacterial, yeast and mould communities found in meat, dairy products, fruit juice and
various other ecosystems such as aerosols (Cocolin et al., 2001; Ercolini et al., 2001; Ndiaye et al.,
2016; Nieguitsila et al., 2007; Ogier et al., 2002). PCR-DGGE is also a powerful molecular method for
rapid detection of microbial community changes or for comparative analyses of environmental samples,
and it offers more accurate information about the distribution and composition of microbial species
present in bioaerosols (Aydin et al., 2015).
However, the various sampling and identification methods mentioned above are of no use without
considering the layout of the facility, the product being produced, and the assessment of personnel
© Central University of Technology, Free State
C h a p t e r 5
152
working in the facility. Moreover, a lack of standardised sampling/analysis methods for each product, or
at least each industry, also makes the determination of a relevant exposure guideline difficult (Wang et
al., 2015). Current bioaerosol research thus primarily focused on the monitoring and control of ambient
or target bioaerosols. A better understanding of the composition and concentration of bioaerosols in
various environments is therefore needed. For example, there are different sets of factors that affect
bioaerosol composition and concentration in indoor versus outdoor environments (Soleimani et al.,
2016). Also, the effective monitoring of bioaerosols requires efficient collection of microorganisms from
the air, and thus an appropriate air sampling technique for a specific industry must be selected (Yoo et
al., 2017).
To investigate the true reflection of bioaerosols in the air, a detailed assessment study is necessary
using the following steps: (i) pre-sampling assessment; (ii) a sampling process (i.e., the collection of
bioaerosols with samplers); and (iii) a post-sampling process (i.e., the air sample handling procedure)
(Yoo et al., 2017; Zhao et al., 2011). The aim of this phase of the study was therefore to determine the
non-culturable fraction of bacterial, yeast and mould diversity during the peak and off-peak seasons in
the selected fruit juice manufacturing plant and to compare the data to results obtained when only the
culturable fraction was determined. An attempt was therefore made to create the same baseline as the
culture-dependent sampling by standardising the sampling conditions as far as possible for culture-
independent sampling.
5.2. Materials and Methods
5.2.1. Sampling
Two SAMPL’AIR LITE (AES Chemunex, United States) air samplers were used to collect culture-
independent bioaerosols in the fruit juice production plant referred to in earlier chapters. All sampling
was performed in duplicate before production and during the peak and off-peak seasons at the facility.
Five distinct areas were identified to ensure a holistic representation of the facility. These areas were:
the entrance to the production area (Area 1), the area for the preparation and mixing of materials (Area
2), the area between the production lines (Area 3), the area for the dispersion of bottles (Area 4), and
the area where the bottles were filled with the final product (Area 5). The air samplers operated at a
flow rate of 100 litres per minute. The air samplers were disinfected with ethanol when changing from
sampling point to sampling point. The samplers were turned on for two minutes prior to sampling to
allow the ethanol to evaporate. Air samples were taken at a height of 1.5 m from the ground, which is
the same level as the working stations in the centre of each area. For culture-independent sampling,
Hydrophilic Polypropylene Membrane Filters (25 mm in diametre and 0.2 µm pore size) (Pall
© Central University of Technology, Free State

C h a p t e r 5
153
Corporation) were placed directly on the media in the agar plates to ensure that precise conditions were
met that would be similar for the culture-dependent sampling method. After 20 min, the samplers were
turned off, the filters were removed from the centre of the sterile petri dishes using sterile forceps, and
placed in sterile falcon tubes. Immediately after collection, the samples were transported to the
laboratory where the filters were stored at -20°C until analysis.
5.2.2. Strategies for the total community DNA extraction and PCR amplification
A comprehensive literature review was conducted to determine which filters and DNA extraction kits
had been used successfully in culture-independent bioaerosol investigations. The following criteria
were subsequently used to organise the data: (i) filter type; (ii) pore size; (iii) flow rate of sampler; (iv)
sampling period; (v) extraction method; (vi) identification method; and (vii) bioaerosols targeted. Several
successful extractions of bioaerosol DNA were conducted (Table 5.4) using various techniques. With
reference to the successful extractions of bioaerosol DNA, four commercial DNA extraction kits and one
manual harsh lysis extraction method were compared to extract total genomic DNA from the Hydrophilic
Polypropylene Membrane Filters used for sampling (5.2.1) (Table 5.5). The commercial extraction kits
were used following the manufacturers’ instructions and the protocol for harsh lysis extraction as
described by Labuschagne and Albertyn (2007). Based on the results presented later in Table 5.5, the
most appropriate extraction/analysis methods were selected for this study.
Total genomic DNA extracted from each filter sample was used as a template for PCR to amplify the
16S, 18S and D1/D2 domains of the 26S rRNA genes. As a quality measure, unused filters were stored
and analysed as controls. No contamination was observed. For the analyses of bacterial, yeast and
mould diversity, different primer sets were used to target the 16S (1 300 bp), 18S (1792 bp) and
D1/D2 domains of the 26S (600 bp) rRNA genes (Table 5.1). The PCR was carried out in a total
volume of 50 µl, containing 5 µl template DNA, 1X ThermoPol reaction buffer, 0.2 mM dNTPs, 0.52
µM of each primer, and 1 unit of Taq DNA polymerase (New England Biolabs). Reaction conditions are
presented in Table 5.2 and Table 5.3. Successful amplification was verified by separating PCR
products on a 1% agarose gel stained with 0.05% Ethidium bromide and visualised with exposure to
UV light. Digital images were captured with the Molecular Imager® Gel Doc™ XR system (BioRad
Laboratories Inc.).
Where low product yield was observed for the direct amplification, a pre-amplification approach was
attempted to increase yield. The extracted DNA was enhanced by pre-amplifying 1 µl of gDNA using
the SSoAdvanced™ PreAmp Supermix (BioRad Laboratories Inc.) and a 50 nM mixture of all specified
© Central University of Technology, Free State
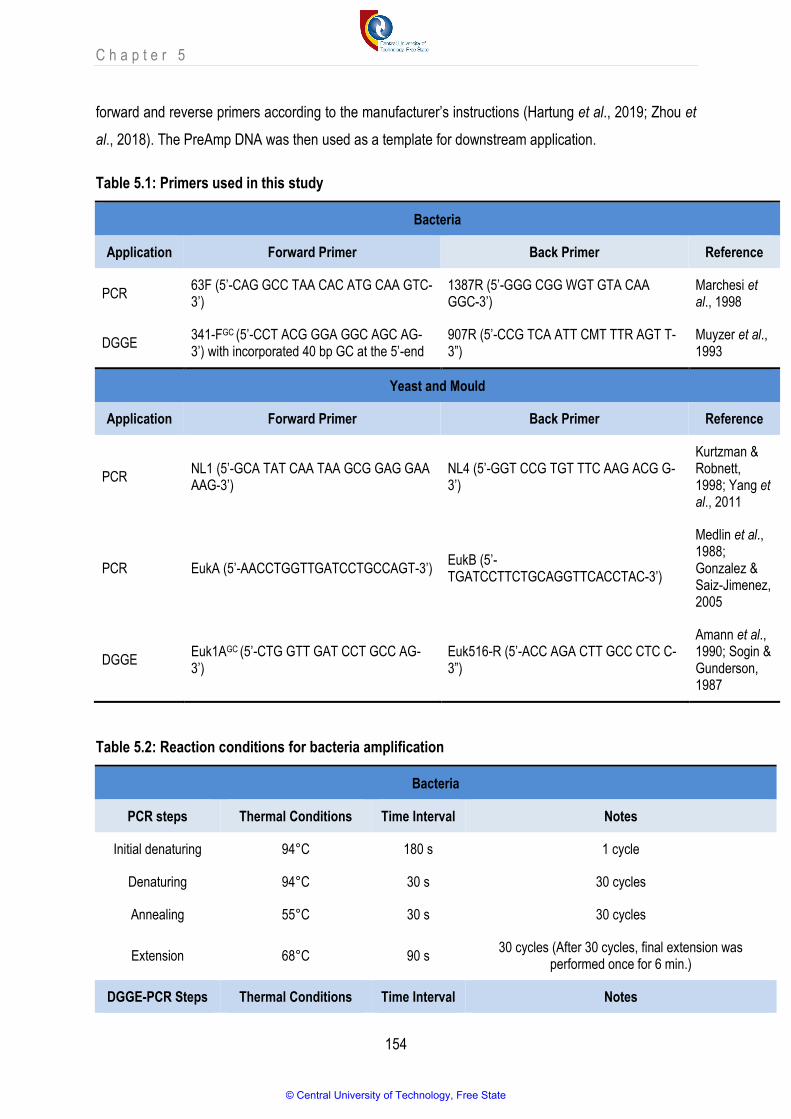
C h a p t e r 5
154
forward and reverse primers according to the manufacturer’s instructions (Hartung et al., 2019; Zhou et
al., 2018). The PreAmp DNA was then used as a template for downstream application.
Table 5.1: Primers used in this study
Bacteria
Application Forward Primer Back Primer Reference
PCR 63F (5’-CAG GCC TAA CAC ATG CAA GTC-3’)
1387R (5’-GGG CGG WGT GTA CAA GGC-3’)
Marchesi et al., 1998
DGGE 341-FGC (5’-CCT ACG GGA GGC AGC AG-3’) with incorporated 40 bp GC at the 5’-end
907R (5’-CCG TCA ATT CMT TTR AGT T-3”)
Muyzer et al., 1993
Yeast and Mould
Application Forward Primer Back Primer Reference
PCR NL1 (5’-GCA TAT CAA TAA GCG GAG GAA AAG-3’)
NL4 (5’-GGT CCG TGT TTC AAG ACG G-3’)
Kurtzman & Robnett, 1998; Yang et al., 2011
PCR EukA (5’-AACCTGGTTGATCCTGCCAGT-3’) EukB (5’-TGATCCTTCTGCAGGTTCACCTAC-3’)
Medlin et al., 1988; Gonzalez & Saiz-Jimenez, 2005
DGGE Euk1AGC (5’-CTG GTT GAT CCT GCC AG-3’)
Euk516-R (5’-ACC AGA CTT GCC CTC C-3”)
Amann et al., 1990; Sogin & Gunderson, 1987
Table 5.2: Reaction conditions for bacteria amplification
Bacteria
PCR steps Thermal Conditions Time Interval Notes
Initial denaturing 94°C 180 s 1 cycle
Denaturing 94°C 30 s 30 cycles
Annealing 55°C 30 s 30 cycles
Extension 68°C 90 s 30 cycles (After 30 cycles, final extension was
performed once for 6 min.)
DGGE-PCR Steps Thermal Conditions Time Interval Notes
© Central University of Technology, Free State

C h a p t e r 5
155
Initial denaturing 95°C 300 s 1 cycle
Denaturing 95°C 45 s 30 cycles
Annealing 55°C 45 s 30 cycles
Extension 68°C 60 s 30 cycles (After 30 cycles, final extension was
performed once for 7 min.)
Table 5.3: Reaction conditions for yeast and mould amplification
Yeast and Mould
PCR Steps Thermal Conditions Time Interval Notes
Initial denaturing 95°C 180 s 1 cycle
Denaturing 95°C 30 s 30 cycles
Annealing 55°C 30 s 30 cycles
Extension 68°C 60 s 30 cycles (After 30 cycles, final extension was
performed once for 6 min.)
DGGE-PCR Steps Thermal Conditions Time Interval Notes
Initial denaturing 94°C 130 s 1 cycle
Denaturing 94°C 30 s 35 cycles
Annealing 56°C 45 s 35 cycles
Extension 68°C 130 s 35 cycles (After 35 cycles, final extension was
performed once for 5 min.)
A nested approach was then used to amplify shorter fragments for DGGE analysis. A 606 bp section
of 16S and a 600 bp of 18S rRNA gene were amplified using primer pairs 341-FGC/907RM and
Euk1AGC/Euk516-R respectively (Table 5.1). Amplification reactions were performed in a total volume of
50 µl with reaction constituents and conditions as described previously (Table 5.2 and Table 5.3). In
order to reduce possible inter-sample PCR variation, two sets of PCRs were performed as independent
duplicates and pooled before loading on the DGGE gel. DNA fragments were separated on a 2%
agarose gel, stained, and visualised under UV light.
5.2.3. Denaturing gradient gel electrophoresis
DGGE analyses were performed on 30 µl of the 606 bp GC-clamped PCR fragments for the 16S
rRNA gene and 600 bp GC-clamped PCR fragments for the 18S rRNA gene using the D-Code
© Central University of Technology, Free State
C h a p t e r 5
156
Universal Mutation Detection System (BioRad Laboratories) essentially as described by Muyzer and co-
workers (1993) and Sogin and Gunderson (1987). Several attempts were made to optimise the DGGE
resolution by varying the polyacrylamide concentration (7%, 8% and 10%), urea gradient (40-60% and
40-50%), and the electrophoresis parameters (for 4.5 h at 130 V at 60°C, for 5 h at 130 V at 60°C, for 5
h at 200 V at 60°C, and for 12 h at 130 V at 60°C). Samplers were finally applied to 8% (w/v)
polyacrylamide gels (acrylamide/bis 37.5:1) in 1X TAE buffer. Optimal separation was achieved with a
40-60% urea-formamide denaturing gradient (100% denaturant corresponds to 7 M urea and 40% [v/v]
formamide). Electrophoresis was carried out for 5 h at 130 V at 60°C. Gels were stained with 0.05%
GelStar® (Lonza) for 15 min, rinsed with ultra-pure water, and photographed while exposed to UV light.
DGGE digital images were captured on the Molecular Imager Gel Doc™ XR and analysed with the
Quantity One® 1-D analysis imaging software (BioRad Laboratories). Densitometric profiles were
generated with the band selection threshold set at 5% intensity. Individual bands were matched
according to their positions in the gel with a 1.5% position tolerance and peak areas were used to
determine intensity (Julien et al., 2008). Cluster analysis describing pattern similarities among different
samples was performed using an unweighted pair-group method with an arithmetic mean algorithm
(UPGMA) (Martinez-Alonso et al., 2010). Dominant bands for further investigation were selected based
on band intensity (≥3.715).
5.2.4. DGGE profile analyses
Diversity and dissimilarity indices were analysed according to the DGGE banding profiles.
5.2.4.1. Operational taxonomic units (OTU’s)
The number of bands were taken as a measure of different operational taxonomic units and the
respective intensity as their proportion in the population (Ahmed et al., 2019).
5.2.4.2. Range weighted richness (Rr)
Species richness was calculated by range of weighted richness:
where N is the number of bands and Dg is the range of denaturant gel in which the top and bottom
bands were separated (Marzorati et al., 2008).
5.2.4.3. Shannon-Weaver diversity index (H)
The Shannon-Weaver diversity index (H) of bacterial diversity was calculated by using the following
equation:
© Central University of Technology, Free State
C h a p t e r 5
157
where Pi is the proportional intensity of each band or OTU and Ln (Pi) is the natural logarithm of
proportional intensity of each band (OTU) (Shannon & Weaver, 1999).
5.3. Results and Discussion
5.3.1. Experimental design, sampling and gDNA extraction
Bioaerosols originate from all types of environments, including the atmosphere, soil, freshwater and
oceans, and their dispersal into air is temporally and spatially variable. The variability of bioaerosol
composition is subjected to: (i) the fact that biological material does not necessarily occur in the air as
independent particles; (ii) bacteria may occur as agglomerations of cells or may be dispersed into the
air on plant or animal fragments, on soil particles, on pollen, or on spores that have become airborne
(Yoo et al., 2017); (iii) the correlation between the variations in atmospheric bacterial community
structures over time and their physical and chemical characteristics (Fierer et al., 2008); (iv) variations
in the robustness of different species of microorganisms; and (v) the difficulty of differentiating strains of
the same species (Griffin et al., 2001). Therefore, examining only the culturable fraction leads to an
underestimation of the total bioaerosol diversity. With this in mind, the culture-independent analyses
revealed a greater diversity of airborne microorganisms compared to the traditional culture-dependent
method (Lee et al., 2009; Yoo et al., 2017). The sensitivity, specificity and high speed of molecular
techniques have also led to their use for bioaerosol monitoring in the determination of air quality and
the detection of airborne pathogens (Han et al., 2012).
Although culture-independent analysis is ideal for diverse bioaerosol composition, diversity analysis is
still complicated due to: (i) bioaerosol composition consisting of various molecular components; (ii)
different molecular components that can interfere in the detection of target bioaerosols; and (iii) the fact
that a large number of the same genus with different species of bioaerosols may occur, making it
difficult for some culture-independent methods to distinguish between them (Yoo et al., 2017; Zhao et
al., 2011).
For accurate identification of culture-independent bioaerosols in a specific environment, four essential
steps need to be established for optimal results, namely: (i) the sampling process; (ii) an appropriate
DNA extraction method; (iii) amplification/identification; and (iv) interpretation of data (Yoo et al., 2017;
Zhao et al., 2011). With these factors in mind, this study attempted to obtain a true reflection of the
culture-independent bioaerosols. Membrane filters placed directly on the media in the agar plates were
© Central University of Technology, Free State
C h a p t e r 5
158
used to attempt to create the same conditions as those that had been used for the culture-dependent
approach (Chapter 4). An attempt was thus made to compare the culture-dependent and culture-
independent data and to determine commonalities and potential relevance. Currently, there is no
published information available on the composition of non-culturable bioaerosols in fruit juice bottling
facilities. In fact, only broad research on sampling procedures to determine the bioaerosol composition
of indoor and outdoor environments, specifically using culture-independent approaches, has conducted,
and thus there is a lack of literature on the culture-independent analysis of bioaerosols in indoor
environments. Indoor air is a very dynamic system in which particles of biological and non-biological
origin are distributed and displaced. Culture-independent analyses that focused on indoor bioaerosols
were conducted by researchers such as Angenent et al. (2005), Norris et al. (2011), O’Brien et al.
(2016), Robertson et al. (2013) and Tanaka et al. (2015), as it is an increasingly important issue for
occupational and public health. Not only sampling procedures, but also DNA extraction methods were
considered because a combination of both is crucial for DNA recovery (Ferguson et al., 2019). The data
that are presented in Table 5.4 show that membrane and fibrous filters were mostly used with pore
sizes ranging from 0.05-18 µm. Although fibrous filters seem popular and have demonstrated good
loading capacity for bioaerosol detection, particles are not easily released and may remain trapped
between the filaments (Cao et al., 2014; Pankhurst et al., 2012). The remaining filters used were
membrane filters, but no specific type seemed popular. After careful consideration, the decision was
taken to use Hydrophilic Polypropylene Membrane Filters (25 mm in diameter and 0.2 µm pore size)
(Pall Corporation) in the current study. Membrane filters typically have high collection efficiencies
(>95%) for particles >0.5 µm (bioaerosol size range: ~5-100 µm) in diameter and are simple to use.
However, membrane filters have a complex internal structure of pores within which particles are
deposited. With these filters, extraction occurs directly from the filter for downstream analysis (Ferguson
et al., 2019). Airflow that was involved in earlier studies varied from 0.6-70.86 L.h-1 and sampling
periods from 10 min to 10 days. The most successful extraction methods seemed to be commercially
available DNA extraction kits for soil and mechanical lysis using beads and chemicals. The DNA
extraction kits for soil demonstrated that the extraction method is suitable for different aerosol filter
types as samples had been successfully sequenced (Despres et al., 2007; Frohlich-Nowoisky et al.,
2012).
© Central University of Technology, Free State

C h a p t e r 5
159
Table 5.4: Different ambient air filters and extraction methods used since 2002 for DNA analysis of bioaerosols, arranged by type of extraction
method
Filter Type, Pore Size, Flow Rate and Time
Extraction Method Bioaerosols Targeted Identification Method Reference
Poretics polyester membrane filters (1 µm pore size, 1000 liters.min-1, 24 h)
MoBio UltraClean Soil DNA kit Bacteria PCR amplification and
sequencing Radosevich et
al., 2002
Glass fibre filters (15 mm diameter, 500 liters.min-1, 4 to 5 d)
Fast DNA spin kit for soil Bacteria, Archaea, Mould, Plants and Animals
PCR amplification, cloning and sequencing
Despres et al., 2007
Cellulose nitrate filters (15 mm diameter, 19.68 liters.min-1, 24 h)
Fast DNA spin kit for soil Bacteria, Archaea, Mould, Plants and Animals
PCR amplification, cloning and sequencing
Despres et al., 2007
Polypropylene filters (44 mm diameter, 11.67 liters.min-1, 10 d)
Fast DNA spin kit for soil Bacteria, Archaea, Mould, Plants and Animals
PCR amplification, cloning and sequencing
Despres et al., 2007
Glass fibre filters (3 µm pore size, 300 liters.min-1, 1 to 7 d)
Fast DNA spin kit for soil Yeast and Mould PCR amplification, cloning and
sequencing Fröhllich-
Nowoisky et al., 2009
Glass fibre filters (50 mm diameter, .225 liters.min-1, 24 h)
Soil DNA isolation kit Bacteria and Mould PCR amplification, cloning and
sequencing Lee et al., 2010
Quartz fibre filters (NA, 1130 liters.min-1, 3 d)
PowerSoil DNA isolation kit Bacteria PCR amplification, cloning and
sequencing Bowers et al.,
2011
HVAC filters (NA, 12.5 liters.min-1, 1 h) PowerSoil DNA isolation kit Bacteria and Mould PCR amplification, cloning and
sequencing Norris et al.,
2011
Glass fibre filters (50 mm diameter, 225 liters.min-1, 24 h)
Soil DNA isolation kit Bacteria and Mould PCR amplification, cloning and
sequencing Lee et al., 2010
© Central University of Technology, Free State

C h a p t e r 5
160
Filter Type, Pore Size, Flow Rate and Time
Extraction Method Bioaerosols Targeted Identification Method Reference
Quartz fibre filters (NA, 1130 liters.min-1, 3 d)
PowerSoil DNA isolation kit Bacteria PCR amplification, cloning and
sequencing Bowers et al.,
2011
HVAC filters (NA, 12.5 liters.min-1, 1 h) PowerSoil DNA isolation kit Bacteria and Mould PCR amplification, cloning and
sequencing Norris et al.,
2011
Polyvinyl chloride filter (25 mm diameter, 5.0 µm pore size, 2-4 liters.min-1, 30-990
min) PowerSoil DNA isolation kit Bacteria
Whole genome sequencing O’Brien et al.,
2016
Quartz fibre filters (150 mm diameter, 500 liters.min-1, 24 h)
Fast DNA spin kit for soil Mould PCR amplification, cloning and
sequencing Fröhlich-
Nowoisky et al., 2012
Palliflex quartz filters (3 µm pore size, 272 liters.min-1, 10-50 h)
Fast DNA spin kit for soil Mould
PCR amplification, cloning and sequencing
Fröhlich-Nowoisky et al.,
2012
Quartz fibre filters (NA, 1000 liters.min-1, 2-26 h)
Fast DNA spin kit for soil Mould
PCR amplification, cloning and sequencing
Fröhlich-Nowoisky et al.,
2012
Dichotomous sampler (self-built) (102 mm diameter, 30 liters.min-1, 7 d)
Fast DNA spin kit for soil Mould
PCR amplification, cloning and sequencing
Fröhlich-Nowoisky et al.,
2012
Quartz fibre filters (8.0 µm pore size, 50 liters.min-1, 48-72 h)
Fast DNA spin kit for soil Mould
PCR amplification, cloning and sequencing
Fröhlich-Nowoisky et al.,
2012
Quartz fibre filters (NA, 1130 liters.min-1, Mould PCR amplification, cloning and Fröhlich-Nowoisky et al.,
© Central University of Technology, Free State
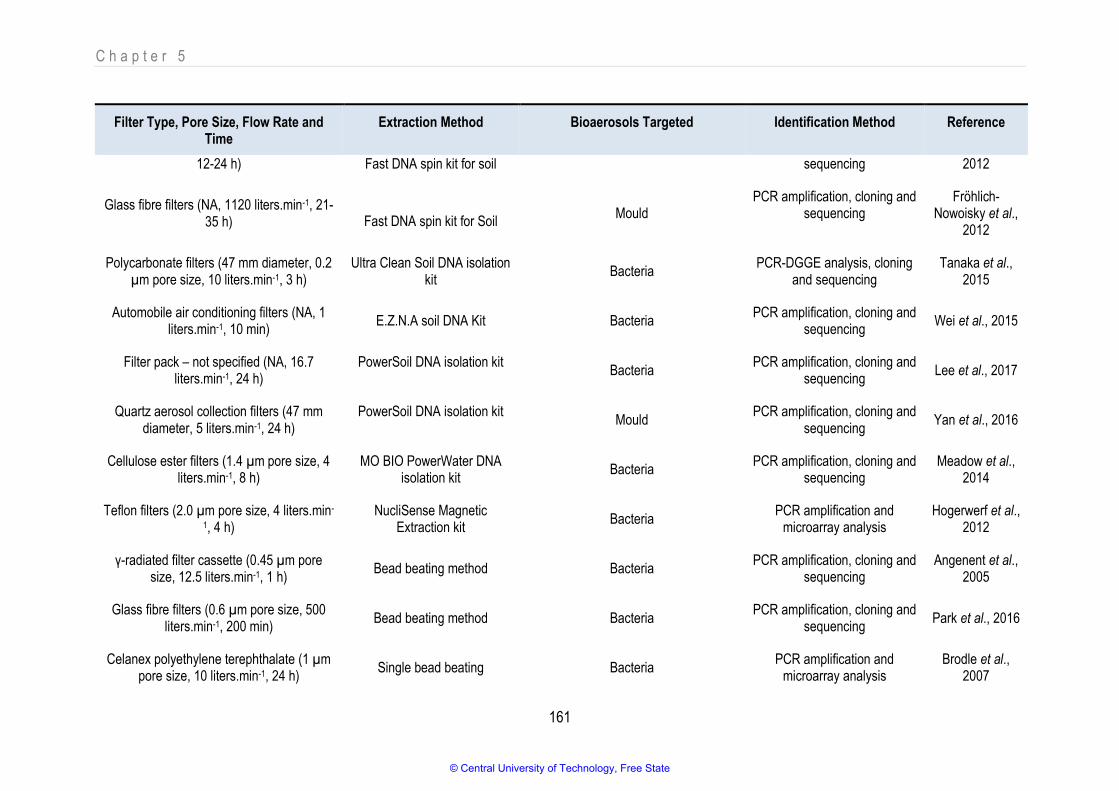
C h a p t e r 5
161
Filter Type, Pore Size, Flow Rate and Time
Extraction Method Bioaerosols Targeted Identification Method Reference
12-24 h) Fast DNA spin kit for soil sequencing 2012
Glass fibre filters (NA, 1120 liters.min-1, 21-35 h)
Fast DNA spin kit for Soil Mould
PCR amplification, cloning and sequencing
Fröhlich-Nowoisky et al.,
2012
Polycarbonate filters (47 mm diameter, 0.2 µm pore size, 10 liters.min-1, 3 h)
Ultra Clean Soil DNA isolation kit
Bacteria PCR-DGGE analysis, cloning
and sequencing Tanaka et al.,
2015
Automobile air conditioning filters (NA, 1 liters.min-1, 10 min)
E.Z.N.A soil DNA Kit Bacteria PCR amplification, cloning and
sequencing Wei et al., 2015
Filter pack – not specified (NA, 16.7 liters.min-1, 24 h)
PowerSoil DNA isolation kit Bacteria
PCR amplification, cloning and sequencing
Lee et al., 2017
Quartz aerosol collection filters (47 mm diameter, 5 liters.min-1, 24 h)
PowerSoil DNA isolation kit Mould
PCR amplification, cloning and sequencing
Yan et al., 2016
Cellulose ester filters (1.4 µm pore size, 4 liters.min-1, 8 h)
MO BIO PowerWater DNA isolation kit
Bacteria PCR amplification, cloning and
sequencing Meadow et al.,
2014
Teflon filters (2.0 µm pore size, 4 liters.min-
1, 4 h) NucliSense Magnetic
Extraction kit Bacteria
PCR amplification and microarray analysis
Hogerwerf et al., 2012
γ-radiated filter cassette (0.45 µm pore size, 12.5 liters.min-1, 1 h)
Bead beating method Bacteria PCR amplification, cloning and
sequencing Angenent et al.,
2005
Glass fibre filters (0.6 µm pore size, 500 liters.min-1, 200 min)
Bead beating method Bacteria PCR amplification, cloning and
sequencing Park et al., 2016
Celanex polyethylene terephthalate (1 µm pore size, 10 liters.min-1, 24 h)
Single bead beating Bacteria PCR amplification and
microarray analysis Brodle et al.,
2007
© Central University of Technology, Free State

C h a p t e r 5
162
Filter Type, Pore Size, Flow Rate and Time
Extraction Method Bioaerosols Targeted Identification Method Reference
Polycarbonate filters (25 mm diameter, 0.8 µm pore size, NA,NA)
Mini-bead Beater, DNA-EZ kit Mould PCR amplification and
microarray analysis Vesper et al.,
2007
Mixed cellulose ester membrane filters (0.8 µm pore size, 2 liters.min-1, 10-90 min)
Bead beater kit Mould PCR amplification, cloning and
sequencing Rittenour et al.,
2013
Borosilicate filters (18 mm diameter, NA, 6 h)
Fast Prep 120 Bacteria PCR amplification and
microarray analysis DeSantis et al.,
2005
Fluoropore membrane PTFE filters (0.056 to 18 µm, 30 to 48 liters.min-1,40 min to 6 h)
Chloroform method Bacteria, Yeast and Mould PCR amplification, cloning and
sequencing Urbano et al.,
2011
Polycarbonate filters (0.2 µm, 300 liters.min-1, NA)
Chloroform method Bacteria PCR amplification and
microarray analysis Robertson et al,
2013
HEPA filters (8cm x 4cm, NA, NA) Modified Miller Method Bacteria PCR amplification and
microarray analysis Korves et al.,
2013
PTFE filters (47 mm diameter, 0.45 µm pore size, NA, 20 min)
Hexadecyltrimethylammonium bromide (CTAB) protocol
Bacteria PCR amplification and
microarray analysis Fahlgren et al.,
2015
NA – Not applicable.
© Central University of Technology, Free State

C h a p t e r 5
163
Table 5.5: Comparison of recommended DNA extraction protocols for DNA analysis of bioaerosols
Extraction Kit/Steps Supplier Outcome Observations Reference
ZR Fungal/Bacterial DNA MiniPrep™ Zymo Research
No bacterial, yeast or mould product observed
Mould detected in air and surface samples using RT-PCR analysis. Bacterial spores detected from powder samples
using RT-PCR analysis
Molsa et al., 2016; Viegas et
al., 2016
ZR Soil Microbe DNA MiniPrep™ Zymo Research
No bacterial, yeast or mould product observed
Bacteria detected in faecal specimens using PCR-DGGE analysis
Huges et al., 2017; Shepherd
et al., 2015
Harch lysis, extraction method
Manual No bacterial, yeast or mould
product observed Modified extraction method for yeast identification using PCR
analysis Labuschagne & Albertyn, 2007
QIAamp® DNA Stool Mini Kit
QIAGEN
No bacterial, yeast or mould product observed
Bacteria detected in human gut samples using PCR-DGGE analysis. Bacteria detected in faecal specimens using PCR-
DGGE analysis
Ariefdjohan et al., 2010;
Collado et al., 2016
XpeditionTM Soil/Fecal DNA MiniPrep Kit Zymo Research
Bacteria detected in human gut samples using PCR-DGGE analysis. Bacteria detected in environmental samples using
PCR-DGGE analysis
Barros et al., 2015: Wilmeth
et al., 2018
© Central University of Technology, Free State

C h a p t e r 5
164
Culture-independent methods have revolutionised our understanding of the microbiology of different
communities. More especially, DNA-based methods for phylogenetic analysis are increasingly applied.
The analytical success of molecular techniques, including PCR-DGGE, is greatly affected by the
reliance on cell lysis efficiency and the quality of DNA recovered from environmental samples.
However, DNA isolation methods that contribute to insufficient cell lysis or shearing of DNA may cause
bias in PCR amplification. It is therefore important that upstream protocols (e.g., DNA extraction) are
optimised in order to obtain accurate results (Ariefdjohan et al., 2010). However, ‘you only see what you
sequence and only sequence what you can extract and amplify’, and this understanding highlights that
the extraction step plays a big role in the effectiveness of DNA-based analysis of environmental
samples. With a lack of information regarding aerosol bacterial diversity in the food industry that existed
at the commencement of the study, five different extraction methods were chosen after a thorough
review of the literature to explore extraction methods used for successful identification of environmental
bioaerosols (Table 5.5). DNA extraction consists of three main steps: (i) cell lysis to expose the
intracellular material; (ii) isolation of DNA from contaminants; and (iii) final elution. The XpeditionTM
Soil/Fecal DNA MiniPrep Kit was revealed as the only method that is able to extract sufficient DNA from
filters usable for PCR.
Higher extraction efficiency allows for better recovery of DNA from environmental samples and this
results in a more comprehensive and complete profile of the bacterial community within a sample. As
soil is considered to be a highly diverse microbial habitat with an estimate of up to 1 million distinct
genomes per gram (Brodle et al., 2007; Santamaria et al., 2018), it is not surprising that this method
had a relatively high success rate. Various commercial DNA extraction kits have been developed to
simplify and speed up the extraction process. However, none of these different techniques have been
quantitatively compared and the relative efficacy of these kits and the optimum range of sample weight
for extraction need further evaluation. Clearly, the choice of DNA extraction and amplification protocols
is pivotal to the outcome of any amplicon sequencing study (Albertsen et al., 2015; Luhung et al.,
2015).
© Central University of Technology, Free State
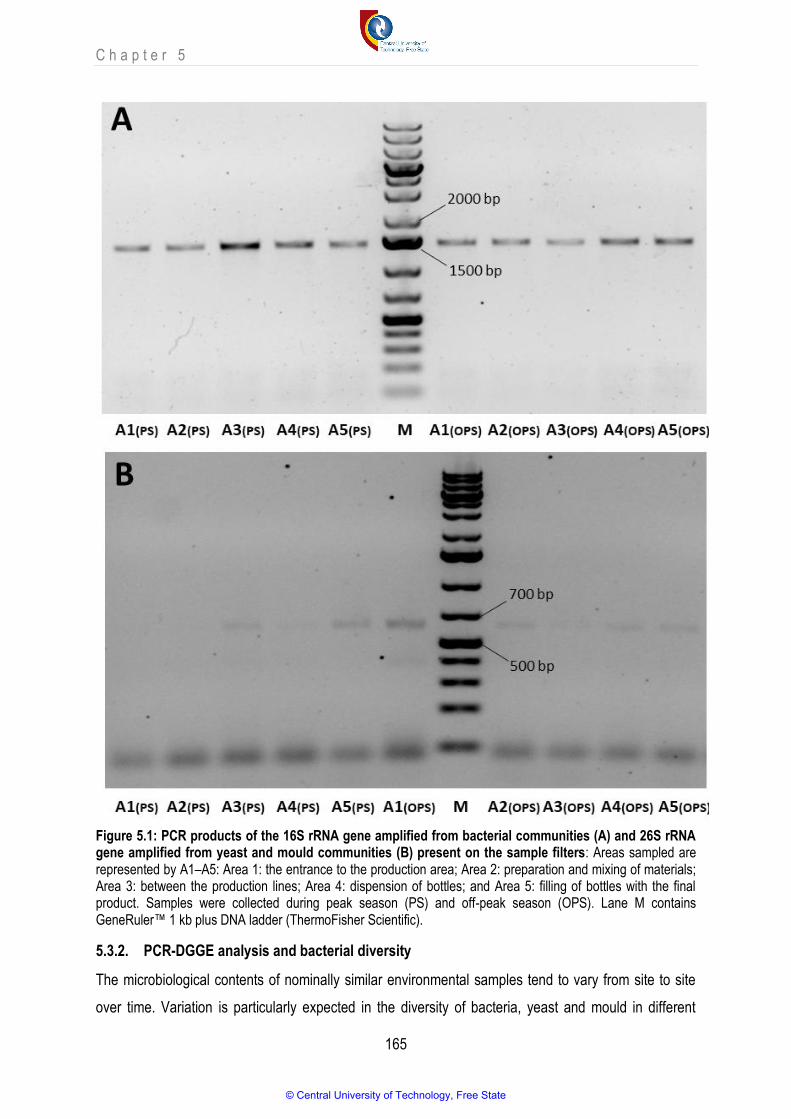
C h a p t e r 5
165
Figure 5.1: PCR products of the 16S rRNA gene amplified from bacterial communities (A) and 26S rRNA gene amplified from yeast and mould communities (B) present on the sample filters: Areas sampled are represented by A1–A5: Area 1: the entrance to the production area; Area 2: preparation and mixing of materials; Area 3: between the production lines; Area 4: dispension of bottles; and Area 5: filling of bottles with the final product. Samples were collected during peak season (PS) and off-peak season (OPS). Lane M contains GeneRuler™ 1 kb plus DNA ladder (ThermoFisher Scientific).
5.3.2. PCR-DGGE analysis and bacterial diversity
The microbiological contents of nominally similar environmental samples tend to vary from site to site
over time. Variation is particularly expected in the diversity of bacteria, yeast and mould in different
© Central University of Technology, Free State

C h a p t e r 5
166
areas. In order to explore a scattered collection of the phylogenetic distribution, the usefulness of
extracted DNA for downstream application was analysed in a range of different steps to identify the
bioaerosol diversity in the industry under study. Figure 5.1 presents the PCR products amplified from
total DNA extracted from filters using the XpeditionTM Soil/Fecal DNA MiniPrep Kit and targeting the
16S rRNA gene. Amplification of the 18S rRNA gene and D1/D2 region of the 26S rRNA was also
attempted to assess yeast and mould diversity (Figure 5.1). Low PCR products were obtained where
primer pair NL1 and NL4 was used to amplify the D1/D2 region. Subsequently, the 18S rRNA gene
region was targeted for further analysis of yeast and mould diversity, although no 18S rRNA gene
amplified products using primer pair EukA and EukB could be obtained.
PCR-DGGE is a useful tool for detecting microbial community structure, dominant populations and
changes of predominant microbiota in specific microhabitats, and it has been widely applied for
comparative analyses of parallel samples (Lv et al., 2012; Tanaka et al., 2015). Figure 5.2 represent
the PCR-DGGE products generated from extracted DNA using primer sets modified with GC clamps
that represent bacterial and yeast/mould communities as the V3 region of the 16S rRNA (Figure 5.2)
and partial 26S rRNA gene products (Figure 5.2). These products were resolved in a polyacrylamide
gel with a urea gradient (40-60%) to assess microbial community structure. Figure 5.3 and Figure 5.4
illustrate the bacterial and yeast and mould diversity respectively. PCR products representative of
bacterial diversity were successfully separated, but the separation of yeast and mould PSR products
was unsuccessful. Despite numerous attempts to optimise different conditions, DGGE resolution could
not be improved.
© Central University of Technology, Free State
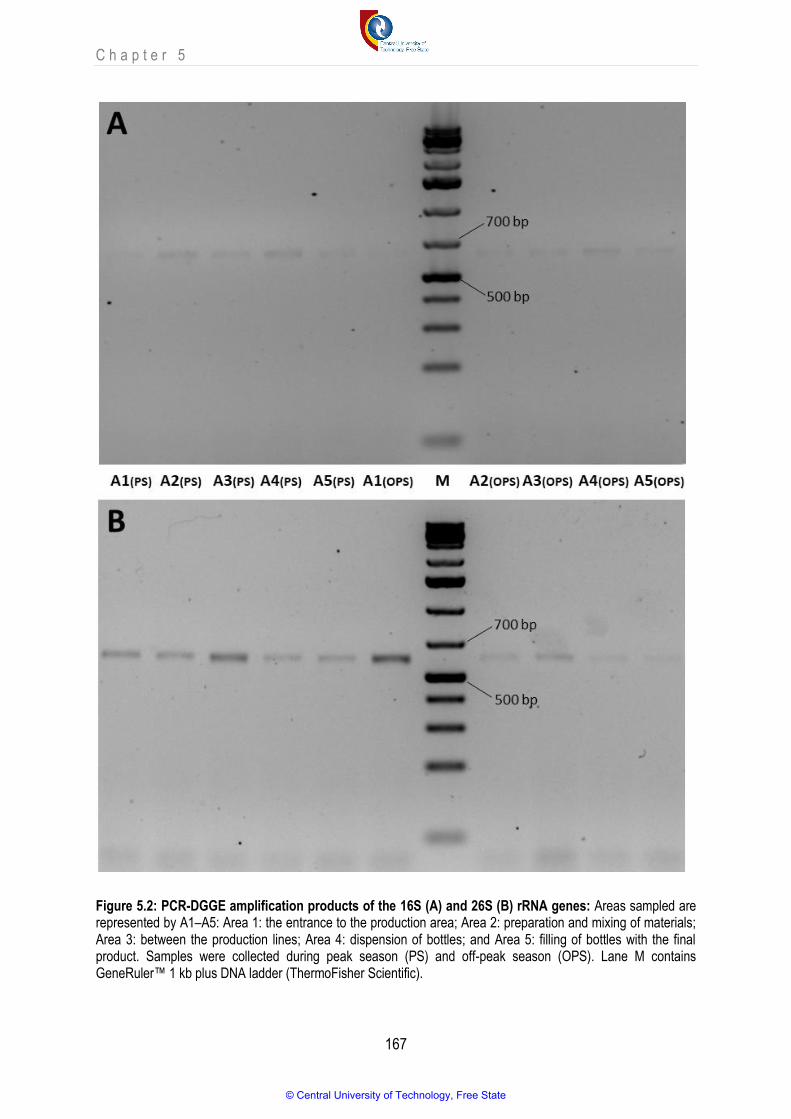
C h a p t e r 5
167
Figure 5.2: PCR-DGGE amplification products of the 16S (A) and 26S (B) rRNA genes: Areas sampled are represented by A1–A5: Area 1: the entrance to the production area; Area 2: preparation and mixing of materials; Area 3: between the production lines; Area 4: dispension of bottles; and Area 5: filling of bottles with the final product. Samples were collected during peak season (PS) and off-peak season (OPS). Lane M contains GeneRuler™ 1 kb plus DNA ladder (ThermoFisher Scientific).
© Central University of Technology, Free State
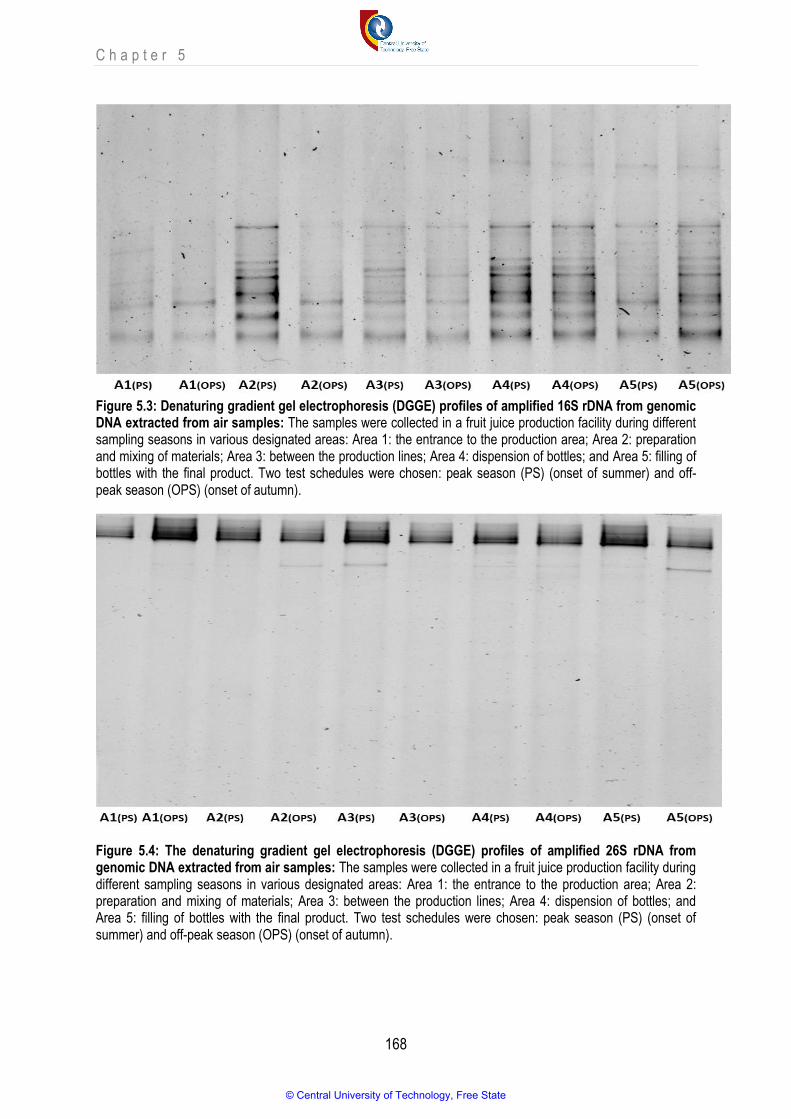
C h a p t e r 5
168
Figure 5.3: Denaturing gradient gel electrophoresis (DGGE) profiles of amplified 16S rDNA from genomic DNA extracted from air samples: The samples were collected in a fruit juice production facility during different sampling seasons in various designated areas: Area 1: the entrance to the production area; Area 2: preparation and mixing of materials; Area 3: between the production lines; Area 4: dispension of bottles; and Area 5: filling of bottles with the final product. Two test schedules were chosen: peak season (PS) (onset of summer) and off-peak season (OPS) (onset of autumn).
Figure 5.4: The denaturing gradient gel electrophoresis (DGGE) profiles of amplified 26S rDNA from genomic DNA extracted from air samples: The samples were collected in a fruit juice production facility during different sampling seasons in various designated areas: Area 1: the entrance to the production area; Area 2: preparation and mixing of materials; Area 3: between the production lines; Area 4: dispension of bottles; and Area 5: filling of bottles with the final product. Two test schedules were chosen: peak season (PS) (onset of summer) and off-peak season (OPS) (onset of autumn).
© Central University of Technology, Free State
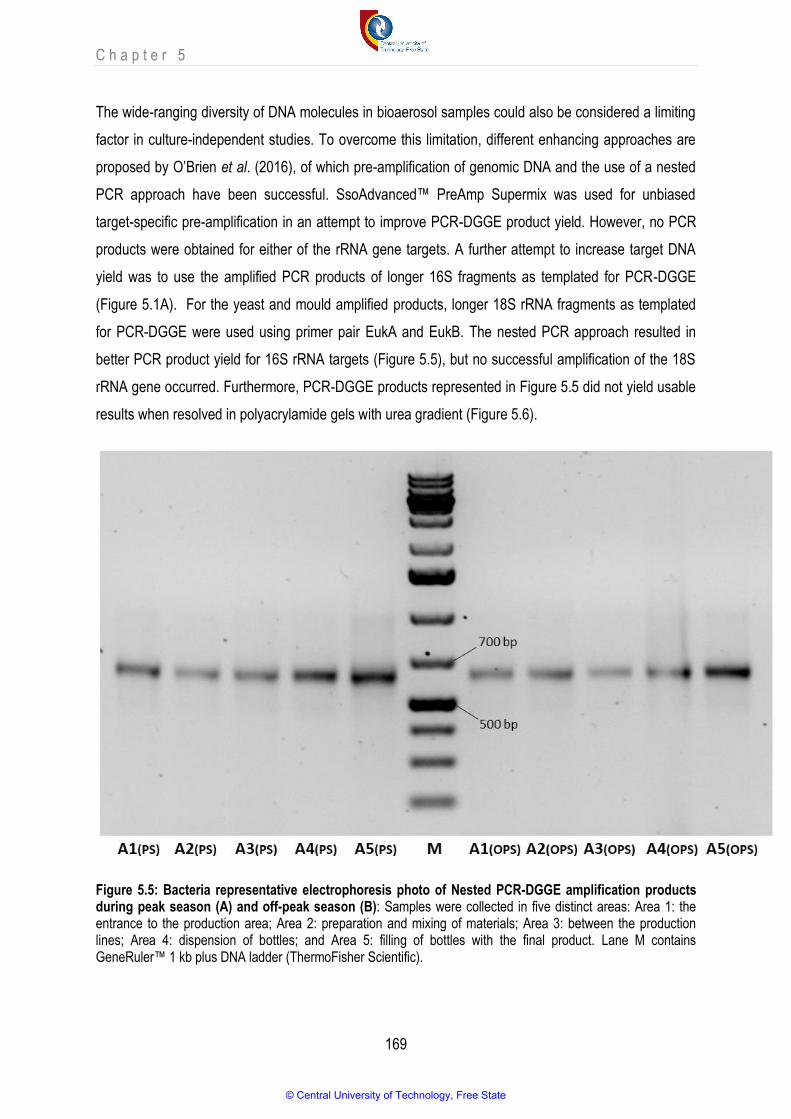
C h a p t e r 5
169
The wide-ranging diversity of DNA molecules in bioaerosol samples could also be considered a limiting
factor in culture-independent studies. To overcome this limitation, different enhancing approaches are
proposed by O’Brien et al. (2016), of which pre-amplification of genomic DNA and the use of a nested
PCR approach have been successful. SsoAdvanced™ PreAmp Supermix was used for unbiased
target-specific pre-amplification in an attempt to improve PCR-DGGE product yield. However, no PCR
products were obtained for either of the rRNA gene targets. A further attempt to increase target DNA
yield was to use the amplified PCR products of longer 16S fragments as templated for PCR-DGGE
(Figure 5.1A). For the yeast and mould amplified products, longer 18S rRNA fragments as templated
for PCR-DGGE were used using primer pair EukA and EukB. The nested PCR approach resulted in
better PCR product yield for 16S rRNA targets (Figure 5.5), but no successful amplification of the 18S
rRNA gene occurred. Furthermore, PCR-DGGE products represented in Figure 5.5 did not yield usable
results when resolved in polyacrylamide gels with urea gradient (Figure 5.6).
Figure 5.5: Bacteria representative electrophoresis photo of Nested PCR-DGGE amplification products during peak season (A) and off-peak season (B): Samples were collected in five distinct areas: Area 1: the entrance to the production area; Area 2: preparation and mixing of materials; Area 3: between the production lines; Area 4: dispension of bottles; and Area 5: filling of bottles with the final product. Lane M contains GeneRuler™ 1 kb plus DNA ladder (ThermoFisher Scientific).
© Central University of Technology, Free State
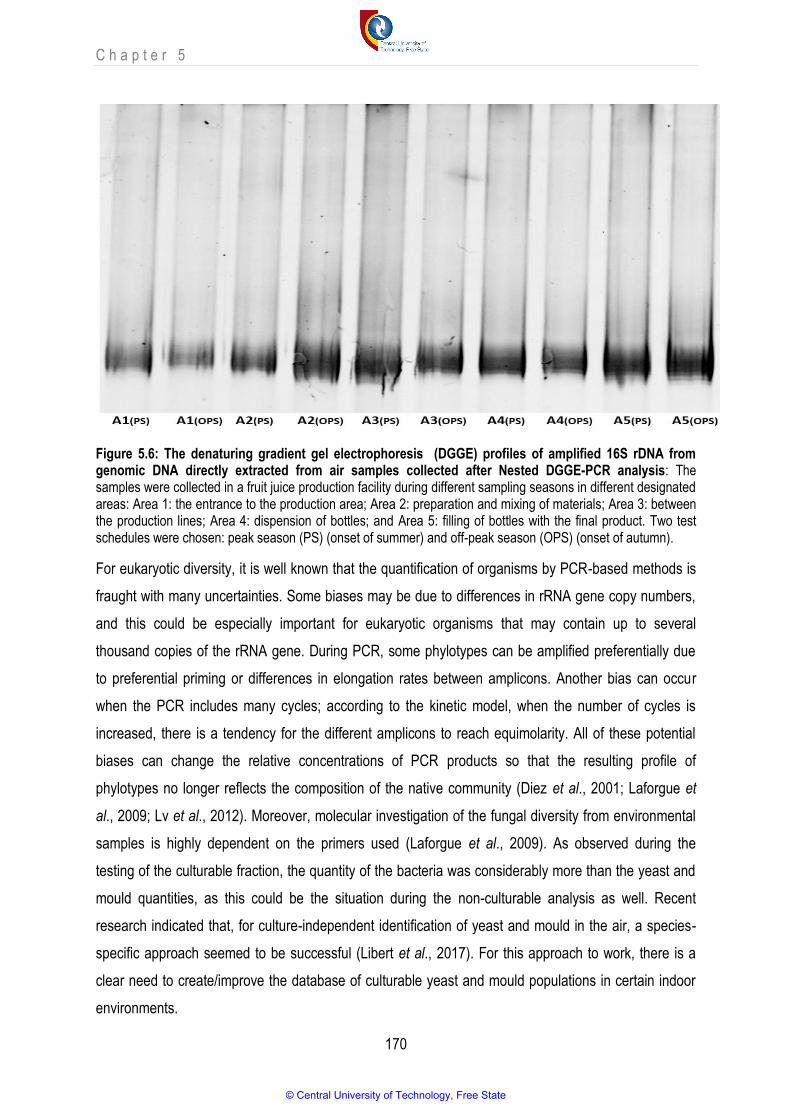
C h a p t e r 5
170
Figure 5.6: The denaturing gradient gel electrophoresis (DGGE) profiles of amplified 16S rDNA from genomic DNA directly extracted from air samples collected after Nested DGGE-PCR analysis: The samples were collected in a fruit juice production facility during different sampling seasons in different designated areas: Area 1: the entrance to the production area; Area 2: preparation and mixing of materials; Area 3: between the production lines; Area 4: dispension of bottles; and Area 5: filling of bottles with the final product. Two test schedules were chosen: peak season (PS) (onset of summer) and off-peak season (OPS) (onset of autumn).
For eukaryotic diversity, it is well known that the quantification of organisms by PCR-based methods is
fraught with many uncertainties. Some biases may be due to differences in rRNA gene copy numbers,
and this could be especially important for eukaryotic organisms that may contain up to several
thousand copies of the rRNA gene. During PCR, some phylotypes can be amplified preferentially due
to preferential priming or differences in elongation rates between amplicons. Another bias can occur
when the PCR includes many cycles; according to the kinetic model, when the number of cycles is
increased, there is a tendency for the different amplicons to reach equimolarity. All of these potential
biases can change the relative concentrations of PCR products so that the resulting profile of
phylotypes no longer reflects the composition of the native community (Diez et al., 2001; Laforgue et
al., 2009; Lv et al., 2012). Moreover, molecular investigation of the fungal diversity from environmental
samples is highly dependent on the primers used (Laforgue et al., 2009). As observed during the
testing of the culturable fraction, the quantity of the bacteria was considerably more than the yeast and
mould quantities, as this could be the situation during the non-culturable analysis as well. Recent
research indicated that, for culture-independent identification of yeast and mould in the air, a species-
specific approach seemed to be successful (Libert et al., 2017). For this approach to work, there is a
clear need to create/improve the database of culturable yeast and mould populations in certain indoor
environments.
© Central University of Technology, Free State

C h a p t e r 5
171
5.3.3. DGGE profile analyses
DGGE fingerprinting can be coupled with the calculation of biodiversity indices, similarity indices,
cluster analysis, and banding patterns, and it can compare bacterial communities occurring in different
environmental samples to evaluate the diversity and the dynamics of bacterial communities (Aydin et
al., 2015; Marzorati et al., 2008).
The gel that is presented in Figure 5.3 was used to analyse the non-culturable bacterial diversity for
each sample area. By using the same quantity of template DNA for PCR-DGGE, the band position and
intensity correspond to the abundance of specific species (Wang et al., 2016). Regrettably, the
resolution (intensity) of the bands represented in Figure 5.3 was not sufficient to allow excision under
blue or UV light, and no sequence data to identify individual band positions could be obtained.
However, comparative analyses of bacterial diversity richness in the different sampling areas were still
possible.
Each vertical lane in Figure 5.6 represents a sample corresponding to a designated area during the two
sampling seasons, and each band position ideally represents a bacterial species. The diversity
observed with this technique was relatively uncomplicated as a few dominant bands and a larger
number of faint bands were revealed. The number of DGGE bands varied from 3 to more than 20
depending on the sample. Bacterial community profiles were different between the two seasons for
Area 1 and Area 2 (A1 - PS; A1 - OPS; A2 - PS and A2 - OPS), but with minimal sample-to-sample
variation for Areas 3 to 5 (A3 – PS; A3 - OPS; A4 – PS; A4 – OPS; A5 - PS and A5 - OPS) for both
seasons.
UPGMA Cluster analysis estimated the order of relatedness among the different samples (Figure 5.7
and Figure 5.8). The cluster analyses that were conducted based on the genetic polymorphism
detected by PCR-DGGE segregated the diversity profiles into two main cluster groups, namely Cluster
1 and Cluster 2, which allowed differentiation between the two groups. Cluster 2 contained the samples
collected during the peak and off-peak seasons in Area 1 and peak season in Area 5. The entrance to
the facility is denoted by Area 1 while the exit is denoted by Area 5. Research has demonstrated that
outdoor bioaerosols can penetrate indoors (Chen et al., 2015; Meadow et al., 2014; Soleimani et al.,
2016), and this was confirmed by the results that indicated that different groups of bioaerosols were
detected in these two areas from those that were detected further inside the plant. This was due to
outdoor bioaerosols being present near the outside doorway. The other samples were combined in
Cluster 1. Eleven samples had a high similarity of more than 70%. Conversely, earlier studies reported
© Central University of Technology, Free State

C h a p t e r 5
172
a low degree of similarity (about 10-40%) with outside airborne bacterial communities (Jeon et al.,
2011; Tanaka et al., 2015).
High similarities (>80%) were detected amongst samples obtained from Area 4 during the peak and off-
peak seasons (82.5%). Area 4 (dispersion of bottles) had poor ventilation (the airflow recorded was 0
m.s-1), was full of dust and was occupied by personnel who dispensed the bottles. Literature refers to a
correlation between microbial counts and the personnel observed in specific areas, and this was
confirmed by the current study as airborne microbials were more prevalent when the areas were
occupied compared to counts in unoccupied conditions. In addition, humans have been reported to be
a source of bacteria and fungi in settled dust samples (Adams et al., 2015). During the culture-
dependent identification, the only bacteria (innocuous, useful and harmful) that were detected during
both seasons were Micrococcus terreus, Staphylococcus cohnii, S. haemolyticus, S. saprophyticus and
S. succinus. The same was observed for Area 4 and Area 5 for samples taken during the off-peak
season based on culture-independent analyses (85% similarity). The only culturable bacteria (either
innocuous, useful or harmful) that were detected during both seasons in this area were Brevibacterium
frigoritolerans, Staphylococcus haemolyticus, S. jettensis, and S. succinus.
Earlier research suggests that PCR-DGGE analysis utilising 16S rRNA genes usually yields patterns
that reflect the composition of dominant microorganisms, including non-culturable members. (El-Sayed
et al., 2015; Head et al., 1998). This explains why the similarities displayed in the bacterial diversity
(Figure 5.7 and Figure 5.8) obtained during the culture-independent analyses differed from what had
been observed during the culture-dependent analyses. Moreover, Shade et al. (2012) demonstrated
that culture-dependent methods from the murine gut and soil could reveal the presence of rare bacterial
species in a community. Their results indicated that bacteria detected by culture-dependent methods
were either less abundant, absent, or it was not possible to distinguish any among the different species.
Various researchers also highlight the importance of culture-dependent methods for analysing outdoor
and indoor bioaerosols (Douwes et al., 2003; Griffin, 2007; Tringe & Hugenholtz, 2008), although they
also point out various limitations such as loss of important microorganisms, a long detection period,
cells that can be non-viable, and dead microorganisms. With this in mind, it may be untimely to
conclude that the results of the culture-dependent and the culture-independent analyses corresponded
in this specific study. Rather, it confirms the need to select a bioaerosol approach that depends on the
information that is needed, such as: (i) is it (the data) qualitative or quantitative; (ii) specific or general;
and (iii) highly localised or over a broader landscape? (Yoo et al., 2017).
© Central University of Technology, Free State

C h a p t e r 5
173
Figure 5.7: Cluster analysis demonstrated graphically as an UPGMA dendogram: The results depict all the DGGE profiles of bacterial 16S rRNA genes amplified using genomic DNA extracted from air samples collected in a fruit juice production facility from five different designated areas: entrance to the production area (A1); preparation and mixing of materials (A2); between the production lines (A3); dispersion of bottles (A4); and filling of the final product (A5). Two test schedules were chosen: peak season (PS) (onset of summer) and off-peak season (OPS) (onset of autumn).
© Central University of Technology, Free State

C h a p t e r 5
174
Figure 5.8: Dice coefficient matrix derived from DGGE profiles of 16S rDNA analysis. Areas: entrance to the production area (A1); preparation and mixing of materials (A2); between the production lines (A3); dispersion of bottles (A4); and filling of the final product (A5). Two test schedules were chosen: peak season (PS) (onset of summer) and off-peak season (OPS) (onset of autumn). Samples highlighted in blue had a high similarity rate of more than 70%.
© Central University of Technology, Free State
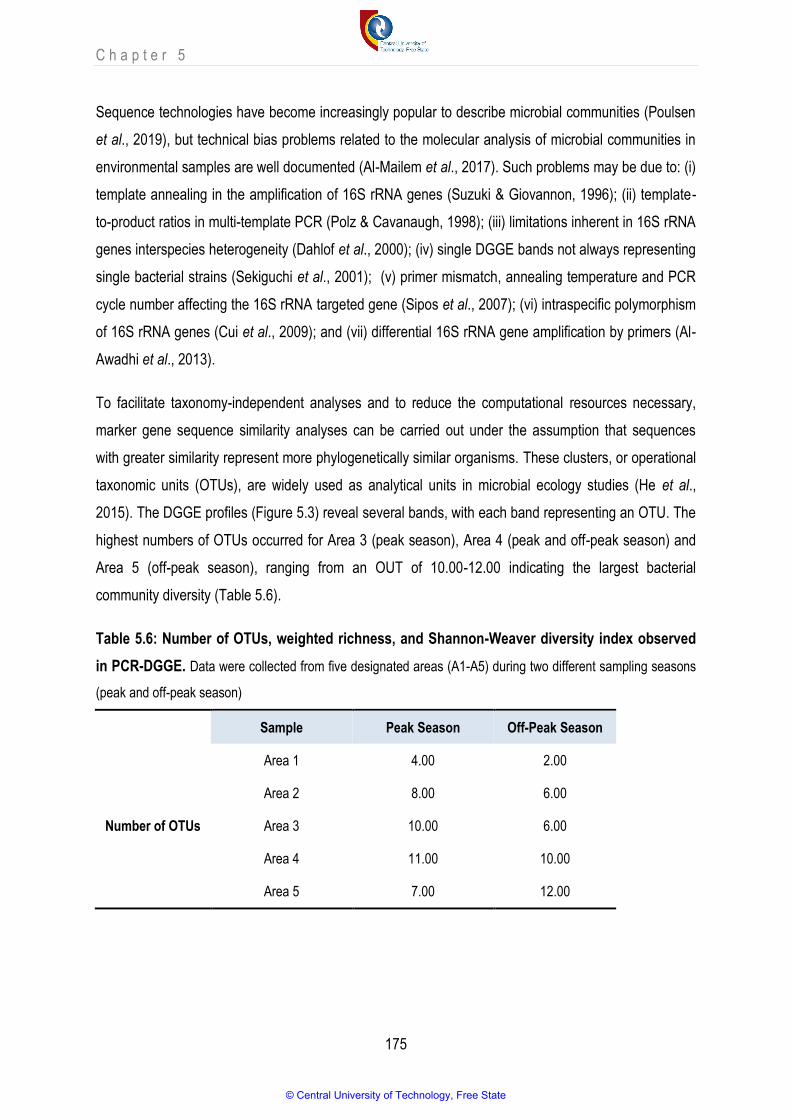
C h a p t e r 5
175
Sequence technologies have become increasingly popular to describe microbial communities (Poulsen
et al., 2019), but technical bias problems related to the molecular analysis of microbial communities in
environmental samples are well documented (Al-Mailem et al., 2017). Such problems may be due to: (i)
template annealing in the amplification of 16S rRNA genes (Suzuki & Giovannon, 1996); (ii) template-
to-product ratios in multi-template PCR (Polz & Cavanaugh, 1998); (iii) limitations inherent in 16S rRNA
genes interspecies heterogeneity (Dahlof et al., 2000); (iv) single DGGE bands not always representing
single bacterial strains (Sekiguchi et al., 2001); (v) primer mismatch, annealing temperature and PCR
cycle number affecting the 16S rRNA targeted gene (Sipos et al., 2007); (vi) intraspecific polymorphism
of 16S rRNA genes (Cui et al., 2009); and (vii) differential 16S rRNA gene amplification by primers (Al-
Awadhi et al., 2013).
To facilitate taxonomy-independent analyses and to reduce the computational resources necessary,
marker gene sequence similarity analyses can be carried out under the assumption that sequences
with greater similarity represent more phylogenetically similar organisms. These clusters, or operational
taxonomic units (OTUs), are widely used as analytical units in microbial ecology studies (He et al.,
2015). The DGGE profiles (Figure 5.3) reveal several bands, with each band representing an OTU. The
highest numbers of OTUs occurred for Area 3 (peak season), Area 4 (peak and off-peak season) and
Area 5 (off-peak season), ranging from an OUT of 10.00-12.00 indicating the largest bacterial
community diversity (Table 5.6).
Table 5.6: Number of OTUs, weighted richness, and Shannon-Weaver diversity index observed
in PCR-DGGE. Data were collected from five designated areas (A1-A5) during two different sampling seasons
(peak and off-peak season)
Sample Peak Season Off-Peak Season
Number of OTUs
Area 1 4.00 2.00
Area 2 8.00 6.00
Area 3 10.00 6.00
Area 4 11.00 10.00
Area 5 7.00 12.00
© Central University of Technology, Free State

C h a p t e r 5
176
Sample Peak Season Off-Peak Season
Range weighted richness
Area 1 0.48 0.12
Area 2 1.92 1.08
Area 3 8.00 2.88
Area 4 9.68 8.00
Area 5 3.92 11.52
Sample Peak Season Off-Peak Season
Shannon-Weaver diversity index
Area 1 1.38 0.69
Area 2 2.70 2.10
Area 3 3.41 2.00
Area 4 3.58 3.57
Area 5 2.42 3.55
If an environment is highly habitable, it can host a vast number of different microorganisms with genetic
variability; hence a wide gradient is needed to describe the total microbial diversity. Conversely, if the
environment is adverse or exclusive, a smaller number of microorganisms will be part of the microbial
community and hence a narrow, denaturing gradient will be used to describe the total diversity. In this
context, the Range weighted richness (Rr) is the total number of bands multiplied by the percentage of
denaturing gradient needed to describe the total diversity of the sample analysed (Marzorati et al.,
2008). In the current study, the DGGE bands were used to calculate species richness which is
expressed as Range weighted richness (Rr). The Range weighted richness (Rr) values for both peak
and off-peak seasons were less than 12 (Table 5.6). However, for both seasons, the rates for Area 1
and Area 2 were considerably lower than for the rest with an Rr <2.00. Based on the DGGE, Rr <10
can be attributed to environments that are particularly adverse or restricted to colonisation (which
suggests contaminated soil), or it may be due to poor DNA extraction that resulted in DGGE
fingerprinting profiles that are not representative of the bacterial community and are characterised by a
low Range weighted richness (Ariefdjohan et al., 2010; Marzorati et al., 2008). For Area 5 (filling of
bottles with final product) in the off-peak season, the highest Rr value of 11.52 was obtained which,
according to the literature, is classified as a medium Range weighted richness that is found in food
(Biradar et al., 2017; Lara et al., 2012; Marzorati et al., 2008). According to the literature, outdoor and
© Central University of Technology, Free State

C h a p t e r 5
177
indoor bioaerosol samples collected a few days apart can harbour very different types of
microorganisms, confirming that the air in the same area may differ considerably during two different
sampling seasons (Tanaka et al., 2015; Xu & Yao, 2013). The same was observed for Area 5, for which
an Rr value of 3.92 was obtained during the peak season. Processes in this area are mostly performed
by automated machinery, although personnel are involved in this area by assisting, especially in the
peak season. This indicates that this area might have contained the highest bacterial richness, because
studies have indicated that humans are a source of bacteria and increase the composition of bacteria in
an area (Adams et al., 2015).
The Shannon-Weaver diversity index provides important information about the rarity and commonness
of species in a community (Biradar et al., 2017). For this reason, Shannon-Weaver diversity index (H)
values were obtained from the DGGE profile of each lane. This diversity index showed that the index of
species diversity from low to medium was 0.69-3.58 (Table 5.6). The lowest OTUs, Ranged-weighted-
richness and Shannon-Weaver diversity rates were detected in Area 1 for the off-peak season. Earlier
studies showed changing values for the Shannon-Weaver diversity index during different seasons in
different designated areas, which clearly suggests that both the number of species and the number of
individuals within species may change during different seasons as well as within different regions
(Bonetta et al., 2010; Osimani et al., 2013). This might have been the case in this study for Area 1
during the off-peak season.
When both diversity and richness increase, the Shannon-Weaver diversity index value also increases
(Biradar et al., 2017). The highest bacterial diversity was observed for Area 4 (peak and off-peak
seasons) and Area 5 (off-peak season), and this corresponded with the number of OTUs, range
weighted richness and the Shannon-Weaver diversity index. These three samples were also clustered
together (Figure 5.9) with a similarity of >80%. These results might indicate that these three areas had
bioaerosols of the same composition corresponding with the DGGE image (Figure 5.8). Area 4
(dispersion of bottles) had poor ventilation (airflow recorded was 0 m.s-1), was full of dust and was
occupied by personnel who dispensed the bottles. These results may indicate that the high bacteria
diversity in Area 4 might have affected Area 5, where the final product was filled.
The journey to develop much-needed standardised methods for bioaerosol research has been
challenging due to major technical limitations. One challenge is that bioaerosol concentrations are
naturally diluted in the environment (Luhung et al., 2015). Moreover, low concentrations of interest led
to detection limits and sensitivity problems in subsequent analyses. In consideration of the possible
limitations in the detection of the non-culturable fraction of bioaerosols, the following can be done to
© Central University of Technology, Free State

C h a p t e r 5
178
optimise the process: (i) the source of the bioaerosols must be understood; (ii) a clear result-focused
sampling design must be followed (e.g., a higher flowrate or longer duration); (iii) a focused and
improved sampling extraction process must be selected; (iv) if needed, extract concentrated DNA; (v)
choose the primer carefully as it is one of the most important factors in achieving accuracy in culture-
independent analyses (with low DNA content, this needs to be species-specific); (vi) utilise appropriate
sequencing technology; and (vii) workflow should be carefully chosen and specifically adapted to meet
the requirements of the project.
© Central University of Technology, Free State

C h a p t e r 5
179
5.4. Conclusion
The bacterial community structure was analysed using the PCR-DGGE method. The PCR-DGGE
method could rapidly analyse a large number of samples without having to know any specific
sequences in the sample. This not only makes it possible to resolve complex ecosystems, but also
enables the analysis of dynamic changes of the microbial community in different environments or time
periods. This method is a useful way to study the microbial community in bioaerosols. Cluster, OTU,
Range weighted richness and the Shannon-Weaver diversity index were used to determine the
richness and diversity of the bioaerosols.
The PCR-DGGE results indicated that the diversity of bacteria was moderately distributed. Three
samples were significant: (i) Area 4 during peak season; (ii) Area 4 during off-peak season; and (iii)
Area 5 during off-peak season. These samples had the highest similarity (>80%), the highest OTUs
(10.00-12.00), the highest specie richness (8.00-11.52), and the highest diversity (3.55-3.58). Area 4
(dispersion of bottles) had poor ventilation and was full of dust, which made this the perfect
environment for bacteria to grow. Area 5 comprised mainly of automated machinery for filling the bottles
with the final product. The system did not function in a completely automated manner and staff
members still needed to assist with packing bottles before filling, closing bottles after filling, labelling
bottles, and packing filled bottles for shipment. A further complication was the fact that more than one
product was filled simultaneously. The combination of machinery and personnel contributed to a
compact atmosphere in this area, making it ideal for bacteria to grow. Moreover, in this designated area
the similarities that were detected indicated an evolutionary relationship, spread and interaction among
the bacterial communities.
Because the PCR-DGGE technique was used to determine the diversity of bacteria in the air, it was
possible to analyse the differences in the number of bacteria and their diversity using samples from
different areas and seasons. Nevertheless, one of the disadvantages in molecular methods is that
protocols tend to be specific to each project and thus differ from one study to another. There is thus
clearly a need to establish the relationship between culture-dependent and culture-independent
approaches when studying bacterial diversity in bioaerosols.
Evidence has increasingly indicated that there is a need for combining molecular tools and
environment-specific culture-dependent approaches when studying bioaerosols. Optimisation can
sometimes be a long and tedious process; however, omitting this critical step will greatly decrease the
accuracy of the results. In light of the potential limitations in detecting the non-culturable fraction of
© Central University of Technology, Free State
C h a p t e r 5
180
bioaerosols, the following can be done to optimise the process: (i) the source of the bioaerosols must
be understood; (ii) a clear result-focused sampling design must be followed (e.g., a higher flowrate or
longer duration); (iii) a focused and improved sampling extraction process must be selected; (iv) if
needed, extract concentrated DNA; (v) choose the primer carefully as it is one of the most important
factors in achieving accuracy in culture-independent analyses (e.g., with low DNA content, this needs to
be specie-specific); (vi) utilise appropriate sequencing technology; and (vii) workflow should be carefully
chosen and specifically adapted to meet the requirements of the project. If these considerations are
not attended to, this field may never be comprehensively understood.
© Central University of Technology, Free State
C h a p t e r 5
181
5.5. References
ADAMS, R.I., BHANGAR, S., PASUT, W., ARENS, E.A., TAYLOR, J.W., LINDOW, S.E., NAZAROFF,
W.W. & BRUNS, T.D. 2015. Chamber bioaerosol study: outdoor air and human occupants as sources
of indoor airborne microbes. PLOS ONE 10(7), e0133221.
AHMED, P.M., MORE, S.A. & KRISHMARAJ, P.U. 2019. In silico denaturing gradient gel
electrophoresis-based evaluation of 16S rDNA primers for metagenomics studies. Research Journal of
Biotechnology 14(2), 54-61.
ALBERTSEN, M., KARST, S.M., ZIEGLER, A.S., KIRKEGAARD, R.H. & NIELSEN, H. 2015. Back to
basics: the influence of DNA extraction and primer choice on phylogenetic analysis of activated sludge
communities. PLOS ONE, 19-24.
AL-AWADHI, H., DASHTI, N., KHANAFER, M., AL-MAILEM, D.M., ALI, N. & RADWON, S.S. 2013.
Bias problems in the molecular-based analysis of environmental bacterial communities: a
representative study on oil-utilization bacteria. Springer Plus 2, 369.
AL-MAILEM, D., KANSOUR, M.K. & RADWAN, S.S. 2017. Capabilities and limitations of DGGE for the
analysis of hydrocarbonoclastic prokaryotic communities directly in environmental samples.
Microbiology Open, 19-31.
ALVAREZ, A.J., BUTTNER, M.P. & STETZENBACH, L.D. 1995. PCR for bioaerosol monitoring:
sensitivity and environmental interference. Applied and Environmental Microbiology 61(10), 3639-44.
AMANN, R.I., BINDER, B.J., OLSON, R.J., CHISHOLM, S.W., DEVEREUX, R. & STAHL, D.A. 1990.
Combination of 16S rRNA-targeted oligonucleotide probes with flow cytometry for analysing mixed
microbial populations. Applied Environmental Microbiology 56, 1919-25.
ANGENENT, L.T., KELLEY, S.T., ST AMAND, A., PACE, N.R. & HERNANDEZ, M.T. 2005. Molecular
identification of potential pathogens in water and air of a hospital therapy pool. Proceedings of the
National Academy of Sciences of the United States of America 102(13), 4860-65.
ARIEFDJOHAN, M.W., SAVAIANO, D.A. & NAKATSU, C.H. 2010. Comparison of DNA extraction kits
for PCR-DGGE analysis of human intestinal microbial communities from fecal specimens. Nutrition
Journal 9(23), 17-25.
© Central University of Technology, Free State

C h a p t e r 5
182
AYDIN, S., SHABI, A., OZBAYRAM, E.G., INCE, B. & INCE, O. 2015. Use of PCR-DGGE-based
molecular methods for the assessment of microbial diversity during anaerobic treatment of antibiotic
combinations. Bioresource Technology 192, 735-40.
BARROS, A.F., BORGES, N.A., FERREIRA, D.C., CARMO, F.L., ROSADO, A.S., FOUQUE, D. &
MAFRA, D. 2015. Is there interaction between gut microbial profile and cardiovascular risk in chronic
kidney disease patients? Future Microbiology 10(4), 517-26.
BEGGS, P.J., SIKOPARIJA, B. & SMITH, M. 2017. Aerobiology in the International Journal of
Biometeorology, 1957-2017. International Journal Biometeorology 61, 51-58.
BIRADAR, B.G., PATIL, C.R. & PASHA, M.A. 2017. Bacterial community analysis of soybean (Glycine
max) sprayed with Panchagavya revealed by DGGE. International Journal of Current Microbiology and
Applied Sciences 6(4), 1207-17.
BONETTA, S., BONETTA, S., MOSSO, S., SAMPO, S. & CARRARO, E. 2010. Assessment of
microbiological indoor air quality in an Italian office building equipped with an HVAC system.
Environmental Monitoring Assessment 161, 473-83.
BOWERS, R.M., SULLIVAN, A.P., COSTELLO, E.K., COLLETT, J.L., KNIGHT, R. & FIERER, N. 2011.
Sources of bacteria in outdoor air across cities in the Midwestern United States. Applied Environmental
Microbiology 77(18), 6350-56.
BRODLE, E.L., DESANTIS, T.Z., MOBERG PARKER, J.P., ZUBLETTA, I.X., PICENO, Y.M. &
ANDERSEN, G.L. 2007. Urban aerosols harbour diverse and dynamic bacterial populations.
Proceedings of the National Academy of Sciences of the United States of America 104(1), 299-304.
CAO, C., JIANG, W., WANG, B., FANG, J., LANG, J., TIAN, G., JIANG, J. & ZHU, T.F. 2014. Inhalable
microorganisms in Beijing’s PM2.5 and PM10 pollutants during a severe smog event. Environmental
Science & Technology 48, 1499-507.
CHEN, R., ZHAO, A., CHEN, H., ZHAO, Z., CAI, J., WANG, C., YANG, C., LI, H., XU, X., HA, S., LI, T.
& KAN, H. 2015. Cardiopulmonary benefits of reducing indoor particles of outdoor origin. Journal of the
American College of Cardiology 6(21), 2279-87.
COCOLIN, L., MANZANO, M., CANTONI, C. & COMI, G. 2001. Denaturing gradient gel electrophoresis
analysis of the 16S rRNA gene V1 region to monitor dynamic changes in the bacterial population during
fermentation of Italian sausages. Applied Environmental Microbiology 67, 5113-21.
© Central University of Technology, Free State

C h a p t e r 5
183
COLLADO, M.C., RAUTAVA, S., AAKKO, J., ISOLAURI, E. & SALMINEN, S. 2016. Human gut
colonisation may be initiated in veto by distinct microbial communities in the placenta and amniotic fluid.
Scientific Report 6, 77-90.
CUI, H.L., ZHOU, P.J., OREN, A. & LIU, S.J. 2009. Intraspecific polymorphism of 16S rRNA genes in
two halophilic archaeal genera: Haloarcula and Halomicrobium. Extremophiles 13, 31-37.
DAHLOF, I., BAILLIE, H. & KJELLEBERG, S. 2000. rpoB-Based microbial community analysis avoids
limitations inherent in 16S rRNA gene intraspecies heterogeneity. Applied and Environment
Microbiology 66, 3376-80.
DESANTIS, T.Z., STONE, C.E., MURRAY, S.R., MOBERG, J.P. & ANDERSEN, G.L. 2005. Rapid
quantification and taxonomic classification of environmental DNA from both prokaryotic and eukaryotic
origins using a microarray. FEMS Microbiology Letters 245, 271-78.
DESPRES, V.R., NOWOISKY, J.F., KLOSE, M., CONRAD, R., ANDREAE, M.O. & POSCHL, U. 2007.
Characterization of primary biogenic aerosol particles in urban, rural, and high-alpine air by DNA
sequence and restriction fragment analysis of ribosomal RNA genes. Biogeosciences 4, 1127-41.
DESPRES, V.R., HUFFMAN, J.A., BURROWS, S.M., HOOSE, C., SAFATOV, A.S., BURYAK, G.,
FROHLICH-NOWOISKY, J., ELBERT, W., ANDREAE, M.O., POSCHL, U. & JAENICKE, R. 2012.
Primary biological aerosol particles in the atmosphere: a review. Tellus B: Chemical and Physical
Meteorology 64, 3059.
DIEZ, B., PEDROS-ALIO, C., MARSH, T.L. & MASSANA, R. 2001. Application of denaturing gradient
gel electrophoresis (DGGE) to study the diversity of marine Picoeukaryotic assemblages and
comparison of DGGE with other molecular techniques. Applied and Environmental Microbiology 67(7),
2942-51.
DOUWES, J., THORNE, P., PEAARCE, N. & HEEDERIK, D. 2003. Bioaerosol health effects and
exposure assessment: progress and prospects. Annual Occupational Hygiene 47, 187-200.
EL-SAYED, W.S., OUF, S.A. & MOHAMED, A-A.H. 2015. Deterioration to extinction of wastewater
bacteria by non-thermal atmospheric pressure air plasma as assessed by 16S rDNA-DGGE
fingerprinting. Frontiers in Microbiology 6, 29-42.
ERCOLINI, D., MOSCHETTI, G., BLAIOTTA, G. & COPPOLA, S. 2001. The potential of a polyphasic
PCR-DGGE approach in evaluating microbial diversity of natural whey cultures for water-buffalo
© Central University of Technology, Free State

C h a p t e r 5
184
mozzarella cheese production: bias of culture-dependent and culture-independent analyses.
Systematic Applied Microbiology 24, 610-17.
FAHLGREN, C., GOMEZ-CONSARNAU, L., ZABORI, J., LINDH, M.V., RADOVAN, K.,
MARTENSSON, E.M., NILSSON, D. & PINHASSI, J. 2015. Seawater mesocosm experiments in the
Arctic uncover differential transfer of marine bacteria to aerosols: bacteria in Arctic marine aerosols.
Environmental Microbiology, 44-81.
FERGUSON, R.M.W., GARCIA-ALCEGA, S., COULON, F., DUMBRELL, A.J., WHITBY, C. &
COLBECK, I. 2019. Bioaerosol biomonitoring: sampling optimization for microbial ecology. Molecular
Ecology Resources 19, 672-90.
FIERER, N., LIU, Z., RODRIQUEZ-HERNANDEZ, M., KNIGHT, R., HENN, M. & HERNANDEZ, M.T.
2008. Short-term temporal variability in airborne bacterial and fungal populations. Applied
Environmental Microbiology 74, 200-07.
FROHLLICH-NOWOISKY, J., PICKERSGILL, D.A., DESPRES, V.R. & POSCHL, U. 2009. High
diversity of fungi in air particulate matter. Proceedings of the National Academy of Sciences of the
United States of America 106(31), 12814-19.
FROHLICH-NOWOISKY, J., BURROWS, S.M., XIE, Z., ENGLING, G., SOLOMON, P.A., FRASER,
M.P., MAYOL-BRACERO, O.L., ARTAXO, P., BEGEROW, D., CONRAD, R., ANDREAE, M.O.,
DESPRES, V.R. & POSCHL, U. 2012. Biogeography in the air: fungal diversity over land and oceans.
Biogeosciences 9, 1125-36.
GONZALEZ, J.M. & SAIZ-JIMENEZ, C. 2005. A simple fluorimetric method for the estimation of DNA-
DNA relatedness between closely related microorganisms by thermal denaturation temperatures.
Extremophiles 9, 75-79.
GORNY, R.L., DUTKIEWICZ, J. & KRYSINSKA-TRACZYK, E. 1999. Size distribution of culturable
airborne microorganisms in outdoor environments in Beijing, China. Annals of Agricultural and
Environmental Medicine 6(2), 105-13.
GRIFFIN, D.W. 2007. Atmospheric movement of microorganisms in clouds of desert dust and
implications for human health. Clinical Microbial Review 20, 459-77.
© Central University of Technology, Free State
C h a p t e r 5
185
GRIFFIN, D.W., KELLOGG, C.A. & SHINN, E.A. 2001. Dust in the wind: long-range transport of dust in
the atmosphere and its implications for global public and ecosystem health. Global Change in Human
Health 2, 20-33.
HAN, I., LEE, T.K., HAN, J., DOAN, T.V., KIM, S.B. & PARK, J. 2012. Improved detection of microbial
risk of releasing genetically modified bacteria in soil by using massive sequencing and antibiotic
resistance selection. Journal of Hazard Material 227-228, 172-78.
HARTUNG, A., MAKAREWICZ, O., EGERER, R., KARRASCH, M., KLINK, A., SAUERBREI, A.,
KENTOUCHE, K. & PLETZ, M.W. 2019. EBV miRNA expression profiles in different infection stages: a
prospective cohort study. PLOS ONE, 17-30.
HE, Y., CAPORASO, J.G., JIANG, X-T., SHENG, H-F., HUSE, S.M., RIDEOUT, J.R., EDGAR, R.C.,
KOPYLOVA, E., WALTERS, W.A., KNIGHT, R. & ZHOU, H-W. 2015. Stability of operational taxonomic
units: an important but neglected property for analysing microbial diversity. Microbiome 3(20), 90-100.
HEAD, I.M., SAUNDERS, J.R. & PICKUP, R.W. 1998. Microbial evolution, diversity and ecology: a
decade of ribosomal RNA analysis of uncultivated microorganisms. Microbial Ecology 35, 1-21.
HOGERWERF, L., BORLEE, F., STILL, K., HEEDERIK, D., VAN ROTTERDAM, B., DE BRUIN, A.,
NIELEN, M. & WOUTERS, I.M. 2012. Detection of Coxiella burnetii DNA in inhalable airborne dust
samples from goat farms after mandatory culling. Applied Environmental Microbiology 78(15), 5410-12.
HUGHES, R., ALKAN, Z., KEIM, N.L. & KABLE, M.E. 2017. Impact of sequence variant detection and
bacterial DNA extraction methods on the measurement of microbial community composition in human
stool. BioRixiv, 279-88.
JEON, E.M., KIM, H.J., JUNG, K., KIM, J.H., KIM, M.Y., KIM, Y.P. & KA, J-O. 2011. Impact of Asian
dust events on airborne bacterial community assessed by molecular analyses. Atmospheric
Environment 45, 4313-21.
JULIEN, M.C., LAFRENIERE, C., ANTOUN, H. & DROUNIN, P. 2008. Sources of clostridia in raw milk
on farms. Applied Environmental Microbiology 74, 6348-57.
KIM, K.Y. & KIM, C.N. 2007. Airborne microbiological characteristics in public buildings of Korea.
Building and Environment 42(5), 2188-96.
© Central University of Technology, Free State

C h a p t e r 5
186
KORVES, T.M., PICENO, Y.M., TOM, L.M., DESANTIS, T.Z., JONES, B.W., ANDERSEN, G.L. &
HWANG, G.M. 2013. Bacterial communities in commercial aircraft high-efficiency particulate air (HEPA)
filters assessed by PhyloChip analysis. Indoor Air 23, 50-61.
KURTZMAN, C.P. & ROBNETT, C.J. 1998. Identification and phylogeny of yeasts from analysis of
nuclear large subunit (26S) ribosomal DNA partial sequence. Antonie van Leeuwenhoek 73, 331-71.
LABUSCHAGNE, M. & ALBERTYN, J. 2007. Cloning of an epoxide hydrolase-encoding gene from
Rhodotorula mucilaginosa and functional expression in Yarrowia lipolytica. Yeast 24, 69-78.
LAFORGUE, R., GUERIN, L., PERNELLE, J.J. & MONNET, C., DUPONT, J. & BOUIX, M. 2009.
Evaluation of PCR-DGGE methodology to monitor fungal communities on grapes. Journal of Applied
Microbiology 107, 1208-18.
LARA, J., GONZALEZ, L.E., FERRERO, M., DIAZ, G.C., PEDROS-ALIO, C. & DEMERGASSO, C.
2012. Enrichment of arsenic transforming and resistant heterotrophic bacteria from sediments of two
salt lakes in Northern Chile. Extremophiles 16, 523-38.
LEE, J.Y., PARK, E.H., LEE. S., KO, G., HONDA, Y., HASHIZUME, M., DENG, F., YI, S. & KIN, H.
2017. Airborne bacterial communities in three East Asian cities of China, South Korea, and Japan.
Nature Research Journal 7, 5540-50.
LEE, S., CHOI, B., YI, S. & KO, G. 2009. Characterization of microbial community during Asian dust
events in Korea. Science Total Environment 407, 5308-14.
LEE, S-H., LEE, H-J., KIM, S-J., LEE, H.M., KANG, H. & KIM, Y.P. 2010. Identification of airborne
bacterial and fungal community structures in an urban area by T-RFLP analysis and quantitative real-
time PCR. Science of the Total Environment 408, 1349-57.
LI, Y., LU, R., LI, W., XIE, Z. & SONG, Y. 2017. Concentrations and size distributions of viable
bioaerosols under various weather conditions in a typical semi-arid city of Northwest China. Journal of
Aerosol Science 106, 83-92.
LIBERT, X., PACKEU, A., BUREAU, F., ROOSENS, N.H. & DE KEERSMAECKER, S.C.J. 2017.
Development and performance assessment of a luminex xMAP® direct hybridization assay for the
detection and identification of indoor air fungal contamination. PLOS ONE, 19-27.
LUHUNG, I., WU, Y., NG, C.K., MILLER, D., CAO, B. & CHANG, V.W-C. 2015. Protocol improvements
for low concentration DNA-based bioaerosol sampling and analysis. PLOS ONE, 79-97.
© Central University of Technology, Free State

C h a p t e r 5
187
LV, X-C., WENG, X., ZHANG, W., RAO, P-F. & NI, L. 2012. Microbial diversity of traditional
fermentation starters for Hong Qu glutinous rice wine as determined by PCR-mediated DGGE. Food
Control 28, 426-34.
MARCHESI, J.R., SATO, T., WEIGHTMAN, A.J., MARTIN, T.A., FRY, J.C., HIOM, S.J. & WADE, W.G.
1998. Design and evaluation of useful bacterium-specific PCR primers that amplify genes coding for
bacterial 16S rRNA. Applied and Environmental Microbiology 64(2), 795-99.
MARTINEZ-ALONSO, M., ESCOLANO, J., MONTESINOS, E. & GAJU, N. 2010. Diversity of the
bacterial community in the surface soil of a pear orchard based on 16S rRNA gene analysis.
International Microbiology 13, 123-34.
MARZORATI, M., WITTEBOLLE, L., BOON, N., DAFFONCHIO, D. & VERSTRAETE, W. 2008. How to
get more out of molecular fingerprints: practical tools for microbial ecology. Environmental Microbiology
10(6), 1571-1581.
MEADOW, J.F., ALTRICHTER, A.E., KEMBEL, S.W., KLIE, J., MHUIREACH, G., MORIYAMA, M.,
NORTHCUTT, D., CONNOR, T.K.O., WOMACK, A.M., BROWN, G.Z., GREEN, J.L. & BOHANNAN,
B.J.M. 2014. Indoor airborne bacterial communities are influenced by ventilation, occupancy and
outdoor air source. Indoor Air 24, 41-48.
MEDLIN, I., ELWOOD, H.J., STICKEL, S. & SOGIN, M.L. 1988. The characterization of enzymatically
amplified eukaryotic 16S-like rRNA-coding regions. Gene 71, 491-99.
MEKLIN, T., REPONEN, T., TOIVOLA, M., KOPONE, V., HUSMAN, T., HYVARINEN, A. 2002. Size
distribution of airborne microbes in moisture-damaged and reference school building of two construction
types. Atmospheric Environment 36(39-40), 6031-39.
MOLSA, M., KALIN-MANTTARI, L., TONTERI, E., HEMMILA, H. & NIKKARI, S. 2016. Comparison of
four commercial DNA extraction kits for the recovery of Bacillus spp. spore DNA from spiked powder
samples. Journal of Microbiological Methods 128, 69-73.
MOTATO, K.E., MILANI, C., VENTURA, M., VALENCIA, F.E., RUAS-MADIEDO, P. & DELGADO. S.
2017. Bacterial diversity of the Colombian fermented milk ‘Suero Costeno’ assessed by culturing and
high-throughput sequencing and DGGE analysis of 16S rRNA gene amplicons. Food Microbiology 68,
129-36.
© Central University of Technology, Free State

C h a p t e r 5
188
MUYZER, G., DE WAAL, E.C. & UITTERLINDEN, A.G. 1993. Profiling of complex microbial
populations by denaturing gradient gel electrophoresis analysis of polymerase chain reaction-amplified
genes coding for 16S rRNA. Applied Environmental Microbial 59, 695-700.
NASIR, Z.A. & COLBECK, I. 2010. Assessment of bacterial and fungal aerosol in different residential
settings. Water Air Soil Pollution, 211, 367-77.
NDIAYE, N.A., HAMDOUCHE, Y., KANE, A., CISSE, M., BERTHIOT, L., TOURE-KANE, N.C. &
MONTET, D. 2016. Application of PCR-DGGE to the study of dynamics and biodiversity of microbial
contaminants during the processing of Hibiscus sabdariffa drinks and concentrates. Fruits 71(3), 141-
49.
NIEGUITSILA, A., DEVILLE, M., JAMAL, T., HALOS, L., BERTHELEMY, M., CHERMETTE, R.,
LATOUCHE, S. & ARNE, P. 2007. Evaluation of fungal aerosols using temporal temperature gradient
electrophoresis (TTGE) and comparison with culture. Journal of Microbiology Methods 70, 86-95.
NORRIS, F., SIEGEL, J.A. & KINNEY, K.A. 2011. Evaluation of HVAC filters as a sampling mechanism
for indoor microbial communities. Atmospheric Environment 45, 338-46.
O’BRIEN, K.M., CHIMENTI, M.S., FARNELL, M., TABLER, T., BAIR, T., BRAY, J.L. & NONNENMANN,
M.W. 2016. High throughput genomic sequencing of bioaerosols in broiler chicken production facilities.
Microbial Biotechnology, 782-92.
O’DONNELL, K. 1993. Fusarium and its near relatives. The fungal holomorph: mitotic, meiotic and
pleomorphic speciation in fungal systematics, DEMBILIO, O & JACAS, J.A. 1993. The fungal
holomorph: mitotic, meiotic and pleomorphic speciation in fungal systematics. CAB International,
Wallingford, 225-33.
OGIER, J.C., SON, O., GRUSS, A., TAILLIEZ, P. & DELACROIX-BUCHET, A. 2002. Identification of
bacterial microflora in dairy products by temporal temperature gradient gel electrophoresis. Applied
Environmental Microbiology 68, 3691-701.
OSIMANI, A., AQUILANTI, L., TAVOLETTI, S. & CLEMENTI, F. 2013. Microbiological monitoring of air
quality in a university canteen: an 11-year report. Environmental Monitoring Assessment 185, 4765-74.
OSIMANI, A., GAROFALO, C., MILANOVIC, V., TACCARI, M., AQUILANTI, L., POLVERIGIANI, S. &
CLEMENTI, F. 2016. Indoor air quality in mass catering plants: occurrence of airborne eumycetes in a
university canteen. International Journal of Hospitality Management 59, 1-10.
© Central University of Technology, Free State
C h a p t e r 5
189
PANKHURST, L.J., WHITBY, C., PAWLETT, M., LARCOMBE, L.D., MCKEW, B., DEACON, L.J.,
MORGAN, S.L., VILLA, R., DREW, G.H., TYRREL, S., POLLARD, S.J.T. & COULON, F. 2012.
Temporal and spatial changes in the microbial bioaerosol communities in green-waste composting.
FEMS Microbiology Ecology 79, 229-39.
PARK, J-W., PARK, C.W., LEE, S.H. & HWANG, J. 2015. Fast monitoring of indoor bioaerosol
concentrations with ATP bioluminescence assay using an electrostatic rod-type sampler. PLOS ONE
10(5), 19-29.
PARK, J., ICHILO, T., NASU, M. & YAMAGUCHI, N. 2016. Investigation of bacterial effects of Asian
dust events through comparison with seasonal variability in outdoor airborne bacterial community.
Scientific Reports, 20-28.
POLZ, M.F. & CAVANAUGH, C.M. 1998. Bias in template-to-product ratios in multitemplate PCR.
Applied and Environment Microbiology 64, 3724-30.
POULSEN, C.S., PAMP, S.J., EKSTROM, C.T. & AARESTRUP, F.M. 2019. Library preparation and
sequencing platform introduce bias in metagenomics characterisation of microbial communities.
BioRxiv, 17-29.
RADOSEVICH, J.L., WILSON, W.J., SHINN, J.H., DESANTIS, T.Z. & ANDERSEN, G.L. 2002.
Development of a high-volume aerosol collection system for the identification of air-borne micro-
organisms. Letters in Applied Microbiology 34, 162-67.
RITTENOUR, W.R., CIACCIO, C.E., BARNES, C.S., KASHON, M.L., LEMONS, A.R., BEEZHOLD,
D.H., & GREEN, B.J. 2013. Internal transcribed spacer rRNA gene sequencing analysis of fungal
diversity in Kansas City indoor environments. Environmental Science Process Impacts 16(1), 33-43.
ROBERTSON, C.E., BAUMGARTNER, L.K., HARRIS, J.K., PETERSON, K.L., STEVENS, M.J.,
FRANK, D.N., & PACE, N.R. 2013. Culture-independent analysis of aerosol microbiology in a
metropolitan subway system. Applied and Environmental Microbiology 79(11), 3485-93.
SANCHEZ-MONEDERO, M.A., STENIFORD, E.I. & URPILAINEN, S.T. 2005. Bioaerosol generation at
large-scale green waste composting plants. Journal of the Air & Waste Management Association 55(5),
612-18.
© Central University of Technology, Free State
C h a p t e r 5
190
SANTAMARIA, J., PARRADO, C.A. & LOPEZ, L. 2018. Soil microbial community structure and
diversity in cut flower cultures under conventional and ecological management. Rev Bras Cienc Solo
42, 16-27.
SEKIGUCHI, H., TOMIOKA, N., NAKAHARA, T. & UCHIYAMA, H. 2001. A single band does not
always represent single bacterial strains in denaturing gel electrophoresis analysis. Biotechnology
Letters 23, 1205-08.
SHADE, A., HOGAN, C.S., KLIMOWICZ, A.K., LINSKE, M., MC MANUS, P.S. & HANDELSMAN, J.
2012. Culturing captures members of the soil rare biosphere. Environmental Microbiology 14(9), 2247-
52.
SHANNON, C.E. & WEAVER, W. 1999. The mathematical theory of communication. Urbana: University
of Illinois Press.
SHEPHERD, M.L., SWECKER, W.S. & PONDER, M.A. 2015. Effect of two different commercial DNA
extraction kits on the bacterial 16S ribosomal RNA gene denaturing gradient gel electrophoresis profile
of Arabian gelding faeces. Journal of Equine Veterinary Science 35(2), 165-69.
SIPOS, R., SZEKELY, A.J., PALATINSKY, M., REVESZ, S., MARIALIGETI, K. & NIKOLAUSZ, M.
2007. Effect of primer mismatch, annealing temperature and PCR cycle number on 16S rRNA gene-
targeting bacterial community analysis. FEMS Microbiology Ecology 60, 341-50.
SOGIN, M.L. & GUNDERSON, J.H. 1987. Structural diversity of eukaryotic small subunit ribosomal
RNAs. Annual New York Academy Science 503, 125-39.
SOLEIMANI, Z., GOUDARZI, G., SOROOSHIAN, A., MARZOUNI, M.B. & MALEKI, H. 2016. Impact of
Middle Eastern dust storms on indoor and outdoor composition of bioaerosols. Atmospheric
Environment 138, 135-43.
SUZUKI, M.T. & GIOVANNONI, S.J. 1996. Bias caused by template annealing in the amplification of
mixtures of 16S rRNA genes by PCR. Applied and Environment Microbiology 62, 625-30.
TANAKA, D., TERADA, Y., NAKASHIMA, T., SAKATOKU, A. & NAKAMURA, S. 2015. Seasonal
variations in airborne bacterial community structures at a suburban site of central Japan over a 1-year
time period using PCR-DGGE method. Aerobiologica 31, 143-57.
TRINGE, S.G. & HUGENHOLTZ, P. 2008. A renaissance for the pioneering 16S rRNA gene. Current
Opinion of Microbiology 11, 442-46.
© Central University of Technology, Free State
C h a p t e r 5
191
URBANO, R., PALENIK, B., GASTON, C.J. & PRATHER, K.A. 2011. Detection and phylogenetic
analysis of coastal bioaerosols using culture dependent and independent techniques. Biogeosciences
8, 301-09.
VESPER, S., MCKINSTRY, C., HARTMANN, C., NEACE, M., YODER, S. & VESPER, A. 2007.
Quantifying fungal viability in air and water samples using quantitative PCR after treatment with
propidium monoazide (PMA). Journal of Microbiological Methods 72, 180-84.
VIEGAS, C., FARIA, T., MENESES, M., CAROLINO, E., VIEGAS, S., GOMES, A.Q. & SABINO, R.
2016. Analysis of surfaces for characterization of fungal burden: does it matter? International Journal
of Occupational Medicine and Environmental Health 29(4), 623-32.
WANG, C-H., CHEN, B.T., HAN, B-C., LIU, A. C-Y., HUNG, P-C., CHEN, C-Y. & CHAO H.J. 2015.
Field evaluation of personal sampling methods for multiple bioaerosols. PLOS ONE 10(3), 308-27.
WANG, N.A., WANG, H., HUI-YING, L.I.U., IRFAN, M., SHI-WEI, N. & YANG, T. 2016. Diversity of
methane-producing microbial community structure with 16S-V3 rDNA PCR-DGGE. Genetika 48(3).
1111-19.
WEI, K., ZHENG, Y., LI, J., SHEN, F., ZOU, Z., FAN, H., LI, X., WU, C. & YAO, M. 2015. Microbial
aerosol characteristics in highly polluted and near pristine environments featuring different climatic
conditions. Scientific Bulletin 60(16), 1439-47.
WERY, N. 2014. Bioaerosols from composting facilities: a review. Cellular and Infection Microbiology
4(42), 1-9.
WILMETH, D.T., JOHNSON, H.A., STAMPS, B.W., BERELSON, W.M., STEVENSON, B.S., NUNN,
H.S., GRIM, S.L., DILLON, M.L., PARADIS, O., CORSETTI, F.A. & SPEAR, J.R. 2018. Environmental
and biological influences on carbonate precipitation within hot spring microbial mats in Little Hot Creek,
CA. Frontiers in Microbiology 9, 14-27.
XIE, Z., FAN, C., LU, R., LIU, P., WANG, B., DU, S., JIN, C., DENG, S. & LI, Y. 2018. Characteristics of
ambient bioaerosols during haze episodes in China: a review. Environmental Pollution, 1-13.
XU, Z. & YAO, M. 2013. Monitoring of bioaerosols inhalation risk in different environments using a six-
stage Andersen sampler and the PCR-DGGE method. Environmental Monitoring Assessment 185,
3993-4003.
© Central University of Technology, Free State

C h a p t e r 5
192
YAN, D., ZHANG, T., SU, J., ZHAO, L-L., WANG, H., FANG, X-M., ZHANG, Y-Q., LIU, H-Y. & YU, L-Y.
2016. Diversity and Composition of Airborne Fungal Community Associated with Particulate Matters in
Beijing during haze and non-haze days. Frontiers in Microbiology 7, 99-111.
YANG, Q., ANGLY, F.E., WANG, Z. & ZHANG, H. 2011. Wastewater treatment systems harbour
specific and diverse yeast communities. Biochemical Engineering Journal 58, 168-76.
YOO, K., LEE, T.K., CHOI, E.J., YANG, J., SHUKLA, S.K., HWANG, S. & PARK, J. 2017. Molecular
approaches for the detection and monitoring of microbial communities in bioaerosols: a review. Journal
of Environmental Sciences 51, 234-47.
ZHAO, Y., AARNINK, A.J.A.A., DOORNENBAL, P., HUYNH, T.T.T., GROOT KOERKAMP, P.W.G., DE
JONG, M.C.M. & LANDMAN, W.J.M. 2011. Investigation of the efficiencies of bioaerosol samplers for
collecting aerosolized bacteria using a Fluorescent Tracer. I: effects of non-sampling processes on
bacterial culturability. Aerosol Science and Technology 45, 423-31.
ZHOU, Y., LUTZ, P-E., WANG, Y.C., RAGOUSSIS, J. & TURECKI, G. 2018. Global long non-coding
RNA expression in the rostral anterior cingulate cortex of depressed suicides. Translational Psychiatry
8(224), 29-42.
© Central University of Technology, Free State
C h a p t e r 6
193
CHAPTER 6
CONCLUSIONS AND RECOMMENDATIONS
6.1. Introduction
Limited data, the enormous variability in the potential effects of different types of bioaerosols, and non-
existent standards in South Africa for bioaerosol prevalence render bioaerosol risk assessments
challenging and often impractical. Moreover, researchers’ methodologies to collect and analyse
bioaerosols have differed significantly, and it is thus important to find the ideal middle ground between
science and industrial practices in the interest of healthy industrial environments for both workers and
products. The targeted facility monitored air quality on a monthly basis by using passive (air plate)
monitoring.
6.2. Concluding Remarks
Exposure to bioaerosols has become a hotly debated topic in the past decade, but there are still many
unanswered questions such as the following: (i) What complications do bioaerosols cause? (ii) How
does the environment influence bioaerosol composition? (iii) Why is there controversy regarding
sampling procedures and methods? (iv) What impact does sampling procedures have on bioaerosol
recovery? (v) Which dose-response relationships of bioaerosols have an effect on the product and/or
occupational health? and (vi) Why are there still only limited guidelines and standards available?
Bearing these questions in mind, the main objective of this study was to collect both the culturable and
non-culturable fraction of bioaerosols by active sampling in different areas of a fruit juice facility during
peak and off-peak seasons. In addition, this study also aimed to: (i) determine, by using statistical data,
if the temperature and airflow in the manufacturing plant affected the growth of organisms in the
bioaerosols; (ii) compare the outcomes of passive and active sampling methods; (iii) conduct a survey
of the bioaerosols that were detected by cultivating and enumerating the culturable fraction of the
bioaerosols; (iv) identify the culturable and non-culturable fraction of the bioaerosols using PCR and
PCR-DGGE analyses; (v) categorise the detected bioaerosols as harmful, innocuous or even useful;
and (vi) compare the data obtained for the culturable and non-culturable bioaerosol fraction.
All living organisms, including bioaerosols, require a specific environment, nutrition and modes of
distribution in order to survive. Two basic environmental parameters, namely temperature and airflow,
are fundamental requirements for bioaerosols to survive and spread. With no temperature control in the
© Central University of Technology, Free State

C h a p t e r 6
194
facility under study, the average recorded temperature of 20.30 ± 1.1C was ideal for bioaerosol
growth. Furthermore, no airflow (0 m.s-1) or ventilation systems were observed, which may have had a
positive or negative impact on the quality of the air in the facility. For example, as the main mode of
bioaerosol distribution (airflow) was not available, the bioaerosols would have relied on other means to
spread through the facility. Moreover, as no airflow or ventilation system was in place, the bioaerosols
were not removed from the facility and might either have ended up in the product or contributed to
potential occupational diseases.
To ensure good air quality in any facility, it is important to measure the concentrations of bioaerosols
that are present, because the number and density of bioaerosols are quick indications of the potential
risks that air poses. Two main sampling methods are available for the quantification of bioaerosols: (i)
passive sampling (this requires petri dishes containing agar that are opened and exposed to the air);
and (ii) active sampling, which physically draws a known volume of air through a particle collection
device. As had been expected, the quantities of bioaerosols observed between the two methods
differed considerably due to the different sampling approaches. Although a well-defined association
was not observed between the two sampling methods, it was notable that at least one of the bioaerosol
counts was outside the specification of the facility, irrespective of whether active or passive sampling
had been used.
The total microbial counts observed were outside the specifications for the majority of the facility during
both seasons. This may have been due to increased levels of airborne organisms in areas that were
frequented by personnel. While yeast and mould were observed throughout the facility during the peak
and off-peak seasons, higher counts were observed during the off-peak season. This was possibly due
to seasonal variation that had already been described by several authors in the past. The microbial,
yeast and mould counts that were observed were elevated with high counts obtained during both
sampling periods. This indicates that the air in this facility created ideal conditions for all the bioaerosols
that were detected. This finding exposed a serious problem as yeast and mould are the main role-
players responsible for spoilage in fruit and more specifically fruit juice, which was what this specific
industry was producing. It is also noteworthy that traces of presumptive positive pathogens were
observed in each of the five areas where samples had been collected. Presumptive positive pathogens
are microorganisms that are capable of developing biofilms on food processing surfaces and have been
associated with foodborne disease outbreaks caused by fruit juice consumption in the past.
Bacteria, yeast and mould are the main groups of microorganisms found in bioaerosols. This study
isolated a total of 239 bacteria, 41 yeasts and 43 moulds from the air in the production environment. Of
© Central University of Technology, Free State
C h a p t e r 6
195
the isolates, 92 different species were identified from culturable fraction. These microorganisms
belonged to 15 different taxonomic orders that were in turn divided into five orders representing
bacteria and ten orders representing yeast and mould. Based on the data, the culturable fraction of the
bioaerosols identified was categorised into three main groups, namely 27 innocuous, 26 useful and 39
harmful bioaerosols.
Innocuous bioaerosols included two dominant genera, namely Bacillus and Staphylococcus. Only four
innocuous yeast and mould genera were detected. Useful bioaerosols detected during the sampling
seasons were again categorised into three groups, namely: (i) medical contribution; (ii) promoting and
protecting plant growth; and (iii) environmental contribution. The fact that harmful bioaerosols were
detected was certainly an aspect that raised concern, especially as Staphylococcus spp.,
Pseudomonas spp., Penicillium spp. and Candida spp. were isolated. All these have been reported
extensively as problematic in the fruit juice industry. These harmful microorganisms have the ability to
be pathogenic/infectious, have multidrug resistance, and have food poisoning/spoilage abilities. Their
detection was quite significant and was considered an aspect that the facility should investigate as a
matter of urgency.
The bacterial community structure was also analysed using PCR-DGGE. The PCR-DGGE method can
be used to rapidly analyse a large number of samples without having to know any specific sequences in
the sample. This not only makes it possible to resolve complex ecosystems, but also to analyse the
dynamic changes of the microbial community in different environments during various time periods.
Diversity, similarity indices and range weighted richness indicated that the diversity of bacteria was
moderately distributed. Three samples were significant: (i) Area 4 (dispersion of bottles) during the peak
season; (ii) Area 4 during off-peak season; and (ii) Area 5 (filling of bottles with the final product) during
off-peak season. These samples had the highest similarity (>80%), the highest OTUs (10.00-12.00), the
highest specie richness (8.00-11.52), and the highest diversity (3.55-3.58). Area 4 had poor ventilation
and was full of dust, making this the perfect environment for bacteria to grow. Area 5 comprised mainly
of automated machinery that filled the bottles with the final product. However, the system was not
completely automated as personnel still needed to pack bottles before filling, fill bottles, close bottles
after filling, label bottles, and pack filled bottles for shipment. A complication was that more than one
product had to be filled simultaneously. The machinery and personnel contributed to a compact
atmosphere in this area which made it ideal for bacterial growth. Although these were designated
areas, the similarities indicated an evolutionary relationship, spread and interaction among the bacterial
communities.
© Central University of Technology, Free State
C h a p t e r 6
196
It is important to emphasise that bioaerosols are ubiquitous environmental contaminants and, in most
cases, they are not an integral part of the standard production process. It would therefore be
inappropriate to simply ‘sample-to-see-what-is-in-the-air’ because the presence of microbes in the air
can be expected. The bioaerosol field is dominated by a lack of consistent data and an abundance of
speculation. The lack of standard methods, environmental guidelines and databases further
complicates the interpretation and comparison of results. In addition, because no single method can
fully characterise all bioaerosol components, it is imperative to do a proper evaluation/investigation
before choosing a sampling method or initiating a sampling protocol. The following comments
summarise important aspects to address when planning a bioaerosol monitoring approach, and these
can also be used as guidelines when future studies are conceptualised.
6.3. Bioaerosol Monitoring Considerations
6.3.1. Sampling motivation
Formulate the objectives for sampling clearly and unambiguously. There is a clear need to be industry-
specific when bioaerosols are sampled. It is also important to establish whether the sampling of
bioaerosols is necessitated by baseline monitoring for compliance or to confront an existing quality
(product) and/or safety (food handler health) problem for which bioaerosols, as causative agents, need
to be ruled out.
6.3.2. Sampling locality
The notion of sampling before doing a critical assessment of the facility is a current shortcoming. This
approach can even be misleading because it produces information that is difficult to interpret, might
create unnecessary concern, and may lead almost inevitably to the sampling having to be repeated
professionally/by external consultants. There is therefore a clear need to be industry- and outcome-
specific before monitoring the presence of bioaerosols in a facility. The focus of the assessment should
include environmental factors, factory design/layout, nature of the equipment, product type, and
conditions impacting food handlers (e.g., their health, shifts/placement, skills level, training, behaviour).
Certain environmental factors such as temperature, airflow and relative humidity can be associated with
bioaerosol levels and factors such as heating, air-conditioning, or ventilating systems may provoke
fluctuations in temperature and relative humidity. Detectable bacterial and fungal levels can also be
affected by these factors because they require specific environmental conditions to grow and
propagate. Sampling sites to consider include areas with negative air pressure, raw material storage
© Central University of Technology, Free State

C h a p t e r 6
197
areas, areas where a lot of dust is generated, under air vents, areas where water spraying or misting
can occur, active floor drains, and areas with high worker activity or other movement.
6.3.3. Selection of bioaerosol components for measurement
The evaluation/investigation should provide information that can be used to establish which bioaerosol
component is of interest: viable microbial components (culture-dependent); or non-viable, but still
bioactive (culture-independent), components. Culture-dependent methods remain important to obtain
information regarding the viability and metabolic activity of these organisms and it is also desirable for
ascertaining the role different microbes play in distinctive processes. Although culture-dependent
methods are by far the most widely used procedures for assessing the microbiological content of
bioaerosols, it is now widely accepted that such methods significantly underestimate the total quantity
of prevalent microbes. General plate count media is a well-known problem as only a small fraction
(10%) of airborne microbes form colonies on a typical culture media, thus leading to a significant
underestimation of the actual viable airborne bioaerosol concentrations. Moreover, a vast number of
remaining airborne microbes can be described as viable but non-culturable, indicating very low
metabolic activity or a resting, dormant state. Dead airborne bacteria or fungi, debris or toxins retain
their allergenic or toxic properties and are therefore also relevant to any occupational health
assessment process. Evidence has increasingly indicated that a clear need exists for combining
molecular tools and environment-specific, culture-dependent approaches when studying bioaerosols.
6.3.4. Choice of equipment
Impingement sampling devices can be used to detect both viable and non-viable bioaerosol
components. Moreover, either viable or non-viable components can be assessed using impaction or
filtration. Choosing a sampling device will also depend on its availability, the level of expertise of the
investigator, and funding.
6.3.5. Sample design and intervals between sampling
When embarking on a new program for compliance monitoring, it is advisable to start with more
frequent data collection sessions as this will allow for baseline establishment. When data are available
to show that the bioaerosols in a system/area are stable enough, the number of data collection points
can be reduced. It is noteworthy that microbial results can differ depending on the activity in a specific
area. Sampling times should also occur during both ‘dynamic’ and ‘static’ conditions for optimal
monitoring.
© Central University of Technology, Free State

C h a p t e r 6
198
6.4 Closing Statements: Future Research, Recommendations to Industry
Until new and reliable techniques for bioaerosol monitoring have been introduced, a common protocol
for their quantification based on currently available methods should be employed to offer a near-uniform
basis to allow cross-comparisons between different experimental data sets. Therefore, further research
is required to establish more appropriate and industry-specific assessment tools for the exposure of
bioaerosols. In this context, the following are recommended: (i) an open network approach; (ii) shared
infrastructure, technical protocols and training programs; (iii) identifying and collaborating with
knowledge-users; and (iv) enhanced capacity-building for response measures.
Information that was elicited by this study may be useful in addressing the gaps in knowledge
mentioned above and to aid the fruit juice industry in better understanding and controlling bioaerosols in
their facilities. This may also relate to other industries where it may be necessary to use more specific
and valid risk assessment protocols for the control of bioaerosols in order to ensure product and
occupational health safety. Future research should focus on designing an application that is industry-
and outcome-specific in order to aid industries in monitoring bioaerosols and thereby limiting
detrimental spoilage and the health risks associated with bioaerosol exposure.
© Central University of Technology, Free State