SHINE Medical Technologies v. 0 - Section 19.03
193
Chapter 19 - Environmental Review Table of Contents SHINE Medical Technologies 19.3-i Rev. 0 SECTION 19.3 DESCRIPTION OF THE AFFECTED ENVIRONMENT Table of Contents Section Title Page 19.3 DESCRIPTION OF THE AFFECTED ENVIRONMENT ..................................19.3-1 19.3.1 LAND USE AND VISUAL RESOURCES .....................................................19.3-1 19.3.2 AIR QUALITY AND NOISE ..........................................................................19.3-9 19.3.3 GEOLOGIC ENVIRONMENT.......................................................................19.3-65 19.3.4 WATER RESOURCES.................................................................................19.3-71 19.3.5 ECOLOGICAL RESOURCES ......................................................................19.3-96 19.3.6 HISTORIC AND CULTURAL RESOURCES ................................................19.3-120 19.3.7 SOCIOECONOMICS....................................................................................19.3-134 19.3.8 HUMAN HEALTH .........................................................................................19.3-164
-
Upload
khangminh22 -
Category
Documents
-
view
4 -
download
0
Transcript of SHINE Medical Technologies v. 0 - Section 19.03
Chapter 19 - Environmental Review Table of Contents
SHINE Medical Technologies 19.3-i Rev. 0
SECTION 19.3
DESCRIPTION OF THE AFFECTED ENVIRONMENT
Table of Contents
Section Title Page
19.3 DESCRIPTION OF THE AFFECTED ENVIRONMENT..................................19.3-1
19.3.1 LAND USE AND VISUAL RESOURCES .....................................................19.3-1
19.3.2 AIR QUALITY AND NOISE ..........................................................................19.3-9
19.3.3 GEOLOGIC ENVIRONMENT.......................................................................19.3-65
19.3.4 WATER RESOURCES.................................................................................19.3-71
19.3.5 ECOLOGICAL RESOURCES ......................................................................19.3-96
19.3.6 HISTORIC AND CULTURAL RESOURCES................................................19.3-120
19.3.7 SOCIOECONOMICS....................................................................................19.3-134
19.3.8 HUMAN HEALTH.........................................................................................19.3-164

Chapter 19 - Environmental Review List of Tables
SHINE Medical Technologies 19.3-ii Rev. 0
List of Tables
Number Title
19.3.1-1 Summary of 2006 Land Use/Land Cover within SHINE Site and Region
19.3.1-2 Crop Production Estimates for SHINE Site and Rock County, Wisconsin
19.3.1-3 City of Janesville Land Use
19.3.2-1 Selected Characteristics of Wisconsin Physiographic Provinces
19.3.2-2 Madison, Wisconsin Climatic Means and Extremes
19.3.2-3 Rockford, Illinois Climatic Means and Extremes
19.3.2-4 Madison, Wisconsin and Rockford, Illinois Additional Climatic Means and Extremes
19.3.2-5 List of NOAA ASOS Stations Located within the Site Climate Region
19.3.2-6 List of NOAA COOP Stations in the Site Climate Region for which Clim-20 Summaries are Available
19.3.2-6 List of NOAA COOP Stations in the Site Climate Region for which Clim-20 Summaries are Available
19.3.2-7 Nearest Federal Class I Areas to the SHINE Site
19.3.2-8 Regional Tornadoes and Waterspouts
19.3.2-9 Details of Strongest Tornadoes in Rock County, Wisconsin
19.3.2-10 Details of Strongest Tornadoes in Surrounding Counties Adjacent to Rock County, Wisconsin
19.3.2-11 Precipitation Extremes at Local and Regional NOAA COOP Meteorological Monitoring Stations within the Site Climate Region
19.3.2-12 Mean Seasonal and Annual Hail or Sleet Frequencies at Rockford, Illinois and Madison, Wisconsin
19.3.2-13 Ice Storms that have Affected Rock County, Wisconsin
19.3.2-14 Mean Seasonal Thunderstorm Frequencies at Rockford, Illinois and Madison, Wisconsin

Chapter 19 - Environmental Review List of Tables
SHINE Medical Technologies 19.3-iii Rev. 0
List of Tables(Continued)
Number Title
19.3.2-15 Design Wet and Dry Bulb Temperatures
19.3.2-16 Estimated 100-Year Return Maximum and Minimum DBT, MCWB coincident with the 100-Year Return Maximum DBT, Historic Maximum WBT and Estimated 100-Year Annual Maximum Return WBT
19.3.2-17 Dry Bulb Temperature Extremes at Local and Regional NOAA COOP Meteorological Monitoring Stations within the Site Climate Region
19.3.2-18 FAA Specifications for Automated Weather Observing Stations
19.3.2-19 Annual Data Recovery Rates (in Percent) of Dry Bulb Temperatures, Relative Humidity, Wind Speed, and Wind Direction from the Southern Wisconsin Regional Airport for 2005-2010
19.3.2-20 Historical Dry Bulb Temperatures, Relative Humidity, and Wind Speed from the Southern Wisconsin Regional Airport for 2005-2010
19.3.2-21 Annual Joint Data Recovery Rates of Wind Speed, Wind Direction, and Computed Pasquill Stability Class from the Southern Wisconsin Regional Airport
19.3.2-22 Pasquill Stability Class Frequency Distributions from the Southern Wisconsin Regional Airport (Percent) 2005-2010
19.3.2-23 Joint Frequency Distribution of Wind Speed and Wind Direction from the Southern Wisconsin Regional Airport 2005-2010 (Pasquill Stability Class A)
19.3.2-24 Joint Frequency Distribution of Wind Speed and Wind Direction from the Southern Wisconsin Regional Airport 2005-2010 (Pasquill Stability Class B)
19.3.2-25 Joint Frequency Distribution of Wind Speed and Wind Direction from the Southern Wisconsin Regional Airport 2005-2010 (Pasquill Stability Class C)
19.3.2-26 Joint Frequency Distribution of Wind Speed and Wind Direction from the Southern Wisconsin Regional Airport 2005-2010 (Pasquill Stability Class D)
19.3.2-27 Joint Frequency Distribution of Wind Speed and Wind Direction from the Southern Wisconsin Regional Airport 2005-2010 (Pasquill Stability Class E)
19.3.2-28 Joint Frequency Distribution of Wind Speed and Wind Direction from the Southern Wisconsin Regional Airport 2005-2010 (Pasquill Stability Class F)

Chapter 19 - Environmental Review List of Tables
SHINE Medical Technologies 19.3-iv Rev. 0
List of Tables(Continued)
Number Title
19.3.2-29 Joint Frequency Distribution of Wind Speed and Wind Direction from the Southern Wisconsin Regional Airport 2005-2010 (Pasquill Stability Class G)
19.3.2-30 Representative Environmental Noise Levels
19.3.4-1 Rockford, Illinois Climatic Means and Extremes
19.3.4-2 Rainfall Depth–Duration–Frequency Data for Janesville Vicinity
19.3.4-3 USGS Streamflow Monitoring Stations in Rock County, Wisconsin
19.3.4-4 Flood Discharge Frequency Data – Rock River at Afton, Wisconsin
19.3.4-5 Annual Minimum Low Flows – Rock River at Afton
19.3.4-6 Groundwater Monitoring Well Water Table Elevations
19.3.4-7 Surface Water Analytical Results
19.3.4-8 SHINE Medical Surface Water Field Data - Janesville
19.3.4-9 Groundwater Analytical Results for Monitoring Wells
19.3.4-10 SHINE Medical Groundwater Field Data – Janesville
19.3.5-1 Fish Potentially Occurring near the SHINE Site
19.3.5-2 Benthic Macroinvertebrates Collected in an Unnamed Stream (Tributary of the Rock River) near the SHINE Site
19.3.5-3 Terrestrial Plants Observed on or near the SHINE Site
19.3.5-4 Mammals Potentially Occurring on or near the SHINE Site
19.3.5-5 Avifaunal Species Potentially Occurring on or near the SHINE Site
19.3.5-6 Reptiles and Amphibians Potentially Occurring on or near the SHINE Site
19.3.5-7 Protected Species near the SHINE Site
19.3.6-1 Previously Recorded Cultural Resources Surveys within 1-mi. (1.6-km) of the Site

Chapter 19 - Environmental Review List of Tables
SHINE Medical Technologies 19.3-v Rev. 0
List of Tables(Continued)
Number Title
19.3.6-2 Eligible or Listed Archaeological Sites within a 10-mi. (16-km) Radius of the SHINE Site, Rock County, Wisconsin
19.3.6-3 Historic Structures and Districts Listed on the NRHP within a 10-mi. (16-km) Radius of the SHINE Site
19.3.7-1 Rock County Labor Force Distribution by County of Employee Residence
19.3.7-2 Comparison of Estimated Major SHINE Labor Force Needs with Estimated Rock County Available Work Force
19.3.7-3 Population and Growth Rates of Municipalities within Rock County
19.3.7-4 Resident Population Distribution, Growth Rates, and Projections for Rock County
19.3.7-5 Estimated Transient Population within 5 mi. (8 km) of the SHINE Site (2010)
19.3.7-6 Demographic (Race and Ethnicity) Characteristics of Rock County
19.3.7-7 Median Household and Per Capita Income Levels within Rock County
19.3.7-8 Civilian Labor Force and Unemployment Rates within Rock County, 2002-2012
19.3.7-9 Employment by Industry within Rock County
19.3.7-10 Top 10 Employers within the ROI (Rock County), City of Janesville
19.3.7-11 Percent of Individuals and Families Living Below the Census Poverty Threshold within Rock County
19.3.7-12 Housing Unit Characteristics within Rock County
19.3.7-13 Tax Rates in Rock County and State of Wisconsin
19.3.7-14 Major Municipal Water Suppliers in Rock County
19.3.7-15 Rock County Community Water Supply Characteristics (2010)
19.3.7-16 Public Wastewater Treatment Systems in Rock County
19.3.7-17 Public School Enrollment (2012) within Rock County

Chapter 19 - Environmental Review List of Tables
SHINE Medical Technologies 19.3-vi Rev. 0
List of Tables(Continued)
Number Title
19.3.7-18 Recreation Facilities within Rock County
19.3.8-1 Distance to Nearest Agricultural and Urban Facilities
19.3.8-2 Chemicals Used/Stored Within Five Miles of the Site

Chapter 19 - Environmental Review List of Figures
SHINE Medical Technologies 19.3-vii Rev. 0
List of Figures
Number Title
19.3.1-1 Aerial View of the SHINE Site
19.3.1-2 Major Land Uses within the Region
19.3.1-3 Janesville Site Region
19.3.1-4 Special Land Use Classifications within the Region
19.3.1-5 Prime Farmland within the Site
19.3.1-6 Prime Farmland within the Region
19.3.1-7 Other Land Use Features near the SHINE Site
19.3.1-8 Major Population Centers and Infrastructure
19.3.1-9 Site Visual Setting
19.3.2-1 Principle Tracks of Winter Synoptic Cyclones that Potentially Affect Wisconsin Weather
19.3.2-2 Physiographic Provinces of Wisconsin
19.3.2-3 Mean Wisconsin Winter Month Temperatures
19.3.2-4 Mean Wisconsin Spring Month Temperatures
19.3.2-5 Mean Wisconsin Summer Month Temperatures
19.3.2-6 Mean Wisconsin Autumn Month Temperatures
19.3.2-7 Mean Wisconsin Winter Month Precipitation
19.3.2-8 Mean Wisconsin Spring Month Precipitation
19.3.2-9 Mean Wisconsin Summer Month Precipitation
19.3.2-10 Mean Wisconsin Autumn Month Precipitation
19.3.2-11 NOAA COOP Network Climate Divisions of Wisconsin
19.3.2-12 Outline of Climate Region Representative of the Site
19.3.2-13 Illinois Annual Mean Water Equivalent Precipitation

Chapter 19 - Environmental Review List of Figures
SHINE Medical Technologies 19.3-viii Rev. 0
List of Figures(Continued)
Number Title
19.3.2-14 Illinois Annual Mean Snowfall
19.3.2-15 Illinois Annual Mean Dry Bulb Temperatures
19.3.2-16 NOAA ASOS Stations Located within the Site Climate Region
19.3.2-17 NOAA COOP Stations Located within the Site Climate Region
19.3.2-18 Wisconsin and Illinois Counties within Site Climate Region Selected for Investigation of Severe Weather Phenomena
19.3.2-19 Annual Wind Rose Southern Wisconsin Regional Airport (2005-2010)
19.3.2-20 January Wind Rose Southern Wisconsin Regional Airport (2005-2010)
19.3.2-21 February Wind Rose Southern Wisconsin Regional Airport (2005-2010)
19.3.2-22 March Wind Rose Southern Wisconsin Regional Airport (2005-2010)
19.3.2-23 April Wind Rose Southern Wisconsin Regional Airport (2005-2010)
19.3.2-24 May Wind Rose Southern Wisconsin Regional Airport (2005-2010)
19.3.2-25 June Wind Rose Southern Wisconsin Regional Airport (2005-2010)
19.3.2-26 July Wind Rose Southern Wisconsin Regional Airport (2005-2010)
19.3.2-27 August Wind Rose Southern Wisconsin Regional Airport (2005-2010)
19.3.2-28 September Wind Rose Southern Wisconsin Regional Airport (2005-2010)
19.3.2-29 October Wind Rose Southern Wisconsin Regional Airport (2005-2010)
19.3.2-30 November Wind Rose Southern Wisconsin Regional Airport (2005-2010)
19.3.2-31 December Wind Rose Southern Wisconsin Regional Airport (2005-2010)
19.3.2-32 Winter Wind Rose Southern Wisconsin Regional Airport (2005-2010)
19.3.2-33 Spring Wind Rose Southern Wisconsin Regional Airport (2005-2010)
19.3.2-34 Summer Wind Rose Southern Wisconsin Regional Airport (2005-2010)

Chapter 19 - Environmental Review List of Figures
SHINE Medical Technologies 19.3-ix Rev. 0
List of Figures(Continued)
Number Title
19.3.2-35 Autumn Wind Rose Southern Wisconsin Regional Airport (2005-2010)
19.3.2-36 Annual Wind Roses Southern Wisconsin Regional Airport (Janesville, WI) and Regional Stations
19.3.3-1 Geotechnical Investigation Boring Locations
19.3.3-2 Generalized Geologic Cross Section of Rock County, West-East
19.3.3-3 Wisconsin Stratigraphic Column
19.3.3-4 Regional Structural Geology
19.3.3-5 Site Cross Section
19.3.3-6 Seismic Hazard Map
19.3.3-7 Capable Fault Zones
19.3.4-1 Project Area Watershed - Tributary to Rock River
19.3.4-2 Project Area Local Drainage
19.3.4-3 Long-Term Annual Streamflows and Precipitation in Rock County
19.3.4-4 Project Water Monitoring Locations
19.3.4-5 Groundwater Elevation Isopleth, Fourth Quarter, 2011
19.3.4-6 Groundwater Elevation Isopleth, First Quarter, 2012
19.3.4-7 Groundwater Elevation Isopleth, Second Quarter, 2012
19.3.4-8 Groundwater Elevation Isopleth, Third Quarter, 2012
19.3.5-1 Ecoregions within a 50-Mi. (80 Km) Radius of the SHINE Site
19.3.5-2 Ecological Resource Entities of Special Interest in Rock County
19.3.5-3 Ecology Sampling Locations
19.3.6-1 Historic Properties Listed on the National Register of Historic Places

Chapter 19 - Environmental Review List of Figures
SHINE Medical Technologies 19.3-x Rev. 0
List of Figures(Continued)
Number Title
19.3.7-1 Population Centers within Rock County
19.3.7-2 Existing Transportation Network within Rock County
19.3.7-3 Existing Transportation Network in Proximity to the SHINE Site
19.3.7-4 Major Recreation Facilities within Rock County
19.3.8-1 Janesville Features and Distances from Site Boundary (1-6 Mile Range)
19.3.8-2 Janesville Features and Distances from Site Boundary (0-1 Mile Range)

Chapter 19 - Environmental Review Acronyms and Abbreviations
SHINE Medical Technologies 19.3-xi Rev. 0
Acronyms and Abbreviations
Acronym/Abbreviation Definition
°C degrees Celsius
°F degrees Fahrenheit
µS/cm micro-Siemens per centimeter
χ/Q relative atmospheric concentration
AASHTO American Association of State Highway and Transportation Officials
ac. acre
AFCCC Air Force Combat Climatology Center
ASCE American Society of Civil Engineers
ASHRAE American Society of Heating, Refrigerating and Air-Conditioning Engineers, Inc.
ASOS Station automated surface observing station
AWOS automated weather observing station
BIA Bureau of Indian Affairs
BLM Bureau of Land Management
BLS Bureau of Labor Statistics
BTOC below top of casing
Bu. bushel
C Celcius
C-14 carbon-14

Chapter 19 - Environmental Review Acronyms and Abbreviations
SHINE Medical Technologies 19.3-xii Rev. 0
Acronyms and Abbreviations (cont’d)
Acronym/Abbreviation Definition
CFR Code of Federal Regulations
cfs cubic feet per second
CFU colony-forming units
Clim-20 Climatography of the United States No. 20
cm centimeter
cm/s centimeters per second
cm/hr centimeters per hour
cm/yr. centimeters per year
cms cubic meters per second
COOP (National Oceanic and Atmospheric Administration) cooperative observing station
dBA A-weighted decibels
DBT dry bulb temperature
deg degrees
DOR Department of Revenue
DPI Department of Public Instruction
DWD Department of Workforce Development
E east
E[M] expected moment magnitude
E-coli Escherichia coli

Chapter 19 - Environmental Review Acronyms and Abbreviations
SHINE Medical Technologies 19.3-xiii Rev. 0
Acronyms and Abbreviations (cont’d)
Acronym/Abbreviation Definition
EDS Environmental Data Service
ENE east-northeast
EPRI Electric Power Research Institute
ESE east-southeast
F Fahrenheit
FAA Federal Aviation Administration
FEMA Federal Emergency Management Agency
fps feet per second
ft. feet
g the acceleration of an object due to the force of gravity
GIS geographical information system
GM General Motors
gpd gallons per day
gpd/ft gallons per day per foot
GHG greenhouse gases
H high
ha hectare
hr. hour
HSG Hydrologic Soil Group

Chapter 19 - Environmental Review Acronyms and Abbreviations
SHINE Medical Technologies 19.3-xiv Rev. 0
Acronyms and Abbreviations (cont’d)
Acronym/Abbreviation Definition
HUC Hydrologic Unit Code
I-39 Interstate Highway 39
I-43 Interstate Highway 43
I-90 Interstate Highway 90
I-131 iodine-131
IAEA International Atomic Energy Agency
IDOA Illinois Department of Agriculture
IHPA Illinois Historic Preservation Agency
IL Illinois
in. inch(es)
in. Hg inches of mercury
in/hr inches per hour
in/yr inches per year
ISMCS international station meteorological climate summary
JFD joint frequency distribution
K-40 potassium-40
kg/m2 kilograms per square meter
KJVL meteorological station identifier for Janesville, Wisconsin

Chapter 19 - Environmental Review Acronyms and Abbreviations
SHINE Medical Technologies 19.3-xv Rev. 0
Acronyms and Abbreviations (cont’d)
Acronym/Abbreviation Definition
km kilometer(s)
KMSN meteorological station identifier for Madison, Wisconsin
KRFD meteorological station identifier for Rockford, Illinois
KY Kentucky
L low
lb/ft2 pounds per square foot
LCD local climatological data
Ldn day night average sound level
lpd liters per day
lpm liters per minute
LU/LC land use/land cover
M moderate
M moment magnitude
m meter(s)
m/s meters per second
max. maximum
MCWB mean coincident wet bulb temperature
Mgd million gallons per day
mg/L milligrams per liter

Chapter 19 - Environmental Review Acronyms and Abbreviations
SHINE Medical Technologies 19.3-xvi Rev. 0
Acronyms and Abbreviations (cont’d)
Acronym/Abbreviation Definition
mg/m3 milligrams per cubic meter
MHS Mercy Health System
MI Michigan
mi. mile(s)
mi.2 square miles
min minutes
min. minimum
mL milliliters
Mld million liters per day
MN Minnesota
MO Missouri
mph miles per hour
MPN most probable number
mrem/yr millirem per year
MSA MSA Professional Services, Inc.
MSL above mean sea level
mSV/yr millisievert per year
mV millivolt
MWe megawatt electric

Chapter 19 - Environmental Review Acronyms and Abbreviations
SHINE Medical Technologies 19.3-xvii Rev. 0
Acronyms and Abbreviations (cont’d)
Acronym/Abbreviation Definition
MWt megawatt thermal
N north
NAICS North American Industry Classification System
NAIP National Agricultural Imagery Program
NAVD 88 North American Vertical Datum of 1988
NCDC National Climatic Data Center
ND not detected above the detection limit
NE northeast
NHI National Heritage Inventory
NLCD2006 National Land Cover Database 2006
NLSI National Lightning Safety Institute
NNE north-northeast
NNW north-northwest
NOAA National Oceanic and Atmospheric Administration
NPDES National Pollutant Discharge Elimination System
NPS National Park Service
NR Natural Resources
NRC U.S. Nuclear Regulatory Commission

Chapter 19 - Environmental Review Acronyms and Abbreviations
SHINE Medical Technologies 19.3-xviii Rev. 0
Acronyms and Abbreviations (cont’d)
Acronym/Abbreviation Definition
NRCS Natural Resources Conservation Service
NRHP National Register of Historic Properties
NTU nephelometric turbidity unit
NW northwest
NWS National Weather Service
NWSFO National Weather Service Forecast Office
PCB polychlorinated biphenyl
PMP probable maximum precipitation
PWR pressurized water reactor
rem roentgen equivalent man
RMSE root mean square error
ROI region of influence
SE southeast
sec seconds
SH state highway
SHINE SHINE Medical Technologies, Inc.
SIC Standard Industrial Classification
sq. km square kilometer
sq. mi. square mile
SSE south-southeast

Chapter 19 - Environmental Review Acronyms and Abbreviations
SHINE Medical Technologies 19.3-xix Rev. 0
Acronyms and Abbreviations (cont’d)
Acronym/Abbreviation Definition
SSURGO Soil Survey Geographic Database
SSW south-southwest
Sv/yr sievert per year
SW southwest
SWRA Southern Wisconsin Regional Airport (Janesville, Wisconsin)
SWWDB Southwest Wisconsin Workforce Development Board
TBEES Teledyne Brown Engineering Environmental Services
TMDL total maximum daily load
TOC top of casing
US U.S. Highway
USACE U.S. Army Corps of Engineers
USAF U.S. Air Force
USCB U.S. Census Bureau
USDA U.S. Department of Agriculture
USDOC U.S. Department of Commerce
USDOI U.S. Department of the Interior
USEPA U.S. Environmental Protection Agency
USFWS U.S. Fish and Wildlife Service

Chapter 19 - Environmental Review Acronyms and Abbreviations
SHINE Medical Technologies 19.3-xx Rev. 0
Acronyms and Abbreviations (cont’d)
Acronym/Abbreviation Definition
USGS U.S. Geological Survey
UTC Universal Time, Coordinated
UWNR University of Wisconsin Nuclear Reactor
vpd vehicles per day
WBAN Weather Bureau Army Navy
WBBA Wisconsin Breeding Bird Atlas
WBT wet bulb temperature
WDNR Wisconsin Department of Natural Resources
WHS Wisconsin Historical Society
WI Wisconsin
WISCLAND Wisconsin Initiative for Statewide Cooperation on Landscape Analysis and Data
WisDOT Wisconsin Department of Transportation
WNW west-northwest
WPDES Wisconsin Pollutant Discharge Elimination System
WSW west-southwest
yd. yard
yr year

Chapter 19 - Environmental Review Land Use and Visual Resources
SHINE Medical Technologies 19.3-1 Rev. 0
CHAPTER 19
19.3 DESCRIPTION OF THE AFFECTED ENVIRONMENT
19.3.1 LAND USE AND VISUAL RESOURCES
This subsection describes the characteristics of the land use of the SHINE Medical Technologies, Inc. (SHINE) site and the region. In addition, a description of the visual resources of the site is provided. The land use for the site and region is analyzed using the National Land Cover Database 2006 (NLCD2006) (Fry, et al., 2011) land use/land cover (LU/LC) database. This provides a more recent and unified database than use of both the Wisconsin Department of Natural Resources (WDNR) Wisconsin Initiative for Statewide Cooperation on Landscape Analysis and Data (WISCLAND) database and the Illinois Department of Agriculture (IDOA) Land Cover of Illinois database. The visual resources are rated using the U.S. Department of the Interior (USDOI) – Bureau of Land Management (BLM) Visual Resource Management System.
19.3.1.1 Land Use
19.3.1.1.1 Site
The SHINE site consists of a 91.27-acre (ac.) (36.9 hectare [ha]) parcel located south of the City of Janesville in Rock County, Wisconsin (Figure 19.3.1-1). Given the undeveloped nature of the site, there are no existing structures or infrastructure located within the site boundary. The approximate limits of the proposed restricted area are located near the center of the site as shown on Figure 19.3.1-1. Due to the nature of the facility, there are no exclusion areas on either the proposed site or adjacent properties. Facilities proposed to be located on the developed SHINE site are described in Section 19.2 and illustrated in Figure 19.2.1-1
LU/LC as mapped by the National Land Cover Database (Fry, et al., 2011) within the property site consists almost entirely of undeveloped cultivated crop lands (Figure 19.3.1-2). Table 19.3.1-1 presents the acreage and percent coverage of the 15 mapped land uses within the site and region. LU/LC on-site consists of 99.8 percent cultivated agricultural land and 0.2 percent developed/open space. U.S. Highway (US) 51 borders the western boundary of the SHINE site, and the Southern Wisconsin Regional Airport (SWRA) is located immediately to the west of US 51 (Figure 19.3.1-1).
19.3.1.1.2 Region
The “region” of the SHINE site is defined as the area within a 5-mile (mi.) (8-kilometer [km]) radius of the site centerpoint (Figure 19.3.1-3). The entire region is contained within Rock County, Wisconsin. Major land uses within the region are listed in Table 19.3.1-1 and depicted in Figure 19.3.1-2. The dominant land use in the region is agricultural/crops (50.2 percent). Pasture/hay fields (11.7 percent), low intensity developed lands (11.7 percent), deciduous forest areas (6.6 percent), and open space developed lands (6.1 percent) make up the other major land uses. The remaining land uses within the region include open water, medium intensity developed lands, high intensity developed lands, barren lands, evergreen forest, mixed forest, shrub/scrub, grassland, woody wetlands, and emergent herbaceous wetlands. The City of Janesville is located directly to the north and is within the region. The northern limits of the City of Beloit are located approximately 3.7 mi. (6.0 km) to the south of the site.

Chapter 19 - Environmental Review Land Use and Visual Resources
SHINE Medical Technologies 19.3-2 Rev. 0
19.3.1.1.3 Special Land Uses
Federal and State special land use classification areas within the region are shown in Figure 19.3.1-4. According to the USDOI-Bureau of Indian Affairs (BIA) (2012) there is no federal land held in trust for an American Indian tribe within the 5 mi. (8 km) region. The WDNR manages two parcels of land in the region, both located southwest of the site. Located south of the airport and 1.9 mi. (3.0 km) from the site is a 112 ac. (45.3 ha) parcel that was gifted to the WDNR, but has no designated use. Rock River Prairie is a 37 ac. (15.0 ha) State Natural Area located 3.5 mi. (5.6 km) from the SHINE site and is accessed from US 51. There are no military reservations, federal designated wild and scenic rivers, national parks, national forests or federal designated coastal zone areas within the region.
19.3.1.1.4 Agricultural Resources and Facilities
As is illustrated in Figure 19.3.1-5, both prime farmland and farmland of statewide importance occur within the site boundaries. Warsaw silt loam is the prime farmland soil type, whereas Lorenzo loam is the soil type of state-wide importance. Prime farmland and farmland of state-wide importance located within the region are shown in Figure 19.3.1-6. Approximately 41,950 ac. (16,977 ha) of the area within the region are lands having soils classified as prime farmland or farmland of statewide importance. The principal agricultural products produced within the area, as estimated by the U.S. Department of Agriculture (USDA), consist of corn, oats, winter wheat, soybeans, and corn silage (USDA, 2011). The potential relative value of the 91.27 ac. (36.9 ha) of farmland acquired for the site would be 13,771 bushels (Bu.) of grain corn or 3947 bushels (Bu.) of soybeans annually (Table 19.3.1-2). These values are based on the Natural Resources Conservation Service (NRCS) crop production estimates for Rock County, WI during the period from 2001-2010.
Other agricultural resources in the immediate area of the SHINE site include farms that are used for dairy production, beef production, and other livestock production (Figure 19.3.1-7). There are also commercial game harvest farms in the region of the site, which are owned by MacFarlane Pheasants, Inc. MacFarlane Pheasants Inc. is the largest pheasant farm in North America and has been in operation since 1929. The company specializes in the production of a variety of game birds including pheasants and Hungarian partridge (MacFarlane Pheasants, Inc., 2012). Hormel Foods has a food processing plant located in Beloit, WI, just outside of the region (Hormel, 2013).
19.3.1.1.5 Mineral Resources
According to the U.S. Environmental Protection Agency (USEPA) Western Ecology Division’s Ecoregions of Wisconsin (USEPA, 2012a), the SHINE site is part of the Rock River Drift Plain Level IV ecoregion, which is located within the Southeastern Wisconsin Till Plains Level III ecoregion. The Rock River Drift Plain has generally steeper topography than surrounding ecoregions, with broad glacial drift outwash plains characterized by loamy deposits over sandy and gravelly soils with moderate to very rapid permeability. The most important mineral resources in this ecoregion are sand, gravel, and crushed stone (Zaporozec, Alexander, 1982). There are no gravel or sand mining operations on-site, however two sand and gravel operations occur within the region (Find the Data, 2012). No other mineral resources are known to be present in the region.

Chapter 19 - Environmental Review Land Use and Visual Resources
SHINE Medical Technologies 19.3-3 Rev. 0
19.3.1.1.6 Major Population Centers and Infrastructure
Population centers and the major infrastructure of Rock County are shown on Figure 19.3.1-8. The only major population centers (> 25,000 residents) located within Rock County are Janesville and Beloit. Subsection 19.3.7 provides a description of the demographics of these centers and their community characteristics.
The major transportation corridors within Rock County include Interstate Highways 39 (I-39) and 90 (I-90), US 14 and 51, and State Highway (SH) 11. Major rail lines or rail systems within the county are owned by Chicago and Northwestern Railroad and Chicago, Milwaukee, St. Paul, and Pacific Railroad.
The only public airport located within the county is the SWRA in Janesville, Wisconsin.
No major transportation waterways occur within the region.
19.3.1.1.7 Land Use Plans
Current and future land use plans for the area immediately adjacent to the SHINE site and region are represented by the comprehensive plans for the City of Janesville (Vandewalle & Associates, 2009a and 2009b.)
Land uses within the City of Janesville are characterized in the City’s comprehensive plan (Vandewalle & Associates, 2009a). Land use categories included in the Janesville Comprehensive Plan include the following:
• Residential, Exurban – generally single-family residential development on private well and on-site waste treatment systems, generally at densities between one dwelling unit per acre (0.4 ha) and one dwelling unit per 35 ac. (14.2 ha).
• Residential, Single-Family Urban – publicly sewered single family residential development.
• Residential, Two-Family/Townhouse – attached single family, two-family, and walk-up townhouse residential development.
• Residential, Multi-Family – a variety of residential units focused in particular on multiple family housing (3+ units per building).
• Office – Office, institutional, research, and office-support land uses.• Commercial – indoor commercial, retail, institutional and service uses with moderate
landscaping and signage.• Light Industrial – indoor industrial land uses and controlled outdoor storage areas with
moderate landscaping and signage.• Heavy Industrial – carefully controlled heavy industrial, storage, and disposal land uses,
with limited landscaping and signage.• Community Facilities – large-scale public buildings, hospitals, youth and elderly service
facilities, and special-care facilities. Small community facilities uses may be located in lands designated as other land use categories.
• Parks and Open Space – park and public open space facilities devoted to playgrounds, play fields, trails, picnic areas, and related recreational activities, and conservation areas.
• Extraction – quarries, gravel pits, clay extraction, peat extraction, and extraction-related land uses.
• Vacant – undeveloped land within the City limits.

Chapter 19 - Environmental Review Land Use and Visual Resources
SHINE Medical Technologies 19.3-4 Rev. 0
• Agriculture – agricultural and related uses, including cropland, farmsteads, operations, and single family residential development with maximum development densities of one dwelling unit per 35 ac. (14.2 ha).
• Surface Water – lakes, rivers, creeks, and perennial streams.• Rights-of-Way – publicly owned land for roads, highways, and railroads.
The total acreage of lands within the 2007 city limits that are classified in each of the land use categories are summarized in Table 19.3.1-3. Dominant land use categories include single family residential (24 percent), rights of way (17 percent), vacant lands (16 percent), community facilities (11 percent), and parks and open space (11 percent) (Vandewalle & Associates, 2009a). Subsection 19.3.7.2 provides additional information regarding major employers (including industrial and commercial) in Janesville.
The lands containing the SHINE site and its immediate environs to the east and south are listed as being agricultural lands on the existing land use map (Vandewalle & Associates, 2009a). The adjacent airport and associated lands west of US 51 are identified as “community facilities,” and lands immediately to the northeast of the site are listed as “vacant.” These “vacant” lands correspond to the parcels included as part of a Tax Increment Financing district proposed for development. However, according to the future land use plan of the City of Janesville, the site and its environs east of US 51 are proposed for development as light industrial land uses (Vandewalle & Associates, 2009b).
19.3.1.2 Visual Resources
The visual setting of the area affected by the construction of the new SHINE facility is represented by agricultural viewsheds to the north and east that consist of predominately flat or a slightly rolling terrain dominated by cultivated fields (Figure 19.3.1-9). The site itself is composed completely of land used for agricultural purposes and has no established structures. The viewshed to the south of the SHINE site consists of both agricultural fields with some light development. Immediately adjacent to the southern border of the site are two large warehouses that support local agricultural operations and provide storage for large farming equipment. The viewshed to the west of the site is a light industrial development landscape that consists of the SWRA and its associated facilities. Specific elements of this landscape include the airport control tower, associated runways, and several large warehouses and hangers. The SWRA supports approximately 50,000 flight operations annually, and the site is in view of the persons utilizing the airport and visitors traveling to the area (Southern Wisconsin Regional Airport, 2012a). The new SHINE facility is described and illustrated in Section 19.4.1.2 and is visible to motorists traveling to and from Janesville, WI, on US 51. The new facility is also visible from Airport Park, which is located northwest of the site across US 51. Residential neighborhoods are located north and northwest of the site, but presently there are trees and other vegetation bordering these neighborhoods that obstruct the view of the site.
The visual resources and scenic quality of the existing site are rated using the USDOI-BLM Visual Resource Management System (USDOI-BLM, 1984). The Scenic Quality Classification is the rating of the visual appeal of the land designated for the site and is based on an evaluation of seven key factors: landform, vegetation, water, color, adjacent scenery, scarcity, and cultural modifications. The Scenic Quality is classified as either an “A,” “B,” or “C,” with “A” as a high quality visual classification and “C” as a low quality visual rating. The site rates as a “C” classification for low Scenic Quality due to a lack of notable features, uniform landform, low vegetation diversity, an absence of water, mute colors, cultural modifications to adjacent

Chapter 19 - Environmental Review Land Use and Visual Resources
SHINE Medical Technologies 19.3-5 Rev. 0
scenery, and a commonality within the physiographic province. The Sensitivity Level, a measurement of the public concern for scenic quality, was also analyzed using six different indicators of public concern: types of users, amount of use, public interest, adjacent land uses, special areas, and other factors. The Sensitivity Level of the public concern for scenic quality is rated on a High (H), Moderate (M), or Low (L) scale. The site has an L sensitivity rating, as an area with low scenic values resulting from a low sensitivity to changes in visual quality by the type of users in the area, a low amount of use by viewers, low public interest in changes to the visual quality of the site, and a lack of special natural and wilderness areas.

Chapter 19 - Environmental Review Land Use and Visual Resources
SHINE Medical Technologies 19.3-6 Rev. 0
Table 19.3.1-1 Summary of 2006 Land Use/Land Cover within SHINE Site and Region
a) Total may add up to more or less than 100 percent due to rounding.Reference: Fry, et al., 2011.
NLCD2006 Land Cover ClassSHINE Site Region
ac. ha Percent ac. ha PercentOpen Water 796 322 1.6%Developed, Open Space 0.18 0.07 0.2% 3043 1231 6.1%Developed, Low Intensity 5858 2371 11.7%Developed, Medium Intensity 1968 796 3.9%Developed, High Intensity 992 401 2.0%Barren 43 17 0.1%Deciduous Forest 3298 1335 6.6%Evergreen Forest 68 28 0.1%Mixed Forest 1 0 0.0%Shrub/Scrub 505 204 1.0%Grassland 1049 425 2.1%Pasture/Hay 5896 2386 11.7%Cultivated Crops 91.09 36.86 99.8% 25,236 10,213 50.2%Woody Wetlands 722 292 1.4%Emergent Herbaceous Wetland 787 318 1.6%
Total(a) 91.27 36.94 100.0% 50,262 20,339 100.0%

Chapter 19 - Environmental Review Land Use and Visual Resources
SHINE Medical Technologies 19.3-7 Rev. 0
Table 19.3.1-2 Crop Production Estimates for SHINE Site and Rock County, Wisconsin
YearPlanted Harvested Production Yield
ac. ha ac. ha Bu. Bu./ac.Corn2001 140,600 56,901 128,000 51,802 17,920,000 1402002 160,500 64,954 149,700 60,584 17,664,600 1182003 151,500 61,312 140,800 56,982 19,571,200 1392004 155,000 62,729 141,000 57,063 23,124,000 1642005 166,000 67,180 150,000 60,705 22,200,000 1482006 152,000 61,514 141,000 57,063 22,419,000 1592007 174,000 70,418 165,000 66,776 25,740,000 1562008 161,000 65,157 152,000 61,514 22,192,000 1462009 162,000 65,561 153,000 61,919 25,245,000 1652010 158,500 64,145 142,000 57,467 24,679,600 173.8Ten Year Avg., Rock County, WI
158,110 63,987 146,250 59,187 22,075,540 150.9
Site Avg. 91.27 36.94 91.27 36.94 13,771 150.9Soybeans2001 106,300 43,020 104,300 42,210 4,484,900 432002 99,200 40,146 97,900 39,620 3,524,400 362003 101,700 41,158 101,400 41,037 2,535,000 252004 87,600 35,452 86,900 35,168 3,736,700 432005 88,600 35,856 87,400 35,371 4,020,400 462006 89,200 36,099 89,000 36,018 4,539,000 512007 71,900 29,098 71,700 29,017 3,369,900 472008 81,100 32,821 81,000 32,781 2,956,500 36.52009 80,000 32,376 79,900 32,336 3,875,150 48.52010 86,000 34,804 85,500 34,602 4,822,200 56.4Ten Year Avg., Rock County, WI
89,160 36,083 88,500 35,816 3,786,415 43.2
Site Avg. 91.27 36.94 91.27 36.94 3947 43.2
Reference: USDA, 2011

Chapter 19 - Environmental Review Land Use and Visual Resources
SHINE Medical Technologies 19.3-8 Rev. 0
Table 19.3.1-3 City of Janesville Land Use
Land Use Category Percent
Residential-Single Family Urban 24%
Residential-Two-Family/Townhouse 2%
Residential-Multi-Family 2%
Office 1%
Commercial 4%
Office 1%
Light Industrial 4%
Heavy Industrial 4%
Community Facilities 11%
Parks and Open Space 11%
Extraction 2%
Vacant 16%
Agricultural 0%
Surface Water 2%
Right of Way 17%
Total(a) 100%
a) Total may add up to more or less than 100 percent due to rounding.
Reference: Vandewalle & Associates, 2009a.

Chapter 19 - Environmental Review Air Quality and Noise
SHINE Medical Technologies 19.3-9 Rev. 0
19.3.2 AIR QUALITY AND NOISE
19.3.2.1 Regional Climatology
19.3.2.1.1 Introduction
Climate is a statistical description of the weather conditions that occur during a long period of time, usually several decades. Weather refers to short-term variations (minutes to months) in the atmosphere.
Sources of data typically used to analyze the climate at a site include weather maps (depictions of areal weather phenomena at one instant of time), atlas maps summarizing long-term climate, records of weather at specific monitoring stations at single instants of time, and long-term climatic statistics at specific monitoring stations.
The purpose of analysis of regional climate is to understand the local climate at the SHINE site in the context of the climate of the surrounding area. Climate phenomena are then analyzed at progressively smaller scales and within progressively smaller areas. As the area being analyzed decreases, some monitoring stations that are considered initially in the broad analysis are excluded because these stations are found to be unrepresentative of the site climate. The end result is a documented, systematic approach that defines local climate within a context that includes a broad surrounding region.
19.3.2.1.2 Regional Climate
The SHINE site is located in south-central Wisconsin. The following discussion summarizes a variety of information that describes the general region in which the SHINE site is located. Because the information is derived from a variety of sources, the geographic area implied by the term “region” is somewhat variable in this introductory discussion. Subsection 19.3.2.1.3 defines a more specific region considered to have a climate representative of the SHINE site, and the subsequent subsections present detailed climatological data for that specific region.
The SHINE site is located in a region with the Köppen classification “Daf”, which is a humid continental climate with warm summers, snowy winters, and humid conditions (Trewartha, 1954). The climate features a large annual temperature range and frequent short duration temperature changes (NCDC, 2011a). Although there are no pronounced dry seasons, most precipitation occurs during the warmer months. During the autumn, winter, and spring, strong synoptic-scale surface cyclones and anticyclones frequently move across the site region. During the summer, synoptic-scale cyclones are usually weaker and pass north of the site region. Most air masses that affect the site region are generally of polar origin. However, air masses occasionally originate from arctic regions, or the Gulf of Mexico. Air masses originating from the Gulf of Mexico generally do not reach the site region during winter months. There are occasional episodes of extreme heat or high humidity during the summer. The windiest months generally occur during the spring and autumn. The annual average number of days with thunderstorms varies from approximately 45 at the southwest corner of the state of Wisconsin, to approximately 35 at the northeast corner of the state (Moran, J.M. and E.J. Hopkins, 2002). Hail is most frequent in the southwestern and west-central portions of the state, and is most common during summer months, peaking in late July. Tornadoes are relatively infrequent. Winter storms that affect the region generally follow one of three tracks shown in Figure 19.3.2-1: Alberta,

Chapter 19 - Environmental Review Air Quality and Noise
SHINE Medical Technologies 19.3-10 Rev. 0
Panhandle, and Gulf Coast tracks. During an average winter, the ground is covered with snow about 60 percent of the time (NCDC, 2011a).
Regional land use is primarily cropland (corn and beans) and dairy (Rand McNally, 1982 and 2005). The natural vegetation includes broadleaf deciduous trees (oak and hickory), evergreen trees, and medium height prairie grass. There are also several urban areas. The soil at the SHINE site is well-drained silt loam.
The landforms of Wisconsin are described by the five physiographic provinces plotted on the map in Figure 19.3.2-2. Details of vegetation, topography, and elevations for those provinces are described in Table 19.3.2-1 (Moran, J.M. and E.J. Hopkins, 2002). Most of the surface water impoundments in Wisconsin are located in the Northern Highland and Eastern Ridges and Lowlands physiographic provinces. Water also flows through extensive wetlands in the form of marshes and swamps. The Northern Highland province has the highest elevations, from which water drains northward to Lake Superior; eastward to Lake Michigan via the Menominee and Wolf Rivers; and westward to the Mississippi River via the St. Croix, Chippewa, Black, and Wisconsin Rivers. The Western Uplands province, which comprises most of the western border of the state with Minnesota, escaped recent glaciation. This allowed streams and rivers to form deeply incised valleys over geologic time. Portions of the uplands are referred to as the “driftless area” due to the lack of glacial debris, or “drift”.
Lake breeze phenomena occur near the shorelines of large bodies of water, such as Lake Michigan, which borders Wisconsin on the east (Moran, J.M. and E.J. Hopkins, 2002). These phenomena feature a circulation system in which air rises over the land and descends over the water, flows from the water toward the land near the ground surface, and flows from land toward the lake aloft. At the surface, the lake breeze appears as a relatively cool and humid wind that sweeps inland. The leading edge of a lake breeze is a miniature cold front and is referred to as the lake breeze front. As the lake breeze front moves inland, it lifts warmer air upward, sometimes causing clouds, or showers. The inland penetration of the lake breeze front varies from a few hundred yards to as much as 25 mi. (40.2 km) (Moran, J.M. and E.J. Hopkins, 2002). Since the SHINE site is located approximately 60 mi. (96.6 km) west of Lake Michigan, it is located too far from the lake be affected by lake breezes. Inland lakes that are located in the SHINE site region are too small to be associated with lake breeze circulations. Therefore, lake breeze circulations are not expected to affect the SHINE site.
The local radiation balance and winds determine temperatures across the state. Movement of air masses, synoptic-scale fronts, and synoptic-scale cyclones and anticyclones strongly influence local temperature and precipitation. Seasonal changes in the intensity and movements of air masses and synoptic-scale weather systems, plus changes in radiation exposure at the ground bring about seasonal changes in temperature and precipitation. North and northwest winds generally bring cold, dry air. South and southeast winds typically bring warm, humid air. Calm wind conditions allow pooling of colder, denser air at locations with lower elevations such as valleys. Unequal rates of diurnal heating of the ground cause some local valley and hillside airflows.
Maps of monthly mean dry bulb temperatures in Wisconsin are presented in Figures 19.3.2-3 through 19.3.2-6 (Moran, J.M. and E.J. Hopkins, 2002). Mean monthly temperatures for winter (Figure 19.3.2-3) show cooler temperatures at the northern end of the state, warmer temperatures near Lake Michigan, and slightly warmer temperatures near Lake Superior. Figure 19.3.2-4 presents mean monthly temperatures in the spring. The springtime monthly

Chapter 19 - Environmental Review Air Quality and Noise
SHINE Medical Technologies 19.3-11 Rev. 0
temperature pattern in Figure 19.3.2-4 is similar to the wintertime temperature pattern in Figure 19.3.2-3, with colder temperatures in the north. The counties that border the Great Lakes have cooler temperatures during spring, since the water warms at a slower rate than the land and thereby cools the air near the shorelines.
Mean monthly temperatures for summer (Figure 19.3.2-5) show a pattern similar to springtime monthly mean temperatures in Figure 19.3.2-4, with warmer interior temperatures in the south. Counties adjacent to Lakes Michigan and Superior are slightly cooler because the lake surfaces are relatively cooler than the land during the summer.
Mean monthly temperatures for autumn (Figure 19.3.2-6) show warmer conditions in the southern interior. The temperatures show a pattern similar to those in the winter, with warmer temperatures at counties near the lake, since the land cools more quickly than the water.
Wisconsin counties that border Lakes Michigan and Superior experience somewhat cooler summers, milder winters, and longer agricultural growing seasons than those counties at greater distances from the lakes. The lakes also occasionally produce lake effect snow during late autumn through winter.
Maps of monthly mean water-equivalent precipitation in Wisconsin are presented in Figures 19.3.2-7 through 19.3.2-10 (Moran, J.M. and E.J. Hopkins, 2002). Generally, the average annual precipitation is higher in southern portions of the Midwest due to the proximity of the Gulf of Mexico, which is a major source of moisture (EDS, 1968). That same general pattern is observed over the state of Wisconsin. Superimposed over that general pattern is a local pattern of periodic lake-effect precipitation. During lake-effect precipitation events, Lakes Superior and Michigan are local sources of moisture that can cause precipitation adjacent to and downwind of the lake shorelines. Those periods of precipitation enhancement tend to occur when the lake water is warmer than the air, which generally occurs during winter. For example, the winter month precipitation in Figure 19.3.2-7 shows higher monthly water equivalent precipitation totals (approximately 1.2 to 2.2 inches [in.]) (3.0 to 5.6 centimeters [cm]) near the north and east boundary counties, caused by lake-effect snow from Lakes Michigan and Superior.
The Madison, Wisconsin and Rockford, Illinois National Oceanic and Atmospheric Administration (NOAA) weather observing stations (NCDC, 2011a, NCDC, 2011c) are the closest first-order weather stations, and are located approximately 40 mi. (64.4 km) north-northwest and 30 mi. (48.3 km) south-southwest of the SHINE site, respectively. “First-order” stations are defined as those on a 24-hour per day, year-round observing schedule with trained, certified observers.
Climatic statistics for Madison presented in Table 19.3.2-2 (NCDC, 2011a) show that monthly mean wind speeds range from 6.7 miles per hour (mph) (3.0 meters per second [m/s]) during the month of August to 10.1 mph (4.5 m/s) during the month of April. Annual mean wind speed is 8.5 mph (3.8 m/s). Monthly prevailing wind directions are from the south-southwest during all months except the winter months of December through February, when the monthly prevailing winds are all from the northwest. Annual prevailing wind is from the south-southwest.
Climatic statistics for Rockford presented in Table 19.3.2-3 (NCDC, 2011c) show that monthly mean wind speeds are similar to those for Madison, and range from 7.0 mph (3.1 m/s) during the month of August, to 11.3 mph (5.1 m/s) during the month of April. Annual mean wind speed is 9.3 mph (4.2 m/s). Monthly prevailing wind directions are similar to Madison, and blow from the south-southwest direction during all months except the period January through March, when the

Chapter 19 - Environmental Review Air Quality and Noise
SHINE Medical Technologies 19.3-12 Rev. 0
monthly prevailing winds are all from the northwest. Annual prevailing wind is from the south-southwest.
Monthly mean relative humidities for Madison range from 66 percent during April and May, to 78 percent during December (Table 19.3.2-2). Rockford monthly mean relative humidities presented are similar to those from Madison, ranging from 66 percent during April and May, to 80 percent during December (Table 19.3.2-3).
Mean monthly water equivalent precipitation and snowfall for Madison and Rockford (Table 19.3.2-2 and Table 19.3.2-3) are similar. Water equivalent precipitation ranges from minima of 1.25 in. (3.18 cm) during January in Madison and 1.34 in. (3.40 cm) during February in Rockford, to maxima during August of 4.33 in. (11.00 cm) at Madison, and during June of 4.80 in. (12.19 cm) in Rockford. Mean monthly snowfall is limited to the months October through May, and ranges from a minimum of 0.1 in. (0.25 cm) at Madison and Rockford to a maximum of 12.9 in. (32.77 cm) during January at Madison. Annual snowfall is 49.9 in. (126.75 cm) at Madison and 38.7 in. (98.30 cm) at Rockford.
Table 19.3.2-4 presents the mean numbers of days per month and per year of rain or drizzle, freezing rain or drizzle, snow, and hail or sleet at Madison and Rockford. Those parameters have very similar values for the two stations.
Annual values of rain or drizzle days are 138 and 139 days for Madison and Rockford. For both Madison and Rockford, rain and drizzle days range from a minimum of 5 or 6 days during January, to a maximum of 16 days during May.
Annual values of freezing rain or drizzle days are two for both Madison and Rockford. For both Madison and Rockford, freezing rain and drizzle days are zero during the months of May through September, and are a maximum of 1 day during the months of December and January.
Snow typically occurs during 75 days per year at Madison, and 68 days per year at Rockford. Hail or sleet typically occurs during 2 days per year at both Madison and Rockford. Freezing rain or drizzle typically occurs during 2 days per year at both Madison and Rockford.
19.3.2.1.3 Identification of Region with Climate Representative of the SHINE Site
The process of comparison of local (site) and regional climates requires a determination of which region is considered “representative” of climate at the SHINE site. That determination is described in this subsection.
The SHINE site is located in central Rock County, Wisconsin which is at the south central edge of the state. It is located near the boundary of two Wisconsin physiographic provinces as presented in Figure 19.3.2-2, the Western Uplands and the Eastern Ridges and Lowlands. It is located in NOAA Cooperative Observer Network (COOP) Climate Division 8 South Central (Figure 19.3.2-11). The finished site grade elevation is approximately 827 feet (ft.) (252 meters [m]) North American Vertical Datum of 1988 (NAVD 88). The land use in the site area is rural.

Chapter 19 - Environmental Review Air Quality and Noise
SHINE Medical Technologies 19.3-13 Rev. 0
Summarizing, the site location is defined by the following characteristics:
a. Located in south-central Wisconsin, on rural prairie silt-loam soil.
b. Located within till plains glacial deposits on the Central Lowland Province of the Interior Plains Division of the United States. It is on the border between the state of Wisconsin Eastern Ridge/Lowland and Western Upland Terrain, and most like the ridge/lowland to the east because the local topography is relatively gently rolling.
c. Located outside the zone of influence of Lake Michigan lake breeze circulation systems.
d. Located within the zone of influence of Lake Michigan effects on temperature and precipitation, including the following: added local warmth during winter and autumn, cooling during summer and spring, and additional local precipitation during winter, spring, and autumn.
Based on the above summary characteristics, the perimeter of a surrounding geographic region, which is characterized as having the same climate as the site, is plotted on the regional map in Figure 19.3.2-12. That perimeter is bounded as follows:
a. Bounded on the east by the 25-mi. (40.2 km) distance of maximum inland penetration of lake breeze circulations from Lake Michigan.
b. Bounded on the south by the approximate southward limit of Lake Michigan’s effects on the local climate of north-central Illinois, as presented in the mean precipitation and snowfall patterns in Figure 19.3.2-13 and Figure 19.3.2-14 and as described by local climatological data summaries for major Illinois monitoring stations. Annual isohyets and lines of equal snowfall are oriented northwest to southeast at the northeast corner of Illinois as shown in Figure 19.3.2-13 and Figure 19.3.2-14, illustrating the effects of Lake Michigan (Figure 19.3.2-15) on northern Illinois precipitation. Increased clouds and cooling effects due to Lake Michigan are described in the climatological summary for Rockford, Illinois (NCDC, 2011c), but are not described in the climatological summaries for Springfield, Illinois farther to the south (NCDC, 2011d), or Moline, Illinois farther to the southwest (NCDC, 2011b).
c. Bounded on the west by the approximate westward limit of Lake Michigan’s effects on the local climate of southern Wisconsin, as presented in the mean monthly temperature and precipitation, maps in Figure 19.3.2-3 through Figure 19.3.2-10.
d. Bounded on the north by the approximate northward limit of Lake Michigan’s effects on the local climate of central Wisconsin, as presented in the mean temperature and precipitation maps in Figure 19.3.2-3 through Figure 19.3.2-10.
e. Bounded on the north by the approximate mean southern boundary of the Wisconsin Central Plain, as presented in Figure 19.3.2-2.
This site climate region is then used to identify regional weather monitoring stations and Wisconsin and Illinois counties that can be used for comparisons in the analysis of local and regional climate.

Chapter 19 - Environmental Review Air Quality and Noise
SHINE Medical Technologies 19.3-14 Rev. 0
19.3.2.1.4 Regional Data Sources
The site climate region is identified in Subsection 19.3.2.1.3. Meteorological parameters from weather stations in the site climate region are available from a number of published data sources. Those data sources are described below.
• Climatography of the United States No. 20 (Clim-20) statistical summaries from the National Climatic Data Center (NCDC).
Clim-20 publications are typically available for COOP daily weather monitoring stations located within the site climate region. Those publications are of particular interest to agriculture, industry, and engineering applications. The publications include a variety of climate statistics useful for regional climate analysis. Those parameters include dry bulb temperature, daily precipitation, and snow fall. Descriptive statistics of those parameters include: mean, extremes, and mean number of days exceeding threshold values.
COOP stations do not generally record humidity-related parameters, such as relative humidity, dew point or wet bulb temperatures. Therefore, wet bulb temperatures that are coincident with extreme dry bulb temperatures – which are of interest in regional climate analysis – are generally not available for COOP stations. Therefore, for COOP stations, it is often necessary to estimate coincident wet bulb temperatures using wet bulb temperatures recorded at other stations.
• Climatological statistics available from Local Climatological Data (LCD) summaries published by NCDC.
LCD annual summaries are typically available for meteorological stations located at major airports. Those summaries include climatic normals, averages and extremes. Thirty-year monthly histories are provided for the following parameters: mean temperature, total precipitation, total snowfall, and heating/cooling degree days. The summaries also include a narrative description of the local climate.
• Statistical summaries available from the International Station Meteorological Climate Summary (ISMCS) (NCDC, 1996b).
Those summaries are available for many domestic and international airports and military installations. The summaries include tabulations of statistics for several parameters of interest in regional climate analysis. The summaries also include a narrative description of local climate. Particularly useful and unique statistics available in the ISMCS are joint-frequency tables of dry bulb, and wet bulb temperature depression, and single-parameter frequency distributions of dry bulb and wet bulb temperatures.
• Statistical summaries published by the American Society of Heating, Refrigerating and Air-Conditioning Engineers, Inc. (ASHRAE) (ASHRAE, 2009).
ASHRAE climatic percentile information is available for worldwide locations including many U.S. airports with hourly surface weather observing stations. Parameters include dry bulb, wet bulb and dew point temperatures. Also included are: statistical design

Chapter 19 - Environmental Review Air Quality and Noise
SHINE Medical Technologies 19.3-15 Rev. 0
values of dry bulb with mean coincident wet bulb temperature, design wet bulb temperature with mean coincident dry bulb temperature, and design dew point with mean coincident dry bulb temperature.
• Statistical summaries published by the U.S. Air Force Combat Climatology Center (AFCCC) (AFCCC, 1999). The AFCCC statistical summaries include values for dry and wet bulb temperatures.
• American Society of Civil Engineers (ASCE) structural design standards for the site climate region (ASCE, 2006).
The ASCE standards provide minimum load requirements for the design of buildings and other structures that are subject to building code requirements. Particularly useful and unique statistics of interest for climate analysis are values of basic wind speed on a map of the U.S. The basic speed is required by standards for determination of design wind loads. Also included are various adjustments and supplementary information dependent on site and structure characteristics. ASCE also provides maps of 50-year return interval snow pack and a methodology for converting 50-year values extracted from the maps to other return intervals (ASCE, 2006).
• 48-hour probable maximum precipitation (PMP).
The 48-hour PMP is available from a study published by the U.S. Department of Commerce (USDOC) (USDOC, 1978). USDOC contains maps of estimated maximum probable precipitation amounts for a number of time periods (USDOC, 1978).
• Tornado, waterspout, and other weather event statistics for counties in the site climate region from the NCDC online Storm Events Database (NCDC, 2011g) and “Storm Data” publications.
The Storm Events Database contains a chronological listing, by state, of climate statistics of interest for climate analysis. Those statistics include: tornadoes, thunderstorms, hail, lightning, high winds, snow, temperature extremes, and other weather phenomena. Also included are statistics on personal injuries and property damage estimates.
The “Storm Data” publications are monthly summaries of severe weather events published by NCDC. These publications provide supplemental information about specific severe weather events.
• Maps of climatological parameters from the Climate Atlas of the United States (NCDC, 2002).
This digital atlas provides color maps of climatic elements for the U.S., such as: temperature, precipitation, snow, wind, and pressure. The period of record for most maps is 1961-1990. The user extracts data from the atlas by selecting a parameter (e.g., dry bulb temperature), a statistical measure (e.g., mean), and a state.
• Hourly meteorological data files in digital TD3505 (NCDC, 2006; NCDC, 2011j; NCDC, 2011k) and TD3280 (NCDC, 2005a; NCDC, 2011h; NCDC, 2011i) formats.

Chapter 19 - Environmental Review Air Quality and Noise
SHINE Medical Technologies 19.3-16 Rev. 0
TD3280 is an older data file format that has recently been replaced by the TD3505 format. Hourly meteorological data files are available in TD3280 format through December, 2009. Data files for 2010 and 2011 are available in TD3505 format. Digital data files are available for worldwide locations from NCDC. These data sets contain hourly values of dry bulb temperature, humidity, wind speed/direction, and cloud cover. These data sets allow analysis of coincident meteorological conditions.
19.3.2.1.5 Identification and Selection for Analysis of Weather Monitoring Stations Located within the Site Climate Region
Figure 19.3.2-16 and Figure 19.3.2-17 present maps of the site climate region (identified in Figure 19.3.2-12), with additional annotations of locations within that region of NOAA Automated Surface Observing Stations (ASOS stations) (Figure 19.3.2-16), and NOAA COOP stations (Figure 19.3.2-17) for which NOAA “Clim-20” summaries have been published by NCDC. Table 19.3.2-5 and Table 19.3.2-6 present lists of the ASOS and COOP stations that are identified in Figure 19.3.2-16 and Figure 19.3.2-17. It should be noted that the ground elevations shown in Table 19.3.2-5 and Table 19.3.2-6 are given in ft. MSL (above Mean Sea Level) because that is the terminology used by NOAA in describing the ASOS and COOP stations (NCDC, 2001a; NCDC, 2001b; NCDC, 2001c; NCDC, 2001d; NCDC, 2001e; NCDC, 2001f; NCDC, 2001g; NCDC, 2001h; NCDC, 2001i; NCDC, 2001j; NCDC, 2001k; NCDC, 2001l; NCDC, 2001m; NCDC, 2001n; NCDC, 2001o; NCDC, 2001p; NCDC, 2001q; NCDC, 2001r; NCDC, 2001s; NCDC, 2001t; NCDC, 2001u; NCDC, 2001v; NCDC, 2001w; NCDC, 2001x; NCDC, 2012b). However, the MSL elevations are functionally equivalent to the NAVD 88 elevations used elsewhere in this subsection.
A subset of the ASOS stations presented in Figure 19.3.2-16 is selected for analysis. The following criteria were used to select that subset of stations. The two first order stations Rockford and Madison are selected because of the extra statistical summaries in the form of NOAA annual summary LCD publications available for them. They also represent the geographical center of the site climate region. Four additional stations located approximately near the four corners of the site climate region are also selected to geographically bracket that region and avoid duplicate representation of similar areas. Those four additional stations are: Baraboo (at the northwest corner of the region), Fond du Lac (at the northeast corner of the region), Freeport (at the southwest corner of the region), and DuPage County (at the southeast corner of the region).
All of the COOP stations presented in Figure 19.3.2-17 and Table 19.3.2-6 are analyzed. Input information for that analysis includes statistics in the NOAA Clim-20 document for each station, that summarize climatic conditions during the 30 year period 1971 through 2000, and ten annual climatological data summaries for each of the states Wisconsin and Illinois, which summarize climatic conditions for each of the 10 years 2001 through 2010. Total years summarized for each of the COOP stations is, therefore, 40 years.
19.3.2.2 Regional Air Quality
The SHINE site is located in Rock County, Wisconsin which is part of the Rockford-Janesville- Beloit Interstate Air Quality Control Region (WDNR, 2011a). This air quality control region combines agricultural activities with the Beloit-Janesville, Wisconsin and Rockford, Illinois urban-industrial areas. The Wisconsin portion of the air quality control region, Rock County, is mostly flat to gently rolling farmland. Industry in the region includes manufacturing, foundry operations and electrical power plants (WDNR, 2011a). Rock County is currently in attainment for all criteria

Chapter 19 - Environmental Review Air Quality and Noise
SHINE Medical Technologies 19.3-17 Rev. 0
pollutants (ozone, particulate matter, carbon monoxide, nitrogen oxides, sulfur dioxide, and lead) (WDNR, 2011a, USEPA, 2011).
Maintenance areas are those geographic areas that have a history of non-attainment but are currently in compliance with the National Ambient Air Quality Standards. In April 2004, the USEPA designated the following 10 counties in eastern Wisconsin as being in non-attainment with the 8-hour ozone air quality standard: Door, Kewaunee, Manitowoc, Sheyboygan, Washington, Ozaukee, Waukesha, Milwaukee, Racine, and Kenosha. However, in 2007, eight of the ten counties (Kewuanee, Manitowoc, Washington, Ozaukee, Waukesha, Milwaukee, Racine, and Kenosha) were re-designated as being in attainment with the 8-hour ozone standard (WDNR, 2012a). The resulting eight-county maintenance area and the two counties currently out of attainment with the 8-hour ozone air quality standard (Door and Sheyboygan counties) are situated to the northeast of the Rockford-Janesville-Beloit Interstate Air Quality Control Region, along the western shore of Lake Michigan. These are the closest non-attainment areas to the SHINE site.
USEPA guidance (USEPA, 1990) states that a Class I visibility impact analysis is necessary for a major source locating within 100 km (160.9 mi.) of a Class I area. Class I areas are national parks and wilderness areas that are potentially sensitive to visibility impairment. Table 19.3.2-7 lists the nearest Federal Class I areas to the SHINE site (NPS, 2011). The table shows that the closest Federal Class I area is the Rainbow Lake Wilderness Area, which is located approximately 455 km (approximately 283 miles) northwest of the SHINE site in far northern Wisconsin.
Causes of regional air quality problems are generally due to a combination of factors. Typically, major factors include the following (Korshover, J., 1967): stagnating surface high pressure systems characterized by low surface wind speeds that linger over a region for several days, concentration of heavy industries and their air pollution emissions in relatively congested areas, and atmospheric mixing depths that limit the volume of air within which pollutants dilute (Holzworth, G.C., 1972). Additional factors can be involved for specific pollutants. For example, ozone air pollution is affected by not only the factors of stagnation, low wind speed, and limited mixing, but also requires the presence of additional factors that support the photochemical reactions in the atmosphere, including: intense sunlight, high temperature, and the presence of precursor chemical pollutants (Stern, A.C., 1973).
19.3.2.3 Severe Weather
19.3.2.3.1 Extreme Wind
A statistic known as the “basic” wind speed is used for design and operating bases. Basic wind speeds are 50 year recurrence interval “nominal design 3-second gust wind speeds (mph) at 33 ft. (10.1 m) above ground for Exposure C category”, as defined in Figures 6-1 and 6-1C of ASCE, 2006.
Several sources are considered to determine the wind speeds for the SHINE site. The basic wind speed for the SHINE site is 90 mph (40.2 m/s), based on the plot of basic wind speeds in Figure 6-1C of ASCE, 2006. Basic wind speeds reported in AFCCC, 1999 for hourly weather stations in the site climate region are as follows: 90 mph (40.2 m/s) for Madison, Wisconsin, and 90 mph (40.2 m/s) for DuPage County Airport, West Chicago, Illinois. Consistency of the three values is the basis for selecting a value of 90 mph (40.2 m/s) for the SHINE site. That value

Chapter 19 - Environmental Review Air Quality and Noise
SHINE Medical Technologies 19.3-18 Rev. 0
applies to a recurrence interval of 50 years. Section C6.5.5 of ASCE, 2006 provides a method to calculate wind speeds for other recurrence intervals. Based on that method, a 100-year return-period value is calculated by multiplying the 50-year return-period value by a factor of 1.07. That approach produces a 100-year return-period three second gust wind speed for the SHINE site area of 96.3 mph (43.0 m/s).
19.3.2.3.2 Tornadoes and Waterspouts
The NCDC Storm Events Database (NCDC, 2011g) provides information on historic storm events on a county basis. To use that database, 28 regional counties that are at least partially included within the site climate region are selected and presented on the map in Figure 19.3.2-18. Those counties approximate the representative climate region defined above in Subsection 19.3.2.1.3. The 28 counties are listed in Table 19.3.2-8 (USCB, 2011).
The NCDC Storm Events Database (NCDC, 2011g) was accessed to extract statistics on regional tornadoes and waterspouts. Information is extracted for the 28 regional counties. Those tornado and waterspout statistics, for the 62-year period May 1950 through July 2011, are presented in Table 19.3.2-8.
Strongest tornadoes in the database for Rock County (in which the SHINE site is located) are reviewed and are found to be of intensity F2. Table 19.3.2-9 provides additional details on the most intense Rock County tornadoes. The strongest tornadoes found in the database for the seven counties adjacent to Rock County: Dane, Jefferson, Walworth, Boone, Winnebago, Stephenson, and Green counties, were reviewed and found to be F3 and F4 storms in Boone County, Illinois, and F3 storms in Dane County and Jefferson County, Wisconsin. Table 19.3.2-10 presents additional details on the strongest tornadoes in counties adjacent to Rock County.
International Atomic Energy Agency (IAEA) guidance for siting research reactors (IAEA, 1987) was reviewed. This guidance requires design tornado information to be based on the maximum historical intensity within a radius of about 100 km (62 mi.) from the SHINE site. For the SHINE site, a 100 km (62 mi.) radius partially extends outside of the representative site climate region included within the 28 county region described above. An F5 intensity tornado was recorded on 8 June 1984 in Iowa County, Wisconsin, at the town of Barneveld, which is located approximately 49.7 mi. (80 km) in a west-northwest direction from the SHINE site.
Regulatory Guide 1.76 specifies design-basis tornado characteristics for nuclear power reactors. Therefore, this guidance is not specifically applicable to an isotope production facility and Regulatory Guide 1.76 is used as a technical reference only. Wisconsin is located in Region I in Regulatory Guide 1.76 Figure 1. The design-basis tornado characteristics applicable to Region I are listed below:
a. Maximum wind speed: 230 mph (103 m/s)b. Translational speed: 46 mph (21 m/s)c. Maximum rotational speed: 184 mph (82 m/s)d. Radius of maximum rotational speed: 150 ft (45.7 m/s)e. Pressure drop: 1.2 psi (83 millibars)f. Rate of pressure drop: 0.5 psi/s (37 millibars)

Chapter 19 - Environmental Review Air Quality and Noise
SHINE Medical Technologies 19.3-19 Rev. 0
19.3.2.3.3 Water Equivalent Precipitation Extremes
This subsection examines and compares water equivalent precipitation extremes within the site climate region, and locally near the SHINE site. Daily total water equivalent precipitation is measured at the local NOAA COOP monitoring station at Beloit, Wisconsin, and several regional COOP stations within the site climate region.
A PMP value for the SHINE site is presented in Subsection 19.3.2.3.6.
Table 19.3.2-11 presents maximum recorded 24-hour and monthly water equivalent precipitation values for the local COOP station at Beloit, and for the 18 regional COOP stations located within the site climate region defined in the map in Figure 19.3.2-17.
Overall historic maximum recorded 24-hour water-equivalent precipitation from records for either the local Beloit station or for regional stations is 8.09 in. (20.55 cm) at DeKalb, Illinois. That event occurred on 18 July 1996. It was due to thunderstorms in a warm, moist tropical air mass streaming north from the Gulf of Mexico and into the warm sector southeast of a synoptic low pressure center located over northern Minnesota (NCDC, 1996a). Flash flooding was widespread over north-central and northeast Illinois due to record breaking rainfall during the 17-18 July period (NCDC, 1997).
Overall historic maximum monthly water-equivalent precipitation from records for either the local Beloit station or for regional stations is 16.09 in. (40.87 cm) at Portage, Wisconsin. That month was August, 1980 (NCDC, 2001s).
19.3.2.3.4 Hail, Snowstorms and Ice Storms
The mean hail or sleet frequencies during winter, spring, summer, autumn, and annual periods for Rockford and Madison are listed in Table 19.3.2-12. Mean hail frequencies are less than one day per season at both stations. Statistics are very similar at Rockford and Madison, verifying some consistency across the site climate region.
Hail events that are either severe (with hail size exceeding 0.75 in. (1.91 cm) in diameter) or large (with hail exceeding one inch in diameter) are reported to have occurred in Rock County, Wisconsin on 11 occasions during the period 1961-1990, or with a frequency of approximately 0.37 occurrences per year (NCDC, 2002). The largest hailstones that Rock County has experienced are as follows: of diameter 3.00 in. (7.62 cm) on one occasion during June 1930, of diameter 2.50 in. (6.35 cm) on one occasion during August 2006, and of diameter 2.00 in. (5.08 cm) on one occasion during June 1975 and one occasion during June 1998 (NCDC, 2011g).
Daily total snowfall amounts are measured at the local NOAA COOP monitoring station at Beloit, Wisconsin, as well as at several regional COOP stations within the site climate region.
Maximum recorded 24-hour snowfall from records for either the local Beloit station or for regional stations is 21.0 in. (53.34 cm) at Dalton, Wisconsin. That event occurred on 2 January 1999. It was due to a major winter synoptic cyclone (the “Blizzard of 1999”) that developed in Colorado, curved northeast through the Great Lakes, then entered Canada (NCDC, 1999 and NCDC, 2000). On 2 January 1999 the synoptic surface low was centered at the south tip of Illinois. A warm maritime tropical air mass with temperatures in the 80s°F was present to the

Chapter 19 - Environmental Review Air Quality and Noise
SHINE Medical Technologies 19.3-20 Rev. 0
south, and a continental arctic air mass with temperatures primarily in the teens °F was present to the north. An area of heavy snow covered the site climate region. This blizzard paralyzed south central and southeast Wisconsin. Ten to 21 in. (25.40 to 53.34 cm) of snow were deposited and wind gusts of 45 to 63 mph (20.1 to 28.2 m/s) occurred. Nearly all cities and villages declared snow emergencies, and airports were closed. Visibility in blowing snow was typically 0.5 mi. (0.8 km). Structural damage to buildings and power lines was reported.
Overall historic maximum monthly snowfall from records for either the local Beloit station, or for regional stations, is 50.4 in. (128.0 cm) at Watertown, Wisconsin. That month was January, 1979 (NCDC, 2001w).
Overall, extreme snowfall conditions recorded at the local station at Beloit, Wisconsin are bracketed by conditions recorded at stations within the site climate region, supporting conclusions regarding climate region representativeness.
A snow pack value for the SHINE site is presented in Subsection 19.3.2.3.6.
The mean number of days with freezing rain or drizzle is 2 days per year at both Madison, Wisconsin and Rockford, Illinois (Table 19.3.2-4). A summary of 14 ice storms that affected Rock County, Wisconsin during the period 1995-2011 is presented in Table 19.3.2-13 (NCDC, 2011g). That summary indicates the following.
a. Several ice storms, as many as two or three, can occur per year.b. Ice can accumulate periodically or during a consecutive period of anywhere from
approximately two hours to 11 hours.c. Ice accumulations typically range from one-tenth to one-quarter inch, but can reach
one-half inch.d. Hazardous driving conditions are a typical result of the storms.
A 50-year return-interval atmospheric ice load due to freezing rain is estimated to be 0.75 in. (1.91 cm) for the SHINE site area (ASCE, 2006). Concurrent three second wind gust is estimated to be 40 mph (17.9 m/s). This ice load is intended for use in assessment of ice accumulation on free objects, such as wires.
19.3.2.3.5 Thunderstorms and Lightning
Thunderstorm statistics for the regional NOAA first order weather stations at Rockford, Illinois and Madison, Wisconsin are published and available for the site climate region (NCDC, 1996b; NCDC, 2011a and NCDC, 2011c). Thunderstorms occur during an average of 43.0 days per year at Rockford, and 39.6 days per year at Madison. Mean seasonal thunderstorm frequencies for Rockford and Madison are listed in Table 19.3.2-14. Thunderstorms are most frequent in summer and least frequent in winter at both stations.

Chapter 19 - Environmental Review Air Quality and Noise
SHINE Medical Technologies 19.3-21 Rev. 0
The mean frequency of lightning strikes to earth is calculated via a method from the Electric Power Research Institute (EPRI), per the U. S. Department of Agriculture Rural Utilities Service (USDA, 1998). The method assumes a relationship between the average number of thunderstorm days per year (T), and the number of lightning strikes to earth per square mile per year (N). The mathematical relationship is as follows:
N = [0.31][T] (Equation 19.3.2-1)
Based on the average number of thunderstorm days per year at Rockford during the 55 year period 1955-2010 (43.0, which is slightly higher than the value of 39.6 days for Madison and is therefore used here), the frequency of lightning strikes to earth per sq. mi. per year is 13.3 (5.1 strikes per sq. km per year) for the SHINE site and surrounding area. For comparison, based on a five year period of record (NLSI, 2011), indicates 2 to 4 flashes per sq. km per year for the site region, which corresponds to 5.2 to 10.4 flashes per sq. mi. per year. The EPRI value therefore is shown to be a reasonable indicator.
19.3.2.3.6 Snowpack and Probable Maximum Precipitation (PMP)
A 100-year return-period snowpack for the SHINE site vicinity was derived by multiplying the 50-year return interval snowpack from Figure 7.1 of ASCE, 2006 by a factor which converts the 50-year return interval snowpack to a 100-year return-interval snowpack. Table C7-3 of ASCE, 2006 suggests that an appropriate factor is 1.22 (i.e., the 50-year value divided by the factor of 0.82 listed in Table C7-3).
The estimated 50-year interval snowpack for the SHINE site from Figure 7.1 of (ASCE, 2006) is 25 in. (63.5 cm). The resulting estimated 100-year return interval snow pack for the SHINE site is 30.5 in. (30.5 in. = 1.22 x 25 in.) (77.5 cm).
The weight of the 48-hour PMP for the SHINE site vicinity was derived by multiplying the 48-hour PMP (in inches) from Figure 21 of USDOC, 1978 by the weight of one inch of water (one inch of water covering one square foot weighs 5.2 lb [2.4 kg]).
The estimated 48-hour PMP for the SHINE site from Figure 21 of USDOC, 1978 is 34 in. (86.4 cm). The resulting estimated weight of the 48-hour PMP for the SHINE site is
176.8 pounds per square feet (lb/ft2) (863.2 kilograms per square meter [kg/m2]) (176.8 lb/ft2
= 34 in. x 5.2 lb/ft2).
19.3.2.3.7 Design Dry Bulb and Wet Bulb Temperatures
Site design basis dry bulb temperatures (DBTs) and wet bulb temperatures (WBTs) are defined for the SHINE site and its climate area. Those include the following statistics.
a. Maximum DBT with annual exceedance probability of 0.4 percentb. Mean coincident wet bulb temperature (MCWB) at the 0.4 percent DBTc. Maximum DBT with annual exceedance probability of 2.0 percentd. MCWB at the 2.0 percent DBTe. Minimum DBT with annual exceedance probability of 0.4 percentf. Minimum DBT with annual exceedance probability of 1.0 percentg. Maximum WBT with annual exceedance probability of 0.4 percent

Chapter 19 - Environmental Review Air Quality and Noise
SHINE Medical Technologies 19.3-22 Rev. 0
h. Maximum DBT with annual exceedance probability of 5 percenti. Minimum DBT with annual exceedance probability of 5 percentj. 100-year return maximum annual DBT k. MCWB at the 100-year return maximum annual DBTl. 100-year return maximum annual WBTm. 100-year return minimum annual DBT
Statistics for (a)-(g) are readily available from (ASHRAE, 2009). Since those statistics are available from a well-known reference, no additional data analysis is required. ASHRAE, 2009 includes values for the following stations in the SHINE site climate region: Fond du Lac, Wisconsin; Madison, Wisconsin; Rockford, Illinois; and DuPage County Airport, Illinois. These stations represent climatic conditions in the northern, central and southern portions of the site climate region, respectively (Figure 19.3.2-16). Worst-case (bounding) values for (a)-(g) are selected from those four stations. To maintain thermodynamic consistency between DBT and coincident WBTs, DBT/MCWB pairs are retained for a single station. The resulting statistics are listed in Table 19.3.2-15.
Statistics for the maximum and minimum DBT with an annual exceedance probability of 5 percent (items [h] and [i] above) are not available from ASHRAE, 2009. In lieu of values from ASHRAE, 2009, values are extracted from published DBT and wet-bulb depression joint frequency tables in NCDC, 1996b. Joint-frequency tables are available only for Madison and Rockford. The extracted statistics for Madison and Rockford are listed in Table 19.3.2-15.
The 100-year return interval maximum annual DBTs and WBTs (items [j], [l] and [m] above) are estimated using a technique described on page 14.6 of Chapter 14 of ASHRAE, 2009. The technique estimates the n-year return-interval extreme temperature from a series of annual maximum and minimum temperatures. The ASHRAE technique uses the following equation:
(Equation 19.3.2-2)
where
n-year return period value of the extreme temperature computed, in years
mean annual extreme maximum or minimum temperature
+1 if the maximum temperature is computed; -1 if the minimum temperature is computed
standard deviation of the annual extreme maximum or minimum temperatures
return period in years ( =100 for a 100-year return interval).
(Equation 19.3.2-3)
sFIMTn
nT
M
I
s
n n
)
1n
nln(ln5772.0
6F

Chapter 19 - Environmental Review Air Quality and Noise
SHINE Medical Technologies 19.3-23 Rev. 0
where
F is a function that converts the standard deviation of annual extreme temperature parameter (such as the annual extreme temperature in °F) to a new variable
that is linearly related to the n-year return-interval extreme temperature .
Since the MCWB coincident with the 100-year return interval maximum DBT is required (item [k] above), this technique is only applied at meteorological stations in the climate region which had: (1) digital records of hourly DBT and coincident WBT and (2) published annual extreme DBTs (i.e., NOAA annual summary LCD publications, such as NCDC, 2011a). The published annual extreme DBTs are required to check annual extreme DBTs extracted from the digital records. There were only two stations in the climate region which meet these requirements: Rockford, Illinois and Madison, Wisconsin.
The ASHRAE technique is applied to hourly TD3280 and TD3505 digital datasets (NCDC, 2011h-k) for each of these two stations. The extreme DBT and WBT are first identified for each year which has at least 90 percent of possible hourly coverage of DBT and WBT. This produces a time-series of annual maximum and minimum DBTs and WBTs for 53 years for Madison and 30 years for Rockford. Each time-series is then input into the ASHRAE technique. The resulting estimated 100-year return period annual DBTs and WBTs (items [j], [l] and [m] above) are listed in Table 19.3.2-16.
The estimated 100-year return maximum annual DBT at Rockford (104.8°F (40.4 ºC); Table 19.3.2-16) is only 0.8°F (0.44 ºC) above the record maximum DBT at Rockford (104°F [40.0 ºC]) (NCDC, 2011c). Instead of attempting to derive a statistical relationship between the DBT and WBT useful over the short DBT interval of 104°F (40.0 ºC) to 104.8°F (40.4 ºC), the MCWB coincident with the estimated 100-year return maximum annual DBT at Rockford (104.8°F [40.4 ºC]) are taken to be the WBT coincident with the record maximum DBT at Rockford (104°F [40.0 ºC]). The WBT coincident with the record maximum DBT at Rockford is 80°F (26.7 ºC) (NCDC, 2011i and NCDC, 2011k). Therefore, the estimated MCWB coincident with the 100-year return maximum annual DBT at Rockford is 80°F (26.7 ºC).
A similar approach is taken for the 100-year return maximum annual DBT for Madison. The 100-year return maximum annual DBT for Madison (104.3°F (40.2 ºC); Table 19.3.2-16) is only 0.3°F (0.17 ºC) above the record maximum DBT for Madison (104°F [40.0 ºC]) (NCDC, 2011a). Therefore, the MCWB coincident with the estimated 100-year return maximum annual DBT is the WBT coincident with the record maximum DBT for Madison. The WBT coincident with the record maximum DBT at Madison is 75°F (23.9 ºC) (NCDC, 2011h and NCDC, 2011j). Therefore, the estimated MCWB coincident with the 100-year return maximum annual DBT for Madison is 75°F (23.9 ºC). The 100-year maximum annual DBT and MCWB pairs (items [j] and [k] above) for Rockford and Madison are listed in Table 19.3.2-16.
19.3.2.3.8 Extreme Dry Bulb Temperatures
An additional review of regional extreme DBTs is done using NOAA COOP climate monitoring stations in the SHINE site climate region. The locations of those stations are shown in Figure 19.3.2-17. The COOP climate monitoring stations do not measure WBT and do not record hourly DBTs. Those stations only record maximum and minimum daily DBTs and daily
s
nT

Chapter 19 - Environmental Review Air Quality and Noise
SHINE Medical Technologies 19.3-24 Rev. 0
precipitation totals. Therefore, it is not possible to identify WBTs coincident with the extreme DBTs recorded at those stations.
Table 19.3.2-17 presents extreme DBTs recorded at the COOP climate monitoring stations. For completeness, Table 19.3.2-17 also includes the extreme DBTs recorded at the two first order stations in the SHINE site climate region (Madison, Wisconsin and Rockford, Illinois). The overall extreme DBTs for the climate region are: a maximum of 109°F (42.8 ºC) recorded on 14 July 1936 at Marengo in Boone County, Illinois, and a minimum of -45°F (-42.8 ºC) recorded on 30 January 1951 at Baraboo in Sauk County, Wisconsin.
Since Marengo is a COOP station, the WBT coincident with the extreme DBT at Marengo (109°F [42.8 ºC]) is not available. Furthermore, DBT and coincident WBT data in digital format that are available for stations in the climate region do not extend as far back as 1936 (Table 19.3.2-5). Therefore, it is necessary to estimate a WBT coincident with the overall extreme DBT.
A graphical extrapolation method is used to estimate the WBT coincident with the overall extreme DBT of 109°F (42.8 ºC). A simple graphical approach is appropriate for several reasons, as follows:
a. A simple graphical approach is appropriate because at the extreme high end of the DBT range there are only a small number of observations. Use of an objective numerical technique to project larger DBT values using a small population as input is unjustified because it is effectively no less subjective than a graphical approach.
b. The requirement is only for a mean coincident WBT value. A mean WBT value is simply identified for any DBT value on the graph, therefore a set of such means is easily plotted, and form the basis of an extrapolation line.
c. Published DBT/WBT depression joint frequency distribution (JFD) tables are available for Madison and Rockford (NCDC, 1996b). The tables are suitable for use in sketching the graphical relationship between regional DBT and WBT during conditions of the peak DBT.
The closest first-order station to Marengo is Rockford, Illinois, which is located approximately 25 mi. (40.2 km) west of Marengo (Figure 19.3.2-17). Therefore, the DBT/WBT depression JFD table from Rockford is used to estimate the WBT coincident with an overall extreme DBT of 109°F (42.8 ºC) recorded at Marengo. The upper DBT limit of the DBT/WBT depression JFD table from Rockford is 103°F (39.4 ºC). Therefore, it is necessary to extrapolate the upper end of the JFD table to the observed DBT of 109°F (42.8 ºC). Graphical extrapolation of the DBT/WBT depression relationship to a DBT of 109°F (42.8 ºC) results in an estimated WBT depression of 30°F (16.7 ºC), which corresponds to a MCWB of 79°F (26.1 ºC) (109°F - 30°F = 79°F). Therefore, the estimated MCWB coincident with the overall extreme DBT of 109°F (42.8 ºC) at Marengo is 79°F (26.1 ºC).
19.3.2.3.9 Restrictive Dispersion Conditions
Major air pollution episodes are typically a result of persistent surface high pressure weather systems that cause light and variable surface winds and stagnant meteorological conditions for four or more consecutive days. Estimates of the stagnation frequency are provided in (NOAA,

Chapter 19 - Environmental Review Air Quality and Noise
SHINE Medical Technologies 19.3-25 Rev. 0
1999; Figures 1 and 2). Those estimates indicate that, on average, the SHINE site location experiences less than two stagnation cases per year and the average length of a case is less than five days.
19.3.2.4 Local Meteorology
The purpose of this local climate analysis is to understand dispersion conditions in the vicinity of the SHINE site. That characterization is input to and provides a context for assessment of atmospheric impact of the facility on the environment. Local dispersion climatology includes consideration of airflow and atmospheric turbulence. The following subsections address local topography, the source of local meteorological data, wind roses, and atmospheric stability distribution.
19.3.2.4.1 Topography
The SHINE site is located approximately at the center of Rock County, Wisconsin, about 13 mi. (20.9 km) north of the Illinois/Wisconsin border, and 2.5 mi. (4.0 km) east of the Rock River. The SHINE site is located within till plains glacial deposits on the Central Lowland Province of the Interior Plains Division of the United States. Within a radial distance from the site of approximately 10 mi. (16.1 km), additional ground surface features include the following:
a. There is terminal kettle-moraine topography in the central, north, and east sections, which represent effects of the last advance of the continental glacier, including uneven hills and ridges, varying drainage patterns, and gently rolling terrain (Rock County, 2012a).
b. There is dissected upland with isolated bluffs in the west and southwest sections, part of the “driftless area” (Subsection 19.3.2.1.2) which was not overrun by ice during the last continental glaciation (Moran, J.M. and E.J. Hopkins, 2002; Rock County, 2012b).
c. The Rock River watershed, the main waterway, bisects the county from north to south (Rock County, 2012a). The Rock River valley is typically less than 1 mi. (1.6 km) wide, with minor slopes at the edges of the river floodplain with heights of approximately 50 ft. (15.2 m).
d. Most land is used for agriculture, including corn and soybean farming (Rand McNally, 1982 and 2005).
e. The main urban centers of Janesville and Beloit are located along the Rock River.
f. The finished site grade elevation is approximately 827 ft. (252 m) NAVD 88. The SHINE site and adjacent ground within a radius of approximately 1 mi. (1.6 km) is flat farmland. Within a 10 mi. (16.1 km) radius from the SHINE site, topographic elevations range from approximately 755 ft. (230 m) NAVD 88 along the Rock River, to approximately 1033 ft. (315 m) NAVD 88 at the highest bluffs (USGS, 1980). Therefore, the topography within a 10 mi. (16.1 km) radius ranges from approximately 72 ft. (21.9 m) below the SHINE site elevation, to 206 ft. (62.8 m) above the SHINE site elevation.

Chapter 19 - Environmental Review Air Quality and Noise
SHINE Medical Technologies 19.3-26 Rev. 0
19.3.2.4.2 Local Data Sources
Surface meteorological data were available from the SWRA in Janesville, Wisconsin (NOAA station identifier KJVL). That airport is located approximately 0.25 mi. (0.40 km) west of the SHINE site. The station elevation is 808 ft. (246.3 m) NAVD 88 (Table 19.3.2-5). The SWRA meteorological monitoring station is an automated weather observation station (AWOS) with precipitation sensors installed (AWOS-IIIP). The Federal Aviation Administration (FAA) describes the specifications of an AWOS system in an Advisory Circular (FAA, 2011). Specifications from this Advisory Circular are listed in Table 19.3.2-18. The AWOS anemometer height at SWRA for the period of interest in this study (2005-2010) is 26 ft. (7.9 m) above ground level (NCDC, 2012a).
The FAA Advisory Circular (FAA, 2011) describes the FAA standard for procurement, construction, installation, activation, and maintenance of non-Federal AWOS systems. That standard is provided in an FAA Order (FAA, 1992), which requires inspections that meet specified technical standards and tolerances. On-site instrument calibration is required annually unless more frequent calibration is specified by the FAA region. Calibrations are required to be done by a qualified technician with FAA verification authority and witnessed by a qualified FAA non-Federal inspector. Facilities Maintenance Log and Technical Performance Record forms are maintained. In addition, NCDC subjects surface meteorological data collected at AWOS stations such as SWRA to documented quality assurance and analysis procedures (Del Greco et al., 2006).
Raw meteorological data from SWRA are obtained from NCDC (NCDC, 2011l). Hourly dry bulb temperature, humidity, wind speed, and wind direction data are extracted from the raw data. Table 19.3.2-19 shows the annual data recovery rates for dry bulb temperature, humidity, wind speed, and wind direction. The table shows that the annual data recovery rate for each variable exceeded 90 percent for 2005, 2006, 2008-2010, and that the recovery rate was approximately 87 percent for each variable in 2007. Data from 2005 through 2010 are chosen for analysis in order to produce a data set with the most recent contiguous 5 years of data, and with 5 years of data having recovery rates better than 90 percent. The period of record requirements comply with the Final Interim Staff Guidance Augmenting NUREG-1537, Part 1, Section 19, to provide meteorological data collected as near as possible to the SHINE site for the most recent 5-year period. Table 19.3.2-20 presents a summary of meteorological parameter statistics from the SWRA during the 2005-2010 period.
Published, tabular values of average daily maximum and minimum dry bulb temperatures are not available from SWRA. However, these values are available for Madison, Wisconsin and Rockford, Illinois from Table 19.3.2-2 and Table 19.3.2-3, respectively. These values are expected to be sufficiently representative of the local climate. Published tabular values of annual fog frequencies are also not available for SWRA. However, these values are available for Madison, Wisconsin and Rockford, Illinois from Table 19.3.2-2 and Table 19.3.2-3, respectively. Heavy fog (defined as fog occurring with visibilities less than or equal to 0.25 miles (0.40 km) occur an average of 21.5 days per year at Madison, Wisconsin and 20.1 days per year at Rockford, Illinois. These values are expected to be sufficiently representative of the local climate.

Chapter 19 - Environmental Review Air Quality and Noise
SHINE Medical Technologies 19.3-27 Rev. 0
19.3.2.4.3 Plans to Access Local Meteorological Data during License Period
Meteorological measurements will be available for use in responding to accidental radiological releases or other emergencies, and other routine purposes that require access to meteorological information during the licensing period. That meteorological information will be obtained for local government weather monitoring stations that observe wind and other surface meteorological parameters on an hourly basis.
When needed during an emergency, real-time hourly surface meteorological measurements of wind direction, wind speed, air temperature, and weather type will be accessed by SHINE through government data sources. Access will be attempted during the emergency in the following sequence, until reliable data are obtained, as follows:
a. Internet access to hourly surface weather observations recorded at the SWRA AWOS, at URL: http://www.weather.gov/data/obhistory/KJVL.html
b. Telephone access to an automated synthesized voice recording of the most recent hourly surface observations recorded at the SWRA AWOS, at number: (608) 758-1723.
c. If weather observations are not available from the SWRA AWOS, then weather information from another station with hourly meteorological data in the Site Climate Region will be used. The following stations will be used, in the order listed below. The stations are listed in order of increasing distance from Janesville, Wisconsin:
1. Rockford, Illinois: http://www.weather.gov/data/obhistory/KRFD.html2. Monroe, Wisconsin: http://www.weather.gov/data/obhistory/KEFT.html3. Burlington, Wisconsin: http://www.weather.gov/data/obhistory/KBUU.html4. Madison, Wisconsin: http://www.weather.gov/data/obhistory/KMSN.html
During normal operations, hourly data will be obtained by internet access to hourly surface weather observations recorded at the SWRA AWOS, at URL: http://www.weather.gov/data/obhistory/KJVL.html.
19.3.2.4.4 Comparison of Local and Regional Wind Roses
Subsection 19.3.2.4.2 describes the meteorological monitoring system at the SWRA in Janesville, Wisconsin. As described in that subsection, wind speed and direction measurements are collected at the 26 ft. (7.9 m) level. Wind speed and direction from the 26 ft. (7.9 m) level are used to determine JFDs that are input to relative atmospheric concentration (χ/Q) and radiological dose assessments in this report (see Subsection 19.4.8.2).
Figures 19.3.2-19 through 19.3.2-35 show the annual, monthly and seasonal wind roses from SWRA. The period of record on which those plots are based is the six years from January 1, 2005 through December 31, 2010 (NCDC, 2011). That period of record is also used for JFD input to χ/Q and radiological dose assessments in this report.
An annual wind rose (Figure 19.3.2-19) shows dominant wind frequencies from the west (approximately 8 percent of the period) and from the south (approximately 7.5 percent of the period). The remaining directions include a group (N, E, SSW, SW, WNW, and NW) with frequencies of occurrence that range from approximately 5 to 7 percent of the period, and

Chapter 19 - Environmental Review Air Quality and Noise
SHINE Medical Technologies 19.3-28 Rev. 0
another group (NNE, NE, ENE, ESE, SE, SSE, WSW, and NNW) with frequencies of occurrence that range from approximately 3.5 to 5 percent of the period. The multi-modal nature of the annual wind rose reflects airflows associated with seasonal shifts of mean North American surface pressure belts and centers, seasonal changes in paths and frequencies of synoptic-scale surface cyclones and anticyclones that move across the area, and seasonal changes in frequency of development of synoptic surface fronts (Trewartha, G.T., 1954; Trewartha, G.T.,1961; Rand McNally, 2005; and EDS, 1968).
The winter season wind rose (Figure 19.3.2-32) shows most frequent wind directions during that season from the west, northwest and north. This is a reflection of polar and arctic air masses that flow from Canada that are dominant during the winter. The large Icelandic low pressure center that intensifies during Northern Hemisphere winter causes a pressure gradient pattern that is oriented in a northwest-to-southeast direction over Canada and the U.S. that guides surface high pressure systems that contain the polar and arctic air masses in a southeast direction from Canada to the Midwest and eastern U.S. Upper-air meridional flow (relatively parallel to lines of longitude) is more prevalent than zonal flow (relatively parallel to lines of latitude), and surface cyclonic storms more frequently occupy the Alberta storm track that extends from southwest Canada into the central U.S.
The spring season wind rose (Figure 19.3.2-33) shows dominant wind direction frequencies from the east, south, and west. During spring, the Icelandic low weakens, the southwest U.S. surface thermal low intensifies, and the north Atlantic Azores high pressure cell intensifies. Because of the northward shift of the subtropical high pressure belt (including the Azores high), storm systems and Canadian air masses are not always pushed towards the southeast, but rather stay farther north during their movement over the Midwest and eastern U.S. Intensification of the southwest U.S. thermal low increases winds from the south over the central U.S. Warm and stationary fronts form more frequently over the Midwest U.S. at the boundaries between northern and southern air masses. Surface pressure troughs at those fronts draw moist modified maritime tropical air from the south that results in surface convergence, lifting, and formation of precipitation at the fronts. The combined results of these changes are increased frequencies of west, south, and east winds as air masses converge on the area from more locations in the southwest, south, and southeast U.S. than during winter.
During the summer season, the subtropical high pressure belt reaches its maximum intensity. It reinforces development of individual surface anticyclones, which follow in a general easterly direction behind weak cold fronts as they move eastward. Surface lows and precipitation are largely suppressed. The summer season wind rose (Figure 19.3.2-34) shows dominant wind direction frequencies from the south and southwest, reflecting flow out of the relatively slow moving surface high pressure centers.
The autumn wind rose (Figure 19.3.2-35) reverts back to some cool season circulation patterns, which are also characteristic of the spring season. It shows dominant wind direction frequencies from the south and west, but east winds occur less frequently than during the spring season. East winds are less frequent because the subtropical surface pressure ridge extends westward from the north Atlantic to the central U.S. during autumn, whereas it is strongest off the Atlantic coastline during spring. Airflow, therefore, moves north out of surface anticyclones that are reinforced by the mean autumn subtropical ridge position across the east central U.S., and airflow relatively infrequently moves towards the west off of the North Atlantic.

Chapter 19 - Environmental Review Air Quality and Noise
SHINE Medical Technologies 19.3-29 Rev. 0
Wind roses were generated for regional climate stations from TD-3505 hourly surface dataset files (NCDC, 2011m). The climate stations (Baraboo, Wisconsin; Madison, Wisconsin; Fond du Lac, Wisconsin; Freeport, Illinois; Rockford, Illinois; and Du Page County Airport, Illinois) were identified in Subsection 19.3.2.1.5. Rockford and Madison represent the geographical center of the site climate region. Baraboo, Fond du Lac, Freeport and Du Page County Airport represent the northwest, northeast, southwest and southeast corners of the climate region, respectively.
Figure 19.3.2-36 shows a comparison of annual wind roses for the SWRA in Janesville and the six regional stations. The wind roses are arranged in the figure to match the approximate physical locations of the stations relative to Janesville, Wisconsin. The annual wind rose from Fond du Lac shows a bimodal southwest and northeast wind direction distribution. The northeast winds appear to be local effects of nearby Lake Winnebago, which is located approximately three miles northeast of the Fond du Lac airport. However, the annual wind roses at the other five regional stations (Baraboo, Madison, Freeport, Rockford, and Du Page County Airport) show overall multi-modal patterns similar to the annual wind rose from Janesville. This consistency verifies the representativeness of wind measurements from the SWRA in Janesville for purposes of dispersion modeling.
19.3.2.4.5 Atmospheric Stability
Pasquill stability class is derived from hourly wind speed, ceiling height, and sky cover measurements from the AWOS at the SWRA in Janesville, Wisconsin. The Pasquill stability class is derived using computer code from USEPA, 1999 which implements the method described by (Turner, D.B,1964). Table 19.3.2-21 shows the joint data recovery of wind speed, wind direction, and the computed Pasquill stability class. Joint data recovery exceeds 90 percent for 2005, 2006, and 2008-2010, and is 86 percent for 2007.
Table 19.3.2-22 presents the annual Pasquill class frequency distributions for the combined local data period 2005-2010, and each individual year in the combined period. This table shows that the Pasquill class “D” stability class is the most frequently occurring stability class for each year and for the combined period. The Pasquill “A” class is the least frequently occurring class. Both of these results are consistent with generally observed stability class climatologies. A similar distribution is also presented, for example, in Stern et al., 1984.
The results in Table 19.3.2-22 are presented in the form of JFDs of wind direction and wind speed stratified by Pasquill stability, in Table 19.3.2-23 through Table 19.3.2-29. These JFDs are used for χ/Q and radiological dose calculations presented in Subsection 19.4.8.2.
19.3.2.5 Programs or Policies to Reduce Greenhouse Gas Emissions
SHINE is committed to minimizing its carbon footprint and promoting initiatives to reduce emissions of greenhouse gases (GHG). SHINE will develop a comprehensive program to avoid and control GHG emissions associated with the facility. It is expected that this program will include elements of the following, as SHINE determines to be appropriate for the facility:
• Participating in USEPA initiatives such as the Climate Leaders Program, ENERGY STAR Commercial Buildings Program, Green Power Partnership, and SmartWay Transport Partnership.
• Developing a GHG emission inventory, including appropriate procedures for estimating or monitoring GHG emissions.

Chapter 19 - Environmental Review Air Quality and Noise
SHINE Medical Technologies 19.3-30 Rev. 0
• Investigating and implementing methods for avoiding or controlling the GHG emissions identified in the inventory.
• Implementing energy efficiency and conservation programs at the SHINE facility.• Working with suppliers, transporters, and customers to improve their energy efficiency.• Installing solar panels and/or purchasing electricity generated from renewable energy
sources.• Encouraging car pooling or other measures to minimize GHG emissions due to vehicle
traffic during construction and operation of the SHINE facility.• Conducting periodic audits of GHG control procedures and implementing corrective
actions when necessary.
19.3.2.6 Noise
19.3.2.6.1 Baseline Noise Conditions
A commonly used measure of noise is A-weighted decibels (dBA). The SHINE site is currently an agricultural field. Consequently, the SHINE site itself has no noise-generating facilities. However, intermittent seasonal noise emissions at the site caused by use of farming equipment may result in noise emissions ranging from 85 to 100 dBA (Bean, T., 2008). At night, or at certain times during the day when traffic on US 51 is particularly light, noise levels at the SHINE site are more typical of a quiet urban setting where the noise level can be expected to range from 40 to 50 dBA (Table 19.3.2-30).
The SHINE site was analyzed for current noise conditions resulting from off-site sources. Continuous daytime baseline level noise at the SHINE site is predominately the result of vehicle noise generation associated with traffic along US 51. The existing daytime traffic volume on US 51 is modeled to result in a 67 dBA noise level approximately 81 ft. (25 m) east of the edge of the northbound driving lane, which attenuates to 57 dBA at 260 ft. (79 m) east of the edge of the northbound driving lane.
The nearest noise receptors to the SHINE site are Airport Park (0.30 mi. [0.48 km] to the northwest); a residence immediately west of Airport Park (0.33 mi. [0.53 km] to the northwest); and a church, Iglesia Hispania Pentecostes (0.35 mi. [0.56 km] to the south). There are no other known traffic-related noise receptors within an audible range of the SHINE site.
On an intermittent basis, the loudest noise-generating facility within an audible range of the SHINE site is SWRA. The baseline noise condition at the SHINE site is characterized by additional intermittent noise generated by take-offs and landings of aircraft at the airport. There is one known past noise study, conducted by SWRA that analyzed noise generated within an audible range of the SHINE site. At the SHINE site, take-off and landing activity associated with Runway 4/22 is indicated to have a day night average sound level (Ldn) value of 60 at the northwest edge of the site with attenuation to an Ldn value of 55 near the middle of the site (Southern Wisconsin Regional Airport, 2004).
The Union Pacific Railroad is approximately 1.6 mi. (2.6 km) northeast of the SHINE site. Given the distance from the site, intermittent noise levels generated by trains are expected to attenuate to baseline levels at the site. There are no other industries or businesses within 1 mi. (1.6 km) of the site that are characterized by notable noise emissions.

Chapter 19 - Environmental Review Air Quality and Noise
SHINE Medical Technologies 19.3-31 Rev. 0
Table 19.3.2-1 Selected Characteristics of Wisconsin Physiographic Provinces(a)
a) Characteristics are based on Moran, J.M. and E.J. Hopkins, 2002 and Rand McNally, 2005.
Lake Superior Lowland
Northern Highland Central Plain
Eastern Ridges and Lowlands
Western Uplands
Vegetation Broadleaf deciduous and needleleaf evergreen trees
Agriculture is limited by lakes, swamps, and short growing season.
Marginally suited for agriculture. Irrigation required. Tamarack bogs occur above impervious lake clays.
Broadleaf deciduous and needleleaf evergreen trees
Broadleaf deciduous trees
Topography Gently sloping plains, with steep escarpments at the southern shore of Lake Superior.
The southernmost portion of the Canadian Shield of crystalline bedrock. Weathering and erosion have reduced terrain to nearly a plain. Scattered hills of resistant bedrock remain. Lake and swamp terrain.
Relatively flat or gently rolling topography with occasional sandstone mesas, buttes, pinnacles.
Numerous glacial landforms, lowest elevations of Wisconsin. Lake Winnebago is remnant of a larger glacial lake. Niagara cuesta is a rock ridge in the northeast in Door and Waukesha Counties.
Escaped recent glaciation, allowing streams and rivers to form steep valleys. Portions of the uplands are referred to as the “driftless area” due to the lack of glacial debris, or “drift”
Elevations Several hundred feet above elevation of the Great Lakes
1,400 to 1,650 ft. NAVD 88
750 to 850 ft. NAVD 88
Topographic relief of 100 to 200 feet above the elevation of Lake Michigan (mean lake elevation is approximately 600 ft. NAVD 88).
Approximately 1,000 to 1,200 ft. NAVD 88, including some topographic relief approaching 500 feet. Rock bluffs, mounds (highest approximately 1,716 ft. NAVD 88).

Chapter 19 - Environmental Review Air Quality and Noise
SHINE Medical Technologies 19.3-32 Rev. 0
Table 19.3.2-2 Madison, Wisconsin Climatic Means and Extremes(Sheet 1 of 2)
Table extracted from NCDC, 2011a. "POR" refers to the period of record (years). Refer to that reference for explanatory notes.

Chapter 19 - Environmental Review Air Quality and Noise
SHINE Medical Technologies 19.3-33 Rev. 0
Table 19.3.2-2 Madison, Wisconsin Climatic Means and Extremes(Sheet 2 of 2)
Table extracted from NCDC, 2011a. "POR" refers to the period of record (years). Refer to that reference for explanatory notes.

Chapter 19 - Environmental Review Air Quality and Noise
SHINE Medical Technologies 19.3-34 Rev. 0
Table 19.3.2-3 Rockford, Illinois Climatic Means and Extremes(Sheet 1 of 2)
Table extracted from NCDC, 2011c. "POR" refers to the period of record (years). Refer to that reference for explanatory notes.

Chapter 19 - Environmental Review Air Quality and Noise
SHINE Medical Technologies 19.3-35 Rev. 0
Table 19.3.2-3 Rockford, Illinois Climatic Means and Extremes(Sheet 2 of 2)
Table extracted from NCDC, 2011c. "POR" refers to the period of record (years). Refer to that reference for explanatory notes.

Chapter 19 - Environmental Review Air Quality and Noise
SHINE Medical Technologies 19.3-36 Rev. 0
Table 19.3.2-4 Madison, Wisconsin and Rockford, Illinois Additional Climatic Means and Extremes
(Sheet 1 of 2) (a)
a) Based on NCDC, 1996b. Period of record for Rockford is 1951-1995 and 1948-1995 for Madison.
Parameter PeriodMadison,
WisconsinRockford, Illinois
Mean number of days with rain or drizzle(NCDC, 1996b)
January 5 6February 5 5March 10 11April 15 15May 16 16June 15 14July 15 14August 14 13September 13 13October 13 13November 10 11December 7 8Annual 138 139
Mean number of days with freezing rain or drizzle(NCDC, 1996b)
January 1 1February < 0.5 < 0.5March < 0.5 < 0.5April < 0.5 < 0.5May 0 0June 0 0July 0 0August 0 0September 0 0October < 0.5 0November < 0.5 < 0.5December 1 1Annual 2 2

Chapter 19 - Environmental Review Air Quality and Noise
SHINE Medical Technologies 19.3-37 Rev. 0
Table 19.3.2-4 Madison, Wisconsin and Rockford, Illinois Additional Climatic Means and Extremes
(Sheet 2 of 2)
Parameter PeriodMadison,
WisconsinRockford, Illinois
Mean number of days with snow(NCDC, 1996b)
January 18 17February 14 13March 13 11April 4 3May < 0.5 < 0.5June 0 0July 0 0August 0 0September < 0.5 0October 1 1November 9 8December 16 15Annual 75 68
Mean number of days with hail or sleet(NCDC, 1996b)
January 0 < 0.5February 0 < 0.5March < 0.5 < 0.5April < 0.5 < 0.5May < 0.5 < 0.5June < 0.5 < 0.5July < 0.5 < 0.5August < 0.5 < 0.5September < 0.5 < 0.5October < 0.5 < 0.5November < 0.5 < 0.5December < 0.5 0Annual 2 2

Chapter 19 - Environmental Review Air Quality and Noise
SHINE Medical Technologies 19.3-38 Rev. 0
Table 19.3.2-5 List of NOAA ASOS Stations Located within the Site Climate Region(a,b,c)
a) The site climate region and station locations are defined via the map in Figure 19.3.2-16.b) Extracted from NCDC, 2012b.c) MSL elevations are functionally equivalent to the NAVD 88 elevations in this table.
Name
USAFID
No.
WBANID
No. St. County
NorthLatitude(deg min sec)
WestLongitude(deg min sec)
GroundElev.
(ft. MSL)
ApproximateAvailable DS 3505 Digital Database Period of Record (years)
Baraboo 726503 54833 WI Sauk 43 31 19 89 46 15 978 1997-2011 (15)
Burlington 722059 4866 WI Racine 42 41 23 88 18 14 779 1948-2011 (64)
De Kalb TaylorMunicipalAirport
722075 04871 WI De Kalb 41 55 55 88 42 28 915 1973-2011 (39)
JuneauDodge County
726509 04898 WI Dodge 43 25 33 88 42 10 936 1997-2011 (15)
Du Page County
725305 94892 IL Du Page 41 54 50 88 14 56 758 1973-2011 (39)
Fond du Lac CountyAirport
726506 04840 WI Fond du Lac
43 46 12 88 29 9 807 1997-2011 (14)
Freeport AlbertusAirport
722082 04876 IL Stephen-son
42 14 45 89 34 55 859 2004-2011 (8)
JanesvilleSouthernWisconsinRegional
726415 94854 WI Rock 42 37 1 89 1 58 808 1973-2011 (39)
Madison DaneCounty TruaxField
726410 14837 WI Dane 43 8 27 89 20 41 866 1948-2011 (64)
MiddletonMunicipalMorey Field
720656 n/a WI Dane 43 7 1 89 31 58 928 2009-2011 (3)
MonroeMunicipal
726414 04873 WI Green 42 36 54 89 35 27 1085 2001-2011 (10)
RochelleMunicipal AirportKoritzField
722182 04890 IL Ogle 41 53 34 89 4 40 781 2004-2011 (8)
ChicagoRockfordIntlAirport
725430 94822 IL Winne-bago
42 11 34 89 5 34 743 1973-2011 (39)
WatertownMunicipalAirport
726464 54834 WI Jefferson 43 10 1 88 43 1 833 1995-2011 (17)

Chapter 19 - Environmental Review Air Quality and Noise
SHINE Medical Technologies 19.3-39 Rev. 0
Table 19.3.2-6 List of NOAA COOP Stations in the Site Climate Region
for which Clim-20 Summaries are Available(a,b)
a) The site climate region and station locations are defined via the map in Figure 19.3.2-17.b) MSL elevations are functionally equivalent to the NAVD 88 elevations in this table.
Name St. County
NorthLatitude(deg min)
WestLongitude(deg min)
GroundElev.
(ft. MSL)
Approx.Period of Record(years)(temp precip)
Arboretum Univ of WI
WI Dane 43 2 89 26 865 41 41
Arlington Univ Farm
WI Columbia 43 18 89 20 1080 49 49
Baraboo WI Sauk 43 28 89 44 823 58 73Beaver Dam WI Dodge 43 27 88 51 840 62 74Beloit WI Rock 42 30 89 2 780 121 162Brodhead WI Green 42 37 89 23 790 115 115Charmany Farm
WI Dane 43 4 89 29 910 49 49
Dalton WI Green Lake 43 39 89 12 860 n/aDe Kalb IL De Kalb 41 56 88 47 873 119 130Fond du Lac WI Fond du
Lac43 48 88 27 760 126 126
Ft Atkinson WI Jefferson 42 54 88 52 800 70 70Hartford 2 W WI Washington 43 20 88 25 980 67 73Horicon WI Dodge 43 26 88 38 880 109 109Lake Geneva WI Walworth 42 36 88 26 880 n/aLake Mills WI Jefferson 43 5 88 54 817 119 121Madison Dane Co AP
WI Dane 43 8 89 21 866 79 79
Marengo IL McHenry 42 18 88 39 815 156 156Oconomowoc WI Waukesha 43 6 88 30 856 73 73Portage WI Columbia 43 32 89 26 775 119 123Prairie du Sac WI Sauk 43 19 89 44 780 n/aRockford AP IL Winnebago 42 12 89 6 730 61 61Stoughton WI Dane 42 37 89 45 840 n/aWatertown WI Jefferson 43 10 88 44 825 121 121Wisconsin Dells
WI Columbia 43 37 89 46 835 89 89

Chapter 19 - Environmental Review Air Quality and Noise
SHINE Medical Technologies 19.3-40 Rev. 0
Table 19.3.2-7 Nearest Federal Class I Areas to the SHINE Site(a)
a) Extracted from NPS, 2011.
Class I AreaDistance from
SHINE Site (km)Distance from
SHINE Site (mi.)Direction from
SHINE Site
Rainbow Lake Wilderness Area, WI 455 283 Northwest
Seney Wilderness Area, MI 475 295 North-northeast
Isle Royale National Park , MI 610 379 North
Mammoth Cave National Park, KY 630 391 South-southeast
Boundary Waters Canoe Area, MN 640 398 North-northwest
Mingo Wilderness Area, MO 645 401 South
Voyageurs National Park MN 730 454 North

Chapter 19 - Environmental Review Air Quality and Noise
SHINE Medical Technologies 19.3-41 Rev. 0
Table 19.3.2-8 Regional Tornadoes and Waterspouts(a,b,c)
a) Period of record is May, 1950 through July, 2011.b) Based on NCDC, 2011g.c) Additionally, an F5 tornado occurred on 8 June 1984 in Iowa County, Wisconsin, at
the town of Barneveld, which is located approximately 50 mi. (80 km) west-northwest of the SHINE site.
State County Area (mi.2)Number of Tornadoes
Number ofWaterspout
sIL Boone 282 8 0IL Carroll 466 14 0IL Cook 1635 51 0IL De Kalb 635 11 0IL Du Page 337 24 0IL Kane 524 19 0IL Lake 1368 16 1IL Lee 729 22 0IL McHenry 611 15 0IL Ogle 763 19 0IL Stephenson 565 13 0IL Whiteside 697 19 0WI Adams 689 17 0WI Columbia 796 34 0WI Dane 1238 56 0WI Dodge 907 58 0WI Fond du Lac 766 43 0WI Green 585 18 0WI Green Lake 380 30 0WI Jefferson 583 33 0WI Juneau 804 23 0WI Kenosha 754 9 1WI Marquette 456 7 0WI Racine 792 20 1WI Sauk 848 23 0WI Walworth 577 23 0WI Washington 436 17 0WI Waukesha 580 28 0

Chapter 19 - Environmental Review Air Quality and Noise
SHINE Medical Technologies 19.3-42 Rev. 0
Table 19.3.2-9 Details of Strongest Tornadoes in Rock County, Wisconsin(a,b,c)
a) The SHINE site is located in Rock County, Wisconsin.b) Period of record is May, 1950 through July, 2011.c) Based on NCDC, 1960; NCDC, 1961; NCDC, 1970; NCDC, 1971; NCDC, 1988; NCDC, 1991;
NCDC, 1998, and NCDC, 2011g.
Tornado Intensity Date
Path Length (mi.)
Path Width (yd.)
Property Damage
($) Additional Description
F2 15 Nov 1960 3.00 67 2,500 Occurred 1.5 mi. (2.4 km) south of Union, Wisconsin. Damage occurred to farm buildings, an abandoned restaurant, and a school roof.
F2 22 Sep 1961 3.60 220 25,000 Occurred 1 mi. (1.6 km) south of Whitewater, Wisconsin. Damage occurred to at least 15 farms. There was 1 injury.
F2 9 Oct 1970 11.10 50 250,000 The tornado moved NNW from the banks of the Rock River just north of Riverside Park (NW of Janesville) and 5 mi. (8.0 km) west of Edgerton toward Stoughton. An outbuilding was damaged. There was 1 injury.
F2 1 Nov 1971 3.00 100 250,000 A small tornado moved northeast in a mostly residential area along a line from 1.5 mi. (2.4 km) NNW to about 4 mi NNE of downtown Beloit. Several homes and garages were severely damaged. There was 1 injury.
F2 8 May 1988 27.00 173 250,000 Tornado affected Rock, Dane, and Jefferson counties. Many farm buildings and two homes were damaged.
F2 27 Mar 1991 7.00 440 2.5 million Tornado affected Green, Rock, Dane, and Jefferson counties. There were 5 injuries and 1 fatality.
F2 25 Jun 1998 2.50 100 845,000 Tornado moved from 2.3 mi. (3.7 km) WNW of Leyden to 1 mi. (1.6 km) NNE of Leyden.

Chapter 19 - Environmental Review Air Quality and Noise
SHINE Medical Technologies 19.3-43 Rev. 0
Table 19.3.2-10 Details of Strongest Tornadoes in Surrounding CountiesAdjacent to Rock County, Wisconsin
(Sheet 1 of 2)(a,b,c,d,e,f)
Tornado Intensity Date County
Path Length
(mi.)
Path Width (yd.)
Property Damage
($) Additional Description
F4 21 Apr 1967 Boone 11.50 1200 250,000 Tornado moved near 50 mph (22.4 m/s) towards ENE to E, from 2 mi. (3.2 km) SE of Cherry Valley to two mi. north of Woodstock. Numerous reports of multiple funnel sightings were substantiated by damage. Almost complete destruction directly in path with major wind damage on either side. Many farm homes completely destroyed. Woods were stripped with large trees uprooted or snapped off. About 5 percent of the path was through an urban area, which was the SE corner of Belvidere, where a high school was hit. There were 450 injuries and 24 fatalities.
F3 7 Jan 2008 Boone 7.00 100 2.0 million Tornado traveled from about 1.2 mi. (1.9 km) N of Poplar Grove in Boone County, to about 3.2 mi (5.1 km) NE of Harvard in McHenry County. A large barn and farmhouse were destroyed, and other buildings severely damaged. Damage also occurred to power lines. Large trees were snapped, uprooted, and stripped of branches. There were 4 injuries.
F3 2 Aug 1967 Dane n/a n/a 25,000 Tornado moved SE on the N shore of Lake Mendota in the town of Westport, about 100 yards (0.1 km) inland. Three cottages were destroyed and several homes slightly damaged. There were 5 injuries and 2 fatalities.

Chapter 19 - Environmental Review Air Quality and Noise
SHINE Medical Technologies 19.3-44 Rev. 0
Table 19.3.2-10 Details of Strongest Tornadoes in Surrounding CountiesAdjacent to Rock County, Wisconsin
(Sheet 2 of 2)
a) The SHINE site is located in Rock County, WI.b) Counties adjacent to Rock County include: Green (WI), Dane (WI), Jefferson (WI), Walworth (WI),
Boone (IL), Winnebago (IL), and Stephenson (IL).c) Period of record is May, 1950 through July, 2011.d) “n/a” means information not available.e) Based on data in references NCDC, 1967a; NCDC, 1967b; NCDC, 1975; NCDC, 1980; NCDC,
1992; NCDC, 2005b; NCDC, 2008; and NCDC, 2011g.f) Additionally, an F5 tornado occurred on 8 June 1984 in Iowa County, Wisconsin, at the town of
Barneveld, which is located approximately 50 mi. (80 km) west-northwest of the SHINE site.
Tornado Intensity Date County
Path Length
(mi.)
Path Width (yd.)
Property Damage
($) Additional Description
F3 4 Jun 1975 Dane 2.30 33 25,000 Tornado touched down three miles north of Sun Prairie and moved towards the east. Two farms had extensive damage and one home was destroyed.
F3 17 Jun 1992
Dane 16.00 400 25.0 million
Tornado occurred 2 mi. (3.2 km) north of Belleville. There were 30 injuries.
F3 18 Aug 2005
Dane 17.00 600 34.3 million
Strong and destructive tornado started about 2.8 mi. (4.5 km) SE of Fitchburg and moved slowly ESE to the southern edge of Lake Kegonsa through residential neighborhoods including Dunn, Pleasant Springs, and Stoughton. There was extensive damage to homes, businesses, farm buildings, vehicles, power lines, and trees. There were 23 injuries and 1 fatality.
F3 5 Jun 1980 Jefferson 4.00 n/a 25,000 Tornado formed near Rock River at 0.25 mi. (0.4 km) E of Watertown, lifted and moved SE where it touched down a second time 1 mi. (1.6 km) SE of Pipersville.

Chapter 19 - Environmental Review Air Quality and Noise
SHINE Medical Technologies 19.3-45 Rev. 0
Table 19.3.2-11 Precipitation Extremes at Local and Regional NOAA COOP Meteorological Monitoring Stations
within the Site Climate Region(a,b,c)
a) The site climate region and station locations are defined in Figure 19.3.2-17.b) Based on 1971-2000 data in NCDC, 2001a-x.c) Madison and Rockford statistics were updated through the year 2010 from NCDC, 2011a
and NCDC, 2011c.
StationName State County
MaximumRecorded24-HourRainfall
(in.)
MaximumRecordedMonthlyRainfall
(in.)
MaximumRecorded24-HourSnowfall
(in.)
MaximumRecorded MonthlySnowfall
(in.)Arboretum Univ of WI
WI Dane 6.00 12.07 12.0 25.5
Arlington Univ Farm WI Columbia 5.10 12.92 14.0 28.0Baraboo WI Sauk 7.78 14.79 12.0 35.2Beaver Dam WI Dodge 4.41 15.05 13.0 30.0Beloit WI Rock 5.77 14.39 11.0 22.0Brodhead WI Green 6.62 13.11 10.0 31.1Charmany Farm WI Dane 5.85 11.47 13.0 20.5Dalton WI Green Lake 4.69 13.77 21.0 25.5DeKalb IL De Kalb 8.09 14.23 15.6 34.5Fond du Lac WI Fond du Lac 6.83 12.70 14.0 25.1Ft Atkinson WI Jefferson 4.47 9.05 14.0 39.0Hartford 2 W WI Washington 5.20 11.23 12.0 33.0Horicon WI Dodge 5.94 14.72 16.0 40.0Lake Geneva WI Walworth 3.88 11.30 13.2 38.5Lake Mills WI Jefferson 4.93 11.31 11.0 31.0Madison Dane Co AP
WI Dane 5.28 15.18 17.3 40.4
Marengo IL McHenry 5.15 11.70 12.0 21.0Oconomowoc WI Waukesha 5.38 11.39 11.5 28.7Portage WI Columbia 6.29 16.09 12.5 34.0Prairie du Sac WI Sauk 5.73 11.41 11.6 23.5Rockford AP IL Winnebago 6.42 13.98 11.4 30.2Stoughton WI Dane 5.05 8.86 12.0 35.5Watertown WI Jefferson 6.65 10.47 13.0 50.4Wisconsin Dells WI Columbia 7.67 14.13 14.0 28.4
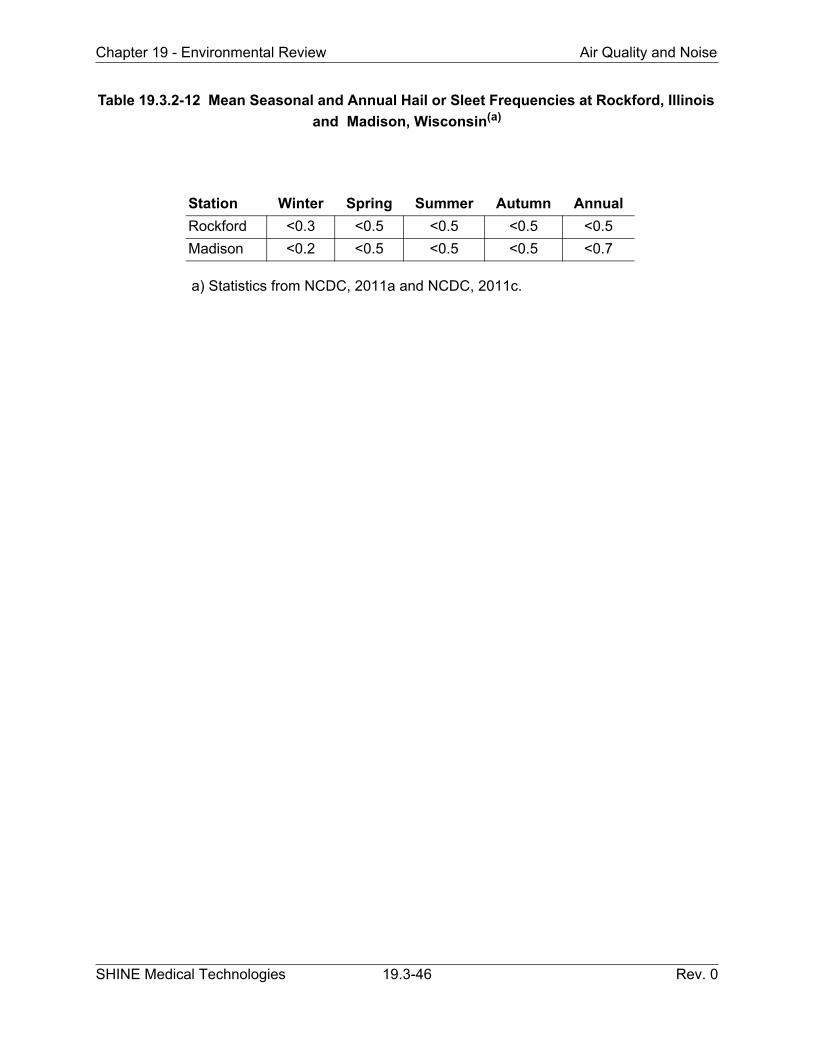
Chapter 19 - Environmental Review Air Quality and Noise
SHINE Medical Technologies 19.3-46 Rev. 0
Table 19.3.2-12 Mean Seasonal and Annual Hail or Sleet Frequencies at Rockford, Illinois
and Madison, Wisconsin(a)
a) Statistics from NCDC, 2011a and NCDC, 2011c.
Station Winter Spring Summer Autumn Annual
Rockford <0.3 <0.5 <0.5 <0.5 <0.5
Madison <0.2 <0.5 <0.5 <0.5 <0.7

Chapter 19 - Environmental Review Air Quality and Noise
SHINE Medical Technologies 19.3-47 Rev. 0
Table 19.3.2-13 Ice Storms that have Affected Rock County, Wisconsin(a)
a) Based on 1995 – 2011 data in NCDC, 2011g.
Date of Storm Description of Ice Storm
26 Feb 1995 Freezing rain and freezing drizzle. Coating of ice up to one-quarter inch.
26 Nov 1995 Two to six hour period of sleet and/or freezing rain glazed road surfaces.
13 Dec 1995 Ice accumulations of one-quarter to one-half inch on top of one to five inches of snow. A glazing of less than one-quarter inch of freezing rain or freezing drizzle.
4 Feb 1997 Several hours of freezing rain, accumulated to one quarter inch. Sheets of ice on roads and sidewalks, especially rural.
3 Feb 2003 Periodic light freezing drizzle of light freezing rain glazed roads and sidewalks.
7 Apr 2003 Freezing drizzle left crusty layers.
16 Jan 2004 Freezing rain caused road surfaces to become very slippery due to initial ice glazing of 1/16 to 1/8 inch.
7 Mar 2004 Freezing drizzle/rain generated a thin layer of ice on road surfaces.
18 Dec 2004 Light freezing drizzle coated roads and bridges during morning hours.
1 Jan 2005 Pockets of freezing rain or drizzle resulted in a light glaze of ice on many road surfaces and sidewalks.
17 Feb 2008 Ice storm affected a 25 to 30 mile wide area stretching from Janesville to Ft. Atkinson to Delafield to Wes Bend to Port Washington, with about 11 hours of freezing rain. Ice accumulations ranged from one quarter to one half inch. Roads were icy.
8 Dec 2008 Freezing rain produced ice accumulations of 1/10 to 2/10 inch near the Illinois border.
28 Mar 2009 Mixture of sleet, rain, freezing rain and snow caused very hazardous driving conditions. Ice accumulations were 0.10 inch.
23 Dec 2009 Freezing rain during afternoon hours resulted in a low-end ice storm with ice accumulations of one quarter to one half inch. Trees and power lines were coated, causing them to break.

Chapter 19 - Environmental Review Air Quality and Noise
SHINE Medical Technologies 19.3-48 Rev. 0
Table 19.3.2-14 Mean Seasonal Thunderstorm Frequencies at Rockford, Illinois and
Madison, Wisconsin(a)
a) Statistics from NCDC, 2011a and NCDC, 2011c.
StationWinter(days)
Spring(days)
Summer(days)
Autumn(days)
Rockford 0.3 4.0 7.4 2.7
Madison 0.2 3.6 7.1 2.3

Chapter 19 - Environmental Review Air Quality and Noise
SHINE Medical Technologies 19.3-49 Rev. 0
Table 19.3.2-15 Design Wet and Dry Bulb Temperatures(a)
a) 0.4%, 1% and 2% temperatures from ASHRAE, 2009. 5% temperatures from NCDC, 1996b
Statistic Bounding Value (°F)
Maximum DBT with annual exceedance probability of 0.4 percent 91.5 (Rockford)
Mean coincident WBT (MCWB) at the 0.4 percent DBT 75.0 (Rockford)
Maximum DBT with annual exceedance probability of 2.0 percent 85.8 (Rockford)
Mean coincident WBT (MCWB) at the 2.0 percent DBT 72.0 (Rockford)
Minimum DBT with annual exceedance probability of 0.4 percent -9.1 (Madison)
Minimum DBT with annual exceedance probability of 1.0 percent -2.9 (Madison)
Maximum WBT with annual exceedance probability of 0.4 percent 78.3 (Du Page County Airport)
Maximum DBT with annual exceedance probability of 5 percent 81 (Rockford)
Minimum DBT with annual exceedance probability of 5 percent 9 (Madison)

Chapter 19 - Environmental Review Air Quality and Noise
SHINE Medical Technologies 19.3-50 Rev. 0
Table 19.3.2-16 Estimated 100-Year Return Maximum and Minimum DBT, MCWB coincident with the 100-Year Return Maximum DBT, Historic Maximum WBT and
Estimated 100-Year Annual Maximum Return WBT
Station
Estimated 100-yr
maximum DBT (°F)
MCWB coincident with 100-yr maximum DBT (°F)
HistoricmaximumWBT (°F)
Estimated 100-yr
maximumWBT (°F)
Estimated 100-yr
minimumDBT (°F)
Rockford 104.8 80 83.6 85.9 -35.1
Madison 104.3 75 85.0 86.0 -33.4
Bounding value 104.8 80 85.0 86.0 -35.1

Chapter 19 - Environmental Review Air Quality and Noise
SHINE Medical Technologies 19.3-51 Rev. 0
Table 19.3.2-17 Dry Bulb Temperature Extremes at Local and Regional NOAA COOP Meteorological Monitoring Stations
within the Site Climate Region(a,b,c,d)
a) The site climate region and station locations are defined in Figure 19.3.2-17.b) Based on 1971-2000 data in NCDC, 2001a-x.c) Rockford and Madison statistics were updated through the year 2010 from NCDC. 2011a
and NCDC, 2011c.d) The highest and lowest dry bulb temperatures in the region are in bold font.
StationName State County
MaximumRecordedDry Bulb
Temperature(°F)
MinimumRecordedDry Bulb
Temperature(°F)
Arboretum Univ. of WI
WI Dane 108 -38
Arlington Univ. Farm WI Columbia 102 -36Baraboo WI Sauk 102 -45Beaver Dam WI Dodge 100 -36Beloit WI Rock 102 -26Brodhead WI Green 102 -36Charmany Farm WI Dane 102 -34Dalton WI Green Lake 103 -39De Kalb IL De Kalb 103 -27Fond du Lac WI Fond du Lac 103 -41Ft Atkinson WI Jefferson 102 -39Hartford 2 W WI Washington 105 -35Horicon WI Dodge 101 -36Lake Geneva WI Walworth 106 -27Lake Mills WI Jefferson 104 -33Madison Dane Co AP WI Dane 104 -37Marengo IL McHenry 109 -29Oconomowoc WI Waukesha 101 -33Portage WI Columbia 103 -35Prairie du Sac WI Sauk 103 -42Rockford AP IL Winnebago 104 -27Stoughton WI Dane 103 -35Watertown WI Jefferson 103 -33Wisconsin Dells WI Columbia 102 -43

Chapter 19 - Environmental Review Air Quality and Noise
SHINE Medical Technologies 19.3-52 Rev. 0
Table 19.3.2-18 FAA Specifications for Automated Weather Observing Stations(a)
a) From FAA, 2011
Parameter Range Accuracy Resolution Other
Dry bulb temperature
-30° – +130°F(-35° – +55°C)
1°F RMSE over entire range with maximum error of 2°F
≤ 1° F time constant ≤ 2 min
Relative humidity
5 – 100 percent ≤ 5 percent ≤ 1 percent time constant < 2 min
Wind speed 2 – 85 knots a) ± 2 knots up to 40 knotsb) RMSE ± 5 percent above 40 knots
1 knot a) distance constant < 10 mb) 2 knot threshold
Wind direction
1°– 360° azimuth ± 5 percent RMSE 1° a) time constant < 2 secondsb) 2 knot threshold
Pressure 17.58 – 31.53 in. Hg a) ± 0.02 in. Hg RMSE; b) maximum error 0.02 in. Hg
0.001 in. Hg drift ≤ 0.02 in. Hg for period not less than 6 months
Visibility < 1/4 – 10 mi. a) 1/4 – 1-1/4 mi.: ± 1/4 mi. b) 1-1/2 – 1-3/4 mi.: + 1/4 , -1/2 mi.c) 2 – 2-1/2 mi.: ± 1/2 mi. d) 3 – 3-1/2 mi.: +1/2, -1 mi. e) ≥ 4 mi.: ± 1 mi.
< 1/4, 1/4, 1/2, 3/4,1, 1-1/4, 1-1/2, 2, 2-1/2, 3, 4, 5, 7, 10 and > 10 mi.
time constant ≤ 3 min
Precipitation 0.01 – 5 in/hr 0.002 in/hr RMSE or 4 percent, which ever is greater
0.01 in.
Cloud height
0 to ≥ 12,500 ft 100 ft. or 5 percent, which ever is greater
a) 0 – 5,500 ft.: 50 ft.b) 5,501 –10,000 ft.: 250 ft. c) > 10,000 ft.: 500 ft.
a) sampling rate at least once every 30 secondsb) at least three cloud layers when visibility ≥ 1/4 mi.
Time 0000 – 2359 UTC within 15 seconds each month 1 second

Chapter 19 - Environmental Review Air Quality and Noise
SHINE Medical Technologies 19.3-53 Rev. 0
Table 19.3.2-19 Annual Data Recovery Rates (in Percent) of Dry Bulb Temperatures, Relative Humidity, Wind Speed, and Wind Direction from the Southern Wisconsin
Regional Airport for 2005-2010(a)
a) From NCDC, 2011l
YearDry Bulb
TemperatureRelative Humidity
Wind Speed
Wind Direction
2005 95.9 95.8 94.0 94.0
2006 93.0 92.9 91.1 91.1
2007 87.7 87.6 87.3 87.3
2008 92.6 92.6 91.2 91.2
2009 93.9 93.6 92.7 92.6
2010 93.8 93.7 92.4 92.4

Chapter 19 - Environmental Review Air Quality and Noise
SHINE Medical Technologies 19.3-54 Rev. 0
Table 19.3.2-20 Historical Dry Bulb Temperatures, Relative Humidity, and Wind Speed
from the Southern Wisconsin Regional Airport for 2005-2010(a)
a) From NCDC, 2011l
Dry Bulb Temperature (°F)
Relative Humidity(percent) Wind Speed (mph)
Month Maximum Minimum Average Average Maximum Average
January 61 -20 22.6 79.2 35 9.2
February 59 -17 24.2 76.0 49 8.7
March 77 7 36.8 72.7 33 8.9
April 84 19 49.7 63.2 40 10.4
May 93 30 59.2 65.5 31 8.8
June 93 43 69.0 71.3 48 7.0
July 97 46 71.9 74.7 31 6.1
August 93 45 71.9 73.3 38 5.8
September 95 34 64.0 72.8 30 6.5
October 90 23 51.5 72.4 38 8.0
November 77 12 40.1 73.1 33 9.2
December 55 -8 24.0 82.4 44 8.6
Average 81 18 48.7 73.1 38 8.1

Chapter 19 - Environmental Review Air Quality and Noise
SHINE Medical Technologies 19.3-55 Rev. 0
Table 19.3.2-21 Annual Joint Data Recovery Rates of Wind Speed, Wind Direction, and
Computed Pasquill Stability Class from the Southern Wisconsin Regional Airport(a)
a) From NCDC, 2011l
Year
Joint Data Recovery(percent)
2005 93.6
2006 90.5
2007 86.0
2008 90.6
2009 91.7
2010 91.7

Chapter 19 - Environmental Review Air Quality and Noise
SHINE Medical Technologies 19.3-56 Rev. 0
Table 19.3.2-22 Pasquill Stability Class Frequency Distributions from the Southern
Wisconsin Regional Airport (Percent) 2005-2010(a)
a) From NCDC, 2011l
Frequency of Occurrence (Percent)
Pasquill Class 2005 2006 2007 2008 2009 2010 2005-2010
A 0.78 0.67 0.86 0.68 1.18 1.16 0.89
B 5.00 3.43 3.61 3.64 5.24 5.39 4.40
C 11.88 11.31 10.15 11.18 10.67 11.98 11.21
D 52.90 56.45 56.67 55.44 54.00 50.19 54.24
E 8.83 8.24 8.15 7.41 7.31 7.08 7.83
F 10.10 10.28 10.35 9.69 9.59 10.48 10.08
G 10.51 9.62 10.21 11.96 12.01 13.72 11.35
Total 100.00 100.00 100.00 100.00 100.00 100.00 100.00

Chapter 19 - Environmental Review Air Quality and Noise
SHINE Medical Technologies 19.3-57 Rev. 0
Table 19.3.2-23 Joint Frequency Distribution of Wind Speed and Wind Direction from the Southern Wisconsin
Regional Airport 2005-2010 (Pasquill Stability Class A)(a)
a) From NCDC, 2011l
Speed (m/s) N NNE NE ENE E ESE SE SSE S SSW SW WSW W WNW NW NNW Total
Calm 323
0.00 < WS < 1.00 0 0 0 0 0 0 1 0 0 0 0 0 0 0 0 0 1
1.00 < WS < 2.00 0 0 1 1 2 1 0 2 0 0 0 0 2 0 0 0 9
2.00 < WS < 3.00 6 2 3 9 5 7 9 6 9 5 5 3 9 5 5 4 92
3.00 < WS < 4.00 0 0 0 0 0 0 0 0 0 0 0 0 0 0 0 0 0
4.00 < WS < 5.00 0 0 0 0 0 0 0 0 0 0 0 0 0 0 0 0 0
5.00 < WS < 6.00 0 0 0 0 0 0 0 0 0 0 0 0 0 0 0 0 0
6.00 < WS < 8.00 0 0 0 0 0 0 0 0 0 0 0 0 0 0 0 0 0
8.00 < WS < 10.00
0 0 0 0 0 0 0 0 0 0 0 0 0 0 0 0 0
> 10.00 0 0 0 0 0 0 0 0 0 0 0 0 0 0 0 0 0
Totals 6 2 4 10 7 8 10 8 9 5 5 3 11 5 5 4 425
Speed (m/s)
Calm 0.68
0.00 < WS < 1.00 0.00 0.00 0.00 0.00 0.00 0.00 0.00 0.00 0.00 0.00 0.00 0.00 0.00 0.00 0.00 0.00 0.00
1.00 < WS < 2.00 0.00 0.00 0.00 0.00 0.00 0.00 0.00 0.00 0.00 0.00 0.00 0.00 0.00 0.00 0.00 0.00 0.02
2.00 < WS < 3.00 0.01 0.00 0.01 0.02 0.01 0.01 0.02 0.01 0.02 0.01 0.01 0.01 0.02 0.01 0.01 0.01 0.19
3.00 < WS < 4.00 0.00 0.00 0.00 0.00 0.00 0.00 0.00 0.00 0.00 0.00 0.00 0.00 0.00 0.00 0.00 0.00 0.00
4.00 < WS < 5.00 0.00 0.00 0.00 0.00 0.00 0.00 0.00 0.00 0.00 0.00 0.00 0.00 0.00 0.00 0.00 0.00 0.00
5.00 < WS < 6.00 0.00 0.00 0.00 0.00 0.00 0.00 0.00 0.00 0.00 0.00 0.00 0.00 0.00 0.00 0.00 0.00 0.00
6.00 < WS < 8.00 0.00 0.00 0.00 0.00 0.00 0.00 0.00 0.00 0.00 0.00 0.00 0.00 0.00 0.00 0.00 0.00 0.00
8.00 < WS < 10.00
0.00 0.00 0.00 0.00 0.00 0.00 0.00 0.00 0.00 0.00 0.00 0.00 0.00 0.00 0.00 0.00 0.00
> 10.00 0.00 0.00 0.00 0.00 0.00 0.00 0.00 0.00 0.00 0.00 0.00 0.00 0.00 0.00 0.00 0.00 0.00
Totals 0.01 0.00 0.01 0.02 0.01 0.02 0.02 0.02 0.02 0.01 0.01 0.01 0.02 0.01 0.01 0.01 0.89
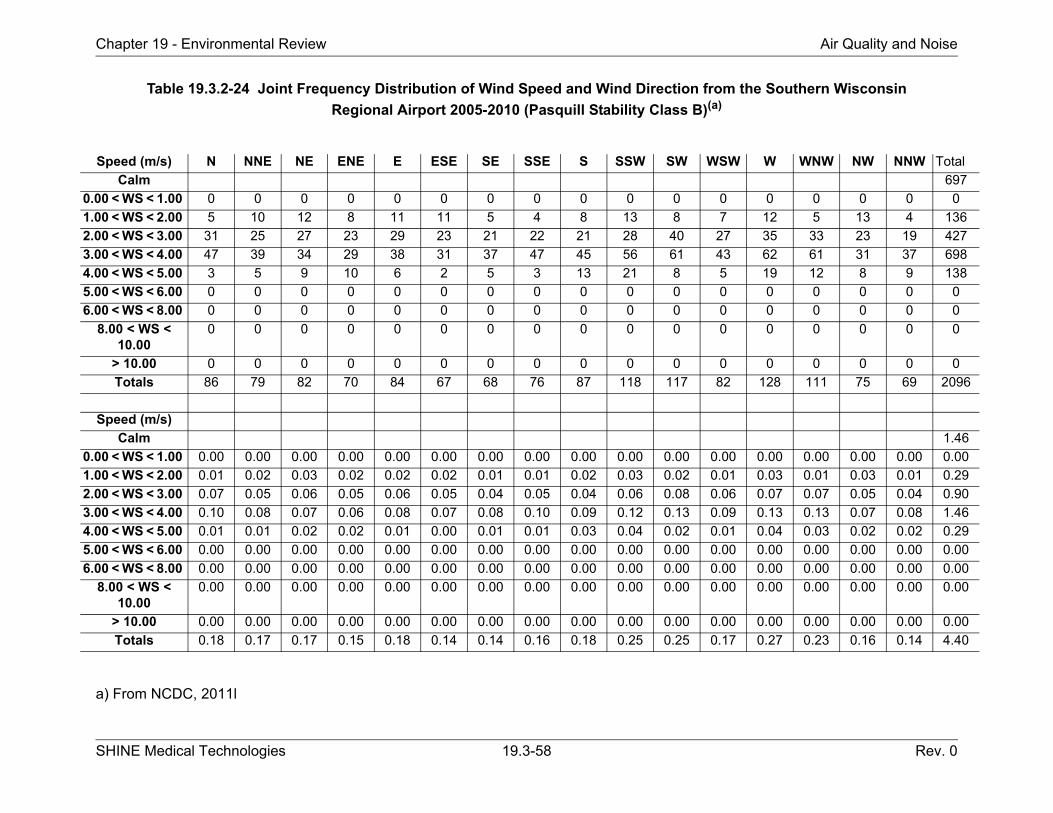
Chapter 19 - Environmental Review Air Quality and Noise
SHINE Medical Technologies 19.3-58 Rev. 0
Table 19.3.2-24 Joint Frequency Distribution of Wind Speed and Wind Direction from the Southern Wisconsin
Regional Airport 2005-2010 (Pasquill Stability Class B)(a)
a) From NCDC, 2011l
Speed (m/s) N NNE NE ENE E ESE SE SSE S SSW SW WSW W WNW NW NNW Total
Calm 697
0.00 < WS < 1.00 0 0 0 0 0 0 0 0 0 0 0 0 0 0 0 0 0
1.00 < WS < 2.00 5 10 12 8 11 11 5 4 8 13 8 7 12 5 13 4 136
2.00 < WS < 3.00 31 25 27 23 29 23 21 22 21 28 40 27 35 33 23 19 427
3.00 < WS < 4.00 47 39 34 29 38 31 37 47 45 56 61 43 62 61 31 37 698
4.00 < WS < 5.00 3 5 9 10 6 2 5 3 13 21 8 5 19 12 8 9 138
5.00 < WS < 6.00 0 0 0 0 0 0 0 0 0 0 0 0 0 0 0 0 0
6.00 < WS < 8.00 0 0 0 0 0 0 0 0 0 0 0 0 0 0 0 0 0
8.00 < WS < 10.00
0 0 0 0 0 0 0 0 0 0 0 0 0 0 0 0 0
> 10.00 0 0 0 0 0 0 0 0 0 0 0 0 0 0 0 0 0
Totals 86 79 82 70 84 67 68 76 87 118 117 82 128 111 75 69 2096
Speed (m/s)
Calm 1.46
0.00 < WS < 1.00 0.00 0.00 0.00 0.00 0.00 0.00 0.00 0.00 0.00 0.00 0.00 0.00 0.00 0.00 0.00 0.00 0.00
1.00 < WS < 2.00 0.01 0.02 0.03 0.02 0.02 0.02 0.01 0.01 0.02 0.03 0.02 0.01 0.03 0.01 0.03 0.01 0.29
2.00 < WS < 3.00 0.07 0.05 0.06 0.05 0.06 0.05 0.04 0.05 0.04 0.06 0.08 0.06 0.07 0.07 0.05 0.04 0.90
3.00 < WS < 4.00 0.10 0.08 0.07 0.06 0.08 0.07 0.08 0.10 0.09 0.12 0.13 0.09 0.13 0.13 0.07 0.08 1.46
4.00 < WS < 5.00 0.01 0.01 0.02 0.02 0.01 0.00 0.01 0.01 0.03 0.04 0.02 0.01 0.04 0.03 0.02 0.02 0.29
5.00 < WS < 6.00 0.00 0.00 0.00 0.00 0.00 0.00 0.00 0.00 0.00 0.00 0.00 0.00 0.00 0.00 0.00 0.00 0.00
6.00 < WS < 8.00 0.00 0.00 0.00 0.00 0.00 0.00 0.00 0.00 0.00 0.00 0.00 0.00 0.00 0.00 0.00 0.00 0.00
8.00 < WS < 10.00
0.00 0.00 0.00 0.00 0.00 0.00 0.00 0.00 0.00 0.00 0.00 0.00 0.00 0.00 0.00 0.00 0.00
> 10.00 0.00 0.00 0.00 0.00 0.00 0.00 0.00 0.00 0.00 0.00 0.00 0.00 0.00 0.00 0.00 0.00 0.00
Totals 0.18 0.17 0.17 0.15 0.18 0.14 0.14 0.16 0.18 0.25 0.25 0.17 0.27 0.23 0.16 0.14 4.40

Chapter 19 - Environmental Review Air Quality and Noise
SHINE Medical Technologies 19.3-59 Rev. 0
Table 19.3.2-25 Joint Frequency Distribution of Wind Speed and Wind Direction from the Southern Wisconsin
Regional Airport 2005-2010 (Pasquill Stability Class C)(a)
a) From NCDC, 2011l
Speed (m/s) N NNE NE ENE E ESE SE SSE S SSW SW WSW W WNW NW NNW Total
Calm 1118
0.00 < WS < 1.00 0 0 0 0 0 0 0 0 0 0 0 0 0 0 0 0 0
1.00 < WS < 2.00 15 2 5 7 15 6 7 3 15 15 16 6 18 14 14 9 167
2.00 < WS < 3.00 34 24 27 34 25 19 25 28 37 38 57 35 59 53 58 30 583
3.00 < WS < 4.00 52 39 39 39 24 39 24 56 65 83 72 72 105 94 60 59 922
4.00 < WS < 5.00 71 72 49 57 54 45 45 81 111 136 148 114 159 150 120 101 1513
5.00 < WS < 6.00 42 29 31 27 36 26 17 45 81 105 87 65 61 91 53 56 852
6.00 < WS < 8.00 0 5 5 6 4 5 6 5 12 12 21 18 23 8 10 2 142
8.00 < WS < 10.00
0 0 0 1 3 0 0 0 4 3 6 3 11 1 0 0 32
> 10.00 0 0 0 0 1 1 0 2 2 0 3 0 5 0 1 0 15
Totals 214 171 156 171 162 141 124 220 327 392 410 313 441 411 316 257 5344
Speed (m/s)
Calm 2.35
0.00 < WS < 1.00 0.00 0.00 0.00 0.00 0.00 0.00 0.00 0.00 0.00 0.00 0.00 0.00 0.00 0.00 0.00 0.00 0.00
1.00 < WS < 2.00 0.03 0.00 0.01 0.01 0.03 0.01 0.01 0.01 0.03 0.03 0.03 0.01 0.04 0.03 0.03 0.02 0.35
2.00 < WS < 3.00 0.07 0.05 0.06 0.07 0.05 0.04 0.05 0.06 0.08 0.08 0.12 0.07 0.12 0.11 0.12 0.06 1.22
3.00 < WS < 4.00 0.11 0.08 0.08 0.08 0.05 0.08 0.05 0.12 0.14 0.17 0.15 0.15 0.22 0.20 0.13 0.12 1.93
4.00 < WS < 5.00 0.15 0.15 0.10 0.12 0.11 0.09 0.09 0.17 0.23 0.29 0.31 0.24 0.33 0.31 0.25 0.21 3.17
5.00 < WS < 6.00 0.09 0.06 0.07 0.06 0.08 0.05 0.04 0.09 0.17 0.22 0.18 0.14 0.13 0.19 0.11 0.12 1.79
6.00 < WS < 8.00 0.00 0.01 0.01 0.01 0.01 0.01 0.01 0.01 0.03 0.03 0.04 0.04 0.05 0.02 0.02 0.00 0.30
8.00 < WS < 10.00
0.00 0.00 0.00 0.00 0.01 0.00 0.00 0.00 0.01 0.01 0.01 0.01 0.02 0.00 0.00 0.00 0.07
> 10.00 0.00 0.00 0.00 0.00 0.00 0.00 0.00 0.00 0.00 0.00 0.01 0.00 0.01 0.00 0.00 0.00 0.03
Totals 0.45 0.36 0.33 0.36 0.34 0.30 0.26 0.46 0.69 0.82 0.86 0.66 0.93 0.86 0.66 0.54 11.21

Chapter 19 - Environmental Review Air Quality and Noise
SHINE Medical Technologies 19.3-60 Rev. 0
Table 19.3.2-26 Joint Frequency Distribution of Wind Speed and Wind Direction from the Southern Wisconsin
Regional Airport 2005-2010 (Pasquill Stability Class D)(a)
a) From NCDC, 2011l
Speed (m/s) N NNE NE ENE E ESE SE SSE S SSW SW WSW W WNW NW NNW Total
Calm 1353
0.00 < WS < 1.00 0 0 0 0 0 0 0 0 0 0 0 0 0 0 0 0 0
1.00 < WS < 2.00 39 31 40 36 45 32 25 18 31 27 24 30 47 35 28 40 528
2.00 < WS < 3.00 241 168 165 158 204 164 154 137 183 185 180 140 254 201 212 150 2896
3.00 < WS < 4.00 323 205 205 224 271 220 203 213 342 282 237 240 331 239 260 236 4031
4.00 < WS < 5.00 326 189 186 200 274 190 161 202 382 250 182 203 319 235 267 241 3807
5.00 < WS < 6.00 374 229 248 263 297 205 194 256 468 476 321 253 486 344 381 326 5121
6.00 < WS < 8.00 259 151 201 291 346 218 174 227 617 488 381 334 605 448 471 379 5590
8.00 < WS < 10.00
63 28 61 90 148 59 31 53 139 170 112 112 239 144 166 115 1730
> 10.00 27 6 8 27 68 25 14 21 72 67 81 96 120 74 55 39 800
Totals 1652 1007 1114 1289 1653 1113 956 1127 2234 1945 1518 1408 2401 1720 1840 1526 25856
Speed (m/s)
Calm 2.84
0.00 < WS < 1.00 0.00 0.00 0.00 0.00 0.00 0.00 0.00 0.00 0.00 0.00 0.00 0.00 0.00 0.00 0.00 0.00 0.00
1.00 < WS < 2.00 0.08 0.07 0.08 0.08 0.09 0.07 0.05 0.04 0.07 0.06 0.05 0.06 0.10 0.07 0.06 0.08 1.11
2.00 < WS < 3.00 0.51 0.35 0.35 0.33 0.43 0.34 0.32 0.29 0.38 0.39 0.38 0.29 0.53 0.42 0.44 0.31 6.07
3.00 < WS < 4.00 0.68 0.43 0.43 0.47 0.57 0.46 0.43 0.45 0.72 0.59 0.50 0.50 0.69 0.50 0.55 0.50 8.46
4.00 < WS < 5.00 0.68 0.40 0.39 0.42 0.57 0.40 0.34 0.42 0.80 0.52 0.38 0.43 0.67 0.49 0.56 0.51 7.99
5.00 < WS < 6.00 0.78 0.48 0.52 0.55 0.62 0.43 0.41 0.54 0.98 1.00 0.67 0.53 1.02 0.72 0.80 0.68 10.74
6.00 < WS < 8.00 0.54 0.32 0.42 0.61 0.73 0.46 0.37 0.48 1.29 1.02 0.80 0.70 1.27 0.94 0.99 0.80 11.73
8.00 < WS < 10.00
0.13 0.06 0.13 0.19 0.31 0.12 0.07 0.11 0.29 0.36 0.23 0.23 0.50 0.30 0.35 0.24 3.63
> 10.00 0.06 0.01 0.02 0.06 0.14 0.05 0.03 0.04 0.15 0.14 0.17 0.20 0.25 0.16 0.12 0.08 1.68
Totals 3.47 2.11 2.34 2.70 3.47 2.33 2.01 2.36 4.69 4.08 3.18 2.95 5.04 3.61 3.86 3.20 54.24

Chapter 19 - Environmental Review Air Quality and Noise
SHINE Medical Technologies 19.3-61 Rev. 0
Table 19.3.2-27 Joint Frequency Distribution of Wind Speed and Wind Direction from the Southern Wisconsin Regional
Airport 2005-2010 (Pasquill Stability Class E)(a)
From NCDC, 2011l
Speed (m/s) N NNE NE ENE E ESE SE SSE S SSW SW WSW W WNW NW NNW Total
Calm 0
0.00 < WS < 1.00 0 0 0 0 0 0 0 0 0 0 0 0 0 0 0 0 0
1.00 < WS < 2.00 0 0 0 0 0 0 0 0 0 0 0 0 0 0 0 0 0
2.00 < WS < 3.00 59 35 48 49 77 82 76 70 91 85 75 44 75 50 53 38 1007
3.00 < WS < 4.00 51 35 54 52 90 84 82 94 167 115 68 61 136 81 73 36 1279
4.00 < WS < 5.00 42 21 37 32 64 31 18 58 150 127 73 54 126 76 76 54 1039
5.00 < WS < 6.00 23 9 11 16 17 16 6 30 65 44 16 26 62 23 27 19 410
6.00 < WS < 8.00 0 0 0 0 0 0 0 0 0 0 0 0 0 0 0 0 0
8.00 < WS < 10.00
0 0 0 0 0 0 0 0 0 0 0 0 0 0 0 0 0
> 10.00 0 0 0 0 0 0 0 0 0 0 0 0 0 0 0 0 0
Totals 175 100 150 149 248 213 182 252 473 371 232 185 399 230 229 147 3735
Speed (m/s)
Calm 0.00
0.00 < WS < 1.00 0.00 0.00 0.00 0.00 0.00 0.00 0.00 0.00 0.00 0.00 0.00 0.00 0.00 0.00 0.00 0.00 0.00
1.00 < WS < 2.00 0.00 0.00 0.00 0.00 0.00 0.00 0.00 0.00 0.00 0.00 0.00 0.00 0.00 0.00 0.00 0.00 0.00
2.00 < WS < 3.00 0.12 0.07 0.10 0.10 0.16 0.17 0.16 0.15 0.19 0.18 0.16 0.09 0.16 0.10 0.11 0.08 2.11
3.00 < WS < 4.00 0.11 0.07 0.11 0.11 0.19 0.18 0.17 0.20 0.35 0.24 0.14 0.13 0.29 0.17 0.15 0.08 2.68
4.00 < WS < 5.00 0.09 0.04 0.08 0.07 0.13 0.07 0.04 0.12 0.31 0.27 0.15 0.11 0.26 0.16 0.16 0.11 2.18
5.00 < WS < 6.00 0.05 0.02 0.02 0.03 0.04 0.03 0.01 0.06 0.14 0.09 0.03 0.05 0.13 0.05 0.06 0.04 0.86
6.00 < WS < 8.00 0.00 0.00 0.00 0.00 0.00 0.00 0.00 0.00 0.00 0.00 0.00 0.00 0.00 0.00 0.00 0.00 0.00
8.00 < WS < 10.00
0.00 0.00 0.00 0.00 0.00 0.00 0.00 0.00 0.00 0.00 0.00 0.00 0.00 0.00 0.00 0.00 0.00
> 10.00 0.00 0.00 0.00 0.00 0.00 0.00 0.00 0.00 0.00 0.00 0.00 0.00 0.00 0.00 0.00 0.00 0.00
Totals 0.37 0.21 0.31 0.31 0.52 0.45 0.38 0.53 0.99 0.78 0.49 0.39 0.84 0.48 0.48 0.31 7.83

Chapter 19 - Environmental Review Air Quality and Noise
SHINE Medical Technologies 19.3-62 Rev. 0
Table 19.3.2-28 Joint Frequency Distribution of Wind Speed and Wind Direction from the Southern Wisconsin Regional
Airport 2005-2010 (Pasquill Stability Class F)(a)
a) From NCDC, 2011l
Speed (m/s) N NNE NE ENE E ESE SE SSE S SSW SW WSW W WNW NW NNW Total
Calm 975
0.00 < WS < 1.00 0 0 0 0 0 0 0 0 0 0 0 0 0 0 0 0 0
1.00 < WS < 2.00 26 14 21 18 41 31 21 19 28 32 18 26 36 15 23 19 388
2.00 < WS < 3.00 117 74 90 111 158 153 148 164 196 176 164 131 265 192 204 101 2444
3.00 < WS < 4.00 37 26 53 32 51 49 50 82 100 85 84 60 109 71 71 38 998
4.00 < WS < 5.00 0 0 0 0 0 0 0 0 0 0 0 0 0 0 0 0 0
5.00 < WS < 6.00 0 0 0 0 0 0 0 0 0 0 0 0 0 0 0 0 0
6.00 < WS < 8.00 0 0 0 0 0 0 0 0 0 0 0 0 0 0 0 0 0
8.00 < WS < 10.00
0 0 0 0 0 0 0 0 0 0 0 0 0 0 0 0 0
> 10.00 0 0 0 0 0 0 0 0 0 0 0 0 0 0 0 0 0
Totals 180 114 164 161 250 233 219 265 324 293 266 217 410 278 298 158 4805
Speed (m/s)
Calm 2.05
0.00 < WS < 1.00 0.00 0.00 0.00 0.00 0.00 0.00 0.00 0.00 0.00 0.00 0.00 0.00 0.00 0.00 0.00 0.00 0.00
1.00 < WS < 2.00 0.05 0.03 0.04 0.04 0.09 0.07 0.04 0.04 0.06 0.07 0.04 0.05 0.08 0.03 0.05 0.04 0.81
2.00 < WS < 3.00 0.25 0.16 0.19 0.23 0.33 0.32 0.31 0.34 0.41 0.37 0.34 0.27 0.56 0.40 0.43 0.21 5.13
3.00 < WS < 4.00 0.08 0.05 0.11 0.07 0.11 0.10 0.10 0.17 0.21 0.18 0.18 0.13 0.23 0.15 0.15 0.08 2.09
4.00 < WS < 5.00 0.00 0.00 0.00 0.00 0.00 0.00 0.00 0.00 0.00 0.00 0.00 0.00 0.00 0.00 0.00 0.00 0.00
5.00 < WS < 6.00 0.00 0.00 0.00 0.00 0.00 0.00 0.00 0.00 0.00 0.00 0.00 0.00 0.00 0.00 0.00 0.00 0.00
6.00 < WS < 8.00 0.00 0.00 0.00 0.00 0.00 0.00 0.00 0.00 0.00 0.00 0.00 0.00 0.00 0.00 0.00 0.00 0.00
8.00 < WS < 10.00
0.00 0.00 0.00 0.00 0.00 0.00 0.00 0.00 0.00 0.00 0.00 0.00 0.00 0.00 0.00 0.00 0.00
> 10.00 0.00 0.00 0.00 0.00 0.00 0.00 0.00 0.00 0.00 0.00 0.00 0.00 0.00 0.00 0.00 0.00 0.00
Totals 0.38 0.24 0.34 0.34 0.52 0.49 0.46 0.56 0.68 0.61 0.56 0.46 0.86 0.58 0.63 0.33 10.08

Chapter 19 - Environmental Review Air Quality and Noise
SHINE Medical Technologies 19.3-63 Rev. 0
Table 19.3.2-29 Joint Frequency Distribution of Wind Speed and Wind Direction from the Southern Wisconsin Regional
Airport 2005-2010 (Pasquill Stability Class G)(a)
a) From NCDC, 2011l
Speed (m/s) N NNE NE ENE E ESE SE SSE S SSW SW WSW W WNW NW NNW Total
Calm 4053
0.00 < WS < 1.00 0 0 0 0 0 0 0 0 0 0 0 0 0 0 0 0 0
1.00 < WS < 2.00 77 35 38 62 113 106 95 61 101 74 55 72 183 126 92 67 1357
2.00 < WS < 3.00 0 0 0 0 0 0 0 0 0 0 0 0 0 0 0 0 0
3.00 < WS < 4.00 0 0 0 0 0 0 0 0 0 0 0 0 0 0 0 0 0
4.00 < WS < 5.00 0 0 0 0 0 0 0 0 0 0 0 0 0 0 0 0 0
5.00 < WS < 6.00 0 0 0 0 0 0 0 0 0 0 0 0 0 0 0 0 0
6.00 < WS < 8.00 0 0 0 0 0 0 0 0 0 0 0 0 0 0 0 0 0
8.00 < WS < 10.00
0 0 0 0 0 0 0 0 0 0 0 0 0 0 0 0 0
> 10.00 0 0 0 0 0 0 0 0 0 0 0 0 0 0 0 0 0
Totals 77 35 38 62 113 106 95 61 101 74 55 72 183 126 92 67 5410
Speed (m/s)
Calm 8.50
0.00 < WS < 1.00 0.00 0.00 0.00 0.00 0.00 0.00 0.00 0.00 0.00 0.00 0.00 0.00 0.00 0.00 0.00 0.00 0.00
1.00 < WS < 2.00 0.16 0.07 0.08 0.13 0.24 0.22 0.20 0.13 0.21 0.16 0.12 0.15 0.38 0.26 0.19 0.14 2.85
2.00 < WS < 3.00 0.00 0.00 0.00 0.00 0.00 0.00 0.00 0.00 0.00 0.00 0.00 0.00 0.00 0.00 0.00 0.00 0.00
3.00 < WS < 4.00 0.00 0.00 0.00 0.00 0.00 0.00 0.00 0.00 0.00 0.00 0.00 0.00 0.00 0.00 0.00 0.00 0.00
4.00 < WS < 5.00 0.00 0.00 0.00 0.00 0.00 0.00 0.00 0.00 0.00 0.00 0.00 0.00 0.00 0.00 0.00 0.00 0.00
5.00 < WS < 6.00 0.00 0.00 0.00 0.00 0.00 0.00 0.00 0.00 0.00 0.00 0.00 0.00 0.00 0.00 0.00 0.00 0.00
6.00 < WS < 8.00 0.00 0.00 0.00 0.00 0.00 0.00 0.00 0.00 0.00 0.00 0.00 0.00 0.00 0.00 0.00 0.00 0.00
8.00 < WS < 10.00
0.00 0.00 0.00 0.00 0.00 0.00 0.00 0.00 0.00 0.00 0.00 0.00 0.00 0.00 0.00 0.00 0.00
> 10.00 0.00 0.00 0.00 0.00 0.00 0.00 0.00 0.00 0.00 0.00 0.00 0.00 0.00 0.00 0.00 0.00 0.00
Totals 0.16 0.07 0.08 0.13 0.24 0.22 0.20 0.13 0.21 0.16 0.12 0.15 0.38 0.26 0.19 0.14 11.35

Chapter 19 - Environmental Review Air Quality and Noise
SHINE Medical Technologies 19.3-64 Rev. 0
Table 19.3.2-30 Representative Environmental Noise Levels(a)
a) Reference: California Department of Transportation, 1998
Common Outdoor ActivitiesNoise Level
(dBA) Common Indoor Activities
--110-- Rock Band
Jet Fly-over at 1000 feet
--100--
Gas Lawnmower at 3 feet
--90--
Food Blender at 3 feet
Diesel Truck going 50 mph at 50feet
--80-- Garbage Disposal at 3 feet
Noisy Urban Area during Daytime
Gas Lawnmower at 100 feet --70-- Vacuum Cleaner at 10 feet
Commercial Area Normal Speech at 3 feet
Heavy Traffic at 300 feet --60--
Large Business Office
Quiet Urban Area during Daytime --50-- Dishwater in Next Room
Quiet Urban Area during Nighttime --40--Theater, Large Conference Room (background)
Quiet Suburban Area duringNighttime
--30-- Library
Quiet Rural Area during NighttimeBedroom at Night, Concert Hall (background)
--20--
Broadcast/ Recording Studio
--10--
Lowest Threshold of HumanHearing
--0-- Lowest Threshold of Human Hearing

Chapter 19 - Environmental Review Geologic Environment
SHINE Medical Technologies 19.3-65 Rev. 0
19.3.3 GEOLOGIC ENVIRONMENT
This subsection provides a description of the geology, soils, and seismology of the site and region.
19.3.3.1 Summary of On-Site Geotechnical Investigations
SHINE conducted a geotechnical investigation at the Janesville site during the fourth quarter of 2011. The investigation included the installation of 15 soil borings, with four of the borings converted to groundwater monitoring wells and one boring used solely for seismic profile testing (Figure 19.3.3-1). The geotechnical investigation methods and results are detailed in three reports:
• Preliminary Geotechnical Engineering Report, Janesville, Wisconsin: August 3, 2012.
• Preliminary Hydrological Analyses, Janesville, Wisconsin: August 3, 2012.
• Seismic Hazard Assessment Report, Janesville, Wisconsin: August 3, 2012.
The geotechnical report includes descriptions of soils encountered to a maximum boring depth of 221 ft. (67 m) below ground surface, the results of vertical seismic profiling, depth to groundwater, engineering properties of the soils encountered at the site, an assessment of geologic hazards at the site or nearby, and the suitability of materials at the site for the construction of the proposed facility.
The hydrological analyses report utilizes data gathered during the geotechnical investigation to assess the hydrologic regime at the site, including the flood risks from nearby surface waters, stormwater and runoff management risks, and groundwater flow and transport.
The seismic hazard report summarizes the geologic history of the region and makes an assessment of hazards associated with seismic events based on the vertical seismic profiling and a review of published and on-line data.
Results from each of these reports are used in the following subsections to further characterize the geological environment at the SHINE site.
19.3.3.2 Bedrock Formations
The SHINE site lies within the Central Lowlands physiographic province of the United States (Fenneman, Nevin Melancthon, 1946) in an area where thick sections of sedimentary rock overlie crystalline rock of Precambrian age (Olcott, Perry G., 1968). The sedimentary rock consists of Cambrian and Ordovician sandstone, dolomite, and shale (Figure 19.3.3-2). The sedimentary rock formations include the Mount Simon and Eau Claire sandstones and the Prairie du Chien group of Cambrian age, and the St. Peter sandstone, and Platteville, Decorah, and Galena formations of Ordovician age (Figure 19.3.3-3). According to Zaporozec (Zaporozec, Alexander, 1982), the “most significant feature of the bedrock surface (in Rock County) is the ancestral Rock River valley more than 300 ft. (91 m) deep, subsequently filled with outwash and other fluvial deposits.”
The Central Lowlands province is located within the middle of the relatively stable North American craton. The North American craton is the portion of the North American continental

Chapter 19 - Environmental Review Geologic Environment
SHINE Medical Technologies 19.3-66 Rev. 0
plate that has been least affected by collisions with other plates or tectonic activity. The regional geologic structures within the basement rock that have been mapped include the Sandwich and Plum River fault zones (inactive); the La Salle anticlinorium, and the Wisconsin and Kankakee Arches (Figure 19.3.3-4).
Between 1.0 and 1.2 billion years ago, a rift zone identified as the Mid-Continent Rift was active from Wisconsin through Mississippi. After the Mid-Continent Rift had ceased being an active rift zone, subsequent cooling of the crust and regional subsidence associated with the Appalachian Orogeny to the east are the probable causes of the regional geologic structures.
Overlying the sedimentary bedrock units are unconsolidated quaternary deposits of glacial till and outwash, consisting of well-sorted sand and gravel. The till and outwash deposits were deposited as the continental ice sheets advanced and retreated during the latter portion of the Pleistocene Epoch, between approximately 10,000 and 30,000 years ago. These outwash deposits are good sources of water, with single well yields of over 5000 gallons per minute (gpm)
(1.89x10⁴ liters per minute [lpm]) (Olcott, Perry G., 1968).
The stratigraphy of the bedrock units that underlie the site (see Figure 19.3.3-3) from youngest to oldest is:
• Galena Formation• Decorah Formation• Platteville Formation• St. Peter sandstone• Prairie du Chien Group• Trempealeau Group• Tunnel City Group• Wonewoc Formation• Eau Claire Formation• Mount Simon Formation• Precambrian basement rock
The bedrock units within Rock County are described in greater detail based on Zaporozec, Alexander, 1982.
The Cambrian-Ordovician sedimentary rocks were deposited in shallow seas on an uneven and arched surface of igneous and metamorphic (basement) rocks of Precambrian age. Both the Precambrian surface and the sedimentary rocks dip gently to the south and southeast. The sedimentary units thicken in the direction of dip from about 1000 ft. (305 m) in the northwestern corner of Rock County to over 1500 ft. (457 m) in the southeastern corner of the county.
The oldest formations of Cambrian age in Rock County are, in ascending order, the Mt. Simon sandstone, Eau Claire sandstone, Wonewoc (also known as the Galesville Formation) sandstone, Tunnel City Group (formerly Franconia sandstone), and Trempealeau Formation, consisting of the Jordan sandstone and St. Lawrence dolomite. In the Rock River valley, these rocks of Cambrian age are overlain primarily by unconsolidated Quaternary deposits, with much of the younger Ordovician sequence having been removed by erosion.

Chapter 19 - Environmental Review Geologic Environment
SHINE Medical Technologies 19.3-67 Rev. 0
Rock formations of Ordovician age include, in ascending order, the Prairie du Chien Group (dolomite), the St. Peter Formation (sandstone), and the Platteville-Galena Formation – also called the Sinnipee Group – consisting of carbonate rocks (limestone and dolomite). The Prairie du Chien Group was greatly thinned by erosion or completely eroded before deposition of the St. Peter sandstone when the land was elevated above sea level. In many areas of Rock County, the Prairie du Chien group is absent, and the St. Peter Formation rests directly on sandstones of Cambrian age. Because it was laid down on an uneven erosional surface, the St. Peter Formation varies considerably in thickness. The bedrock surface in the western part of the county is formed primarily by the St. Peter sandstone. Bedrock east of the Rock River valley and the ridge tops west of the valley are formed by the Platteville-Galena unit.
After the deposition of the sedimentary rocks, erosion over a long period of time produced a bedrock surface having a maximum relief of 1000 ft. (305 m) in Rock County. The most significant feature of the bedrock surface is the ancestral Rock River valley, which reaches depths of greater than 300 ft (91 m) (see Figure 19.3.3-2) and was subsequently filled with outwash and other fluvial deposits. East of the buried valley the bedrock has a flat, relatively undissected surface. West of the valley the bedrock surface is rugged and dissected.
19.3.3.3 Bedrock Overburden
The site has been influenced strongly by Pleistocene glacial erosion and deposition, and subsequent post-glacial erosional and depositional processes. The site is covered by a mantle of well-drained loamy soils underlain by stratified sand and gravel. These sands and gravels represent late Wisconsin to possibly Holocene age glaciofluvial outwash deposits, transported from the Wisconsin-age glacial moraines related to the Green Bay Ice lobe of the Laurentide Ice Sheet to the north. Depth to bedrock at the SHINE site may be as deep as 300 ft. (91 m), supported by geotechnical boreholes for this investigation completed to 221-ft. (67 m) depths without encountering bedrock (Figure 19.3.3-5).
Lab testing showed the soils to be primarily clean sandy soils with occasional gravel layers, with the density of the sand increasing with depth. A hard clayey silt layer was observed at approximately 180 ft. (55 m) below ground surface, and groundwater was observed at a depth of 50 to 65 ft. (15.3 to 19.8 m) below ground surface.
19.3.3.4 Soils
On-Site Soil Types
The soils were formed primarily from glacial processes which occurred in the region. Glacial till and outwash are the primary parent materials for the soil, in addition to reworked loess, decomposed vegetation, and deposits from the dolomite and sandstone bedrock in the area. Most of the glacial outwash in the area consists of stratified sand and gravel, deposited by water flowing from the glacier as it melted and receded. A layer of finer-grained material, which overlies the outwash, eventually weathered to form the silt loam and loam present at the site (USDA-SCS, 1974).
The soils at the site are classified by the USDA Soil Conservation Service Soil Survey of Rock County, Wisconsin as two types, the Warsaw silt loam and the Lorenzo loam (USDA-SCS, 1974) (see Figure 19.3.1-5). The Warsaw silt loam, the primary soil at the site, is characteristic of outwash plains and terraces, with the surface layer either a silt loam or loam. The Warsaw silt

Chapter 19 - Environmental Review Geologic Environment
SHINE Medical Technologies 19.3-68 Rev. 0
loam typically has slow runoff and is well-suited for farm and crop production. Soils in the Warsaw series consist of level to sloping loamy soils which are underlain by stratified sand and gravel. Permeability is typically moderate in the subsoil, with underlying sand and gravel typically found at depths ranging from 24 to 40 in. (61 to 102 cm) (USDA-SCS, 1974).
A secondary soil found at the site is the Lorenzo loam. The Lorenzo loam is also typically found on outwash plains and terraces. The surface layer of the Lorenzo loam is a black loam. The Lorenzo loam is well-drained and is moderately susceptible to erosion. The soils of the Lorenzo series are moderately suited to agriculture, with slow runoff. Permeability is typically moderate in the subsoil, with the underlying stratified sand and gravel found at a depth ranging from 12 to 20 in. (30 to 51 cm) (USDA-SCS, 1974).
Prime Farmland
The Warsaw silt loam with less than 2 percent slope is classified as a prime farmland soil by the USDA Natural Resources Conservation Service, indicating that the soil has the best combination of physical and chemical characteristics for producing crops suitable for the area. Additional factors in the prime farmland designation include favorable climate, adequate and dependable water supply, acceptable soil pH, acceptable salt/sodium content, and the soil is not excessively eroded or saturated with water. Criteria for defining and delineating these lands are determined by the appropriate state or local agencies in cooperation with USDA. The significant difference between farmland of statewide importance and USDA designated prime farmland is that although the criteria used to designate both types of soils are not appropriate outside the state or local area, these lands which are designated as farmland of statewide importance approach the productivity of lands in their area that meet criteria for prime farmland and unique farmland.
The Lorenzo silt loam present on the site is classified as farmland of statewide importance. Farmland of statewide importance approaches the productivity of prime farmland, but the soil does not meet the criteria for designation as prime farmland.
The prime farmland on the site is shown on Figure 19.3.1-5. Approximately 41,950 ac. (16,977 ha) of the area within the region are lands having soils classified as prime farmland or farmland of statewide importance.
Soil Erodibility
The Warsaw and Lorenzo soils, when found on slopes greater than 2 percent, are described by the USDA SCS (USDA-SCS, 1974) as slightly-to-moderately-erodible soil units. The soils found on slopes less than 2 percent are not considered erodible. The erodibility of the soil units is a factor of the soil type, the amount of rainfall and runoff, wind speed, and the length and steepness of the ground slope. No soils present on the site or within the area of the site are listed as highly erodible land by the USDA NRCS (USDA NRCS, 2012a).
Current erosion control practices observed at the site include the use of conservation or minimum tillage measures, the use of vegetated swales, and contoured cultivation. Conservation tillage is minimally disturbing the stubble from the preceding crop prior to planting of the next crop so that the root system serves to anchor the topsoil. Vegetated swales slow the rate of runoff, reducing the amount of sediment carried in the water, and sediment is trapped in place. Contoured cultivation parallels the contours of the land surface, allowing stormwater to be detained within the furrows, leading to increased infiltration.

Chapter 19 - Environmental Review Geologic Environment
SHINE Medical Technologies 19.3-69 Rev. 0
Soil Shrink/Swell Potential
The shrink/swell potential of soil is the tendency of soil to expand or contract due to changes in the water content of the soil. Highly plastic clays are a significant component of soils with a high shrink-swell potential. The content of the soil on the site is primarily sand, with no evidence of highly plastic clays. The shrink/swell potential of the soils at the site is considered to be minimal.
19.3.3.5 Seismology
Wisconsin, located in the central portion of the North American craton, is not within or near active seismic zones or fault zones; however, minor earthquakes can occur in the region. Three earthquakes within approximately 200 mi. (322 km) of the site have been recorded during the first six months of 2012. These three earthquakes were centered near the towns of McHenry, Illinois; Clintonville, Wisconsin; and Topeka, Indiana. The McHenry earthquake was reported as a 2.3 magnitude earthquake, the Topeka earthquake was reported as a 3.0 magnitude earthquake, and the Clintonville earthquake was reported as a 1.5 magnitude earthquake (CERI, 2012).
The intensity and frequency of the earthquakes within the region are reflected in the Wisconsin Seismic Hazard Map (Figure 19.3.3-6), which depicts the Janesville region as within the seismic hazard zone with a less than 2 percent chance of exceeding 0.4 to 0.6 gravities (g) within the next 50 years, where g is the acceleration of an object due to the force of gravity.
The geologic history of the basement rocks indicates that the site is located in a region of relative tectonic stability. Several post-500 million year old geologic structures have been mapped near the site, including the Sandwich and Plum River fault zones, the La Salle anticlinorium, and the Wisconsin and Kankakee Arches (see Figure 19.3.3-4). These geologic structures appear to have formed and been seismogenic under a tectonic regime different from the present-day. No seismogenic “capable” faults are recognized on or near the site. Capable faults are defined as either having exhibited movement at the surface in the past 35,000 years or recurring movement within the past 500,000 years. The closest known “capable” faults are part of the Wabash Valley liquefaction features located approximately 170 mi. (274 km) south of the site, and the New Madrid seismic zone located approximately 400 mi. (644 km) south of the site (Figure 19.3.3-7). Within 124 mi. (200 km) of the SHINE site, available earthquake catalogs contain only 35 epicenters for small to moderate earthquakes up to expected moment magnitude (E[M]) 5.15 that have occurred since 1804. Interpretation of readily-available felt intensity records indicates that only moderate earthquake shaking (i.e., Modified Mercalli Intensity scale V) has probably been felt at the site four times in approximately the last 200 years.
Estimates of seismic hazard for the region from the U.S. Geological Survey (USGS) 2008 national seismic hazard maps indicate that the site is located within one of the lowest earthquake hazard areas in the conterminous United States.
As noted in Subection 2.5.7.3, liquefaction of soils typically occurs in loose soils under saturated or near-saturated conditions. The soils underlying the site at depths where saturated or near-saturated conditions are encountered were classified as dense during the geotechnical investigation.
In Subsections 2.5.4 and 2.5.5, a detailed discussion of the seismic setting at the site and the derivation of probabilistic estimates of earthquake ground shaking from maximum potential

Chapter 19 - Environmental Review Geologic Environment
SHINE Medical Technologies 19.3-70 Rev. 0
earthquakes can be found. The estimates were derived using the national seismic hazard model for five return periods between 475 and 19,900 years, using a maximum potential (M) of 5.8. The peak horizontal ground acceleration (PGA) estimates derived from the national seismic hazard model, presented in Table 2.5-5, indicate a low to very low level of earthquake shaking hazard at the site.
19.3.3.6 Other Hazards
19.3.3.6.1 Tsunamis
The nearest source for tsunami-related impact is Lake Michigan, located approximately 63 mi (101 km) to the east of the site. The elevation of the lake nearest to the site is in the Kenosha, WI area, at an elevation of approximately 580 ft. (177 m), which is approximately 230 to 250 ft. (70 to 76 m) below the elevation of the site. While the possibility of a large wave being generated in Lake Michigan exists, there is a negligible probability of it being greater than 230 ft. (70 m) and maintaining sufficient height for more than 60 mi. (96 km) to impact the site. Consequently, the risk of tsunami is correspondingly very low.
19.3.3.6.2 Volcanism
As noted in Subsection 19.3.3.5, the site is located in a tectonically-stable region of the middle of the continent identified as the Central Lowlands (see Subsection 19.3.3.2). Volcanoes tend to cluster along narrow mountainous belts where folding and fracturing of the rocks provide channelways to the surface for the escape of magma (USGS, 2012a). The lack of magma forming processes in the Central Lowlands province prevents the formation of volcanoes in the region.
19.3.3.6.3 Landslides
Based on the landslide overview map of the conterminous United States, the SHINE site is located in a zone of low landslide incidence, which is defined as less than 1.5 percent of area involved in landsliding. The Rock County Hazard Mitigation Plan indicates that “…no significant landslides…have been reported in Rock County in recent years.”.
19.3.3.7 Karst and Subsidence
Karst terrain results from the dissolution of carbonate bedrock which is often followed by the formation of sinkholes with the subsidence of soils overlying the sinkholes. Karst areas can also include subsurface caverns and streams, which may also collapse, leading to subsidence of overlying soils and the formation of sinkholes. Rock County, especially the eastern third, contains carbonate bedrock which can be susceptible to dissolution or karst formation. The SHINE site is located in the central portion of the county, and no evidence for karst or subsidence has been observed at the site. In addition, subsidence has not been an issue in Rock County, and the subsidence hazard is low.

Chapter 19 - Environmental Review Water Resources
SHINE Medical Technologies 19.3-71 Rev. 0
19.3.4 WATER RESOURCES
19.3.4.1 Hydrology
19.3.4.1.1 Surface Water
The SHINE site is located within a small sub-watershed of the Upper Rock River (Hydrologic Unit Code 07090001 [USEPA, 2012b]). The project area watershed discharges to the Rock River at approximately river mile 179.4, as indicated on Federal Emergency Management Agency (FEMA) flood profiles (FEMA, 2008). This project area discharge location is approximately 10 mi. (16 km) by river downstream of downtown Janesville and approximately 8.3 mi. (13.4 km) by river upstream from the Wisconsin – Illinois state line. The Rock River watershed area at the USGS stream gaging station at Afton, at Rock River mile 181.3, is 3340 sq. mi. (8651 sq. km).
19.3.4.1.1.1 Watershed Description
The drainage area of the project area watershed is approximately 1377 ac. (557 ha) (Figure 19.3.4-1). At the upstream end of the watershed, the USGS Hydrologic Unit Code (HUC) 12-digit drainage boundary for the watershed extends north of SH 11. No drainage culverts under SH 11 in that area are apparent and little or no surface drainage occurs southerly across SH 11. Another small, unnamed tributary to the Rock River borders the project area watershed to the southeast. The project area watershed has generally low relief, however, slopes as high as approximately 6 percent are present in the watershed.
US 51 runs north–south through the project area watershed, with approximately half of the project area watershed located on each side of the highway.
There are culverts under US 51 that convey water from the east side ditch to the west side, including two culvert locations (three culvert pipes) adjacent to the site (Figure 19.3.4-2). The watershed runoff that flows through those culverts passes through the SWRA, then through culverts under West Airport Road, through the Glen Erin Golf Course, and then through a box culvert under West Happy Hollow Road before discharging to the Rock River. Downstream of West Happy Hollow Road, the stream passes through the wooded Rock River floodplain and Happy Hollow Park, which has a boat ramp located at the confluence of the stream with the Rock River.
Soils within the project area watershed have a relatively high infiltration capacity and the water table is generally not near the surface. Consequently, the project area watershed generates low surface runoff. As a result, aerial images of the area do not show readily identifiable stream channels, as defined by stream banks or vegetation upstream of the wooded Rock River floodplain.
The project area watershed has a land use that consists primarily of cultivated fields. Other land uses in the project area watershed include the airport, the Glen Erin Golf Club, and the Happy Hollow Park.
As is illustrated in Figure 19.3.4-1, a small upstream area drains through a portion of the approximately 91.27-ac. site. The site topography slopes toward the southwest. Most of the drainage generated by the site or upstream of the site is intercepted by the US 51 drainage ditch

Chapter 19 - Environmental Review Water Resources
SHINE Medical Technologies 19.3-72 Rev. 0
that is located along the western side of the site. A small portion of the site drains to the south onto private land abutting the south boundary of the site.
19.3.4.1.1.2 Climate
Climate of the SHINE site is characterized as having four distinct seasons. Based on the Rockford, Illinois NOAA station located approximately 30 miles south of the site, monthly normal temperatures range from a normal daily maximum in July of 83.1 degrees Fahrenheit (°F) (28.4 degrees Celsius [°C]) to a normal daily minimum of 9.3 °F (-12.6°C) for the month of January (NCDC, 2011c). Annually, the mean number of days when the maximum daily temperature does not exceed 32°F (0°C) is 55.3.
The normal annual precipitation in the Janesville vicinity based on the NOAA station at Rockford is approximately 36.6 in. (93.0 cm). The period from April through September receives a normal rainfall of 24.23 in. (61.5 cm), with June the calendar month with the largest normal rainfall amount. The normal annual snowfall is 38.7 in. (98.3 cm). A summary of monthly and annual precipitation data is provided in Table 19.3.4-1.
Rainfall depth–duration–frequency statistics for the area for durations up to 10 days are summarized in Table 19.3.4-2. The 24-hour (hr.) duration, 2-year recurrence interval rainfall is 2.78 in. (7.06 cm) and the 24-hr., 100-year rainfall depth is 7.06 in. (17.9 cm) (Huff, Floyd A. and James R. Angel, 1992).
19.3.4.1.1.3 Soils and Land Cover
The site is covered by a mantle of well-drained loamy soils underlain by stratified sand and gravel with a depth to bedrock as much as 300 feet. The silty loam soils in the vicinity of the SHINE site have slopes ranging from nearly flat up to approximately 6 percent. The surficial soils at the site are identified by the NRCS soil survey information (USDA NRCS, 2012a and 2012b) as Warsaw silt loam and the Lorenzo loam. The Warsaw silt loam and Lorenzo loam are classified as having a moderately low runoff potential as Hydrologic Soil Group (HSG) B. HSG B soils are those that have a moderate infiltration rate and water transmission rate within the soil profile in the range of 0.15 to 0.30 inches per hour (in/hr) (0.4 to 0.76 centimeters per hour [cm/hr]). Warsaw silt loam is characterized as having a sand content of 67 percent and the Lorenzo loam has a sand content of 62 percent. The Warsaw silt loam has a saturated vertical hydraulic conductivity of
approximately 62 micrometers per second (equivalent to 6.2 x 10⁻³ cm/s or 8.8 in/hr [22.4 cm/hr]), and the Lorenzo loam has a saturated vertical hydraulic conductivity of approximately
50 micrometers per second (equivalent to 5.0 x 10⁻³ cm/s or 7.1 in/hr [18 cm/hr]), which are relatively high hydraulic conductivities, and lead to the classification as “well drained” soils. The saturated vertical hydraulic conductivity identified for the soils are significantly greater than the water transmission rate range associated with HSG B soils as described above.
The NRCS soil survey classification information also indicates depth to water table is greater than 179 cm (70 in.) throughout the project area and adjoining land (the water table level is more than 50 feet below ground surface, as described in Subsection 19.3.3.3). The relatively low runoff potential is reflected in the relative absence of well defined intermittent stream channels near the site.

Chapter 19 - Environmental Review Water Resources
SHINE Medical Technologies 19.3-73 Rev. 0
The site is currently utilized for row crop agriculture. The eastern portion of the site is equipped with a center-pivot irrigation system, which is also indicative of both a well drained soil as described above and a readily available groundwater supply.
19.3.4.1.1.4 Streamflow
There are no streamflow monitoring data from the project area watershed and there are no permanent streams on the site or in proximity to the site. The Rock River is located approximately 2 mi. (3.2 km) south-southwest of the site. To characterize runoff and streamflow in the area, however, there are several USGS streamflow monitoring stations in Rock County (Table 19.3.4-3). The nearest Rock River streamflow station (USGS Station 05430500 Rock River at Afton, Wisconsin) (USGS, 2012b) is located upstream from the point where the site watershed drains into the river west of the site. The Turtle Creek at Carvers Rock Road near Clinton, Wisconsin (Station 05431486) is located east of the site. The Yahara River near Fulton, Wisconsin (Station 05430175) is located to the northwest, and Badfish Creek near Cooksville, Wisconsin (Station 05430150) is located to the northwest. There are other stations, but none with long term streamflow records.
Flows at these four stations indicate that the runoff in the Rock River, Turtle Creek and Yahara River is very similar when expressed in inches of runoff per year per unit drainage area. Runoff rates presented as 12-month depths based on the running average over the previous 60 months (5 years) for these streams along with precipitation similarly expressed as 12-month depths from the 60-month (5-year) running average are presented in Figure 19.3.4-3. The figure illustrates that even over an arbitrary 5-year period variations in average streamflow are notable and trend closely with precipitation. Badfish Creek appears to have a higher sustained flow from groundwater contribution(s). The figure illustrates that for these four representative streams, the 5-year average runoff rate has ranged from approximately 4 to 17 inches per year (in/yr) (10 to 43 centimeters per year [cm/yr]). The long-term average discharges for these streams range from approximately 8.2 to 11.4 in/yr (20 to 28 cm/yr), whereas the long-term flow at the Badfish Creek station has been approximately 18.3 in/yr (46 cm/yr)
The City of Janesville has stated an assumed average groundwater recharge rate for Rock County of 6.3 in/yr (16 cm/yr) (City of Janesville, 2010) and that the estimated groundwater production is approximately 15 percent of the recharge rate (0.95 in/yr, [2.41 cm/yr]). A portion of the groundwater production is not ultimately consumed (e.g., treated wastewater discharges) and returns to the streams as surface flow.
Olcott describes the upper part of Turtle Creek and the Rock River as receiving groundwater discharge (Olcott, Perry G., 1968). The lower portion of Turtle Creek, nearest the site, is described as being a losing stream, with infiltration to the groundwater, which then may discharge into the Rock River.
The baseflow contribution to the total flow in these streams can be quantified using standard procedures (Sloto, Ronald A. and Michele Y. Crouse, 1996; Hughes et al., 2003). Analyses using these methods indicate that the baseflow contributions are approximately 84 to 91 percent of the flow at the Rock River at Afton station, 77 percent at the Turtle Creek station, 87 to 89 percent at the Badfish Creek station, and 86 percent at the Yahara River near Fulton station. Based on these estimates of the baseflow component of streamflow and the total runoff, the typical long-term average surface flow component of streamflow ranges from approximately 0.8 to 2.0 in/yr (2 to 5 cm/yr).
Chapter 19 - Environmental Review Water Resources
SHINE Medical Technologies 19.3-74 Rev. 0
19.3.4.1.1.4.1 High Flows
The annual maximum floods on streams in Rock County typically occur either in late winter/early spring (March to April) or due to early summer thunderstorms, most often in June. Floods on the Rock River at Afton generally occur in March or April, with few floods occurring in November to January. For smaller watersheds, the peak runoff events typically occur either in February to March or in June to July time periods.
The USGS has evaluated watershed peak runoff rates and developed regression equations relating various watershed parameters to observed high flows (Walker, J.F. and W.R. Krug, 2003). For the physiographic region in which the site is located, the watershed parameters of drainage area, main channel slope, and surface storage in lakes, ponds, wetlands, etc., as indicated on USGS and NRCS information, are the three watershed parameters found to provide the best statistical predictor.
The USGS has estimated discharge frequency data for the Rock River at long-term streamflow stations, including Station 05430500 at Afton. The discharge frequency data are summarized in Table 19.3.4-4. Rock River flood discharge frequency data used by FEMA for the Rock County Flood Insurance Study (FEMA, 2008) are also included in Table 19.3.4-4. Rock River flood levels near the site are well below the lowest ground elevations at the site. River flood levels are also sufficiently below the site that the river flood levels have no backwater influence on the tributary flood water levels.
Analyses were completed to estimate the maximum water levels at the SHINE site resulting from a local Probable Maximum Precipitation (PMP) event. Several conservative assumptions were made for the analyses, including the assumption of nearly complete runoff (limited infiltration and losses) and the failure of the site drainage system (designed for a 100-year return period event), resulting in exclusively overland flow. The SHINE site also has a perimeter berm with an external conveyance area that splits runoff from areas upstream of the site, resulting in a portion of stormwater that flows west along the northern edge of the site and a portion that flows south and then west along the site.
The analyses determined that the maximum water levels around the site safety structures from on-site runoff are below the floor levels of the structures. Additionally the maximum water runoff from an approximate 234-ac. drainage area is diverted around the site by the perimeter berm and conveyance system, resulting in water levels below the top of berm at all locations. The analyses also determined that flow velocities associated with those diverted flows are not high and, therefore, not significantly erosive.
19.3.4.1.1.4.2 Low Flows
Low flows at the Rock County streamflow gaging stations (Table 19.3.4-3) can be characterized based on average flows over selected periods of 7, 15, and 30 days. The minimum average low flows during the period of record in these streams exhibit more variation than high flows. The Rock River flows at Afton are affected by upstream flow controls. The 7-, 15- and 30-day average low flows in the 98-year long period of record are 0.0343, 0.045, and 0.052 cubic feet per second per square mile (cfs/sq. mi. [0.0025, 0.0034, and 0.0039 cubic meters per second per square kilometer (cms/sq. km)]), respectively. The shorter duration (e.g., 7-day) average low flows are more affected by gated controls than longer duration flows, such as the 30-day average low flow, which is comparable to rates on other local streams that are not affected by flow

Chapter 19 - Environmental Review Water Resources
SHINE Medical Technologies 19.3-75 Rev. 0
controls. The corresponding (7-, 15-, and 30-day) record low flows in the 72-year Turtle Creek record are 0.085, 0.091, and 0.096 cfs/sq. mi. (0.0062, 0.0067, and 0.0070 cms/sq. km). The record low flows (runoff per unit drainage area) in the Yahara River and Badfish Creek, both of which have 35-year periods of record, are approximately twice and six times those in Turtle Creek.
The annual minimum 7-day average low flows on the Rock River at Afton show a significant autocorrelation and long-term variation, similar to the variation in the 5-year running average flows as shown in Figure 19.3.4-3. The annual minimum 7-day average low flows during the 35-year period from 1935 to 1970 are significantly lower than the flows during the period from 1914 to 1935 and the period from 1970 to 2011. As observed for the 5-year running average comparison with rainfall, distinct rainfall and flow variations over relatively long time periods have occurred. The 20 lowest values of the annual (January–December) minimum 7-day and 30-day average low flows from the period of record are summarized in Table 19.3.4-5.
19.3.4.1.1.5 Dams and Reservoirs
There are numerous dams on the Rock River. These low dams were originally constructed for hydropower and are characterized as having a small increase in water level, or head, for increased power but generally do not create a large reservoir volume. With reference to the junction of the tributary stream through which the site drains to the Rock River, the Indianford Dam is located on the Rock River approximately 21 mi. (34 km) upstream; the Centerway Dam is located upstream near downtown Janesville just downstream of the West Centerway Street / US 51 bridge crossing, and Monterey Dam is located approximately 6.5 mi. (10.5 km) upstream. Downstream from the SHINE site, the first dam on the Rock River is the Blackhawk Dam, also known as the Beloit Dam, located approximately 8.4 river mi. (13.5 river km) downstream of the site.
None of these dams maintain a large upstream reservoir or have a high head, especially during high flow events. The Indianford Dam was constructed downstream of the natural Lake Koshkonong. There are no dams or reservoirs upstream of the site or on an adjacent stream within a distance of the site that would potentially affect the site in the event of a failure of the structure.
While Wisconsin has many natural lakes, Rock County has few lakes and no large lakes other than Lake Koshkonong. The southern end of Lake Koshkonong is located in Rock County but the majority of the lake is located in Jefferson County. The nearest named lake is Lions Pond located in Lions Park in southern Janesville, approximately 3.3 mi. (5.3 km) north of the site and just east of the Rock River.
Delavan Lake is located 19.6 mi. (31.5 km) east of the site in Walworth County. The only other relatively close lake included in the Wisconsin DNR lake maps inventory (WDNR, 2012b) is Spaulding Pond, located approximately 8.5 mi. (13.7 km) northeast of the site.
19.3.4.1.1.6 Estuaries and Oceans
No estuaries or oceans are located near the SHINE site.

Chapter 19 - Environmental Review Water Resources
SHINE Medical Technologies 19.3-76 Rev. 0
19.3.4.1.1.7 Applicable Regulations and Permits
Site development stormwater regulatory criteria applicable to the site area are established by Wisconsin administrative code, Chapters Natural Resources (NR) 151 and NR 216 and City of Janesville Ordinances Chapter 15, Sections 15.05 (construction erosion and sediment control) and 15.06 (post-construction stormwater management) (City of Janesville, 2011a).
Stormwater discharge regulatory requirements established pursuant to the federal National Pollutant Discharge Elimination System (NPDES) program are based on industrial classification code applicable to the activity. The facility is believed to be appropriately classified with SIC 2834 (325412 North American Industry Classification System [NAICS]) (USCB, 2012). This industrial classification code requires a Wisconsin Pollutant Discharge Elimination System (WPDES) stormwater discharge permit (NR 216.21 (2)(b)), except that an exclusion exists for certain facilities that are constructed and operated such that no activities defined as “industrial activities” are exposed to stormwater (NR 216.21 (3)). This industry type requires a WPDES stormwater discharge permit for industrial activity only if industrial activities are exposed to stormwater; it is anticipated that the site design and operation would be such that no industrial activities are exposed to stormwater and that a Conditional No Exposure Certification submitted regularly as required would be applicable. The “no exposure” exclusion exists and if the site has no industrial activities exposed to stormwater, then a WPDES permit for stormwater discharge would not be required.
For construction sites disturbing 1 ac. (0.4 ha) or more, controls must be implemented that reduce sediment discharge from the site by 80 percent on an average annual basis (NR 151.12). Additionally, the site must be constructed such that peak discharge rate and a minimum infiltration volume are provided (NR 151.12(5)).
The local stormwater regulations require that for sites that disturb more than 1 ac. (0.4 ha), the 2-, 10-, and 100-year design storms must be managed on the site to result in no increase in peak runoff rates for those events (City of Janesville, 2011b). Also, for new development sites that are not in-fill development of less than 5 ac. (2 ha), the post-development infiltration is to be at least 60 percent of the pre-development infiltration volume on an average annual basis. Additionally, total suspended solids must be reduced by 80 percent from the loading if no controls were implemented (same requirement as state criteria at NR 151.12).
Other regulatory designations and standards related to water quality are discussed in Subsection 19.3.4.3.1. While existing and potential for surface water use at the vicinity of the site is limited, water use exceeding certain threshold rates including the capacity to withdraw water at a rate of 100,000 gallons per day or more (WDNR, 2011b), requires registration in the state’s water use program. There are no designated floodplains within the SHINE site, so floodplain regulations established by the local community in accordance with minimum federal requirements for participation in the National Flood Insurance Program are not applicable (i.e., criteria for development within a designated flood hazard area).
The site is not located within a FEMA 100-year floodplain. However, Rock County ordinance Chapter 32 (Rock County, 2005) provides for regulation of floodplain development within regional floodplains, defined as floodplains that are mapped by local, non-FEMA studies. No regional floodplain mapping at the site is known.

Chapter 19 - Environmental Review Water Resources
SHINE Medical Technologies 19.3-77 Rev. 0
19.3.4.1.2 Groundwater
There are two major aquifer systems within the region, the surficial aquifer and the Cambrian-Ordovician aquifer system, neither of which are identified by the USEPA as sole-source aquifers (USEPA, 2012c) The surficial aquifer system consists of sand and gravel, ice-contact deposits, and alluvium. The Cambrian-Ordovician aquifer system consists of a sandstone and dolomite aquifer and two sandstone aquifers, typically separated by less-permeable confining layers (Olcott, Perry G., 1992). At the SHINE site, the surficial aquifer is present as glacial outwash, and the Cambrian-Ordovician aquifer is either an upper Cambrian sandstone or a lower Ordovician sandstone and dolomite unit. The stratigraphy of the site is described in detail in Subsections 19.3.3.2 and 19.3.3.3 and a cross-section of the site, including the location of the water table, is shown on Figure 19.3.3-5.
19.3.4.1.2.1 Surficial Aquifer System
The regional surficial aquifer is composed of material deposited during multiple advances and subsequent retreat of continental glaciers during the Quaternary period. The SHINE site is located within a pre-glacial river valley, where the bedrock surface was eroded up to 300 ft. (91 m) below surrounding bedrock (Olcott, Perry G.,1968). The pre-glacial valley is filled with glacial outwash, consisting of well-graded sand and sand and gravel. The sand extends to a depth of at least 221 ft. (67 m) below ground surface. A 10 ft. (3 m) to 18 ft. (5 m) thick layer of hard clayey silt layer occurs at approximately 180 ft. (55 m) below ground surface. The hard clayey silt layer is underlain by sand or silty sand to the borehole termination depth of 221 ft. (67 m) below ground surface. The hard clayey silt layer occurred within all three borings at depths greater than 180 ft. (55 m) below ground surface. Monitoring of wells installed on the SHINE site (Figure 19.3.4-4) demonstrates that groundwater is present at a depth of 50 to 65 ft. (15.3 to 19.8 m) below ground surface, corresponding to groundwater elevations ranging from 765.72 ft. (233.39 m) to 761.96 ft. (232.25 m) (Table 19.3.4-6).
Based on monthly water level measurements, the direction of groundwater flow at the site is to the southwest, toward the Rock River (Figures 19.3.4-5, 19.3.4-6, 19.3.4-7, and 19.3.4-8), with minimal seasonal change in flow direction.
The coarse nature of the glacial outwash material is reflected in permeability estimates derived from slug tests performed in the monitoring wells installed at the SHINE site. The slug-in tests indicate an average permeability estimate of 0.0051 feet per second [fps] (0.155 centimeters per second [cm/s]) and the slug-out tests indicate an average permeability of 0.0039 fps (0.119 cm/s), with the average permeability of 0.0045 fps (0.137 cm/s). The surficial aquifer in the area has
shown yields of 5000 gpm (1.89 x 10⁴ lpm) with a resulting drawdown of less than 7 ft. (2.1 m) over a 24-hr. test (Olcott, Perry G., 1968). The average north to south hydraulic gradient at the site ranges from 0.0007 to 0.0008 feet per foot (0.021 to 0.024 cm per cm) between monitoring wells SM-GW1A and SM-GW2A, and the average east to west hydraulic gradient ranges from 0.0002 to 0.0005 feet per foot (0.006 to 0.015 cm per cm) between monitoring wells SM-GW3A and SM-GW4A. Prior to the start of SHINE’s investigation, no wells were present on the site. Consequently, no historic groundwater information is available for the site.

Chapter 19 - Environmental Review Water Resources
SHINE Medical Technologies 19.3-78 Rev. 0
19.3.4.1.2.2 Bedrock Groundwater
In Rock County, the deeper bedrock groundwater is found within the sedimentary formations (Platteville-Galena dolomite, St. Peter sandstone, Prairie du Chen dolomite, and Cambrian sandstone) which overlie the Precambrian basement rock. The formations may act as a single aquifer or as independent aquifers, based on the separation of the units by less permeable members. This deep groundwater is not typically utilized for water supplies (Zaporozec, Alexander, 1982). The drilling was terminated at approximately 220 ft. (67 m) below ground surface and did not penetrate the bedrock formation.
The Cambrian sandstone’s estimated thickness at the SHINE site is 1000 ft. (300 m), and is the primary source of water where the surficial aquifer is not available. Pump tests on wells within the Cambrian sandstone have resulted in estimated yields ranging from 32,000 to 37,000 gallons per day per foot (gpd/ft) (121,133 to 140,060 liters per minute per meter) (LeRoux E.F., 1963).
19.3.4.2 Water Use
19.3.4.2.1 Regional Surface Water Use
The USGS has periodically reported water use information within Wisconsin, including statistics by county. The USGS (Buchwald, Cheryl A., 2011) found that in 2005 the total water use in Rock County was 96.31 million gallons per day (Mgd) (364.6 million liters per day [Mld]) with 50.56 Mgd (191.4 Mld), or 52.5 percent, coming from surface water sources and 45.75 Mgd (173.2 Mld) (47.5 percent) coming from groundwater sources. However, 50.12 Mgd (189.7 Mld), including only 0.12 Mgd (0.5 Mld) from groundwater, was used for thermo-electric power generation and all, or nearly all, of that use was for cooling water. When excluding thermo-electric power generation from water use, the USGS reported that the 2005 surface water use was equivalent to 4.7 gallons (17.8 liters) per capita per day, compared to a similar per capita groundwater use of 385.4 gallons per day (gpd) (1458.9 liters per day [lpd]). A similar USGS report of water use in the year 2000 listed a Rock County total water use of 162.61 Mgd (615.5 Mld) and a thermoelectric power generation water use of 133.54 Mgd (505.5 Mld) (Ellefson, et al., 2002).
The Wisconsin Department of Health Services reported that no community water supplies in Rock County rely on surface water while a population of 122,585 is served by groundwater (Wisconsin Department of Health Services, 2012). Olcott reported that surface water use prior to 1968 was limited, with the only significant industrial use being cooling water (Olcott, Perry G., 1968).
The Janesville City Water Utility developed a water conservation plan in 2010 in accordance with a Public Service Commission requirement (City of Janesville, 2010). In 2010 the Water Utility projected a total 2010 water pumpage volume of 5,060 million gallons (13.86 Mgd [52.5 Mld]) and a projected 2020 volume of 5910 million gallons (16.2 Mgd [61.3 Mld]). Peak water pumpage through 2009 occurred in 1999; water usage dropped in the following years primarily due to reduction in industrial use (City of Janesville, 2010)
The Water Utility plans to develop an industrial facility water audit program that the industrial water users, which included 29 users in 2010, may voluntarily use to improve water efficiency. Water conservation programs will also be developed for other water use sectors.

Chapter 19 - Environmental Review Water Resources
SHINE Medical Technologies 19.3-79 Rev. 0
The City is currently planning to install a new water distribution line along the northern boundary of the project property. This distribution line would serve the properties in the vicinity of the SHINE site as well as the facility.
Water uses in the vicinity of the project include agricultural irrigation and potable water supply. Near the site, the SWRA uses the public water supply system. These uses are both supplied by groundwater resources. There are no apparent, or known, surface water uses near the SHINE site.
19.3.4.2.2 Groundwater
All public water supplies in Rock County are from groundwater. Table 19.3.7-14 lists the nine major municipal water suppliers that each serve communities in Rock County. Six of the nine municipal water systems in Rock County have a wellhead protection plan including Clinton, Evansville, Footville, Janesville, Milton, and Orfordville. Wellhead protection ordinances are in place for only Evansville and Janesville (USGS, 2012c). Janesville and Evansville have both a wellhead protection plan and a wellhead protection ordinance.
The water systems serving the largest populations are those in Beloit and Janesville. In addition to the public water systems, numerous private wells provide drinking water to residents not connected to municipal water supplies.
The Janesville Water Utility provides water supply for both public drinking water and for fire protection utilizing eight wells. The water supply system for the city of Janesville includes three booster stations, two water storage reservoirs, and a water tower. According to the city of Janesville, the total pumping capacity of its eight groundwater wells is 29 Mgd (109.8 Mld). Average water usage is about 11 Mgd (41.6 Mld). Accordingly, the excess capacity of the Janesville water supply system is approximately 18 Mgd (68.1 Mld).
Public water supplies within Wisconsin are monitored to ensure public health protection, whereas individual well owners are responsible for monitoring and testing private wells. The public water use index for Rock County is 80 (Table 19.3.7-15), which estimates how many people are served by public water supplies. A number greater than 50 means more people are served by public water versus private wells.
The Janesville water supply is disinfected with chlorine treatment and fluoride added at each pumping station and pumped directly into the distribution system. There are two earth-covered reservoirs for storage as well as a 500,000-gallon (1,892,706-liter) water tower completed in 2007. The wells include four deep wells, approximately 1150 ft. (350 m) deep, and four sand and gravel wells that are 100 to 200 ft. (30.5 to 61 m) deep. The shallow wells have nitrate concentrations that are controlled by blending with water from the deep wells.
In addition to the municipal water utility, groundwater is also withdrawn for agricultural irrigation. The USGS estimates that agricultural crop irrigation is the largest user of groundwater in Rock County, with an estimated usage of 16.2 Mgd (61.3 Mld) (Buchwald, Cheryl A., 2011).
19.3.4.2.3 Facility Water Use
Water use by the SHINE facility is described in Subsection 19.2.3 and is entirely supplied by groundwater from the City of Janesville water supply wells.

Chapter 19 - Environmental Review Water Resources
SHINE Medical Technologies 19.3-80 Rev. 0
19.3.4.3 Water Quality
19.3.4.3.1 Surface Water
Stream water quality generally reflects groundwater characteristics as a result of the groundwater discharge conditions that exist in much of Rock County (Olcott, Perry G., 1968).
Surface water management activities conducted in accordance with Section 305(b) of the Clean Water Act and the Total Daily Maximum Load (TMDL) program provide water quality characterization and are described below.
19.3.4.3.1.1 Water Quality
19.3.4.3.1.1.1 Impaired Waters and Total Maximum Daily Load
The SHINE site is located in the watershed of an unnamed stream located within the Lower Rock River Basin. The unnamed tributary flows into the most downstream segment of the Rock River identified by WDNR for purposes of water quality monitoring and reporting. The Rock River segment extends from the Illinois state boundary upstream approximately 12.4 river mi. (20 river km) to the Janesville wastewater treatment plant. This segment of the Rock River is considered to be impaired due to total suspended solids and total phosphorous (The CADMUS Group, 2011). This segment of the Rock River (Illinois state line to the Janesville wastewater treatment plant) has previously been impaired as a result of mercury and polychlorinated biphenyl (PCB) pollutants; however, those have since been removed. The specific impairments listed for this reach of the Rock River are low dissolved oxygen and degraded habitat. The SHINE site drains into the Rock River through the project area watershed at a point approximately 8.3 mi. (13.4 km) upstream from the Illinois state line.
On a regional and state-wide basis, Wisconsin has identified phosphorus and suspended solids as parameters of concern due to the ability of particulates to adsorb and transport phosphorus. State regulations include specific numerical criteria directed at the control of discharge of phosphorus and suspended solids from development sites. The State’s 303d list of impaired streams developed and updated as required by the Clean Water Act has identified only the Rock River in the vicinity of the SHINE site as an impaired water body.
The TMDL states that industrial facilities operating under a general WPDES permit will be screened to determine if additional requirements might be needed to ensure that the permitted activity is consistent with TMDL goals. Individual permits, if issued, will include limits consistent with approved TMDL wasteload allocations (The CADMUS Group, 2011).
19.3.4.3.1.1.2 Other Water Body Designations
The Lower Rock River is a state-designated Area of Special Natural Resource Interest as a result of it being Natural Heritage Inventory (NHI) water. The NHI program was created by the Wisconsin legislature in 1985.
Bass Creek and Turtle Creek, two tributaries to the Rock River in the vicinity of the site, are designated as Exceptional Resource Waters (Rock County Planning, Economic & Community Development Agency, 2009). An Exceptional Resource Water is defined as a stream or lake that has excellent water quality, high recreational and aesthetic value, high quality fishing, but that

Chapter 19 - Environmental Review Water Resources
SHINE Medical Technologies 19.3-81 Rev. 0
does not rise to the designation of outstanding resource water because it may be impacted by point source pollution or that it may have the potential for future discharge from a small community sewer system. (NR102.11 (1)(d)28).
19.3.4.3.1.2 Project Surface Water Monitoring
Surface water quality monitoring was completed monthly from October 2011 through September 2012. The later part of this period occurred during a widely-recognized severe drought condition in south-central Wisconsin. As a result of these conditions, surface water samples were only collectable at location SW-02 on the unnamed tributary south of the SHINE site. The other two locations were established as opportunistic sampling locations and were observed to be dry on all twelve sampling events during the monitoring period.
Laboratory results for samples collected at monitoring location SW-02 (Figure 19.3.4-4) are presented in Table 19.3.4-7 and field-measured parameters are provided in Table 19.3.4-8. Water was consistently present in the unnamed stream at location SW-02, although it was shallow and slow-flowing. It is believed that the flow was dominated in each sample by base flow contributed from groundwater seepage.
Total phosphorus is a constituent of primary regional concern in surface waters. The phosphorus concentration at SW-02 was generally less than the detection limit (<0.2 mg/L).
Field-measured parameters are summarized in Table 19.3.4-8. No remarkable measurements were documented. As noted above, physical conditions for sampling were less than ideal due to shallow water depth.
19.3.4.3.2 Groundwater
19.3.4.3.2.1 Groundwater Quality
Groundwater quality monitoring was completed in four groundwater wells on a monthly basis from October 2011 through September 2012. The later part of this period occurred during a widely recognized severe drought condition in south-central Wisconsin.
Laboratory results for samples collected at monitoring location SM-GW1A, SM-GW2A, SM-GW3A, and SM-GW4A (Figure 19.3.4-4) are presented in Table 19.3.4-9 and field measured parameters are provided in Table 19.3.4-10. The groundwater elevations were also measured during the sampling events and are summarized in Table 19.3.4-6. Figures 19.3.4-5 through 19.3.4-8 provide groundwater isopleths for the first month of each quarterly monitoring period.
Nitrate impact is a concern in agricultural areas due to the use of fertilizers and the presence of livestock. The nitrate concentrations were consistently above the drinking water standard of 10 mg/l, with all samples found to contain nitrates. The minimum nitrate concentration detected was 13.5 mg/l and the maximum detection of 19.3 mg/l. Fecal coliform and Escherichia coli (E-coli) are common bacterial contaminants, often found in groundwater under the influence of surface water which has come into contact with human or animal waste. The groundwater samples were not found to contain E. coli above the detection limit. Fecal coliform was present in 3 of the 53 samples analyzed, with a maximum detection of 7 colony-forming units per 100 mL (CFU/100mL). Salinity and specific conductance are field parameters used to determine the stability of the groundwater prior to collection of the samples. During the May field effort, these

Chapter 19 - Environmental Review Water Resources
SHINE Medical Technologies 19.3-82 Rev. 0
parameters were elevated over previous months, but returned to earlier levels during the June field event.
19.3.4.3.3 Past, Present and Reasonably Foreseeable Actions
Subsection 19.4.13 provides an analysis of the cumulative effects of the SHINE project in consideration of other past, present and reasonably foreseeable future actions. On-going agricultural uses will place continuing demand on the groundwater supply in the vicinity of the SHINE site.
With respect to other potential uses of water resources, SHINE identified one key off-site activity representing a potential additional demand on water supplies, wastewater treatment, and pollutant loading. Specifically, the lands immediately to the northeast of the SHINE site are zoned for future light industrial development. While designs and development plans have not been prepared for this development area, it is expected that such uses will place additional demands on the City’s water supply and water treatment system. Additionally, construction of these areas will represent a potential additional source of pollutant loading associated with runoff from construction sites.
There are no other identified domestic, municipal, industrial, mining, recreation, navigation, or hydroelectric power uses of any bodies of water or aquifers at distances close enough to affect or be adversely affected by the facilities.

Chapter 19 - Environmental Review Water Resources
SHINE Medical Technologies 19.3-83 Rev. 0
Table 19.3.4-1 Rockford, Illinois Climatic Means and Extremes(Sheet 1 of 2)

Chapter 19 - Environmental Review Water Resources
SHINE Medical Technologies 19.3-84 Rev. 0
Table 19.3.4-1 Rockford, Illinois Climatic Means and Extremes(Sheet 2 of 2)
Table extracted from NCDC, 2011c. "POR" refers to the period of record (years). Refer to that source for explanatory notes.

Chapter 19 - Environmental Review Water Resources
SHINE Medical Technologies 19.3-85 Rev. 0
Table 19.3.4-2 Rainfall Depth–Duration–Frequency Data for Janesville Vicinity
Duration
Rainfall (inches) for Given Recurrence Interval (years)
0.5 1 2 5 10 25 50 100
5-min 0.22 0.27 0.33 0.42 0.50 0.62 0.73 0.85
10-min 0.38 0.47 0.58 0.74 0.88 1.09 1.27 1.48
15-min 0.49 0.61 0.75 0.95 1.13 1.40 1.64 1.91
30-min 0.67 0.83 1.03 1.31 1.55 1.92 2.24 2.61
1-hour 0.86 1.06 1.31 1.66 1.97 2.43 2.85 3.32
2-hour 1.05 1.30 1.61 2.05 2.44 3.00 3.51 4.09
3-hour 1.17 1.44 1.78 2.26 2.69 3.32 3.88 4.52
6-hour 1.17 1.69 2.09 2.65 3.15 3.88 4.55 5.30
12-hour 1.37 1.96 2.42 3.07 3.65 4.51 5.27 6.14
24-hour 1.82 2.25 2.78 3.53 4.2 5.18 6.06 7.06
48-hour 1.97 2.46 3.07 3.96 4.68 5.79 6.75 7.82
72-hour 2.16 2.70 3.38 4.34 5.16 6.34 7.34 8.47
10-day 2.97 3.71 4.72 5.93 6.86 8.21 9.33 10.6
Reference: Huff, Floyd A. and James R. Angel, 1992

Chapter 19 - Environmental Review Water Resources
SHINE Medical Technologies 19.3-86 Rev. 0
Table 19.3.4-3 USGS Streamflow Monitoring Stations in Rock County, Wisconsin
Station NameStation Number
Drainage Area(sq. mi.) Period of Record
Rock River at Newville, WI 5427530 2560 October 2009–present
Rock River at Indianford, WI 5427570 2630 May 1975–2011
Yahara River near Edgerton, WI 5430000 430 October 1916–Nov 1917
Badfish Creek near Cooksville, WI 5430150 82.6 July 1977–present
Yahara River near Fulton, WI 5430175 518 (481.4) (a) July 1977–present
Fischer Creek Tributary at Janesville, WI
5430403 1.42 August 1980–November 1984
Markham Creek at O Leary Road near Janesville, WI
5430446 9.32 June 2004–November 2005
Rock River at Afton, WI 5430500 3340 January 1914–present
Stevens Creek near Footville, WI 5430540 13.9 May 2004–November 2005
Turtle Creek at Carvers Rock Road near Clinton, WI
5431486 199 (196.67) (a) September 1939–present
Turtle Creek near Clinton, WI 5431500 202 September 1939–December 1979
a) Contributing drainage area.
Reference: USGS, 2012b

Chapter 19 - Environmental Review Water Resources
SHINE Medical Technologies 19.3-87 Rev. 0
Table 19.3.4-4 Flood Discharge Frequency Data – Rock River at Afton, Wisconsin
RecordPeriod
Discharge (cfs) for Indicated Recurrence Interval
2-yrs. 5-yrs. 10-yrs. 25-yrs. 50-yrs. 100-yrs. 500-yrs.
1914 – 2000 6,350 8,730 10,200 11,900 13,000 14,100 NA
1914 – 2011 6,460 6,010 10,610 12,530 13,900 15,220 18,150
Reference: Flynn et al., 2006

Chapter 19 - Environmental Review Water Resources
SHINE Medical Technologies 19.3-88 Rev. 0
Table 19.3.4-5 Annual Minimum Low Flows – Rock River at Afton
Reference: USGS, 2012b
30-Day Average Low Flow 7-Day Average Low Flow
Year Flow Rank Year Flow Rank
(cfs) (cfs)
1934 174 1 1934 115 1
1936 193 2 1964 149 2
1964 195 3 1932 152 3
1939 202 4 1936 170 4
1958 203 5 1958 171 5
1932 218 6 1959 179 6
1949 252 7 1939 188 7
1937 257 8 1949 204 8
1959 257 9 1948 225 9
1948 275 10 1946 237 10
1963 282 11 1937 238 11
1931 288 12 1953 242 12
1946 297 13 1931 243 13
1941 308 14 1963 258 14
1953 320 15 1940 260 15
1971 328 16 1941 278 16
1957 333 17 1962 278 17
1940 342 18 1957 285 18
1955 356 19 1955 288 19
1988 361 20 1971 288 20
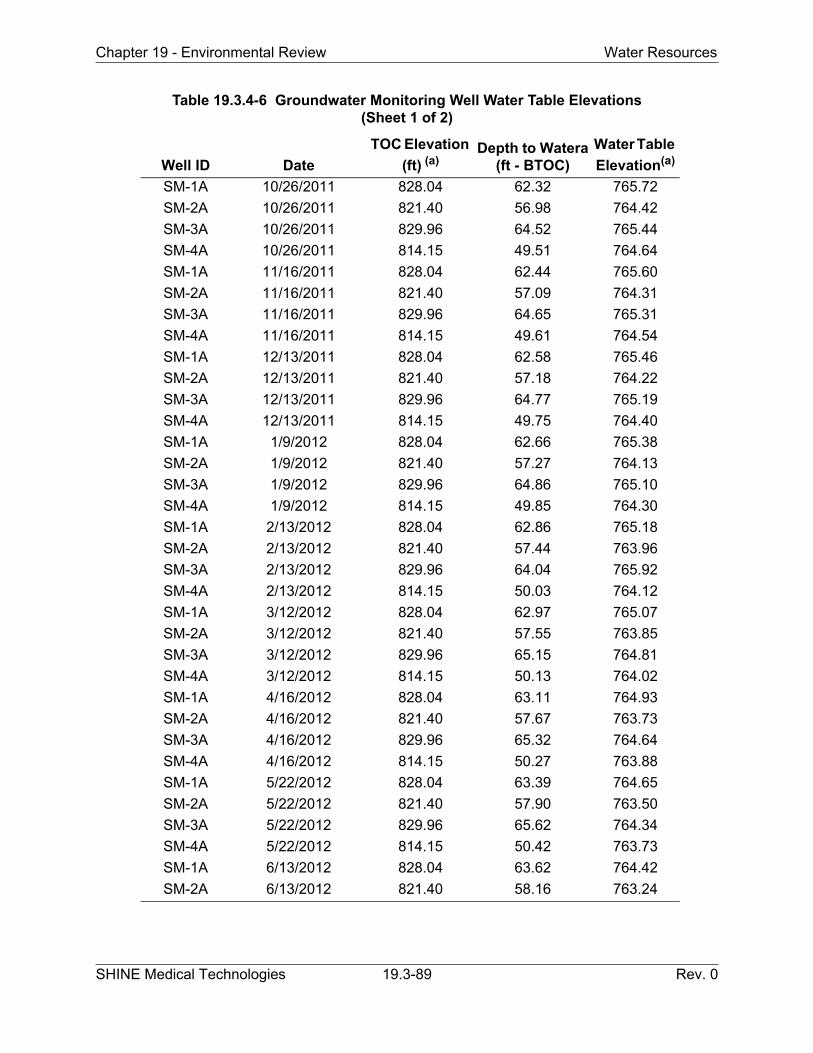
Chapter 19 - Environmental Review Water Resources
SHINE Medical Technologies 19.3-89 Rev. 0
Table 19.3.4-6 Groundwater Monitoring Well Water Table Elevations(Sheet 1 of 2)
Well ID Date
TOC Elevation
(ft) (a)Depth to Watera
(ft - BTOC)
Water Table
Elevation(a)
SM-1A 10/26/2011 828.04 62.32 765.72
SM-2A 10/26/2011 821.40 56.98 764.42
SM-3A 10/26/2011 829.96 64.52 765.44
SM-4A 10/26/2011 814.15 49.51 764.64
SM-1A 11/16/2011 828.04 62.44 765.60
SM-2A 11/16/2011 821.40 57.09 764.31
SM-3A 11/16/2011 829.96 64.65 765.31
SM-4A 11/16/2011 814.15 49.61 764.54
SM-1A 12/13/2011 828.04 62.58 765.46
SM-2A 12/13/2011 821.40 57.18 764.22
SM-3A 12/13/2011 829.96 64.77 765.19
SM-4A 12/13/2011 814.15 49.75 764.40
SM-1A 1/9/2012 828.04 62.66 765.38
SM-2A 1/9/2012 821.40 57.27 764.13
SM-3A 1/9/2012 829.96 64.86 765.10
SM-4A 1/9/2012 814.15 49.85 764.30
SM-1A 2/13/2012 828.04 62.86 765.18
SM-2A 2/13/2012 821.40 57.44 763.96
SM-3A 2/13/2012 829.96 64.04 765.92
SM-4A 2/13/2012 814.15 50.03 764.12
SM-1A 3/12/2012 828.04 62.97 765.07
SM-2A 3/12/2012 821.40 57.55 763.85
SM-3A 3/12/2012 829.96 65.15 764.81
SM-4A 3/12/2012 814.15 50.13 764.02
SM-1A 4/16/2012 828.04 63.11 764.93
SM-2A 4/16/2012 821.40 57.67 763.73
SM-3A 4/16/2012 829.96 65.32 764.64
SM-4A 4/16/2012 814.15 50.27 763.88
SM-1A 5/22/2012 828.04 63.39 764.65
SM-2A 5/22/2012 821.40 57.90 763.50
SM-3A 5/22/2012 829.96 65.62 764.34
SM-4A 5/22/2012 814.15 50.42 763.73
SM-1A 6/13/2012 828.04 63.62 764.42
SM-2A 6/13/2012 821.40 58.16 763.24

Chapter 19 - Environmental Review Water Resources
SHINE Medical Technologies 19.3-90 Rev. 0
Table 19.3.4-6 Groundwater Monitoring Well Water Table Elevations(Sheet 2 of 2)
Well ID Date
TOC Elevation
(ft) (a)Depth to Water
(ft - BTOC)
Water Table
Elevation(a)
SM-3A 6/13/2012 829.96 65.90 764.06
SM-4A 6/13/2012 814.15 50.68 763.47
SM-1A 7/16/2012 828.04 64.30 763.74
SM-2A 7/16/2012 821.40 58.93 762.47
SM-3A 7/16/2012 829.96 66.77 763.19
SM-4A 7/16/2012 814.15 51.29 762.86
SM-1A 8/15/2012 828.04 64.52 763.52
SM-2A 8/15/2012 821.40 59.18 762.22
SM-3A 8/15/2012 829.96 66.84 763.12
SM-4A 8/15/2012 814.15 51.62 762.53
SM-1A 9/18/2012 828.04 64.81 763.23
SM-2A 9/18/2012 821.40 59.44 761.96
SM-3A 9/18/2012 829.96 67.12 762.84
SM-4A 9/18/2012 814.15 51.89 762.26
a) TOC: top of casing; BTOC: below top of casing; all vertical elevations are NAVD 88

Chapter 19 - Environmental Review Water Resources
SHINE Medical Technologies 19.3-91 Rev. 0
Table 19.3.4-7 Surface Water Analytical Results
Parameter Units
Method Detection
Limits
NumberSamplesCollected
NumberDetects Min. Max
Alkalinity, Bicarbonate (CaCO3) mg/L 2.3 17 17 272 301
Alkalinity, Total As CaCO3 mg/L 10 17 17 278 327
Biochemical Oxygen Demand, 5 day mg/L 2.0 17 5 ND 10.4
Carbon Dioxide mg/L 5.0 15 15 9.8 21
Carbon Dioxide (Not Preserved - NP) mg/L 5.0 4 4 20 22
Chemical Oxygen Demand mg/L 11.3 17 9 ND 43.8
Chlorophyll A mg/m3 0.084 17 14 ND 27
Coliform, Fecal CFU/100mL 1 17 14 ND 1300
Coliform, Total MPN/100mL 1 17 17 650 27200
Escherichia Coli MPN/100mL 1 17 17 1 649
Kjeldahl Nitrogen, Total mg/L 0.35 17 10 ND 2.6
Nitrate As Nitrogen mg/L 1.0 17 17 6.4 10.4
Nitrite As Nitrogen mg/L 0.1 17 4 ND 0.26
Nitrogen As Ammonia mg/L 0.25 17 0 ND ND
Orthophosphorus mg/L 0.003 17 17 0.016 0.062
Pheophytin A mg/m3 0.059 17 10 ND 16
Phosphorus mg/L 0.088 17 4 ND 0.42
Silica mg/L 0.134 17 17 11.9 22.9
Total Dissolved Solids (TDS) mg/L 8.7 17 17 378 500
Total Hardness mg/L 0.15 17 17 351 414
Total Organic Nitrogen mg/L 0.35 17 10 ND 2.6
Total Suspended Solids (TSS) mg/L 0.031 17 17 0.8 238
Calcium mg/L 6.6 17 17 79.2 94.6
Chloride mg/L 2.0 17 17 24.5 48.2
Cyanide, Total mg/L 0.0043 17 3 ND 0.0071
Iron mg/L 0.0048 17 17 0.0396 6.52
Lead mg/L 0.0013 17 9 ND 0.0236
Magnesium mg/L 0.0231 17 17 37.3 43.2
Mercury mg/L 0.0001 17 0 ND ND
Potassium mg/L 0.0473 17 17 2.12 3.96
Sodium mg/L 0.0285 17 17 5.57 16
Sulfate mg/L 2.0 17 17 25.4 34.6
Zinc mg/L 0.0016 17 7 ND 0.0322
mg/L - milligrams per literND - not detected above the detection limit
mg/m3 - milligrams per cubic meterMPN/100ml - most probable number per 100 milliliters

Chapter 19 - Environmental Review Water Resources
SHINE Medical Technologies 19.3-92 Rev. 0
Table 19.3.4-8 SHINE Medical Surface Water Field Data - Janesville
Sample ID Date Temp. (°C)pH
(SU)
Specific Conductivity
(µS/cm)
DissolvedOxygen(mg/L)
Turbidity(NTU)
Salinity(%) Color Odor
WaterLevel
(inches) Comments
SM-SW01 10/27/2011 NS NS NS NS NS NS NS NS NS Stream Dry
SM-SW02 10/27/2011 8.19 7.18 600 15.14 1.6 0.00 Clear No Odor 6.0
SM-SW03 10/27/2011 NS NS NS NS NS NS NS NS NS Culvert Dry
SM-SW01 11/16/2011 NS NS NS NS NS NS NS NS NS Stream Dry
SM-SW02 11/16/2011 10.89 6.59 600 10.78 0.0 0.00 Clear No Odor 7.0
SM-SW03 11/16/2011 NS NS NS NS NS NS NS NS NS Culvert Dry
SM-SW01 12/13/2011 NS NS NS NS NS NS NS NS NS Stream Dry
SM-SW02 12/13/2011 6.84 7.46 754 7.72 3.4 0.37 Clear No Odor 8.0
SM-SW03 12/13/2011 NS NS NS NS NS NS NS NS NS Culvert Dry
SM-SW01 1/9/2012 NS NS NS NS NS NS NS NS NS Stream Dry
SM-SW02 1/9/2012 5.84 7.44 770 7.80 -1.6 0.38 Clear No Odor 7.0
SM-SW03 1/9/2012 NS NS NS NS NS NS NS NS NS Culvert Dry
SM-SW01 2/13/2012 NS NS NS NS NS NS NS NS NS Stream Dry
SM-SW02 2/13/2012 5.92 7.47 600 7.93 2.6 0.29 Clear No Odor 3 - 11
SM-SW03 2/13/2012 NS NS NS NS NS NS NS NS NS Culvert Dry
SM-SW01 3/13/2012 NS NS NS NS NS NS NS NS NS Stream Dry
SM-SW02 3/13/2012 8.87 7.41 764 7.98 5.0 0.38 Clear No Odor 4.0
SM-SW03 3/13/2012 NS NS NS NS NS NS NS NS NS Culvert Dry
SM-SW01 4/16/2012 NS NS NS NS NS NS NS NS NS Stream Dry
SM-SW02 4/16/2012 10.42 7.54 645 7.14 1.3 0.32 Clear No Odor 8.0
SM-SW03 4/16/2012 NS NS NS NS NS NS NS NS NS Culvert Dry
SM-SW01 5/22/2012 NS NS NS NS NS NS NS NS NS Stream Dry
SM-SW02 5/22/2012 11.55 7.43 1496 8.05 34.7 0.76* Clear No Odor 6.0
SM-SW03 5/22/2012 NS NS NS NS NS NS NS NS NS Culvert Dry
SM-SW01 6/12/2012 NS NS NS NS NS NS NS NS NS Stream Dry
SM-SW02 6/12/2012 15.67 7.53 728 8.02 21.9 0.36 Clear No Odor 5.0
SM-SW03 6/12/2012 NS NS NS NS NS NS NS NS NS Culvert Dry
SM-SW01 7/16/2012 NS NS NS NS NS NS NS NS NS Stream Dry
SM-SW02 7/16/2012 21.69 6.79 757 6.18 6.0 0.37 Clear No Odor 6.0
SM-SW03 7/16/2012 NS NS NS NS NS NS NS NS NS Culvert Dry
SM-SW01 8/15/2012 NS NS NS NS NS NS NS NS NS Stream Dry
SM-SW02 8/15/2012 17.33 7.44 748 4.73 16.0 0.37 Clear No Odor 7.0
SM-SW03 8/15/2012 NS NS NS NS NS NS NS NS NS Culvert Dry
SM-SW01 9/18/2012 NS NS NS NS NS NS NS NS NS Culvert Dry
SM-SW02 9/18/2012 13.83 6.99 797 7.31 2.0 0.39 Clear No Odor 6.0
SM-SW03 9/18/2012 NS NS NS NS NS NS NS NS NS Culvert Dry

Chapter 19 - Environmental Review Water Resources
SHINE Medical Technologies 19.3-93 Rev. 0
Table 19.3.4-9 Groundwater Analytical Results for Monitoring Wells
Parameter Units
Method Detection
Limits
NumberSamplesCollected
NumberDetects Minimum Maximum
Alkalinity, Bicarbonate (CaCO3) mg/L 2.3 53 53 231 302
Alkalinity, Total As CaCO3 mg/L 10 53 53 248 612
Biochemical Oxygen Demand, 5 day mg/L 2 53 0 ND ND
Carbon Dioxide mg/L 5 48 48 18 31
Carbon Dioxide (Not Preserved - NP) mg/L 5 10 10 20 30
Chemical Oxygen Demand mg/L 11.3 53 15 ND 89.1
Chlorophyll A mg/m3 0.084 53 7 ND 1.6
Coliform, Fecal CFU/100mL 1 53 3 ND 7
Coliform, Total MPN/100mL 1 53 37 ND 2419
Escherichia Coli MPN/100mL 1 53 0 ND ND
Kjeldahl Nitrogen, Total mg/L 0.35 53 8 ND 0.46
Nitrate As Nitrogen mg/L 1 53 53 13.5 22.2
Nitrite As Nitrogen mg/L 0.1 53 0 ND ND
Nitrogen As Ammonia mg/L 0.25 53 1 ND 0.52
Orthophosphorus mg/L 0.003 53 38 ND 0.086
Pheophytin A mg/m3 0.059 53 7 ND 2.2
Phosphorus mg/L 0.088 53 1 ND 0.26
Silica mg/L 134 53 53 13.9 18.8
Total Dissolved Solids (TDS) mg/L 8.7 53 53 340 462
Total Hardness mg/L 150 53 53 330 565
Total Organic Nitrogen mg/L 0.35 53 6 ND 0.46
Total Suspended Solids (TSS) mg/L 0.031 53 53 1 389
Calcium mg/L 6.6 53 53 74.6 126
Chloride mg/L 2 53 53 16.6 29.2
Cyanide, Total mg/L 0.0061 53 8 ND 0.018
Iron mg/L 4.8 53 53 0.044 3.04
Lead mg/L 1.3 53 36 ND 0.0042
Magnesium mg/L 23.1 53 53 33.6 60.8
Mercury mg/L 0.0001 53 0 ND ND
Potassium mg/L 47.3 53 53 0.449 2.96
Sodium mg/L 28.5 53 53 2.26 9.15
Sulfate mg/L 2 53 53 10.1 20.3
Zinc mg/L 0.0016 53 28 ND 0.0302

Chapter 19 - Environmental Review Water Resources
SHINE Medical Technologies 19.3-94 Rev. 0
Table 19.3.4-10 SHINE Medical Groundwater Field Data – Janesville(Sheet 1 of 2)
Sample ID Date
WaterLevel
(ft BTOC)Temp.
(°C)
pH(standard
units)
SpecificConductivity
(µS/cm)
DissolvedOxygen(mg/L)
ORP(mV)
Turbidity(NTU)
Salinity(%) Color/Odor
SM-GW1A 10/26/2011 62.38 10.70 7.30 705 10.70 125.2 27.0 0.35 Clear/No Odor
SM-GW2A 10/26/2011 57.02 10.64 7.30 673 10.94 134.7 5.7 0.33 Clear/No Odor
SM-GW3A 10/27/2011 64.59 11.60 7.23 703 10.14 104.9 6.0 0.35 Clear/No Odor
SM-GW4A 10/27/2011 49.55 10.39 7.21 724 11.19 107.9 8.9 0.36 Clear/No Odor
SM-GW1A 11/16/2011 62.45 10.11 7.22 711 10.44 133.7 3.7 0.35 Clear/No Odor
SM-GW2A 11/16/2011 57.09 11.23 7.20 678 10.74 116.4 8.9 0.33 Clear/No Odor
SM-GW3A 11/17/2011 64.67 9.35 7.24 701 10.03 122.5 -0.8 0.34 Clear/No Odor
SM-GW4A 11/17/2011 49.65 9.03 7.15 745 11.06 135.6 -0.8 0.37 Clear/No Odor
SM-GW1A 12/13/2011 62.59 10.43 7.21 700 10.44 150.3 32.7 0.35 Clear/No Odor
SM-GW2A 12/13/2011 57.22 10.33 7.23 698 9.78 123.3 5.6 0.34 Clear/No Odor
SM-GW3A 12/19/2011 64.81 11.14 7.22 733 11.08 120.6 5.0 0.36 Clear/No Odor
SM-GW4A 12/19/2011 49.78 10.17 7.18 763 11.73 113.3 18.3 0.37 Clear/No Odor
SM-GW1A 1/10/2012 62.69 8.19 7.28 693 11.60 113.6 16.6 0.34 Clear/No Odor
SM-GW2A 1/10/2012 57.29 8.50 7.30 674 11.72 120.9 0.2 0.33 Clear/No Odor
SM-GW3A 1/10/2012 64.92 9.66 7.26 719 11.25 120.6 3.7 0.35 Clear/No Odor
SM-GW4A 1/10/2012 49.85 7.69 7.19 737 11.45 133.8 6.0 0.36 Clear/No Odor
SM-GW1A 2/14/2012 62.88 8.41 7.22 711 11.70 141.0 35.5 0.35 Slightly Turbid/No Odor
SM-GW2A 2/14/2012 57.48 8.63 7.30 673 11.95 112.8 0.7 0.33 Clear/No Odor
SM-GW3A 2/14/2012 64.04 8.23 7.24 723 10.98 144.4 4.6 0.35 Clear/No Odor
SM-GW4A 2/14/2012 50.04 7.79 7.17 729 11.85 180.2 6.5 0.36 Clear/No Odor
SM-GW1A 3/12/2012 62.96 11.54 7.13 714 10.02 122.9 28.9 0.35 Clear/No Odor
SM-GW2A 3/12/2012 57.54 11.91 7.19 680 10.43 99.7 1.5 0.33 Clear/No Odor
SM-GW3A 3/12/2012 65.16 12.25 7.11 726 9.72 107.5 0.3 0.36 Clear/No Odor
SM-GW4A 3/12/2012 50.13 11.80 7.02 556 10.16 169.8 9.1 0.36 Light Tan/No Odor
SM-GW1A 4/16/2012 63.14 10.87 7.35 586 10.10 121.5 32.6 0.29 Light Brown/No Odor
SM-GW2A 4/16/2012 57.68 10.54 7.40 580 10.62 131.0 4.1 0.28 Clear/No Odor
SM-GW3A 4/17/2012 63.35 13.46 7.06 729 10.13 155.4 -2.3 0.36 Clear/No Odor
SM-GW4A 4/17/2012 50.31 14.48 7.01 744 9.85 198.5 -4.1 0.37 Clear/No Odor
SM-GW1A 5/23/2012 63.44 15.97 6.62 1320 10.03 332.4 0.5 0.67(a) Clear/No Odor
SM-GW2A 5/23/2012 57.90 18.00 6.66 1282 10.09 414.4 3.1 0.64(a) Clear/No Odor
SM-GW3A 5/22/2012 65.66 14.77 6.20 1369 10.07 416.4 2.0 0.69(a) Clear/No Odor
SM-GW4A 5/22/2012 50.44 13.91 6.73 1370 10.47 319.6 1.3 0.69(a) Clear/No Odor

Chapter 19 - Environmental Review Water Resources
SHINE Medical Technologies 19.3-95 Rev. 0
Table 19.3.4-10 SHINE Medical Groundwater Field Data – Janesville(Sheet 2 of 2)
Sample ID Date
WaterLevel
(ft BTOC)Temp.
(°C)
pH(standard
units)
SpecificConductivity
(µS/cm)
DissolvedOxygen(mg/L)
ORP(mV)
Turbidity(NTU)
Salinity(%) Color/Odor
SM-GW1A 6/13/2012 63.66 13.04 7.21 646 11.68 202.6 6.6 0.32 Clear/No Odor
SM-GW2A 6/12/2012 58.22 14.14 7.24 647 11.68 194.1 0.4 0.32 Clear/No Odor
SM-GW3A 6/13/2012 65.94 12.44 7.17 687 11.72 200.0 0.0 0.34 Clear/No Odor
SM-GW4A 6/12/2012 50.67 13.00 7.17 700 11.55 217.1 24.1 0.34 Clear/No Odor
SM-GW1A 7/16/2012 64.36 17.85 5.42 652 11.44 618.5 103.7 0.32 Light Brown/No Odor
SM-GW2A 7/17/2012 58.97 19.11 6.31 779 11.68 549.5 131.2 0.38 Light Brown/No Odor
SM-GW3A 7/17/2012 66.77 13.49 4.52 747 12.47 574.4 10.7 0.37 Light Brown/No Odor
SM-GW4A 7/16/2012 51.30 20.33 6.00 771 13.39 549.1 81.6 0.38 Light Brown/No Odor
SM-GW1A 8/15/2012 64.55 15.56 7.29 635 10.01 122.3 3.9 0.31 Clear/No Odor
SM-GW2A 8/16/2012 59.20 14.79 7.34 645 10.48 147.1 6.5 0.32 Clear/No Odor
SM-GW3A 8/16/2012 66.87 13.44 7.33 704 10.25 147.1 3.7 0.35 Clear/No Odor
SM-GW4A 8/15/2012 51.65 14.00 7.27 672 10.35 122.2 0.9 0.33 Clear/No Odor
SM-GW1A 9/19/2012 64.81 12.81 7.40 710 10.52 201.0 7.7 0.35 Clear/No Odor
SM-GW2A 9/18/2012 59.46 14.11 5.78 721 11.01 339.3 0.3 0.35 Clear/No Odor
SM-GW3A 9/18/2012 67.14 13.09 6.71 809 10.59 212.3 0.3 0.40 Clear/No Odor
SM-GW4A 9/19/2012 51.9 13.89 7.16 781 10.43 260.1 7.4 0.38 Clear/No Odor
a) meter malfunctioningµS/cm - micro Siemens per centimetermV - millivoltNTU - nephelometric turbidity unit

Chapter 19 - Environmental Review Ecological Resources
SHINE Medical Technologies 19.3-96 Rev. 0
19.3.5 ECOLOGICAL RESOURCES
This subsection provides a description and characterization of the terrestrial and aquatic ecosystems potentially affected by the construction and operation of the SHINE facility. Consultations with the WDNR (WDNR, 2012c) and U.S. Fish and Wildlife Service (USFWS) (USFWS, 2012) were initiated for information regarding ecological resources near the SHINE site. This consultation process was used to obtain agency input regarding threatened and endangered species, sensitive habitats, commercial and recreational species, and other ecological characteristics for the site and near-site areas. Ecological resources described herein are based on recorded information provided by resource agencies and supplemental quarterly field surveys conducted in 2011 and 2012.
19.3.5.1 Off-Site Areas
Ecoregions are geographical areas within which the biotic and abiotic components of terrestrial and aquatic ecosystems exhibit relatively homogenous patterns in comparison to that of other areas. Ecoregions serve as a spatial framework for the research, assessment, monitoring, and management of ecosystems and ecosystem components. Wisconsin contains 27 Level IV ecoregions nested within six larger Level III regions that also occupy portions of Illinois and other adjoining states (Omernik et al., 2008). Three Level III ecoregions have been identified and are further divided into several other Level IV ecoregions in southern Wisconsin and northern Illinois as depicted in Figure 19.3.5-1. The Rock River Drift Plain and the Southeastern Wisconsin Savannah and Till Plain are the only two ecoregions mapped within Rock County. The only ecoregion near the site (5-mi. [8-km] radius) is the Rock River Drift Plain as part of the larger Southeastern Wisconsin Till Plains ecoregion. Ecoregions are mapped by the USEPA (USEPA, 2012d) and are described in Wisconsin and Illinois by Omernik et al. (Omernik et al., 2008) and Woods et al. (Woods et al., 2006), respectively.
The SHINE site is located within the Rock River Drift Plain as depicted in Figure 19.3.5-1. The Rock River Drift Plain is located in both southern Wisconsin and northern Illinois. This Level IV ecoregion is characterized by a landscape containing numerous small creeks, a greater stream density, and fewer lakes than in ecoregions to the north and east. Steeper topography and broad outwash plains with loamy and sandy soils characterize this ecoregion (Omernik et al., 2008). The soils of the Rock River Drift Plain have developed primarily from glacial till, outwash deposits, loess, or alluvium. Oak savanna, prairie, and to a lesser extent, forest (primarily on fire-protected dissected uplands and along water courses) were the predominant vegetative communities prior to European settlement. Today, more than half of the Rock River Drift Plain is cropland. Although forage crops and feed grains harvested to support dairy operations and livestock are most common, cash-grain farming is also important (Woods et al., 2006).
19.3.5.2 Site and Near Site Areas
The SHINE site consists of a 91.27-ac. (36.94 ha) parcel located south of Janesville, Wisconsin, as depicted in Figure 19.3.1-1. Within the site boundary, 91.09 ac. (36.86 ha), or 99.8 percent of the site, consists of agriculture/cultivated crops (see Table 19.3.1-1). The remaining 0.18 ac. (0.07 ha) consists of developed open space as described in Subsection 19.3.1. Because of continuous land disturbance associated with agricultural practices, the site is devoid of natural landscapes such as forest, wetlands, grasslands, prairie, old field, and other natural plant communities. In addition, there are no ephemeral, intermittent, or perennial streams and associated riparian zones located within the boundaries of the SHINE site.

Chapter 19 - Environmental Review Ecological Resources
SHINE Medical Technologies 19.3-97 Rev. 0
The entire 5-mi. (8-km) radius of the site center point is contained within the Rock River Drift Plain Level IV ecoregion as depicted in Figure 19.3.5-1. The Rock River Drift Plain Level IV ecoregion is described in Subsection 19.3.5.1.
Land cover near the site (5-mi. [8-km] radius) is illustrated in Figure 19.3.1-2 and summarized in Table 19.3.1-1. The vast majority of the area near the site is used for agricultural production (see Table 19.3.1-1). Cultivated crops make up 25,236 ac. (10,213 ha), or more than 50 percent of the area near the site. Corn, soybeans, and winter wheat are commonly grown. An additional 5896 ac. (2386 ha), or approximately 12 percent near the site, is used for pasture or hay production. Altogether, agricultural activities make up 61.9 percent of the area near the site.
Developed lands account for 11,861 ac. (4800 ha), or nearly 24 percent near the site (see Table 19.3.1-1). This includes developed lands mapped as open space, low intensity, medium intensity, and high intensity. Developed lands are further described in Subsection 19.3.1.
Forested resources account for 3367 ac. (1363 ha), or less than 7 percent, near the site (see Table 19.3.1-1). Forested resources primarily consist of deciduous forest but also include minor amounts of evergreen and mixed forest. Because most of the natural communities near the site have been converted to agriculture, forested resources are concentrated in riparian corridors along the Rock River and its associated tributary streams.
Mapped wetland land cover is sparse near the SHINE site as indicated in Table 19.3.1-1. Wetlands mapped near the site include 722 ac. (292 ha) of woody wetlands and 787 ac. (318 ha) of emergent herbaceous wetlands. Together, wetland cover types account for 3 percent of the land cover near the site. A total of 796 ac. (322 ha), or close to 2 percent, near the site is mapped as open water.
Grassland resources account for 1049 ac. (425 ha), or just over 2 percent, near the site. Shrub/scrub and barren lands each account for 1 percent or less near the site (see Table 19.3.1-1).
19.3.5.3 History
The SHINE site is located within the Southeastern Wisconsin Till Plains where, at the time of European settlement, forests were common on moraines and along watercourses whereas prairie occurred on level to rolling uplands (Woods et al., 2006). According to Will-Wolf and Montague (Will-Wolf, S, and T.C. Montague, 1994), prairie covered approximately 50 percent of southern Wisconsin prior to European settlement. However, given the intensity of agricultural land uses, a very small fraction of the original tallgrass prairie remains in Wisconsin (Higgins et al., 2001; Smith, Daryl D., 1990).
Conversion of native plant communities to agriculture in the Midwest took place primarily in the
19th Century and was accelerated in 1837 by John Deere’s invention of the self-scouring steel plow (Robertson, Ken, 2008). Conversion to agriculture not only changed the composition of plant communities, but also resulted in the draining of wetlands and the channelization of small streams to accommodate row crop production. Lands of the SHINE site have been in continuous agricultural production for several decades.

Chapter 19 - Environmental Review Ecological Resources
SHINE Medical Technologies 19.3-98 Rev. 0
19.3.5.4 Places and Entities of Special Interest
This subsection provides information relative to the ecological resources of special interest near the SHINE site. The occurrence and characteristics of these features is developed as a result of quarterly field studies on and immediately surrounding the site, general field reconnaissance, and from agency correspondence.
19.3.5.4.1 Communities and Habitats of Special Interest
Ecological communities of special interest near the SHINE site include wetlands and terrestrial communities of special interest identified by WDNR. As described in Subsection 19.3.5.6, mapped wetland land cover is sparse near the SHINE site as indicated in Table 19.3.1-1. Wetlands mapped near the site include 722 ac. (292 ha) of woody wetlands and 787 ac. (318 ha) of emergent herbaceous wetlands. Together, wetland cover types account for 3 percent of the land cover within the 5-mi. (8 km) radius. There are no wetlands on-site.
As part of a WDNR endangered resources review letter, six communities of special interest were identified near the SHINE site (WDNR, 2012c):
• Dry prairie, • Dry-mesic prairie, • Mesic prairie, • Southern dry-mesic forest, • Southern mesic forest, and • Wet prairie.
Dry Prairie. This dry grassland community usually occurs on steep south or west facing slopes or at the summits of river bluffs with sandstone or dolomite bedrock near the surface. Short to medium-sized prairie grasses such as little bluestem (Schizachyrium scoparium), side-oats grama (Bouteloua curtipendula), hairy grama (Bouteloua hirsuta), and prairie dropseed (Sporobolus heterolepis) are the dominants in this community. Common shrubs and forbs include lead plant (Amorpha canescens), silky aster (Aster sericeus), flowering spurge (Euphorbia corollata), purple prairie-clover (Dalea purpurea), cylindrical blazing-star (Liatris cylindracea), and gray goldenrod (Solidago nemoralis). Stands on knolls in the Kettle Moraine region of southeastern Wisconsin, and on bluffs along the St. Croix River on the Minnesota- Wisconsin border, occur on gravelly substrates and may warrant recognition as distinctive subtypes of “Dry Prairie.”
Dry Mesic Prairie. This grassland community was common in parts of southern Wisconsin, occurring on slightly less droughty sites than dry prairie. Today, this community type is rare because of conversion to agricultural uses or the encroachment of woody vegetation due to the lack of wildfire. Dry-mesic prairie has many of the same grasses as dry prairie, but taller species such as big bluestem (Andropogon gerardii) and Indian-grass (Sorghastrum nutans) dominate. Needle grass (Stipa spartea) and prairie drop-seed may also be present. The herb component is more diverse than in dry prairies, as it may include many species that occur in both dry and mesic prairies. Composites and legumes are particularly well-represented in relatively undisturbed stands.
Mesic Prairie. Although common historically, this type is extremely rare today. This grassland community occurs on rich, moist, well-drained sites, usually on level or gently rolling glacial

Chapter 19 - Environmental Review Ecological Resources
SHINE Medical Technologies 19.3-99 Rev. 0
topography. The dominant plant is the tall grass, big bluestem. The grasses little bluestem, Indian grass, needle grass, prairie dropseed, and switch grass (Panicum virgatum) are also frequent. The forb layer is diverse in the number, size, and physiognomy of the species. Common taxa include the prairie docks (Silphium spp.), lead plant, heath aster (Aster ericoides), smooth aster (Aster laevis), prairie coreopsis (Coreopsis palmata), prairie sunflower (Helianthus pauciflorus), rattlesnake-master (Eryngium yuccifolium), flowering spurge, bee-balm (Monarda fistulosa), prairie coneflower (Echinacea pallida), and spiderwort (Tradescantia spp.).
Southern Dry-mesic Forest. Red oak is a common dominant tree of this upland forest community type. White oak (Quercus alba), basswood (Tilia americana), sugar maple (Acer saccharum), red maple (Acer rubrum), white ash (Fraxinus americana), shagbark hickory (Carya ovata), and black cherry (Prunus serotina) are also important. The herbaceous understory flora is diverse and includes many species listed under southern dry forest plus jack-in-the-pulpit (Arisaema triphyllum), enchanter's-nightshade (Circaea spp.), large-flowered bellwort (Uvularia grandiflora), interrupted fern (Osmunda claytoniana), lady fern (Athyrium filix-femina), tick-trefoils (Desmodium spp.), and hog peanut (Amphicarpaea bracteata).
Southern Mesic Forest. This upland forest community occurs on rich, well-drained loamy soils, mostly on glacial till plains or loess-capped sites south of the tension zone. The dominant tree species is sugar maple, but basswood, and near Lake Michigan, American beech may be co-dominant. Many other trees are found in these forests, including those of the walnut family, ironwood (Carpinus caroliniana), red oak (Quercus rubra), red maple, white ash, and slippery elm (Ulmus rubra). The understory is typically open, or sometimes brushy with species of gooseberry (Ribes spp.) on sites with a history of grazing, and supports fine spring ephemeral displays. Characteristic herbs are spring-beauty (Claytonia spp.), trout-lilies (Erythronium spp.), trilliums (Trillium spp.), violets (Viola spp.), bloodroot (Sanguinaria canadensis), blue cohosh (Caulophyllum thalictroides), mayapple (Podophyllum peltatum), and Virginia waterleaf (Hydrophyllum virginianum).
Wet Prairie. This is a rather variable tall grassland community that shares characteristics of prairies, southern sedge meadow, calcareous fen and even emergent aquatic communities. The wet prairies’ more wetland-like character can mean that sometimes very few obligate prairie species are present. In wet prairie the dominant graminoids may include Canada bluejoint grass (Calamagrostis canadensis), cordgrass (Spartina spp.), and marsh wild- timothy (Muhlenbergia glomerata), plus several sedge species including lake sedge (Carex spp.), water sedge (Carex aquatilis), and woolly sedge (Carex spp.). Many of the herbs are shared with the wet-mesic prairies, but the following species are often prevalent: New England aster (Aster novae-angliae), swamp thistle (Cirsium muticum), northern bedstraw (Galium boreale), yellow stargrass (Hypoxis hirsuta), cowbane (Oxypolis rigidior), tall meadow-rue (Thalictrum dasycarpum), golden Alexander (Zizia spp.), and mountain-mint (Pycnanthemum spp.).
A total of ten state designated natural areas are located in Rock County (Figure 19.3.5-2). However, only Rock River Prairie is located within 5-mi (8-km) of the SHINE site. Rock River Prairie is a 37-ac. (14 ha) dry prairie situated on the rolling terrace above the Rock River and contains large populations of prairie forbs and grasses including several rare and threatened plants. The prairie supports over 50 native prairie species including pasque flower (Anemone patens), cream wild indigo (Baptisia bracteata), rock sandwort (Arenaria spp.), and prairie gentian (Gentiana puberulenta). Dominant grasses include little blue-stem and side-oats grama with prairie drop-seed. More common forbs present include silky aster, shooting-star (Dodecatheon spp.), prairie-smoke (Anemone patens), bird’s-foot violet (Viola pedata), smooth

Chapter 19 - Environmental Review Ecological Resources
SHINE Medical Technologies 19.3-100 Rev. 0
yellow flax (Linum spp.), fringed puccoon (Lithospermum incisum), and spiderwort. The prairie also contains rare plants including one of Wisconsin’s largest populations of the state-endangered wild petunia (Ruellia humilis). Other rare plants include prairie bush-clover (Lespedeza leptostachya), woolly milkweed (Acerates lanuginosa) and prairie thistle (Cirsium spp.). The rare prairie false dandelion (Microseris cuspidata) was recently rediscovered at the site after the reintroduction of fire and other management activities. Rock River Prairie is owned by the WDNR and was designated a State Natural Area in 1999 (WDNR, 2012d).
Given the landscape position of the SHINE site, it is likely that the SHINE site may have been prairie habitat before its conversion to agriculture. However, because of the complete conversion of the lands of the SHINE site and its immediate environs to cultivated fields or other developed uses, none of the above habitat types are present either on-site or in adjacent off-site areas.
19.3.5.4.2 Other Sensitive or Susceptible Areas
In addition to the state-listed natural areas described above, Happy Hollow County Park, located southwest of the site is a park with natural features of special interest (see Figure 19.3.5-2). The park consists of 192 ac. (77 ha) that are located along the Rock River. The park supports a wide variety of habitats including wetlands, grasslands, and forested areas. It is of interest for bird watching and supports an abundance of bird species such as eagles, hawks, owls, kingfishers, herons, sea gulls and a variety of song birds. The park also has a trail system that is designated for both hiking and equestrian use (Rock County, 2012c).
19.3.5.4.3 Important Ecological Systems
Rock County is located along a principal route of the Mississippi Flyway (Bird Nature, 2012). As such, natural habitats along the Rock River and other areas are particularly useful to migrating birds for resting, feeding and foraging. Unbroken forested lands and riparian habitats are particularly recognized for their value in providing support to neotropical migratory birds both during migration and as habitats for nesting and nursery areas. Such areas however, are largely confined to the lands west of US 51 along the Rock River. Habitats of the SHINE site and adjacent lands are dominated by agricultural and developed uses and are not considered to be high value or important ecological systems.
19.3.5.5 Aquatic Communities and Potentially Affected Water Bodies
There are no aquatic resources or water bodies present on the SHINE site. This subsection therefore, provides information that describes the aquatic communities and potentially affected water bodies within the 5-mi. (8-km) area around the SHINE site.
Available mapping indicates that the majority of site runoff flows southwest toward the Rock River. However, because of the high infiltration rate of the soils near the SHINE site, no organized stream channel and associated aquatic habitats are present. Sampling was performed within an unnamed stream located south of the site in order to characterize aquatic biota near the SHINE site.
Aquatic habitats near the SHINE site include those associated with the Rock River and an unnamed stream which is a tributary to the Rock River. The unnamed stream is located approximately 1.6 mi. (2.6 km) south of the site, while the Rock River is 1.9 mi. (3.1 km)

Chapter 19 - Environmental Review Ecological Resources
SHINE Medical Technologies 19.3-101 Rev. 0
southwest of the site. The SHINE site and immediate off-site areas drain south and west towards the Rock River and its tributaries. Local streams have substrates consisting primarily of sand, gravel, cobble, and occasional boulders.
Surveys of adult and juvenile fish in the Rock River have been compiled by the WDNR and are accessible in a fish mapping database (WDNR, 2012e). Table 19.3.5-1 summarizes Rock River fish species from the WDNR database collected within Rock County since the year 1980. In order to further characterize the aquatic biological communities of tributaries potentially draining the site, fish surveys and benthic macroinvertebrate surveys were conducted within the unnamed stream south of the site (Figure 19.3.5-3). Fish surveys were conducted utilizing a seine on a quarterly basis (October 2011, January 2012, April 2012, and July 2012). Macroinvertebrate surveys were conducted in October 2011 and April 2012 by use of a kicknet in representative in-stream habitats. Aquatic location 2 was the only location along the unnamed stream that contained water. Therefore, no samples were collected from aquatic location 1. Six sweeps or kicks collected at aquatic location 2 were composited, preserved using 5 percent buffered formaldehyde, and transported to AMEC’s St. Louis laboratory for analysis.
WDNR’s fish mapping database indicate that a total of 21 distinct species have been collected in the Rock River by electrofishing since 1980 (see Table 19.3.5-1). Results reflect a fish community typical of flowing river habitats. Representative species of the Rock River near the SHINE site include smallmouth bass (Micropterus dolomieu), northern pike (Esox lucius), rock bass (Ambloplites rupestris), freshwater drum (Aplodinotus grunniens), northern hogsucker (Hypentelium nigricans), white bass (Morone chrysops), channel catfish (Ictalurus punctatus), bigmouth buffalo (Ictiobus cyprinellus), shorthead redhorse (Moxostoma macrolepidotum), white sucker (Catostomus commersonii), spotfin shiner (Cyprinella spiloptera), emerald shiner (Notropis atherinoides), spottail shiner (Notropis hudsonius), logperch (Percina caprodes), sauger (Sander canadensis), and walleye (Sander vitreus). Other species that are more characteristic of slow-moving/backwater included bowfin (Amia calva), common carp (Cyprinus carpio), pumpkinseed (Lepomis gibbosus), bluegill (Lepomis macrochirus), and black crappie (Pomoxis nigromaculatus).
Only two species were collected from the unnamed tributary of the Rock River, located south of the site. Species present in this small stream included brook stickleback (Culaea inconstans) and green sunfish (Lepomis cyanellus). This stream is the closest freshwater body to the SHINE site and is characterized as having a channel that is 3 to 4 ft. (0.9 to 1.2 m) wide at the ordinary high water mark, and having a depth of up to approximately 1 ft. (0.3 m) deep. Given its small size, fish species diversity was expected to be low.
Benthic macroinvertebrate collections from the unnamed stream south of the site contained a total of 252 specimens representing 12 distinct taxa in the fall 2011 samples, and a total of 284 specimens representing 9 distinct taxa in the spring 2012 samples (Table 19.3.5-2). Low species diversity is likely due to the very small and intermittent nature of this stream. Crustaceans, particularly the amphipod Gammarus, dominated both samples representing 79 percent of the fall 2011 sample and 94 percent of the spring 2012 sample. All other taxa collected in the benthic macroinvertebrate samples made up less that 5 percent of the samples. Shannon diversity for fall 2011 and spring 2012 was 0.96 and 0.35 (respectively). Biotic index values for fall 2011 and spring 2012 were 6.29 and 6.69, respectively (see Table 19.3.5-2). These values indicate the presence of a moderately tolerant benthic invertebrate community.

Chapter 19 - Environmental Review Ecological Resources
SHINE Medical Technologies 19.3-102 Rev. 0
19.3.5.6 Wetlands
Wetlands are transitional ecosystems between aquatic and terrestrial systems where the water table is usually at or near the surface or the land is covered by shallow water (Cowardin et al., 1979). Wetlands vary widely because of regional and local differences in soils, topography, climate, hydrology, water chemistry, vegetation, and other factors, including human disturbance. For regulatory purposes under the Clean Water Act, the term wetland means "...those areas that are inundated or saturated by surface or groundwater at a frequency and duration sufficient to support, and that under normal circumstances do support, a prevalence of vegetation typically adapted for life in saturated soil conditions. Wetlands generally include swamps, marshes, bogs and similar areas" (40 CFR 230.3(t)). Jurisdictional wetlands are regulated by the U.S. Army Corps of Engineers (USACE) and display characteristic hydrology, soils, and hydrophytic plants.
A wetland delineation survey was performed at the SHINE site in October 2011 in accordance with Regional Supplement to the Corps of Engineers Wetland Delineation Manual: Northcentral and Northeast Region (USACE, 2009). No jurisdictional wetlands were identified within the site boundary.
19.3.5.7 Terrestrial Communities
This subsection provides a description and characterization of terrestrial communities identified on the SHINE site and the surrounding area. Quarterly pedestrian and roadside surveys were conducted to identify and characterize plant and animal species that occur on site and those that are characteristic of the area.
19.3.5.7.1 Plant Communities
Characterization of terrestrial plant communities on and in proximity to the SHINE site is based on records review (recorded distributional records), agency consultation with WDNR and USFWS, and field studies. Investigative methods included vegetative land cover type mapping and field confirmation, general site reconnaissance, and pedestrian surveys. Pedestrian surveys were performed during the growing season in the fall 2011 and spring and summer 2012 to identify and record terrestrial plant species for a qualitative inventory of the flora on and in proximity to the site. Supplemental field studies are used in part to characterize the assemblage of terrestrial plant species and to aid in the identification of any federally listed threatened or endangered species or Wisconsin listed threatened, endangered or special concern species potentially occurring within and in proximity to the SHINE property boundary.
Most of the site is used for cultivated crops, with generally opportunistic weedy species encountered in-between planted fields and along the west border with US 51 (Figure 19.3.5-3). Cultivated crops on the SHINE site include corn (Zea mays), soybean (Glycine max), and winter wheat (Triticum aestivum). Weedy species encountered on-site include fescue (Festuca sp.), green foxtail (Setaria viridis), Queen Anne’s lace (Daucus carota), and common dandelion (Taraxacum officinale).
As depicted in Figure 19.3.1-2, the land cover types found in proximity to the site are mainly developed-open space, developed-low, medium, and high intensity, and cultivated crops/pasture/hay, with a small area south of the site combining deciduous forest, scrub shrub, grassland herbaceous, and woody wetlands. Table 19.3.5-3 lists the terrestrial plants observed within these land cover areas from pedestrian surveys during the growing season.

Chapter 19 - Environmental Review Ecological Resources
SHINE Medical Technologies 19.3-103 Rev. 0
No federal or state-listed threatened, endangered or special concern plant species have been observed on or in the proximity of the SHINE site.
The site and terrestrial habitats in proximity to the site are mainly cultivated crops/pasture/hay and developed areas. This is consistent with the dominant land uses within the region (see Figure 19.3.1-2).
19.3.5.7.2 Wildlife
The terrestrial ecology of the SHINE site and near the site was characterized in a series of quarterly field studies conducted over a 1-year period extending from October 2011 to September 2012. The field studies for wildlife included surveys for avifauna, mammals and herpetofauna. In general, study methods within the ecological investigation area included a review of available mapping, databases, and correspondence with the appropriate agencies. A map of the site along with the aquatic and bird survey locations is provided in Figure 19.3.5-3. The subsections below summarize relevant information from each of these studies and provide other data and descriptions of the terrestrial ecology in the area.
19.3.5.7.2.1 Mammals
Methodology for the identification of mammal species within the SHINE site and near the site consisted of records review (i.e., recorded range/distributional records [American Society of Mammalogists, 2012]) and agency consultation with WDNR and USFWS. These methods were supplemented with additional field studies including general field reconnaissance and faunal observations, road kills, tracks, scat, nests, or other indicated evidence. Supplemental field studies within the site and near the site were used in part to characterize the assemblage of mammal species and to aid in the identification of protected species near the SHINE site. Specific mammal survey locations were not developed. Mammal species were recorded based on general field reconnaissance and incidental observations at the aquatic survey locations and along the bird survey route. A quarterly walk through of the entire site was also conducted for evidence of wildlife use.
Mammals were not commonly observed during site reconnaissance due to the agricultural nature of the site. Mammal species observed on-site included white-tailed deer (Odocoileus virginianus), raccoon (Procyon lotor hirtus), eastern cottontail (Sylvilagus floridanus), and groundhog (Marmota monax). Mammal occurrence on-site is likely driven by the presence and life stage of the agriculture crop that is present, as agricultural crops provide a source of food for some wildlife species. The list of mammals observed on-site and those potentially occurring near the site, based on distributional range, are recorded in Table 19.3.5-4. No protected mammal species have been observed or are known to occur at the SHINE site. White-tailed deer and eastern cottontail are both recreationally valuable as game species. Their use of the site, however, is sporadic given the lack of cover, shelter, and water supply. Agency consultation did not identify any state or federally listed mammal species that were recorded within 5 mi. (8 km) of the SHINE site.
19.3.5.7.2.2 Birds
Identification of bird species potentially occurring on the site or in near off-site areas consisted of records review (i.e., recorded range/distributional records [WBBA, 2012 and USGS, 2012d]), field investigation and agency consultation with USFWS and WDNR. For the SHINE site and

Chapter 19 - Environmental Review Ecological Resources
SHINE Medical Technologies 19.3-104 Rev. 0
near the site, field studies included general field reconnaissance and observation, site surveys, and roadside bird surveys. Figure 19.3.5-3 depicts the roadside survey route that was surveyed seasonally (fall, winter, spring, summer) for birds. Observers stopped at 0.5 mi. (0.8 km) intervals to record all birds seen or heard during a 3-minute survey period. The route was driven on two separate dates during each season with observations initiated approximately at sunrise each day.
Fifty-eight species were observed during the 2011-2012 surveys near the site, 61 species were identified as part of the Wisconsin Breeding Bird Atlas (WBBA) database (WBBA, 2012), and 74 species were recorded as part of the closest Breeding Bird Survey route (USGS, 2012d). Abundant and common bird species observed during field surveys near the site included red-winged blackbird (Agelaius phoeniceus), northern cardinal (Cardinalis cardinalis), American goldfinch (Carduelis tristis), house finch (Carpodacus mexicanus), American crow (Corvus brachyrhynchos), horned lark (Eremophila alpestris), house sparrow (Passer domesticus), common grackle (Quiscalus quiscula), European starling (Sturnus vulgaris), and American robin (Turdus migratorius). Birds observed on-site included red-winged blackbird, Canada goose (Branta canadensis), red-tailed hawk (Buteo jamaicensis), killdeer (Charadrius vociferus), American crow, and horned lark. The complete list of birds observed on-site and those potentially occurring near the site are recorded in Table 19.3.5-5. Based on the methodology outlined above, there are no protected bird species at the SHINE site. Canada goose is the only species observed on-site that is recreationally valuable since it is a game species.
The state of Wisconsin is part of the Mississippi Flyway. Based on field observations, Canada geese occasionally fly over the site or use the site during migration to feed. In addition to the Mississippi Flyway, the Rock River (approximately 2 mi. [3.2 km] south of the site) is a potential habitat for other waterfowl and shoreline bird use; however, there are no documented rookeries near the site along the Rock River. Agency consultation did not identify any state or federally listed bird species that were recorded within 5 mi. (8 km) of the SHINE site.
19.3.5.7.2.3 Herpetofauna
Amphibians and reptiles (herpetofauna) within the site and near the site areas were identified using records review (i.e., recorded range/distributional records [WDNR, 2012f]) and agency consultation with USFWS and WDNR. On the SHINE site these methods were supplemented with additional field studies including general field reconnaissance and site surveys. Supplemental field studies within the site and near the site were used in part to characterize the assemblage of amphibian and reptile species and to aid in the identification of protected species near the SHINE site. Terrestrial ecology study locations on the site and near the site are shown on Figure 19.3.5-3. Specific herpetofauna survey locations were not developed. Herpetofauna were recorded based on general field reconnaissance and incidental observations at the aquatic survey locations and along the bird survey route. A quarterly walk-through of the entire site was also conducted for evidence of wildlife use. Species observed or heard during field surveys near the site included the American toad (Bufo americanus), bullfrog (Rana catesbiana), green frog (Rana clanitans), northern leopard frog (Rana pipiens), spring peeper (Pseudacris crucifer), common snapping turtle (Chelydra serpentina), and eastern garter snake (Thamnophis sirtalis). There were no amphibians or reptiles observed on the SHINE site. The complete list of herpetofauna potentially occurring based on range/distribution near the site is recorded in Table 19.3.5-6.

Chapter 19 - Environmental Review Ecological Resources
SHINE Medical Technologies 19.3-105 Rev. 0
WDNR identified the Blanding’s turtle (Emydoidea blandingii) as state threatened and potentially occurring near the site. The Blanding’s turtle is found in a variety of aquatic habitats including marshes, lake bays, slow-moving streams, oxbows, drainage ditches, meadows, and wetlands. This species is semi-terrestrial thus individuals may spend a good deal of time on land moving between a variety of wetland types from early March to mid-October. They typically overwinter in standing water that is at least 3 ft. (0.9 m) in depth with a deep organic substrate but will also use both warm and cold-water streams and rivers where they can avoid freezing. Nesting occurs from about mid-May through June depending on spring temperatures and they have a strong preference for nesting in sandy soils. Hatching occurs from early August through early September but hatchlings can successfully overwinter in the nest, emerging the following spring (WDNR, 2012g). Blanding’s turtles were not observed during field reconnaissance. Given the absence of wetlands and open water habitat on the site or its immediate near-site environs, Blanding’s turtles are not expected to occur on-site.
19.3.5.8 Invasive Species
Non-native species are those species that arrived in and colonized an area with direct or indirect human assistance, even if they are native elsewhere in the state. Non-native species may also be called non-indigenous, alien, exotic, adventive or naturalized species. Invasive species, as defined by Executive Order 13112, include alien species whose introduction does or is likely to cause economic or environmental harm or harm to human health. According to Executive Order 13112, each federal agency whose actions may affect the status of invasive species shall, to the extent practicable and permitted by law, prevent the introduction of invasive species; detect and control populations of such species; monitor invasive species populations; and provide for the restoration of native species in ecosystems that have been invaded.
In 2001, the Wisconsin Legislature directed the WDNR to establish a statewide program to control invasive species, and to promulgate rules to identify, classify and control invasive species for purposes of the program. On September 1, 2009, the WDNR created Wisconsin's Invasive Species Identification, Classification and Control Rule (Chapter NR 40, Wisconsin Administrative Code). In accordance with the rule, invasive species have been identified and classified into two categories: Prohibited and Restricted. With certain exceptions, the transport, possession, transfer and introduction of Prohibited species is banned. Restricted species are also subject to a ban on transport, transfer and introduction, but possession is allowed, with the exception of fish and crayfish (WDNR, 2012h).
Because there are no ponds, streams, or other water bodies on-site, aquatic invasive species associated with these habitats, such as fish and crayfish, are not present on the SHINE site. Similarly, the lack of wetlands on-site precludes the presence of obligate wetland invasive species on the SHINE site.
The list of invasive species for the State of Wisconsin (WDNR, 2010b) was evaluated against the terrestrial plant species observed during the vegetation surveys conducted on the site and near the site in 2011 and 2012. Based on this evaluation, seven “restricted” and two “prohibited” plant species were identified off-site in nearby areas.
Restricted species observed in nearby off-site areas include musk thistle (Carduus nutans), autumn olive (Elaeagnus umbellata), bush honeysuckle (Lonicera maackii), garlic mustard (Alliaria petiolata), wild parsnip (Pastinaca sativa), dames rocket (Hesperis matronalis), and reed canary grass (Phalaris arundinacea). These weedy invasive species were observed in various

Chapter 19 - Environmental Review Ecological Resources
SHINE Medical Technologies 19.3-106 Rev. 0
land cover types including developed lands, agricultural lands, and riparian corridors. “Prohibited” species observed in nearby off site areas include Japanese honeysuckle (Lonicera japonica), and sericea lespedeza (Lespedeza cuneata). Japanese honeysuckle was observed on nearby developed lands, whereas sericea lespedeza was observed in the riparian corridor of the unnamed stream south of the site. It should be noted that no invasive species listed by WDNR (neither restricted nor prohibited) were observed on the SHINE site. Additionally, there are no existing plans to implement invasive species management/control activities at the facility.
19.3.5.9 Procedures and Protocols
The SHINE site has been in agricultural production for several decades. As such, the site has a history of frequent ground disturbance (disking, planting, plowing) and herbicide applications to maximize row crop production. There are no ecological procedures or management plans in place for the SHINE site.
19.3.5.10 Studies and Monitoring
The terrestrial and aquatic ecology of the SHINE site and near the site was characterized in a series of field studies conducted over a 1-year period extending from October 2011 to September 2012. The objective of the field studies was to obtain site-specific species data to characterize existing ecological conditions. The field studies included surveys for terrestrial vegetation, avifauna, mammals, herpetofauna, identification of waters of the United States (including wetlands), adult/juvenile fish, and benthic macroinvertebrates. In general, study methods within the ecological investigation area included a review of available mapping, databases, and correspondence with the appropriate agencies along with supplemental field studies. Subsections 19.3.5.5 and 19.3.5.7 summarize relevant information from each of these studies and provide other data on existing terrestrial and aquatic ecology in accordance with the guidance in the Final ISG Augmenting NUREG-1537.
19.3.5.11 Protected Species
A list of threatened/endangered species or species of special concern identified within 6 mi. (9.7 km) of the SHINE site is provided in Table 19.3.5-7. Terrestrial and aquatic listed species include five fish species, five mussel species, one turtle species, and 27 plant species. Agency consultation did not identify any state or federally listed mammal, bird, or insect species near the SHINE site.
The fish, unionid mussels, and turtle with the potential to occur near the study area are listed as state endangered, threatened, or species of special concern. The fish include the American eel (Anguilla rostrata), gravel chub (Erimystax (Hybopsis)x-punctatus), redfin shiner (Lythrurus umbratilis), greater redhorse (Moxostoma valenciennesi), and Ozark minnow (Notropis nubilus). Listed mussels include the elktoe (Alasmidonta marginata), purple wartyback (Cyclonaias tuberculata), monkeyface (Quadrula metanevra), ellipse (Venustaconcha ellipsiformis), and rainbow shell (Villosa iris). The Blanding’s turtle (Emydoidea blandingii) is the only reptile species listed with the potential to occur near the SHINE site. These species were indicated to be known or likely to occur near the site during consultation with the WDNR (WDNR, 2012c). The species listed above inhabit aquatic areas such as rivers and streams and the Blanding’s turtle requires ponds and wetlands. Because these habitats are absent from the site, these species are not expected to occur on the SHINE site. The Rock River and adjacent riparian

Chapter 19 - Environmental Review Ecological Resources
SHINE Medical Technologies 19.3-107 Rev. 0
area, approximately 2 mi. (3.2 km) from the SHINE site, is the nearest location with suitable habitat for the listed fish, mussel, and turtle species.
Agency consultation identified 27 plant species that may potentially occur near the site that are listed as state endangered, threatened, or species of special concern (WDNR, 2012c). The state or federal status of each of these species is provided in Table 19.3.5-7. The prairie bush-clover (Lespedeza leptostachya) is listed as a state endangered and federally threatened species and is the only plant species that is federally listed near the site (WDNR, 2012c; USFWS, 2012). The listed plant species are discussed below based on the three general habitat types in which they are found: forests/woodlands, riparian areas, and prairies.
Eight state-listed plant species known or likely to occur near the site prefer forested or woodland habitats including: yellow giant hyssop (Agastache nepetoides), purple milkweed (Asclepias purpurascens), kitten tails (Besseya bullii), wood spurge (Euphorbia commutata), hairy wild-petunia (Ruellia humilis), snowy campion (Silene nivea), purple meadow-parsnip (Thaspium trifoliatum var. flavum), and sycamore (Platanus occidentalis). There is no forested habitat on the SHINE site nor were any of these species observed during any of the vegetation surveys within the site or near the site.
Two state-listed plant species known or likely to occur near the site prefer wetland or true aquatic habitats including small forget-me-not (Myosotis laxa) and yellow water lily (Nuphar advena). Small forget-me-not is typically found in cold, clear forested streams whereas yellow water lily prefers shallow to deep water of sluggish streams, ponds and lakes (WDNR, 2012c). Aquatic habitats, including streams, ponds, and lakes, are lacking from the site and neither of these species was observed during any of the vegetation surveys within the site or near the site.
Seventeen state-listed plant species that prefer prairie habitat were identified as known or likely to occur near the SHINE site include:
a. Artemisa dracunculus (dragon wormwood) b. Asclepias lanuginosa (wooly milkweed) c. Cacalia tuberosa (prairie Indian-plantain) d. Calylophus serrulatus (yellow evening primrose) e. Camassia scilloides (wild hyancinth) f. Cirsium hillii (Hill’s thistle) g. Cypripedium candidum (small white lady’s-slipper)h. Echinacea pallida (pale purple coneflower) i. Hypericum sphaerocarpum (round-fruited St. John’s-wort)j. Lespedeza leptostachya (prairie bush clover) k. Melica nitens (three-flowered melic grass) l. Nothocalais cuspidata (prairie false-dandelion) m. Penstemon hirsutus (hairy beardtongue) n. Polygala incarnata (pink milkwort)o. Polytaenia nuttallii (prairie parsley) p. Prenanthes aspera (rough rattlesnake-root) q. Scutellaria parvula (small skullcap)
None of these species were observed during the vegetation surveys performed within or near the site. Furthermore, the entire SHINE site is composed of agricultural land and does not include the preferred prairie habitat of the listed species above.

Chapter 19 - Environmental Review Ecological Resources
SHINE Medical Technologies 19.3-108 Rev. 0
Table 19.3.5-1 Fish Potentially Occurring near the SHINE Site
Common Name Scientific Name
Rock
River(a)
Unnamed Stream (Tributary of Rock
River(b))
Rock bass Ambloplites rupestris X
Bowfin Amia calva X
Freshwater drum Aplodinotus grunniens X
White sucker Catostomus commersonii X
Brook stickleback Culaea inconstans X
Spotfin shiner Cyprinella spiloptera X
Common carp Cyprinus carpio X
Northern pike Esox lucius X
Northern hogsucker Hypentelium nigricans X
Channel catfish Ictalurus punctatus X
Bigmouth buffalo Ictiobus cyprinellus X
Green sunfish Lepomis cyanellus X
Pumpkinseed Lepomis gibbosus X
Bluegill Lepomis macrochirus X
Smallmouth bass Micropterus dolomieu X
White bass Morone chrysops X
Shorthead redhorse Moxostoma macrolepidotum X
Emerald shiner Notropis atherinoides X
Spottail shiner Notropis hudsonius X
Logperch Percina caprodes X
Black crappie Pomoxis nigromaculatus X
Sauger Sander canadensis X
Walleye Sander vitreus X
Species Richness 21 2
a) WDNR, 2012c (fish collected on the Rock River within Rock County beyond the year 1980).
b) SHINE ER field sampling program.

Chapter 19 - Environmental Review Ecological Resources
SHINE Medical Technologies 19.3-109 Rev. 0
Table 19.3.5-2 Benthic Macroinvertebrates Collected in an Unnamed Stream (Tributary of the Rock River) near the SHINE Site
Orders
Abundance
Fall 2011 Spring 2012
Diptera 2
Dixidae
Dixa modesta 1
Chironomidae 1
Chironominae 1
Apedilum 1
Stictochironomus 9
Stratiomyidae
Odontomyia 2
Hemiptera
Belostomatidae
Belostoma 3
Corixidae
Sigara 2 1
Gerridae
Aquarius 1
Coleoptera
Hydrophilidae 1
Tropisternus 1
Tricladida
Dugesiidae
Girardia 10 6
Megaloptera
Sialidae
Sialis 1
Non-insects
Amphipoda 9
Gammarus 200 266
Isopoda
Caecidotea 10
Lirceus 5
Gastropoda
Gyraulus 1
Planorbidae 1
Physidae
Physa 1
Total # 252 284
Taxa Richness 12 9
EPT Richness 0 0
Shannon Diversity Index 0.96 0.35
Biotic Index 6.29 6.69
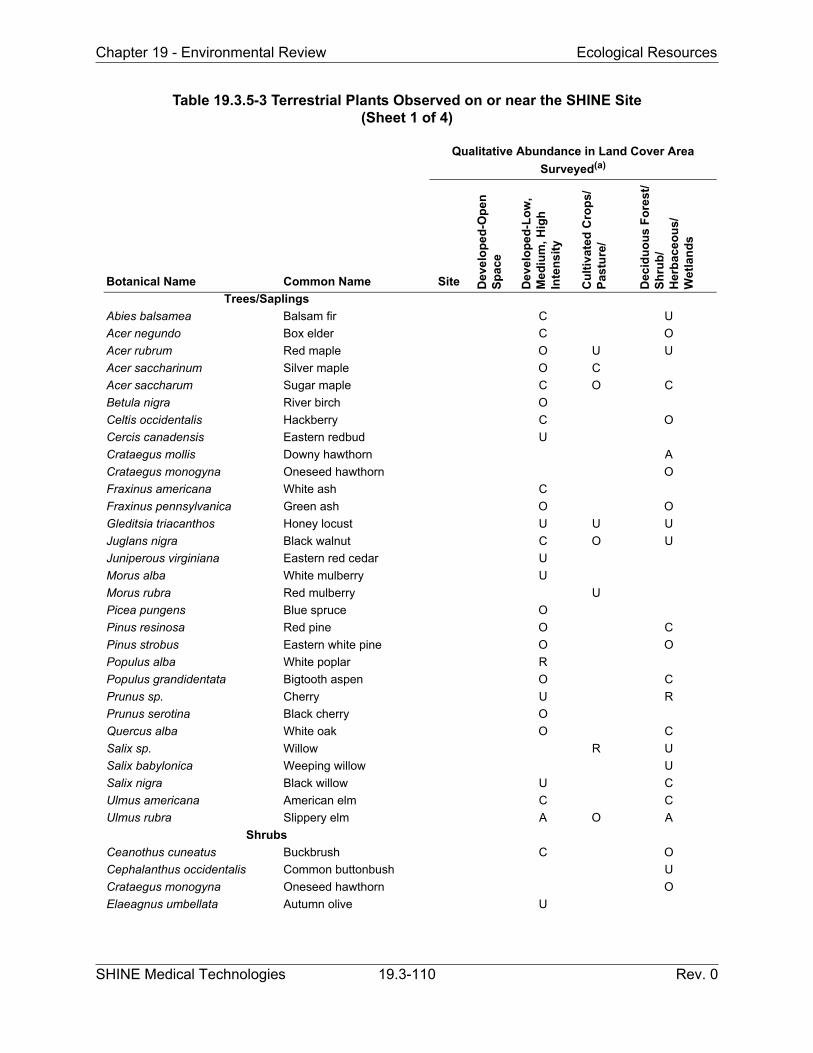
Chapter 19 - Environmental Review Ecological Resources
SHINE Medical Technologies 19.3-110 Rev. 0
Table 19.3.5-3 Terrestrial Plants Observed on or near the SHINE Site(Sheet 1 of 4)
Botanical Name Common Name
Qualitative Abundance in Land Cover Area
Surveyed(a)
Site Dev
elo
pe
d-O
pen
S
pac
e
Dev
elo
pe
d-L
ow
, M
ed
ium
, Hig
h
Inte
ns
ity
Cu
ltiv
ated
Cro
ps/
Pas
ture
/
Dec
idu
ou
s F
ore
st/
Sh
rub
/H
erb
ace
ou
s/W
etla
nd
s
Trees/Saplings
Abies balsamea Balsam fir C U
Acer negundo Box elder C O
Acer rubrum Red maple O U U
Acer saccharinum Silver maple O C
Acer saccharum Sugar maple C O C
Betula nigra River birch O
Celtis occidentalis Hackberry C O
Cercis canadensis Eastern redbud U
Crataegus mollis Downy hawthorn A
Crataegus monogyna Oneseed hawthorn O
Fraxinus americana White ash C
Fraxinus pennsylvanica Green ash O O
Gleditsia triacanthos Honey locust U U U
Juglans nigra Black walnut C O U
Juniperous virginiana Eastern red cedar U
Morus alba White mulberry U
Morus rubra Red mulberry U
Picea pungens Blue spruce O
Pinus resinosa Red pine O C
Pinus strobus Eastern white pine O O
Populus alba White poplar R
Populus grandidentata Bigtooth aspen O C
Prunus sp. Cherry U R
Prunus serotina Black cherry O
Quercus alba White oak O C
Salix sp. Willow R U
Salix babylonica Weeping willow U
Salix nigra Black willow U C
Ulmus americana American elm C C
Ulmus rubra Slippery elm A O A
Shrubs
Ceanothus cuneatus Buckbrush C O
Cephalanthus occidentalis Common buttonbush U
Crataegus monogyna Oneseed hawthorn O
Elaeagnus umbellata Autumn olive U

Chapter 19 - Environmental Review Ecological Resources
SHINE Medical Technologies 19.3-111 Rev. 0
Table 19.3.5-3 Terrestrial Plants Observed on or near the SHINE Site(Sheet 2 of 4)
Botanical Name Common Name
Qualitative Abundance in Land Cover Area
Surveyed(a)
Site Dev
elo
pe
d-O
pen
S
pac
e
Dev
elo
pe
d-L
ow
, M
ed
ium
, Hig
h
Inte
ns
ity
Cu
ltiv
ated
Cro
ps/
Pas
ture
/
Dec
idu
ou
s F
ore
st/
Sh
rub
/H
erb
ace
ou
s/W
etla
nd
s
Shrubs (continued)
Juniperous virginianus Eastern red cedar U O
Lonicera maackii Bush honeysuckle A A A
Ribes cynosbati Eastern prickly gooseberry C O
Rosa rugosa Rugosa rose C
Symphoricarpos occidentalis Western snowberry O
Syringa vulgaris Common lilac U
Viburnum sp. Viburnum O
Vines
Lonicera japonica Japanese honeysuckle O
Parthenocissus quinquefolia Virginia creeper C A
Rubus sp. Blackberry C C C
Solanum dulcamara Climbing nightshade U
Toxicodendron radicans Poison ivy U
Vitis sp. Wild grape U
Herbs
Achillea millefolium Yarrow O U C
Alliaria petiolata Garlic mustard U C O
Amaranthus sp. Pigweed U
Andropogon gerardii Big bluestem U
Antennaria neglecta Field pussytoes U
Arctium lappa Greater burdock R
Arctium pubens Common burdock O U R
Artemisia ludoviciana White sagebrush O
Artemisia serrata Sawtooth wormwood C
Asclepias syriaca Common milkweed U
Aster sp. Aster U
Bidens aristosa Bearded beggarticks C
Boltonia asteroides White doll's daisy U
Brassica nigra Black mustard U
Bromus catharticus Rescuegrass O
Bromus japonicus Field brome A C C
Bromus pubescens Hairy woodland brome C O

Chapter 19 - Environmental Review Ecological Resources
SHINE Medical Technologies 19.3-112 Rev. 0
Table 19.3.5-3 Terrestrial Plants Observed on or near the SHINE Site(Sheet 3 of 4)
Botanical Name Common Name
Qualitative Abundance in Land Cover Area
Surveyed(a)
Site Dev
elo
pe
d-O
pen
S
pac
e
Dev
elo
pe
d-L
ow
, M
ed
ium
, Hig
h
Inte
ns
ity
Cu
ltiv
ated
Cro
ps/
Pas
ture
/
Dec
idu
ou
s F
ore
st/
Sh
rub
/Her
ba
ceo
us/
Wet
lan
ds
Herbs (continued)
Bromus tectorum Drooping brome C
Carduus nutans Musk thistle U C C A
Carex sp. Sedge C
Cichorium intybus Chicory U
Cirsium vulgare Bull thistle O
Dactylis glomerata Orchardgrass C C
Daucus carota Queen Anne's lace U O C
Equisetum arvense Field horsetail C
Erigeron philadelphicus Philadelphia fleabane O O
Erysimum sp. Wallflower U U
Eupatorium perfoliatum Late boneset U
Eupatorium rugosum White snakeroot U C U
Festuca sp. Fescue A A O C
Festuca arundinacea Tall fescue A A
Glycine max Soybean A A
Hesperis matronalis Dame's rocket C C
Impatiens capensis Jewelweed C
Lemna sp. Duckweed A
Leonurus cardiaca Common motherwort O
Lespedeza sp. Lespedeza O O
Lespedeza cuneata Sericea lespedeza O
Leucanthemum vulgare Oxeye daisy U U R
Marrubium vulgare White horehound R U
Medicago sativa Alfalfa A
Melilotus officinalis Sweetclover O
Monarda fistulosa Wild bergamot U
Oenothera biennis Common evening primrose R
Panicum sp. Panic grass O O O
Panicum virgatum Switchgrass C U
Pastinaca sativa Wild parsnip C
Phalaris arundinacea Reed canary grass A
Physalis longifolia Longleaf groundcherry U
Plantago lanceolata Narrowleaf plantain U
Poa annua Annual bluegrass A C
Poa compressa Canada bluegrass A

Chapter 19 - Environmental Review Ecological Resources
SHINE Medical Technologies 19.3-113 Rev. 0
Table 19.3.5-3 Terrestrial Plants Observed on or near the SHINE Site(Sheet 4 of 4)
Botanical Name Common Name
Qualitative Abundance in Land Cover Area
Surveyed(a)
Site Dev
elo
pe
d-O
pen
S
pac
e
Dev
elo
pe
d-L
ow
, M
ed
ium
, Hig
h
Inte
ns
ity
Cu
ltiv
ated
Cro
ps/
Pas
ture
/
Dec
idu
ou
s F
ore
st/
Sh
rub
/H
erb
ace
ou
s/W
etla
nd
s
Herbs (continued)
Polygonum sp. Knotweed U C
Schizachyrium scoparium Little bluestem O U
Scirpus atrovirens Green bulrush O
Senecio pauperculus Balsam groundsel C C
Setaria sp Foxtail O
Setaria faberi Foxtail A O
Setaria viridis Green foxtail O O C
Silene csereii Balkan catchfly O O
Silene cucubalus Maidenstears O
Silphium perfoliatum Cup plant O
Solidago altissima Tall goldenrod C
Solidago canadensis Canada goldenrod U C O A
Solidago gigantea Giant goldenrod C
Sorghum halepense Johnson grass O C
Stachys byzantina Lamb's ear O O
Stellaria media Common chickweed O
Symphyotrichum lanceolatum White panicle aster O
Symphyotrichum novae-angliae New England aster O
Taraxacum officinale Common dandelion U O C U C
Thlaspi arvense Field pennycress U
Toxicodendron radicans Poison ivy U
Tragopogon dubius Western salsify U
Trifolium pratense Red clover O U O
Triticum aestivum Winter wheat A O O A
Typha latifolia Broadleaf cattail U R U
Verbena stricta Hoary verbena C
Viola sp. Violet C
Xanthium strumarium Cocklebur C A U
Zea mays Corn A C A
Zizia aurea Golden zizia C
a) Abundance Categories: A=abundant; C=common; O=occasional; U=uncommon; R=rare

Chapter 19 - Environmental Review Ecological Resources
SHINE Medical Technologies 19.3-114 Rev. 0
Table 19.3.5-4 Mammals Potentially Occurring on or near the SHINE Site
Group/Scientific Name Common NameObserved during
Field Survey
Pouched Mammals
Didelphis virginiana Opossum X
Hare-Shaped Mammals
Sylvilagus floridanus Eastern Cottontail X
Insect-Eating Mammals
Blarina brevicauda Northern Short-Tailed Shrew
Sorex cinereus Masked Shrew
Sorex hoyi Pygmy Shrew
Scalopus aquaticus Eastern Mole
Flying Mammals
Eptesicus fuscus Big Brown Bat
Lasiurus borealis Red Bat
Lasiurus cinereus Hoary Bat
Myotis lucifugus Little Brown Bat
Pipistrellus subflavus Eastern Pipistrelle
Flesh-Eating Mammals
Canis latrans Coyote X
Urocyon cinereoargenteus Gray Fox
Vulpes vulpes Red Fox
Lontra canadensis River Otter
Mustela frenata Long-tailed Weasel
Mustela nivalis Least Weasel
Neovison vison American Mink
Mephitis mephitis Striped Skunk X
Procyon lotor Raccoon X
Even-Toed Hoofed Mammals
Odocoileus virginianus White-Tailed Deer X
Gnawing Mammals
Marmota monax Groundhog X
Sciurus carolinensis Gray Squirrel X
Spermophilus tridecemlineatus Thirteen-Lined Ground Squirrel X
Castor canadensis Beaver
Zapus hudsonius Meadow Jumping Mouse
Microtus ochrogaster Prairie Vole
Microtus pennsylvanicus Meadow Vole
Ondatra zibethicus Muskrat
Peromyscus leucopus White-Footed Mouse
Mus musculus House Mouse
Rattus norvegicus Norway Rat
Reference: American Society of Mammologists, 2012

Chapter 19 - Environmental Review Ecological Resources
SHINE Medical Technologies 19.3-115 Rev. 0
Table 19.3.5-5 Avifaunal Species Potentially Occurring on or near the SHINE Site(Sheet 1 of 3)
Scientific Name Common Name
FieldSurveys
Abundance(a)
Wisconsin Breeding
Bird Atlas(b)
Breeding Bird
Survey(c)
Actitis macularia Spotted sandpiper X
Agelaius phoeniceus Red-winged blackbird A(d) X X
Ammodramus savannarum Grasshopper sparrow R X
Anas platyrhynchos Mallard R X X
Accipiter cooperii Cooper's hawk R
Archilochus colubris Ruby-throated hummingbird X
Ardea herodias Great blue heron X X
Baeolophus bicolor Tufted titmouse O
Bombycilla cedrorum Cedar waxwing U X X
Branta canadensis Canada goose O(d) X X
Bubo virginianus Great horned owl X
Buteo jamaicensis Red-tailed hawk U(d) X X
Butorides virescens Green heron X
Cardinalis cardinalis Northern cardinal C X X
Carduelis tristis American goldfinch C X X
Carpodacus mexicanus House finch C X X
Ceryle alcyon Belted kingfisher X X
Chaetura pelagica Chimney swift X
Charadrius vociferus Killdeer O(d) X X
Chordeiles minor Common nighthawk R X
Cistothorus platensis Sedge wren X
Coccyzus americanus Yellow-billed cuckoo X
Coccyzus erythropthalmus Black-billed cuckoo X
Colaptes auratus Northern flicker R X X
Colinus virginianus Northern bobwhite X
Columba livia Rock dove U X X
Contopus virens Eastern wood pewee U X X
Corvus brachyrhynchos American crow C(d) X X
Cyanocitta cristata Blue jay O X X
Dendroica petechia Yellow warbler R X X
Dolichonyx oryzivorus Bobolink X
Dumetella carolinensis Gray catbird U X X
Empidonax alnorum Alder flycatcher X
Empidonax minimus Least flycatcher R X
Empidonax spp. Willow/alder flycatcher X
Empidonax traillii Willow flycatcher X
Eremophila alpestris Horned lark C(d) X
Euphagus cyanocephalus Brewer's blackbird U X
Falco sparverius American kestrel X X

Chapter 19 - Environmental Review Ecological Resources
SHINE Medical Technologies 19.3-116 Rev. 0
Table 19.3.5-5 Avifaunal Species Potentially Occurring on or near the SHINE Site(Sheet 2 of 3)
Scientific Name Common Name
Field Surveys
Abundance(a)
Wisconsin Breeding
Bird Atlas(b)
Breeding Bird
Survey(c)
Geothlypis triachas Common yellowthroat R X X
Grus canadensis Sandhill crane X X
Hirundo rustica Barn swallow U X X
Hylocichla mustelina Wood thrush X X
Icterus galbula Baltimore oriole R X X
Icterus spurius Orchard oriole R X
Junco hyemalis Dark-eyed junco O
Larus delawarensis Ring-billed gull R X
Melanerpes carolinus Red-bellied woodpecker O X X
Melanerpes erythrocephalus Red-headed woodpecker X
Meleagris gallopavo Wild turkey O X
Melospiza melodia Song sparrow O X X
Mimus polyglottos Northern mockingbird O
Molothrus ater Brown-headed cowbird O X X
Myiarchus crinitus Great crested flycatcher R X X
Passer domesticus House sparrow C X X
Passerculus sandwichensis Savannah sparrow X
Passerina cyanea Indigo bunting R X X
Petrochelidon pyrrhonota Cliff swallow X X
Phasianus colchicus Ring-necked pheasant X
Pheucticus ludovicianus Rose-breasted grosbeak X
Picoides pubescens Downy woodpecker O X X
Picoides villosus Hairy woodpecker X
Pipilo erythrophthalmus Eastern towhee U
Poecile atricapillus Black-capped chickadee O X X
Polioptila caerulea Blue-gray gnatcatcher R X X
Pooecetes gramineus Vesper sparrow X X
Progne subis Purple martin R X
Quiscalus quiscula Common grackle C X X
Riparia riparia Bank swallow X
Sayornis phoebe Eastern phoebe O X X
Sialia sialis Eastern bluebird O X X
Sitta carolinensis White-breasted nuthatch O X X
Spiza americana Dickcissel X
Spizella arborea American tree sparrow R
Spizella passerina Chipping sparrow O X X
Spizella pusilla Field sparrow U(d) X X
Stelgidopteryx serripennis Northern rough-winged swallow
R X X

Chapter 19 - Environmental Review Ecological Resources
SHINE Medical Technologies 19.3-117 Rev. 0
Table 19.3.5-5 Avifaunal Species Potentially Occurring on or near the SHINE Site(Sheet 3 of 3)
Scientific Name Common Name
FieldSurveys
Abundance(a)
Wisconsin Breeding
Bird Atlas(b)
Breeding Bird
Survey(c)
Sturnella magna Eastern meadowlark O X X
Sturnella neglecta Western meadowlark X
Sturnus vulgaris European starling A X X
Tachycineta bicolor Tree swallow R X X
Toxostoma rufum Brown thrasher U X X
Troglodytes aedon House wren X X
Turdus migratorius American robin A X X
Tyrannus tyrannus Eastern kingbird U X X
Vireo gilvus Warbling vireo X X
Vireo olivaceus Red-eyed vireo X X
Wilsonia catrina Hooded warbler X
Zenaida macroura Mourning dove U X X
Zonotrichia albicollis White-throated sparrow U
Species Richness 58 61 74
a) A=abundant; C=common; O=occasional; U=uncommon; R=rareb) WBBA, 2012c) USGS, 2012dd) Indicates species observed on-site.

Chapter 19 - Environmental Review Ecological Resources
SHINE Medical Technologies 19.3-118 Rev. 0
Table 19.3.5-6 Reptiles and Amphibians Potentially Occurring on or near the SHINE Site
Scientific Name Common NameObserved during
Field SurveyTurtles
Apolone spinifera Spiny softshell turtleChrysemes picta Painted turtleChelydra serpentina Common snapping turtle XEmydoidea blandingii Blanding's turtleGraptemys geographica Common map turtleGraptemys ouachitensis Ouachita map turtleGraptemys pseudogeographica False map turtleSternotherus odoratus Common musk turtle
SalamandersNecturus maculosa MudpuppyFrogs and ToadsBufo americanus American toad XHyla chrysoscelis Copes gray treefrogHyla versicolor Eastern gray treefrogPseudacris crucifer Spring peeper XPseudacris triseritata Western chorus frogRana catesbiana Bullfrog XRana clanitans Green frog XRana pipiens Northern leopard frog XRana sylvatica Wood frog
SnakesColuber constictor Blue racerElaphe vulpina Fox snakeHeterodon platyrhinos Eastern hog-nosed snakeLampropeltis triangulum Milk snakeNerodia sipedon Northern water snakeOpheodrys vernalis Smooth green snakeSistrurus catenatus Eastern massasaugaStoreria dekayi Northern brown snakeStoreria occipitomaculata Red-bellied snakeThamnophis sirtalis Eastern garter snake X
LizardsCnemidophorus sexlineatus Six-lined racerunnerEumeces fasciatus Five-lined skink
Reference: WDNR, 2012f

Chapter 19 - Environmental Review Ecological Resources
SHINE Medical Technologies 19.3-119 Rev. 0
Table 19.3.5-7 Protected Species near the SHINE Site(a)
Scientific Name Common Name Status(a)
Fish
Anguilla rostrata American eel Species of special concern (S)
Erimystax x-punctatus Gravel chub Endangered (S)
Lythrurus umbratilis Redfin Shiner Threatened (S)
Moxostoma valenciennesi Greater redhorse Threatened (S)
Notropis nubilus Ozark Minnow Threatened (S)
Mussels
Alasmidonta marginata Elktoe Species of special concern (S)
Cyclonaias tuberculata Purple wartyback Endangered (S)
Quadrula metanevra Monkeyface Threatened (S)
Venustaconcha ellipsiformis Ellipse Threatened (S)
Villosa iris Rainbow shell Endangered (S)
Turtles
Emydoidea blandingii Blanding's turtle Threatened (S)
Plants
Agastache nepetoides Yellow giant hyssop Threatened (S)
Artemisa dracunculus Dragon wormwood Species of special concern (S)
Asclepias lanuginosa Woolly milkweed Threatened (S)
Asclepias purpurascens Purple milkweed Endangered (S)
Besseya bullii Kitten tails Threatened (S)
Cacalia tuberosa Prairie Indian-plantain Threatened (S)
Calylophus serrulatus Yellow evening primrose Species of special concern (S)
Camassia scilloides Wild hyancinth Endangered (S)
Cirsium hillii Hill's thistle Threatened (S)
Echinacea pallida Pale purple coneflower Threatened (S)
Euphorbia commutata Wood spurge Species of special concern (S)
Lespedeza leptostachya Prairie bush-clover Endangered (S)Threatened (F)
Melica nitens Three-flowered melic grass Species of special concern (S)
Nothocalais cuspidata Prairie false-dandelion Species of special concern (S)
Penstemon hirsutus Hairy beardtongue Species of special concern (S)
Polytaenia nuttallii Prairie parsley Threatened (S)
Prenanthes aspera Rough rattlesnake-root Endangered (S)
Ruellia humilis Hairy wild-petunia Endangered (S)
Scutellaria parvula Small skullcap Endangered (S)
Silene nivea Snowy campion Threatened (S)
Thaspium trifoliatum Purple meadow-parsnip Species of special concern (S)
Cypripedium candidum Small white lady's-slipper Threatened (S)
Hypericum sphaerocarpum Round-fruited St. John's-wort Threatened (S)
Myosotis laxa Small forget-me-not Species of special concern (S)
Nuphar advena Yellow water lily Species of special concern (S)
Plantanus occidentalis Sycamore Species of special concern (S)
Polygala incarnata Pink milkwort Endangered (S)
a) Protected species information was provided by USFWS and WDNR within a 6-mi (9.7 km) radius of the site b) State listed (S), Federally listed (F).References: USFWS, 2012 and WDNR, 2012c
Chapter 19 - Environmental Review Historic and Cultural Resources
SHINE Medical Technologies 19.3-120 Rev. 0
19.3.6 HISTORIC AND CULTURAL RESOURCES
Cultural resource studies were performed for the SHINE site that consisted of a geographical information system (GIS) analysis, a records level review of properties listed on the National Register of Historic Properties (NRHP), and field surveys. GIS analyses and records reviews were performed on an area within a 10-mi. (16-km) radius of the SHINE site. While this radius is not specified in the Final ISG Augmenting NUREG-1537, the use of 10 mi. (16 km) is consistent with guidance of NUREG-1555 (Subsection 2.5.3) regarding the radius appropriate for the collection of sufficient data to describe historic properties within the area surrounding a proposed project. Field surveys and reviews consisted of a Phase I archaeological survey of the entirety of the SHINE site. This survey was conducted to ensure compliance with Section 106 of the National Historic Preservation Act and other Federal and state cultural resources management regulations.
19.3.6.1 Cultural Setting
General information regarding the cultural setting in the vicinity of the SHINE site is summarized by Knopf and Krause (Knopf, Chad and Kari Krause, 2012) and is presented in this section.
The prehistory of southern Wisconsin is divided into four broad periods describing Native American habitation and development: the Paleoindian, Archaic, Woodland, and Mississippian periods. Approximately 10,000 years ago, Paleoindians pushed northward into Wisconsin as the glaciers retreated. These hunter-gatherers exploited the new resource-rich environments and hunted woolly mammoth, mastodon, and bison. Small, mobile groups utilized fluted and unfluted projectile points/knives designed for hunting and butchering animals. Clovis and Folsom points have been recovered in southeastern Wisconsin.
Along with the change in the climate to warmer and drier conditions that occurred around 8000 years ago, came the shift from hunting Ice Age mammals to smaller modern animals such as deer and elk. This shift coincided with the Archaic Tradition, which is subdivided into the Early, Middle, and Late Archaic periods. The social organization during the Early and Middle Archaic periods continued with mobile groups of hunter-gatherers with an increasingly sedentary lifestyle during the Late Archaic period.
Cultural changes that occurred during the Woodland period (approximately 3000 years ago) included the use of pottery and bow and arrow, construction of conical and effigy mounds, and the existence of large villages. The Early Woodland period is characterized by the appearance of flat bottomed vessels tempered with grit, Kramer and Waubesa projectile points, and conical mounds. Subsistence practices during the Middle Woodland period included hunting, gathering of nuts and wild rice, and cultivation of squash. The Late Woodland period is characterized by more intensive cultivation of corn and the use of pottery consisting of globular jars with cord or fabric impressed decorations.
The Mississippian period began about 1000 years ago; Native American occupants of Rock County were the Koshkonong Oneota. These people lived in large villages, grew corn, beans, and squash, and maintained a large trade network that crossed the continent. The Oneota are considered the ancestors of the modern-day Ho Chunk (Winnebago) tribe. The Indian tribes present in the state when it was first visited by Jean Nicolet in 1634 included the Ho Chunk, Potawatomi, Menominee, and Chippewa Indians. With the influx of European fur traders, loggers and early settlers in the late 1600s, and the succeeding Native American and European wars,

Chapter 19 - Environmental Review Historic and Cultural Resources
SHINE Medical Technologies 19.3-121 Rev. 0
many tribes of southeastern Wisconsin either migrated (or were removed) west of the Mississippi River.
Euro-American settlers moved into Wisconsin during the 1830s and 1840s to take control of the
territory ceded by Native American groups. Throughout the 19th and 20th centuries, Rock County was primarily an agricultural economy that utilized the power of the Rock River for mills and transportation of trade commodities. Despite burgeoning industrial development and population growth after the Civil War, the farming industry expanded as railroads and urban markets developed in veins along the rail lines throughout the state. Urban growth and the advancements in transportation spurred along the shift in Wisconsin agriculture to focus on commercial dairy production, which helped to extend the viability of traditional agriculture in the region. Manufacturing boomed in Rock County in the 20th century, as General Motors (GM) and other firms began producing tractors, machinery, paper, pens, and refined farm products such as snack foods. Though manufacturing gained a large market share, agriculture has remained an important factor in the regional economy.
19.3.6.2 Previous Investigations
To ensure that all potential impacts to known historic properties were addressed prior to construction, SHINE completed the background records review for the project at the Historic Preservation Office, Wisconsin Historical Society (WHS) in Madison, Wisconsin and at the Illinois Historic Preservation Agency (IHPA) in Springfield, Illinois; NRHP-listed properties were identified using the online NRHP database. This investigation covered a 10-mi. (16-km) radius surrounding the SHINE site. This radius encompasses all of Rock County, Wisconsin and portions of Winnebago and Boone counties, Illinois (Knopf, Chad and Kari Krause, 2012).
19.3.6.2.1 Previously Conducted Cultural Resources Surveys
A total of 126 cultural resource surveys in Wisconsin and 17 surveys in Illinois were completed and recorded at the WHS and IHPA within a 10-mi. (16-km) radius surrounding the project area. These included 38 records reviews, 102 Phase I investigations, and two archaeological site excavations. Only seven surveys were conducted within 1 mi. (1.6 km) of the SHINE site (Knopf and Krause, 2012) (Table 19.3.6-1). None of these investigations were located within the project boundary. Two reports could not be examined because they were either missing or never received by the WHS. The remaining five surveys were documented and the reports were on file at the WHS. The five documented surveys were associated with the construction along US 51, I-90, the installation of a sewer line, and upgrades at the SWRA. Two surveys were conducted at the SWRA. The SWRA is located immediately to the west of US 51. No archaeological sites were identified for any of these five projects, and no additional fieldwork was recommended.
19.3.6.2.2 Previously Recorded Archaeological Sites
Eligible or listed archaeological sites located within a 10-mi. (16-km) radius of the SHINE site were identified through a information request with the WHS and by a database search of Illinois Historic Preservation Agency (IHPA) records. There are 223 archaeological sites identified in Wisconsin, five sites identified in Illinois, and one site that is bisected by the Wisconsin-Illinois state line (WHS, 2012a; IHPA, 2013). As is presented in Table 19.3.6-2, only one prehistoric site is listed on the NRHP, whereas a total of 87 sites are eligible for listing on the NRHP in Wisconsin; there are no eligible or listed sites in Illinois.

Chapter 19 - Environmental Review Historic and Cultural Resources
SHINE Medical Technologies 19.3-122 Rev. 0
The majority of the 87 eligible sites consist of prehistoric burials or mounds (n=44), while one mound site is a listed NRHP property (the Strong Partridge Mound Group). The Strong Partridge Mound Group was listed on the NRHP on March 1, 1994 and is located in Beloit, Wisconsin. It is a prehistoric effigy mound group from the Late Woodland period. The remaining eligible sites consist of 39 historic/modern period cemeteries and four archaeological sites. All cemeteries or burials/prehistoric mounds are protected under Wisconsin Statute 157.70. The Happy Hallow Cemetery is closest, located approximately 1.2 mi. (2.0 km) south of the SHINE site (Figure 19.3.1-4).
19.3.6.2.3 Previously Recorded Historic Structures and Districts
Table 19.3.6-3 lists historic structures and districts listed on the NRHP and located within a 10 mi. (16-km) radius of the SHINE site. A total of 85 NRHP-listed districts or properties are identified in Wisconsin as illustrated in Figure 19.3.6-1. However, no NRHP-listed properties are located in Illinois (IHPA, 2013).
Recorded sites within Wisconsin summarized in Table 19.3.6-3 include districts and numerous individual properties located in Janesville and Beloit. Individually listed properties have also been identified in the communities of Bradford, Clinton, Footville, Turtle, and La Prairie. Janesville contains 14 historic districts and 20 historic properties. The Benton Avenue, Bostwick Avenue, Columbus Circle, Conrad Cottages and the Look West Avenue Historic Districts contain domestic architecture of such styles as Colonial Revival, Tudor Revival, Mission Revival, Greek Revival, Italianate, Queen Anne, Late Victorian, and bungalow/craftsman. The remaining historic districts, including Courthouse Hill, East and West Milwaukee, Jefferson Avenue, North Main and South Main Historic Districts, are associated with the city’s residences, commerce, industry, and government. The Old Fourth Ward and Prospect Hill Historic Districts are of Italianate or Queen Anne construction and contain residential dwellings, as well as educational and religious facilities. The remaining individual historic properties are primarily houses distributed throughout Janesville; additional properties include a business, educational facilities, an armory, and churches. The nearest listed NRHP property, the John and Martha Hugunin House, is located 1.1 mi. (1.7 km) northeast of the SHINE site. The Hugunin House is Italianate in style, and is significant for its architectural design and relation to historic farming in the region. It was listed on the NRHP on June 1, 2005.
Three historic districts are located in the City of Beloit, located 3.7 mi. (6.0 km) south of the SHINE site. The Bluff Street Historic District contains domestic dwellings dating from 1847 to 1915 and is significant for its association with European exploration and settlement. The Merrill Avenue Historic District contains domestic dwellings dating from 1891 to 1942 and is composed
of 19th to 20th century revival architectural styles. The Near East Side Historic District is composed of a mix of architectural styles dating from 1850 to 1932 and contains two prehistoric archaeological mound groups as contributing elements to the district. While the remaining 27 individual historic properties are primarily houses distributed throughout the area, additional properties include an apartment complex, municipal facilities, a museum, college buildings, and churches. Constructed in 1917, Fairbanks Flats were built exclusively for African-American workers after World War I and played a prominent role in community planning during the twentieth century. The apartments are located 6.9 mi. (11.1 km) south of the SHINE site.
Another 21 NRHP-listed historic properties are scattered within the 10-mi. (16-km) radius around the SHINE site (Figure 19.3.6-1). The community of Clinton, located 8.2 mi. (13.2 km) southeast

Chapter 19 - Environmental Review Historic and Cultural Resources
SHINE Medical Technologies 19.3-123 Rev. 0
of the SHINE site, contains examples of governmental and commerce architecture with the Clinton Village Hall, water tower, Citizens Bank, and the Crosby Block. The remaining
NRHP-listed properties are residential dwellings dating from the late 19th century constructed in Italianate, Queen Anne, and Greek Revival architectural styles. Two farmsteads in Bradford Township; two dwellings in Plymouth and LaPrairie Townships; a house, church, and an iron bridge in Turtle Township; and two stores, one bank, and one house in the Town of Footville comprise the last of the NRHP-listed properties within the 10-mi. (16-km) radius of the SHINE site.
19.3.6.3 Results of Phase I Cultural Resource Investigation
A Phase I archeological survey was conducted on lands within the project boundary. The survey was supervised in the field by Mr. Chad Knopf while Ms. Kari Krause served as the Principal Investigator. Mr. Knopf has a Bachelor’s degree in Anthropology and has over 2 years of experience in historic and prehistoric archaeology. Kari Krause is a Registered Professional Archaeologist with a Master of Arts degree in Anthropology. Ms. Krause has over 17 years of experience conducting archaeological projects throughout the Midwestern United States. Fieldwork was performed following methodologies established by the WHS. The survey was completed utilizing a pedestrian survey at closely spaced transect intervals (less than 49 ft. [15 m] between transects) that allowed crews to systematically inspect the ground surface of the tilled agricultural field. Three shovel test pits were judgmentally placed and excavated across the project area to provide an understanding of the soil stratigraphy. No archaeological sites or evidence of cultural resources were identified within the survey area, and no further archaeological investigations are recommended (Knopf, Chad and Kari Krause, 2012). The report was submitted to the WHS for review and comment. In a letter dated February 16, 2012 (WHS, 2012), the WHS indicated that they had reviewed the report and found it complete and concluded that consultation regarding the SHINE project was complete.
19.3.6.4 Native American and State Agency Consultation
SHINE initiated consultation with 13 tribes that are federally recognized in Wisconsin. A single response letter was received from the Winnebago Tribe of Nebraska who indicated that they have cultural properties of interest in the project area, but had no concerns regarding the project. However, they did indicate the desire to be contacted in the event burial sites or other cultural materials were discovered during construction. Follow-up calls were made to representatives of the remaining 12 tribes; however, no return calls to SHINE were received.
Illinois currently does not have a federally recognized Native American tribe.

Chapter 19 - Environmental Review Historic and Cultural Resources
SHINE Medical Technologies 19.3-124 Rev. 0
Table 19.3.6-1 Previously Recorded Cultural Resources Surveys within 1-mi. (1.6-km) of the Site
Report No. Survey Type Date Results
Distance from Site
(centerpoint)
88-2033 Interviews for planned project associated with US Highway 51
1988 No sites identified; no additional fieldwork recommended
0.2-mi. (0.3-km) West
00-0787 Phase I archaeological survey at the Southern Wisconsin Regional Airport
2000 No sites identified; no additional fieldwork recommended
0.6-mi. (1-km) West
93-2029 Records review for proposed sewer and water main route
1993 No sites identified; no additional fieldwork recommended
0.3-mi. (0.5-km) West
84-1001 Phase I archaeological survey of Route 11 - pedestrian survey
1985 No sites identified; no additional fieldwork recommended
0.8-mi. (1.3-km) North
05-0607 Phase I archaeological survey at Rock County Airport – shovel testing
2005 No sites identified; no additional fieldwork recommended
0.6-mi. (1-km) West
97-1131 Phase I archaeological survey of proposed Janesville bypass
1997 Not available 0.8-mi. (1.3-km) North
89-5527 Records review 1989 Not available 0.8-mi. (1.3-km) North
Reference: Knopf, Chad and Kari Krause, 2012

Chapter 19 - Environmental Review Historic and Cultural Resources
SHINE Medical Technologies 19.3-125 Rev. 0
Table 19.3.6-2 Eligible or Listed Archaeological Sites within a 10-mi. (16-km) Radius of the SHINE Site, Rock County, Wisconsin
(Sheet 1 of 4)
State Number
Burial Number Site Name Age
NRHP Status
RO-0130 BRO-0179 Spring Brook Burial Site Unknown Eligible
RO-0286 BRO-0127 Morgan School Enclosure Unknown Eligible
RO-0036 BRO-0126 McLenegan Group South Unknown Eligible
RO-0141 BRO-0085 McLenegan Group North Unknown Eligible
RO-0138 BRO-0111 Pierce Group Unknown Eligible
RO-0136 BRO-0110 Baarz Mounds Unknown Eligible
RO-0097 BRO-0147 Chrispinsen Mound Unknown Eligible
RO-0007 BRO-0181 Crystal and Hiawatha Springs Unknown Eligible
RO-0324 90J-W Unknown Eligible
RO-0009 Riverside Park Village Unknown Eligible
RO-0076 BRO-0176 Riverbank Quarry Burials Unknown Eligible
RO-0325 90J-X Unknown Eligible
RO-0080 BRO-0140 McElroy Trio Unknown Eligible
RO-0082 BRO-0142 Sutherland Graves Unknown Eligible
RO-0103 BRO-0150 Bailey Mounds Unknown Eligible
RO-0104 BRO-0151 Spring Brook Mounds Unknown Eligible
RO-0107 BRO-0152 Several Small Tumuli Unknown Eligible
RO-0117 BRO-0153 Woodstock Mound Group Unknown Eligible
RO-0290 BRO-0102 Rockport Park Mounds Unknown Eligible
RO-0307 Jones Unknown Eligible
RO-0126 BRO-0107 Afton Mound Group Unknown Eligible
RO-0122 BRO-? Inman Unknown Eligible
RO-0291 BRO-0099 Six House Mounds Unknown Eligible
RO-0125 BRO-0155 Reynolds Group Unknown Eligible
RO-0119 BRO-0154 Afton Mill Unknown Eligible
RO-0127 BRO-0108 Henbest Mounds Unknown Eligible
RO-0021 BRO-0116 Roth Mound Group Unknown Eligible
RO-0023 BRO-0117 Yost Mound Unknown Eligible
RO-0030 BRO-0122 Weirick Mound Group Unknown Eligible

Chapter 19 - Environmental Review Historic and Cultural Resources
SHINE Medical Technologies 19.3-126 Rev. 0
Table 19.3.6-2 Eligible or Listed Archaeological Sites within a 10-mi. (16-km) Radius of the SHINE Site, Rock County, Wisconsin
(Sheet 2 of 4)
State Number
Burial Number Site Name Age
NRHP Status
RO-0027 BRO-0119 Henderson Mound Unknown Eligible
RO-0031 BRO-0123 Adams - Duquy Unknown Eligible
RO-0143 BRO-0087 Strong Partridge Mound Group Unknown NRHP
RO-0142 BRO-0086 Joint Switch Group Unknown Eligible
RO-0034 BRO-0125 Poe Mound Unknown Eligible
RO-0144 BRO-0088 Whitfield Campsite Unknown Eligible
RO-0019 BRO-0115 Water Tower Mounds Unknown Eligible
RO-0038 BRO-0128 Jones Unknown Eligible
RO-0015 BRO-0114 Beloit College Mound Group 300-600 A.D. (un-calibrated); Date most likely between 500-900
A.D.
Eligible
RO-0039/
WO-0460(a)BRO-0129 State Line Mound Group 800-1300 A.D. Eligible
RO-0390 BRO-? Henbest Mounds Unknown Eligible
RO-0083 BRO-0141 Duplicate of RO-0104 Spring Brook Mounds
Unknown Eligible
RO-0028 BRO-0120 Baldwin Mounds Unknown Eligible
RO-0396 BRO-0174 Buells Bear Unknown Eligible
RO-0407 BRO-0172 Oakwood Cemetery Mounds Unknown Eligible
RO-0041 BRO-0131 Hillcrest Unknown Eligible
RO-0219 BRO-0173 Ho-Chunk Council House Unknown Eligible
RO-0140 BRO-0082 Murphy Group Unknown Eligible
RO-0425 BRO-0171 Nyman-Inman Burials Unknown Eligible
RO-0426 BRO-0050 Dillenback Cemetery Unknown Eligible
BRO-0076 Turtle Cemetery (aka Turtleville Cemetery)
Currently active Eligible
BRO-0078 Shopiere Cemetery (aka Bethel Cemetery)
Currently active Eligible
BRO-0077 Clinton Corners Cemetery Unknown Eligible
BRO-0167 Jack Family Cemetery Unknown Eligible

Chapter 19 - Environmental Review Historic and Cultural Resources
SHINE Medical Technologies 19.3-127 Rev. 0
Table 19.3.6-2 Eligible or Listed Archaeological Sites within a 10-mi. (16-km) Radius of the SHINE Site, Rock County, Wisconsin
(Sheet 3 of 4)
State Number
Burial Number Site Name Age
NRHP Status
BRO-0168 Murray Settlement Cemetery Unknown Eligible
BRO-0066 Newark Cemetery Currently active Eligible
BRO-0067 Unnamed Cemetery Unknown Eligible
BRO-0064 Luther valley east Cemetery Unknown Eligible
BRO-0069 Unnamed Cemetery Unknown Eligible
BRO-0070 Plymouth Cemetery (aka Hanover Cemetery)
Presently active Eligible
BRO-0068 Naugle Cemetery (aka Norwegian Cemetery; Baptist Church Cemetery)
Unknown Eligible
BRO-0044 Mount Zion Cemetery (Clarke) Unknown Eligible
BRO-0043 Emerald Grove Cemetery 1850-present Eligible
BRO-0042 Milton Lawn Memorial Park 1932-present Eligible
BRO-0053 Mt. Pleasant Cemetery Unknown Eligible
BRO-0051 Rock County Institution Cemetery
Unknown Eligible
BRO-0049 Unnamed Cemetery Unknown Eligible
BRO-0048 Mt. Olivet Cemetery 1852 Eligible
BRO-0047 Oak Hill Cemetery 1851 Eligible
BRO-0046 Unnamed Cemetery Unknown Eligible
BRO-0165 Trinity Episcopal Church Cemetery
Unknown Eligible
BRO-0045 Unnamed cemetery Unknown Eligible
BRO-0081 Indian Cemetery Unknown Eligible
BRO-0040 Grove Cemetery 1848 Eligible
BRO-0041 Bethel Cemetery (aka Disciples Cemetery; Center Cemetery)
1869-present Eligible
BRO-0018 Carver's Rock Burial 1843 Eligible
BRO-0019 Clinton Cemetery 1860-present Eligible
BRO-0088 Polander Mound Group Unknown Eligible
BRO-0122 Haggerty Mound Group Unknown Eligible

Chapter 19 - Environmental Review Historic and Cultural Resources
SHINE Medical Technologies 19.3-128 Rev. 0
Table 19.3.6-2 Eligible or Listed Archaeological Sites within a 10-mi. (16-km) Radius of the SHINE Site, Rock County, Wisconsin
(Sheet 4 of 4)
State Number
Burial Number Site Name Age
NRHP Status
BRO-0007 Oakwood Cemetery (aka Beloit Cemetery)
1840-present Eligible
BRO-0006 Calvary Catholic Cemetery 1850s Eligible
BRO-0008 East Lawn Cemetery 1919-present Eligible
BRO-0009 Isolated Grave Unknown Eligible
BRO-0010 Mt. Thabor Cemetery (aka Tabor Cemetery or Thabor Cemetery)
1952 Eligible
BRO-0011 Baldwin Cemetery Presently active Eligible
BRO-0129 Nine Mile Swallow Unknown Eligible
BRO-0005 Afton Cemetery (aka Town of Rock Cemetery)
Unknown Eligible
BRO-0012 Happy Hollow Cemetery (aka Gower or Rock Vale Cemetery)
1850s Eligible
BRO-0133 Langford Mound Unknown Eligible
a) Rock County, WI/Winnebago County, ILReferences: WHS, 2012a; IHPA, 2013
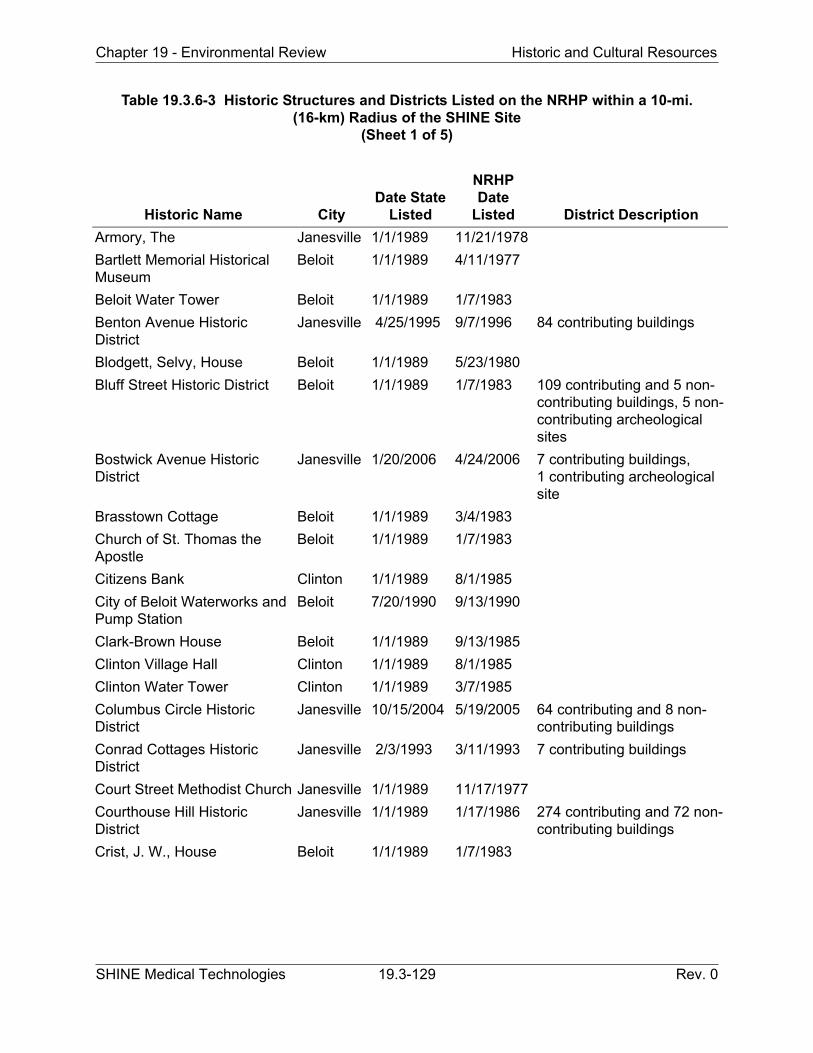
Chapter 19 - Environmental Review Historic and Cultural Resources
SHINE Medical Technologies 19.3-129 Rev. 0
Table 19.3.6-3 Historic Structures and Districts Listed on the NRHP within a 10-mi. (16-km) Radius of the SHINE Site
(Sheet 1 of 5)
Historic Name CityDate State
Listed
NRHP Date
Listed District Description
Armory, The Janesville 1/1/1989 11/21/1978
Bartlett Memorial Historical Museum
Beloit 1/1/1989 4/11/1977
Beloit Water Tower Beloit 1/1/1989 1/7/1983
Benton Avenue Historic District
Janesville 4/25/1995 9/7/1996 84 contributing buildings
Blodgett, Selvy, House Beloit 1/1/1989 5/23/1980
Bluff Street Historic District Beloit 1/1/1989 1/7/1983 109 contributing and 5 non-contributing buildings, 5 non-contributing archeological sites
Bostwick Avenue Historic District
Janesville 1/20/2006 4/24/2006 7 contributing buildings, 1 contributing archeological site
Brasstown Cottage Beloit 1/1/1989 3/4/1983
Church of St. Thomas the Apostle
Beloit 1/1/1989 1/7/1983
Citizens Bank Clinton 1/1/1989 8/1/1985
City of Beloit Waterworks and Pump Station
Beloit 7/20/1990 9/13/1990
Clark-Brown House Beloit 1/1/1989 9/13/1985
Clinton Village Hall Clinton 1/1/1989 8/1/1985
Clinton Water Tower Clinton 1/1/1989 3/7/1985
Columbus Circle Historic District
Janesville 10/15/2004 5/19/2005 64 contributing and 8 non-contributing buildings
Conrad Cottages Historic District
Janesville 2/3/1993 3/11/1993 7 contributing buildings
Court Street Methodist Church Janesville 1/1/1989 11/17/1977
Courthouse Hill Historic District
Janesville 1/1/1989 1/17/1986 274 contributing and 72 non-contributing buildings
Crist, J. W., House Beloit 1/1/1989 1/7/1983

Chapter 19 - Environmental Review Historic and Cultural Resources
SHINE Medical Technologies 19.3-130 Rev. 0
Table 19.3.6-3 Historic Structures and Districts Listed on the NRHP within a 10-mi. (16-km) Radius of the SHINE Site
(Sheet 2 of 5)
Historic Name CityDate State
Listed
NRHP Date
Listed District Description
Crosby Block Clinton 1/1/1989 8/1/1985 1 contributing building
Crosby, James B., House Janesville 4/25/1995 12/14/1998 10 contributing buildings
Dean, Erastus, Farmstead Bradford (township)
1/1/1989 12/4/1978
DeLong, Homer B., House Clinton 1/1/1989 8/1/1985
Dougan Round Barn Beloit 1/1/1989 6/4/1979
Dow, J.B., House and Carpenter Douglas Barn
Beloit 1/1/1989 1/7/1983
East Milwaukee Street Historic District
Janesville 1/1/1989 2/8/1980 7 contributing buildings
Emerson Hall Beloit 1/1/1989 9/20/1979
Fairbanks Flats Beloit 1/1/1989 1/7/1983 4 contributing buildings
First Congregational Church Beloit 1/1/1989 1/23/1975
Footville Condensery Footville 1/1/1989 5/7/1982
Footville State Bank Footville 1/1/1989 5/7/1982
Fredendall Block Janesville 1/1/1989 3/25/1982
Hanchett Block Beloit 1/1/1989 3/20/1980
Hilton House Hotel Beloit 7/18/2003 11/7/2003
Hugunin, John and Martha, House
Janesville 1/21/2005 6/1/2005
Janesville Cotton Mill Janesville 1/1/1989 7/16/1980 2 contributing buildings
Janesville High School Janesville 1/15/1999 6/25/1999
Janesville Public Library Janesville 1/1/1989 7/1/1981
Janesville Pumping Station Janesville 1/1/1989 3/7/1985
Jefferson Avenue Historic District
Janesville 1/20/2006 4/19/2006 77 contributing and 7 non-contributing buildings
Jones, John W., House Janesville 7/20/2007 3/14/2008
Lappin-Hayes Block Janesville 1/1/1989 11/7/1976

Chapter 19 - Environmental Review Historic and Cultural Resources
SHINE Medical Technologies 19.3-131 Rev. 0
Table 19.3.6-3 Historic Structures and Districts Listed on the NRHP within a 10-mi. (16-km) Radius of the SHINE Site
(Sheet 3 of 5)
Historic Name CityDate State
Listed
NRHP Date
Listed District Description
LaPrairie Grange Hall No. 79 LaPrairie (township)
1/1/1989 4/11/1977
Lathrop-Munn Cobblestone House
Beloit 1/1/1989 8/22/1977
Look West Historic District Janesville 1/1/1989 3/26/1987 547 contributing and 92 non-contributing buildings, 1 contributing archeological site
Look West Historic District Extension
Janesville 12/11/1993 12/10/1993 71 contributing and 4 non-contributing buildings
Lovejoy and Merrill-Nowlan Houses
Janesville 1/1/1989 1/21/1980 2 contributing buildings
Merrill Avenue Historic District Beloit 1/1/1989 2/19/1993 4 contributing buildings
Moran's Saloon Beloit 1/1/1989 1/7/1983
Murray-George House Turtle (township)
1/1/1989 9/13/1985
Myers-Newhoff House Janesville 1/1/1989 5/18/1979
Myers, Peter, Pork Packing Plant and Willard Coleman Building
Janesville 1/1/1989 7/7/1983 3 contributing buildings
Near East Side Historic District
Beloit 1/1/1989 1/7/1983 166 contributing and 14 non-contributing buildings, 2 contributing archeological sites, 1 contributing object
Neese, Elbert, House Beloit 1/1/1989 1/7/1983
North Main Street Historic District
Janesville 1/1/1989 7/22/1983 4 contributing buildings
Nye, Clark, House Beloit 1/1/1989 1/7/1983
Old Fourth Ward Historic District
Janesville 2/7/1990 5/30/1990 1100 contributing and 443 non-contributing buildings, 1 contributing and 1 non-contributing archeological site
Owen, William J., Store Footville 1/1/1989 5/7/1982

Chapter 19 - Environmental Review Historic and Cultural Resources
SHINE Medical Technologies 19.3-132 Rev. 0
Table 19.3.6-3 Historic Structures and Districts Listed on the NRHP within a 10-mi. (16-km) Radius of the SHINE Site
(Sheet 4 of 5)
Historic Name CityDate State
Listed
NRHP Date
Listed District Description
Pangborn, J. L., House Clinton 1/1/1989 8/1/1985
Payne-Craig House Janesville 1/1/1989 7/2/1987
Pearsons Hall of Science Beloit 1/1/1989 6/30/1980
Prospect Hill Historic District Janesville 7/22/1992 11/5/1992 115 contributing and 12 non-contributing buildings
Randall, Brewster, House Janesville 1/1/1989 3/1/1984
Rasey House Beloit 1/1/1989 12/27/1974
Rau, Charles, House Beloit 1/1/1989 8/13/1976
Richardson-Brinkman Cobblestone House
Clinton 1/1/1989 7/28/1977
Richardson, Hamilton, House Janesville 1/1/1989 7/17/1978
Rindfleisch Building Beloit 1/1/1989 1/7/1983
Shopiere Congregational Church
Turtle (township)
1/1/1989 8/13/1976
Slaymaker, Stephen, House Beloit 1/1/1989 1/7/1983
Smiley, Samuel, House Plymouth (township)
1/1/1989 10/21/1982
Smith, John, House Clinton 1/1/1989 8/1/1985
South Main Street Historic District
Janesville 4/19/1990 6/1/1990 14 contributing buildings
St. Paul's Episcopal Church Beloit 1/1/1989 4/4/1978
Stark-Clint House 1/1/1989 9/13/1985
Strang, Soloman J., House Footville 1/1/1989 5/7/1982
Strong Building Beloit 1/1/1989 1/7/1983
Strunk, John and Eleanor, House
Janesville 7/20/2007 3/11/2008
Tallman House Janesville 1/1/1989 10/15/1970
Taylor, A. E., House Clinton 1/1/1989 8/1/1985

Chapter 19 - Environmental Review Historic and Cultural Resources
SHINE Medical Technologies 19.3-133 Rev. 0
Table 19.3.6-3 Historic Structures and Districts Listed on the NRHP within a 10-mi. (16-km) Radius of the SHINE Site
(Sheet 5 of 5)
References: WHS, 2012a; WHS, 2013
Historic Name CityDate State
Listed
NRHP Date
Listed District Description
Turtleville Iron Bridge Turtle (township)
1/1/1989 9/15/1977
West Milwaukee Street Historic District
Janesville 2/19/1990 5/17/1990 54 contributing and 10 non-contributing buildings
Willard, Frances, Schoolhouse
Janesville 1/1/1989 10/5/1977
Wyman-Rye Farmstead Bradford (township)
1/1/1989 11/7/1977; 11/21/1977
2 contributing and 3 non-contributing buildings
Yates, Florence, House Beloit 1/1/1989 1/7/1983

Chapter 19 - Environmental Review Socioeconomics
SHINE Medical Technologies 19.3-134 Rev. 0
19.3.7 SOCIOECONOMICS
This subsection characterizes the current socioeconomic conditions within the region of influence (ROI) surrounding the SHINE site. It provides the basis for assessing potential socioeconomic impacts as a result of the construction and operation of the SHINE facility at the Janesville site. The socioeconomic characterization addresses demographics (resident and transient population growth rates, race and ethnicity), community characteristics (the economy, housing availability, public services, local transportation), and tax payment information.
The socioeconomic characterization is presented on a spatial and temporal (demography) basis. The appropriate nature and extent of socioeconomic characterization is described in the Final ISG Augmenting NUREG-1537, Part 1, Section 19.3.7, that requires the applicant or licensee to briefly describe socioeconomic conditions in the region (affected counties) around the proposed site, including sufficient detail to permit the assessment and evaluation of impacts from the proposed action.
Geographic Area of Analysis
For this assessment, the ROI has been established as the appropriate geographic area of analysis to support the characterization of socioeconomic baselines. The ROI corresponds to the area that incurs the greatest stresses to community services resulting from the SHINE project’s demand for construction/operations workers.
For purposes of demographic and community characteristics analysis, the ROI is considered to correspond to the residential distribution of the majority of the construction and operational workforces for the SHINE facility. As shown in Table 19.3.7-1, approximately 83 percent of the total labor force of Rock County, Wisconsin resides within Rock County. Approximately 15 percent out of the remaining 17 percent of the Rock County labor force commutes from counties adjacent to Rock County, or very nearly adjacent, including Winnebago County in Illinois (6.0 percent); and Dane County (2.9 percent), Walworth County (2.1 percent), Green County (1.9 percent), and Jefferson County (1.6 percent) in Wisconsin. This suggests that the Rock County resident population contains a large workforce that is capable of supporting both construction and operation of the SHINE facility.
Table 19.3.7-2 provides a summary of the workforce of Rock County by labor type specific to the occupation categories which are projected to require 20 or more employees at peak times in the construction schedule and subsequent operational phase. This table demonstrates that the workforce of the county is substantial in most categories of projected need for construction labor force and is likely to support the SHINE project. Also demonstrated is the fact that Rock County has a substantial labor force in the areas of industrial process operations, technical support and production management. Available data support the assumption that the local resident labor force of Rock County is capable to meet much of the demand of the SHINE project. Therefore, Rock County, WI is determined to represent the socioeconomic ROI and serves as the basis for assessment of potential project effects from construction and operation.
19.3.7.1 Demography
The demography statistics within the ROI are characterized in the following subsections. Within the ROI, there are two municipalities of greater than 25,000 population: Janesville and Beloit. Therefore, demographic analysis includes statistics for these municipalities in addition to

Chapter 19 - Environmental Review Socioeconomics
SHINE Medical Technologies 19.3-135 Rev. 0
statistics for the overall ROI. This characterization provides a description of the resident population and includes resident population from the 2000 U.S. Census Bureau (USCB), resident population from the 2010 USCB, and population projection through 2055.
Population projections at the county level are provided through 2055 to support the assessment of potential effects during the period of the facility’s operational license (30 years) and decommissioning. The initial date of operation is anticipated to be 2016. Population projections presented in this subsection are based on published county population projections through the year 2035 and are extended through the year 2055.
19.3.7.1.1 Resident Population
19.3.7.1.1.1 Resident Population of Communities in ROI
The resident population of the ROI and its 29 municipalities is 160,331. Between 2000 and 2010, the county experienced a 5.3 percent increase in population. During the same period, the city of Janesville, which is the municipality having the largest population in Rock County, grew 6.9 percent from a population of 59,498 in 2000 to 63,575 in 2010. The city of Beloit has the second greatest population within Rock County with a population of 36,966 (USCB, 2010c). Other municipalities having a population exceeding 5,000 include the town of Beloit, Edgerton, Evansville, and Milton. All other municipalities have population levels less than 5,000 with the majority being less than 2,000 (Table 19.3.7-3). The municipalities in Rock County are shown on Figure 19.3.7-1.
19.3.7.1.1.2 ROI Resident Population Growth Projection
The SHINE Operating License is expected to extend to year 2046. Population projections beyond 2035 are based on extrapolation of the county-specific growth rate of 5 percent that is the resulting equivalent rate of growth projected between 2025 and 2035 based on published projections. The resulting projections for 2045 and 2055 are shown in Table 19.3.7-4.
Population projections published by Rock County (Rock County, 2009) anticipate that the county’s population will increase by 22,313 persons between 2010 and 2035. As shown in Table 19.3.7-4, the projected population for the year 2025 is 174,018 and the projected population for the year 2035 is 182,644. The projected growth rate for this 10-year time period equates to 4.96 percent. Extrapolation of this growth rate for two additional 10-year periods yields population projections of 191,703 for the year 2045 and 201,212 for the year 2055.
19.3.7.1.1.3 Transient Population within 5 mi. (8 km)
Transient population within the 5-mi. (8-km) area around the SHINE site has been estimated. This subsection establishes an estimate of transient population within 5 mi. (8 km) from the SHINE site.
Significant sources of transient population in the 5-mi. (8-km) area around the SHINE site include major employers, schools (including elementary, middle, and high schools, colleges and universities), recreation areas, medical facilities, lodging facilities, and the SWRA. Estimation of transient populations within a given area may vary according to the time spent in the area

Chapter 19 - Environmental Review Socioeconomics
SHINE Medical Technologies 19.3-136 Rev. 0
(duration). This estimate is based on raw transient population estimates weighted according to the length of time each transient population group is expected to be in the area as follows:
• Employer and school estimates x 0.27, which assumes that each employee or student is present at the facility 9 hours per day and 5 days per week.
• Recreation area estimates x 0.33, which assumes that each daily visitor is present at the recreation area 8 hours per day.
• SWRA estimates (passengers and crew) x 0.0833, which assumes that each person is present for 2 hours for each takeoff or landing.
• Medical facilities and lodging facilities were not multiplied by a weighting factor; the assumption is that each bed at a medical facility and each room in a lodging facility is occupied 24 hours per day and 7 days per week.
The 2010 weighted transient population estimate is provided in Table 19.3.7-5. Schools and major employers account for the majority of the transients within the 5-mi. (8-km) area.
19.3.7.1.1.4 Race and Ethnicity of the Resident Population in the ROI
Race and ethnicity information is described for Rock County and for major population centers having a resident population exceeding 25,000.
Rock County’s population is predominantly white (87.6 percent). The county population in 2010 is slightly more diverse overall when compared to 2000 USCB data. In 2000, the county’s white population was 91.0 percent, and the percentages of Black or African American population (4.6 percent) and population classified by the USCB as “Some Other Race” (1.8 percent) were slightly less than 2010 USCB numbers (5.0 percent and 3.7 percent, respectively). Comparative data for persons of Hispanic origin indicate a growth rate that is higher than the statewide rate of growth but is consistent with the national trend. In 2000, the percentage of Rock County’s total population that was classified as Hispanic or Latino was 3.9 percent and in 2010, the percentage increased to 7.6 percent (Table 19.3.7-6).
The trends in the city of Janesville are similar to countywide trends, with a slightly more diverse population in 2010 than in 2000 due in part to increases of the Hispanic or Latino population (2.6 percent of the total population in 2000, compared to 5.4 percent in 2010). In addition, the percentage of Janesville’s population that is Black or African American doubled from 2000 to 2010 (1.3 percent to 2.6 percent), and the population classified as “Some Other Race” also grew, from 1.0 percent to 2.0 percent of the overall population. While there is increased diversity, approximately 92 percent of the Janesville population is white (see Table 19.3.7-6).
The city of Beloit is more diverse in comparison with Janesville and Rock County’s overall population. Beloit’s population is approximately 69 percent white, a reduction from 75.6 percent in 2000. The City’s gains in Hispanic or Latino population and population classified as “Some Other Race” are much more significant than in Janesville, Rock County, the state, and the nation. The percentage of “Some Other Race” and Hispanic populations increased in the city of Beloit from 4.6 percent to 10.0 percent and from 9.1 percent to 17.1 percent, respectively (see Table 19.3.7-6).
Total minority population percentage for a defined population reflects minority racial status in conjunction with Hispanic or Latino ethnicity. The total minority population percentage is highest

Chapter 19 - Environmental Review Socioeconomics
SHINE Medical Technologies 19.3-137 Rev. 0
in Beloit, and has increased from 28.1 percent in 2000 to 36.5 percent in 2010. This rate of increase is over twice the statewide rate of increase, and significantly greater than the national rate of increase. Janesville saw total minority population grow at approximately the same rate as the national rate of increase, reaching 11.2 percent in 2010, up from 6.1 percent in 2000. Rock County’s total minority population increase, from 10.8 percent in 2000 to 15.5 percent in 2010, was less than the national rate of increase, but greater than that for the State of Wisconsin (see Table 19.3.7-6).
19.3.7.2 Community Characteristics
The term “community characteristics” is used to describe those socioeconomic attributes that pertain to the local economy, local housing statistics, public services, infrastructure including major transportation facilities, and tax payment information. The data presented are at the level of the ROI with the exception of descriptions of some transportation infrastructure such as highways and railroads that are regional and trans-regional in nature.
19.3.7.2.1 Economy
The economy of the ROI has experienced notable change in recent years. Economic data presented in this subsection include key economic indicators and address the following economic characteristics within the ROI:
• Income• Labor force• Unemployment• Poverty rates
19.3.7.2.1.1 Income (Population and Household)
The per capita income for the ROI is $23,209, which is almost equal to that for the city of Janesville ($23,300) but less than both the statewide ($26,279) and national ($26,942) averages. The per capita income for the city of Beloit ($17,180) is markedly lower. Compared to the 2000 to 2010 rates of change for the state and the nation, the ROI, Janesville, and Beloit experienced much more notable decreases in per capita income from 2000 levels when adjusted for inflation (decreases of 12.3 percent, 17.2 percent, and 19.8 percent, respectively). Comparative state and national numbers reflect a more moderate decrease in per capita income (decreases of 2.4 percent and 1.4 percent, respectively) (Table 19.3.7-7).
Median household income in the ROI is $49,144, which represents a 14.8 percent decline from 2000 when adjusted for inflation. The 2010 median household income for Janesville ($48,257) is slightly less than the ROI, although the city’s rate of change from 2000 to 2010 is greater, a 17.1 percent decline. The city of Beloit’s median household income is comparatively lower at $37,430, which is an 18.8 percent decline from 2000 when adjusted for inflation. The 2000 ROI median household income was greater than state and national levels. The 2010 USCB data show that the ROI’s median household income ($49,144) is less than the state ($50,814) and the nation ($51,222), although the difference is not as great as that for per capita income levels (see Table 19.3.7-7).

Chapter 19 - Environmental Review Socioeconomics
SHINE Medical Technologies 19.3-138 Rev. 0
19.3.7.2.1.2 Labor Force and Unemployment
The 2012 civilian labor force in Rock County is 78,132, which represents a 5.2 percent decrease from the total labor force in 2002. In contrast, the state of Wisconsin and national labor force have increased over this same time period, at 1 percent and 6.8 percent, respectively. Although the ROI labor force has been decreasing since 2006, unemployment rates are consistently higher than the statewide total number and national unemployment rates (Table 19.3.7-8). This can be attributed mostly to layoffs by GM at its Janesville plant beginning in 2006, followed by the plant’s closure in 2008. Overall, the GM plant closure resulted in the elimination of approximately 4,700 jobs, and subsequent closures of local automotive suppliers resulted in additional job losses (SWWDB, 2009). At the ROI, state, and national levels, the number of unemployed workers has increased significantly over a 10-year period (change of 43.3 percent for county, 43.5 percent for the state, and 51.3 percent for the nation); however, the unemployment rates are much higher for the ROI, peaking at 12.8 percent in 2009 compared to 8.7 percent for the state and 9.3 percent for the nation. The most current 2012 data available show a 9.2 percent unemployment rate for the ROI, a decrease compared with the previous 3 years, but higher than both the state (7.5 percent) and the national unemployment rate (8.2 percent) (see Table 19.3.7-8).
As evidenced by the 2008 GM plant closure, a contributing factor to the higher unemployment rate in the ROI is the decline of its manufacturing base. In 2000, manufacturing was the largest employment category in the ROI (29.7 percent of total jobs in the ROI), followed by education and health services (18.6 percent) and retail trade (12.1 percent). These industry rankings are consistent with state data for 2000 (22.2 percent, 20 percent, and 11.6 percent, respectively), although in the ROI a larger percentage of employment was manufacturing-based. Since 2000, the number of manufacturing employees in the ROI has decreased by 62.9 percent, and the largest employer is now the education and health services industry. Manufacturing is estimated to currently comprise 13.9 percent of the ROI’s total jobs, compared to 16.3 percent of total jobs at the state level. Statewide there has been a significant decrease in manufacturing employment (declined by 27.1 percent); however, the manufacturing industry remains the largest employer in the state. Other industries (retail trade, transportation/warehousing/utilities, information, finance/insurance/real estate, and education and health services) also experienced employment losses at both the ROI and state level, and the rate of decline in employment for these industries is greater for the ROI than statewide. Both the ROI and statewide levels of employment in construction, mining, and natural resources declined based on comparative analysis of the 2012 estimates with 2000 data (declines of 65.1 percent and 65.4 percent, respectively) (Table 19.3.7-9). The actual change is likely not as high, however, due to the fact that the construction, mining, and natural resources category in 2000 included farm employment (under agriculture, forestry, fishing and hunting, and mining), whereas the 2012 data exclude farming. The 2012 data also do not identify a stand-alone category of construction, making it difficult to calculate the extent to which construction employment has decreased.
Industry sectors in the ROI that have experienced growth are public administration (309.7 percent increase from 2000), wholesale trade (31.2 percent increase), other services except public administration (21.1 percent increase), professional and business services (15.5 percent increase), and leisure and hospitality (10.4 percent increase) (Table 19.3.7-9).
The top 10 employers in Rock County provide an illustration of the diversity of the local economy, although manufacturing represents the smallest share of the individuals employed by the largest employers (Table 19.3.7-10).

Chapter 19 - Environmental Review Socioeconomics
SHINE Medical Technologies 19.3-139 Rev. 0
Based on comparison with the overall ROI (Rock County) employed labor force of 70,949 (see Table 19.3.7-8), the combined employment of the top 10 employers accounts for approximately 18 percent of the total ROI employment (BLS, 2012a; Rock County Development Alliance, 2011).
As shown in Table 19.3.7-10, the top employers in the city of Janesville include seven employers with greater than 500 employees: Mercy Health System, Janesville School District, Rock County Government, Wal-Mart/Sam’s Club, GHC Specialty Brands, Blackhawk Technical College, and Woodman’s Food Market, Inc. These largest employers in Janesville are in the medical, government, and retail/wholesale industries; none within the manufacturing sector. The largest manufacturing sector employers in Janesville are Seneca Foods Corporation, SSI Technologies, Inc., Prent Corporation, Simmons and HUFCOR, Inc. (Rock County Development Alliance, 2011).
19.3.7.2.1.3 Poverty Rates
In 2000, poverty rates for individuals (7.3 percent) and families (5.1 percent) in the ROI were less than rates for both the state (8.7 percent for individuals and 5.6 percent for families) and the nation (12.4 percent and 9.2 percent). Compared to the ROI, state, and nation, poverty rates for individuals and families were lower in the city of Janesville (6.5 percent and 4.3 percent) and higher in the city of Beloit (12.5 percent and 9.6 percent). In 2010, the percent of individuals (12.8 percent) and families (9.4 percent) in the ROI living below the USCB poverty threshold was greater than the comparable rates for the state of Wisconsin (12.1 percent and 8.1 percent) and less than those for the nation (14.4 percent and 10.5 percent) (Table 19.3.7-11).
While a larger percentage of individuals and families in the ROI, Janesville, Beloit, statewide, and nationwide now live below the poverty threshold than was the case in 2000, the cities of Janesville and Beloit experienced more marked increases in poverty between 2000 and 2010. In Janesville, the percent of individuals and families living below the poverty threshold more than doubled over 10 years from 6.5 percent to 13.6 percent (individuals) and 4.3 percent to 10.4 percent (families). Poverty in Beloit in this same 10-year period also increased notably, with almost a quarter of individuals living below the poverty threshold (up from 12.5 percent in 2000), and 18 percent of families living below the poverty threshold, compared to 9.6 percent in 2000. The ROI experienced greater increases in poverty relative to the state and the nation, with reported rates of 7.3 percent and 5.1 percent (individuals and families) in 2000 that increased to 12.8 percent and 9.4 percent, respectively, in 2010 (see Table 19.3.7-11).
19.3.7.2.2 Housing
Based on 2010 USCB data, the total number of housing units in the ROI is 68,392 with 62,406 occupied units and 5,986 vacant units. Additionally, the vacancy rate is 8.8 percent, which is an increase from 5.7 percent in 2000. The ROI housing vacancy rates are slightly higher than those for Janesville, which increased from 4.7 percent in 2000 to 7.9 percent in 2010. The city of Beloit’s vacancy rate (11.4 percent) is higher than vacancy rates in Janesville and the ROI. Beloit’s vacancy rate in 2000 was 6.3 percent. Vacancy rates have also increased statewide in Wisconsin and nationally. The current vacancy rate of 8.8 percent in the ROI is less than that for the state (12.6 percent) and the nation (12.7 percent) (Table 19.3.7-12).
The 2010 median home value in the ROI is $140,300, which is less than the state and the national median home value ($171,000 and $187,500, respectively). Median home values in the

Chapter 19 - Environmental Review Socioeconomics
SHINE Medical Technologies 19.3-140 Rev. 0
cities of Janesville ($135,400) and Beloit ($90,500) are lower than the median home value in the ROI. When accounting for inflation, the ROI median home value increased by 12.8 percent between 2000 and 2010, compared to 20.4 percent increase for the state of Wisconsin and 23.8 percent increase at the national level. These increases are significantly higher than those for Janesville and Beloit, which are 6.9 percent and 4.8 percent, respectively (see Table 19.3.7-12).
19.3.7.2.3 Transportation
19.3.7.2.3.1 Roads and Highways
Major highways in the ROI and in proximity to the SHINE site are shown on Figures 19.3.7-2 and 19.3.7-3, respectively.
Within the Rock County, there are three major interstate highways and several U.S. Highways (see Figure 19.3.7-2):
• I-39• I-43• I-90
I-39 and I-90 share common pavement (signed as I-39/90) across the length of the county. Additionally, Rock County is served by Interstate Highway 43 (I-43), which begins in Beloit and extends northeasterly toward Milwaukee and then north to Green Bay. In relation to the site,I-39/90 is located 2.2 mi. (3.5 km) to the east and I-43 is located approximately 6.9 mi. (11.1 km) to the southeast.
The U.S. highways include US 14 and US 51. US 14 generally extends from east to west, whereas US 51 is oriented north to south. Both highways pass through Janesville in central Rock County.
From the site, I-39/90 is accessible via US 51 and SH 11. Major highways/roadways and their pavement condition are listed below.
• US 51, a minor arterial that is oriented north-south along the west side of the site is in good condition.
• SH 11, a major collector that extends east-west just north of the site is in good condition. • I-39/90, a principal arterial that is oriented north-south about 2.2 mi. (3.5 km) east of the
site, is in fair condition.• Town Line Road, a major collector that runs east-west about 2.7 mi. (4.3 km) south of the
site, is in good condition.
Traffic volumes, obtained from the Wisconsin Department of Transportation (WisDOT), are for 2010 and are listed below (WisDOT, 2010):
• I-39/90 – 45,700 vehicles per day (vpd), south of SH 11• I-39/90 – 50,400 vpd, north of SH 11• US 51 – 9,000 vpd, south of SH 11• SH 11 – 8,400 vpd, east of US 51• SH 11 – 12,400 vpd, west of I-39/90

Chapter 19 - Environmental Review Socioeconomics
SHINE Medical Technologies 19.3-141 Rev. 0
• Town Line Road – 3,400 vpd, east of US 51
19.3.7.2.3.2 Transit
Public transportation in the city of Janesville is provided by the Janesville Transit System, which operates a regular bus service Monday through Saturday on six routes inside Janesville (City of Janesville, 2012b). Additionally, the Beloit-Janesville Express operates on weekdays between the two cities. The route of the Beloit-Janesville Express passes directly to the west of the SHINE site on US 51. The nearest stops along this route are at Kellogg Avenue to the north and at Sunny Lane to the south (City of Janesville, 2012b). The Kellogg Avenue Route extends south from the Janesville Transfer Center to Kellogg Avenue, which is approximately 2.3 mi. (3.7 km) north of the SHINE site (City of Janesville, 2012c).
19.3.7.2.3.3 Rail
The nearest railroad to the SHINE site is the Union Pacific Railroad, which is approximately 1.6 mi. (2.6 km) northeast of the site and is oriented in a northwest-to-southeast direction. The Union Pacific Railroad manages a rail yard just north of SH 11 and west of I-39/90 (see Figure 19.3.7-3). No passenger rail service is currently available in Janesville (Vandewalle & Associates, 2009a). There is no direct access to rail from the site.
19.3.7.2.3.4 Air
SWRA is a general aviation airport immediately west of the SHINE site off of US 51. The airport has three paved runways. The runways have a length of 7300 ft. (2225 m), 6701 ft. (2042 m), and 5,000 ft. (1524 m) long. The airport has more than 50,000 operations per year (landings and take-offs) and there are 94 aircraft based at the airport (Southern Wisconsin Regional Airport, 2012b). The airport recently began a project to modernize, enlarge and increase the functionality of the 50-year old terminal building. Phase one of this four-phase project began in May 2012 at a cost of $1.46 million. This last phase of construction is expected to be complete by 2014/2015 (Southern Wisconsin Regional Airport, 2012c).
19.3.7.2.4 Tax Payment Information
The construction and operation of the SHINE facility results in the payment of taxes to political jurisdictions (Table 19.3.7-13). It is probable, over the course of construction and operation, that tax payments are directly or indirectly made by SHINE to many different jurisdictions, including multiple states, due to the likelihood that some materials used for construction and operational purposes are purchased from suppliers in other states where sales taxes are applied. As discussed in Subsection 19.3.7, it is assumed that the majority of the SHINE workforce resides within the ROI (Rock County). This includes current residents of Rock County who have been contributing to the local tax base as well as some individuals and families who are anticipated to relocate to Rock County and add to the local tax base. Thus the effects of tax payments associated with development and operation of the SHINE plant are expected to be greatest on the city of Janesville, Janesville School District, and Rock County, as well as the state of Wisconsin. The tax rates for these jurisdictions are discussed below.
The state of Wisconsin has a flat corporate tax rate of 7.9 percent. Wisconsin assesses a variable tax rate on earned income. The income tax rate increases from 4.6 to 7.75 percent depending on income level and marital status. Wisconsin has a statewide sales tax rate of

Chapter 19 - Environmental Review Socioeconomics
SHINE Medical Technologies 19.3-142 Rev. 0
5 percent. An additional 0.5 percent is added by Rock County as local sales tax. Property tax on owned property is assessed at the county and municipal levels.
The property tax rates in Rock County vary among local school districts. Within the Janesville School District in the city of Janesville, the net property tax rate in 2011 was $25.0148 per $1,000 of assessed value. Of this net property tax rate, $6.4427 per $1,000 is allocated for the Rock County government, $7.0402 per $1,000 is allocated for the city of Janesville government (City of Janesville, 2012d), $10.1902 is allocated for the Board of Education, $1.8275 per $1,000 is allocated for the Blackhawk Technical College, $0.8612 per $1,000 is allocated for the Public Library System, $0.1738 per $1,000 is allocated for the state of Wisconsin, and a reduction of $1.5208 per $1,000 is applied due to state of Wisconsin tax credit. The SHINE site is located within the Janesville School District in the city of Janesville.
19.3.7.2.5 Public Services
This subsection addresses the following public services within the ROI:
• Public Water Supply and Wastewater Systems • Local Public Schools • Public Recreational Facilities
19.3.7.2.5.1 Public Water Supply and Wastewater Systems
Public Water Supplies
This subsection provides a characterization of the existing public water supplies and waste water treatment systems within the ROI. All public water supplies in Rock County are from groundwater. Table 19.3.7-14 lists the nine major municipal water suppliers that each serve communities in Rock County. Six of the nine municipal water systems in Rock County have a wellhead protection plan, including Clinton, Evansville, Footville, Janesville, Milton, and Orfordville. Wellhead protection ordinances are in place for only Evansville and Janesville (USGS, 2007).
The water systems serving the largest populations are those in Beloit and Janesville. In addition to the public water systems, numerous private wells provide drinking water to residents not connected to municipal water supplies.
The Janesville Water Utility provides water supply for both public drinking water and for fire protection utilizing eight wells. The water supply system for the city of Janesville includes two water storage reservoirs and one water tower. According to the city of Janesville, the total pumping capacity of its eight groundwater wells is 29 Mgd (109.8 Mld). Average water usage is about 11 Mgd (41.6 Mld). Accordingly, the excess capacity of the Janesville water supply system is approximately 18 Mgd (68.1 Mld).
Public water supplies within Wisconsin are monitored to ensure public health protection, whereas individual well owners are responsible for monitoring and testing private wells. The public water use index for Rock County is 80 (Table 19.3.7-15), which estimates how many people are served by public water supplies. A number greater than 50 means more people are served by public water versus private wells.

Chapter 19 - Environmental Review Socioeconomics
SHINE Medical Technologies 19.3-143 Rev. 0
Wastewater Treatment Systems
Waste water treatment is provided by local jurisdictions. Table 19.3.7-16 details public waste water treatment systems, their permitted capacities, and their average daily usage for each community in Rock County. Sewage within the city of Janesville is collected from about 300 mi. (483 km) of sewer main, and treated at a plant off Afton Road, near the City’s south- west corner. The treatment plant has an average design peak flow of 25 Mgd (94.6 Mld). The average daily discharge flow is 13 Mgd (49.2 Mld). Accordingly, the excess capacity of the Janesville wastewater treatment system is approximately 12 Mgd (45.4 Mld) (Vandewalle & Associates, 2009a).
19.3.7.2.5.2 Local Public Schools
Rock County is served by eight local public school districts, in addition to one state of Wisconsin facility (Table 19.3.7-17). Current student enrollment is 27,807. The Janesville School District has an enrollment of 10,325. Collectively, the school districts operate 39 elementary schools, 11 middle schools, and 15 high schools. Three additional schools are classified as elementary/,
providing classes from kindergarten or first grade through 12th grade (DPI, 2012).
The closest public schools to the SHINE site, defined as those within 2.5 mi. (4 km), are units of the Janesville School district and are located to the north of the SHINE site: Janesville Academy for International Studies (20 enrollment), Jackson Elementary School (325 enrollment), Lincoln Elementary School (397 enrollment), and Edison Middle School (724 enrollment). Janesville Academy for International Studies is located at 2909 Kellogg Avenue, Jackson Elementary School is located at 441 West Burbank Avenue, Lincoln Elementary School is located at 1821 Conde Street, and Edison Middle School is located at 1649 South Chatham Street (Janesville School District, 2012).
Other educational institutions are located in the vicinity of the SHINE site. Private schools located within 2.5 mi. (4 km) of the SHINE site include Rock County Christian School (111 enrollment), and Oakhill Christian School (69 enrollment). Higher education institutions located within 2.5 mi. (4 km) of the SHINE site include Blackhawk Technical College (Janesville Aviation Center and Janesville Central Campus), and the University of Wisconsin-Rock County.
19.3.7.2.5.3 Public Recreational Facilities
Figure 19.3.7-4 and Table 19.3.7-18 identify the major recreational facilities within the ROI and provide information relative to their distance from the SHINE site. Rock County owns and maintains 888.2 ac. (359.4 ha) of park space (Design Perspectives Inc., 2009). The county parks are classified as regional parks, community parks, and trails. Other community and regional recreational facilities in the county are owned and maintained by the city of Janesville and the city of Beloit. Janesville maintains 64 improved parks, 10 of which are regional or community parks (City of Janesville, 2012f). Beloit’s park system is comprised of 42 parks, including one regional park and four community parks (Vandewalle & Associates, 2006). The WDNR owns and maintains 17,000 ac. (6879.7 ha) of State Wildlife Areas, which are open to the public for recreational use, including seasonal hunting. As is illustrated in Figure 19.3.7-4, each of the State Wildlife Areas is located a minimum of 10 mi. (16 km) from the SHINE site (WDNR, 2009).

Chapter 19 - Environmental Review Socioeconomics
SHINE Medical Technologies 19.3-144 Rev. 0
Regional and community parks in the Rock County, Janesville, and Beloit park systems are identified on Table 19.3.7-18 and shown on Figure 19.3.7-4. Included is indication of the distance from each park to the SHINE site and the recreational purpose of each park in terms of active (recreation facilities such as ball fields and recreation centers) or passive (recreation facilities such as trails and picnic facilities). One park, Airport Park, is located within 1 mi. (1.6 km) of the SHINE site. It is a two-acre (0.8-ha) passive use park with picnic tables, benches, and a picnic shelter (Design Perspectives Inc., 2009). Eight parks are located at distances between 1 mi. and 5 mi. (1.6 km and 8 km) from the SHINE site; they include a mix of passive and active recreational amenities (Table 19.3.7-18).
Trails in the area of the SHINE site are primarily for recreational use. The city of Janesville manages the South Connector Trail, a multi-use trail that runs adjacent to the north of, and parallel to, SH 11 from west of the Rock River eastward to near the Union Pacific Railroad. There are no direct trail connections or marked bike routes to the SHINE site. Rock County also maintains 226 mi. (364 km) of snowmobile trails, with the nearest snowmobile trail located approximately 2.4 mi. (3.9 km) south of the site.
Though not classified as public recreational facilities, there are two private golf facilities within the immediate area of the SHINE site. Glen Erin Golf Course (1417 W. Airport Road) is located immediately southwest of the site (adjacent to the south of SWRA), and Mid City Golf Range (4337 S. US 51) is located immediately south of the site.

Chapter 19 - Environmental Review Socioeconomics
SHINE Medical Technologies 19.3-145 Rev. 0
Table 19.3.7-1 Rock County Labor Force Distribution by County of Employee Residence
County of Employee Residence State
Rock County Labor Force
Number Percent
Rock County WI 56,850 82.9%
Winnebago County IL 4,095 6.0%
Dane County WI 1,990 2.9%
Walworth County WI 1,455 2.1%
Green County WI 1,325 1.9%
Jefferson County WI 1,090 1.6%
Milwaukee County WI 265 0.4%
Boone County IL 250 0.4%
Stephenson County IL 85 0.1%
Reference: American Association of State Highway and Transportation Officials (AASHTO), 2012

Chapter 19 - Environmental Review Socioeconomics
SHINE Medical Technologies 19.3-146 Rev. 0
Table 19.3.7-2 Comparison of Estimated Major SHINE Labor Force Needs with Estimated Rock County Available Work Force
Occupation
SHINE Peak
Need(a)Estimate of Labor Force Availability
in Rock County(b)
Construction PhaseBoilermaker 24 No DataCarpenter 45 360Electrician 55 190Ironworker 50 No DataLaborer 70 340Equipment Operator/Eng. 26 130Plumber/Pipefitter 70 70Sheet Metal Worker 30 80(c)
Construction Supervisor 20 160Total Construction Labor
Force(d)420
Operational PhaseOperation Support 40 340 first-line supervisors of production
and operating workersProductions/Operations 37 110 industrial production managers
Tech Support(e) 40 500 maintenance, 90 engineers, 2,000 craftspeople
Total Operational Labor
Force(d)150
b) Rock County labor force estimate from BLS, 2011 unless otherwise notedc) Labor force estimates from BLS, 2009; no data available for 2011d) SHINE total labor force estimate at peak month includes all labor categoriese) Tech support subcategories include: maintenance (machinery maintenance
workers and general maintenance and repair workers), engineers (industrial engineers and mechanical drafters), and craftspeople (janitors and cleaners, landscaping and groundskeepers, electricians, plumbers and pipefitters, industrial
References: Bureau of Labor Statistics (BLS), 2009 and BLS, 2011

Chapter 19 - Environmental Review Socioeconomics
SHINE Medical Technologies 19.3-147 Rev. 0
Table 19.3.7-3 Population and Growth Rates of Municipalities within Rock County
MunicipalityPopulation
2000Population
2010Observed Growth
Rate (%)Town
Avon 586 608 3.8%Beloit 7,038 7,662 8.9%Bradford 1,007 1,121 11.3%Center 1,005 1,066 6.1%Clinton 893 930 4.1%Fulton 3,158 3,252 3.0%Harmony 2,351 2,569 9.3%Janesville 3,750 3,434 -8.4%Johnstown 802 778 -3.0%La Prairie 929 834 -10.2%Lima 1,312 1,280 -2.4%Magnolia 854 767 -10.2%Milton 2,844 2,923 2.8%Newark 1,571 1,541 -1.9%Plymouth 1,270 1,235 -2.8%Porter 925 945 2.2%Rock 3,338 3,196 -4.3%Spring Valley 813 746 -8.2%Turtle 2,444 2,388 -2.3%Union 1,860 2,099 12.8%
VillageClinton 2,162 2,154 -0.4%Footville 788 808 2.5%Orfordville 1,272 1,442 13.4%
CityBeloit 35,775 36,966 3.3%
Broadhead(a) N/A 90Edgerton 4,891 5,364 9.7%Evansville 4,039 5,012 24.1%Janesville 59,498 63,575 6.9%Milton 5,132 5,546 8.1%
Total Rock County 152,307 160,331 5.3%
a) 2000 data for Broadhead, Rock County is unavailable. The majority of Broadhead is located in Green County, WI.
References: USCB, 2000a; USCB, 2010c

Chapter 19 - Environmental Review Socioeconomics
SHINE Medical Technologies 19.3-148 Rev. 0
Table 19.3.7-4 Resident Population Distribution, Growth Rates, and Projections for Rock County
County
Population Projected Population(a)
2000 2010
2000-2010
Growth Rate (%) 2015 2025 2035 2045 2055
2015-2055 Projected Growth Rate (%)
Rock County 152,307 160,331 5.3 165,354 174,018 182,644 191,703 201,212 21.7
a) The growth rate of 4.96 percent per ten year time period, calculated based on the projected ten year growth from 2025 and 2035 published projections, is extrapolated to determine projections for the years 2045 and 2055
References: Rock County, 2009; USCB, 2000a; and USCB, 2010d

Chapter 19 - Environmental Review Socioeconomics
SHINE Medical Technologies 19.3-149 Rev. 0
Table 19.3.7-5 Estimated Transient Population within 5 mi. (8 km) of the SHINE Site (2010)
Transient SourceNumber of Facilities
Raw Population Estimate
Weighted Population Estimate
Major Employers 14 9,841 2,657Schools, Colleges, Universityies
32 14,860 4,014
Recreation Areas 43 1,366 451Medical Facilities 21 717 717Lodging Facilities 3 149 149Total 113 26,933 8,073(a)
a) Total Weighted Population Estimate includes passengers, crew, and all employees of various companies at the SWRA which are not included in any individual transient source subtotal.

Chapter 19 - Environmental Review Socioeconomics
SHINE Medical Technologies 19.3-150 Rev. 0
Table 19.3.7-6 Demographic (Race and Ethnicity) Characteristics of Rock County
Location YearTotal
Population
Population by Race (%)
Per
son
s o
f H
isp
anic
O
rig
in
Wh
ite
Min
ori
ty
Po
pu
lati
on
(i
ncl
ud
ing
H
isp
anic
Bla
ck o
r A
fric
an
Am
eric
an
Am
eric
an In
dia
n
and
Ala
ska
Nat
ive
Asi
an
Nat
ive
Haw
aiia
n
and
Oth
er P
acif
ic
Isla
nd
er
So
me
Oth
er
Rac
e
City of Janesville
2000 59,498 95.3 6.1 1.3 0.2 1.0 0 1 2.6
2010 63,575 91.7 11.2 2.6 0.3 1.3 0 2 5.4
% Change 6.9 -3.6 5.1 1.3 0.1 0.3 0 1 2.8
City of Beloit
2000 35,775 75.6 28.1 15.4 0.4 1.2 0.1 4.6 9.1
2010 36,966 68.9 36.5 15.1 0.4 1.1 0 10 17.1
% Change 3.3 -6.7 8.4 -0.3 0 -0.1 -0.1 5.4 8
Rock County
2000 152,307 91.0 10.8 4.6 0.3 0.8 0 1.8 3.9
2010 160,331 87.6 15.5 5.0 0.3 1.0 0 3.7 7.6
% Change 5.3 -3.4 4.7 0.4 0 0.2 0 1.9 3.7
State of WI
2000 5,363,675 88.9 12.7 5.7 0.9 1.7 0 1.6 3.6
2010 5,686,986 86.2 16.7 6.3 1.0 2.3 0 2.4 5.9
% Change 6.0 -2.7 4.0 0.6 0.1 0.6 0 0.8 2.3
Nation
2000 281,421,906 75.1 30.9 12.3 0.9 3.6 0.1 5.5 12.5
2010 308,745,538 72.4 36.3 12.6 0.9 4.8 0.2 6.2 16.3
% Change 9.7 -2.7 5.4 0.3 0 1.2 0.1 0.7 3.8
References: USCB, 2000a and 2010a
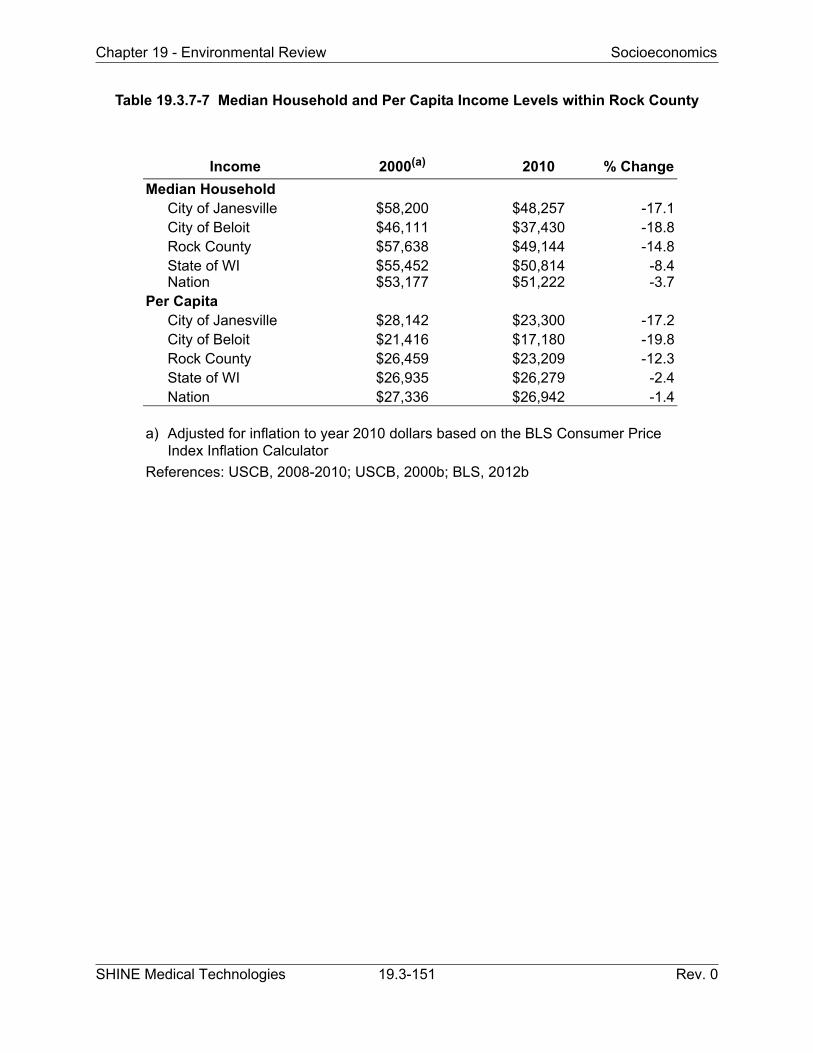
Chapter 19 - Environmental Review Socioeconomics
SHINE Medical Technologies 19.3-151 Rev. 0
Table 19.3.7-7 Median Household and Per Capita Income Levels within Rock County
Income 2000(a) 2010 % Change
Median HouseholdCity of Janesville $58,200 $48,257 -17.1City of Beloit $46,111 $37,430 -18.8Rock County $57,638 $49,144 -14.8State of WI $55,452 $50,814 -8.4Nation $53,177 $51,222 -3.7
Per Capita City of Janesville $28,142 $23,300 -17.2City of Beloit $21,416 $17,180 -19.8Rock County $26,459 $23,209 -12.3State of WI $26,935 $26,279 -2.4Nation $27,336 $26,942 -1.4
a) Adjusted for inflation to year 2010 dollars based on the BLS Consumer Price Index Inflation Calculator
References: USCB, 2008-2010; USCB, 2000b; BLS, 2012b

Chapter 19 - Environmental Review Socioeconomics
SHINE Medical Technologies 19.3-152 Rev. 0
Table 19.3.7-8 Civilian Labor Force and Unemployment Rates within Rock County, 2002-2012
2002 2003 2004 2005 2006 2007 2008 2009 2010 2011 2012(a)
Growth Rate (%)
2002-12
Rock County
Labor Force 82,433 82,488 82,729 83,608 84,664 84,619 83,459 82,874 80,965 78,687 78,132 -5.2
Employed 77,422 77,391 78,071 78,665 80,410 79,979 78,283 72,274 71,891 71,223 70,949 -8.4
Unemployed 5,011 5,097 4,658 4,943 4,254 4,640 5,176 10,600 9,074 7,464 7,183 43.3
Unemployment Rate (%)
6.1 6.2 5.6 5.9 5.0 5.5 6.2 12.8 11.2 9.5 9.2
State of Wisconsin
Labor Force 3,021,068 3,033,674 3,020,402 3,035,808 3,077,096 3,096,926 3,089,376 3,115,357 3,082,676 3,062,259 3,049,702 1.0
Employed 2,860,915 2,862,587 2,868,376 2,890,117 2,932,482 2,948,725 2,939,773 2,842,916 2,821,803 2,833,431 2,819,901 -1.4
Unemployed 160,153 171,087 152,026 145,691 144,614 148,201 149,603 272,441 260,873 228,828 229,801 43.5
Unemployment Rate (%)
5.3 5.6 5.0 4.8 4.7 4.8 4.8 8.7 8.5 7.5 7.5
United States
Labor Force(b) 144,863 146,510 147,401 149,320 151,428 153,124 154,287 154,142 153,889 153,617 154,707 6.8
Employed(b) 136,485 137,736 139,252 141,730 144,427 146,047 145,362 139,877 139,064 139,869 142,034 4.1
Unemployed(b) 8,378 8,774 8,149 7,591 7,001 7,078 8,924 14,265 14,825 13,747 12,673 51.3
Unemployment Rate (%)
5.8 6.0 5.5 5.1 4.6 4.6 5.8 9.3 9.6 8.9 8.2
a) Through March 2012.b) Numbers in thousandsReference: BLS, 2012a

Chapter 19 - Environmental Review Socioeconomics
SHINE Medical Technologies 19.3-153 Rev. 0
Table 19.3.7-9 Employment by Industry within Rock County
Employment Industry2000 2012(a) 2000-2012
Change (%)Number Percent Number PercentRock County
Construction, Mining and Natural Resources(b) 5,738 7.5 2,000 3.3 -65.1
Agriculture, Forestry, Fishing and Hunting, and Mining 1,314 1.7 No data No data --Construction 4,424 5.8 No data No data --
Manufacturing 22,640 29.7 8,400 13.9 -62.9Wholesale Trade 2,592 3.4 3,400 5.6 31.2Retail Trade 9,270 12.1 8,300 13.8 -10.5Transportation, Warehousing, Utilities 3,499 4.6 2,600 4.3 -25.7Information 1,497 2.0 1,100 1.8 -26.5Finance, Insurance, Real Estate 3,029 4.0 2,000 3.3 -34.0Professional and Business Services 3,724 4.9 4,300 7.1 15.5Education and Health Services 14,197 18.6 10,400 17.2 -26.7Leisure and Hospitality 5,162 6.8 5,700 9.5 10.4Other Services (except Public Administration) 2,889 3.8 3,500 5.8 21.1Public Administration 2,099 2.7 8,600 14.3 309.7State of Wisconsin
Construction, Mining and Natural Resources(b) 237,043 8.7 81,900 3.0 -65.4
Agriculture, Forestry, Fishing and Hunting, and Mining 75,418 2.8 No data No dataConstruction 161,625 5.9 No data No data
Manufacturing 606,845 22.2 442,300 16.3 -27.1Wholesale Trade 87,979 3.2 115,700 4.3 31.5Retail Trade 317,881 11.6 287,400 10.6 -9.6Transportation, Warehousing, Utilities 123,657 4.5 97,400 3.6 -21.2Information 60,142 2.2 46,000 1.7 -23.5Finance, Insurance, Real Estate 168,060 6.1 155,500 5.7 -7.5Professional and Business Services 179,503 6.6 280,900 10.4 56.5Education and Health Services 548,111 20.0 416,000 15.3 -24.1Leisure and Hospitality 198,528 7.3 235,600 8.7 18.7Other Services (except Public Administration) 111,028 4.1 134,100 4.9 20.8Public Administration 96,148 3.5 420,100 15.5 336.9
a) Through April 2012b) 2012 figures reflect non-farm employment and do not isolate “construction,” contrasted to 2000 data.References: USCB, 2000b; Department of Workforce Development (DWD), 2012

Chapter 19 - Environmental Review Socioeconomics
SHINE Medical Technologies 19.3-154 Rev. 0
Table 19.3.7-10 Top 10 Employers within the ROI (Rock County), City of Janesville
EmployerNumber of Employees Percent Product/Service
Top 10 Employers within Rock County
Mercy Health System(a) 3,687 29.0 Medical Services
Beloit Health System 1,486 11.7 Medical Services
Janesville School District 1,368 10.8 Public Education
Rock County 1,170 9.2 Government
Hendricks Holdings (ABC et. al.) 857 6.7 Wholesale Distributor
Beloit School District 849 6.7 Public Education
Wal-Mart/Sam’s Club(a) 855 6.7 Retail
GHC Specialty Brands 843 6.6 Wholesale Distributor
Blackhawk Technical College 825 6.5 Educational Services
Kerry Americas(a) 759 6.0 Food Products
Total 12,699 100.0
Top 10 Employers within the City of Janesville
Mercy Health System(a) 3,687 34.8 Medical Services
Janesville School District 1,368 12.9 Public Education
Rock County 1,170 11.1 Government
Wal-Mart/Sam’s Club(a) 855 8.1 Retail
GHC Specialty Brands 843 8.0 Wholesale Distribution
Blackhawk Technical College 825 7.8 Public Education
Woodman’s Food Market, Inc. 541 5.1 Retail
Lemans Corporation 450 4.3 Wholesale Distribution
J.P. Cullen & Sons 432 4.1 Construction
Seneca Foods Corporation 415 3.9 Food Processing
Total 10,586 100.0
Top 5 Manufacturing Sector Employers within the City of Janesville
Seneca Foods Corporation 415 26.0 Food Processing
SSI Technologies, Inc. 382 23.9 Metal Components and Sensors
Prent Corporation 342 21.4 Plastic Parts
Simmons 239 15.0 Mattresses
HUFCOR, Inc. 220 13.8 Accordion Doors & Walls
Total 1,598 100.0
a) Employees located at multiple locations
Reference: Rock County Development Alliance, 2011

Chapter 19 - Environmental Review Socioeconomics
SHINE Medical Technologies 19.3-155 Rev. 0
Table 19.3.7-11 Percent of Individuals and Families Living Below the Census Poverty Threshold within Rock County
Category 2000 (%) 2010 (%)
IndividualsCity of Janesville 6.5 13.6City of Beloit 12.5 21.8Rock County 7.3 12.8State of WI 8.7 12.1Nation 12.4 14.4
Families City of Janesville 4.3 10.4City of Beloit 9.6 18.0Rock County 5.1 9.4State of WI 5.6 8.1Nation 9.2 10.5
Reference: USCB, 2008-2010; USCB, 2000b

Chapter 19 - Environmental Review Socioeconomics
SHINE Medical Technologies 19.3-156 Rev. 0
Table 19.3.7-12 Housing Unit Characteristics within Rock County
Housing Category 2000 20102000-2010
ChangeCity of Janesville
Total Number of Units 25,083 27,433 9.4%Number of Occupied Units 23,894 25,259 5.7%Number of Vacant Units 1,189 2,174 82.8%Vacancy Rate 4.7% 7.9% 3.2%
Median Value(a) $126,630 $135,400 6.9%
City of BeloitTotal Number of Units 14,262 15,330 7.5%Number of Occupied Units 13,370 13,583 1.6%Number of Vacant Units 892 1,747 95.9%Vacancy Rate 6.3% 11.4% 5.1%
Median Value(a) $86,361 $90,500 4.8%
Rock CountyTotal Number of Units 62,187 68,392 10.0%Number of Occupied Units 58,617 62,406 6.5%Number of Vacant Units 3,570 5,986 67.7%Vacancy Rate 5.7% 8.8% 3.1%
Median Value(a) $124,350 $140,300 12.8%
State of WisconsinTotal Number of Units 2,321,144 2,612,299 12.5%Number of Occupied Units 2,084,544 2,282,507 9.5%Number of Vacant Units 236,600 329,792 39.4%Vacancy Rate 10.2% 12.6% 2.4%
Median Value(a) $142,078 $171,000 20.4%
NationTotal Number of Units 115,904,641 131,210,606 13.2%Number of Occupied Units 105,480,101 114,596,927 8.6%Number of Vacant Units 10,424,540 16,613,679 59.4%Vacancy Rate 9.0% 12.7% 3.7%
Median Value(a) $151,449 $187,500 23.8%
a) Adjusted for inflation to year 2010 dollars based on the BLS Consumer Price Index Inflation Calculator
References: BLS, 2012a, USCB, 2008-2010; USCB, 2000a; USCB, 2000b

Chapter 19 - Environmental Review Socioeconomics
SHINE Medical Technologies 19.3-157 Rev. 0
Table 19.3.7-13 Tax Rates in Rock County and State of Wisconsin
a) Includes County, City, Janesville School District Board of Education, and Other (Blackhawk Vocational Technical Adult Education (VTAE) – 1.8275, Public Library – 0.8612, State – 0.1738, State Tax Credit – -1.5208)
References: City of Janesville, 2012d; Department of Revenue (DOR), 2011; and DOR, 2012
Location
Corporate Tax Rate
(%)
Income Tax Rate(%)
Property Tax Rate (Dollars per $1,000 value)
Sales Tax Rate (%)County City
Board of Education Net(a)
Rock County
n/a n/a 6.4427 7.0402 10.1902 25.0148 0.50
State of WI 7.9 4.6-7.75 5.0

Chapter 19 - Environmental Review Socioeconomics
SHINE Medical Technologies 19.3-158 Rev. 0
Table 19.3.7-14 Major Municipal Water Suppliers in Rock County
Reference: USGS, 2007
MunicipalWater System
WellheadProtection Plan
WellheadProtection Ordinance
City of Beloit No No
Clinton Waterworks Yes No
Edgerton Waterworks No No
Evansville Waterworks Yes Yes
Footville Waterworks Yes No
Fulton Utility District No No
Janesville Water Utility Yes Yes
Milton Waterworks Yes No
Orfordville Waterworks Yes No

Chapter 19 - Environmental Review Socioeconomics
SHINE Medical Technologies 19.3-159 Rev. 0
Table 19.3.7-15 Rock County Community Water Supply Characteristics (2010)
Groundwater Population
Surface Water Population
Population Served
County Population
Public Water Use Index
122,585 0 122,585 152,307 80
Reference: Wisconsin Department of Health Services, 2010

Chapter 19 - Environmental Review Socioeconomics
SHINE Medical Technologies 19.3-160 Rev. 0
Table 19.3.7-16 Public Wastewater Treatment Systems in Rock County
a) Vandewalle & Associates, 2009a
References: USEPA, 2008 and Vandewalle & Associates, 2009a
Treatment Facility/ Project
Name
Existing Total Flow(Mgd)
Present Design Total Flow
(Mgd)
ExcessCapacity
(Mgd)
ExcessCapacity(Percent)
Beloit WWTP 9.00 11.00 2.00 18%
Clinton STP 0.13 0.38 0.25 66%
Edgerton STP 0.53 0.70 0.17 25%
Evansville WWTP 0.45 0.60 0.16 26%
Footville STP 0.08 0.11 0.03 28%
Janesville WWTP(a) 13.00 25.00 12.00 48%
Milton STP 0.38 0.63 0.25 40%
Orfordville STP 0.12 0.40 0.28 70%
Consolidated Koshkonong STP
0.42 0.60 0.18 30%
Plymouth #1STP 0.02 0.03 0.01 33%
Beloit, Town 0.45 0.65 0.21 32%

Chapter 19 - Environmental Review Socioeconomics
SHINE Medical Technologies 19.3-161 Rev. 0
Table 19.3.7-17 Public School Enrollment (2012) within Rock County
DistrictStudent
Enrollment
Number of Schools
ElementaryElementary/Secondary
Middle School
High School
Beloit School District 6,967 11 2 2 3
Beloit Turner School District
1,461 2 0 1 1
Clinton Community School District
1,190 1 0 1 1
Edgerton School District 1,786 2 0 1 1
Evansville Community School District
1,775 2 0 1 1
Janesville School District 10,325 13 0 3 6
Milton School District 3,363 5 0 1 1
Parkview School District 940 3 0 1 1
WI Department of Public Instruction
0 0 1 0 0
Total, Rock County 27,807 39 3 11 15
Reference: Department of Public Instruction (DPI), 2012

Chapter 19 - Environmental Review Socioeconomics
SHINE Medical Technologies 19.3-162 Rev. 0
Table 19.3.7-18 Recreation Facilities within Rock County (Sheet 1 of 2)
Park
Amenities AcreageDistance from
SHINE Site
Passive Active ac. ha mi. km
Regional Parks
Rock County
Beckman Mill County Park 51.6 20.9 10.8 17.4
Carver-Roehl Park 52 21.0 10.2 16.4
Gibbs Lake Park X 286.6 116.0 13.6 21.9
Happy Hollow Park X 191.2 77.4 1.9 3.1
Lee Park X X 40 16.2 11.3 18.2
Magnolia Bluff Park X 112.1 45.4 18.1 29.1
Murwin Park X 42 17.0 13.9 22.4
City of Janesville
Northeast Regional Park X 87 35.2 7.4 11.9
Palmer Park X 164 66.4 4 6.4
Riverside Park X X 87 35.2 6.3 10.1
Rockport Park X X 246 99.6 3.4 5.5
City of Beloit
Big Hill Memorial Park X 197.2 79.8 4.7 7.6
Community Parks
Rock County
Airport Park X 2 0.8 0.5 0.8
Avon Park X 17 6.9 16.8 27.0
Koshkonong Lake Access X 12.7 5.1 15.4 24.8
Ice Age Park X 3.4 1.4 8.8 14.2
Indianford Park X 1.2 0.5 12.8 20.6
Royce Dallman Park X 2.3 0.9 15.3 24.6
Schollmeyer Park X 1 0.4 5.5 8.9
Sugar River Park X 6.5 2.6 16.1 25.9
Sweet-Allyn Park X X 39 15.8 5.5 8.9
Walt Lindemann Sportsman’s Park X X 10 4.0 6.9 11.1
City of Janesville
Bond Park X 12 4.9 4 6.4
Kiwanis Community Park X 9 3.6 6.4 10.3
Lustig Park X 32 12.9 3 4.8
Monterey Park X 42 17.0 3.2 5.1
Optimist Community Park 35 14.2 5.1 8.2
Traxler Park X 27 10.9 4.6 7.4
City of Beloit
Krueger Recreation Area X 15.7 6.4 7.1 11.4
Leeson Park X 41.5 16.8 7.7 12.4
Riverside Park X 24.9 10.1 7.7 12.4
Telfer Park X 28.8 11.7 6.3 10.1

Chapter 19 - Environmental Review Socioeconomics
SHINE Medical Technologies 19.3-163 Rev. 0
Table 19.3.7-18 Recreation Facilities within Rock County (Sheet 2 of 2)
ParkAmenities Length(a)
Distance from SHINE Site
Passive Active mi. km mi. kmRock County Trails
South Connector Trail X 4.0 6.4 0.8 1.3Ice Age Connector Trail X 3.7 6.0 7.7 12.4Pelishak-Tiffany Nature Trail X 6.0 9.7 9.7 15.6
Hanover Wildlife Area1 X 17.6 7.1 6.8 10.9
a) Hanover Wildlife Area is measured in acres/hectares
References: City of Janesville, 2012c; City of Janesville, 2012f, Design Perspectives Inc, 2009, and Vandewalle & Associates, 2006

Chapter 19 - Environmental Review Human Health
SHINE Medical Technologies 19.3-164 Rev. 0
19.3.8 HUMAN HEALTH
This subsection describes the existing public and occupational health issues.
19.3.8.1 Maps of Potentially Sensitive Surrounding Facilities
Figures 19.3.8-1 and 19.3.8-2 show distances from the proposed action to the following points or areas:
• Nearest full-time resident.• Nearest sensitive receptors.
- Educational facilities- Medical facilities- Community centers- Animal production facilities- Parks- Religious institutions
The site boundary distances to these locations are summarized in Table 19.3.8-1.
The nearest site boundary is approximately 300 m (0.19 mi.) east of the production facility building centerpoint (see Figure 19.2.1-1).
The nearest drinking water intake is an active, drilled, private well (Wisconsin unique well number MF461) located northwest of the site at 1112 W. Knilans Road, Janesville, Wisconsin, 53545.
19.3.8.2 Background Radiation Exposure
The major sources and levels of background radiation exposure, both natural and man-made, are discussed in this subsection.
Based on the information contained in the following subsections, there are no abnormal radiation hazards in the vicinity of the SHINE site; therefore, the background radiation exposure due to both natural and man-made sources is 6.2 millisievert per year (mSv/yr) (620 millirem [roentgen equivalent man] per year [mrem/yr]) (NRC, 2012a).
19.3.8.2.1 Natural Sources
The U.S. Nuclear Regulatory Commission (NRC) divides natural sources of radiation into three categories: cosmic, internal, and terrestrial. Cosmic radiation is the result of radiation received from extraterrestrial sources, such as the sun and other stars, that penetrate the Earth’s atmosphere. Internal radiation is the result of naturally occurring potassium-40 (K-40) and carbon-14 (C-14) in all humans. Lastly, terrestrial radiation is the result of dose received from naturally occurring uranium, thorium, and radium found in soil and rock. Also, radon gas seeps through the ground and into the air where it is inhaled; this source represents the majority of the background radiation for an average member of the public (NRC, 2012b).

Chapter 19 - Environmental Review Human Health
SHINE Medical Technologies 19.3-165 Rev. 0
Based on information in the following subsections, there are no natural features of the SHINE site vicinity that would place natural background radiation at levels higher than the United States average. Therefore, the public receives an average natural background dose of 3.1 mSv/yr (310 mrem/yr) (NRC, 2012a).
19.3.8.2.1.1 Cosmic Radiation
Cosmic radiation exposure depends on the site elevation. The terrain in the vicinity of the SHINE site is relatively flat, and the site elevation is well within the national elevation average. Therefore, it is appropriate to use the average annual dose due to cosmic radiation, 0.31 mSV/yr (31 mrem/yr) (NRC, 2012a).
19.3.8.2.1.2 Internal Radiation
There are no above-normal sources of radioactivity contained in the food and water consumed in Janesville, Wisconsin based on publicly available USEPA data (USEPA, 2009). The average annual dose due to internal radiation, 0.31 mSv/yr (31 mrem/yr), is applicable (NRC, 2012a).
19.3.8.2.1.3 Terrestrial Radiation
The national average for terrestrial radiation, 2.48 mSv/yr (248 mrem/yr), which includes uranium, thorium, radium, and radon gas, is applicable to the vicinity of the SHINE site (NRC, 2012a).
19.3.8.2.2 Man-Made Sources
Man-made sources of radiation consist of medical sources, consumer products, and nuclear power sources. Medical procedures (e.g., X-rays, whole body CT scans, nuclear medicine procedures) account for a vast majority of the man-made radiation received annually. Consumer products, such as smoke detectors, televisions, and combustible fuels, also contribute to man-made radiation dose. Lastly, nuclear fuel cycle facilities (from uranium mining and milling to the disposal of spent nuclear fuel), nuclear power plants, and the transportation of radioactive material contribute to man-made radiation dose (NRC, 2012c).
Based on the information in the following subsections, there are no abnormal sources of radiation located in the vicinity of the SHINE site; therefore, the public receives an average dose due to man-made radiation sources of 3.1 mSv/yr (310 mrem/yr) (NRC, 2012a).
19.3.8.2.2.1 Medical Sources
The area surrounding the SHINE site contains three medical facilities: First Choice Women’s Health Center, Mercy Clinic South, and Mercy Hospital, which are all located in Janesville, Wisconsin (see Table 19.3.8-1). First Choice Women’s Health Center does not provide services that utilize ionizing radiation. Mercy Clinic South provides imaging services to patients (MHS, 2012a). Mercy Hospital provides modern medical services to patients that include imaging services, radiation oncology, and nuclear medicine (MHS, 2012b).
Those members of the public who are employed at Mercy Hospital or Mercy Clinic South may receive a higher dose due to medical sources than that of the average citizen medical dose, an

Chapter 19 - Environmental Review Human Health
SHINE Medical Technologies 19.3-166 Rev. 0
average total dose of 2.98 mSv/yr (298 mrem/yr), but the medical workers do not receive a dose in excess of the occupational limits set in 10 CFR 20, 0.05 Sv/yr (5 rem/yr) (NRC, 2012a).
19.3.8.2.2.2 Consumer Products
Ionizing radiation dose from the use of consumer products will fluctuate based on the lifestyle of the individual in question; therefore, a best estimate of the average annual dose due to consumer products, 0.12 mSv/yr (12 mrem/yr), is used (NRC, 2012a).
19.3.8.2.2.3 Nuclear Reactor Facilities
The contribution to man-made radiation from nuclear reactor facilities in the proposed action area is small. There are no nuclear fuel cycle facilities in the area; however, I-39/90 is approximately 2 mi. (3.2 km) from the site boundary, so there may be some radiation received from the transportation of radioactive material along that roadway. Railroads surround the proposed action area on all but the southeast sides, so transportation of radioactive materials along the railroads may contribute additional doses.
In addition, the SHINE site is located between two nuclear reactors: Exelon’s Byron Station (a two-unit pressurized water reactor (PWR) with a total net electrical generation of 2336 megawatts [MWe]) and the University of Wisconsin Nuclear Reactor (UWNR) research facility (variable thermal power up to 1 MWt) (Exelon, 2012; UWNR, 2011a). Byron Station is located approximately 40 mi. (64 km) south-southwest of the project facility (Google, 2012). Based on off-site dose calculations from Byron Station, the dose to the public near the SHINE site is very low due to the distance between the site and Byron Station (TBEES, 2011). Similarly, the UWNR is approximately 37 mi. (60 km) north-northwest of the project facility, and the dose to the public is very low due to the distance between the UWNR and the SHINE site (Google, 2012; UWNR, 2011b).
19.3.8.3 Description of Radioactive and Nonradioactive Liquid, Gaseous, and Solid Waste Management Effluent Control Systems
There are no radioactive materials currently stored on the site or within the vicinity of the SHINE site; therefore, there are no radioactive effluent control systems on or within the vicinity of the site. See Subsection 19.3.8.8 for a description of nearby nuclear reactor facilities’ radioactive effluent monitoring programs.
Nonradioactive liquid, gaseous, and solid waste effluents from facilities in the vicinity of the SHINE site report hazardous effluents to the USEPA (USEPA, 2012e).
19.3.8.4 Information on Radioactive and Nonradioactive Effluents Released to the Environment
There are no radioactive materials stored on the site; therefore, there are no radioactive effluents released to the environment on-site. Mercy Hospital stores medical isotopes for use in their nuclear medicine program (MHS, 2012b). See Subsection 19.3.8.2.2.3 for a discussion of nearest operating nuclear reactor facilities’ radioactive releases.

Chapter 19 - Environmental Review Human Health
SHINE Medical Technologies 19.3-167 Rev. 0
See Table 19.3.8-2 for a list of hazardous materials stored within 5 mi. (8 km) of the SHINE site. It is assumed that any of these materials could be released to the environment in the vicinity of the SHINE site.
19.3.8.5 Radioactive and Nonradioactive Hazardous Material Stored On-Site or within the Vicinity
There are no radioactive materials currently stored on the site. Mercy Hospital stores medical isotopes for use in their nuclear medicine program (MHS, 2012b).
There are no hazardous industrial materials stored on the site. However, since the SHINE site is currently used for agricultural purposes (see Subsection 19.3.4.1.1.3), chemical fertilizers and pesticides may have been used on the site. See Table 19.3.8-2 for a list of hazardous material stored within 5 mi. (8 km) of the SHINE site.
19.3.8.6 Current On-Site or Nearby Sources and Levels of Exposure to Members of the Public and Workers from Radioactive Materials
There are no existing radioactive materials currently stored on-site; therefore there is no exposure to the public.
Mercy Hospital is the only facility in the vicinity of the SHINE site that possesses radioactive material. Patients at the hospital may be exposed to this radiation in a planned and controlled manner based on professionally prepared treatments. See Subsection 19.3.8.2.2.1 for the average annual radiation dose from medical facilities.
There may be some radiation dose received from the transportation of radioactive material along I-39/90, which is located approximately 2 mi. (3.2 km) east of the site boundary. Railroads surround the proposed action area on all but the southeast sides, so transportation of radioactive materials along the railroads may contribute additional doses. Contributions from these sources are discussed in Subsection 19.3.8.2.2.3.
19.3.8.7 Historical Exposures to Radioactive Materials to Both Workers and Members of the Public
There are no recordable incidents involving radioactive material in the vicinity of the SHINE site (USEPA, 2012e).
Any historical exposure to radioactive material would come from treatment in the Mercy Hospital nuclear medicine department. Patients at the hospital may have been historically exposed to this radiation in a planned and controlled manner, based on professionally-prepared treatments.
19.3.8.8 Description of Nearby Operating Facilities’ Effluent Monitoring Programs
Exelon’s Byron Station submits an annual radiological environmental operating report to the NRC, and the most recent results of the radiological environmental monitoring program are approximately the same as those found during the pre-operational studies conducted at Byron Station. Liquid effluents from Byron Station are released to the Rock River in controlled batches after radioassay of each batch. Gaseous effluents are released to the atmosphere and are calculated on the basis of analyses of weekly grab samples and grab samples of batch releases

Chapter 19 - Environmental Review Human Health
SHINE Medical Technologies 19.3-168 Rev. 0
prior to the release of noble gases as well as continuously-collected composite samples of iodine and particulate radioactivity sampled during the course of the year. The results of effluent analyses are summarized on a monthly basis. Airborne concentrations of noble gases, iodine-131 (I-131), and particulate radioactivity in off-site areas are calculated using isotopic composition of effluents and meteorological data. C-14 concentration in off-site areas is calculated based on industry-approved methodology for estimation of the amount released and meteorological data. (TBEES, 2011)
Environmental monitoring is conducted by sampling at indicator and control (background) locations in the vicinity of Byron Station to measure changes in radiation or radioactivity levels that may be attributable to station operation. If significant changes attributable to Byron Station are measured, these changes are correlated with effluent releases. An environmental monitoring program is conducted which also includes all potential pathways at the site. Gaseous pathways include ground plane (direct), inhalation, vegetation, meat, and milk. Liquid pathways include potable water and freshwater fish. The critical pathway for 2010 gaseous dose was vegetation. The critical pathway for 2010 liquid dose was freshwater fish. (TBEES, 2011)
The UWNR effluent monitoring program uses Landauer Luxel brand area monitors located in areas surrounding the reactor laboratory. Liquid effluents are monitored, recorded, and discharged to the sanitary sewer from the facility. Exhaust effluents are monitored, recorded, and discharged through the UWNR stack. Solid waste is monitored, recorded, and transferred to the UW Broad Scope license for ultimate disposal in accordance with the UWNR radioactive materials license. Quantities of released effluents are reported in the UWNR annual operating report. (UWNR, 2011b)
19.3.8.9 Relevant Occupational Injury Rates and Occupational Fatal Injury Rates
Occupational injury and fatal injury rates for occupations relevant to the construction, operation, and decommissioning of the SHINE facility are discussed in this subsection.
Recent BLS data, which lists the national incidence rates of nonfatal occupational injuries and illnesses by industry, was consulted to estimate relevant occupational injury rates for the SHINE project. The incidence rate is defined as the number of injuries and illnesses per 100 full-time workers. For this estimate the incidence rate of the total number of recordable cases was used. During the construction and decommissioning phases, the total number of recordable cases for construction workers in the construction industry is 3.9 per 100 full-time workers. During the operation phase, SHINE employees work in environments found in multiple industries, therefore, the total number of recordable cases for all industries (3.8 per 100 full-time workers), is used to estimate the occupational injury rate for SHINE employees. (BLS, 2012c)
Comparable BLS data exists for national occupational fatal injury rates. The BLS defines fatal injury rates as the number of fatal occupational injuries per 100,000 full-time equivalent workers. For the construction industry, the fatal injury rate is estimated to be 8.9 per 100,000 full-time equivalent workers. As discussed above, SHINE employees work in varying environments, so the fatal injury rate for all industries (3.5 per 100,000 full-time equivalent workers) is used to estimate the occupational fatal injury rate for SHINE employees. (BLS, 2012d)

Chapter 19 - Environmental Review Human Health
SHINE Medical Technologies 19.3-169 Rev. 0
Table 19.3.8-1 Distance to Nearest Agricultural and Urban Facilities
Facility Type Location of InterestDistance to SHINE
Site Boundary
Residential Nearest Full-Time Resident 0.33 mi. (0.53 km)
Park
Airport Park 0.30 mi. (0.48 km)
Paw Print Park 1.16 mi. (1.87 km)
Burbank Park 1.38 mi. (2.22 km)
Medical
First Choice Women’s Health Center 1.37 mi. (2.20 km)
Mercy Clinic South 1.58 mi. (2.54 km)
Mercy Hospital 4.21 mi. (6.78 km)
Educational
Roessel Aviation 0.78 mi. (1.26 km)
Blackhawk Technical College Aviation Center 0.89 mi. (1.43 km)
Rock County Christian School 1.14 mi. (1.83 km)
Jackson Elementary School 1.28 mi. (2.06 km)
Community Kids Learning Centers 1.36 mi. (2.19 km)
Community Center
Caravilla Education and Rehabilitation Comm Center
1.62 mi. (2.61 km)
Religious Institutions
Iglesia Hispania Pentecostes 0.35 mi. (0.56 km)
Summit Baptist Church 1.37 mi. (2.20 km)
Animal Production
Dairy Production 0.51 mi. (0.82 km)
Horse Pasture 0.52 mi. (0.84 km)
Goat Production 0.69 mi. (1.11 km)
MacFarland Pheasants, Inc. 0.86 mi. (1.38 km)
Beef Production Area 0.97 mi. (1.56 km)

Chapter 19 - Environmental Review Human Health
SHINE Medical Technologies 19.3-170 Rev. 0
Table 19.3.8-2 Chemicals Used/Stored Within Five Miles of the Site(Sheet 1 of 4)
List of Chemicals
No. 2 Diesel Fuel
No. 2 Fuel Oil
1,2,3-Propanetriol
10-34-0 Ammonium Polyphosphate Solution
2,2-Dimethypropane – 1,3-Diol
2-Ethylhexnol
2-Phenoxyethanol
4,4-Diphenylmethane Diisocyanate
77-80% Calcium Chloride
AC-101
Acetic Acid
Acrylamide Copolymer
Adogen
Alkyl Dimethylamine C1295
Aminoethylethanolamine
Anhydrous Ammonia
Ammonium Hydroxide Solution (29%)
Ammonium Polyph, 4%N 10%P205 10%K20 1%S, .25
Ammonium Polyphosphate Potassium Chloride
Ammonium Polyphosphate Potassium Hydro
Ammonium Polyphosphate Potassium Hydroxide, 6-24-6
Ammonium Polyphosphate Potassium Solution
Ammonium Polyphoste Potassium Chloride
Anionic Asphalt Emulsion
Ammonium Thiosulfate
Aromatic Polyester Polyol
Arosurf
Battery Acid
Battery Electrolyte

Chapter 19 - Environmental Review Human Health
SHINE Medical Technologies 19.3-171 Rev. 0
Table 19.3.8-2 Chemicals Used/Stored Within Five Miles of the Site (Sheet 2 of 4)
List of Chemicals
Benzoic Acid
Benzyl Chloride
Biodiesel
Chlorine
D-36 Condensate Treatement
Diary Acid #5W
De-icing Fluid
Diesel Fuel
Diethyloxyester Dimethylammonium Chloride
Diethanolamine
Diethyl Sulfate
Diethylene Glycol
Diethylene Triamine
Dihydrogenated Tallowmethyl Amine
Dimethyl C12 Amine 95%
Dimethyl C16 Amine 95%
Dimethyl Sulfate
Dimethylamineopropylamine
DXP 5522-048
DXP 5522-131
DXP 5558-66
DXP 5536-094
Ethyl Alcohol
Ethyl Mercaptan
Ethylene Oxide
Fatty Acid C8-C18
Fatty Alcohol C12-C18
Fertilizer Rinsatc
Fertilizer, Commercial BlenD Liquid N-P-K
Furfuryl Alcohol

Chapter 19 - Environmental Review Human Health
SHINE Medical Technologies 19.3-172 Rev. 0
Table 19.3.8-2 Chemicals Used/Stored Within Five Miles of the Site (Sheet 3 of 4)
List of Chemicals
Gasoline
Glyphosphate
Herbicide
Hubercarb Q200 (Calcium Carbonate)
Hydrogen
Hydrogen Peroxide
INDULIN 747
Isopropanol
Jet Fuel
Lauric Acid 1299
Liquified Petroleum Propane
Metam-Sodium
Methoxypolyglycol Basic
Methyl Chloride
Methyldiethanolamine
N-Butyl Alcohol
Nitric Acid
Oleic Acid
P&G Code 10020418
P&G Code 65163
Pesticides/Insecticides
Peracetic Acid
Phosphoric Acid
Polyethylene Glycol
POLYHEED 997
Polyol
Potassium Chloride
Potassium Hydroxide
Propylene Glycol
Propylene Oxide

Chapter 19 - Environmental Review Human Health
SHINE Medical Technologies 19.3-173 Rev. 0
Table 19.3.8-2 Chemicals Used/Stored Within Five Miles of the Site (Sheet 4 of 4)
List of Chemicals
Propane
QUESTAR CAF
REWOCOROS AC 100 US
REWODERM S 1333
REWOPAL 12
REWOQUAT (WE 18, E US, WE 28 US, WE 16, CQ 100)
REWOTERIC AM TEG
Road Saver Sealants
Sodium Bisulfate
Sodium Bisulfite
Sodium Hydroxide
Sodium Hypochlorite
Soft Tallow Diester
Solvent Blend 19205
Sorbitan Trioleate
Stearic Acid
Styrene
Sulfuric Acid
TEGO IL IMES
TEGO AMID S 18
TEGOTENS EC 11
TEGOSOFT PBE
Triethanolamine
Urea
Various Oils
Varamide
Varine O
Variquat
Varisoft
Varonic