Shifting trends: detecting environmentally mediated regulation in long-lived marine vertebrates...
27
Shifting trends: detecting environmentally mediated regulation in long-lived marine vertebrates using time-series data Clive R. McMahon 1, 2, 3 , Marthán N. Bester 1 , Mark A. Hindell 3 , Barry W. Brook 4 and Corey J. A. Bradshaw 4, 5 (1) Department of Zoology and Entomology, Mammal Research Institute, University of Pretoria, Pretoria, Gauteng, Republic of South Africa (2) School for Environmental Research, Institute of Advanced Studies, Charles Darwin University, Darwin, NT, 0909, Australia (3) Antarctic Wildlife Research Unit, School of Zoology, University of Tasmania, Private Bag 05, Hobart, TAS, 7001, Australia (4) Research Institute for Climate Change and Sustainability, School of Earth and Environmental Sciences, University of Adelaide, Adelaide, SA, 5005, Australia (5) South Australian Research and Development Institute, P.O. Box 120, Henley Beach, Adelaide, SA, 5022, Australia Clive R. McMahon Email: [email protected] Communicated by Jean-Michel Gaillard. Abstract Assessing the status and trends in animal populations is essential for effective species conservation and management practices. However, unless time-series abundance data demonstrate rapid and reliable fluctuations, objective appraisal of directionality of trends is problematic. We adopted a multiple-working hypotheses approach based on information-theoretic and Bayesian multi-model inference to examine the population trends and form of intrinsic regulation demonstrated by a long-lived species, the southern elephant seal. We also determined the evidence for density dependence in 11 other well- studied marine mammal species. (1) We tested the type of population regulation for elephant seals from Marion Island (1986–2004) and from 11 other marine mammal species, and (2) we described the trends and behavior of the 19-year population time series at Marion Island to identify changes in population trends. We contrasted five plausible trend models using information-theoretic and Bayesian-inference estimates of model parsimony. Our analyses identified two distinct phases of population growth for this population with the inflexion occurring in 1998. Thus, the population decreased between 1986 and 1997 (-3.7% per annum) and increased between 1997 and 2004 (1.9% per annum). An index of environmental stochasticity, the Southern Oscillation Index, explained some of the variance in r and N. We determined analytically that there was good evidence for density dependence in the Marion Island population and that density dependence was widespread among marine mammal species (67% of species showed evidence for population regulation). This approach demonstrates the potential functionality of a relatively simple technique that can be applied to short time series to
Transcript of Shifting trends: detecting environmentally mediated regulation in long-lived marine vertebrates...

Shifting trends: detecting environmentally mediated regulation in long-lived marine vertebrates using time-series data Clive R. McMahon1, 2, 3 , Marthán N. Bester1, Mark A. Hindell3, Barry W. Brook4 and Corey J. A. Bradshaw4, 5
(1) Department of Zoology and Entomology, Mammal Research Institute, University of Pretoria, Pretoria, Gauteng, Republic of South Africa
(2) School for Environmental Research, Institute of Advanced Studies, Charles Darwin University, Darwin, NT, 0909, Australia
(3) Antarctic Wildlife Research Unit, School of Zoology, University of Tasmania, Private Bag 05, Hobart, TAS, 7001, Australia
(4) Research Institute for Climate Change and Sustainability, School of Earth and Environmental Sciences, University of Adelaide, Adelaide, SA, 5005, Australia
(5) South Australian Research and Development Institute, P.O. Box 120, Henley Beach, Adelaide, SA, 5022, Australia
Clive R. McMahon Email: [email protected]
Communicated by Jean-Michel Gaillard. Abstract Assessing the status and trends in animal populations is essential for effective species conservation and management practices. However, unless time-series abundance data demonstrate rapid and reliable fluctuations, objective appraisal of directionality of trends is problematic. We adopted a multiple-working hypotheses approach based on information-theoretic and Bayesian multi-model inference to examine the population trends and form of intrinsic regulation demonstrated by a long-lived species, the southern elephant seal. We also determined the evidence for density dependence in 11 other well-studied marine mammal species. (1) We tested the type of population regulation for elephant seals from Marion Island (1986–2004) and from 11 other marine mammal species, and (2) we described the trends and behavior of the 19-year population time series at Marion Island to identify changes in population trends. We contrasted five plausible trend models using information-theoretic and Bayesian-inference estimates of model parsimony. Our analyses identified two distinct phases of population growth for this population with the inflexion occurring in 1998. Thus, the population decreased between 1986 and 1997 (−3.7% per annum) and increased between 1997 and 2004 (1.9% per annum). An index of environmental stochasticity, the Southern Oscillation Index, explained some of the variance in r and N. We determined analytically that there was good evidence for density dependence in the Marion Island population and that density dependence was widespread among marine mammal species (67% of species showed evidence for population regulation). This approach demonstrates the potential functionality of a relatively simple technique that can be applied to short time series to

identify the type of regulation, and the uncertainty associated with the phenomenon, operating in populations of large mammals.
Introduction Assessing the trends in an animal population is the cornerstone of effective species conservation and management (see Caughley 1994 for a review). However, unless time-series abundance data (which are often necessarily collected over relatively short time spans) demonstrate rapid and reliably measured fluctuations, the objective appraisal of directionality of a trend can be problematic (Barker and Sauer 1992; Thomas 1996). Furthermore, population trends can be driven by intrinsic (density dependence) and extrinsic (e.g., food limitation) factors simultaneously, and ‘corrupted’ by measurement and sampling error (Holmes and Fagan 2002; Freckleton et al. 2006), such that identifying the mechanisms underlying population change is typically difficult. Untangling the potentially confounding effects of these factors is essential for effective conservation and recovery plans because density-dependent processes exert strong control over predictions of extinction risk and population viability (Ginzburg et al. 1990).
The historic difficulty in detecting density dependence has recently been improved using multi-model inference approaches (Brook and Bradshaw 2006); however, detection is still highly dependent on the number of generations over which a particular species is monitored (Brook and Bradshaw 2006) and the amount of measurement error associated with abundance indices (Freckleton et al. 2006). This is particularly important for long-lived animals for which even a decade or more of reliable time-series data may still only span a few generations. From a more applied perspective, the identification of where in a time series important changes in trends occur has been addressed recently with the application of smoothing algorithms (Thomas 1996; Fewster et al. 2000). However, recent approaches using generalized additive models (GAM) (e.g., Fewster et al. 2000) that test for changes in abundance to identify when trend fluctuations occur fail to incorporate model uncertainty or deal robustly with issues of parsimony because they rely on often single, over-parameterized models.
One species of long-lived and wide-ranging predator, the southern elephant seal (Mirounga leonina), demonstrated consistent and large decreases in population size through most of its breeding range between the 1950s and 1990s (McMahon et al. 2005). These decreases are thought to be the consequence of large-scale environmental change affecting food availability (Hindell 1991; McMahon et al. 2003). Recently, there have been assertions that at least some populations may now be increasing, and environmental conditions originally responsible for the decreases in populations may have ameliorated (Guinet et al. 1999; Slip and Burton 1999; Pistorius et al. 2001; McMahon et al. 2005). Southern elephant seals are an ideal candidate species for testing the combined effects of intrinsic and extrinsic factors on population trends for large, long-lived species because (1) they range over wide areas of the Southern Ocean (Bester 1988, 1989; Campagna et al. 1999; Hindell et al. 2003b; Bradshaw et al. 2004) and therefore, their life history (growth and survival) reflects the productivity of large oceanic ecosystems (McMahon et

al. 2003), and (2) they return to their natal islands annually and predictably, so population assessment via direct counts and tag-resighting methods is relatively straightforward.
Previous assertions that variation in elephant seal population rates of change are indicative of density-regulated stabilization (Pistorius et al. 2001) have been challenged for small populations due to (1) the reliability of methods used to detect changes in trend data and (2) the apparent inability to identify regulatory mechanisms for small populations (Bradshaw et al. 2002). The number of individuals comprising the well-studied Marion Island (subantarctic Indian Ocean) population of southern elephant seals has decreased by approximately 87% from 3,662 pups born in 1951 to 488 in 2004; however, detailed time-series data from the last decade suggest that the decline is slowing, if not reversing (Pistorius et al. 2001).
In this paper we re-address the time-series data available for the adult female component of the Marion Island population of southern elephant seals from 1986 to 2004: (1) to assess specifically the evidence for density-regulated and environmentally mediated variation in the population rate of change using a multi-model inference approach (Brook and Bradshaw 2006); (2) to identify if and where in the time series there is a reversal in the decline using multi-model inference to identify shifts in population trends and the relative contribution of environmental stochasticity; (3) examine the evidence for density dependence in other long-lived marine mammals as a point of comparison; (4) to explore whether it is possible to infer regulation mechanics and processes from short (relative to generation length) time series. Given the evidence for shifting demographic patterns in the Marion Island population (age at primiparity—Pistorius et al. 2001) and the low expected measurement error of annual census data (see “Methods”), this population represents a good example to test how density regulation modifies abundance trends in long-lived marine predators.
Methods Population census
At Marion Island (46°52�34�S, 37°51�32�E) a complete count of all adult female seals was done on a single day (15 October) annually from 1986 to 2004; this is the standard method for population estimates in southern elephant seals (Laws 1994). In all years, harem females at Marion Island were counted by two observers. Because elephant seals are capital breeders and remain ashore during the breeding season, we are confident that the shore counts are representative of the total number of female seals breeding (see also McMahon and Bradshaw 2004). When individual counts differed, subsequent counts were done until the final tallies were identical. Harems at Marion Island are small (mean number female seals per harem = 23; Wilkinson and van Aarde 1999), so observation error in count data is expected to be low and highly representative of the total number of females present on breeding beaches (Condy 1978). Furthermore, because the same counting protocols were followed in each year of the study, it is unlikely that any temporal shift in the minimal predicted error exists. All female seals were counted (rather

than estimated), and <40 seals per harem were counted at any one time. These conditions suggest that observation error is negligible. We contend therefore that the minimal observation error does not obscure the density-dependent signal inherent in the time-series data.
Analysis
Previous methods used to examine the evidence for density dependence from time-series data have generally ignored model-selection uncertainty, even though there is no single population dynamical framework that can be applied to all taxa (Brook and Bradshaw 2006). Therefore, we adopted a multiple-working hypotheses approach based on information-theoretic and Bayesian multi-model inference (Burnham and Anderson 2002) and an a priori model set of five population dynamics models (Brook and Bradshaw 2006) commonly used to describe phenomenological time-series data that represent components of previous Neyman–Pearson hypothesis tests (Saether et al. 2002; Turchin 2003).
The model set was based on variants of the generalized �-logistic population growth model:
(1)
where N t = population size at time t, r = realized population growth rate, r m = maximal intrinsic population growth rate, K = carrying capacity, and � permits a non-linear relationship between rate of increase and abundance. The term � t has a mean of zero and a variance (� 2) that reflects environmental variability in r. All models below were fitted assuming process error, and hence initial population size did not need to be estimated as a separate parameter. Density-independent model variants used were (1) non-directional population fluctuations with a normally distributed error term (‘random walk;’ Foley 1994) where r m = 0 with a single parameter estimated: �; (2) the standard geometric Malthusian growth model (May 1975) with a normally distributed error term (‘exponential’; � = −�, r m and � estimated). Density-dependent model variants used were (3) a stochastic form of the Ricker logistic model with one fixed parameter � = 1 and three parameters to be estimated, r m , K and � (Dennis and Taper 1994); (4) the stochastic Gompertz-logistic model where density-dependence is proportional to the log of abundance (Reddingius 1971; Pollard et al. 1987), with r m, log e [K], log e [N t ], � = 1, and �; (5) the generalized �-logistic growth model (Gilpin and Ayala 1973) with r m, K, �, and �. In the linear/log-linear variants of the model (Ricker- and Gompertz-logistic), variance is estimated as:
where q = number of transitions and � = the linear slope of r t versus N t .
For each species, we used maximum-likelihood estimation to fit model parameters via linear regression for random walk, exponential for Ricker-logistic and Gompertz-logistic

models, and non-linear regression using Nelder–Mead optimization for the �-logistic model (Dennis and Taper 1994; Saether et al. 2002). The �-logistic model optimization was initiated with parameter estimates of r m , K and � derived from a simulation routine analogous to the approach employed by Sibly et al. (2005). We first set a vector ranging from near 0 to twice the maximum observed r or N (for the r m and K vectors, respectively) and near 0–10 for the � vector. Each vector had 50 intervals between minimum and maximum values. For each of the 50 × 50 × 50 (125,000) combinations of r m , K and �, we calculated predicted r using Eq. 1 and the log-likelihood, and stored the successively larger values of the latter. The combination of r m , K and � producing the maximum log-likelihood were subsequently used as the starting parameters for the Nelder–Mead optimization of Eq. 1 (implemented using the optim function in R Language (R Development Core Team 2004).
We used an index of Kullback–Leibler (K–L) information loss and a Bayesian inferential estimate to assign relative strengths of evidence to the different competing models (Burnham and Anderson 2002): Akaike’s information criterion corrected for small sample sizes (AIC c ) and the dimension-consistent Bayesian Information Criterion (BIC). The latter measure was included because BIC can be used to justify AIC weighting, which tends to favor the more complex models when sample sizes are large (Burnham and Anderson 2004; Link and Barker 2006). The relative likelihoods of candidate models were calculated using AIC c and BIC weights (Burnham and Anderson 2002). Thus, the weight (wAIC c and wBIC) of any particular model varies from 0 (no support) to 1 (complete support) relative to the entire model set.
For the Marion Island elephant seal population, we contrasted a suite of models incorporating both intrinsic and extrinsic variables to explain variation in population rate of change. The underlying intrinsic component of the model was based on the Gompertz-logistic (GL Model 1) given it received the highest ranking relative to the other dynamical models (see “Results”). To this Gompertz form we incorporated both additive and interaction terms describing environmental variability (GL Models 2 and 3, respectively)—the average Southern Oscillation Index (SOI) between the months of February and October (corresponding to the adult female’s over-wintering foraging trip). The SOI has been shown previously to be correlated with pup survival the following year (McMahon and Burton 2005). Another GL model variant allowed for carrying capacity (K) to fluctuate as a function of SOI (GL Model 3 ‘K-ratio;’ see Hone and Clutton-Brock 2007). Finally, we combined GL Models 2 and 3 to explain variance in r and K simultaneously:
(2)
To test the hypothesis that the Marion Island elephant seal population has recently changed from a decreasing to an increasing one, we applied a series of linear and non-linear models to the time-series data and assessed the evidence for any change in the trend over time. We also included an index of environmental variation in the models considered to examine the relative contribution of inter-annual environmental

stochasticity on temporal variation in N. We again used the average SOI between the months of February and October as an index of environmental fluctuation.
We constructed an a priori set of six models that could conceivably describe a multitude of plausible changes in population trends. These included (1) an intercept model that assumed no trend over time (y = a); (2) an SOI-only model (y = SOI); (3) an exponential model that describes a monotonic trend over time (y = ae x ); (4) the exponential model including SOI (y = ae x + SOI); (5) a quadratic model that describes a shift in trend (e.g., declining to increasing or vice-versa) (y = a + bx + cx 2); and the quadratic model including SOI (y = a + bx + cx 2 + SOI). Although many variants of these models could be applied, we chose the three basic model structures representing the array of plausible biological hypotheses. All models were compared using wAIC c and wBIC as described above for the phenomenological analysis determining evidence for density dependence. In the case of models describing changes to population trends over time (quadratic), we calculated the first derivative and solved for zero to identify the point of inflexion (i.e., the time when the population trend shifted). To estimate confidence intervals for this inflexion point, we repeated the above analysis 10,000 times using a jack-knife procedure where each iteration removed a random point in the time series data. The final jack-knife confidence intervals were determined using model-averaged predictions based on the information-theoretic and Bayesian inference weights calculated at each iteration.
Other marine mammal time series To test for the prevalence of density dependence as determined from time-series data in marine mammals, we compiled a set of time-series abundance data for another 11 well-studied marine mammal species for which extensive series were available (Fig. 1). A strict set of filtering and transformation criteria was applied to the larger database prior to the extraction of the marine mammal data: (1) time series were required to contain at least eight annual abundance transitions (q), (2) counts were from single species, (3) all transformed values (e.g., log) were back-transformed to raw numbers, (4) where a single zero or sequence of zeros occurred in a time series, the first zero in each run of zeros was converted to the lowest non-zero abundance measure for that time series, and (5) abundance measures in each time series were required to fluctuate over at least four different values (full details in Brook et al. 2006). Applying these filtering criteria ensured that multiple generations of each species were assessed. Because generation times were not available for all of the species examined, we used a surrogate measure of the number of generations over which monitoring occurred by dividing the number of population transitions within a series by the age at first breeding (Brook and Bradshaw 2006). For each of these time series, we applied the multi-model inference approach described above to assess the evidence for density dependence and an index of its strength by the percent deviance explained in observed r.

Fig. 1 Time series of 11 marine mammal populations used to investigate the evidence for density dependence in seals and whales: a southern elephant seals (Mirounga leonina), b northern elephant seals (M. angustirostris), c Hawaiian monk seals (Monachus schauinslandi), d harbor seals (Phoca vitulina), e harp seals (P. groenlandica), f grey seals (Halichoerus grypus), g South African fur seals (Arctocephalus pusillus pusillus), h northern fur seals (Callorhinus ursinus), i Stellers sea lions (Eumetopias jubatus), j Florida manatees (Trichechus manatus) and (k) grey whales (Eschrichtius robustus). See text for references
All qualifying marine mammal species (i.e., those that met the above criteria) from the database were included in our analysis here: southern elephant seals from Macquarie Island (n = 21 years; de Little et al. 2007); northern elephant seals (Mirounga angustirostris) in California (n = 21; NOAA NMFS 2000); harp seals (Phoca groenlandica) in Canada (n = 48; Colman 1949); grey seals (Halichoerus grypus) in the Baltic Sea (n = 26; Tormosov and Rezvov 1977); harbor seals (Phoca vitulina) in the western USA (n = 22; Jeffries et al. 2003); Hawaiian monk seals (Monachus schauinslandi; n = 12; Gerrodette and Gilmartin 1990); Steller sea lions (Eumetopias jubatus) in Alaska (n = 21; Alaska Fisheries Science Center 2002); northern fur seals (Callorhinus ursinus) in Alaska (n = 43; Poland 1892); South African fur seals (Arctocephalus pusillus pusillus; n = 78; Warneke and Shaughnessy 1985); grey whales (Eschrichtius robustus) in the North Pacific (n = 19; Gerber et al. 1999); manatees

(Trichechus manatus) in Florida (n = 28; Florida Fish and Wildlife Conservation Commission 2003).
We compared model-averaged maximum rates of population increase (r m ) predicted from the r versus N relationships to maximum intrinsic rates of population growth derived from age-classified models to validate our predictions. Using data from various published sources (McLaren 1967; Reiter and Le Boeuf 1991; York 1994; Caswell et al. 1999; Baker and Thompson 2007), we constructed a series of simple age-structured life tables based on age-specific estimates of maximum survival (l x ) and fertility (m x ) (see Caughley 1977 for methods details) to estimate maximum rate of population increase.
Results Evidence for density dependence The time-series data on the Marion Island population of southern elephant seals from 1986 to 2004 (Fig. 1a) indicated good evidence for density dependence (86.1–86.9% of the information-theoretic weight—Table 1 based on BIC and AIC c , respectively) using the multiple working hypotheses approach to investigate variation in r versus population size (Tables 1, 2; Fig. 2b). Mean r over the 19 years was −0.020 (var = 0.004), and the model-averaged percent deviance explained used as a measure of goodness-of-fit was approximately 27%—note that the null deviance is based on an intercept of the exponential model, so when the random walk model gives a worse prediction than the mean r projection, its %DE will be negative). AIC c and BIC weights (which sum to unity across the five models) were highest for the Gompertz-logistic model (0.42–0.44), followed by Ricker-logistic, �-logistic and the two density-independent models, random walk and exponential (Table 1). Using the density-dependent models only, model-averaged carrying capacity (K) was 452 adult female elephant seals. However, including all models and using the largest recorded number of adult female elephant seals (n = 690 in 1986) to estimate ‘K’, for the density-independent models, full model-averaged carrying capacity was higher at 483 (Fig. 2). Table 1 Evidence for density regulation based on variants of the �-logistic model examining the relationship between r and N for the Marion Island elephant seal population (1986–2004)
Model k LL �AIC c wAIC c �BIC wBIC %DE Gompertz 3 27.72 0.00 0.439 0.00 0.425 33.0
Ricker 3 27.49 0.46 0.349 0.46 0.337 31.3
�-logistic 4 27.72 3.36 0.081 2.89 0.099 33.0
Random walk 1 23.28 3.41 0.080 3.10 0.090 −9.7
Exponential 2 24.11 4.30 0.051 4.33 0.049 0.0 Five a priori population dynamics models (RW = random walk, EX = exponential growth, RL = Ricker-logistic growth, GL = Gompertz-logistic growth and TL = �-logistic growth) were used. Shown are the relative strengths of evidence [Akaike’s Information Criterion (AIC c ) and Bayesian Information Criterion (BIC) weights] for the five models encapsulating density-independent (RW, EX) and density-dependent (RL, GL, TL) growth. The sum of AIC c and BIC weights (wAIC c and wBIC) for the density-dependent models represents the combined percentage support for density dependence (%DD) (models listed in descending order of wAIC c

and wBIC). Shown also are the number of model parameters (k), log-likelihood (LL), change in AIC c and BIC (�AIC c ; �BIC), and the percent deviance explained by each model (%DE) Table 2 Contrasting variants of the Gompertz-logistic (GL) model excluding and including environmental variance (Southern Oscillation Index, SOI)
Model k LL �AIC c wAIC c �BIC wBIC %DE GL 3 27.72 0.00 0.828 0.00 0.778 33.0
GL + SOI 4 27.70 3.41 0.151 2.93 0.179 33.9
GL + SOI + log10 N × SOI 5 27.69 7.35 0.021 5.84 0.042 35.5
GL.K·SOI 3 18.46 18.51 <0.001 18.51 <0.001 34.0
GL.K·SOI + SOI 4 18.46 21.88 <0.001 21.41 <0.001 35.5 Model variants include: (1) the GL model only without SOI, (2) the GL model including SOI (GL + SOI), (3) the GL model including SOI and the interaction term between log10 population size (N) and SOI (GL + SOI + log10 N × SOI), (4) the GL model with SOI modifying the estimate of carrying capacity (k) at each time step (GL.K SOI) and (5) SOI modifying both K and explaining residual variance in rate of population change (r). Shown are the relative strengths of evidence [Akaike’s Information Criterion (AIC c ) and Bayesian Information Criterion (BIC) weights] for the four models, the number of model parameters (k), log-likelihood (LL), change in AIC c and BIC (�AIC c ; �BIC), and the percent deviance explained by each model (%DE)
Fig. 2 Relationship between N t and year for adult female southern elephant seal counts at Marion Island from 1986 to 2004 (left panel) and intrinsic rate of population change (r = log(N t+1/N t )) versus N t giving q = 18 yearly transitions (right panel). Five population dynamics models (RW random walk, EX exponential growth, RL Ricker-logistic growth, GL Gompertz-logistic growth, TL �-logistic growth) were fitted to the relationship of r versus N t . Akaike’s Information Criterion corrected for small sample size (AIC c ), and Bayesian Information Criterion (BIC) weights indicated an overall weight of density dependence of 86.1 (�wBIC of RL, GL and TL models; Table 1) to 86.9% (�wAIC c )
Density feedback and environmental variation
Contrasting the four variants of the basic and environmentally mediated (K-ratio) Gompertz-logistic model to investigate the interaction between negative density feedback
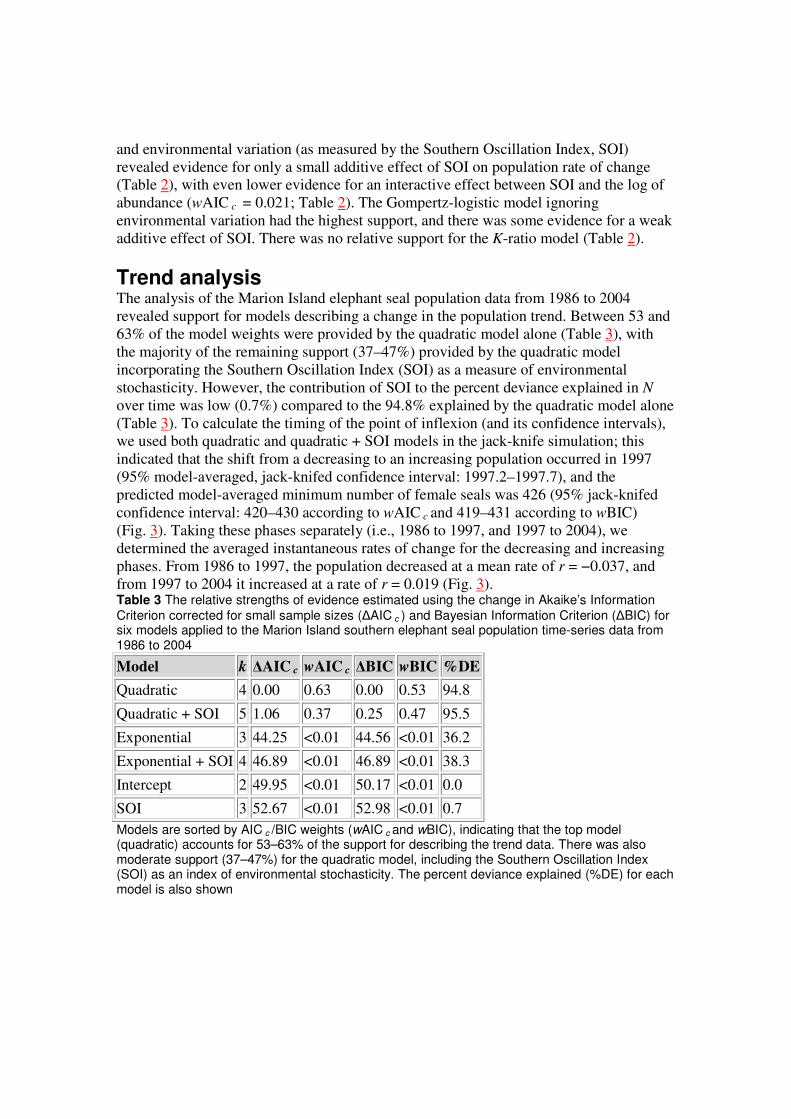
and environmental variation (as measured by the Southern Oscillation Index, SOI) revealed evidence for only a small additive effect of SOI on population rate of change (Table 2), with even lower evidence for an interactive effect between SOI and the log of abundance (wAIC c = 0.021; Table 2). The Gompertz-logistic model ignoring environmental variation had the highest support, and there was some evidence for a weak additive effect of SOI. There was no relative support for the K-ratio model (Table 2).
Trend analysis The analysis of the Marion Island elephant seal population data from 1986 to 2004 revealed support for models describing a change in the population trend. Between 53 and 63% of the model weights were provided by the quadratic model alone (Table 3), with the majority of the remaining support (37–47%) provided by the quadratic model incorporating the Southern Oscillation Index (SOI) as a measure of environmental stochasticity. However, the contribution of SOI to the percent deviance explained in N over time was low (0.7%) compared to the 94.8% explained by the quadratic model alone (Table 3). To calculate the timing of the point of inflexion (and its confidence intervals), we used both quadratic and quadratic + SOI models in the jack-knife simulation; this indicated that the shift from a decreasing to an increasing population occurred in 1997 (95% model-averaged, jack-knifed confidence interval: 1997.2–1997.7), and the predicted model-averaged minimum number of female seals was 426 (95% jack-knifed confidence interval: 420–430 according to wAIC c and 419–431 according to wBIC) (Fig. 3). Taking these phases separately (i.e., 1986 to 1997, and 1997 to 2004), we determined the averaged instantaneous rates of change for the decreasing and increasing phases. From 1986 to 1997, the population decreased at a mean rate of r = −0.037, and from 1997 to 2004 it increased at a rate of r = 0.019 (Fig. 3). Table 3 The relative strengths of evidence estimated using the change in Akaike’s Information Criterion corrected for small sample sizes (�AIC c ) and Bayesian Information Criterion (�BIC) for six models applied to the Marion Island southern elephant seal population time-series data from 1986 to 2004
Model k �AIC c wAIC c �BIC wBIC %DE Quadratic 4 0.00 0.63 0.00 0.53 94.8
Quadratic + SOI 5 1.06 0.37 0.25 0.47 95.5
Exponential 3 44.25 <0.01 44.56 <0.01 36.2
Exponential + SOI 4 46.89 <0.01 46.89 <0.01 38.3
Intercept 2 49.95 <0.01 50.17 <0.01 0.0
SOI 3 52.67 <0.01 52.98 <0.01 0.7 Models are sorted by AIC c /BIC weights (wAIC c and wBIC), indicating that the top model (quadratic) accounts for 53–63% of the support for describing the trend data. There was also moderate support (37–47%) for the quadratic model, including the Southern Oscillation Index (SOI) as an index of environmental stochasticity. The percent deviance explained (%DE) for each model is also shown

Fig. 3 Two quadratic models fitted to the time-series abundance data of Marion Island southern elephant seals. Shown are the raw count data (points), the top non-linear (quadratic) fit accounting for 53–63% of the multi-model inference weights using Akaike’s Information Criterion (AIC c ) and Bayesian Information Criterion (BIC) weights (solid line), and the quadratic fit including the Southern Oscillation Index (SOI) accounting for 37–47% of the weight (dashed line). Grey dotted lines are the model-averaged 95% jack-knifed confidence limits for the estimate of the inflexion point indicating the change in population trend (decreasing to increasing) between 1997.2 and 1997.7 and the associated minimum population size (416–436) for the time series
Other marine mammal populations The majority (8 of 12 according to wAIC c ; 9 of 12 according to wBIC) species/populations of marine mammal time-series abundance data examined (including the present study) demonstrated evidence (i.e., >50% sum of the density-dependent model AIC c weights) for density dependence (Table 4); however, the strength of evidence for density dependence was unrelated to the number of time transitions,
generations monitored, mean rate of population change model-averaged estimate of r m , variance of r, or coefficient of variation in N (Table 4). All phocids (‘true seal’ species) except Hawaiian monk seals demonstrated support for density dependence according to wAIC c ; however, the latter species was included when assessed with wBIC (Table 4). An index of the strength of density dependence, percent deviance explained (%DE), was relatively high for species showing high support for density dependence (Table 4). Indeed, there was a positive relationship between the sum of the density-dependent model weights and %DE (Fig. 4), suggesting that the stronger the effect, the more readily it was detected.

Table 4 Results examining the evidence for density dependence in time-series abundance data collected for 12 species of marine mammal (including M. leonina from Marion under study) using a multi-model inference approach
AIC c (BIC) model weights & % deviance explained
% DD Species q
r m
(m
a)
Var(r)
CV(N)
Gen
Ref
RW EX RL GL TL %DEma
�wAIC c (�wBIC)
Phoca groenlandica
46
−0.014
3.06
0.354 37.8 9.2 1
0.001 (0.003)
<0.001 (<0.001)
0.023 (0.026)
0.753 (0.848)
0.223 (0.123)
77.4 (77.1)
>99.9 (99.7)
Mirounga angustirostris
16
0.070
0.53
0.003 37.6 5.6
* 2
<0.001 (<0.001)
0.001 (<0.001)
0.238 (0.220)
0.611 (0.565)
0.150 (0.214)
65.3 (65.5)
>99.9 (>99.9)
Halichoerus grypus
23
0.085
0.2
0.282 39.4 25.
5* 3
<0.001 (<0.001)
<0.001 (<0.001)
0.011 (0.011)
0.809 (0.822)
0.180 (0.167)
59.3 (59.3)
>99.9 (>99.9)
Trichechus manatus
27
0.087
1.16
0.105 54.6 10.
8* 4 0.059 (0.129)
0.049 (0.066)
0.197 (0.184)
0.558 (0.521)
0.138 (0.099)
80.5 (70.4)
89.3 (80.5)
Mirounga leonina (Macquarie)
20
0.004
2.93
0.007 6.9 7.9 5
0.085 (0.117)
0.025 (0.027)
0.412 (0.393)
0.385 (0.367)
0.092 (0.096)
30.3 (29.2)
88.9 (85.7)
Mirounga leonina (Marion)
18
−0.020
0.86
0.004 16.5 7.6 6
0.080 (0.090)
0.051 (0.049)
0.349 (0.337)
0.439 (0.424)
0.082 (0.100)
27.3 (27.0)
86.9 (86.1)

AIC c (BIC) model weights & % deviance explained
% DD Species q
r m
(m
a)
Var(r)
CV(N)
Gen
Ref
RW EX RL GL TL %DEma
�wAIC c (�wBIC)
Phoca vitulina
18
0.061
0.23
0.048 40.5 13.
5* 7 0.122 (0.134)
0.070 (0.065)
0.462 (0.434)
0.181 (0.170)
0.165 (0.196)
23.5 (23.4)
80.8 (80.1)
Eumetopias jubatus
16
−0.723
3.08
10.886
100.9
5.3* 8
0.210 (0.189)
0.084 (0.071)
0.033 (0.033)
0.579 (0.567)
0.094 (0.141)
3.0 (3.1)
70.6 (74.0)
Callorhinus ursinus
42
0.055
0.23
0.165 79.3 10.
3* 9 0.423 (0.707)
0.208 (0.162)
0.127 (0.049)
0.187 (0.072)
0.055 (0.011)
4.4 (−4.0)
36.9 (13.1)
Monachus schauinslandi
11
−0.001
0.24
0.017 11.9 9.5
* 10
0.605 (0.362)
0.131 (0.109)
0.115 (0.205)
0.139 (0.249)
0.010 (0.074)
7.8 (15.7)
26.4 (52.8)
Arctocephalus pusillus pusillus
76
0.010
0.31
0.293 91.7 9.4 1
1
0.589 (0.869)
0.208 (0.101)
0.072 (0.012)
0.099 (0.016)
0.032 (0.002)
0.4 (−0.04)
20.3 (3.0)
Eschrichtius robustus
14
0.031
0.10
0.044 19.3 20.
0 12
0.664 (0.607)
0.198 (0.192)
0.055 (0.075)
0.073 (0.099)
0.010 (0.027)
−0.6 (0.1)
13.8 (20.1)
Five a priori population dynamics models (RW = random walk, EX = exponential growth, RL = Ricker-logistic growth, GL = Gompertz-logistic growth and TL = �-logistic growth) were used. Shown are the relative strengths of evidence [Akaike’s Information Criterion (AIC c ) and Bayesian Information Criterion (BIC) weights] for the five models encapsulating density-independent (RW, EX) and density-dependent (RL, GL, TL) growth. The sum of AIC c and BIC weights (wAIC c and wBIC) for the density-dependent models represents the combined

percentage support for density dependence (%DD) (species listed in descending order of wAIC c
). Shown also are the time of transitions per time series (q), mean rate of population change model-averaged estimate of r m , variance of r (Var(r)), coefficient of variation of N (CV(N), %), generation time (gen) in years observed either directly from the published literature—marked with an asterisk (*), or calculated from published life tables and calculated after Gaillard et al. (2005), model-averaged percent deviance explained across the five models (%DEma), and source (ref) reference: 1 = (Colman 1949), 2 = (Huber et al. 1991; NOAA NMFS 2000), 3 = (Bowen et al. 2006; Schwarz and Stobo 2000; Tormosov and Rezvov 1977), 4 = (Florida Fish and Wildlife Conservation Commission 2003; Marmontel et al. 1997), 5 = (de Little et al. 2007; McMahon et al. 2005), 6 = this study (McMahon et al. 2005), 7 = (Harkonen et al. 2002; Jeffries et al. 2003), 8 = (Alaska Fisheries Science Center 2002; Holmes et al. 2007), 9 = (Barlow and Boveng 1991; Poland 1892), 10 = (Gerrodette and Gilmartin 1990; Harting et al. 2007), 11 = (Hennemann 1984; Warneke and Shaughnessy 1985; Wickens and York 1997), 12 = (Gerber et al. 1999; Swartz et al. 2006)
Fig. 4 Left panel relationship between the evidence for density dependence (according to AIC c
and BIC) in the relationship between r and N and the model-averaged percent deviance explained (%DE) for 12 populations of marine mammal (see Table 3). Right panel relationship between model-averaged r m for each of the 12 populations predicted from the five variants of the �-logistic model and the evidence for density dependence based on AIC c and BIC weights
Model-averaged maximum rates of population increase (r m ) predicted from the r versus N relationships (Table 5) were generally greater than those estimated from age-classified models (Table 5). Using the latter approach, age-specific demographic rates produced r m
mainly in the range of ~0.20 (albeit with some exceptions—Table 5). Table 5 Maximum potential rates of population increase for nine species of marine mammal
Species r m Source Southern elephant seal Mirounga leonina 0.26 McLaren (1967)
Northern elephant seal Mirounga angustirostris 0.21 Schmitz and Stobo (1984)
Hawaiian monk seal Monachus schauinslandi 0.23 Baker and Thompson (2007)
Grey seal Halichoerus grypus 0.20 McLaren (1967)
Harp seal Phoca groenlandica 0.21 McLaren (1967)

Species r m Source Steller sea lion Eumetopias jubatus 0.18 Schmitz and Stobo (1984)
Northern fur seal Callorhinus ursinus 0.23 McLaren (1967)
Fur seals Arctocephalus pusillus. 0.31 Hennemann (1984)
Northern right whale Eubalaena glacialis 0.05 Caswell et al. (1999)
Discussion Identifying the factors that regulate population growth is an important step towards understanding the overall dynamics of a population (Pöysä and Pesonen 2003); therefore, the capacity to measure the strength and evidence of intrinsic dynamics is a central aim in population ecology (Yang et al. 2008). Moreover, there has been increasing emphasis placed on quantifying the relative role of both intrinsic and extrinsic dynamics in driving population trends, with particular focus on the complex interplay between the two processes (e.g., Sæther 1997; Gaillard et al. 2000; de Little et al. 2007; Yang et al. 2008). Using phenomenological time series of abundance for a well-studied marine predator, the southern elephant seal at Marion Island, we determined that intrinsic regulation was an important determinant of temporal trends. Although we did detect some evidence for extrinsic control measured by the Southern Oscillation Index (SOI), its overall effect on abundance trends was weak. We did not detect a strong influence of SOI on rate of population change or on fluctuation in carrying capacity. This supports the notion that short-term changes in population size are buffered against temporary fluctuations in food availability in long-lived species capable of sequestering sufficient resources (Hindell et al. 2003a). Despite explaining an important component of variation in first-year survival in this species (McMahon and Burton 2005), intrinsic regulation explains more of the year-to-year variation in abundance.
Lande et al. (2002, 2006) developed a method for determining the strength and type of density dependence operating in age-structured populations. Lande et al. (2006) were able to estimate more accurately the key parameters driving population change as well as the strength of density dependence in red deer (Cervus elaphus) when including population age structure in their models. While this is an important component of population models examining regulatory mechanisms in long-lived organisms, the methods outlined by Lande et al. (2006) are difficult to implement because they require long time series of age-structured data. Generally, such data are more difficult to obtain than those needed to examine the phenomenological evidence for density dependence (Lande et al. 2002, 2006). Even in our 20-year time series, it was not possible to use this method because we lacked explicit age-structure data for a sufficiently long period over the interval investigated.
The Marion Island population of southern elephant seals has decreased by 87% since 1951, but the population has undergone a recent change in growth rate. Our analyses identified two periods of differing growth rates with a single clear period of transition in 1997: (1) when the population decreased (1986–1997) and (2) when the population

increased (1997–2004). Likewise, the abundance trends of 11 other species of marine mammals demonstrated that most species had good evidence for density regulation. This suggests that despite the increase in the strength of evidence for density dependence detected in time-series data with an increasing number of generations monitored (Brook and Bradshaw 2006), marine mammal population trends often provide convincing evidence of density dependence after only a few generations. Moreover, the positive relationship between the evidence for density dependence and goodness-of-fit demonstrates that the effect size of the phenomenon dictates the probability of detection. One potential issue for the detection of density dependence in exploited populations reduced below carrying capacity is that the severity of the negative feedback mechanism may be reduced (Strong’s 1986 concept of density ‘vagueness’). The northern and South African fur seal abundance data were derived from heavily exploited populations, and their corresponding MMI evidence for density dependence was low (37 and 20%, respectively, Table 4). This may suggest that relative density time series derived from harvest data may underestimate the evidence in heavily exploited populations.
We observed that most estimated rates of maximum population growth (r m ) calculated from time-series data exceeded those estimated from age-specific demographic rates. This suggests that support for the Gompertz-logistic model, favored in most of the analyzed time series, (Table 4), may have been upwardly biased. Without explicit information on the degree or scale dependence of measurement error inherent in the abundance time series estimates, it was impossible for us to partition overall variance into process and measurement sources. High measurement error can downwardly bias estimates of �, resulting in upwardly biased estimates of r m. Additional bias can arise from the incorporation of immigrants such that abundance does not reflect intrinsic increase alone (Bradshaw et al. 2000). Further, a strongly concave relationship between r and N results in high predicted r m when extrapolated to zero density, yet observations at low population size are rare. Conversely, r m estimated from demographic rates may not have adequately reflected true maximum potential given that all measured rates are subject to environmental and density-dependent constraints that we could not model explicitly.
That marine mammal populations can provide convincing evidence of density dependence after only a few generations is an important finding because changes in the growth and behavior of apex predator populations is generally thought to reflect broad-scale environmental changes (Croxall et al. 2002; Hindell et al. 2003a) occurring over long periods. Thus, if the population response is sensitive to such environmental shifts and manifests this sensitivity in the form of per capita control of vital rates (e.g., survival, fecundity) over relatively short time periods, apex marine predators might prove to be useful indicator species for ecosystem changes over broad geographical regions (see Hindell et al. 2003a for review). This is particularly relevant for wide-ranging species such as elephant seals that procure their food from across entire ocean basins (e.g., Bradshaw et al. 2004).
In the case of southern elephant seals from Marion Island, our findings suggest that there has been a major alteration in the southern Indian Ocean biome where southern elephant

seals from Marion Island spend approximately 80% of their lives and procure their food (Bester 1988, 1989). Our results support the idea of resource depletion being responsible for the earlier decline of these populations (i.e., a decline to a new carrying capacity in a resource-poorer environment) and also suggest that per capita resources have improved over the last decade because a reduction in the age at primiparity and increases in weaning masses have been observed at Marion Island (Pistorius et al. 1999; McMahon et al. 2003). Indeed, evidence that the two larger sub-populations at Kerguelen and Heard Islands have increased (Guinet et al. 1999; Slip and Burton 1999) provide further anecdotal support that recent per capita food availability has increased in the southern Indian Ocean. While it is possible that local population increases may be due in part to immigration, there is little evidence to suggest that immigration is an important determinant of population size at Marion Island (Bester 1988). Predation rates are also considered to have been relatively constant over the study interval because there is no evidence for a decrease in the number of killer whales in the region (cf. Keith et al. 2001; Pistorius et al. 2002).
Consequently, the most-likely explanation describing the precipitous decreases in southern elephant seal numbers worldwide between the 1950s and 1990s is that a shift toward lower food availability most probably mediated by large-scale oceanographic changes was responsible (McMahon et al. 2005; de Little et al. 2007). There are recent reports of broad-scale changes in several Southern Ocean processes, such as sea ice extent (de la Mare 1997), that have been linked to changes in food supply (Loeb et al. 1997). This has led some to conclude that a major ecosystem ‘regime shift’ has occurred in the region (Weimerskirch et al. 2003). These lines of evidence support our hypothesis linking changes in elephant seal populations to large-scale environmental fluctuations that primarily alter per capita resource availability. However, it is doubtful that the per capita changes in food availability (prey abundance and patchiness) or quality (resource density) are mediated by the Marion Island population alone (Bradshaw et al. 2002); rather, the substantially larger population to which they belong (Kerguelen sub-population—McMahon et al. 2005) may have shifted in terms of population density or demography over the last decade. However, data supporting this notion are unavailable from the largest sub-populations within this breeding region at Isles Kerguelen and Heard Island (Bradshaw et al. 2002; McMahon et al. 2005).
Another potential contributing factor to the recent change in elephant seal rates of decline is the long-term changes in per capita resource availability following the exploitation of many seal populations during the eighteenth and nineteenth centuries (Hindell and Burton 1988; Hindell 1991). The hypothesis states that following the cessation of exploitation, per capita resources increased due to lower overall densities of seals. Elephant seal populations could then increase in numbers sufficiently to ‘overshoot’ pre-sealing numbers (Hindell 1991) if there was sufficient temporal lag in the regulatory mechanism driving population size (Turchin 2003). The observed decreases in seal populations following this initial recovery were thought to represent a density-dependent equilibration process (Hindell 1991; McMahon et al. 2005), and the latest recovery phase may indeed represent yet another equilibration phase, albeit at a level below that operating in the

1950s. The evidence for density dependence in the Marion and Macquarie Island populations found in this study further support that hypothesis.
A common problem in the detection of density dependence in abundance time series is how sampling (observation) error can alter conclusions (Wolda and Dennis 1993; Dennis and Taper 1994; Freckleton et al. 2006). Brook and Bradshaw (2006) examined the evidence for density dependence in 1,198 species’ time series of abundance using the same multi-model inference (MMI) approach outlined in this paper and tackled the issue of sampling error indirectly by comparing those species with direct-count data (e.g., mark-recapture estimates of abundance, entire colony counts) to those with indirect-count data (e.g., catch-per-unit effort, harvest indices). The species with higher error (indirect counts) showed that the MMI strength-of-evidence approach for assessing the support for density dependence was not increased erroneously by higher sampling error. In fact, the greatest MMI support was derived from the time series thought to be least affected by non-process error, suggesting instead that sampling error reduces support for density dependence. Therefore, while large sampling errors relative to actual changes in population density can spuriously inflate the detection of density dependence (Wolda and Dennis 1993; Dennis and Taper 1994; Shenk et al. 1998), this does not appear to be overly problematic with the approach employed here (see Brook and Bradshaw 2006). Further, processes driven entirely by measurement error are expected to produce log-linear (� = 0) r versus N relationships (Freckleton et al. 2006). Examination of the � estimate for the Marion population revealed a value >4 (result not shown; � estimates for the remaining species ranged from 0.002 to 2.798), suggesting a convex relationship not prone to excessive measurement error. This corroborates the assumed low sampling error for the Marion Island elephant seal data (but not necessarily those for other species examined) due to the relatively small population size and direct, complete-count surveys, suggesting our conclusions for this population are robust.
It may also be argued that the loading of an a priori model set toward a particular prediction (e.g., three density-dependent vs. two density-independent models) could bias our conclusions. However, the strength of evidence for a specific hypothesis encapsulated by multiple models should not change relative to the number of models evaluated because weights are adjusted relative to all candidate models in the set (Burnham and Anderson 2002). For example, consider a two-model set where both models have identical information criterion scores. In this particular example, the AIC c or BIC weights would be exactly 0.5 for each model. Notwithstanding this theoretical justification, Brook and Bradshaw (2006) provided a direct test of this assumption by evaluating two separate, dichotomous comparisons where only one density-independent (H0) and one density-dependent (HA) model were represented. As expected, the two pair-wise comparisons showed similar proportional support for density dependence to the full MMI approach. As such, we are confident that our results reflect a genuine ecological phenomenon and are not an artifact of observer error in census data, nor are they biased by the models considered.
In summary, our study examined several approaches to test the explicit hypothesis that a population of long-lived vertebrate shifted direction in population trends and that this was

due to a complex interaction between density feedback mechanisms typical of the taxon, combined with weak environmental control. Indeed, to understand fully the mechanistic basis of population fluctuations, analyses should attempt to include collateral information, such as the demographic structure of the population (Coulson et al. 2001). However, including such detailed data in assessments of population trends is not always possible, nor is it always practical. Our detailed analyses of the Marion Island elephant seal population time series in combination with the consistency of the trends observed across marine mammal groups demonstrates that relatively simple approaches can be used to quantify hypotheses related to broad-scale environmental change (e.g., ‘regime shifts’), the type of regulation operating in populations, and the uncertainty associated with the estimated parameters. Long-lived marine predators such as southern elephant seals provide an ideal test case to examine ecosystem-level changes in productivity given their capacity to assimilate food collected over large regions of the ocean. Although many marine predators are considered to be generalist feeders, thereby limiting their role to provide information on ecosystem change (Hindell et al. 2003a), southern elephant seal population trends and demographics appear to provide good short-term indications of large-scale environmental changes that affect per capita resource availability (McMahon and Burton 2005).
Acknowledgments We thank all the seal counters at Marion Island from 1986 to 2004 for their dedication and hard work, in particular we thank P. Pistorius and G. Hofmeyr for collating the Marion Island data for us. We thank C. Barbraud, J.-M. Gaillard and an anonymous reviewer for helpful comments to improve the manuscript. We also thank G.-J. Yang, R. Lande, T. Coulson, S. Engen and B.-E. Sæther for valuable advice and discussion. The Republic of South Africa Department of Environmental Affairs and Tourism (formerly the Department of Environmental Affairs) provided financial and logistical support on the advice of the South African Scientific Committee for Antarctic Research. The project conformed to the requirements of the Ethics Committee, Faculty of Natural and Agricultural Sciences, University of Pretoria (ref. no. 990112-002) and was accomplished under permit from the Department of Environmental Affairs and Tourism. CRM and MAH conceived the idea for the paper, CRM, CJAB and BWB wrote the paper, CJAB and BWB did the analyses, MNB initiated and maintained the annual censuses of the Marion Island southern elephant seal population, and all co-authors contributed intellectual content.
References
Alaska Fisheries Science Center (2002) Steller Sea Lion Adult Count Database. In: National Marine Mammal Laboratory, Alaska Fisheries Science Center, Juneau, Alaska Baker JD, Thompson PM (2007) Temporal and spatial variation in age-specific survival rates of a long-lived mammal, the Hawaiian monk seal. Proc R Soc Lond B 274:407–415
Barker RJ, Sauer JR (1992) Modelling population change from time series data. In: McCullough

DR, Barret RH (eds) Wildlife 2001: populations. Elsevier, London, pp 182–194 Barlow J, Boveng P (1991) Modeling age-specific mortality for marine mammals. Mar Mamm Sci 7:50–65
Bester MN (1988) Marking and monitoring studies of the Kerguelen stock of southern elephant seals Mirounga leonina and their bearing on biological research in the Vestfold Hills. Hydrobiologia 165:269–277
Bester MN (1989) Movements of southern elephant seals and subantarctic fur seals in relation to Marion Island. Mar Mamm Sci 5:257–265
Bowen WD, Iverson SJ, McMillan JI, Boness DJ (2006) Reproductive performance in grey seals: age-related improvement and senescence in a capital breeder. J Anim Ecol 75:1340–1351
Bradshaw CJA, Hindell MA, Sumner MD, Michael KJ (2004) Loyalty pays: life-history consequences of fidelity to marine foraging regions by elephant seals. Anim Behav 68:1349–1360
Bradshaw CJA, McMahon CR, Hindell MA, Pistorius PA, Bester MN (2002) Do southern elephant seals show density dependence in fecundity? Polar Biol 25:650–655 Bradshaw CJA, Lalas C, Thompson CM (2000) Clustering of colonies in an expanding population of New Zealand fur seals (Arctocephalus forsteri). J Zool London 250:105–112
Brook BW, Bradshaw CJA (2006) Strength of evidence for density dependence in abundance time series of 1198 species. Ecology 87:1445–1451
Brook BW, Traill LW, Bradshaw CJA (2006) Minimum viable population size and global extinction risk are unrelated. Ecol Lett 9:375–382
Burnham KP, Anderson DR (2002) Model selection and multimodal inference: a practical information-theoretic approach, 2nd edn. Springer, New York Burnham KP, Anderson DR (2004) Understanding AIC and BIC in model selection. Sociol Meth Res 33:261–304
Campagna C, Fedak MA, McConnell BJ (1999) Post-breeding distribution and diving behaviour of

adult male southern elephant seals from Patagonia. J Mammal 80:1341–1352
Caswell H, Fujiwara M, Brault S (1999) Declining survival probability threatens the North Atlantic right whale. Proc Natl Acad Sci USA 96:3308–3313
Caughley G (1977) Analysis of vertebrate populations. Wiley, Chichester Caughley G (1994) Directions in conservation biology. J Anim Ecol 63:215–244
Colman JS (1949) The New Foundland seal fishery and the Second World War. J Anim Ecol 18:40–46
Condy PR (1978) The distribution and abundance of southern elephant seals Mirounga leonina (Linn.) on the Prince Edward Islands. S Afr J Antarc Res 8:42–48 Coulson T, Catchpole EA, Albon SD, Morgan BJT, Pemberton JM, Clutton-Brock TH, Crawley MJ, Grenfell BT (2001) Age, sex, density, winter weather and population crashes in soay sheep. Science 292:1528–1531
Croxall JP, Trathan PN, Murray EJ (2002) Environmental change and Antarctic seabird populations. Science 297:1510–1514
de la Mare WK (1997) Abrupt mid-twentieth-century decline in Antarctic sea-ice extent from whaling records. Nature 389:1510–1514
de Little SC, Bradshaw CJA, McMahon CR, Hindell MA (2007) Complex interplay between intrinsic and extrinsic drivers of long-term survival trends in southern elephant seals. BMC Ecol 7:3
Dennis B, Taper ML (1994) Density dependence in time series observations of natural populations: estimation and testing. Ecol Monog 64:205–224
Fewster RM, Buckland ST, Siriwardena GM, Baillie SR, Wilson JD (2000) Analysis of population trends for farmland birds using generalized additive models. Ecology 81:1970–1984 Florida Fish Wildlife Conservation Commission (2003) Manatee mortality statistics. Florida Fish and Wildlife Conservation Commission, St Petersburg

Foley P (1994) Predicting extinction times from environmental stochasticity and carrying-capacity. Conserv Biol 8:124–137
Freckleton RP, Watkinson AR, Green RE, Sutherland WJ (2006) Census error and the detection of density dependence. J Anim Ecol 75:837–851
Gaillard JM, Festa-Bianchet M, Yoccoz NG, Loison A, Toigo C (2000) Temporal variation in fitness components and population dynamics of large herbivores. Ann Rev Ecol Syst 31:367–393
Gaillard J-M, Yoccoz NG, Lebreton J-D, Bonenfant C, Devillard S, Loison A, Pontier D, Allaine D (2005) Generation time: a reliable metric to measure life-history variation among mammalian populations. Am Nat 166:119–123
Gerber LR, DeMaster DP, Kareiva PM (1999) Gray whales and the value of monitoring data in implementing the US Endangered Species Act. Conserv Biol 13:1215–1219
Gerrodette T, Gilmartin WG (1990) Demographic consequences of changed pupping and hauling sites of the Hawaiian monk seal. Conserv Biol 4:423–430
Gilpin ME, Ayala FJ (1973) Global models of growth and competition. Proc Natl Acad Sci USA 70:3590–3593
Ginzburg LR, Ferson S, Akçakaya HR (1990) Reconstructibility of density dependence and the conservative assessment of extinction risks. Conserv Biol 4:63–70
Guinet C, Jouventin P, Weimerskirch H (1999) Recent population change of the southern elephant seal at Îles Crozet and Îles Kerguelen: the end of the decrease? Antarc Sci 11:193–197 Harkonen T, Harding KC, Heide-Jorgensen MP (2002) Rates of increase in age-structured populations: a lesson from the European harbour seals. Can J Zool Rev Can Zool 80:1498–1510
Harting AL, Baker JD, Johanos TC (2007) Reproductive patterns of the Hawaiian monk seal. Mar Mamm Sci 23:553–573
Hennemann WW (1984) Intrinsic rates of natural increase of altricial and precocial eutherian mammals: the potential price of precociality. Oikos 43:363–368

Hindell MA (1991) Some life-history parameters of a declining population of southern elephant seals, Mirounga leonina. J Anim Ecol 60:119–134
Hindell MA, Bradshaw CJA, Harcourt RG, Guinet C (2003a) Ecosystem monitoring: are seals a potential tool for monitoring change in marine systems? In: Gales NJ, Hindell MA, Kirkwood R (eds) Marine mammals. Fisheries, tourism and management issues, vol Chap. 17. CSIRO Publishing, Melbourne, pp 330–343 Hindell MA, Bradshaw CJA, Sumner MD, Michael KJ, Burton HR (2003b) Dispersal of female southern elephant seals and their prey consumption during the austral summer: relevance to management and oceanographic zones. J Appl Ecol 40:703–715
Hindell MA, Burton HR (1988) The history of the elephant seal industry at Macquarie Island and estimates of the pre-sealing numbers. Pap Proc R Soc Tasmania 122:159–176 Holmes EE, Fagan WF (2002) Validating population viability analysis for corrupted data sets. Ecology 83:2379–2386 Holmes EE, Fritz LW, York AE, Sweeney K (2007) Age-structured modeling reveals long-term declines in the natality of western Steller sea lions. Ecol Appl 17:2214–2232
Hone J, Clutton-Brock TH (2007) Climate, food, density and wildlife population growth rate. J Anim Ecol 76:361–367
Huber HR, Rovetta AC, Fry LA, Johnston S (1991) Age-specific natality of northern elephant seals at the South Farallon Islands, California. J Mammal 72:525–534
Jeffries S, Huber H, Calombokidis J, Laake J (2003) Trends and status of harbour seals in Washington State: 1978–1999. J Wildl Manage 67:207–218
Keith M, Bester MN, Bartlett PA, Baker D (2001) Killer whales (Orcinus orca) at Marion Island, Southern Ocean. Afr Zool 36:163–175 Lande R, Engen S, Saether B-E, Coulson T (2006) Estimating density dependence from time series of population age structure. Am Nat 168:76–87
Lande R, Engen S, Saether BE (2002) Estimating density dependence in time-series of age-structured populations. Philos Trans R Soc Lond B 357:1179–1184

Laws RM (1994) History and present status of southern elephant seal populations. In: Le Boeuf BJ, Laws RM (eds) Elephant seals: population ecology, behavior, and physiology. University of California Press, Berkeley, pp 49–65 Link WA, Barker RJ (2006) Model weights and the foundations of multimodel inference. Ecology 87:2626–2635
Loeb V et al (1997) Effects of sea-ice extent and krill or salp dominance on the Antarctic food web. Nature 387:897–900
Marmontel M, Humphrey SR, Oshea TJ (1997) Population viability analysis of the Florida manatee (Trichechus manatus latirostris), 1976–1991. Conserv Biol 11:467–481
May RM (1975) Biological populations obeying difference equations: stable points, stable cycles and chaos. J Theor Biol 49:511–524
McLaren IA (1967) Seals and group selection. Ecology 48:104–110
McMahon CR, Bester MN, Burton HR, Hindell MA, Bradshaw CJA (2005) Population status, trends and a re-examination of the hypotheses explaining the recent decreases of the southern elephant seal, Mirounga leonina. Mamm Rev 35:82–100
McMahon CR, Bradshaw CJA (2004) Harem choice and breeding experience of female southern elephant seals influence offspring survival. Behav Ecol Sociobiol 55:349–362
McMahon CR, Burton HR (2005) Climate change and seal survival: evidence for environmentally mediated changes in elephant seal, Mirounga leonina, pup survival. Proc R Soc Lond B 272:923–928
McMahon CR, Burton HR, Bester MN (2003) A demographic comparison of two southern elephant seal populations. J Anim Ecol 72:61–74
NOAA NMFS (2000) Northern Elephant Seal (Mirounga angustirostris): California Breeding Stock. Stock Assessment Report. In: Office of Protected Resources, National Marine Fisheries Service, Silver Spring, Maryland

Pistorius PA, Bester MN, Kirkman SP (1999) Dynamic age-distributions in a declining population of southern elephant seals. Antarc Sci 11:445–450 Pistorius PA, Bester MN, Kirkman SP, Taylor FE (2001) Temporal changes in fecundity and age at sexual maturity of southern elephant seals at Marion Island. Polar Biol 24:343–348
Pistorius PA et al (2002) Distribution, movement and estimated population size of killer whales at Marion Island, December 2000. S Afr J Wildl Res 32:86–92 Poland H (1892) Fur-bearing mammals in nature and commerce. Gurney and Jackson, London Pollard E, Lakhani KH, Rothery P (1987) The detection of density-dependence from a series of annual censuses. Ecology 68:2046–2055
Pöysä H, Pesonen M (2003) Density dependence, regulation and open-closed populations: insights from the wigeon, Anas penelope. Oikos 102:358–366
R Development Core Team (2004) R: a language and environment for statistical computing. R Foundation for Statistical Computing, Vienna Reddingius J (1971) Gambling for existence. Acta Biotheor 20(Suppl Primum):1–208 Reiter J, Le Boeuf BJ (1991) Life history consequences of variation in age at primiparity in northern elephant seals. Behav Ecol Sociobiol 28:153–160
Sæther B-E (1997) Environmental stochasticity and population dynamics of large herbivores: a search for mechanisms. Trends Ecol Evol 12:143–149
Saether BE, Engen S, Matthysen E (2002) Demographic characteristics and population dynamical patterns of solitary birds. Science 295:2070–2073
Schmitz OJ, Lavigne DM (1984) Intrinsic rate of increase, body size, and specific metabolic-rate in marine mammals. Oecologia 62:305–309
Schwarz CJ, Stobo WT (2000) Estimation of juvenile survival, adult survival, and age-specific pupping probabilities for the female grey seal (Halichoerus gryprus) on Sable Island from capture-recapture data. Can J Fish Aquat Sci 57:247–253

Shenk TM, White GC, Burnham KP (1998) Sampling-variance effects on detecting density dependence from temporal trends in natural populations. Ecol Monog 68:445–463 Sibly RM, Barker D, Denham MC, Hone J, Page M (2005) On the regulation of populations of mammals, birds, fish, and insects. Science 309:607–610
Slip DJ, Burton HR (1999) Population status and seasonal haulout patterns of the southern elephant seal (Mirounga leonina) at Heard Island. Antarc Sci 11:38–47 Strong DR (1986) Density-vague population change. Trends Ecol Evol 1:39–42
Swartz SL, Taylor BL, Rugh DJ (2006) Gray whale Eschrichtius robustus population and stock identity. Mammal Rev 36:66–84
Thomas L (1996) Monitoring long-term population change: why are there so many analysis methods. Ecology 77:49–58
Tormosov DD, Rezvov GV (1977) II. Seal populations and the methods for carrying censuses: the biology of seals. Proceedings of the symposium on the conservation of baltic seals. Finn Game Res 37:14–17 Turchin P (2003) Phenomenological time-series analysis. In: Complex population dynamics: a theoretical/empirical synthesis. Princeton University Press, Princeton Warneke RM, Shaughnessy PD (1985) Arctocephalus pusillus, the South African and Australian fur seal: taxonomy, evolution, biogeography, and life history. In: Ling JK, Bryden MM (eds) Studies of sea mammals in south latitudes. South Australian Museum, Adelaide, pp 153–177 Weimerskirch H, Inchausti P, Guinet C, Barbraud C (2003) Trends in bird and seal populations as indicators of a system shift in the Southern Ocean. Antarc Sci 15:249–256
Wickens P, York AE (1997) Comparative population dynamics of fur seals. Mar Mamm Sci 13:241–292
Wilkinson I, van Aarde RJ (1999) Marion Island elephant seals: the paucity-of-males hypothesis tested. Can J Zool 77:1547–1554
Wolda H, Dennis B (1993) Density-dependence tests, are they. Oecologia 95:581–591 Yang GJ, Bradshaw CJA, Whelan PI, Brook BW (2008a) Importance of endogenous feedback

controlling the long-term abundance of tropical mosquito species. Popul Ecol 50:293–305
Yang GJ, Brook BW, Whelan PI, Cleland S, Bradshaw CJA (2008) Interplay between endogenous and exogenous factors controlling temporal abundance patterns of tropical disease-carrying mosquitoes. Ecol Appl (2008) York AE (1994) The population dynamics of northern sea lions, 1975–1985. Mar Mamm Sci 10:38–51