Shaping the Future Financial Report 2005 - BASF
170
Shaping the Future Financial Report 2005
-
Upload
khangminh22 -
Category
Documents
-
view
0 -
download
0
Transcript of Shaping the Future Financial Report 2005 - BASF

Shaping the FutureFinancial Report 2005

BASF Group 2005
Overview
Million €
2005 2004 Change
in %
Sales 42,745 37,537 13.9
Income from operations before interest, taxes, depreciation
and amortization (EBITDA) 8,233 7,685 7.1
Income from operations (EBIT) before special items 6,138 5,230 17.4
Income from operations (EBIT) 5,830 5,193 12.3
Income before taxes and minority interests 5,926 4,347 36.3
Net income 3,007 2,004 50.0
Earnings per share (€) 5.73 3.65 57.0
Earnings per share in accordance with U.S. GAAP (€) 5.83 3.39 72.0
Dividend per share (€) 2.00 1.70 17.6
Cash provided by operating activities 5,250* 4,634 13.3
Additions to tangible and intangible assets 2,523 2,163 16.6
Depreciation of tangible and intangible assets 2,403 2,492 (3.6)
Return on assets (%) 17.7 13.2 –
Return on equity after tax (%) 18.6 12.9 –
Research and development expenses 1,064 986 7.9
Number of employees as of December 31 80,945 81,955 (1.2)
* Before external financing of pension obligations
Accounting principles for this reportStarting in 2005, the accounting and reporting of the BASF Group is performed in accordance with International Financial Reporting Standards (IFRS). The previous year’s figures have been restated in accordance with IFRS. Detailed explanations of the application of IFRS can be found in the Notes to the Consolidated Financial Statements on page 106 onward.
Income from operations at record high of €5,830 million
Premium of €2,354 million earned on our cost of capital (2004: €1,982 million)
Dividend increased to €2.00 (2004: €1.70)
26.06 million shares bought back for a total of €1,435 million
Pensions externally financed through a Contractual Trust Arrangement (CTA)
◾
◾
◾
◾
◾
Cover photo: Yolanda dos Santos, administrative assistant (left) and Alessandra Gonçalves de Freitas,Responsible Care coordinator, both at BASF in Guaratinguetá, Brazil.

BASF’s Segments
Chemicals
Significant increase in sales due to higher volumes and pricesHigher annual earnings despite startup costs for new plants and the effects of the hurricanes in the United StatesBusiness strengthened with electronic chemicalsExpansion of our production capacities in Asia
◾◾
◾◾
Plastics
Sales growth thanks to further price increasesIncrease in earnings in Polyurethanes and Performance PolymerHigh volatility and further increase in raw material costsBusiness models successfully optimized
◾◾◾◾
Performance Products
Increase in sales due to higher pricesImprovement in earnings due to double-digit growth in Functional PolymersGrowth boosted by positive business performance in Asia PacificSuccessful start of operations at production complext for acrylic acid and acrylates in Nanjing, China
◾◾◾◾
Agricultural Products & Nutrition
Agricultural Products division posts higher earningsAgricultural Products increases research and development expenditureLower prices for lysine and vitamin C negatively impact sales and earnings in Fine ChemicalsExtensive restructuring program launched in Fine Chemicals
◾◾◾
◾
Oil & Gas
Sales and earnings improveNatural gas sales volume rise againCooperation with our Russian partner Gazprom extended
◾◾◾

BASF’s Segments
Million € 2005 2004 Change
in %
Sales 8,103 7,020 15.4
Income from operations (EBIT)
before special items 1,488 1,377 8.1
Income from operations (EBIT) 1,326 1,284 3.3
Million € %
1 Styrenics 4,518 38.6
2 Performance Polymers 2,909 24.8
3 Polyurethanes 4,291 36.6
11,718 100.0
Million € 2005 2004 Change
in %
Sales 11,718 10,532 11.3
Income from operations (EBIT)
before special items 1,031 752 37.1
Income from operations (EBIT) 1,015 694 46.3
Million € %
1 Inorganics 1,017 12.6
2 Petrochemicals 5,084 62.7
3 Intermediates 2,002 24.7
8,103 100.0
Million € 2005 2004 Change
in %
Sales 8,267 8,005 3.3
Income from operations (EBIT)
before special items 890 850 4.7
Income from operations (EBIT) 863 1,128 (23.5)
Million € %
1 Performance Chemicals 2,889 34.9
2 Coatings 2,180 26.4
3 Functional Polymers 3,198 38.7
8,267 100.0
Million € 2005 2004 Change
in %
Sales 5,030 5,147 (2.3)
Income from operations (EBIT)
before special items 693 763 (9.2)
Income from operations (EBIT) 623 658 (5.3)
Million € %
1 Agricultural Products 3,298 65.6
2 Fine Chemicals 1,732 34.4
5,030 100.0
Million € 2005 2004 Change
in %
Sales 7,656 5,263 45.5
Income from operations (EBIT)
before special items 2,410 1,653 45.8
Income from operations (EBIT) 2,410 1,643 46.7
Million € %
Oil & Gas 7,656 100.0
Segment key data Sales by division
1
2
3
1
2
3
1
2
3
1
2

WHO WE ARE
BASF is the world’s leading chemical company: The Chemical Company. Our portfolio ranges from chemicals, plastics, performance products, agricultural products and fi ne chemicals to crude oil and natural gas. As a reliable partner to virtually all industries, our intelligent system solutions and high-value products help customers to be more successful.
WHAT WE ACHIEVE
Our goal is to use our products and services to successfully shape the future of our customers, business partners and employees. In doing so, we aim to grow profi tably and con-sistently increase the value of our company.
HOW WE SHAPE THE FUTURE
We develop new technologies and use them to open up addi-tional market opportunities. We combine economic success with environmental protection and social responsibil ity. This is our contribution to a better future for us and for coming generations.

Contents
3 Milestones 4 Letter from the Chairman of the Board of Executive Directors 6 Board of Executive Directors 8 BASF Shares
Management’s Analysis 14 Corporate Profi le BASF Group 14 Overview 15 Sites and Markets 16 Structure and Organization 17 Strategy, Goals and Value-based Management at BASF
21 Economic Environment 21 Trends in the Global Economy and the Chemical Industry in 2005
23 Trends in Key Customer Industries in 2005
24 BASF Group Business Review and Analysis 24 Results of Operations in the BASF Group 28 Balance Sheet Structure 30 Liquidity and Capital Resources 35 Results of Operations by Segment 51 Regional Results 53 Research and Development 56 Supplementary Report 57 Outlook 61 Purchasing, Marketing and Sales 64 Corporate Responsibility 64 Employees 66 Environmental Protection and Safety 68 Social Responsibility 69 Risk Management System and Risks of Future Development
Corporate Governance 73 Corporate Governance at BASF
76 Management and Supervisory Boards 80 Report of the Supervisory Board 83 Compliance Statement in Accordance with the German Corporate Governance Code
Consolidated Financial Statements 86 Statement by the Board of Executive Directors 87 Report of Independent Auditors 88 BASF Group Consolidated Financial Statements and Notes to the Consolidated Financial Statements
Glossary, Index and Ten-year Summary 154 Glossary 156 Index 157 Ten-year Summary

2 | 3
January
BASF acquires the global electronic chemi-
cals business of Merck KGaA, Germany, for
€270 million. The acquisition makes BASF a
leading supplier of electronic chemicals for
the rapidly growing semiconductor and fl at
screen industries.
BASF starts to establish a regional shared
service center in Kuala Lumpur, Malaysia. The
center will provide services in the areas of
fi nance and accounting, information technol-
ogy and human resources for BASF Group
companies in 15 countries in Asia Pacifi c.
February
BASF is the world’s most admired chemical
company according to a poll conducted by
the U.S. business magazine FORTUNE.
March
BASF creates a European shared service cen-
ter, BASF Services Europe GmbH, in Berlin.
More than 500 people will be employed in the
areas of fi nance and accounting as well as
human resources.
In Caojing, China, BASF starts operations
at the world’s largest production plant for
polytetrahydrofuran (PolyTHF®), a starting
material for textiles. The plant improves prox-
imity to customers and supply security in
Asia.
BASF acquires all shares in BASF NOF
Coatings Ltd. in Tokyo, Japan, formerly a 50-
50 joint venture between BASF and the Japa-
nese NOF Corporation.
April
BASF celebrates its 140th anniversary.
BASF and the Russian gas company Gaz-
prom announce that they will extend their
cooperation along the entire value adding
chain – from production and transportation
through to marketing of natural gas in Europe.
May
BASF and Shell Chemicals sell their 50-50
joint venture Basell, one of the world’s leading
manufacturers of polyolefi ns, for €4.4 billion.
June
A highly effi cient combined heat and power
(CHP) plant is inaugurated at BASF’s Ludwigs-
hafen site.
July
After three years, the Ludwigshafen Site Proj-
ect is completed successfully, permanently
reducing costs at the production site by
€480 million.
August
BASF announces its plans to expand the
capacity of the naphtha steam cracker at its
Antwerp site to 1.08 million metric tons per
year in 2007. The capacity expansion will
involve an investment of around €200 million.
September
Together with its Chinese partner Sinopec,
BASF offi cially inaugurates its new Verbund
site in Nanjing, China. The new site is the larg-
est individual investment in BASF’s 140-year
history, with the two partners investing a total
of $2.9 billion.
BASF receives an award for its 2004 cor-
porate reporting. It was ranked “best annual
report” by the German business magazine
manager magazin.
BASF shares are included in the Dow
Jones Sustainability Index (DJSI World) – the
world’s most important sustainability index –
for the fi fth year in succession.
October
Effective October 1, BASF acquires the Swiss
fi ne chemicals company Orgamol to strength-
en its pharma solutions business.
BASF Aktiengesellschaft announces that
it will pay approximately €3.7 billion into a
newly established Contractual Trust Arrange-
ment by the end of 2005 to fi nance pension
obligations to its employees and pensioners.
BASF Corporation announces its plans to
reduce annual costs in North America by a
further $150 million by mid-2007. This brings
the total cost reductions for the program
started in 2003 to $400 million per year.
November
German business magazine manager magazin
names Dr. Jürgen Hambrecht and his Board
colleagues Manager of the Year 2005 and
pays tribute to the achievement of all BASF
employees.
BASF announces its plans to increase
spending on research and development to
€1,150 million in 2006 and to create an addi-
tional 180 positions for scientists in its
Research Verbund.
December
Construction work starts on the North Euro-
pean Gas Pipeline (NEGP). At the same time,
a new German-Russian joint venture, North
European Gas Pipeline Company, is created
by Gazprom, BASF and E.ON.
BASF Plant Science obtains exclusive
license rights for technologies to optimize
genetic plant traits from the Belgian biotech-
nology company CropDesign. The focus lies
on improving the yield and drought resistance
of agricultural crops.
BASF buys back shares for €1,435 million
in 2005 with the aim of reducing its stock-
holders’ equity.
To expand its portfolio through forward
integration in innovative, high-growth markets,
BASF plans to acquire Degussa’s construc-
tion chemicals business and tenders an offer
to acquire the U.S. catalyst manufacturer
Engelhard Corporation.
Milestones

Letter from the Chairman of the Board of Executive Directors
BASF is shaping the future – and has been doing so successfully for more than 140 years. We are
The Chemical Company, the world’s leading chemical company. Our goal is sustainable success. We aim
to create value for our shareholders, our employees and our business partners. We again succeeded in
this: The past year was the best ever in the history of our company. I sincerely thank all BASF employees
worldwide for their hard work and this exceptional outcome.
Our strategy of profi table growth continues to be successful – despite weak growth in our home
market in Europe. In 2005, we increased sales by 14% to €42.7 billion. As a result, we grew faster than the
market, while earning a higher premium on our cost of capital. Our shareholders should also be pleased
by this success: In view of our strong earnings, the Board of Executive Directors and the Supervisory
Board will propose a dividend of €2.00 to the Annual Meeting, an increase of 18% compared with last
year. In addition, we bought back shares for €1,435 million in 2005, and we plan to continue with our
share buybacks in 2006.
ACHIEVING PROFITABLE GROWTH In 2005, we enhanced our effi ciency and effectively reduced
our costs even further. One example is the Ludwigshafen Site Project, which will permanently reduce
costs by €480 million per year. In North America, we reached our savings goal of $250 million ahead
of schedule. Now, our new goal is to cut our annual costs by a total of $400 million by 2007. We are
implementing similar measures in the other regions to strengthen our competitiveness and safeguard jobs
with a future.
A major step on our path to profi table growth has been the successful start of operations at our new
Verbund site in Nanjing, China, in summer 2005. This joint venture with our Chinese partner Sinopec
is the largest single investment in BASF’s history. We now have the advantage of being able to supply
customers in the region directly, thus extending our strong position in the rapidly growing Asian market.
By investing in the development of Siberian gas fi elds and in the construction of the North European
Gas Pipeline with our partner Gazprom, we are also creating additional growth potential. At the same
time, we are helping to ensure long-term energy supplies to Europe.
In order to grow successfully, we will build on our strengths and continuously optimize our portfolio.
This includes strategic divestitures, like that of our share in the polyolefi ns producer Basell in 2005. At
the same time, we strengthened our portfolio last year. For example, BASF acquired Merck’s electronic
chemicals business and purchased the fi ne chemicals company Orgamol.
CREATING LONG-TERM VALUE We want to continue to shape the future and create long-term value
for our business partners. Therefore, we are developing innovative products and intelligent solutions and
services for our customers worldwide.
Our researchers and developers around the world work to ensure that we can offer our customers
those solutions that will give them a competitive edge. We are thus planning to expand our global
research and development activities and to further increase expenditures in this area in 2006.
Furthermore, we are developing new business opportunities in fi ve growth clusters: energy management,
raw materials change, nanotechnology, plant biotechnology and white (industrial) biotechnology.
To sharpen our competitive edge, we have established a network of approximately 1,300 research
partnerships worldwide.

4 | 5
Yet in the end, only the best team is able to
create long-term value. We want to remain
at the forefront of innovation and customer
orientation. To do this, we are implementing
appropriate training and education programs
for our employees. Every member of BASF’s
team understands the importance of continuous
personal development, of learning from one
another, and encouraging each other to become
even better. All team members contribute their
personal strengths and professional and cultural
experience. This diversity helps us to better
understand our customers’ needs. In this way,
we can develop the best ideas for our products
and solutions to make our customers even
more successful.
SHAPING A SUSTAINABLE FUTURE We plan and manage our business sustainably – that means that
we take responsibility for human beings and the environment. You can read more about our activities in
all areas of sustainable development in our Corporate Report, which is published in conjunction with this
Financial Report.
In 2006, our prospects are promising. Having made BASF signifi cantly more competitive in recent
years, we now want to further supplement our portfolio. Our goal is to acquire businesses that are even
more customer-oriented and driven by innovation and growth. For example, we have tendered offers to
acquire the U.S. catalyst company Engelhard Corporation as well as Degussa’s construction chemicals
business.
Our strategy BASF 2015 describes the path we are taking to ensure our future. Our goal is to continue
to grow profi tably by following our four strategic guidelines:
Earn a premium on our cost of capital
Help our customers to be more sucessful
Form the best team in industry
Ensure sustainable development
Looking to the future, I see enormous opportunities for BASF that we will be certain to seize. I assure you
that the entire BASF team and I will do our utmost to continue to create value for our shareholders and
partners as the world’s leading chemical company – The Chemical Company.
◾◾◾◾
Dr. Jürgen Hambrecht
Chairman of the Board of Executive Directors
Dr. Jürgen HambrechtChairman of the Board of Executive Directors

Board of Executive Directors
Board of Executive Directors
Peter Oakley, 53, economist, with BASF for 29 years.Agricultural Products; Fine Chemicals; Specialty Chemicals Research; Plant Bio-technology Research.
Dr. Martin Brudermüller, 44, chemist, with BASF for 18 years.(Appointed to the Board of Executive Directors effective January 1, 2006. Responsible for Asia as of April 2006).
Dr. Kurt Bock, 47, business economist, with BASF for 15 years.Finance; Global Procurement & Logistics; Information Services; Corporate Controlling; Corporate Audit; South America.
Klaus Peter Löbbe, 59, economist, with BASF for 39 years.Coatings; North America (NAFTA).
Dr. Jürgen Hambrecht, 59, chemist, with BASF for 30 years.Chairman of the Board of Executive Directors. Legal, Taxes & Insurance; Strategic Planning & Controlling; Executive Management & Development; Communications BASF Group; Investor Relations.

6 | 7
Eggert Voscherau, 62, economist, with BASF for 37 years.Vice Chairman of the Board of Executive Directors and Industrial Relations Director.Human Resources; Environment, Safety & Energy; Occupational Medicine & Health Protection; Europe; Ludwigshafen Verbund Site; BASF Antwerpen N.V.
Dr. John Feldmann, 56, chemist, with BASF for 18 years.Oil & Gas; Styrenics; Performance Polymers; Polyurethanes; Polymer Research.
Dr. Stefan Marcinowski, 53, chemist, with BASF for 27 years.Research Executive Director.Inorganics; Petrochemicals; Inter-mediates; Chemicals Research & Engineering; Corporate Enginee-ring; University Relations & Research Planning; BASF Future Business GmbH.
Dr. Andreas Kreimeyer, 50, biologist, with BASF for 20 years. Performance Chemicals; Functional Polymers; Asia.
As of February 24, 2006

BASF Shares
Dividend increased to €2.00 per share
BASF shares increase in value by 26.2% in 2005
Share buybacks for €1,435 million
◾
◾
◾
be €1,029 million, based on the number of qualifying shares as of December 31, 2005. On the basis of the per share dividend and the year-end price, BASF shares provided an attractive dividend yield of 3.09% in 2005. We aim to increase our dividend further in the future. In 2005, BASF Aktiengesellschaft bought back 26.06 million shares on the stock exchange for a total of €1,435 million and an average price of €55.05 per share.
In 2005, BASF shares again performed very well, increas-ing in value by 26.2%. As a result, BASF shares outper-formed the Dow Jones EURO STOXXSM 50 Total Return Index, which rose 24.3%. Germany’s DAX 30 index rose 27.1% in the same period. In recent years, long-term investors have profi ted from the strong performance of BASF shares. Shareholders who invested €1,000 in BASF shares at the end of 1995 and reinvested the dividends (excluding tax credits) in additional BASF shares would have increased the value of the holding to €5,343 after 10 years. This increase of 434% is equivalent to an aver-age annual return of 18.2% and is considerably higher than the corresponding return for the EURO STOXX 50 (11.2%) and DAX 30 (9.1%). Dividend of €2.00 and further buybacks to increase
shareholder value
The Board of Executive Directors and the Supervisory Board are proposing to increase the dividend from €1.70 to €2.00 per share. As a result, the total amount payable will
BASF (+26.2%)
Change in value of an investment in BASF sharesin 2005 (with dividends reinvested, indexed)
DAX 30 (27.1%)
EURO STOXX 50 (+24.3%)
95
100
105
110
115
120
125
Jan. Feb. Mar. Apr. May June July Aug. Sep. Oct. Nov. Dec.
’96 ’97 ’98 ’99 ’00 ’01 ’02 ’03 ’04 ’05
BASF (Ø +18.2% per year)
Change in value of an investment in BASF sharesin 1996–2005 (with dividends reinvested, indexed)
DAX 30 (Ø +9.1% per year)
EURO STOXX 50 (Ø +11.2% per year)
100
150
200
250
300
350
400
450
500
BASF Shares
Dividend
€
2005 2.00
2004 1.70
2003 1.40
2002 1.40
2001 1.30

8 | 9
Investment in BASF shares
average annual performance
2005 26.2%
27.1%
24.3%
2001 – 2005 9.7%
–3.4%
–3.6%
1996 – 2005 18.2%
9.1%
11.2%
BASF
DAX 30
EURO STOXX 50
Share ownership by country
Holding of share capital in % 2006* 2004 2001 1995 1988
Germany 45.1 47.6 65.0 73.2 76.9
United Kingdom 17.3 14.9 11.6 8.1 3.0
United States 13.5 13.8 9.4 3.9 0.9
Switzerland 5.7 3.3 3.6 3.2 9.5
Belgium 5.5 5.3 1.4 1.2 0.3
Other countries 12.9 15.1 9.0 10.4 9.4
100.0 100.0 100.0 100.0 100.0
* The shareholder survey was performed in January 2006.
In many countries, we offer share purchase programs to encourage our employees to become shareholders and thus co-owners of BASF. Further details are provided on page 147.
BASF Aktiengesellschaft had 515 million shares outstand-ing as of December 31, 2005 and its market capitalization was €33.3 billion with a year-end share price of €64.71. Since the beginning of 1999, we have bought back a total of 123.5 million shares for €5.4 billion. As a result, we have reduced the number of shares by 19.8% in the past seven years. We plan to buy back additional shares in the future in order to reduce our high equity ratio.
Broad base of international shareholders:
100% free fl oat
At the beginning of 2006, BASF had approximately 460,000 shareholders. The development of our shareholder structure refl ects the increasing interest of international investors in BASF’s shares: At the beginning of 2006, non-German investors held 55% of BASF’s share capital compared with 52% in 2004. British and American investors are particularly well represented, accounting for 17% and 14% of the share capital, respectively. Institutional investors – for example banks and invest-ment companies – hold 72% of the share capital; 28% is held by private investors. This distribution has changed lit-tle in recent years.

BASF Shares
BASF shares included in important indices
The price of BASF shares forms part of the calculation of German and international indices.
Weighting of BASF shares in important
indices as of December 31, 2005 %
DAX 30 5.9
DJ STOXX 50 1.2
DJ EURO STOXX 50 1.9
DJ Chemicals 6.1
MSCI World Index 0.2
S&P Global 100 0.5
In 2005, BASF shares were also included in the Dow Jones Sustainability Index World for the fi fth year in suc-cession and remained a member of the FTSE 4 Good Index. Inclusion in such sustainability indices is a sign that we are recognized internationally as a successful company that is managed according to the principles of sustainability.
Investor Relations:
Close dialogue with the capital markets
Our corporate strategy aims to create value sustainably. We support this strategy through regular and open com-munication with all capital market participants. To help institutional investors assess the business situation and the further development of our company, we held more than 360 individual meetings in Germany and abroad. We considerably increased the number of events for private investors in 2005. The presentations on the company are available on the Internet at www.basf.com/share.
BASF’s investor relations team received a number of awards in 2005. For example, we were ranked number one in the Thomson Extel survey for the best investor rela-tions activities of all European companies and by the spe-cialist magazine Institutional Investor for the best investor relations work in the chemical industry.
You can reach BASF’s investor relations team by phone at +49 621 60-48230 or by e-mail at [email protected].
Further information
Stock exchange Securities code number Ticker symbol
Deutsche Börse 515100 BAS
London Stock Exchange 0083142 BFA
Swiss Exchange 323600 AN
New York Stock Exchange 055262505 (CUSIP) BF (ADR)
ISIN International Stock Identifi cation Number DE0005151005
Jennifer Insabella and Christoph Beumelburg conduct information events for investors worldwide.

10 | 11
Key BASF share data
2001 2002 2003 2004 2005
Year-end price (€) 41.75 36.08 44.58 53.00 64.71
Year high (€) 50.45 49.80 44.58 53.00 65.33
Year low (€) 31.00 32.90 28.41 40.49 50.11
Year average (€) 44.66 42.37 38.52 45.18 57.13
Daily trade in shares1
– million € 108.54 129.67 127.20 121.74 153.98
– million shares 2.48 3.09 3.33 2.71 2.70
Number of shares as of December 31 (million shares) 583.40 570.32 556.64 541.24 515.06
Market capitalization as of December 31 (billion €) 24.36 20.58 24.82 28.69 33.33
Earnings per share2 (€) 9.723 2.60 1.62 3.65 5.73
Dividend per share (€) 1.30 1.40 1.40 1.70 2.00
Dividend yield4 (%) 3.11 3.88 3.14 3.21 3.09
Payout ratio4 (%) 12.94 52.46 85.05 45.11 34.22
Price-earnings ratio2, 4 (P/E ratio) 4.30 13.88 27.52 14.52 11.29
Key data for BASF ADRs5
Year-end price ($) 37.91 38.22 55.75 72.02 76.48
Year high ($) 46.73 46.85 55.75 72.02 77.26
Year low ($) 28.80 32.40 32.00 48.42 63.68
Year average ($) 40.05 39.90 43.81 56.39 70.91
Daily trade in shares
– million $ 2.36 3.08 4.54 4.03 8.99
– thousand shares 59.98 78.73 105.32 71.80 126.81
1 Average, Xetra trading2 Starting in 2005, the accounting and reporting of the BASF Group is performed in accordance with International Financial Reporting Standards (IFRS). The previous
year’s fi gure has been restated accordingly. Detailed explanations of the fi rst application of IFRS can be found in Note 3 to the Consolidated Financial Statements
on page 106 onward. 3 Including extraordinary income of €9.92 per share4 Based on year-end share price5 BASF shares are traded on the New York Stock Exchange in the form of ADRs (American Depositary Receipts). Each BASF ADR is equivalent to one BASF share.


> What will tomorrow’s
markets want?


>> Intelligent solutions
To continue our success in tomorrow’s markets, we think strategical-
ly and across disciplines when developing new products. Our fungi-
cide boscalid, which won the BASF Innovation Award 2005, is just
one example from the fi eld of crop protection. This product is used
predominantly in specialty crops such as fruits, vegetables, vines and
ornamental plants. Close cooperation with customers like winemaker
Helmut Darting helps us to tailor innovations to market needs.
Maria Scherer, Global Research Fungicides BASF and member of the
innovation team, can confi rm this: Our products help protect our
customers’ harvests and increase quality. Boscalid is only one of
many success stories at BASF that show that it’s worth investing in
intelligent solutions.

Overview
With approximately 81,000 employees, customers in over 170 countries and more than 100 production sites, BASF is the world’s leading chemical company – The Chemical Company. The BASF Group consists of BASF Aktiengesellschaft and over 300 affi liated companies and subsidiaries and is headquartered in Ludwigshafen, Germany. This is where we operate the world’s largest integrated chemical site. Twelve operating divisions are responsible for produc-ing and distributing approximately 8,000 products. For reporting purposes, the operating divisions are combined into the segments Chemicals, Plastics, Performance Products, Agricultural Products & Nutrition and Oil & Gas.
Chemicals
Our portfolio ranges from basic Inorganics and Petro-chemicals to Intermediates. Plasticizers, solvents, glues and resins, as well as electronic grade chemicals are just a few examples of our wide variety of products. Key cus-tomer segments for our products include the chemical, pharmaceutical, electronics, textile and automotive indus-tries. Furthermore, we achieve around 30% of our sales with other BASF segments, which use our products to manufacture higher value goods.
Plastics
We are one of the world’s leading producers of plastics – the eco-effi cient materials of the future. Our product port-folio consists of Styrenics, Performance Polymers and Polyurethanes. In standard plastics, we concentrate on selected product lines and highly effi cient marketing pro-cesses. In our business with specialties, we offer a wide range of high-value products, system solutions and ser-vices. In close cooperation with our customers, we con-stantly extend this range and add new applications. Our main customers are companies in the automotive, pack-aging, construction, and electrical and electronics indus-tries.
Performance Products
In our Performance Chemicals and Functional Polymers divisons, we produce a wide range of innovative products and system solutions used to make products for the tex-tile, automotive and paper industries, as well as deter-gents, hygiene articles, adhesives and construction mate-rials. In our Coatings division, we focus on developing and producing coatings for the automotive industry and for industrial applications.
Agricultural Products & Nutrition
The Agricultural Products & Nutrition segment consists of the Agricultural Products and Fine Chemicals divisions. Products from our Agricultural Products division pro-tect crops from harmful fungi, insects and weeds, while increasing crop quality and yields. We also conduct research in the fi eld of plant biotechnology, focusing on more effi cient agriculture, healthier nutrition and plants as “green factories” to produce chemical substances. Products in our Fine Chemicals division include vita-mins, aroma chemicals, UV fi lters, as well as various poly-mers. We offer these high-value products to our custom-ers in the nutrition, pharmaceutical and cosmetic industries.
Oil & Gas
Our subsidiary Wintershall explores for and produces oil and natural gas in Europe, North Africa, South America, Russia and the Caspian Sea area. Together with its Rus-sian partner Gazprom, Wintershall is also active in Euro-pean gas trading – the transport, storage and distribution of natural gas.
Management’s Analysis > Corporate Profi le BASF Group
Overview

14 | 15
BASF operates six Verbund sites and more than 100 pro-duction sites worldwide in proximity to our customers. In our Verbund, we link production plants intelligently to save resources and energy. The largest Verbund site in the BASF Group is located at our headquarters in Ludwigshafen, Germany. This was where the Verbund concept was developed and optimized before it was applied to other sites around the world.
Our 12 operating divisions supply approximately 8,000 products to a variety of international business partners. We maintain business relationships with customers in more than 170 countries. In 2005, we generated 56% of our sales in Europe. North America (NAFTA) accounted for 22% of sales, Asia Pacifi c for 15% and South America, Africa, Middle East for 7%.
Sites and Markets
Management’s Analysis > Corporate Profi le BASF Group
Sites and Markets
BASF sites
Freeport (12)
Verbund site
(number of production
plants)
Major production
site
Geismar (20)
Antwerp (54) Ludwigshafen (250)
Kuantan (12)
Nanjing (10)

Corporate legal structure
BASF Aktiengesellschaft, which is headquartered in Lud-wigshafen, Germany, is the largest operating company in the BASF Group. Directly or indirectly, it holds the shares in the companies that belong to the BASF Group. All of BASF Aktiengesellschaft’s shares are available for public trading on stock exchanges. The majority of BASF Group companies cover a broad spectrum of the businesses of our operating divisions; other companies concentrate on specifi c areas such as the Coatings or Polyurethanes divisions or the Oil & Gas segment. The BASF Group Consolidated Financial Statements include BASF Aktiengesellschaft and 164 fully consolidat-ed subsidiaries. We consolidate 15 joint ventures conduct-ed with one or more partners on a proportional basis. In addition, two joint ventures, three major associated com-panies in which we have a 20% to 50% interest, as well as 11 affi liated companies are reported in the fi nancial result using the equity method. We also have a stake in more than 100 smaller companies that are not material to BASF’s operations, either individually or in the aggregate. For further information see Note 1 to the Consolidated Financial Statements on page 93 onward.
Organization of the BASF Group
Twelve operating divisions bear bottom-line responsibility and manage our 57 regional and global business units. As profi t centers, the business units are responsible for all business operations and are organized along business or product lines.
In addition, six regional divisions contribute to the strate-gic development of BASF’s business and help exploit market potential. These divisions are also responsible for optimizing the necessary regional infrastructure. For reporting purposes, the divisions are summarized in the following four regions:
EuropeNorth America (NAFTA)
Asia Pacifi cSouth America, Africa, Middle East
Corporate divisions and corporate departments have the following responsibilities:
Corporate divisions:
FinanceLegal, Taxes & InsuranceStrategic Planning & Controlling
Corporate Departments:
Communications BASF GroupCorporate AuditCorporate ControllingGlobal HR – Executive Management & DevelopmentInvestor Relations
Service functions and Group-wide coordination activities are performed by the competence centers:
Chemicals Research & EngineeringCorporate EngineeringEnvironment, Safety & EnergyGlobal Procurement & LogisticsHuman ResourcesInformation ServicesOccupational Medicine & Health ProtectionPlant Biotechnology ResearchPolymer ResearchSpecialty Chemicals ResearchUniversity Relations & Research Planning
◾◾◾◾
◾◾◾
◾◾◾◾◾
◾◾◾◾◾◾◾◾◾◾◾
Structure and Organization
Management’s Analysis > Corporate Profi le BASF Group
Structure and Organization

16 | 17
Management’s Analysis > Strategy, Goals and Value-based Management at BASF
Strategies for Value-adding Growth
Strategies for Value-adding Growth
Chemistry offers enormous opportunities. It stands
for the future that we are actively shaping. We are
expanding our strengths and making our portfolio
more resilient toward cyclicality and oil price fl uctua-
tions. We are concentrating on our core activities:
in our chemical businesses, in agricultural products
and nutrition, and in oil and gas. We are innovative
and act sustainably to ensure that we will still be the
world’s leading chemical company in the future.
Innovations are crucial for profi table growth. We are there-fore strengthening our global research and development activities. We have combined the important technology-driven issues of the future in fi ve “growth clusters”: energy management, raw material change, nanotechnology, plant biotechnology and white (industrial) biotechnology. Inter-disciplinary cooperation is the key to success. We want to use the potential offered by these broad-spectrum tech-nologies to open up new and attractive business opportu-nities for our customers and ourselves. For example, we are already one of the world’s leading companies in the fi eld of nanotechnology, which we use in many applications such as polymer dispersions, pigments and catalysts. BASF is one of the world’s leading companies with regard to research and development in the fi eld of plant biotechnology. We aim to shape this attractive market of the future using our powerful technology platform. Our research activities in this area focus on more effi cient agri-culture, healthier nutrition, and plants as “green factories” to produce specifi c chemical substances. By expanding white biotechnology, we aim to use our expertise in the areas of enzyme catalysis and fermenta-tive manufacturing processes to develop new products and processes outside the current key areas of fi ne chem-icals and intermediates. You can read more about our research activities on page 53.
Our four strategic guidelines
Four strategic guidelines describe our path to the future: Earn a premium on our cost of capitalHelp our customers to be more successfulForm the best team in industryEnsure sustainable development
We align our activities with these four guidelines. They are inextricably linked with one another, and their combination makes us successful.
Earn a premium on our cost of capital
We earn a premium on our cost of capital to increase the value of BASF. To achieve this goal, we have been expanding on our value-based management strategy. Earnings before interest and taxes (EBIT) after cost of capital is now the key performance and management indi-cator for our operating divisions and business units. We measure every business decision and our performance on the basis of how it infl uences earnings after cost of capital in the short and long term. As a result, all of our employ-ees help us to improve cost structures, use our capital more effi ciently and grow profi tably.
Help our customers to be more successful
We are there wherever our customers are. We invested in good time in growth markets and are now active in all important markets worldwide. In order to grow profi tably, we need to understand our customers’ businesses as well as our own and offer unique value propositions. To achieve this, we need the best employees who work closely with our customers to identify their needs and come up with intelligent solutions. We then select the best business models suited to our customers’ needs. This ensures the success of our customers and our own success.
◾◾◾◾
Management’s Analysis > Strategy, Goals and Value-based Management at BASF
Strategies for Value-adding Growth
Form the best team in industry
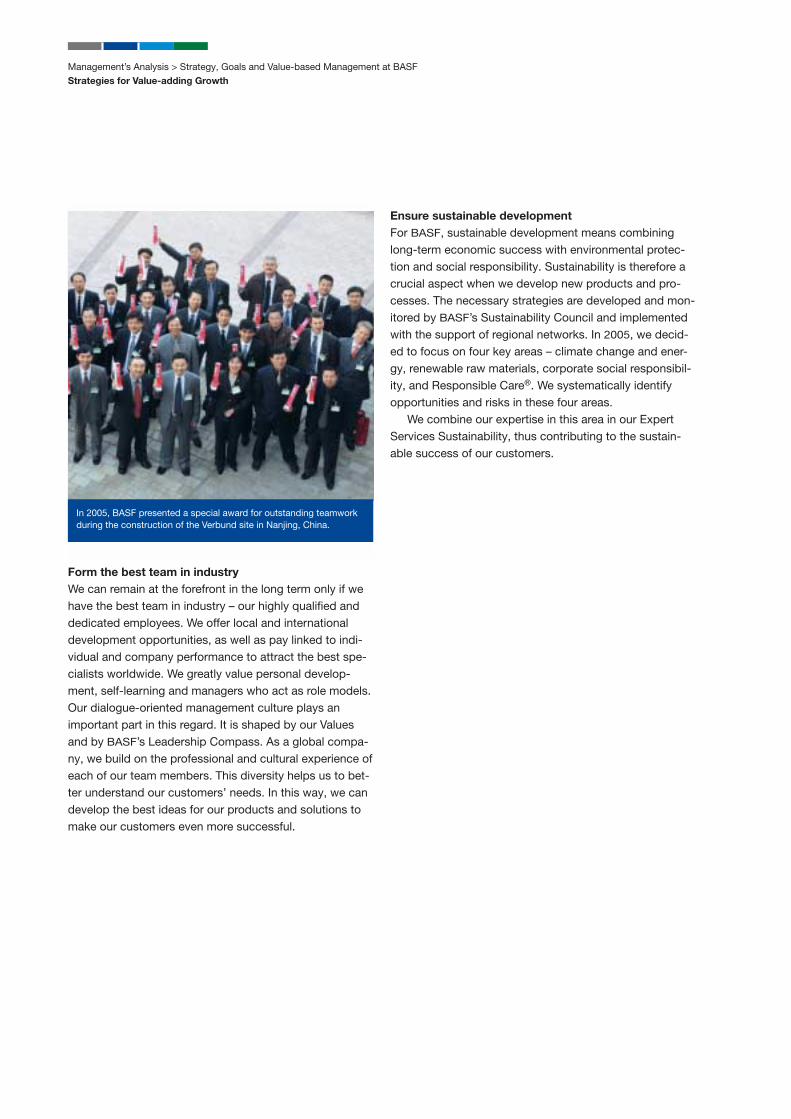
We can remain at the forefront in the long term only if we have the best team in industry – our highly qualifi ed and dedicated employees. We offer local and international development opportunities, as well as pay linked to indi-vidual and company performance to attract the best spe-cialists worldwide. We greatly value personal develop-ment, self-learning and managers who act as role models. Our dialogue-oriented management culture plays an important part in this regard. It is shaped by our Values and by BASF’s Leadership Compass. As a global compa-ny, we build on the professional and cultural experience of each of our team members. This diversity helps us to bet-ter understand our customers’ needs. In this way, we can develop the best ideas for our products and solutions to make our customers even more successful.
Ensure sustainable development
For BASF, sustainable development means combining long-term economic success with environmental protec-tion and social responsibility. Sustainability is therefore a crucial aspect when we develop new products and pro-cesses. The necessary strategies are developed and mon-itored by BASF’s Sustainability Council and implemented with the support of regional networks. In 2005, we decid-ed to focus on four key areas – climate change and ener-gy, renewable raw materials, corporate social responsibil-ity, and Responsible Care®. We systematically identify opportunities and risks in these four areas. We combine our expertise in this area in our Expert Services Sustainability, thus contributing to the sustain-able success of our customers.
In 2005, BASF presented a special award for outstanding teamwork during the construction of the Verbund site in Nanjing, China.

18 | 19
Segment Strategies
The strategies of our segments are derived from our stra-tegic guidelines:
Chemicals
We aim to strengthen our market leadership in Europe, improve our cost structure and market position in North America, and expand our activities in Asia. To achive this, we constantly increase our competitiveness by exploiting the synergy potential of our Verbund, by introducing inno-vative processes and products, and by investing in high-growth business areas.
Plastics
In standard plastics, we concentrate on high-volume product lines with effi cient production and marketing pro-cesses. We have optimized our global product portfolio so that we are able to produce and supply high-quality prod-ucts reliably and at competitive prices. In our business with specialties, we offer a wide range of high-value products and system solutions that we con-stantly expand and improve in close cooperation with our customers. Performance Products
Our innovative systems from performance chemistry con-tribute to the comfort and safety of many everyday prod-ucts, from cars, paper and construction materials to detergents and baby diapers. Our success is based on tailor-made products, system solutions, applications and services that we develop in close cooperation with our customers. A further success factor is our ability to solve our partners’ problems quickly and according to their needs. We want to help our customers to be more suc-cessful with innovative business models tailored to their needs and markets, a global production and technical ser-vice network, as well as optimized cost structures.
Agricultural Products & Nutrition
In the Agricultural Products division, we focus on mee-ting the wishes of our customers in key agricultural mar-kets. As leaders in innovation, we invest continuously in research and development of novel solutions to protect and improve plant health. In the Fine Chemicals division, we aim to achieve a leadership position in strategically important markets by means of innovative products and customer-oriented solutions. Active portfolio and cost management strength-en our competitiveness in both the Fine Chemicals and the Agricultural Products divisions. Oil & Gas
In exploration and production of oil and gas, we benefi t from our many years of experience and our technology portfolio. We focus on areas rich in oil and gas in Europe, North Africa, South America as well as in Russia and the Caspian Sea area. In natural gas trading, we and our Russian partner Gazprom are making use of the growth opportunities that are arising from increasing demand and the liberalization of the European gas markets. Exploration and production complement our natural gas trading activities as part of our “Gas for Europe” strat-egy. Together with Gazprom, we plan to produce natural gas outside of Europe, transport it to Europe and market it there. We aim to ensure a high degree of supply security by operating and expanding gas transport and storage facilities.
Management’s Analysis > Strategy, Goals and Value-based Management at BASF
Segment Strategies

Value-based Management at BASF
Our goal is to further increase BASF’s value by earning a premium on our cost of capital. Value-based management is therefore one of the key elements of our strategy BASF 2015. In 2005, we continued to implement our value-based management concept throughout the BASF Group. In doing so, we are taking a comprehensive approach that includes all functions within the company and encourages all employees to think and act in an entrepreneurial manner.
EBIT after cost of capital
Earnings before interest and taxes (EBIT) after cost of capital is the key performance and management indicator for our operating divisions and business units. The BASF Group must achieve an EBIT of at least 10% on its operat-ing assets to satisfy the returns expected by providers of equity and debt, and to cover standardized tax expenses.
Calculation of the cost of capital percentage
The cost of capital percentage before interest and taxes of 10% corresponds to a weighted average cost of capital (WACC) of approximately 6% after taxes. The WACC cal-culation is an internationally recognized method of deter-mining a company’s cost of capital. The return desired by shareholders and interest rates on debt capital are deter-mined and weighted according to their share of total capi-tal. We calculate our cost of equity on the basis of the market value of BASF shares. The cost of capital percent-age is reviewed annually.
Value-based management in target agreements
Value-based management is only successful if it is fi rmly rooted in the company and rigorously implemented. An important factor in ensuring its successful implementation is achieved by linking it directly to performance-related pay. We achieve this through target agreements with our employees.
Value-based management throughout the company
We provide our employees worldwide with relevant infor-mation on value-based management. Our goal is to make them more aware of business contexts, thus enabling them to personally create value. We use established learning tools such as an interac-tive Web-based program, a business simulation game specially adapted for BASF, and a tailor-made range of seminars on value-based management. In 2006, we plan to integrate value-based management even more exten-sively in our company: Around 8,000 employees world-wide in specialist and managerial positions will exchange their experience with specifi c approaches to value-creation in cross-functional groups. In addition, we will provide practice-oriented training on value-based man-agement for employees from non-business backgrounds. The various value drivers that are used by our units throughout the world are available to all our employees in a Good Practice database.
Management’s Analysis > Strategy, Goals and Value-based Management at BASF
Value-based Management at BASF
Premium of €2,354 million on our cost of capital
EBIT after cost of capital is calculated by subtracting income taxes for oil production that are noncompen-sable with German taxes (€1,072 million) and the cost of capital (€2,811 million) from the BASF Group’s EBIT (€5,830 million). Finally, the EBIT for activities not assigned to the segments (€(407) million) is added, since this is already provided for in the cost of capital percentage. Based on average operating assets of €28.1 billion for the segments in 2005, we achieved an EBIT after cost of capital of €2,354 million. We thus created corresponding value for our share-holders.

20 | 21
Management’s Analysis > Economic Environment
Trends in the Global Economy and the Chemical Industry in 2005
Trends in the Global Economy
and the Chemical Industry in 2005
Economic growth impaired by record oil prices
Chemical industry curbed by weakening industrial demand
Growth remains strong in Asia
◾
◾
◾
Overall economic growth in 2005 was somewhat more subdued than in the previous year and slower than our forecast. Global growth slackened during 2005, in particu-lar due to dramatically higher oil prices. In 2005, the global gross domestic product rose 3.1%, one percentage point lower than in the boom year of 2004. In Europe, despite gratifying growth in exports, the economy weakened because domestic demand was very moderate. The vigor of the U.S. economy continued despite the effects of the hurricanes and higher interest rates. In China, the economy continued to grow strongly, regardless of the more cautious economic policy. The Japanese economy grew faster than anticipated.
Global industrial production grew by 3.3% in 2005 com-pared with 5.5% in 2004. Global chemical production growth (excluding phar-maceuticals) also slowed down considerably since the start of the year. Global growth in 2005 was only 2.7% compared with 4.7% in the previous year. High energy costs affected the chemical industry and its customer sectors. In Europe, chemical production grew by 0.8% in 2005. When compared internationally, growth was slight, mainly because of lower domestic demand, in particular from industry. Foreign trade was also weaker than in the previ-ous year. Only Germany reported surprisingly strong growth in chemical production of 4% in 2005. This was principally due to exports and solid industrial growth.
* The values for 2004 and 2005 will be corrected in 2006 due to changes in
the calculation method by the Chinese National Bureau of Statistics.
* The values for 2004 and 2005 will be corrected in 2006 due to changes in
production statistics by the Federal Reserve Board.
Gross domestic product
Real change compared with previous year (%)
2004
World 4.1
Western Europe 2.3
United States 4.2
Asia excl. Japan 7.3*
Japan 2.3
South America 7.0
2005 estimate
World 3.1
Western Europe 1.4
United States 3.2
Asia excl. Japan 6.3*
Japan 2.0
South America 4.4
Chemical production (excluding pharmaceuticals)Real change compared with previous year (%)
2004
World 4.7
Western Europe 1.9
United States 3.3*
Asia excl. Japan 10.4
Japan 1.8
South America 8.0
2005 estimate
World 2.7
Western Europe 0.8
United States 1.2*
Asia excl. Japan 7.2
Japan 0.6
South America 4.3

Management’s Analysis > Economic Environment
Trends in the Global Economy and the Chemical Industry in 2005
In the United States, production in the chemical industry increased by 1.2% in 2005. The slowdown compared with the previous year was mainly caused by production losses in the southern United States as a result of the hurricanes. In addition, natural gas prices in the United States have doubled since the start of the year. The cost spiral and the associated loss of competitiveness had a negative impact on producers of petrochemical products and fertilizers in particular. In the course of 2005, the rapid expansion of chemical production in Asia (excluding Japan) slowed down paral-lel to industrial activity and amounted to 7.2%. However, Asia remained by far the most dynamic region. Production growth in China remained above 10%. The chemical industry in India and Malaysia also experienced double-digit growth. By contrast, growth in Taiwan and South Korea was weaker.
Growth in the Japanese chemical industry was particular-ly slow in the fi rst six months of 2005. For the year as a whole, production increased by 0.6%. Following a particularly expansive phase in 2004, pro-duction growth in the South American chemical industry in 2005 was much lower but nevertheless healthy at 4.3%. During the third quarter in particular, prices for chemi-cal raw materials such as naphtha again rose signifi cant-ly, reaching record levels. This was caused by a sharp rise in oil prices (Brent). Oil prices peaked at $67 per barrel in August but have fallen signifi cantly below the $60 mark since November. On an annual basis, oil prices rose by 42% to approximately $55 per barrel; naphtha prices increased by 26% to $474 per metric ton.
Naphtha price in $/tonOil price in $/barrel
Price trends for crude oil and naphtha
$/metric ton
150
250
350
450
550
650
25
35
45
55
65
75
$/bbl
20052004200315
Price trends for natural gas (United States)
$/mbtu
0
2
4
6
8
10
12
14
200520042003

22 | 23
Trends in Key Customer Industries in 2005
In 2005, global industrial growth reached 3.3%. Global industrial production proved to be resilient despite dra-matically higher oil prices. This was noticeable in the sta-bility of the capital goods market, while a decline was noted in the growth of the consumer goods industries and energy-intensive basic industries. Economic activity was bolstered principally by the Asian economies. The indus-trialized countries lagged considerably behind with growth of 1.8%. In the United States and Europe, in particular, the automotive industry was negatively impacted by oil price increases in 2005. Sales volumes and production suffered from the subdued consumer climate. In North America, sales of light trucks, which had been a growth segment in recent years, fell signifi cantly. In Asia, on the other hand, and China in particular, expansion continued, increasing by approximately 11%. Overall, global growth in 2005 declined to 2.8%. At 2.5%, growth in agriculture was slower than in 2004. This was primarily due to lower world market prices
for key commodities, an unfavorable exchange rate trend
for export-oriented farmers in Brazil, as well as dry weath-
er in parts of North and South America and Southern
Europe. The construction industry posted further solid growth of 3.3% in 2005; however, growth slackened in the sec-ond half of the year. In the United States, housing con-struction declined in particular. This was due to higher interest rates and the trend toward saturation of the real estate market. The building boom in Asia – mainly in China – continued unabated with growth of more than 6%. Strong investment activity in the United States and China helped the electrical and electronics industry to achieve persistently high growth of approximately 5%. Only Europe remained static at the previous year’s level. With production growth of approximately 12%, Asia retained its position as the most dynamic region. The information and communication industry grew globally by 10% and showed a particularly impressive increase of 14% in the United States. The sector recorded double-digit growth rates for the third consecutive year. The European paper industry was affected by a strike in the Finnish paper industry that lasted for two months. Thanks to growth in Asia, global production grew by approximately 2%.
The textile industry in industrialized countries was badly affected by the expiration of the Multi-Fiber Agreement; exports from China to the United States and Europe increased sharply. This led both the United States and Europe to take protectionist measures. Even so, textile production in industrialized countries declined by 2.4%. Asia was responsible for global growth of 2.8%.
Management’s Analysis > Economic Environment
Trends in Key Customer Industries in 2005
Growth in key customer industries
Real change compared with previous year (%)
2005
Automotive
(per-unit basis)
OECD (0.2)
World 2.8
Agriculture OECD 2.1
World 2.5
Construction OECD 2.6
World 3.3
Electrical OECD 2.4
World 5.1
Information and
communications
OECD 5.9
World 10.1
Paper OECD 0.3
World 1.9
Textiles OECD (2.4)
World 2.8
BASF sales by industry
Percentage of sales in 2005
> 15 %
each
Chemicals (not an industry with end users)
Energy
10 – 15 %
each
Automotive
Agriculture
5 – 10 %
each
Construction
< 5 %
each
Electrical/electronics Furniture Packaging
Carpets Health Paper
Cosmetics Leather/shoes Textiles
Detergents/cleaners
Other industries: approximately 10% in total

Management’s Analysis > BASF Group Business Review and Analysis
Results of Operations in the BASF Group
Results of Operations in the BASF Group
Income from operations at record high
Strongest earnings growth in the Plastics and Oil & Gas segments
High contribution to earnings from successful restructuring and portfolio optimization measures
Dividend increased to €2.00 (2004: €1.70)
◾
◾
◾
◾
Overview
BASF’s business developed very strongly in 2005. We increased sales and earnings despite substantially higher raw material prices and the subdued economic environment in our home market, Europe. We increased income from operations by €637 million. This earnings growth of 12.3% compared with our very strong performance in 2004 was due primarily to price increases for many products in our portfolio and to contin-ued restructuring measures. We completed the Ludwig-shafen Site Project on schedule in 2005. As a result, we permanently lowered costs by €480 million per year at our largest site compared with 2003. In North America (NAFTA), we achieved savings of more than $250 million per year.
Raw material prices were high and rose even further in the course of the year. We were largely able to offset these increases by raising sales prices for our products. For some products, however, higher raw materials prices could only be passed on after a delay. Our Oil & Gas seg-ment benefi ted from higher oil prices. We again earned a high premium of €2,354 million on our cost of capital in 2005 (2004: €1,982 million). The fi nancial result increased by almost €1 billion. This was partially due to the gain from the sale of our stake in Basell. Net income improved by 50% thanks to very strong income from operations and the higher fi nancial result. Earnings per share increased by 57% to €5.73.
Sales and earnings*
Million € 2005 2004 Change in %
Sales 42,745 37,537 13.9
Income from operations before interest, taxes, depreciation and amortization (EBITDA) 8,233 7,685 7.1
Income from operations (EBIT) before special items 6,138 5,230 17.4
Income from operations (EBIT) 5,830 5,193 12.3
Income from operations (EBIT) as a percentage of sales 13.6 13.8 –
Financial result 96 (846) .
Income before taxes and minority interests 5,926 4,347 36.3
Net income 3,007 2,004 50.0
Net income as a percentage of sales 7.0 5.3 –
Earnings per share (€) 5.73 3.65 57.0
Net income in accordance with U.S. GAAP 3,061 1,863 64.3
Earnings per share in accordance with U.S. GAAP (€) 5.83 3.39 72.0
* Starting in 2005, the accounting and reporting of the BASF Group is performed in accordance with International Financial Reporting Standards (IFRS). The previous
year’s fi gures have been restated accordingly. The IFRS fi gures for 2004 that were published together with the results for the fi rst quarter of 2005 were not attested by
the external auditor and have been slightly adjusted. The effects were taken into account in the fourth quarter of 2004. Detailed explanations of the fi rst application of
IFRS can be found in Note 3 to the Consolidated Financial Statements on page 106 onward.

24 | 25
2004
Million € 1st Quarter 2nd Quarter 3rd Quarter 4th Quarter 2004
Sales 9,051 9,314 9,314 9,858 37,537
Income from operations (EBIT) before special items 1,175 1,266 1,172 1,617 5,230
Income from operations (EBIT) 1,075 1,250 1,076 1,792 5,193
Financial result (40) 12 (127) (691) (846)
Income before taxes and minority interests 1,035 1,262 949 1,101 4,347
Net income 520 714 366 404 2,004
Earnings per share (€) 0.94 1.30 0.67 0.74 3.65
2005
Million € 1st Quarter 2nd Quarter 3rd Quarter 4th Quarter 2005
Sales 10,083 10,581 10,361 11,720 42,745
Income from operations (EBIT) before special items 1,563 1,657 1,327 1,591 6,138
Income from operations (EBIT) 1,499 1,587 1,262 1,482 5,830
Financial result 45 (82) 176 (43) 96
Income before taxes and minority interests 1,544 1,505 1,438 1,439 5,926
Net income 861 778 808 560 3,007
Earnings per share (€) 1.60 1.48 1.55 1.10 5.73
Sales and earnings by quarter

Management’s Analysis > BASF Group Business Review and Analysis
Results of Operations in the BASF Group
Sales
Sales in 2005 rose 13.9% compared with the previous year to €42,745 million. The change in sales was due to the fol-lowing factors:
Income from operations
Compared with 2004, we increased income from opera-tions by €637 million to €5,830 million. Income from oper-ations as a percentage of sales was 13.6% compared with 13.8% in 2004. The increase in earnings was primarily due to higher prices for our products in almost all segments. The Plas-tics segment especially increased its earnings substantial-ly despite the high volatility of raw material prices. Higher oil prices also led to signifi cantly higher earnings in our Oil & Gas segment. In addition, restructuring measures introduced in previ-ous years paid off: Earnings were boosted by the Lud-wigshafen Site Project, which was completed this year. We also reduced costs in North America (NAFTA) earlier than expected.
Special items
Income from operations in 2005 contained special charg-es of €308 million, compared with €37 million in the previ-ous year. In 2004, special items contained the gain from the sale of the printing systems business. €295 million was incurred for restructuring measures chiefl y related to measures to increase effi ciency at the production site in Ludwigshafen, Germany, as well as the partial closure of the site in Feluy, Belgium. Other special charges were related to the restructuring program for the Fine Chemicals and Intermediates divisions, for example, for the closure of a vitamin C plant in Grenaa, Denmark, as well as plants for THF and PolyTHF® in Yokkaichi, Japan. Special gains primarily resulted from divestitures asso-ciated with portfolio optimization in the Agricultural Prod-ucts division. In 2005, the fi nancial result included, in particular, the gain from the sale of the 50% stake in Basell. The 2004 fi nancial result contained write-downs on participations.
Factors infl uencing salesMillion € As %
of sales
Volumes 932 2.5
Prices 4,144 11.0
Currencies 362 1.0
Acquisitions and additions to the
scope of consolidation 406 1.1
Divestitures (636) (1.7)
5,208 13.9
Higher sales volumes were achieved mainly in the Chemi-cals and Oil & Gas segments. We were also able to imple-ment price increases in almost all areas of our portfolio. The appreciation of the U.S. dollar, especially in the sec-ond half of the year, had only a minor overall impact on sales. Companies in the Asia Pacifi c region generated sig-nifi cantly higher sales, one reason being the startup of the plants at our new Verbund site in Nanjing, China. Our acquisitions contributed €325 million to the increase in sales. This was primarily due to the acquisition of the electronic chemicals business of Merck KGaA, Darmstadt, Germany, in April 2005. The acquisition of the Swiss fi ne chemicals company Orgamol and other smaller fi rms in the Plastics segment took place in the fourth quarter, so there was no substantial effect on sales. Addi-tions to the scope of consolidation contributed €81 million to sales. Divestitures reduced sales by €636 million, particularly as a result of the sale of our printing systems business in the fourth quarter of 2004. In addition, the Agricultural Products division continued with its portfolio optimization measures by selling individual products. We also sold our styrenics business in the United States.

26 | 27
Income before taxes and minority interests
Compared with the previous year, income before taxes and minority interests rose by €1,579 million to €5,926 mil-lion in 2005. In 2005, the return on assets as a percentage of income before taxes (plus interest expenses) increased to 17.7%, compared with 13.2% in the previous year.
Net income/earnings per share
Net income was €3,007 million in 2005. This represents an increase of €1,003 million, or 50%, compared with 2004. Minority interests contained profi ts of €161 million pay-able to shareholders of consolidated companies. In 2005, these were primarily our partner companies in natural gas trading and the steam cracker in Port Arthur, Texas. The tax rate declined by 4 percentage points, mostly as a result of tax-free earnings from the sale of our stake in Basell. The previous year contained non-tax-deductible write-downs on participating interests. Noncompensable foreign income taxes on oil produc-tion rose by €404 million to €1,072 million as a result of higher oil prices.
Earnings per share in 2005 were €5.73 compared with €3.65 in the previous year. In 2005, net income in accor-dance with U.S. GAAP was €3,061 million, or €5.83 per share, compared with €1,863 million or €3.39 per share in the previous year. Detailed explanations of our net income in accordance with U.S. GAAP are provided in Note 5 to the Consolidated Financial Statements on page 110 onward.
Proposed appropriation of profi t
BASF Aktiengesellschaft achieved net income of €1,273 million. Including profi t carried forward from 2004 of €15 million, profi t retained was €1,288 million. At the Annual Meeting on May 4, 2006, the Board of Executive Directors and the Supervisory Board will propose a divi-dend payment of €2.00 per qualifying share. If share-holders approve this proposal, the total dividend payable on qualifying shares as of December 31, 2005 will be €1,029 million. If the number of qualifying shares and the amount of the dividend payable decline by the date of the Annual Meeting as a result of share buybacks, it is further proposed that the remaining profi t retained be carried forward.
Special items 1st Quarter 2nd Quarter 3rd Quarter 4th Quarter Full Year
Million € 2005 2004 2005 2004 2005 2004 2005 2004 2005 2004
– In income from operations (64) (100) (70) (16) (65) (96) (109) 175 (308) (37)
– In fi nancial result – (21) – (1) 222 (16) – (580) 222 (618)
(64) (121) (70) (17) 157 (112) (109) (405) (86) (655)

Management’s Analysis > BASF Group Business Review and Analysis
Balance Sheet Structure
Balance Sheet Structure
Total assets almost unchanged despite higher volume of business and
the rise in the value of the dollar
Pension provisions reduced through external fi nancing of pension obligations
Shares bought back for €1,435 million
◾
◾
◾
Assets
2005
Million €
2005
%
2004
Million €
Long-term assets
Intangible assets 3,720 10.4 3,607
Property, plant and equipment 13,987 39.2 13,063
Investments accounted for using the equity method 244 0.7 1,100
Other fi nancial assets 813 2.3 938
Deferred taxes 1,255 3.5 1,337
Other long-term assets 524 1.5 473
20,543 57.6 20,518
Short-term assets
Inventories 5,430 15.2 4,645
Accounts receivable, trade 7,020 19.7 5,861
Other receivables and miscellaneous short-term assets 1,586 4.4 2,133
Liquid funds 1,091 3.1 2,291
15,127 42.4 14,930
Total assets 35,670 100.0 35,448
Stockholders’ equity and liabilities
2005
Million €
2005
%
2004
Million €
Stockholders’ equity
Subscribed capital 4,417 12.4 4,411
Retained earnings 11,928 33.4 11,923
Other comprehensive income 696 2.0 (60)
Minority interests 482 1.3 328
17,523 49.1 16,602
Long-term liabilities
Provisions for pensions and similar obligations 1,547 4.4 4,124
Other provisions 2,791 7.8 2,376
Deferred taxes 699 2.0 948
Financial indebtedness 3,682 10.3 1,845
Other liabilities 1,043 2.9 1,079
9,762 27.4 10,372
Short-term liabilities
Accounts payable, trade 2,777 7.8 2,372
Provisions 2,763 7.7 2,364
Tax liabilities 887 2.5 644
Financial indebtedness 259 0.7 1,453
Other liabilities 1,699 4.8 1,641
8,385 23.5 8,474
Total stockholders’ equity and liabilities 35,670 100.0 35,448

28 | 29
BASF’s total assets increased slightly by €222 million. The increased working capital due to higher sales was offset by the transfer of €3.7 billion in liquid funds into a Contractual Trust Arrangement (CTA) (see page 65 for further details). Long-term assets remained virtually unchanged. The increase due to the appreciation of the U.S. dollar was offset by the sale of the 50% stake in Basell as well as by capital expenditures below the level of depreciation and amortization (excluding acquisitions). The ratio of long-term to total assets declined slightly to 57.6% from 57.9% in 2004. Long-term assets consisted of:
Assets by regionTangible assets Inventories Receivables
% 2005 2004 2005 2004 2005 2004
Europe 52.4 55.4 51.0 53.1 57.9 61.8
North America (NAFTA) 18.1 18.1 29.6 28.6 18.0 17.5
Asia Pacifi c 25.7 23.1 13.5 12.5 15.5 12.9
South America, Africa, Middle East 3.8 3.4 5.9 5.8 8.6 7.8
100.0 100.0 100.0 100.0 100.0 100.0
Further details on the composition of and changes in long-term assets are provided in the Notes to the Consoli-dated Financial Statements on page 126 onward. The most important capital expenditures are explained on page 32. Inventories increased by €785 million to €5,430 million as a result of the expansion of business and higher raw material prices. We nevertheless reduced days of invento-ry valued slightly compared with 2004. Trade accounts receivable rose by €1,159 million as a result of higher sales and currency effects. Their share of total assets rose by 3.2 percentage points compared with the previous year. Days sales outstanding, however, remained low. The breakdown of tangible assets, inventories and receivables by region is shown in the following table.
Stockholders’ equity increased by €921 million, mainly due to our high earnings and, to a lesser extent, to posi-tive currency effects. These effects were offset by the pay-ment of dividends and the repurchase of 26.06 million shares for €1,435 million. In addition, we offset actuarial losses from the valuation of our pension obligations of €660 million against stockholders’ equity in accordance with International Accounting Standard (IAS) 19 for the fi rst time in 2005 (see also page 108). The equity ratio was 49.1% compared with 46.8% in 2004.
Net debt
Million € 2005 2004
Liquid funds 1,091 2,291
Financial indebtedness 3,941 3,298
Net debt 2,850 1,007
Net debt increased as a result of the transfer of assets to fi nance pension obligations of BASF Aktiengesellschaft externally and the share buybacks. This was offset partial-ly by the high level of cash provided by operating activities and by cash infl ows from divestitures. The types, terms and currencies and lines of credit are explained in Note 25 to the Consolidated Financial State-ments on page 143 onward. Long-term liabilities declined by €610 million to €9,762 million. Long-term fi nancial indebtedness rose as a result of the issue of the 3.375% Euro Bond with a volume of €1.4 billion by BASF Aktiengesellschaft. Because of the CTA, however, the ratio of long-term liabilities to total lia-bilities declined to 27.4% from 29.3% in 2004. Short-term liabilities changed only slightly. Financial indebtedness declined primarily as a result of the repayment of BASF Aktiengesellschaft’s €1.25 billion 5.75% Euro Bond.
Long-term assets
% 2005
• Intangible assets 18.1
Thereof self-generated assets 0.5
• Tangible assets 68.1
• Financial assets 5.1
• Other long-term assets 8.7
100.0

Management’s Analysis > BASF Group Business Review and Analysis
Liquidity and Capital Resources
Liquidity and Capital Resources
Cash provided by operating activities at record level
Further reduction in net working capital
Liquid funds of €3.7 billion transferred to Contractual Trust Arrangement (CTA)
Capital expenditures, including acquisitions, dividends and share buybacks, fi nanced
from cash provided by operating activities
Cash infl ows from portfolio measures
◾
◾
◾
◾
◾
Statements of cash fl ows
Million € 2005 2004
Net income 3,007 2,004
Depreciation and amortization of intangible, tangible and fi nancial assets 2,427 3,119
Changes in working capital 250 (193)
Miscellaneous items (434) (296)
Cash provided by operating activities before external fi nancing of pension obligations 5,250 4,634
External fi nancing of pension obligations (CTA) (3,660) –
Cash provided by operating activities 1,590 4,634
Payments related to tangible and intangible assets (1,948) (2,057)
Acquisitions/divestitures 995 570
Financial investments and other items 247 254
Cash used in investing activities (706) (1,233)
Capital increases/repayments (1,425) (781)
Changes in fi nancial liabilities 299 (203)
Dividends (982) (852)
Cash used in fi nancing activities (2,108) (1,836)
Net changes in cash and cash equivalents (1,224) 1,565
Cash and cash equivalents as of beginning of year and other changes 2,132 521
Cash and cash equivalents as of end of year 908 2,086
Marketable securities 183 205
Liquid funds 1,091 2,291
30 | 31
PRINCIPLES AND OBJECTIVES OF OUR FINANCIAL
MANAGEMENT
Financial management in the BASF Group is largely cen-tralized and is supported by regional competence centers. Our fi nancing and investment policy is value-based, with risk management taking precedence over profi tability. The risks associated with currencies, interest rate changes and creditworthiness are systematically analyzed as part of our fi nancial management and limited using modern processes and fi nancial instruments. We also employ deri-vative instruments for this purpose. Further details can be found on page 150 onward. Another objective of our fi nancial management is to provide the BASF Group with the fi nancial fl exibility needed to steadily develop its business portfolio and continue its shareholder-oriented dividend and share buy-back policy. The fundamental objectives of our fi nancial manage-ment are to ensure liquidity, limit fi nancial risks and opti-mize our cost of capital by means of an appropriate capi-tal structure. Our fi nancial activities are conducted in line with the operational business and the company’s strategic direction. As a borrower, we make use of international capital markets. In doing so, we aim to preserve our ability to meet our fi nancial obligations, which is rated “very good” by independent rating agencies. We thus ensure attractive fi nancing conditions.
FINANCIAL POSITION OF THE BASF GROUP IN 2005
Cash provided by operating activities
At €5,250 million, cash provided by operating activities before external fi nancing of pension obligations was high in 2005, primarily as a result of the signifi cant increase in earnings. This represents a rise of 13.3% compared with the very strong level in 2004. We further reduced net working capital despite a high-er volume of business. Balance sheet items nevertheless increased, in particular due to the rise in the value of the U.S. dollar. “Miscellaneous items” primarily reflects the reclassifi -cation of the gain from the sale of the stake in Basell, which is included as part of cash inflows in cash used in investing activities.
External fi nancing of pension obligations
As of the end of the year, we transferred approximately €3.7 billion into a Contractual Trust Arrangement (CTA). This measure will lessen the impact of pension payments on BASF’s future cash fl ow and will further improve the transparency of our fi nancial reporting (see also page 65).
Cash used in investing activities
Net capital expenditures declined by €527 million, or 42.7%, compared with 2004. This signifi cant decline was due primarily to cash inflows from portfolio measures. We spent €1,948 million, or 5.3% less than in 2004, on additions to tangible and intangible assets. As a result, capital expenditures were again substantially below the level of depreciation and amortization. Expenditures for acquisitions totaled €536 million and were primarily related to the acquisition of the electronic chemicals business of Merck KGaA, Darmstadt, Germany, as well as the Swiss fi ne chemicals company Orgamol. We generated proceeds of €1,531 million from divestitures, the most important of which was the sale of the stake in Basell. Additional cash infl ows were related to further portfolio optimization measures in the Agricultural Prod-ucts division and the sale of our polystyrene business in the United States. Changes in financial assets, marketable securities and financial receivables resulted in an outflow of €211 million. The sale and disposal of long-term assets and securities generated proceeds of €458 million. In 2005, we invested a total of €2,523 million in tangi-ble and intangible assets, including acquisitions, com-pared with €2,163 million in 2004. On a regional basis, these expenditures were as follows:
Capital expenditures
by region
% 2005 2004
Europe 56.8 55.6
North America (NAFTA) 11.2 12.5
Asia Pacifi c 27.6 28.1
South America, Africa, Middle East 4.4 3.8
100.0 100.0

Management’s Analysis > BASF Group Business Review and Analysis
Liquidity and Capital Resources
In the Chemicals segment, investments and acquisitions in 2005 rose by 6.3% compared with the previous year to €639 million. Major projects included:
Completion and startup of the steam cracker, a syngas plant and production plants for formic acid, C4 oxo alcohols, ethylene oxide and ethylene glycol, propionic acid, methylamines and dimethylformamide at the new Verbund site in Nanjing, China;Completion and startup of plants for cyclohexane and isopropanolamine in Ludwigshafen;Completion and startup of a THF/PolyTHF® plant in Caojing, China;Optimization of plasticizer production in North America (NAFTA); andAcquisition of the electronic chemicals business of Merck KGaA, Darmstadt, Germany.
In the Plastics segment, we spent €490 million on capital expenditures and acquisitions in 2005. This was an in-crease of 3.6% compared with the previous year. Among the important investments were:
Expansion of MDI production capacity in Antwerp, Bel-gium;Construction of new MDI and TDI plants in Caojing, China;Acquisition of the global TDI business of Huntsman, United States;Establishment of a PUR systems house in Bangpoo, Thailand;Construction of a PBT plant in Kuantan, Malaysia;Expansion of capacities for engineering plastics com-pounding in Pasir Gudang, Malaysia; Start of expansion of production capacities for poly-amide 6 in Freeport, Texas; andAcquisition of Leuna-Miramid GmbH, Leuna, Germany.
◾
◾
◾
◾
◾
◾
◾
◾
◾
◾◾
◾
◾
In the Performance Products segment, investments in 2005 increased by 14.1% to €347 million. The most impor-tant projects were:
Completion and startup of plants for acrylic acid and acrylates at the new Verbund site in Nanjing, China;Construction of a superabsorbents plant in Freeport, Texas; andConstruction of a plant for raw materials for HDI-based coatings at the site in Caojing, China.
In the Agricultural Products & Nutrition segment, we spent €296 million on capital expenditures and acquisi-tions in 2005 compared with €253 million in the previous year. The Agricultural Products division invested €74 mil-lion, mainly in optimization measures at various sites. The Fine Chemicals division spent €222 million on capital expenditures and acquisitions in 2005. Major projects included:
Construction of a plant for citral derivatives in Ludwigs-hafen and the completion of a plant for UV absorbers in Ludwigshafen;Construction of a feed enzymes plant in Ludwigshafen; andAcquisition of the Swiss fi ne chemicals company Orgamol with sites in Switzerland and France.
In the Oil & Gas segment, we invested €624 million com-pared with €388 million in 2004. Key projects included:
Pipeline connection to the Mittelplate offshore oil field in Germany;Debottlenecking of the STEGAL natural gas pipeline;Start of development of the Achimov horizon in a sec-tion of the Urengoy field in Russia;Start of conversion of the Haidach natural gas fi eld in Austria into a natural gas storage facility;Acquisition of the Saltfl eetby natural gas fi eld in the United Kingdom; andDevelopment of new natural gas deposits in the Dutch North Sea and in Argentina.
◾
◾
◾
◾
◾
◾
◾
◾◾
◾
◾
◾

32 | 33
Cash used in fi nancing activities
In 2005, cash used in fi nancing activities was €2,108 mil-lion compared with €1,836 million in 2004. We spent a total of €1,435 million to buy back 26.06 million shares at an average price of €55.05 per share (see also page 8). €982 million was paid in dividends and profit transfers in 2005. Of this amount, €904 million, or €1.70 per share, was for dividend payments to shareholders of BASF Aktiengesellschaft for fi scal year 2004. Shareholders of fully or proportionately consolidated companies received €78 million.
Liquid funds declined due to the transfer of funds into the Contractual Trust Arrangement and amounted to €1,091 million at the end of 2005. As a result, liquid funds as a proportion of total assets declined to 3.1%. Financial indebtedness increased by 19.5% compared with 2004 and amounted to €3,941 million. Because of the decline in liquid funds, net debt increased by €1,843 mil-lion to €2,850 million. Financial liabilities are discussed in detail in Note 25 to the Consolidated Financial Statements on page 143 onward. Detailed information on other fi nancial liabilities is pro-vided in Note 26 to the Consolidated Financial Statements on page 145 onward.

Management’s Analysis > BASF Group Business Review and Analysis
Liquidity and Capital Resources
Key ratios and ratings
In 2005, we improved key ratios, thus laying the foundation for maintaining good credit ratings.
Horizontal balance sheet ratios 2005 2004
Fixed asset coverage I (%) =Stockholders’ equity*Intangible assets + Tangible assets + Financial assets 88 84
Fixed asset coverage II (%) =Stockholders’ equity* + Long-term liabilitiesIntangible assets + Tangible assets + Financial assets 140 139
Fixed asset coverage III (%) =Stockholders’ equity* + Long-term liabilitiesIntangible assets + Tangible assets + Financial assets + Inventories 109 112
* Minus proposed dividend
Liquidity and debt ratios 2005 2004
Liquidity I (%) =Short-term receivables + Liquid fundsShort-term liabilities + Proposed dividend 103 110
Liquidity II (%) =Current assetsShort-term liabilities + Proposed dividend 161 159
Dynamic debt level (%) =Cash provided by operating activitiesFinancial indebtedness 133* 141
Debt-equity ratio (%) =Financial indebtednessFinancial indebtedness + Stockholders’ equity 18.4 16.6
* Before external fi nancing of pension obligations
Interest coverage 2005 2004
EBITDA interest coverage =
Income from operations before interest, taxes
depreciation and amortizationInterest expense 23.4 26.7
The rating agencies Moody’s and Standard & Poor’s continue to give BASF their best ratings for short-term debt and “very good” ratings for long-term debt. Moody’s has assigned us a short-term debt rating of P-1 and a long-term rating of Aa3; our ratings from Standard & Poor’s are A1+ short-term and AA- long-term.

34 | 35
Results of Operations by Segment
Segment overview
Sales Income from operations
before interest, taxes, depre-
ciation and amortization
(EBITDA)
Income from operations
(EBIT) before special items
Million € 2005 2004 2005 2004 2005 2004
Chemicals 8,103 7,020 1,942 1,857 1,488 1,377
Plastics 11,718 10,532 1,504 1,193 1,031 752
Performance Products 8,267 8,005 1,227 1,503 890 850
Agricultural Products & Nutrition 5,030 5,147 996 1,093 693 763
Thereof Agricultural Products 3,298 3,354 907 887 671 666
Fine Chemicals 1,732 1,793 89 206 22 97
Oil & Gas 7,656 5,263 2,859 2,098 2,410 1,653
Other* 1,971 1,570 (295) (59) (374) (165)
Thereof corporate research costs – – – – (225) (168)
42,745 37,537 8,233 7,685 6,138 5,230
Segment overview
Income from
operations
(EBIT)
Assets Capital expenditures**
Million € 2005 2004 2005 2004 2005 2004
Chemicals 1,326 1,284 6,146 5,219 639 601
Plastics 1,015 694 6,639 6,187 490 473
Performance Products 863 1,128 4,863 4,538 347 304
Agricultural Products & Nutrition 623 658 6,637 6,293 296 253
Thereof Agricultural Products 681 602 5,156 4,985 74 100
Fine Chemicals (58) 56 1,481 1,308 222 153
Oil & Gas 2,410 1,643 4,895 4,063 624 388
Other* (407) (214) 6,490 9,148 127 144
Thereof corporate research costs (225) (168) – – – –
5,830 5,193 35,670 35,448 2,523 2,163
** “Other” includes the fertilizers business and other businesses as well as expenses, income and assets not allocated to the segments. This item also includes foreign
currency results from fi nancial indebtedness that are not allocated to the segments, hedging of forecasted sales, as well as from currency positions that are macro-
hedged (€(97) million, previous year €54 million).
** Capital expenditures in tangible assets (thereof €329 million from acquisitions in 2005) and intangible assets (thereof €257 million from acquisitions in 2005).
Management’s Analysis > BASF Group Business Review and Analysis
Results of Operations by Segment

Management’s Analysis > BASF Group Business Review and Analysis
Results of Operations by Segment
Sales 1st Quarter 2nd Quarter 3rd Quarter 4th Quarter
Million € 2005 2004 2005 2004 2005 2004 2005 2004
Chemicals 1,822 1,582 2,007 1,748 2,063 1,811 2,211 1,879
Plastics 2,800 2,307 2,924 2,522 2,957 2,827 3,037 2,876
Performance Products 1,908 1,929 2,098 2,029 2,106 2,068 2,155 1,979
Agricultural Products & Nutrition 1,354 1,441 1,465 1,527 1,008 1,035 1,203 1,144
Thereof Agricultural Products 959 983 1,043 1,071 576 591 720 709
Fine Chemicals 395 458 422 456 432 444 483 435
Oil & Gas 1,840 1,394 1,650 1,090 1,630 1,163 2,536 1,616
Other* 359 398 437 398 597 410 578 364
10,083 9,051 10,581 9,314 10,361 9,314 11,720 9,858
Income from operations (EBIT) 1st Quarter 2nd Quarter 3rd Quarter 4th Quarter
Million € 2005 2004 2005 2004 2005 2004 2005 2004
Chemicals 426 234 345 335 259 338 296 377
Plastics 268 154 280 171 260 169 207 200
Performance Products 224 203 282 230 209 214 148 481
Agricultural Products & Nutrition 304 280 272 268 (11) (26) 58 136
Thereof Agricultural Products 284 234 291 235 (12) (29) 118 162
Fine Chemicals 20 46 (19) 33 1 3 (60) (26)
Oil & Gas 484 343 579 346 594 459 753 495
Other* (207) (139) (171) (100) (49) (78) 20 103
1,499 1,075 1,587 1,250 1,262 1,076 1,482 1,792
Income from operations (EBIT)
before special items
1st Quarter 2nd Quarter 3rd Quarter 4th Quarter
Million € 2005 2004 2005 2004 2005 2004 2005 2004
Chemicals 426 251 415 340 268 367 379 419
Plastics 269 155 274 180 267 180 221 237
Performance Products 225 210 272 233 216 216 177 191
Agricultural Products & Nutrition 296 300 302 273 (23) 4 118 186
Thereof Agricultural Products 276 254 295 239 (24) (11) 124 184
Fine Chemicals 20 46 7 34 1 15 (6) 2
Oil & Gas 484 343 579 339 594 459 753 512
Other* (137) (84) (185) (99) 5 (54) (57) 72
1,563 1,175 1,657 1,266 1,327 1,172 1,591 1,617
* “Other” includes the fertilizers business and other businesses as well as expenses, income and assets not allocated to the segments. This item also includes foreign
currency results from fi nancial indebtedness that are not allocated to the segments, hedging of forecasted sales, as well as from currency positions that are macro-
hedged (€(97) million, previous year €54 million).

36 | 37
Chemicals
Signifi cant increase in sales due to higher volumes and prices
Increased earnings despite startup costs for new plants and the effects
of the hurricanes in the United States
Business strengthened with electronic chemicals
Expansion of our production capacities in Asia
◾
◾
◾
◾
The Chemicals segment comprises the Inorganics, Petrochemicals and Intermediates divisions.
Compared with the previous year, we increased sales to third parties by €1,083 million to €8,103 million in 2005 due to higher prices and volumes (volumes 5%, prices 8%, portfolio 2%). This was primarily due to the plants at our Verbund site in Nanjing, China, as well as the acquisition of the electronic chemicals business of Merck KGaA, Darmstadt, Germany.
Segment data
Million € 2005 2004 Change in %
Sales to third parties 8,103 7,020 15.4
Thereof Inorganics 1,017 844 20.5
Petrochemicals 5,084 4,189 21.4
Intermediates 2,002 1,987 0.8
Intersegmental transfers 3,826 3,395 12.7
Sales including intersegmental transfers 11,929 10,415 14.5
Income from operations before interest, taxes, depreciation
and amortization (EBITDA) 1,942 1,857 4.6
Income from operations (EBIT) before special items 1,488 1,377 8.1
Income from operations (EBIT) 1,326 1,284 3.3
Operating margin (%) 16.4 18.3 –
Assets 6,146 5,219 17.8
Return on operating assets (%) 23.3 25.2 –
Research and development expenses 114 98 16.3
Additions to tangible and intangible assets 639 601 6.3
We increased income from operations again by 3.3% compared with the exceedingly strong level in 2004. Earn-ings grew despite the hurricanes in the United States and additional costs for the startup of our plants in Nanjing and Caojing, China. It was mostly possible to pass on higher raw material prices to customers due to continuing strong demand in many product lines.
Management’s Analysis > BASF Group Business Review and Analysis
Chemicals

Management’s Analysis > BASF Group Business Review and Analysis
Chemicals
At €6,146 million, assets were €927 million higher than in 2004 due to the following measures in our key regions: In Europe, we successfully started up new plants. At the Ludwigshafen site, for example, we commenced pro-duction of the petrochemical cyclohexane. This year, we started production of triethylenediamine, an important basic product in the manufacture of polyurethanes, in Ant-werp, Belgium. In North America (NAFTA), we are aligning production of plasticizers with our customers’ needs. At our site in Pasadena, Texas, we are converting the 2-ethylhexanol plant to produce 2-propylheptanol. At the same site, a new plant is also being built to produce the plasticizer Palatinol® DPHP from 2-propylheptanol. The production capacity of the 2-ethylhexanol plant is also being increased at the site in Freeport, Texas. We aim to start up the new and expanded plants in mid-2006.
In Asia, we reached several milestones in the expansion of our chemicals business. The purchase of the electronic chemicals business complements our portfolio and strengthens our position in this growth industry in Asia. The creation of a new, global business unit headquartered in Hong Kong is also contributing to this success. In Nan-jing, China, we started operations at a Verbund site in this important market together with Sinopec, our Chinese partner. Since then, both the steam cracker and the downstream plants have been operating reliably. This site is a key factor in supplying our Chinese customers with important petrochemical raw materials. We started pro-duction of THF and PolyTHF® at the world-scale plant at our site in Caojing, China. Among other things, PolyTHF® is used to make spandex fi bers. In 2006, we expect business to remain stable, with our new plants in Asia contributing signifi cantly to business. Earnings will, above all, be negatively impacted by sched-uled plant shutdowns for inspections and maintenance. We also expect raw material costs to remain high and energy costs to increase. In 2006, we nevertheless aim to match the previous year’s strong earnings.
Inorganics
In 2005, we increased sales to third parties by €173 million to €1,017 million (volumes 1%, prices 1%, portfolio 18%). The sales growth was mainly due to the purchase of the electronic chemicals business in April 2005. Income from operations in 2005 was slightly higher than the previous year’s already high level. Higher natural gas prices, particularly in the second half of 2005, resulted in a slightly lower contribution to earnings from methane-based products. However, this was offset by continued improvement in earnings from basic inorganic chemicals. The acquisition of Merck KGaA’s activities serves to develop BASF’s electronic chemicals business. It consid-erably strengthens BASF’s market position in Europe and Asia, making BASF the leading provider of electronic chemicals in the growth areas of semiconductors and fl at screens.
Innovative catalysts enable emission-free production of cyclohexane at a new plant at the Ludwigshafen site.

38 | 39
We expect higher sales in 2006 with contributions from all of the division’s business units. We do not expect to match the high earnings level of 2005 because further increases in natural gas and energy prices will put noticeable pres-sure on margins.
Petrochemicals
In 2005, we signifi cantly increased sales to third parties by €895 million to €5,084 million (volumes 12%, prices 9%). All product lines contributed to this increase. Sales growth for cracker products, in particular, was higher than aver-age in view of increased prices for crude oil and naphtha. Sales of alkylene oxides and glycols as well as plasticizers and solvents also increased thanks to strong demand. With business remaining strong, income from opera-tions exceeded the very high level recorded in 2004. Raw material prices were considerably higher and very volatile, with record highs for crude oil and naphtha. We were largely able to pass on these increases to our customers in the form of higher prices. Capacity utilization rates at our plants were again very high. As a result, our margins were high, especially in the fi rst half of the year. In the fall of 2005, hurricanes forced us to shut down our plants in the Gulf of Mexico for several weeks. In 2006, we expect that our business will continue to develop positively. Although we anticipate sales at the previous year’s level, it will be diffi cult to match the record earnings posted in 2005. Additional business volumes will certainly come from the fi rst full operational year of our plants in Nanjing, China. However, these are likely to be offset by scheduled shutdowns of major plants in Europe and the United States.
Intermediates
Sales to third parties amounted to €2,002 million (volumes –9%, prices 9%, currencies 1%). In line with our “value before volume” strategy, we offset lower sales volumes compared with 2004 thanks to price increases in all regions and nearly all product lines. Global demand in the strategic business units amines, carboxylic acids and specialty intermediates was strong in 2005. From the second quarter onward, however, the butanediol and derivatives business was affected by a decline in demand for PolyTHF®, in particular in Asia. This was due to a textile trading dispute lasting several months between China and the United States as well as between China and the E.U. In the second half of 2005, the strate-gic business unit polyalcohols and specialties recovered following initially weak demand in its most important application, coatings. Income from operations was lower than in 2004 due to special items. In the fi rst half of 2005, raw material costs remained overall constant and price increases led to signi-fi cantly improved margins. After the hurricanes in the Gulf of Mexico in the third quarter of 2005, however, the prices of almost all important raw materials rose dramatically worldwide. Costs for the startup of six new plants in Cao-jing and Nanjing, China, also negatively impacted earnings in the second half of the year. Earnings in 2005 were also impaired by special charges: The largest items were the provisions established for the restructuring and partial closure of the site in Feluy, Belgium, and the closure of plants for THF and PolyTHF® in Yokkaichi, Japan. We expect sales to increase slightly in 2006. Thanks to the restructuring measures we have introduced, we expect to improve earnings despite higher raw material costs and additional capacities at both existing and new competitors.

Plastics
Sales growth thanks to higher prices
Increase in earnings in Polyurethanes and Performance Polymers
High volatility and further increase in raw material costs
Business models successfully optimized
◾
◾
◾
◾
The Plastics segment comprises the Styrenics, Performance Polymers and Polyurethanes divisions.
Segment data
Million € 2005 2004 Change in %
Sales to third parties 11,718 10,532 11.3
Thereof Styrenics 4,518 4,450 1.5
Performance Polymers 2,909 2,587 12.4
Polyurethanes 4,291 3,495 22.8
Intersegmental transfers 471 677 (30.4)
Sales including intersegmental transfers 12,189 11,209 8.7
Income from operations before interest, taxes, depreciation
and amortization (EBITDA) 1,504 1,193 26.1
Income from operations (EBIT) before special items 1,031 752 37.1
Income from operations (EBIT) 1,015 694 46.3
Operating margin (%) 8.7 6.6 –
Assets 6,639 6,187 7.3
Return on operating assets (%) 15.9 11.6 –
Research and development expenses 135 136 (0.7)
Additions to tangible and intangible assets 490 473 3.6
Sales to third parties rose by €1,186 million to €11,718 mil-lion in 2005 (volumes 1%, prices 9%, currencies 1%). Income from operations rose by €321 million to €1,015 million compared with last year’s strong level. In the Per-formance Polymers and Polyurethanes divisions, sales and earnings continued to improve as a result of higher prices despite high and volatile raw material costs. Only the Styrenics division fell short of the previous year’s high earnings, even though sales remained stable. This was due to both the high volatility of benzene and styrenics prices as well as a decline in market demand.
Price increases were necessary to pass on higher raw material costs. As a result, demand in the second half of 2005 was lower than originally forecast. Our margins therefore came under pressure and softened slightly. We further strengthened the polyurethanes and perfor-mance polymers businesses through acquisitions. All divi-sions continued to optimize their business models. Here, we focused on working closer with customers to imple-ment their ideas for new products and applications. Spe-cialties in the Styrenics division were combined in a single global business unit.
Management’s Analysis > BASF Group Business Review and Analysis
Plastics

40 | 41
In 2005, we invested primarily in the further expansion of our business in the Performance Polymers and Polyure-thanes divisions. Inventories and especially receivables rose compared with the previous year as a result of signifi -cantly higher sales volumes and prices. This increased the segment’s total assets. In 2006, the main focus will be on starting up addition-al capacities in Asia. The MDI/TDI complex built together with our partners in Caojing, China, is one example of the consistent expansion of our activities in this region. Due to the expansion of our business, we expect sales to increase slightly. In view of the startup costs for our new plants and the ongoing volatility of raw material costs for styrenics and fi ber intermediates, we aim to at least match the 2005 earnings level.
Styrenics
At €4,518 million, sales to third parties in the Styrenics division in 2005 remained at the previous year’s level (vol-umes –3%, prices 4%, currencies 2%, portfolio –1%). This was due to a decline in demand and structural effects. Income from operations was considerably below last year’s high level. In contrast to 2004, we were able to pass on further increases in raw material costs to customers only after a considerable delay. The high volatility of ben-zene and styrene prices had a negative impact on earn-ings. Furthermore, the decline in demand negatively impacted earnings and was caused to some extent by substitution of styrenics by other materials. We have consistently proceeded to reorient our busi-ness models. Since the start of 2005, we have combined specialties in a single global unit. This has the essential advantage that all activities are now coordinated world-wide “under one roof.” Since then, we have marketed our product range worldwide under the new PlasticsPlus® brand. A successful example of a product innovation is the rapid global introduction of Ecovio®, a biodegradable plastic partly based on renewable raw materials.
We have reached important milestones in the restructuring of our business in North America (NAFTA). The measures carried out in 2005 included the divestiture of the polysty-rene business together with the site in Joliet, Illinois. In addition, we transferred production of Styropor® from South Brunswick, New Jersey, to Altamira, Mexico. In 2006, we aim to increase sales and signifi cantly increase earnings. To do this, we want to better manage the signifi cantly higher volatility of prices and raw material costs seen in recent years and further reduce our fi xed costs.
Martin Vallo, BASF Elastogran, and Klauss Knörr, adidas, develop a sports shoe sole with an innovative shock-absorbing system.

Management’s Analysis > BASF Group Business Review and Analysis
Plastics
Performance Polymers
Sales to third parties rose €322 million to €2,909 million in 2005 (volumes 4%, prices 8%). In particular, sales in Asia increased signifi cantly compared with 2004. Income from operations increased despite persistently high raw material prices. We succeeded in implementing substantial price increases, especially for polyamides and intermediates, which made a signifi cant contribution to earnings. We expanded our engineering plastics business world-wide. In Asia, we increased compounding capacities in Pasir Gudang, Malaysia, and in Pudong, China. Addition-ally, we are building a new PBT plant in Kuantan, Malay-sia, together with our Japanese partner Toray Industries Inc. This plant is scheduled to start operations in mid-2006. We acquired the company Leuna-Miramid GmbH, in Leuna, Germany, strengthening our position in engineer-ing plastics in Europe. By acquiring the North American business of LATI
USA, Inc., we consolidated our market position in this region. The restructuring measures underway in this region will continue. We have rigorously continued to optimize our globally managed commodity business model for polyamides and intermediates. This provides us with the fl exibility to exploit regional market advantages. In engineering plastics, we are expanding our coopera-tion with key customers. Here, we are focusing on new applications and new uses for plastics. On the basis of the measures we are planning, we expect a slight increase in earnings in 2006.
Polyurethanes
Sales to third parties rose by €796 million to €4,291 million in 2005 (volumes 2%, prices 17%, currencies 2%, portfolio
2%). The strongest growth was recorded in the Asia Pacif-ic region. We improved income from operations compared with 2004. This was mainly due to sales prices, which rose during the course of the year. Signifi cantly higher raw material and energy costs did, however, impact our busi-ness. In 2005, our capital expenditures again focused on Asia: The production facility for the basic materials MDI and TDI, which we are building with our partners in Caojing, China, is scheduled to start operations in sum-mer 2006. The additional capacities will be used to meet the constantly rising demand in Asia, and in China in par-ticular. In addition, this facility will provide the necessary starting materials for the production of specialties in Pudong, China, which is planned for 2007. At our Verbund site in Antwerp, Belgium, we raised production capacity for MDI from 360,000 to 450,000 metric tons per year in 2005 in order to meet increased demand. In 2006, we expect persistently volatile and generally very high prices for raw materials and energy. The startup costs for the plants in Caojing, China, will additionally reduce earnings. It will therefore be a considerable chal-lenge to match the strong level of earnings posted in 2005.

42 | 43
Management’s Analysis > BASF Group Business Review and Analysis
Performance Products
Performance Products
Increase in sales mainly due to higher prices
Improvement in earnings due to double-digit growth in Functional Polymers
Growth boosted by positive business performance in Asia Pacifi c
Successful start of operations at production complex for acrylic acid
and acrylates in Nanjing, China
◾
◾
◾
◾
The Performance Products segment consists of the Performance Chemicals, Coatings and Functional Polymers divisions.
Segment data
Million € 2005 2004 Change in %
Sales to third parties 8,267 8,005 3.3
Thereof Peformance Chemicals 2,889 3,228 (10.5)
Coatings 2,180 2,022 7.8
Functional Polymers 3,198 2,755 16.1
Intersegmental transfers 352 291 21.0
Sales including intersegmental transfers 8,619 8,296 3.9
Income from operations before interest, taxes, depreciation
and amortization (EBITDA) 1,227 1,503 (18.4)
Income from operations (EBIT) before special items 890 850 4.7
Income from operations (EBIT) 863 1,128 (23.5)
Operating margin (%) 10.4 14.1 –
Assets 4,863 4,538 7.2
Return on operating assets (%) 18.4 24.2 –
Research and development expenses 214 217 (1.4)
Additions to tangible and intangible assets 347 304 14.1
Sales to third parties in 2005 climbed €262 million to €8,267 million compared with 2004 (prices 7%, currencies 1%, portfolio –5%). This more than offset the decline in sales due to the sale of the printing systems business in November 2004. The sales growth was due mainly to rigorously imple-mented price increases. The Functional Polymers division, in particular, continued to grow profi tably. The positive development of business in Asia gave additional impetus to growth.
Income from operations before special items increased by €40 million to €890 million, building on last year’s strong level. This was primarily achieved by signifi cantly better margins for functional polymers. On the other hand, income from operations declined by €265 million because the special income from the sale of the printing systems business was recorded in 2004.
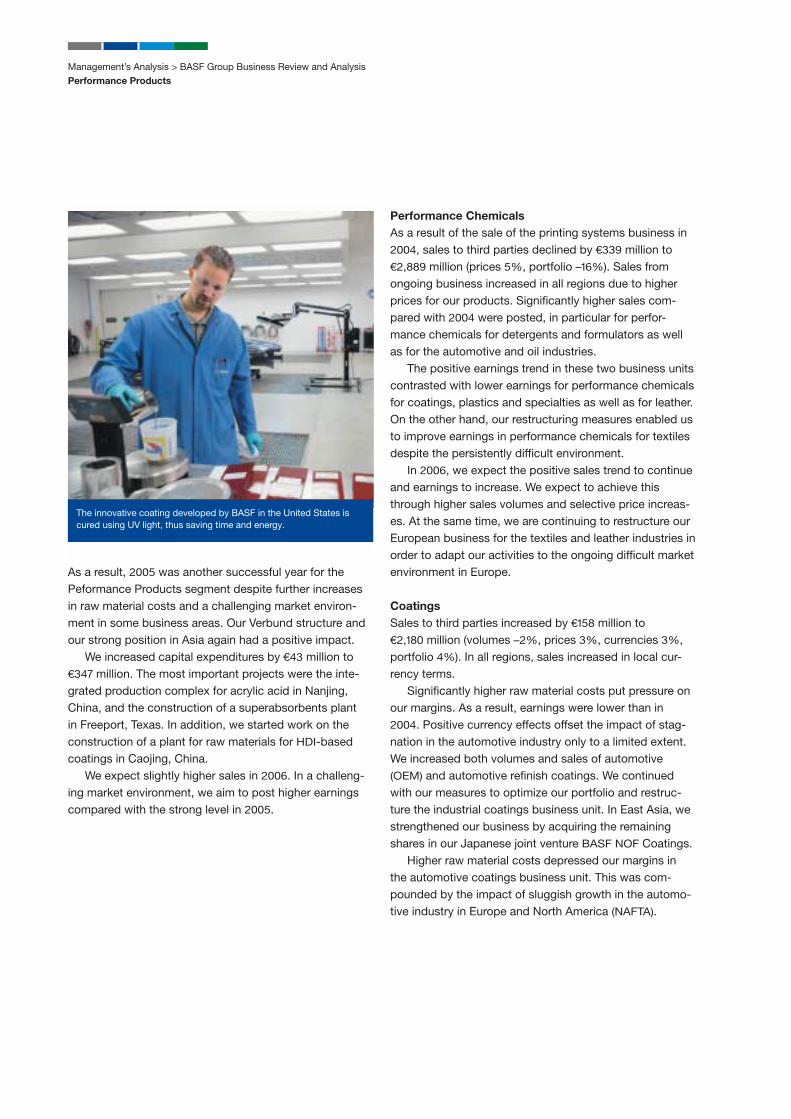
Management’s Analysis > BASF Group Business Review and Analysis
Performance Products
As a result, 2005 was another successful year for the Peformance Products segment despite further increases in raw material costs and a challenging market environ-ment in some business areas. Our Verbund structure and our strong position in Asia again had a positive impact. We increased capital expenditures by €43 million to €347 million. The most important projects were the inte-grated production complex for acrylic acid in Nanjing, China, and the construction of a superabsorbents plant in Freeport, Texas. In addition, we started work on the construction of a plant for raw materials for HDI-based coatings in Caojing, China. We expect slightly higher sales in 2006. In a challeng-ing market environment, we aim to post higher earnings compared with the strong level in 2005.
Performance Chemicals
As a result of the sale of the printing systems business in 2004, sales to third parties declined by €339 million to €2,889 million (prices 5%, portfolio –16%). Sales from ongoing business increased in all regions due to higher prices for our products. Signifi cantly higher sales com-pared with 2004 were posted, in particular for perfor-mance chemicals for detergents and formulators as well as for the automotive and oil industries. The positive earnings trend in these two business units contrasted with lower earnings for performance chemicals for coatings, plastics and specialties as well as for leather. On the other hand, our restructuring measures enabled us to improve earnings in performance chemicals for textiles despite the persistently diffi cult environment. In 2006, we expect the positive sales trend to continue and earnings to increase. We expect to achieve this through higher sales volumes and selective price increas-es. At the same time, we are continuing to restructure our European business for the textiles and leather industries in order to adapt our activities to the ongoing diffi cult market environment in Europe.
Coatings
Sales to third parties increased by €158 million to €2,180 million (volumes –2%, prices 3%, currencies 3%,
portfolio 4%). In all regions, sales increased in local cur-rency terms. Signifi cantly higher raw material costs put pressure on our margins. As a result, earnings were lower than in 2004. Positive currency effects offset the impact of stag-nation in the automotive industry only to a limited extent. We increased both volumes and sales of automotive (OEM) and automotive refi nish coatings. We continued with our measures to optimize our portfolio and restruc-ture the industrial coatings business unit. In East Asia, we strengthened our business by acquiring the remaining shares in our Japanese joint venture BASF NOF Coatings. Higher raw material costs depressed our margins in the automotive coatings business unit. This was com-pounded by the impact of sluggish growth in the automo-tive industry in Europe and North America (NAFTA).
The innovative coating developed by BASF in the United States is cured using UV light, thus saving time and energy.

44 | 45
We continued to expand our system supplier concept for reducing the total cost of coating processes for custom-ers. In addition to supplying our products, we provide inventory management and other customer services. In the refi nish coatings business, earnings remained at last year’s level, although margins were lower because of changes in the product mix and higher raw material costs. We achieved above-average increases in exports to East-ern Europe. In the architectural coatings business in South Ameri-ca, we strengthened our market leadership with our Suvinil® brand and improved earnings. We aim to increase sales and earnings in 2006. In par-ticular, we expect a positive impact from our newly estab-lished regional business unit in Asia. In addition, we are rigorously pursuing the restructuring of our industrial coat-ings business. We are expanding our presence in growth markets in Eastern Europe and Asia. We plan to continue the measures we have already introduced to increase effi -ciency in all regions and business units.
Functional Polymers
At €3,198 million, sales to third parties increased by €443 million compared with 2004 (volumes 1%, prices 14%, currencies 1%). This signifi cant increase was primar-ily the result of passing on higher raw material costs to our customers.
We increased sales volumes considerably, in particular for adhesives raw materials and acrylic monomers. Higher sales volumes of acrylic monomers resulted from the start of operations at our plants in Nanjing, China. Our world-scale plants for the production of acrylic acid and acrylates at this new BASF Verbund site were completed on schedule. Operations started successfully in the fi rst quarter, and full production capacity was available by the end of April. In Europe, we suffered losses in dispersions for paper fi nishing as a result of the long industrial dispute in the Finnish paper industry. We discontinued our busi-ness with dispersions for the carpet industry in Europe because of the unsatisfactory earnings situation and redu-ced our production capacities by closing an old plant. Income from operations was signifi cantly higher than in 2004. All product lines, especially acrylic monomers, con-tributed to this thanks to high capacity utilization of cost-effi cient plants. In 2006, we expect sales to be slightly higher than in 2005 due to continuing strong demand. In a challenging market environment, we aim to match the very strong earnings posted in 2005.

Management’s Analysis > BASF Group Business Review and Analysis
Agricultural Products & Nutrition
Agricultural Products & Nutrition
Agricultural Products division posts higher earnings
Agricultural Products increases research and development expenditure
Lower prices for lysine and vitamin C negatively impact sales and earnings in Fine Chemicals
Extensive restructuring program launched in Fine Chemicals
◾
◾
◾
◾
The Agricultural Products & Nutrition segment comprises the Agricultural Products and Fine Chemicals divisions.
Agricultural Products
At €3,298 million, sales to third parties were €56 million lower than in 2004 (volumes –1%, prices/currencies –1%). Our sales in Europe declined by 4% to €1,507 million. Persistently dry weather in parts of southern Europe led to lower sales volumes. However, our business in the Central and Eastern European growth markets developed posi-tively. The launch of boscalid, our newly developed fungi-cide, also had a positive impact on our business. We successfully expanded our business in North America (NAFTA), where sales rose by 9% to €946 million. Here, our product Headline®, which contains the active ingredient F 500®, made a major contribution thanks to its positive effects on crop health and yields. Sales in Asia declined by 2% to €212 million due to the transfer of distribution in Australia to a third party. This reorganization enabled us to reduce selling expenses and increase our profi tability and the market presence of our products.
Operating division data
Million € 2005 2004 Change in %
Sales to third parties 3,298 3,354 (1.7)
Intersegmental transfers 29 26 11.5
Sales including intersegmental transfers 3,327 3,380 (1.6)
Income from operations before interest, taxes, depreciation
and amortization (EBITDA) 907 887 2.3
Income from operations (EBIT) before special items 671 666 0.8
Income from operations (EBIT) 681 602 13.1
Operating margin (%) 20.6 17.9 –
Assets 5,156 4,985 3.4
Return on operating assets (%) 13.4 11.4 –
Research and development expenses 303 272 11.4
Additions to tangible and intangible assets 74 100 (26.0)
In South America, sales declined by 10% to €633 million. This was mainly due to conditions in Brazil, where persis-tently dry weather reduced harvests and the appreciation of the real put our export-oriented customers under con-siderable pressure. In this region, we continued with our cautious business policy, which aims to achieve long-term success. Our fungicide Opera® with the active ingredient F 500 continued to affi rm its market leadership. In addi-tion, we successfully expanded our insecticide business in Brazil with the seed treatment product Standak®, which contains the active ingredient fi pronil.

46 | 47
We increased income from operations by €79 million to €681 million. Higher demand for our innovative products offset the negative impact of lower sales and scheduled rises in research and development expenses. We generated special income from the sale of three active ingredients as a result of portfolio optimization measures. We increased research and development expenditure by €31 million to €303 million. As a percentage of sales, research and development expenses amounted to 9.2%, compared with 8.1% in 2004. Details of our activities in the area of crop protection research are provided on page 55. Assuming normal seasonal conditions in 2006, we expect to increase sales and maintain earnings at last year’s strong level. We aim to develop our business with our high-value, innovative products. At the same time, we plan to provide additional funds to conduct research into new solutions to improve plant health and develop prod-ucts based on our latest active ingredients. We will continue to manage receivables and invento-ries strictly in a market that continues to be highly com-petitive.
Plant biotechnology
BASF is one of the world’s leading companies in the fi eld of plant biotechnology research and development. Plant biotechnology is one of the company’s fi ve growth clus-ters and BASF plans to provide a further €270 million for research in this area in the next three years. You can read more about BASF’s growth clusters on page 53. We plan to shape this attractive market of the future with our technology platform and an extensive project portfolio. All our activities in plant biotechnology are com-bined in our subsidiary BASF Plant Science. Among other things, we are focusing on crops for healthier nutrition and plants as renewable raw materials – “green factories” – to produce specifi c chemical sub-stances. This includes plants with optimized constituent components such as oils, proteins, starches, vitamins or fatty acids. Another focus is to use biotechnology to protect plants from pests and to increase the yield of important crops such as corn (maize), wheat and soybeans. This also involves developing plants that are more resistant to drought. In 2005, we signed an extensive licensing agree-ment and research cooperation with the Belgian biotech-nology company CropDesign that gives us a signifi cant competitive advantage.
BASF Plant Science operates an international research and technology platform with a team of approximately 500 highly qualifi ed staff at seven sites in Europe and North America. In addition, we cooperate with numerous research institutes, universities and biotechnology compa-nies worldwide. Our subsidiary Metanomics in Berlin is an important part of this biotechnology network. Metanomics operates a technology platform to identify agronomically important genes on the basis of metabolic functional genomics. This involves determining the metabolic functions of specifi c genes in living organisms. This information offers us great-er possibilities of fi nding new relevant genes. By combin-ing bioanalysis and bioinformatics, this platform gives us a unique level of precision and performance within the industry, and thus accelerates our research and develop-ment processes. In addition to the focus on plant research, this approach also opens up synergies in the areas of pharmacology, toxicology and nutritional science.
This automated system increases testing effi ciency in the insecticide laboratory.

Management’s Analysis > BASF Group Business Review and Analysis
Agricultural Products & Nutrition
In 2005, sales to third parties fell by €61 million to €1,732 million (volumes 3%, prices –7%, currencies 1%). We achieved further profi table growth in the product lines fat-soluble vitamins and organic acids, which are used in animal nutrition, and aroma chemicals. Business with lysine and vitamin C was signifi cantly negatively impacted by falling prices. Regulatory changes for the active ingredient pseudoephedrine in the U.S. pharmaceu-ticals market led to lower sales in the Pharma Solutions unit. Sales were also reduced by the disposal of the Cramlington production site, which still contributed to business in 2004. Effective October 1, 2005, we acquired the Orgamol Group with sites in Switzerland and France. This acquisi-tion will enable us to expand the high-growth contract manufacturing business, which involves the exclusive manufacture of active ingredients and intermediates for the pharmaceutical industry.
Following the start of our own production of feed enzymes from 2006 onward, we will be able to realize the added value created by these products and achieve cost advan-tages. In addition to the decline in sales prices, earnings were negatively affected by increasingly higher costs for raw materials and energy in the course of the year. Cost reductions, for example in the citral product line, only partially offset operating costs. We introduced a restructuring program in view of the unsatisfactory earnings trend. One-time charges related to this program largely accounted for special items. The larg-est individual items involved the closure of the vitamin C plant in Grenaa, Denmark, and a reduction in the work-force at the production site in Minden, Germany. Assets in the Fine Chemicals division increased in 2005 as a result of the Orgamol acquisition. On a compa-rable basis, however, we reduced operating assets. On the basis of the measures we are taking, we expect higher sales and earnings in 2006.
Operating division data
Million € 2005 2004 Change in %
Sales to third parties 1,732 1,793 (3.4)
Intersegmental transfers 28 30 (6.7)
Sales including intersegmental transfers 1,760 1,823 (3.5)
Income from operations before interest, taxes, depreciation
and amortization (EBITDA) 89 206 (56.8)
Income from operations (EBIT) before special items 22 97 (77.3)
Income from operations (EBIT) (58) 56 .
Operating margin (%) (3.3) 3.1 –
Assets 1,481 1,308 13.2
Return on operating assets (%) (4.2) 4.2 –
Research and development expenses 70 90 (22.2)
Additions to tangible and intangible assets 222 153 45.1
Fine Chemicals
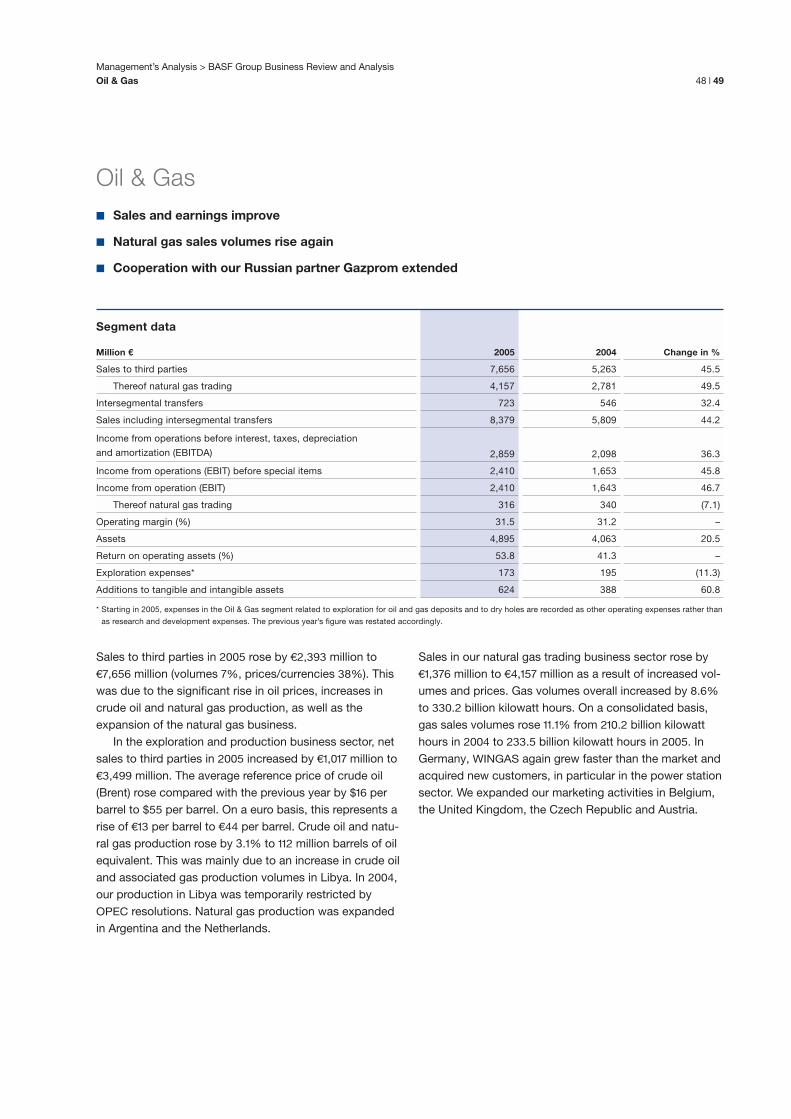
48 | 49
Management’s Analysis > BASF Group Business Review and Analysis
Oil & Gas
Oil & Gas
Sales and earnings improve
Natural gas sales volumes rise again
Cooperation with our Russian partner Gazprom extended
◾
◾
◾
Sales to third parties in 2005 rose by €2,393 million to €7,656 million (volumes 7%, prices/currencies 38%). This was due to the signifi cant rise in oil prices, increases in crude oil and natural gas production, as well as the expansion of the natural gas business. In the exploration and production business sector, net sales to third parties in 2005 increased by €1,017 million to €3,499 million. The average reference price of crude oil (Brent) rose compared with the previous year by $16 per barrel to $55 per barrel. On a euro basis, this represents a rise of €13 per barrel to €44 per barrel. Crude oil and natu-ral gas production rose by 3.1% to 112 million barrels of oil equivalent. This was mainly due to an increase in crude oil and associated gas production volumes in Libya. In 2004,
our production in Libya was temporarily restricted by OPEC resolutions. Natural gas production was expanded in Argentina and the Netherlands.
Sales in our natural gas trading business sector rose by €1,376 million to €4,157 million as a result of increased vol-umes and prices. Gas volumes overall increased by 8.6% to 330.2 billion kilowatt hours. On a consolidated basis, gas sales volumes rose 11.1% from 210.2 billion kilowatt hours in 2004 to 233.5 billion kilowatt hours in 2005. In Germany, WINGAS again grew faster than the market and acquired new customers, in particular in the power station sector. We expanded our marketing activities in Belgium, the United Kingdom, the Czech Republic and Austria.
Segment data
Million € 2005 2004 Change in %
Sales to third parties 7,656 5,263 45.5
Thereof natural gas trading 4,157 2,781 49.5
Intersegmental transfers 723 546 32.4
Sales including intersegmental transfers 8,379 5,809 44.2
Income from operations before interest, taxes, depreciation
and amortization (EBITDA) 2,859 2,098 36.3
Income from operations (EBIT) before special items 2,410 1,653 45.8
Income from operation (EBIT) 2,410 1,643 46.7
Thereof natural gas trading 316 340 (7.1)
Operating margin (%) 31.5 31.2 –
Assets 4,895 4,063 20.5
Return on operating assets (%) 53.8 41.3 –
Exploration expenses* 173 195 (11.3)
Additions to tangible and intangible assets 624 388 60.8
* Starting in 2005, expenses in the Oil & Gas segment related to exploration for oil and gas deposits and to dry holes are recorded as other operating expenses rather than
as research and development expenses. The previous year’s fi gure was restated accordingly.

Management’s Analysis > BASF Group Business Review and Analysis
Oil & Gas
Income from operations rose €767 million to €2,410 million. Income from operations in the exploration and produc--tion business sector, which is included in this amount, increased by €791 million to €2,094 million, mainly as a result of higher prices. Income from operations includes income taxes on oil production in North Africa and the Middle East of €1,072 million that are noncompensable with German corporate income tax. These taxes are reported as income tax (see also Note 10 to the Consoli-dated Financial Statements on page 121). Income from operations from natural gas trading declined by €24 million to €316 million. Our buying and selling prices largely depend on the price of crude oil. However, the time lag between changes is longer for sell-ing prices than for buying prices. The continuous increase in oil prices over a long time therefore impaired our trading margin during the reporting period. Assets in the Oil & Gas segment rose by €832 million to €4,895 million compared with the previous year. Addi-tions to tangible assets mainly involved exploration and production activities in Germany, the Netherlands, Libya and Argentina.
In 2005, 16 wildcat and appraisal wells were drilled in the search for new oil and natural gas deposits, 11 of which were successful. As a result, we replenished 52% of the volumes drilled in 2005. In the natural gas trading sector, we invested primarily in expanding our infrastructure. Proved crude oil reserves declined by 6% to 63 million tons compared with year-end 2004. The reserve-to-pro-duction ratio was seven years, compared with eight years at year-end 2004. Proved natural gas reserves of 63 billion cubic meters declined by 5% compared with the previous year. The reserve-to-production ratio is nine years. To further extend our long-standing cooperation with our Russian partner Gazprom, we signed a memorandum of understanding covering the entire value-adding chain – from production and transportation through to natural gas trading. Under the terms of the memorandum of under-standing, Gazprom is to increase its stake in WINGAS. The Yuzhno-Russkoye fi eld in Western Siberia is to be developed jointly. It is also planned to jointly construct the North European Gas Pipeline (NEGP) through the Baltic Sea. Following startup, which is scheduled for 2010, WIN-
GAS is to obtain up to 9 billion cubic meters of gas per year for the next 25 years from the new pipeline. In our Achimgaz joint venture with Gazprom, roads and construction site work for the drilling and production facili-ties have been largely completed. This joint venture will produce natural gas and condensate from the Achimov deposit of the Urengoy gas fi eld in western Siberia. The fi rst drilling facility of the six planned production wells to be drilled in the fi rst phase of the project is expected to start operations at the beginning of 2006. In 2006, we expect average prices for crude oil to remain high. We aim to increase sales and earnings in 2006 as a result of the planned expansion of natural gas production and natural gas trading activities.
On the Russian mainland, work starts on the North European Gas Pipeline – a joint venture between BASF, Gazprom and E.ON.

50 | 51
Management’s Analysis > BASF Group Business Review and Analysis
Regional Results
Regional Results
Europe: Ludwigshafen Site Project successfully completed
North America (NAFTA): Income from operations triples
Asia: Signifi cant increase in sales, also as a result of the new Verbund site in Nanjing, China
South America: Agricultural Products business subdued
◾
◾
◾
◾
Europe
Companies in Europe increased sales by €2,557 million in 2005. We were able to pass on higher raw materials costs to the market. This, together with greater demand and the appreciation of the U.S. dollar, had a positive impact on our business. The sales growth was due in particular to the contribu-tion of the Plastics and Oil & Gas segments. The Plastics segment increased sales mainly as a result of higher prices. The Oil & Gas segment made the largest contribu-tion to sales thanks to the continued expansion of its nat-ural gas trading business and increased crude oil and nat-ural gas production. Sales in the Performance Products segment were only slightly lower than in 2004; the effect of the divestiture of the printing systems business was largely offset by stronger demand and higher sales prices. Sales in the Agricultural Products division failed to match the previous year’s level of sales because of dry weather in parts of southern Europe. In the Fine Chemicals divi-sion, sales also declined due to price pressure for impor-tant products. Stronger demand and higher selling prices led to an increase in income from operations by €149 million com-pared with 2004. The Plastics segment made a substantial contribution to this result. The Oil & Gas segment benefi t-ed from the rise in oil prices. Additionally, our measures to reduce fi xed costs paid off. This was particularly the case
for the Ludwigshafen Site Project, which was completed on schedule in 2005. This project enabled us to perma-nently reduce annual costs at our largest site by €480 mil-lion since 2003. In 2005, we rigorously implemented the project “Fur-ther Development of European Organization,” which was started in 2004. This project aims to increase growth and effi ciency in Europe. To this end, we have aligned the business units and the management organization with the market. We expect these measures to result in total addi-tional cost savings of approximately €90 million per year for the BASF Group. In addition, we are currently estab-lishing a European shared service center in Berlin, where we will combine fi nance and accounting functions as well as standard human resources functions.
North America (NAFTA)
Sales by companies in North America (NAFTA) climbed 16.9% to €9,542 million. In local currency terms, sales rose by 17.2%. The largest contribution came from the Chemicals segment, in particular from the Petrochemicals division, which achieved higher sales due to increased volumes and prices. The sales growth was also driven by the C4 complex in Port Arthur, Texas, that we operate with our U.S.-based joint venture partners Total Petrochemi-cals and Shell. This plant started operations in 2004, with 2005 being its fi rst full year of sales.
Region
Sales by
location of company
Sales by
location of customer
Income from operations
(EBIT)
Million € 2005 2004
Change
in % 2005 2004
Change
in % 2005 2004
Change
in %
Europe 25,093 22,536 11.3 23,755 21,343 11.3 4,385 4,236 3.5
Thereof Germany 17,100 15,216 12.4 8,865 7,382 20.1 3,019 3,131 (3.6)
North America (NAFTA) 9,542 8,165 16.9 9,479 8,182 15.9 855 286 199.0
Asia Pacifi c* 6,042 4,911 23.0 6,500 5,309 22.4 297 361 (17.7)
South America, Africa, Middle East* 2,068 1,925 7.4 3,011 2,703 11.4 293 310 (5.5)
42,745 37,537 13.9 42,745 37,537 13.9 5,830 5,193 12.3
* Effective January 1, 2005, companies in Asia are reported in the region “Asia Pacifi c.” South America, which was previously reported separately, is now reported together
with the geographic regions Africa and Middle East in the region “South America, Africa, Middle East.”

Management’s Analysis > BASF Group Business Review and Analysis
Regional Results
Income from operations tripled compared with 2004, ris-ing to €855 million. Increased volumes and therefore high-er capacity utilization rates contributed to this growth. This applied, in particular, in the Plastics segment and the Petrochemicals, Functional Polymers and Agricultural Products divisions. Furthermore, we reached our target of reducing fi xed costs by $250 million per year by 2006 ahead of schedule in mid-2005. This enabled us to offset the consequences of the hurricanes, which signifi cantly impaired our earnings. We aim to rigorously continue with our restructuring program: After attaining in 2005 the goal we set ourselves for 2006, we now intend to reduce annual fi xed costs by a further $150 million by mid-2007. In addition, we expect the Commercial Effectiveness Program we initiated in 2005 to improve earnings. By 2007, we plan to implement measures to increase income from operations by $200 million per year. To achieve this, we are aligning our price structures, logistics, inventory management and business models more closely with mar-ket conditions.
Asia Pacifi c
The companies in Asia Pacifi c increased sales by 23% to €6,042 million. In local currency terms, sales increased by 20.4%. This sales growth was due primarily to the successful startup of all plants at the new Verbund site in Nanjing, China, as well as the THF/PolyTHF® plant in Caojing, China. In addition, the Chemicals segment increased its sales by acquiring the electronic chemicals business of Merck KGaA. The higher sales in the Plastics segment were due primarily to stronger demand for MDI, polyure-thane systems and engineering plastics. In the Perfor-mance Products segment, sales of acrylic acid and acry-lates in particular rose due to higher volumes and prices. Compared with 2004, income from operations declined by €64 million to €297 million. The main reasons for this were a diffi cult market environment for intermediates as well as high and volatile raw material costs for styrenics. Earnings were also negatively impacted by special charg-es resulting from restructuring measures. These related primarily to the planned closure of plants for THF and PolyTHF® in Yokkaichi, Japan.
In Kuala Lumpur, Malaysia, we established a regional shared service center to provide fi nance, accounting, information technology and human resources services to BASF Group companies in 15 countries in the Asia Pacifi c region.
South America, Africa, Middle East
Sales by companies in this region rose by 7.4% to €2,068 million. In local currency terms, however, sales declined by 4.9%. Sales in the Agricultural Products division declined because of the dry weather in parts of South America. The appreciation of the Brazilian real impaired our customers’ competitiveness, and this also had a detrimental effect on our business. The performance of our architectural coatings busi-ness, however, was strong, and we also expanded our natural gas business in Argentina. Income from operations declined by €17 million com-pared with the previous year to €293 million. This was essentially caused by lower volumes in our agricultural products business and also by expenses for dry holes in the Oil & Gas segment in Brazil. This was offset only to some extent by positive effects from the appreciation of individual local currencies against the euro.

52 | 53
Management’s Analysis
Research and Development
Research and Development
€800 million for fi ve growth clusters between 2006 and 2008
Expansion of our global research activities
Almost 1,300 research cooperations worldwide
Research and development expenditure increased by 8%
◾
◾
◾
◾
Innovations are crucial to BASF’s profi table growth. They are essentially driven by customer needs and technologi-cal progress. In many cases, our products provide the impetus for progress in other industries, where they act as the starting point for innovative end products. In turn, the success of such products strengthens our own business. Our recipe for success in research and development (R&D) is our Know-How Verbund. At its center are our four global technology platforms: Polymer Research; Chemi-cals Research & Engineering; Specialty Chemicals Research; and Plant Biotechnology Research. BASF employs approximately 7,000 employees in research and development worldwide. In addition, almost 1,300 cooper-ations worldwide provide impulses for our research activi-ties. Of these, about two-thirds are with centers of excel-lence such as universities and research institutes, and one-third with startup companies or other industrial part-ners throughout the world. Each year, BASF applies for an average of 1,100 chemi-cal patents, making us number one in the world among chemical companies. Our research and development activities are closely focused on market needs. Our goal is to build on impulses for innovation from all regions. To this end, we currently operate 16 research and development centers in Europe, 13 in North America, 17 in Asia and four in South America. At our site in Pudong, China, for example, we are estab-lishing a development platform for performance chemicals and polymer dispersions as well as a polyurethane sys-tems house. We are planning to create further develop-ment centers, which will enable us to pick up market sig-nals even more effi ciently. We want to expand our R&D team further. We therefore plan to employee approximately 180 additional scientists worldwide. We aim to extend the cooperative model that we use with the Institut de Science et d‘Ingénierie Supra-moléculaires (ISIS) in Strasbourg, France, to other out-standing research establishments. In addition, we are intensifying our research activities in Asia. In 2005, we expanded our team in the synthesis laboratory in Thane, India. A laboratory for research into nanostructured sur-faces is scheduled to open in Singapore.
In 2005, we spent €1,064 million on research and develop-ment compared with €986 million in 2004. Of the amount spent in 2005, 78.6% fell under the operational responsi-bility of the operating divisions, with the remaining 21.4% being accounted for primarily by corporate research. In particular, this includes research activities in BASF’s growth clusters as well as research to develop new tech-nologies and methods.
Corporate research
Between 2006 and 2008, we plan to invest approximately €800 million in our fi ve growth clusters – energy manage-ment, nanotechnology, white (industrial) biotechnology, plant biotechnology and raw material change – as part of our strategy “We Innovate for Growth.” These clusters involve cross-sectional technologies in which interdisci-plinary cooperation is the key to success. In the area of energy management, we are focusing on developing new technologies and materials for energy storage and conver-sion. In nanotechnology, we are researching possible applications of nanomaterials and nanostructured surfac-es for use in various applications including coatings, ther-mal insulation and hydrogen storage. Our white biotech-nology research concentrates on three areas: enzyme catalysis for the production of specialty chemicals; fer-mentation and industrial proteins; and biopolymers. The plant biotechnology growth cluster includes developing plants to improve agricultural effi ciency, providing healthi-er nutrition and developing plants as “green factories” to produce chemical substances. In the raw materials change growth cluster, we aim to expand the range of starting materials for the value-adding chains in our Pro-duction Verbund; examples include renewable raw materi-als and natural gas. Details of the R&D activities of our segments are pro-vided on the following page.

Management’s Analysis
Research and Development
Chemicals
Our work centers on process innovations for new and existing products that offer signifi cant competitive advan-tages. We place particular importance on optimizing and expanding our value-adding chains at Verbund sites. In November 2005, for example, we introduced a new pro-duction process for the petrochemical cyclohexane at the Ludwigshafen Verbund site. At the heart of the production plant is a new heterogeneous catalyst that produces an exceptionally high yield with almost no by-products. We are continuously developing our technologies. For example, in the fi eld of gas scrubbing we are working with the Japanese company JGC Corporation on a new pro-cess to remove and store the carbon dioxide (CO2) con-tained in natural gas. Compared with conventional meth-ods, the costs involved in this process are approximately 20% lower. Our gas-scrubbing technology is also being further developed in a European research project to remove CO2 from power station emissions. In 2005, we successfully launched the plasticizer Hex-amoll® DINCH in a variety of new applications. This inno-vative product is particularly suitable for sensitive PVC applications such as medical devices and toys. We offer our customers in the automotive and con-struction industries market tailor-made liquids based on the inorganic specialty carbonyl iron powder. These liquids are used in damping systems, one example being the cable-stayed bridge in Dubrovnik, Croatia.
Plastics
R&D in the Plastics segment concentrates on production processes as well as product and system development. We aim to optimize existing production processes and develop new, highly effi cient processes that offer consi-derable cost advantages. The innovative HPPO process is one example. Together with the U.S. company Dow, we have developed a very cost-effi cient process to manufac-ture propylene oxide (PO) from propylene and hydrogen peroxide (HP). This process generates no unwanted by-products. In product and system development, we work closely with our customers to improve existing products and develop new materials. Cooperation with our customers early in the development process enables us to develop successful products quickly and on target. Our product Ultradur® High Speed is one example of this. With the help of nanomaterials, this fast-fl owing technical plastic offers our customers signifi cant cost benefi ts in processing.
Performance Products
In the Performance Products segment, our technical development centers and pilot plants play a key role in successfully understanding our customers’ needs and testing new products under real-life conditions. This year, we expanded our customer-oriented deve-lopment facilities. We set up two new technical develop-ment centers: for performance chemicals for leather and textiles in Thane, India; and for performance chemicals for leather, textiles, detergents and formulators, as well as dispersions in Pudong, China. We also helped the Chinese Academy of Environmental Sciences (CRAES) in Beijing, China, to build and operate China’s fi rst independent engine test laboratory. This cooperation is helping to improve the quality of Chinese fuels. Our researchers are working on a large number of innovations for everyday products. For example, we are expanding our product range with UV-curing automobile refi nish coatings. In this area, we are working to introduce a new scratch resistant clear coat for repairs. The coating can self-repair paintwork scratches thanks to its innova-tive refl ow properties. BASF has developed and patented Belmadur® technology for the wood products industry. By cross-linking cellulose fi bers in domestic woods, the renewable raw material
Research and development expenses in 2005
by segment*
Million €, %
1 Chemicals 114 10.7%
2 Plastics 135 12.7%
3 Performance
Products 214 20.1%
4 Agricultural Products & Nutrition 373 35.1%
5 Corporate research,
other 228 21.4%
1,064 100.0%
* Starting in 2005, expenses in the Oil & Gas segment related to exploration
for oil and gas deposits and to dry holes are recorded as other operating
expenses rather than as research and development expenses.
2
34
51

54 | 55
becomes more durable, harder and has greater dimen-sional stability. In addition to replacing tropical hardwoods with domestic woods, this opens up new applications for customers in the building sector and for outdoor products. We are rigorously opening up new applications for our innovative fi ber binder, Acrodur®: for example, in the non-wovens industry as a heat-resistant binder used in the manufacturing of glass nonwovens.
Agricultural Products & Nutrition
In the Agricultural Products division, we have extended the early phase of research into active ingredients by strengthening our teams with additional scientists. Their work focuses on identifying and optimizing new lead structures for innovative crop protection products. We have also provided additional fi nancial resources for developing products based on our latest active ingredi-ents. As a result, research and development expenses increased by €31 million to €303 million. In relation to sales, spending increased to 9.2% in 2005 compared with
8.1% in 2004. Our development pipeline was strengthened with a new insecticide. In addition, we successfully developed the fungicide metrafenone for market launch. Our researchers are currently working on the development of a total of six new active ingredients and on a new herbicide tolerance project. These future product innovations have a peak sales potential of €700 million. A further eight crop protection active ingredients with a peak sales potential of €1,200 million are currently being introduced to the market. Of these, the fungicide F 500® and boscalid have performed particularly well. In view of additional market opportunities for products with the active ingredient F 500®, we have increased the peak sales potential from €400 million to €500 million. Assum-ing seasonal conditions are average, we expect to achieve this target in 2007. Our goal is to achieve boscalid sales of €150 million per year. In 2005, we achieved approximately 60% of peak sales potential with currently marketed active ingredients.
In the Fine Chemicals division, we spent 4.0% of sales on research and development in 2005. We shifted the emphasis of our R&D activities from process to product innovation in 2005. We brought new products to market in several areas. In Pharma Solutions, for example, we began marketing directly compressible forms of the anal-gesic ibuprofen and the tablet binder Kollidon® VA 64 Fine. In 2006, we expect our research and development expenses to remain at the same level as in 2005. The focuses in the individual business units are as follows: products for improved feed utilization in animal nutrition; development of new formulation technologies and globally registered formulations in human nutrition; development of new ingredients based on natural raw materials for skin-care, haircare and oral hygiene products in the cosmetics sector; and new solutions to improve drug bioavailability in the Pharma Solutions business unit. In addition, we want to further develop our systematic idea-fi nding process. The core element is to intensify cooperation with our customers to allow us to align our research goals even more closely with their needs.
BASF can thank Walter Ohrbohm (left) for 90 patents on which many modern coating systems are based. His goal: 100 patents by 2008.

Management’s Analysis
Supplementary Report
Supplementary Report
Offer to acquire Engelhard Corporation
On January 3, 2006, BASF offi cially announced that it had made an all-cash offer to acquire all outstanding shares of common stock of U.S. specialty chemical company Engelhard Corporation, Iselin, New Jersey, for $37 per share. Iron Acquisition Corporation, Florham Park, New Jer-sey, a wholly owned subsidiary of BASF Aktiengesell-schaft, published the offi cial tender offer on January 9,
2006 and submitted the documents necessary under U.S. law to the Securities and Exchange Commission (SEC). On the basis of the offer price of $37 per share, the price to acquire all outstanding shares would be approximately $4.9 billion. The offer is subject to a number of conditions. These include acceptance by a majority of Engelhard’s shareholders on a fully diluted basis, as well as Engel-hard’s board taking all necessary actions to make its shareholders’ rights plan and the supermajority voting provisions in its certifi cate of incorporation innapplicable to BASF’s offer. The offer is also subject to receipt of the necessary regulatory approvals, in particular merger control approv-als. The waiting period under the Hart-Scott-Rodino Anti-trusts Improvements Act of 1976, as amended, expired on February 3, 2006 without objections being raised by the Federal Trade Commission (FTC). As a result, BASF is free under U.S. antitrust laws to proceed with its acquisition of Engelhard.
The European Commission also granted approval for the transaction for the E.U. on February 23, 2006. On February 6, 2006, BASF extended its offer, which has previously been scheduled to expire on February 6,
2006, until March 3, 2006. BASF is free to extend the offer further if necessary. Further information on the offer is available on the Internet at corporate.basf.com/tender-offer and on the SEC’s website at www.sec.gov.
Negotiations on the purchase of Degussa’s construc-
tion chemicals business
BASF is negotiating with Degussa AG, Düsseldorf, Ger-many, on the purchase of its construction chemicals busi-ness. The joint aim is to conclude the purchase agreement for the transaction shortly. Degussa’s construction chemicals division markets over 40,000 products in the Americas, Europe and Asia Pacifi c, and is organized in two segments – Admixture Systems and Construction Systems. Total sales in 2004 were €1.8 billion.

56 | 57
Management’s Analysis > Outlook
Economic Environment
Economic Environment
In 2006, we expect the positive economic trend to contin-ue and see favorable medium-term perspectives for the global economy. Stable geopolitical conditions and sound economic policy are, however, necessary for this. We have based our business planning on the following assumptions:
Oil prices of around $55/barrel on average in 2006 with a downward trend from the second half of the yearAn average euro/dollar exchange rate of $1.25 per euro Moderately higher interest rates in the course of 2006 and subsequent years
We expect the global economy to grow by 3.2% in 2006 and by an average of 3.1% per year until 2008. In Europe, we foresee slightly higher growth in 2006 carried predominantly by exports. We anticipate growth of just under 2%, with domestic demand remaining sub-dued. We expect investment to pick up despite the ongo-ing shift in production capacity to Eastern Europe. In the medium term, we expect a further improvement due to reforms of tax and social security systems and in the labor market. Even so, the European economy is not likely to grow by more than just over 2% per year.
◾
◾◾
Growth in North America will likely weaken as a result of rising interest rates and the end of the construction boom in the United States. We anticipate average annual growth of 3% in the medium term. With gross domestic product growth of more than 6% per year, Asia (excluding Japan) is expected to remain by far the fastest growing region thanks primarily to thriving trade within the region, as well as higher levels of dispos-able income among consumers. China, the region’s growth engine, is likely to grow at approximately 8% per year despite its more cautious economic policy. In South America, we expect growth rates to decline slightly in the medium term due to high interest rates and weaker export growth. Africa/Middle East, however, is expected to grow by just under 5% per year, in particular due to higher oil and gas exports and thanks to strong growth in the chemical industry as a result of expanding petrochemical capacity.
Outlook for gross domestic product
Real change compared with previous year (%)
2006
World 3.2
Western Europe 1.9
United States 3.3
Asia excl. Japan 6.3
Japan 1.7
South America 3.8
Outlook for chemical production (excl. pharma)Real change compared with previous year (%)
2006
World 3.0
Western Europe 1.8
United States 2.0
Asia excl. Japan 7.1
Japan 1.3
South America 3.8
Trends 2006 – 2008
World 3.1
Western Europe 2.1
United States 3.0
Asia excl. Japan 6.3
Japan 1.9
South America 3.7
Trends 2006 – 2008
World 3.1
Western Europe 1.8
United States 1.9
Asia excl. Japan 6.8
Japan 1.3
South America 3.4

Management’s Analysis > Outlook
Economic Environment
Outlook for the chemical industry
Under the conditions we have outlined, we expect global chemical production (excluding pharmaceuticals) to grow by 3% in 2006. In Europe, we anticipate a slight upturn in domestic demand. Together with the rise in net exports, this is likely to benefi t chemical production, which is expected to grow by just under 2%. In the medium term, we expect chemi-cal production to grow parallel to European industrial pro-duction. The chemical industry in the United States will proba-bly grow only moderately, although domestic demand for chemicals will be supported by the country’s stable indus-trial production. In the medium term, chemical production growth is likely to be signifi cantly slower than that of industry and gross domestic product as a result of struc-tural problems.
In 2006, we expect chemical production in Asia (exclud-ing Japan) to increase by more than 7%. Asia remains by far the most dynamic region worldwide, even though growth was slower than in the record year of 2004 in which production grew by over 10%. In particular, growth is being driven by industrial production and the ongoing high level of investment in China and India. In the medium term, the region is likely to continue to benefi t from strong growth in industrial customer sectors. We expect annual growth rates of just under 7%. In Japan, chemical production growth is likely to remain slightly lower than industrial growth. Stronger growth is impeded by the strong yen and rising imports. In the medium term, we expect chemical production to grow by more than 1% per year. Following high growth rates in recent years, we antici-pate that growth in the chemical industry in South Ameri-ca will decline to just under 4% per year. This is due to a slowdown in industrial production, resulting in lower demand for chemical products.

58 | 59
Management’s Analysis > Outlook
BASF Group Outlook
BASF Group Outlook
Our business has continued to develop successfully since the beginning of 2006. The level of orders remains strong. Taking into account the economic assumptions described above, we expect BASF’s business to develop positively in the next two years. Signifi cant opportunities are offered by the improving investment and consumer climate in Europe, the ongoing robustness of the North American economy and contin-ued dynamic growth in Asia. We will fully realize the potential offered by our investments in high-growth regions: For example, we aim to generate 10% of sales in our chemical businesses in China by 2010. We see the greatest risks in the following areas:
The recent increase in tensions in regional trouble spotsThe associated growing uncertainty with regard to raw material supplies and increasing volatility of raw material prices, in particular, oil pricesA possible downturn in the economyMajor exchange rate changes, in particular with regard to the U.S. dollarAdditional requirements and regulations, for example for emissions, that differ from region to region and incur extra costs
A weaker U.S. dollar causes negative currency effects, in particular in our Agricultural Products and Fine Chemicals divisions and Performance Products segment. Further-more, record high prices for almost all products make it diffi cult to pass on further increases in raw material costs in the form of higher sale prices because substitution by alternative products is likely to increase.
We anticipate the following developments in specifi c areas at BASF*:
Continuing on our path of value-adding growth
We aim to remain the world’s leading chemical company. Our goal is to continue to increase BASF’s value and earn an attractive premium on our cost of capital. We plan to continue with our measures to optimize our portfolio. This also involves acquisitions in high-growth areas that complement our portfolio. Recent examples include our cash offer for Engelhard Corporation, United States, and our bid for Degussa’s construction chemicals business.
◾
◾
◾◾
◾
To ensure our long-term competitiveness, we will also adapt our processes according to changing market requirements. This includes ongoing restructuring mea-sures to further reduce our costs.
Sales We aim to continue to grow faster than the market.
Earnings
We plan to follow on from the strong level of income from operations before special items posted in 2005. To make BASF even more successful in the future, we are planning to increase our research and development spending.
Dividends and share buybacks
We want to offer our shareholders an attractive dividend yield. We therefore aim to increase our dividend. We plan to continue to buy back shares.
Research and development In 2006, we expect to further increase our research and development expenditures by 8% to approximately €1.15 billion. In the coming years, we therefore plan to cre-ate approximately 180 additional positions for research scientists. More details are provided in the section Research and Development on page 53 onward.
Capital expenditures and fi nancing
Planned capital expenditures in 2006 will amount to almost €2.0 billion and are thus expected to be below the level of depreciation and amortization. Capital expendi-tures in 2007 are likely to be comparable. We aim to fi nance these planned investments from cash provided by operating activities. The most important capital expenditure projects in our segments are listed on the next page. The main focus of our investment commitments is on Europe due to the proj-ects in the Oil & Gas segment.
* The outlook for individual segments and operating divisions is given in the
section Results of Operations by Segment on page 37 onward.

Management’s Analysis > Outlook
BASF Group Outlook
COMMITMENTS FOR INVESTMENTS BY SEGMENT
Chemicals
Expansion of the Electronic Materials Center EuropeExpansion of nitric acid capacity in Antwerp, BelgiumExpansion of capacity of the steam cracker in Ant-werp, Belgium
Plastics
Completion and startup of production plants for TDI and MDI in Caojing, ChinaConstruction of an HPPO plant in Antwerp, BelgiumEstablishment of a PUR systems house and construc-tion of a production plant for TPU in Pudong, ChinaCompletion and startup of a PBT plant in Kuantan, MalaysiaConstruction of a compounding plant for engineering plastics in Pudong, ChinaExpansion of production capacities for polyamide 6 in Freeport, TexasConstruction of a production plant for Ecofl ex® in Schwarzheide, Germany
◾◾◾
◾
◾◾
◾
◾
◾
◾
Performance Products
Construction of a plant for HDI-based coatings in Cao-jing, China Construction of a superabsorbents plant in Freeport, Texas
Agricultural Products & Nutrition
Completion and startup of a plant for citral derivatives in LudwigshafenCompletion and startup of a production plant for feed enzymes in Ludwigshafen
Oil & Gas
Development of new natural gas reserves in the Dutch North Sea and in ArgentinaDevelopment of new oil fi elds in Libya and the expan-sion of existing onesDevelopment of the Achimov horizon in a section of the Urengoy gas fi eld in RussiaDebottlenecking of the STEGAL natural gas pipelineConstruction of a compressor station for the WEDAL natural gas pipeline in Lippe, GermanyConversion of the Haidach natural gas fi eld in Austria into a natural gas storage facilityConversion of the Saltfl eetby natural gas fi eld in the United Kingdom into a natural gas storage facility
◾
◾
◾
◾
◾
◾
◾
◾◾
◾
◾
Commitments for investments by segment
%
1 Chemicals 19
2 Plastics 21
3 Performance Products 16
4 Agricultural Products & Nutrition 7
5 Oil & Gas 21
6 Infrastructure, IT, other 16
100
Commitments for investments by region
%
1 Europe 61
2 North America (NAFTA) 17
3 Asia Pacifi c 15
4 South America, Africa,
Middle East 7
100
1
2
34
5
6
12
3
4

60 | 61
Management’s Analysis > Purchasing, Marketing and Sales
Purchasing
Purchasing, Marketing and Sales
Our strength: A global Procurement Verbund
Regional concentration of purchasing activities
Business models tailored to customer needs
◾
◾
◾
PURCHASING
Procurement Verbund ensures competitive
advantages
Worldwide in 2005, BASF procured some 500,000 differ-ent raw materials, technical goods, as well as services for plant construction and maintenance worth approximately €18.8 billion. We purchased logistics services to the value of about €2.0 billion to ensure these goods reached our sites and customers on time. We aim to further optimize our worldwide Procurement Verbund by further intensify-ing the coordination of our Group-wide activities. Global and regional procurement teams that network the local purchasing units enable us to pool local needs at different sites. As a result, BASF can have more impact on the mar-ket, obtain price advantages and better ensure supplies.
Raw materials purchasing
The most important materials used in production at our Verbund sites are petrochemical feedstocks such as naphtha and LPG (liquefi ed petroleum gas). They serve as feedstocks for the steam crackers we operate in Ludwigs-hafen, Germany; Antwerp, Belgium; Port Arthur, Texas; and, since 2005, Nanjing, China. We also purchase a large number of other raw materials as diverse as ammonia, precious metals and sugar. We coordinate purchasing of key raw materials centrally by means of global or regional product teams. We continue to use decentralized pur-chasing for raw materials for which demand is concentrat-ed at only one site. Purchasing and research units work closely with one another. Even during the product development phase, purchasing develops a range of procurement alternatives together with research and production, since this is where a large part of the future costs of products is determined.
Technical purchasing
Global and regional procurement teams coordinate purchases of technical goods and services such as machines, apparatus, laboratory equipment, erection of scaffolding or installation work. Close collaboration with our engineering and maintenance units allows us to com-bine our requirements quickly and effi ciently and to stan-dardize goods and services, thus achieving savings. In addition, we are tapping into the potential of new procure-ment markets.
Procurement of logistics services
We secure optimal logistics costs and strengthen our competitiveness by means of:
Global coordination of air and sea freight procurementRegional service-provider management for land freightGroup-wide coordination of packaging procurementGroup-wide management of negotiations with service providers for business travel
Supply chain management (SCM)
SCM is an important part of our BASF 2015 strategy. As part of this strategy, we have restructured our supply chain management activities to optimize logistics and planning processes. As a result, we not only achieve greater effi ciency in our own value-adding chains, but also include customers and suppliers and contribute to their success.
◾◾◾◾
Management’s Analysis > Purchasing, Marketing and Sales
Purchasing
E-commerce
We continuously improve the effi ciency of our purchasing processes using e-commerce. This has a positive impact on process times and process quality. For purchasing technical goods and services, we use the electronic mar-ketplace cc-hubwoo, in which BASF owns a stake. With more than 20 million articles, around 8,000 suppliers and more than 1 million completed transactions in 2005, cc-hubwoo is one of the world’s busiest marketplaces. In addition, more than 2,500 tenders for technical goods and services were processed electronically in 2005. We are also expanding our successful e-commerce activities on the sales side. We reap the benefi ts of e-commerce for BASF and our customers by using tailor-made business models.
In 2005, we increased our e-commerce sales by almost 50% from €6.5 billion to €9.6 billion. This corresponds to about 27% of total sales (excluding the oil and gas busi-ness). The e-commerce trend is also global: All regions at BASF reported higher e-commerce sales in 2005. We have integrated the marketplace Elemica in our purchasing processes for raw materials. This allows elec-tronic data exchange with suppliers. Elemica is used as a trading platform for chemical products by more than 230 customers and suppliers. Our uniform, integrated extranet solution WorldAccount is available for small and medium-sized suppliers.

62 | 63
Management’s Analysis > Purchasing, Marketing and Sales
Marketing and Sales
MARKETING AND SALES
We align BASF’s business models to the needs of our customers. Standard products have to be supplied in a defi ned quality, reliably and at a competitive price. With specialties, we offer our customers tailor-made solutions for their problems. Our focus is on mutual success. We want to achieve this not only by cooperating with custom-ers at an early phase of development, but also by working with them to constantly improve existing products, appli-cations and processes.
We organize our marketing and sales activities according to the various business models in our Segments: In our Chemicals segment, we supply standard prod-ucts to our customers in large volumes with low marketing expenses and usually without distributors. We are strengthening and extending our portfolio of inorganic and organic specialties. In order to develop new applica-tions and attract new customers, we are expanding our activities to market product innovations and tailor-made solutions. BASF’s Plastics segment offers standard products, specialties and products tailored to specifi c customers. Standard products are usually distributed in large quanti-ties and are associated with low marketing expenses. For specialty and customized products, we often work togeth-er with our customers at an early stage of development. We are also increasingly using the opportunities offered by e-commerce. In 2005, we posted e-commerce sales of more than €3 billion, and in some businesses e-commerce accounted for over 80% of sales.
The Performance Products segment produces a large number of products, formulations and systems. What matters to customers are a product’s technical applica-tions and its performance. This requires both tailor-made customer service by our sales staff at the customer’s site as well as specialized marketing. We maintain technical development facilities and pilot plants close to our cus-tomers in the most important regions. The Agricultural Products division offers a high-value product portfolio tailored to the needs of the major agri-cultural markets. We focus on the needs of the farmers who use our products and on the needs of the processing industry and the food trade. High-quality, innovative prod-ucts and services as well as a local presence are the key factors for a successful partnership with these groups. We supply our customers via a global network of trading part-ners. Our Fine Chemicals division supplies specialties through a global marketing and sales system. The local presence of regional business units ensures customer ori-entation and competency in our key markets: animal and human nutrition, cosmetics and pharmaceuticals. In the Oil & Gas segment, we sell natural gas primarily to wholesalers through our subsidiaries WINGAS and Win-tershall Erdgas Handelshaus and its affi liated companies. We also offer customers transport and storage services. We market the majority of our crude oil through our oil trading company in Switzerland.
In 2005, selling expenses, which include distribution, ship-ping, marketing and advertising costs, were €4,330 million compared with €4,309 million in 2004. Corporate advertis-ing costs totaled €40 million in 2005 compared with €19 million in 2004.

Management’s Analysis > Corporate Responsibility
Employees
Corporate Responsibility
€3.7 billion transferred to a Contractual Trust Arrangement to fi nance pension obligations
Global goals for Responsible Care®
€56.8 million for specifi c social responsibility projects
◾
◾
◾
EMPLOYEES
The BASF Group will be successful in the long run only if it has qualifi ed and motivated employees from around the world. Our management team has members from more than 30 different nations. To attract, retain and train the best talent for each function, we create a working environ-ment that supports our employees so they can perform at their best to make our company successful. The number of BASF Group employees declined by 1,010, or 1.2%, to 80,945 at the end of 2005. This change refl ects the impact of changes in the scope of consolida-tion as well as acquisitions and divestitures. The decline in the number of employees was primarily associated with measures to increase effi ciency at the Ludwigshafen site and in North America (NAFTA). In 2004, company management and employee repre-sentatives signed an agreement that provides clear per-
spectives for employment at the main production site in Ludwigshafen. Under the terms of the “Stability through Change” agreement, the number of employees of BASF Aktiengesellschaft will be approximately 32,000 (Decem-ber 31, 2005: 34,143). This target fi gure will remain in force until 2010, although the exact headcount may be adjusted depending on natural fl uctuation; enforced redundancies will be avoided. The precondition for this agreement is that the site not be impacted by economic factors or neg-ative circumstances that endanger BASF Aktiengesell-schaft’s competitiveness to such an extent that specifi c structural measures are necessary. The viability of the agreement will be reviewed with employee representatives each year. Last year, the BASF Group employed 2,330 trainees. In addition, 702 young people were trained by BASF Job-markt GmbH together with more than 450 partner compa-nies in the region as part of BASF’s Training Verbund.
Employees by region2005 2005 2004
% %
Europe 56,614 69.9 70.2
Thereof Germany 45,620 56.4 56.9
Thereof BASF Aktiengesellschaft 34,143 42.2 43.1
North America (NAFTA) 9,826 12.1 12.9
Asia Pacifi c 9,669 12.0 10.9
South America, Africa, Middle East 4,836 6.0 6.0
80,945 100.0 100.0

64 | 65
Trends in personnel costs
In 2005, personnel costs declined by €41 million to €5,574 million, and can be broken down as follows:
To maintain the highest level of expertise and qualifi cation among our employees, we invested €100.7 million in con-tinuing education and training last year in Germany alone. Of this amount, €33.1 million was spent on continuing education programs and €67.6 million on vocational train-ing. Global expenditure on education and training amount-ed to €122.8 million. As a result, we spent an average of more than €1,500 per employee on training measures. In addition, we invested approximately €11.6 million in the BASF Training Verbund in the Rhine-Neckar metropolitan region.
Sharing in the company’s success
BASF promotes employee investment in the company with the “plus” share purchase program. In 2005, approxi-mately 39% of employees of BASF Aktiengesellschaft and BASF Group companies in Germany took advantage of the opportunity to invest part of their annual bonus in BASF shares. Last year, employees bought a total of 565,000 BASF shares under this program. Of this amount, 458,720 shares were acquired by employees of BASF Aktiengesellschaft and 106,280 by employees of other BASF Group companies. If the employees keep their shares for a longer period, they receive additional free shares from the company (see also page 149). Since 1999, senior executives of the BASF Group have been able to participate in the BOP stock option program. The program ties a signifi cant proportion of their compen-sation to the long-term performance of our shares. In 2005, 82% of approximately 1,000 senior executives eligi-ble to participate worldwide took part in the BOP program and invested up to 30% of their variable compensation in BASF shares. For each share purchased in this way, BASF grants stock option rights whose value is paid out if the price of BASF stock meets ambitious targets (see also page 147).
Personnel costs
Million € Change in
%
Wages and salaries 4,553 (0.6)
Social security and expenses for pensions
and assistance 1,021 (1.4)
Thereof for pension benefi ts 242 6.1
5,574 (0.7)
External fi nancing of pensions
With effect from the end of 2005, BASF Aktiengesellschaft has paid approximately €3.7 billion into a newly estab-lished Contractual Trust Arrangement (CTA) under the name BASF Pensionstreuhand e. V. This money will be used solely to fi nance pension obligations to the compa-ny’s employees and pensioners. As a result, virtually all company benefi ts that exceed those of BASF Pensions-kasse VVaG will be fi nanced externally. This measure will lessen the impact on BASF’s future operational cash fl ow from maturing pension payments. In addition, this will improve the transparency of our fi nancial reporting and allow better comparison with our interna-tional competitors. There will be no effect on the benefi t levels for employ-ees and pensioners of BASF; the pensions will also con-tinue to be paid by BASF. The CTA facilitates a long-term investment strategy that is specially adapted to the development of pension obligations. This strengthens the basis on which pension obligations are funded, despite the additional strain imposed by the growing number of pensioners and by the increased life expectancy of the recipients.
Many of our employees own BASF shares. They can buy them on the intranet or, as shown here, at special terminals.
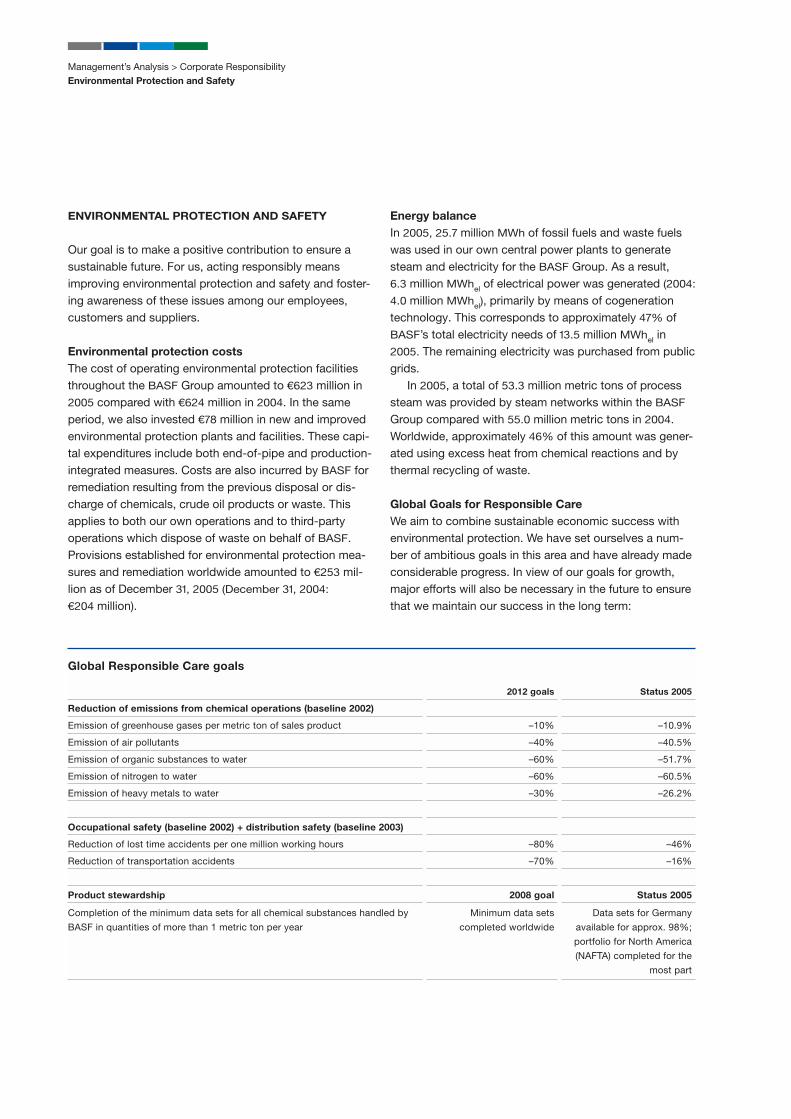
Management’s Analysis > Corporate Responsibility
Environmental Protection and Safety
ENVIRONMENTAL PROTECTION AND SAFETY
Our goal is to make a positive contribution to ensure a sustainable future. For us, acting responsibly means improving environmental protection and safety and foster-ing awareness of these issues among our employees, customers and suppliers.
Environmental protection costs
The cost of operating environmental protection facilities throughout the BASF Group amounted to €623 million in 2005 compared with €624 million in 2004. In the same period, we also invested €78 million in new and improved environmental protection plants and facilities. These capi-tal expenditures include both end-of-pipe and production-integrated measures. Costs are also incurred by BASF for remediation resulting from the previous disposal or dis-charge of chemicals, crude oil products or waste. This applies to both our own operations and to third-party operations which dispose of waste on behalf of BASF. Provisions established for environmental protection mea-sures and remediation worldwide amounted to €253 mil-lion as of December 31, 2005 (December 31, 2004: €204 million).
Energy balance
In 2005, 25.7 million MWh of fossil fuels and waste fuels was used in our own central power plants to generate steam and electricity for the BASF Group. As a result, 6.3 million MWhel of electrical power was generated (2004:
4.0 million MWhel), primarily by means of cogeneration technology. This corresponds to approximately 47% of BASF’s total electricity needs of 13.5 million MWhel in
2005. The remaining electricity was purchased from public grids. In 2005, a total of 53.3 million metric tons of process steam was provided by steam networks within the BASF Group compared with 55.0 million metric tons in 2004. Worldwide, approximately 46% of this amount was gener-ated using excess heat from chemical reactions and by thermal recycling of waste.
Global Goals for Responsible Care
We aim to combine sustainable economic success with environmental protection. We have set ourselves a num-ber of ambitious goals in this area and have already made considerable progress. In view of our goals for growth, major efforts will also be necessary in the future to ensure that we maintain our success in the long term:
Global Responsible Care goals
2012 goals Status 2005
Reduction of emissions from chemical operations (baseline 2002)
Emission of greenhouse gases per metric ton of sales product –10% –10.9%
Emission of air pollutants –40% –40.5%
Emission of organic substances to water –60% –51.7%
Emission of nitrogen to water –60% –60.5%
Emission of heavy metals to water –30% –26.2%
Occupational safety (baseline 2002) + distribution safety (baseline 2003)
Reduction of lost time accidents per one million working hours –80% –46%
Reduction of transportation accidents –70% –16%
Product stewardship 2008 goal Status 2005
Completion of the minimum data sets for all chemical substances handled by
BASF in quantities of more than 1 metric ton per year
Minimum data sets
completed worldwide
Data sets for Germany
available for approx. 98%;
portfolio for North America
(NAFTA) completed for the
most part

66 | 67
Emissions from our chemical operations
We are committed to the aims of the 1997 Kyoto Protocol to reduce greenhouse gas emissions. In 2005, BASF’s chemical business worldwide emitted 24.8 million metric tons of greenhouse gases compared with 27.6 million metric tons in 2004. Compared with the baseline year 2002, we achieved a reduction of 10.9% in greenhouse gas emissions per metric ton of sales product even though our production rose by 13% during the same period. Emissions to air from BASF’s chemical operations worldwide totaled 50,900 metric tons of air pollutants, compared with 54,000 metric tons in 2004. This repre-sents a reduction of 40.5% compared with 2002. This welcome development was primarily due to optimizing treatment of fl ue gas at plants at European sites. We have also come closer to achieving our targets for emissions to water: In 2005, BASF emitted to water a total of 44,200 metric tons of organic substances – calculated as chemical oxygen demand (COD). The fi gure for 2004 was 86,700 metric tons. Compared to the baseline year, we have reduced emissions by 51.7% overall. Emissions of nitrogen to water totaled 8,800 metric tons, compared with 18,600 metric tons in 2004. This is a reduction of 60.5% compared with 2002. Wastewater contained 45 metric tons of heavy metals, or a reduction of 26.2% com-pared with the baseline year 2002.
Occupational safety and distribution safety
We have committed ourselves to promoting and maintain-ing safe and healthy working conditions. At the same time, safety is a prerequisite for smooth production. In 2005, the BASF Group’s lost time accident rate worldwide was 1.8 per one million working hours com-pared with 1.9 in 2004. This corresponds to a reduction of 46% in the rate of accidents compared with 2002. At our Ludwigshafen site, we reduced the lost time accident rate by 14% compared with the previous year to 1.8 accidents per million working hours.
We have established uniform global standards for the transportation and storage of chemical products. These standards also apply to our partner companies. Our safety checks and training ensure that our partners will fulfi ll the high demands made on them. Thanks to these measures, we have further improved distribution safety: In 2005, there were 0.47 transportation accidents per 10,000 ship-ments worldwide compared with 0.5 in the previous year. This corresponds to a reduction of 16% compared with our baseline year 2003.
Worldwide expansion of substance data sets
In Germany, the base data set is available for around 98% of the substances we handle in quantities of more than 1 metric ton per year. In 2005, we compiled data for sub-stances that are new to our portfolio. By the end of 2005, we also completed the basic data for the majority of the substances we handle in North America (NAFTA).
Environmental policy
The European Union is currently preparing new draft legis-lation for chemicals (REACH) that aims to regulate their registration, evaluation and authorization. It is expected that the new draft law will come into force in the relevant E.U. member states in 2007. It is not yet possible to quan-tify the associated costs. With regard to E.U. emissions trading, the BASF Group was allocated allowances (EUA) for approximately 3 mil-lion metric tons of carbon dioxide (CO2) per year for its European sites for 2005. More stringent conditions are expected in the second trading period (2008 to 2012) on the basis of the E.U. Commission’s recommendations in December 2005. Thereafter, the Commission expects higher reduction targets from the member states. In addi-tion, the auctioning of some allowances and the inclusion of further plants in the trading system is expected.

Management’s Analysis > Corporate Responsibility
Social Responsibility
SOCIAL RESPONSIBILITY
As a global company, BASF takes its worldwide social responsibilities seriously. We contribute to numerous proj-ects in the form of donations and sponsorship as well as through the individual efforts of our employees. In 2005, the BASF Group spent a total of €56.8 million on specifi c cultural and social projects and to provide human itarian aid. This corresponded to an increase of 50.3% compared with 2004.
“We Help the Region Win”
In the future, our economic success will increasingly depend on the social acceptance of our activities. This applies especially in the communities in which our sites are located. We are therefore strongly committed to proj-ects in the Rhein-Neckar metropolitan region of Germany under the title “We Help the Region Win.” We support projects in the areas of youth/education, future/innovation/science, as well as culture and sports. In 2005, we increased our funding for these projects to €22 million. The design of this campaign and its underlying philosophy has been confi rmed by a very positive response.
Donations
Donations by the BASF Group are governed by a policy for donations and sponsorship. The main focus is on regional needs. In the aftermath of the tsunami that destroyed many coastal areas of southeastern Asia in December 2004, BASF employees donated €1.4 million. This amount was doubled by BASF to €2.8 million. Together with €1 million in immediate aid provided by BASF’s Board of Executive Directors just a few days after catastrophe, this brought the total donation by employees and the company to €3.8 million. We also acted quickly following other natural disasters: In the wake of the devastating hurricanes in the United States, we provided $1 million in emergency relief aid. This money was used, among other things, to rebuild commu-nities affected by the disaster. Following the earthquake in Pakistan, BASF also gave assistance, for example, by providing shelter for victims and mobile hospitals.
Education
Education is a central issue for BASF. What we invest in education and knowledge today pays off in the long run in terms of regional competitiveness. That is why we are intensifying our commitment to the communities in which our sites are located and are taking measures worldwide to facilitate or to promote access to education and knowl-edge. Basic needs are frequently at the heart of this. Since August 2005, we have supported the Lapdesk Project in South Africa, which aims to improve learning conditions for school children. Last year, BASF companies also donated money to equip local schools in Thailand, Malay-sia and India. We are incorporating our regional projects in the Knowledge Factory initiative, of which BASF was one of the founding members in 2005. The Knowledge Factory aims to make Germany more sustainable as a business location. Member companies enter into educational part-nerships and take part in projects with kindergartens and schools in their respective regions. Further information on the Knowledge Factory is available in German at www.wissensfabrik-deutschland.de.
You can fi nd more details on sustainable management and corporate social responsibility on the Internet at corporate.basf.com/sustainability or in our Corporate Report 2005 available at corporate.basf.com/corporate-report.
BASF Group donations, sponsoring andown projects in 2005Million €
1 Science 2.5 4.4%
2 Charities 4.6 8.1%
3 Culture 6.7 11.8%
4 Sports 2.7 4.7%
5 Schools and
training,
employment-
promotion 37.0 65.2%
6 Other 3.3 5.8%
56.8 100.0%
12
3
4
5
6

68 | 69
Risk Management System and
Risks of Future Development
RISK MANAGEMENT SYSTEM
Goals and principles of risk management Risk management has the goal of identifying risks as early as possible, limiting business losses by means of suitable measures, and avoiding risks that pose a threat to the company’s existence. Our risk management system is based on the following principles and requirements:
High safety standards for plant operation to protect man and the environmentCodes of conduct to ensure compliance with legal requirementsA Leadership Compass that defi nes high standards of management integrityReview committees to verify important business decisionsOrganizational measures to prevent abuse of authority
Organization, responsibilities and tools
Regular risk analyses at the corporate level are conducted by BASF’s Chief Compliance Offi cer and by the units:
Corporate Controlling;Environment, Safety & Energy;Finance;Global Procurement & Logistics; Human Resources; Legal, Taxes & Insurance; andStrategic Planning & Controlling.
Specifi c risks pertaining to operating divisions and units are continually registered and monitored centrally. Defi ned and regular communications tools ensure that risks are reported quickly to the Board of Executive Directors, pro-viding an up-to-date overview of the current risks to the BASF Group. In addition, we use key data and indicators for con-stant monitoring of certain risk areas. The reports are drawn up and submitted when defi ned risk thresholds have been reached. This ensures that risks are recognized early on and that the appropriate information is then immediately reported to the responsible decision-makers.
◾
◾
◾
◾
◾
◾◾◾◾◾◾◾
BASF uses various tools for the early recognition and identifi cation of risks. These include risk identifi cation checklists, analyses of various scenarios and value driver trees. We quantify risks to the extent they can be assessed; we also determine the impact on earnings and the likelihood of occurrence. The Board of Executive Directors receives monthly reports on current and forecast business trends from cen-tralized controlling. These reports contain analyses of operating, fi nancial and economic risks. The reports are based on computer-generated risk reports by the respon-sible decentralized and centralized risk specialists, who are appointed for the various divisions, regions and sites. Strategic opportunities and risks are assessed as part of the continuously monitored product division and regional strategies and balanced against one another. Annually as well as on an interim basis, our indepen-dent auditors and Corporate Audit department examine the functioning and effectiveness of our risk management system, as well as its development and integration into business processes. In 2005, we continued to develop the risk management process throughout the BASF Group in accordance with internationally accepted standards. Guidance is taken from the Enterprise Risk Management (ERM) – Integrated Framework of the COSO (Committee of Sponsoring Organizations of the Treadway Commission). How individual risk categories are dealt with is descri-bed in the Risks of Future Development section on page 70.
Internal monitoring
BASF’s Corporate Audit department – which acts on behalf of the Board of Executive Directors – operates throughout BASF Aktiengesellschaft and the BASF Group. The department checks:
adherence to directives, guidelines, approval limits and fair trade regulations; asset security and the attainment of an appropriate rate of return on invested capital; the organization and its processes in terms of effi cien-cy, effectiveness and proper functioning; the functionality and reliability of the risk management system; and the reliability of reporting.
◾
◾
◾
◾
◾
Management’s Analysis
Risk Management System and Risks of Future Development

Management’s Analysis
Risk Management System and Risks of Future Development
Internal monitoring also takes place in special committees that meet regularly. They analyze our businesses, expect-ed outcomes and related risks, developing trends and structural developments. Basic elements of internal moni-toring include general principles of risk avoidance such as the separation of duties and the four-eyes principle for important transactions. In addition, we have introduced guidelines for rate hedging, investments and the use of derivative fi nancial instruments. In 2005, we uniformly documented the internal control process for fi nancial reporting throughout the BASF Group in a new IT system in accordance with Section 404 of the Sarbanes-Oxley Act (SOX). The effectiveness of the inter-nal control process was confi rmed on this basis by both self-assessment by management and by the auditors (see also page 73).
Risk controlling The Strategic Planning & Controlling division and the Finance division handle centralized risk controlling. They regularly inform the Board of Executive Directors of signifi -cant risks. The Strategic Planning & Controlling division ensures that communication about risk management and its continued development takes place in all operating units, corporate divisions, competence centers and regional divisions worldwide. In addition, the division coordinates identifi cation of all signifi cant risks for BASF throughout the company and systematically evaluates them according to uniform standards. Twelve operating divisions bear overall responsibility for business operations within the BASF Group. It there-fore follows that operational risk management is focused in these units. We have also established decentralized risk controlling units in the competence centers and regional divisions that work closely with the centralized units.
RISKS OF FUTURE DEVELOPMENT
Financial risks
We monitor and control fi nancial risks in the Treasury department of the Corporate Center or through appropri-ately authorized Group companies. Detailed guidelines and procedures exist for dealing with fi nancial risks. Among other things, they provide for separate trading and processing functions. Currency, interest rate and price risks: These risks are also hedged using derivative instruments. Detailed expla-nations on the use of derivatives and information about the book values and fair values of these instruments are provided in Note 29 to the Consolidated Financial State-ments on page 150 onward. Liquidity risks: We recognize any risks from cash fl ow fl uctuations in good time using our liquidity planning sys-tem. We have ready access to suffi cient liquid funds in view of our good credit ratings, the ongoing commercial paper program and committed credit lines from banks. BASF’s current short-term and long-term ratings as well as our bond ratings are shown on page 34. Credit risk and default risk: We limit country-specifi c risks through internal country ratings, which are continuo-usly adapted to changing economic, political and social conditions. We use export credit insurance as the main tool to limit specifi c country-related risks. We reduce credit risks for our investments by engaging in transactions only with business partners and banks with very good credit ratings and by adhering to fi xed limits. Monetary transactions are also conducted through such banks. We reduce the risk of default on receivables by continuously monitoring the creditworthiness and pay-ment behavior of customers and by setting appropriate credit limits. Risks are also limited through the use of credit insurance and bank guarantees.

70 | 71
Pension obligations: We predominantly fi nance company pension schemes externally through separate pension assets. In addition to the pension plans of our Group com-panies in North America (NAFTA), this applies in particular to BASF Pensionskasse VVaG in Germany. At the end of 2005, we additionally transferred assets to a newly estab-lished Contractual Trust Arrangement (CTA) (see page 65 for further details). Because a portion of these assets has been invested in stocks and fi xed-income securities, stock market and bond market losses could result in the accrued assets being insuffi cient to fi nance the pensions. In order to limit this risk, we are increasingly offering employees defi ned contribution schemes. In Germany, the company retire-ment program has been modifi ed to take account of changing conditions in the capital markets and rising life expectancy. We are limiting fi nancial risks through a revised BASF Pensionskasse tariff for new employees.
Supply risks
Prices of raw materials, energy, precursors and intermedi-ates that depend on the price of oil present a potential risk for BASF. We reduce this risk through our global purchas-ing activities, long-term supply contracts and optimized procedures for the purchase of additional quantities of raw materials on spot markets and through commodity derivatives. Purchase agreements for the most strategical-ly important raw materials are negotiated and concluded centrally. In the fi eld of research and development, we are work-ing on new technologies that appropriately address risks relating to the availability and price of basic raw materials. If raw material costs rise over a longer period, it is not always possible to pass on the higher costs fully in the form of higher prices for our products in the short term. However, in the current and expected future economic sit-uation, we believe that we can successfully implement the necessary price adjustments, albeit after a certain delay.
Market risks
Cyclical fl uctuations in demand in key customer seg-ments, such as the automotive, construction, electrical/electronics and textile industries, as well as intense com-petition in sales markets, present operating risks in our Chemicals, Performance Products and Plastics segments. In addition, these segments are affected by the trend toward offshoring in key customer industries and by over-capacities for some products. We reduce these risks by continually expanding cyclically resilient businesses, such
as agricultural products, active ingredients and active ingredient precursors for pharmaceuticals and nutrition, and natural gas. In cyclical businesses, we seek to maintain cost lead-ership and enter into close cooperations with customers that will allow us to tap into new applications and markets quickly. Furthermore, we are expanding business activities in high-growth regions. In response to product substitutions and the declining use of certain products in the Performance Products and Plastics segments, we develop and market products with improved or entirely new properties. We also offer our customers specifi c system solutions that can be employ-ed over a longer period. In the Northern Hemisphere, sales volumes of crop protection products are affected by the seasonal nature of the market – with sales being concentrated in the fi rst half of the year – and by the weather. Demand for crop protec-tion products is further infl uenced by the agricultural poli-cies of governments and multinational organizations. The typical periods allowed for payment in this industry can lead to losses from receivables during regional economic crises. The increased marketing and sale of products in combination with genetically modifi ed seeds could have an adverse effect on the development of our crop protec-tion business. We are responding to these risks with inno-vative products and solutions that create added value for our customers.
Regulatory risks The European Union’s new chemicals policy will alter the registration, evaluation and approval process for chemical substances. This poses the risk that BASF and its Europe-an customers will be placed at a disadvantage compared with non-European competitors as a result of cost-inten-sive testing and registration procedures. The new legisla-tion is expected to take effect in 2007. It is not yet possi-ble to quantify the associated costs.
Economic risks
We do not expect any serious risks for the chemical industry or for the overall economy in 2006. Neither do we expect serious changes to market conditions or the com-petitive environment. The continued volatility of oil prices and the exchange rate of the U.S. dollar constitute possi-ble risks for global economic development. We believe it is unlikely that there will be a sharp increase in interest rates that would have a negative impact on the economy. Neither do we expect a dramatic downturn in growth in

Management’s Analysis
Risk Management System and Risks of Future Development
China. Detailed explanations of expected economic devel-opments can be found under “Economic Environment,” on page 57 onward.
Other signifi cant risks
Risks arising from acquisition and investment decisions:The implementation of decisions related to acquisitions and investments is associated with complex risks. These are mainly caused by the high level of capital involved and the long-term capital commitment required. The prepara-tion, implementation and follow-up for such decisions are based on specifi ed responsibilities and approval processes. Exploration risk: In the Oil & Gas segment, future growth in the exploration and production business sector is largely based on the success of exploration activities. The search for new reserves of crude oil and natural gas depends on geological requirements with regard to the presence, quantity and quality of hydrocarbons. We reduce risks by means of a balanced exploration portfolio. IT risks: We use the latest hardware and software to reduce potential risks from the loss or manipulation of data. Throughout the entire BASF Group we have integrat-ed, standardized IT infrastructures, backup systems, repli-cated databases, virus and access protection, encoding systems and a high degree of internal networking. Research and development: Because of the high degree of complexity and uncertainty involved in chemical and biological research, there is a risk that projects might be discontinued or that developed products will not receive approval for marketing. We reduce this risk through our global Know-how Verbund and our effi cient innovation process (see also “Research and Develop-ment” on page 53). Patent risks: The Patents, Trademarks & Licenses department of BASF Aktiengesellschaft, together with the appropriate units of the U.S.-based BASF Corporation and BASF Coatings, Münster, monitors all the intellectual property rights of BASF. At the same time, through our extensive demarcation research we aim to avoid patent and licensing disputes as far as possible. Suffi cient provisions have been made for the very small number of existing and pending patent disputes. Prospective candidates for technical and manage-ment positions: Our employees’ performance is essential to the growth and development of the BASF Group. We are increasingly competing with other companies for high-ly qualifi ed technical and management personnel. We ensure the potential of our management candidates by broadening the international nature of our management
team. We also promote entrepreneurship by offering employees attractive assignments, a variety of internation-al development perspectives, a broad spectrum of advanced training and continuing education opportunities, progressive benefi ts and performance-based compensa-tion. Part of this compensation is a broad-based program that allows employees to share in the company’s success. We have also put in place a sophisticated stock option plan for approximately 1,000 BASF Group executives. Fur-ther details can be found in Note 28 to the Consolidated Financial Statements on page 147 onward. Corporate Security: Assessing security risks on a global basis and determining their potential impact on BASF has become an extremely diffi cult undertaking. Through its Group-wide network, BASF’s Corporate Secu-rity department works in close cooperation with local authorities. In addition, with the help of our constantly updated security measures, we ensure the monitored pro-tection of the company and its employees. We use awareness campaigns and training to increase the sensitivity of our employees in their dealings with spe-cialist and confi dential information as well as their judi-cious use of the Internet and e-mail. Legal risks: We limit risks from potential infringements of rights or the law by using compliance programs, legal training and centralized contract management. Details about our current litigation can be found in Note 27 to the Consolidated Financial Statements on page 146 onward.
ASSESSMENT OF THE OVERALL RISK SITUATION
In our opinion, there are no individual or aggregate risks that pose a threat to the continued existence of the BASF Group at the present time or in the foreseeable future.

Corporate Governance
Corporate Governance at BASF
Corporate Governance at BASF
Corporate governance refers to the entire system of man-aging and overseeing a company as well as all internal and external regulatory and monitoring mechanisms. Effective and transparent corporate governance guaran-tees that BASF is managed and monitored in a responsi-ble and value-driven manner. This fosters the confi dence of our domestic and international investors, the fi nancial markets, our business partners, employees and the public in the management and supervision of the company. Good corporate governance is accorded very high importance at BASF. We therefore support the German Corporate Governance Code, which we regard as an important tool in the capital market-driven development of corporate governance. We follow the recommendations of the German Governance Code in its revised version of June 2005 with a few exceptions. You can fi nd the 2005 joint Declaration of Conformity by the Board of Executive Directors and the Supervisory Board at the end of this section on page 83. The Declaration of Conformity and the German Corporate Governance Code are available on our website at corporate.basf.com/governance_e. Because BASF’s shares are listed on the New York Stock Exchange (NYSE), BASF is also subject to U.S. capital market legislation, including the Sarbanes-Oxley Act (SOX) of 2002, as well as the regulations of the U.S.
Securities and Exchange Commission (SEC) and the NYSE. To ensure that these extensive new regulations are observed, the Supervisory Board has, for example:
established an Audit Committee, introduced a new approval procedure specifi cally for procuring non-audit services from auditors, established a procedure for receiving and processing accounting-related complaints, and implemented a Code of Conduct for fi nancial issues that supplements the company’s general Code of Conduct.
◾◾
◾
◾
Furthermore, Section 404 of SOX was implemented and the internal control processes for fi nancial reporting were uniformly documented throughout the BASF Group in a new, separate IT system. On this basis, the effectiveness of this control system was assessed at all management levels in 2005. We came to the conclusion that our control system is effective. The auditors have confi rmed the results of our self-assessment in their report. Our system complies in all regards with the requirements of Section 404 of SOX and the COSO Report. As a result, we have implemented Section 404 of SOX successfully and one year earlier than required by the SEC. Implementation of Section 404 of SOX was associated with signifi cantly higher expenses for documentation and review require-ments.
Corporate management and control by the Board of
Executive Directors and Supervisory Board
In contrast to the situation in many other countries, two separate bodies work together at German stock corpora-tions: a Board of Executive Directors and a Supervisory Board. Appointments to the two bodies are strictly sepa-rate. A member of the Supervisory Board cannot simulta-neously be a member of the Board of Executive Directors. BASF’s Board of Executive Directors is responsible for the management of the company and represents BASF Aktiengesellschaft in all business undertakings with third parties. Its activities and decisions are geared to the com-pany’s interests, and it is dedicated to the goal of increas-ing the company’s value in the long term. The decisions made by the Board of Executive Directors are always based on a simple majority. In the case of a tied vote, the casting vote is given by the Chairman of the Board. The Board of Executive Directors reports to the Super-visory Board regularly, comprehensively and in a timely manner on all material matters concerning the company with regard to strategic planning, business development, risk issues and risk management. Furthermore, it agrees corporate strategy with the Supervisory Board. Where required by the Articles of Association of BASF Aktienge-sellschaft, the Board of Executive Directors must have the approval of the Supervisory Board for certain transactions before they are concluded. Such cases include the pur-chase of corporate shareholdings in excess of €100 million and the commencement of new or the termination of existing business activities.
72 | 73

Corporate Governance
Corporate Governance at BASF
The Audit Committee is also responsible for business rela-tions with the company’s auditors: It prepares the Supervi-sory Board’s proposal to the Annual Meeting regarding the selection of an auditor, monitors the auditor’s indepen-dence, defi nes the key aspects of the audit together with the auditor, agrees the auditing fees, and establishes the conditions for the provision of non-audit services. The Audit Committee comprises Max Dietrich Kley, Dr. Karl-heinz Messmer, Hans Dieter Pötsch and Michael Vassilia-dis. The chairman of the Audit Committee is Max Dietrich Kley. As former Chief Financial Offi cer of BASF and as Chief Financial Offi cer of Volkswagen AG, respectively, Max Dietrich Kley and Hans Dieter Pötsch have particular knowledge and experience in the application of account-ing principles and internal audit procedures, and have been appointed by the Supervisory Board as Audit Com-mittee Financial Experts. The members of the Board of Executive Directors and the Supervisory Board are listed together with remunera-tion details on pages 76 to 79.
Shareholders’ rights
At Annual Meetings, shareholders have rights of participa-tion and supervision. Each BASF share represents one vote. Shareholders may exercise their voting rights at Annual Meetings either personally or through a represen-tative of their choice, or through a company-appointed proxy authorized by shareholders to vote according to their instructions. There are neither voting caps to limit the number of votes a shareholder may cast nor special vot-ing rights. BASF has fully implemented the principle of “one share one vote.” All shareholders are entitled to par-ticipate in Annual Meetings, to speak to and request infor-mation from the Board relating to items on the agenda to the extent necessary to make an informed judgment of the company’s affairs.
The Supervisory Board of BASF Aktiengesellschaft appoints members of the Board of Executive Directors and monitors and advises the Board of Executive Direc-tors on management issues. The Supervisory Board of BASF Aktiengesellschaft comprises 20 members and in accordance with the German Codetermination Act con-sists in equal parts of shareholder representatives – elect-ed by shareholders at the Annual Meeting – and employee representatives. Supervisory Board resolutions require a simple majority. In the case of a tied vote, a second vote is held and the Chairman of the Supervisory Board may cast a deciding vote. Alongside the Mediation Committee, the Supervisory Board has established a Nomination and Compensation Committee (Personalausschuss) and an Audit Committee. The Nomination and Compensation Committee is charged with setting Board members’ remuneration and related contractual issues. It comprises Supervisory Board Chairman Dr. Jürgen F. Strube (chairman) as well as Supervisory Board members Robert Oswald, Dr. Tessen von Heydebreck and Wolfgang Daniel. The sole task of the Mediation Committee is to make a proposal to appoint a member to the Board of Executive Directors in the event that the necessary two-thirds majority is not attained in the fi rst round of voting in the Supervisory Board. In the second round of voting, a simple majority is suffi cient to appoint a member to the Board of Executives. The members of the Mediation Committee are Super-visory Board Chairman Dr. Jürgen F. Strube (chairman), Supervisory Board Deputy Chairman Robert Oswald (deputy chairman), Dr. Tessen von Heydebreck and Michael Vassiliadis. The Audit Committee makes preparations for the negotiations and resolutions of the Supervisory Board for the approval of the Financial Statements of BASF Aktien-gesellschaft as well as the Consolidated Financial State-ments of BASF Group, reviews the Annual Report on Form 20-F that has to be submitted to the U.S. Securities and Exchange Commission and deals with risk monitoring and internal accounting controls.

74 | 75
Values and Principles of the BASF Group/
Code of Conduct
In order to guarantee a high standard of corporate gover-nance, we have published the Values and Principles of the BASF Group, and the Code of Conduct/Compliance Pro-gram. These lay down our business principles and guide-lines for the conduct of all activities within the BASF Group. The Code of Conduct describes in detail the con-duct we expect from BASF employees – based on the principle of integrity. Key areas include observing all rele-vant legislation, in particular antitrust and competition leg-islation, sanctions and export controls – including those on chemical weapons, labor laws and legislation relating to plant safety. Other issues are bans on insider dealing and providing or receiving bribes from business partners or state offi cials, and the need to treat BASF’s assets responsibly. The Corporate Audit department together with BASF’s Chief Compliance Offi cer monitor compliance on a regular basis. The Values and Principles of the BASF Group and the Code of Conduct are also available on the Internet at corporate.basf.com/values.
Share ownership by members of the Board of
Executive Directors and the Supervisory Board
No member of the Board of Executive Directors or the Supervisory Board owns shares in BASF Aktiengesell-schaft and related options or other derivatives that account for 1% or more of the share capital. Furthermore, the entire holdings by members of the Board of Executive Directors and the Supervisory Board account for less than 1% of the shares issued by the company. Since July 1, 2002, in accordance with Section 15a of the German Securities Trading Act, all members of the Board of Executive Directors and the Supervisory Board, as well as certain of their relatives, are required to disclose the purchase or sale of BASF shares and other related rights to the German Financial Supervisory Authority (Bundesanstalt für Finanzdienstleistungsaufsicht) and to the company if transactions within the calendar year exceed the threshold of €5,000.
In 2005, there were a total of 11 reportable transactions in which members of the Board of Executive Directors and Supervisory Board purchased or sold BASF shares. The transactions involved between 17 and 2,000 shares with a per-share price of between €49.94 and €60.30. All trans-actions reported in 2005 are published on the Internet at corporate.basf.com/governance_e.
Directors’ and offi cers’ liability insurance
(D&O insurance)
BASF has taken out liability insurance that covers the activities of members of the Board of Executive Directors and the Supervisory Board (D&O insurance). The policy provides for a suitable level of deductibles.

Corporate Governance
Management and Supervisory Boards
Management and Supervisory Boards
Board of Executive Directors
As of December 31, 2005, there were eight members on the Board of Executive Directors of BASF Aktiengesell-schaft. On December 16, 2005, the Supervisory Board appointed Dr. Martin Brudermüller as an additional mem-ber of the Board of Executive Directors with effect from January 1, 2006.
DR. JÜRGEN HAMBRECHT
Chairman of the Board of Executive Directors Responsibilities: Legal, Taxes & Insurance; Strategic Planning & Controlling; Executive Management & Development; Commu nications BASF Group; Investor Relations First appointed: 1997 (chairman since 2003)Term expires: 2007
Supervisory board memberships (excluding internal
memberships):
Bilfi nger Berger AG (supervisory board member)
EGGERT VOSCHERAU
Vice Chairman of the Board of Executive DirectorsResponsibilities: Industrial Relations Director; Human Resour- ces; Environment, Safety & Energy; Ludwigshafen Verbund Site; Antwerp Verbund Site; Occupational Medicine & Health Protection; EuropeFirst appointed: 1996
Term expires: 2008
Supervisory board memberships (excluding internal
memberships):
HDI Haftpfl ichtverband der Deutschen Industrie VVaG
(supervisory board member) Talanx AG (supervisory board member)Internal memberships as defi ned in Section 100 (2) of the
German Stock Corporation Act:
BASF Schwarzheide GmbH (supervisory board chairman)Comparable German and non-German controlling bodies:
BASF Antwerpen N.V. (administrative council chairman)
DR. KURT BOCK
Responsibilities: Finance; Global Procurement & Logistics; Information Services; Corporate Controlling; Corporate Audit; South AmericaFirst appointed: 2003
Term expires: 2007
Internal memberships as defi ned in Section 100 (2) of the
German Stock Corporation Act:
Wintershall AG (supervisory board member)Comparable German and non-German controlling bodies:
The Germany Fund Inc. (member of the board of directors)
DR. MARTIN BRUDERMÜLLER
Responsibilities: Asia (from April 1, 2006)First appointed: 2006
Term expires: 2008
Comparable German and non-German controlling bodies:
BASF Antwerpen N.V. (administrative council member)
DR. JOHN FELDMANN
Responsibilities: Styrenics; Performance Polymers; Polyurethanes; Oil & Gas; Polymer ResearchFirst appointed: 2000
Term expires: 2009
Internal memberships as defi ned in Section 100 (2) of the
German Stock Corporation Act:
Wintershall AG (supervisory board chairman)
DR. ANDREAS KREIMEYER
Responsibilities: Performance Chemicals; Functional Poly- mers; Asia (until March 31, 2006); Coatings (from April 1, 2006)First appointed: 2003
Term expires: 2007
Internal memberships as defi ned in Section 100 (2) of the
German Stock Corporation Act:
BASF Coatings AG (supervisory board member)
KLAUS PETER LÖBBE
Responsibilities: Coatings (until March 31, 2006); North America (NAFTA)First appointed: 2002
Term expires: 2006
Internal memberships as defi ned in Section 100 (2) of the
German Stock Corporation Act:
BASF Coatings AG (supervisory board chairman)
DR. STEFAN MARCINOWSKI
Responsibilities: Research Executive Director; Inorganics; Petrochemicals; Intermediates; Chemicals Research and Engineering; Corporate Engineering; University Relations & Research Planning; BASF Future Business GmbH
First appointed: 1997
Term expires: 2007
Internal memberships as defi ned in Section 100 (2) of the
German Stock Corporation Act:
Wintershall AG (supervisory board member)
PETER OAKLEY
Responsibilities: Agricultural Products; Fine Chemicals; Specialty Chemicals Research; BASF Plant Science GmbH
First appointed: 1998
Term expires: 2008

76 | 77
Supervisory Board
The Supervisory Board of BASF Aktiengesellschaft com-prises 20 members. Ten members are elected by share-holders at the Annual Meeting, and the remaining 10 are elected by employees. With the exception of Hans Dieter Pötsch, the shareholder representatives were elected at the Annual Meeting on May 6, 2003. Hans Dieter Pötsch was appointed by the district court of Ludwigshafen on March 2, 2004 to replace Helmut Werner, who died on February 6, 2004. With the exception of Ralf Sikorski and Michael Vassiliadis, the employee representatives were elected on February 25, 2003 in accordance with the Ger-man Codetermination Act. Effective August 7, 2003, Ralf Sikorski was appointed by the district court of Ludwigs-hafen to replace Gerhard Zibell, who resigned from the Supervisory Board with effect from July 31, 2003. Effective August 1, 2004, Michael Vassiliadis, who had been elected to the Supervisory Board by employees, replaced Dr. Jür-gen Walter, who retired effective July 31, 2004. The current term of all members of the Supervisory Board expires at the end of BASF Aktiengesellschaft’s Annual Meeting 2008.
Members of the Supervisory Board
(as of December 31, 2005)
DR. JÜRGEN F. STRUBE, Mannheim, GermanyChairman of the Supervisory Board of BASF Aktiengesellschaft Former Chairman of the Board of Executive Directors of BASF AktiengesellschaftSupervisory board memberships (excluding internal
memberships):
Allianz Lebensversicherungs-AG (supervisory board member) Bayerische Motoren Werke AG (supervisory board member) Bertelsmann AG (supervisory board deputy chairman) Commerzbank AG (supervisory board member) Fuchs Petrolub AG (supervisory board chairman) Hapag-Lloyd AG (supervisory board member) Linde AG (supervisory board member)
ROBERT OSWALD, Altrip, GermanyDeputy Chairman of the Supervisory Board of BASF Aktien-gesellschaft Chairman of the works council of the Ludwigshafen site of BASF Aktiengesellschaft and the chairman of the joint works council of the BASF Group
RALF BASTIAN, Neuhofen, GermanyMember of the works council of the Ludwigshafen site of BASF Aktiengesellschaft
WOLFGANG DANIEL, Limburgerhof, GermanyDeputy chairman of the works council of the Ludwigshafen site of BASF Aktiengesellschaft
PROF. DR. FRANÇOIS N. DIEDERICH, Zurich, SwitzerlandProfessor at Zurich Technical University
MICHAEL DIEKMANN, Munich, GermanyChairman of the Board of Management of Allianz AGSupervisory board memberships (excluding internal
memberships):
Linde AG (supervisory board deputy chairman) Lufthansa AG (supervisory board member)Internal memberships as defi ned in Section 100 (2) of the
German Stock Corporation Act:
Allianz Deutschland AG (supervisory board chairman) Allianz Global Investors AG (supervisory board chairman) Allianz Lebensversicherungs-AG (supervisory board chairman) (until December 31, 2005) Allianz Versicherungs-AG (supervisory board chairman) (until December 31, 2005) Dresdner Bank AG (supervisory board chairman)Comparable German and non-German controlling bodies:
Assurances Générales de France (administratrive council member) Riunione Adriatica di Sicurtà S.p.A. (administrative council member)
DR. TESSEN VON HEYDEBRECK, Frankfurt (Main), GermanyMember of the Board of Managing Directors of Deutsche Bank AGSupervisory board memberships (excluding internal
memberships):
BVV Versicherungsverein des Bankgewerbes a. G.
(supervisory board member) Dürr AG (supervisory board member)Internal memberships as defi ned in Section 100 (2) of the
German Stock Corporation Act:
Deutsche Bank Privat- und Geschäftskunden AG
(supervisory board member) DWS Investment GmbH (supervisory board member)Comparable German and non-German controlling bodies:
Deutsche Bank OOO (supervisory board chairman) Deutsche Bank Luxembourg S.A.
(administrative council chairman) Deutsche Bank Polska S.A. (supervisory board chairman) Deutsche Bank Rt. (supervisory board chairman) Deutsche Bank Trust Corp. (supervisory board member) DB Trust Company America (supervisory board member)
ARTHUR L. KELLY, Chicago, IllinoisChief executive of KEL Enterprises L.P.Supervisory board memberships (excluding internal
memberships):
Bayerische Motoren Werke AG (supervisory board member)Comparable German and non-German controlling bodies:
Data Card Corporation (member of the board of directors) Deere & Company (member of the board of directors) Northern Trust Corporation (member of the board of directors) Snap-on Incorporated (member of the board of directors)
ROLF KLEFFMANN, Wehrbleck, Germany

Corporate Governance
Management and Supervisory Boards
Chairman of the works council of Wintershall AG’s Barnstorf oil plant
MAX DIETRICH KLEY, Heidelberg, GermanyLawyerFormer Vice Chairman of the Board of Executive Directors of BASF AktiengesellschaftSupervisory board memberships (excluding internal
memberships):
HeidelbergCement AG (supervisory board member) Infi neon Technologies AG (supervisory board chairman) Schott AG (supervisory board member) SGL Carbon AG (supervisory board chairman)Comparable German and non-German controlling bodies:
UniCredito Italiano S.p.A (member of the administrative council) (as of January 11, 2006)
PROFESSOR DR. RENATE KÖCHER, Allensbach, GermanyManaging Director of the Institut für Demoskopie Allensbach,Gesellschaft zum Studium der öffentlichen Meinung mbHSupervisory board memberships (excluding internal
memberships):
Allianz AG (supervisory board member) MAN AG (supervisory board member) Infi neon Technologies AG (supervisory board member)
EVA KRAUT, Ludwigshafen, GermanyChairwoman of the works council of BASF IT Services GmbH,Ludwigshafen
ULRICH KÜPPERS, Ludwigshafen, GermanyRegional manager of the Rhineland-Palatinate/Saarland branch of the Mining, Chemical and Energy Industries Union (IG BCE)
Supervisory board memberships (excluding internal
memberships):
Klinikum der Stadt Ludwigshafen gGmbH
(supervisory board deputy chairman) STEAG Saar Energie AG (supervisory board deputy chairman) Technische Werke Ludwigshafen AG (TWL)
(supervisory board deputy chairman) Verkehrsbetriebe Ludwigshafen GmbH (supervisory board member) Villeroy & Boch AG (supervisory board member)
KONRAD MANTEUFFEL, Bensheim, GermanyMember of the works council of the Ludwigshafen site of BASF AktiengesellschaftSupervisory board memberships (excluding internal
memberships):
BASF Pensionskasse VVaG
(supervisory board deputy chairman) LUWOGE Wohnungsunternehmen der BASF GmbH
(supervisory board member)
DR. KARLHEINZ MESSMER, Weisenheim am Berg, GermanyPlant manager at the Ludwigshafen site of BASF Aktien-gesellschaftChairman of the Committee of Executive Representatives of BASF Aktiengesellschaft
HANS DIETER PÖTSCH, Wolfsburg, GermanyMember of the Board of Management of Volkswagen AGSupervisory board memberships (excluding internal
memberships):
Allianz Versicherungs AG (supervisory board member) Bizerba GmbH & Co. KG (supervisory board member)
DR. HERMANN SCHOLL, Stuttgart, GermanyChairman of the Supervisory Council of Robert Bosch GmbH
and Managing Director of Robert Bosch Industrietreuhand KG
Supervisory board memberships (excluding internal
memberships):
Robert Bosch GmbH (supervisory board chairman)Comparable German and non-German controlling bodies:
Robert Bosch Internationale Beteiligungen AG
(member of the administrative council) Robert Bosch Corporation (member of the board of directors) Sanofi -Aventis S.A. (member of the administrative council)
RALF SIKORSKI, Ludwigshafen, GermanyManager of the Ludwigshafen branch of the Mining, Chemical and Energy Industries Union (IG BCE)
ROBERT STUDER, Zurich, SwitzerlandFormer Chairman of the Supervisory Board of the Union Bankof SwitzerlandComparable German and non-German controlling bodies:
Espirito Santo Financial Group S.A. (member of the administrative council) Renault S.A. (member of the administrative council) Schindler Holding AG (member of the administrative council)
MICHAEL VASSILIADIS, Hemmingen, GermanyMember of the Central Board of Executive Directors of the Mining, Chemical and Energy Industries Union (IG BCE)
Supervisory board memberships (excluding internal
memberships):
Henkel KGaA (supervisory board member) K+S AG (supervisory board deputy chairman) K+S Kali GmbH (supervisory board deputy chairman) STEAG AG (supervisory board member)

78 | 79
Compensation of directors and offi cers
For the year ended December 31, 2005, compensation paid to the members of the Board of Executive Directors totaled €15.3 million; the members of the Supervisory Board received €3.4 million.
The compensation of the Board of Executive Directors consists of a fi xed and an annual variable component as well as stock options as a long-term element. The effec-tive annual variable payments is determined by the return on assets. Each Board member may invest 10% to 30% of his variable bonus in the BASF stock option program (BOP). This personal investment is the prerequisite for the granting of option rights according to conditions that apply to all participants in the BOP program (see also page 147). Thus, by far the larger part of the Board’s overall compensation is directly linked to the company’s performance. In 2005, the members of the Board of Executive Direc-tors were granted 209,792 stock options under the BASF stock option program. In 2005, the issue of option rights resulted in personnel costs totaling €6.3 million. Of this amount, €1.4 million was related to option rights issued in 2005 and €4.9 million to option rights issued in 1999 through 2004. In 2005, the exercising of option rights granted under the BASF stock option program between 1999 and 2003 resulted in cash payments totaling €1.4 mil-lion to members of the Board of Executive Directors and €2.9 million to previous members or their surviving depen-dants. The cash payment does not infl uence personnel costs associated with the issuing of option rights.
Million € 2005 2004
Board of Executive Directors’ compensation 15.3 14.0
Thereof fi xed payments 5.0 4.8
variable payments 10.3 9.2
Exercise of option rights granted under the BASF stock option program 1.4 0.6
Supervisory Board’s compensation 3.4 2.7
Thereof fi xed payments 0.5 0.5
variable payments 2.9 2.2
Total compensation of former members of the Board of Executive Directors and their surviving dependents 5.8 6.0
Exercise of option rights by former members of the Board of Executive Directors and their surviving dependents 2.9 1.3
Pension provisions for former members of the Board of Executive Directors and their surviving dependents 77.7* 69.9
Loans to members of the Board of Executive Directors and the Supervisory Board – –
Contingent liability for the benefi t of members of the Board of Executive Directors and the Supervisory Board – –
* The change compared with 2004 was primarily due to the lower interest rate used to assess pension obligations.
The compensation of the Supervisory Board is defi ned in the Articles of Association of BASF Aktiengesellschaft. Pursuant thereto, each member of the Supervisory Board is reimbursed for the past year for out-of-pocket expenses and for value-added tax to be paid with regard to the Board membership. In addition, he or she receives a fi xed annual payment of €25,000 and a variable performance-related bonus amounting to €3,500 for each €0.05 by which the dividend paid to shareholders in a given year exceeds €0.30. For the year ended December 31, 2005, this will be €119,00 on the basis of the proposed dividend of €2.00 per share that will be submitted to the Annual Meeting on May 4, 2006. The chairman of the Supervisory Board receives a payment of twice and the deputy chairman a payment of 1.5 times this amount. In addition, the company grants members of the Supervisory Board a fee of €500 for attending a meeting of the Supervisory Board or one of its committees to which they belong. Each member of the Audit Committee of the Supervisory Board receives an additional payment of €25,000. The chairman of this com-mittee receives a payment of twice and the deputy chair-man a payment of 1.5 times this additional amount.

Corporate Governance
Report of the Supervisory Board
Report of the Supervisory Board
Dear Shareholders,
2005 was the most successful year in BASF’s history to date: Both the net income of the BASF Group as well as earnings per share were at record highs. Primarily, this is not simply the result of an improvement in the economic environment, but is the visible success of a long-term strategy and the efforts of the Board of Executive Direc-tors and the employees of the BASF Group: BASF is on the right path with its strategy BASF 2015. At the same time, BASF’s success in 2005 is a challenge and an incen-tive to continue to implement the company’s strategic guidelines rigorously: Earn a premium on cost of capital, help customers to be more successful, form the best team in industry, and ensure sustainable development. The Supervisory Board will do its utmost to help the Board of Executive Directors and BASF’s employees to reach these goals. The Supervisory Board carefully and regularly moni-tored company management during the year and provided advice on the company’s strategic development and important individual measures. To this end, the Super-visory Board requested detailed information from the Board of Executive Directors at meetings, as well as in written and verbal reports. Topics included business poli-cies, the business situation and business trends, profi t-ability, the company’s planning with regard to fi nances, capital expenditures and human resources at BASF and its major subsidiaries, as well as deviations from business forecasts. The Chairman of the Supervisory Board also regularly requested information from the Chairman of the Board of Executive Directors with regard to current business developments and important events outside of Supervisory Board meetings. The Supervisory Board was involved at an early stage in decisions of major importance.
Meetings
The Supervisory Board met fi ve times in 2005. At these meetings, the Supervisory Board discussed reports from the Board of Executive Directors. The Supervisory Board also discussed the company’s prospects as a whole and its individual businesses with the Board of Executive Directors. The members of the Supervisory Board elected by shareholders and by employees prepared for the meet-ings in separate preliminary discussions.
In addition to monitoring management by the Board of Executive Directors, one of the chief duties of the Supervi-sory Board is to offer advice and discuss BASF’s strate-gy. An important milestone was the offer to acquire the U.S. specialty chemical manufacturer Engelhard Corpora-tion, which was announced on January 3, 2006 and offi -cially tendered on January 9, 2006. Engelhard is a leading catalyst manufacturer. If successful, the acquisition – the largest ever in the history of BASF – would enable BASF to open up a promising and high growth business area. Currently, BASF has only a slight market presence in this fi eld. The deal would signifi cantly expand our existing expertise. A similar situation applies to the planned acqui-sition of Degussa’s construction chemicals business: Here too, a new business area for BASF would complement the company’s existing activities in the area of precursors for construction chemicals. Both acquisitions would also sup-port BASF’s strategic goal of making its business less susceptible to cyclicality. Independent of possible individual transactions, the Supervisory Board also dealt with the development of BASF’s strategy in Asia Pacifi c, with special emphasis on China and India; the strategy of the Oil & Gas segment; and the company’s positioning in the fi eld of biotechno-logy, and was informed by the Board of Executive Direc-tors of the strategic options as well as the opportunities and risks in these areas. During a visit to the sites in Nan-jing and Caojing, China, as well as to Kuala Lumpur and Kuantan, Malaysia, the Supervisory Board gained its own impression of the progress being made in realizing the strategy for the Asia Pacifi c region. The enormous prog-ress that BASF is making in this important region was welcomed unanimously. Where specifi c transactions and measures proposed by the Board of Executive Directors required decisions by the Supervisory Board as required by law or the Articles of Association, votes were taken at Supervisory Board meet-ings. The Supervisory Board approved the sale of the 50% share in Basell N.V., the acquisition of the fi ne chemi-cals company Orgamol S.A., the tendering of a cash offer to acquire all shares in the U.S. specialty chemical com-pany Engelhard Corporation, and the acquisition of the construction chemicals business of Degussa AG. At our meeting on December 16, 2005, we also approved the Board of Executive Directors’ plans for 2006 and empow-ered the Board of Executive Directors to procure funding.

80 | 81
Corporate governance and compliance statement
In 2005, the Supervisory Board again addressed in detail changes to the fi nancial and corporate legal environment in which the company operates, as well as the issue of corporate governance at BASF. In its meeting on December 16, 2005, the Supervisory Board approved the new joint compliance statement by the Supervisory Board and the Board of Executive Direc-tors in accordance with Section 161 of the German Stock Corporation Act. BASF follows the recommendations of the German Corporate Governance Code, in its version of June 2, 2005, with a few exceptions: For example, we do not publish individual remuneration details for the mem-bers of the Board of Executive Directors and Supervisory Board, and remuneration of the Board of Executive Direc-tors is dealt with in the Supervisory Board’s Nomination and Compensation Committee rather than in a plenary session of the Supervisory Board. From next year, the remuneration of the Board of Executive Directors will be disclosed individually in accordance with the provisions of the German Law on the Disclosure of the Compensation of Members of the Board of Management. The complete text of the compliance statement is provided on page 83 of the Financial Report and is also permanently available to shareholders on BASF’s website.
Committees
The Supervisory Board has established three committees with equal representation from shareholders and em ployee representatives: the Nomination and Compen-sation Committee (Personalauschuss) created in accor-dance with Section 89 (4) of the German Stock Corpora-tion Act; the Audit Committee; and the Mediation Committee established in accordance with Section 27 (3)
of the German Codetermination Act. The members of the Nomination and Compensation Committee are as follows: Supervisory Board Chairman Dr. Jürgen F. Strube (chairman), Supervisory Board Dep-uty Chairman Robert Oswald (deputy chairman), Dr. Tes-sen von Heydebreck and Michael Vassiliadis. The Nomi-nation and Compensation Committee met four times in 2005. In its meetings, with the Chairman of Board of Executive Directors, it discussed, in particular, plans for the future appointment of members of the Board of Exec-utive Directors (long-term succession planning), as well as the remuneration of the Board of Executive Directors. The Nomination and Compensation Committee proposed to the Supervisory Board the appointment of Dr. Martin Bru-dermüller as an additional member of the Board of Execu-
tive Directors and the extension of Eggert Voscherau’s term by a further two years. The Supervisory Board approved these proposals in its meeting on December 16,
2005. In 2005, the Audit Committee comprised Supervisory Board members Max Dietrich Kley, Dr. Karlheinz Messmer, Hans Dieter Pötsch and Michael Vassiliadis. The chairman of the Audit Committee is Max Dietrich Kley, who like Hans Dieter Pötsch, has been appointed Audit Committee Financial Expert. The Audit Committee met three times in 2005. Its activities primarily included reviewing the Con-solidated Financial Statements of BASF Aktiengesellschaft as well as BASF Group; reviewing the Annual Report on Form 20-F prepared in accordance with U.S. accounting standards; advising the Board of Executive Directors on accounting issues; preparing the Supervisory Board’s pro-posal to the Annual Meeting regarding the selection of an auditor; discussing and defi ning particular features of the audit; regulating business relations with the company’s auditors, including the adoption of a resolution regarding the commissioning and provision of non-audit services by the auditors; agreeing the auditing fees; and monitoring the auditor’s independence. In 2005, the Audit Commit-tee discussions also focused on the transition of the Con-solidated Financial Statements to International Financial Reporting Standards (IFRS) and the creation of an internal control system for fi nancial reporting whose strict formal-ization, extensive documentation requirements and con-trol processes satisfy the requirements of Section 404 of the U.S. Sarbanes-Oxley Act (SOX). Furthermore, the Audit Committee dealt in detail with the preparation of a proposal by the Supervisory Board to the Annual Meeting for the election of an auditor. In the course of a structured selection process, the Audit Committee evaluated the ten-ders and services of various audit companies. In accor-dance with the recommendation of the Audit Committee, the Supervisory Board will propose to the Annual Meeting to elect KPMG as the new auditor for the Financial State-ments of BASF Group and BASF Aktiengesellschaft as well as the Annual Report on Form 20-F of BASF Aktien-gesellschaft. It was not necessary to convene the Mediation Com-mittee in 2005. Its members are Supervisory Board Chair-man Dr. Jürgen F. Strube (chairman), Supervisory Board Deputy Chairman Robert Oswald (deputy chairman), Dr. Tessen von Heydebreck and Michael Vassiliadis.

Corporate Governance
Report of the Supervisory Board
Financial Statements of the BASF Group and
BASF Aktiengesellschaft
On the basis of the preliminary review by the Audit Com-mittee, on which the Chairman of the Audit Committee reported to the Supervisory Board, we have examined the Financial Statements of BASF Aktiengesellschaft for 2005, the proposal by the Board of Executive Directors for the appropriation of profi t, the BASF Group Consolidated Financial Statements and Management’s Analysis for BASF Aktiengesellschaft and the BASF Group. Deloitte & Touche GmbH, the auditors elected by the Annual Meet-ing for fi scal 2005, have examined the Financial State-ments of BASF Aktiengesellschaft and the BASF Group Consolidated Financial Statements, including the book-keeping and Management’s Analysis, and have approved them free of qualifi cation. The auditors also noted that the Board of Executive Directors, in accordance with Section 91 (2) of the German Stock Corporation Act, had instituted a suitable information and monitoring system which met the needs of the company and appeared suitable, both in de-sign and the way in which it had been applied, to pro-vide early warning of developments that pose a threat to the continued existence of the company. The documents to be examined and the auditors’ reports were sent in good time to every member of the Supervisory Board. The auditors attended the accounts review meeting of the Audit Committee on February 20,
2006 as well as the accounts meeting of the Supervisory Board on February 28, 2006 and reported on the main fi ndings of their audit. The auditors also provided detailed explanations of their reports on the day before the accounts review meeting.
We have reviewed the auditors’ reports. The results of the preliminary review by the Audit Committee and the results of our own examination fully concur with those of the audit. The Supervisory Board sees no grounds for objections. At the Supervisory Board’s accounts meeting on Feb-ruary 28, 2006, we approved the Financial Statements of BASF Aktiengesellschaft drawn up by the Board of Execu-tive Directors and the Consolidated Financial Statements of the BASF Group, making the Financial Statements fi nal. We concur with the proposal of the Board of Executive Directors regarding the appropriation of profi t and the payment of a dividend of €2.00 per share.
Composition of the Supervisory Board and
Board of Executive Directors
There were no changes to the composition of the Super-visory Board in 2005. In its meeting on December 16, 2005, the Supervisory Board appointed Dr. Martin Brudermüller as a member of the Board of Executive Directors with effect from January 1, 2006. This fi rst appointment has a term of three years. Effective April 1, 2006, Dr. Martin Brudermüller will be responsible for Asia and will be headquartered in Hong Kong. The appointment takes account of the importance of the fast growing Asian region for BASF. In the same meeting, the Supervisory Board extended the term of the Vice Chairman of the Board of Executive Directors and Industrial Relations Director, Eggert Voscherau, which would have expired at the end of the Annual Meeting on May 4, 2006, for a further two years until the end of the Annual Meeting in 2008.
Ludwigshafen, February 28, 2006
The Supervisory Board
Dr. Jürgen F. Strube
Chairman of the Supervisory Board

82 | 83
Compliance Statement in Accordance
with the German Corporate Governance Code
Compliance Statement 2005 of the Board of Executive
Directors and the Supervisory Board of BASF Aktien-
gesellschaft
1. Statement of Principles pursuant to § 161 AktG [Stock Corporation Act]We declare that the recommendations by the Govern-ment Commission on the German Corporate Gover-nance Code published by the Federal Ministry of Justice in the offi cial section of the electronic Federal Gazette have been complied with in the year 2005 and will be complied with in the year 2006 subject to the measures outlined below.
2. Deviations a) Compensation of Chair and Membership
in Supervisory Board Committees As set forth in Section 5.4.7 of the Code, compensa-
tion shall take into account the chair position and the membership in Supervisory Board committees. In respect to the Audit Committee we comply with this recommendation in addition to granting an attendance fee for the committee meetings.
The membership in the other committees is solely reimbursed by granting an attendance fee for the com-mittee meetings. A supplementary compensation for the chair is not provided for, since this function has to date been exercised by the Chairman of the Supervi-sory Board.
It will be proposed to the 2006 Annual General Meeting to newly regulate Supervisory Board compensation, taking, in principle, the recommendations of Section 5.4.7 of the Code into account. Except is the Mediation Committee pursuant to § 27 Section 3 of the MitbestG [Codetermination Act], which, at our company, did not have to convene to date. Its members are not entitled to a specifi c compensation in addition to any possible attendance fee for the meetings.
b) Dealing with the structure of the Executive Board com-
pensation system by the full Supervisory Board; assessment of the appropriateness of the compensa-tion of the members of the Executive Board by also applying performance-related criteria; individualized publication of the compensation of the members of the Executive Board and the Supervisory Board
The respective chairmen of the Supervisory Board
Committees report regularly to the Supervisory Board on the work of the Committees. This includes the work of the Nomination and Compensation Committee (Personalaus-schuss). Beyond that we do not comply with the above-mentioned recommendations, especially not with the recommendation to report on the individualized compen-sation of the Executive Board and the Supervisory Board in 2005 and 2006.
c) Publication to the shareholders of candidates propo-sed for the Supervisory Board Chair
In accordance with this recommendation newly includ-ed in 2005, candidates for the Supervisory Board Chair shall be published to the shareholders, although those candidates, as a rule, are members of a Supervisory Board still to be elected and the Chairman of the Supervisory Board has to be elected from among them. An early nomination may, therefore, lead, in fact, to a prior determination of the Supervisory Board’s future members. In the event of a by-election, separate in time from a Supervisory Board election, there is, a priori, no opportunity to publish the candidates to the shareholders. We, therefore, consider the recommen-dation to be less practical. Since for the time being an election of the Chairman of the Supervisory Board is not pending, we intend to observe the further develop-ment, before we decide on a comply or an explain.
d) Compliance Statement Pursuant to Section 3.10 of the Code, the Board of
Executive Directors and the Supervisory Board shall report each year in the Company’s Annual Report on the Company’s corporate governance. This includes the explanation of possible deviations from the recom-mendations of the Code. By § 161 AktG this reporting obligation is regulated with, in part, different content. The Board of Executive Directors and the Supervisory Board resolved to exclusively report as required by law.
Ludwigshafen, December 16, 2005
The Supervisory Board The Boardof BASF Aktiengesellschaft of Executive Directors of BASF Aktiengesellschaft
Corporate Governance
Compliance Statement in Accordance with the German Corporate Governance Code


> What really makes projects successful?


>> Partnership
Successfully realizing a project like our new Verbund site in Nanjing,
China within only four years between groundbreaking and the start
of operations is only possible with strong partners. You Houping,
Sinopec, and Dr. Bernd Blumenberg, BASF, together head the joint
venture BASF-YPC Co. Ltd. that operates the new site. The largest
investment in our 140-year history is based on the Verbund concept
that we apply at our main site in Ludwigshafen, Germany. The
Nanjing site has an area of 220 hectares and produces 1.7 million
metric tons of high-value chemicals and plastics. As a result, the site
plays an important part in our economic success in the fast growing
Chinese market.

Consolidated Financial Statements
Statement by the Board of Executive Directors
The Board of Executive Directors of the BASF Group is responsible for preparing the Consolidated Financial Statements and Management’s Analysis of BASF Group. The Consolidated Financial Statements were prepared for the fi rst time according to the International Financial Reporting Standards (IFRS) in 2005. U.S. genenerally accepted accounting principles (U.S. GAAP) were imple-mented as far as possible within the scope offered by the accounting and valuation options under IFRS. A reconcili-ation of net income and stockholders’ equity to U.S. GAAP is provided to account for the remaining differ-ences. The conversion from the regulations of the German Commercial Code (HGB) to IFRS is shown in detail in a reconciliation in the notes to the fi nancial statements. We have established effective internal control systems over fi nancial reporting, which also comply with the regulations of Section 404 of the Sarbanes Oxley Act, to ensure the adherence of the Consolidated Financial Statements and Management’s Analysis with applicable accounting rules, and the truth and fairness of our company reporting.
The adherence to uniform, Group-wide accounting and reporting standards and the reliability and effectiveness of our control systems are continuously audited by our inter-nal audit department throughout the Group. Our risk man-agement system complies with the requirements of the German Act on Verifi cation and Transparency in the Cor-porate Sector (Section 91 (2), Stock Corporation Act). The system identifi es substantial risks in a timely manner enabling the Board of Executive Directors to take appro-priate action as required. Deloitte & Touche GmbH Wirtschaftsprüfungsgesell-schaft has examined BASF’s Consolidated Financial Statements and Management’s Analysis and approved them free of qualifi cation. The Consolidated Financial Statements and Management’s Analysis and the auditors’ report were examined at length by the Audit Committee of the Supervisory Board in the presence of the auditors and were discussed in detail at a Supervisory Board meeting at which the auditors were also present. For the results of the Supervisory Board’s examination, please refer to the Report of the Supervisory Board.
Consolidated Financial Statements > Statement by the Board of Executive Directors
Ludwigshafen, February 20, 2006
Dr. Jürgen Hambrecht Dr. Kurt Bock
Chairman of the Board Chief Financial Offi cerof Executive Directors of BASF Aktiengesellschaftof BASF Aktiengesellschaft

86 | 87
Consolidated Financial Statements > Report of Independent Auditors
Independent Auditors’ Report
We have audited the accompanying consolidated balance sheets of BASF Aktiengesellschaft and subsidiaries as of December 31, 2005 and 2004, and the related consoli-dated statements of income, recognized income and expense, stockholders’ equity, and cash fl ows for the years then ended. These fi nancial statements are the responsibility of the Company’s management. Our respon-sibility is to express an opinion on these fi nancial state-ments based on our audits. We conducted our audits in accordance with auditing standards generally accepted in Germany and the stan-dards of the Public Company Accounting Oversight Board (United States). Those standards require that we plan and perform the audit to obtain reasonable assurance about whether the fi nancial statements are free of material mis-statement. An audit also includes examining, on a test basis, evidence supporting the amounts and disclosures in the fi nancial statements. An audit also includes assess-ing the accounting principles used and signifi cant esti-mates made by management, as well as evaluating the overall fi nancial statement presentation. We believe that our audits provide a reasonable basis for our opinion. In our opinion, such consolidated fi nancial statements present fairly, in all material respects, the fi nancial position of BASF Aktiengesellschaft and its subsidiaries as of December 31, 2005 and 2004, and the results of their operations and their cash fl ows for the years then ended in conformity with International Financial Reporting Standards.
Application of accounting principles generally accepted in the United States would have affected stockholders’ equity as of December 31, 2005 and 2004 and net income for the years then ended to the extent summarized by the Company in Note 5 to the Consolidated Financial Statements. We have also audited, in accordance with the stan-dards of the Public Company Accounting Oversight Board (United States), the effectiveness of the Company’s inter-nal control over fi nancial reporting as of December 31, 2005, based on the criteria established in Internal Con-trol—Integrated Framework issued by the Committee of Sponsoring Organizations of the Treadway Commission and our report dated February 21, 2006 expressed an unqualifi ed opinion on management’s assessment of the effectiveness of the Company’s internal control over fi nan-cial reporting and an unqualifi ed opinion on the effective-ness of the Company’s internal control over fi nancial reporting.
Frankfurt am Main, February 21, 2006
Deloitte & Touche GmbH
Wirtschaftsprüfungsgesellschaft
Dr. Künnemann Dr. Beine
Wirtschaftsprüfer Wirtschaftsprüfer

BASF Group Consolidated Financial Statements and Notes
Consolidated Statements of Income
Million € Explanations in Note 2005 2004
Sales (6) 42,744.9 37,536.6
Cost of sales 29,566.8 25,721.2
Gross profi t on sales 13,178.1 11,815.4
Selling expenses 4,329.9 4,309.2
General and administrative expenses 780.1 707.4
Research and development expenses 1,063.7 986.5
Other operating income (7) 600.2 1,046.1
Other operating expenses (8) 1,775.1 1,665.9
Income from operations 5,829.5 5,192.5
Income from companies accounted for using the equity method 5.6 (7.2)
Other income from participations 342.4 (588.5)
Interest result (170.0) (206.1)
Other fi nancial result (81.9) (43.9)
Financial result (9) 96.1 (845.7)
Income before taxes and minority interests 5,925.6 4,346.8
Income taxes (10) 2,758.1 2,213.5
Income before minority interests 3,167.5 2,133.3
Minority interests (11) 160.8 129.0
Net income 3,006.7 2,004.3
Earnings per share (€) (4) 5.73 3.65
Dilution effect – –
Diluted earnings per share (€) (4) 5.73 3.65

88 | 89
Consolidated Balance Sheets
ASSETS
Million € Explanations in Note 2005 2004
Long-term assets
Intangible assets (14) 3,719.6 3,606.6
Property, plant and equipment (15) 13,986.9 13,062.7
Investments accounted for using the equity method (16) 244.3 1,100.5
Other fi nancial assets (16) 813.0 938.1
Deferred taxes (10) 1,254.7 1,336.6
Other long-term assets (18) 524.0 473.5
20,542.5 20,518.0
Short-term assets
Inventories (17) 5,430.2 4,645.4
Accounts receivable, trade 7,020.2 5,860.8
Other receivables and other assets (18) 1,586.4 2,132.8
Liquid funds (19) 1,090.8 2,290.5
15,127.6 14,929.5
Total assets 35,670.1 35,447.5
STOCKHOLDERS’ EQUITY AND LIABILITIES
Million € Explanations in Note 2005 2004
Stockholders’ equity
Subscribed capital (20) 1,316.8 1,383.5
Capital surplus (20) 3,100.2 3,027.6
Retained earnings (21) 11,928.0 11,923.1
Other comprehensive income (21) 696.7 (60.5)
Minority interests (22) 481.8 328.5
17,523.5 16,602.2
Long-term liabilities
Provisions for pensions and similar obligations (23) 1,546.6 4,124.1
Other provisions (24) 2,791.2 2,375.7
Deferred taxes (10) 699.3 948.0
Financial indebtedness (25) 3,681.7 1,844.6
Other liabilities (25) 1,042.8 1,078.8
9,761.6 10,371.2
Short-term liabilities
Accounts payable, trade 2,777.0 2,371.5
Provisions (24) 2,762.5 2,364.1
Tax liabilities (10) 887.2 644.3
Financial indebtedness (25) 259.3 1,452.8
Other liabilities (25) 1,699.0 1,641.4
8,385.0 8,474.1
Total stockholders’ equity and liabilities 35,670.1 35,447.5

BASF Group Consolidated Financial Statements and Notes
Consolidated Statements of Recognized Income
and Expense
Income and expense items
Million € 2005 2004
Income before minority interests 3,167.5 2,133.3
Fair value changes in available-for-sale securities 66.7 96.9
Cash-fl ow hedges (21.2) (42.4)
Change in foreign currency translation adjustments 714.5 (230.6)
Actuarial gains/losses from pensions and similar obligations (1,075.9) (364.5)
Deferred taxes 413.2 147.1
Minority interests 29.4 (19.4)
Total income and expense recognized in equity 126.7 (412.9)
Total income and expense for the period 3,294.2 1,720.4
Thereof BASF 3,104.0 1,610.8
Thereof minority interests 190.2 109.6
Development of income
and expense recognized
directly in equity
Retained
earnings
Other comprehensive income Total income and
expense recog-
nized directly in
equity
Million €
Actuarial gains/
losses
Foreign
currency
translation
adjustment
Fair value
changes in
available-for-
sale
securities
Cash-fl ow
hedges
Total of other
comprehen-
sive income
As of January 1, 2005 (233.9) (226.2) 192.6 (26.9) (60.5) (294.4)
Additions (1,075.9) 714.5 78.5 (25.6) 767.4 (308.5)
Releases (11.8) 4.4 (7.4) (7.4)
Deferred taxes 416.0 (13.6) (0.8) 11.6 (2.8) 413.2
As of December 31, 2005 (893.8) 474.7 258.5 (36.5) 696.7 (197.1)
As of January 1, 2004 under IFRS – – 99.1 – 99.1 99.1
Additions (364.5) (230.6) 101.2 (43.1) (172.5) (537.0)
Releases – – (4.3) 0.7 (3.6) (3.6)
Deferred taxes 130.6 4.4 (3.4) 15.5 16.5 147.1
As of December 31, 2004 (233.9) (226.2) 192.6 (26.9) (60.5) (294.4)

90 | 91
Million €
Number of
subscribed
shares out-
standing
Subscribed
capital
Capital
surplus
Retained
earnings
Other Com-
prehensive
income1
Minority
interests
Total
stockholders’
equity
As of January 1, 2005 540,440,410 1,383.5 3,027.6 11,923.1 (60.5) 328.5 16,602.2
Share buy-back and cancellation
of own shares including own
shares intended to be cancelled (26,062,229) (66.7) 67.0 (1,435.1) (1,434.8)
Exercise of exchange rights of
former Wintershall shareholders 819
Capital withdrawal/contribution 9.5 9.5
Dividends paid (903.9) (78.2)2 (982.1)
Net income 3,006.7 160.8 3,167.5
Income and expense recognized
directly in equity (659.9) 757.2 29.4 126.7
Changes in scope of consoli-
dation and other changes 5.63 (2.9) 31.8 34.5
December 31, 2005 514,379,000 1,316.8 3,100.2 11,928.0 696.7 481.8 17,523.5
December 31, 2003 under HGB 556,643,410 1,425.0 2,982.4 12,054.8 (971.9) 388.1 15,878.4
Changes in accounting
policies in the fi nancial state-
ments prepared according to
German GAAP in 2004 (202.5) (99.4) (66.4) (368.3)
Adjustments due to fi rst-time
adoption of IFRS4 2.6 (219.8) 1,170.4 (3.0) 950.2
January 1, 2004 under IFRS 556,643,410 1,425.0 2,985.0 11,632.5 99.1 318.7 16,460.3
Share buy-back and cancellation
of own shares including own
shares intended to be cancelled (16,203,000) (41.5) 39.4 (723.6) (725.7)
Capital withdrawal/contribution 4.1 (59.6) (55.5)
Dividends paid (774.1) (77.7)2 (851.8)
Net income 2,004.3 129.0 2,133.3
Income and expense recognized
directly in equity (233.9) (159.6) (19.4) (412.9)
Changes in scope of consolidati-
on and other changes 3.23 13.8 37.5 54.5
December 31, 2004 540,440,410 1,383.5 3,027.6 11,923.1 (60.5) 328.5 16,602.2
1 Details are provided in the “Consolidated Statements of Recognized Income and Expense” on page 90.2 Profi t and loss transfers3 Granting of BASF shares under the employee share program “plus” 4 The effects of conversion to IFRS are shown in detail in Note 4.
Consolidated Statements of Stockholders’ Equity
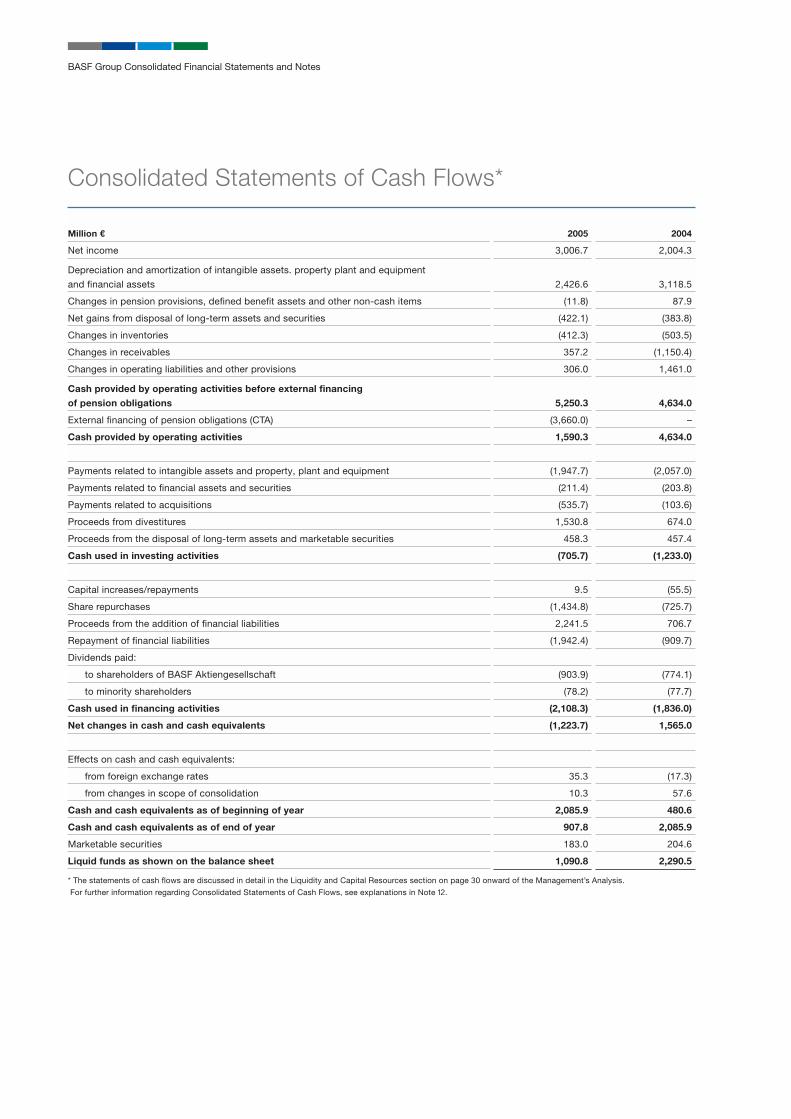
BASF Group Consolidated Financial Statements and Notes
Consolidated Statements of Cash Flows*
Million € 2005 2004
Net income 3,006.7 2,004.3
Depreciation and amortization of intangible assets. property plant and equipment
and fi nancial assets 2,426.6 3,118.5
Changes in pension provisions, defi ned benefi t assets and other non-cash items (11.8) 87.9
Net gains from disposal of long-term assets and securities (422.1) (383.8)
Changes in inventories (412.3) (503.5)
Changes in receivables 357.2 (1,150.4)
Changes in operating liabilities and other provisions 306.0 1,461.0
Cash provided by operating activities before external fi nancing
of pension obligations 5,250.3 4,634.0
External fi nancing of pension obligations (CTA) (3,660.0) –
Cash provided by operating activities 1,590.3 4,634.0
Payments related to intangible assets and property, plant and equipment (1,947.7) (2,057.0)
Payments related to fi nancial assets and securities (211.4) (203.8)
Payments related to acquisitions (535.7) (103.6)
Proceeds from divestitures 1,530.8 674.0
Proceeds from the disposal of long-term assets and marketable securities 458.3 457.4
Cash used in investing activities (705.7) (1,233.0)
Capital increases/repayments 9.5 (55.5)
Share repurchases (1,434.8) (725.7)
Proceeds from the addition of fi nancial liabilities 2,241.5 706.7
Repayment of fi nancial liabilities (1,942.4) (909.7)
Dividends paid:
to shareholders of BASF Aktiengesellschaft (903.9) (774.1)
to minority shareholders (78.2) (77.7)
Cash used in fi nancing activities (2,108.3) (1,836.0)
Net changes in cash and cash equivalents (1,223.7) 1,565.0
Effects on cash and cash equivalents:
from foreign exchange rates 35.3 (17.3)
from changes in scope of consolidation 10.3 57.6
Cash and cash equivalents as of beginning of year 2,085.9 480.6
Cash and cash equivalents as of end of year 907.8 2,085.9
Marketable securities 183.0 204.6
Liquid funds as shown on the balance sheet 1,090.8 2,290.5
* The statements of cash fl ows are discussed in detail in the Liquidity and Capital Resources section on page 30 onward of the Management’s Analysis.
For further information regarding Consolidated Statements of Cash Flows, see explanations in Note 12.

92 | 93
1. Summary of accounting policies
(a) Basis of presentation
The Consolidated Financial Statements of BASF Aktien-gesellschaft (“BASF” or “BASF Aktiengesellschaft”) were prepared for the fi rst time according to the International Financial Reporting Standards (IFRS) valid as of Decem-ber 31, 2005. All those IFRS valid in the reporting year 2005 as well as the pronouncements of the International Financial Reporting Interpretations Committee (IFRIC) were adopted to the extent that they were endorsed by the European Union. IFRS, which had not been endorsed by the European Union until that time, had no effect on BASF’s Consolidated Financial Statements. The consoli-dated fi nancial statements of the BASF Group have been converted to IFRS retrospectively as of January 1, 2004. The effects of the fi rst-time adoption of IFRS are shown in Note 3. The Consolidated Financial Statements comply with U.S. Generally Accepted Accounting Principles (U.S. GAAP) as far as permissible under IFRS. The remaining differences are shown in a reconciliation of net income and stockholders’ equity to U.S. GAAP in Note 5. The Consolidated Financial Statements were approved by the Supervisory Board of BASF Aktiengesellschaft at their meeting on Febraury 28, 2006 after their examination by the Audit Committee of the Supervisory Board.
(b) Scope of consolidation
The Consolidated Financial Statements include BASF Aktiengesellschaft, the parent company, with its head-quarters in Germany as well as all the material subsidiar-ies in which BASF Aktiengesellschaft directly or indirectly exercises a majority of the voting rights (collectively, the “Company”). Material, jointly-operated companies are included on a proportional consolidation basis.
2005 2004
Consolidated companies as of January 1 160 154
Thereof proportionally consolidated 12 12
First-time consolidations 28 20
Thereof proportionally consolidated 4 –
Thereof changes in the consolidation
method (1) –
Deconsolidations 8 14
Thereof proportionally consolidated – –
Consolidated as of December 31 180 160
Thereof proportionally consolidated 15 12
2005 2004
Affi liated companies 11 13
Joint ventures 2 3
Other associated companies 3 3
16 19
Subsidiaries and joint ventures whose impact on the net worth, fi nancial position and results of the Company are individually and in aggregate immaterial are not consoli-dated. The effects of not consolidating immaterial compa-nies on the net worth, fi nancial position and results of the Company account in each case for less than 2.0%.
Affi liated companies not consolidated due to immateri-ality, non-proportionally consolidated jointly-owned com-panies, as well as the remaining associated companies are accounted for using the equity method. Associated companies are those entities in which the Company has a participation of at least 20% and exercises a signifi cant infl uence over the operating and fi nancial policies. Overall, this applies to:

BASF Group Consolidated Financial Statements and Notes
First-time consolidations in 2005 comprised: Three companies in Asia and four in Europe in connec- tion with the acquisition of the electronic chemicals business of Merck KGaA, Darmstadt, Germany;Leuna Miramid GmbH, Leuna, Germany, which pro-duces and sells polyamide and polyamide compounds;Three companies in connection with the acquisition of a consulting company, plan business market en-abling services AG, which is focused on the design of business processes and their mapping in IT systems;Two companies headquartered in Switzerland and one in France as a result of the acquisition of the Swiss fi ne chemicals company, Orgamol;OOO Achimgaz, the Russian Federation, a joint venture with Gazprom for the exploration of gas, which has been proportionally consolidated; Six further newly-founded companies in Canada, Germany, the United Kingdom and the United States; andSeven further previously unconsolidated companies with headquarters in Germany, China, Taiwan, Malaysia and Turkey due to their increased importance.
Deconsolidations in 2005 included eight companies due to their decreased importance or due to mergers with other BASF companies.
◾
◾
◾
◾
◾
◾
◾
First time consolidations in 2004 comprised:BASF Performance Polymers GmbH, Rudolstadt, Ger-many, which produces nylon granules and compound-ing products;Foam Enterprises Inc., United States, which produces rigid polyurethane foams;BASF Pipeline Holdings LLC, United States, which holds a direct stake in a butadiene pipeline in the United States;Three Wintershall companies in Brazil, which explore for oil and gas in Brazil;Eight previously unconsolidated European and two U.S. companies due to corporate restructuring; and Four further previously unconsolidated companies with headquarters in China, Japan, and Germany due to their increased importance.
Deconsolidations in 2004 included two companies due to their decreased signifi cance and fi ve due to restructuring or liquidation. A further seven companies were eliminated from the scope of consolidation as a result of the sale of the printing systems business to CVC Capital Partners.
◾
◾
◾
◾
◾
◾
2005
Million €
2005
%
2004
Million €
2004
%
Sales 81.2 0.2 43.5 0.1
Long-term assets 3.2 . 3.5 .
Thereof property, plant and equipment 26.7 0.2 57.3 0.4
Short-term assets (38.0) (0.3) 17.3 0.1
Thereof liquid funds 10.3 0.4 57.6 9.0
Assets (34.8) (0.1) 20.8 0.1
Stockholders’ equity 3.1 . 37.8 0.2
Long-term liabilities 16.8 0.2 0.2 .
Thereof fi nancial indebtedness 9.4 0.5 – –
Short-term liabilities (54.7) (0.6) (17.2) (0.2)
Thereof fi nancial indebtedness 16.2 1.1 3.9 0.8
Stockholders’ equity and liabilities (34.8) (0.1) 20.8 0.1
Contingent liabilities and other fi nancial
obligations 46.3 1.6 89.8 2.8
Changes in the scope of consolidation had the following effects on the sales and the balance sheet of the BASF Group:

94 | 95
Proportional consolidation
Condensed fi nancial information relating to the Company’s pro rata interest in jointly operated companies accounted for using the proportional consolidation method is as follows:
Million € 2005 2004
Income statement information
Sales 3,150.5 2,258.6
Gross profi t on sales 183.2 178.1
Income from operations 123.8 116.6
Income before taxes and minority interests 127.6 124.9
Net income 113.7 99.3
Balance sheet information
Long-term assets 1,396.4 1,241.9
Thereof property, plant and equipment 1,325.1 1,177.0
Short-term assets 775.9 527.8
Thereof liquid funds 47.3 24.5
Assets 2,172.3 1,769.7
Stockholders’ equity 630.7 678.4
Long-term liabilities 948.7 668.5
Thereof fi nancial indebtedness 547.0 370.0
Short-term liabilities 592.9 422.8
Thereof fi nancial indebtedness 9.9 16.0
Stockholders’ equity 2,172.3 1,769.7
Warranties and other fi nancial obligations 128.5 77.1
Cash fl ow information
Cash provided by operating activities 207.6 79.6
Cash used in investing activities (205.5) (267.9)
Cash provided by fi nancing activities 14.4 181.6
Net change in cash and cash equivalents 16.5 (6.7)

BASF Group Consolidated Financial Statements and Notes
Associated companies accounted for using the equity method
Condensed fi nancial information of the most signifi cant associated companies accounted for using the equity method, including the Solvin Group (BASF’s share: 25%) and the Svalöf Weibull Group (BASF’s share: 40%) are shown below.The 2004 fi gures contain the Basell Group, which was sold in 2005 (BASF’s share: 50%).
Million €2005 2004
Income statement information
Sales 1,372.0 8,052.7
Gross profi t on sales 351.3 1,131.7
Income from operations 103.8 296.4
Income before taxes and minority interests 102.0 318.3
Net income 67.0 222.6
BASF’s share of net income 16.8 93.9
Balance sheet information
Long-term assets 477.3 5,258.4
Thereof property, plant, and equipment 459.5 3,430.0
Short-term assets 672.1 2,486.4
Thereof liquid funds 48.6 8.0
Total assets 1,149.4 7,744.8
Stockholders’ equity 343.4 3,540.3
Long-term liabilities 190.6 2,158.0
Thereof fi nancial indebtedness 123.3 1,338.7
Short-term liabilities 615.4 2,046.5
Thereof fi nancial indebtedness 20.4 329.9
Total stockholders’ equity and liabilities 1,149.4 7,744.8
BASF’s investment 95.4 1,695.8
(c) Summary of signifi cant accounting policies
Balance sheet date: The individual fi nancial statements of the companies forming part of the group (hereinafter referred to as “consolidated companies”) are generally prepared as of the balance sheet date of the Consolidated Financial Statements. In certain cases, interim fi nancial statements or adjusted statements as of the balance sheet date of the Consolidated Financial Statements are prepared and used.
Uniform valuation: Assets and liabilities of consolidated companies are accounted for and valued uniformly in ac-cordance with the principles described herein. For com-panies accounted for using the equity method, signifi cant deviations in the valuations are adjusted. Eliminations: Transactions between consolidated companies as well as inter-company profi ts resulting from sales and services rendered between consolidated com-panies are eliminated in full, and those for jointly operated companies on a pro rata basis. Inter-company profi ts resulting from sales at market prices to companies ac-counted for using the equity method are not eliminated due to immateriality.

96 | 97
Capital consolidation: Capital consolidation is based on the purchase method, which conforms with U.S. GAAP. Initially, all assets, debts and intangible assets that are to be capitalized are valued at fair value. Finally, the acquisi-tion cost is matched to the proportionate share of the ac-quired equity. Differences not allocated to individual as-sets are capitalized as goodwill. Goodwill is not amortized, but written down in the case of impairment (see page 126 for further information on intangible assets). Revenue recognition: Revenues from product sales and the rendering of services are recognized upon ship-ment to customers or performance of the service upon the transfer of ownership and risks to the buyer. Provisions for discounts, sales returns, rebates to customers, estimated future warranty obligations and other claims are provided for in the same period the related sales are recorded. In certain cases deliveries require customer accep-tance. Revenues are deferred in these cases until cus-tomer acceptance occurs. Long-term contracts primarily concern the construc-tion of chemical plants for third parties. Realization of revenues and costs takes place according to the stage of completion when the outcome of the construction con-tract can be estimated reliably. To the extent that the out-come of the construction cannot be estimated reliably, revenue is recognized only to the extent of contract costs incurred. Expected losses on the construction contract are recognized by write-downs to the lower fair value. Revenue from interest-bearing assets is recognized ac-cording to the outstanding receivables at reporting date using the effective interest method. Dividends are recog-nized when the shareholder’s right to receive payment is established.
Payments relating to the sale or licensing of technologies or technological expertise are recognized in income ac-cording to the contractually agreed transfer of the rights and obligations relating to those technologies. Borrowing costs: If the construction phase of prop-erty, plant or equipment extends beyond a period of one year, the interest incurred on borrowed capital that is directly attributable to that asset is capitalized as part of the cost of that asset up to the date the asset is ready for its intended use or available for sale. All other borrowing costs are recognized as an expense in the period in which they are incurred. Investment subsidies: Government grants related to the acquisition or construction of property, plant and equipment reduce the acquisition or construction cost of the respective assets. Other government grants or gov-ernment assistance are set up as deferred income and recognized as income over the underlying period or the expected useful life of the respective asset. Conversion of foreign currency items: The cost of as-sets acquired in foreign currencies and revenues from sales in foreign currencies are recorded at current rates on transaction dates. Short-term foreign currency receivables and liabilities are valued at the rate on the balance sheet date. Translation of foreign currency fi nancial statements: The translation of foreign currency fi nancial statements conforms with the functional currencies of the consoli-dated companies. The local currency or the U.S. dollar is the functional currency of BASF subsidiaries and jointly operated companies in North America (NAFTA), Japan, Korea, China, Brazil, Malaysia, Singapore and the Russian Federation. Translation therefore takes place using the

BASF Group Consolidated Financial Statements and Notes
current rate method. Balance sheet items are translated toeuros at year-end rates. Expenses and income are trans-lated at monthly average rates in Euro and accumulated for the year. The effects of rate changes are shown under “currency translation adjustment” as a component of other comprehensive income in equity and are treated as income or expense in the consolidated statements of in-come only upon the disposal of a company. The euro is the functional currency for the remaining companies. The temporal method is therefore used to make the conversion: long-term assets except loans, and paid-in capital are translated using historical rates. Other assets, liabilities and provisions are translated using closing rates. Equity is then calculated as the balancing fi gure. Expenses and income are converted at monthly av-erage rates and cumulated to year-end fi gures, except for those items derived from balance sheet items converted at historical rates, which are also translated at historical rates. Foreign exchange gains or losses resulting from the conversion process are recognized in profi t or loss and shown in other operating expenses or income. Acquired intangible assets – excluding goodwill – are valued at cost less regularly scheduled straight-line amor-tization. The useful life is determined based on the period of the underlying contract and the period of time over which the intangible asset is expected to be used. Write-downs are made when the recoverable amount of the as-set is lower than the carrying value. The recoverable value is the higher of fair value less selling costs and value in use. Write-backs (reversals of impairment losses) are made if the reasons for the previous years’ write-downs no longer exist. Internally generated intangible assets primarily com-prises internally developed software. Such software as well as other internally generated assets for internal use are valued at cost and amortized over their useful lives. Write-downs are made if the carrying amount of an asset exceeds the recoverable value.
Development costs also includes, in addition to those costs directly attributable to the development of the asset, appropriate allocations of material and manufacturing overheads as well as an appropriate share of the adminis-trative costs involved in the development of the intangible assets. Borrowing costs are capitalized if they are material and are incurred during the period of the development of the asset. The average amortization period for intangible assets with fi nite useful lives is 9 years for 2005 and 8 years for 2004 based on the following expected useful lives:
Goodwill: Since 2004, goodwill is only written down if there is an impairment. Impairment testing takes place an-nually and additionally if there is an indication of an im-pairment. The goodwill impairment test is based on cash generating units using the discounted cash-fl ow method. The cash generating units at BASF are principally the business units. Recoverable value is the higher of net sales price and the value in use. Value in use is generally determined using the discounted cashfl ow method. The estimated cash fl ows are generally based on the current plans of the Company for the next three years and rely on the expertise of the respective business unit management. For cash fl ow projections beyond the detailed planning period, growth rates ranging from 0% to 2% were as-sumed depending on the individual business units. Inter-est rates used depend on the business unit (business) and the country in which the business unit operates and ranged from 8.7% to 13.8%. If the necessary write-down exceeds the carrying value of goodwill, the write-down is made with the remaining write-down charged evenly to the remaining assets in the cash-generating unit. Goodwill write-downs are reported under other operating expenses.
Depreciation periodsYears
Marketing and similar rights 2–20
Product rights, licenses and trademarks 2–15
Know-how, patents and production technologies 3–15
Internally generated intangible assets 3–5
Other rights and values 2–20

98 | 99
Emission rights: Emission right certifi cates granted by the German Emissions Trading Authority (DEHSt) or a similar authority in other European countries are recorded at fair value at the time of issue. Purchased emission rights are recorded at acquisition cost. Property, plant and equipment: Property, plant and equipment is stated at acquisition or production cost less scheduled depreciation over its estimated useful life. Low-value assets are fully depreciated in the year of acquisition and are shown as disposals. The revaluation method is not used for the valuation of property, plant and equip-ment. The cost of self-constructed plants includes direct costs, appropriate allocations of material and manufactur-ing overheads, and an appropriate share of the adminis-trative costs for those areas involved in the construction of the plants. Borrowing costs which are incurred during the period of construction are capitalized. For companies in Germany, borrowing costs were set at 4.5% whereas country-specifi c rates were used for Group companies outside Germany. Expected costs involved in the regularly scheduled shut-down of important plants are capitalized as part of the asset and depreciated using the straight-line method over the period to the next planned shut-down. In oil and gas exploration, the estimated discounted costs for reha-bilitating sites, especially the fi lling of wells and the re-moval of production facilities, are capitalized as part of the individual asset and depreciated over the expected useful life of the asset using the straight-line method. Long-term assets, including long-distance natural gas pipelines, are depreciated using the straight-line method. The weighted-average periods of depreciation used were as follows:
Write-downs are made on property, plant and equipment whenever events or changes in circumstances indicate that the carrying value of an asset may not be recover-able. Measurement of an impairment loss for long-lived assets that the Company expects to hold and use is based on the discounted expected future cash fl ows from the use of the asset less costs for its removal. A write-down is made in the amount of the difference between the net carrying value and the discounted future cash fl ows. In oil and gas exploration, exploration and production costs are accounted for using the successful efforts method. Under this method, costs of successful and in-complete oil and gas drilling operations are capitalized as property, plant and equipment. Successful drillings are depreciated based on the production and estimated avail-able resources. Successful drillings of German operations that were completed before the end of 2000 are depreci-ated under the declining balance method over 8 years (for drilling in old fi elds) and 15 years. Geophysical expendi-tures, including exploratory and dry-hole costs, are charged against income. Investment properties held to realize capital gains or rental income are immaterial. They are valued at acquisi-tion cost less scheduled depreciation or at fair value, if lower. Leasing: According to IAS 17 leasing contracts are classifi ed as either fi nancing or operating leases. Assets used which are subject to operating leases are not capi-talized. Leasing payments are charged to income in the year they are incurred.
Depreciation periods
2005
(Years)
2004
(Years)
Buildings and structural installations 28 25
Industrial plant and machinery 13 12
Long-distance natural gas pipelines 25 25
Working and offi ce equipment and
other facilities 8 8

BASF Group Consolidated Financial Statements and Notes
A lease is classifi ed as a fi nance lease if it transfers substantially all of the risks and rewards incidental to its ownership. Assets used subject to a fi nance lease are re-corded at the fair value of the leased property or, if lower, the present value of the minimum lease payments. Leas-ing payments are apportioned between the interest com-ponent and the principal component. The principal com-ponent reduces the outstanding liability, while the interest component is charged as interest expense. Depreciation takes place over the useful life of the asset or the period of the lease if it is shorter. Details regarding the individual leasing contracts are presented in Note 30. Investments in companies accounted for using the equity method: The capital consolidation of participations accounted for using the equity method is carried out un-der the same principles as for those companies which are fully consolidated. The carrying values of these compa-nies are adjusted annually based on the pro rata share of income, dividends and other changes in stockholders’ eq-uity. Goodwill associated with such investments is no lon-ger amortized since 2004 but is written down only in the case of an impairment.
Financial instruments
Financial assets and fi nancial liabilities are recorded on the balance sheet when BASF Group becomes a party to a fi nancial instrument. Financial assets are derecognized when the contractual rights to the cash fl ows from the fi nancial asset expire or when the fi nancial asset with all risks and rewards of ownership is transferred. Financial liabilities are derecognized when the contractual obliga-tion is discharged, cancelled or expires. Customary pur-chases or sales of assets are accounted for using settle-ment date accounting. According to IAS 32, fi nancial instruments include primary instruments such as accounts receivable and accounts payable, investments and equity instruments. Financial instruments also include deriva-tives, which are matched to underlying primary fi nancial instruments and used to hedge risks, such as those aris-ing from changes in currency exchange and interest rates.Financial assets and liabilities are divided into the follow-ing valuation categories:
Financial assets and liabilities that are measured at fair value through profi t or loss include exclusively derivatives and other trading instruments. Within this valuation category are included cash balances, time deposits and checks, which are shown under liquid funds, as well as derivatives shown under other assets and other liabilities. Loans and receivables comprise fi nancial assets with fi xed or determinable payments, which are not quoted on an active market, and are not derivatives or classi-fi ed as available-for-sale. Other receivables and loans classifi ed under “accounts receivable, trade,” “other receivables and miscellaneous short-term assets,” and “other long-term assets” are included herein. Initial valuation is done at present value, which generally matches the nominal value of the receivable or loan. Interest-free and low-interest long-term loans and receivables are recorded at present value. Subsequent valuations are generally done at historical cost, under consideration of the effective interest method. Held-to-maturity fi nancial instruments consist of fi nancial assets with fi xed or determinable payments, and a fi xed term, for which the company has the ability and intent to hold until maturity, and which are not de-rivatives and do not fall into other valuation categories. Initial valuation is done at present value, which gener-ally matches the nominal value. Subsequent valuations are generally done at historical cost, under consider-ation of the effective interest method. There exist no material fi nancial assets that fall into this category.Available-for-sale fi nancial instruments comprise fi nancial assets, which are not derivatives and do not fall into any of the previously stated valuation cate-gories. Participations booked under the item “other fi nancial assets” not accounted for using the equity method, and securities which are available for sale as well as long-term securities reported under the item “liquid funds” are included here. Initial valuation is done at present value. Changes in the present value are booked into equity under the item “other compre-hensive income,” and only fl ow through the income statement when they are disposed of or have an im-pairment in value. Participations whose present value cannot be reliably determined are carried at historical cost, and are written off in the case of an impairment in value.
◾
◾
◾
◾

100 | 101
Financial liabilities are initially valued at present value, which generally corresponds to the amount received or nominal value. Subsequent valuations are generally done at historical cost, under consideration of the effective interest method.
In 2005, there were no reclassifi cations between these valuation categories. Derivative fi nancial instruments can be embedded within other contracts. Under IFRS, embedded derivatives are recorded separately from their base contracts andshown at fair value. Derivatives within the BASF group are generally used for hedging purposes. The bulk of these contracts, how-ever, are not accounted for using hedge accounting as defi ned under IFRS. Nonetheless, these derivatives are ef-fective hedges in the context of the group strategy. Changes in the fair value of the derivatives almost com-pletely offset the change in the value of the underlying contracts. The BASF Group uses hedge accounting for certain hedges of future transactions (“cash fl ow hedge”). The ef-fective portion of the change in fair value is thereby re-corded directly in equity under other comprehensive in-come, taking deferred taxes into account, and does not fl ow through the income statement. The ineffective portion is recorded immediately in the income statement. In the case of future transactions that will lead to a non-fi nancial asset or a non-fi nancial debt being booked, the cumu-lated fair value changes in equity are immediately charged against the acquisition cost. For future transactions that will lead to fi nancial debts or assets, the cumulated fair value changes in equity fl ow through the income state-ment during the same reporting period in which the under-lying contract effects the income statement. The hedging time frame of future transactions generally extends up to one year; the maturity of the hedging instrument is based upon the effective date of the future transaction. All hedged future transactions became effective in the 2005 business year. The use of derivative fi nancial instruments to hedge exchange rate, interest and price risks is detailed in Note 29.
◾ If there are indications of impairment in fi nancial instru-ments, impairment write-downs are carried out. The indi-cations include above all, a reduction in the fair value, a signifi cant reduction in credit quality, the existence of transfer risks, payment delays, higher probability of insol-vency, the necessity of debtor recapitalization or the dis-appearance of an active market. If the reason for a write-down for loans and receivables as well as held-to-maturity fi nancial instruments no longer exists, the write-down is reversed up to the acquisition cost carried forward and recognized in income. In the case of available for sale securities, write-ups principally do not fl ow through the income statement, but are credited directly to equity (other comprehensive income). Write-ups up to the amount of the original write-down are recognized in income in the case of debt instruments; write-ups beyond are recognized in equity. Write-ups are not made for participations for which a fair value cannot be reliably determined and are therefore carried at acquisition cost. Deferred tax assets: Deferred tax assets are recorded for taxable temporary differences between the valuation of assets and liabilities in the fi nancial statements of the consolidated companies and the carrying amounts for tax purposes. In addition, deferred taxes are recorded for tax loss carryforwards to the extent that it is probable that future taxable profi t for the relevant tax authority will be available against which the tax loss carryforwards can be utilized. For companies located in Germany, a 38% tax rate is applied; for other companies, the tax rates applica-ble in the individual countries are used. Appropriate valuation allowances are made if expected future earnings of a company make it seem more likely than not that the tax benefi ts will not be realized. Inventories: Inventories are carried at acquisition costs or production costs. Write-downs are made if the fair value or value in use based on the net realizable value is lower than the carrying value. The net realizable value is based on fair value less costs to sell which can be directly allocated to the respective asset incurred prior to sale.

BASF Group Consolidated Financial Statements and Notes
Production costs include, in addition to direct costs, an appropriate allocation of overhead cost of production using normal utilization rates of the production plants. In addition, pensions, social services and voluntary social benefi ts are included as well as allocations for administra-tive costs, provided they relate to the production process. Financing costs are not included in production costs. Pension provisions and other personal obligations: Provisions for pensions are based on actuarial computa-tions made according to the projected unit credit method. Similar obligations, especially those arising from commit-ments made by North American Group companies to pay the healthcare costs and life insurance premiums of re-tired staff and their dependents, are included in pension provisions. Actuarial profi ts and losses are offset against other comprehensive income. The calculation of the pen-sion provisions was based largely on reports prepared by Bode Hewitt AG & Co. KG in Munich, Germany. Other provisions: Other provisions are set up when there is a present obligation as a result of a past event and when there is a probable outfl ow of resources whose amount can be reliably estimated. The amount of the provision is the probable amount required to settle the obligation. Provisions are recognized for German trade income tax and German corporate income tax and similar income taxes in the amount necessary to meet the expected pay-ment obligations, less any prepayments that have been made. Other taxes assessed are appropriately considered. Provisions are established for certain environmental protection measures and risks if the measures are likely necessary as a result of legal or regulatory obligations or
other events and are not capitalized. Provisions for re-quired recultivations associated with oil and gas opera-tions primarily concern the fi lling of wells and the removal of production facilities upon the termination of production. The present value of the obligation increases the acquisi-tion cost of the respective asset when it is initially recog-nized. Provisions are made for expected severance payments or similar personnel expenses as well as for demolition expenses and other charges related to the closing down of operations that have been decided upon and publicly announced by management. The probable amount required to settle long-term obli-gations is discounted if the effect of discounting is mate-rial. In this case, valuation of the provision is done at pres-ent value. Financing costs are shown in other fi nancial results. Provisions for long-service and anniversary bonuses are largely calculated based on actuarial principles, and discounted using an interest rate of 3.25%. For signed contracts under the pre-retirement part-time programs, provisions for the present value of supplemental (top-up) payments are provided in their full amount and the wage and salary payments due during the passive phase of agreements are accrued through installments and dis-counted at an interest rate of 3.0%. Provisions are re-corded for the expected costs of pre-retirement part-time programs that are anticipated to be contracted during the term of the collective bargaining agreements, taking into consideration the ceilings provided in the collective agreements. The formation of provisions for the BASF stock option program (BOP) and BASF’s incentive share program “plus” is described in detail in Note 28. Deferred tax liabilities: Deferred tax liabilities are recorded for temporary differences between the valuation of assets and liabilities in the fi nancial statements of the consolidated company and the carrying amounts for tax purposes to the extent that there is a surplus of deferred tax liabilities relating to a taxation authority.

102 | 103
Earnings per share: The calculation of earnings per share is based on the average number of common shares out-standing during the applicable period and the net income of the period after minority interests. Use of estimates and assumptions in fi nancial state-ment preparation: The preparation of fi nancial statements requires the use of estimates and assumptions that affect the reported amounts of assets and liabilities and disclo-sure of contingent assets and liabilities at the date of the fi nancial statements and the reported amounts of reve-nues and expenses during the reporting periods. In the preparation of these Consolidated Financial Statements, estimates and assumptions have been made by manage-ment concerning the selection of useful lives of property, plant and equipment and intangible assets, the measure-ment of provisions, the carrying value of investments, and other similar evaluations of assets and obligations. Given the uncertainty regarding the determination of these fac-tors, actual results could differ from these estimates. The use of estimates at closing date is especially sig-nifi cant for the following items: Goodwill is measured for reporting units and is tested for impairment once a year. Write downs are made when an impairment has been determined, i.e., when the book value of the reporting unit exceeds the net present value of future cash fl ows. Impairment testing relies on long-term earnings predictions based on economic trends. Deferred taxes are also recognized for tax loss carry-forwards. Their realization depends on the future taxable profi ts of the respective group companies. Write-downs are made when it is uncertain if future earnings will be suf-fi cient to take advantage of the tax loss carryforwards. Pension provisions are infl uenced by assumptions covering the future development of wages and salaries, future pension payments, interest rates and the value of plan assets. Errors in assumptions could lead to an over- or underfunding of pension liabilities which are offset against retained earnings. See Note 23 for additional in-formation.
Other provisions also cover risks resulting from legal dis-putes and proceedings. In order to determine the amount of the provisions, the facts relating to each case, the size of the claim, claims awarded in similar cases and inde-pendent expert advice are considered along with assump-tions regarding the probability of a successful claim and the range of possible claims. The actual costs can devi-ate from these estimates (See also Note 27). Other provisions also include expected charges for the rehabilitation of contaminated sites, the re-cultivation of landfi lls, the removal of environmental contamination at existing production or storage facilities and other similar measures. If the respective group company is the only possible claimant that can be identifi ed, the provision cov-ers the entire expected claim. At sites operated together by one or more partners, the provision covers only BASF’s share of the expected claim. The determination of the amount of the claim is complex and is based on the avail-able site data, the technology and processes used as well as current regulations (See Note 24). Assumptions have to be made in determining the inter-est rate to be used in calculating long-term provisions. Write-downs of assets are made in the case of an im-pairment. An impairment test is conducted if certain events indicate an impairment. Impairment tests are based on a comparison of the carrying value and the re-coverable amount. The recoverable amount is the higher of net realizable value and value in use. The determination of value in use requires the estimation and discounting of cash fl ows. The estimation of the cash fl ows considers all the information available at closing date which may devi-ate from actual developments. This includes, among other things, expected revenue from sales of products, the re-turn on assets, materials and energy costs. If the recover-able value is lower than the carrying value, a write-down in the amount of the difference is made (compare Notes 14 and 15).

BASF Group Consolidated Financial Statements and Notes
IFRSs and IFRICs not considered in the preparation of
these statements
The effects of IFRSs and IFRICs not applied or not yet endorsed by the European Union in the reporting year 2005 were reviewed:
IFRS 7 “Financial Instruments: Disclosures” requires more extensive disclosure regarding fi nancial instru-ments. The disclosure requirements in IAS 32 were incorporated in IFRS 7 and extended. In addition to the existing disclosure requirements regarding the approach, presentation and measurement of fi nancial instruments, additional information is required regard-ing the type and extent of risks stemming from fi nan-cial instruments. As BASF already publishes extensive information in its notes to the fi nancial statements regarding risk, it is not expected that this will have any material effect on the Consolidated Financial State-ments of the BASF Group. IFRS 7 is to be applied for reporting years beginning on or after January 1, 2007.IFRIC 6 “Liabilities arising from Participating in a Spe-cifi c Market – Waste Electrical and Electronic Equip-ment” was issued to give guidance on the issue of establishing provisions as a result of the European Union’s Directive on Waste Electrical and Electronic Equipment. The IFRIC interpretation clearly states when a provision is to be established according to IAS
37 for the decommissioning of equipment that has been sold to private households before August 13,
2005 (“historical household equipment”). IFRIC 6 will have no effect on the Consolidated Financial State-ments of BASF Group.
◾
◾
In IFRIC 7 “Applying the Restatement Approach under IAS 29 “Financial Reporting in Hyperinfl ationary Econ-omies for the First Time” two specifi c issues related to IAS 29 were treated. On the one hand, it explains how an entity has to restate its fi nancial statements in ac-cordance with IAS 29 in the fi rst year the existence of hyperinfl ation is identifi ed in the economy of its func-tional currency. On the other hand, IFRIC 7 gives guid-ance on how an entity has to treat deferred taxes in the opening balance sheet. IFRIC 7 is to be applied for re-porting years beginning on or after March 1, 2006. This interpretation will have no effect on the Group Consoli-dated Financial Statements of BASF.IFRIC 8 “Scope of IFRS 2” clarifi es that IFRS 2 (Share-based Payment) also applies to agreements whereby the entity makes payments for which the entity does not receive any goods or services or inadequate con-sideration. If the identifi able consideration is less than, or appears to be less than, the fair value of the equity instruments granted or liability incurred, IFRIC 8 inter-prets this circumstance to indicate that other consider-ation (i.e., goods or services) has been (or will be) received. Therefore, IFRS 2 is to be applied in such cases. IFRIC 8 is to be applied for reporting years beginning on or after May 1, 2006. The application of IFRIC 8 has no effects on the Consolidated Financial Statements of BASF Group, as there are no agree-ments to which IFRIC 8 would apply.
◾
◾

104 | 105
2. Acquisitions/divestitures
On January 28, 2005 BASF acquired the electronic chemi-cals business of Merck KGaA, Darmstadt, Germany, for €270 million. The transaction included production and dis-tribution centers for high purity chemicals in Asia and Eu-rope. Merck’s sales in this business amounted to approxi-mately €200 million in 2004. This business was included in the Inorganics division. The difference between the acquisition price and the fair value of the equity purchased which could not be allo-cated to any particular asset was recorded as goodwill. Goodwill includes inseparable assets such as future syn-ergies and the resulting future earnings potential. In total, €122 million was recognized as goodwill. On October 1, 2005, BASF acquired 100% of the shares in the Swiss fi ne chemicals company Orgamol S.A. The acquisition included, among other things, two pro-duction sites for the production of pharma ingredients. In
2004, company sales stood at approximately €100 million. The business was included in the Fine Chemicals division. At acquisition, goodwill of €2 million was recognized for the Orgamol Group. Further acquisitions in 2005 included Leuna Miramid and a consulting company, plan business market enabling services AG, as well as the 50% share of BASF Coatings Japan Ltd. from NOF Corp. In 2004, acquisitions primarily concerned the takeover of the plasticizer business from Sunoco, United States. The transaction included production plants for phthalic anhydride and oxo alcohols in Pasadena, Texas, as well as various intangible assets and inventories. All acquired assets and liabilities are recognized at fair value. Differences between the acquisition price and the net fair value of the cost of the identifi able assets, liabilities and contingent liabilities were recognized as goodwill.
Acquisitions2005
Million €
2005
%
2004
Million €
2004
%
Sales 324.5 0.9 504.5 1.5
Long-term assets 601.1 2.9 91.4 0.4
Thereof property, plant and equipment 329.5 2.5 58.3 0.4
Short-term assets (348.3) (2.3) (73.1) (0.6)
Thereof liquid funds* (535.7) (23.4) (103.6) (16.1)
Assets 252.8 0.7 18.3 0.1
Long-term liabilities 117.6 1.1 2.6 .
Thereof fi nancial indebtedness 2.0 0.1 – –
Short-term liabilities 135.2 1.6 15.7 0.2
Thereof fi nancial indebtedness 45.9 3.2 – –
Stockholders’ equity and liabilities 252.8 0.7 18.3 0.1
Contingent liabilities and other fi nancial
obligations 71.7 2.5 – –
*Primarily due to purchase price payments
On May 5, 2005, BASF and Shell Chemicals sold their 50-50 joint venture Basell to Nell Acquisition S.a.r.l., Luxembourg, a subsidiary of Access Industries, New York. The sales price totaled €4.4 billion including liabilities.
Acquisitions had the following effects on the sales and the balance sheet of the BASF Group:

BASF Group Consolidated Financial Statements and Notes
Furthermore, our polystyrene business in the United States and Canada including our production plant in Joliet, Illinois, was sold to INEOS on April 25, 2005. The business and production plant sold belonged to the Styrenics division. Divestitures in 2004 concerned primarily the sale of the printing systems business to CVC Capital Partners.
Divestitures had the following effects on the sales and the balance sheet of the BASF Group:
Divestitures 2005
Million €
2005
%
2004
Million €
2004
%
Sales (636.1) (1.7) (246.7) (0.7)
Long-term assets (1,028.3) (5.0) (119.0) (0.5)
Thereof property, plant and equipment (52.2) (0.4) (85.4) (0.6)
Short-term assets 1,435.9 9.6 314.6 2.5
Thereof liquid funds* 1,530.8 66.8 674.0 104.9
Assets 407.6 1.1 195.6 0.6
Stockholders’ equity 362.7 2.2 360.4 2.2
Long-term liabilities 50.3 0.5 (59.6) (0.5)
Thereof fi nancial indebtedness – – – –
Short-term liabilities (5.4) (0.1) (105.2) (1.5)
Thereof fi nancial indebtedness – – (0.3) (0.1)
Stockholders’ equity and liabilities 407.6 1.1 195.6 0.6
Contingent liabilities and other fi nancial
obligations – – (4.5) (0.1)
*In particular, due to proceeds from divestitures
Discontinuing operations
There were no discontinuing operations in 2005.
Planned acquisitions/divestitures
On January 9, 2006, the Iron Acquisition Corporation, Florham Park, New Jersey, a one-hundred percent sub-sidiary of BASF Aktiengesellschaft, announced a cash offer for all the shares of Engelhard Corporation, Iselin, New Jersey, in the amount of $37 per share. The total cost of the transaction based on the price per share is approximately $4.9 billion. The extended offer expires on March 3, 2006. BASF is continuing to complement its portfolio with the purchase of the Degussa construction chemicals busi-ness. Exclusive negotiations between BASF and Degussa began on February 14, 2006. For additional details, please see the supplementary report (page 56).
3. Effects of the conversion to IFRS
The consolidated fi nancial statements of BASF Group were based on the accounting and valuation principles of the German Commercial Code (Handelsgesetzbuch) and the German Stock Corporation Act (Aktiengesetz) as well as the accounting standards of the German Accounting Standards Committee (Deutscher Standardisierungsrat), collectively German GAAP up to and including the 2004 reporting year. International Financial Reporting Standards (IFRS) were followed to the greatest extent allowable un-der German GAAP. Due to the mandate by the European Union on July 19, 2002, BASF, as a listed company, has completely con-verted to the International Financial Reporting Standards (IFRS) in accordance with IFRS 1 “First-time Adoption” starting from January 1, 2005. The previous year’s fi gures were restated appropriately. Effects of the conversion were netted against equity as of January 1, 2004.

106 | 107
The results for the 2004 reporting year are presented according to IFRS. The retroactive adjustment of the results for 2004 led to the following reconciliation items:
Reconciliation of stockholders’ equity to IFRS
Million € Note January 1, 2004 December 31, 2004
Stockholders’ equity in accordance with German GAAP 15,878.4 15,765.0
Capitalization of interest cost (a) 322.4 314.3
Capitalization of internally generated intangible assets (b) 114.4 80.6
Accounting for pensions (c) (160.8) (62.7)
Accounting for provisions (d) 186.4 178.8
Accounting for fi nancial instruments (e) (22.6) 196.3
Valuation of inventories (f) 102.2 11.8
Reversal of goodwill amortization and write-offs due to impairment (g) – 108.7
Other adjustments (h) (71.2) 52.6
Tax effects of planned dividend payments and other tax effects (i) 57.9 (43.2)
Valuation adjustments relating to companies accounted for using
the equity method (j) 53.2 –
Adjustments in accordance with IFRS 581.9 837.2
Stockholders’ equity in accordance with IFRS 16,460.3 16,602.2
The conversion affected the following items:
Reconciliation of income from operations to IFRS
Million € Note 2004
Income from operations in accordance with German GAAP 4,855.6
Capitalization of interest cost (a) (63.6)
Capitalization of internally intangible generated assets (b) (53.5)
Accounting for pensions (c) 65.6
Accounting for provisions (d) 13.9
Accounting for fi nancial instruments (e) 95.2
Valuation of inventories (f) (3.4)
Reversal of goodwill amortization and write-offs due to impairments (g) 150.4
Other adjustments (h) (22.8)
Change in presentation of net fi nancing cost of personnel obligations 155.1
Adjustments in accordance with IFRS 336.9
Income from operations in accordance with IFRS 5,192.5

BASF Group Consolidated Financial Statements and Notes
The signifi cant adjustments to IFRS are explained below: (a) Capitalization of interest cost
According to IFRS, borrowing costs for property, plant and equipment that are directly attributable to the con-struction period may be capitalized in the period in which they are incurred if the construction period is lengthy. Previously, in accordance with German GAAP, borrowing costs for construction were not capitalized. Under U.S. GAAP the capitalization of construction interest costs is required. In order to minimize the differences between IFRS and U.S. GAAP the allowed alternative treatment of capitalizing interest incurred in lengthy construction projects has been followed. (b) Capitalization of internally generated in tangible
assets
Costs incurred for computer software developed or ob-tained for the Company’s internal use are to be capitalized as intangible assets and amortized over the expected useful life of the software under IFRS. According to German GAAP, the capitalization of costs for internally generated intangible assets is not permissible. IAS 38 “Intangible Assets” covers the capitalization of develop-ment costs.
(c) Accounting for pensions
Pension obligations arising from direct promises of the Company to the employees were already recorded in the 2004 annual fi nancial statements according to IAS 19 “Employee Benefi ts.” This led to a new valuation whereby the formerly deferred actuarial gains and losses were off-set against retained earnings as of January 1, 2004. Pension benefi ts are also provided by legally indepen-dent funds, particularly the ‘‘BASF Pensionskasse VVaG’’ (‘‘BASF Pensionskasse’’). As BASF guarantees the com-mitments of the these funds, they are classifi ed as defi ned benefi t plans according to IFRS and are to be included in the Group consolidated fi nancial statements. This was not permissible under German GAAP. The inclusion of these pension plans was done retroactively to January 1, 2004 according to IFRS. Actuarial gains and losses were not recognized according to IFRS 1 “First-time Adoption.” BASF exercises the option introduced by an amend-ment to IAS 19 “Employee Benefi ts,” which allows actuarial gains and losses to be recognized against retained earnings in the year they are incurred.
Reconciliation of income after taxes and minority
interests to IFRS
Million € Note 2004
Net income after minority interests in accordance with German GAAP 1,883.0
Capitalization of interest cost (a) 4.3
Capitalization of internally generated intangible assets (b) (32.5)
Accounting for pensions (c) 41.1
Accounting for provisions (d) (8.5)
Accounting for fi nancial instruments (e) 150.1
Valuation of inventories (f) (2.1)
Reversal of goodwill amortization and write-offs due to impairments (g) 112.9
Other adjustments (h) 16.4
Tax effects of planned dividend payments and other tax effects (i) (107.2)
Valuation adjustments relating to companies accounted for using the equity method (j) (53.2)
Adjustments in accordance with IFRS 121.3
Net income after minority interests in accordance with IFRS 2,004.3
108 | 109
Additionally, fi nancing costs for pensions and other per-sonnel obligations are offset against the expected return on plan assets (2004: €155.1 million) and not shown, as previously, before EBIT, but rather separately under “other fi nancial results.” (d) Accounting for provisions
The reconciliation item contains the following deviations:Provisions are made for deferred maintenance and mandated modifi cations in connection with the opera-tion of plants according to German GAAP. IFRS re-quires that these measures are expensed in the period they occur.Under IFRS, provisions for certain environmental mea-sures and recultivation obligations are set-up in the amount of the expected obligations and at the same time increase the acquisition cost of the respective assets. According to German GAAP, such costs were accumulated, whereas according to IFRS they are capitalized and depreciated using the straight-line method.According to German GAAP, provisions are established for cyclical major overhauls whereas IFRS requires that such expenses are capitalized upon performance and are depreciated until the next regularly scheduled overhaul.Long-term provisions are discounted under IFRS. German GAAP stipulates the use of nominal values.
(e) Accounting for fi nancial instruments
IFRS requires that derivatives are valued on the bal-ance sheet at market value and shown as “Other receiv-ables” or “Other liabilities.” Changes in market value, as long as they do not fulfi ll the strict requirements of hedge accounting, affect income. Under German GAAP, unreal-ized gains on swaps and other forward contracts are de-ferred until settlement or termination while unrealized ex-pected losses from pending transactions are charged to income each period. Under German GAAP, long-term receivables and liabil-ities denominated in a foreign currency are converted into euros at the exchange rates at the dates when the trans-actions took place or the lower exchange rates at year end for receivables and the higher exchange rates for lia-bilities. IFRS requires conversion at the exchange rate at the end of the year.
◾
◾
◾
◾
Under IFRS, available-for-sale securities are recorded at market values on the balance sheet date. Changes in val-uation are recognized outside of profi t and loss in equity. Write-downs do not affect income. Under German GAAP, such securities and other investments are valued at the lower of acquisition cost or market value at the balance sheet date and affect income. (f) Valuation of inventories
As the LIFO method is not allowed under IFRS, the valua-tion of inventories was already changed to the weighted-average method as of January 1, 2004.
According to German GAAP, raw materials and sup-plies are to be discounted based on lower replacement costs. Under IFRS write-downs are only allowed based on lower net realizable value. (g) Reversal of goodwill amortization and write-offs
due to impairment
Goodwill was amortized over its useful life in accor-dance with German GAAP. IFRS 3 “Business Combina-tions,” however, requires that goodwill is tested for impair-ment at least once a year according to IAS 36 “Impairment of Assets.” Based on IFRS 1 “First-time Adoption” and IFRS 3 “Business Combinations” regularly scheduled de-preciation on goodwill was not to be made after January 1, 2004. According to impairment tests carried out at the transition date, and at year-end 2004 and 2005, no impair-ment write-offs were necessary. (h) Other adjustments
These refer primarily to the treatment of government grants which are not recognized as income intially but rather reduce the acquisition cost of the respective item of property, plant and equipment. They also refer to re-classifi cations in the consolidated income statement which is discussed in more detail on the next page under “Presentation.” (i) Tax effects of planned dividend payments and
other tax effects
According to IFRS, deferred taxes are recognized for the tax effect of planned dividend distributions from BASF Group companies considering the current fi nancial plans and the change in the German Corporate Income Tax Act (Section 8b KStG).

BASF Group Consolidated Financial Statements and Notes
(j) Valuation adjustments relating to companies
accounted for using the equity method
Signifi cant changes resulting from the conversion to IFRS primarily concern the capitalization and the straight-line amortization of internally-generated software as well as the accounting for capitalized interest for Group com-panies accounted for using the equity method. As a result of these adjustments, the book value of these fi nancial assets under IFRS was higher than that recorded under German GAAP as of January 1, 2004. The negative recon-ciliation item to income under IFRS was related to write-downs of these participations.
Presentation
The presentation of the income statement as well as the balance sheet is in accordance with IAS 1 “Presentation of Financial Statements.” Individual positions were summa-rized to improve clarity and are presented in detail in the notes to the fi nancial statements.
Consolidated Balance Sheets
IFRS requires the differentiation between long-term and short-term assets. German GAAP, by contrast, distin-guished between fi xed assets and current assets. The item “investments accounted for using the equity method” contains in 2004, in particular, our stake in the Basell joint venture, which was sold on May 2, 2005. In equity, the new item “other comprehensive Income” is presented to account for changes that do not affect income. The option under IFRS 1 to net the translation adjustment against re-tained earnings as of January 1, 2004 was exercised. Lia-bilities are segmented according to maturity, whereas they are segmented into provisions and liabilities under Ger-man GAAP.
Consolidated Statements of Income
Financing costs for pensions and other personnel obliga-tions netted against expected returns of pension plan as-sets are not reported before EBIT but after EBIT in a new item “other fi nancial results.” This also includes the capi-talization of interest cost, the accrued interest of other provisions and changes in the fair value of interest rate derivatives.
The calculation of earnings per common share is based on the weighted-average number of common shares out-standing during the applicable period. The calculation of diluted earnings per common share refl ects the dilutive ef-fect of all potential common shares that were outstanding during the respective period. Shares awarded under the BASF employee participation program “plus” have been included in the computation of diluted earnings per share. Due to a resolution by the Board of Executive Directors and the Supervisory Board in 2002, settlements of stock options from the BASF stock option program (BOP) for senior management are made in cash, therefore such stock options have no dilutive effect. The earnings per share were not impacted by any dilu-tive effect in 2005 and in 2004, as the impact of potential common shares was anti-dilutive in each year.
Earnings per share
2005 2004
Net income under IFRS
(Million €) 3,006.7 2,004.3
Number of shares (1,000)
Weighted-average number of shares 525,125 548,714
Earnings per share under IFRS (€) 5.73 3.65
4. Earnings per share
5. Reconciliation of net income and stockholders’
equity to U.S. GAAP
The Consolidated Financial Statements comply with U.S. GAAP as far as permissible under IFRS. The remain-ing differences concern the following adjustments:

110 | 111
Reconciliation of net income to U.S. GAAP
Million € Note 2005 2004
Income after taxes and minority interests to IFRS 3,006.7 2004.3
Adjustments required to conform with U.S. GAAP
Accounting for pensions (a) (72.6) (24.6)
Accounting for provisions (b) 6.5 6.1
Valuation adjustments relating to companies accounted for using
the equity method (e) – (108.4)
Acquisitions (f) (21.8) –
Other adjustments (g) 166.9 (11.0)
Deferred taxes (h) (26.2) (2.4)
Minority interests (i) 1.1 (1.2)
Adjustments to U.S. GAAP 53.9 (141.5)
Net income in accordance with U.S. GAAP 3,060.6 1,862.8
Earnings per share in accordance with U.S. GAAP (€) 5.83 3.39
Dilutive effect – –
Diluted earnings per share in accordance with U.S. GAAP (€) 5.83 3.39
Reconciliation of stockholders’ equity to U.S. GAAP
Million € Note 2005 2004
Stockholders’ equity in accordance with IFRS as of December 31 17,523.5 16,602.2
Minority interests (481.8) (328.5)
Stockholders’ equity excluding minority interests 17,041.7 16,273.7
Adjustments required to conform with U.S. GAAP
Accounting for pensions (a) 920.1 1,020.1
Accounting for provisions (b) 113.0 105.0
Accounting for fi nancial instruments (c) (12.1) –
Reversal of goodwill amortization and write-offs due to
impairment (d) 344.5 325.7
Valuation adjustments relating to companies accounted for using
the equity method (e) 39.0 39.0
Acquisitions (f) (21.8) –
Other adjustments (g) (0.1) (145.7)
Deferred taxes (h) (463.4) (441.7)
Minority interests (i) (16.1) (17.0)
Adjustments to U.S. GAAP 903.1 885.4
Stockholders’ equity in accordance with U.S. GAAP as of December 31 17,944.8 17,159.1

BASF Group Consolidated Financial Statements and Notes
(a) Accounting for pensions
Pension provisions and expenses which fall under the scope of SFAS 87 are based on the same assumptions as under IFRS (see Note 23). BASF excercises the option allowing actuarial gains and losses to offset directly against retained earnings outside of profi t and loss in the year in which they are incurred. According to SFAS 87, these items are charged to income as soon as they ex-
The balance of the expected return on plan assets and the interest costs pertaining to the pension obligation is recognized in the fi nancial results (see Note 9) as an al-lowable IFRS option. According to U.S. GAAP, these items are considered in personnel costs. As a result earn-
ings before interest and taxes (EBIT), according to U.S.
GAAP, would be lower in 2005 by €120.8 (2004: €134.8 million), and the fi nancial result accordingly higher. Actuarial losses amounted to €2,587.1 million as of December 31, 2005 and €1,505.8 million as of December 31, 2004. Based on these amounts, €62.2 million was amortized in 2005 and €15.4 million in 2004 in the income statement. As of December 31, 2005, unrecognized prior service costs existed in the amount of €54.2 million and
ceed 10% of the greater of the Projected Benefi t Oblig-ation (PBO) and the pension plan assets. In addition, a difference results because an Additional Minimum Liability reduces stockholders’ equity according to U.S. GAAP. The Accumulated Benefi t Obligation (ABO) amounted to €11,398.0 million in 2005 compared with €9,419.9 million in 2004. This obligation relates to pension plans whose plan assets do not completely cover the ABO.
Current funding situation2005 2004
Million € ABO Plan Assets ABO Plan Assets
Unfunded pension plans 582.2 – 3,563.1 –
Partially funded pension plans 6,954.6 6,756.6 1,727.5 1,686.3
Total of pension plans that are not fully funded 7,536.8 6,756.6 5,290.6 1,686.3
Fully funded pension plans 3,861.2 4,258.6 4,129.3 4,518.0
11,398.0 11,015.2 9,419.9 6,204.3
as of December 31, 2004, €64.3 million. Based on these amounts, €10.4 million was amortized in 2005 and €9.2 million in 2004 in the income statement. Disclosure re-quirements according to SFAS 132 “Employers Disclo-sures about Pensions and Other Postretirement Benefi ts” (revised 2003) are contained in Note 23. (b) Accounting for provisions
The reconciliation item contains the following deviations: Provisions for part-time programs for employees nearing retirement age: In these fi nancial statements agreed upon top-up payments within the pre-retirement part-time programs are immediately accrued in their full amount, and discounted at a rate of 3.0%. A provision is also recorded for the expected costs for agreements that
Earnings per share
2005 2004
Net income in accordance with U.S. GAAP (Million €) 3,060.6 1,862.8
Number of shares (1,000)
Weighted-average undiluted number of shares 525,125 548,714
Dilutive effect – –
Weighted-average diluted number of shares 525,125 548,714
Basic earnings per share in accordance with U.S. GAAP (€) 5.83 3.39
Dilutive effect – –
Diluted earnings per share in accordance with U.S. GAAP 5.83 3.39
The calculation of earnings per share is described in detail in Note 4.
112 | 113
are anticipated to be concluded during the term of the collective bargaining agreements, taking into consider-ation the ceilings on the number of employee participants provided in such collective bargaining agreements. In accordance with U.S. GAAP, provisions may only be re-corded for employees who have accepted an offer, and the supplemental payments are accrued over the employ-ee’s remaining service period. This resulted in a decrease in income under U.S. GAAP of €29.4 million in 2005 and €22.3 million in 2004. Stockholders’ equity increased by €125.3 million in 2005 and by €154.7 million in 2004. Provisions for restructuring measures: SFAS 146, “Ac-counting for Costs Associated with Exit and Disposal Ac-tivities” requires expected costs associated with the exit or disposal of business activities to be accrued only when a liability against a third party exists. In case of a retention period, severance payments to employees are accrued over the term of this period. Discounting of provisions and liabilities: According to IFRS, long-term provisions and liabilities are to be dis-counted to their present value if the effect from discount-ing is material. Under U.S. GAAP, however, discounting is only permissible when the amount and timing of the cash fl ows can be reliably predicted. This resulted in an income effect of €10.8 million in 2005 and €47.0 million in 2004, and a decrease in equity of €30.5 million in 2005 and of €41.3 million in 2004. (c) Accounting for fi nancial instruments
The guidelines for accounting for fi nancial instruments ac-cording to IAS 39 “Financial Instruments: Recognition and Measurement” and SFAS 133 “Accounting for Derivatives and Hedging Activities” are very similar in concept. The reconciliation items relate to the differing treatment of fair value changes of derivatives within equity, which are a component of a cash-fl ow hedge for a future transaction. According to IAS 39, for hedging future transactions, there is an option regarding the accounting treatment of these fair value changes. BASF has chosen the option to net these changes in valuation against the acquisition costs of the non-fi nancial assets or debts. The other option allows the valuation changes to be charged off through the in-come statement, in the same period in which the hedged transaction fl ows through the income statement. Accord-ing to SFAS 133, only the second method is allowed, while netting out against acquisition costs is prohibited. This timing difference leads to a difference in equity, and has no impact on income.
(d) Reversal of goodwill amortization and write-offs
due to impairment
Goodwill is only written down if an impairment exists ac-cording to SFAS 142 as of January 1, 2002. According to IFRS 1 “First-time Adoption” in conjunction with IFRS 3 “Business combinations,” regularly scheduled amortiza-tion of goodwill has been replaced by impairment testing effective as of January 1, 2004. The amortization on good-will in 2002 and 2003 has been reversed and added to stockholders’ equity. (e) Valuation adjustments relating to companies
accounted for using the equity method
Herein are contained differences from companies ac-counted for under the equity method that result from dif-ferent dates on which the scheduled amortization for goodwill has to be discontinued under U.S. GAAP (2002) and IFRS (2004). (f) Acquisitions
A difference between U.S. GAAP and IFRS with respect to the fi rst-time consolidation involves the treatment of re-search and development projects of acquired businesses. Whereas these costs are expensed in the fi rst year of con-solidation under U.S. GAAP, IFRS requires that these costs are capitalized as intangible assets and amortized over their useful lives. This resulted in a decrease of in-come of €25.5 million. Stockholders’ equity decreased similarly by €25.5 million in 2005. There were no research and development costs in connection with acquisitions in 2004. According to U.S. GAAP, contingent purchase price adjustments of acquisitions are only accounted for at the time of payment of the contingent price adjustment. IFRS 3, however, requires the recognition of these purchase price adjustments at estimated values in the fi rst consoli-dation of an acquired business. If a negative difference exists as a result of these differing practices, it is to be booked immediately to the income statement according to IFRS, whereas according to U.S. GAAP it reduces the val-ues assigned to the acquired assets. This resulted in an income effect of €3.7 million in 2005. Stockholders’ equity increased corresepondingly by €3.7 million in 2005. There were no such discrepancies in 2004 as a result of contin-gent price adjustments. (g) Other adjustments
This item primarily includes the elimination of provisions for the fair value of stock options granted, differences arising from the accounting of sale and leaseback trans-actions as well as provisions for major overhauls of large scale plants.

BASF Group Consolidated Financial Statements and Notes
(i) Minority interests
The portion of U.S. GAAP valuation adjustments applying to minority interests is shown separately.Consolidation of majority-owned subsidiaries: First-time consolidations of subsidiaries require the re-statement of prior years’ fi gures. The effect of fi rst-time consolidated companies on the net worth, fi nancial posi-tion and results was immaterial; an adjustment was there-fore not performed.
New U.S. GAAP accounting standards not yet adopted
SFAS 123R “Share-Based Payment” (revised 2004) replaces SFAS 123 “Accounting for Stock-Based Com-pensation”. This disallows the former optional treatments contained in APB 25 “Accounting for Stock Issued to Employees.” According to SFAS 123R, all listed companies must recognize stock-based payment as an expense during the vesting period. Equity instruments granted as payment are valued at their market value at the time of granting. The market value at reporting date is calculated to value share-based payment which is to be settled in
Stockholders’ equity Income
Million € Note 2005 2004 2005 2004
Accounting for pensions (a) (348.5) (384.2) 27.4 10.2
Accounting for provisions (b) (51.6) (46.0) (5.2) 10.7
Accounting for fi nancial instruments (c) 4.3 – (5.3) –
Reversal of goodwill amortization and write-offs due
to impairment (d) (96.2) (86.9) – –
Acquisitions (f) 9.3 – 9.3 –
Other adjustments (g) 19.3 75.4 (52.4) (23.3)
(463.4) (441.7) (26.2) (2.4)
Following a resolution by the Board of Executive Direc-tors, stock options are to be settled in cash. Under U.S.
GAAP, such obligations are to be accounted for as stock appreciation rights based on the intrinsic value of the op-tions on the balance sheet date. However, options granted in prior years, for which cash settlement was not foreseen, are to be accounted for in accordance with SFAS 123 as equity instruments based upon the fair value on the grant date. In the present Financial Statements, all obligations resulting from stock options are accounted for based upon the fair value on the balance sheet date. A provision is accrued over the vesting period of the options. The dif-ferent accounting methods led to an increase in net in-come in accordance with U.S. GAAP of €6.1 million in 2005, and €16.1 million in 2004. In the present Financial Statements, obligations result-ing from stock options are shown as provisions. In accor-dance with U.S. GAAP, options for which cash settlement was not originally foreseen are recorded as additions to stockholders’ equity. Overall, the accounting for stock op-tions resulted in a decrease in stockholders’ equity of €17.4 million in 2005, and €9.4 million in 2004.
Under IFRS, anticipated costs necessary for the major overhaul of large scale plants prescribed at certain inter-vals are capitalized as a part of the respective asset and depreciated on a straight-line basis over the period until the next regularly scheduled major overhaul. According to U.S. GAAP, provisions for such costs were established. In 2005 the accounting method was changed to IFRS. The cumulative effect of €117.0 million was recognized in in-come. Gains from the sale of assets which continue to be used under operating leases are to be recognized in in-come under IFRS, if the sale is an arm’s length transac-tion. U.S. GAAP requires the deferral of the gain and its recognition in income over the useful life of the asset. (h) Deferred taxes
The adjustments required to conform with U.S. GAAP would result in taxable temporary differences between the valuation of assets and liabilities in the Consolidated Financial Statements and the carrying amount for tax pur-poses. Resulting adjustments for deferred taxes primarily relate to the following:

114 | 115
Other changes in stockholders’ equity
The option allowed by IFRS 1 to offset currency translation adjustments against retained earnings as of January 1, 2004 was exercised. Under U.S. GAAP, the translation adjustment is to be carried forward unchanged under “other compre-hensive income.” According to U.S. GAAP, specifi cally SFAS 130, certain expenses and income are recognized outside of profi t or loss (Other Comprehensive Income):
Million € 2005 2004
Net income in accordance with U.S. GAAP (before other comprehensive income) 3,060.6 1,862.8
Change of foreign currency translation adjustments
Gross 765.6 (291.3)
Deferred taxes (33.1) 17.2
Changes in unrealized holding gains on securities
Gross 66.7 95.6
Deferred taxes 4.5 0.3
Changes in unrealized losses from cash fl ow hedges
Gross (21.2) (54.0)
Deferred taxes 11.6 18.7
Additional minimum liability for pensions
Gross (1,179.7) (514.7)
Deferred taxes 457.1 197.0
Other comprehensive income (loss), net of tax 71.5 (531.2)
Comprehensive income, net of tax 3,132.1 1,331.6
cash. SFAS 123R applies to all reporting years commenc-ing after June 15, 2005. As BASF already recognizes share-based payment as an expense, SFAS 123R will have no material effects on BASF’s Consolidated Financial Statements. SFAS 154, governing the accounting and reporting of voluntary changes in accounting methods, replaces APB Opinion Nr. 20 “Accounting Changes” and FASB State-ment No. 3 “Reporting Accounting Changes in Interim Fi-nancial Statements.” According to SFAS 154, future im-pacts on income as a result of voluntary changes in accounting methods will no longer be shown as a sepa-rate item “cumulative change in accounting principle” on the income statement of the current period but rather as an adjustment of the fi nancial statements for all previously published periods as if the new method had always been used.
EITF 04-13 “Inventory Exchanges” determines when a pur-chase and sale of inventory is to be seen as a barter transaction. According to APB Opinion No. 29 “Account-ing for Non-monetary Transactions,” barter transactions may not be shown on the income statement. The key cri-terion is whether the purchase and sale are closely con-nected. EITF 04-13 clearly states that no sales revenues may be recognized from these transactions if sale and purchase of inventories are clearly connected. Further-more, EITF 04-13 has specifi ed the scope of FASB State-ment No. 153 “Exchanges of Non-monetary Assets.” EITF 04-13 is to be applied to all new transactions that were concluded in the reporting years beginning after March 15, 2006. No revenue was recognized for barter transactions as defi ned in these standards. The rules are essentially similar to those in IFRS.

BASF Group Consolidated Financial Statements and Notes
6. Reporting by segment and region
The Company is a worldwide manufacturer and sup-plier of about 8,000 products. The Company offers a wide range of products, including chemicals, plastics, dyes and pigments, dispersions, automotive and industrial coatings, agricultural products, fi ne chemicals, crude oil and natural gas. The Company conducts its worldwide operations through 12 operating divisions, which have been aggre-gated into fi ve reporting segments based on the nature of the products and production processes, the type of cus-tomers, the channels of distribution and the nature of the regulatory environment (see also the explanations in the Management’s Analysis section on pages 14 onward). The Chemicals segment is made up of the divisions Inorganics, Petrochemicals and Intermediates. Plastics is composed of the divisions Styrenics, Performance Poly-mers and Polyurethanes. Performance Products com-prises the divisions Performance Chemicals, Coatings and Functional Polymers. The segment Agricultural Products & Nutrition comprises the divisions Agricultural Products and Fine Chemicals. The Oil & Gas Segment consists of the operating division Oil & Gas, which conducts oil and gas exploration and production and trades in natural gas.
Business activities not allocated to any operating division are shown as “other” and comprise the sale of feedstock, remaining fertilizers activities, engineering and other ser-vices as well as rental income. The income from opera-tions recorded as “other” includes mainly costs of re-search related to the Group of €225.0 million in 2005 and €168.0 million in 2004. “Other” also includes foreign currency results from fi nancial indebtedness, hedging of forecasted sales, as well as from foreign currency positions that were macro-hedged of €(97.0) million in 2005 and €54.0 million in 2004. Transfers between the reportable segments are shown separately and generally valued at market-based prices. The allocation of assets and depreciation to the seg-ments is based on economic control. Assets used by more than one segment are allocated based on the per-centage of usage. Exploration expenses in the Oil & Gas segment are re-ported under other operating expenses as of 2005. Prior years’ fi gures were restated accordingly.
Million € 2005 2004
Stockholders’ equity in accordance with U.S. GAAP (before accumulated other comprehensive income) 19,408.9 18,694.7
Accumulated other comprehensive income
Foreign currency translation adjustments
Gross (603.4) (1,369.0)
Deferred taxes 36.1 69.2
Unrealized holding gains on securities
Gross 262.9 196.2
Deferred taxes (40.9) (45.4)
Unrealized losses from cash fl ow hedges
Gross (79.3) (58.1)
Deferred taxes 31.7 20.1
Additional minimum liability for pensions
Gross (1,730.7) (551.0)
Deferred taxes 659.5 202.4
Accumulated other comprehensive income (1,464.1) (1,535.6)
Total stockholders’ equity in accordance with U.S. GAAP including comprehensive income 17,944.8 17,159.1

116 | 117
Segments
2005 Chemi-
cals
Plastics Perfor-
mance
Products
Agricultural Products
& Nutrition
Oil & Gas Other BASF
Group
Million €
Agricul-
tural
Products
Fine
Chemi-
cals
Total
Thereof
Explo-
ration
Net sales 8,103 11,718 8,267 3,298 1,732 5,030 7,656 3,499 1,971 42,745
Change (%) 15.4 11.3 3.3 (1.7) (3.4) (2.3) 45.5 41.0 25.5 13.9
Intersegmental transfers 3,826 471 352 29 28 53 723 235 468 5,893
Sales including transfers 11,929 12,189 8,619 3,327 1,760 5,083 8,379 3,734 2,439 48,638
Income from operations 1,326 1,015 863 681 (58) 623 2,410 2,094 (407) 5,830
Change (%) 3.3 46.3 (23.5) 13.1 . (5.3) 46.7 60.7 (90.2) 12.3
Assets 6,146 6,639 4,863 5,156 1,481 6,637 4,895 2,155 6,490 35,670
Thereof goodwill 133 143 266 1,496 6 1,502 64 64 31 2,139
Thereof property, plant and equipment 3,567 3,155 1,944 618 747 1,365 3,033 1,355 923 13,987
Return on operating assets (%)* 23.3 15.9 18.4 13.4 . 9.6 53.8 103.3 . 19.9
Debt 1,766 1,676 1,766 951 538 1,489 1,836 903 9,614 18,147
Research and development expense 114 135 214 303 70 373 1 . 227 1,064
Investment in property, plant and
equipment and intangible assets 639 490 347 74 222 296 624 381 127 2,523
Depreciation and amortization of property,
plant and equipment and intangible assets 616 489 364 226 147 373 449 322 112 2,403
Thereof due to impairments 61 . 10 9 16 25 . . 1 97
2004 Chemi-
cals
Plastics Perfor-
mance
Products
Agricultural Products
& Nutrition
Oil & Gas Other BASF
Group
Million €
Agricul-
tural
Products
Fine
Chemi-
cals
Total
Thereof
Explo-
ration
Net sales 7,020 10,532 8,005 3,354 1,793 5,147 5,263 2,482 1,570 37,537
Change (%) 22.0 19.9 4.9 5.6 (2.8) 2.5 9.9 14.7 14.0 12.5
Intersegmental transfers 3,395 677 291 26 30 52 546 173 462 5,423
Sales including transfers 10,415 11,209 8,296 3,380 1,823 5,199 5,809 2,655 2,032 42,960
Income from operations 1,284 694 1,128 602 56 658 1,643 1,303 (214) 5,193
Assets 5,219 6,187 4,538 4,985 1,308 6,293 4,063 1,899 9,148 35,448
Thereof goodwill 11 125 237 1,509 2 1,511 64 64 25 1,973
Thereof property, plant and equipment 3,283 2,857 1,892 661 639 1,300 2,814 1,255 917 13,063
Return on operating assets (%)* 25.2 11.6 24.2 11.4 4.2 9.9 41.3 69.6 . 18.5
Debt 1,836 1,836 2,287 1,100 704 1,804 1,902 1,081 9,181 18,846
Research and development expense 98 136 217 272 90 362 . . 173 986
Investment in property, plant and
equipment and intangible assets 601 473 304 100 153 253 388 329 144 2,163
Depreciation and amortization of property,
plant and equipment and intangible assets 573 499 375 285 150 435 455 330 155 2,492
Thereof due to impairments 52 . 4 25 . 25 . . 70 151
* EBIT calculations based on average assets of the segments

BASF Group Consolidated Financial Statements and Notes
Regions
2005
Million €
Europe Thereof
Germany
North
America
(NAFTA)
Asia
Pacifi c
South
America,
Africa,
Middle
East
BASF
Group
Location of customers
Sales 23,755 8,865 9,479 6,500 3,011 42,745
Change (%) 11.3 20.1 15.9 22.4 11.4 13.9
Share (%) 55.6 20.7 22.2 15.2 7.0 100.0
Location of companies
Sales 25,093 17,100 9,542 6,042 2,068 42,745
Sales including transfers 28,565 19,932 10,110 6,334 2,160 47,169
Income from operations 4,385 3,019 855 297 293 5,830
Assets 19,961 13,374 7,789 6,112 1,808 35,670
Thereof property, plant and equipment 7,334 5,045 2,534 3,594 525 13,987
Investment in property, plant and equipment and intangible assets 1,433 837 281 697 112 2,523
Depreciation and amortization of property, plant and equipment
and intangible assets 1,473 915 460 403 67 2,403
Employees (December 31) 56,614 45,620 9,826 9,669 4,836 80,945
2004
Million €
Europe Thereof
Germany
North
America
(NAFTA)
Asia
Pacifi c
South
America,
Africa,
Middle
East
BASF
Group
Location of customers
Sales 21,343 7,382 8,182 5,309 2,703 37,537
Change (%) 10.0 4.4 14.2 18.8 16.4 12.5
Share (%) 56.9 19.7 21.8 14.1 7.2 100.0
Location of companies
Sales 22,536 15,216 8,165 4,911 1,925 37,537
Sales including transfers 25,527 17,751 8,655 5,461 1,803 41,446
Income from operations 4,236 3,131 286 361 310 5,193
Assets 21,815 14,567 7,254 4,888 1,491 35,448
Thereof property, plant and equipment 7,245 5,067 2,364 3,013 441 13,063
Investment in property, plant and equipment and intangible assets 1,202 816 271 608 82 2,163
Depreciation and amortization of property, plant and equipment
and intangible assets 1,530 975 608 250 104 2,492
Employees (December 31) 57,540 46,666 10,578 8,916 4,921 81,955
The region “Asia Pacifi c” has been shown separately since January 1, 2005 due to its increasing importance. Af-rica, which was included in the “Asia Pacifi c and Africa” region until 2004 and the Middle East have been com-
bined with the formerly independent region “South America.” The values for the previous year have been appropriately restated.

118 | 119
Million € 2005 2004
Release and adjustment of provisions 118.4 154.4
Income from miscellaneous revenue generating activities 85.3 71.7
Gains from foreign currency transactions 43.3 145.6
Gains from foreign currency conversion 57.3 12.1
Gains from disposal of assets and divestitures 107.4 448.7
Other 188.5 213.6
600.2 1,046.1
7. Other operating income
Release and adjustment of provisions relate principally to sales and purchase provisions, provisions for lawsuits and damage claims and various other items in the normal course of business. Provisions are reversed or adjusted if the circumstances at closing date indicate that they are no longer probable or that the probable amount has been reduced. Income from miscellaneous revenue-generating activities primarily represents revenues from energy sales, sales of raw materials as well as income from rentals and logistics services. Gains from foreign currency transactions represent realized gains on receivables and liabilities denominated in foreign currencies, gains resulting from conversion of receivables, liabilities and other items denominated in
foreign currencies at the balance sheet date and gains from changed fair values of currency derivatives. Gains from conversion of fi nancial statements of group companies in foreign currencies includes gains from currency exposures of fi nancial statements in foreign currency, which are converted into euros under the tem-poral method. They are related to a higher net asset expo-sure or lower net liability exposure after conversion into euros than at the previous balance sheet date. Gains from the disposal of assets primarily includedivestitures in the Agricultural Products segment to opti-mize the portfolio in 2005, and the sale of the printing sys-tems business in 2004. Other includes reversal of valuation allowances on receivables, miscellaneous sales and various other sundry items.
8. Other operating expenses
Million € 2005 2004
Integration and restructuring measures 446.5 542.8
Environmental protection and safety measures, costs of demolition and planning costs related
to the preparation of capital expenditure projects not subject to mandatory capitalization 158.3 168.3
Amortization of intangible assets and depreciation of property, plant and equipment 204.6 209.3
Thereof internally generated assets 61.7 78.6
Costs from miscellaneous revenue-generating activities 84.7 69.7
Losses from foreign currency transactions 189.5 30.3
Losses from foreign currency conversion 23.0 44.1
Losses from disposal of assets 15.5 12.2
Oil and gas exploration expenses 172.9 194.9
Other 480.1 394.3
1,775.1 1,665.9

BASF Group Consolidated Financial Statements and Notes
Integration and restructuring measures in 2005 primarily concerned the restructuring of the Fine Chemicals division as well as measures to further improve the effi ciency at the sites in Ludwigshafen, Germany, and Feluy, Belgium. In 2004, this item included additional charges from the Ludwigshafen Site Project and restructuring measures in North America. Further expenses were related to the cost of demoli-tion and removal of fi xed assets as well as the preparation of capital expenditure projects not subject to mandatory capitalization.
Costs from miscellaneous revenue-generating activities refer to costs relating to the items shown as miscellaneous revenue-generating activities (see Note 7). Losses from foreign currency transactions include losses from foreign currency items and forward contracts as well as the valuation of receivables and liabilities in for-eign currencies at the exchange rate on the balance sheet date. Other expenses were incurred as a result of write-offs of no longer usable inventory in the amount of €103.0 mil-lion in 2005 and €83.0 million in 2004 as well as for other reasons affecting various items.
9. Financial result
Million € 2005 2004
Income (losses) from companies accounted for using the equity method 5.6 (7.2)
Income from participations in affi liated and associated companies 53.5 10.5
Income from the disposal or write-ups of participations 310.7 38.1
Income from profi t transfer agreements 9.0 2.3
Losses from loss transfer agreements (13.6) (15.2)
Write-down of, and losses from, retirement of participations (17.9) (625.4)
Income from tax allocation to participating interests 0.7 1.2
Other income from participations 342.4 (588.5)
Interest expenses (351.9) (288.9)
Interest income 153.3 66.3
Interest and dividend income from securities and receivables 28.6 16.5
Interest result (170.0) (206.1)
Write-ups/profi ts from the sale of securities and receivables 16.1 13.7
Write-downs/losses from the disposal of securities and receivables (6.7) (40.3)
Net fi nancing from long-term personnel provisions (121.7) (137.7)
Interest accrued on other interest-bearing liabilities (50.8) (48.8)
Capitalization of interest cost 43.0 72.5
Other fi nancial expenses and income 38.2 96.7
Other fi nancial result (81.9) (43.9)
Financial result 96.1 (845.7)
Income from the disposal or write-ups of participations contains the gain of the sale of our 50% share of Basell in 2005. In the prior year, in contrast, valuation adjustments on participations were necessary, which were shown under write-down of, and losses from, retirement of fi nancial assets as well as securities held as current assets.

120 | 121
Income before taxes and minority interests is broken down by into domestic and foreign taxes as follows:
In Germany a uniform corporate tax of 25% and thereon a solidarity surcharge of 5.5% is uniformly levied on all dis-tributed and undistributed earnings. In addition to corpo-rate income tax, income generated in Germany is subject to a trade income tax that varies depending on the munic-ipality in which the company is located. After accounting for trade income tax, which is a deductible operating ex-pense, BASF has a weighted-average trade income tax rate of 15.3%. Because German trade income tax is de-ductible, it also reduces the assessment basis for corpo-rate income tax. For German companies, deferred taxes are calculated using a tax rate of 38%.
Income from foreign Group companies is taxed at the income tax rates applicable in the respective countries of domicile. For foreign Group companies, deferred taxes are cal-culated using the tax rates applicable in the individual for-eign countries. Such rates averaged 29% in 2005 and 29% in 2004. Income taxes on foreign oil-producing operations in certain regions are compensated up to the level of the German corporate income tax on this foreign taxable in-come. The non-compensable amount is shown separately in the following table. “Other taxes” includes real estate taxes and other comparable taxes in the amount of €90.0 million in 2005 and €93.0 million in 2004; they are allocated to the appro-priate functional costs.
Million € 2005 2004
German corporate income tax, solidarity surcharge, German trade income taxes 433.4 532.4
Foreign income tax 1,970.1 1,396.5
Taxes for prior years 81.5 (16.1)
Current taxes 2,485.0 1,912.8
Deferred taxes 273.1 300.7
Income taxes 2,758.1 2,213.5
Thereof income taxes on oil-producing operations 1,450.0 911.0
Other taxes 151.4 150.4
Tax expense 2,909.5 2,363.9
10. Income taxes
Million € 2005 2004
Germany 1,524.5 1,270.5
Foreign oil production branches of
German companies 1,514.6 975.0
Foreign 2,886.5 2,101.3
5,925.6 4,346.8

BASF Group Consolidated Financial Statements and Notes
Tax exempt earnings arose from the sale of participations or securities. This particularly concerned the sale of the joint venture Basell in 2005 and the sale of the printing systems business in 2004. The non-deductible expenses in 2004 include primarily write-downs of participations.Deferred tax assets on tax loss carryforwards including those for prior years are recorded. If expected future tax-
able profi ts of a company make it more likely than not that the future tax benefi ts will not be realized, adequate valua-tion allowances are established. Deferred taxes result from the following temporary differences between the valuation of assets and liabilities under IFRS and for tax purposes.
Reconciliation from the statutory tax rate in Germany to the
effective tax rate
2005
Million € %
2004
Million € %
German corporate income tax 1,481.4 25.0 1,086.7 25.0
Solidarity surcharge 13.4 0.2 12.7 0.3
German trade income tax net of corporate income tax 141.2 2.4 177.5 4.1
Foreign tax-rate differential 113.5 1.9 44.5 1.0Tax exempt income (208.4) (3.5) (209.2) (4.8)
Non-deductible expenses 155.6 2.6 325.3 7.5
Income after taxes of companies accounted for using the equity method (1.4) . 1.8 .
Taxes for previous years 81.5 1.4 (16.1) (0.4)
Income taxes on oil-producing operations non-compensable
with German corporate income tax 1,072.5 18.1 667.7 15.4
Deferred taxes for planned dividend distributions 9.5 0.2 107.5 2.5
Other (100.7) (1.7) 15.1 0.3
Income taxes/effective tax rates 2,758.1 46.6 2,213.5 50.9
Deferred tax assetsTax assets Tax liabilities
Million € 2005 2004 2005 2004
Intangible assets (111.0) (30.0) 282.2 125.2
Property, plant and equipment (456.8) (333.6) 343.0 775.7
Financial assets 12.7 21.6 0.2 55.3
Inventories and accounts receivable 3.6 (57.7) 110.8 36.5
Provisions for pensions 641.0 331.7 2.9 (73.0)
Other provisions and liabilities 415.2 491.2 (44.2) (127.4)
Tax loss carryforwards 840.0 816.7 – –
Other 44.7 210.3 4.4 155.7
Valuation allowances (134.7) (113.6) – –
Thereof for tax loss carryforwards (37.3) (41.6) – –
Total 1,254.7 1,336.6 699.3 948.0
Thereof short-term 369.4 207.3 137.5 145.7

122 | 123
The assessment of the probability of a reversal of the tem-porary difference between the book and tax values or the use of a tax loss carryforward are decisive for the value of a deferred tax asset. The carrying amount of a deferred tax asset is recognized to the extent to which it is proba-ble that suffi cient taxable profi t relating to the same taxa-tion authority will be available to allow the benefi t of part or all of that deferred tax asset to be utilized. Based on experience and the expected development of taxable in-come, it is assumed that the advantages of deferred tax assets recognized will be realized. Deferred tax assets were offset against deferred tax liabilities of the same maturity to the degree that these relate to the same taxation authority. Deferred tax assets for undistributed earnings of sub-sidiaries in the amount of €7,918.7 million in 2005 and €7,245.3 million in 2004 were not recognized, as they are not subject to such taxation or that they are reinvested for indeterminate periods of time. For these timing differ-ences, the calculation of deferred taxes would have only had to consider the respective withholding tax or the German taxation of 5% on dividends paid. The regional distribution of tax loss carryforwards is as follows:
German tax losses may be carried forward indefi nitely. Foreign loss carryforwards exist primarily in North America (NAFTA). These expire starting in 2020. North America (NAFTA) recorded a loss before taxes in 2004. Loss carry-forwards in the NAFTA region could be reduced due to higher earnings but the reduction was partially offset by the appreciation of the U.S. dollar. Considering the restructuring measures that are being implemented and expected future profi ts as a result, no write-downs on deferred tax assets were made. Write-downs on tax loss carryforwards of €72.2 million in 2005 and €87.0 million in 2004 were made.
Tax liabilities comprise tax liabilities and tax provisions. Tax liabilities primarily concern the assessed income tax and other taxes. Tax provisions mainly concern income taxes for the current and the previous year.
Million € 2005 2004
Germany 30.1 26.3
Foreign 2,114.5 2,142.4
2,144.6 2,168.7
Tax liabilities
Million € 2005 2004
Tax provisions 330.7 309.0
Tax liabilities 556.5 335.3
887.2 644.3
Million € 2005 2004
Minority interests in profi ts 179.0 145.5
Minority interests in losses 18.2 16.5
160.8 129.0
Million € 2005 2004
Income tax payments 2,252.4 1,543.0
Interest payments 220.3 226.6
Dividends received 68.1 47.6
11. Minority interests
12. Other information
Additional information on consolidated statements of
cash fl ows Cash provided by operating activities includes the following cash fl ows:
Minority interests in profi ts relate primarily to the Group companies engaged in trading and distribution of natural gas and to the operating company for the steam cracker in Port Arthur, Texas. Minority interests in losses mainly related to BASF Plant Science. See Note 22 for a detailed analysis of consolidated subsidiaries with minority shareholdings.

BASF Group Consolidated Financial Statements and Notes
Personnel costs
Million € 2005 2004
Wages and salaries 4,553.0 4,579.1
Social security contributions and expenses for pensions and assistance 1,021.4 1,035.8
Thereof for pension benefi ts 242.4 227.4
5,574.4 5,614.9
Average number of employees Fully-consolidated
companies
Proportionally-consolidated
companies
BASF Group
2005 2004 2005 2004 2005 2004
Europe 56,284 59,783 270 252 56,554 60,035
Thereof Germany 45,618 47,830 16 14 45,634 47,844
North America (NAFTA) 9,934 11,002 466 488 10,400 11,490
Asia Pacifi c 8,732 7,911 1,694 1,912 10,426 9,823
South America, Africa, Middle East 4,827 5,000 – – 4,827 5,000
BASF Group 79,777 83,696 2,430 2,652 82,207 86,348
Thereof with trainee contracts 2,329 2,549 2 2 2,331 2,551
Thereof with limited-term contracts 1,709 1,738 12 233 1,721 1,971
The number of employees in proportionally-consolidated companies is included in the fi gures above in full. Consid-ered pro-rata, the average number of employees in the BASF Group was 80,992 in 2005 and 85,022 in 2004. The number of employees in 2005 fell primarily due to ongoing measures to improve the effi ciency of our sites in Europe and North America. As a result of the acquisition of the electronic chemicals business from Merck KGaA, the number of employees increased by 578 in 2005. As a result of the sale of the fi bers business, 1,214 em-ployees transferred to Honeywell in 2004. The sale of the printing systems resulted a reduction in the number of employees by 326 in 2005 and 2,029 in 2004.
Subsidiaries
German subsidiaries which are either joint-stock compa-nies or partnerships make use of the exemptions accord-ing to Section 264 (3) and Section 264b of the German Commerical Code. The individual companies are listed in the List of Shares Held.
List of Shares Held
A list of companies included in the Consolidated Financial Statements as well as a list of all companies in which BASF has a participation, has been deposited in the Commercial Register HRB 3000 in Ludwigshafen (Rhine), Germany, as required by the German Commercial Code, Section 313 (2). The List of Shares Held can be obtained as a separate report from BASF Aktiengesellschaft, and is available on the Internet at corporate.basf.com/gover-nance_e.
Statement of compliance according to Section 161 of
the German Stock Corporation Act
The statement of compliance with the German Corporate Governance Codex according to Section 161 of the Ger-man Stock Corporation Act was signed by the Board of Executives and the Supervisory Board. The statement of compliance may be seen on the Internet at corporate.basf.com/cg_berichte.
German Group companies incurred costs for employee representatives to comply with statutory regulations of €11.4 million in 2005 and €11.2 million in 2004.

124 | 125
13. Compensation for the Board of Executive Directors and Supervisory Board of BASF Aktiengesellschaft
In 2005, the exercising of options granted in 1999 resulted in cash payments totaling €1.4 million to members of the Board of Executive Directors and €2.9 million to previous members or their surviving dependents. Cash payments do not infl uence personnel costs associated with the issu-ing of options, as the payments were charged against pro-visions established for this purpose in previous years. See Note 28 for further details. The change in pension provisions for former members of the Board of Directors compared to 2004 was largely due to the use of a lower interest rate in the valuation. Compensation of the Supervisory Board is further de-tailed on page 79 of the Management’s Analysis. The members of the Board of Executive Directors and the Supervisory Board as well as their memberships on other supervisory boards are shown on pages 76 to 78.
Compensation for the Board of Executive Directors and Supervisory
Board
Million € 2005 2004
Board of Executive Directors’ compensation 15.3 14.0
Thereof fi xed payments 5.0 4.8
Thereof performance-related payments 10.3 9.2
Exercise of option rights by the Board of Executive Directors 1.4 0.6
Supervisory Board’s compensation 3.4 2.7
Thereof fi xed payments 0.5 0.5
Thereof performance-related payments 2.9 2.2
Total compensation of former members of the Board of Executive Directors
and their surviving dependents 5.8 6.0
Exercise of option rights by former members of the Board of Executive Directors
and their surviving dependents 2.9 1.3
Pension provisions for former members of the Board of Executive Directors
and their surviving dependents 77.7 69.9
Loans to members of the Board of Executive Directors and the Supervisory Board – –
Guarantees to members of the Board of Executive Directors and the Supervisory Board – –
Performance-related compensation for Board members is based on the return on assets which corresponds to earn-ings before taxes plus borrowing costs as a percentage of average assets. In 2005, the members of the Board of Executive Direc-tors were also granted 209,792 options under the BASF stock option program. Together with the options granted in previous years and the options already exercised, cur-rent and former members of the Board of Executive Direc-tors hold 618,456 options. In 2005, the issue of options resulted in additional personnel costs totaling €6.3 million. Of this amount, €1.4 million was related to options issued in 2005, and €4.9 million to options issued between 1999 and 2004, which result in personnel costs over the vesting period.

BASF Group Consolidated Financial Statements and Notes
Additions in 2005 primarily related to the acquisition of the electronic chemicals business of Merck KGaA, Darmstadt, Germany, and the Swiss fi ne chemicals company Orgamol S.A.
Write-downs of €30.4 million in 2005 primarily concerned customer lists. There were no material write-ups. Concessions for oil and gas production of €59.8 million purchased by companies in the Oil & Gas segment were included under “other rights and values.” The oil and gas concessions allow the production of oil and gas in certain locations and involve obligations to deliver a small portion of the amounts produced to local companies. The rights to produce oil and gas expire at the end of the license period. The emission rights granted without charge were capitalized in the line “transfer” as “other rights and values.” Their book value on the balance sheet date equates to the acquisition costs of €52.2 million.
Developments 2005
Million €
Marketing,
supply and
similar rights
Product
rights,
licenses and
trademarks
Know-how,
patents and
production
technology
Goodwill Internally
generated
intangible
assets
Other rights
and values*
Total
Acquisition costs
Balance as of January 1, 2005 708.0 727.3 928.0 1,972.4 272.1 693.4 5,301.2
Changes in scope of
consolidation – – 0.8 2.2 – 2.7 5.7
Additions 56.7 15.6 63.6 136.6 22.6 40.1 335.2
Disposals 223.6 38.8 28.7 92.6 30.5 72.5 486.7
Transfers (0.4) (3.5) 15.9 (44.9) 0.4 88.2 55.7
Exchange differences 7.6 22.7 16.1 164.8 8.0 55.4 274.6
Balance as of December 31,
2005 548.3 723.3 995.7 2,138.5 272.6 807.3 5,485.7
Amortization
Balance as of January 1, 2005 407.9 261.1 579.8 – 143.8 302.0 1,694.6
Changes in scope of
consolidation – – 0.6 – – 0.7 1.3
Additions 70.0 60.3 83.9 – 61.7 92.4 368.3
Disposals 220.5 9.7 19.5 – 30.0 69.6 349.3
Transfers 0.2 . (0.1) – . (0.6) (0.5)
Exchange differences 2.8 11.0 7.5 – 3.5 26.9 51.7
Balance as of December 31,
2005 260.4 322.7 652.2 – 179.0 351.8 1766.1
Net book value as of
December 31, 2005 287.9 400.6 343.5 2,138.5 93.6 455.5 3,719.6
* Including licenses on such rights and values
14. Intangible assets

126 | 127
Additions in 2004 relate to the acquisition of the polyurethane foams business from Foam Enterprises, Inc., United States. There were no signifi cant write-downs in 2004. There were no material write-ups.
Developments 2004
Million €
Marketing,
supply and
similar rights
Product
rights,
licenses and
trademarks
Know-how,
patents and
production
technology
Goodwill Internally
generated
intangible
assets
Other rights
and values*
Total
Acquisition costs
Balance as of January 1, 2004 672.5 728.3 916.3 2,038.3 282.0 714.5 5,351.9
Changes in scope of
consolidation 35.0 3.5 3.1 1.2 – 1.6 44.4
Additions 22.1 13.3 11.9 16.6 30.5 46.2 140.6
Disposals 16.5 8.2 50.8 9.2 38.2 51.9 174.8
Transfers (5.6) 1.7 53.1 (1.9) – 16.8 64.1
Exchange differences 0.5 (11.3) (5.6) (72.6) (2.2) (33.8) (125.0)
Balance as of December 31,
2004 708.0 727.3 928.0 1,972.4 272.1 693.4 5,301.2
Amortization
Balance as of January 1, 2004 300.1 175.5 532.9 – 99.9 268.2 1,376.6
Changes in scope of
consolidation – – 1.7 – – 1.0 2.7
Additions 92.7 71.6 88.2 – 78.6 108.3 439.4
Disposals 8.5 9.5 55.2 – 32.8 49.0 155.0
Transfers 23.7 28.9 14.2 – – (10.4) 56.4
Exchange differences (0.1) (5.4) (2.0) – (1.9) (16.1) (25.5)
Balance as of December 31,
2004 407.9 261.1 579.8 – 143.8 302.0 1,694.6
Net book value as of
December 31, 2004 300.1 466.2 348.2 1,972.4 128.3 391.4 3,606.6
* Including licenses on such rights and values

BASF Group Consolidated Financial Statements and Notes
Additions in 2005 are explained in detail in the Management’s Analysis under “Liquidity and Capital Resources” on page 32. Write-downs of €76.5 million in 2005 primarily relate to restructuring measures in the Intermediates division in Asia. There were no material write-ups.
Developments 2005
Million €
Land, land rights
and buildings
Machinery
and technical
equipment
Miscellaneous
equipment and
fi xtures
Advance
payments and
construction in
progress
Total
Acquisition costs
Balance as of January 1, 2005 6,475.2 30,238.9 2,596.1 2,132.0 41,442.2
Change in scope of consolidation 8.1 16.3 6.5 5.8 36.7
Additions 234.8 742.8 94.5 1115.7 2,187.8
Disposals 134.9 581.6 165.8 8.3 890.6
Transfers 240.1 1,831.1 54.4 (2,095.9) 29.7
Exchange differences 274.7 1,285.9 102.9 152.9 1,816.4
Balance as of December 31, 2005 7,098.0 33,533.4 2,688.6 1,302.2 44,622.2
Depreciation
Balance as of January 1, 2005 3,972.5 22,216.5 2,170.8 19.7 28,379.5
Change in scope of consolidation 1.0 5.2 3.8 – 10.0
Additions 198.0 1,674.0 154.9 8.0 2,034.9
Disposals 90.5 521.1 152.9 3.1 767.6
Transfers 42.5 (3.4) 4.2 0.8 44.1
Exchange differences 119.0 732.0 83.4 – 934.4
Balance as of December 31, 2005 4,242.5 24,103.2 2,264.2 25.4 30,635.3
Net book value as of December 31, 2005 2,855.5 9,430.2 424.4 1,276.8 13,986.9
15. Property, plant and equipment

128 | 129
Additions in 2004 primarily concern the construction of our Verbund site in Nanjing, China. Write-downs of €111.9 million in 2004 primarily relate to European sites of the Chemicals segment as well as restructuring measures in North America (NAFTA).
Developments 2004
Million €
Land, land rights
and buildings
Machinery
and technical
equipment
Miscellaneous
equipment and
fi xtures
Advance
payments and
construction in
progress
Total
Acquisition costs
Balance as of January 1, 2004 6,567.2 29,775.6 2,762.1 2,173.7 41,278.6
Change in scope of consolidation 26.3 92.7 11.2 22.8 153.0
Additions 55.0 490.1 85.3 1,391.7 2,022.1
Disposals 227.7 692.5 197.4 32.8 1,150.4
Transfers 142.0 1,093.4 3.4 (1,417.5) (178.7)
Exchange differences (87.6) (520.4) (68.5) (5.9) (682.4)
Balance as of December 31, 2004 6,475.2 30,238.9 2,596.1 2,132.0 41,442.2
Depreciation
Balance as of January 1, 2004 3,927.8 21,398.8 2,224.9 4.4 27,555.9
Change in scope of consolidation 8.6 77.9 9.2 – 95.7
Additions 251.6 1,600.9 184.9 15.4 2,052.8
Disposals 172.3 580.0 177.5 0.2 930.0
Transfers (0.9) 8.0 (21.0) 0.1 (13.8)
Exchange differences (42.3) (289.1) (49.7) – (381.1)
Balance as of December 31, 2004 3,972.5 22,216.5 2,170.8 19.7 28,379.5
Net book value as of December 31, 2004 2,502.7 8,022.4 425.3 2,112.3 13,062.7

BASF Group Consolidated Financial Statements and Notes
Developments 2005
Million €
Investments
accounted for
using the equity
method
Investments
in
affi liated
companies
Investments in
associated
companies
Shares in
other
participations
Long-term
securities
Acquisition cost carried forward
Balance as of January 1, 2005 1,654.5 272.0 86.5 425.7 12.1
Change in scope of consolidation (9.3) (11.8) (7.0) – –
Additions 16.4 24.5 12.8 3.7 0.1
Disposals 1,352.1 39.3 0.4 58.8 6.0
Transfers (9.8) 9.7 (10.6) 52.7 0.5
Exchange differences – 1.0 1.8 1.1 –
Balance as of December 31, 2005 299.7 256.1 83.1 424.4 6.7
Depreciation
Balance as of January 1, 2005 554.0 100.0 30.8 20.3 1.4
Change in scope of consolidation – 0.4 – – –
Additions – 3.4 4.1 8.3 –
Disposals 498.6 10.5 – – –
Transfers – 10.2 (10.6) – (0.3)
Exchange differences – 0.4 – – –
Balance as of December 21, 2005 55.4 103.9 24.3 28.6 1.1
Net book value as of December 31, 2005 244.3 152.2 58.8 395.8 5.6
16. Investments accounted for using the equity method and other fi nancial assets
Developments 2005
Million €
Loans to
affi liated
companies
Loans to
associated
companies and
participating
interests
Other loans and
investments
Other fi nancial
assets
Investments
accounted for
using the equity
method and
other fi nancial
assets
Acquisition cost carried forward
Balance as of January 1, 2005 196.3 102.1 65.6 1160.3 2,814.8
Changes in scope of consolidation – – – (18.8) (28.1)
Additions 5.3 51.6 11.3 109.3 125.7
Disposals 6.9 21.1 5.5 138.0 1,490.1
Transfers (55.8) (7.2) (20.0) (30.7) (40.5)
Exchange differences 0.7 14.7 4.4 23.7 23.7
Balance as of December 31, 2005 139.6 140.1 55.8 1105.8 1,405.5
Depreciation
Balance as of January 1, 2005 65.5 – 4.2 222.2 776.2
Changes in scope of consolidation – – – 0.4 0.4
Additions 4.8 2.1 0.7 23.4 23.4
Disposals (60.9) – 0.2 (50.2) 448.4
Transfers (3.7) – 0.6 (3.8) (3.8)
Exchange differences – – – 0.4 0.4
Balance as of December 31, 2005 127.5 2.1 5.3 292.8 348.2
Net book value as of December 31, 2005 12.1 138.0 50.5 813.0 1,057.3

130 | 131
Developments 2004
Million €
Investments
accounted for
using the equity
method
Investments
in
affi liated
companies
Investments in
associated
companies
Shares in
other
participations
Long-term
securities
Acquisition cost carried forward
Balance as January 1, 2004 1,698.7 357.5 75.2 335.3 14.4
Change in scope of consolidation (21.3) (30.2) – 7.8 –
Additions 9.5 7.7 19.2 2.7 1.2
Disposals 72.0 61.8 – 0.2 3.4
Transfers 39.7 (0.7) (6.6) 80.7 (0.1)
Exchange differences (0.1) (0.5) (1.3) (0.6) –
Balance as of December 31, 2004 1,654.5 272.0 86.5 425.7 12.1
Depreciation
Balance as of January 1, 2004 – 89.7 19.0 0.1 1.9
Change in scope of consolidation – 0.2 – – –
Additions 554.0 28.6 11.8 20.2 –
Disposals – 10.7 – – –
Transfers – (7.6) – – (0.5)
Exchange differences – (0.2) – – –
Balance as of December 31, 2004 554.0 100.0 30.8 20.3 1.4
Net book value as of December 31, 2004 1,100.5 172.0 55.7 405.4 10.7
Developments 2004
Million €
Loans to
affi liated
companies
Loans to
associated
companies and
participating
interests
Other loans and
investments
Other
fi nancial assets
Investments
accounted for
using the equity
method and
other fi nancial
assets
Acquisition cost carried forward
Balance as of January 1, 2004 127.9 117.0 65.2 1092.5 2,791.2
Changes in scope of consolidation (8.3) – – (30.7) (52.0)
Additions 77.3 13.3 13.1 134.5 144.0
Disposals 1.0 – – 66.4 138.4
Transfers 0.6 (23.2) (14.5) 36.2 75.9
Exchange differences (0.2) (5.0) 1.8 (5.8) (5.9)
Balance as of December 31, 2004 196.3 102.1 65.6 1160.3 2,814.8
Depreciation
Balance as of January 1, 2004 29.8 – 3.9 144.4 144.4
Changes in scope of consolidation 42.8 – – 43 43
Additions 11.0 – 0.7 72.3 626.3
Disposals – – – 10.7 10.7
Transfers (18.1) – (0.3) (26.5) (26.5)
Exchange differences – – (0.1) (0.3) (0.3)
Balance as of December 31, 2004 65.5 – 4.2 222.2 776.2
Net book value as of December 31, 2004 130.8 102.1 61.4 938.1 2,038.6
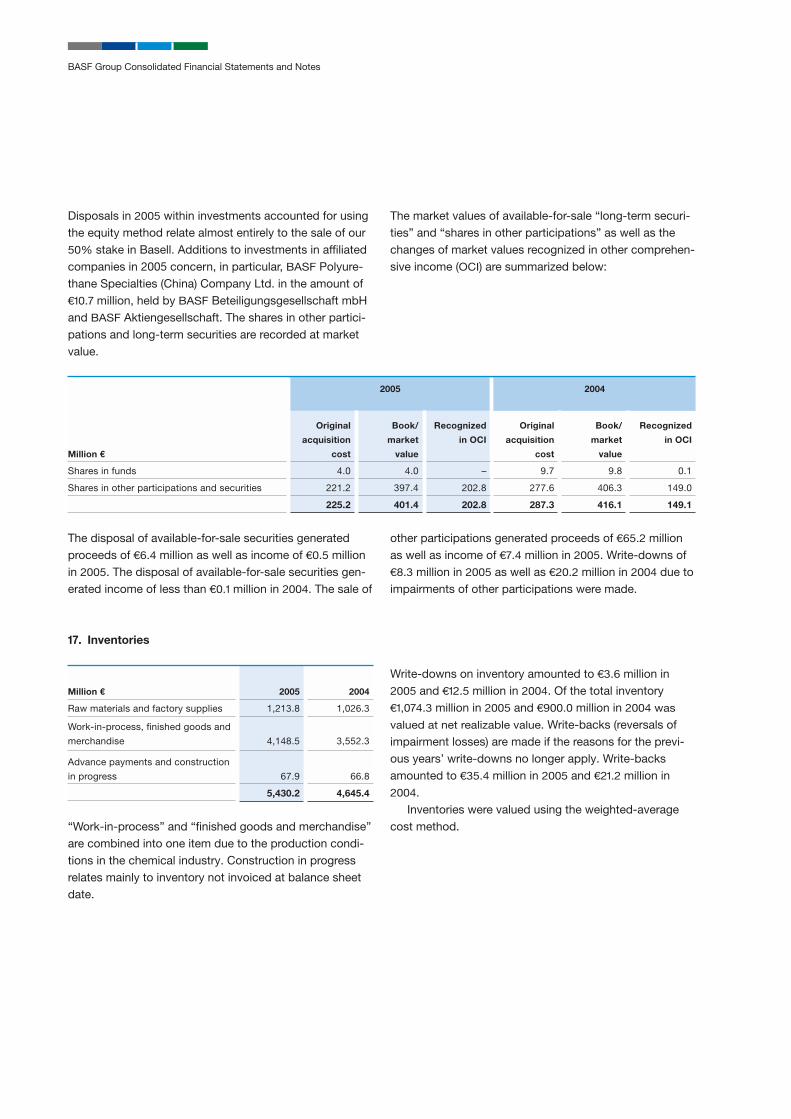
BASF Group Consolidated Financial Statements and Notes
Disposals in 2005 within investments accounted for using the equity method relate almost entirely to the sale of our 50% stake in Basell. Additions to investments in affi liated companies in 2005 concern, in particular, BASF Polyure-thane Specialties (China) Company Ltd. in the amount of €10.7 million, held by BASF Beteiligungsgesellschaft mbH and BASF Aktiengesellschaft. The shares in other partici-pations and long-term securities are recorded at market value.
The market values of available-for-sale “long-term securi-ties” and “shares in other participations” as well as the changes of market values recognized in other comprehen-sive income (OCI) are summarized below:
2005 2004
Million €
Original
acquisition
cost
Book/
market
value
Recognized
in OCI
Original
acquisition
cost
Book/
market
value
Recognized
in OCI
Shares in funds 4.0 4.0 – 9.7 9.8 0.1
Shares in other participations and securities 221.2 397.4 202.8 277.6 406.3 149.0
225.2 401.4 202.8 287.3 416.1 149.1
The disposal of available-for-sale securities generated proceeds of €6.4 million as well as income of €0.5 million in 2005. The disposal of available-for-sale securities gen-erated income of less than €0.1 million in 2004. The sale of
17. Inventories
Million € 2005 2004
Raw materials and factory supplies 1,213.8 1,026.3
Work-in-process, fi nished goods and
merchandise 4,148.5 3,552.3
Advance payments and construction
in progress 67.9 66.8
5,430.2 4,645.4
“Work-in-process” and “fi nished goods and merchandise” are combined into one item due to the production condi-tions in the chemical industry. Construction in progress relates mainly to inventory not invoiced at balance sheet date.
other participations generated proceeds of €65.2 million as well as income of €7.4 million in 2005. Write-downs of €8.3 million in 2005 as well as €20.2 million in 2004 due to impairments of other participations were made.
Write-downs on inventory amounted to €3.6 million in 2005 and €12.5 million in 2004. Of the total inventory €1,074.3 million in 2005 and €900.0 million in 2004 was
valued at net realizable value. Write-backs (reversals of impairment losses) are made if the reasons for the previ-ous years’ write-downs no longer apply. Write-backs amounted to €35.4 million in 2005 and €21.2 million in 2004. Inventories were valued using the weighted-average cost method.

132 | 133
Prepaid expenses include pre-payments for operating expenses of €32.9 million in 2005 and €29.3 million in 2004 as well as pre-payments for insurance premiums of €28.0 million in 2005 and €23.2 million in 2004.
2005 2004
Million €
Thereof
short-term
Thereof
short-term
Receivables from affi liated companies 383.8 383.8 286.0 286.0
Prepaid expenses 136.1 123.0 150.0 132.2
Defi ned benefi t assets 288.3 – 185.5 –
Miscellaneous receivables and other assets 1,302.2 1,079.6 1,984.8 1,714.6
Thereof:
Receivables from associated companies and other
participating interests 55.7 52.1 73.3 73.2
Other assets 1,246.5 1,027.5 1,911.5 1,641.4
2,110.4 1,586.4 2,606.3 2,132.8
18. Other receivables and other assets
Composition of other assets
Million € 2005 2004
Tax refund claims 276.7 244.1
Loans and interest receivables 134.0 187.6
Deferrals from fi nancial derivatives 296.6 935.0
Employee receivables 31.7 36.6
Rents and deposits 55.7 44.7
Insurance claims 12.4 2.9
Receivables from joint venture partners 129.8 36.3
Other 309.6 424.3
1,246.5 1,911.5
Deferrals from fi nancial derivatives decreased primarily due to an increase in exchange rates of the relevant currencies. Prepaid expenses amounted to €3.9 million in 2005 and €5.2 million in 2004.
Valuation allowances for doubtful
accounts
Million €
As of
January 1,
2005
Additions
affecting
income
Releases
affecting
income
Additions
not affecting
income
Releases
not affecting
income
Balance as of
December 31,
2005
Accounts receivable, trade 336.3 86.2 87.5 38.4 17.6 355.8
Other assets 33.0 16.7 4.6 8.0 6.6 46.5
369.3 102.9 92.1 46.4 24.2 402.3
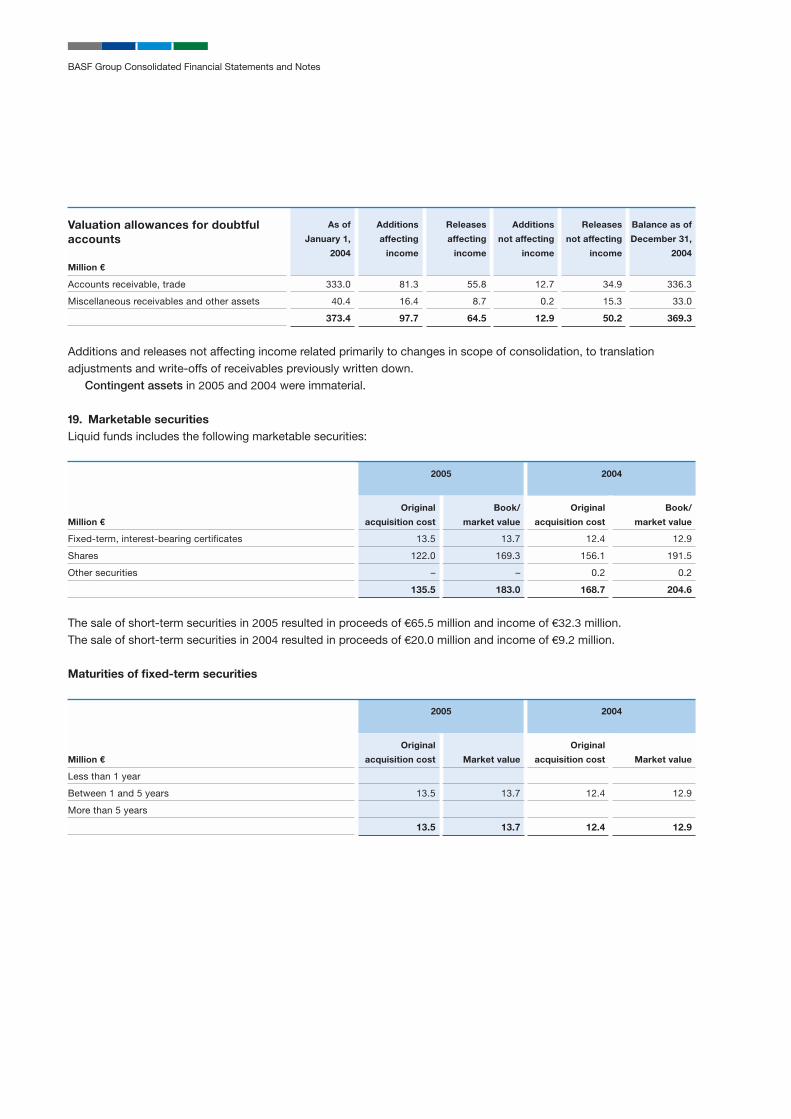
BASF Group Consolidated Financial Statements and Notes
Additions and releases not affecting income related primarily to changes in scope of consolidation, to translation adjustments and write-offs of receivables previously written down. Contingent assets in 2005 and 2004 were immaterial.
Valuation allowances for doubtful
accounts
Million €
As of
January 1,
2004
Additions
affecting
income
Releases
affecting
income
Additions
not affecting
income
Releases
not affecting
income
Balance as of
December 31,
2004
Accounts receivable, trade 333.0 81.3 55.8 12.7 34.9 336.3
Miscellaneous receivables and other assets 40.4 16.4 8.7 0.2 15.3 33.0
373.4 97.7 64.5 12.9 50.2 369.3
2005 2004
Million €
Original
acquisition cost
Book/
market value
Original
acquisition cost
Book/
market value
Fixed-term, interest-bearing certifi cates 13.5 13.7 12.4 12.9
Shares 122.0 169.3 156.1 191.5
Other securities – – 0.2 0.2
135.5 183.0 168.7 204.6
19. Marketable securities
Liquid funds includes the following marketable securities:
The sale of short-term securities in 2005 resulted in proceeds of €65.5 million and income of €32.3 million. The sale of short-term securities in 2004 resulted in proceeds of €20.0 million and income of €9.2 million.
Maturities of fi xed-term securities
2005 2004
Million €
Original
acquisition cost Market value
Original
acquisition cost Market value
Less than 1 year
Between 1 and 5 years 13.5 13.7 12.4 12.9
More than 5 years
13.5 13.7 12.4 12.9

134 | 135
Share repurchase
The Board of Executive Directors received approval at the Annual Meeting on April 28, 2005, to repurchase BASF’s shares to a maximum amount of 10% of subscribed capi-tal by October 27, 2006. The shares shall be purchased on the stock exchange or through a public purchase offer ad-dressed to all shareholders. If BASF shares are purchased on a stock exchange, the price paid for the shares may not be higher than the highest market price on the buying day and may not be lower than 25% of that market price. In the case of a public purchase offer, the price offered by BASF may be a maximum of 10% higher than the highest market price on the third trading day prior to the publish-ing of the public purchase offer. This authorization super-sedes the validity of the prior authorization to repurchase BASF shares granted by the Annual Meeting on April 29,
2004. In addition, the Board of Executive Directors has been authorized at the Annual Meeting on April 28, 2005 to pur-chase shares through the use of put and call options. The price paid for options purchased may not exceed the the-oretical value calculated with recognized fi nancial models using the same assumptions, such as strike price, as the options themselves, while the price received for options sold may not fall beneath this value.
In 2005, a total of 26,062,229 shares, or 4.8% of the issued shares, were acquired. The average purchase price was €55.05 per share. A total of 26,182,229 shares were cancelled by December 31, 2005. Thereof were included 800,000 shares that were acquired in 2004. As of the bal-ance sheet date, 680,000 shares of BASF stock were held by BASF. These were acquired for the purpose of cancel-lation. Therefore, these shares were not capitalized, but rather the subscribed capital is shown net of these shares at December 31, 2005. During 2004, 16,203,000 shares, or 2.9% of the issued shares, were acquired. The average purchase price was €44.79 per share. These were can-celled in 2004 and 2005.
Conditional capital
Of the conditioned capital, €384.0 million serves to fulfi ll the exercising of warrants related to option bonds. The Board of Executive Directors was authorized at the Annual Meeting on April 26, 2001, to do so until April 1, 2006. An additional €27.4 million is reserved to fulfi ll stock op-tions granted under the BASF Stock Option Program (BOP) 2001/2005 to the members of the Board of Execu-tive Directors and other senior executives of BASF and its subsidiaries; up to €0.3 million is reserved to fulfi ll stock options from the Stock Option Program /2000.
20. Capital and reserves
Conditional capital Authorized capital
Million € 2005 2004 2005 2004
January 1 424.0 425.3 500.0 500.0
Conditional capital for the stock option program BOP 1999/2000 and the BOP
2001/2005, decrease due to exercise and experation of option rights (12.3) (1.3)
Cancellation of the prior authorization at the annual meeting on April 29, 2004 (500.0)
Increase due to authorization for the issuance of new shares against cash or
contributions in kind at the annual meeting on April 29, 2004 500.0
December 31 411.7 424.0 500.0 500.0
Subscribed capital
Million €
Outstanding
shares
Subscribed
capital
Capital
reserves
Outstanding shares as of December 31, 2005 515,059,000 1,318.5 3,100.2
Repurchased shares intended to be cancelled (680,000) (1.7) –
Outstanding shares as disclosed in the fi nancial statements 514,379,000 1,316.8 3,100.2

BASF Group Consolidated Financial Statements and Notes
21. Retained earnings and other comprehensive
income
Authorized capital
At the Annual Meeting of April 29, 2004, shareholders authorized the Board of Executive Directors, with the approval of the Supervisory Board, to increase subscribed capital by issuing new shares in an amount of up to €500.0 million against cash or contribution in kind through May 1, 2009. The Board of Executive Directors is empow-ered to decide on the exclusion of shareholders’ subscrip-tion rights, for these new shares.
Capital surplus
Capital surplus includes premiums from the issuance of shares, the fair value of warrants attached to option bonds and negative goodwill from the capital consolidation resulting from acquisitions of subsidiaries in exchange for issue of BASF shares at par value.
The changes in scope of consolidation did not lead to a change in the legal reserves in 2005 but led to a reduction of less than €0.1 million in 2004. Transfers from “other re-tained earnings and profi t retained” increased legal re-serves by €33.1 million in 2005, €15.5 million in 2004. The offsetting of actuarial gains and losses resulted in a reduc-tion of retained earnings by €659.9 in 2005 and €233.9 in 2004.
Other comprehensive income
Certain expenses and income have been recorded according to IFRS outside of the income statement. Included among these are translation adjustments, valua-tion of securities at fair value and changes in the fair value of derivatives held to hedge future cash fl ows.
Million € 2005 2004
Legal reserves 291.7 258.6
Other retained earnings and profi t
retained 11,636.3 11,664.5
Retained earnings 11,928.0 11,923.1
Translation adjustments
The difference between the historical exchange rate at the time of acquisition and the rate used to translate the equity of a company as of the balance sheet date is recorded directly in equity and only fl ows through the income statement upon the disposal of a company.
Cash fl ow hedges
In 2005, the acquisition costs of inventories were reduced by €17.4 million through cashfl ow hedges. The entry af-fecting the income statement related to interest expenses. The total ineffective portion of all fair value changes of derivatives in 2005 affecting the income statement amounted to €3.9 million.
Valuation of securities at fair value
Changes in value of available-for-sale securities are accounted for in equity, without impacting the income statement, until the securities are disposed of. Upon dis-posal, the changes accumulated in equity are accounted for in the income statement.

136 | 137
22. Minority interests
Company Partner 2005
Equity stake
(%)
2005
Million €
2004
Equity stake
(%)
2004
Million €
WINGAS GmbH,
Kassel, Germany
Gazprom-Group,
Moscow, Russia 35.0 81.4 35.0 88.1
Yangzi-BASF Styrenics Co. Ltd.,
Nanjing, China
Yangzi Petrochemical
Corp. Ltd., Nanjing, China 40.0 45.3 40.0 49.5
BASF India Ltd.,
Mumbai, India
Publicly traded shares
47.3 28.4 47.3 23.7
BASF PETRONAS Chemicals Sdn.
Bhd., Petaling Jaya, Malaysia
PETRONAS (Petroliam
Nasional Bhd.),
Kuala Lumpur, Malaysia 40.0 117.2 40.0 97.3
BASF SONATRACH PropanChem S.A.,
Tarragona, Spain
SONATRACH, Algiers, Algeria
49.0 36.9 49.0 20.6
BASF FINA Petrochemicals Ltd.,
Port Arthur, Texas
Total Petrochemicals Inc.,
Houston,Texas 40.0 124.4 40.0 18.1
Other 48.2 31.2
481.8 328.5
23. Provisions for pensions and similar obligations
In addition to government pension schemes, most em-ployees are entitled to Company pension benefi ts from either defi ned contribution or defi ned benefi t plans or both. Benefi ts generally depend on years of service, con-tribution or compensation and consider the legal, fi scal and economic conditions of the countries where compa-nies are located. To control the risks of changing condi-tions in the capital markets, as well the increasing life-ex-pectancies, employees will be increasingly offered defi ned contribution plans in the future. For BASF Aktiengesellschaft and other German sub-sidiaries, a basic level of benefi ts is provided by the legally independent funded plan, BASF Pensionskasse VVaG, which is fi nanced by contributions of employees and the Company and the returns on its assets. Mid-2004, the defi ned benefi t plan of BASF Pensionskasse VVaG, was closed, and a new defi ned contribution plan was intro-duced. To fulfi ll legal solvency obligations (Section 53c VAG), a contribution of €135.5 million was made to the eq-uity of the BASF Pensionskasse in 2005, which did not fl ow through the income statement.
Additional employee pension commitments at German Group companies were previously fi nanced almost exclu-sively via pension provisions. In December 2005, BASF established a Contractual Trust Arrangement (CTA), “BASF Pensionstreuhand e.V.,” and contributed liquid funds of €3,660 million to fi nance employee pension commitments of BASF Aktien-gesellschaft. The funds are administered by this trustee and serve exclusively to fi nance the pen-sion obligations of BASF Aktiengesellschaft. Since the contributed funds are classifi ed as plan assets according to IAS 19, they are netted against existing pension provi-sions. In the case of non-German subsidiaries, pension enti-tlements are covered in some cases by pension provi-sions, but mainly by external insurance companies or pension funds. The measurement date for most of the pension plans is December 31 of the reporting period. The most recent actuarial mortality tables are used. The valuation using the projected unit credit method per IAS 19 was carried out under the following assumptions:

BASF Group Consolidated Financial Statements and Notes
Assumptions used to determine expenses for
pension benefi t (weighted average)
Germany
in %
Foreign
in %
2005 2004 2005 2004
Interest rate 5.25 5.75 5.58 5.93
Projected increase of wages and salaries 2.50 2.50 3.80 3.88
Projected pension increase 1.50 1.50 0.51 0.60
Expected return on plan assets 5.16 6.25 8.21 8.39
Assumptions used to determine the defi ned benefi t
obligation (weighted average)
Germany
in %
Foreign
in %
(in %) 2005 (in %) 2004 (in %) 2005 (in %) 2004
Interest rate 4.25 5.25 5.18 5.58
Projected increase of wages and salaries 2.50 2.50 4.55 3.80
Projected pension increase 1.50 1.50 0.51 0.51
Similar obligations refer to commitments by BASF’s North American Group companies to provide for the costs of medical and life insurance benefi ts for employees and eli-gible dependents after retirement. They are based upon an actuarial valuation, considering the future cost trend and a discount rate of 5.5%. The assumptions regarding the overall expected long-term rate of return are based on forecasts of expected individual asset class returns and the desired portfolio structure. The forecasts are based on long-term historical average returns and take the current yield level and the in-fl ation trend into consideration. Due to yet lower interest rates and the expectations of lower future infl ation rates, the long-term expected return on debt securities has been lowered, compared with the prior year.
The portfolio structure of the pension plan assets is as follows:
Plan asset portfolio
structureAverage
target
allocation
(in %)
2006
Plan assets
%
2005 2004
Equities 36 31 45
Debt securities 55 30 48
Real estate 6 3 5
Other 3 36 2
100 100 100
The high percentage of assets under “other” in 2005 is due to the inclusion of BASF Pensionstreuhand e.V. for the fi rst time. Funds contributed in December 2005 were fi rst placed in cash, and will be invested according to the target allocation in 2006. The target asset allocation has been defi ned using as-set liability studies and is reviewed regularly. This ensures that plan assets are aligned with plan liabilities. The cur-rent portfolio structure is generally oriented towards the target asset allocation. In addition, current market views are taken into consideration. In order to mitigate invest-ment risks and to benefi t from a large number of return sources, individual investments are globally diversifi ed.

138 | 139
Development of the defi ned benefi t obligation
Million € 2005 2004
Defi ned benefi t obligation as of January 1 9,814.1 9,220.3
Service cost 192.7 185.9
Interest cost 527.4 528.6
Benefi ts paid (566.0) (589.2)
Participants’ contributions 39.3 40.5
Change in actuarial assumptions 1,530.4 521.2
Settlements and other changes 77.2 30.5
Exchange rate changes 292.4 (123.7)
Defi ned benefi t obligation as of December 31 11,907.5 9,814.1
The pension funds held securities issued by BASF Group companies, whose total market value amounted to €13.4 million on December 31, 2005 (2004: €8.6 million). The market value of rental properties held by BASF pen-sion funds rented to BASF Group companies amounted to
€43.8 million as of December 31, 2005 (2004: €43.8 mil-lion). No material transactions took place between the pension funds and BASF group companies, or related companies in 2005 and in 2004. The pension provisions were as follows:
Development of plan assets
Million € 2005 2004
Plan assets as of January 1 6,204.3 5,952.4
Expected return on plan assets 421.7 409.6
Difference between expected and actual returns 438.4 192.8
Employer contributions 244.5 99.8
One-time contribution to fund the CTA by BASF AG 3,660.0 –
Participants‘ contributions 39.3 40.5
Benefi ts paid (336.2) (344.6)
Exchange rate changes 254.2 (110.7)
Other changes 89.0 (35.5)
Plan assets as of December 31 11,015.2 6,204.3
Reconciliation of the defi ned benefi t obligation to the pension provisions
Million € 2005 2004
Defi ned benefi t obligation as of December 31 11,907.5 9,814.1
Less plan assets as of December 31 11,015.2 6,204.3
Funded status 892.3 3,609.8
Unrecognized past service cost (2.7) (3.5)
Asset ceiling in accordance with IAS 19.58 1.9 –
Capitalized defi ned benefi t asset 288.3 185.5
Provisions for pensions 1,179.8 3,791.8
Provisions for similar obligations 366.8 332.3
Provisions for pensions and similar obligations 1,546.6 4,124.1

BASF Group Consolidated Financial Statements and Notes
Actuarial gains and losses are charged directly against retained earnings in the reporting period they occur. Ex-penses from past service costs are amortized over the average service period of the entitled employees until the benefi ts become vested.
€1,075.9 million and €364.5 million in actuarial losses were charged outside of income and profi t to retained earnings in 2005 and 2004 respectively. Since the introduction of this accounting policy, a total of €1,440.4 million has been charged against retained earnings, not taking deferred taxes into account.
The current funding situation of the defi ned benefi t obligation is disclosed in the following table:
Current funding situation2005 2004
Million € DBO Plan assets DBO Plan assets
Unfunded pension plans 606.3 – 3,638.5 –
Partially funded pension plans 7,299.2 6,758.5 1,853.0 1,687.7
Total of pension plans that are not fully funded 7,905.5 6,758.5 5,491.5 1,687.7
Fully funded pension plans 4,002.0 4,256.7 4,322.6 4,516.6
11,907.5 11,015.2 9,814.1 6,204.3
Due to rising DBOs, the pension liabilities exceeded plan assets for the fi rst time in 2005 for several pension plans leading to their inclusion in the partially funded plan category.
The following overview shows the differences between the actuarial assumptions and the actual development relating to the DBO and the plan assets.
Differences between actuarial assumptions and the actual development
Million € 2005 2004
Defi ned benefi t obligation 11,907.5 9,814.1
Thereof impact of experience adjustments 19.5 22.6
Plan assets 11,015.2 6,204.3
Thereof impact of experience adjustments 438.4 192.8
Funded status 892.3 3,609.8
Payments arising from pension obligations existing as of December 31, 2005 are due as follows:
Expected payments resulting from pension obligations existing as of December 31, 2005
Million €
2006 570.1
2007 586.0
2008 591.6
2009 602.9
2010 633.3
2011 through 2015 3,362.3

140 | 141
The estimated contribution payments for defi ned benefi t plans for 2006 are €119.6 million. In addition, contributions to public pension plans amounted to €317.7 million in 2005 and €307.6 million in 2004.
Composition of expenses for pension benefi ts
Million € 2005 2004
Service cost 192.7 185.9
Amortization of past service cost 1.9 6.0
Settlement gains/losses (3.6) (10.2)
Expenses for similar obligations 0.1 .
Expenses for defi ned benefi t plans charged to income from operations 191.1 181.7
Interest cost 527.4 528.6
Expected return on plan assets (421.7) (409.6)
Expenses for similar obligations 15.1 15.8
Expenses for defi ned benefi t plans charged to fi nancial result 120.8 134.8
Expenses for defi ned contribution plans 51.7 45.7
Expenses for pension benefi ts 363.6 362.2
2005 2004
Million € Total
Thereof short-
term Total
Thereof short-
term
Recultivation obligations 589.4 0.2 534.8 0.2
Environmental protection and remediation costs 252.9 63.8 203.9 38.8
Personnel costs 1,599.2 929.0 1,473.1 842.9
Sales and purchase risks 919.0 917.0 758.7 757.4
Integration, shutdown and restructuring costs 266.3 241.8 324.3 316.9
Legal, damage claims, guarantees and related commitments 446.9 238.3 425.6 141.0
Other 1,480.0 372.4 1,019.4 266.9
5,553.7 2,762.5 4,739.8 2,364.1
24. Other provisions
Recultivation obligations concern estimated costs for the fi lling of wells and the removal of production equipment after the end of production. Environmental protection and remediation costs con-cern expected costs for rehabilitating contaminated sites, recultivating landfi lls, removal of environmental contami-nation at existing production or storage sites and other measures.
The personnel cost provision includes obligations to grant long-time service bonuses and anniversary pay-ments, variable compensation including related social security contributions and other accruals as well as provi-sions for early retirement and short-working programs for employees nearing retirement. Most German BASF com-panies have various programs that entitle employees who are at least 55 years old to reduce their working hours to 50% for up to six years.
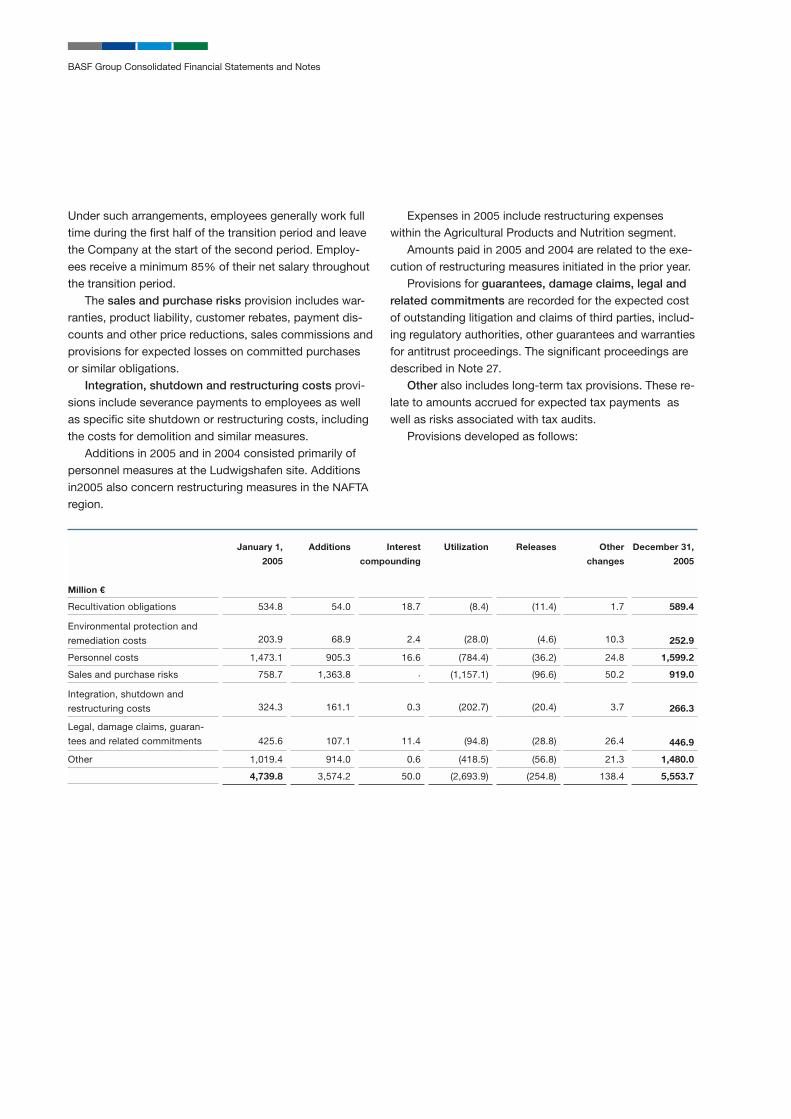
BASF Group Consolidated Financial Statements and Notes
Million €
January 1,
2005
Additions Interest
compounding
Utilization Releases Other
changes
December 31,
2005
Recultivation obligations 534.8 54.0 18.7 (8.4) (11.4) 1.7 589.4
Environmental protection and
remediation costs 203.9 68.9 2.4 (28.0) (4.6) 10.3 252.9
Personnel costs 1,473.1 905.3 16.6 (784.4) (36.2) 24.8 1,599.2
Sales and purchase risks 758.7 1,363.8 . (1,157.1) (96.6) 50.2 919.0
Integration, shutdown and
restructuring costs 324.3 161.1 0.3 (202.7) (20.4) 3.7 266.3
Legal, damage claims, guaran-
tees and related commitments 425.6 107.1 11.4 (94.8) (28.8) 26.4 446.9
Other 1,019.4 914.0 0.6 (418.5) (56.8) 21.3 1,480.0
4,739.8 3,574.2 50.0 (2,693.9) (254.8) 138.4 5,553.7
Under such arrangements, employees generally work full time during the fi rst half of the transition period and leave the Company at the start of the second period. Employ-ees receive a minimum 85% of their net salary throughout the transition period. The sales and purchase risks provision includes war-ranties, product liability, customer rebates, payment dis-counts and other price reductions, sales commissions and provisions for expected losses on committed purchases or similar obligations. Integration, shutdown and restructuring costs provi-sions include severance payments to employees as well as specifi c site shutdown or restructuring costs, including the costs for demolition and similar measures. Additions in 2005 and in 2004 consisted primarily of personnel measures at the Ludwigshafen site. Additions in2005 also concern restructuring measures in the NAFTA region.
Expenses in 2005 include restructuring expenses within the Agricultural Products and Nutrition segment. Amounts paid in 2005 and 2004 are related to the exe-cution of restructuring measures initiated in the prior year. Provisions for guarantees, damage claims, legal and related commitments are recorded for the expected cost of outstanding litigation and claims of third parties, includ-ing regulatory authorities, other guarantees and warranties for antitrust proceedings. The signifi cant proceedings are described in Note 27. Other also includes long-term tax provisions. These re-late to amounts accrued for expected tax payments as well as risks associated with tax audits. Provisions developed as follows:
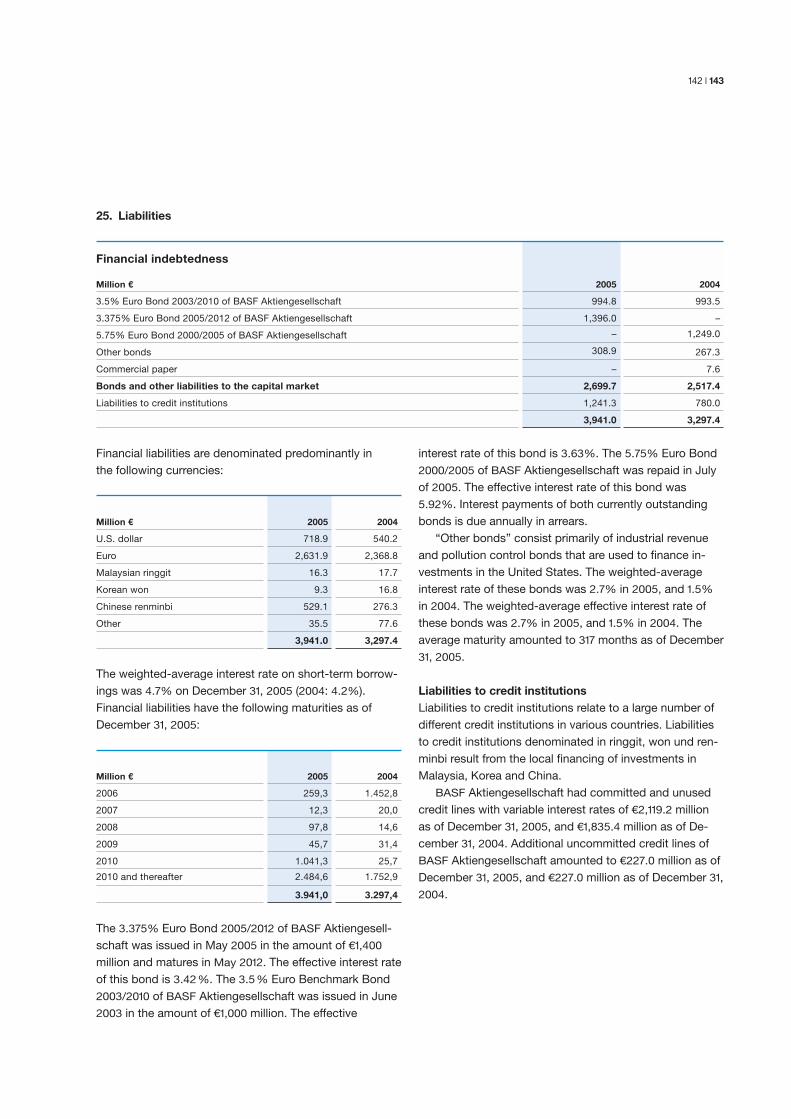
142 | 143
25. Liabilities
Financial indebtedness
Million € 2005 2004
3.5% Euro Bond 2003/2010 of BASF Aktiengesellschaft 994.8 993.5
3.375% Euro Bond 2005/2012 of BASF Aktiengesellschaft 1,396.0 –
5.75% Euro Bond 2000/2005 of BASF Aktiengesellschaft – 1,249.0
Other bonds 308.9 267.3
Commercial paper – 7.6
Bonds and other liabilities to the capital market 2,699.7 2,517.4
Liabilities to credit institutions 1,241.3 780.0
3,941.0 3,297.4
Financial liabilities are denominated predominantly in the following currencies:
The weighted-average interest rate on short-term borrow-ings was 4.7% on December 31, 2005 (2004: 4.2%). Financial liabilities have the following maturities as of December 31, 2005:
The 3.375% Euro Bond 2005/2012 of BASF Aktiengesell-schaft was issued in May 2005 in the amount of €1,400 million and matures in May 2012. The effective interest rate of this bond is 3.42 %. The 3.5 % Euro Benchmark Bond 2003/2010 of BASF Aktiengesellschaft was issued in June 2003 in the amount of €1,000 million. The effective
Million € 2005 2004
U.S. dollar 718.9 540.2
Euro 2,631.9 2,368.8
Malaysian ringgit 16.3 17.7
Korean won 9.3 16.8
Chinese renminbi 529.1 276.3
Other 35.5 77.6
3,941.0 3,297.4
interest rate of this bond is 3.63%. The 5.75% Euro Bond 2000/2005 of BASF Aktiengesellschaft was repaid in July of 2005. The effective interest rate of this bond was 5.92%. Interest payments of both currently outstanding bonds is due annually in arrears. “Other bonds” consist primarily of industrial revenue and pollution control bonds that are used to fi nance in-vestments in the United States. The weighted-average interest rate of these bonds was 2.7% in 2005, and 1.5% in 2004. The weighted-average effective interest rate of these bonds was 2.7% in 2005, and 1.5% in 2004. The average maturity amounted to 317 months as of December 31, 2005.
Liabilities to credit institutions
Liabilities to credit institutions relate to a large number of different credit institutions in various countries. Liabilities to credit institutions denominated in ringgit, won und ren-minbi result from the local fi nancing of investments in Malaysia, Korea and China. BASF Aktiengesellschaft had committed and unused credit lines with variable interest rates of €2,119.2 million as of December 31, 2005, and €1,835.4 million as of De-cember 31, 2004. Additional uncommitted credit lines of BASF Aktiengesellschaft amounted to €227.0 million as of December 31, 2005, and €227.0 million as of December 31, 2004.
Million € 2005 2004
2006 259,3 1.452,8
2007 12,3 20,0
2008 97,8 14,6
2009 45,7 31,4
2010 1.041,3 25,7
2010 and thereafter 2.484,6 1.752,9
3.941,0 3.297,4

BASF Group Consolidated Financial Statements and Notes
Other liabilities2005 2004
Million €
Thereof
short-term
Thereof
short-term
Advances received on account of orders 121.3 121.3 109.8 109.4
Liabilities on bills 47.5 45.0 70.1 70.1
Liabilities to companies in which participations are held 333.1 268.2 362.5 259.4
Liabilities relating to social security 174.1 174.0 155.0 155.0
Non-trade liabilities to joint venture partners 683.0 116.9 687.6 119.8
Liabilities arising from deferrals from fi nancial derivatives 185.4 154.0 83.7 70.3
Liabilities arising from fi nancing leases 117.5 15.9 24.6 6.9
Miscellaneous 814.6 717.0 876.0 736.2
Total 2,476.5 1,612.3 2,369.3 1,527.1
Deferred income 265.3 86.7 350.9 114.3
Other liabilities 2,741.8 1,699.0 2,720.2 1,641.4
Liabilities to companies in which participations are held include the portion of liabilities that are not eliminated to jointly owned companies accounted for using the proportional consolidation method of €80.0 million as of December 31, 2005, and €31.6 million as of December 31, 2004. Further liabilities relating to associated companies accounted for using the equity or cost method were €253.1 million as of December 31, 2005, and €330.9 million as of December 31, 2004.
Maturities of liabilities2005 2004
Million €
Less than
1 year
1-5 years
More than
5 years
Less than
1 year
1-5 years
More than
5 years
Bonds and other liabilities to the capital market – 1,009.0 1,690.7 1,256.5 2.5 1,258.4
Liabilities to credit institutions 259.3 188.0 794.0 196.6 82.6 501.1
Accounts payable, trade 2,777.0 - - 2,371.5 - –
Liabilities to affi liated companies 187.7 1.0 63.9 227.2 67.1 36.0
Advances received on account of orders 121.3 – – 109.4 0.4 –
Liabilities on bills 45.0 2.5 – 70.1 – –
Liabilities to associated companies 80.5 – – 32.2 – –
Miscellaneous liabilities 1,264.5 427.2 548.2 1,202.5 517.4 457.9
4,735.3 1,627.7 3,096.8 5,465.7 670.0 2,253.4
Leasing liabilities are detailed in Note 30.

144 | 145
Collateralized liabilities and contingent liabilities are shown below:
Secured liabilities and contingent liabilities
Million € 2005 2004
Liabilities to credit institutions 4.2 4.3
Other liabilities 7.1 7.3
Contingent liabilities – –
11.3 11.6
Certain liabilities are collateralized with mortgages or securities. In addition, BASF Aktiengesellschaft has given covenants in favor of BASF Pensionskasse VVaG with regard to adhering to certain balance sheet ratios and to forgo encumbering property as security for creditors.
26. Accounts payable and other fi nancial obligations
The contingencies listed below are stated at nominal value.
Contingent liabilities
Million € 2005 2004
Bills of exchange 8.9 10.3
Thereof to affi liated companies 0.3 0.2
Guarantees 330.8 248.2
Thereof to affi liated companies 50.6 7.8
Warranties 93.8 69.6
Granting collateral on behalf of third-party liabilities 12.7 13.0
446.2 341.1
Other fi nancial obligations
Million € 2005 2004
Remaining cost of construction in progress 1,927.8 1,700.7
Thereof purchase commitment 692.2 378.6
Thereof for the purchase of intangible assets 2.2 -
Obligation arising from long-term leases (excluding fi nancing leases) 827.4 812.4
Payment and loan commitments and other fi nancial obligations 92.4 15.9
2,847.6 2,529.0

BASF Group Consolidated Financial Statements and Notes
Obligations from long-term rental and lease contracts (not fi nancing leases) are due as follows:
Million €
2006 171.9
2007 137.6
2008 103.0
2009 83.5
2010 67.4
2011 and thereafter 264.0
827.4
Property, plant and equipment held under long-term leases primarily concern buildings and computer infra-structure. Leasing obligation are explained in detail in Note 30.
Purchase commitments for raw materials and natural
gas from long-term contracts
The Company has entered into long-term purchase con-tracts for natural gas, the vast majority of which are cou-pled with long-term supply contracts to customers. In addition, the Company purchases raw materials globally, both on the basis of long-term contracts and in spot mar-kets. In general, such commitments are at prices that are regularly adjusted to market conditions. The fi xed and de-terminable portions of long-term purchase contracts with a remaining term of more than one year as of December 31, 2005, are as follows:
Million €
2006 9,934.1
2007 6,316.0
2008 4,814.0
2009 4,193.4
2010 3,413.8
2011 and thereafter 32,245.3
60,916.6
27. Risks from litigation and claims
Antitrust Claims Relating to Vitamins
On November 21, 2001, the European Commission im-posed a fi ne of €296.2 million against BASF Aktiengesell-schaft in connection with certain violations of antitrust laws relating to the sale of vitamin products in Europe bet-ween 1989 and early 1999. On December 9, 2004, the Eu-ropean Commission imposed an additional fi ne of €35 million for violations of certain antitrust laws relating to the sale of vitamin B4 (choline chloride) in the mid-1990s. BASF has appealed against both decisions. Further pro-ceedings are still pending in Brazil and Australia. A few State court lawsuits on behalf of indirect pur-chasers are still pending in the United States in connec-tion with said antitrust law violations. Further claims for damages have been fi led in the United Kingdom. A class action fi led in Australia has been settled, with court ap-proval still outstanding. For these proceedings, the company has established provisions that it anticipates to be suffi cient. BASF Aktiengesellschaft has been named as a defen-dant in Empagran S.A. v. F. Hoffmann-LaRoche, Ltd, et al., a federal class action fi led in the U.S. District Court for the District of Columbia purportedly on behalf of all persons who purchased vitamins from the defendants outside the United States between January 1, 1988 and February 1999. The Empagran complaint alleges that the plaintiffs were overcharged on their vitamins purchases as the result of a worldwide conspiracy among the defen-dants to fi x vitamin prices. By decision dated June 7, 2001, the District Court for the District of Columbia dismissed the Empagran complaint for lack of subject matter juris-diction. On January 17, 2003, a divided panel of the United States Court of Appeals for the District of Columbia Cir-cuit reversed the District Court’s ruling. The Court of Appeals held that the United States antitrust laws permit the assertion of federal subject matter jurisdiction over claims by foreign purchasers based on purchases made and purported damages felt outside the United States.
For information regarding possible contingent liabilities in connection with the acquisition of Englehard Corporation, Iselin, New Jersey, please see the Supplementary Report on page 56.

146 | 147
BASF Aktiengesellschaft and the other defendants peti-tioned for a Writ of Certiorari to the United States Su-preme Court. The Supreme Court granted the petition, and on June 14, 2004, vacated the Court of Appeals’ rul-ing and remanded the case to the Court of Appeals by an 8-0 decision. On June 28, 2005, the Court of Appeals, on remand, ruled that plaintiffs’ alleged link between foreign injury and domestic effects was legally insuffi cient to trig-ger jurisdiction under the Sherman Act and therefore affi rmed the district court’s dismissal of the action. On October 26, 2005, plaintiffs fi led a new petition for a writ of certiorari to the U.S. Supreme Court. The Supreme Court has denied plaintiffs’ petition, which BASF and the other defendants have opposed, on January 6, 2006. The proceedings are, therefore, terminated and the case is fi -nally dismissed.
Meridia Class Actions against BASF Corporation and
BASF Aktiengesellschaft
In various class actions in the United States, Knoll Phar-maceutical Corporation (KPC) and BASF Corporation (and in two cases BASF Aktiengesellschaft) as well as Abbott Laboratories, Inc. and Glaxo Wellcome were sued for an unknown amount of damages as well as for the reim-bursement of costs for preventive medical check-ups. The claims are based on the alleged hazardousness, alleged insuffi cient trials, and failures during the regulatory approval process of Meridia® (trade name of the obesity drug sibutramine). Both actions against BASF Aktienge-sellschaft have been dropped or dismissed. The claims against BASF Corporation have similarily been voluntarily dismissed. All cases have now been settled, with payment made by Abbott Laboratories which acquired KPC from BASF.
Additional Proceedings
The Supreme Court of Minnesota in its decision dated February 19, 2004, upheld a jury verdict against BASF Corporation in an amount of $52 million (with interest now totaling $60 million). The court held that the sale of the plant protection products Poast® and Poast Plus® at dif-ferent sales prices violated consumer protection laws. BASF believes that different sales prices are justifi ed be-cause the products are based on different patented for-mulas and also must be sold as different products under relevant EPA regulations. BASF fi led a petition for a Writ of Certiorari seeking review by the United States Supreme
Court. BASF’s petition was granted, and the case was re-manded to the Minnesota Supreme Court for reconsidera-tion of its prior opinion in light of an intervening U.S. Supreme Court ruling in another case. The Court‘s new ruling is expected during the fi rst quarter of 2006. In 2005, class action lawsuits against BASF Aktienge-sellschaft and BASF Corporation had been fi led at U.S. courts. It was alleged that sales of urethanes and “ure-thanes products” had violated antitrust laws. BASF will vigorously defend those lawsuits. In August 2005, the European Commission issued Statements of Objections against several European pro-ducers of methacrylates and polymethacrylates for al-leged anticompetitive behavior between 1995 and 2000, inter alia against BASF Aktiengesellschaft. Although the evidence induced by the Commission against the com-pany is considered weak, a fi ne against the company can-not be excluded. Therefore, the company has established provisions for the costs of this proceeding that it antici-pates to be suffi cient.
28. Stock-based compensation
BASF stock option program (BOP)
In 2005, BASF continued the BASF stock option program (BOP) for senior executives of the company worldwide. This program has existed since 1999. Approximately 1,000
senior executives, including the Board of Executive Direc-tors, are currently entitled to participate in this program. To participate in the stock option program, each partic-ipant must hold as a personal investment BASF shares in the amount of 10% to 30% of his or her individual variable compensation. The number of shares is determined by the amount of variable compensation designated by the par-ticipant and the weighted-average market price quotation for BASF shares on the fi rst business day after the annual meeting, which was €50.03 on April 29, 2005 (base price). For each BASF share of the individual investment, a participant receives four options. Each option consists of two parts, right A and right B, which may be exercised if defi ned thresholds have been met: The threshold of right A is met if the price of the BASF share has increased by more than 30% in comparison to the base price (absolute threshold). The value of right A will be the difference between the market price of BASF shares at the exercise date and the base price; it is limited to 100% of the base price.

BASF Group Consolidated Financial Statements and Notes
Right B may be exercised if the cumulative percentage performance of BASF shares exceeds (relative threshold) the percentage performance of the MSCI World Chemi-cals IndexSM (MSCI Chemicals). The value of right B will be the base price of the option multiplied by twice the percentage outperformance of BASF shares compared to the MSCI Chemicals index on the exercise date. Shares of the individual investment must be held for at least two years following the granting of the options. The options were granted on July 1, 2005 and may be exercised following a two-year vesting period, between July 1, 2007 and June 30, 2013. During the exercise period, it is not possible to exercise options during certain periods (closed periods). Each option right may only be exercised if the performance targets are achieved and may only be exercised once, meaning that if only one performance tar-get is met and that option is exercised, the other option right expires. The maximum gain for a participant from the BOP program is limited to 10 times the original individual investment and will be principally settled in cash. The stock option programs BOP 1999 to BOP 2004 were structured in a similar way to the BOP 2005 pro-gram. To participate in the BOP program, each participant
must hold BASF shares in the amount of 10% to 30% of his or her individual variable compensation (BOP
2001 – 2004) or must make an individual investment in BASF shares in the amount of 10% to 30% of his or her individual variable compensation that is used to purchase BASF shares at the market price on the fi rst business day after the Annual Meeting (BOP 1999 and 2000). The op-tions may be exercised following a vesting period of two years (BOP 2001 – 2004) or three years (BOP 1999 and
2000). The benchmark index used to determine the value of right B for BOP 1999 and 2000 is the Dow Jones EURO STOXXSM Total Return Index (EURO STOXXSM). This was replaced by the Dow Jones Chemicals Total Return Index (DJ Chemicals) between 2001 and 2004, and starting in 2005 by the MSCI Chemicals. The MSCI Chemicals is a global industry index for the chemical industry that mea-sures the performance of the companies contained within it in their respective local currencies, which signifi cantly reduces currency effects. Details on the fair value and the number of options issued are described below.
Fair value and parameters used as of December 31, 20051 Program years
BASF stock option program
2005 2004
Fair value €26.44 €35.73
Dividend yield of BASF shares 2.63% 2.63%
Risk free interest rate 3.22% 3.17%
Volatility of BASF shares 26.26% 24.66%
Volatility index2) 17.29% 15.58%
Correlation BASF quotation: index2) 85.05% 68.74%
1 It is assumed that the options will be exercised, based upon the potential gains.2 2005: MSCI Chemicals; 2004: DJ Chemicals
The values for volatility were determined on the basis of the monthly closing prices over a historical period correspond-ing to the remaining exercise term.

148 | 149
Options outstanding 2005 2004
Weighted-average
base price (€)
Options
(Number)
Weighted-average
base price (€)
Options
(Number)
Options outstanding as of January 1 43.64 4,643,465 43.99 3,833,959
Options granted 50.03 1,807,800 42.73 1,115,964
Options expired and forfeited1 43.79 66,950 43.15 64,464
Options exercised 43.36 983,706 45.02 241,994
Options outstanding as of December 31 45.83 5,400,609 43.64 4,643,465
Thereof exercisable options 44.16 2,493,669 45.46 312,181
1 Option rights lapse if the option holders no longer work for BASF or have sold part of their individual investment before the two-year holding period.
They remain valid in the case of retirement.
The weighted-average maturity of the outstanding options was 5.86 years on December 31, 2005 and 5.70 years on December 31, 2004. The base prices were within a range of €38.94 to €50.03 in 2005, and €38.94 to €47.87 in 2004. Because of a resolution by the Board of Executive Directors and the Supervisory Board in 2002, to settle stock options in cash, options outstanding as of Decem-ber 31, 2005 are valued with the fair value as of the bal-ance sheet date. This amount is accrued as a provision over the respective vesting period. An amount of €48.5 million was charged to income in 2005, and €36.4 million was charged to income in 2004. Previously accrued provi-sions were increased from €81.8 million on December 31, 2004 to €101.0 million on December 31, 2005. The total in-trinsic value of exercisable options amounted to €51.2 mil-lion on December 31, 2005 and €2.4 million on December 31, 2004.
BASF “plus” incentive share program In 1999, BASF started an incentive share program called “plus” for all eligible employees except the senior execu-tives entitled to participate in the BOP. Currently, employ-ees of German and of various European and Mexican sub-sidiaries are entitled to participate in the program. Each participant must make an individual investment in BASF shares from his or her variable compensation. For each 10 BASF shares purchased in the program, a participant re-ceives one BASF share at no cost after one, three, fi ve, seven and 10 years of holding the BASF shares. The fi rst 10 shares entitle the participant to receive one BASF share at no extra cost for each year for the next ten years. The right to receive free BASF shares expires if a participant sells the individual investment in BASF shares, if the par-ticipant stops working for the Company or one year after
retirement. Details on the incentive share program are described below.
Number of shares held
under the program
2005 2004
Number of shares held as individual
investment as of January 1 2,405,230 2,091,400
Number of shares added to the
individual investment 565,000 468,320
Number of subscription rights lapsed (175,100) 154,490
Number of shares held as indivi-
dual investment as of December 31 2,795,130 2,405,230
The free shares to be provided by the company are valued at the fair value of the grant date. Fair value is determined on the basis of the stock price of BASF shares, taking into account the present value of dividends, which are not paid during the term of the program. The weighted-average fair value at grant date amounted to €39.57 for the program in 2005 and €32.44 for the program in 2004. The fair value of the free shares to be granted is booked through the income statement against capital surplus over the period until the shares are issued. Provisions for the costs for the 1999 – 2002 program continue to be accrued proportionally on the basis of the BASF closing stock price. Compensation cost of €12.2 million was recorded in 2005 and €10.4 million in 2004 for the employee stock program.

BASF Group Consolidated Financial Statements and Notes
29. Derivatives and other fi nancial instruments
The use of derivative instruments
The Company is exposed to foreign currency, interest rate and commodity price risks during the normal course of business. These risks are hedged through a centrally de-termined strategy, with the use of derivative instruments. In addition, derivative instruments are used to replace transactions in original fi nancial instruments, such as shares or fi xed-interest securities. Derivative instruments are only used if they have a corresponding underlying position or planned transaction arising from the operating business, cash investments, fi nancing or planned sales. The leverage effect that can be achieved with derivatives is deliberately not used. The derivative instruments held by the Company are not held for the purpose of trading. Where derivatives have a positive market value, the Company is exposed to credit risks in the event of non-performance of their counterparts. This credit risk is mini-mized by trading contracts exclusively with major credit-worthy fi nancial institutions and partners, within pre-defi ned credit limits. To ensure effi cient risk management, market risks are centralized at BASF Aktiengesellschaft, except when certain subsidiaries have been authorized to conclude derivative contracts under the principles mentioned above. Contracting and execution of these instruments is performed according to internal guidelines, and complies with rigorous control mechanisms. The risks arising from changes in exchange rates, in-terest rates, and prices as a result of the underlying trans-actions and the derivative transactions concluded to hedge them are monitored constantly. The same is true of
the derivative instruments, which are used to replace transactions in original fi nancial instruments.
Financial risks
Foreign currency risk: Changes in foreign exchange rates could lead to a decline in value in fi nancial instruments. Foreign currency risks are especially prevalent in accounts payable and receivable that are not denominated in the local currency of BASF Group companies, or for future foreign currency transactions. To hedge the exchange rate risk against the U.S. dollar, the British pound, the Brazilian real, and the Korean won, foreign exchange forward contracts, combined interest and currency swaps and currency options are used. Default risk: This is the risk that the counterparties do not fulfi ll their contractual obligations. The book value of all fi nancial assets plus the nominal value of contingent assets excluding contingent liabilities represents the maxi-mal default risk. Due to the global activities and diversifi ed customer structure of the BASF Group, there is no signifi cant con-centration of default risk. Interest rate risk: Interest rate risks result from changes in prevailing interest rates, which can cause a change in the present value of fi xed rate instruments, as well as a change in the interest payments of variable rate instruments. To hedge this risk, and in particular to hedge the risk for loans to group companies, interest rate swaps, and combined interest and currency derivatives are used. These risks are relevant in the case of investments and fi nancial obligations but are not of material signifi cance on the operating side.
Book value of interest-bearing
fi nancial instruments December 31, 2005 December 31, 2004
Million €
Fixed-interest
rate
Variable-interest
rate
Fixed-interest
rate
Variable-interest
rate
Loans 195.6 5.1 217.6 76.7
Securities 13.7 – 12.8 –
Financial indebtedness 2,831.3 1,109.7 2,520.8 776.6

150 | 151
Fair value of fi nancial instruments
The fair value of a fi nancial instrument is the price at which the instrument could be exchanged between willing parties. When pricing on an active market is available, for example a stock exchange, this price is used. In other cases a valuation is based on an internal valuation model, using current market parameters. Commonly used tech-niques include net present value, and option pricing mod-els. The fair value of fi nancial debts is determined on the basis of interbank interest rates. For trade accounts receivable, liquid funds and other assets, trade accounts payable and other liabilities, the book value of short-term items approximates the fair value.
Participations which are not traded on an active market and whose net present value could not be reliably deter-mined are contained within “other fi nancial assets.” These are therefore valued at acquisition cost. The book value of these participations amounts to €606.8 on December 31, 2005, and €633.1 on December 31, 2004. The book value of fi nancial indebtedness amounted to €3,941.0 million in 2005 and €3,297.4 million in 2004. The market value of fi nancial indebtedness amounted to €3,963.4 million in 2005 and €3,334.2 million in 2004. The difference between book and market values resulted primarily due to changes in market interest rates.
Derivative instruments at
market value Nominal value as of December 31 Market value as of December 31
Million € 2005 2004 2005 2004
Foreign currency contracts 5,675.5 5,265.3 35.1 541.1
Currency options 3,407.3 2,122.1 (33.5) 66.9
Foreign currency derivatives 9,082.8 7,387.4 1.6 608.0
Interest swaps 199.1 908.9 (2.4) (43.8)
Combined interest and currency swaps 1,438.5 2,108.0 127.8 308.9
Interest derivatives 1,637.6 3,016.9 125.4 265.1
Commodity derivatives/Other derivatives 873.7 355.5 (15.8) (21.8)
Forward exchange contracts generally mature within one year. The nominal values are the totals of the purchases and sales of the particular derivatives on a gross basis. The fair market values correspond to resale or termination values, which are determined from market quotations or by the use of option pricing models or, in the case of unlisted contracts, the termination amount in the event of premature cancellation. Offsetting changes in the valuation of the underlying transactions are not taken into account.
Positive fair values of derivatives are contained within the item other receivables in the amount of €296.6 million in 2005 and €935.0 million in 2004. Negative fair values in the amount of €185.4 million in 2005 and €83.7 million in 2004 are shown under other liabilities. Commodity derivatives in the amount of €4.4 million are used in line with cash fl ow hedge accounting to hedge prices for raw materials, e.g., naphtha. The hedged raw-material infl ows will most likely impact the cash-fl ow and income statement in 2006.

BASF Group Consolidated Financial Statements and Notes
30. Leasing
Leased assets
Property, plant and equipment include those assets which are considered to be economically owned through a fi nancing lease. They primarily concern the following items:
Liabilities from fi nancing leases
Million €
Minimum leasing
payments
Interest portion Leasing liability
2006 22.9 7.0 15.9
2007 20.6 6.6 14.0
2008 18.7 6.2 12.5
2009 17.0 5.8 11.2
2010 17.7 5.4 12.3
After 2010 77.5 25.9 51.6
174.4 56.9 117.5
In the current year less than €0.1 million in additional lease payments were booked to the minimum lease expense (through the income statement) due to contractual obligations. Offsetting these leasing liabilities, expected minimum lease payments from sub-lessees amounted to €0.1 million.
Leased assets
December 31, .2005
Million €
Acquisition cost Net book value
Land, land rights and building, incl. buildings on land owned by others 78.9 63.0
Machinery and technical equipment 114.6 65.3
Miscellaneous equipment and fi xtures 83.5 28.0
Advance payments and construction in progress – –
277.0 156.3
In addition, BASF is a lessee in operating leases. The resulting lease obligations totalling €827.4 million come due in the following years:
Liabilities due to operating lease contracts2005
Less than 1 year
1 – 5 years More than 5 years
in total
Nominal value of the future minimum payments 171.9 391.5 264.0

152 | 153
31. Related-party transactions
IAS 24 requires the disclosure of transactions with related parties; both with companies that are not fully consoli-dated, as well as with individuals. Material supply relation-ships exist between the proportionally consolidated Group companies Wintershall Erdgas Handelshaus GmbH, Wintershall Erdgas Handelshaus, Switzerland, and companies of the BASF Group for the supply of oil and gas. The unconsolidated portion of these supplies amounted to €632.1 million in 2005 and €457.4 million in 2004. In addition, a material supply relationship existed be-tween the BASF Group and the Basell Group, which was accounted for by the equity method until 2005. Deliveries to the Basell Group amounted to €284.8 in 2005 and €254.0 in 2004. All transactions were at arm’s length. Please see Note 17 for details regarding payables and receivables with companies accounted for proportionally, at acquisition cost, or according to the equity method. There were no transactions between group companies and related individuals that were signifi cant, or of an unusual nature.
32. Services provided by the external auditor
BASF Group companies have used the following services of Deloitte & Touche GmbH:
The annual audit concerned the audit of the annual fi nan-cial statements of the BASF Group as well as the legally required audit of the fi nancial statements of BASF Aktien-gesellschaft and the consolidated subsidiary companies, and joint ventures. Audit-related services concerned billed services pri-marily for due diligence, confi rmation of the conformance to certain contractual obligations as well as audits relating to documentation of the internal control systems required by the Sarbanes-Oxley Act. Tax consultation services primarily concerned tax con-sultation services in connection with planned or existing transactions, transfer price analysis, as well as consulta-tion with employees on foreign delegation assignments. Other services concern amounts billed in connection with the handling of insurance damage claims as well as numerous other services. Costs for the audit of BASF Aktiengesellschaft amounted to €2.3 million in both 2005 and 2004. For other contracted services not related to the annual audit for BASF Aktiengesellschaft, fees paid to Deloitte amounted to €2.0 million in 2005 and €0.8 million in 2004. Costs for the audit of proportionally consolidated com-panies amounted to €0.4 million in 2005 and €0.4 million in 2004. For other contracted services not related to the annual audit for proportionally consolidated companies, fees amounted to €0.02 million in 2005 and €0.1 million in 2004.
Million € 2005 2004
Annual audit 12.8 11.7
Audit-related services 5.1 1.8
Tax consultation services 0.9 1.6
Other services 0.5 0.5
19.3 15.6
Offsetting these leasing liabilities, expected minimum lease payments from sub-lessees amounted to €13.9 mil-lion. Minimum lease payments in the amount of €15.6 mil-lion, conditional lease payment of €0.6 million, and pay-ments received from sub-lessees of €3.3 million are in-cluded in the operating results of the current year.
BASF as lessor
BASF acts as the lessor only in a minor capacity for fi nancing leases. Receivables from fi nancing leases are below €0.5 million as of December 31, 2005. Nominal min-imum payments arising from operating leases amount to €7.3 million within one year, and €27.2 million within the next fi ve years.

Glossary2-ethylhexanolA completely synthetic alcohol used, for example, in the production of plasticizers.
2-propylheptanolStarting product in the production of plasticizers and auxiliaries for chemical and technical industry.
acrylic monomersAcrylic monomers are part of the product range of the Performance Chemicals division and are used among other things as starting materials in the production of poly-mer dispersions.
Agricultural ProductsThe Agricultural Products division develops, produces and markets products to protect crops from fun-gal attack, insect pests and weeds
automotive OEM coatingsCoating systems for vehicle bodies that protect the vehicle from corro-sion (cathodic dip) and gravel and chippings (primer), provide color (basecoat) and offer protection from environmental factors (topcoat).
automotive refi nish coatings Coatings systems for the repair of vehicles under the trademarks Gla-surit® and R-M®.
biotechnologyThis term covers all processes and products that use living organisms, for example bacteria and yeasts, or their cellular constituents. BASF is using plant biotechnology to devel-op plants that enable a healthier diet through improved constituents, as well as crops with better cultiva-tion characteristics. In addition, BASF is concentrating on the bio-catalytic production of vitamins, amino acids, enzymes and chiral intermediates.
C4 complexPart of the production complex in Port Arthur, Texas. Here, three suc-cessive chemical processes are used to obtain butadiene, alkylate gasoline and propylene from a C4 stream (a mixture of various hydro-carbons each containing four car-bon atoms) from the steam cracker.
CoatingsThe Coatings division develops, produces and markets automotive OEM, automotive refi nish coatings, industrial coatings and decorative paints.
COSOThe Committee of Sponsoring Organizations of the Treadway Commission is a voluntary private-sector organization dedicated to improving the quality of fi nancial reporting through business ethics, effective internal controls and cor-porate governance.
dividend yieldThe dividend yield is the “return” received by a shareholder in the form of a dividend in relation to the year-end share price. It is calculated by dividing the per-share dividend by the year-end share price and multiplying by 100.
downstream plantA plant that is downstream of the steam cracker in the chemical val-ue-adding process.
earnings per shareThe amount earned by BASF in euros per share based on the weighted number of shares.
EBITEarnings before interest and taxes.
EBIT after cost of capitalWe use this key performance and management indicator for our oper-ating divisions and business units to ensure that we satisfy the returns expected by providers of equity and debt on the assets employed.
EBITDAEarnings before interest, taxes, depreciation and amortization
economies of scaleCost advantages derived from mod-ern world-scale plants.
energy managementThe development of new materials and technologies to convert and store energy. Energy management also refers to the responsible use of fossil fuels, for example through the development of energy-saving materials such as insulating materi-als. Energy management at BASF also involves the exploration for and production of crude oil and natural gas in selected regions by our sub-sidiary Wintershall AG.
ERMEnterprise Risk Management is a supplement to the original COSO model that was published in 2004.
explorationTo investigate and explore an area in the search for mineral resources such as crude oil or natural gas. For successful exploration, it is impor-tant to discover oil and gas-bearing structures (deposits, fi elds) using suitable geophysical processes at sea or on land rather than by means of expensive drilling.
FASBThe Financial Accounting Standards Board is a U.S.-based body that is accountable to the U.S. Securities and Exchange Commission (SEC). It prepares and publishes Statements of Financial Accounting Standards (SFAS).
fermentationFermentation is a process in which biological materials are reacted with the aid of bacterial, fungal or cell cultures, or with enzymes.
Fine ChemicalsIn the Fine Chemicals division, we develop, produce and market high-value products for human and ani-mal nutrition and for the cosmetics and pharmaceutical industries. Our primary products are vitamins, pharmaceutical active ingredients, polymers for pharmaceuticals and cosmetics, carotenoids, aroma chemicals, UV fi lters, the amino acid lysine, as well as enzymes for animal nutrition.
Functional PolymersThe Functional Polymers division is the global market leader in acrylic acid and superabsorbents and is a leading supplier of functional poly-mers for the adhesives, construc-tion, carpeting and paper industries. The division operates production facilities in all important regions of the world, consistently capitalizing on the BASF Verbund and expand-ing its global presence.
fungicideAn active ingredient that kills fungi or inhibits their growth (for example in plants).
futuresA binding agreement between two partners to buy or sell a specifi c amount of an exactly defi ned com-modity or fi nancial instrument at a particular price on a stipulated future date.
HDIHexamethylene diisocyanate is a raw material used in the production of automotive, industrial and plastic coatings.
herbicideAn active ingredient used to destroy weeds.
HPPO processTechnology to produce propylene oxide (PO) from propylene and hydrogen peroxide (HP).
IASInternational Accounting Standards (see also IFRS)
IFRICThe International Financial Report-ing Interpretations Committee is a committee that publishes proposed guidance on IFRS and IAS.
IFRSInternational Financial Reporting Standards (until 2001 International Accounting Standards, IAS) are developed and published by the International Accounting Standards Board (IASB) headquartered in London, United Kingdom. In accor-dance with the IAS Regulation, IFRS are mandatory for listed companies in the European Union since 2005.
industrial coatingsCoating materials for industrial goods with the exception of vehi-cles.
InorganicsThe Inorganics division produces raw materials such as ammonia, sulfuric acid and nitric acid, as well as the electrolysis products chlorine and sodium hydroxide. The division also produces innovative specialties such as electronic chemicals, het-erogeneous catalysts, impregnating resins and powder injection molding technologies.
insecticideAn active ingredient used to destroy harmful insects.
IntermediatesThe Intermediates division produces and sells amines, diols and polyal-cohols, as well as carboxylic acids and specialties such as phosgene derivatives, glyoxal and derivatives, and chiral intermediates for a vari-ety of chemical syntheses; 25% of the division‘s volumes are for cap-tive use within BASF.
Kyoto protocolThe Kyoto Protocol is a supplement to the United Nations Framework Convention on Climate Control. Its main goal is to reduce emissions of greenhouse gases.
Glossary

liquefi ed petroleum gas (LPG)Liquefi ed natural gases, e.g., pro-pane, butane and propane-butane blends, are used in the heating mar-ket, as an alternative feedstock for cracker operations and for other chemical processes.
MDIDiphenylmethane diisocyanate: a polyurethane basic product
MWhMegawatt hour: a measuring unit for energy
MWhelElectric megawatt hour: a measur-ing unit for electrical energy
NAFTAFree trade zone between the United States, Canada and Mexico; estab-lished in the North American Free Trade Agreement. This economic region is one of BASF’s four busi-ness regions.
nanotechnologyThe term nanotechnology applies to materials, structures and technolo-gies with one thing in common: the creation or presence of at least one spatial dimension smaller than a few hundred nanometers. This includes the production of nanopar-ticles and the creation of nanostruc-tures, which in turn make it possible to produce products with new or improved properties. Examples include starting materials for textiles that absorb UV radiation and water-repellant surface coatings for the textile and automotive industries.
naphthaLiquid petroleum that is obtained as a by-product of oil refi ning. Heavy naphtha is the starting point for gasoline production. Light naphtha is the most important feedstock for steam crackers.
OECDThe Organization of Economic Cooperation and Development is an international body headquar-tered in Paris, France.
Oil & GasOur oil and gas operations are con-ducted by Wintershall AG and its subsidiaries and include exploration and production of crude oil and nat-ural gas, crude oil and natural gas trading, and the leasing of natural gas storage and transport facilities.
payout ratioThe distribution ratio shows what proportion of earnings is distributed in the form of a dividend. It is calcu-lated by dividing the total dividend paid by net income and multiplying by 100.
PBTPolybutylene terephthalate: a type of plastic
Performance ChemicalsThe Performance Chemicals divi-sion includes the business areas Coatings, Plastics & Specialties; Automotive & Oil Industry; Textiles; Leather; and Detergents & Formula-tors. In all fi ve business areas, we supply high-performance special-ties worldwide that add value for our customers directly without fur-ther chemical processing.
Performance PolymersThe Performance Polymers division produces engineering plastics for use in the automotive and electron-ics industries, for example, as well as fi ber intermediates.
PetrochemicalsThe Petrochemicals division oper-ates world-scale facilities to supply the Verbund sites with petrochemi-cal feedstocks such as ethylene and propylene, as well as with tech-nical gases such as hydrogen and oxygen. In later processing stages, products in BASF’s plasticizers and solvents value-adding chains are produced, as are alkylene oxides and glycols. Typical examples are butanol, phthalic anhydride and ethylene oxide, which are pro-cessed primarily within the BASF Verbund.
plant biotechnologyAn area of biotechnology in which methods of traditional cultivation are optimized using methods from molecular biology and biochemistry. For example, plants can be devel-oped that contain constituents that allow a healthier diet, that grow under adverse conditions, or that form substances that would other-wise have to be produced using complicated chemical processes.
PolyTHF®
Polytetrahydrofuran: a starting material for elastic fi bers
PolyurethanesThe Polyurethanes division is one of the world’s leading producers of polyurethanes. Our product range includes the entire spectrum of basic polyurethane products, tailor-made polyurethane systems and polyurethane specialties. Polyure-thanes are used, for example, as rigid or fl exible foams for domestic appliances and mattresses, and as specialty plastics for the automobile and footwear industries.
REACHA proposed new EU regulatory framework for the registration, eval-uation and authorization of chemi-cals.
Responsible Care®
A worldwide initiative by the chemi-cal industry to continuously improve its performance in the fi elds of envi-ronmental protection, safety and health.
return on assetsThis describes the return we make on the average assets employed during the year. It is calculated as income from ordinary activities plus interest expenses as a percentage of average assets.
return on equity after taxThis describes the return we make on the average equity used during a fi scal year. It is calculated as income from minority interests as a percentage of average equity.
return on operating assetsThe return on operating assets describes the return made by an individual segment or the BASF Group on its allocated assets. It is calculated as income from opera-tions as a percentage of average operating assets.
return on salesThe return on sales describes the return we make from our operations as a percentage of sales. It is calcu-lated as income from operations as a percentage of sales.
Sarbanes-Oxley Act (SOX)A law enacted in the United States in 2002 to improve corporate fi nan-cial reporting. The Sarbanes-Oxley Act applies to U.S. companies and foreign companies listed on U.S. stock exchanges.
special itemsOne-time costs or one-time pay-ments that signifi cantly affect the earnings of a segment or the BASF Group. Special items include pay-ments arising from restructuring measures and severance payments.
steam crackerA large plant in which steam is used to “crack” naphtha (petroleum). The resulting petrochemicals – above all, ethylene and propylene – are the starting materials used to manufac-ture most of BASF’s products.
StyrenicsThis operating division produces and distributes styrene and styren-ics worldwide. The production of the primary product styrene is pri-marily for captive use (backward integration). Styrenics are used in many fi elds, including the construc-tion, packaging, automotive, elec-tric and leisure industries.
swapAn agreement between two compa-nies to exchange payment fl ows in the future. In an interest swap, a fi xed interest rate is exchanged for a fl oating one for an agreed nominal amount.
TDIToluene diisocyanate: a polyure-thane basic product
THFTetrahydrofuran: a starting material for PolyTHF®
TPUThermoplastic polyurethanes are specialty plastics used in a wide range of applications, e.g., in the automotive, sportswear and foot-wear industries.
U.S. GAAPUnited States Generally Accepted Accounting Principles
value-adding chainSuccessive steps in a production process, from the raw materials through various intermediate steps to the fi nished product.
VerbundThe Verbund is one of BASF’s greatest strengths: At our major sites, we link our production plants in a sophisticated system along our value-adding chains: Even by-prod-ucts or waste from one plant can often be used as raw materials in a neighboring plant. We thus save energy and raw materials, reduce logistics costs and use infrastruc-ture facilities jointly.
white biotechnologyAn area of biotechnology that deals with products and processes in the chemical, textile and food indus-tries.
world-scale plantsLarge production plants in which products can be manufactured on a world scale. The more a plant pro-duces, the lower the fi xed costs per metric ton of product (see also: economies of scale). BASF is there-fore committed to cost-effective large-scale plants of this kind in all major economic regions.
154 | 155

Index
Acquisitions .................................................................30ff., 56, 104f.
Agricultural Products & Nutrition ........ 14, 19, 32, 46ff., 55, 63, 116f.
Audit Committee ......................................................................74, 81
Balance sheet ........................................................................28f., 89
Basell ............................................................................ 3, 26, 96, 120
Board of Executive Directors .... 4f., 6f., 73ff., 76, 79, 82, 83, 86, 125
Capital expenditures .................................. 19, 30ff, 41, 48, 50, 100f.
Cash fl ows, statement of ..............................................30ff., 92, 123
Chemicals ...................................... 14, 19, 32, 37ff., 54, 60, 63, 116f.
Coatings .......................................................................................44f.
Code of Conduct .........................................................................73ff.
Compliance statement ...................................................................83
Consolidated Financial Statements ......................................82, 88ff.
Contractual Trust Arrangement (CTA) .......................... 3, 31, 65, 137
Corporate governance ................................................................73ff.
Cost of capital ................................................................................20
Crude oil/natural gas.................................. 14, 19, 49f., 72, 117, 146
Derivative fi nancial instruments .................................70, 100f., 150f.
Dispersions ............................................................................45, 53f.
Divestitures .................................................................. 26, 31f., 105f
Dividend ..................................................................................8ff., 33
E-commerce ...................................................................................62
Electronic chemicals ........................................................3, 37f., 105
Employees ......................................................................18, 64f., 124
Environmental protection .......................................................18, 66f.
F 500® .......................................................................................46, 55
Financial management ...................................................................31
Fine Chemicals ........................................... 14, 19, 48, 55, 105, 116f.
Functional Polymers ......................................................................45
Growth clusters .................................................................. 17, 47, 53
Income, statement of ............................................................24ff., 88
Innovation....................................................................................53ff.
Inorganics.............................................................................38f., 105
Intermediates .................................................................................39
Investor relations ..........................................................................8ff.
Joint ventures ...........................................................................16, 95
Key ratios .................................................................................34, 69
Knowledge Factory ........................................................................68
Naphtha ..................................................................................20f., 61
Oil & Gas .................................................... 14, 19, 32, 49f., 63, 116f.
Performance Chemicals .................................................................44
Performance Polymers...................................................................42
Performance Products ...................... 14, 19, 32, 43ff., 54f., 63, 116f.
Petrochemicals ..............................................................................39
Plant biotechnology .................................................................47, 53
Plastics ................................................ 14, 19, 32, 40ff., 54, 63, 116f.
“plus” share program .............................................................65, 149
Polyurethanes ................................................................................42
Procurement Verbund ....................................................................61
Products ............................................................14, 32, 38f., 42, 53ff.
Ratings ...........................................................................................34
Regions .............................................. 15, 16, 22, 29, 38, 46, 50f., 57
Report of Independent Auditors .............................................82, 87,
Research and development ..................................................47, 53ff.
Responsible Care® .........................................................................66
Risk management .......................................................................69ff.
Sales ...........................................................................26, 35ff., 116ff.
Segment reporting .................................................14, 19, 35f., 116f.
Share buyback program ..................................................... 8, 33, 135
Shared service centers ............................................................3, 51f.
Shareholders .....................................................................4f., 8ff., 20
Shares/share price ........................................................................8ff.
Sites .........................................................................................15, 80
Social responsibility ...................................................................... 68
Special items ..................................................................................26
Statement by the Board of Executive Directors ............................86
Steamcracker ............................................................... 32, 38, 60, 61
Stockholders’ equity ..................................................28f., 90f., 135f.
Stock option program ............................................ 65, 79, 125, 147f.
Strategy .................................................................................17ff., 80
Styrenics ........................................................................................41
Supervisory Board ............................................73ff., 77ff., 81ff., 125
Supply chain management ............................................................61
Sustainability .................................................................. 5, 10, 18, 68
Training Verbund ..........................................................................64f.
Value added.....................................................................8f., 17ff., 59
Value-based management .......................................................17, 20
Value-driver trees ...........................................................................69
WINGAS........................................................................................49f.
Index

Ten-year Summary
Ten-year Summary1
Million € 1996 1997 1998 1999 2000 2001 2002 2003 2004 2005
Financial Statement
Sales 24,939 28,520 27,643 29,473 35,946 32,500 32,216 33,361 37,537 42,745
Income from operations (EBIT) 2,195 2,731 2,624 2,009 3,070 1,217 2,641 2,658 5,193 5,830
Income from ordinary activities 2,257 2,726 2,771 2,606 2,827 609 2,641 2,168 4,347 5,926
Extraordinary income – – – – – 6,121 – – – –
Income before taxes and minority interests 2,257 2,726 2,771 2,606 2,827 6,730 2,641 2,168 4,347 5,926
Income before minority interests 1,452 1,639 1,664 1,245 1,282 5,826 1,599 976 2,133 3,168
Net income 1,427 1,654 1,699 1,237 1,240 5,858 1,504 910 2,004 3,007
Capital expenditures and depreciation
Additions to tangible and
intangible assets 2,416 2,564 3,722 3,253 6,931 3,313 3,055 3,415 2,163 2,523
Thereof tangible assets 1,861 2,229 2,899 2,764 3,631 3,037 2,677 2,293 2,022 2,188
Deprecation of tangible and
intangible assets 1,797 2,028 2,260 2,662 2,916 2,925 2,464 2,452 2,492 2,403
Thereof tangible assets 1,606 1,732 1,843 2,018 2,245 2,307 2,012 1,951 2,053 2,035
Number of employees
At year-end 105,589 104,979 105,945 104,628 103,273 92,545 89,389 87,159 81,955 80,945
Annual average 108,266 105,885 106,928 107,163 105,784 94,744 90,899 88,167 85,022 80,992
Personnel costs 5,637 5,790 6,010 6,180 6,596 6,028 5,975 5,891 5,615 5,574
Key data
Earnings per share (€) 2.32 2.67 2.73 2.00 2.02 9.722 2.60 1.62 3.65 5.73
Earnings per share in accordance
with U.S. GAAP (€) 2.84 2.14 2.45 9.38 2.96 2.35 3.39 5.83
Cash provided by operating activities 3,476 3,291 3,744 3,255 2,992 2,319 2,313 4,878 4,634 5,2503
Return on sales (%) 8.8 9.6 9.5 6.8 8.5 3.7 8.2 8.0 13.8 13.6
Return on assets (%) 11.4 12.6 11.9 10.2 9.9 3.1 8.4 7.4 13.2 17.7
Return on equity after tax (%) 14.8 14.6 13.2 9.1 9.0 36.62 9.3 6.0 12.9 18.6
Appropriation of profi ts
Net income of BASF AG4 870 943 1,074 1,007 1,265 5,904 1,045 1,103 1,363 1,273
Transfer to retained earnings4 332 307 381 304 50 5,153 247 334 449 –
Dividend 537 636 693 695 1,214 758 789 774 904 1,0295
Dividend per share (€) 0.87 1.02 1.12 1.13 1.30 1.30 1.40 1.40 1.70 2.00
+0.706
Number of shares as December 31
(in thousands) 618,052 622,063 623,794 620,985 607,399 583,401 570,316 556,643 540,440 515,059
1 Starting in 2005, the accounting and reporting of the BASF Group is performed in accordance with International Financial Reporting Standards (IFRS). The previous
year’s fi gures have been restated in accordance with IFRS. The fi gures for years up to and including 2003 were prepared in accordance with German GAAP.2 Including extraordinary income3 Before external fi nancing of pension obligations4 Calculated in accordance with German GAAP5 With regard to the number of qualifying shares on December 31, 2005. 6 Special dividend of stockholders’ equity charged with 45% corporate income tax
156 | 157

Ten-year Summary1
Balance Sheet (German GAAP)
Million € 1996 1997 1998 1999 2000 2001 2002 2003
Intangible assets 1,297 1,497 1,965 2,147 4,538 3,943 3,464 3,793
Tangible assets 8,217 9,076 10,755 12,416 13,641 14,190 13,745 13,070
Financial assets 2,093 2,132 1,826 1,507 3,590 3,360 3,249 2,600
Fixed assets 11,607 12,705 14,546 16,070 21,769 21,493 20,458 19,463
Inventories 3,665 3,876 3,703 4,028 5,211 5,007 4,798 4,151
Accounts receivable, trade 3,714 4,299 4,017 4,967 6,068 5,875 5,316 4,954
Other receivables 1,341 1,765 1,856 2,211 3,369 2,384 2,947 3,159
Deferred taxes 69 45 1,077 1,225 1,270 1,373 1,204 1,247
Liquid funds 1,957 1,846 1,503 1,508 870 743 363 628
Current assets 10,746 11,831 12,156 13,939 16,788 15,382 14,628 14,139
Assets 22,353 24,536 26,702 30,009 38,557 36,875 35,086 33,602
Subscribed capital 1,580 1,590 1,595 1,590 1,555 1,494 1,460 1,425
Capital surplus 2,515 2,567 2,590 2,675 2,746 2,914 2,948 2,983
Paid-in capital 4,095 4,157 4,185 4,265 4,301 4,408 4,408 4,408
Retained earnings 6,262 7,418 8,695 9,002 8,851 12,222 12,468 12,055
Currency translation adjustment (129) 201 39 549 662 532 (330) (972)
Minority interests 248 255 331 329 481 360 396 388
Stockholders’ equity 10,476 12,031 13,250 14,145 14,295 17,522 16,942 15,879
Pensions and other long-term provisions 5,052 4,824 5,561 5,812 6,209 6,809 6,233 6,205
Tax and other short-term provisions 2,391 2,463 2,185 2,826 3,334 3,332 2,764 2,982
Provisions 7,443 7,287 7,746 8,638 9,543 10,141 8,997 9,187
Financial indebtedness 1,042 1,126 1,316 1,294 7,892 2,835 3,610 3,507
Accounts payable, trade 1,628 1,972 1,871 2,316 2,848 2,467 2,344 2,056
Other liabilities 1,764 2,120 2,519 3,616 3,979 3,910 3,193 2,973
Liabilities 4,434 5,218 5,706 7,226 14,719 9,212 9,147 8,536
Provisions and liabilities 11,877 12,505 13,452 15,864 24,262 19,353 18,144 17,723
Thereof long-term liabilities 6,223 6,094 6,898 7,529 9,059 9,955 9,211 10,285
Total stockholders’ equity and liabilities 22,353 24,536 26,702 30,009 38,557 36,875 35,086 33,602
1 Starting in 2005, the accounting and reporting of the BASF Group is performed in accordance with International Financial Reporting Standards (IFRS). The previous
year’s fi gures have been restated in accordance with IFRS. The fi gures for years up to and including 2003 were prepared in accordance with German GAAP.
Ten-year Summary

Balance Sheet (IFRS)
Million € 2004 2005
Intangible assets 3,607 3,720
Property, plant and equipment 13,063 13,987
Investments accounted for using the equity method 1,100 244
Other financial assets 938 813
Deferred taxes 1,337 1,255
Other long-term assets 473 524
Long-term assets 20,518 20,543
Inventories 4,645 5,430
Accounts receivable, trade 5,861 7,020
Other receivables and miscellaneous short-term assets 2,133 1,586
Liquid funds 2,291 1,091
Short-term assets 14,930 15,127
Assets 35,448 35,670
Subscribed capital 1,383 1,317
Capital surplus 3,028 3,100
Paid-in capital 4,411 4,417
Retained earnings 11,923 11,928
Other comprehensive income (60) 696
Minority interests 328 482
Stockholders’ equity 16,602 17,523
Provisions for pensions and other obligations 4,124 1,547
Other provisions 2,376 2,791
Deferred taxes 948 699
Financial indebtedness 1,845 3,682
Other liabilities 1,079 1,043
Long-term liabilities 10,372 9,762
Accounts payable, trade 2,372 2,777
Provisions 2,364 2,763
Tax liabilities 644 887
Financial indebtedness 1,453 259
Other liabilities 1,641 1,699
Short-term liabilities 8,474 8,385
Total stockholders’ equity and liabilities 35,448 35,670
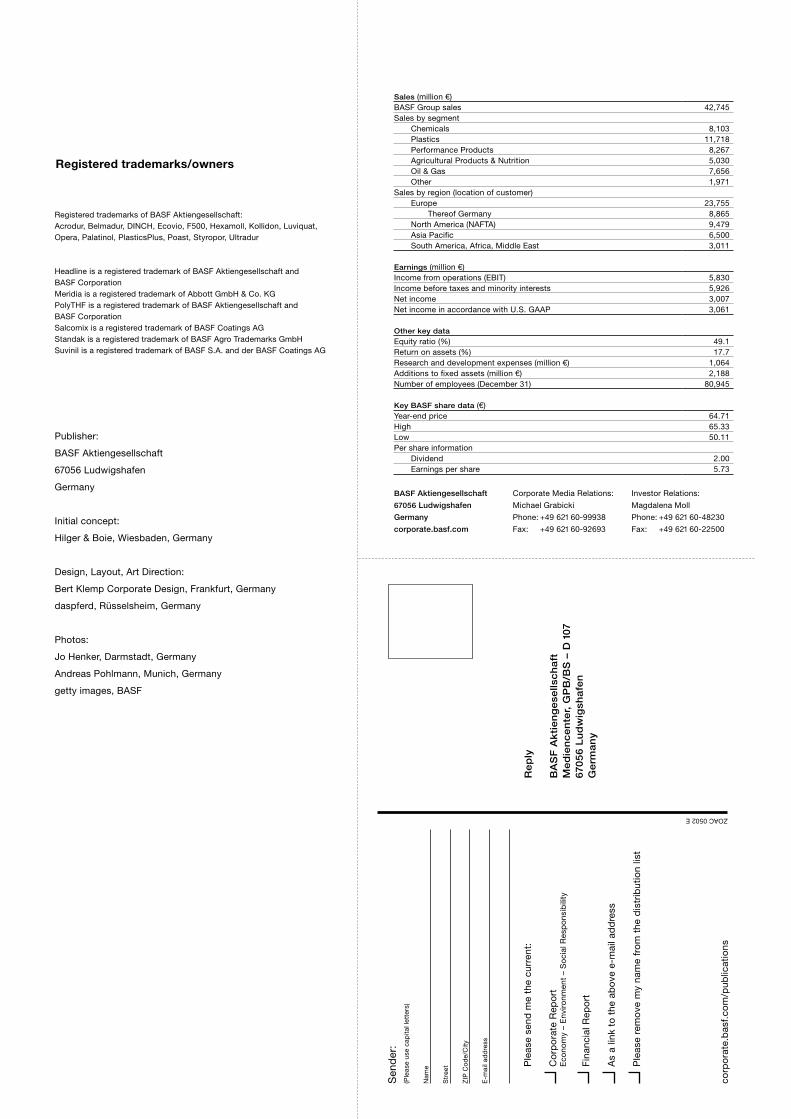
Registered trademarks of BASF Aktiengesellschaft:Acrodur, Belmadur, DINCH, Ecovio, F500, Hexamoll, Kollidon, Luviquat, Opera, Palatinol, PlasticsPlus, Poast, Styropor, Ultradur
Headline is a registered trademark of BASF Aktiengesellschaft and BASF CorporationMeridia is a registered trademark of Abbott GmbH & Co. KGPolyTHF is a registered trademark of BASF Aktiengesellschaft and BASF CorporationSalcomix is a registered trademark of BASF Coatings AGStandak is a registered trademark of BASF Agro Trademarks GmbHSuvinil is a registered trademark of BASF S.A. and der BASF Coatings AG
Publisher:
BASF Aktiengesellschaft
67056 Ludwigshafen
Germany
Initial concept:
Hilger & Boie, Wiesbaden, Germany
Design, Layout, Art Direction:
Bert Klemp Corporate Design, Frankfurt, Germany
daspferd, Rüsselsheim, Germany
Photos:
Jo Henker, Darmstadt, Germany
Andreas Pohlmann, Munich, Germany
getty images, BASF
Registered trademarks/owners
Re
ply
BA
SF
Akti
en
ge
sells
ch
aft
M
ed
ien
ce
nte
r, G
PB
/BS
– D
10
76
705
6 L
ud
wig
sha
fen
Ge
rma
ny
Sen
der
:(P
leas
e us
e ca
pita
l let
ters
)
Nam
e
Str
eet
ZIP
Co
de/
City
E-m
ail a
dd
ress
ZOAC 0502 E
P
leas
e se
nd m
e th
e cu
rren
t:
Co
rpo
rate
Rep
ort
E
cono
my
– E
nviro
nmen
t –
So
cial
Res
po
nsib
ility
Fin
anci
al R
epo
rt
As
a lin
k to
the
ab
ove
e-m
ail a
dd
ress
Ple
ase
rem
ove
my
nam
e fr
om
the
dis
trib
utio
n lis
t
corp
ora
te.b
asf.
com
/pub
licat
ions
Sales (million €) BASF Group sales 42,745Sales by segment Chemicals 8,103 Plastics 11,718 Performance Products 8,267 Agricultural Products & Nutrition 5,030 Oil & Gas 7,656 Other 1,971Sales by region (location of customer) Europe 23,755 Thereof Germany 8,865 North America (NAFTA) 9,479 Asia Pacific 6,500 South America, Africa, Middle East 3,011
Earnings (million €) Income from operations (EBIT) 5,830Income before taxes and minority interests 5,926Net income 3,007Net income in accordance with U.S. GAAP 3,061
Other key data Equity ratio (%) 49.1Return on assets (%) 17.7Research and development expenses (million €) 1,064Additions to fixed assets (million €) 2,188Number of employees (December 31) 80,945
Key BASF share data (€) Year-end price 64.71High 65.33Low 50.11Per share information Dividend 2.00 Earnings per share 5.73
BASF Aktiengesellschaft
67056 Ludwigshafen
Germany
corporate.basf.com
Corporate Media Relations:
Michael Grabicki
Phone: +49 621 60-99938
Fax: +49 621 60-92693
Investor Relations:
Magdalena Moll
Phone: +49 621 60-48230
Fax: +49 621 60-22500

Key data BASF Group 2005
Forward looking statements
This report contains forward-looking statements under
the U.S. Private Securities Litigation Reform Act of 1995.
These statements are based on current expectations,
estimates and projections of BASF management and cur-
rently available information. They are not guarantees of
future performance, involve certain risks and uncertain-
ties that are difficult to predict and are based upon
assumptions as to future events that may not prove to be
accurate. Many factors could cause the actual results,
performance or achievements of BASF to be materially
different from those that may be expressed or implied by
such statements. Such factors include those discussed in
BASF’s Form 20-F filed with the Securities and Exchange
Commission. We do not assume any obligation to update
the forward-looking statements contained in this report.
BASF is a member of the
World Business Council for
Sustainable Development.
In 2005, BASF shares were
included in the Dow Jones
Sustainability Index World for
the fifth year in succession.
This report went to press on February 24, 2006
and was published on March 14, 2006.
Yes, please send me further information.

ZO
AC
060
2 E
You can find this and other publications
from BASF on the Internet at corporate.basf.com.
You can also order the reports
◾ by telephone: +49 621 60-91827
◾ by fax: +49 621 60-20162
◾ by e-mail to: [email protected]
◾ on the Internet: corporate.basf.com/mediaorders
◾ Important dates
◾ May 4, 2006
Interim Report First Quarter 2006
◾ August 2, 2006
Interim Report Second Quarter 2006
◾ November 2, 2006
Interim Report Third Quarter 2006
◾ Annual Meetings
◾ May 4, 2006, Mannheim
◾ April 26, 2007, Mannheim
◾ Contacts
◾ Corporate Media Relations: Michael Grabicki Phone: +49 621 60-99938
Fax: +49 621 60-92693
◾ Investor Relations: Magdalena Moll Phone: +49 621 60-48230
Fax: +49 621 60-22500
◾ General inquiries: Phone: +49 621 60-0
Fax: +49 621 60-42525
◾ Internet: corporate.basf.com/financial-report
◾ BASF Aktiengesellschaft 67056 Ludwigshafen Germany