S.F. Holding Co., Ltd. 2021 Semi-Annual Report
326
S.F. Holding Co., Ltd. 2021 Semi-Annual Report
-
Upload
khangminh22 -
Category
Documents
-
view
0 -
download
0
Transcript of S.F. Holding Co., Ltd. 2021 Semi-Annual Report

S.F. Holding Co., Ltd. 2021 Semi-Annual Report

S.F. Holding Co., Ltd. 2021 Semi-Annual Report
2
S.F. Holding Co., Ltd.
2021 Semi-Annual Report
August 2021

S.F. Holding Co., Ltd. 2021 Semi-Annual Report
3
Chapter 1 Important Information, Table of Contents, and Definitions
The Company’s Board of Directors, Supervisory Committee, directors, supervisors, and senior management
hereby guarantee that the contents of the Semi-Annual Report are true, accurate, and complete, and that there are
no misrepresentations, misleading statements, or material omissions, and shall assume individual and joint legal
liabilities.
Wang Wei, the Company’s responsible person, Chen Fei, the person in charge of accounting work, and Hu
Xiaofei, the person in charge of the accounting department (accounting officer), hereby declare and warrant that
the financial report within the Semi-Annual Report is true, accurate, and complete.
All directors have attended the Board meeting approving the Semi-Annual Report.
The Company is required to comply with the disclosure requirements presented in the Shenzhen Stock
Exchange for Industrial Information Disclosure No.9 – Listed Companies Engaged in the Express Delivery
Services Business.
In this Semi-Annual Report, the Company details the possible risk factors and countermeasures that may
occur in the future. For more information, refer to “Section X. Possible Risks and Countermeasures” in “Chapter 3.
Management Discussion and Analysis.” Investors shall refer to this information.
The Company does not plan to issue cash or equity dividends, nor to convert equity reserve into share capital
of the Company.

S.F. Holding Co., Ltd. 2021 Semi-Annual Report
4
Table of Contents
Chapter 1 Important Information, Table of Contents, and Definitions ........................................ 2
Chapter 2 Company Profile and Key Financial Indicators ........................................................... 7
Chapter 3 Management Discussion and Analysis ......................................................................... 10
Chapter 4. Corporate Governance ................................................................................................. 79
Chapter 5. Environmental and Social Responsibilities ................................................................ 69
Chapter 6. Significant Events ......................................................................................................... 72
Chapter 7 Share Changes & Shareholder Details I. Changes in Shares ................................... 121
Chapter 8 Preferred Shares .......................................................................................................... 125
Chapter 9 Bonds ............................................................................................................................. 126
Chapter 10 Financial Statements .................................................................................................. 127

S.F. Holding Co., Ltd. 2021 Semi-Annual Report
5
List of Documents Available for Inspection
(1) Financial statements signed and sealed by the legal representative, the person in charge of finance and the person in charge of the
accounting department of the Company.
(2) The original copies of all documents and announcements of the Company which have been publicly disclosed in newspapers
designated by the China Securities Regulatory Commission during the reporting period.
(3) The original text of the 2021 Semi-Annual report signed by the chairman of the Board of Directors.
(4) The place where the above documents are maintained: the office of the Company’s Board of Directors.

S.F. Holding Co., Ltd. 2021 Semi-Annual Report
6
Definitions
Term Description
Reporting period January 1, 2021 to June 30, 2021
The same period of
previous year January 1, 2020 to June 30, 2020
The Company, The listed
Company, SF Holding, SF S.F. Holding Co., Ltd.
RMB Renminbi yuan
Mingde Holding Shenzhen Mingde Holding Development Co., Ltd., the controlling shareholder of S.F.
Holding Co., Ltd.
Taisen Holding Shenzhen S.F. Taisen Holding (Group) Co., Ltd., a wholly-owned subsidiary of S.F.
Holding Co., Ltd.
Hive Box Technology Shenzhen Hive Box Technology Co., Ltd., a commonly controlled entity of S.F.
Holding Co., Ltd.
SF Intra-city, Intra-city
Industrial Hangzhou SF Intra-city Industrial Co., Ltd. is a subsidiary of S.F. Holdings Co., Ltd.
CSRC China Securities Regulatory Commission
HK Stock Exchange The Stock Exchange of Hong Kong Limited
HK SFC The Securities and Futures Commission of Hong Kong
Kerry Logistics
Kerry Logistics Network Limited,a company listed on the Main Board of The Stock
Exchange of Hong Kong Limite. Stock abbreviation: Kerry Logistics; Stock code:
00636.HK
SF REIT SF Real Estate Investment Trust,a joint venture of S.F. Holding Co., Ltd. The SF REIT
has been listed on the Main Board of the HK Stock Exchange since May 17, 2021,
with the stock code of “2191.HK” and the stock abbreviation of “SF REIT”.

S.F. Holding Co., Ltd. 2021 Semi-Annual Report
7
Chapter 2 Company Profile and Key Financial Indicators
I. Company Profile
Stock Abbreviation SF Holding Stock Code 002352
Listed Stock Exchange Shenzhen Stock Exchange
Chinese Name of the Company 顺丰控股股份有限公司
Chinese Name Abbreviation of the Company 顺丰控股
English Name of the Company S.F. Holding Co., Ltd.
English Name Abbreviation of the Company SF Holding
Legal Representative of the Company Wang Wei
II. Contacts and Contact Methods
Board Secretary Securities Affairs Representative
Name Ling Gan Jing Zeng
Address
Block B,TK Chuangzhi Tiandi Building, Keji South
1st Road, Nanshan District, Shenzhen, Guangdong Province, P.R.China
Block B,TK Chuangzhi Tiandi Building, Keji South
1st Road, Nanshan District, Shenzhen, Guangdong Province, P.R.China
Tel No. 0755-36395338 0755-36395338
Fax 0755-36646688 0755-36646688
Email [email protected] [email protected]
III. Other Information
1. Corporate Contact Information
Were there any changes to the Company’s registered address, office address or postal code, company website, or to the email address during the reporting period?
□ Yes √No
There were no changes to the Company’s registered address, office address or postal code, company website and the email address
during the reporting period. Refer to the Company’s 2020 Annual report for details.
2. Information Disclosure and Location of Report
Were there any changes to information disclosure and location during the reporting period?
□ Yes √No
There were no changes to the name of the newspaper designated for information disclosure, to the address of website designated by
the China Securities Regulatory Commission for semi-annual report publication, nor to the storage location of company’s Semi-Annual report during the reporting period. Refer to the Company’s 2020 Annual report for details.
3. Other Relevant Information
Were there any changes to other relevant information during the reporting period?
□ Yes √No

S.F. Holding Co., Ltd. 2021 Semi-Annual Report
8
IV. Key Accounting Information and Financial Indicators
Does the Company need to adjust its financial information retrospectively or restate its previous year accounting information?
□Yes √No
Current reporting period The same period of previous
year
Increase/Decrease over the
same period of previous year
Revenue (RMB) 88,343,929,823.78 71,129,007,738.21 24.20%
Net profit attributable to shareholders of
the parent company (RMB) 759,921,074.24 3,761,593,296.43 -79.80%
Net profit after deducting non-recurring
profit or loss attributable to shareholders of the parent company (RMB)
-477,088,774.82 3,444,761,400.75 -113.85%
Net cash flow from operating activities
(RMB) 4,331,632,843.16 6,931,712,320.10 -37.51%
Basic earnings per share (RMB/share) 0.17 0.85 -80.00%
Diluted earnings per share (RMB/share) 0.17 0.85 -80.00%
Weighted average return on net assets 1.34% 8.51% A decrease of 7.17
percentage points
End of the current reporting
period End of previous year
Increase/Decrease over
previous year end
Total assets (RMB) 133,393,058,169.57 111,160,042,260.97 20.00%
Total equity attributable to shareholders of
the parent company (RMB) 56,681,222,769.04 56,443,050,238.39 0.42%
V Differences Arising from Chinese and the International Accounting Standards
1. Differences between net profits and net assets disclosed in the financial reports in accordance with
international accounting standards and Chinese accounting standards
□Applicable √Not applicable
There is no difference between the net profits and net assets disclosed in financial reports in accordance with international accounting standards and those disclosed in accordance with Chinese accounting standards in the reporting period.
2. Differences between net profit and net assets disclosed in the financial reports in accordance with
overseas accounting standards and Chinese accounting standards
□Applicable √Not applicable
There is no difference between the net profits and net assets disclosed in the financial reports in accordance with overseas accounting standards and those disclosed in accordance with Chinese accounting standards in the reporting period.
VI Non-Recurring Profit or Loss
√Applicable □Not applicable
Unit: RMB
Item Amount Note
Investment income from disposal of subsidiaries 942,964,204.15
It mainly represents gains from
disposal of subsidiaries to SF
REIT, for details, please refer to
Note 5(2) of Chapter 10 Financial
Statements.
Gains or losses on disposals of non-current assets (including
offsetting amount for the provision of impairment of assets) -6,632,153.94

S.F. Holding Co., Ltd. 2021 Semi-Annual Report
9
Government grants recognized in profit or loss for the current
period (excluding government grants that are closely related to
the Company’s business operations, with fixed quotas or amounts in accordance with national uniform standards)
383,344,061.72
It mainly represents fiscal
approportion, transportation
capacity subsidies, tax refunds
and employment stabilization subsidies, etc.
Gains generated where investment costs of acquisition of
subsidiaries, associates and joint ventures by the Company are
less than the Company’s share of the fair value of the investee's identifiable net assets
2,375,341.81
Gains or losses from changes in fair value of financial assets held
for trading, derivative financial assets, financial liabilities held for
trading and derivative financial liabilities, and investment gains or
losses arising from the disposal of financial assets held for
trading, derivative financial assets, financial liabilities held for
trading, derivative financial liabilities and other debt investments,
excluding hedging activities related to the normal business operations of the Company
21,622,194.25
Reversal of provision for impairment of receivables and contract
assets that have been assessed for impairment individually 18,564,776.44
Net amount of other non-operating income and expenses -23,918,665.39
Less: Income tax effect 94,158,037.89
Profit or loss attributable to minority shareholders (after tax) 7,151,872.09
Total 1,237,009,849.06 --
Provide explanations for classifying non-recurring profit or loss items defined in the Explanatory Announcement No. 1 for Public
Company Information Disclosures – Non-recurring profit or loss, and for classifying non-recurring profit or loss items listed in the
Explanatory Announcement No. 1 for Public Company Information Disclosures – Non-recurring profit or loss as recurring profit or loss items.
□Applicable √Not applicable
The Company has not classified non-recurring profit or loss items defined or listed in the Explanatory Announcement No. 1 for Public Company Information Disclosures – Non-recurring profit or loss as recurring profit or loss items in the reporting period.

S.F. Holding Co., Ltd. 2021 Semi-Annual Report
10
Chapter 3 Management Discussion and Analysis
I. Primary business of the Company during the reporting period
Is the Company required to comply with disclosure requirement of a particular industry?
Yes
Express Delivery Service Industry
(I) Industry development
1. China logistics industry has large market size and broad market space, the potential for consolidation is vast
Despite of COVID-19’s continious uncertainties on the global economy, China has entered a “new normal” for pandemic
prevention control and economy recovered robustly. Driven by the steady growth of industrial logistics in China, growing import and
export momentum and the continuously rapid development of new drivers related to people’s livelihood and consumption, the
prosperity index of logistics industry in China was in a relatively high range. From 2010 to 2020, the total social logistics expenditure
in China increased from RMB7.1 trillion to RMB14.9 trillion, with a compound annual growth rate of 7.7%, In 2020, the total social
logistics expenditure accounted for 14.7% of GDP. Among them, the express delivery service industry was a key segment of the
gigantic logistics market. According to the data from the State Post Bureau, from 2010 to 2020, the business volume and income
from the express delivery service industry increased by 36.3 times and 15.3 times respectively, with shipments delivered totalling
49.39 billion in the first half of 2021, representing a year-on-year increase of 45.8%, the business income totalling RMB 484.21
billion, representing a year-on-year increase of 26.6%, and the average daily handling volume exceeding 300 million in June this year.
China’s express delivery market has been the world’s largest for many years, maintaining robust growth momentum.
Despite of the broad logistics market in China, the market of the logistics industry in China is still very fragmented compared
with that in developed countries. According to the data released by the China Federation of Logistics and Purchasing in November
2020, the total revenue from logistics business of the comprehensively top 50 logistics companies in 2019 was RMB1.1 trillion, but
accounted only for 10.7% of China’s total revenue from logistics business of RMB10.3 trillion in 2019, with a low degree of
concentration and huge space for future integration. Along with the rapid growth of the express service industry in China in recent
years, express service enterprises diverged in terms of business volume, market share, business model and profitability and etc.

S.F. Holding Co., Ltd. 2021 Semi-Annual Report
11
Leading express enterprises built up cost advantage with scale effect and further expanded their market share, resulting in the gradual
withdrawl of certain small and medium sized express enterprises and making the market more concentrated. Data from the State Post
Bureau shows that the brand concentration index, CR8, came in at 80.8 in the first half of 2021. Meanwhile, leading express
enterprises kept optimizing their services, explored diversified business and built new business lines, such as freight, cold chain and
supply chain leveraging on talent, technology and capital, in a bid to expand their network coverage both at home and abroad and
build end-to-end integrated logistics service capabilities. Besides, they seek to enhance operation efficiency with technology and
developed the “scattered, chaotic and poor” logistics industry in a scaled, standardized and efficient manner. With the continuous
development of logistics industry, upgrading information technology brought new technologies for logistics and new business forms
sprung up, coupled with the upgrading supply chain, leading an increasingly concentrated logistics industry and making the market
divided by several leading large-scale professional logistics companies.
2. The trend of empowering different industries to build digital, intelligent, efficient and flexible supply chains through
technology advancement is providing new opportunities for logistics companies
In recent years, big data, cloud computing, artificial intelligence and other technologies have been widely practiced in logistics
scenarios. Through the extensive application of RFID, sensors, GPS, cloud computing and other information technologies in logistics
transportation, warehousing, packaging, loading and unloading, and distribution processing , distribution, information service and
other links, the intelligentization, automation and visualization of the logistics system have been realized, which greatly improves the
logistics efficiency. The proportion of total social logistics costs to GDP is generally used to measure the level of social logistics
costs and modernization. The lower the proportion, the higher the overall social logistics efficiency and the higher the modernization
level of the logistics industry. From 2010 to 2020, the proportion of total social logistics costs to GDP in China dropped from 17.8%
to 14.7%, a decrease of 3.1 percentage points. The reason is that on the one hand, the logistics industry has moved from low
concentration and decentralized competition to intensification and scale by giving full play to the effect of large-scale operation; on
the other hand, the improvement of logistics technology and intelligent level has shortend the logistics operation time and labor
intensity, improved the overall transport quality and efficiency, and the logistics industry has achieved remarkable results in cost
reduction and efficiency enhancement. However, this proportion is still at a relatively high level compared with 6%~8% in developed
countries in Europe and the United States, and there is still much room for improvement in the overall operational efficiency of
China's logistics industry.
On March 16, 2021, 13 departments including the National Development and Reform Commission jointly issued the "Opinions
on Accelerating the Promotion of High-Quality Development of Manufacturing Services (《关于加快推动制造服务业高质量发展
的意见》)" (Fa Gai Chan Ye [2021] No. 372), which proposed the need to accelerate the upgrading of professional and
comprehensive service capabilities for manufacturing industry and improve the overall quality and level of the manufacturing
industry chain; use 5G, big data, cloud computing, artificial intelligence, blockchain and other new-generation information
technologies to vigorously develop intelligent manufacturing; develop a modern logistics service system, facilitate the integration
and sharing of information resources; promote the real-time collection and interconnection of information in upstream and
downstream links such as procurement, production and circulation, and improve the level of integrated operation of production,
manufacturing and logistics; promote the application of perception technology in key nodes of the manufacturing supply chain;
promote the intelligentization of supply chain system in key industries, and gradually realize the visualization of supply chain; with a
focus on the construction of “One Belt and One Road”, encourage professional services such as supply chain management to go out

S.F. Holding Co., Ltd. 2021 Semi-Annual Report
12
in concert with manufacturing industry, and enhance the ability to allocate resources in the global service market, etc..
It can be seen that, at the critical stage of the gradual improvement of the new generation of information technology and
infrastructure, the vigorous development of intelligent manufacturing and the promotion of industrial upgrading in China, the
logistics industry in China is facing historic opportunities and key time windows to contribute to the promotion of manufacturing
value chain, drive digital visualization of supply chain, build modern logistics service standards, and enhance the global influence
and competitiveness of China's manufacturing supply chain. In particular, the epidemic has rapidly change the behavior of end
consumers to online consumption, and the online penetration rate of commodities has continued to increase with new forms of online
retail such as traditional e-commerce platforms, live streaming e-commerce, short video e-commerce and community group buying
emerging in an endless stream, and under the background of the significant increase of customer acquisition cost on online platforms,
brands are also paying more attention to private domain traffic. Therefore, the new business model with decentralized channel flow,
fragmented orders and online and offline integration will put forward higher requirements for brand owners' ability to perceive and
respond to market changes, be flexible and respond efficiently in the overall supply chain. How to achieve consumer insight, accurate
marketing forecasting, omnichannel operation, demand-matching production, fast inventory turnover, and establish a DTC (Direct to
Customer) flexible supply chain system with efficient response has become the key to win the market for brands. The entire supply
chain, from commodity supply to reaching consumers, will be reshaped: the production- and channel-centric "push" model is
evolving towards a consumer-centric "pull" model, and the planned, high-volume traditional logistics delivery model will shift to a
more flexible and agile approach. In this process, third-party logistics enterprises deeply cooperate with brand owners and penetrate
into every link of their supply chain services. With rich practical experience in logistics scenarios, combined with big data and
algorithm technology, AIoT, and software and hardware system integration capabilities, they help brand owners build digital, visual
and intelligent supply chain systems. The transformation of supply chain from the traditional cost center to the consumer-centric
enterprise value creation will be a new opportunity for third-party logistics enterprises and customers to work together to achieve
win-win results, upgrade their industries and services, and gain a broader market share in the future.
3. Under the guidance of government policies, express delivery industry is looking to move on from price war to a more
orderly market, and shifting from homogeneous competition to providing comprehensive logistics services
After many years of rapid development, China has grown into the world’s largest express delivery market by business volume.
According to the data from the State Post Bureau, from 2010 to 2020, shipments delivered by Chinese express delivery companies
increased to 83.36 billion from 2.34 billion, representing a CAGR of approximately 42.9%, and the business volume of express
delivery is expected to reach 95.5 billion in 2021. During the 13th Five-Year Plan, China’s parcel delivery volume has surpassed that
of the United States, Japan and Europe combined, and accounts for more than 50% of total global growth, making it the powerhouse
and stabilizer for the international post industry.
The Chinese express delivery industry is currently going through a transition from the growth stage toward the maturity phase,
and the concentration of the market is increasing. E-commerce market remains the primary driving force of express industry growth,
but there exists severe homogeneous competition among e-commerce delivery services – most e-commerce delivery businesses rely
heavily on price competition to grow market share. Meanwhile, with the entry of new entrants supported by the capital markets,
low-price strategy has become a main way to occupy the e-commerce delivery market share rapidly for new entrants. To this end, the
original competitive landscape of e-commerce delivery industry was hit hard, and the price war among the e-commerce delivery
industry was increasingly intensified. This has resulted in a consistent decline of the overall express delivery price per shipment in

S.F. Holding Co., Ltd. 2021 Semi-Annual Report
13
recent years – from RMB24.60 per shipment in 2010 to RMB10.55 per shipment in 2020.
In this year, regulatory authorities have promulgated a number of policies to rectify the chaos in express delivery industry. In
Yiwu, Zhejiang, where has huge express shipments and fierce price competition, the regulatory authorities have issued caution letters
to some express delivery companies, requiring them not to dump by reducing the price far below the cost, and related outlets have
been requested to suspend their operation. On April 22, in the 70th executive meeting of the Government of Zhejiang Province,
Zhejiang Express Delivery Industry Development Regulation (Draft) (《浙江省快递业促进条例(草案)》) was approved, which
stipulates that express delivery operators shall not provide express delivery services at a price below the cost; e-commerce platform
operators shall not use technologies and other means to impede the normal services provided by express delivery operators. On June
23, seven departments including the Ministry of Transport and the State Post Bureau jointly published the Opinions on the Protection
of the Legal Rights and Interests of the Couriers (《关于做好快递员群体合法权益保障工作的意见》), which proposes specific
measures against unfair market competition, differentiated regional delivery charges and other issues, and requires to ensure
reasonable remuneration for couriers and fulfill the responsibilities of express delivery companies. The gradual improvement of
relevant laws and regulations will facilitate the orderly operation and reasonable competition of the participants in express delivery
market, and the industry will head into a stage of high-quality development.
Meanwhile, with the increasing business scenarios diversity and supply chain complexity, customers will have increasing needs
of the outsourcing service of overall supply chain management, and will be no longer satisfied with single delivery service of express
delivery companies. In line with the diversification trend of customer needs, leading companies in the domestic express delivery
industry also have started to actively expand diversified businesses to meet customers’ needs. In recent years, leading companies of
express delivery industry have been committed to expanding new tracks to march into new fields and tried to integrate new business

S.F. Holding Co., Ltd. 2021 Semi-Annual Report
14
forms to offer services. With diversified first-mover advantage, leading companies in the industry established competitive advantage
in comprehensive logistic service capability. It is expected that with the specialization and internationalization of the segregation of
duties in the industry, one-stop comprehensive solution capabilities will be the core competitiveness of courier and logistics
companies in the future.
4. Due to strong demand for cross-border logistics services, Chinese corporates need to cooperate with Chinese
logistics players with international end-to-end supply chain services capabilities
Thanks to effective pandemic prevention and control measures, China took the lead in resuming work and production under the
global pandemic, highlighting its advantages in the complete manufacturing industry chain and boosting the import and export trade
volumes. According to statistics released by the General Administration of Customs in July this year, total value of China
exports and imports of goods in the first half of 2021 reached RMB18.07 trillion, representing a increase of 27.1% over the same
period last year, of which exports reached RMB9.85 trillion, representing a increase of 28.1%. Meanwhile, the pandemic also
accelerated the trend towards an online shift of global trade and consumption and promoted the rapid growth of cross-border
e-commerce industry. According to data from the General Administration of Customs, in the first half of 2021, China's imports and
exports from cross-border e-commerce companies developed with a good momentum, recording total value of RMB886.7 billion,
representing a year-on-year increase of 28.6%. The General Administration of Customs and other government departments have also
introduced a series of measures to deepen cross-border trade facilitation reform and optimize the business environment at ports. With
the benefits from the industry and policies, China's import and export is expected to maintain good growth.
With the booming cross-border trade and the continuous support of national policies such as“the Belt and Road” initiatives,
Chinese brands also leveraged on the historic opportunity to expand overseas markets and promote brands internationalisation.
However, they also faced risks of complex and volatile international environment and high uncertainties, which proposed great
challenges to the safe and stable operation of the industry chain and supply chain.This prompted brand owners to re-examine the
safety and reliability of their international supply chain layout, and the global industry chain will be restructured. Therefore, building
the foundations for an independent and controllable express logistics and supply chain will be the key to assisting the globalisation of
China`s industry chain, and the enhanced competitiveness and voice of brand owners will drive domestic cross-border logistics
companies to expand their business with brands, so as to accelerate the globalization of China's logistics supply chain and bring
enormous opportunities for the international supply chain business of China’s express logistics companies.
In addition, with the increasing penetration rate of global online consumption and the rapid growth of cross-border e-commerce,
cross-border logistics is shifted towards fragmented demand, increasing cargo volume and direct customer proportion and changing
industry services from partial process to door-to-door full process. However, cross-border logistics still has common pain points at
the current stage, such as slow timeframe, uncertain delivery time, various chain participants, opaque routing, low customs clearance
efficiency and price fluctuations. The instability of fulfillment services affects consumers' shopping experience and limits the
business expansion of cross-border e-commerce to some extent and increases the operational risks of enterprises. Therefore, brand
owners are urgently seeking for the cross-border logistics service providers with stable and efficient end-to-end international supply
chain solutions. In particular, with the shortage of logistics warehouse resources due to the pandemic, international express logistics
service enterprises that have stable international cargo air resources as well as strong localized operation capabilities of custom
clearance, overseas warehouses and landed distribution, and can provide efficient and agile one-stop fulfillment services will be more
competitive. With the globalization of China’s manufacturing supply chain and the rapid development of cross-border e-commerce,

S.F. Holding Co., Ltd. 2021 Semi-Annual Report
15
comprehensive cross-border logistics service providers with strong international logistics network and core scarce resources will
continue to gain market share and gradually develop into leading players.
5. Green (environmental-friendly) express services have evolved from conceptual ideas to actual implementation, and
are expected to develop further alongside the green supply chain to create additional "green value"
China at the United Nations (UN) General Assembly made it clear that "China will increase its nationally determined
contributions, adopt more forceful policies and measures, strive to peak its carbon dioxide emissions by 2030 and achieve carbon
neutrality by 2060". Since the target was proposed, the intensity of carbon neutrality policies has increased significantly, with
ministries and commissions following up with detailed policies. In January 2021, the State Post Bureau proposed to accelerate the
green transformation of express packaging, and continuously improve the industry regulations, standards and policy system in line
with the concept of green development. It was also proposed to vigorously implement the "2582" Project in 2021, among others,
special treatment will be carried out for excessive packaging bags of heavy metals and certain substances. In March 2021, the
Measure on Express Mail Package Management promulgated by the Ministry of Transport was formally implemented. The Measure
specifies the unified management responsibility of delivery corporate headquarters, regulates that delivery enterprise shall strictly
implement the package management system, purchase and use packing materials approved by the national regulations, prefer to
adopt a reusable and easily recyclable packaging, optimize the express mail packaging, reduce the use of packaging and encourage
delivery companies to recycle packaging. In July 2021, the "Fourteenth Five-year Plan for Circular Economy Development" was
rolled out. By 2025, e-commerce express will basically realize non-secondary packaging, and the scale of recyclable express
packaging applications will reach 10 million.
It is foreseeable that we are moving forward to a sustainable future. The supply chain industry will definitely adapt to this huge
change of green industry, realize carbon emission management and accelerate the low-carbon transformation of warehousing,
packaging, transportation and delivery through scientific and technological means as well as advanced low-carbon technologies. We
will also further extend the green value to the supply chain, reduce customer carbon emissions, help customers to create green value,
and jointly step into the industry with science and technology, efficient, clean and green.

S.F. Holding Co., Ltd. 2021 Semi-Annual Report
16
(II) Primary business, products and its use, operating models etc. of the Company

S.F. Holding Co., Ltd. 2021 Semi-Annual Report
17
SF Holding is the largest integrated logistics service provider in China, the fourth largest express enterprise worldwide in terms
of market capitalization, and is committed to becoming a data and technology-driven company providing independent third party
solutions. It empowers customers with leading technology and provides customers with smart and integrated supply chain solutions
covering various industries and application scenarios.
With a focus on the logistics ecosystem, the Company horizontally expands its diversified businesses while vertically deepens
its product stratification, so as to meet the needs of different market segments, and cover the complete supply chain of customers.
The main businesses and services provided include: Express delivery business, including high-quality door-to-door express delivery
products that meet the rapid delivery needs of individual and corporate customers, and cost-effective economic express products that
serve the majority of merchants in the e-commerce market, and provide professional integrated warehousing management and
warehousing allocation services; Freight business, including door-to-door transportation and delivery services for large-size parcels,
less-than-truck-load (“LTL”), and large-volume heavy cargo for the mid-to-high-end market, as well as economical freight services
for the main market; Cold Chain and Pharmaceuticals business , including professional cold chain integrated services based on
storage, sorting, packaging, trunk transportation, urban distribution, and door-to-door delivery with multi-temperature controlled
storage for businesses in the fresh and frozen food industry, as well as the plarmaceutical logistics and transportation services that
serve various market entities such as manufacturers, distribution companies, disease control centers, hospitals, pharmacies, and
pharmaceutical e-commerce companies; Intra-city instant delivery business , including instant logistics and deliery services for
brand customers and small and medium-sized businesses to provide catering takeaway, near-field e-commerce, local retail and other
scenarios, as well as providing local life services of help taking, help sending, help buying, and help handling affairs for individual
users; International business, including high-efficiency standard express to meet the needs of cross-border express delivery,
cost-effective economic express to meet the needs of cross-border e-commerce, and integrated international supply chain services
covering LTL and overseas warehouses that serve customers' international operations; Supply chain business, driven by technology
and based on SF’s well-established logistics network and product matrix, it integrates the advanced supply chain management
experience of SF DSC (formerly known as “SF DHL”) and New Havi, to provide customers with intelligent software and hardware
system integration services that help them realize digital supply chain transformation, as well as a complete set of supply chain
solutions for supply chain planning, layout optimization, operation execution and implementation.
After years of development, by virtue of the Company’s high penetrating delivery network covering China and major countries
and regions in the world, the Company has quickly extended to freight, cold chain, intra-city delivery, supply chain and other fields
through internal incubation and merger and acquisition, so as to build a complete integrated comprehensive logistics service system.
We can not only provide end-to-end quality logistics services, but also provide integrated supply chain solutions throughout the
procurement, production, distribution, sales and aftersales for customers. Based on the diverse needs of different industries,
customers and scenarios, SF Holding adheres to the “customer-centric, demand-driven and experience-based” product design
philosophy that focuses on each industry’s unique characteristics, and starts from the application scenarios of customers to drill into
their requirements for different use cases within the end-to-end whole process and other individual requirements of customers. Thus
SF Holding is able to design suitable products, services and solutions for customers while creating differentiated competitive
advantage, and such product design in turn drives internal resource allocation, optimizes the product mix and enables the
development of the solution capability.
In addition, SF Holding always attaches importance to research and development (R&D) of technology and adheres to the
forward-looking layout. The Company has technology and practical application ability that stay ahead of peers in the cutting-edge
fields such as artificial intelligence (AI), big data, robotics, Internet of Things (IoT), logistics map and blockchain. Relying on the

S.F. Holding Co., Ltd. 2021 Semi-Annual Report
18
diversified business development of the Company, its services have gradually penetrated into the end-to-end value chain parts of the
whole process of manufacturing and commercial retail in all walks of life, therefore accumulating extensive logistics scenarios and
massive data. In combination with the R&D and application of continuously innovative logistics technology, we realise the
digitalized and efficient operation of the whole process within the Company, which assists to the growth of diversified businesses and
provide customers with high quality and accurate delivery services. Moreover, with the continuous accumulation of extensive
scientific and technological capabilities and experience, we conduct continuous iteration and upgrading to work out leading
technology products and smart logistics solutions. With science and technology as the entry point, we work with industry customers
to implement digital transformation of supply chain in addressing problems such as information silo, inventory fragmentation,
response lag, prediction error, low efficiency and so on under the traditional supply chain mode, and truly realise real-time
information collection, interconnection and online visibility of the whole supply chain. We carry out front-end procurement,
production, inventory and sales under the accurate prediction of direct to customer (DTC), establish flexible supply chain systems
capable of real-time response, flexible and efficient, which not only to helps our clients achieve cost reduction and benefit increase,
but also promotes the transformation of customer supply chain from cost-based to value-based and becomes the key to core
competitiveness. At present, the Company has exported scientific and technological services and overall supply chain solutions in
FMCG, shoes and apparel, cosmetics, 3C, home furnishing, auto parts and other industries, which truly contributes to industrial
upgrading and high-quality development.
SF Holding is also a smart logistics operator with network scale advantages, boasting an operating model with strong
management and control over the whole network by leveraging on its powerful information system and efficient integration of
multiple networks and business segments. All business segments and branches of SF Holding come under the unified control and
management of its headquarters. The headquarters organizes pick-up, delivery, distributed processing and transit transportation in a
unified way within its business scope, and independently allocates network resources based on its actual needs for business
development. Also, the Company uses a wide range of information technologies to guarantee the implementation of unified standards
in the entire network, and establishes several industry-leading business information systems to guarantee the overall operational
quality of the network. SF Holding has a gigantic logistics network at home and abroad, including an “aviation network” consisting
of all-cargo aircraft, commercial flight and drones; a “ground network” consisting of operating service points, transit and distribution
service points, land transportation networks, customer hotline networks, and last mile networks; and an “information network”
consisting of various types of big data, block-chain, cloud computing, machine learning and planning optimization, smart logistics
map, Internet of Things (IoT) and so on. The three networks are integrated into one “aviation + ground + information” network. This
SF network is a comprehensive logistics network system with the most powerful network control, the highest stability, and the most
unique resources in the industry domestically.

S.F. Holding Co., Ltd. 2021 Semi-Annual Report
19
(III) Overall performance of the Company during the first half of 2021
1. Overall financial performance
Over its 28 years of development, SF Holding has upheld long-termism, and has built a solid network foundation and excellent
service capabilities by adhering to a forward-looking and leading-edge strategic layout around its corporate vision and mission.
Especially when emergencies such as the pandemic occured, it has demonstrated strong network operation and risk resistance,
providing a strong guarantee for the normal production and operation of the society and residents' lives. Under the recurring global
pandemic and China's entry into the "new normal" of fighting against pandemic, key changes are taking place in the domestic and
international environment, macroeconomic landscape, industrial development and industry trends. Our future national industries will
be developed towards promoting the new development pattern of“dual circulation", strengthening the competitive advantage of
national industry chain, accelerating the high-quality development of manufacturing and service industry, building a digital supply
chain and improving the overall quality and level of industry chain. The express logistics industry, as the core carrier that connects
the upstream and downstream of the industry chain and merchants and consumers, is undergoing a historic and critical period for
industrial upgrading.
With a deep understanding of the industry development trend and maintaining its strategic direction, the Company has been well
poised for historical opportunities. 2021 is a key year for the Company to build on past successes to further advance our cause. The
Company insists on expanding diversified business markets of express delivery, freight, cold chain, intra-city, international and
supply chain to build comprehensive service strength and long-term core competitiveness, solidify the new growth curve and
maintain long-term and sustainable development. In the first half of 2021, the Company recorded 5.13 billion shipments for its
express & logistics service, achieving year-on-year growth of 40.4% and a two-year average growth of 59.5%, higher than the
industry's two-year average growth rate of 33.4%, despite the high base of shipments that benefited from the outbreak of demand for
anti-pandemic emergency delivery in the same period last year. Meanwhile, relying on its integrated logistics service capabilities
covering various industries and application scenarios, the Company penetrated into all aspects of the customer's supply chain and
served the digital transformation of the industry chain and supply chain by providing data technology service solutions for various
industries with its rich practical experience in logistics scenarios and based on leading technology and hardware and software system
integration capabilities.

S.F. Holding Co., Ltd. 2021 Semi-Annual Report
20
The Company’s key financial indicators are shown in the table below:
Item Indicator
Current
reporting
period
The same
period for
previous year
Increase/decrease over the same
period for previous year
Shipment
Shipments of express logistic business
note 1 (RMB billion) 5.131 3.655 40.37%
Average revenue per shipment of
express logistic business note 1 (RMB) 15.94 18.39 -13.32%
Item Indicator
Current
reporting
period
The same
period for
previous year
Increase/decrease over the same
period for previous year
Income
statement
Revenue (RMB billion) 88.344 71.129 24.20%
Net profit attributable to shareholders
of the parent company (RMB billion) 0.760 3.762 -79.80%
Net profit attributable to shareholders
of the parent company after deducting
non-recurring profit or loss (RMB billion)
-0.477 3.445 -113.85%
Weighted average return on net assets 1.34% 8.51% A decrease of 7.17 percentage
points
Earnings per share (RMB/share) 0.17 0.85 -80.00%
Item Indicator
End of current
reporting
period
End of
previous year
Increase/decrease over previous
year end
Balance sheet
Total assets (RMB billion) 133.393 111.160 20.00%
Total equity attributable to shareholders
of the parent company (RMB billion) 56.681 56.443 0.42%
Debt to asset ratio 57.04% 48.94% An increase of 8.10 percentage
points
Note 1: “Express logistics business” includes the Company’s time-definite express, economy express, freight, cold chain and pharmaceuticals, intra-city instant delivery and
international express business, but does not include supply chain and other segments.
Revenue: In the first half of 2021, the Company generated total revenue of RMB88.344 billion, representing a year-on-year
growth of 24.20% and a two-year average growth of 32.82%, higher than the two-year growth rate of 19.40% in the industry. The
Company has optimized and upgraded its time-definite products note 2 since this April, and the revenue from time-definite express
business increased by 6.50% year-on-year based on the product data for the reporting period and the same period for previous year
adjusted retroactively according to new classifications. The slowdown in growth was mainly due to the high demand for delivery of
emergency epidemic prevention supplies during the pandemic last year, resulting in a larger increment of the time-definite business
and a higher base year-on-year. The economy express business under new standards mainly serves the main e-commerce market,
providing products focusing on cost efficiency and high-quality e-commerce delivery service, and the business grew rapidly with
revenue increasing by 69.16% year-on-year. In addition to the express business, under the Company's strategy of actively expanding
new business markets, other new business segments have continued to maintain rapid growth, with aggregate revenue increasing by
43.77% year-on-year, contributing more than 48% of the revenue growth and increasing the proportion of total revenue from 26.69%
in the same period for previous year to 30.89% in the reporting period.
Note 2: The adjustments and changes of main products involved in product optimization and upgrading are explained in detail in 4. “We will continue to optimize product
stratification and improve product matrix to meet the diversified needs of customers and gain new growth drivers” under “(III) The Company's overall business situation in the first half
of 2021”.
Profit: In the first half of 2021, the Company generated a net profit attributable to shareholders of the parent company (“net
profit”) of RMB0.760 billion, representing a year-on-year decline of 79.80%, of which, RMB-0.989 billion was from the first quarter
and RMB1.749 billion was from the second quarter. The Company also generated a net profit attributable to shareholders of the
parent company after deducting non-recurring profit or loss (“net profit after deduction of non-recurring profit or loss”) of

S.F. Holding Co., Ltd. 2021 Semi-Annual Report
21
RMB-0.477 billion, representing a year-on-year decline of 113.85%, of which, RMB-1.134 billion was from the first quarter and
RMB0.657 billion was from the second quarter. The non-recurring profit or loss Note 3 in the first half of 2021 mainly represented the
gain on disposal of the Company’s interest in three property assets located in Foshan, Wuhu and Hong Kong to SF REIT, and
government grants, etc.
Note 3: For details, please refer to “VI Non-Recurring Profit or Loss”under Chapter 2 “Company Profile and Key Financial Indicators”.
Due to the strong demand for delivery of emergency epidemic prevention supplies during the pandemic last year and the
increasing demand for delivery resulting from the rapid increase of online consumption penetration in the post-pandemic era, the
Company has continuously improved its product matrix and vigorously explored new markets, leading to a rapid expansion of
business scale and a significant growth in business volume of 68.46% in 2020. In the first half of this year,the Company still
maintained a good growth momentum and achieved a growth in business volume of 40.37% on the basis of the high base of the same
period for previous year, further expanding the network business volume. However, the pandemic in last year also disrupted the
Company's normal schedule of network expansion, coupled with the delay of investment in capital expenditure and the surge in
business volume, resulting in significant capacity bottlenecks in many parts of the express delivery network during the peak season in
the fourth quarter of last year, affecting network operation efficiency.
In order to enhance the network processing capacity and guarantee the timeliness and service stability, as well as based on the
Company's development direction of grasping the historical opportunities in the industry, continuously enhancing the comprehensive
logistics service capacity and creating digital supply chain solutions, the Company has accelerated the network development of
diversified business segments, and invested additional resources in transit sites and automation equipment, transportation capacity in
trunk and branch routes, etc. since the fourth quarter of last year and up to this year, so as to consolidate its operation infrastructure,
improve its processing capacity and efficiency, resolve the capacity bottleneck caused by slow investment in the early stage, and
support the rapid development of its businesses in the long run. The concentration of costs and expenses resulted from such resource
investment has led to the pressure on the Company's profit in the first half of this year. At the same time, in response to the policy not
to return to hometown during Spring Festival holiday in the first quarter of this year, the Company has given adequate care and
incentive to the staff left on duty, and thus the number of staff on duty during the Spring Festival such as collectors, warehousemen
and transit operators and salary costs increased significantly, which also brought temporary one-off impact on the Company's
profitability. In addition, the economy express products of the Company which mainly serve in the main e-commerce market has
recorded faster growth; however, such growth has an impact on the overall gross margin level to a certain extent because of the low
pricing of products of this segment.
Net profit after deducting non-recurring profit or loss in the second quarter of 2021 increased by approximately RMB1.791
billion as compared with the first quarter, and the performance achieved quarter on quarter improvement, which was because during
the reporting period, the Company has also continued to review the resource allocation of each business line, strengthened the
resource integration and optimization of the sites and routes of the express network, freight network, warehousing network and
franchise network, and continued to carry out the upgrading and transformation of automation equipment in transit fields, which
gradually alleviated the capacity bottleneck and caused the resource utilization rate, operation efficiency and other indicators in the
second quarter to steadily increase as compared with the first quarter. At the same time, the Company continued to strengthen refined
cost control to facilitate dilution of fixed asset costs along with the growth of business volume, realizing the scale effect. At the same
time, benefiting from the Company’s continued investment in digital, intelligent and visualization technology to help streamline the
organization and raise management efficiency, the costs continued to decline.
According to the segment report note 4, the Company generated a total profit of RMB1.093 billion in the first half of 2021, of

S.F. Holding Co., Ltd. 2021 Semi-Annual Report
22
which the express segment accounted for a total profit of RMB1.514 billion, representing a decrease as compared with that of
corresponding period of last year. As disclosed above, such decrease was attributable to the cost increased rapidly due to the overall
network resources were concentrated on increasing investment this year, as well as the gross margin under pressure due to the rapid
increase in proportion of the economical courier product business with relatively low price. The total loss of the Freight segment was
RMB0.508 billion, which was mainly attributable to the Company’s promotion of the four networks integration, acceleration of
express network construction, and enhancement of the transportation capacity of main and branch lines and improvement of the
efficiency of land transportation. Other segments recorded a total profit of RMB0.076 billion, which was due to, on one hand, the
new businesses in the growth period did not make profit contribution as a result of the continued expansion in new business markets
by the Company, and on other hand, the transfer of interests in three property assets that located in Foshan, Wuhu and Hong Kong to
SF Real Estate Investment Trust by the Company for a lump-sum disposal gains note 3.
The above investment will exert pressure on the profitability of the Company in the short term, but in the long term, it will assist
the Company in further consolidating the service capability of diversified business that centered on the logistics supply chain ecology,
and accumulating massive data and practical experience in more industries and scenarios. Combined with our technology that assists
customers in digital supply chain transformation, the Company will truly become an independent third-party industry solutions data
technology service company.
Unit: RMB billion
Item Express segment Freight segment Others Inter-segment
elimination Total
Revenue from external
customers 66.505 13.399 8.440 - 88.344
Inter-segment revenue 5.275 1.156 5.243 -11.675 -
Total profit/(loss) 1.514 -0.508 0.076 0.011 1.093
Income tax expenses 0.536 0.073 0.066 0.003 0.677
Net profit/(loss) 0.978 -0.580 0.011 0.008 0.416
Gross profit margin 12.05% 1.25% 7.74% / 10.10%
Net profit margin 1.36% -3.99% 0.08% / 0.47%
Note 4: Please see Note 7(a) to “Financial Statements in Chapter 10” for details of segmental reporting. The express segment mainly includes single piece express delivery that
under 20KG, such as the time-definite express, economy product, cold chain and pharmaceuticals products, , and international express etc. The freight segment mainly includes freight
business and single piece express delivery that above 20KG. Other segments mainly include intra-city, supply chain, other incubating new businesses and undistributed parts.
Financial status: As of the end of the reporting period, the Company had total assets of RMB133.393billion, representing an
increase of 20.00% compared to the end of 2020. Net assets attributable to shareholders of the Company totalled RMB56.681 billion,
representing an increase of 0.42% compared to the end of 2020. As of the end of the reporting period, the gearing ratios of the
Company increased from 48.94% as at 31 December 2020 to 57.04% as at 30 June 2021. Such increase was mainly attributable to the
increase in both right-of-use assets and lease liabilities as result of the adoption of new accounting standard for lease by the Company
for the year, as well as additional external debt financing required by the Company to support the necessary capital expenditures due
to the year-on-year decrease in net operating cash flow as result of acceleration of the investment in the construction of the business
networks and increase in the cost of compensation subsidies for front-line employees by the Company in the first half of the year.
The Company also announced the proposal of non-public A share offering in February of this year. The Company intended to issue
shares to not more than 35 specific investors and raised proceedings of not more than RMB20 billion to upgrade of the express
delivery equipment automation, support the construction of the Ezhou airport logisitc centre project in Hubei, the development of
digital intelligent supply chain system solutions, land transportation capacity improvements, aviation material procument and

S.F. Holding Co., Ltd. 2021 Semi-Annual Report
23
maintenance projects, and supplement of working capital. The proposal was approved by the Issuance Review Committee of CSRC
in May 31 of this year. Upon obtaining the official approval, the Company will make issuance at an appropriate time and raise not
more than RMB20 billion. At that time, the debt ratio of the Company will be further reduced, and the financial situation will remain
stable.
2. We have adopted a proactive marketing strategy covering both deep-dive and new expansion, continuously
improving customer experience and loyality
In 2021, the Company has continued to focus on industry characteristics, focusing on contextualisation, digitisation and further
refinement, digging deeper into customer requirements, and continuing to improve its ability to serve its customers as well as the
customer experience, and increase customer loyalty. In addition, the Company starts from the application scenarios of customers to
drill into their requirements for different use cases within the end-to-end whole process, so as to optimizes the product mix, refine
product and service standards and enable the development of the solution capability. Meanwhile, it continues to optimize operation
model and enhance resource efficiency, providing customers with cost-effective services and assisting customers in cost reduction
and efficiency improvement, therefore ensuring the steady and healthy growth of our customers and our businesses.
Credit account customers: In the first half of 2021, based on the guiding principle of deepening customer scenarios,
broadening business fields and expanding business scope, the Company adhered to a management model oriented by customer
stratification, industry perspectives and scenario classification, and realised reasonable and differentiated pricing of services based on
different characteristics and needs of customers. Also, relying on the big data platform and smart domain system of SF Technology,
the Company achieved the process-wide visualization, traceability and verification of customer cooperation data, improved the flat
customer demand solution channel, and responded to and addressed customers’ demands in a timely manner. According to the
scenarios of customer logistics supply chain in different industries, the Company deeply engaged in the upstream and downstream of

S.F. Holding Co., Ltd. 2021 Semi-Annual Report
24
customers’ industry chains, and made logistics product portfolios cross-selling to comprehensively improve cooperation loyalty of
customers, and therefore further improving our industrial solution capability.
As of the end of the reporting period, the number of active credit account customers had reached 1.55 million. In the first half of
2021, revenue from credit account customers recorded year-on-year growth of over 32%, with an increase of 23% in customers with
monthly sales in excess of RMB10,000. The proportion of customers with monthly sales at the RMB1 million level has also
gradually increased, while the portion of customers in the e-commerce field has steadily increased, and the customer structure has
continued to optimise.
Retail customers: In the first half of 2021, the Company expanded the retail business for time-defined products and extended
online shopping product returns business. In addition, by virtue of science and technology intelligence platform, based on the
intelligent big data unit area, the Company further explored the consumer demand scenarios and launched targeted special services
such as family express delivery, charity express delivery and enterprise employee benefits. By constantly iterating new business
models, the Company met the delivery needs of users in social, charity, shopping, business travel, entertainment, medical and other
scenarios. In terms of offline channels, the Company set up the operation and management system of third-party co-distribution
service providers, and adopts scientific models of courier and channel delivery, so as to strengthen channel operation and
management and improve service precision. At the same time, with the help of continuous iteration of digital intelligent tools, the
Company supported the accurate investment of resources on the front line of business. In terms of online channels, through
continuous innovation and optimization, the automated operation system based on the whole life cycle of users has been improved.
As of the end of the reporting period, individual member numbers had reached 439 million, representing an increase of 15.5%
compared to the end of 2020. There were over 100 million online monthly active users, and the active users on SF Express APP
presented a year-on-year growth of exceeding 100%.
3. Improving the collaboration of the four networks, optimising the network-based operating model, and driving
integration of resources and capacity
In the first half of 2021, centering on the development direction of enhancing comprehensive logistics service capacity and
building digital supply chain solutions, the Company further enhanced the investment in system intelligent construction and
automation equipment, continued to deepen the resource integration among diverse business segments and optimised the
process-whole operation model. Through intensive cost management, the Company continued to release resources and production
capacity, promoted the synchronous improvement of operation effectiveness, efficiency and quality, thereby consolidating our core
competitiveness.
Network integration:In the first half of the year, the Company fully launched the four-network integration in more than 100
cities across China, which strengthened the integration and optimization of the site and route resources of our express network,
freight network, warehousing network and franchise network, and promoted cost optimization and timeliness improvement
through duplicated network convergence. As of the end of the reporting period, most of oversize express delivery in the express
delivery network has been integrated into the freight delivery network for processing, and about 1,200 trunk routes has been
optimized and integrated, accounting for about 5% of the trunk routes. There is still room for further integration in the future. While
improving the operation efficiency of the automated transit for traditional small parcel express, the timeliness of freight network
services mainly for large parcel has also been significantly improved by increasing the frequency of and straightening the trunk
routes, and the life time of the whole process of large parcel has been shortened to 42 hours. The consolidation of foundation

S.F. Holding Co., Ltd. 2021 Semi-Annual Report
25
capability and the promotion of production capacity brought by the four-network integration will further lay an efficient operation
foundation for the business peak in the second half of the year. Intelligent construction of the system: We will continue to
strengthen the intelligent construction and application of the operation system, such as smart transportation platform and aviation
resources management system, through further intelligent and accurate resource allocation, which not only effectively integrates
multiple resources, but also highlights the scale effect to achieve the double improvement of quality and efficiency. Investment in
automation equipment: We will continue to carry out the upgrade and transformation of the automation equipment in transit fields,
and at the same time, combine the fast and slow separation and sub-sorting to further release part of the transit capacity. As of the end
of the reporting period, a total of 33 sets of automated sorting machine for small parcel and 306 sets of sorting machine for single
delivery items were put into use in the first half of the year, and the processing efficiency of transit operators increased 16.95%
year-on-year. In the second half of the year, we will continue to promote the construction of transit sites in the same area of the park
and increase the investment in small and large automation equipment to further enhance the overall production capacity of the
network and meet the business peak. Model optimization: We will continue to optimize the operating model of the whole link
through the continued promotion of containerized transport, regional direct distribution and shipping, direct delivery at transit depots
and other models, which have effectively reduced pressure on the allocation and warehouse management links. As of the end of the
reporting period, the efficiency of warehouse management increased 28.65% year-on-year. Cost refined management: Depending
on the solid digital technology infrastructure, the Company has continuously strengthened the refined investment and control of the
whole link cost of receiving, transferring, transporting and dispatching, built a system model to monitor the rationality of resource
investment, and promoted the improvement of resource utilization and operation efficiency.
Beneficial from the above measures, the network operation efficiency of each business segment of the Company has been
improved. With the continuous growth of business volume, the efficiency of resource use has been gradually improved compared to
the corresponding period of last year. However, the overall network optimization, especially the integration construction of transit
fields, needs to be carried out gradually, and there is still much room for improvement in efficiency and benefit brought by
automation equipment investment and routes integration. In the future, the Company will also strengthen the refined management
and control of the costs of each operation link, improve the matching degree of resource investment, and ensure the high growth of
business while achieving more reasonable returns of benefits.
4. Continuously optimising product segmentation and product matrix, capturing growth momentum by fulfilling
divsified needs of our customers
SF has always been adhering to the product design philosophy of “user-centric, demand-driven and experience-based”, and
continuously providing customers with high-quality service experience. Based on the change in market environment and diverse
needs of customers, SF constantly improves the product and service system.

S.F. Holding Co., Ltd. 2021 Semi-Annual Report
26
(1) Express
Time-definite Express: As the pioneer of time-definite express in the express delivery industry, the Company continued to
cultivate medium and high-end express market. In the first half of this year, the Company completed the optimization and upgrade of
time-definite products system, expanded the moat, and consolidated the pioneering advantages of time-definite express, while
enriching and improving product matrix in order to meet diverse needs of customers. The time-definite products after optimization
and upgrade mainly included SF Same Day Delivery, SF Speedy Express and SF Standard Express. SF Same Day Delivery provides
customers with high efficient delivery service of same-day mailing and same-day delivery. As of the first half of the year, this service
has covered 191 cities, and will continue to expand its service scope. SF Speedy Express is committed to provide customers with
delivery service that is “fast, punctual and stable” and has covered more than 90,000 flow directions across China. Second day
delivery can be achieved in most main urban areas, and the next morning delivery can be achieved in some cities. The new
generation of SF Standard Express provides customers with delivery service of "better prices, stable timeliness, and worry-free
consignment". It is still a product with leading timeliness and cost-effectiveness, with service covering all over the country and
collaborating with multiple transport capacity to meet the diverse needs of delivery. Of these, based on the consistency of service
timeliness standard, pricing standard and operation standard, the standard land transport products originally belonging to the
economic express segment are simultaneously upgraded int the new generation of SF Standard Express product.
Therefore, during the report period, according to the new statistics caliber after product optimization and upgrade and the
synchronously retrospective data of the same period last year, the Company’s time-definite express business of recorded a
tax-exclusive revenue of RMB46.161 billion in the first half of 2021, representing a year-on-year increase of 6.50%. The slowdown
in growth was mainly due to the strong demand for emergency delivery during the epidemic period last year, resulting in a large

S.F. Holding Co., Ltd. 2021 Semi-Annual Report
27
increment of time-definite express business, and a high year-on-year base. In the future, time-definite express service will grasp the
increase in online shopping penetration rate and the opportunities of transformation and upgrading of the manufacturing industry,
aiming at high-end e-commerce consumption and manufacturing sectors. With the establishment of future cargo airport hubs, we will
continue to improve the time efficiency of inter-delivery between key cities, improve the efficiency of aviation resources and
strengthen the coordination of the air-ground model, so as to further enhance the delivery capacity and stability, and stabilize the
high-end market share.
Economy express: Regarding to the market strategy of the economic express sector, SF gradually implemented the "two
brands" strategy. According to the different needs of customers, we provide E-commerce Standard Express/SF Economy Express
products for the e-commerce market above the average level, and Fengwang Express products for customers to choose, which are
operated in franchise mode and serve the sinking e-commerce market. As a new e-commerce flagship product of SF Holding’s
self-operation, the timeliness of E-commerce Standard Express got fully improved. Compared with SF Economy Express, 83% of
the standard route timeliness of E-commerce Standard Express got faster by one day, and it also provides door-to-door service,
demonstrating the brand concept of "speed + warmth" of SF. SF Economy Express product remained positioning itself in route filling
with timeliness and price slightly lower than E-commerce Standard Express, but still equipped with door-to-door service. At the same
time, the Company was also gradually optimizing its customer structure, directing high-quality customers to upgrade to E-commerce
Standard Express product, and it will also manage and control the resouces allocation during the peak period to ensure that the
corresponding resource and cost input are more matched with the products positioning, so as to increase the product profitability.
Fengwang Express is an independent brand of our Company for franchise-based express developing in the e-commerce market in
lower-tier cities and focused on the construction of network capacity and independent service system in the first half of 2021 by
building a franchisee network at both the collecting and dispatching ends and fully leveraging on the advantages of integration with
SF Express in the transit and transportation links, as well as expanding its own network based on the effective use of marginal
capacity.
According to the new caliber statistics after product optimization and upgrading and synchronously retrospecting the data of the
same period last year, the Company's economy express business achieved revenue after tax of RMB14.890 billion in the first half of
2021, an increase of 69.16% year-on-year, representing the strong growth trend continued with a year-on-year growth rate above the
industry level and an increasing market share of e-commerce.
(2) Freight
The less-than-truck-load industry is a trillion-dollar market, which is in the stage of scale and accelerated industry consolidation.
Unlike the highly concentrated and seemingly highly standardised and scaled express delivery industry, concentration in the
less-than-truck-load industry is still relatively low, offering major potential for market development and integration. With the
upgrading of industry and consumption, the demand for logistics supply chain is gradually flattening and flexibilizing, and
small-batch, high-frequency and fragmented orders has increased significantly. Meanwhile, as channels becoming diversified, small
and medium-sized enterprises are also gradually entering into domestic and international markets, covering more remote customers,
resulting a wider logistics network coverage and higher cost performance. To C consumer supply chain is accelerating the
transformation of consumption patterns with the normalization of the epidemic prevention which leading to a more fragmented,
flexible and diversified logistics services demand, while the demand in To B industry supply chain market is going toward high-end
and integrated due to the supply-side structural reform. In addition, with the reconstruction of regional industrial structure,

S.F. Holding Co., Ltd. 2021 Semi-Annual Report
28
development of community group purchase and the growing export trading due to the epidemic, metropolitan freight and
cross-border logistics market also ushered in development opportunities.
Based on the changes in market and customer demand, SF Freight(顺丰快运), leveraging on the Group's brand and network
advantages, continues to increase resource investment to improve the timeliness of large-scale parcel and service consistently. It also
expanded its services to To C large-scale parcel delivery, To B small-batch allocation, large-batch transfer and full-truck-load
transportation through SF Freight directly operated network, SX Freight(顺心捷达) franchise network and flexible resource
cooperation mode, and the standard express product service system achieved full coverage from small to large, from high-end to
affordable. The directly operated network provides high-end products and personalized extension services on the ends, while SX
Freight builds a strengthened middle business service network based on franchise model to provide customers with timely, stable
quality and cost-effective product services. The resource cooperation model provides point-to-point direct delivery with lower cost
catering for the demand for supply chain services that emphasizing direct delivery than relying on network. At the same time, we
continue to strengthen the terminal To C to home delivery and other extended services, To B large parcel fulfillment and warehousing
services to build a relative shaped terminal differentiated/personalized service system, providing customers with a more
comprehensive and high-quality service experience, so as to further consolidate the barriers in terminal service. As of the end of June
2021, the orders of SF Freight one-stop home delivery service increased by over 400% year-on-year with the service timeliness rate
of 99.29%, and the service products increased by 45% year-on-year. In addition, SF Freight continued improving its service
capabilities in metropolitan freight and cross-border logistics, and constructed a product service matrix covering the whole process of
large-scale parcel logistics in diversified scenarios.
The unswerving technology-based operation model is the core foundation for the growth of SF Freight . By applying innovative
technology tools and system, the all-round intelligent technology relating to collecting, transferring, transporting and dispatching
helps to reduce cost and increase efficiency and ultimiately build our core competitiveness. The investment in SF Freight transit
equipment has increased by over 300% as compared to last year, including six-sided scanners, pendulum wheel automatic sorting,
module belt automatic sorting, intelligent sorting carts, Shentong monitoring (神瞳监控), etc. During the shopping festival of "618"
this year, the peak volume and the processed volume increased by 36% and 325% year-on-year respectively, while the operating
efficiency improved by 12% and the customer satisfaction reached 98.96%. As of June 2021, SF Freight’s self-operated and franchise
network comprised a total of 192 transit depots and collection and dispatch points and over 1,600collection and delivery points with a
total surface area of more than 3.9 million square meters, and daily loading capacity of 233,000 tonnes. We operate 3,292 trunk
routes, over 11,000 branch routes, a network of 12,355 franchise outlets, and provide business coverage across 32 provinces and 365
major cities and areas nationwide.
The effective integration between freight network and express network, directly operated network and franchise network will
help reduce costs and increase efficiency and improve operational management efficiency. The integration of the operation planning
and in-process control and management of each network, on the one hand, effectively improves management and scheduling
efficiency, and on the other hand, realizes the centralized operation of large-size business in the SF Freight system. While the cost
structure is optimized, the delivery time of large-size items is obviously accelerated, and the customer service experience is further
improved. At the same time, the collaboration between SF Freight and SX Freight in terms of management, venue routes and
technology is becoming more mature. Through the unified management of theintermediate platform, the integration of vehicle lines
and venues, the operation efficiency and timeliness are rapidly improved, and the cost is continuously optimized. The mutual
empowerment and coordinated development of direct operation and franchise are realized, which will bring greater impetus to the
development of SF Freight' business. In 2020, the cumulative cargo volume of directly operated network and franchise freight

S.F. Holding Co., Ltd. 2021 Semi-Annual Report
29
network has exceeded ten million tonnes.
In 2019 and 2020, a revenue from SF Freight’s less-than-truck-load has been ranked first in China's LTL industry for two
consecutive years. While achieving scale growth, SF Freight has also won a good customer reputation with its leading timeliness and
high-quality service, along with the continuous improvement of awareness and influence. In the first half of 2021, the freight
products of the Company generated an external overall revenue of RMB11.513 billion and year-on-year growth of 50.01%. Overall
LTL cargo volume recorded year-on-year growth of 81.3%, cargo volume of directly operated network recorded year-on-year growth
of 88.7% , and cargo volume of franchise network recorded year-on-year growth of 62.5%. Our revenue scale and business growth
rate remained at the top of the full-network LTL market players.
(3) Cold Chain and Pharmaceuticals
Food cold chain: According to experts from the Cold Chain Logistics Professional Committee of China Federation of Logistics
and Purchasing, China's cold chain logistics market will grow by 15%, the scale of the market will exceed RMB440.6 billion and the
total cold chain demand will increase to 305 million tonnes in 2021. With the rapid growth of fresh food retail and the recovery of the
catering industry, the scale of the cold chain logistics market has expanded rapidly. At the same time, under the “new normal” of
epidemic prevention and control, the government continues to strengthen the supervision of the food cold chain industry. As various
national macro policies being launched successively, the cold chain industry has entered a new historical stage, and the small,
scattered, and disorderd pattern of cold chain logistics has been improved. In 2020, the top 100 cold chain enterprises accounted for
18% of the total revenue in the industry, and the industry concentration has further improved. However, due to the high threshold of
cold chain infrastructure construction, the penetration rate of cold chain logistics is still low, and the circulation of agricultural
product related to cold chain transportation is much lower than 80%-90% of developed countries such as Europe, America and
Japan.
Meanwhile, as consumer perceptions and purchasing behaviors evolve, fresh food channels are demonstrating certain changes.
New e-commerce, new catering and new retail are rising, resulting in the further deepening of channel sinking with the gradual
shrinking of traditional channels. Therefore, the change of new mode is accelerated under the boost of information technology. As the
food consumption upgrade has fueled structural changes in the food supply chain, thus the market’s demand for cold chain
networking is booming. SF Cold Chain focuses on a network-based comprehensive cold chain service provider covering the whole
country, which enables it toseize the historical opportunity in the new development period of the cold chain industry.
SF Cold Chain products are designed with cold storage as the center, relying on the express network to create three cold chain
capabilities (warehousing network, trunk network and terminal city delivery network) and build a cold chain ecological platform,
with a view to provide industry customers with a full supply chain scene service and cooperation. As of the end of the reporting
period, SF Cold Chain has 35 food cold-storage facilities (excluding the cold-storage facilities of New Havi) with a total area of
201,000 square meters, covering 5 temperature zones for customers to make personalized choices; 159 food trunk routes, over 23,000
deployable refrigerated trucks, and over 200 sets of customized packaging solutions, serving 193 cities, opening 3,619 flow
directions, covering 1,052 districts and counties, and has drawed a SF Cold Chain network map covering the whole country. The
Company continues to innovate and reform in the cold chain "warehouse + delivery", and has been committed to providing
customers with comprehensive cold chain logistics solutions, which has won the Company’s recognition from many leading
customers in the industry. Up to now, SF Holding has cooperated with major customers in the ice cream industry, yogurt industry,
poultry industry and frozen pastry industry in the whole supply chain scenario, and has built supply chain solutions for sub-industries,

S.F. Holding Co., Ltd. 2021 Semi-Annual Report
30
with the ability of smart cold chain supply chain service.
In addition, in the field of fresh agricultural products delivery, SF Holding continues to boost the upward trend of agricultural
product. SF Holding actively responds to the rural revitalization call of governments at all levels, continues to increase the
investment of 30 million special funds, and expands the scope of rural revitalization to all 832 state-level poverty-stricken counties
and more than 240 provincial-level poverty-stricken counties that had been lifted out of poverty; SF Holding also cooperates with the
government and associations of the production area to boost the upward trend of agricultural product. Meanwhile, SF Holding
cooperates with the government to build regional brands to help the development of brands of important agricultural products, such
as litchi, cherry and waxberry. As a service provider to help the development of agricultural specialty products, SF Holding continues
to improve its logistics network, timeliness, packaging and preservation technology and other professional capabilities on the basis of
focusing on the entire industry chain. SF Holding is committed to providing users with more efficient and satisfactory services by
increasing the investment of special aircraft/bulk aviation/land transportation resources, introducing new equipment such as mobile
sorting vehicles, and deepening the transformation of mode,such as compartmentalised warehousing + on-site distribution, so as to
continuously improve the timeliness and quality and reduce customers' comprehensive logistics costs.
As one of the top 100 enterprises in China's cold chain industry, SF Cold Chain has responded to the call of the government and
has repeatedly become the industry standard setter. Since August 2020, SF Holding has participated in the preparation of certain
standards, such as "Specification for Cold-chain Logistics Service"(《冷链快递服务规范》) led by State Post Bureau, "General
Requirements for Air-ground Multimodal Transport for Cold Chain Cargo "(《冷链货物空陆联运通用要求》) led by China
Academy of Transportation Sciences, "Operation Specification of Cold-chain Logistics for Live Seafood"(《活体海产品冷链物流作
业规范》), "Packaging, Transport and Storage for Chilled and Frozen Foods in Logistics"(《冷藏、冷冻食品的物流包装、运输、
仓储》), “Code for Temperature Monitoring of Food Cold Storage”(《食品冷库温度监测规程》)and “Operation Specification for
Terminal Distribution Cold Chain of Food”(《食品冷链末端配送作业规范》)led by CCLC, and continues to lead the development
of domestic cold chain logistics industry. In June 2021, the Cold Chain Logistics Professional Committee of China Federation of
Logistics and Purchasing released the "2020 China Top 100 Cold Chain Logistics List", and SF Cold Chain ranked first for three
consecutive years.
Pharmaceutical logistics: In the first half of 2021, with the deepening of China’s pharmaceutical reform, internet clinic,
online settlement for medical insurance and other pilot work has been promoted. Due to the prevention and control of normalization
of COVID-19 and changes of consumers’ habits, more and more pharmaceuticals sales channel has been shifted from offline to retail
and online, and the transportation of pharmaceuticals has gradually showing the characteristics of small-batch, high-frequency and
home delivery, therefore putting forward higher requirements to the supply chain service capacity, quality and safety, emergency
response capacity and the expansion of service coverage of socialized pharmaceutical logistics enterprises,.
SF pharmaceutical continued to strengthen its development of pharmaceutical warehouse network and service network. As of
the end of the reporting period, SF Pharmaceutical’s network covered 240 prefecture-level cities and 2,068 districts and counties, and
operated 12 pharmaceutical warehouses (11 GSP-certified pharmaceutical facilities and 1 bespoke warehouses) with a total area of
approximately 170,000 square meters. Besides, SF Pharmaceutical was equipped with 292 self-owned refrigerated trucks
(GSP-validated) , with 50 pharmaceutical transportation trunk routing link hub cities nationwide, providing customers with a
professional, safe, process-wide controllable end-to-end pharmaceutical logistics supply chain solutions and services. Relying on its
own logistics network, technology foundation and leadership experience in intensive resource management, SF Pharmaceutical has
take the leading position in the pharmaceutical third-party logistics industry.

S.F. Holding Co., Ltd. 2021 Semi-Annual Report
31
With the business philosophy of "Delivering Health to the Public", SF Pharmaceutical managed to cover various fields such as
pharmaceutical manufacturers, vaccine makers, medical equipment, distributors, disease control centres and hospitals at all levels,
hospitals, chain store pharmacies, pharmaceutical e-commerce and other businesses. In 2021, SF Pharmaceutical passed the
assessment from Pharmaceutical Logistics under China Federation of Logistics and Purchasing (中国物流与采购联合会医药物流
分会) and became an official member of the Vaccine Transport Guarantee Working Group. Since the first service provided, it has
safely delivery of an aggregate of 180 million doses of COVID-19 vaccines. In terms of the cold chain transportation for biological
samples, IVD reagents, insulin, etc. and smart pharmaceutical logistics, SF Pharmaceutical can provide industry-leading
pharmaceutical cold chain packaging, integrated IoT Polar platform (ie. temperature and humidity, GPS routing and other
visualization and surveillance) to realize precise control for different temperature zones in the range from -80°C to 25°C, and carry
out instant O2O cold chain delivery, constant temperature transportation of 24-168 hours for medium to long distance, as well as
supporting temperature data output and on-site printing to cope with the increasingly diverse market demands of pharmaceutical
companies and medical institutions. Meanwhile, SF Pharmaceutical cooperates with major Chinese Web hospitals and DTP
pharmacies to solve the “last mile” service through technology-based solutions, realizing intra-city instant delivery capacity and
medicine cabinet delivery. Leverages SF’s early investment in technology, SF Pharmaceutical has empowered its pharmaceutical
customers with industry-leading warehousing and distribution logistics information systems, full visualisation and monitoring
platforms, digital supply chain service capabilities and algorithmic capabilities (such as technological warehouse network planning),
in order to reach in-depth strategic cooperation with its customers and tap into information, intelligence and digital development.
In the first half of 2021, the Company’s revenue generated from the cold chain and pharmaceutical business (including cold
chain of food and pharmaceutical logistics) amounted to RMB3.720 billion, representing a year-on-year increase of 14.79%.
(4) Intra-city instant delivery business
The local consumption market has realized rapid development with the prosperous development of macro-economy, vigorous
lower-tier markets and continuously upgraded resident consumption demands. Driven by the renovation of internet technology, new
consumption forms and business models have continuously emerged, and multiple private traffic flows such as applet, live broadcast
and short video, and self-owned online channels of merchants have been increasingly active, which has further stimulated the
diversified development of local consumption service scenarios and formation of instant consumption habits of residents, and
spawned a vast range of demands for instant delivery services. Thanks to the open and inclusive distribution network and
professional solutions, independent third-party real-time delivery service providers will further give play to its core infrastructure
function in new consumption with great prospects of future development.
Featuring the development concept of “high quality, high efficiency and full scenario”, SF Intra-city has become the largest
independent third-party real-time distribution service platform in China with an open ecosystem. S.F. Intra-city has provided
large-scale, customized and all-weather infrastructure support for merchants of new business forms and operators of private traffic
flows by continuously optimizing the service matrix and proactively expanding channel partners such as social media, e-commerce
platforms, SaaS service providers and logistics service providers. It has realized its nationwide network coverage in more than 1,000
counties and cities, and cooperated with over 2,000 merchants’ brands, serving in excess of 500 thousand merchants and 100 million
individual users, and realizing full coverage in business circles and 24h all-weather service in more cities, in order to create a
beautiful life of more people with instant service.
Based on the deep understanding of the new consumption trend in local life, S.F. Intra-city has initiated the multi-scenario

S.F. Holding Co., Ltd. 2021 Semi-Annual Report
32
business model in the industry, improved and consolidated its service system covering catering, fresh fruits and vegetables, cakes and
flowers, 3C digital, apparel, cosmetics, personal errand, life service, corporate service and last mile delivery. The extensive coverage
of multiple scenarios has contributed to the rapid growth of order quantity, and healthy and diversified order structure of S.F.
Intra-city, and stimulated the improvement in both business scale and efficiency through network effect and scale effect.
S.F. Intra-city has been fine-tuning industrial solutions, lean technology and digital operation capability following the
customer-oriented principle. On one hand, it has focused on the real-time logistics demands and pain points of customers in different
sub-sectors and produced bespoke and diversified solutions through in-depth data analysis on industrial characteristics and
performance, in order to help merchants, set up good brand images among consumers and display the competitive advantages of
differentiated service. On the other hand, centered on the intelligent real-time logistics system based on AI and big data technology, it
has created the optimal intelligent dispatch, pricing and routine planning, conducted capacity estimation, task planning, cost planning
and performance monitoring, and realized organic allocation of shopfront, commercial area and city-wide capacity. We manage to
maintain the fluctuation of time-sensitive rate at 3.5% and 2.5% even in adverse weather and peak hours of holidays, in order to
create first-class efficiency and high-quality service in the industry.
Much concerned about the eco-health of riders, S.F. Intra-city have established a comprehensive training system to improve and
expand their professional skills and promote the development of their individual capabilities. S.F. Intra-city offer 24h online service
to solve relevant problems at work and continuously optimize the experience of riders. We have also cooperated with SF Charity
Foundation to launch the “Million Riders Care Program”, with an aim of providing educational support for riders’ children and offer
aids to riders’ families in terms of medical demands. S.F. Intra-city aim to create friendly and sustainable working environment for
riders and comprehensively enhance their satisfaction and loyalty through warm concern and continuous improvement in riders’
safety and welfare.
In the first half of 2021, tax-exclusive revenue from the Company’s intra-city instant delivery products amounted to RMB2.241
billion, representing a year-on-year increase of 77.12%, much higher than the average growth rate of the industry.
(5) International business
SF International is committed to providing convenient and reliable logistics services, such as international express delivery,
international e-commerce, international freight forwarding, international warehousing, goods consolidation and forwarding services,
for domestic and foreign manufacturers, trading companies, cross-border e-commerce companies and consumers. In addition, we can
provide integrated and customized import/export supply chain solutions, including transportation, customs clearance, delivery,
warehousing and system, based on our customers’ needs.
SF International’s courier business has continued to grow and it serves 78 nations and regions around the world. In the first half
of the current year, eight new routes were opened, including those from Thailand to Europe, from Mainland China to South Africa,
and from Brazil to Mainland China. SF International’s e-commerce business covers 225 countries and regions around the world. By
exploring multi-faceted and in-depth cooperation with cross-border e-commerce platforms, e-commerce independent stations and
their underlying service providers, relying on our self-operated international air transport resources, our own customs clearance
guarantee capability, overseas local service teams and logistics networks, we are developing cross-border e-commerce logistics
ecosystem and helping domestic e-commerce companies to expand overseas while achieving stable growth of our own business.
SF International has continued to increase its basic transportation capacity and obtained a stable growth of its freight forwarding
services. It has dedicated to expand the international airline network and opened nine new international all-cargo aircraft routes

S.F. Holding Co., Ltd. 2021 Semi-Annual Report
33
including those from Shenzhen to Los Angeles, from Shenzhen to Manila, and from Wuhan to Hanoi. In the first half of the year, our
all-cargo aircraft carried a total volume of approximately 80,000 tonnes on international routes. In respect of maritime transport, we
have improved our acquisition capacity of shipping space through directly cooperating with well-known shipping companies in the
industry to achieve stable growth of our export business from China to Europe and America. In respect to rail transport, we have
successfully launched a self-operated express line between Chengdu and Cologne through Xi’an, Chongqing and Wuhan freight train
platforms to create SF International’s premium routes. Due to the impact of the COVID-19 pandemic, in many hospitals in
neighboring India, there was a shortage in medical supplies such as oxygen generators. In June 2021, SF International undertook the
transportation of 15,000 sets of oxygen generators purchased from East China to India for an Indian company. All tasks of materials
transportation were completed efficiently in batches with self-operated stable air freight capacity and logistics solutions customized
for its customers.
SF International has continued to make breakthroughs in international supply chain solutions. Based on our overseas supply
chain warehouses built in England, India, Thailand and so on, we have further formed a multi-spot layout of warehouse network in
Philippines and America, so as to strengthen our localized self-operation ability with the solutions of overseas warehousing and
distribution and help Chinese enterprises to expedite their overseas localized operation. As for the management of overseas
warehouses, we take the lead in passing the ISO9001, ISO14001 and ISO28001 international certification for self-operated overseas
warehouses in India in line with the international management standard. In addition, SF International has seized new opportunities
brought by the establishment of Hainan Free Trade Port, offering major international lines, intelligent warehouses and smart logistics
transportation services for cross-border e-commerce companies on the island and consumer good companies with free duty outside or
on the island, and providing end-to-end, customized and digital intelligent bonded logistics solutions for domestic and foreign
companies settling in Hainan.
During the first half of 2021, the revenue from the Company’s international express business amounted to RMB3.281 billion,
representing a year-on-year increase of 12.94%.
(6) Supply Chain Business
Relying on a complete product matrix and its integrated logistics service capabilities in terms of express delivery, freight, cold
chain, warehousing, intra-city instant delivery and international express delivery, combined with extensive and advanced experience
in supply chain of SF DSC (formerly named as “SF DHL”) and New Havi after M&A integration, SF Holding’s service covers all
parts of the supply chain from procurement, production, circulation, sales and after-sales in various industries, providing customers
end-to-end one-stop supply chain solutions with industry characteristics. Meanwhile, with the addition of industry-leading practical
ability of logistics scenarios in advanced technology areas such as artificial intelligence (AI), robot, Internet of Things (IoT), logistics
map and blockchain, SF Holding is focusing on technology to jointly reform traditional supply chain pattern with customers and to
promote the digital, automation and intelligent transformation of customers’ supply chains. It takes a customer-centered approach to
exactly predict their actual demands for guiding upfront procurement, production, storage and sales and then set up a supply chain
system with timely response, efficiency and flexibility.
In the first half of 2021, SF Holding continued to explore with its head customers to create industry technology services based
on the concept of digitisation, standardisation and product focus. It provides big data products about decision-making with
efficiency and accuracy of operational scenario improved by big data and algorithm, and smart supply chain products which
connect the upstream and downstream of industry chain and achieve a visible supply chain in all processes, omni-channel inventory

S.F. Holding Co., Ltd. 2021 Semi-Annual Report
34
system of “e-commerce shared inventory”, and efficient performance and delivery of orders, as well as online omni-channel tools
for store operation and management for companies, whereby it assists brands and retailers to achieve direct traffic and users
conversion with data perception, analysis and operations and optimize marketing decision-making. Therefore, it can further drive the
front-end production and turnover speed of the supply chain; quickly meet customers’ needs. Leveraging on digitalization and
intelligence, we can optimize and upgrade industry customers’ cost-generating supply chain into a new profit-making supply chain,
and make new business growth with customers. At present, technology service solutions have been widely applied to
industry-leading customers involved in fast-moving retail, clothing, shoes and hats, 3C, home appliances, auto parts, liquor, medicine
and finance sectors. We also offer whole-link D2C business chain solution covering from marketing and selling, commodity
management, forecasting and replenishment, fulfillment to smart stores. Only in the first half of this year the contract amount related
to technology service has exceeded RMB100 million. In the future, learning from the solutions of industry benchmark for customers,
we will build and constantly update the system of products, capabilities and services for “D2C SaaS + VAS” (standardized
application + value-added services), to help growing SMEs to gain new and sustainable business growth.
SF Holding has also continued to empower SF DSC and New Havi with technology as well as synergies within the network and
resources, driving the digital transformation and upgrading and new business growth of them.
SF DSC has fully embraced these market changes. Based on the customer and industry knowledge accumulated over its 30 years
of service experience and utilizing its self-developed modularized technological products as well as its capability to analyze
customers’ supply chains and formulate solutions, it can formulate man-and-machine soft solutions for B2B2C scenarios on a flexible
basis, and thus becomes a partner to customers’ supply chain transformation. Further, it also fosters benchmark customers in
high-tech, fast-moving consumer good, automotive, household and other industries, aiming to continuously precipitate and iterate
industry supply chain solution products, and form a scale effect by expanding to other upstream and midstream customers in the
industry. At the same time, with the continuous development of " dual cycle " economic momentum, demand of domestic high-tech
industry customers to go abroad and expand the global market has risen sharply. SF DSC proactively use its global vision and
resource network to provide domestic customers with a " package " of solutions covering whole course, in a view to connect
domestic and international supply chains via high quality services and support the sustained and stable development of its overseas
business. In the first half of 2021, SF DSC achieved high dual-digit growth in revenue. Such a revenue growth rate is significantly
ahead of the industry average, indicating that business potential continues to emerge.
New Havi is an integrated solution provider in the field of cold-chain logistics and supply chain, mainly serving for customers in
the catering and food industries. In the first half of 2021, the COVID-19 pandemic was rampant across the globe, which had an
imported impact on certain domestic areas. Catering and food industry still faced challenges. By constantly upholding a concept of
"Healthy Development", New Havi actively enhanced its "Internal Capabilities" and improved the integration and synergy within SF
Group, in order to turn challenges into opportunities and achieve continued and stable progress in epidemic prevention and control,
foundation construction and business development.
In terms of epidemic prevention and control, in response to the normalised trend, New Havi continues to strengthen the
nationwide prevention and control mechanism and implement all prevention and control measures in depth to ensure the supply for
customers, with an aim to ensure the safety of products, personnel and operations at all nodes of the supply chain. In terms of
foundation construction, New Havi takes business development as a fulcrum to continuously expand its logistics footprint in China.
On the one hand, it continues to expand in key cities across the country, with new logistics centers in Beijing and Tianjin now in
operation; on the other hand, the logistics network continues to extend to the west, namely Xinjiang and Tibet regions. As of the

S.F. Holding Co., Ltd. 2021 Semi-Annual Report
35
reporting period, New Havi has 45 efficient logistics centers in 29 cities across China. In addition, New Havi’s technology capability
has been further enhanced. It has gradually built up a technology structure with product development as the core to provide internal
support to optimize operational efficiency and offer external services to customers via high value-added technology solutions. As of
the reporting period, New Havi has attained 10 self-researched core system intellectual property rights. At the business aspect, we
rely on its advantages in technology, logistics network and its extensive experience in serving Chinese market. New Havi has made
dynamic adjustments to its business development strategies, such as establishing strategic cooperations and extending its product
lines to the upstream and downstream of supply chain, etc., thus New Havi 's service area and scope continue to expand. Thanks to its
flexible business strategies, its overall business still keeps an upward trend and has achieved dual-digit growth. In June of the year,
New Havi has received awards such as the China Federation of Logistics and Purchasing’s Cold Chain Logistics Expert Committee’s,
ranking fourth in the “2019 China Cold Chain Logistics top 100 Companies” and 2021 China Catering Industry Summit’s "China
Catering Supply Chain top 10 Organizations".
In the first half of 2021, the revenue from the Company’s supply chain business as a whole amounted to RMB5.294 billion,
representing a year-onyear increase of 79.02%, staying ahead of its peers in the industry.
II. Competitiveness Analysis
(I) The complete product matrix and the diversified services capability empower SF to become a highly
efficient and reliable social infrastructure provider
The Company maintains a diversified layout. Based on the established, efficient and time-definite express network and through
a two-wheel driving model of "Endogenous Development + Outward M&A", the Company continue to innovate and incubate new
business centring on the logistics ecosystem as well as invest in and acquire excellent logistics peers, in a view to gradually become
the No. 1 comprehensive logistics service provider in China that covers express, freight, cold chain and pharmaceuticals, intra-city
instant delivery, international express and supply chain. At the same time, the Company has developed different product sequences
for the corresponding market segments of each business segment in response to the diversified requirements of customers. The
Company has launched high-standard services that meet the high quality requirements of customers in the middle and high-end
market, and cost-effective services that can meet the business needs of customers in the sinking market. Through such a complete
product matrix and the organic combination of different products, we can deeply integrate into various business models and scenarios
of customers and provide comprehensive end-to-end one-stop and full-chain integrated logistics supply chain solutions.
In addition to its traditional strength as the industry leader in the time-definite Express, the Company had also achieved rapid
development in the new business areas with diversified strategic layout, establishing industry-leading network coverage and depth,
operational capability, innovative technology, service quality and brand image, and ranking top in terms of market share in respective
segments. According to the revenue ranking in the 2021 China top 30 LTL Enterprises in released by Freightlink Intelligence, SF
Express ranked in first and became the first enterprise in LTL industry with annual revenue exceeding RMB20 billion. SF ranked first
in the 2020 list of top 100 cold chain logistics enterprises in China released by China Federation of Logistics and Purchasing.
According to iResearch, SF Intra-city Express is the largest instant delivery service provider of independent third-party orders. In
addition, New Havi and Sf DSC were established by acquiring and integrating excellent supply chain enterprises to rapidly
accumulate and absorb international leading supply chain service experience and build complementary advantages. New businesses
other than express business have accounted for 30.9% of the Company's overall revenue, becoming a new growth driver for the

S.F. Holding Co., Ltd. 2021 Semi-Annual Report
36
Company. In a nearly RMB15 trillion market of China's logistics industry, Sf has broad opportunities to grow.

S.F. Holding Co., Ltd. 2021 Semi-Annual Report
37
In addition, the Company announced in February 2021 that it intended to acquire 931,209,117 shares of Kerry Logistics
Network Limited (“Kerry Logistics”) (approximately 51.8% of the issued share capital of the target company or 51.5% of the fully
diluted share capital) and cancel 51.8% of Kerry Logistics’ share options that had not been exercised as at the final vesting date held
by Kerry Logistics’s share option holders on behalf of the Kerry Logistics. The transaction, if successfully closed, will further
improve the company’s capability of integrating integrated logistics solutions and effectively supplement its resources and
capabilities in international freight forwarding, customs clearance and other aspects. In combination with SF Holding’s international
cargo airline resources and the target company’s extensive international freight forwarding network, this transaction will further
strengthen SF’s competitive advantage in international cross-border freight transport.
With its integrate product mix and multi-industry service capability, SF Holding 's businesses have penetrated various fields
such as industrial manufacturing, commercial circulation, agricultural products upward, food cold chain, pharmaceutical circulation,
cross-border trade and local life, which achieved an all-round business coverage. At the same time, through the flexible combination
of network resources and service capabilities, the Company can seize the new market opportunities, adapt to new business forms, and
even lead a new model of future supply chain development. In the manufacturing and distribution sectors, with its high efficiency
freight capacity and LTL end-to-end transportation, the Company facilitated production and distribution under the C2M and JIT
models, made a fast response to the small-batch and high-frequency packaging requirements, and turned around the high inventory
and low efficiency situation under the traditional mass production, multi-layered channel flow and multi-warehouse distribution. In
addition to the domestic market, SF Holding also actively conducting international route network layout, and working with the fast
fashion industry to make a rapid response to minimize overseas distribution costs and operational risks; meanwhile, leveraging on the
O2O model that integrated the online e-commerce and offline local life, SF Holding can access customer's global inventory data, so
as to match its product service at each timeliness level and provide user-friendly service that can fully meet the differentiated needs
of consumers and deliver goods from central warehouse/branch warehouse/front warehouse/store at minute level/day/next
day/customized date. For cold chain sector, the Company continues to upgrade cold storage automation, temperature-controlled
packaging technology and process-wide temperature control system to create a nationwide cold chain network, grasp the
development opportunity of the delayering demand for food cold chain and medical circulation channels under the trend of online
purchasing of fresh food and e-medical in China, and resolve consumers' livelihood and health needs without leaving home.
SF Holding will keep innovating, actively adapt to new business forms, new models and new trends, and promote supply chain
management and technological advancement in all industries. At the same time, against the epidemics and other special extreme
environmental challenges, the Company still able to guarantee the normal operation of social production and people's livelihood with
its strong network appeal and execution, thus became an efficient and stable social service supporter.
(II) Through development of digital and smart solution, driven by technological invocation, SF is leading
the logistics industry on the technology front
SF Holding is committed to becoming a data and technology-driven company providing independent third party solutions.
Based on its massive data and industrial experience acquired from diverse businesses, and industry-leading intelligent, digital
technology innovation, SF Holding empowers the transformation and upgrading of the industry’s supply chain. On the one hand, SF
Holding focuses on transformation and upgrading of the digital and smart logistics network and supply chain foundation system, and
creates SF’s “intelligent brain” by opening up the digital closed-loop of operation, sales and experience and other links and sectors, in
order to help improving customer experience while reducing operational costs. On the other hand, relied on rich technology products
and data assets, SF Holding combined with the characteristic scenarios of various industries to quickly empower external customers.

S.F. Holding Co., Ltd. 2021 Semi-Annual Report
38
In addition, by upgrading data and AI platform and basic technology platform, SF Holding further enhances its basic capabilities to
provide fast, universal and flexible support for business innovation and iteration. At the same time, SF Holding will continues to
consolidate its technological capability, increase investment in pre-research technology and lay out of emerging technologies such as
blockchain, privacy computing and unmanned X for long-term development by creating a virtuous innovation ecosystem focus on the
transformation of logistics and supply chain technology.
SF Holding had 3,427 patents and 1,892 copyrights awarded or under application. The number of invention patent applications
accounted for 57% of the total patent applications. SF Holding was granted awards including the “Leading Technology Achievement
Award 2021”, “Science and Technology Award for the Postal Industry” and “China’s Top 10 Leading Innovative Enterprises in Smart
Logistics”.
1. Diversified business, plentiful scenarios, accumulation of rich massive data and technology platform's middle
platform capabilities
(1) Diverse and massive data assets
Relying on its diversified business scenarios, SF deposits nearly 100 petabytes of massive data from multiple channels such as
receipt and dispatching, transportation, orders, supply chain and customer experience through IoT equipment, businesses tracking and
builds an elastic converged big data platform across multiple clouds and multiple centers for the storage and large-scale computing
needs of massive data, so as to escort SF’s digitalized and intelligent transformation and services.
(2) Efficient and flexible data platform
Based on self-developed underlying distributed computing, storage and scheduling structure, SF creates an ecologically oriented,
all-domain data sharing capability center, providing a one-stop data intelligence platform for the full-stack of data models, assets,
governance and operating, solving the challenges of data silo integration and security governance, so as to provide powerful data
support for enterprises to carry out business model innovation, drive organizational and process evolution.
(3) Advanced and secure technology platform
We build an advanced, secure, reliable and efficient cloud foundation to achieve comprehensive cloudization and servitization of
application systems and continuously reduce the cost of basic resources; through features such as elastic scaling of resources and
one-stop CI/CD R&D pipeline, we can significantly mitigate the constraints of technology deployment on businesses and flexibly
support business strategies.
2. Technology-driven digitalized and intelligent transformation to help refine internal operations and empowering
customers to transform their supply chain
(1) Logistics big data network digitalized and intelligent
Leveraging on big data, IoT, RPA, airlines direct connection and other smart technologies and measures, SF has deeply
digitalized all aspects and elements of logistics operations. Through accurate and real-time collection of resource information in
receipt and dispatching, transit and transportation, we obtain front-end dynamic and static business data, and rely on comprehensive
optimization of intelligent algorithms to drive the flexible allocation of all kinds of resources, and also conduct whole-cycle
refinement of process control to ensure the timely fulfillment of express shipments and reduce the cost of resource procurement and
use efficiency.

S.F. Holding Co., Ltd. 2021 Semi-Annual Report
39

S.F. Holding Co., Ltd. 2021 Semi-Annual Report
40
Receipt and dispatching: Based on AOI map, we combine prediction of piece volume and courier’s capability and other data to
conduct intelligent management of 410,000 couriers, complete the optimal matching of receipt and dispatching tasks with transport
resources, improve labour intensity of couriers and promote improvement of receipt and dispatching services.
Transit: We display the operation of transit fields in 2D/3D view on a real-time basis, and conduct digital grid management of
staff in transit field to improve its operating efficiency; an innovative mode of customs supervision for domestic and international
express shipments is achieved for the first time, and we adopt multiple real-time risk-controlled mechanisms for custom examination
and passing as well as efficient real-time dynamic sorting mode, to achieve common production lines, data sharing and full visibility,
and to build Asia's No. 1 high-frequency and time-sensitive all-cargo intelligent logistics aerial port.
Transportation: We refine and model control of the lifetime-cycle of air and land resources; upgrade trading model to support
diverse demand access and fulfillment capabilities.
(2) Supply chain foundation digitalized and intelligent
By building a self-built end-to-end supply chain foundation system with fully independent intellectual property right
(OMS/TMS/WMS/BMS), we connect all parts of supply chain business such as order, warehousing, transportation and settlement.
Meanwhile, we rely on SF’s warehousing, logistics network and year’s of experience in the industry, leveraging blockchain, ROS,
AIoT and other cutting-edge technologies to develop efficient resource matching and refined operation capabilities covering the
whole industry and realize digital management of the full-stack and the full scenario.
Furthermore, by integrating professional consulting, big data algorithms and R&D capabilities, we accumulate solutions for
demand forecasting, circular pickup, multi-level warehouse replenishment, network optimization, shop production selection
recommendation, park management, inhouse optimization, terminal consumer analysis and other scenarios, covering FMCG, 3C,
auto parts, beverage, medicine, government and enterprises and other industries,which help customers reduce costs and increase
efficiency, optimize marketing layout, and promote the upgrading of industrial digital intelligence.
3. Creating innovative technology products and providing data technology services for industry solutions
(1) Technology capability products
SF Trace: Based on self-developed trusted cross-chain components and privacy protection algorithms, it capitalizes the in-depth
technology integration of blockchain and Internet of Things (IoT), combined with SF Holding's basic logistics service capabilities,
to solve the problems of information data disconnection and bugsell in commodity channels in traditional traceability. SF Trace is
applied in various fields such as beverages, agricultural and sideline foods, cross-border commodities, and auto parts.
AI Argus: It integrates computer vision and edge computing technology to build an AIoT perception platform covering the
entire network. It analyzes the key production factors of each scene in real time with hundreds of thousands of sensing contacts,
forming real-time business dynamic data covering all scenes, thereby accumulating hundreds of millions of data assets and enriching
algorithm IP to ensure high algorithm accuracy. Starting from the logistics scenes of SF Holding, it rapidly expands the application
industry relying on lightweight, flexible, rapid deployment and independent iterative learning mode, provides customers with digital
intelligent management and operation solutions, and facilitates the digital transformation and upgrading of the industry.
(2) Smart logistics products
SF United-store: It focuses on enterprises in the apparel, footwear, and fast-moving retail industries, and provides them with
online and offline (O2O) order performance monitoring and after-sales processing, full-scenario smart logistics management

S.F. Holding Co., Ltd. 2021 Semi-Annual Report
41
(including tripartite logistics) and other SaaS-based services in various order fulfillment scenarios to help customers complete
full-link digital and intelligent transformation, refined business management and control, and cost reduction and efficiency
enhancement. It has served more than 5,000 customers, covering more than 200,000 stores in more than 20 sub-industries.
(3) Smart supply chain products
SF Cloud Chain: Relying on SF Holding's supply chain foundation matrix and AIoT, intelligent algorithms and other
technologies, it builds a service cluster with fully independent intellectual property right to provide lightweight SaaS-based product
services. Based on the product's strong expandability, it can flexibly serve customers in different industries, solve the pain points of
various scenarios, adapt to enterprises of different sizes, create a one-stop full-link solution for the supply chain, and help enterprises
quickly realize the innovation of supply chain management mode.
SF Network: Through the analysis of terminal demand and based on multi-factor considerations, multi-scenario configuration,
and multi-objective calculations, it can analyze and solve supply chain network problems such as high transportation costs,
cross-warehouse consignment, poor delivery timeliness, and low customer satisfaction, and provide planning-level optimization
solutions for warehouse networks, routes, inventory and product selection, with visual analysis results.
SF Cycle: For the inbound logistics scenario of manufacturing enterprises with many suppliers and large scale of production, it
gathers key parties such as OEMs, suppliers, and carriers through intelligent algorithms and system integration to provide loading
and distribution plan in the production of material, with an aim to realize milk run, solve the problems of information fragmentation,
short production plan lock-up period, and low resource utilization, and help enterprises improve resource utilization and optimize
manual experience.
4. Technology empowers safe and sustainable development, creating a win-win situation together
(1) Smart security control
Information security: SF Holding has continued to carry out the operation and optimization of the ISO27001 information
security management system and ISO27701 privacy information management system, established and improved the data compliance
system, and carries out grade protection evaluation of information system security. It has strengthened the control of sensitive data in
all aspects including logistics ordering, pickup, transfer, delivery, and signature, and continuously improved security protection
capabilities.
Business security: Using big data mining and machine learning technology, SF Holding has simulated risk behaviors in massive
air waybill data and established a multi-agent confrontation reinforcement learning system. In response to malicious claims,
marketing cheating, business profit-making and other scenarios, SF Holding has strictly controlled the illegal behaviors such as black
production, scalpers, and wool party activities, so as to avoid and restore the company's economic losses. It has accumulated general
risk control capabilities to achieve standardized output to credit, e-commerce, insurance and other industries.
(2) Sustainable packaging
Recycling packaging: SF Holding has created a brand-new recycling packaging and carrier operation management platform, to
provide customers inside and outside the industry with an overall recycling packaging solution, and upgraded the packaging carbon
emission evaluation algorithm and system. The recycling box has been recycled 21.8 million times.
Green packaging: Relying on the green packaging technology laboratory, SF Holding has carried out research and development
on reduction and degradation technology product solutions for plastic bags, tapes, and cushioning materials. In the first half of 2021,

S.F. Holding Co., Ltd. 2021 Semi-Annual Report
42
a total of about 18,000 tons of raw materials was saved, and carbon emission was reduced by about 35,000 tons.
(III) Our integrated technologies and solutions support corporate clients to digitalise their own supply
chain
Relying on its comprehensive logistics service capabilities and leading logistics technology capabilities, SF Holding has
continued to penetrate into the supply chain of various industries and Industrial Internet. It provides full-chain digital solutions
building on its diversified foundation and logistics technology capabilities, digging deep into the entire production and operation
chain of order planning, purchasing implementation, manufacturing, and delivery operations. It also provides a full set of services
such as business consulting, inventory optimization, warehouse network planning, warehousing management, transportation and
distribution, and reverse logistics. At present, it has covered 8 major industry head customers, including fast-moving retail, apparel
and footwear, beverages, auto parts, 3C, medicine, household appliances, and financial insurance, helping customers improve
their market competitiveness in terms of product, service, and cost, and move towards digital-intelligent transformation of the supply
chain.
Fast-moving retail industry: With the rapid development of D2C (Direct to Customer) scenes in social media and live
broadcasts such as WeChat, Tik Tok, and Kuaishou, changes in new retail format not only pose challenges for customers, but also
bring new opportunities to the logistics industry. The supply chain pain points and demands of various industries are becoming more
and more obvious. The fast-moving retail industry is mainly concentrated in SKUs, and its inventory involves expiration date and
safety, coupled with online and offline separation, frequent sales promotion, causing big challenges to inventory management, where
the coexistence of sluggishness and out-of-stock can be observed easily.

S.F. Holding Co., Ltd. 2021 Semi-Annual Report
43
In terms of solutions for the fast-moving retail industry, SF Holding has joined forces with beauty brand customers to create a
“e-commerce shared inventory” model, which mainly refers to the integration of inventory of different channels through the system
and the integration of inventory rights to achieve unified management of multi-channel inventory, thereby truly solving the
omni-channel inventory turnover problems of brands based on reasonable deployment and on-demand performance. It turns online
and offline logistics into real-time visualization and big data decision-making, realizing the circulation, control, optimization and
sharing of channel inventory in a material sense. On the one hand, it can integrate inventory of different channels to realize unified
management, optimize logistics costs, and reduce inventory and capital occupation. On the other hand, it can grasp the dynamic data
of consumers globally and use consumption behavior to force the upstream supply chain, which not only allows the entire supply
chain to operate efficiently, but also greatly increases the response speed and creates increments with a more on-demand shopping
experience.
In addition, based on the retail store scenario, we jointly innovated with the world's leading retail giants. Using real-time IoT big
data as well as efficient AI replenishment algorithms for shared inventories of regional warehouses, front warehouses, and stores, we
improved the inventory management efficiency of store staff by more than 90%, and sales increased by 10% year-on-year. In addition,
thanks to the added real-time data warehouses, real-time visibility of distribution and logistics operations of stores, and coordination
with more online and offline promotions, customers can get the goods they want on demand without being restricted by store
inventories, and can require the goods delivered directly with more personalized delivery requirements, which improves the intimacy
between customers and their consumers, and promotes the increase in sales of their brand's private domain fans.
3C communications industry: leading companies in the communications industry are faced with problems such as having too
many product matrices, wide global distribution of supply chains, and high management difficulties. And customers require in-depth
control over the upstream and downstream of the industry chain to achieve vertical integration of business processes. In response to
the volatility, complexity and uncertainty faced by the industry, SF continued to optimize algorithm models and systems, upgrade
logistics equipment and services, and provide customers in the 3C industry with agile, accurate, high-quality, and cost-effective
services, so as to gradually realize the transformation from a logistics delivery service partner to a strategic win-win partner.
As the overseas epidemic intensifies this year, the transportation capacity in Southeast Asia, which is an important region for the
production and assembly of raw materials in the consumer electronics industry, becomes the key demand and guarantee of industry
customers. SF integrated its own flights and external transportation capacity to open up the transportation capacity resources of 11
airlines at 6 ports in Hong Kong, Kunming, Chengdu, Xi'an, Shanghai, and Wuhan, which provided fast transportation response
capabilities for urgent orders of overseas factories’ urgently needed raw materials and overseas finished products for 3C customers,
and thus won a good reputation for agile response to the urgent needs of customers.
At the same time, during the peak of the new product launch of a leading electronic product company in the online shopping
festival on June 18 this year, SF’s industry solution project team coordinated 25,000 front warehouses in 323 cities across China and
it took less than 20 minutes on average to complete the first batch of orders from sale to delivery, with a sign-off rate of 100%, and
zero error rate, helping customers bring the ultimate timeliness and experience to consumers.

S.F. Holding Co., Ltd. 2021 Semi-Annual Report
44
Auto parts industry: Driven by macro policies such as carbon peak & carbon neutrality, the share of new energy & charging
piles is gradually increasing compared with the proportion of traditional OEMs; and the trend of online consumption also makes the
role of logistics service providers change from the original To B scenario to "To B + To C". Therefore, as the infrastructure provider,
SF focused on the ability to provide full-link digital solutions to both the OEMs of core enterprises and participants at all levels.
SF's auto parts industry technology solutions have covered all automotive link scenarios, including purchasing logistics,
production logistics, after-sales logistics, reverse logistics, etc. At the same time, it has newly expanded the entire vehicle transport
logistics solution and the new energy charging pile installation and distribution integrated solution to provide consistent high-quality
services to automobile manufacturers, spare part manufacturers, 4S shops and end customers across China.
Among them, the intelligent networking project with China National Heavy Duty Truck, starting from the perspectives of
automation, informatization, and digitization, actively explored the application of smart logistics supply chains on the industrial side,
assisted the iterative upgrade of the automotive logistics industry, and was committed to satisfying customers' demand for supply
chain services such as cost reduction across the entire chain, full-process perception and controllability, high-quality performance,
and flexible production, creating the most advanced integrated pre-production intelligent logistics benchmark for China's commercial
vehicles. The project was finally selected as a "Typical Case of Intensive Integration and Innovation Development of Logistics
Industry and Manufacturing Industry" by the Development and Reform Commission of the State Council.

S.F. Holding Co., Ltd. 2021 Semi-Annual Report
45
In addition, as for the clothing, shoes and hats industry, SF continued to deepen the integrated service of To B To C
warehousing and distribution for sports brand customers, expanding from the original domestic warehousing and distribution
business to the bonded warehousing and distribution business. At the same time, SF explored the maximum performance and
visualized management cooperation to realize the digital innovation of the supply chain, so as to actively lead the changes in market
demand and enhance the market competitiveness of both parties. As for the smart home industry, based on in-depth analysis on
customer needs and industrial capabilities, SF built scenario-based algorithm models and improved informatization tools to achieve
customer distribution network integration, omni-channel inventory, unified warehouse and co-allocation, and to connect
manufacturing data and logistics data, so as to realize the digital intelligence of the end-to-end value chain, effectively reduce
customers’ logistics costs, and improve the quality indicators of fulfillment and delivery. As for the pharmaceutical industry, the
self-developed "SF NBAI (丰智云链)" (pharmaceutical version), on which SaaS can be deployed locally, has the characteristics of
flexible connection with upstream and downstream systems, flexible adaptation according to customer scenarios, compliance with
pharmaceutical industry standards, support for full-process temperature control management, and support for UDI management,
assisting more industry customers to quickly improve the level of integrated supply chain logistics management, and thus
significantly enhances the integrated information management capabilities of warehousing and distribution of pharmaceutical
customers. As for the wine industry, SF is currently being in-depth cooperation with leading liquor, beer, and red wine companies,
with its business being in more than 20 scenarios and customized service areas. And SF used the blockchain traceability platform "SF
Traceability (丰溯)" to provide product traceability services for high-end wines, on which brand owners can realize the full life cycle
management of traceable source code, traceable data analysis, enterprise marketing management, etc. with the background data of
merchants on SF Traceability (丰溯). As for the financial and insurance industry, in the bank card business, SF focused on the
entire process of card application, card production, card issuance, receipt and transfer, and provided a package of solutions such as

S.F. Holding Co., Ltd. 2021 Semi-Annual Report
46
co-branded card customization, automatic packaging and intelligence of card delivery, customization of time-sensitive products, and
personalized delivery services. At the same time, in the information audit service, SF integrated its terminal outlets resources with
technology, and thus realized the dual guarantee service capabilities of direct management and control + technological support, and
provided customers with efficient and convenient information audit services.
The Company continued to explore together with top customers. It optimized and upgraded the traditional cost supply chain
with digital intelligence to have it transformed into a new revenue supply chain and a new business model of D2C (Direct to
Customer), so as to create new business growth with customers. At the same time, as a result of industry scenarios, the Company has
gradually built a product, capability and service system of"D2C SaaS+VAS" (standardized application + value-added service), which
will help more growing SMEs to achieve more sustainable business growth in the future through on-demand configuration,
plug-and-play SaaS products that are standardized, productized, and modularized as well as agile delivery based on cloud services.
SF adhered to the position of an independent third party, took technology as the lead and made use of its comprehensive
logistics service capabilities of multiple business formats. Thus, it had a complete set of supply chain solution implementation
capabilities of "technology integration + program implementation", forming a unique and leading core competitiveness in the
industry. While its cases successfully implemented in various industries also brought high recognition from cooperative customers.
Driven by technological services, SF also further strengthened customers' stickiness to its logistics services, so as to form in-depth
strategic cooperation, jointly promot the transformation of digital supply chain, and work hand in hand with customers to achieve a
win-win situation.
(Ⅳ) Unique and scarce intelligent logistics network, the “Aviation + Ground + Information” three-in-one
network
SF Holding continues to consolidate and upgrade its unique and scarce comprehensive logistics service network integrating
three networks, “aviation network + ground network + information network”, consistently consolidating and expanding its leading
advantages in the industry. The aviation network system formed by mutually complementary “all-cargo aircrafts, commercial flights
and drones” builds a time barrier, and the scarcity of aviation resources ensures the Company’s lasting leading advantage. The
ground network systems such as perfect terminal service point, stable delivery team, intensive transit allocation network, efficient
transportation network and smart customer service system, build differentiated service barriers. The Company’s control over the
ground network ensures a stable service timeliness; hundreds of thousands of couriers, the top 4 independent call centers and the top
6 industry claim centers ensure warm customer experiences. By applying cutting-edge technologies such as big data, block chain, AI,
and IoT to various business links and scenarios, SF Holding built an information network platform. On the one hand, it empowers
internal operation, improves network efficiency, and promotes a comprehensive upgrade of smart logistics. On the other hand, it
empowers industry customers, and helps them reduce costs and increase efficiency, forming an open and win-win ecosystem, and
promoting industrial transformation and upgrading.

S.F. Holding Co., Ltd. 2021 Semi-Annual Report
47
1. Aviation network
In 2009, SF Airlines became the first privately-owned air freight company in China. Today, it has developed into China’s largest
and the world’s leading air freight company, forming a cargo route network covering the whole country and expanding to Asia and
reaching Europe and America, serving more than 80 cities around the world.
All-cargo aircrafts: (1) Fleet building: It had 66 self-operated all-cargo aircrafts (of which, Boeing 767: 11 aircrafts, Boeing
747: 2 aircrafts, Boeing 757: 36 aircrafts, Boeing 737: 17 aircrafts) with an average age of 24.5 years, and 13 chartered all-cargo
aircrafts, operating 93 flight routes in total. (2) Traffic rights and airport slots: It had a total of 258 pairs of slots, covering 54 large
and medium-sized cities nationwide and international cities including Los Angeles, Liege, Frankfurt, Delhi, Singapore, Ho Chi Minh
and Chennai. (3) Pilots: It had a total of 569 pilots, including 243 captains and 326 co-pilots. (4) Global operation: In the first half
of 2021, it operated 2,528 international flights in total, representing a year-on-year increase of 73.8%. 9 international and regional
routes were newly launched, including Shenzhen-Los Angeles, Shenzhen-Manila and Chengdu-Dacca. Among them, Shenzhen-Los
Angeles is SF Airlines’ first non-stop regular cargo route to the United States and the seventh intercontinental route operated by
all-cargo aircrafts. (5) Aviation safety: Since its first flight, SF Airlines has entered its 12th year of safe operation and operated
over 500,000 hours safely.

S.F. Holding Co., Ltd. 2021 Semi-Annual Report
48
Commercial flight resources: SF has secured stable passenger aircraft bellyhold resources from more than 100 commercial
airlines at home and abroad through direct operations (cooperating directly with airlines), agents (freight forwarders), or tripartite
cooperation (SF, airlines, and agents) to operate 2,172 flight routes across China and the world, achieving full coverage of direct
cooperation in head and waist airlines, and gradually completing the national strategic fulcrum layout of the aviation bellyhold
business.

S.F. Holding Co., Ltd. 2021 Semi-Annual Report
49
As at the end of the reporting period, SF Holding’s all-cargo aircraft and commercial flights operated a total of 2,265 flight
routes, and the total number of flights in the first half of 2021 was 732,500, with a daily average of 4,047 flights. Total air cargo
volume handled was approximately 894,200 tonnes, of which all-cargo volume handled was 481,400 tonnes, up 18.06%
year-on-year.
Freight capacity of SF Holding’s air transport business:
Resources
End of the current reporting
period/Current reporting
period
Daily average during the
reporting period
All-cargo aircrafts
Number of self-operated
aircrafts 66 aircrafts -
Number of external chartered
aircrafts 13 aircrafts -
Number of all-cargo aircraft
routes 93 routes -
Total number of flights 26,600 flights 147 flights
Total cargo volume 481,400 tonnes 2,660 tonnes
Resources End of the current
reporting period/Current
reporting period
Daily average during the
reporting period
Commercial flights
Number of commercial flight
routes 2,172 routes -
Total number of flights 705,900 flights 3,900 flights
Total cargo volume 412,800 tonnes 2,280 tonnes
Cargo airport hub construction: The Hubei International Logistics Hub project lies at the core of SF Airlines’ transportation
system. Ezhou Huahu Airport will be built into an international air cargo logistics hub with cargo functions as its main function,
which is the first cargo hub airport in Asia and the forth in the world. Ezhou Huahu Airport is a Level 4E airport featuring all-cargo
aircraft operation, two separated strips paralleled with each other and is able to reach areas where the percentage of economic
population is 90% of the whole country within 1.5 to 2 hours’ flight. The completion of the Ezhou Huahu Airport will form an
express logistics cargo hub in the central China that can radiate its influence across the country, and reshape the air cargo market
structure of China’s civil aviation. SF will use this hub as the center of its air route network that covers the entire country and reaches
the world, providing good fundamental support for increasing the coverage of time-definite products, enhancing timeliness of
products, building high-end integrated logistics service capabilities, and reducing the cost of aviation network operation. The Hubei
International Logistics Hub has been incorporated into the package of supporting policies as planned in the national emergency
infrastructure shortcomings remedying project, and Ezhou Huahu Airport has been included in the scope of the air emergency and
rescue system construction by the Hubei Province. In the first half of 2021, the Company comprehensively promoted the construction
of the main airport project of the hub project, and strived to realise the delivery and acceptance of the airport’s full-field construction
projects, and ultimately kick off the flight inspection at the end of 2021. After the airport is completed, it is estimated that cargo and
mail throughput and passenger throughput will be 2.45 million tons and 1 million respectively in 2025, and 3.3 million tons and 1.5
million respectively in 2030.

S.F. Holding Co., Ltd. 2021 Semi-Annual Report
50
2. Ground network
Service points: As at the end of the reporting period, SF Holding’s business covered 335 prefecture-level cities and 2,848
county-level cities, with approximately 21,000 directly-operated service points. The international standard express/international
economy express businesses covered 78 countries and regions abroad. The international small parcel business covered 225
countries/regions around the world. The Company had about 410,000 couriers under various workforce models.
Transit Hub Distribution: As at the end of the reporting period, SF Holding had 10 hub-level transit depots, service points at
37 aviation and railway stations (excluding stations sharing sites with transit depots), and 151 sub-district transit depots (excluding
SF freight and SX Freight), of which 129 transit depots have adopted the automatic sorting equipment, representing an increase of 8
transit depots as compared with the end of previous year. The freight delivery network (including SF Freight and SX Freight) has 41
hubs and 79 regional hubs, 13 of which have been put into operation with automation equipment.

S.F. Holding Co., Ltd. 2021 Semi-Annual Report
51
Ground transportation network: As at the end of the reporting period, SF Holding had about 68,000 directly-operated and
outsourced vehicles for more than 120,000 long-haul and branch routes. The total number of vehicles for terminal collection and
delivery was about 110,000 (excluding motorcycles and two-wheeled/three-wheeled electric vehicles). High-speed railway lines
(including Rail Speedy Express(极速达)services and standard railway lines) had covered 91 cities with 541 flow-directions in use.
There are 4 pairs of express lines (being 8 lines) and 106 standard railway lines in use. By leveraging stable railway transportation
capacity, the Company powered the dispatch and delivery of products with regional characteristics such as cherry and other fresh
products in the first half of 2021. In addition to freight business, the Company has developed its capacity to transport grain, coal coke,
non-ferrous metals, building materials and chemical products and other domestic bulk materials, targeting industry-leading customers
to develop replicable multimodal transportion solutions. At the same time, the Company has developed its stable dispatch and
delivery capacity using international freight train on new platforms to carry out the operation of special trains for e-commerce and the
international business of China-Europe freight trains.
Warehousing network: SF warehousing network consists of self-operated warehouses and franchise warehouses, the difference
of which was positioned based on customers’ production, circulation, and consumer end. A national warehousing network resource
layout was formed by a combination of heavy and light assets model, and ultimately a warehousing network of efficiency, flexibility,
and complementarities was created. SF Holding owns warehousing systems with independent intellectual property rights, automation
equipment research and development capabilities, and storage planning and design capabilities. By realizing manpower digitalization,
production capacity digitalization, operation digitalization and end-to-end visualization through the digital transformation of
warehousing, functions of business planning, business decision-making and risk early warning are able to be improved, thereby the
Company can effectively achieve substantial cost reduction and efficiency enhancement. Meanwhile, the Company improves its
efficiency by studying of a variety of automation equipment integration and synergy, and realizes dynamic optimal scheduling and

S.F. Holding Co., Ltd. 2021 Semi-Annual Report
52
allocation of task priority by establishing a resource model and strategy through dynamic algorithm and automation engine. With the
support of scientific and technological capabilities, SF warehousing network was able to meet the different demands of customers in
various industrial segments in cooperation with SF Express and other SF ecological businesses, and provide customers with
multi-scenario, end-to-end intelligent supply chain solutions.
SF Holding owned 259 self-operated warehouses of various types (including the New Havi cold-chain logistics center), with a
total area of approximately 3.05 million square meters. The Company continued to strengthen the nationwide warehousing service
network, consolidate the warehousing service capabilities, provide more customized supply chain solutions for warehousing and
distribution based on scenario requirements of brand customers, and constantly improve the innovation of warehousing and
distribution integrated operation model to establish benchmarks in various industries such as 3C, shoes and apparel, cosmetics, cold
chain of food and pharmetical. The Company continued to increase investment in automation equipment to constantly invest and
optimize automation equipment in warehouses across the network. The warehousing system is continuously optimized and iterated,
supporting the development of customers with multi-industry and multi-scenario business by scientific and technological means,
providing support for significantly improving the capacity and efficiency during peak. During the “618” peak period of 2021, the
e-commerce warehousing and distribution business volume of the Company increased by more than 100% year-on-year, and the
operational efficiency and delivery quality continued to improve.
Shuangjie Supply Chain, a subsidiary of the Company, has 161 franchise warehouses, covering an area of 2.34 million square
meters, which acted as a backup complementation to self-operated warehouse resource. As an open and independent supply chain
service platform integrated with warehousing and distribution, Shuangjie Supply Chain, oriented to demands of e-commerce and new
retails logistics, provides clients with a set of warehouse-based omni-channel (ToB, ToC online and offline) products, and empowers
the franchise warehouses by warehouse management system and SOP process optimization and other lean management methods, in
order to improve its operational capability and service quality.
Moreover, with existing e-commerce platform customers, SF International strived to establish overseas warehousing network by
focusing on overseas markets with cross-border e-commerce development potential. At present, SF International has set up 15
overseas warehouses next to the ports in a total of 9 overseas countries and regions, including United States, Germany, Estonia, UK,

S.F. Holding Co., Ltd. 2021 Semi-Annual Report
53
Poland, Thailand, Indonesia, Japan and Australia. Leveraging on domestic and overseas collection and delivery network,
warehousing, customs clearance, agency and other resources, SF International is able to provide one-stop import and export supply
chain service for customers.
Customer service network: SF Holding is committed to developing cutting-edge customer service systems and service
strategies, taking advice from customers and responding promptly to their needs; and to building a smart and digitalized service
management platform, in order to provide them with professional, efficient and user-friendly services. SF Holding has four separate
call centers, six industry claim centers, and 1,000,000 customer calls are served on a daily basis. Customers have 24/7 access to
internet-based self-service via WeChat mini apps, WeChat public account, the Company’s official website, the SF Credit Account
Management Platform and mobile apps.
Last mile service: By focusing on customer’s diversified needs on pick-up and delivery, SF Holding has been improving the
customer service experience. On the one hand, SF Holding continues to strengthen the construction of couriers team, and implements
the concept of “3+1” to unified service standards, so as to improve the experience of “user-friendly” in the last mile service. On the
other hand, leveraging on the synergistic effect between terminal channel and couriers, SF Holding built a third-party service
provider operating system and an intelligent delivery model, and accelerated cooperation in resources co-allocation with third-party
to create a win-win situation. Besides, by expending the coverage of the last 100 miles service of Hive Box lockers in cities and
opening up China Post express delivery system routing in lower tier rural areas, SF Holding was able to provide “once postage for
express delivery (一票到底)” service, and an terminal network layout integrated with "home delivery, locker delivery, and station
delivery " for the Company’s last mile service has been formed initially, to provide customers with “more friendly and more
convenient” pick-up and delivery service. As of the end of the reporting period, SF Holding established 128,000 terminal service
outlets through cooperating with urban service outlets, service agency outlets in townships, property management companies and
hospitals/ scenic spots/transportation hubs, increasing the coverage rate of outlets at counties and townships level by 3.75 percentage
points over the end of last year to 91.10%.
Hive Box Technology, in which SF Holding has invested as a shareholder, looked to explore and meet multi-scenario
customized needs through technology application, covering delivery locker, smart micro warehouse, bag locker, government affairs
cabinet and other smart end products. Hive Box Technology continued to expand its coverage footprint in the express industry with
unique momentum to develop the last mile of diversified service. Hive Box Technology has set up service outlets in 160,000+
communities in 200+ key cities, and has established 300,000+ locker outlets. So far, Hive Box Technology is home to 4.6 million
registered couriers in aggregate, serving 360 million customers.
Hive Box lockers, as part of the terminal delivery solution, are flexible and safe and able to meet customers’ personalized
receiving needs and improve customer’s experience; it can also increase the delivery efficiency of the last mile service and will help
the Company implement the contact-less delivery strategy for the last mile service, so as to enhance the efficiency of terminal
delivery on the other hand. In response to the coronavirus pneumonia outbreak, Hive Box lockers are regarded as the major solution
of safe shipping without physical contacts, with more packages put into lockers. Contact-less delivery helps consumers cultivate a
habit of picking up packages from lockers, and is expected to speed up the development of smart locker industry.

S.F. Holding Co., Ltd. 2021 Semi-Annual Report
54
3. Information network
SF Holding has independently researched and developed a complete set of smart information network platforms. The set of all
those platforms has covered all business segments and scenarios to enable business in a fast, flexible, safe and comprehensive manner,
and has promoted logistics full chain information interconnection, which has created a smart and solid foundation for the diversified
business development of the Company. Meanwhile, SF Holding has also been committed to the development and implementation of
cutting-edge technologies, applied cutting-edge technologies such as big data, block chain, AI and Internet of Things to more
practical business scenarios, and supported new technology applications with cloud computing. SF Holding has adhered to
user-oriented product design to enhance business performance and user experience, and enabled technology and products to be
conscientiously implemented and better serve customers. Moreover, SF Holding has also integrated internal resources. Relying on
massive internal and external data, SF Holding uses data and technology to make decisions and lead operations, and created SF’s
“intelligent brain”, realizing data-driven technology and technology-enabled logistics. SF Holding achieved the integration of the
three networks of “aviation + ground + information” into one network, providing support to unlimited business possibilities.
(V) First-mover development of scarce logisitcs land resources to facilitate industrial upgrades
SF Industrial Park is committed to becoming an industrial park operator based on modern logistics. As an important part of its
strategic layout, it will continue to diversify SF Holding’s “ground network”, to complete SF’s key resources and services provided
to customers. Actively responding to the requirements of the “14th Five-Year Plan” for the express delivery industry and the national
“New Infrastructure” policy, the Company has built “smart logistics” parks and “technological innovation” parks, while developing
digital infrastructure industry chains such as “information network” and “transportation logistics network”. It provides customers
with a full range of comprehensive package services in warehousing, logistics, business flow, information and capital flows to
optimize and upgrade their supply chains and empower their business development. As at the end of the reporting period, SF Holding
has successfully laid out an industrial park project across 53 cities, and the logistics sites covered a land area of approximately 9,300
mu, approximately 2.04 million square meters of the operational project were completed. It is expected that approximately 0.99
million square meters will be completed in the second half of 2021, in the next three years, the area under management and operation
of SF Industrial Park will exceed 6 million square meters.
In order to support the sustainable and healthy development of the Company's logistics industrial park, meet the demand for site
resources for the development of the main logistics business, broaden financing channels, and build a capital operation platform for
the industrial park, the Company will set up a real estate trust fund with three properties located in Foshan, Wuhu, and Hong Kong of
China as the underlying assets, and will be listed on the Main Board of The Stock Exchange of Hong Kong Limited on May 17, 2021.
At the same time, the Company intends to jointly establish a logistics development fund with Hammer Capital Real Estate Limited to
invest in strategically located logistics industrial park projects to further enhance the Company's core competitiveness.

S.F. Holding Co., Ltd. 2021 Semi-Annual Report
55

S.F. Holding Co., Ltd. 2021 Semi-Annual Report
56
(VI) SF Holding adopts an operating model with strong management control over the whole network and
with stability and flexibility
SF Holding adopts an operating model that maintains strong management and control over the whole network, with the whole
express delivery network and key resources under the strict control of its headquarters, covering all links of the business chain, which
is conducive to the precise alignment of its corporate strategies from top to toe, as well as the effective achievement of its strategies
and business goals; it also helps to maintain the stability and controllability of our operation, standardization and compliance of our
internal control, and ensure standardized operations, high operational efficiency and high service quality, thereby enhancing
customer’s loyalty and brand reputation. While maintaining strict control of the key links and core resources, we have adopted a
diversified resource acquisition and operation model, aiming to enhance the flexibility of the whole network and the space for
expansion, and extend the coverage of our services; we rely on our standardized operation and control processes that have been
developed upon many years of experience, as well as the advanced logistics technology to ensure the controllability and stability of
the entire logistics chain, so as to achieve full control of the overall network and further enhancement of resource efficiency, provide
support for business expansion, and form a stable and flexible network foundation. Meanwhile, the Company’s new businesses have
made full use of the existing network resources to achieve synergy among network, customers, technology and resources, so as to
grow rapidly and complement the existing businesses.
(VII) Shaping a good brand image with a long-standing top ranking in service quality
SF Holding has established itself as a well-recognized and reputable express delivery service provider through over 20 years of
development. It is synonymous with “efficiency”, “punctuality” and “safety”, widely noted for its excellent corporate image and
brand value and been widely recognized by customers, the industry and the community.

S.F. Holding Co., Ltd. 2021 Semi-Annual Report
57
At the regular press conference of the first quarter held on January 14, 2021, according to the 2020 “Overall Satisfaction of
Express Delivery Enterprises” (《2020 年快递企业总体满意度》) released by the State Post Bureau, S.F. Express has ranked No.1 in
“Overall Satisfaction towards Express Delivery Service Enterprises” for 12 consecutive years. Meanwhile, it ranked first, for the 8th
consecutive year, in terms of whole-process time limit and 72-hour punctuality. SF Holding was ranked 5th among “Most Admired
Chinese Companies” in 2020 by Fortune, rising four places. This was the fourth consecutive year that SF Holding had been listed
among the most admired Chinese companies. In the “World’s Top 500 Most Valuable Brands” released by BrandFinance, a
well-known brand value consulting company, SF Holding ranked 270th, representing a significant rise compared with that of 2020
(460th place).
(VIII) Warm, principled and productive SF culture
In SF’s history of development, corporate culture is not just a belief, but more as a commitment and practice. It is reflected in
every word and action of all SF employees, is expressed in every operating process, and has become a strong spiritual force that is
embedded in SF’s cohesiveness, competitiveness, and vitality. 1. SF’s success is grounded in assisting customers to succeed: SF
has always been customer-oriented and is committed to providing customers with above expectation services, assisting customers to
create value and achieve success. During the COVID-19 pandemic, no matter the regional outbreak in Shijiazhuang at the beginning
of the year, or subsequently in Ruili and Guangzhou, as one of the very few logistics service providers that can maintain normal
operations and provide end-to-end whole-process services, SF Holding has joined the fight against the pandemic by regarding the
fight as its unshirkable responsibility. Starting from customer needs, SF’s customer support team has made every attempt to maintain
safe and stable services for customers during the pandemic, thus winning trust from customers. 2. Innovation drives SF forward:
SF Holding advocates the culture of innovation, emphasizing that everyone and every move can be innovative. While improving
productivity and service quality through research and development of new technologies, it has continuously introduced innovative
service and solutions by keeping pace with market changes to provide customers with high-quality, efficient services. 3. Equality
and respect uniting every heart: SF treats every staff equally and with respect, respecting the value of their contributions, providing

S.F. Holding Co., Ltd. 2021 Semi-Annual Report
58
everyone with equal development opportunities and assisting staff to actualize personal value. SF cares every employee and provided
diversified benefits by group such as family insurance and employee condolences to improve employee perception and satisfaction.
During the Spring Festival, SF actively responded to the national policy of "Chinese New Year in situ" and encouraged employees
from all over the country to celebrate the Chinese New Year in situ, and provided various care and benefits. 4. Be responsible
proactively and fulfill the mission: SF has always been participating in social welfare activities and proactively assuming social
responsibilities. Whenever natural disaster outbroke, SF Holding actively devoted actively devote itself to disaster relief by
exploiting its strengths. During the COVID-19 pandemic, SF Holding stood firm mobilizing its HR, transportation and financial
resources to the fullest extent, provided a strong specialized assistance for the delivery of antipandemic materials and living supplies,
and built “green channels” for the transportation of pandemic control supplies. SF Holding also encourages employees to take social
responsibility. Upholding just and rightful acts, working for the public good, and other positive events occur more and more
frequently among SF couriers. Yang Jingshan, the founder of a “volunteer service team” during the pandemic, Li Yuanping, who has
donated blood for free for 22 years, and many other SF staff proactively shoulder social responsibility, conveying touching sensations.
On February 17, Wang Yong, the “most impressive courier”, was selected as "Moving China" 2020 Person of the Year. Serving
customers and giving back to the society with the simplest actions and the most sincere beliefs are the social responsibilities of SF
staff.

S.F. Holding Co., Ltd. 2021 Semi-Annual Report
59
III. Analysis on Main Business
Overview
Is it the same with those disclosed in Primary Business of the Company during the Reporting Period?
√ Yes □ No
For details, please refer to “I. Primary Business of the Company during the Reporting Period”.
Year-over-year changes to major financial data
Unit: RMB
Current Reporting Period The Same Period of
Previous Year
Increase/Decrease over
the same period of
previous year
Rationale
Revenue 88,343,929,823.78 71,129,007,738.21 24.20% Mainly due to business
growth.
Cost of revenue 79,421,353,588.40 57,863,128,901.41 37.26%
Mainly due to business
growth, investment
increase in improving
productivity and expansion of new business.
Selling and distribution
expenses 1,310,233,654.15 1,056,658,701.93 24.00%
General and
administration expenses 6,529,046,289.13 5,861,443,162.73 11.39%
Financial expenses 621,902,222.77 472,967,469.92 31.49%
Mainly due to the impact
of interest expenses on
lease liabilities resulting
from the adoption of new lease standard.
Income tax expense 677,358,703.20 1,714,998,647.00 -60.50%
Mainly due to the decrease
in total profits and increase
in deductible tax losses for
which no deferred tax asset was recognised.
Research and
development investment 1,708,373,810.41 1,311,258,210.74 30.29%
Mainly due to the increase
in research and development activities.
Net cash flows from
operating activities 4,331,632,843.16 6,931,712,320.10 -37.51%
Mainly due to the decrease
in net profit.
Net cash flows from
investing activities -10,892,398,614.05 -17,870,077,628.81 39.05%
Mainly due to the increase
in net cash inflows from
disposal of subsidiaries,
decrease in net cash
outflows of structural
deposits, and increase in
net cash outflows for
purchasing and
constructing long-term assets.
Net cash flows from
financing activities 7,324,694,755.57 2,545,719,388.91 187.73%
Mainly due to the increase
in capital contribution from
minority and net cash inflows from borrowings.
Net increase in cash and
cash equivalents 777,176,873.33 -8,373,723,779.87 109.28%
For details please refer to
the above analysis of cash
flow changes in operating
activities, investing
activities and financing activities.
Did significant changes occur in profit composition or sources of profit?
□ Applicable √ Not applicable

S.F. Holding Co., Ltd. 2021 Semi-Annual Report
60
There were no significant changes in profit composition or sources of profit during the reporting period.
Composition of revenue
Unit: RMB
Current Reporting Period The Same Period of Previous Year Increase/Decrease
over the same
period of previous year
Amount Proportion of
Revenue Amount
Proportion of Revenue
Revenue 88,343,929,823.78 100% 71,129,007,738.21 100% 24.20%
Categorized by industry
Express logistic and
supply chain 87,099,464,261.56 98.59% 70,188,001,144.10 98.68% 24.09%
Sales of goods 563,159,220.18 0.64% 452,123,296.72 0.64% 24.56%
Others 681,306,342.04 0.77% 488,883,297.39 0.69% 39.36%
Categorized by product
Time-definite Expressnote 3 46,161,162,400.04 52.25% 43,343,101,741.61 60.94% 6.50%
Economy Product note 3 14,890,048,712.29 16.85% 8,802,434,291.67 12.38% 69.16%
Freight 11,512,628,979.08 13.03% 7,674,464,424.81 10.79% 50.01%
Cold Chain and
Pharmaceuticals 3,719,997,345.16 4.21% 3,240,731,441.57 4.56% 14.79%
Intra-City Instant Delivery 2,241,284,109.83 2.54% 1,265,413,899.41 1.78% 77.12%
International Express 3,280,794,909.92 3.71% 2,904,883,603.56 4.08% 12.94%
Supply Chain 5,293,547,805.24 5.99% 2,956,971,741.47 4.16% 79.02%
Others 1,244,465,562.22 1.41% 941,006,594.11 1.32% 32.25%
Categorized by region
Express logistic and
supply chain – East China 25,952,910,364.81 29.38% 19,336,652,950.23 27.19% 34.22%
Express logistic and
supply chain – South
China
23,803,547,991.27 26.94% 19,002,148,999.94 26.72% 25.27%
Express logistic and
supply chain – North China
17,196,437,337.63 19.47% 14,826,811,732.21 20.84% 15.98%
Express logistic and
supply chain – Central China
11,318,052,416.74 12.81% 9,226,900,387.54 12.97% 22.66%
Express logistic and
supply chain – West China 6,782,220,948.23 7.68% 5,664,614,722.70 7.96% 19.73%
Express logistic and
supply chain –
Hong Kong and Macao
1,377,672,381.40 1.56% 1,406,433,781.68 1.98% -2.04%
Express logistic and
supply chain – Overseas 668,622,821.48 0.76% 724,438,569.80 1.02% -7.70%
Sales of goods and others 1,244,465,562.22 1.41% 941,006,594.11 1.32% 32.25%
Note 1: Product revenue and district revenue in the preceding table have not been audited.
Note 2: Any discrepancies in the above table between totals and sums of the amounts are due to rounding.
Note 3: The Company completed the optimization and upgrade of express delivery products in April this year. For details of the he main product
adjustments and changes, please refer to "(III)Overall Performance of the Company during the First Half of 2021 - 4. We will continue to optimize product stratification and improve product matrix to meet the diversified needs of customers and gain new growth drivers - (1) Delivery business”.
The operating income data in the current period and the corresponding last period relating to Time-definite Express and Economy Product in this table have been adjusted retrospectively based on the new statistical rules due to product optimization and upgrade.
Industries, products, or regions accounting for more than 10% of company revenue or operating profit ?
√ Applicable □ Not applicable
The Company is required to comply with the disclosure requirements of the “Guidelines of the Shenzhen Stock Exchange for

S.F. Holding Co., Ltd. 2021 Semi-Annual Report
61
Industrial Information Disclosure No.9 – Listed Companies Engaged in the Express Delivery Services Business”
Unit: RMB
Revenue Cost of revenue
Gross
Profit
Margin
Revenue
Increase/
Decrease over the
same period of previous year
Cost of revenue
Increase or
Decrease over
the same period of previous year
Gross Profit
Margin Increase
or Decrease over
the same period of previous year
Categorized by industry
Express logistic and
supply chain 87,099,464,261.56 78,446,298,960.60 9.93% 24.09% 37.33% -8.69%
During the reporting period, the Company has accurately accounted its operating cost according to the nature of resources consumed
under the underlying requirements of the accounting standards. However, a fair and accurate allocation of cost by product or by
region has not been possible. It was because the express and logistics industry itself was basically a complex network, by highly
connection, overlaps in different types of resources consumed, all direction of waybills, a tremendous number of customers, highly
crossover of different types of resources fully shared.
Where the Company’s statistical criteria for core business data are adjusted during the reporting period, the core business data for the
most recent year have been adjusted based on the statistical criteria effective as of the end of the reporting period
□ Applicable √ Not applicable
Disclosure of express delivery volumes and average revenue per shipment
For more details, please refer to the “I. Primary Business of the Company during the Reporting Period”under the section “Management Discussion and Analysis”.
Explanation for related changes greater than 30% as compared with those in the prior year period
√ Applicable □ Not applicable
For more details, please refer to the “I. Primary Business of the Company during the Reporting Period” under the section
“Management Discussion and Analysis”.
Ⅳ. Non-core Business Analysis
√ Applicable □ Not applicable
Unit: RMB
Amount Proportion of
Total Profit Reason Whether Sustainable
Other income 716,561,124.08 65.55%
Mainly including
government grants related to
daily activities, which
comprise value-added tax
additional credit and other tax preference.
No
Investment income 1,130,498,743.99 103.42%
Mainly including investment
income from the disposal of
subsidies and income from structured deposits.
Income from structured
deposits is sustainable; while
other investment income is not sustainable.
Gains and losses
arising from
changes in fair value
29,589,246.28 2.71% No
Credit impairment
losses -11,176,161.04 -1.02% No
Asset impairment
losses -592,019.83 -0.05% No

S.F. Holding Co., Ltd. 2021 Semi-Annual Report
62
Non-operating
income 125,023,072.59 11.44%
Mainly including
government grants unrelated
to daily activities and
compensation income.
No
Non-operating
expenses 126,095,725.78 11.54%
Mainly including losses on
scrapping of assets and compensation expenses .
No
Ⅴ. Analysis of Assets and Liabilities
1. Major changes in asset composition
Unit: RMB
Item
End of Current Reporting Period End of Previous Year Increase/
Decrease in
Proportion
Major Changes Amount
Proportion of
Total Assets
Amount
Proportion of
Total Assets
Cash at bank and
on hand 16,862,359,321.83 12.64% 16,417,891,707.19 14.77% -2.13%
For details, please refer to
analysis on cash flow in “III.
Analysis on Main Business”
under Chapter 3 Management Discussion and Analysis.
Financial
assets held for trading
10,024,418,773.30 7.51% 6,276,922,669.69 5.65% 1.86% Mainly due to increase in
structured deposits.
Accounts
receivable 18,603,262,202.89 13.95% 16,849,064,250.79 15.16% -1.21% Mainly due to business growth.
Advances to suppliers
2,310,290,874.56 1.73% 3,176,518,926.99 2.86% -1.13%
Due to the impact of adopting
new lease standard. For details,
please refer to “2 Summary of
significant accounting policies
and accounting estimates - (31)
Significant changes in
accounting policies” under
Chapter 10 Financial Statements.
Inventories 981,610,149.77 0.74% 986,950,595.04 0.89% -0.15% No major changes.
Contract assets 375,776,993.91 0.28% 399,035,179.94 0.36% -0.08% No major changes.
Long-term
equity investments
5,075,968,100.17 3.81% 3,647,231,277.90 3.28% 0.53%
Mainly due to increase in
investments in joint ventures and associates.
Investments in
other equity instruments
4,455,155,248.78 3.34% 5,027,489,054.30 4.52% -1.18% Mainly due to disposal of
investments in stocks.
Investment
properties 1,430,515,368.05 1.07% 2,219,404,821.35 2.00% -0.93%
Mainly due to disposal of
subsidiaries.
Fixed assets 22,740,388,614.84 17.05% 22,356,651,754.60 20.11% -3.06% No major changes.
Construction
in progress 6,521,949,882.48 4.89% 5,379,854,462.06 4.84% 0.05%
Mainly due to increase in
investments in industrial park projects and distribution hubs.
Right-of-use
assets 13,374,738,542.41 10.03% - 0.00% 10.03%
Due to the impact of adopting
new lease standard. For details,
please refer to “2 Summary of
significant accounting policies
and accounting estimates - (31)

S.F. Holding Co., Ltd. 2021 Semi-Annual Report
63
Significant changes in
accounting policies” under
Chapter 10 Financial Statements.
Intangible
assets 9,896,036,364.07 7.42% 10,633,114,090.26 9.57% -2.15%
Mainly due to disposal of
subsidiaries.
Short-term
borrowings 15,018,583,357.05 11.26% 7,996,570,312.73 7.19% 4.07%
Mainly due to additional
short-term borrowings.
Accounts
payable 15,896,242,092.03 11.92% 15,484,940,351.95 13.93% -2.01%
No major changes.
Contract
liabilities 1,816,741,934.15 1.36% 1,539,264,096.14 1.38% -0.02%
No major changes.
Employee
benefits payable 3,259,281,586.74 2.44% 4,310,829,146.80 3.88% -1.44%
Mainly due to payment of
employee benefits.
Other payables 7,581,186,251.15 5.68% 7,530,793,784.24 6.77% -1.09% No major changes.
Current portion of
non-current liabilities
7,727,706,661.82 5.79% 2,945,350,894.28 2.65% 3.14%
Due to the impact of adopting
new lease standard. For details,
please refer to “2 Summary of
significant accounting policies
and accounting estimates - (31)
Significant changes in
accounting policies” under
Chapter 10 Financial
Statements.
Other current
liabilities 2,138,161,857.86 1.60% 92,355,845.77 0.08% 1.52%
Mainly due to issuance of
short term corporate
debentures and super short term commercial papers.
Long-term
borrowings 1,758,386,807.78 1.32% 1,865,820,266.05 1.68% -0.36%
No major changes.
Bonds payable 8,860,323,061.45 6.64% 8,425,430,468.77 7.58% -0.94% No major changes.
Lease liabilities 8,140,284,965.55 6.10% - 0.00% 6.10%
Due to the impact of adopting
new lease standard. For details,
please refer to “2 Summary of
significant accounting policies
and accounting estimates - (31)
Significant changes in
accounting policies” under
Chapter 10 Financial
Statements.
Capital reserve 25,549,775,675.75 19.15% 24,405,217,286.50 21.96% -2.81% Mainly due to the contributions
from minority.
2. Key overseas assets
□ Applicable √ Not applicable

S.F. Holding Co., Ltd. 2021 Semi-Annual Report
64
3. Assets and liabilities measured at fair value
√ Applicable □ Not applicable
Unit: RMB
Item Opening Balance
Changes in Fair
Value Gains and
Losses in
Current Period
Accumulated Fair
Value Changes
Included in Equity
Provision for
Impairment in
Current Period
Amount of Purchase in Current Period
Amount of Sales in Current Period
Other Changes Closing Balance
Financial assets
1. Financial
assets held for trading
(excluding derivative
financial assets) Note 1
7,108,448,710.77 29,589,246.28 - - 3,584,859,597.06 10,568,692.12 158,910,181.28 10,871,239,043.27
2. Investments in other equity
instruments 5,027,489,054.30 - -81,332,522.97 - 28,410,932.19 472,850,846.22 -46,561,368.52 4,455,155,248.78
Subtotal financial assets 12,135,937,765.07 29,589,246.28 -81,332,522.97 - 3,613,270,529.25 483,419,538.34 112,348,812.76 15,326,394,292.05
Total 12,135,937,765.07 29,589,246.28 -81,332,522.97 - 3,613,270,529.25 483,419,538.34 112,348,812.76 15,326,394,292.05
Financial liabilities 22,155,013.53 - 1,548,378.54 - - - - 23,703,392.07
Note 1: Financial assets held for trading include structured deposits that do not carry the characteristics of contract cash flow for principal and interest. The structured deposits have short maturities and are highly liquid, and net
purchases and sales for the current period are stated in the current period.
Other changes
Other changes in financial assets held for trading are mainly investment income realized by matured structured deposits, and other changes in investments in other equity instruments are mainly due to
exchange differences on translation of foreign currency financial statements.
Did significant changes occur for the Company’s major asset measurement attributes during the reporting period?
□Yes √No

S.F. Holding Co., Ltd. 2021 Semi-Annual Report
65
4. Limitation of asset rights as of the end of the reporting period
At the end of the reporting period, the Company’s assets with restricted rights are mainly legal reserves in the Central Bank and
long-term bank borrowing mortgage, details of which are as follows:
Unit: RMB
Item Book Value at the End of Period Limitation Reason
Cash at bank and on hand 657,359,839.02 Legal reserves in the Central Bank
Fixed assets 138,131,064.70 Long-term borrowing mortgage
Intangible assets 37,331,287.81 Long-term borrowing mortgage
Investment properties 120,581,681.47 Long-term borrowing mortgage
Construction in progress 56,904,866.40 Long-term borrowing mortgage
Total 1,010,308,739.40
VI. Analysis of Investments
1. General Situation
√ Applicable □ Not applicable
The Company is required to comply with the disclosure requirements of the “Guidelines of the Shenzhen Stock Exchange for Industrial Information Disclosure No.9 –Listed Companies Engaged in the Express Delivery Services Business.”
Investment Amount During the Reporting
Period (RMB)
Investment Amount During the same
period
of previous year (RMB)
Change
9,779,121,645.46 4,073,775,309.03 140.05%
Of these, breakdown items of capital expenditure during the reporting period are as in the table below:
Item Investment Amount During the Reporting
Period (RMB)
Office and Buildings 319,226,178.92
Land 1,017,940,227.93
Warehouse 614,274,346.62
Sorting center 3,079,207,621.27
Aircraft 1,463,149,260.61
Vehicle 750,959,721.02
Information technology equipment 414,673,536.57
Equity investments 590,678,590.99
Others 1,529,012,161.53
Total 9,779,121,645.46
2. Significant Equity Investment Obtained During the Reporting Period
□Applicable √ Not applicable
3. Significant Non-Equity Investment Ongoing During the Reporting Period
□Applicable √ Not applicable

S.F. Holding Co., Ltd. 2021 Semi-Annual Report
66
4. Investments in Financial Assets
(1) Investments in Securities
√ Applicable □Not applicable
Unit: RMB
Security Type Stock
Code
Abbreviation
of Security
Initial
Investment
Accounting
Measurement
Model
Book value at the beginning of
the reporting
period
Gains and
losses from
changes in
fair
value during
the period
Accumulated
fair value changes
included in
equity
Purchase
amount during the
reporting
period
Sales
amount during the
reporting
period
Gains and losses
of the reporting
period
Book value at
the end of the
reporting period
Accounting
items Capital source
Domestic and
foreign stock 06166 China VAST 235,363,230.78
Fair value
measurement 278,203,363.27 - -14,487,217.96 - 15,675,043.26 14,620,117.03 245,170,032.06
Investments in other
equity instruments
Self-owned
funds
Domestic and foreign stock
01810 Xiaomi Corporation
- Fair value measurement
386,952,350.26 - -66,147,133.51 - 316,948,959.29 - -
Investments in other
equity
instruments
Self-owned funds
Domestic and
foreign stock 01492
Zhongdi
Dairy -
Fair value
measurement 100,084,665.79 - 141,583.16 - 100,226,843.67 - -
Investments in other
equity
instruments
Self-owned
funds
Domestic and foreign stock
300771 Zhilai Technology
21,377,000.00 Fair value measurement
125,918,400.00 - -18,115,200.00 - - - 107,803,200.00
Investments
in other equity
instruments
Self-owned funds
Domestic and foreign stock
GB00BLH1QT30
Samarkand 28,160,015.47 Fair value measurement
- - 14,390,410.09 28,410,932.19 - - 42,974,604.86
Investments
in other equity
instruments
Self-owned funds
Other securities held at the end of the
period - -- - - - - - - - -- --
Total 284,900,246.25 -- 891,158,779.32 - -84,217,558.22 28,410,932.19 432,850,846.22 14,620,117.03 395,947,836.92 -- --
Disclosure Date of Securities Investment
Approval Board Announcement N/A
Disclosure Date of Securities Investment
Approval Shareholders Meeting Announcement (if any)
N/A

S.F. Holding Co., Ltd. 2021 Semi-Annual Report
67
(2) Investments in Derivatives
√ Applicable □ Not applicable
Unit: RMB10 thousands
Counter
party
Related-
party
relationship
(Y/N)
Related-
party
transacti
ons (Y/N)
Type of
derivatives
Initial
investment amount
Starting date
Ending date
Investment
amount at the
beginning of
the reporting period
Amount of
purchase in
the reporting period
Amount of
sales in the
reporting period
Provision
for impairment
Investment
amount at the
end of the
reporting period
Investment amount
at the end of the
reporting period to
net assets of the Company
Gains/ (losses)
recognized
during the reporting
period
Bank No No Foreign exchange
forward contracts 129,275.00 2020/7/20 2023/7/24 130,466.00 N/A N/A - 129,275.00 2.26% -184.31
Bank No No Foreign exchange
forward contracts 96,956.25 2020/7/28 2023/7/24 97,849.50 N/A N/A - 96,956.25 1.69% -138.23
Bank No No Foreign exchange
forward contracts 96,956.25 2020/7/30 2023/7/24 97,849.50 N/A N/A - 96,956.25 1.69% -138.23
Total 323,187.50 -- -- 326,165.00 N/A N/A - 323,187.50 5.64% -460.77
Source of funds Self-owned funds
Lawsuit (if applicable) N/A
Disclosure Date of Derivatives Investment
Approval Board Announcement (if any) March 24, 2020
Disclosure Date of Derivatives Investment
Approval Shareholders Meeting Announcement (if any)
N/A
Risk analysis and control measures for
derivatives investment during the reporting
period (including but not limited to market
risk, liquidity risk, credit risk, operational risk, legal risk, etc.)
(I) Risk analysis
The foreign exchange hedging business is carried out by the Company based on the principles of lawfulness, prudence, safety and effectiveness, and not for
speculative purposes. All foreign exchange hedging transactions are derived from normal cross-border business, but certain risks may exist in foreign
exchange hedging transactions.
1. Market risk: The foreign exchange hedging business carried out by the Company and its subsidiaries mainly involves daily cross-border intermodal
transportation fees and investment and financing activities denominated in foreign currencies related to the main business. The associated market risk refer
to losses which may arise from changes in price of foreign exchange hedging products due to fluctuations in market prices of underlying exchange rates and
interest rates.

S.F. Holding Co., Ltd. 2021 Semi-Annual Report
68
2. Liquidity risk: Since all foreign exchange hedging business is conducted through financial institutions, we are subject to the risk of having to pay fees to
banks due to losses in closing out positions caused by insufficient liquidity in the market.
3. Non-performance risk: The Company and its subsidiaries conduct foreign exchange hedging business mainly based on rolling forecasts for risk
management. We are subject to the risk that the actual cash flow deviates from forecast, resulting in failure to fulfill obligations under relevant hedging
contracts when due.
4. Other risks: In the course of business, if the person concerned fails to report and seek approval in accordance with the prescribed procedures, or fails to
make records on foreign exchange hedging business accurately, timely and completely, losses may be incurred or trading opportunities may be lost. At the
same time, if the person concerned fails to fully understand the terms of the transaction contract and product information, we are exposed to related legal risks and transaction losses as a result.
(II) Risk control measures
1. Clarify the criteria of initiating transaction of foreign exchange hedging product: All foreign exchange hedging businesses are derived from normal
cross-border business for the purpose of averting and preventing exchange rate and interest rate risk. No foreign exchange derivatives trading shall be
carried out for speculative purposes.
2. Selection of products: Hedging products with simple structure, strong liquidity and controllable risk are selected to carry out foreign exchange hedging
business.
3. Counterparty selection: The counterparties of the Company’s foreign exchange hedging business are large state-owned commercial banks and
international banks with sound operation, good credit, long history of cooperation with the Company and good credit standing.
4. Determination of fair value of foreign exchange hedging products: The foreign exchange hedging products operated by the Company are mainly for the
management of foreign exchange transactions in the predictable future period, withhigh market transparency and active trading; the transaction price and
settlement unit price of which can fully reflect their fair value. The Company determines the fair value of the hedging products in accordance with the
transaction data provided by or obtained from the public domain including banks and Reuters.
5. Equipped with professional staff: The Company has maintained a team of professionals with expertise in financial derivatives, responsible for the
Company’s exchange rate risk management, market analysis, product research and the Company’s overall management policy recommendations, etc.
6. Establishing a comprehensive risk alarm and reporting mechanism: The Company sets risk limits for foreign exchange hedging business where
transactions have been made, timely evaluates changes in risk exposure and derived gains and losses, and provides regular risk analysis report to the
management and the Board of Directors. Appropriate risk assessment models or monitoring systems are used to continuously monitor and report various
risks. More frequent reports are made when the market fluctuates drastically or when risks are higher. A response plan will be made promptly.
7. Separation of duties and personnel between the front end and back end is strictly implemented. Dealers cannot concurrently hold the position as
accounting personnel and vice versa.
Changes in market price or fair value of
invested derivatives during the reporting
period (the specific methods, relevant
assumptions and parameters used in the
The Company’s analysis of the fair value of derivatives is based on the financial market fair value valuation report provided by the bank at month end.

S.F. Holding Co., Ltd. 2021 Semi-Annual Report
69
analysis of the fair value should be disclosed)
Explanation of whether the accounting
policies and accounting principles of the
Company’s derivatives during the reporting
period are significantly changed compared with the previous reporting period
No
Opinions of independent directors on the
Company’s derivatives investment and risk
control
The independent directors believed that the Company had established an internal control system for foreign exchange hedging and effective risk control
measures in accordance with the requirements stipulated by relevant laws. Under the premise of complying with national laws and regulations and ensuring
that the Company’s daily operation were not affected, the Company used its own funds to carry out foreign exchange hedging when appropriate, which was
conducive to preventing interest rate and exchange rate risks, reducing the impact of interest rate fluctuations on the Company, in line with the interests of the Company and all shareholders and was no harm to the Company and all shareholders, especially the interests of minority shareholders.

S.F. Holding Co., Ltd. 2021 Semi-Annual Report
70
VII. Sale of Significant Assets and Equity
1. Sale of significant assets
□ Applicable √ Not applicable
2. Sale of significant equity
√ Applicable □ Not applicable
Counterparty
Disposal of
equity interests
Date of disposal
Transaction
Price (RMB0’000)
Net profit attributable
to the Company by
the disposed equity
from the beginning of the reporting period to
the date of disposal
(RMB0’000)
Impact of the disposal
of equity interests on the Company
Proportion
of net profit
attributable
to the equity
interests disposed to
the
Company’s
total net
profit
The pricing
principle for
disposal of the equity
interests
Related
party transaction
Relationship
with the counterparty
Completion
of the
transfer of the equity
interests
involved
Implemented
as
scheduled. If
not, provide the reasons
and steps
taken
Date of disclosure
Disclosure Index
SF Logistics Holdings
Limited
100% equity
of Golden
Bauhinia Logistics
Holdings
Limited and
its
subsidiaries
May 13, 2021
242,427.82 N/A
It is conductive to expanding the
innovative financing
channels for the
Company to enhance
the efficiency of cash turnover, optimize the
asset and liability
structure, establish an
industrial-park
light-asset capital
operation platform
and improve the
Company’s cash flow
115.82%
Pricing will be
negotiated
with the
transferee
based on the appraised
value of the
property
assets as at
the valuation
benchmark
date.
No N/A Yes Yes
April29, 2021 and
May 19,
2021
The “Announcement on the Establishment of A Real Estate
Investment Trust by a Holding
Subsidiary and Its Listing on the Main
Board of the Hong Kong Stock
Exchange” (No. 2021-058) and “Progress Announcement on the
Establishment of a Real Estate
Investment Trust by a Holding
Subsidiary and Its Listing on the Main
Board of the Hong Kong Stock
Exchange” (No. 2021-066) disclosed
by the Company on the Cninfo website
(http://www.cninfo.com.cn)

S.F. Holding Co., Ltd. 2021 Semi-Annual Report
71
VIII. Analysis of Major Holdings and Participating Companies
√ Applicable □ Not applicable
Major subsidiaries and equity participation companies that affect the Company’s net profit by more than 10%
Unit: RMB
Company
name
Company
Type Primary Business
Registered
Capital Total Assets Net Assets
Operating
Income
Operating
Profit Net Profit
Shenzhen S.F.
Taisen
Holdings (Group) Co.,
Ltd.
Subsidiary
Investments in
industrial businesses,
investment consulting
and other information
consulting, supply chain management,
asset management,
capital management,
investment
management, etc.
RMB2,010 million
58,989,386,828.76 33,422,205,923.35 1,956,676,292.94 67,467,644.85 33,382,610.81
Acquisition and disposal of subsidiaries during the reporting period
√ Applicable □ Not applicable
Company Name
Acquisition or
Disposal of
Subsidiaries During the Reporting Period
Impact on Overall Production
Operations and Performance
Chongqing E-PLUS Technology Co., Ltd. New establishment No major impact
Chongqing Xuefeng Zhiyuan Supply Chain Management Co., Ltd. New establishment No major impact
Chongqing Jieyutai Enterprise Management Co., Ltd. New establishment No major impact
Chongqing Fengyutai Enterprise Management Co., Ltd. New establishment No major impact
Chongqing Fonair Aviation Engineering Technology Co., Ltd. New establishment No major impact
EXEL Logistics (Tianjin) Co., Ltd. New establishment No major impact
EXEL Aolong Logistics (Zhanjiang) Co., Ltd. New establishment No major impact
Yirongcheng Information Service (Wuhan) Co., Ltd. New establishment No major impact
New Havi (Hubei) Supply Chain Management Co., Ltd. New establishment No major impact
Xinjiang E-PLUS Technology Co., Ltd. New establishment No major impact
Xi'an Fengle Apartment Management Co., Ltd. New establishment No major impact
Wuhan Fengyu Apartment Management Co., Ltd. New establishment No major impact
Tianjin E-PLUS Technology Co., Ltd. New establishment No major impact
Tianjin Shunxin Freight Co., Ltd. New establishment No major impact
Tianjin Bingzhi Supply Chain Management Co., Ltd. New establishment No major impact
Taizhou Jietai Enterprise Management Co., Ltd. New establishment No major impact
Sichuan E-PLUS Technology Co., Ltd. New establishment No major impact
Sichuan Jieyutai Enterprise Management Co., Ltd. New establishment No major impact
S.F. (Chengdu) International Logistics Co., Ltd. New establishment No major impact
Shijiazhuang E-PLUS Technology Co., Ltd. New establishment No major impact
Shenyang E-PLUS Technology Co., Ltd. New establishment No major impact
Shenzhen Fengwang Holding Co., Ltd. New establishment No major impact
Shenzhen Chenfeng Industrial Investment Development Co., Ltd. New establishment No major impact
Shenzhen Fengzan Technology Co., Ltd. New establishment No major impact
Shanghai Zhihui Fenghe Trading Co., Ltd. New establishment No major impact
Shanghai E-PLUS Technology Co., Ltd. New establishment No major impact
Shanghai Xijie Supply Chain Technology Co., Ltd. New establishment No major impact
Shanghai Shunzijia Technology Co., Ltd. New establishment No major impact
Shanghai S.F. E-commerce Co., Ltd. New establishment No major impact

S.F. Holding Co., Ltd. 2021 Semi-Annual Report
72
Shanghai Gejie Supply Chain Technology Co., Ltd. New establishment No major impact
Shanghai Fengji Technology Co., Ltd. New establishment No major impact
Shanxi E-PLUS Technology Co., Ltd. New establishment No major impact
Shandong E-PLUS Technology Co., Ltd. New establishment No major impact
Ningxia E-PLUS Technology Co., Ltd. New establishment No major impact
Nanning E-PLUS Information Technology Co., Ltd. New establishment No major impact
Nanchang Jietai Industrial Park Management Co., Ltd. New establishment No major impact
Luohe Fengtai Industrial Park Management Co., Ltd. New establishment No major impact
Jinhua Jietai Enterprise Management Co., Ltd. New establishment No major impact
Jiangxi E-PLUS Technology Co., Ltd. New establishment No major impact
Jiangsu S.F. Information Service Technology Co., Ltd. New establishment No major impact
Jilin E-PLUS Technology Co., Ltd. New establishment No major impact
Huai'an Fengyutai Enterprise Management Co., Ltd. New establishment No major impact
Huai'an Fengtai E-commerce Industrial Park Co., Ltd. New establishment No major impact
Heilongjiang E-PLUS Technology Co., Ltd. New establishment No major impact
Hebi Fengtai Industrial Park Asset Management Co., Ltd. New establishment No major impact
Henan E-PLUS Information Technology Co., Ltd. New establishment No major impact
Hefei E-PLUS Technology Co., Ltd. New establishment No major impact
Hefei Jiafeng Industrial Park Management Co., Ltd. New establishment No major impact
Hefei Fengyutai Enterprise Management Co., Ltd. New establishment No major impact
Hainan E-PLUS Technology Co., Ltd. New establishment No major impact
Hainan S.F. International Supply Chain Management Co., Ltd. New establishment No major impact
Guizhou E-PLUS Technology Co., Ltd. New establishment No major impact
Guangzhou Fengyi Supply Chain Management Co., Ltd. New establishment No major impact
Guangzhou Fengle Apartment Management Co., Ltd. New establishment No major impact
Guangzhou Fengda Express Co., Ltd. New establishment No major impact
Gansu Yishoufa Information Technology Co., Ltd. New establishment No major impact
SF Supply Chain (Hainan) Co., Ltd. New establishment No major impact
Dongguan S.F. Information Technology Service Co., Ltd. New establishment No major impact
Dongguan Chengfeng Technology Co., Ltd. New establishment No major impact
Chengdu Shengyutai Enterprise Management Co., Ltd. New establishment No major impact
Changzhou Fengyutai Enterprise Management Co., Ltd. New establishment No major impact
Beijing Yishoufa Technology Co., Ltd. New establishment No major impact
Beijing Tongchen Human Resource Service Co., Ltd. New establishment No major impact
Beijing Fengzan Technology Co., Ltd. New establishment No major impact
Bengbu S.F. Logistics Co., Ltd. New establishment No major impact
Zhentai Industrial Park Limited New establishment No major impact
Zhentai Industrial Park (Hong Kong) Limited New establishment No major impact
YouTai Investment Limited New establishment No major impact
YiJie Investment Limited New establishment No major impact
Yifeng Industrial Park Limited New establishment No major impact
Yifeng Industrial Park (Hong Kong) Limited New establishment No major impact
Taichen Industrial Park Limited New establishment No major impact
Taichen Industrial Park (Hong Kong) Limited New establishment No major impact
ShunJie Investment Limited New establishment No major impact
Shunda Industrial Park Limited New establishment No major impact
Shunda Industrial Park (Hong Kong) Limited New establishment No major impact

S.F. Holding Co., Ltd. 2021 Semi-Annual Report
73
SF INTERNATIONAL EXPRESS (MALAYSIA) SDN. BHD New establishment No major impact
SF LOGISTICS BRASIL LTDA. New establishment No major impact
SF Holding Investment 2021 Limited New establishment No major impact
SF EXPRESS SPAIN GLOBAL,S.L. New establishment No major impact
SF Express International Bangladesh Ltd. New establishment No major impact
SF Express (Mauritius) New establishment No major impact
SF EXPRESS (ITALY) S.R.L. New establishment No major impact
SF EXPRESS (HUNGARY) Kft. New establishment No major impact
Ruilifeng Industrial Park Limited New establishment No major impact
Ruilifeng Industrial Park (Hong Kong) Limited New establishment No major impact
Ruifeng Industrial Park Limited New establishment No major impact
Ruifeng Industrial Park (Hong Kong) Limited New establishment No major impact
Jietai Industrial Park Limited New establishment No major impact
Jietai Industrial Park (Hong Kong) Limited New establishment No major impact
Jiafeng Industrial Park Limited New establishment No major impact
Jiafeng Industrial Park (Hong Kong) Limited New establishment No major impact
Hongtong Industrial Park Limited New establishment No major impact
Hongtong Industrial Park (Hong Kong) Limited New establishment No major impact
Hongtai Industrial Park Limited New establishment No major impact
Hongtai Industrial Park (Hong Kong) Limited New establishment No major impact
Hengfeng Industrial Park Limited New establishment No major impact
Hengfeng Industrial Park (Hong Kong) Limited New establishment No major impact
Hefeng Industrial Park Limited New establishment No major impact
Hefeng Industrial Park (Hong Kong) Limited New establishment No major impact
Fengyutai Industrial Park Limited New establishment No major impact
Fengyutai Industrial Park (Hong Kong) Limited New establishment No major impact
Fengruntai Industrial Park Limited New establishment No major impact
Fengruntai Industrial Park (Hong Kong) Limited New establishment No major impact
Fengruikai Industrial Park Limited New establishment No major impact
Chengtai Industrial Park Limited New establishment No major impact
Chengtai Industrial Park (Hong Kong) Limited New establishment No major impact
Weishi Intenet Insurance Agency Co., Ltd. Asset acquisition No major impact
Jiangsu Senyuan Household Appliance Technology Co., Ltd. Acquisition No major impact
Flourish Harmony Holdings Company Limited Acquisition No major impact
Advance Harmony Holdings Company Limited Acquisition No major impact
Bon Way Logistics (H.K.) Company Limited Acquisition No major impact
Bon Way Trucking Company Limited Acquisition No major impact
ULTRA WISE INVESTMENT LIMITED Acquisition No major impact
SUNNY SIGHT LIMITED Acquisition No major impact
FORTUNE UP DEVELOPMENT LIMITED Acquisition No major impact
Zhengzhou Fengtai E-commerce Industrial Park Management Co., Ltd. Sale No major impact
Beijing Huabao Lutong Automobile Investment Co.,Ltd. Sale No major impact
Wuhu Fengtai E-commerce Industrial Park Management Co., Ltd. Sale
For details, please refer to Note
5(2) of Chapter 10 Financial Statements.
GOODEAR DEVELOPMENT LIMITED Sale
For details, please refer to Note
5(2) of Chapter 10 Financial
Statements.

S.F. Holding Co., Ltd. 2021 Semi-Annual Report
74
Foshan Runzhong Industrial Investment Co., Ltd. Sale
For details, please refer to Note
5(2) of Chapter 10 Financial Statements.
CHUI YUK HOLDINGS LTMITED Sale
For details, please refer to Note
5(2) of Chapter 10 Financial
Statements.
Wuhu Industrial Park Limited Sale
For details, please refer to Note
5(2) of Chapter 10 Financial Statements.
Wuhu Fengtai (Hong Kong) Limited Sale
For details, please refer to Note
5(2) of Chapter 10 Financial Statements.
Golden Bauhinia Logistics Holdings Limited Sale
For details, please refer to Note
5(2) of Chapter 10 Financial Statements.
Foshan Industrial Park Limited Sale
For details, please refer to Note
5(2) of Chapter 10 Financial
Statements.
Foshan Fengtai (Hong Kong) Limited Sale
For details, please refer to Note
5(2) of Chapter 10 Financial Statements.
Zonghao Supply Chain Consulting (Shenzhen) Co., Ltd. Cancellation No major impact
EXEL Supply Chain Management (Shanghai) Co., Ltd. Cancellation No major impact
S.F. Intra-city Holding Co., Ltd. Cancellation No major impact
Shenzhen FengKong Technology Co., Ltd. Cancellation No major impact
Dunhuang Fengzhao Technology Co., Ltd. Cancellation No major impact
Dingxi Fengnong Technology Co., Ltd. Cancellation No major impact
Descriptions for major holdings and participating companies.
The net profit of Shenzhen S.F. Taisen Holdings (Group) Co., Ltd. was generated from its principal operations.
IX. Structured Entities Controlled by the Company
□ Applicable √ Not applicable
X. Company risks and countermeasures
1. Market risk
Risk of macro-economic fluctuations: The logistics industry plays an important fundamental role in the development of the
national economy but it is also significantly affected by macroeconomic conditions. In recent years, China’s macroeconomy has
experienced slowing growth as it underwent a period of economic structure transition, and the future development will remain rather
complicated. In addition, the recurring of and uncertain global situation of the COVID-19 pandemic may affected certain regions in
China and may lead to local logistical suspension. The combination effect of above issues may bring a certain impact on the overall
development of China’s logistics industry and the performance of SF Holding.
Market competition risks: Competition in China’s express logistics industry has become increasingly fierce. On the one hand,
industry leading express logistics enterprises continue to strive to expand their businesses and networks. On the other hand,
E-commerce platform enterprises, as well as international logistics operators with a presence in China are creeping into the express
logistics industry with great resources and sufficient capital, further exacerbating market competition. If the Company cannot adjust
its operating strategies and take effective countermeasures in a timely manner in response to market changes, our growth rate may
slow down, market share and gross margin may decline.

S.F. Holding Co., Ltd. 2021 Semi-Annual Report
75
Currently, economies of scale are gradually emerging in the operations of China’s mainstream courier companies, providing
objective leeway for a decline in courier service prices. At the same time, homogeneity of service we are offering in the courier and
logistics industry is relatively high, and market competition is relatively fierce. In addition, low-price strategies have become the
main means by which new industry entrants rapidly seize market share, impacting the existing competitive situation of e-commerce
express delivery industry, and price wars are also increasing in ferocity. The Company has been building mid-to-high end market
barriers, forging differentiated competitive advantage and price moat through timeliness and service quality. In order to meet the
diversified needs of customers, the Company has actively marched into the mid-to-low end e-commerce market in recent years so as
to build a complete product mix. Under the impact of competition in the e-commerce express market, the Company's express
products and services may face downward pricing pressure in future.
Risks arising from change in new business model: In recent years, with the rapid development of information technology, the
impact of the Internet economy on all aspects of life has become increasingly obvious. In the express delivery industry, information
platform-type enterprises have emerged. Through fast matching and effective management of information between supply and
demand, such enterprises can quickly gather and utilize crowd-sourcing personnel to deliver appropriate services for customers,
which will have a certain impact on the traditional business model of the express delivery industry.
Risk response: In the face of above risks, the Company has established a comprehensive risk management and control system,
and is continuously improving and iterating in response to market changes. The Company tracked the macro-economy and the
impacts caused by the pandemic, focused on the analysis of its impact on our main business, and adjusted our operation strategies in
a timely manner to minimise the adverse impact of changes in macro-economy and the pandemic on the Company’s business and
future development. The Company pays close attention to and studies industry development trends, analyses the market competition
patterns, and adopts active, effective strategies to achieve forward-looking planning and business resource distribution. The Company
adheres to the multi-dimensional development of business, constantly improves the product portfolios to achieve a differentiated
service experience; The Company also deeply integrates the business foundation in order to achieve the resources complementation
and network effectiveness for establishing long-term core competitiveness. Meanwhile, the Company attaches great importance to
science and technology investment, as it could enable product innovation, improve service quality, consolidate core competition
barriers, and thereby supporting the long-term sustainable development of the Company’s business.
2. Policy risk
Risks arising from changes in industry regulations and industrial policies: The operation of express delivery requires
business licensing and is subject to regulation by laws, administrative rules and industry standards such as the Postal Law of the
People’s Republic of China (《邮政法》), the Administrative Measures for Express Delivery Business Licensing (《快递业务经营
许可管理办法》), the Administrative Measures for Express Delivery Market (《快递市场管理办法》) and the Rules for Guiding the
Operation of Express Business (《快递业务操作指导规范》). In order to support the development of the express delivery industry,
competent departments at various levels have successively introduced a number of industrial support and encouragement policies.
However, should major changes in or adjustments to relevant laws, regulations or industrial policies occur in the future, they may
have an impact on the development trend and market competition landscape of the express delivery industry, which may in turn affect
the future business growth and performance of the Company.
Risk response: The Company has established research teams for state and local policies in all business units to conduct
in-depth analysis on relevant policies introduced and scientific predictions of future policy directions and trends in the light of overall

S.F. Holding Co., Ltd. 2021 Semi-Annual Report
76
changes in the external environment. Forward-looking plans are implemented and adjusted by fully capitalizing on favorable policies
while avoiding policy risks, hence promoting business growth.
Risks from relevant state policies on environmental protection, energy conservation and emission reduction: China has
undertaked that it will strive to reach the peak of CO2 emissions by 2030 and achieve carbon neutrality by 2060. It is foreseeable that
China will issue subsequent policies on environmental protection, energy conservation and emission reduction. Such policies to be
released may affect the service and operation pattern of express delivery companies, and may lead to increased expenses in relevant
aspects such as environmental protection, energy conservation and emission reduction incurred by express delivery companies, which
may affect the future performance of the Company. Meanwhile, if companies fail to fufill their green environmental obligations in
accordance with the laws, they will not only be liable to the relevant legal obligation, but also impair their social images.
Risk response: The Company took into account the external environment and policy changes as well as developed a keen
insight into the development trend of the industry, so as to steer the direction of the industry and implement the forward-looking
deployment and adjustment. The Company paid attention to its own impacts on the environment, therefore formulating the "SF
Holdings’ White Paper for Carbon Emisson Target 2021 " (《顺丰控股碳目标白皮书 2021》). By leveraging technological strength
such as artificial intelligence and big data, the Company adjusted the energy consumption structure, upgraded transportation and
business models, and then promoted the green and low-carbon reform.
3. Business risks
Risks of possible rising costs: The traditional express delivery industry is a labor-intensive industry. There are relatively large
demands for labor along various stages of operation such as collection, sorting, transportation and delivery. With decreasing rate of
population growth in China, there are certain pressures on rising labor costs while investments in logistics infrastructures and other
aspects are also increasing. If the Company cannot secure enough business volume or effectively control costs in the future, it will
probably face challenges in its future earnings growth.
Risk response: The Company has improved its logistics framework, innovated system component, including bringing the
entire logistics process online by applying smart technologies, improving transit depots’ automation in productivity, upgrading route
planning, using scientific and technological means to enhance efficiency and reduce manpower investment and labor costs, gradually
achieving transformation of the express delivery industry from a labor-intensive industry to a technology intensive industry. The
Company also continues to review and optimise resource invested in all business units to expand the synergy and reuse of resources
and enhance cost efficiency. Considering that the Company is in the critical period of new business expansion, the increase of the
predictive investment in logistics infrastructures and the in-depth integration of business framework are conducive to creating
long-term core competiveness, and will gradually obtain scale dividends with the high-speed growth of new business.
Risks from fuel price fluctuation: Transportation cost is one of the major costs of the express delivery industry, and fuel cost
is a component of transportation cost. Fluctuation of fuel price will have a certain impact on the profitability of express delivery
companies. If the fuel price rises significantly in the future, the Company will experience pressure of increased costs.
Risk response: The Company will further optimise layout of sortation centers, enhance scientific route planning and loading
rate of operating routes, and improve resource utilization to reduce the risk of fuel price fluctuations. Further, the Company will
strengthen promotion for use of new energy vehicles to reduce the risk of fuel price fluctuations to a certain extent. Meanwhile, the
Company has matured operation and cost monitoring mechanisms. When costs fluctuate significantly, operation plans and fuel cost
control measures will be dynamically adjusted to reduce the negative impact of fuel cost fluctuation on the Company.

S.F. Holding Co., Ltd. 2021 Semi-Annual Report
77
International operation risk: As the Company strengthens the overseas networks and improves overseas service capability,
the international business of the Company has maintained high-speed growth in recent years. However, international logistics service
relying on international trade is subject to the impact of the COVID-19, international environment and other unpredictable factors.
For example, the global economic development, labor union, geopolitics, national relationships, international trade and tax policies,
all have experienced unprecedented changes and the uncertainties of international trade have intensified. Also, due to the continuous
impact of the COVID-19 and the different effect of the anti-epidemic policies of each country, the Company currently faces
challenges in both the transportation capacity of international routes for controlling purchase cost and stable operation capability in
some countries and regions where business has been set up. If the Company fails to take effective measures to deal with this, it may
have an adverse impact on the Company’s international business development.
Risk response: The Company carries out an in-depth research on the international political and economic situation and trade
development trend, to analyse international logistics competition pattern and implement forward-looking international strategic
planning and business layout. In the course of business development, we continue to track and study changes in trade policies,
closely monitor the market dynamics and adjust our corresponding strategies for international business operation in a timely manner.
To respond to the impact of international epidemic, the Company actively explores international transportation resources in terms of
the sea, land, air and rail, strengthens the monitoring of operation network, and makes every effort to ensure stable and efficient
cross-border services. Meanwhile, the Company increases the investment in scientific and technological resources, promotes the
construction of international business informationization, and facilitates to make operational decisions.
4. Exchange rate fluctuation risks
Exchange rate fluctuation risks: The Company is committed to providing accessible, reliable and integrated international
express delivery, logistics and supply chain solutions for domestic and foreign manufacturing companies, trading companies,
cross-border e-commerce businesses and consumers. Thus far, the Company has rolled out international logistics services in
countries including Singapore, South Korea, Malaysia, Japan and Thailand, and B2C and e-commerce delivery services in a number
of countries and regions. Going forward, as its overseas operations expand, businesses denominated in foreign currencies are set to
account for an increasing share of our total business volume. Given the uncertainties in the international financial environment and
fluctuations in RMB’s exchange rates, the Company’s revenue, earnings, foreign-currency assets, foreign-currency liabilities and
future foreign-currency transactions will all be subject to appreciation or depreciation, which will in turn affect the Company’s
business performance or financial statements.
Risk response: The Company’s foreign exchange transactions are mainly conducted based on the actual needs of its
cross-border foreign-currency businesses. To avoid and guard against risks associated with fluctuations in exchange rates and interest
rates, better manage its foreign currency positions and become more competitive, the Company has established the Management
System for Foreign Exchange Risk(《外汇风险管理制度》), and conducts centralized management of foreign currency positions,
under which it decides expenditure based on revenue, implements maturity matching and performs natural hedging to avoid foreign
exchange risk in advance wherever possible. It also uses financial derivatives and hedging products with low default risks and
controllable risks to lock in the costs of exchange rate and interest rate and avoid the relevant risks. All the Company’s hedging
transactions are conducted in strict compliance with the relevant hedging principles, and are based on our normal production and
business activities and justified with actual business operations. All the transactions are carried out for the purpose of locking in costs
and avoiding risks. The Company does not trade for speculative purposes, and operates within its authority to ensure effective
execution and reduce the impact of exchange rate fluctuations on its operation and earnings. In terms of counterparty selection, the
Company conducts foreign exchange hedging transactions only with large and established commercial banks home and abroad, and

S.F. Holding Co., Ltd. 2021 Semi-Annual Report
78
all such transactions conform to the principles of legality, prudence, safety and effectiveness. In addition, the Company will step up
efforts to study and analyse exchange rates and interest rates, closely monitor changes in the global markets, issue early warnings in
time, and take countermeasures accordingly.
5. Information system risk
Information system risk: To cope with our diversified development of the Company’s business and the complex and diverse
needs of customers, the Company has built and applied various information systems and technologies. Rapid development of the
industry and changing market also pose challenge of rapid change in technology and services to the construction of core business
systems of the Company. With the wide variety and rapid replacement of professional technologies in the Company along with
emerging new technologies, changes in information technology and future business requirements may cause certain information
system risks. Meanwhile, despite the series of information security control mechanisms established for the large amount of data
accumulated for years by the Company, there still exists certain human or system caused information security risks.
Risk Responses: The Company has formulated comprehensive response measures for information system risks. On the one
hand, the Company continues to carry out operation and optimization of the ISO27001 information security management system and
the ISO27701 privacy information management system. The Company implements information security control and protection in all
aspects according to established policies and strategies for information security, and continuously updates all procedures and systems
for information security. It continuously strengthens risk awareness of staff and trainings for staff operation standards, develops
internal information circulation guidelines, implements rules of strong control over sensitive information, avoids unintentional
violations, and constructs monitoring and pre-warning and response systems for abnormal behaviors, so as to eliminate information
system security risks in their infancy. Meanwhile, according to requirements of regulatory authorities, the Company has carried out
evaluation for security classification protection of information system. Based on high standards of technology protection
requirements, it conducts continuous and stable security intervention in the business system construction phase to improve the ability
of the clients’ service products and business systems themselves against anti-security attacks. During the operation of the information
system, it has established the security capability baseline (measurable cyberspace security capability evaluation), safe operation
capability (situational awareness of privacy data risks, MTTD and MTTR indicators based on offensive and defensive confrontations),
DevOps security capability (DevSecOps process and tool chain), and security ecology capability (external perception and linked stop
sell) to enhance the capability of the IT infrastructures to discover and defend against cyber security attacks. On the other hand, the
Company has established a more comprehensive system for prevention and control of information risks, formulated standard
processes such as the Major Event Management Process System for IT System (《IT 系统重大事件管理流程制度》) and the
Management Guidelines for Emergency Plan Formulation and Implementation of IT System (《IT 系统应急预案制定与执行管理指
引》) to implement closed-loop risk prevention and control in terms of pre-warning, in-process control and post-recording.
Additionally, the Company has actively cooperated with the National Development and Reform Commission, the State General
Administration of Posts and all levels of public security departments to combat behaviors such as black production and speculation;
has actively participated in the formulation and review of various information security standards of the National Information Security
Standards Committee, pilot work for implementation of policies; has regularly held security summits and security salons to facilitate
information sharing with industry leaders and industry elites; and has established alliance partnership and cooperation with
information security teams of well-known Internet and e-commerce companies for the joint construction of a safe and orderly
cyberspace.

S.F. Holding Co., Ltd. 2021 Semi-Annual Report
79
Chapter 4. Corporate Governance
I. Details about the Annual Shareholders’ General Meeting and Extraordinary Shareholders’
General Meetings Held during the Reporting Period
1. Details about the shareholders’ general meeting during the reporting period
Meeting Meeting Type Investor
Participation % Date Convened Disclosure Date Meeting Resolutions
First
Extraordinary
General
Meeting of
Shareholders of 2021
Extraordinary
General
Meeting
18.83% January 27, 2021 January 28, 2021
“Resolutions of the
First Extraordinary
General Meeting of
2021”
(2021-011)(http://www.cninfo.com.cn)
Second
Extraordinary
General
Meeting of
Shareholders of 2021
Extraordinary
General
Meeting
69.84% March 2, 2021 March 3, 2021
“Resolutions of the
Second
Extraordinary
General Meeting of
2021”
(2021-025)(http://www.cninfo.com.cn)
2020 Annual
General
Meeting
Annual General
Meeting 69.19% April 9, 2021 April 10, 2021
“2020 Annual
General Meeting
Resolutions”
(2021-049)
(http://www.cninfo.com.cn)
Third
Extraordinary
General
Meeting of
Shareholders of 2021
Extraordinary
General
Meeting
67.63% June 15, 2021 June 16, 2021
“Resolutions of the
Third Extraordinary
General Meeting of
2021”
(2021-080)(http://www.cninfo.com.cn)
2. Extraordinary Shareholders’ General Meeting requested by the preferred shareholder with restitution of
voting right
□ Applicable √ Not applicable
II. Changes of Directors, Supervisors, and Senior Executives
√ Applicable □ Not applicable
Name Position(s) held Type Date Reason
Sun Xun
Supervisor,
Chairman of the
Supervisory
Committee
Resigned March 16, 2021
Resigned as supervisor and Chairman of the
Supervisory Committee due to personal position adjustment.
Li Li
Employee
representative supervisor
Resigned March 16, 2021 Resigned as supervisor due to personal position
adjustment.
Chu Yan
Employee
representative supervisor
Elected April 8, 2021 Elected as the employee representative supervisor to
fill vacancy
Wang Jia Supervisor Elected April 9, 2021 Elected as supervisor to fill vacancy

S.F. Holding Co., Ltd. 2021 Semi-Annual Report
80
NG Wai Ting
Financial head,
deputy general manager
Resigned April 24, 2021
Resigned as the financial head and deputy general
manager due to personal reason, but still holds the position of director.
III. Profit Distribution & Increase of Share Capital due to Conversion of Equity Reserves
during the Reporting Period
□ Applicable √ Not applicable
The Company does not plan to issue cash or equity dividends, nor to convert equity reserve into share capital of the Company.
IV. Execution of Stock Incentive Plan, ESOP, or Other Employee Incentives
□ Applicable √ Not applicable
During the reporting period, the Company did not have or execute any stock incentive plan, ESOP, or other employee incentives.

S.F. Holding Co., Ltd. 2021 Semi-Annual Report
81
Chapter 5. Environmental and Social Responsibilities
I. Environmental protection
Did the listed Company and its subsidiaries belong to the major pollutant discharge units announced by the Ministry of Ecology and
Environment?
□ Yes √ No
Other environmental related information
SF is deeply aware of the significance of green practice. As an enterprise with a sense of social responsibility, SF has been
committed to building sustainable supply chain services.We released the SF Holding Carbon Target White Paper 2021 on the World
Environment Day on June 5, 2021, and formulated ambitious carbon emission reduction targets and strategic plans based on past
carbon reduction achievements. We have set two carbon reduction targets. Firstly, SF will drive carbon green evolution through its
technology advantages, with a target to improve carbon efficiency by 55% in 2030 compared to 2021. Secondly, in order to construct
climate-friendly express delivery, the carbon footprint of each express parcel will be reduced by 70% in 2030 compared to 2021. We
have formulated a 10-year carbon reduction action plan to promote the achievement of the targets. Based on business growth
forecasts, the amount of carbon emissions that need to be reduced will increase year by year. We intend to achieve carbon reduction
goals by adjusting the energy structure, upgrading transportation and business models, thorough application of technological means,
and other means such as forestry carbon sinks and carbon trading.
In practice, SF has continuously injected technoloy in its operation, promoted the green and low-carbon reform with the power
of science and technology, improved and reshaped the logistics link of supply chain, subsequently made great achievements in
packaging, transportation, transport and other links. As of the first half of 2021, electronic waybills basically achieved full coverage,
the packaging ratio for thin tape reached 99.88%, and non-secondary packaging ratio for e-commerce express reached 99.37%.
We also hopes that the green value extends to the supply chain, so it advocates and joins hands with upstream and downstream
partners and customers to promote the green transformation and upgrading of the industry through technological empowerment, and
jointly assume the responsibility of protecting the earth, becoming partners to achieve zero carbon emissions.
II. Social Responsibilities
Empowering rural revitalization through industry services: SF Holding is the first domestic logistics company to deliver
fresh agricultural products directly from farmers to urban consumers in the form of express delivery. Since then, we have established
a business model from "field" to "mouth". For a long time, a large number of high-quality agricultural products have encountered
problems in the delivery process such as easy to damage, difficulty in packaging, prolonged transportation process, and inability to
form large scale. They have also encountered problems in marketing process such as few channels, single form, hard to find large
quantity of customers, and inability to have brand effect. Over time, farmers are hard to expand their income, and impossible for the
agricultural products to achieve profitability. SF Holding adhered to the concept of distributing quality agricultural products across
the country and promoting better brands of agricultural products.
Through the construction of collection points of agricultural products in the field, R&D investment in mobile sorting vehicles
to adapt to small-batch allocation, construction of fresh products’ pretreatment centers close to the place of origin, tailored design for

S.F. Holding Co., Ltd. 2021 Semi-Annual Report
82
the packaging of various fresh products, deployment of specialized refrigerated vehicles during the harvest season of characteristic
agricultural products, exclusive all-cargo aircrafts, and other transportation resources, SF Holding continued to refresh the delivery
speed of agricultural products in circulations, and to innovate fresh-preserving methods in delivery processes, helping farmers to
transport quality agricultural products out of the mountain, to the tables of thousands of households. With a robust logistics network,
top-notch packaging technology, and superior delivery capability, SF Holding overcame each thorny category of transportation,
including hairy crabs, beef and mutton, live fish, seafood, lychee, strawberry, peach, matsutake, etc., to realize a direct delivery
model with Chinese characteristics and nationwide coverage. SF Holding insisted to diversify the range of its services and business
scenarios through innovative logistics models, efficiency enhancement through cost reduction, and market pricing. In addition to
providing efficient logistics and distribution, SF Holding actively assisted local governments in building regional public brands to
make more agricultural products known to consumers, such as traceability and testing of agricultural residues, for rural revitalization,
allowing the Chinese to know, taste, and recognize more local brands of characteristic agricultural products.
Up to now, the upstream service network of agricultural products assisted by SF Holding has covered more than 2,800 cities
and more than 4,000 fresh products across the country. In the first half of 2021, SF Holding delivered 2,139 tons and 417 million
deliveries of characteristic agricultural products, generating an income of around RMB 21.2 billion to local farmers.
2021 is beginning of the "14th Five-Year Plan", which is also a year for rural revitalization acceleration. To actively respond to
the national strategy, continue to consolidate and expand the poverty alleviation achievements, and effectively cohesion with rural
revitalization, SF Holding targeted all 832 national-level poverty counties and more than 240 provincial-level poverty counties that
have been lifted out of poverty to continuously promote the special assistance and subsidy program for rural revitalization. We
continue to invest human resources, money, and supplies to help poverty-stricken villages achieve sustainable development to help
poverty-stricken villages achieve sustainability develop.

S.F. Holding Co., Ltd. 2021 Semi-Annual Report
83
Chapter 6. Significant Events
I. Commitments made by the Company’s actual controllers, shareholders, related parties,
purchasers, and others that were fulfilled during the reporting period and those not fulfilled
as of the end of the reporting period
□Applicable √ Not applicable
II. Status of Capital of the Listed Company Used for Non-operating Purposes by the
Controlling Shareholder and Other Related Parties
□Applicable √ Not applicable
III. Illegal Provision of Guarantees for External Parties
□Applicable √ Not applicable
IV. Details Regarding Engagement and Disengagement of Auditor
Is the semi-annual financial report audited?
□Yes √ No
The Company’s semi-annual financial report has not been audited.
V. Explanations provided by the Board of Directors, the Supervisory Committee, regarding
the “non-standard audit report” issued by the auditor for the reporting period
□Applicable √ Not applicable
VI. Explanations provided by the Board of Directors regarding the “non-standard audit
report” issued by the auditor for the last year
□Applicable √ Not applicable
VII. Bankruptcy and Reorganization
□Applicable √ Not applicable
There was no such situation for the Company during the reporting period.
VIII. Lawsuit
Significant Lawsuit or Arbitration
□Applicable √ Not applicable
There was no significant lawsuit or arbitration during the reporting period.
Other legal cases
□ Applicable √ Not applicable
As of June 30, 2021, other legal proceedings of the listed Company and its subsidiaries were as follows:

S.F. Holding Co., Ltd. 2021 Semi-Annual Report
84
1. The total amount involved in legal cases resolved during the reporting period was RMB101.30 million.
2. Cases not yet resolved during the reporting period include: Cases involving the Company and its subsidiaries as defendants
amounted to RMB196.82 million, accounting for 0.35% of audited net assets attributable to shareholders of the parent Company at
the end of 2020. The above-mentioned litigation matters include a number of independent traffic accident cases and transportation
claims with small amounts involved. The Company and its subsidiaries have already purchased commercial insurance for operating
vehicles, transportation and other business activities. Based on the historical experience, the insurance purchased can basically cover
the losses caused by the case. Cases involving the Company and its subsidiaries as plaintiffs amounted to RMB347.74 million,
accounting for 0.62% of audited net assets attributable to shareholders of the parent Company at the end of 2020. The described legal
proceedings will not have a material adverse effect on the Company’s financial status and ability to continue operations.
IX. Punishment and rectification
□Applicable √ Not applicable
X. Integrity of the Company, its controlling shareholders, and actual controller
□Applicable √ Not applicable

S.F. Holding Co., Ltd. 2021 Semi-Annual Report
85
XI. Significant related-party transactions
1. Related-party transactions relevant to routine operations
√Applicable □Not applicable
Related Party Relationship
Type of
related
party
transaction
Details of
related-partytransaction
Pricing principle
of the related party transaction
Transact
ion price
Transaction
amount (10
thousands RMB)
Proporti
on of
same
category
of
transacti
ons
Approved
transaction
quota (10
Thousands RMB)
Was the
approved
quota
exceeded
?
Related-pa
rty
transaction
settlement method
Similar
Market price
Disclosure
date Disclosure index
Mingde Holding
and its
subsidiaries
Controlling
shareholder of
the Company
Provide
services
to
related parties
Courier
service,
communicat
ion service,
technology
developmentservice, etc.
Fair pricing based
on market prices
in accordance with
the principle of
independent transactions
Contract
price 6,878.94 0.08% 30,000.00 No
Settlement
based on
the
settlement
period and
terms in
the contract
N/A January
8,2021
Announcement on
the“Proposal on Estimated
Daily Related-party
Transaction Amount in 2021”
disclosed at CNINFO
(Announcement No.
2021-007) (http://www.cninfo.com.cn)
Mingde Holding
and its
subsidiaries
Controlling
shareholder of
the Company
Receive
services
from
related parties
Agent
service fees,
etc.
Fair pricing based
on market prices
in accordance with
the principle of
independent transactions
Contract
price 10,222.31 0.13% 45,000.00 No
Settlement
based on
the
settlement
period and
terms in
the contract
N/A January
8,2021
Announcement on
the“Proposal on Estimated
Daily Related-party
Transaction Amount in 2021”
disclosed at CNINFO
(Announcement No.
2021-007) (http://www.cninfo.com.cn)
Mingde Holding
and its
subsidiaries
Controlling
shareholder of
the Company
Purchase
of goods
/
equipme
nt from
related parties
Purchase of
goods /
equipment
Fair pricing based
on market prices
in accordance with
the principle of
independent transactions
Contractprice
11,655.63 0.15% 30,000.00 No
Settlement
based on
the
settlement
period and
terms in
the contract
N/A January 8,2021
Announcement on
the“Proposal on Estimated
Daily Related-party
Transaction Amount in 2021”
disclosed at CNINFO
(Announcement No.
2021-007) (http://www.cninfo.com.cn)

S.F. Holding Co., Ltd. 2021 Semi-Annual Report
86
Mingde Holding
and its subsidiaries
Controlling
shareholder of the Company
Lease of
premises
from
related parties
Lease of
premises
Fair pricing based
on market prices
in accordance with
the principle of
independent transactions
Contract
price 7,367.57 0.09% 10,000.00 No
Settlement
based on
the
settlement
period and
terms in
the
contract
N/A January
8,2021
Announcement on
the“Proposal on Estimated
Daily Related-party
Transaction Amount in 2021”
disclosed at CNINFO
(Announcement No.
2021-007)
(http://www.cninfo.com.cn)
CR-SF
International
Express Co.,
Ltd.
A senior
manager of the
Company serves
as adirector of
CRSF
International
Express Co., Ltd.
Provide
services
to
related
parties
Transportati
on services
Fair pricing based
on market prices
in accordance with
the principle of
independent transactions
Contract
price 9,211.67 0.10% 55,000.00 No
Settlement
based on
the
settlement
period and
terms in
the contract
N/A January
8,2021
Announcement on
the“Proposal on Estimated
Daily Related-party
Transaction Amount in 2021”
disclosed at CNINFO
(Announcement No.
2021-007) (http://www.cninfo.com.cn)
CR-SF
International
Express Co., Ltd.
A senior
manager of the
Company serves
as a director of
CRSF
International
Express Co., Ltd.
Receive
services
from
related parties
Transportati
on services
Fair pricing based
on market prices
in accordance with
the principle of
independent transactions
Contract
price 29,123.19 0.37% 90,000.00 No
Settlement
based on
the
settlement
period and
terms in
the contract
N/A January
8,2021
Announcement on
the“Proposal on Estimated
Daily Related-party
Transaction Amount in 2021”
disclosed at CNINFO
(Announcement No.
2021-007) (http://www.cninfo.com.cn)
M China
Management
Limited and its
subsidiaries and
its franchisees
A director of the
Company serves
as a director of
the parent
company of M
China
Management Limited
Provide
services
to
related
parties
Supply
chain
service and
distribution
service
Fair pricing based
on market prices
in accordance with
the principle of
independent
transactions
Contract
price 76,808.54 0.87% 155,000.00 No
Settlement
based on
the
settlement
period and
terms in
the contract
N/A January
8,2021
Announcement on
the“Proposal on Estimated
Daily Related-party
Transaction Amount in 2021”
disclosed at CNINFO
(Announcement No.
2021-007) (http://www.cninfo.com.cn)
China
International
Marine
Containers
(Group) Co.,
Ltd. and its subsidiaries
A director of the
Company serves
as a director of
China
International
Marine
Containers
(Group) Co.,
Ltd.
Purchase
of goods
/
equipme
nt from
related parties
Purchase of
equipment
Fair pricing based
on market prices
in accordance with
the principle of
independent transactions
Contract
price 56,422.72 0.71% 140,000.00 No
Settlement
based on
the
settlement
period and
terms in
the
contract
N/A May
29,2021
Announcement on
the“Proposal on Increasing
the Estimated Daily
Related-party Transaction
Amount in 2021” disclosed at
CNINFO (Announcement No.
2021-074)
(http://www.cninfo.com.cn)
Total -- -- 207,690.57 -- 555,000.00 -- -- -- -- --

S.F. Holding Co., Ltd. 2021 Semi-Annual Report
87
Details of large amount of sales returns Nil
Actual performance in the reporting period versus
predicted total amount of daily related-party transactions, by types (if any)
The Company’s tenth meeting of the fifth Board of Directors on January 7,2021 and the First Extraordinary General Meeting of Shareholders
of 2021 on January 27,2021 reviewed and approved the “Proposal on Estimated Daily Related-party Transaction Amount in 2021.” Also, the
Company’s sixteenth meeting of the fifth Board of Directors on May 28,2021 reviewed and approved the “Proposal on Increasing the
Estimated Daily Related-party Transaction Amount in 2021.”The amount of the aforementioned related-party transactions did not exceed the
approved amount.
Reason for significant difference between the transaction
price and the market price (if applicable) N/A

S.F. Holding Co., Ltd. 2021 Semi-Annual Report
88
2. Related-party transactions relevant to purchases and sales of assets or equities
□Applicable √ Not applicable No related-party transactions relevant to purchases and sales of assets or equities during the reporting period.
3. Related-party transactions with joint investments
□Applicable √ Not applicable
No related-party transactions with joint investments during the reporting period.
4. Credits and liabilities with related parties
□Applicable√ Not applicable
No credits and liabilities with related parties in the reporting period.
5. Transactions with related financial companies and financial companies controlled by the Company
□Applicable √ Not applicable
No deposits, loans, credits or other financial business between the Company and the related financial companies and financial companies controlled by the Company and related parties.
6. Other significant related-party transactions
√ Applicable □Not applicable
(1) Waiver of preemptive rights on the capital increase of an investee company
In order to expand the network layout, quickly seize an advantageous position in the last-mile express logistics market, provide
better services and experience to consumers, and improve efficiency, Hive Box Holdings Limited (“Hive Box”), an investee company
of the Company, intended to introduce strategic investors for financing US$400 million(Hereinafter referred to as "This Financing").
Original shareholders of Hive Box will not participate in the subscription for new shares. After the completion of This Financing, the
Company’s shareholdings in Hive Box will be diluted from 10.06% to 8.73%.
In view of the fact that This Financing involves the Company waiving their preemptive rights on the capital increase of Hive
Box, according to the Stock Listing Rules of Shenzhen Stock Exchange and other related regulations, Hive Box is a related party of
the Company and therefore the Company’s waiver of preemptive rights on the capital increase of its investee company constitutes a
related party transaction.
On January 7, 2021 , the Company’s waiver of preemptive rights on the capital increase of its investee company Hive Box was
reviewed and approved at the tenth meeting of the fifth Board of Directors and the tenth meeting of the fifth board of supervisors of
the Company respectively, the contents of which are detailed in the Company’s announcements (Announcement No.
2021-004,2021-005,2021-006) disclosed on CNINFO.
(2) Related party transactions on capital increase to SF Intra-city
In order to accelerate the implementation of the last mile strategy, strengthen barriers to competition and further enhance the
core competitiveness of the Company, the Company intends to contribute increased capital to Hangzhou SF Intra-city Industrial Co.,
Ltd.(“SF Intra-city”), a subsidiary, through Taisen Holding, a wholly-owned subsidiary, and Taisen Holding intends to enter into the

S.F. Holding Co., Ltd. 2021 Semi-Annual Report
89
Capital Increase Agreement with SF Intra-city, of which both parties agree that the amount of the capital increase is RMB409 million.
Other shareholders of SF Intra-city will not participate in the subscription of the additional shares. Upon completion of the capital
increase, the Company's aggregate shareholding in SF Intra-city will increase from 65.46% to 66.76%.
In light of that Zhang Yichen has been appointed as a representative for the executive partner of Beijing Xinrunheng Equity
Investment Partnership (Limited Partnership) (“Beijing Xinrunheng”), a shareholder of SF Intra-city, and he concurrently serves as a
director of the Company. According to the Stock Listing Rules of Shenzhen Stock Exchange and other related regulations, Beijing
Xinrunheng is a related party of the Company and the capital increase to subsidiary constitutes a related party transaction.
On March 17, 2021, the capital increase to subsidiary was considered and approved at the 12th meeting of the 5th session of the
Board and the 12th meeting of the 5th session of the board of supervisors. The contents of which are detailed in the Company’s
announcement (2021-027, 2021-028, 2021-036) disclosed on Cninfo.
Major related party transactions were disclosed on the following websites:
Announcement Disclosure Date Disclosure Website
Announcement on the Resolution of the 10th Meeting of the 5th Session of the Board (2021-004)
January 8, 2021 http://www.cninfo.com.cn
Announcement on the Resolution of the 10th Meeting of the 5th Session of the Board of Supervisors (2021-005)
January 8, 2021 http://www.cninfo.com.cn
Announcement on Waiver of Preemptive Rights on
Capital Increase of an Investee Company and Related
Party Transaction (2021-006)
January 8, 2021 http://www.cninfo.com.cn
Announcement on the Resolution of the 12th Meeting of
the 5th Session of the Board (2021-027) March 18, 2021 http://www.cninfo.com.cn
Announcement on the Resolution of the 12th Meeting of
the 5th Session of the Board of Supervisors (2021-028) March 18, 2021 http://www.cninfo.com.cn
Announcement on Capital Increase to Subsidiary and
Related Party Transaction(2021-036) March 18, 2021 http://www.cninfo.com.cn
XII. Significant Contracts and Their Execution
1. Trusteeships, contracts, and leases
(1) Trusteeships
□ Applicable √ Not applicable
No significant trusteeships in the reporting period.
(2) Contracts
□ Applicable √ Not applicable
No significant contracts in the reporting period.
(3) Leases
□ Applicable √ Not applicable
No significant leases in the reporting period.

S.F. Holding Co., Ltd. 2021 Semi-Annual Report
90
2. Significant guarantees
√ Applicable □ Not applicable
Unit: RMB10 thousands
The listed Company and its subsidiaries’ guarantees to external parties (Guarantees to subsidiaries are not included)
Guarantee party
Disclosure
date of Quota announcement
Amount of
guaranteed
Quota approved
Actual
date of
occurrence
Actual
guarantee
amount
Type of
guarantee
Collateral
(if any)
Counter-g
uarantee
(if any)
Period of guarantee Executed
?
Guarantee for a
related party?
DHL Weiheng (Zhuhai) Supply Chain Management Co., Ltd. 2020/3/24 14,700.00 2020/12/31 12,642.00 Joint liability
guarantee
Zhuhai
project land Yes 2020/12/31-2033/12/23 No No
Total guarantee quota approved for external parties during the reporting
period (A1) 10,000.00
Total actual amount of guarantees for external
parties during the reporting period (A2) 0.00
Total guarantee quota approved for external parties at the end of the
reporting period (A3) 339,260.00
Total actual guarantee balance for external
parties at the end of the reporting period (A4) 12,642.00
The listed Company’s guarantees to subsidiaries
Guarantee party
Disclosure
date of Quota announcement
Amount of
guaranteed
Quota
approved
Actual
date of
occurrence
Actual
guarantee
amount
Type of
guarantee
Collateral
(if any)
Counter-g
uarantee
(if any)
Period of guarantee Executed
?
Guarantee for a
related party?
SF HOLDING INVESTMENT LIMITED 2017/12/28 323,187.50 2018/7/26 323,187.50 Joint liability
guarantee None None 2018/7/26-2023/7/26 No No
SF HOLDING INVESTMENT LIMITED 2019/1/4 600,000.00 2020/2/20 452,462.50 Joint liability
guarantee None None 2020/2/20-2030/2/20 No No
Total guarantee quota approved for subsidiaries during the reporting
period (B1) 3,803,180.00
Total actual amount of guarantees for
subsidiaries during the reporting period (B2) 0.00
Total guarantee quota approved for the subsidiaries at the end of the
reporting period (B3) 4,578,830.00
Total actual guarantee balance for subsidiaries
at the end of the reporting period (B4) 775,650.00
Subsidiary’s guarantees to subsidiaries
Guarantee party
Disclosure
date of Quota announcement
Amount of
guaranteed
Quota approved
Actual
date of
occurrence
Actual
guarantee
amount
Type of
guarantee
Collateral
(if any)
Counter-g
uarantee
(if any)
Period of guarantee Executed
?
Guarantee for a
related party?
Tianjin SF Fengtai E-commerce Industrial Park Co., Ltd. 2018/3/14 28,000.00 2018/10/19 1,000.00 Joint liability
guarantee
Tianjin SF Fengtai
project land None 2018/10/19-2021/4/20 Yes No

S.F. Holding Co., Ltd. 2021 Semi-Annual Report
91
Tianjin SF Fengtai E-commerce Industrial Park Co., Ltd. 2018/3/14 28,000.00 2018/10/19 3,877.00 Joint liability
guarantee
Tianjin SF
Fengtai
project land
None 2018/10/19-2033/10/19 No No
Tianjin SF Fengtai E-commerce Industrial Park Co., Ltd. 2018/3/14 28,000.00 2018/10/19 2,200.00 Joint liability
guarantee
Tianjin SF
Fengtai
project land
None 2018/11/9-2033/10/19 No No
Tianjin SF Fengtai E-commerce Industrial Park Co., Ltd. 2018/3/14 28,000.00 2018/10/19 1,100.00 Joint liability
guarantee
Tianjin SF
Fengtai
project land
None 2018/12/19-2033/10/19 No No
Tianjin SF Fengtai E-commerce Industrial Park Co., Ltd. 2018/3/14 28,000.00 2018/10/19 2,150.00 Joint liability
guarantee
Tianjin SF Fengtai
project land
None 2019/1/28-2033/10/19 No No
Shunyuan Financial Lease (Tianjin) Co., Ltd. 2019/3/16 70,000.00 2019/4/22 2,000.00 Joint liability
guarantee None None 2019/5/10-2021/4/20 Yes No
Shunyuan Financial Lease (Tianjin) Co., Ltd. 2019/3/16 70,000.00 2019/4/22 12,000.00 Joint liability
guarantee None None 2019/5/10-2024/1/24 No No
HAVI Logistics (Dongguan) Co., Ltd. 2019/3/16 6,400.00 2019/5/10 4,500.00 Joint liability
guarantee None None 2019/5/10-2021/4/18 Yes No
SF Holding Limited 2020/3/24 824,760.00 2020/5/25 8,325.75 Joint liability
guarantee None None 2020/5/25-2021/6/30 Yes No
Shenzhen Shuncheng Supply Chain Service Co., Ltd. 2019/3/16 1,000.00 2020/4/14 1,000.00 Joint liability
guarantee None None 2020/4/23-2021/4/23 Yes No
Shenzhen Shunlu Air Freight Forwarding Co., Ltd. 2019/3/16 1,000.00 2020/4/14 1,000.00 Joint liability
guarantee None None 2020/4/22-2021/4/22 Yes No
SF Holding Limited 2020/3/24 570,760.00 2020/11/6 16,651.50 Joint liability
guarantee None None 2020/11/6-2021/6/2 Yes No
SF Holding Limited 2020/3/24 570,760.00 2020/11/27 16,651.50 Joint liability
guarantee None None 2020/11/27-2021/6/2 Yes No
S.F. EXPRESS (HONG KONG) LIMITED 2018/3/14 1,500.00 2018/10/10 27.74 Joint liability
guarantee None None 2018/10/10-2021/7/30 No No
Shanghai Fengtaiyuanxing Property Management Service Co., Ltd. 2018/3/14 10,000.00 2018/9/1 4,578.29 Joint liability
guarantee None None 2018/9/1-2021/8/31 No No
SF Airlines Company Limited 2018/3/14 58,000.00 2018/12/25 2,500.00 Joint liability
guarantee None None 2019/2/7-2021/2/7 Yes No
S.F. EXPRESS (HONG KONG) LIMITED 2019/3/16 8,200.00 2019/4/26 12.61 Joint liability
guarantee None None 2019/4/26-2021/5/15 Yes No
S.F. EXPRESS (HONG KONG) LIMITED 2019/3/16 8,200.00 2019/5/23 83.26 Joint liability
guarantee None None 2019/5/23-2022/5/31 No No
S.F. EXPRESS (HONG KONG) LIMITED 2019/3/16 8,200.00 2019/5/23 140.37 Joint liability
guarantee None None 2019/5/23-2022/5/31 No No
Changchun Fengtai E-commerce Industrial Park Management Co.,
Ltd. 2019/3/16 600.00 2019/7/16 209.00
Joint liability
guarantee None None 2019/7/16-2021/7/23 No No

S.F. Holding Co., Ltd. 2021 Semi-Annual Report
92
S.F. EXPRESS (HONG KONG) LIMITED 2019/3/16 13,200.00 2019/7/4 24.59 Joint liability
guarantee None None 2019/7/4-2021/2/19 Yes No
SF Airlines Company Limited 2019/3/16 26,000.00 2019/8/23 5,000.00
Joint liability
guarantee None None 2019/8/23-2021/8/15 No No
SF Airlines Company Limited 2019/3/16 26,000.00 2019/8/22 3,000.00 Joint liability
guarantee None None 2019/8/22-2021/8/15 No No
Shenzhen SF Comprehensive Logistics Service Co., Ltd. 2019/3/16 2,500.00 2019/9/3 30.00 Joint liability
guarantee None None 2019/9/3-2021/1/31 Yes No
S.F. EXPRESS (HONG KONG) LIMITED 2019/3/16 13,200.00 2019/10/2 19.98 Joint liability
guarantee None None 2019/10/2-2022/7/14 No No
S.F. EXPRESS (HONG KONG) LIMITED 2019/3/16 13,200.00 2019/10/2 10.48 Joint liability
guarantee None None 2019/10/2-2021/8/25 No No
Weihai S.F. Express Co., Ltd. 2019/3/16 100.00 2019/11/15 1.00 Joint liability
guarantee None None 2019/11/15-2021/1/31 Yes No
Weihai S.F. Express Co., Ltd. 2019/3/16 100.00 2019/11/15 1.00 Joint liability
guarantee None None 2019/11/15-2021/1/31 Yes No
DSC Logistics (Beijing) Co., Ltdnote1 2019/3/16 5,100.00 2019/12/2 53.21 Joint liability
guarantee None None 2019/12/2-2021/2/28 Yes No
DSC Logistics (Beijing) Co., Ltd note1 2019/3/16 5,100.00 2019/12/27 0.31 Joint liability
guarantee None None 2019/12/27-2021/2/28 Yes No
S.F. EXPRESS (CHINA) LIMITED 2019/3/16 4,000.00 2019/12/30 8.33 Joint liability
guarantee None None 2019/12/30-2021/1/4 Yes No
Shenzhen Fengtai E-commerce Industrial Park Property Service Co., Ltd.
2019/3/16 3,700.00 2019/8/1 3,342.61 Joint liability
guarantee None None 2019/8/1-2022/7/31 No No
Yiwu Fengyutai Enterprise Management Co., Ltd. 2019/3/16 1,400.00 2019/8/1 1,239.44 Joint liability
guarantee None None 2019/8/1-2022/7/31 No No
Huai'an Fengtai Enterprise Management Co., Ltd. 2019/3/16 400.00 2019/8/1 315.54 Joint liability
guarantee None None 2019/8/1-2022/7/31 No No
Shenzhen S.F. Supply Chain Co., Ltd. 2019/3/16 11,900.00 2020/1/17 36.77 Joint liability
guarantee None None 2020/1/17-2021/1/20 Yes No
S.F. EXPRESS (CHINA) LIMITED 2019/3/16 4,000.00 2020/1/8 83.26 Joint liability
guarantee None None 2020/1/8-2021/1/14 Yes No
Shanghai Shunheng Logistics Co., Ltd. 2019/3/16 400.00 2020/1/19 58.44 Joint liability
guarantee None None 2020/1/19-2021/1/10 Yes No
Xinjiang SF Express Co.,LTD. 2019/3/16 100.00 2020/1/19 2.00 Joint liability
guarantee None None 2020/1/19-2021/1/17 Yes No
Jiangsu S.F. Express Co., Ltd. 2019/3/16 300.00 2020/1/20 67.36 Joint liability
guarantee None None 2020/1/20-2021/1/10 Yes No
Shenzhen Shuncheng Supply Chain Service Co., Ltd. 2019/3/16 2,000.00 2020/1/17 5.23 Joint liability
guarantee None None 2020/1/17-2021/2/28 Yes No
Shenzhen S.F. Supply Chain Co., Ltd. 2019/3/16 11,900.00 2020/1/10 120.13 Joint liability None None 2020/1/10-2021/2/28 Yes No

S.F. Holding Co., Ltd. 2021 Semi-Annual Report
93
guarantee
TIANJIN S.F. EXPRESS CO., LTD. 2019/3/16 800.00 2020/1/17 80.90 Joint liability
guarantee None None 2020/1/17-2021/12/31 No No
Wenzhou Shunheng Express Co., Ltd. 2019/3/16 200.00 2020/1/17 110.00 Joint liability
guarantee None None 2020/1/17-2021/1/10 Yes No
Guangxi ShunFeng Express Co.,Ltd. 2019/3/16 200.00 2020/2/19 100.00 Joint liability
guarantee None None 2020/2/19-2021/1/31 Yes No
Guizhou S.F. Express Co., Ltd. 2019/3/16 200.00 2020/2/19 12.74 Joint liability
guarantee None None 2020/2/19-2021/2/28 Yes No
SF Airlines Company Limited 2019/3/16 26,000.00 2020/2/24 2.00 Joint liability
guarantee None None 2020/2/24-2021/2/21 Yes No
SF Airlines Company Limited 2019/3/16 26,000.00 2020/2/24 22.03 Joint liability
guarantee None None 2020/2/24-2021/3/6 Yes No
Yantai S.F. Express Co., Ltd. 2019/3/16 200.00 2020/2/24 65.00 Joint liability
guarantee None None 2020/2/24-2021/1/31 Yes No
Zhanjiang S.F. Express Co., Ltd. 2019/3/16 50.00 2020/2/19 25.00 Joint liability
guarantee None None 2020/2/19-2021/8/5 No No
Chongqing Huiyifeng Logistics Co., Ltd. 2019/3/16 2,800.00 2020/2/14 1,500.00 Joint liability
guarantee None None 2020/2/14-2021/1/21 Yes No
SF Airlines Company Limited 2019/3/16 26,000.00 2020/3/3 16.64 Joint liability
guarantee None None 2020/3/3-2021/2/24 Yes No
Shenzhen S.F. Supply Chain Co., Ltd. 2019/3/16 11,900.00 2020/3/5 600.00 Joint liability
guarantee None None 2020/3/5-2021/2/28 Yes No
Shenzhen SF Comprehensive Logistics Service Co., Ltd. 2019/3/16 2,500.00 2020/3/5 100.00 Joint liability
guarantee None None 2020/3/5-2021/1/31 Yes No
Suzhou Industrial Park S.F. Express Co., Ltd. 2019/3/16 1,900.00 2020/3/5 50.00 Joint liability
guarantee None None 2020/3/5-2021/2/28 Yes No
Shenzhen Shunlu Logistics Co., Ltd. 2019/3/16 2,100.00 2020/3/16 100.00 Joint liability
guarantee None None 2020/3/16-2021/4/15 Yes No
Shenzhen Shunlu Logistics Co., Ltd. 2019/3/16 2,100.00 2020/3/16 80.00 Joint liability
guarantee None None 2020/3/16-2021/6/30 Yes No
S. F. Express (Shenyang) Co., Ltd 2019/3/16 600.00 2020/3/16 45.37 Joint liability
guarantee None None 2020/3/16-2021/3/9 Yes No
Beijing S.F. Express Co., LTD. 2019/3/16 1,500.00 2020/3/16 100.00 Joint liability
guarantee None None 2020/3/16-2021/4/20 Yes No
DHL LOGISTICS(CHINA) CO.,LTD. 2019/3/16 5,900.00 2020/3/19 20.00 Joint liability
guarantee None None 2020/3/19-2021/3/31 Yes No
S.F. Express Co., Ltd. 2019/3/16 25,000.00 2020/3/3 500.00 Joint liability
guarantee None None 2020/3/3-2021/3/1 Yes No
S.F. EXPRESS (CHINA) LIMITED 2019/3/16 4,000.00 2020/3/19 49.95 Joint liability
guarantee None None 2020/3/19-2021/3/31 Yes No

S.F. Holding Co., Ltd. 2021 Semi-Annual Report
94
Chengdu Shunyifeng Pharmaceutical Co., Ltd. 2019/3/16 100.00 2020/3/20 43.63 Joint liability
guarantee None None 2020/3/20-2021/3/12 Yes No
Zhejiang Shunlu Logistics Co.,Ltd. 2019/3/16 5,000.00 2020/3/30 350.00 Joint liability
guarantee None None 2020/3/30-2021/3/12 Yes No
Xi'an Shunlu Logistics Co., Ltd. 2019/3/16 1,300.00 2020/3/30 230.90 Joint liability
guarantee None None 2020/3/30-2021/3/27 Yes No
Sichuan S.F. Express Co., Ltd. 2019/3/16 500.00 2020/3/26 5.00 Joint liability
guarantee None None 2020/3/26-2021/1/31 Yes No
S.F. Express Co., Ltd. 2019/3/16 25,000.00 2020/3/23 3,000.00 Joint liability
guarantee None None 2020/3/23-2021/3/11 Yes No
S.F. Express (Huizhou) Co., Ltd. 2019/3/16 450.00 2020/3/23 19.57 Joint liability
guarantee None None 2020/3/23-2021/6/30 Yes No
SF Airlines Company Limited 2019/3/16 26,000.00 2020/3/23 57.77 Joint liability
guarantee None None 2020/3/23-2021/3/12 Yes No
Shenzhen Shuncheng Supply Chain Service Co., Ltd. 2019/3/16 2,000.00 2020/3/23 22.84 Joint liability
guarantee None None 2020/3/23-2021/2/28 Yes No
S.F. EXPRESS (HONG KONG) LIMITED 2019/3/16 13,200.00 2020/3/25 64.64 Joint liability
guarantee None None 2020/3/25-2021/5/26 Yes No
SF-Express(Ningxia)Co.,Ltd 2019/3/16 200.00 2020/3/31 100.00 Joint liability
guarantee None None 2020/3/31-2021/1/31 Yes No
EXEL LOGISTICS CHINA CO.,LTD. 2019/3/16 2,700.00 2020/4/3 173.39 Joint liability
guarantee None None 2020/4/3-2022/7/31 No No
EXEL LOGISTICS CHINA CO.,LTD. 2019/3/16 2,700.00 2020/4/3 328.86 Joint liability
guarantee None None 2020/4/3-2022/7/31 No No
EXEL LOGISTICS CHINA CO.,LTD. 2019/3/16 2,700.00 2020/4/3 500.00 Joint liability
guarantee None None 2020/4/3-2023/4/3 No No
XI`AN S.F EXPRESS CO.,LTD 2019/3/16 600.00 2020/4/10 56.87 Joint liability
guarantee None None 2020/4/10-2021/3/19 Yes No
Suzhou Industrial Park S.F. Express Co., Ltd. 2019/3/16 1,900.00 2020/4/15 28.39 Joint liability
guarantee None None 2020/4/15-2021/6/30 Yes No
DSC Logistics (Beijing) Co., Ltd note1 2020/3/24 2,000.00 2020/4/28 70.35 Joint liability
guarantee None None 2020/4/28-2022/9/30 No No
S.F. EXPRESS (AUSTRALIA) PTY LTD 2020/3/24 1,500.00 2020/4/21 19.49 Joint liability
guarantee None None 2020/4/21-2021/3/31 Yes No
Anhui S.F. Express Co., Ltd. 2020/3/24 1,200.00 2020/4/29 10.00 Joint liability
guarantee None None 2020/4/29-2021/4/21 Yes No
Chengdu Taishun Logistics Co.,Ltd. 2020/3/24 2,000.00 2020/4/28 100.00 Joint liability
guarantee None None 2020/4/28-2021/1/31 Yes No
FS ELECTRONIC TECHNOLOGY CO., LIMITED 2020/3/24 1,000.00 2020/4/16 288.57 Joint liability
guarantee None None 2020/4/16-2021/7/31 No No
Guizhou S.F. Express Co., Ltd. 2020/3/24 300.00 2020/4/29 64.96 Joint liability None None 2020/4/29-2021/4/21 Yes No

S.F. Holding Co., Ltd. 2021 Semi-Annual Report
95
guarantee
Hebei S.F. Express Co., Ltd. 2020/3/24 400.00 2020/4/16 12.68 Joint liability
guarantee None None 2020/4/16-2021/4/10 Yes No
Hubei S.F. Transportation Co., Ltd. 2020/3/24 700.00 2020/4/28 323.29 Joint liability
guarantee None None 2020/4/28-2021/4/15 Yes No
Jiangxi S.F. Express Co., Ltd. 2020/3/24 1,000.00 2020/4/16 223.43 Joint liability
guarantee None None 2020/4/16-2021/4/10 Yes No
NINGBO SHUNFENG EXPRESS CO.,LTD. 2020/3/24 3,000.00 2020/4/16 550.00 Joint liability
guarantee None None 2020/4/16-2021/5/7 Yes No
Shandong S.F. Express Co., Ltd. 2020/3/24 1,500.00 2020/4/16 30.00 Joint liability
guarantee None None 2020/4/16-2021/1/31 Yes No
Shandong S.F. Express Co., Ltd. 2020/3/24 1,500.00 2020/4/29 309.71 Joint liability
guarantee None None 2020/4/29-2021/4/21 Yes No
Shanghai Shunheng Logistics Co., Ltd. 2020/3/24 3,000.00 2020/4/26 107.41 Joint liability
guarantee None None 2020/4/26-2021/4/15 Yes No
Shenzhen SF Fix Technology Co., Ltd. 2020/3/24 10,000.00 2020/4/23 400.00 Joint liability
guarantee None None 2020/4/23-2021/1/31 Yes No
Shenzhen Fengyi Technology Co., Ltd. 2020/3/24 10,000.00 2020/4/29 500.00 Joint liability
guarantee None None 2020/4/29-2021/4/26 Yes No
Shenzhen S.F. Supply Chain Co., Ltd. 2020/3/24 10,000.00 2020/4/16 230.00 Joint liability
guarantee None None 2020/4/16-2021/4/30 Yes No
Shenzhen S.F. Supply Chain Co., Ltd. 2020/3/24 10,000.00 2020/4/29 500.00 Joint liability
guarantee None None 2020/4/29-2021/3/27 Yes No
Shenzhen S.F. Supply Chain Co., Ltd. 2020/3/24 10,000.00 2020/4/29 500.00 Joint liability
guarantee None None 2020/4/29-2021/5/5 Yes No
Shenzhen S.F. Supply Chain Co., Ltd. 2020/3/24 10,000.00 2020/4/23 60.00 Joint liability
guarantee None None 2020/4/23-2021/4/14 Yes No
SF Airlines Company Limited 2020/3/24 20,000.00 2020/4/16 2,000.00 Joint liability
guarantee None None 2020/4/16-2021/4/15 Yes No
S.F.Express(Dong Guan)Limited 2020/3/24 3,000.00 2020/4/29 15.03 Joint liability
guarantee None None 2020/4/29-2021/4/24 Yes No
S.F. Express Group (Shanghai) Co., Ltd. 2020/3/24 1,200.00 2020/4/28 100.00 Joint liability
guarantee None None 2020/4/28-2021/10/31 No No
SF Express ChongQing CO.LTD 2020/3/24 1,000.00 2020/4/26 169.01 Joint liability
guarantee None None 2020/4/26-2021/4/15 Yes No
SF Pharmaceutical Supply Chain Hubei Co., Ltd. 2020/3/24 100.00 2020/4/23 5.00 Joint liability
guarantee None None 2020/4/23-2021/3/31 Yes No
Sichuan S.F. Express Co., Ltd. 2020/3/24 500.00 2020/4/27 11.61 Joint liability
guarantee None None 2020/4/27-2021/4/21 Yes No
Suzhou Industrial Park S.F. Express Co., Ltd. 2020/3/24 1,500.00 2020/4/16 20.00 Joint liability
guarantee None None 2020/4/16-2021/4/7 Yes No

S.F. Holding Co., Ltd. 2021 Semi-Annual Report
96
Zhejiang Shunhefeng Freight Co., Ltd. 2020/3/24 700.00 2020/4/29 10.00 Joint liability
guarantee None None 2020/4/29-2021/4/21 Yes No
Zhejiang Shunlu Logistics Co.,Ltd. 2020/3/24 3,000.00 2020/4/28 749.32 Joint liability
guarantee None None 2020/4/28-2021/4/21 Yes No
S.F. Transportation (Changzhou) Co., Ltd. 2020/3/24 200.00 2020/4/30 74.85 Joint liability
guarantee None None 2020/4/30-2021/4/21 Yes No
Jiangsu Shunhefeng Freight Co., Ltd. 2020/3/24 1,200.00 2020/5/26 18.02 Joint liability
guarantee None None 2020/5/26-2021/4/30 Yes No
DHL LOGISTICS(CHINA) CO.,LTD. 2020/3/24 4,000.00 2020/5/19 1,086.87 Joint liability
guarantee None None 2020/5/19-2022/12/14 No No
Jiangsu Shunhefeng Freight Co., Ltd. 2020/3/24 1,200.00 2020/5/29 692.81 Joint liability
guarantee None None 2020/5/29-2021/4/30 Yes No
DSC Logistics (Beijing) Co., Ltd note1 2020/3/24 2,000.00 2020/5/18 58.86 Joint liability
guarantee None None 2020/5/18-2022/7/31 No No
DSC Logistics (Beijing) Co., Ltd note1 2020/3/24 2,000.00 2020/5/18 237.86 Joint liability
guarantee None None 2020/5/18-2022/7/31 No No
Shaanxi SF Freight Co., Ltd. 2020/3/24 400.00 2020/5/13 59.55 Joint liability
guarantee None None 2020/5/13-2021/7/31 No No
S.F. EXPRESS (CHINA) LIMITED 2020/3/24 2,000.00 2020/5/12 83.26 Joint liability
guarantee None None 2020/5/12-2021/5/21 Yes No
Shandong S.F. Express Co., Ltd. 2020/3/24 1,500.00 2020/5/28 31.58 Joint liability
guarantee None None 2020/5/28-2021/5/25 Yes No
Shandong S.F. Express Co., Ltd. 2020/3/24 1,500.00 2020/5/28 94.74 Joint liability
guarantee None None 2020/5/28-2021/5/15 Yes No
Chengdu Taishun Logistics Co.,Ltd. 2020/3/24 2,000.00 2020/5/19 900.00 Joint liability
guarantee None None 2020/5/19-2021/4/30 Yes No
Guizhou S.F. Express Co., Ltd. 2020/3/24 300.00 2020/5/19 12.28 Joint liability
guarantee None None 2020/5/19-2021/5/8 Yes No
Hebei S.F. Express Co., Ltd. 2020/3/24 400.00 2020/5/20 90.00 Joint liability
guarantee None None 2020/5/20-2021/3/31 Yes No
Jiangsu S.F. Express Co., Ltd. 2020/3/24 450.00 2020/5/20 60.35 Joint liability
guarantee None None 2020/5/20-2021/5/14 Yes No
Shenzhen SF Comprehensive Logistics Service Co., Ltd. 2020/3/24 5,500.00 2020/5/19 75.00 Joint liability
guarantee None None 2020/5/19-2021/3/31 Yes No
Shenzhen Shunlu Logistics Co., Ltd. 2020/3/24 2,000.00 2020/5/19 391.19 Joint liability
guarantee None None 2020/5/19-2021/1/31 Yes No
Liaoning Shunlu Logistics Co., Ltd. 2020/3/24 1,000.00 2020/5/28 191.30 Joint liability
guarantee None None 2020/5/28-2021/4/30 Yes No
Shenzhen Fengyi Technology Co., Ltd. 2020/3/24 10,000.00 2020/6/1 50.00 Joint liability
guarantee None None 2020/6/1-2021/4/15 Yes No
Hubei S.F. Express Co., Ltd. 2020/3/24 1,000.00 2020/6/1 24.93 Joint liability None None 2020/6/1-2021/4/30 Yes No

S.F. Holding Co., Ltd. 2021 Semi-Annual Report
97
guarantee
Shenzhen Fengyi Technology Co., Ltd. 2020/3/24 10,000.00 2020/6/10 1,825.00 Joint liability
guarantee None None 2020/6/10-2021/2/28 Yes No
EXEL LOGISTICS CHINA CO.,LTD. 2020/3/24 700.00 2020/6/10 169.71 Joint liability
guarantee None None 2020/6/10-2021/3/31 Yes No
DSC Logistics (Beijing) Co., Ltd note1 2020/3/24 2,000.00 2020/6/10 519.61 Joint liability
guarantee None None 2020/6/10-2021/12/31 No No
DSC Logistics (Beijing) Co., Ltd note1 2020/3/24 2,000.00 2020/6/10 116.56 Joint liability
guarantee None None 2020/6/10-2021/12/31 No No
DSC Logistics (Beijing) Co., Ltd note1 2020/3/24 2,000.00 2020/6/11 24.85 Joint liability
guarantee None None 2020/6/11-2022/7/31 No No
Anhui S.F. Express Co., Ltd. 2020/3/24 1,200.00 2020/6/29 180.00 Joint liability
guarantee None None 2020/6/29-2021/5/31 Yes No
Anhui S.F. Express Co., Ltd. 2020/3/24 1,200.00 2020/6/8 59.72 Joint liability
guarantee None None 2020/6/8-2021/5/31 Yes No
Anhui S.F. Express Co., Ltd. 2020/3/24 1,200.00 2020/6/29 99.37 Joint liability
guarantee None None 2020/6/29-2021/6/30 Yes No
Guizhou S.F. Express Co., Ltd. 2020/3/24 300.00 2020/6/1 11.38 Joint liability
guarantee None None 2020/6/1-2021/4/30 Yes No
HaiNan S.F.Express LTD. 2020/3/24 500.00 2020/6/29 35.00 Joint liability
guarantee None None 2020/6/29-2021/1/31 Yes No
Hangzhou SF Zhida Logistics Co., Ltd. 2020/3/24 550.00 2020/6/1 256.59 Joint liability
guarantee None None 2020/6/1-2021/5/19 Yes No
Hubei S.F. Express Co., Ltd. 2020/3/24 1,000.00 2020/6/29 24.93 Joint liability
guarantee None None 2020/6/29-2021/7/30 No No
Hubei S.F. Express Co., Ltd. 2020/3/24 1,000.00 2020/6/1 80.00 Joint liability
guarantee None None 2020/6/1-2021/5/31 Yes No
Jiangsu S.F. Express Co., Ltd. 2020/3/24 450.00 2020/6/17 3.00 Joint liability
guarantee None None 2020/6/17-2021/6/14 Yes No
Jiangsu S.F. Express Co., Ltd. 2020/3/24 450.00 2020/6/1 82.33 Joint liability
guarantee None None 2020/6/1-2021/5/31 Yes No
Jinhua S.F. Express Co., Ltd. 2020/3/24 200.00 2020/6/1 5.00 Joint liability
guarantee None None 2020/6/1-2021/4/30 Yes No
Liaoning Shunhe Supply Chain Management Co., Ltd. 2020/3/24 500.00 2020/6/1 7.00 Joint liability
guarantee None None 2020/6/1-2021/4/30 Yes No
Nantong S.F. Express Co., Ltd. 2020/3/24 100.00 2020/6/1 12.27 Joint liability
guarantee None None 2020/6/1-2021/5/18 Yes No
Shandong S.F. Express Co., Ltd. 2020/3/24 1,500.00 2020/6/1 150.00 Joint liability
guarantee None None 2020/6/1-2021/5/31 Yes No
Shandong S.F. Express Co., Ltd. 2020/3/24 1,500.00 2020/6/1 2.00 Joint liability
guarantee None None 2020/6/1-2021/5/14 Yes No

S.F. Holding Co., Ltd. 2021 Semi-Annual Report
98
Zhejiang Shuangjie Supply Chain Technology Co., Ltd. 2020/3/24 1,600.00 2020/6/10 30.40 Joint liability
guarantee None None 2020/6/10-2021/5/25 Yes No
Shanghai Shuncheng Logistics Co., Ltd. 2020/3/24 1,500.00 2020/6/12 400.00 Joint liability
guarantee None None 2020/6/12-2021/9/30 No No
Shenzhen Shuncheng Supply Chain Service Co., Ltd. 2020/3/24 200.00 2020/6/10 14.54 Joint liability
guarantee None None 2020/6/10-2021/5/31 Yes No
Shenzhen Shuncheng Supply Chain Service Co., Ltd. 2020/3/24 200.00 2020/6/30 23.00 Joint liability
guarantee None None 2020/6/30-2021/5/31 Yes No
SF Airlines Company Limited 2020/3/24 20,000.00 2020/6/24 1,200.00 Joint liability
guarantee None None 2020/6/24-2021/5/13 Yes No
SF Airlines Company Limited 2020/3/24 20,000.00 2020/6/8 9.43 Joint liability
guarantee None None 2020/6/8-2021/4/30 Yes No
SF Airlines Company Limited 2020/3/24 20,000.00 2020/6/22 96.96 Joint liability
guarantee None None 2020/6/22-2021/3/31 Yes No
S.F. Express Co., Ltd. 2020/3/24 17,300.00 2020/6/8 100.00 Joint liability
guarantee None None 2020/6/8-2021/4/30 Yes No
Sichuan Shunhefeng Freight Co., Ltd. 2020/3/24 300.00 2020/6/4 43.35 Joint liability
guarantee None None 2020/6/4-2021/5/31 Yes No
Wuxi S.F. Express Co., Ltd. 2020/3/24 500.00 2020/6/3 20.00 Joint liability
guarantee None None 2020/6/3-2021/5/23 Yes No
Xinjiang SF Express Co.,LTD. 2020/3/24 210.00 2020/6/29 104.78 Joint liability
guarantee None None 2020/6/29-2021/6/19 Yes No
Zhaoqing S.F. Express Co., Ltd. 2020/3/24 100.00 2020/6/10 16.20 Joint liability
guarantee None None 2020/6/10-2021/6/5 Yes No
Zhejiang Shuangjie Supply Chain Technology Co., Ltd. 2020/3/24 1,600.00 2020/6/11 21.65 Joint liability
guarantee None None 2020/6/11-2021/11/30 No No
Zhejiang Shunlu Logistics Co.,Ltd. 2020/3/24 3,000.00 2020/6/8 40.00 Joint liability
guarantee None None 2020/6/8-2021/5/28 Yes No
Anhui S.F. Express Co., Ltd. 2020/3/24 1,200.00 2020/6/24 5.00 Joint liability
guarantee None None 2020/6/24-2021/6/15 Yes No
Hubei S.F. Express Co., Ltd. 2020/3/24 1,000.00 2020/6/24 1.00 Joint liability
guarantee None None 2020/6/24-2021/6/19 Yes No
Shenzhen SF Freight Co., Ltd. 2020/3/24 2,000.00 2020/6/24 325.15 Joint liability
guarantee None None 2020/6/24-2021/6/11 Yes No
SF Airlines Company Limited 2020/3/24 20,000.00 2020/6/19 3.23 Joint liability
guarantee None None 2020/6/19-2021/6/20 Yes No
SF Airlines Company Limited 2020/3/24 20,000.00 2020/6/19 12.93 Joint liability
guarantee None None 2020/6/19-2021/6/28 Yes No
TIANJIN S.F. EXPRESS CO., LTD. 2020/3/24 700.00 2020/6/29 130.00 Joint liability
guarantee None None 2020/6/29-2021/7/29 No No
Tibet S.F. Express Co., Ltd. 2020/3/24 100.00 2020/6/24 5.00 Joint liability None None 2020/6/24-2021/3/31 Yes No

S.F. Holding Co., Ltd. 2021 Semi-Annual Report
99
guarantee
Zhejiang Shunlu Logistics Co.,Ltd. 2020/3/24 3,000.00 2020/6/24 100.00 Joint liability
guarantee None None 2020/6/24-2021/5/31 Yes No
Anhui Shunhe Freight Co., Ltd. 2020/3/24 350.00 2020/6/24 45.17 Joint liability
guarantee None None 2020/6/24-2021/6/9 Yes No
Liaoning Shunlu Logistics Co., Ltd. 2020/3/24 1,000.00 2020/6/24 172.09 Joint liability
guarantee None None 2020/6/24-2021/6/11 Yes No
S.F. EXPRESS (CHINA) LIMITED 2020/3/24 2,000.00 2020/6/18 41.63 Joint liability
guarantee None None 2020/6/18-2021/7/6 No No
Shenzhen Shuncheng Supply Chain Service Co., Ltd. 2020/3/24 1,400.00 2020/7/17 25.00 Joint liability
guarantee None None 2020/7/17-2021/7/3 No No
Hunan SF Freight Co., Ltd. 2020/3/24 200.00 2020/7/17 6.60 Joint liability
guarantee None None 2020/7/17-2021/5/14 Yes No
S.F. Express Corporation 2020/3/24 1,000.00 2020/7/22 129.28 Joint liability
guarantee None None 2020/7/22-2021/5/26 Yes No
Shanghai Shuncheng Logistics Co., Ltd. 2020/3/24 1,500.00 2020/7/14 380.00 Joint liability
guarantee None None 2020/7/14-2021/5/31 Yes No
Qinghai SF Juyi Supply Chain Management Co., Ltd. 2020/3/24 100.00 2020/7/14 18.28 Joint liability
guarantee None None 2020/7/14-2021/7/10 No No
Heilongjiang S.F. Express Co., Ltd. 2020/3/24 300.00 2020/7/14 117.21 Joint liability
guarantee None None 2020/7/14-2021/6/30 Yes No
Zhejiang Shunhefeng Freight Co., Ltd. 2020/3/24 700.00 2020/7/14 5.00 Joint liability
guarantee None None 2020/7/14-2021/6/30 Yes No
Suzhou Industrial Park S.F. Express Co., Ltd. 2020/3/24 2,500.00 2020/7/10 27.24 Joint liability
guarantee None None 2020/7/10-2021/3/31 Yes No
XI`AN S.F EXPRESS CO.,LTD 2020/3/24 500.00 2020/7/22 125.74 Joint liability
guarantee None None 2020/7/22-2021/7/6 No No
Xi'an Shunlu Logistics Co., Ltd. 2020/3/24 1,500.00 2020/7/10 9.42 Joint liability
guarantee None None 2020/7/10-2021/8/31 No No
Shanghai Shunheng Logistics Co., Ltd. 2020/3/24 5,000.00 2020/7/28 100.00 Joint liability
guarantee None None 2020/7/28-2021/9/30 No No
Beijing S.F. Express Co., LTD. 2020/3/24 3,000.00 2020/7/22 200.00 Joint liability
guarantee None None 2020/7/22-2021/4/29 Yes No
Shanghai Shunheng Logistics Co., Ltd. 2020/3/24 5,000.00 2020/7/22 46.39 Joint liability
guarantee None None 2020/7/22-2021/7/9 No No
Shenzhen Shuncheng Supply Chain Service Co., Ltd. 2020/3/24 1,400.00 2020/7/3 14.18 Joint liability
guarantee None None 2020/7/3-2021/6/1 Yes No
Shenzhen Shunlu Logistics Co., Ltd. 2020/3/24 2,000.00 2020/7/30 140.00 Joint liability
guarantee None None 2020/7/30-2021/8/31 No No
Shenzhen SF Comprehensive Logistics Service Co., Ltd. 2020/3/24 8,400.00 2020/7/14 300.00 Joint liability
guarantee None None 2020/7/14-2021/6/14 Yes No

S.F. Holding Co., Ltd. 2021 Semi-Annual Report
100
Shenzhen S.F. Supply Chain Co., Ltd. 2020/3/24 10,000.00 2020/7/2 500.00 Joint liability
guarantee None None 2020/7/2-2021/3/31 Yes No
SF Airlines Company Limited 2020/3/24 220,000.00 2020/7/23 23.27 Joint liability
guarantee None None 2020/7/23-2021/6/29 Yes No
Zhejiang Shuangjie Supply Chain Technology Co., Ltd. 2020/3/24 1,600.00 2020/7/30 47.26 Joint liability
guarantee None None 2020/7/30-2021/7/14 No No
SF Transportation (Nanjing) Co., Ltd. 2020/3/24 600.00 2020/7/29 100.00 Joint liability
guarantee None None 2020/7/29-2021/6/15 Yes No
Guang Zhou S.F. Express Co., Ltd. 2020/3/24 6,000.00 2020/7/27 1,200.00 Joint liability
guarantee None None 2020/7/27-2021/8/8 No No
Guang Zhou S.F. Express Co., Ltd. 2020/3/24 6,000.00 2020/7/27 1,500.00 Joint liability
guarantee None None 2020/7/27-2021/8/8 No No
Jiangsu S.F. Express Co., Ltd. 2020/3/24 750.00 2020/7/10 110.00 Joint liability
guarantee None None 2020/7/10-2021/6/11 Yes No
Jiangsu Shunhefeng Freight Co., Ltd. 2020/3/24 1,800.00 2020/7/30 73.13 Joint liability
guarantee None None 2020/7/30-2021/6/30 Yes No
Liaoning Shunhe Supply Chain Management Co., Ltd. 2020/3/24 500.00 2020/7/30 36.57 Joint liability
guarantee None None 2020/7/30-2021/7/15 No No
XIAMEN SHUNFENG EXPRESS CO.,LTD. 2020/3/24 500.00 2020/7/28 100.00 Joint liability
guarantee None None 2020/7/28-2021/7/31 No No
Shanghai SF Freight Co., Ltd. 2020/3/24 1,500.00 2020/7/27 418.25 Joint liability
guarantee None None 2020/7/27-2021/7/22 No No
Shenzhen S.F. Supply Chain Co., Ltd. 2020/3/24 10,000.00 2020/7/28 106.53 Joint liability
guarantee None None 2020/7/28-2021/7/20 No No
Shenzhen SF Freight Co., Ltd. 2020/3/24 2,000.00 2020/7/28 432.81 Joint liability
guarantee None None 2020/7/28-2021/7/31 No No
Sichuan S.F. Express Co., Ltd. 2020/3/24 1,000.00 2020/7/30 13.08 Joint liability
guarantee None None 2020/7/30-2021/7/20 No No
Yangzhou Shunfeng Express Transport Co., Ltd. 2020/3/24 300.00 2020/7/27 90.93 Joint liability
guarantee None None 2020/7/27-2021/7/22 No No
Zhejiang Shuangjie Supply Chain Technology Co., Ltd. 2020/3/24 1,600.00 2020/7/30 28.15 Joint liability
guarantee None None 2020/7/30-2021/7/14 No No
Zhejiang Shuangjie Supply Chain Technology Co., Ltd. 2020/3/24 1,600.00 2020/7/14 39.51 Joint liability
guarantee None None 2020/7/14-2021/7/6 No No
Shanghai SF Freight Co., Ltd. 2020/3/24 1,500.00 2020/8/3 418.25 Joint liability
guarantee None None 2020/8/3-2021/7/9 No No
Guang Zhou S.F. Express Co., Ltd. 2020/3/24 6,000.00 2020/8/6 1,200.00 Joint liability
guarantee None None 2020/8/6-2021/8/8 No No
Shenzhen Shuncheng Supply Chain Service Co., Ltd. 2020/3/24 1,400.00 2020/8/5 29.11 Joint liability
guarantee None None 2020/8/5-2021/7/20 No No
Jiangxi S.F. Express Co., Ltd. 2020/3/24 1,000.00 2020/8/5 113.03 Joint liability None None 2020/8/5-2021/7/14 No No

S.F. Holding Co., Ltd. 2021 Semi-Annual Report
101
guarantee
Fengrongliantong Technology (Shenzhen) Co., Ltd. 2020/3/24 15,000.00 2020/8/7 2,500.00 Joint liability
guarantee None None 2020/8/7-2021/8/4 No No
Jiangsu S.F. Express Co., Ltd. 2020/3/24 750.00 2020/8/7 110.00 Joint liability
guarantee None None 2020/8/7-2021/7/31 No No
Shandong SF Freight Co., Ltd. 2020/3/24 1,000.00 2020/8/12 75.00 Joint liability
guarantee None None 2020/8/12-2021/7/31 No No
Yunnan Shunhe Freight Co., Ltd. 2020/3/24 250.00 2020/8/12 93.97 Joint liability
guarantee None None 2020/8/12-2021/7/29 No No
Guangxi SF Freight Co., Ltd. 2020/3/24 250.00 2020/8/14 30.00 Joint liability
guarantee None None 2020/8/14-2021/8/5 No No
Shenzhen SF Comprehensive Logistics Service Co., Ltd. 2020/3/24 8,400.00 2020/8/12 10.00 Joint liability
guarantee None None 2020/8/12-2021/7/31 No No
Shanghai Shunheng Logistics Co., Ltd. 2020/3/24 5,000.00 2020/8/14 350.00 Joint liability
guarantee None None 2020/8/14-2021/1/31 Yes No
Fujian Shunhe Supply Chain Management Co., Ltd. 2020/3/24 400.00 2020/8/18 26.36 Joint liability
guarantee None None 2020/8/18-2021/7/20 No No
Fujian Shunhe Supply Chain Management Co., Ltd. 2020/3/24 400.00 2020/8/18 75.88 Joint liability
guarantee None None 2020/8/18-2021/7/20 No No
SF Airlines Company Limited 2020/3/24 220,000.00 2020/8/4 8.78 Joint liability
guarantee None None 2020/8/4-2021/6/30 Yes No
Hunan,S.F.Express(Group)Co.,Ltd. 2020/3/24 1,500.00 2020/8/12 12.00 Joint liability
guarantee None None 2020/8/12-2021/5/31 Yes No
S.F. Express Corporation 2020/3/24 1,000.00 2020/8/19 170.26 Joint liability
guarantee None None 2020/8/19-2021/8/3 No No
SF Express (Europe) Co.Ltd 2020/3/24 3,900.00 2020/8/7 3,290.91 Joint liability
guarantee None None 2020/8/7-2025/7/16 No No
Beijing Shuncheng Logistics Co., Ltd. 2020/3/24 8,000.00 2020/8/20 300.00 Joint liability
guarantee None None 2020/8/20-2021/5/31 Yes No
Hebei S.F. Express Co., Ltd. 2020/3/24 400.00 2020/8/12 30.00 Joint liability
guarantee None None 2020/8/12-2021/7/31 No No
Jiangsu Huihai Logistics Co.,Ltd. 2020/3/24 100.00 2020/8/19 20.00 Joint liability
guarantee None None 2020/8/19-2021/10/14 No No
Jiangsu S.F. Express Co., Ltd. 2020/3/24 750.00 2020/8/21 5.70 Joint liability
guarantee None None 2020/8/21-2021/8/13 No No
Lanzhou S.F. Express Co., Ltd. 2020/3/24 100.00 2020/8/20 15.00 Joint liability
guarantee None None 2020/8/20-2021/6/30 Yes No
NINGBO SHUNFENG EXPRESS CO.,LTD. 2020/3/24 3,000.00 2020/8/20 9.46 Joint liability
guarantee None None 2020/8/20-2021/7/30 No No
QUANZHOU SHUNFENG TRANSPORTATION COMPANY
LIMITED 2020/3/24 850.00 2020/8/12 500.00
Joint liability
guarantee None None 2020/8/12-2021/7/30 No No

S.F. Holding Co., Ltd. 2021 Semi-Annual Report
102
Quanzhou Shunlu Logistics Co., Ltd. 2020/3/24 1,300.00 2020/8/21 105.55 Joint liability
guarantee None None 2020/8/21-2021/8/5 No No
XIAMEN SHUNFENG EXPRESS CO.,LTD. 2020/3/24 500.00 2020/8/12 150.00 Joint liability
guarantee None None 2020/8/12-2021/7/31 No No
SF Airlines Company Limited 2020/3/24 220,000.00 2020/8/26 195.54 Joint liability
guarantee None None 2020/8/26-2021/8/31 No No
Tibet S.F. Express Co., Ltd. 2020/3/24 100.00 2020/8/21 10.00 Joint liability
guarantee None None 2020/8/21-2021/5/30 Yes No
EXEL LOGISTICS CHINA CO.,LTD. 2020/3/24 1,000.00 2020/8/31 53.41 Joint liability
guarantee None None 2020/8/31-2022/12/31 No No
Yunnan S.F. Express Co., Ltd. 2020/3/24 500.00 2020/8/20 221.86 Joint liability
guarantee None None 2020/8/20-2021/7/31 No No
Zhejiang Shuangjie Supply Chain Technology Co., Ltd. 2020/3/24 1,600.00 2020/8/14 80.00 Joint liability
guarantee None None 2020/8/14-2021/7/30 No No
Zhejiang Shunlu Logistics Co.,Ltd. 2020/3/24 33,000.00 2020/8/21 10.00 Joint liability
guarantee None None 2020/8/21-2021/4/30 Yes No
Shenzhen Fenglang Supply Chain Co., Ltd. 2020/3/24 5,100.00 2020/8/19 236.70 Joint liability
guarantee None None 2020/8/19-2021/2/13 Yes No
Zhejiang Shuangjie Supply Chain Technology Co., Ltd. 2020/3/24 1,600.00 2020/9/3 50.49 Joint liability
guarantee None None 2020/9/3-2021/8/12 No No
S.F. EXPRESS (HONG KONG) LIMITED 2020/3/24 10,000.00 2020/9/1 41.94 Joint liability
guarantee None None 2020/9/1-2022/9/30 No No
Jiangsu Shunhefeng Freight Co., Ltd. 2020/3/24 1,800.00 2020/9/3 6.58 Joint liability
guarantee None None 2020/9/3-2021/10/31 No No
Hubei Shunhefeng Freight Co., Ltd. 2020/3/24 200.00 2020/9/3 3.00 Joint liability
guarantee None None 2020/9/3-2021/8/25 No No
Shanghai FONPAI Supply Chain Co., Ltd. 2020/3/24 100.00 2020/9/3 3.00 Joint liability
guarantee None None 2020/9/3-2021/8/13 No No
Anhui Shunhe Freight Co., Ltd. 2020/3/24 350.00 2020/9/11 115.10 Joint liability
guarantee None None 2020/9/11-2021/8/14 No No
Shenzhen SF Comprehensive Logistics Service Co., Ltd. 2020/3/24 8,400.00 2020/9/11 10.00 Joint liability
guarantee None None 2020/9/11-2021/9/3 No No
Tianjin SF Zhida Logistics Co., Ltd. 2020/3/24 200.00 2020/9/11 20.00 Joint liability
guarantee None None 2020/9/11-2021/7/14 No No
Shenzhen S.F. Intra-city Logistics Co., Ltd. 2020/3/24 500.00 2020/9/11 15.00 Joint liability
guarantee None None 2020/9/11-2021/4/30 Yes No
Shenzhen S.F. Intra-city Logistics Co., Ltd. 2020/3/24 500.00 2020/9/11 15.00 Joint liability
guarantee None None 2020/9/11-2021/4/30 Yes No
SF Supply Chain (Hong Kong) Limited 2020/3/24 2,100.00 2020/9/29 853.11 Joint liability
guarantee None None 2020/9/29-2024/1/29 No No
S.F. EXPRESS (CHINA) LIMITED 2020/3/24 2,300.00 2020/9/22 24.98 Joint liability None None 2020/9/22-2021/9/30 No No

S.F. Holding Co., Ltd. 2021 Semi-Annual Report
103
guarantee
Anhui S.F. Express Co., Ltd. 2020/3/24 1,200.00 2020/9/28 3.00 Joint liability
guarantee None None 2020/9/28-2021/9/22 No No
Anhui Shunhe Freight Co., Ltd. 2020/3/24 350.00 2020/9/29 1.04 Joint liability
guarantee None None 2020/9/29-2021/9/29 No No
Beijing Shuncheng Logistics Co., Ltd. 2020/3/24 8,000.00 2020/9/17 500.00 Joint liability
guarantee None None 2020/9/17-2021/6/30 Yes No
Beijing Shuncheng Logistics Co., Ltd. 2020/3/24 8,000.00 2020/9/17 1,300.00 Joint liability
guarantee None None 2020/9/17-2021/6/30 Yes No
Beijing Shuncheng Logistics Co., Ltd. 2020/3/24 8,000.00 2020/9/28 570.56 Joint liability
guarantee None None 2020/9/28-2021/9/30 No No
Beijing S.F. Express Co., LTD. 2020/3/24 3,000.00 2020/9/30 464.88 Joint liability
guarantee None None 2020/9/30-2021/9/22 No No
Dongguan DHL Supply Chain Co., Ltd. 2020/3/24 3,300.00 2020/9/25 148.63 Joint liability
guarantee None None 2020/9/25-2021/9/29 No No
Foshan S.F. Express Co., Ltd. 2020/3/24 900.00 2020/9/17 528.87 Joint liability
guarantee None None 2020/9/17-2021/8/31 No No
Guizhou SF Zhida Freight Co., Ltd. 2020/3/24 300.00 2020/9/27 98.61 Joint liability
guarantee None None 2020/9/27-2021/9/14 No No
Hangzhou SF Zhida Logistics Co., Ltd. 2020/3/24 1,350.00 2020/9/29 256.59 Joint liability
guarantee None None 2020/9/29-2021/5/19 Yes No
Hangzhou Zhentai Asset Management Co., Ltd. 2020/3/24 3,500.00 2020/9/3 226.60 Joint liability
guarantee None None 2020/9/3-2021/8/31 No No
Hangzhou Zhentai Asset Management Co., Ltd. 2020/3/24 3,500.00 2020/9/3 290.10 Joint liability
guarantee None None 2020/9/3-2021/8/31 No No
Hangzhou Zhentai Asset Management Co., Ltd. 2020/3/24 3,500.00 2020/9/3 183.20 Joint liability
guarantee None None 2020/9/3-2021/8/31 No No
Hangzhou Zhentai Asset Management Co., Ltd. 2020/3/24 3,500.00 2020/9/3 183.20 Joint liability
guarantee None None 2020/9/3-2021/8/31 No No
Hubei S.F. Express Co., Ltd. 2020/3/24 1,000.00 2020/9/18 16.07 Joint liability
guarantee None None 2020/9/18-2021/8/25 No No
Jiangsu S.F. Express Co., Ltd. 2020/3/24 750.00 2020/9/30 108.16 Joint liability
guarantee None None 2020/9/30-2021/3/31 Yes No
Jiangsu S.F. Express Co., Ltd. 2020/3/24 750.00 2020/9/17 5.00 Joint liability
guarantee None None 2020/9/17-2021/9/14 No No
Jiangsu S.F. Express Co., Ltd. 2020/3/24 750.00 2020/9/2 8.00 Joint liability
guarantee None None 2020/9/2-2021/8/13 No No
Jiangsu Shunhefeng Freight Co., Ltd. 2020/3/24 1,800.00 2020/9/27 30.00 Joint liability
guarantee None None 2020/9/27-2021/9/15 No No
Sichuan S.F. Express Co., Ltd. 2020/3/24 1,000.00 2020/7/28 22.20 Joint liability
guarantee None None 2020/7/28-2021/7/17 No No

S.F. Holding Co., Ltd. 2021 Semi-Annual Report
104
Jiangsu Shunhefeng Freight Co., Ltd. 2020/3/24 1,800.00 2020/9/27 27.66 Joint liability
guarantee None None 2020/9/27-2021/9/18 No No
Jiangxi S.F. Express Co., Ltd. 2020/3/24 1,000.00 2020/9/18 15.00 Joint liability
guarantee None None 2020/9/18-2021/9/14 No No
DHL LOGISTICS(CHINA) CO.,LTD. 2020/3/24 4,000.00 2020/9/28 39.41 Joint liability
guarantee None None 2020/9/28-2021/8/31 No No
Lanzhou S.F. Express Co., Ltd. 2020/3/24 100.00 2020/9/30 30.00 Joint liability
guarantee None None 2020/9/30-2021/9/21 No No
Shanghai Shunheng Logistics Co., Ltd. 2020/3/24 5,000.00 2020/9/30 139.35 Joint liability
guarantee None None 2020/9/30-2021/5/14 Yes No
Nantong S.F. Express Co., Ltd. 2020/3/24 200.00 2020/9/30 74.27 Joint liability
guarantee None None 2020/9/30-2021/1/9 Yes No
S.F. Express Group (Shanghai) Co., Ltd. 2020/3/24 2,100.00 2020/9/29 200.00 Joint liability
guarantee None None 2020/9/29-2021/10/31 No No
Suzhou Industrial Park S.F. Express Co., Ltd. 2020/3/24 2,500.00 2020/9/4 300.00 Joint liability
guarantee None None 2020/9/4-2021/8/31 No No
Qinghai Shunfeng Express Co., Ltd. 2020/3/24 200.00 2020/9/8 34.65 Joint liability
guarantee None None 2020/9/8-2021/8/19 No No
Shandong SF Freight Co., Ltd. 2020/3/24 1,000.00 2020/9/27 101.91 Joint liability
guarantee None None 2020/9/27-2021/11/30 No No
Shanghai Solution Plus Supply Chain Co., Ltd. 2020/3/24 1,000.00 2020/9/29 140.63 Joint liability
guarantee None None 2020/9/29-2021/7/24 No No
Shanghai Shunheng Logistics Co., Ltd. 2020/3/24 5,000.00 2020/9/18 10.00 Joint liability
guarantee None None 2020/9/18-2021/6/30 Yes No
Shenzhen Fengnong Technology Co., Ltd. 2020/3/24 310.00 2020/9/28 7.05 Joint liability
guarantee None None 2020/9/28-2021/7/31 No No
Shenzhen Shuncheng Supply Chain Service Co., Ltd. 2020/3/24 1,400.00 2020/9/27 36.56 Joint liability
guarantee None None 2020/9/27-2021/9/18 No No
Shenzhen SF Comprehensive Logistics Service Co., Ltd. 2020/3/24 8,400.00 2020/9/22 17.00 Joint liability
guarantee None None 2020/9/22-2021/12/31 No No
S.F. Express (Huizhou) Co., Ltd. 2020/3/24 700.00 2020/9/17 378.94 Joint liability
guarantee None None 2020/9/17-2021/8/31 No No
S.F.EXPRESS (TIANJIN) CO., LTD. 2020/3/24 300.00 2020/9/27 52.91 Joint liability
guarantee None None 2020/9/27-2021/2/26 Yes No
S.F. Express Group (Shanghai) Co., Ltd. 2020/3/24 2,100.00 2020/9/7 790.00 Joint liability
guarantee None None 2020/9/7-2022/2/28 No No
S.F. Express Co., Ltd. 2020/3/24 17,300.00 2020/9/27 30.00 Joint liability
guarantee None None 2020/9/27-2021/10/15 No No
SF Express ChongQing CO.LTD 2020/3/24 1,000.00 2020/9/17 262.66 Joint liability
guarantee None None 2020/9/17-2021/12/31 No No
Sichuan S.F. Express Co., Ltd. 2020/3/24 1,000.00 2020/9/25 5.00 Joint liability None None 2020/9/25-2021/7/31 No No

S.F. Holding Co., Ltd. 2021 Semi-Annual Report
105
guarantee
Suzhou Industrial Park S.F. Express Co., Ltd. 2020/3/24 2,500.00 2020/9/8 3.00 Joint liability
guarantee None None 2020/9/8-2021/7/31 No No
Suzhou Industrial Park S.F. Express Co., Ltd. 2020/3/24 2,500.00 2020/9/8 77.87 Joint liability
guarantee None None 2020/9/8-2021/3/31 Yes No
Suzhou Industrial Park S.F. Express Co., Ltd. 2020/3/24 2,500.00 2020/9/25 91.46 Joint liability
guarantee None None 2020/9/25-2021/6/30 Yes No
Zhejiang Shuangjie Supply Chain Technology Co., Ltd. 2020/3/24 1,600.00 2020/9/28 87.38 Joint liability
guarantee None None 2020/9/28-2021/6/30 Yes No
Zhejiang Shuangjie Supply Chain Technology Co., Ltd. 2020/3/24 1,600.00 2020/9/27 10.97 Joint liability
guarantee None None 2020/9/27-2021/9/16 No No
Zhejiang Shuangjie Supply Chain Technology Co., Ltd. 2020/3/24 1,600.00 2020/9/27 2.00 Joint liability
guarantee None None 2020/9/27-2021/9/16 No No
Zhejiang Shuangjie Supply Chain Technology Co., Ltd. 2020/3/24 1,600.00 2020/9/27 60.00 Joint liability
guarantee None None 2020/9/27-2021/9/21 No No
Zhejiang Shunhefeng Freight Co., Ltd. 2020/3/24 700.00 2020/9/29 5.00 Joint liability
guarantee None None 2020/9/29-2021/9/3 No No
Beijing Shuncheng Logistics Co., Ltd. 2020/3/24 8,000.00 2020/9/3 100.00 Joint liability
guarantee None None 2020/9/3-2021/5/31 Yes No
HaiNan S.F.Express LTD. 2020/3/24 700.00 2020/9/2 177.28 Joint liability
guarantee None None 2020/9/2-2021/8/31 No No
Hubei S.F. Express Co., Ltd. 2020/3/24 1,000.00 2020/9/2 80.00 Joint liability
guarantee None None 2020/9/2-2021/8/13 No No
Hubei S.F. Express Co., Ltd. 2020/3/24 1,000.00 2020/9/3 1.80 Joint liability
guarantee None None 2020/9/3-2021/4/30 Yes No
Quanzhou Shunlu Logistics Co., Ltd. 2020/3/24 1,300.00 2020/9/3 15.00 Joint liability
guarantee None None 2020/9/3-2021/7/31 No No
Shenzhen SF Comprehensive Logistics Service Co., Ltd. 2020/3/24 8,400.00 2020/9/3 100.00 Joint liability
guarantee None None 2020/9/3-2021/9/5 No No
Suzhou Industrial Park S.F. Express Co., Ltd. 2020/3/24 2,500.00 2020/9/3 205.17 Joint liability
guarantee None None 2020/9/3-2021/9/23 No No
Zhejiang Shun Feng Express Co., Ltd. 2020/3/24 2,000.00 2020/9/2 600.00 Joint liability
guarantee None None 2020/9/2-2021/6/30 Yes No
Shenzhen Fengyi Technology Co., Ltd. 2020/3/24 10,000.00 2020/10/15 350.00 Joint liability
guarantee None None 2020/10/15-2021/10/15 No No
Chongqing SF Zhida Supply Chain Management Co., Ltd. 2020/3/24 650.00 2020/10/16 148.36 Joint liability
guarantee None None 2020/10/16-2021/9/30 No No
Shenzhen Fengyi Technology Co., Ltd. 2020/3/24 10,000.00 2020/10/21 10.00 Joint liability
guarantee None None 2020/10/21-2021/10/10 No No
Shenzhen Fengnong Technology Co., Ltd. 2020/3/24 310.00 2020/10/19 17.94 Joint liability
guarantee None None 2020/10/19-2021/7/31 No No

S.F. Holding Co., Ltd. 2021 Semi-Annual Report
106
Shenzhen Fengyi Technology Co., Ltd. 2020/3/24 10,000.00 2020/10/20 500.00 Joint liability
guarantee None None 2020/10/20-2021/10/10 No No
Sichuan Shunhefeng Freight Co., Ltd. 2020/3/24 300.00 2020/10/22 14.78 Joint liability
guarantee None None 2020/10/22-2021/10/15 No No
Sichuan Shunhefeng Freight Co., Ltd. 2020/3/24 300.00 2020/10/22 15.10 Joint liability
guarantee None None 2020/10/22-2021/10/15 No No
Zhejiang Shuangjie Supply Chain Technology Co., Ltd. 2020/3/24 1,600.00 2020/10/22 224.64 Joint liability
guarantee None None 2020/10/22-2021/9/30 No No
Anhui S.F. Express Co., Ltd. 2020/3/24 1,200.00 2020/10/12 5.00 Joint liability
guarantee None None 2020/10/12-2021/8/31 No No
Beijing Shuncheng Logistics Co., Ltd. 2020/3/24 8,000.00 2020/10/28 563.53 Joint liability
guarantee None None 2020/10/28-2021/10/26 No No
Guangxi ShunFeng Express Co.,Ltd. 2020/3/24 700.00 2020/10/29 50.00 Joint liability
guarantee None None 2020/10/29-2021/10/15 No No
Hebei S.F. Express Co., Ltd. 2020/3/24 400.00 2020/10/21 2.00 Joint liability
guarantee None None 2020/10/21-2021/10/10 No No
HENAN S.F.EXPRESS CO.,LTD 2020/3/24 600.00 2020/10/22 333.56 Joint liability
guarantee None None 2020/10/22-2021/10/15 No No
Hunan,S.F.Express(Group)Co.,Ltd. 2020/3/24 1,500.00 2020/10/13 400.00 Joint liability
guarantee None None 2020/10/13-2021/7/31 No No
Hunan,S.F.Express(Group)Co.,Ltd. 2020/3/24 1,500.00 2020/10/13 200.00 Joint liability
guarantee None None 2020/10/13-2021/7/31 No No
Jiangsu S.F. Express Co., Ltd. 2020/3/24 750.00 2020/10/13 5.00 Joint liability
guarantee None None 2020/10/13-2021/9/24 No No
Jiangsu S.F. Express Co., Ltd. 2020/3/24 750.00 2020/10/29 6.00 Joint liability
guarantee None None 2020/10/29-2021/10/15 No No
DHL LOGISTICS(CHINA) CO.,LTD. 2020/3/24 4,000.00 2020/10/28 78.38 Joint liability
guarantee None None 2020/10/28-2021/10/23 No No
Shanghai Shunheng Logistics Co., Ltd. 2020/3/24 5,000.00 2020/10/29 15.15 Joint liability
guarantee None None 2020/10/29-2022/1/31 No No
Shenzhen Shuncheng Supply Chain Service Co., Ltd. 2020/3/24 1,400.00 2020/10/28 7.74 Joint liability
guarantee None None 2020/10/28-2021/8/15 No No
Shenzhen Shuncheng Supply Chain Service Co., Ltd. 2020/3/24 1,400.00 2020/10/10 20.45 Joint liability
guarantee None None 2020/10/10-2021/9/9 No No
SF Airlines Company Limited 2020/3/24 220,000.00 2020/10/29 20.30 Joint liability
guarantee None None 2020/10/29-2021/10/22 No No
S.F. Express Co., Ltd. 2020/3/24 17,300.00 2020/10/29 4.00 Joint liability
guarantee None None 2020/10/29-2021/6/21 Yes No
S.F. Express Co., Ltd. 2020/3/24 17,300.00 2020/10/29 200.00 Joint liability
guarantee None None 2020/10/29-2021/6/21 Yes No
Sichuan Shunhefeng Freight Co., Ltd. 2020/3/24 300.00 2020/10/30 18.96 Joint liability None None 2020/10/30-2021/12/31 No No

S.F. Holding Co., Ltd. 2021 Semi-Annual Report
107
guarantee
Sichuan S.F. Express Co., Ltd. 2020/3/24 1,000.00 2020/10/22 32.00 Joint liability
guarantee None None 2020/10/22-2021/4/9 Yes No
Sichuan S.F. Express Co., Ltd. 2020/3/24 1,000.00 2020/10/22 49.65 Joint liability
guarantee None None 2020/10/22-2021/10/16 No No
Xuzhou S.F. Express Co., Ltd. 2020/3/24 400.00 2020/10/13 195.67 Joint liability
guarantee None None 2020/10/13-2021/9/30 No No
ZHONGSHAN S.F. EXPRESS CO. LTD 2020/3/24 600.00 2020/10/23 21.06 Joint liability
guarantee None None 2020/10/23-2021/5/14 Yes No
Guangxi ShunFeng Express Co.,Ltd. 2020/3/24 700.00 2020/11/4 50.00 Joint liability
guarantee None None 2020/11/4-2021/11/30 No No
Anhui Shunhe Freight Co., Ltd. 2020/3/24 350.00 2020/11/10 12.47 Joint liability
guarantee None None 2020/11/10-2021/10/27 No No
DSC Logistics (Beijing) Co., Ltd note1 2020/3/24 2,000.00 2020/11/6 28.11 Joint liability
guarantee None None 2020/11/6-2023/10/31 No No
DSC Logistics (Beijing) Co., Ltd note1 2020/3/24 2,000.00 2020/11/5 135.75 Joint liability
guarantee None None 2020/11/5-2023/10/31 No No
EXEL LOGISTICS CHINA CO.,LTD. 2020/3/24 1,000.00 2020/11/20 153.35 Joint liability
guarantee None None 2020/11/20-2021/3/31 Yes No
Hubei Shunhefeng Freight Co., Ltd. 2020/3/24 200.00 2020/11/10 5.67 Joint liability
guarantee None None 2020/11/10-2021/10/9 No No
Hunan SF Freight Co., Ltd. 2020/3/24 200.00 2020/11/19 9.73 Joint liability
guarantee None None 2020/11/19-2021/10/31 No No
Jiangsu Shunhefeng Freight Co., Ltd. 2020/3/24 1,800.00 2020/11/10 2.46 Joint liability
guarantee None None 2020/11/10-2021/10/31 No No
Liaoning Shunhe Supply Chain Management Co., Ltd. 2020/3/24 500.00 2020/11/10 2.00 Joint liability
guarantee None None 2020/11/10-2021/10/31 No No
Liaoning Shunhe Supply Chain Management Co., Ltd. 2020/3/24 500.00 2020/11/9 6.72 Joint liability
guarantee None None 2020/11/9-2021/10/30 No No
Qingdao SF Freight Co., Ltd. 2020/3/24 150.00 2020/11/17 54.07 Joint liability
guarantee None None 2020/11/17-2021/10/31 No No
Shandong SF Freight Co., Ltd. 2020/3/24 1,000.00 2020/11/9 101.91 Joint liability
guarantee None None 2020/11/9-2022/5/31 No No
Shaanxi SF Freight Co., Ltd. 2020/3/24 400.00 2020/11/17 21.09 Joint liability
guarantee None None 2020/11/17-2021/6/30 Yes No
Shenzhen SF Fix Technology Co., Ltd. 2020/3/24 10,000.00 2020/11/2 40.00 Joint liability
guarantee None None 2020/11/2-2021/5/30 Yes No
Shenzhen SF Fix Technology Co., Ltd. 2020/3/24 10,000.00 2020/11/2 200.00 Joint liability
guarantee None None 2020/11/2-2021/5/31 Yes No
Shenzhen Fengyi Technology Co., Ltd. 2020/3/24 10,000.00 2020/11/11 183.68 Joint liability
guarantee None None 2020/11/11-2021/10/17 No No

S.F. Holding Co., Ltd. 2021 Semi-Annual Report
108
Shenzhen Fengyi Technology Co., Ltd. 2020/3/24 10,000.00 2020/11/11 400.00 Joint liability
guarantee None None 2020/11/11-2021/11/30 No No
Shenzhen SF Comprehensive Logistics Service Co., Ltd. 2020/3/24 8,400.00 2020/11/6 410.40 Joint liability
guarantee None None 2020/11/6-2021/3/27 Yes No
Shenzhen SF Comprehensive Logistics Service Co., Ltd. 2020/3/24 8,400.00 2020/11/9 50.00 Joint liability
guarantee None None 2020/11/9-2021/5/31 Yes No
Shenzhen SF Comprehensive Logistics Service Co., Ltd. 2020/3/24 8,400.00 2020/11/2 100.00 Joint liability
guarantee None None 2020/11/2-2021/8/31 No No
Shenzhen SF Comprehensive Logistics Service Co., Ltd. 2020/3/24 8,400.00 2020/11/9 120.00 Joint liability
guarantee None None 2020/11/9-2021/8/31 No No
Tianjin SF Freight Co., Ltd. 2020/3/24 100.00 2020/11/19 42.62 Joint liability
guarantee None None 2020/11/19-2021/11/11 No No
Shenzhen Fengyi Technology Co., Ltd. 2020/3/24 10,000.00 2020/11/30 50.00 Joint liability
guarantee None None 2020/11/30-2021/11/20 No No
S.F. EXPRESS (CHINA) LIMITED 2020/3/24 2,300.00 2020/11/23 99.91 Joint liability
guarantee None None 2020/11/23-2021/11/30 No No
Anhui S.F. Express Co., Ltd. 2020/3/24 1,200.00 2020/11/10 5.00 Joint liability
guarantee None None 2020/11/10-2021/9/30 No No
Anhui S.F. Express Co., Ltd. 2020/3/24 1,200.00 2020/11/4 80.00 Joint liability
guarantee None None 2020/11/4-2021/8/31 No No
Guizhou S.F. Express Co., Ltd. 2020/3/24 300.00 2020/11/10 12.21 Joint liability
guarantee None None 2020/11/10-2021/10/31 No No
Hunan,S.F.Express(Group)Co.,Ltd. 2020/3/24 1,500.00 2020/11/17 5.00 Joint liability
guarantee None None 2020/11/17-2021/7/31 No No
Hunan,S.F.Express(Group)Co.,Ltd. 2020/3/24 1,500.00 2020/11/10 87.72 Joint liability
guarantee None None 2020/11/10-2021/10/31 No No
Jiangsu S.F. Express Co., Ltd. 2020/3/24 750.00 2020/11/18 6.00 Joint liability
guarantee None None 2020/11/18-2021/12/31 No No
Jieyang Shunfeng Express Co., Ltd. 2020/3/24 50.00 2020/11/9 4.00 Joint liability
guarantee None None 2020/11/9-2021/10/12 No No
Langfang S.F. Express Co., Ltd. 2020/3/24 50.00 2020/11/10 1.00 Joint liability
guarantee None None 2020/11/10-2021/7/14 No No
Jiangsu S.F. Express Co., Ltd. 2020/3/24 750.00 2020/11/19 7.29 Joint liability
guarantee None None 2020/11/19-2021/2/28 Yes No
Lishui S.F. Express Co., Ltd. 2020/3/24 100.00 2020/11/20 40.59 Joint liability
guarantee None None 2020/11/20-2021/12/15 No No
NINGBO SHUNFENG EXPRESS CO.,LTD. 2020/3/24 3,000.00 2020/11/18 500.00 Joint liability
guarantee None None 2020/11/18-2021/12/31 No No
Qinghai Shunfeng Express Co., Ltd. 2020/3/24 200.00 2020/11/19 2.02 Joint liability
guarantee None None 2020/11/19-2021/10/31 No No
Shandong S.F. Express Co., Ltd. 2020/3/24 2,000.00 2020/11/9 250.00 Joint liability None None 2020/11/9-2021/10/27 No No

S.F. Holding Co., Ltd. 2021 Semi-Annual Report
109
guarantee
Shandong S.F. Express Co., Ltd. 2020/3/24 2,000.00 2020/11/25 21.24 Joint liability
guarantee None None 2020/11/25-2021/11/12 No No
Shenzhen Shuncheng Supply Chain Service Co., Ltd. 2020/3/24 1,400.00 2020/11/25 12.07 Joint liability
guarantee None None 2020/11/25-2021/10/31 No No
Shenzhen Shuncheng Supply Chain Service Co., Ltd. 2020/3/24 1,400.00 2020/11/15 11.30 Joint liability
guarantee None None 2020/11/15-2021/10/31 No No
Shenzhen Shuncheng Supply Chain Service Co., Ltd. 2020/3/24 1,400.00 2020/11/15 25.04 Joint liability
guarantee None None 2020/11/15-2021/10/31 No No
Hebei Shunhe Supply Chain Management Co., Ltd. 2020/3/24 150.00 2020/11/27 26.46 Joint liability
guarantee None None 2020/11/27-2021/2/28 Yes No
S.F.Express(Dong Guan)Limited 2020/3/24 4,000.00 2020/11/18 11.74 Joint liability
guarantee None None 2020/11/18-2021/11/11 No No
S.F.EXPRESS (TIANJIN) CO., LTD. 2020/3/24 300.00 2020/11/18 45.13 Joint liability
guarantee None None 2020/11/18-2021/1/31 Yes No
Sichuan S.F. Express Co., Ltd. 2020/3/24 1,000.00 2020/11/19 9.10 Joint liability
guarantee None None 2020/11/19-2021/10/31 No No
Sichuan S.F. Express Co., Ltd. 2020/3/24 1,000.00 2020/11/19 2.85 Joint liability
guarantee None None 2020/11/19-2021/10/15 No No
Sichuan S.F. Express Co., Ltd. 2020/3/24 1,000.00 2020/11/19 40.50 Joint liability
guarantee None None 2020/11/19-2021/10/16 No No
Wuxi S.F. Express Co., Ltd. 2020/3/24 500.00 2020/11/17 2.00 Joint liability
guarantee None None 2020/11/17-2021/10/31 No No
Zhejiang Shun Feng Express Co., Ltd. 2020/3/24 2,000.00 2020/11/18 300.00 Joint liability
guarantee None None 2020/11/18-2021/12/7 No No
XI`AN S.F EXPRESS CO.,LTD 2020/3/24 500.00 2020/11/10 53.84 Joint liability
guarantee None None 2020/11/10-2021/10/27 No No
Shenzhen SF Fix Technology Co., Ltd. 2020/3/24 10,000.00 2020/11/23 1,600.00 Joint liability
guarantee None None 2020/11/23-2021/6/30 Yes No
Chongqing Huiyifeng Logistics Co., Ltd. 2020/3/24 3,000.00 2020/12/30 1,500.00 Joint liability
guarantee None None 2020/12/30-2022/1/19 No No
Jiangsu Shunhefeng Freight Co., Ltd. 2020/3/24 1,800.00 2020/12/28 73.08 Joint liability
guarantee None None 2020/12/28-2021/7/27 No No
Liaoning Shunhe Supply Chain Management Co., Ltd. 2020/3/24 500.00 2020/12/30 115.86 Joint liability
guarantee None None 2020/12/30-2021/12/15 No No
Fujian Shunhe Supply Chain Management Co., Ltd. 2020/3/24 400.00 2020/12/30 60.45 Joint liability
guarantee None None 2020/12/30-2022/2/28 No No
Shanghai Shunheng Logistics Co., Ltd. 2020/3/24 5,000.00 2020/12/25 10.00 Joint liability
guarantee None None 2020/12/25-2021/9/27 No No
Shenzhen Shuncheng Supply Chain Service Co., Ltd. 2020/3/24 1,400.00 2020/12/30 106.53 Joint liability
guarantee None None 2020/12/30-2021/12/29 No No

S.F. Holding Co., Ltd. 2021 Semi-Annual Report
110
Guangxi ShunFeng Express Co.,Ltd. 2020/3/24 700.00 2020/12/29 100.00 Joint liability
guarantee None None 2020/12/29-2022/1/31 No No
XIAMEN SHUNFENG EXPRESS CO.,LTD. 2020/3/24 500.00 2020/12/29 40.00 Joint liability
guarantee None None 2020/12/29-2021/12/31 No No
Jiangxi S.F. Express Co., Ltd. 2020/3/24 1,000.00 2020/12/29 17.27 Joint liability
guarantee None None 2020/12/29-2021/12/23 No No
S.F. Express Co., Ltd. 2020/3/24 17,300.00 2020/12/25 200.00 Joint liability
guarantee None None 2020/12/25-2021/3/31 Yes No
Sichuan S.F. Express Co., Ltd. 2020/3/24 1,000.00 2020/12/25 22.04 Joint liability
guarantee None None 2020/12/25-2022/3/31 No No
Heilongjiang SF Juyi Supply Chain Management Co., Ltd. 2020/3/24 400.00 2020/12/17 51.60 Joint liability
guarantee None None 2020/12/17-2021/11/30 No No
Jiangsu Shunhefeng Freight Co., Ltd. 2020/3/24 1,800.00 2020/12/11 76.86 Joint liability
guarantee None None 2020/12/11-2021/11/30 No No
S. F. Express (Shenyang) Co., Ltd 2020/3/24 1,000.00 2020/12/16 210.00 Joint liability
guarantee None None 2020/12/16-2021/11/30 No No
Shenzhen S.F. Intra-city Logistics Co., Ltd. 2020/3/24 500.00 2020/12/16 15.00 Joint liability
guarantee None None 2020/12/16-2021/9/30 No No
Shenzhen Shunlu Air Freight Forwarding Co., Ltd. 2020/3/24 6,500.00 2020/12/16 2,238.00 Joint liability
guarantee None None 2020/12/16-2021/12/31 No No
Shandong S.F. Express Co., Ltd. 2020/3/24 2,000.00 2020/12/9 22.55 Joint liability
guarantee None None 2020/12/9-2021/11/20 No No
ZHONGSHAN S.F. EXPRESS CO. LTD 2020/3/24 600.00 2020/12/8 255.12 Joint liability
guarantee None None 2020/12/8-2021/12/2 No No
Shanghai Shunheng Logistics Co., Ltd. 2020/3/24 5,000.00 2020/12/9 49.56 Joint liability
guarantee None None 2020/12/9-2021/10/31 No No
Shanxi S.F. Express Co., Ltd. 2020/3/24 100.00 2020/12/9 26.25 Joint liability
guarantee None None 2020/12/9-2021/5/31 Yes No
S.F. Transportation (Changzhou) Co., Ltd. 2020/3/24 200.00 2020/12/9 25.09 Joint liability
guarantee None None 2020/12/9-2021/2/28 Yes No
Shanghai Shunheng Logistics Co., Ltd. 2020/3/24 5,000.00 2020/12/9 271.26 Joint liability
guarantee None None 2020/12/9-2021/2/28 Yes No
XI`AN S.F EXPRESS CO.,LTD 2020/3/24 500.00 2020/12/9 1.38 Joint liability
guarantee None None 2020/12/9-2021/10/31 No No
Shenzhen S.F. Supply Chain Co., Ltd. 2020/3/24 10,000.00 2020/12/10 106.76 Joint liability
guarantee None None 2020/12/10-2021/11/30 No No
S. F. Express (Shenyang) Co., Ltd 2020/3/24 1,000.00 2020/12/8 107.75 Joint liability
guarantee None None 2020/12/8-2021/11/30 No No
S. F. Express (Shenyang) Co., Ltd 2020/3/24 1,000.00 2020/12/8 8.00 Joint liability
guarantee None None 2020/12/8-2021/10/31 No No
S.F.Express(Dong Guan)Limited 2020/3/24 4,000.00 2020/12/8 222.06 Joint liability None None 2020/12/8-2021/11/11 No No

S.F. Holding Co., Ltd. 2021 Semi-Annual Report
111
guarantee
SF Express ChongQing CO.LTD 2020/3/24 1,000.00 2020/12/3 110.00 Joint liability
guarantee None None 2020/12/3-2021/12/31 No No
S.F. Express Group (Shanghai) Co., Ltd. 2020/3/24 2,100.00 2020/12/2 10.00 Joint liability
guarantee None None 2020/12/2-2021/11/20 No No
Sichuan S.F. Express Co., Ltd. 2020/3/24 1,000.00 2020/12/2 20.00 Joint liability
guarantee None None 2020/12/2-2021/9/30 No No
Wuxi S.F. Express Co., Ltd. 2020/3/24 500.00 2020/12/3 174.68 Joint liability
guarantee None None 2020/12/3-2021/11/20 No No
Shandong S.F. Express Co., Ltd. 2020/3/24 2,000.00 2020/12/3 30.00 Joint liability
guarantee None None 2020/12/3-2021/11/30 No No
QINGDAO S.F.EXPRESS CO.,LTD. 2020/3/24 1,300.00 2020/12/3 260.00 Joint liability
guarantee None None 2020/12/3-2021/11/30 No No
Beijing Shuncheng Logistics Co., Ltd. 2020/3/24 8,000.00 2020/12/3 600.00 Joint liability
guarantee None None 2020/12/3-2021/11/25 No No
Liaoning Shunlu Logistics Co., Ltd. 2020/3/24 1,800.00 2020/12/3 420.00 Joint liability
guarantee None None 2020/12/3-2021/10/31 No No
Shandong S.F. Express Co., Ltd. 2020/3/24 2,000.00 2020/12/3 27.78 Joint liability
guarantee None None 2020/12/3-2022/4/3 No No
S. F. Express (Shenyang) Co., Ltd 2020/3/24 1,000.00 2020/12/3 46.41 Joint liability
guarantee None None 2020/12/3-2021/1/31 Yes No
Hunan SF Freight Co., Ltd. 2020/3/24 200.00 2020/12/3 37.73 Joint liability
guarantee None None 2020/12/3-2021/11/30 No No
Anhui Shunhe Freight Co., Ltd. 2020/3/24 350.00 2020/12/3 2.00 Joint liability
guarantee None None 2020/12/3-2021/11/20 No No
Shandong S.F. Express Co., Ltd. 2020/3/24 2,000.00 2020/12/3 51.25 Joint liability
guarantee None None 2020/12/3-2021/11/20 No No
S.F. EXPRESS (CHINA) LIMITED 2020/3/24 2,300.00 2020/12/9 1,159.78 Joint liability
guarantee None None 2020/12/9-2021/12/14 No No
S.F. EXPRESS (CHINA) LIMITED 2020/3/24 2,300.00 2020/12/24 8.33 Joint liability
guarantee None None 2020/12/24-2022/1/4 No No
S.F. EXPRESS (CHINA) LIMITED 2020/3/24 2,300.00 2020/12/24 12.49 Joint liability
guarantee None None 2020/12/24-2022/1/4 No No
DSC Logistics (Beijing) Co., Ltd note1 2020/3/24 2,000.00 2020/12/10 70.90 Joint liability
guarantee None None 2020/12/10-2021/11/4 No No
Guizhou Fengtai E-commerce Industrial Park Management Co.,
Ltd. 2020/3/24 2,500.00 2020/12/18 2,320.54
Joint liability
guarantee None None 2020/12/18-2021/5/1 Yes No
Hubei S.F. Express Co., Ltd. 2020/3/24 1,000.00 2020/12/30 6.81 Joint liability
guarantee None None 2020/12/30-2021/12/23 No No
DHL LOGISTICS(CHINA) CO.,LTD. 2020/3/24 4,000.00 2020/12/28 77.01 Joint liability
guarantee None None 2020/12/28-2021/11/15 No No

S.F. Holding Co., Ltd. 2021 Semi-Annual Report
112
Shenzhen Shuncheng Supply Chain Service Co., Ltd. 2020/3/24 1,400.00 2020/12/8 135.73 Joint liability
guarantee None None 2020/12/8-2021/12/31 No No
Shenzhen Shuncheng Supply Chain Service Co., Ltd. 2020/3/24 1,400.00 2020/12/8 118.51 Joint liability
guarantee None None 2020/12/8-2021/11/30 No No
Shenzhen SF Comprehensive Logistics Service Co., Ltd. 2020/3/24 8,400.00 2020/12/23 5,100.00 Joint liability
guarantee None None 2020/12/23-2021/10/31 No No
Jiangsu S.F. Express Co., Ltd. 2020/3/24 750.00 2020/12/23 11.56 Joint liability
guarantee None None 2020/12/23-2021/11/18 No No
Shenzhen Shunlu Air Freight Forwarding Co., Ltd. 2020/3/24 6,500.00 2020/12/29 1,850.00 Joint liability
guarantee None None 2020/12/29-2021/12/31 No No
S.F.Express(Dong Guan)Limited 2020/3/24 4,000.00 2020/12/25 993.23 Joint liability
guarantee None None 2020/12/25-2021/12/20 No No
EXEL LOGISTICS CHINA CO.,LTD. 2020/3/24 1,000.00 2020/12/29 161.23 Joint liability
guarantee None None 2020/12/29-2022/3/31 No No
EXEL LOGISTICS CHINA CO.,LTD. 2020/3/24 1,000.00 2020/12/30 58.80 Joint liability
guarantee None None 2020/12/30-2022/4/30 No No
Shenzhen Fengyi Technology Co., Ltd. 2020/3/24 10,000.00 2020/12/31 100.00 Joint liability
guarantee None None 2020/12/31-2021/10/15 No No
SF LOGISTICS MEXICO SA de CV 2020/3/24 500.00 2020/7/21 193.91 Joint liability
guarantee None None 2020/7/21-2021/7/20 No No
Dongguan DHL Supply Chain Co., Ltd. 2020/3/24 3,300.00 2020/8/1 3,000.00 Joint liability
guarantee None None 2020/8/1-2025/7/31 No No
Yiwu Fengyutai Enterprise Management Co., Ltd. 2020/3/24 2,000.00 2020/9/1 1,291.52 Joint liability
guarantee None None 2020/9/1-2023/8/31 No No
Quanzhou Fengyutai Enterprise Management Co., Ltd. 2020/3/24 1,500.00 2020/9/1 1,132.52 Joint liability
guarantee None None 2020/9/1-2023/8/31 No No
Wuxi Jietai Enterprise Management Co., Ltd. 2020/3/24 1,650.00 2020/9/1 1,598.21 Joint liability
guarantee None None 2020/9/1-2023/8/31 No No
Huai'an Fengtai Enterprise Management Co., Ltd. 2020/3/24 530.00 2020/9/1 495.83 Joint liability
guarantee None None 2020/9/1-2023/8/31 No No
HaiNan S.F.Express LTD. 2020/3/24 700.00 2021/1/4 150.00 Joint liability
guarantee None None 2021/01/04-2021/12/31 No No
Shenzhen Fengyi Technology Co., Ltd. 2020/3/24 10,000.00 2021/1/4 200.00 Joint liability
guarantee None None 2021/01/04-2021/06/30 Yes No
Xi'an Shunlu Logistics Co., Ltd. 2020/3/24 1,500.00 2021/1/4 547.78 Joint liability
guarantee None None 2021/01/04-2021/12/31 No No
Beijing S.F. Express Co., LTD. 2020/3/24 3,000.00 2021/1/5 350.00 Joint liability
guarantee None None 2021/01/05-2021/12/31 No No
Beijing Shuncheng Logistics Co., Ltd. 2020/3/24 8,000.00 2021/1/5 10.00 Joint liability
guarantee None None 2021/01/05-2021/12/31 No No
Zhejiang Shun Feng Express Co., Ltd. 2020/3/24 2,000.00 2021/1/11 56.01 Joint liability None None 2021/01/11-2021/07/31 No No

S.F. Holding Co., Ltd. 2021 Semi-Annual Report
113
guarantee
DHL LOGISTICS(CHINA) CO.,LTD. 2020/3/24 4,000.00 2021/1/13 100.00 Joint liability
guarantee None None 2021/01/13-2021/05/11 Yes No
QINGDAO S.F.EXPRESS CO.,LTD. 2020/3/24 1,300.00 2021/1/13 180.00 Joint liability
guarantee None None 2021/01/13-2021/12/19 No No
Shenzhen Shuncheng Supply Chain Service Co., Ltd. 2020/3/24 1,400.00 2021/1/13 7.88 Joint liability
guarantee None None 2021/01/13-2021/12/31 No No
Haikou Fengtai Industrial Park Management Co., Ltd. 2020/3/24 510.00 2021/1/15 367.27 Joint liability
guarantee None None 2021/01/16-2021/10/06 No No
NINGBO SHUNFENG EXPRESS CO.,LTD. 2020/3/24 3,000.00 2021/1/15 118.52 Joint liability
guarantee None None 2021/01/15-2021/12/31 No No
Zhejiang Shun Feng Express Co., Ltd. 2020/3/24 2,000.00 2021/1/15 191.10 Joint liability
guarantee None None 2021/01/15-2021/02/28 Yes No
Anhui Shunhe Freight Co., Ltd. 2020/3/24 350.00 2021/1/18 23.45 Joint liability
guarantee None None 2021/01/18-2021/12/31 No No
QINGDAO S.F.EXPRESS CO.,LTD. 2020/3/24 1,300.00 2021/1/18 3.00 Joint liability
guarantee None None 2021/01/18-2021/12/31 No No
Shenzhen Fengyi Technology Co., Ltd. 2020/3/24 10,000.00 2021/1/18 345.00 Joint liability
guarantee None None 2021/01/18-2022/01/15 No No
SF Airlines Company Limited 2020/3/24 220,000.00 2021/1/19 2,500.00 Joint liability
guarantee None None 2021/01/19-2022/01/14 No No
S.F.Express(Dong Guan)Limited 2020/3/24 4,000.00 2021/1/19 186.04 Joint liability
guarantee None None 2021/01/19-2021/12/31 No No
Guangxi ShunFeng Express Co.,Ltd. 2020/3/24 700.00 2021/1/21 70.00 Joint liability
guarantee None None 2021/01/21-2022/01/31 No No
Zhejiang Shuangjie Supply Chain Technology Co., Ltd. 2020/3/24 1,600.00 2021/1/21 54.64 Joint liability
guarantee None None 2021/01/21-2022/04/30 No No
Beijing S.F. Express Co., LTD. 2020/3/24 3,000.00 2021/1/21 30.00 Joint liability
guarantee None None 2021/01/21-2022/01/31 No No
Guangxi ShunFeng Express Co.,Ltd. 2020/3/24 700.00 2021/1/21 10.00 Joint liability
guarantee None None 2021/01/21-2022/01/31 No No
S.F.EXPRESS (TIANJIN) CO., LTD. 2020/3/24 300.00 2021/1/21 7.00 Joint liability
guarantee None None 2021/01/21-2021/12/31 No No
Zhejiang Shuangjie Supply Chain Technology Co., Ltd. 2020/3/24 1,600.00 2021/1/21 2.90 Joint liability
guarantee None None 2021/01/21-2021/12/29 No No
Shanghai Shunheng Logistics Co., Ltd. 2020/3/24 5,000.00 2021/1/25 32.90 Joint liability
guarantee None None 2021/01/25-2021/12/31 No No
Shenzhen SF Fix Technology Co., Ltd. 2020/3/24 10,000.00 2021/1/26 250.00 Joint liability
guarantee None None 2021/01/26-2021/12/31 No No
Quanzhou Shunlu Logistics Co., Ltd. 2020/3/24 1,300.00 2021/1/28 400.00 Joint liability
guarantee None None 2021/01/28-2021/12/31 No No

S.F. Holding Co., Ltd. 2021 Semi-Annual Report
114
Quanzhou Shunlu Logistics Co., Ltd. 2020/3/24 1,300.00 2021/1/28 300.00 Joint liability
guarantee None None 2021/01/28-2021/12/31 No No
Shenzhen SF Comprehensive Logistics Service Co., Ltd. 2020/3/24 8,400.00 2021/1/28 46.41 Joint liability
guarantee None None 2021/01/28-2022/02/28 No No
Guangdong S.F. E-commerce Co., Ltd. 2020/3/24 500.00 2021/1/28 40.00 Joint liability
guarantee None None 2021/01/28-2022/01/31 No No
QINGDAO S.F.EXPRESS CO.,LTD. 2020/3/24 1,300.00 2021/1/28 40.00 Joint liability
guarantee None None 2021/01/28-2021/11/30 No No
Hangzhou SF Zhida Logistics Co., Ltd. 2020/3/24 1,350.00 2021/1/29 100.00 Joint liability
guarantee None None 2021/01/29-2021/12/31 No No
Shanghai Solution Plus Supply Chain Co., Ltd. 2020/3/24 1,000.00 2021/1/29 100.00 Joint liability
guarantee None None 2021/01/29-2021/09/30 No No
Zhejiang Shuangjie Supply Chain Technology Co., Ltd. 2020/3/24 1,600.00 2021/1/29 73.09 Joint liability
guarantee None None 2021/01/29-2021/12/31 No No
Zhejiang Shuangjie Supply Chain Technology Co., Ltd. 2020/3/24 1,600.00 2021/1/29 47.54 Joint liability
guarantee None None 2021/01/29-2021/11/30 No No
Chengdu Taishun Logistics Co.,Ltd. 2020/3/24 2,000.00 2021/2/2 69.00 Joint liability
guarantee None None 2021/02/02-2021/12/31 No No
FS ELECTRONIC TECHNOLOGY CO., LIMITED 2020/3/24 1,000.00 2021/2/2 20.81 Joint liability
guarantee None None 2021/02/02-2021/12/31 No No
E COMMERCE FULFILLMENT COMPANY LTD 2020/3/24 100.00 2021/2/4 21.36 Joint liability
guarantee None None 2021/02/04-2021/11/11 No No
ZHONGSHAN S.F. EXPRESS CO. LTD 2020/3/24 600.00 2021/2/2 120.61 Joint liability
guarantee None None 2021/02/02-2021/12/09 No No
Shanghai Shunheng Logistics Co., Ltd. 2020/3/24 5,000.00 2021/2/3 1,993.18 Joint liability
guarantee None None 2021/02/03-2022/01/31 No No
Sichuan S.F. Express Co., Ltd. 2020/3/24 1,000.00 2021/2/3 144.20 Joint liability
guarantee None None 2021/02/03-2021/12/25 No No
Jiangsu Shunhefeng Freight Co., Ltd. 2020/3/24 1,800.00 2021/2/3 3.00 Joint liability
guarantee None None 2021/02/03-2021/12/31 No No
Zhejiang Shuangjie Supply Chain Technology Co., Ltd. 2020/3/24 1,600.00 2021/2/4 125.84 Joint liability
guarantee None None 2021/02/04-2022/01/27 No No
Shandong SF Freight Co., Ltd. 2020/3/24 1,000.00 2021/2/4 94.32 Joint liability
guarantee None None 2021/02/04-2022/04/30 No No
Shenzhen SF Comprehensive Logistics Service Co., Ltd. 2020/3/24 8,400.00 2021/2/4 35.00 Joint liability
guarantee None None 2021/02/04-2021/04/30 Yes No
Shenzhen Fengyi Technology Co., Ltd. 2020/3/24 10,000.00 2021/2/4 10.00 Joint liability
guarantee None None 2021/02/04-2021/11/30 No No
Shenzhen Fengyi Technology Co., Ltd. 2020/3/24 10,000.00 2021/2/4 60.00 Joint liability
guarantee None None 2021/02/04-2022/01/15 No No
Wuhan SF Zhida Logistics Co., Ltd. 2020/3/24 300.00 2021/2/4 50.00 Joint liability None None 2021/02/04-2021/11/30 No No

S.F. Holding Co., Ltd. 2021 Semi-Annual Report
115
guarantee
EXEL LOGISTICS CHINA CO.,LTD. 2020/3/24 1,000.00 2021/2/7 10.00 Joint liability
guarantee None None 2021/02/07-2021/12/31 No No
EXEL LOGISTICS CHINA CO.,LTD. 2020/3/24 1,000.00 2021/2/7 150.00 Joint liability
guarantee None None 2021/02/07-2021/12/31 No No
Weihai S.F. Express Co., Ltd. 2020/3/24 100.00 2021/2/7 1.00 Joint liability
guarantee None None 2021/02/07-2021/12/31 No No
S.F. Express Co., Ltd. 2020/3/24 17,300.00 2021/2/26 500.00 Joint liability
guarantee None None 2021/02/26-2022/03/01 No No
Shaanxi SF Freight Co., Ltd. 2020/3/24 400.00 2021/2/26 6.52 Joint liability
guarantee None None 2021/02/26-2022/02/07 No No
DSC Logistics (Beijing) Co., Ltd note1 2020/3/24 2,000.00 2021/2/26 43.27 Joint liability
guarantee None None 2021/02/26-2023/03/31 No No
Dongguan DHL Supply Chain Co., Ltd. 2020/3/24 3,300.00 2021/2/26 372.66 Joint liability
guarantee None None 2021/02/26-2022/02/28 No No
Zhejiang Shuangjie Supply Chain Technology Co., Ltd. 2020/3/24 1,600.00 2021/3/1 15.30 Joint liability
guarantee None None 2021/03/01-2022/01/26 No No
Shenzhen SF Comprehensive Logistics Service Co., Ltd. 2020/3/24 8,400.00 2021/3/2 643.00 Joint liability
guarantee None None 2021/03/02-2022/01/31 No No
Shenzhen Shunlu Logistics Co., Ltd. 2020/3/24 2,000.00 2021/3/2 118.00 Joint liability
guarantee None None 2021/03/02-2021/12/31 No No
Qingdao SF Freight Co., Ltd. 2020/3/24 150.00 2021/3/8 55.81 Joint liability
guarantee None None 2021/03/08-2022/01/31 No No
Xinjiang SF Express Co.,LTD. 2020/3/24 210.00 2021/3/8 6.00 Joint liability
guarantee None None 2021/03/08-2021/12/31 No No
Yantai S.F. Express Co., Ltd. 2020/3/24 200.00 2021/3/8 85.00 Joint liability
guarantee None None 2021/03/08-2022/01/31 No No
Shenzhen Fengyi Technology Co., Ltd. 2020/3/24 10,000.00 2021/3/9 10.00 Joint liability
guarantee None None 2021/03/09-2021/11/30 No No
Shenzhen SF Comprehensive Logistics Service Co., Ltd. 2020/3/24 8,400.00 2021/3/9 45.37 Joint liability
guarantee None None 2021/03/09-2022/02/28 No No
SF GLOBAL EXPRESS (M) SDN BHD 2020/3/24 500.00 2021/3/9 23.35 Joint liability
guarantee None None 2021/03/09-2022/04/15 No No
SF Airlines Company Limited 2021/3/18 72,000.00 2021/5/18 200.00 Joint liability
guarantee None None 2021/05/18-2022/11/11 No No
Sichuan Shunhefeng Freight Co., Ltd. 2020/3/24 300.00 2021/3/9 15.47 Joint liability
guarantee None None 2021/03/09-2021/12/25 No No
Sichuan Shunhefeng Freight Co., Ltd. 2020/3/24 300.00 2021/3/9 10.88 Joint liability
guarantee None None 2021/03/09-2022/01/31 No No
Wuhan SF Zhida Logistics Co., Ltd. 2020/3/24 300.00 2021/3/9 40.00 Joint liability
guarantee None None 2021/03/09-2021/12/31 No No

S.F. Holding Co., Ltd. 2021 Semi-Annual Report
116
Hubei S.F. Express Co., Ltd. 2020/3/24 1,000.00 2021/3/16 15.00 Joint liability
guarantee None None 2021/03/16-2021/12/31 No No
QINGDAO S.F.EXPRESS CO.,LTD. 2020/3/24 1,300.00 2021/3/16 150.00 Joint liability
guarantee None None 2021/03/16-2022/03/09 No No
Shandong S.F. Express Co., Ltd. 2020/3/24 2,000.00 2021/3/16 35.00 Joint liability
guarantee None None 2021/03/16-2022/01/31 No No
Shenzhen Fenglang Supply Chain Co., Ltd. 2020/3/24 5,100.00 2021/3/16 321.40 Joint liability
guarantee None None 2021/03/16-2022/03/10 No No
Shenzhen Fenglang Supply Chain Co., Ltd. 2020/3/24 5,100.00 2021/3/16 300.50 Joint liability
guarantee None None 2021/03/16-2022/03/08 No No
S.F. Express Co., Ltd. 2020/3/24 17,300.00 2021/3/16 3,000.00 Joint liability
guarantee None None 2021/03/16-2022/03/11 No No
Nantong S.F. Express Co., Ltd. 2020/3/24 200.00 2021/3/19 74.27 Joint liability
guarantee None None 2021/03/19-2021/06/30 Yes No
Shanghai Shunheng Logistics Co., Ltd. 2020/3/24 5,000.00 2021/3/19 185.02 Joint liability
guarantee None None 2021/03/19-2021/04/15 Yes No
Shenzhen Shuncheng Supply Chain Service Co., Ltd. 2020/3/24 1,400.00 2021/3/19 18.26 Joint liability
guarantee None None 2021/03/19-2021/11/30 No No
SF Supply Chain (Hong Kong) Limited 2020/3/24 2,100.00 2021/3/23 96.50 Joint liability
guarantee None None 2021/03/22-2024/07/20 No No
Anhui S.F. Express Co., Ltd. 2020/3/24 1,200.00 2021/3/23 4.56 Joint liability
guarantee None None 2021/03/23-2022/01/18 No No
Guizhou S.F. Express Co., Ltd. 2020/3/24 300.00 2021/3/23 14.77 Joint liability
guarantee None None 2021/03/23-2022/02/28 No No
Shenzhen SF Comprehensive Logistics Service Co., Ltd. 2020/3/24 8,400.00 2021/3/23 100.00 Joint liability
guarantee None None 2021/03/23-2021/12/31 No No
Yunnan S.F. Express Co., Ltd. 2020/3/24 500.00 2021/3/23 163.54 Joint liability
guarantee None None 2021/03/23-2022/02/17 No No
Chengdu Shunyifeng Pharmaceutical Co., Ltd. 2020/3/24 100.00 2021/3/25 43.63 Joint liability
guarantee None None 2021/03/25-2022/03/12 No No
Suzhou Industrial Park S.F. Express Co., Ltd. 2020/3/24 2,500.00 2021/3/25 78.95 Joint liability
guarantee None None 2021/03/25-2021/11/30 No No
Xi'an Shunlu Logistics Co., Ltd. 2020/3/24 1,500.00 2021/3/25 202.98 Joint liability
guarantee None None 2021/03/25-2022/01/27 No No
Guizhou S.F. Express Co., Ltd. 2020/3/24 300.00 2021/3/26 12.74 Joint liability
guarantee None None 2021/03/26-2021/08/31 No No
Wuhan SF Zhida Logistics Co., Ltd. 2020/3/24 300.00 2021/3/26 100.00 Joint liability
guarantee None None 2021/03/26-2021/06/02 Yes No
Xinjiang SF Express Co.,LTD. 2020/3/24 210.00 2021/3/26 2.00 Joint liability
guarantee None None 2021/03/26-2021/12/31 No No
S.F. Express Co., Ltd. 2020/3/24 17,300.00 2021/3/30 300.00 Joint liability None None 2021/03/30-2022/03/31 No No

S.F. Holding Co., Ltd. 2021 Semi-Annual Report
117
guarantee
DHL LOGISTICS(CHINA) CO.,LTD. 2020/3/24 4,000.00 2021/3/31 76.73 Joint liability
guarantee None None 2021/03/31-2021/06/09 Yes No
XI`AN S.F EXPRESS CO.,LTD 2020/3/24 500.00 2021/3/30 56.87 Joint liability
guarantee None None 2021/03/30-2022/03/09 No No
Shenzhen Fengyi Technology Co., Ltd. 2020/3/24 10,000.00 2021/4/8 500.00 Joint liability
guarantee None None 2021/04/08-2022/02/28 No No
Shenzhen Fengyi Technology Co., Ltd. 2020/3/24 10,000.00 2021/4/8 600.00 Joint liability
guarantee None None 2021/04/08-2022/03/31 No No
Hebei S.F. Express Co., Ltd. 2021/3/18 400.00 2021/4/9 30.00 Joint liability
guarantee None None 2021/04/09-2021/12/31 No No
Zhejiang Shuangjie Supply Chain Technology Co., Ltd. 2021/3/18 2,000.00 2021/4/9 41.23 Joint liability
guarantee None None 2021/04/09-2022/03/18 No No
SF Express ChongQing CO.LTD 2021/3/18 1,000.00 2021/4/14 169.01 Joint liability
guarantee None None 2021/04/14-2022/02/28 No No
Xinjiang SF Express Co.,LTD. 2021/3/18 400.00 2021/4/15 9.49 Joint liability
guarantee None None 2021/04/15-2021/10/31 No No
Yunnan Shunhe Freight Co., Ltd. 2021/3/18 500.00 2021/4/15 50.27 Joint liability
guarantee None None 2021/04/15-2022/05/06 No No
Shaanxi SF Freight Co., Ltd. 2021/3/18 300.00 2021/4/23 122.83 Joint liability
guarantee None None 2021/04/23-2022/07/31 No No
Shenzhen Fengyi Technology Co., Ltd. 2021/3/18 20,000.00 2021/4/23 362.00 Joint liability
guarantee None None 2021/04/23-2022/04/30 No No
Shenzhen Fengyi Technology Co., Ltd. 2021/3/18 20,000.00 2021/4/23 300.00 Joint liability
guarantee None None 2021/04/23-2022/01/15 No No
Shenzhen Fengyi Technology Co., Ltd. 2021/3/18 20,000.00 2021/4/23 500.00 Joint liability
guarantee None None 2021/04/23-2022/03/31 No No
Shenzhen Fengyi Technology Co., Ltd. 2021/3/18 20,000.00 2021/4/23 500.00 Joint liability
guarantee None None 2021/04/23-2022/03/31 No No
Shenzhen Fengyi Technology Co., Ltd. 2021/3/18 20,000.00 2021/4/23 600.00 Joint liability
guarantee None None 2021/04/23-2022/04/15 No No
Shenzhen Fengyi Technology Co., Ltd. 2021/3/18 20,000.00 2021/4/23 500.00 Joint liability
guarantee None None 2021/04/23-2022/03/31 No No
Shenzhen Fengyi Technology Co., Ltd. 2021/3/18 20,000.00 2021/4/23 500.00 Joint liability
guarantee None None 2021/04/23-2022/03/31 No No
Tianjin SF Freight Co., Ltd. 2021/3/18 200.00 2021/4/15 35.83 Joint liability
guarantee None None 2021/04/15-2022/01/14 No No
Anhui S.F. Express Co., Ltd. 2021/3/18 7,500.00 2021/4/14 10.00 Joint liability
guarantee None None 2021/04/14-2022/05/31 No No
Shenzhen SF Fix Technology Co., Ltd. 2021/3/18 20,000.00 2021/4/14 300.00 Joint liability
guarantee None None 2021/04/14-2022/01/31 No No

S.F. Holding Co., Ltd. 2021 Semi-Annual Report
118
Guizhou S.F. Express Co., Ltd. 2021/3/18 400.00 2021/4/14 64.96 Joint liability
guarantee None None 2021/04/14-2022/03/31 No No
Jiaxing S.F. Transportation Co., Ltd. 2021/3/18 300.00 2021/4/14 113.57 Joint liability
guarantee None None 2021/04/14-2022/06/30 No No
Shaanxi SF Freight Co., Ltd. 2021/3/18 300.00 2021/4/14 2.90 Joint liability
guarantee None None 2021/04/14-2022/04/04 No No
NINGBO SHUNFENG EXPRESS CO.,LTD. 2021/3/18 1,500.00 2021/4/14 400.00 Joint liability
guarantee None None 2021/04/14-2022/05/06 No No
XIAMEN SHUNFENG EXPRESS CO.,LTD. 2021/3/18 1,000.00 2021/4/14 100.00 Joint liability
guarantee None None 2021/04/14-2021/07/31 No No
Beijing S.F. Express Co., LTD. 2021/3/18 2,000.00 2021/4/14 100.00 Joint liability
guarantee None None 2021/04/14-2022/04/20 No No
Shenzhen Fengyi Technology Co., Ltd. 2021/3/18 20,000.00 2021/4/14 62.00 Joint liability
guarantee None None 2021/04/14-2022/02/28 No No
S.F. Express Co., Ltd. 2021/3/18 2,000.00 2021/4/14 300.00 Joint liability
guarantee None None 2021/04/14-2022/03/31 No No
Shenzhen SF Comprehensive Logistics Service Co., Ltd. 2021/3/18 8,250.00 2021/4/15 720.00 Joint liability
guarantee None None 2021/04/15-2021/10/30 No No
Shandong S.F. Express Co., Ltd. 2021/3/18 1,500.00 2021/4/15 5.00 Joint liability
guarantee None None 2021/04/15-2021/05/31 Yes No
Sichuan S.F. Express Co., Ltd. 2021/3/18 1,000.00 2021/4/22 5.00 Joint liability
guarantee None None 2021/04/22-2022/01/31 No No
Guangzhou Huiyi Logistics Co., Ltd. 2021/3/18 2,600.00 2021/4/22 25.00 Joint liability
guarantee None None 2021/04/22-2022/02/28 No No
S.F. Express Co.,Ltd. 2021/3/18 1,000.00 2021/5/31 49.71 Joint liability
guarantee None None 2021/05/31-2022/01/14 No No
Changchun SF Freight Co., Ltd. 2021/3/18 300.00 2021/4/28 49.01 Joint liability
guarantee None None 2021/04/28-2021/10/21 No No
Suzhou Industrial Park S.F. Express Co., Ltd. 2021/3/18 2,500.00 2021/4/30 50.00 Joint liability
guarantee None None 2021/04/30-2022/04/22 No No
Suzhou Industrial Park S.F. Express Co., Ltd. 2021/3/18 2,500.00 2021/4/30 20.00 Joint liability
guarantee None None 2021/04/30-2022/04/22 No No
Sichuan S.F. Express Co., Ltd. 2021/3/18 1,000.00 2021/4/29 11.61 Joint liability
guarantee None None 2021/04/29-2022/04/21 No No
S.F. Express Co., Ltd. 2021/3/18 2,000.00 2021/4/30 83.37 Joint liability
guarantee None None 2021/04/30-2021/07/31 No No
S.F.Express(Dong Guan)Limited 2021/3/18 2,500.00 2021/4/30 15.03 Joint liability
guarantee None None 2021/04/30-2022/04/22 No No
Liaoning Shunhe Supply Chain Management Co., Ltd. 2021/3/18 700.00 2021/4/28 3.83 Joint liability
guarantee None None 2021/04/28-2021/09/30 No No
DHL LOGISTICS(CHINA) CO.,LTD. 2021/3/18 1,600.00 2021/4/28 20.00 Joint liability None None 2021/04/28-2022/04/20 No No

S.F. Holding Co., Ltd. 2021 Semi-Annual Report
119
guarantee
HENAN S.F.EXPRESS CO.,LTD 2021/3/18 500.00 2021/4/30 15.00 Joint liability
guarantee None None 2021/04/30-2022/04/22 No No
HaiNan S.F.Express LTD. 2021/3/18 600.00 2021/4/30 35.00 Joint liability
guarantee None None 2021/04/30-2022/02/04 No No
EXEL LOGISTICS CHINA CO.,LTD. 2021/3/18 1,600.00 2021/4/30 133.25 Joint liability
guarantee None None 2021/04/30-2024/04/30 No No
Guizhou S.F. Express Co., Ltd. 2021/3/18 400.00 2021/4/30 20.28 Joint liability
guarantee None None 2021/04/30-2022/04/04 No No
S.F. Express Group (Shanghai) Co., Ltd. 2021/3/18 2,000.00 2021/5/6 100.00 Joint liability
guarantee None None 2021/05/06-2022/05/04 No No
XI`AN S.F EXPRESS CO.,LTD 2021/3/18 150.00 2021/5/18 28.29 Joint liability
guarantee None None 2021/05/18-2022/05/07 No No
S. F. Express (Shenyang) Co., Ltd 2021/3/18 1,000.00 2021/5/20 16.75 Joint liability
guarantee None None 2021/05/20-2022/05/07 No No
SF Express ChongQing CO.LTD 2021/3/18 1,000.00 2021/5/18 169.01 Joint liability
guarantee None None 2021/05/18-2021/12/31 No No
Jiangsu S.F. Express Co., Ltd. 2021/3/18 1,000.00 2021/5/20 3.83 Joint liability
guarantee None None 2021/05/20-2022/05/07 No No
Jiangsu S.F. Express Co., Ltd. 2021/3/18 1,000.00 2021/5/20 1.00 Joint liability
guarantee None None 2021/05/20-2022/05/07 No No
HENAN S.F.EXPRESS CO.,LTD 2021/3/18 500.00 2021/5/20 33.00 Joint liability
guarantee None None 2021/05/20-2022/05/07 No No
Liaoning Shunlu Logistics Co., Ltd. 2021/3/18 1,000.00 2021/5/20 86.41 Joint liability
guarantee None None 2021/05/20-2022/05/07 No No
S.F.EXPRESS OF DALIAN L.T.D 2021/3/18 500.00 2021/5/20 296.28 Joint liability
guarantee None None 2021/05/20-2022/05/07 No No
Shenzhen SF Fix Technology Co., Ltd. 2021/3/18 20,000.00 2021/5/20 1,600.00 Joint liability
guarantee None None 2021/05/20-2022/06/30 No No
Shanghai Shunheng Logistics Co., Ltd. 2021/3/18 5,000.00 2021/5/20 58.44 Joint liability
guarantee None None 2021/05/20-2021/12/08 No No
Wenzhou Shunheng Express Co., Ltd. 2021/3/18 1,000.00 2021/5/20 437.92 Joint liability
guarantee None None 2021/05/20-2022/05/07 No No
Taizhou S.F. Express Co., Ltd. 2021/3/18 500.00 2021/5/20 304.95 Joint liability
guarantee None None 2021/05/20-2022/05/13 No No
Zhejiang Shunlu Logistics Co.,Ltd. 2021/3/18 34,000.00 2021/5/20 108.78 Joint liability
guarantee None None 2021/05/20-2022/05/07 No No
Guizhou S.F. Express Co., Ltd. 2021/3/18 400.00 2021/5/25 21.60 Joint liability
guarantee None None 2021/05/25-2022/05/13 No No
SF Airlines Company Limited 2021/3/18 72,000.00 2021/5/20 31.35 Joint liability
guarantee None None 2021/05/20-2022/05/07 No No

S.F. Holding Co., Ltd. 2021 Semi-Annual Report
120
Shandong S.F. Express Co., Ltd. 2021/3/18 1,500.00 2021/5/20 146.75 Joint liability
guarantee None None 2021/05/20-2022/05/07 No No
Shandong S.F. Express Co., Ltd. 2021/3/18 1,500.00 2021/5/20 107.96 Joint liability
guarantee None None 2021/05/20-2022/05/07 No No
Shenzhen SF Comprehensive Logistics Service Co., Ltd. 2021/3/18 8,250.00 2021/5/14 50.00 Joint liability
guarantee None None 2021/05/14-2022/05/14 No No
S.F. EXPRESS (CHINA) LIMITED 2021/3/18 25,000.00 2021/5/18 83.26 Joint liability
guarantee None None 2021/05/21-2022/05/21 No No
Hubei S.F. Express Co., Ltd. 2021/3/18 400.00 2021/5/25 26.94 Joint liability
guarantee None None 2021/05/25-2022/04/30 No No
Shenzhen Fenglang Supply Chain Co., Ltd. 2021/3/18 2,000.00 2021/5/14 171.00 Joint liability
guarantee None None 2021/05/14-2021/11/10 No No
Shenzhen SF Comprehensive Logistics Service Co., Ltd. 2021/3/18 8,250.00 2021/5/12 17.00 Joint liability
guarantee None None 2021/05/12-2021/07/31 No No
Shenzhen SF Comprehensive Logistics Service Co., Ltd. 2021/3/18 8,250.00 2021/5/14 250.00 Joint liability
guarantee None None 2021/05/14-2021/12/31 No No
Huai'an S.F. Express Co., Ltd. 2021/3/18 200.00 2021/5/18 63.54 Joint liability
guarantee None None 2021/05/18-2022/04/22 No No
Shenzhen Shuncheng Supply Chain Service Co., Ltd. 2021/3/18 1,000.00 2021/5/18 321.24 Joint liability
guarantee None None 2021/05/18-2022/05/07 No No
Shenzhen Shunlu Logistics Co., Ltd. 2021/3/18 1,000.00 2021/5/18 412.33 Joint liability
guarantee None None 2021/05/18-2022/05/07 No No
Wenzhou Shunheng Express Co., Ltd. 2021/3/18 1,000.00 2021/5/18 110.00 Joint liability
guarantee None None 2021/05/18-2021/11/04 No No
Wuhan SF Cold Chain Supply Chain Co., Ltd. 2021/3/18 60.00 2021/5/18 10.00 Joint liability
guarantee None None 2021/05/18-2022/04/19 No No
Zhejiang Shuangjie Supply Chain Technology Co., Ltd. 2021/3/18 2,000.00 2021/5/26 200.00 Joint liability
guarantee None None 2021/05/26-2022/05/13 No No
Shanxi S.F. Express Co., Ltd. 2021/3/18 100.00 2021/5/26 6.00 Joint liability
guarantee None None 2021/05/26-2021/12/31 No No
Shanxi S.F. Express Co., Ltd. 2021/3/18 100.00 2021/5/26 35.00 Joint liability
guarantee None None 2021/05/26-2021/12/31 No No
Shenzhen Shunlu Logistics Co., Ltd. 2021/3/18 1,000.00 2021/5/18 80.00 Joint liability
guarantee None None 2021/05/18-2022/05/07 No No
Shenzhen Shunlu Logistics Co., Ltd. 2021/3/18 1,000.00 2021/5/26 40.00 Joint liability
guarantee None None 2021/05/26-2022/05/07 No No
Guangdong S.F. E-commerce Co., Ltd. 2021/3/18 14,000.00 2021/5/26 310.58 Joint liability
guarantee None None 2021/05/26-2021/12/31 No No
Shenzhen Shuncheng Supply Chain Service Co., Ltd. 2021/3/18 1,000.00 2021/5/27 21.84 Joint liability
guarantee None None 2021/05/27-2022/05/15 No No
Shenzhen S.F. Supply Chain Co., Ltd. 2021/3/18 5,000.00 2021/5/27 790.00 Joint liability None None 2021/05/27-2022/04/30 No No

S.F. Holding Co., Ltd. 2021 Semi-Annual Report
121
guarantee
Hunan,S.F.Express(Group)Co.,Ltd. 2021/3/18 1,500.00 2021/5/27 217.56 Joint liability
guarantee None None 2021/05/27-2022/05/13 No No
Zhejiang Shunhefeng Freight Co., Ltd. 2021/3/18 800.00 2021/5/28 82.53 Joint liability
guarantee None None 2021/05/28-2022/05/18 No No
S. F. Express (Shenyang) Co., Ltd 2021/3/18 1,000.00 2021/5/28 48.00 Joint liability
guarantee None None 2021/05/28-2022/05/17 No No
Tianjin SF Juyi Logistics Co., Ltd. 2021/3/18 600.00 2021/5/28 20.81 Joint liability
guarantee None None 2021/05/28-2022/05/25 No No
DHL LOGISTICS(CHINA) CO.,LTD. 2021/3/18 1,600.00 2021/5/28 35.28 Joint liability
guarantee None None 2021/05/28-2022/05/14 No No
Shenzhen Fengyi Technology Co., Ltd. 2021/3/18 20,000.00 2021/5/31 300.00 Joint liability
guarantee None None 2021/05/31-2022/05/14 No No
S.F. Express Co.,Ltd. 2021/3/18 1,000.00 2021/5/31 497.15 Joint liability
guarantee None None 2021/05/31-2022/06/30 No No
Henan Huihai Logistics Co., Ltd. 2021/3/18 500.00 2021/5/28 149.76 Joint liability
guarantee None None 2021/05/28-2022/05/07 No No
Suzhou Industrial Park S.F. Express Co., Ltd. 2021/3/18 2,500.00 2021/6/4 1.88 Joint liability
guarantee None None 2021/06/04-2022/03/31 No No
SF Airlines Company Limited 2021/3/18 72,000.00 2021/6/8 16.64 Joint liability
guarantee None None 2021/06/08-2021/12/31 No No
SF Airlines Company Limited 2021/3/18 72,000.00 2021/6/8 0.76 Joint liability
guarantee None None 2021/06/08-2022/05/07 No No
Zhejiang Shuangjie Supply Chain Technology Co., Ltd. 2021/3/18 2,000.00 2021/6/8 9.00 Joint liability
guarantee None None 2021/06/08-2022/05/07 No No
S.F.Express(Dong Guan)Limited 2021/3/18 2,500.00 2021/6/1 61.45 Joint liability
guarantee None None 2021/06/01-2022/06/30 No No
Anhui S.F. Express Co., Ltd. 2021/3/18 7,500.00 2021/6/1 180.00 Joint liability
guarantee None None 2021/06/01-2022/05/31 No No
Guang Zhou S.F. Express Co., Ltd. 2021/3/18 5,000.00 2021/6/3 267.91 Joint liability
guarantee None None 2021/06/03-2021/12/31 No No
Guizhou S.F. Express Co., Ltd. 2021/3/18 400.00 2021/6/1 11.38 Joint liability
guarantee None None 2021/06/01-2022/04/30 No No
Guizhou S.F. Express Co., Ltd. 2021/3/18 400.00 2021/6/1 12.28 Joint liability
guarantee None None 2021/06/01-2022/04/30 No No
Hangzhou SF Zhida Logistics Co., Ltd. 2021/3/18 1,000.00 2021/6/4 256.59 Joint liability
guarantee None None 2021/06/04-2022/05/18 No No
Shandong SF Freight Co., Ltd. 2021/3/18 600.00 2021/6/3 177.19 Joint liability
guarantee None None 2021/06/03-2022/05/19 No No
Shanghai Shunheng Logistics Co., Ltd. 2021/3/18 5,000.00 2021/6/3 107.41 Joint liability
guarantee None None 2021/06/03-2021/12/31 No No

S.F. Holding Co., Ltd. 2021 Semi-Annual Report
122
Shenzhen Shuncheng Supply Chain Service Co., Ltd. 2021/3/18 1,000.00 2021/6/8 60.00 Joint liability
guarantee None None 2021/06/08-2021/07/31 No No
Shenzhen SF Comprehensive Logistics Service Co., Ltd. 2021/3/18 8,250.00 2021/6/8 456.00 Joint liability
guarantee None None 2021/06/08-2022/06/30 No No
SF-Express(Ningxia)Co.,Ltd 2021/3/18 100.00 2021/6/9 0.50 Joint liability
guarantee None None 2021/06/09-2021/12/31 No No
S.F. Express Co., Ltd. 2021/3/18 2,000.00 2021/6/1 100.00 Joint liability
guarantee None None 2021/06/01-2022/04/30 No No
Zhanjiang S.F. Express Co., Ltd. 2021/3/18 1,000.00 2021/6/4 54.56 Joint liability
guarantee None None 2021/06/04-2022/05/13 No No
FS TECHNOLOGY MACAU CO.,LTD. 2021/3/18 70.00 2021/6/7 19.39 Joint liability
guarantee None None 2021/06/07-2021/12/31 No No
Anhui S.F. Express Co., Ltd. 2021/3/18 7,500.00 2021/6/11 59.72 Joint liability
guarantee None None 2021/06/11-2022/08/31 No No
DHL LOGISTICS(CHINA) CO.,LTD. 2021/3/18 1,600.00 2021/6/11 78.38 Joint liability
guarantee None None 2021/06/11-2022/05/10 No No
Jiangsu Shunhefeng Freight Co., Ltd. 2021/3/18 3,000.00 2021/6/11 295.84 Joint liability
guarantee None None 2021/06/11-2022/05/25 No No
Shanghai Shuncheng Logistics Co., Ltd. 2021/3/18 1,200.00 2021/6/11 380.00 Joint liability
guarantee None None 2021/06/11-2022/05/31 No No
Shanghai Shunheng Logistics Co., Ltd. 2021/3/18 5,000.00 2021/6/11 66.51 Joint liability
guarantee None None 2021/06/11-2022/05/31 No No
S.F.Express(Dong Guan)Limited 2021/3/18 2,500.00 2021/6/11 459.47 Joint liability
guarantee None None 2021/06/11-2022/08/31 No No
EXEL Technology Solution (Shanghai) Co., Ltd. 2021/3/18 3,000.00 2021/6/11 530.03 Joint liability
guarantee None None 2021/06/11-2021/10/31 No No
DSC Logistics (Beijing) Co., Ltd note1 2021/3/18 5,700.00 2021/6/11 57.25 Joint liability
guarantee None None 2021/06/11-2021/07/31 No No
Guangdong S.F. E-commerce Co., Ltd. 2021/3/18 14,000.00 2021/6/11 200.00 Joint liability
guarantee None None 2021/06/11-2022/05/31 No No
Hubei S.F. Transportation Co., Ltd. 2021/3/18 1,000.00 2021/6/9 323.29 Joint liability
guarantee None None 2021/06/09-2022/05/09 No No
Jiangsu S.F. Express Co., Ltd. 2021/3/18 1,000.00 2021/6/11 60.35 Joint liability
guarantee None None 2021/06/11-2022/08/31 No No
Anhui S.F. Express Co., Ltd. 2021/3/18 7,500.00 2021/6/17 99.37 Joint liability
guarantee None None 2021/06/17-2022/05/31 No No
Anhui Shunhe Freight Co., Ltd. 2021/3/18 5,500.00 2021/6/17 45.17 Joint liability
guarantee None None 2021/06/17-2022/06/09 No No
Beijing S.F. Express Co., LTD. 2021/3/18 2,000.00 2021/6/17 172.87 Joint liability
guarantee None None 2021/06/17-2022/06/09 No No
DSC Logistics (Beijing) Co., Ltd note1 2021/3/18 5,700.00 2021/6/17 82.28 Joint liability None None 2021/06/17-2022/05/31 No No

S.F. Holding Co., Ltd. 2021 Semi-Annual Report
123
guarantee
Guangxi ShunFeng Express Co.,Ltd. 2021/3/18 500.00 2021/6/17 200.00 Joint liability
guarantee None None 2021/06/17-2022/01/31 No No
DHL LOGISTICS(CHINA) CO.,LTD. 2021/3/18 1,600.00 2021/6/15 76.73 Joint liability
guarantee None None 2021/06/15-2022/05/23 No No
Henan Huihai Logistics Co., Ltd. 2021/3/18 500.00 2021/6/17 26.00 Joint liability
guarantee None None 2021/06/17-2022/06/09 No No
Jiangsu Shunhefeng Freight Co., Ltd. 2021/3/18 3,000.00 2021/6/17 91.63 Joint liability
guarantee None None 2021/06/17-2022/06/05 No No
Xiamen Fengyutai Industrial Park Management Co., Ltd. 2021/3/18 1,000.00 2021/6/18 738.41 Joint liability
guarantee None None 2021/06/18-2021/12/11 No No
Shenzhen Fengyi Technology Co., Ltd. 2021/3/18 20,000.00 2021/6/17 700.00 Joint liability
guarantee None None 2021/06/17-2022/03/26 No No
Shenzhen Fengyi Technology Co., Ltd. 2021/3/18 20,000.00 2021/6/17 100.00 Joint liability
guarantee None None 2021/06/17-2022/06/09 No No
SF Airlines Company Limited 2021/3/18 72,000.00 2021/6/17 96.96 Joint liability
guarantee None None 2021/06/17-2021/12/31 No No
Jiangsu Shunhefeng Freight Co., Ltd. 2021/3/18 3,000.00 2021/6/18 46.59 Joint liability
guarantee None None 2021/06/18-2022/05/31 No No
Jiangsu Shunhefeng Freight Co., Ltd. 2021/3/18 3,000.00 2021/6/18 692.81 Joint liability
guarantee None None 2021/06/18-2022/06/05 No No
Jinhua S.F. Express Co., Ltd. 2021/3/18 100.00 2021/6/18 5.00 Joint liability
guarantee None None 2021/06/18-2022/04/30 No No
Liaoning Shunhe Supply Chain Management Co., Ltd. 2021/3/18 700.00 2021/6/18 7.00 Joint liability
guarantee None None 2021/06/18-2022/04/30 No No
Shandong S.F. Express Co., Ltd. 2021/3/18 1,500.00 2021/6/18 31.58 Joint liability
guarantee None None 2021/06/18-2022/06/09 No No
Shandong S.F. Express Co., Ltd. 2021/3/18 1,500.00 2021/6/18 94.74 Joint liability
guarantee None None 2021/06/18-2022/06/09 No No
Shenzhen Shuncheng Supply Chain Service Co., Ltd. 2021/3/18 1,000.00 2021/6/18 64.17 Joint liability
guarantee None None 2021/06/18-2021/11/30 No No
S.F.EXPRESS (TIANJIN) CO., LTD. 2021/3/18 300.00 2021/6/18 50.00 Joint liability
guarantee None None 2021/06/18-2021/12/31 No No
Jiangsu S.F. Express Co., Ltd. 2021/3/18 1,000.00 2021/6/25 9.57 Joint liability
guarantee None None 2021/06/25-2022/06/22 No No
Jiangsu Shunhefeng Freight Co., Ltd. 2021/3/18 3,000.00 2021/6/21 74.85 Joint liability
guarantee None None 2021/06/21-2022/06/05 No No
Jiangxi S.F. Express Co., Ltd. 2021/3/18 500.00 2021/6/21 223.43 Joint liability
guarantee None None 2021/06/21-2022/10/13 No No
Liaoning Shunlu Logistics Co., Ltd. 2021/3/18 1,000.00 2021/6/25 172.09 Joint liability
guarantee None None 2021/06/25-2022/06/12 No No

S.F. Holding Co., Ltd. 2021 Semi-Annual Report
124
Shanghai Shunheng Logistics Co., Ltd. 2021/3/18 5,000.00 2021/6/25 185.02 Joint liability
guarantee None None 2021/06/25-2022/01/31 No No
SF Airlines Company Limited 2021/3/18 72,000.00 2021/6/11 96.96 Joint liability
guarantee None None 2021/06/11-2021/12/31 No No
Shenzhen Shuncheng Supply Chain Service Co., Ltd. 2021/3/18 1,000.00 2021/6/21 14.54 Joint liability
guarantee None None 2021/06/21-2022/06/09 No No
SF Airlines Company Limited 2021/3/18 72,000.00 2021/6/25 67.45 Joint liability
guarantee None None 2021/06/25-2022/06/15 No No
SF Airlines Company Limited 2021/3/18 72,000.00 2021/6/25 25.21 Joint liability
guarantee None None 2021/06/25-2022/04/30 No No
S.F. Express Co., Ltd. 2021/3/18 2,000.00 2021/6/25 200.00 Joint liability
guarantee None None 2021/06/25-2021/12/31 No No
Suzhou Industrial Park S.F. Express Co., Ltd. 2021/3/18 2,500.00 2021/6/21 400.64 Joint liability
guarantee None None 2021/06/21-2022/06/09 No No
Chongqing SF Zhida Supply Chain Management Co., Ltd. 2021/3/18 400.00 2021/6/21 70.11 Joint liability
guarantee None None 2021/06/21-2022/07/31 No No
DSC Logistics (Beijing) Co., Ltd note1 2021/3/18 5,700.00 2021/6/21 15.00 Joint liability
guarantee None None 2021/06/21-2022/06/28 No No
S.F.EXPRESS OF DALIAN L.T.D 2021/3/18 500.00 2021/6/30 79.58 Joint liability
guarantee None None 2021/06/30-2021/08/13 No No
SF Airlines Company Limited 2021/3/18 72,000.00 2021/4/23 11.63 Joint liability
guarantee None None 2021/04/23-2022/04/15 No No
HAVI Logistics (Dongguan) Co., Ltd. 2021/3/18 4,500.00 2021/4/16 3,750.00 Joint liability
guarantee None None 2021/4/16-2026/4/16 No No
SF Fengtai Industrial Park Holdings Limited 2021/3/18 550,100.00 2021/4/29 495,818.52 Joint liability
guarantee None None 2021/4/29-2066/1/20 No No
S.F. EXPRESS (CHINA) LIMITED 2021/3/18 25,000.00 2021/5/1 7,779.52 Joint liability
guarantee None None 2021/5/1-2029/4/30 No No
S.F. EXPRESS (HONG KONG) LIMITED 2021/3/18 25,000.00 2021/5/1 7,520.31 Joint liability
guarantee None None 2021/5/1-2029/4/30 No No
Foshan S.F. Express Co., Ltd. 2021/3/18 10,700.00 2021/5/1 5,171.88 Joint liability
guarantee None None 2021/5/1-2029/4/30 No No
Anhui Shunhe Freight Co., Ltd. 2021/3/18 5,500.00 2021/5/1 864.06 Joint liability
guarantee None None 2021/5/1-2029/4/30 No No
Anhui S.F. Express Co., Ltd. 2021/3/18 7,500.00 2021/5/1 1,069.63 Joint liability
guarantee None None 2021/5/1-2029/4/30 No No
Wuhu Fengtai E-commerce Industrial Park Management Co., Ltd. 2021/3/18 10,100.00 2021/4/25 10,000.00 Joint liability
guarantee
Foshan Project Real
Estate
None 2021/4/25-2026/4/22 No No
Total guarantee quota approved for subsidiaries during the reporting
period (C1) 2,685,000.00
Total actual amount of guarantees for
subsidiaries during the reporting period (C2) 574,174.58

S.F. Holding Co., Ltd. 2021 Semi-Annual Report
125
Total guarantee quota approved for the subsidiaries at the end of the
reporting period (C3) 2,797,753.68
Total actual guarantee balance for subsidiaries
at the end of the reporting period (C4) 668,636.06
Total guarantee amount provided by the Company (i.e the total amount of the above three major items)
Total guarantee quota approved during the reporting period
(A1+B1+C1) 6,498,180.00
Total actual amount of guarantee during the
reporting period
(A2+B2+C2)
574,174.58
Total guarantee quota approved at the end of the reporting
period (A3+B3+C3) 7,715,843.68
Total actual guarantee balance at the end of the
reporting period
(A4+B4+C4)
1,456,928.06
Total guarantee amount (A4+B4+C4) to net assets of the Company 25.70%
Of which:
Amount of guarantee for shareholders, actual controller, and their related parties (D) -
Amount of debt guarantee provided for guaranteed party whose asset-liability ratio is not less
than 70% directly or indirectly (E) 563,827.00
Amount of total guarantee over 50% of net assets (F) -
Total amount of the above three guarantees (D+E+F) 563,827.00
Explanation of warranty liability or possible joint liquidation (if any) N/A
Explanation of provision of guarantees for external parties in violation of the prescribed
procedure (if any) N/A
Note 1: "DHL Logistics (Beijing) Co., Ltd.(敦豪物流(北京)有限公司)" was renamed " DSC Logistics (Beijing) Co., Ltd (丰豪物流(北京)有限公司)" on July 22, 2020.

S.F. Holding Co., Ltd. 2021 Semi-Annual Report
126
3. Entrusted funds
√ Applicable □ Not applicable
Unit: RMB10 thousands
Type Funding Source for
Entrusted Funds
Maximum Daily
Balance of Such
Entrusted Funds
During the
Reporting Period
Unexpired
Balance
Overdue
Outstanding
Amount
Impairment
Provision of
Overdue
Outstanding Funds
Bank wealth
management products Self-owned fund 1,729,000.00 999,000.00 - -
Total 1,729,000.00 999,000.00 - -
Details of individual items with significant amount or of low safety, poor liquidity, or without principal guarantee high risk wealth
management products
□ Applicable √ Not applicable
The entrusted funds is expected to fail to recover the principal, or there may be other circumstances that may result in impairment.
□ Applicable √ Not applicable
4. Significant contracts relevant to routine operations
□ Applicable √ Not applicable
5. Other significant contracts
□ Applicable √ Not applicable
No other significant contracts in the reporting period.
XIII. Other Major Issues
√ Applicable □ Not applicable
1. Non-public stock offering for 2021
According to the development strategies of the Company, at the 11th meeting of the 5th session of the Board of Directors, the
11th meeting of the 5th session of the Board of Supervisors and the 2021 second extraordinary general meeting convened by the
Company on February 8, 2021 and March 2, 2021 respectively, the resolution regarding the non-public stock offering of A-share was
reviewed and approved, and the Company intended to launch a non-public stock offering, with the aim of raising up to RMB22
billion in funds, which will be used for express delivery equipment automation and upgrades, the construction of the Ezhou airport
transshipment centre project in Hubei, the construction of digital intelligent supply chain system solutions, land transportation
capacity improvements, aviation material purchase and maintenance projects, and supplement of working capital.
In accordance with the relevant laws, regulations and regulatory documents and relevant regulatory requirements, combined
with the actual situation of the Company, at the 15th meeting of the 5th session of the Board of Directors and the 14th meeting of the
5th session of the Board of Supervisors convened by the Company on May 13, 2021, the Company adjusted the proposal for 2021
non-public stock offering of A-share, with the maximum total amount of proceeds adjusted from RMB22 billion to RMB20 billion.
On May 31, 2021, the Company's application for this non-public stock offering of A-share was reviewed and approved by the

S.F. Holding Co., Ltd. 2021 Semi-Annual Report
127
Issuance Examination Committee of the China Securities Regulatory Commission(CSRC). So far, the Company has not received any
written approval from the CSRC.
For details, please refer to the Company’s announcements (2021-013, 2021-014, 2021-025, 2021-061, 2021-062, 2021-063,
2021-064, and 2021-076) disclosed on Cninfo.
2. Tender offer to acquire 51.8% equity of Kerry Logistics
In order to further enhance the Company's capability of integrating integrated logistics solutions, improve the strategic layout
of freight forwarding and international business, at the 11th meeting of the 5th session of the Board of Directors, the 16th meeting of
the 5th session of the Board of Directors and the 2021 third extraordinary general meeting convened by the Company on February 8,
May 28, and June 15, 2021 respectively, the resolution regarding tender offer to acquire 51.8% equity of Kerry Logistics was
reviewed and approved, and the Company intended to, through its wholly-owned subsidiary, Flourish Harmony Holdings Company
Limited, subject to the fulfillment or waiver of the conditions precedent, issue tender offers to eligible shareholders and share option
holders of Kerry Logistics Network Limited, a company listed on the Main Board of The Stock Exchange of Hong Kong Limited
(hereinafter referred to as the “HK Stock Exchange”) (stock abbreviation: Kerry Logistics; stock code: 00636.HK), to acquire
931,209,117 shares (approximately 51.8% of the issued share capital or 51.5% of the fully diluted share capital) of Kerry Logistics in
cash, and cancel 51.8% of Kerry Logistics’s share options that had not been exercised as at the final vesting date held by Kerry
Logistics’s share option holders on behalf of Kerry Logistics. If the transaction is successfully completed, Kerry Logistics will still
maintain its listing status on the Main Board of the HK Stock Exchange. This transaction is a cross-border tender offer, On August 9,
2021, all the pre-conditions for this transaction have been fulfilled or waived. On August 12, 2021, the offeror and the target
company jointly sent the comprehensive offer documents. As of now, the transaction has not been closed yet.
For details, please refer to the Company’s announcements (2021-013, 2021-015, 2021-070, 2021-073, 2021-080, 2021-090,
2021-093, 2021-094) disclosed on Cninfo.
3. Setting up a real estate investment trust that is intended to be listed on the HK Stock Exchange
In order to support the sustainable and healthy development of the Company's logistics industrial park, develop innovative
financing channels, and build an asset-light capital operation platform for the industrial park, the Company planned to set up a real
estate investment trust (hereinafter referred to as the “SF REIT”) in Hong Kong and go public on the HK Stock Exchange with the
three properties located in Foshan, Wuhu and Hong Kong within China in respective as its foundation assets which are indirectly held
by the Company through its overseas holding subsidiaries. At the 14th meeting of the 5th session of the Board of Directors convened
by the Company on April 27, 2021, the resolution regarding setting up the SF REIT in Hong Kong and being listed on the Main
Board of the HK Stock Exchange by its holding subsidiaries was reviewed and approved. The Company receieved the approval for
the establishment application and listing application of the SF REIT by the HK SFC and the HK Stock Exchange on May 3, 2021 and
May 14, 2021, respectively. The SF REIT has been listed on the Main Board of the HK Stock Exchange since May 17, 2021, with the
stock code of “2191.HK” and the stock abbreviation of “SF REIT”. After the listing of SF REIT Fund, the Company indirectly holds
35% of its shares through subsidiaries. The Company's transfer of the interests of three property assets to the SF REIT Fund brought
a one-off equity investment income before tax of approximately HK$1.08 billion (equivalent to approximately RMB896 million).
For details, please refer to the Company’s announcements (2021-023, 2021-057, 2021-058, and 2021-066) disclosed on Cninfo.

S.F. Holding Co., Ltd. 2021 Semi-Annual Report
128
4. Intra-city Industrial Spin-off and going public on the Main Board of the HK Stock Exchange
In order to expand the Company's diversified financing channels, at the 16th meeting of the 5th session of the Board of
Directors, the 15th meeting of the 5th session of the Board of Supervisors and the 2021 third extraordinary general meeting convened
by the Company on May 28, 2021 and June 15, 2021 respectively, it was agreed to spin off its subsidiary Hangzhou SF Intra-city
Industrial Co., Ltd. (hereinafter referred to as “Intra-city Industrial”) and go public on the Main Board of the HK Stock Exchange
(hereinafter referred to as the “H-share Issuance”).
The spin-off and listing will build an international capital operation platform for Intra-city Industrial, enhance its brand
awareness and market influence, continue to consolidate and strengthen the core resources of Intra-city Industrial, and promote the
rapid development of its business. At the same time, the spin-off will also help further expand the Company's diversified financing
channels and will become an important milestone in the Company's diversified layout strategy. After the spin-off and listing,
Intra-city Industrial remains the Company’s holding subsidiary, and will not have any material adverse impact on the Company’s
continued operations of other business segments, and will not affect the Company’s independent listing status, which is conducive to
enhancing the Company’s comprehensive competitiveness, and in line with the overall interests of the Company’s shareholders.
Up till now, the H-share Issuance of Intra-city Industrial has been accepted by the CSRC, and Intra-city Industrial has also
submitted application materials for the issuance of H-share to the HK Stock Exchange. The issuance still needs to obtain the approval
from the CSRC, the HK SFC and the HK Stock Exchange.
For details, please refer to the Company’s announcements (2021-070, 2021-071, 2021-072, 2021-080, 2021-084, and 2021-085)
disclosed on Cninfo.
5. Issuance of debt financing products in domestic and international markets by wholly-owned subsidiaries
In order to satisfy the development requirements of domestic and international business, reduce financing costs and optimize
the debt structure according to the development strategies of the Company, at the 11th meeting of the 5th session of Board of
Directors and the 2021 second extraordinary general meeting convened by the Company on February 8, 2021 and March 2, 2021
respectively, the “Resolution regarding the Issuance of Debt Financing Products in Domestic and International Markets by
Wholly-owned Subsidiaries” was reviewed and approved, and the Company was authorised to issue debt financing products in
domestic and international markets through Taisen Holding and SF Holding Investment 2021 Limited (“SFHI 2021”), the
wholly-owned subsidiaries, for an equivalent amount of no more than RMB20 billion (inclusive), including RMB18 billion which are
the expected size of issuance in international market.
According to the Notice of Acceptance for Registration issued by NAFMII (Zhong Shi Xie Zhu [2019] SCP No.71), Taisen
Holding completed altogether two issuances of Super Short-Term Commercial Paper on March 18, 2021 and March 19, 2021
respectively, each with an issuance quota of RMB500 million.
According to the Approval of the Issuance of Corporate Bonds to Qualified Investors via a Public Offering by Shenzhen S.F.
Taisen Holding (Group) Co., Ltd. (Zheng Jian Xu Ke [2019] No. 388) from the CSRC, from April 23, 2021 to April 26, 2021, Taisen
Holding completed the 2021 public offering of green corporate bonds (first tranche) (specially used for carbon neutrality), with an
issuance scale of RMB500 million.

S.F. Holding Co., Ltd. 2021 Semi-Annual Report
129
According to the Approval of the Issuance of Short–Trerm Corporate Bonds to Professional Investors via a Public Offering by
Shenzhen S.F. Taisen Holding (Group) Co., Ltd. (Zheng Jian Xu Ke [2020] No. 1964) from the CSRC, from May 20, 2021 to May 21,
2021, Taisen Holding completed the 2021 public offering of short–trerm corporate bonds (first tranche), with an issuance scale of
RMB1 billion; and from June 3, 2021 to June 4, 2021, Taisen Holding completed the 2021 public offering of short–trerm corporate
bonds (second tranche), with an issuance scale of RMB500 million.
For details, please refer to the Company’s announcements (2021-013, 2021-017, 2021-025, 2021-042, 2021-043, 2021-056,
2021-068, and 2021-078) disclosed on Cninfo.
6. Our subsidiaries' participation in investment in equity investment funds and the progress
With a view to promoting the Company’s long-term development and ensuring positive interactions between industrial and
capital operations, Shenzhen Shunfeng Investment Co., Ltd. (hereinafter referred to as “Shunfeng Investment”), the Company’s
wholly-owned subsidiary, entered into the Limited Partnership Agreement on Jinfeng Borun (Xiamen) Equity Investment Partnership
(Limited Partnership) on September 22, 2020. The fund mainly invests in supply chain, logistics and consumption upgrade-related
businesses. Shunfeng Investment plans to subscribe to the shares of the investment fund as a limited partnership for RMB500 million.
On March 25, 2021, the Company received a notice from the fund manager that the investment fund has completed a new round of
fundraising. After the completion of the fundraising, the scale of the investment fund will be RMB1.5 billion, and SF Investment's
subscribed capital contribution will account for 33.33%.
In order to promote the sustainable and healthy development of the Company's logistics industrial park, better support the
development of the main logistics industry's demand for site resources, promote the positive interaction between the Company's
industrial operation and capital management, and enhance the Company's core competitiveness, on April 30, 2021, ShunJie
Investment Limited (hereinafter referred to as "Shunjie Investment"), a subsidiary of the Company, signed a cooperation agreement
with Hammer Capital Real Estate Limited (hereinafter referred to as "HCRE") and other parties. The subsidiary of the Company
plans to jointly establish a logistics development fund with HCRE to invest in logistics properties or project companies holding
logistics properties in China's first-tier and other central cities. The fund's initial delivery subscribed capital contribution target is
expected to be US300 million. The general partnership of the fund is jointly invested by Shunjie Investment and HCRE, each of
which holds 50% of the shares of the GP company. At the same time, the subsidiary of the Company, being a limited partner and a
carried interest partner of the Fund, will subscribe to the fund with a total planned investment of 25% of the fund size. And HCRE’s
affiliated companies or affiliated persons , being limited partners and/or carried interest partners and special limited partners of the
Fund, will subscribe to the fund with a total planned investment of not less than 5% of the fund size.
For details, please refer to the announcements (2021-044, 2021-059) disclosed by the Company on cninfo.
A disclosure index for the above-mentioned significant events and other significant events is as below:
Announcement Disclosure Date Disclosure Website
Announcement of Resolutions of the Eleventh Meeting of the Fifth
Board of Directors (2021-013) 2021/2/10 www.cninfo.com.cn
Announcement of Resolutions of the Eleventh Meeting of the Fifth Board of Supervisors (2021-014)
2021/2/10 www.cninfo.com.cn

S.F. Holding Co., Ltd. 2021 Semi-Annual Report
130
Announcement on the proposed partial tender offer to acquire 51.8% equity of Kerry Logistics (2021-015)
2021/2/10 www.cninfo.com.cn
Announcement on the issuance of debt financing products by
wholly-owned subsidiaries at home and abroad (2021-017) 2021/2/10 www.cninfo.com.cn
Announcement on planning the establishment and listing of real estate
investment trust funds (2021-023) 2021/2/10 www.cninfo.com.cn
Announcement of Resolutions of the Second Extraordinary General
Meeting of Shareholders in 2021 (2021-025) 2021/3/3 www.cninfo.com.cn
Announcement on the issuance results of the first phase of
ultra-short-term financing bonds for 2021, a wholly-owned subsidiary of Shenzhen SF Tyson Holdings (Group) Co., Ltd. (2021-042)
2021/3/20 www.cninfo.com.cn
Announcement on the issuance results of the second phase of
ultra-short-term financing bonds in 2021, the wholly-owned subsidiary Shenzhen SF Tyson Holdings (Group) Co., Ltd. (2021-043)
2021/3/23 www.cninfo.com.cn
Announcement on the progress of wholly-owned subsidiaries'
participation in investment in equity investment funds (2021-044) 2021/3/26 www.cninfo.com.cn
Announcement on the acceptance of applications for non-public
offering of stocks by the China Securities Regulatory Commission (2021-045)
2021/3/27 www.cninfo.com.cn
Announcement on the receipt of the "Notice of Feedback on One-time
Review of Administrative License Projects of the China Securities
Regulatory Commission" (2021-050)
2021/4/12 www.cninfo.com.cn
Announcement on the issuance results of the wholly-owned
subsidiary Shenzhen SF Tyson Holdings (Group) Co., Ltd. for the
public issuance of green corporate bonds to qualified investors in 2021 (Phase 1) (special use for carbon neutrality) (2021-056)
2021/4/27 www.cninfo.com.cn
Announcement of Resolutions of the Fourteenth Meeting of the Fifth
Session of the Board of Directors (2021-057) 2021/4/29 www.cninfo.com.cn
Announcement on the establishment of real estate investment trust
funds by holding subsidiaries and listing on the main board of the
Hong Kong Stock Exchange (2021-058)
2021/4/29 www.cninfo.com.cn
Announcement on the participation of the Company's subsidiaries in
the establishment of a logistics development fund (2021-059) 2021/4/30 www.cninfo.com.cn
Announcement of Resolutions of the Fifteenth Meeting of the Fifth
Session of the Board of Directors (2021-061) 2021/5/14 www.cninfo.com.cn
Announcement of Resolutions of the Fourteenth Meeting of the Fifth
Board of Supervisors (2021-062) 2021/5/14 www.cninfo.com.cn
Announcement on Adjusting the 2021 Non-public Issuance of A
Shares Plan (2021-063) 2021/5/14 www.cninfo.com.cn
Announcement on the revision of the plan for non-public issuance of
A shares (2021-064) 2021/5/14 www.cninfo.com.cn
Announcement on the progress of the establishment of real estate
investment trust funds by holding subsidiaries and listing on the main
board of the Hong Kong Stock Exchange (2021-066)
2021/5/19 www.cninfo.com.cn
Announcement on the issuance results of the public offering of
short-term corporate bonds (Phase 1) by Shenzhen SF Tyson Holdings
(Group) Co., Ltd., a wholly-owned subsidiary of Shenzhen SF Tyson
Holdings (Group) Co., Ltd. to professional investors in 2021 (2021-068)
2021/5/22 www.cninfo.com.cn
Announcement of Resolutions of the Sixteenth Meeting of the Fifth
Session of the Board of Directors (2021-070) 2021/5/29 www.cninfo.com.cn
Announcement of Resolutions of the Fifteenth Meeting of the Fifth
Board of Supervisors (2021-071) 2021/5/29 www.cninfo.com.cn

S.F. Holding Co., Ltd. 2021 Semi-Annual Report
131
Announcement on the spin-off of its holding subsidiary, Tongcheng
Industrial, and its listing on the main board of the Hong Kong Stock
Exchange (2021-072)
2021/5/29 www.cninfo.com.cn
Announcement on the proposed partial tender offer to acquire 51.8%
equity of Kerry Logistics (2021-073) 2021/5/29 www.cninfo.com.cn
Announcement on the application for non-public issuance of A shares
approved by the Issuance Review Committee of the China Securities
Regulatory Commission (2021-076)
2021/6/1 www.cninfo.com.cn
Announcement on the issuance results of the public offering of
short-term corporate bonds (Phase 2) by Shenzhen SF Tyson Holdings
(Group) Co., Ltd., a wholly-owned subsidiary, to professional
investors in 2021 (2021-078)
2021/6/5 www.cninfo.com.cn
Announcement of Resolutions of the Third Extraordinary General
Meeting of Shareholders in 2021 (2021-080) 2021/6/16 www.cninfo.com.cn
Announcement on the acceptance of application materials for
overseas initial public issuance of shares by holding subsidiaries by
the China Securities Regulatory Commission (2021-084)
2021/6/24 www.cninfo.com.cn
Announcement on the submission of an overseas initial public
offering and listing application by a holding subsidiary to The Stock Exchange of Hong Kong Limited (2021-085)
2021/7/1 www.cninfo.com.cn
Announcement on progress of the proposed partial tender offer to
acquire 51.8% equity of Kerry Logistics (2021-090) 2021/8/3 www.cninfo.com.cn
Announcement on progress of the proposed partial tender offer to
acquire 51.8% equity of Kerry Logistics (2021-093) 2021/8/10 www.cninfo.com.cn
Announcement on progress of the proposed partial tender offer to acquire 51.8% equity of Kerry Logistics (2021-094)
2021/8/12 www.cninfo.com.cn
XIV. Significant Events of Subsidiaries
□ Applicable √ Not applicable

S.F. Holding Co., Ltd. 2021 Semi-Annual Report
132
Chapter 7 Share Changes & Shareholder Details I. Changes in Shares
Ⅰ. Issuance and Listing of Securities
1. Changes in Shares
Unit: number of shares
Before this change Increase or decrease of this change (+,-) After this change
Number Percentage
Issuance
of new shares
Bonus shares
Convers
ion of
provident funds
to
shares
Other Subtotal Number Percentage
I. Restricted shares 66,127,382 1.45% - - - -13,204,386 -13,204,386 52,922,996 1.16%
1. State shareholding - - - - - - - - -
2. State-owned legal
person holdings
- - - - - - - - -
3. Other domestic shares 66,127,382 1.45% - - - -13,204,386 -13,204,386 52,922,996 1.16%
Including: Domestic legal
person holdings
- - - - - - - - -
Domestic natural
person holdings 66,127,382 1.45%
- - - -13,204,386 -13,204,386 52,922,996 1.16%
4. Foreign holdings - - - - - - - - -
Including: Foreign legal
person holdings
- - - - - - - - -
Foreign natural
person holdings
- - - - - - - - -
II. Unrestricted shares 4,490,313,073 98.55% - - - 13,204,386 13,204,386 4,503,517,459 98.84%
1. RMB ordinary shares 4,490,313,073 98.55% - - - 13,204,386 13,204,386 4,503,517,459 98.84%
III. Total number of shares 4,556,440,455 100.00% - - - - - 4,556,440,455 100.00%
Note: Any discrepancy between the mantissas of the subtotals and the sums of the added numbers in the above table is due to
rounding.
Reasons for changes in shares
□ Applicable √ Not applicable
Approval of changes in shares
□ Applicable √ Not applicable
Transfer of changes in shares
□ Applicable √ Not applicable
Progress in the implementation of share repurchase
□ Applicable √ Not applicable
Progress in the implementation of the centralized bidding method to reduce holding of repurchased shares
□ Applicable √ Not applicable
The impact of changes in shares on financial indicators such as basic earnings per share and diluted earnings per share, net assets per
share attributable to the common shareholders of the Company in the most recent year / period
□ Applicable √ Not applicable
Other content that the Company deems necessary or required by the securities regulatory agency to disclose
□ Applicable √ Not applicable

S.F. Holding Co., Ltd. 2021 Semi-Annual Report
133
2. Changes in restricted shares
√ Applicable □ Not applicable
Unit: number of shares
Name of
shareholder
Restricted shares
at the beginning of the period
Number of
restricted
shares
removed in
the period
Number of
restricted
shares
increased
in the
period
Restricted
shares at the end of the period
Restricted sales reasons Date of restricted sales
removal
Liu Jilu 65,617,221 13,204,386 - 52,412,835 lock-up shares for senior
managers
13,204,386 lock-up
shares of senior
managers were
unlocked at the beginning of 2021
Yuan Fuxiang 510,161 - - 510,161 restricted shares for IPO -
Total 66,127,382 13,204,386 - 52,922,996 -- --
Ⅱ. Issuance and Listing of Securities
□ Applicable √ Not applicable
III. Total number of shareholders and their holdings
Unit: number of shares
Total number of ordinary
shareholders at the end of reporting period
286,001
Total number of preferred shareholders with
voting rights restored (if any) at the end of reporting period
0
Ordinary shareholders holding more than 5% of shares or shares of the top 10 ordinary shareholders
Name of shareholder Type of
shareholder
Sharehold
ing percentag
e
Number of ordinary shares
held at the end
of the reporting period
Increase or
decrease of shares during reporting
period
Number of
restricted ordinary
shares held
Number of
non-restricted ordinary shares
held
Pledged, marked or frozen shares
Status of
shares Amount
Shenzhen Mingde
Holding Development Co., Ltd.
Domestic
non-state-
owned
legal person
59.30% 2,701,927,139 - - 2,701,927,139 Pledged 919,000,000
Shenzhen Zhaoguang
Investment Co., Ltd.
State-own
ed legal
person
4.79% 218,304,300 -48,333,246 - 218,304,300 Pledged 68,478,354
Hong Kong Securities
Clearing Company Ltd.
Overseas
legal person
4.17% 189,975,416 47,839,397 - 189,975,416 -
-
Ningbo Shunda
Fengrun Venture
Capital Partnership (Limited Partnership)
Domestic
non-state-
owned
legal
person
2.45% 111,590,807 -26,637,697 - - Pledged 19,648,802
Liu Jilu
Domestic
natural person
1.53% 69,883,780 - 52,412,835 17,470,945 Pledged 3,300,000
Suzhou Industrial
Park Oriza Shunfeng
Equity Investment
Company (Limited
Domestic
non-state-
owned
legal
1.11% 50,727,645 -15,049,350 - 50,727,645 - -

S.F. Holding Co., Ltd. 2021 Semi-Annual Report
134
Partnership) person
Norges Bank – Own
Funds
Overseas
legal person
0.62% 28,060,869 6,604,721 - 28,060,869 - -
CAISSE DE DÉPÔT
ET PLACEMENT DU
QUÉBEC
Other
0.47% 21,433,047 8,686,870 - 21,433,047 - -
China CITIC Bank
Co., Ltd.-BOCOM
Schroder New Vitality
Flexible Allocation of
Mixed Securities
Investment Fund
Other
0.32% 14,602,198 -2,875,261 - 14,602,198 - -
China Resources
Shenguotou Trust Co.,
Ltd. – China
Resources
Trusts•Springs
Balance No. 5
Collective Fund Trust Plan
Other
0.30% 13,777,262 10,792,745 - 13,777,262 - -
Strategic investor or general legal person becomes the top
10 ordinary shareholder due to the placement of new shares
(if any)
N/A
Explain any associated relationship and/or persons acting in concert between the above-mentioned shareholders
The Company is not aware of whether there is an associated
relationship between the above mentioned shareholders and whether
they are acting in concert.
Explain entrusting/being entrusted voting rights or waiving
voting rights of the above-mentioned shareholders N/A
Explain DPM repurchase for the top 10 shareholders (if
any) N/A
Top 10 ordinary shareholders holding unrestricted shares
Name of shareholder
Number of unrestricted ordinary
shares held at the end of the
reporting period
Type of shares
Type of shares Quantity
Shenzhen Mingde Holding Development Co., Ltd. 2,701,927,139 RMB-denominated
ordinary shares 2,701,927,139
Shenzhen Zhaoguang Investment Co., Ltd. 218,304,300 RMB-denominated
ordinary shares 218,304,300
Hong Kong Securities Clearing Company Ltd. 189,975,416 RMB-denominated
ordinary shares 189,975,416
Ningbo Shunda Fengrun Venture Capital Partnership (Limited Partnership)
111,590,807 RMB-denominated
ordinary shares 111,590,807
Suzhou Industrial Park Oriza Shunfeng Equity Investment Company (Limited Partnership)
50,727,645 RMB-denominated
ordinary shares 50,727,645
Norges Bank–Own Funds 28,060,869 RMB-denominated
ordinary shares 28,060,869
CAISSE DE DÉPÔT ET PLACEMENT DU QUÉBEC 21,433,047
RMB-denominated ordinary shares
21,433,047
Liu Jilu 17,470,945
RMB-denominated
ordinary shares 17,470,945
China CITIC Bank Co., Ltd.-BOCOM Schroder New
Vitality Flexible Allocation of Mixed Securities Investment Fund
14,602,198 RMB-denominated
ordinary shares 14,602,198
China Resources Shenguotou Trust Co., Ltd. – China
Resources Trusts•Springs Balance No. 5 Collective Fund Trust Plan
13,777,262 RMB-denominated
ordinary shares 13,777,262

S.F. Holding Co., Ltd. 2021 Semi-Annual Report
135
Explain any associated relationship or persons acting in concert between the top 10
non-restricted ordinary shareholders and between the top 10 non-restricted ordinary
shareholders and the top 10 ordinary shareholders
The Company is not aware of
whether there is an associated
relationship between the
above-mentioned shareholders and whether they are acting in concert.
Explain the top 10 ordinary shareholders’ participation in margin financing (if any) N/A
Did any of the top 10 ordinary shareholders or the top 10 non-restricted ordinary shareholders of the Company conduct any
promissory repurchase during the reporting period?
□Yes √ No
No such cases in the reporting period.
IV. Changes in shares held by directors, supervisors and senior managers
□ Applicable √ Not applicable
The Company’s directors, supervisors and senior managers did not change during the reporting period. For details, please refer to the
2020 Annual Report.
V. Change of controlling shareholder or actual controller
Change of controlling shareholder in the reporting period
□ Applicable √ Not applicable Controlling shareholder did not change during the reporting period.
Change of actual controller during the reporting period
□ Applicable √ Not applicable
The actual controller did not change during the reporting period.

S.F. Holding Co., Ltd. 2021 Semi-Annual Report
136
Chapter 8 Preferred Shares
□ Applicable √ Not applicable
No such cases in the reporting period.

S.F. Holding Co., Ltd. 2021 Semi-Annual Report
137
Chapter 9 Bonds
□ Applicable √ Not applicable

.F. Holding Co., Ltd. 2021 Semi-Annual Report
138
Chapter 10 Financial Statements
[English Translation for Reference Only]
Review Report
PwC ZT Yue Zi (2021) No. 0029
To the shareholders of S.F. Holding Co., Ltd., We have reviewed the accompanying interim financial statements of S.F. Holding Co., Ltd. (hereinafter “S.F. Holding”), which comprise the consolidated and company balance sheets as at 30 June 2021, the consolidated and company income statements, the consolidated and company statements of changes in equity and the consolidated and company cash flow statements for the six-month period then ended, and the notes to the interim financial statements. Management of S.F. Holding is responsible for the preparation of these interim financial statements in accordance with the requirements of the Accounting Standards for Business Enterprises. Our responsibility is to issue a review report on these interim financial statements based on our review. We conducted our review in accordance with China Standards on Review Engagement No. 2101, “Review of Financial Statements”. These standards require that we plan and perform the review to obtain limited assurance as to whether the interim financial statements are free of material misstatement. A review is limited primarily to inquiries of company personnel and analytical procedures applied to financial data and thus provides less assurance than an audit. We have not performed an audit and, accordingly, we do not express an audit opinion. Based on our review, nothing has come to our attention that causes us to believe that the interim financial statements are not prepared in accordance with the Accounting Standards for Business Enterprises or do not present fairly, in all material respects, the consolidated and company’s financial position of S.F. Holding as at 30 June 2021, and their financial performance and cash flows for the period then ended. PricewaterhouseCoopers Zhong Tian LLP Shanghai, the People’s Republic of China 20 August 2021
Signing CPA
Signing CPA
—————————————
Chen Anqiang (Engagement Partner)
———————— Liu Jingping

139
S.F. HOLDING CO., LTD. CONSOLIDATED BALANCE SHEET AS AT 30 JUNE 2021 (All amounts in RMB Yuan unless otherwise stated) [English translation for reference only]
ASSETS Note 30 June 2021
31 December 2020
Consolidated Consolidated
Current assets
Cash at bank and on hand 4(1) 16,862,359,321.83 16,417,891,707.19
Financial assets held for trading 4(2) 10,024,418,773.30 6,276,922,669.69
Notes receivable 159,414,841.49 166,476,628.34
Accounts receivable 4(3) 18,603,262,202.89 16,849,064,250.79
Advances to suppliers 4(4) 2,310,290,874.56 3,176,518,926.99
Factoring receivables 4(5) 141,731.44 309,932.28
Loans and advances 4(6) 37,862,307.56 60,917,899.18
Other receivables 4(7) 2,621,280,338.67 2,493,564,401.11
Inventories 4(8) 981,610,149.77 986,950,595.04
Contract assets 4(9) 375,776,993.91 399,035,179.94
Current portion of non-current assets 4(11) 253,525,731.69 156,240,777.09
Other current assets 4(10) 5,861,061,750.50 4,693,077,389.66
Total current assets 58,091,005,017.61 51,676,970,357.30
Non-current assets
Long-term receivables 4(11) 711,149,218.75 607,103,640.21
Long-term equity investments 4(12) 5,075,968,100.17 3,647,231,277.90
Investments in other equity instruments 4(13) 4,455,155,248.78 5,027,489,054.30
Other non-current financial assets 4(14) 846,820,269.97 831,526,041.08
Investment properties 4(15) 1,430,515,368.05 2,219,404,821.35
Fixed assets 4(16) 22,740,388,614.84 22,356,651,754.60
Construction in progress 4(17) 6,521,949,882.48 5,379,854,462.06
Right-of-use assets 4(18) 13,374,738,542.41 --
Intangible assets 4(19) 9,896,036,364.07 10,633,114,090.26
Capitalised development expenditures 4(20) 585,909,976.65 540,903,450.14
Goodwill 4(21) 3,359,112,287.60 3,377,141,391.71
Long-term prepaid expenses 4(22) 1,956,684,942.83 1,860,736,934.89
Deferred tax assets 4(40) 1,776,170,609.17 1,539,267,775.98
Other non-current assets 4(23) 2,571,453,726.19 1,462,647,209.19
Total non-current assets 75,302,053,151.96 59,483,071,903.67
TOTAL ASSETS 133,393,058,169.57 111,160,042,260.97

140
S.F. HOLDING CO., LTD. CONSOLIDATED BALANCE SHEET (CONT’D) AS AT 30 JUNE 2021 (All amounts in RMB Yuan unless otherwise stated) [English translation for reference only]
LIABILITIES AND EQUITY Note 30 June 2021
31 December 2020 Consolidated Consolidated Current liabilities
Short-term borrowings 4(25) 15,018,583,357.05 7,996,570,312.73 Deposits from customers 2,925,182.37 3,654,785.86 Financial liabilities held for trading 23,703,392.07 22,155,013.53 Accounts payable 4(26) 15,896,242,092.03 15,484,940,351.95 Advances from customers 4(27) 24,032,178.00 27,575,669.47 Contract liabilities 4(28) 1,816,741,934.15 1,539,264,096.14 Employee benefits payable 4(29) 3,259,281,586.74 4,310,829,146.80 Taxes payable 4(30) 1,375,056,805.45 1,855,263,509.24 Other payables 4(31) 7,581,186,251.15 7,530,793,784.24 Current portion of non-current liabilities 4(32) 7,727,706,661.82 2,945,350,894.28 Other current liabilities 4(33) 2,138,161,857.86 92,355,845.77
Total current liabilities 54,863,621,298.69 41,808,753,410.01
Non-current liabilities
Long-term borrowings 4(34) 1,758,386,807.78 1,865,820,266.05 Debentures payable 4(35) 8,860,323,061.45 8,425,430,468.77 Lease liabilities 4(36) 8,140,284,965.55 -- Long-term payables 4(37) - 10,201,626.90 Long-term employee benefits payable 4(38) 191,906,251.48 145,540,226.93 Deferred income 4(39) 594,877,637.91 414,736,204.81 Deferred tax liabilities 4(40) 1,638,070,232.93 1,687,605,941.56 Provisions 39,799,250.63 42,253,056.91
Total non-current liabilities 21,223,648,207.73 12,591,587,791.93
Total liabilities 76,087,269,506.42 54,400,341,201.94
Equity
Share capital 4(41) 4,556,440,455.00 4,556,440,455.00 Capital reserve 4(42) 25,549,775,675.75 24,405,217,286.50 Less: Treasury stock 4(43) (394,992,892.71) (394,992,892.71) Other comprehensive income 4(64) 864,517,815.45 1,143,969,091.52 General risk reserve 283,083,184.04 279,142,491.29 Surplus reserve 4(45) 745,043,348.45 745,043,348.45 Retained earnings 4(46) 25,077,355,183.06 25,708,230,458.34
Total equity attributable to shareholders of the Company 56,681,222,769.04 56,443,050,238.39
Minority interests 4(47) 624,565,894.11 316,650,820.64
Total equity 57,305,788,663.15 56,759,701,059.03
TOTAL LIABILITIES AND EQUITY 133,393,058,169.57 111,160,042,260.97
The accompanying notes form an integral part of these financial statements.
Legal representative: Wang Wei Principal in charge of accounting: Chen Fei Head of
accounting department: Hu Xiaofei

141
S.F. HOLDING CO., LTD. COMPANY BALANCE SHEET AS AT 30 JUNE 2021 (All amounts in RMB Yuan unless otherwise stated) [English translation for reference only]
ASSETS Note 30 June 2021 31 December 2020 Company Company
Current assets Cash at bank and on hand 17(1) 56,435,522.39 58,098,498.15 Financial assets held for trading 250,782,638.89 200,376,712.32 Advances to suppliers 539,201.13 991,345.81 Other receivables 17(2) 5,460,904,966.22 6,960,858,841.98 Other current assets 292,522.37 70,727.68
Total current assets 5,768,954,851.00 7,220,396,125.94
Non-current assets
Long-term receivables 17(3) - 82,496,567.74 Long-term equity investments 17(4) 50,997,087,817.91 50,997,093,513.91 Construction in progress 4,953,207.54 - Right-of-use assets 2,332,731.69 -- Intangible assets 389,268,293.21 396,121,670.15 Long-term prepaid expenses 883,479.39 27,611.60 Other non-current assets 1,319,002.89 -
Total non-current assets 51,395,844,532.63 51,475,739,363.40
TOTAL ASSETS 57,164,799,383.63 58,696,135,489.34

142
S.F. HOLDING CO., LTD. COMPANY BALANCE SHEET (CONT’D) AS AT 30 JUNE 2021 (All amounts in RMB Yuan unless otherwise stated) [English translation for reference only]
LIABILITIES AND EQUITY Note 30 June 2021
31 December 2020 Company Company
Current liabilities
Employee benefits payable 226,666.65 226,666.65 Other payables 6,872,534.23 15,926,205.73 Taxes payable 41,580.00 21,397,863.68
Total current liabilities 7,140,780.88 37,550,736.06
Non-current liabilities
Deferred tax liabilities - 94,178.08 Lease liabilities 2,415,173.65 --
Total non-current liabilities 2,415,173.65 94,178.08
Total liabilities 9,555,954.53 37,644,914.14
Equity
Share capital 4,556,440,455.00 4,556,440,455.00 Capital reserve 52,344,314,626.55 52,344,320,322.55 Less: Treasury stock (394,992,892.71) (394,992,892.71) Surplus reserve 591,998,348.14 591,998,348.14 Retained earnings 57,482,892.12 1,560,724,342.22
Total equity 57,155,243,429.10 58,658,490,575.20
TOTAL LIABILITIES AND EQUITY 57,164,799,383.63 58,696,135,489.34
The accompanying notes form an integral part of these financial statements.
Legal representative: Wang Wei Principal in charge of accounting: Chen Fei Head of
accounting department: Hu Xiaofei

143
S.F. HOLDING CO., LTD. CONSOLIDATED AND COMPANY INCOME STATEMENTS FOR THE SIX MONTHS ENDED 30 JUNE 2021 (All amounts in RMB Yuan unless otherwise stated) [English translation for reference only]
For the six months ended 30 June
Item Note 2021 2020 2021 2020 Consolidated Consolidated Company Company 1. Revenue 4(48) 88,343,929,823.78 71,129,007,738.21 - -
Less: Cost of revenue 4(48) (79,421,353,588.40) (57,863,128,901.41) - - Taxes and surcharges 4(49) (210,648,900.18) (181,851,687.80) (2,138.00) (152,793.39) Selling and distribution expenses 4(50) (1,310,233,654.15) (1,056,658,701.93) - - General and administrative
expenses 4(51) (6,529,046,289.13) (5,861,443,162.73) (11,066,575.34) (3,945,277.40) Research and development
expenses 4(52) (1,007,216,703.68) (733,339,628.41) (20,525.40) (10,764.93) Financial (costs)/income 4(53) (621,902,222.77) (472,967,469.92) 876,184.52 (92,238,167.70)
Including: Interest expenses (666,601,847.87) (568,057,438.29) (50,551.62) (100,954,908.22) Interest income 93,386,299.49 78,055,138.82 932,196.09 8,727,879.35
Add : Other income 4(55) 716,561,124.08 645,710,052.98 - 24,401.99
Investment income 4(56) 17(5) 1,130,498,743.99 223,418,158.46 2,664,607.92 44,903,960.29
Including: Investment losses from associates and joint ventures (8,751,248.27) (18,447,519.77) - -
Gains arising from changes in fair value 4(57) 29,589,246.28 16,413,953.16 405,926.57 1,716,972.58
Credit impairment losses 4(58) (11,176,161.04) (459,541,101.91) (231.78) - Asset impairment losses 4(59) (592,019.83) (27,469,084.52) - - Losses on disposal of assets 4(60) (14,187,714.91) (9,646,491.49) - -
2. Operating profit/(loss) 1,094,221,684.04 5,348,503,672.69 (7,142,751.51) (49,701,668.56)
Add: Non-operating income 4(61)(a) 125,023,072.59 89,733,785.62 - 4,725,851.13 Less: Non-operating expenses 4(61)(b) (126,095,725.78) (99,473,652.09) - -
3. Total profit/(loss) 1,093,149,030.85 5,338,763,806.22 (7,142,751.51) (44,975,817.43)
Less: Income tax (expenses)/credits 4(62) (677,358,703.20) (1,714,998,647.00) 3,893,110.99 1,723,041.10
4. Net profit/(loss) 415,790,327.65 3,623,765,159.22 (3,249,640.52) (43,252,776.33)
Classified by continuity of operations:
Net profit/(loss) from continuing operations 415,790,327.65 3,623,765,159.22 (3,249,640.52) (43,252,776.33)
Net profit from discontinued operations - - - -
Classified by ownership of the equity: Attributable to shareholders of the
Company 759,921,074.24 3,761,593,296.43 Not applicable Not applicable Minority interests (344,130,746.59) (137,828,137.21) Not applicable Not applicable

144
S.F. HOLDING CO., LTD. CONSOLIDATED AND COMPANY INCOME STATEMENTS (CONT’D) FOR THE SIX MONTHS ENDED 30 JUNE 2021 (All amounts in RMB Yuan unless otherwise stated) [English translation for reference only]
For the six months ended 30 June
Item Note 2021 2020 2021 2020 Consolidated Consolidated Company Company 5. Other comprehensive income, net
of tax (167,117,849.66) 146,353,697.64 - -
Attributable to shareholders of the Company, net of tax (166,315,123.26) 146,482,499.71 - -
Other comprehensive income items which will not be reclassified subsequently to profit or loss (76,892,005.25) 41,738,101.54 - - Changes in fair value of other
equity instruments investment 4(64) (76,803,722.97) 40,865,087.90 - - Other comprehensive income
items which will not be transferred to profit or loss under the equity method 4(64) (88,282.28) 873,013.64 - -
Other comprehensive income items which will be reclassified subsequently to profit or loss (89,423,118.01) 104,744,398.17 - - Cash flow hedging reserve (5,527,991.60) - - - Exchange differences on
translation of foreign currency financial statements 4(64) (83,895,126.41)
104,744,398.17
-
- Attributable to minority interests, net
of tax 4(64) (802,726.40) (128,802.07) - -
6. Total comprehensive income 248,672,477.99 3,770,118,856.86 (3,249,640.52) (43,252,776.33)
Attributable to shareholders of the Company 593,605,950.98 3,908,075,796.14 Not applicable Not applicable
Attributable to minority interests (344,933,472.99) (137,956,939.28) Not applicable Not applicable
7. Earnings per share
Basic earnings per share (RMB Yuan) 4(63) 0.17 0.85 Not applicable Not applicable
Diluted earnings per share (RMB Yuan) 4(63) 0.17 0.85 Not applicable Not applicable
The accompanying notes form an integral part of these financial statements.
Legal representative: Wang Wei Principal in charge of accounting: Chen Fei Head of
accounting department: Hu Xiaofei

145
S.F. HOLDING CO., LTD. CONSOLIDATED AND COMPANY CASH FLOW STATEMENTS FOR THE SIX MONTHS ENDED 30 JUNE 2021 (All amounts in RMB Yuan unless otherwise stated) [English translation for reference only]
For the six months ended 30 June
Item Note 2021 2020 2021 2020 Consolidated Consolidated Company Company
1. Cash flows from operating activities
Cash received from sales of goods or rendering of services 90,333,953,289.62 72,947,979,643.63 - -
Net decrease in loans to customers 30,155,476.57 - - - Net decrease in balances with central
bank 347,210,432.62 - - - Net decrease in placements with and
loans to banks and other financial institutions - 200,000,000.00 - -
Net increase in deposits from customers 845,475.00 1,379,123.94 - -
Refund of taxes and levies 73,786,234.28 72,251,370.53 - - Cash received relating to other
operating activities 4(65)(a) 44,986,705,898.36 36,120,935,884.94 1,370,901.95 16,784,720.65
Sub-total of operating cash inflows 135,772,656,806.45 109,342,546,023.04 1,370,901.95 16,784,720.65
Cash paid for goods and services (66,970,611,765.37) (46,139,569,576.39) - - Net increase in loans to customers - (50,761,631.37) - - Net increase in balances with central
bank - (9,705,168.79) - - Cash paid to and on behalf of
employees (14,840,279,837.39) (12,231,862,172.78) (1,361,999.08) (1,060,000.00) Payments of taxes and levies (2,721,791,350.68) (2,492,140,114.50) (15,996,401.37) (1,303,436.03) Cash paid relating to other operating
activities 4(65)(b) (46,908,341,009.85) (41,486,795,039.11) (6,316,624.44) (4,859,502.53)
Sub-total of operating cash outflows (131,441,023,963.29) (102,410,833,702.94) (23,675,024.89) (7,222,938.56)
Net cash flows from operating activities 4(66)(a) 4,331,632,843.16 6,931,712,320.10 (22,304,122.94) 9,561,782.09
2. Cash flows used in investing
activities Cash received from disposal of
investments 934,434,794.34 14,054,523.72 - - Cash received from returns on
investments 182,466,161.37 239,369,492.41 1,502,824,484.40 1,166,683,179.88 Cash received from disposal of fixed
assets and other long-term assets 85,924,854.13 21,609,036.69 - - Net cash received from disposal of
subsidiaries and other business units 4(65)(c) 1,414,075,843.20 30,000,000.00 - -
Cash received relating to other investing activities 4(65)(e) 46,455,050,489.87 52,830,000,000.00 1,162,496,567.74 9,802,734,180.72
Sub-total of investing cash inflows 49,071,952,142.91 53,135,033,052.82 2,665,321,052.14 10,969,417,360.60
Cash paid to acquire fixed assets and other long-term assets (9,188,443,054.47) (3,973,822,904.91) (13,841,151.75) (76,698.78)
Cash paid to acquire investments (391,136,879.92) (99,952,404.12) - - Net cash paid to acquire subsidiaries 4(65)(d) (199,541,711.07) - - - Cash paid relating to other investing
activities 4(65)(f) (50,185,229,111.50) (66,931,335,372.60) (1,130,000,000.00) (10,554,370,000.00)
Sub-total of investing cash outflows (59,964,350,756.96) (71,005,110,681.63) (1,143,841,151.75) (10,554,446,698.78)
Net cash flows (used in)/from investing activities (10,892,398,614.05) (17,870,077,628.81) 1,521,479,900.39 414,970,661.82

146
S.F. HOLDING CO., LTD. CONSOLIDATED AND COMPANY CASH FLOW STATEMENTS (CONT'D) FOR THE SIX MONTHS ENDED 30 JUNE 2021 (All amounts in RMB Yuan unless otherwise stated) [English translation for reference only]
For the six months ended 30 June
Item Note 2021 2020 2021 2020 Consolidated Consolidated Company Company
3. Cash flows from financing activities
Cash received from capital contributions 1,725,968,997.55 628,689,248.52 - -
Including: Cash received from capital contributions by minority interests of subsidiaries 1,725,968,997.55 628,689,248.52 - -
Cash received from borrowings and issue of debentures 14,320,423,964.61 13,587,708,869.12 - -
Sub-total of financing cash inflows 16,046,392,962.16 14,216,398,117.64 - -
Cash repayments of borrowings (4,322,819,732.70) (10,113,537,717.41) - (200,000.00) Cash payments for interest expenses
and distribution of dividends or profits (1,846,032,070.72) (1,473,795,893.91) (1,499,991,809.58) (1,190,371,675.27)
Cash payments relating to other financing activities 4(65)(g) (2,552,846,403.17) (83,345,117.41) (847,407.69) (59,418,005.17)
Sub-total of financing cash outflows (8,721,698,206.59) (11,670,678,728.73) (1,500,839,217.27) (1,249,989,680.44)
Net cash flows from/(used in) financing activities 7,324,694,755.57 2,545,719,388.91 (1,500,839,217.27) (1,249,989,680.44)
4. Effect of foreign exchange rate
changes on cash and cash equivalents 13,247,888.65 18,922,139.93 464.06 86.68
5. Net increase/(decrease) in cash and
cash equivalents 4(66)(b) 777,176,873.33 (8,373,723,779.87) (1,662,975.76) (825,457,149.85) Add: Cash and cash equivalents at the
beginning of the period 4(66)(b) 15,466,483,805.74 17,764,448,498.26 58,098,498.15 966,640,292.56
6. Cash and cash equivalents at the
end of the period 4(66)(c) 16,243,660,679.07 9,390,724,718.39 56,435,522.39 141,183,142.71
The accompanying notes form an integral part of these financial statements. Legal representative: Wang Wei Principal in charge of accounting: Chen Fei Head of
accounting department: Hu Xiaofei

147
S.F. HOLDING CO., LTD. CONSOLIDATED STATEMENT OF CHANGES IN EQUITY FOR THE SIX MONTHS ENDED 30 JUNE 2021 (All amounts in RMB Yuan unless otherwise stated) [English translation for reference only]
Equity attributable to shareholders of the parent company
Note Share
capital Other equity instruments
Capital reserve
Less: Treasury
stock
Other comprehensive
income General
risk reserve Special reserve
Surplus reserve
Retained earnings
Minority interests
Total equity
Balance at 1 January 2020 4,414,585,265.00 768,938,484.90 16,124,018,594.16 (454,761,306.79) 1,002,715,607.38 225,783,247.34 - 601,241,237.54 19,769,413,015.66 73,897,241.58 42,525,831,386.77
Movements for the six
months ended 30 June 2020
Total comprehensive income Net profit - - - - - - - - 3,761,593,296.43 (137,828,137.21) 3,623,765,159.22 Other comprehensive
income - - - - 146,482,499.71 - - - - (128,802.07) 146,353,697.64
Total comprehensive income for the period - - - - 146,482,499.71 - - - 3,761,593,296.43 (137,956,939.28) 3,770,118,856.86
Capital contribution and withdrawal by shareholders Capital contribution by
shareholders - - 461,825,148.38 - - - - - - 166,864,100.14 628,689,248.52 Transfer of convertible
corporate debentures to share capital and capital reserve 36,244,799.00 (192,913,580.65) 1,443,407,004.09 - - - - - - - 1,286,738,222.44
Other equity instruments issued by subsidiaries - - - - - - - - - 59,516,921.23 59,516,921.23
Changes in share-based payment restricted shares 4(43) (2,456,568.00) - (57,311,814.73) 59,768,382.73 - - - - - - -
Share-based payments included in equity 9(1) - - 47,180,411.55 - - - - - - 7,072,954.99 54,253,366.54
Others - - (118,279,760.81) - - - - - - 109,085,601.49 (9,194,159.32) Profit distribution
Appropriation to general risk reserve 4(46) - - - - - 2,344,717.97 - - (2,344,717.97) - -
Distribution to shareholders 4(46) - - - - - - - - (1,188,301,851.36) - (1,188,301,851.36)
Other movements in capital reserve - - 5,209,476.53 - - - - - - - 5,209,476.53
Safety reserve Appropriation 4(44) - - - - - - 12,187,435.48 - - - 12,187,435.48 Utilisation 4(44) - - - - - - (12,187,435.48) - - - (12,187,435.48)
Balance at 30 June 2020 4,448,373,496.00 576,024,904.25 17,906,049,059.17 (394,992,924.06) 1,149,198,107.09 228,127,965.31 - 601,241,237.54 22,340,359,742.76 278,479,880.15 47,132,861,468.21

148
S.F. HOLDING CO., LTD. CONSOLIDATED STATEMENT OF CHANGES IN EQUITY (CONT’D) FOR THE SIX MONTHS ENDED 30 JUNE 2021 (All amounts in RMB Yuan unless otherwise stated) [English translation for reference only]
Equity attributable to shareholders of the parent company
Note Share
capital Capital reserve
Less: Treasury
stock
Other comprehen
sive income General
risk reserve Special reserve
Surplus reserve
Retained earnings
Minority interests
Total equity
Balance at 1 January 2021 4,556,440,455.00 24,405,217,286.50 (394,992,892.71) 1,143,969,091.52 279,142,491.29 - 745,043,348.45 25,708,230,458.34 316,650,820.64 56,759,701,059.03
Movements for the six months ended
30 June 2021 Total comprehensive income
Net profit - - - - - - - 759,921,074.24 (344,130,746.59) 415,790,327.65 Other comprehensive income - - - (166,315,123.26) - - - - (802,726.40) (167,117,849.66) Total comprehensive income for the
period - - - (166,315,123.26) - - - 759,921,074.24 (344,933,472.99) 248,672,477.99 Capital contribution and withdrawal by
shareholders Capital contribution by shareholders - 1,098,398,176.77 - - - - - - 632,873,657.25 1,731,271,834.02 Share-based payments included in
equity 9(1) - 104,555,342.61 - - - - - - 17,805,267.97 122,360,610.58 Others - (52,539,410.09) - - - - - - 2,169,621.24 (50,369,788.85)
Profit distribution Appropriation to general risk reserve 4(46) - - - - 3,940,692.75 - - (3,940,692.75) - - Distribution to shareholders 4(46) - - - - - - - (1,499,991,809.58) - (1,499,991,809.58)
Transfer within equity Transfer from other comprehensive
income to retained earnings - - - (113,136,152.81) - - - 113,136,152.81 - - Other movements in capital reserve - (5,855,720.04) - - - - - - - (5,855,720.04) Safety reserve
Appropriation 4(44) - - - - - 12,520,064.22 - - - 12,520,064.22 Utilisation 4(44) - - - - - (12,520,064.22) - - - (12,520,064.22)
Balance at 30 June 2021 4,556,440,455.00 25,549,775,675.75 (394,992,892.71) 864,517,815.45 283,083,184.04 - 745,043,348.45 25,077,355,183.06 624,565,894.11 57,305,788,663.15
The accompanying notes form an integral part of these financial statements.
Legal representative: Wang Wei Principal in charge of accounting: Chen Fei Head of accounting department: Hu Xiaofei

149
S.F. HOLDING CO., LTD. COMPANY STATEMENT OF CHANGES IN EQUITY FOR THE SIX MONTHS ENDED 30 JUNE 2021 (All amounts in RMB Yuan unless otherwise stated) [English translation for reference only]
Note Share
capital Other equity instruments
Capital reserve
Less: Treasury stock
Surplus reserve
Retained earnings
Total equity
Balance at 1 January 2020 4,414,585,265.00 768,938,484.90 46,642,944,149.90 (454,761,306.79) 448,196,237.23 1,454,807,195.40 53,274,710,025.64
Movements for the six months
ended 30 June 2020 Total comprehensive income
Net loss - - - - - (43,252,776.33) (43,252,776.33) Capital contribution and
withdrawal by shareholders Capital contribution by holders
of convertible corporate debentures 36,244,799.00 (192,913,580.65) 1,443,407,004.09 - - - 1,286,738,222.44
Changes in share-based payment restricted shares 4(43) (2,456,568.00) - (57,311,814.73) 59,768,382.73 - - -
Profit distribution Distribution to shareholders 4(46) - - - - - (1,188,301,851.36) (1,188,301,851.36)
Balance at 30 June 2020 4,448,373,496.00 576,024,904.25 48,029,039,339.26 (394,992,924.06) 448,196,237.23 223,252,567.71 53,329,893,620.39
Balance at 1 January 2021 4,556,440,455.00 - 52,344,320,322.55 (394,992,892.71) 591,998,348.14 1,560,724,342.22 58,658,490,575.20
Movements for the six months
ended 30 June 2021 Total comprehensive income
Net loss - - - - - (3,249,640.52) (3,249,640.52) Profit distribution
Distribution to shareholders 4(46) - - - - - (1,499,991,809.58) (1,499,991,809.58) Others - - (5,696.00) - - - (5,696.00)
Balance at 30 June 2021 4,556,440,455.00 - 52,344,314,626.55 (394,992,892.71) 591,998,348.14 57,482,892.12 57,155,243,429.10
The accompanying notes form an integral part of these financial statements. Legal representative: Wang Wei Principal in charge of accounting: Chen Fei Head of accounting department: Hu Xiaofei

S.F. HOLDING CO., LTD. NOTES TO THE FINANCIAL STATEMENTS FOR THE SIX MONTHS ENDED 30 JUNE 2021 (All amounts in RMB Yuan unless otherwise stated) [English translation for reference only]
150
1 General information and historical development S.F. Holding Co., Ltd. (formerly “Ma’anshan Dingtai Rare Earth and New Materials Co., Ltd.”, hereinafter “S.F. Holding” or “the Company”), formerly known as Ma’anshan Dingtai Science & Technology Co., Ltd., was established by 11 natural persons including Liu Jilu and the Labour Union of Ma’anshan Dingtai Metallic Products Co., Ltd. by cash contribution on 13 May 2003. Initiated by the original shareholders of the Company, the Company was formally changed as Ma’anshan Dingtai Rare Earth and New Materials Co., Ltd. with a registered capital of RMB 50 million as approved by the shareholders’ meeting on 18 October 2007 and the inaugural meeting on 22 October 2007. On 11 January 2010, the Company successfully issued 19,500,000 ordinary shares at par value of RMB 1.00 per share at Shenzhen Stock Exchange under the Regulatory Permission [2010] No. 41 as approved by the China Securities Regulatory Commission. The outstanding shares were listed for trading at Shenzhen Stock Exchange on 5 February 2010. After the shares were issued, the total share capital of the Company was changed to 77,830,780 shares. Pursuant to the Proposal on the Profit Distribution Plan for 2014 approved by the 2014 annual shareholders’ meeting held by the Company on 19 May 2015, the Company converted capital reserve into new shares on the basis of 5 shares for every 10 existing shares, with 77,830,780 shares in total at the end of 2014 as base. After the conversion, the total share capital of the Company was increased by 38,915,390 shares to 116,746,170 shares. Pursuant to the Proposal on the Profit Distribution Plan for 2015 approved by the 2015 annual shareholders’ meeting held by the Company on 17 May 2016, the Company, with 116,746,170 shares in total at the end of 2015 as base, converted capital reserve into new shares on the basis of 10 shares for every 10 existing shares. After the conversion, the total share capital of the Company was increased by 116,746,170 shares to 233,492,340 shares. Pursuant to the resolution of the 13th session of the 3rd Board of Directors of the Company dated 22 May 2016 and relevant resolutions approved on the first interim shareholders’ meeting in 2016 held by the Company on 30 June 2016, including the Resolution Concerning the Company Qualifying for Criteria for Major Assets Restructuring of Listed Companies, the Resolution on Related-party Transaction Composed of Major Assets Swap and Issuing Shares to Purchase Assets and Raise Matching Fund and the Resolution on ‘Major Assets Swap and Issuing Shares to Purchase Assets and Raise Matching Fund and Related-party Transaction Report (Draft) of Ma’anshan Dingtai Rare Earth and New Materials Co., Ltd.’ and Summaries, the Company conducted a series of major assets restructuring as follows:

S.F. HOLDING CO., LTD. NOTES TO THE FINANCIAL STATEMENTS FOR THE SIX MONTHS ENDED 30 JUNE 2021 (All amounts in RMB Yuan unless otherwise stated) [English translation for reference only]
151
1 General information and historical development (Cont’d)
(1) Major assets swap In December 2016, the Company swapped all the assets and liabilities (“exchange-out assets”) it held as at 31 December 2015 (“assessment base date”) for the equivalent portion (“exchange-in assets”) of 68.40%, 9.93%, 6.75%, 6.75%, 6.75%, 1.35% and 0.07% of the equities in Shenzhen S.F. Taisen Holdings (Group) Co., Ltd. (formerly “S.F. Holding (Group) Co., Ltd.”, “Taisen Holdings”) respectively held by Shenzhen Mingde Holdings Development Co., Ltd. (“Mingde Holdings”), Ningbo Shunda Fengrun Investment Management Partnership (Limited Partnership) (“Shunda Fengrun”), Jiaqiang Shunfeng (Shenzhen) Equity Investment Partnership (Limited Partnership) (“Jiaqiang Shunfeng”), Shenzhen Zhaoguang Investment Co., Ltd. (“Zhaoguang Investment”), Suzhou Industrial Park Oriza Shunfeng Equity Investment Company (Limited Partnership) (“Oriza Shunfeng”), Suzhou Guyu Qiuchuang Equity Investment Partnership (Limited Partnership) (“Guyu Qiuchuang”) and Ningbo Shunxin Fenghe Investment Management Partnership (Limited Partnership) (“Shunxin Fenghe”). For this transaction, the exchange-out assets were priced at RMB 796 million and the exchange-in assets were priced at RMB 43.30 billion. Pursuant to the second interim shareholders’ meeting in 2016 dated 28 December 2016 (“restructuring date”), the Company approved and reelected a new Board of Directors, which indicated the completion of major assets swap transaction and the successful listing of Taisen Holdings on Shenzhen Stock Exchange through back door listing.
(2) Issuing shares to purchase assets In December 2016, the Company issued 3,950,185,873 ordinary shares (A shares) at par value of RMB 1.00 per share at an issuing price of RMB 10.76 per share to Mingde Holdings, Shunda Fengrun, Jiaqiang Shunfeng, Zhaoguang Investment, Oriza Shunfeng, Guyu Qiuchuang and Shunxin Fenghe to cover the difference of the above swap (RMB 42,504,000,000). The difference between the value of shares and the share capital amounting to RMB 38,553,814,120.48 was recognised as capital reserve. The total share capital was changed to 4,183,678,213 shares. After the new shares were issued, Mingde Holdings, Shunda Fengrun, Jiaqiang Shunfeng, Zhaoguang Investment, Oriza Shunfeng and other shareholders held 64.58%, 9.38%, 6.37%, 6.37%, 6.37% and 6.92% respectively of the equities in the Company. The China Securities Regulatory Commission approved the above assets restructuring plan of the Company on 12 December 2016. The share change above was verified by PricewaterhouseCoopers Zhong Tian LLP with a capital verification report of PwC ZT Yan Zi (2016) No. 1757 issued on 28 December 2016. The Company registered the additional 3.95 billion shares at China Securities Depository and the Clearing Corporation Limited Shenzhen Branch on 18 January 2017.

S.F. HOLDING CO., LTD. NOTES TO THE FINANCIAL STATEMENTS FOR THE SIX MONTHS ENDED 30 JUNE 2021 (All amounts in RMB Yuan unless otherwise stated) [English translation for reference only]
152
1 General information and historical development (Cont’d)
(3) Raising matching fund In July 2017, the Company issued 227,337,311 ordinary shares (A shares) at par value of RMB 1.00 per share to specific investors through non-public offering at RMB 35.19 per share. The total fund raised amounted to RMB 7,999,999,974.09. Net of underwriter and sponsor’s fees and other transaction costs, the net fund raised amounted to RMB 7,822,179,636.78, including an increment of share capital of RMB 227,337,311.00 and an increment of capital reserve by RMB 7,604,681,212.80. The aforesaid fund was received on 31 July 2017 and verified by PricewaterhouseCoopers Zhong Tian LLP with a capital verification report of PwC ZT Yan Zi (2017) No. 745 issued. The Company registered the additional shares at China Securities Depository and the Clearing Corporation Limited Shenzhen Branch on 15 August 2017. The total share capital was changed to 4,411,015,524 shares. Mingde Holdings, Shunda Fengrun, Jiaqiang Shunfeng, Zhaoguang Investment, Oriza Shunfeng and other shareholders held 61.25%, 8.89%, 6.04%, 6.04%, 6.04% and 11.74% of the equities in the Company respectively. Afterwards, the Company conducted several restricted shares incentive plans, share repurchase and transfer of convertible corporate debentures to share capital. The total share capital of the Company as at 30 June 2021 was changed to 4,556,440,455 shares.

S.F. HOLDING CO., LTD. NOTES TO THE FINANCIAL STATEMENTS FOR THE SIX MONTHS ENDED 30 JUNE 2021 (All amounts in RMB Yuan unless otherwise stated) [English translation for reference only]
153
1 General information and historical development (Cont’d) The approved business scope of the Company and its subsidiaries (“the Group”) includes: assets management, capital management, investment management (trusts, financial assets management and security assets management are not allowed); auto rent; enterprise headquarters management; customs brokerage, inspection brokerage; investment in industries; domestic trade; marketing planning; investment consultancy and other information consultancy (excluding human resources intermediary service, securities and restricted projects); engagement in the development of network technology, information technology and electronic product technology and related technology services, consultancy and transfer of network technology, and provision of network information, E-Commerce service platform, business management, investment consultancy, investment management, enterprise management consulting, etc.; call centre business and information service (both are second type value-added telecommunication services) and road transportation of common cargo; international freight forwarding for air transportation and road transportation of imported and exported goods or transit goods, including solicitation, booking, shipping, warehousing and packaging; type-1 and type-2 (international and domestic) sales agency of air transport; common cargo transportation, stowage and logistics services; science and technology information consulting, project investment consulting and logistics information consulting; data processing; research and development and sales of communication equipment, and related technology services (projects subject to approval could only be implemented after approval by relevant authorities), research and development of unmanned aerial vehicle(“UAV”) and spare parts; supply chain management and related supporting services, and engagement in both export and import business; development, construction and operation of industrial park; property management; self-owned property leasing; network marketing promotion; E-Commerce training; information technology outsourcing and information services outsourcing; data mining, data analysis and data services; development and application of general software, industry application software and embedded software; operation of on-line trading, on-line consulting, on-line auction and on-line advertising; network business service and database service; services in respect of development and application of electronic government affairs system; communications industry value-added business services; international freight forwarding, domestic and international express (excluding business exclusively operated by postal enterprises), transportation of cargo shipping containers and large objects, economic and technical consulting, technical information consulting, and engagement in commercial activities by way of franchising; transport services of domestic (including Hong Kong, Macau and Taiwan) and international aviation cargo and related services, and import and export of goods and technology; cargo express agent services; international freight forwarding (excluding shipping agency business), loading, unloading and handling; international and domestic freight forwarding; technology development of software and hardware for financial payment systems; internet payment, bank card acquiring, supply chain management; non-securities equity investment activities and relevant consulting services; finance leasing; leasing; purchase of leased property from home and abroad; residual value processing and maintenance of leased property; leasing consulting; commercial factoring related to main operating activities; delivery of goods; freight equipment leasing; container yard operation and container leasing service; railway cargo transportation; ship freight; product marketing design and planning for enterprises and individuals and related business agency services; non-vessel operating common carrier business; maritime international freight forwarding business; building construction engineering; wholesale of medicine and medical equipment; sales of food; human resources service. First-tier and second-tier subsidiaries included in the consolidation scope of the financial statements are detailed in Note 6(1). The changes in the scope of consolidation for the current period are set out in Note 5. Mingde Holdings is the parent company and ultimate controlling company of the Company, and Mr Wang Wei is the ultimate controller of the Company. These financial statements were authorised for issue by the Board of Directors of the Company on 20 August 2021.

S.F. HOLDING CO., LTD. NOTES TO THE FINANCIAL STATEMENTS FOR THE SIX MONTHS ENDED 30 JUNE 2021 (All amounts in RMB Yuan unless otherwise stated) [English translation for reference only]
154
2 Summary of significant accounting policies and accounting estimates The Group determines the specific accounting policies and estimates based on its features of production and operation, primarily comprising the methods of provision for expected credit losses on receivables and contract assets (Note 2(9)), valuation of inventories (Note 2(10)), measurement model of investment properties (Note 2(12)), depreciation of fixed assets and amortisation of intangible assets and right-of-use assets (Note 2(13), (16), (28)), criterion for capitalisation of capitalised development expenditures (Note 2(17)), recognition and measurement of revenue (Note 2(26)), etc. Details of the Group’s critical judgements, critical accounting estimates and key assumptions used in determining significant accounting policies are set forth in Note 2(30).
(1) Basis of preparation The financial statements are prepared in accordance with the Accounting Standards for Business Enterprises - Basic Standard, and the specific accounting standards and other relevant regulations issued by the Ministry of Finance on 15 February 2006 and in subsequent periods (hereafter, referred to as “the Accounting Standards for Business Enterprises” or “CASs”) and the disclosure requirements in the Preparation Convention of Information Disclosure by Companies Offering Securities to the Public No. 15 - General Rules on Financial Reporting issued by the China Securities Regulatory Commission. The financial statements are prepared on a going concern basis.
(2) Statement of compliance with the Accounting Standards for Business Enterprises The financial statements of the Company for the six months ended 30 June 2021 are in compliance with the Accounting Standards for Business Enterprises, and truly and completely present the consolidated and company financial position of the Company as at 30 June 2021 and their financial performance, cash flows and other information for the period then ended.
(3) Accounting year The Company’s accounting year starts on 1 January and ends on 31 December.
(4) Recording currency The Company’s recording currency is Renminbi (RMB). The Company’s subsidiaries decide their recording currencies in line with the economic environments in which they operate, while the subsidiaries in Hong Kong and abroad mainly adopt currencies including HKD, USD, KRW, EUR, etc. as their recording currencies. The financial statements are presented in RMB.

S.F. HOLDING CO., LTD. NOTES TO THE FINANCIAL STATEMENTS FOR THE SIX MONTHS ENDED 30 JUNE 2021 (All amounts in RMB Yuan unless otherwise stated) [English translation for reference only]
155
2 Summary of significant accounting policies and accounting estimates (Cont’d)
(5) Business combinations
(a) Business combinations involving enterprises under common control The consideration paid and net assets obtained by the Group in a business combination are measured at the carrying amount. If the acquiree is acquired from a third party by the ultimate controlling party in a prior year, the consideration paid and net assets obtained by the Group are measured based on the carrying amounts of the acquiree’s assets and liabilities (including the goodwill arising from the acquisition of the acquiree by the ultimate controlling party) presented in the consolidated financial statements of the ultimate controlling party. The difference between the carrying amount of the net assets obtained from the combination and the carrying amount of the consideration paid for the combination is treated as an adjustment to capital reserve (share premium). If the capital reserve (share premium) is not sufficient to absorb the difference, the remaining balance is adjusted against retained earnings. Costs directly attributable to the business combination are included in profit or loss in the period in which they are incurred. Transaction costs associated with the issue of equity or debt securities for the business combination are included in the initially recognised amounts of the equity or debt securities.
(b) Business combinations involving enterprises not under common control The combination cost and identifiable net assets obtained by the Group in a business combination are measured at fair value at the acquisition date. Where the combination cost exceeds the Group’s interest in the fair value of the acquiree’s identifiable net assets, the difference is recognised as goodwill; where the combination cost is lower than the Group’s interest in the fair value of the acquiree’s identifiable net assets, the difference is recognised in profit or loss for the current period. Costs directly attributable to the combination are included in profit or loss in the period in which they are incurred. Transaction costs associated with the issue of equity or debt securities for the business combination are included in the initially recognised amounts of the equity or debt securities.

S.F. HOLDING CO., LTD. NOTES TO THE FINANCIAL STATEMENTS FOR THE SIX MONTHS ENDED 30 JUNE 2021 (All amounts in RMB Yuan unless otherwise stated) [English translation for reference only]
156
2 Summary of significant accounting policies and accounting estimates (Cont’d)
(6) Preparation of consolidated financial statements The consolidated financial statements comprise the financial statements of the Company and all of its subsidiaries. Subsidiaries are consolidated from the date on which the Group obtains control and are de-consolidated from the date on which such control ceases. For a subsidiary that is acquired in a business combination involving enterprises under common control, it is included in the consolidated financial statements from the date when it, together with the Company, comes under common control of the ultimate controlling party. The portion of the net profits realised before the combination date is presented separately in the consolidated income statement. In preparing the consolidated financial statements, where the accounting policies and the accounting periods of the Company and subsidiaries are inconsistent, the financial statements of the subsidiaries are adjusted in accordance with the accounting policies and the accounting period of the Company. For subsidiaries acquired from business combinations involving enterprises not under common control, the individual financial statements of the subsidiaries are adjusted based on the fair value of the identifiable net assets at the acquisition date.
All significant intra-group balances, transactions and unrealised profits are eliminated in the consolidated financial statements. The portion of subsidiaries’ equity and the portion of subsidiaries’ net profit or loss and comprehensive income for the period not attributable to the Company are recognised as minority interests, minority interest income and total comprehensive income attributable to minority shareholders and presented separately in the consolidated financial statements under equity, net profit and total comprehensive income respectively. Where the loss for the current period attributable to the minority shareholders of the subsidiaries exceeds the share of the minority interests in the opening balance of equity, the excess is still deducted against minority interests. Unrealised profits and losses resulting from the sale of assets by the Company to its subsidiaries are fully eliminated against net profit attributable to owners of the parent. Unrealised profits and losses resulting from the sale of assets by a subsidiary to the Company are eliminated and allocated between net profit attributable to owners of the parent and minority interest income in accordance with the allocation proportion of the parent in the subsidiary. Unrealised profits and losses resulting from the sale of assets by one subsidiary to another are eliminated and allocated between net profit attributable to owners of the parent and minority interest income in accordance with the allocation proportion of the parent in the selling subsidiary. If the accounting treatment of a transaction is inconsistent in the financial statements at the Group level and at the Company or its subsidiary level, adjustment will be made from the perspective of the Group.
(7) Cash and cash equivalents Cash and cash equivalents comprise cash on hand, deposits that can be readily drawn on demand, and short-term and highly liquid investments that are readily convertible to known amounts of cash and which are subject to an insignificant risk of changes in value.

S.F. HOLDING CO., LTD. NOTES TO THE FINANCIAL STATEMENTS FOR THE SIX MONTHS ENDED 30 JUNE 2021 (All amounts in RMB Yuan unless otherwise stated) [English translation for reference only]
157
2 Summary of significant accounting policies and accounting estimates (Cont’d)
(8) Foreign currency translation
(a) Foreign currency transactions Foreign currency transactions are translated into recording currency using the spot exchange rates and approximate exchange rates prevailing at the dates of the transactions. At the balance sheet date, monetary items denominated in foreign currencies are translated into recording currency using the spot exchange rates on the balance sheet date. Exchange differences arising from these translations are recognised in profit or loss for the current period, except for those attributable to foreign currency borrowings that have been taken out specifically for acquisition or construction of qualifying assets, which are capitalised as part of the cost of those assets. Non-monetary items denominated in foreign currencies that are measured at historical costs are translated at the balance sheet date using the spot exchange rates at the date of the transactions. The effect of exchange rate changes on cash is presented separately in the cash flow statement.
(b) Translation of foreign currency financial statements The asset and liability items in the balance sheets for overseas operations are translated at the spot exchange rates on the balance sheet date. Among the equity items, the items other than retained earnings are translated at the spot exchange rates of the transaction dates. The income and expense items in the income statement of foreign operations are translated at the spot exchange rates of the transaction dates. The differences arising from the above translation are recognised in other comprehensive income. The cash flows of foreign operations are translated at the spot exchange rates on the dates of the cash flows. The effect of exchange rate changes on cash is presented separately in the cash flow statement.
(9) Financial instruments A financial instrument is any contract that gives rise to a financial asset of one entity and a financial liability or equity instrument of another entity. A financial asset or a financial liability is recognised when the Group becomes a party to the contractual provisions of the instrument.
(a) Financial assets (i) Classification and measurement
Based on the business model for managing the financial assets and the contractual cash flow characteristics of the financial assets, financial assets are classified as: (1) financial assets at amortised cost; (2) financial assets at fair value through other comprehensive income; (3) financial assets at fair value through profit or loss.

S.F. HOLDING CO., LTD. NOTES TO THE FINANCIAL STATEMENTS FOR THE SIX MONTHS ENDED 30 JUNE 2021 (All amounts in RMB Yuan unless otherwise stated) [English translation for reference only]
158
2 Summary of significant accounting policies and accounting estimates (Cont’d)
(9) Financial instruments (Cont’d) (a) Financial assets (Cont’d) (i) Classification and measurement (Cont’d)
The financial assets are measured at fair value at initial recognition. Related transaction costs that are attributable to the acquisition of the financial assets are included in the initially recognised amounts, except for the financial assets at fair value through profit or loss, the related transaction costs of which are recognised directly in profit or loss for the current period. Accounts receivable or notes receivable arising from sales of products or rendering of services (excluding or without regard to significant financing components) are initially recognised at the consideration that is entitled to be charged by the Group as expected. Debt instruments The debt instruments held by the Group refer to the instruments that meet the definition of financial liabilities from the perspective of the issuer, and are measured in the following ways: Measured at amortised cost: The objective of the Group’s business model is to hold the financial assets to collect the contractual cash flows, and the contractual cash flow characteristics are consistent with a basic lending arrangement, which gives rise on specified dates to the contractual cash flows that are solely payments of principal and interest on the principal amount outstanding. The interest income of such financial assets is recognised using the effective interest method. Such financial assets mainly comprise cash at bank and on hand, notes receivable, accounts receivable, factoring receivables, loans and advances, other receivables and long-term receivables. Long-term receivables that are due within one year (inclusive) as from the balance sheet date are included in the current portion of non-current assets. Measured at fair value through profit or loss: Debt instruments held by the Group that are not divided into those at amortised cost, or those measured at fair value through other comprehensive income, are measured at fair value through profit or loss. At initial recognition, the Group designates a portion of financial assets as at fair value through profit or loss to eliminate or significantly reduce an accounting mismatch. Financial assets measured at fair value through profit or loss that are due after one year (inclusive) as from the balance sheet date and are expected to be held over one year are included in other non-current financial assets, and others are included in financial assets held for trading.

S.F. HOLDING CO., LTD. NOTES TO THE FINANCIAL STATEMENTS FOR THE SIX MONTHS ENDED 30 JUNE 2021 (All amounts in RMB Yuan unless otherwise stated) [English translation for reference only]
159
2 Summary of significant accounting policies and accounting estimates (Cont’d)
(9) Financial instruments (Cont’d) (a) Financial assets (Cont’d) (i) Classification and measurement (Cont’d)
Equity instruments Investments in equity instruments, over which the Group has no control, joint control or significant influence, are measured at fair value through profit or loss under financial assets held for trading; investments in equity instruments expected to be held over one year as from the balance sheet date are included in other non-current financial assets. In addition, a portion of certain investments in equity instruments not held for trading are designated as financial assets at fair value through other comprehensive income under investments in other equity instruments. The relevant dividend income of such financial assets is recognised in profit or loss for the current period.
(ii) Impairment The Group confirms the loss provision based on expected credit losses for financial assets and contract assets measured at amortised cost.
Giving consideration to reasonable and supportable information on past events, current conditions and forecasts of future economic conditions, as well as the default risk weight, the Group recognises the expected credit loss as the probability-weighted amount of the present value of the difference between the cash flows receivable from the contract and the cash flows expected to collect.
As at each balance sheet date, the expected credit losses of financial instruments at different stages are measured respectively. 12-month expected credit loss provision is recognised for financial instruments in Stage 1 that have not had a significant increase in credit risk since initial recognition; lifetime expected credit loss provision is recognised for financial instruments in Stage 2 that have had a significant increase in credit risk yet without credit impairment since initial recognition; and lifetime expected credit loss provision is recognised for financial instruments in Stage 3 that have had credit impairment since initial recognition.

S.F. HOLDING CO., LTD. NOTES TO THE FINANCIAL STATEMENTS FOR THE SIX MONTHS ENDED 30 JUNE 2021 (All amounts in RMB Yuan unless otherwise stated) [English translation for reference only]
160
2 Summary of significant accounting policies and accounting estimates (Cont’d)
(9) Financial instruments (Cont’d) (a) Financial assets (Cont’d)
(ii) Impairment (Cont’d)
For the financial instruments with lower credit risk on the balance sheet date, the Group assumes there is no significant increase in credit risk since initial recognition and recognises the 12-month expected credit loss provision. For the financial instruments in Stage 1, Stage 2 and with lower credit risk, the Group calculates the interest income by applying the effective interest rate to the gross carrying amount (before deduction of the impairment provision). For the financial instruments in Stage 3, the interest income is calculated by applying the effective interest rate to the amortised cost (after deduction of the impairment provision from the gross carrying amount). For notes and accounts receivables and contract assets, the Group recognises the lifetime expected credit loss provision regardless of whether there exists a significant financing component. In case the expected credit losses of an individually assessed financial asset cannot be evaluated with reasonable cost, the Group divides the receivables into certain groupings based on credit risk characteristics, and calculates the expected credit losses for the groupings. Basis for determining groupings and methods for provision are presented as follows: Bank acceptance notes Group of bank notes with low credit risk Accounts receivable, other receivables Group of receivables from related parties Accounts receivable, other receivables and
contract assets Group of receivables from non-related parties
Long-term receivables Group of finance leases Long-term receivables Group of interest-free loans to employees Based on the exposure at default and the lifetime expected credit loss rate, the Group calculates the expected credit losses of notes receivable, accounts receivable and contract assets that are classified into groupings with consideration to historical credit losses experience, current conditions and forecasts of future economic conditions. Based on the exposure at default and the 12-month/lifetime expected credit loss rate, the Group calculates the expected credit losses of other receivables, factoring receivables, loans and advances, and long-term receivables that are classified into groupings with consideration to historical credit losses experience, the current conditions and forecasts of future economic conditions. The Group recognises the loss provision made or reversed into profit or loss for the current period.

S.F. HOLDING CO., LTD. NOTES TO THE FINANCIAL STATEMENTS FOR THE SIX MONTHS ENDED 30 JUNE 2021 (All amounts in RMB Yuan unless otherwise stated) [English translation for reference only]
161
2 Summary of significant accounting policies and accounting estimates (Cont’d) (9) Financial instruments (Cont’d) (a) Financial assets (Cont’d)
(iii) Derecognition
A financial asset is derecognised when any of the below criteria is met: (1) the contractual rights to receive the cash flows from the financial asset expire; (2) the financial asset has been transferred and the Group transfers substantially all the risks and rewards of ownership of the financial asset to the transferee; or (3) the financial asset has been transferred and the Group has not retained control of the financial asset, although the Group neither transfers nor retains substantially all the risks and rewards of ownership of the financial asset. When a financial asset is derecognised, the difference between the carrying amount and the sum of the consideration received and the cumulative changes in fair value that are previously recognised directly in other comprehensive income is recognised in profit or loss for the current period, except for those as investments in other equity instruments, the difference aforementioned is recognised in retained earnings instead.
(b) Financial liabilities
Financial liabilities are classified as financial liabilities at amortised cost and financial liabilities at fair value through profit or loss at initial recognition. Financial liabilities of the Group mainly comprise financial liabilities at amortised cost, including convertible corporate debentures and other financial liabilities. Convertible corporate debentures Convertible corporate debentures comprise liability portion and equity portion. The liability portion is classified as liabilities, which reflects the obligation to pay fixed principal and interest, and its fair value is calculated by the market interest rate of similar debentures without embedded convertible option at initial recognition, and is subsequently measured at amortised cost using the effective interest method. The equity portion reflects the embedded option that converts liabilities into ordinary shares, which can only be settled by exchanging a fixed amount of its own equity instruments for a fixed amount of cash or other financial assets. The difference between the overall proceeds of issuance of convertible corporate debentures and the liability portion is recognised as equity by the Group. Direct transaction costs are allocated based on the shares of the liability portion and the equity portion in issuance proceeds. When convertible corporate debentures are converted into stock shares, the amount calculated by the number of shares converted and the par value per share is recognised as share capital, and the difference between the balance of relevant portion of convertible corporate debentures and the above share capital is recognised as share premium in capital reserve.

S.F. HOLDING CO., LTD. NOTES TO THE FINANCIAL STATEMENTS FOR THE SIX MONTHS ENDED 30 JUNE 2021 (All amounts in RMB Yuan unless otherwise stated) [English translation for reference only]
162
2 Summary of significant accounting policies and accounting estimates (Cont’d) (9) Financial instruments (Cont’d)
(b) Financial liabilities (Cont’d)
Other financial liabilities Other financial liabilities measured at amortised cost mainly comprise notes and accounts payables, other payables, borrowings, other debentures payable except for convertible corporate debentures, etc. Such financial liabilities are initially recognised at fair value, net of transaction costs incurred, and subsequently measured using the effective interest method. Financial liabilities that are due within one year (inclusive) are classified as current liabilities; those with maturities over one year but are due within one year (inclusive) as from the balance sheet date are classified as current portion of non-current liabilities. Others are classified as non-current liabilities. A financial liability is derecognised or partly derecognised when the underlying present obligation is discharged or partly discharged. The difference between the carrying amount of the derecognised part of the financial liability and the consideration paid is recognised in profit or loss for the current period.
(c) Equity instruments An equity instrument is a contract that represents a residual interest in the assets of an entity after deducting all of its liabilities.
(d) Determination of fair value of financial instruments The fair value of a financial instrument that is traded in an active market is determined at the quoted price in the active market. The fair value of a financial instrument that is not traded in an active market is determined by using a valuation technique. In valuation, the Group adopts valuation techniques applicable in the current situation and supported by adequate available data and other information, selects inputs with the same characteristics as those of assets or liabilities considered in relevant transactions of assets or liabilities by market participants, and gives priority to the use of relevant observable inputs. When relevant observable inputs are not available or feasible, unobservable inputs are adopted.

S.F. HOLDING CO., LTD. NOTES TO THE FINANCIAL STATEMENTS FOR THE SIX MONTHS ENDED 30 JUNE 2021 (All amounts in RMB Yuan unless otherwise stated) [English translation for reference only]
163
2 Summary of significant accounting policies and accounting estimates (Cont’d) (9) Financial instruments (Cont’d) (e) Hedge accounting
The hedge accounting method refers to a method to recognise gains or losses arising from a hedging instrument and a hedged item in profit or loss for the current period (or other comprehensive income) to reflect the effect of the risk management activities. The hedged item refers to an item which exposes the Group to risks of changes in fair value or cash flows and is designated as being hedged and can be measured reliably. The hedged item designated by the Group is the 5-year debentures denominated in USD which exposes the Group to risks of changes in cash flows. The hedging instrument refers to a financial instrument which is designated by the Group and by which it is expected that changes in its fair value or cash flow can offset the changes in fair value or cash flow of the hedged item. The Group’s hedging instruments are the 5-year forward exchange contracts denominated in USD. The Group, on an ongoing basis, assess at inception of the hedging relationship and in subsequent periods, whether a hedging relationship qualifies for hedge accounting. A hedging relationship qualifies for hedge accounting only if all of the following criteria are met:
- there is an economic relationship between the hedged item and the hedging instrument;
- the effect of credit risk does not dominate the value changes that result from that economic relationship;
- the hedge ratio of the hedging relationship is the same as that resulting from the quantity of the hedged item that the entity actually hedges and the quantity of the hedging instrument that the entity actually uses to hedge that quantity of hedged item.
If a hedging relationship becomes ineffective due to the hedge ratio but the risk management objective for designating such hedging relationship remains the same, the Group will make an adjustment to the quantity of the hedged item or the hedging instrument in the existing hedging relationship for the purpose of realigning the hedge ratio to achieve hedge effectiveness. The hedging accounting is discontinued in case of one of the following conditions:
- the hedging relationship no longer meets the risk management objective on the basis of which it qualified for hedge accounting;
- the hedging instrument or instruments have been due, sold, or the contract has been terminated or exercised;
- there is no longer an economic relationship between the hedged item and the hedging instrument or the effect of credit risk starts to dominate the value changes that result from that economic relationship;
- other conditions that a hedging relationship no longer qualifies for hedge accounting.

S.F. HOLDING CO., LTD. NOTES TO THE FINANCIAL STATEMENTS FOR THE SIX MONTHS ENDED 30 JUNE 2021 (All amounts in RMB Yuan unless otherwise stated) [English translation for reference only]
164
2 Summary of significant accounting policies and accounting estimates (Cont’d)
(9) Financial instruments (Cont’d)
(e) Hedge accounting (Cont’d)
(i) Cash flow hedge The Group adopts the cash flow hedge. A cash flow hedge refers to a hedge of the exposure to changes in cash flows. The effective portion of gains or losses arising from the hedging instrument is recognised as cash flow hedging reserve in other comprehensive income. Amount of cash flow hedging reserve is the lower of the following two (in absolute amount):
- the cumulative gains or losses arising from the hedging instrument since inception of the hedge;
- the cumulative change in present value of the expected future cash flows on the hedged item since inception of the hedge.
The amount of cash flow hedging reserve included in other comprehensive income during each period represents the change in cash flow hedging reserve for the current period. The ineffective portion of gains or losses arising from hedging instrument is recognised in profit or loss for the current period. When the Group discontinues hedge accounting for a cash flow hedge, it shall account for the amount that has been accumulated in the cash flow hedging reserve recognised in other comprehensive income in accordance with the accounting policies as follows:
- if the hedged future cash flows are still expected to occur, that amount shall remain in the cash flow hedging reserve and be accounted for in accordance with the above-mentioned accounting policies;
- if the hedged future cash flows are not expected to occur, that amount shall be immediately reclassified from other comprehensive income to profit or loss for the current period.

S.F. HOLDING CO., LTD. NOTES TO THE FINANCIAL STATEMENTS FOR THE SIX MONTHS ENDED 30 JUNE 2021 (All amounts in RMB Yuan unless otherwise stated) [English translation for reference only]
165
2 Summary of significant accounting policies and accounting estimates (Cont’d)
(10) Inventories
(a) Classification Inventories comprise low-value consumables, raw materials in stock, finished goods, costs to fulfil a contract(Note 2(26)(a)), aviation consumables and properties under development, and are stated at the lower of cost and net realisable value.
(b) Valuation method for inventory issued Raw materials in stock and finished goods are accounted for using the weighted average method upon issuance. Aviation consumables are accounted for using the specific-unit-cost method upon issuance. Properties under development comprise land costs, construction costs, other direct and indirect development expenses, etc., and are transferred to completed properties held for sale at actual cost upon completion.
(c) Amortisation methods of low-value consumables Low-value consumables are amortised into expenses in full when issued for use.
(d) Basis for determining the net realisable value of inventories and provision for decline in the value of inventories Provision for decline in the value of inventories is determined at the excess amount of the carrying amounts of the inventories over their net realisable value. Net realisable value is determined based on the estimated selling price in the ordinary course of business, less the estimated costs and estimated costs necessary to make the sale and related taxes.
(e) The Group adopts the perpetual inventory system.

S.F. HOLDING CO., LTD. NOTES TO THE FINANCIAL STATEMENTS FOR THE SIX MONTHS ENDED 30 JUNE 2021 (All amounts in RMB Yuan unless otherwise stated) [English translation for reference only]
166
2 Summary of significant accounting policies and accounting estimates (Cont’d)
(11) Long-term equity investments Long-term equity investments comprise the Company’s long-term equity investments in its subsidiaries, and the Group’s long-term equity investments in its joint ventures and associates. A subsidiary is an investee over which the Company is able to exercise control. A joint venture is a joint arrangement which is structured through a separate vehicle over which the Group has joint control together with other parties and only has rights to the net assets of the arrangement based on legal forms, contractual terms and other facts and circumstances. An associate is the investee over which the Group has significant influence by participating in the financial and operating policy decisions. Investments in subsidiaries are presented in the Company’s financial statements using the cost method, and are adjusted to the equity method when preparing the consolidated financial statements, and investments in joint ventures and associates are accounted for using the equity method.
(a) Determination of investment cost
For long-term equity investments arising from business combination involving enterprises under common control, the initial investment cost shall be the share of the carrying amount of equity of the acquiree in the consolidated financial statements of the ultimate controlling party as at the combination date; for long-term equity investments arising from business combination involving enterprises not under common control, the investment cost shall be the combination cost. For long-term equity investments acquired not through a business combination: for long-term equity investments acquired by payment in cash, the initial investment cost shall be the purchase price actually paid; for long-term equity investments acquired by issuing equity securities, the initial investment cost shall be the fair value of the equity securities issued.

S.F. HOLDING CO., LTD. NOTES TO THE FINANCIAL STATEMENTS FOR THE SIX MONTHS ENDED 30 JUNE 2021 (All amounts in RMB Yuan unless otherwise stated) [English translation for reference only]
167
2 Summary of significant accounting policies and accounting estimates (Cont’d)
(11) Long-term equity investments (Cont’d)
(b) Subsequent measurement and recognition methods of gains and losses Long-term equity investments accounted for using the cost method are measured at the initial investment cost. Cash dividend or profit distribution declared by an investee is recognised as investment income in profit or loss for the current period. For long-term equity investments that are accounted for using the equity method, where the initial investment cost exceeds the Group’s share of the fair value of the investee’s identifiable net assets at the time of acquisition, the investment is initially measured at cost. Where the initial investment cost is less than the Group’s share of the fair value of the investee’s identifiable net assets at the time of acquisition, the difference is included in profit or loss for the current period and the cost of the long-term equity investment is adjusted upwards accordingly. Under the equity method, the Group recognises the investment income according to its share of net profit or loss of the investee. The Group discontinues recognising its share of the net losses of an investee after the carrying amounts of the long-term equity investment together with any long-term interests that in substance form part of the investor’s net investment in the investee are reduced to zero. However, if the Group has obligations for additional losses and the criteria with respect to recognition of provisions are satisfied, the Group continues recognising the estimated losses that it needs to bear. The changes of the Group’s share of the investee’s equity other than those arising from the net profit or loss, other comprehensive income and profit distribution, are recognised in the Group’s capital reserve and the carrying amounts of the long-term equity investment are adjusted accordingly. The carrying amount of the investment is reduced by the Group’s share of the profit distribution or cash dividends declared by an investee. The unrealised profits or losses arising from the transactions between the Group and its investees are eliminated in proportion to the Group’s equity interest in the investees, based on which the investment gain or losses are recognised. For the loss on the intra-group transaction amongst the Group and its investees attributable to asset impairment losses, any unrealised loss is not eliminated.
(c) Basis for determining existence of control, joint control, significant influence over investees Control means having power over an investee, enjoying variable returns through involvement in relevant activities of the investee, and being able to impact the amount of such variable returns by using the power over the investee. Joint control is the agreed sharing of control over an arrangement, and the decision of activities relating to such arrangement requires the unanimous consent of the Group and other parties sharing control.
Significant influence is the power to participate in making the decisions on financial and operating policies of the investee, but is not control or joint control over making those policies.
(d) Impairment of long-term equity investments The carrying amounts of long-term equity investments in subsidiaries, joint ventures and associates are reduced to the recoverable amounts when the recoverable amounts are below their carrying amounts (Note 2(19)).

S.F. HOLDING CO., LTD. NOTES TO THE FINANCIAL STATEMENTS FOR THE SIX MONTHS ENDED 30 JUNE 2021 (All amounts in RMB Yuan unless otherwise stated) [English translation for reference only]
168
2 Summary of significant accounting policies and accounting estimates (Cont’d)
(12) Investment properties Investment properties, including land use rights that have already been leased out, buildings that are held for the purpose of leasing and buildings that are being constructed or developed for future use for leasing, are measured initially at cost. Subsequent expenditures incurred in relation to an investment property are included in the cost of the investment property when it is probable that the associated economic benefits will flow to the Group and their costs can be reliably measured; otherwise, the expenditures are recognised in profit or loss for the period in which they are incurred. The Group adopts the cost model for subsequent measurement of investment properties. Buildings and land use rights are depreciated or amortised to their estimated net residual values over their estimated useful lives. The estimated useful lives, the estimated net residual values that are expressed as a percentage of cost and the annual depreciation rates of investment properties are presented as follows: Estimated
useful lives Estimated net
residual values Annual depreciation/
amortisation rates Buildings 10 to 50 years 5% 9.50% - 1.90% Land use rights 20 to 50 years 0% 5.00% - 2.00% When an investment property is transferred to self-used property, it is reclassified to fixed asset or intangible asset at the date of the transfer. When an self-used property is transferred out for earning rentals or for capital appreciation, the fixed asset or intangible asset is transferred to investment properties at the date of the transfer. Upon the transfer, amount is recognised at the carrying amount prior to the transfer. The investment property’s estimated useful life, net residual value and depreciation (amortisation) method applied are reviewed and adjusted as appropriate at each year-end. An investment property is derecognised on disposal or when the investment property is permanently withdrawn from use and no future economic benefits are expected from its disposal. The net amount of proceeds from sale, transfer, retirement or damage of an investment property net of its carrying amount and related taxes and expenses is recognised in profit or loss for the current period.

S.F. HOLDING CO., LTD. NOTES TO THE FINANCIAL STATEMENTS FOR THE SIX MONTHS ENDED 30 JUNE 2021 (All amounts in RMB Yuan unless otherwise stated) [English translation for reference only]
169
2 Summary of significant accounting policies and accounting estimates (Cont’d) (13) Fixed assets
(a) Recognition and initial measurement of fixed assets
Fixed assets comprise buildings, motor vehicles, computers and electronic equipment, aircraft and aircraft engines, rotables and high-value aircraft maintenance tools, machinery and equipment, office equipment and other equipment. Fixed assets are recognised when it is probable that the associated economic benefits will flow to the Group and the related cost can be reliably measured. Fixed assets purchased or constructed are initially measured at cost at the time of acquisition. Subsequent expenditures incurred for a fixed asset are included in the cost of the fixed asset when it is probable that the associated economic benefits will flow to the Group and the related cost can be reliably measured. The carrying amount of the replaced part is derecognised. All the other subsequent expenditures are recognised in profit or loss for the period in which they are incurred.
(b) Depreciation method for fixed assets Except for replacement parts for overhaul of engine, fixed assets are depreciated using the straight-line method to allocate the recorded amount of the assets to their estimated residual values over their estimated useful lives. For the fixed assets that have been provided for impairment loss, the related depreciation charge is prospectively determined based upon the adjusted carrying amounts over their remaining useful lives. The estimated useful lives, the estimated net residual values expressed as a percentage of cost and the annual depreciation rates of fixed assets are presented as follows:
Estimated
useful lives Estimated net
residual values Annual
depreciation rates Buildings 10 to 50 years 5% 9.50% - 1.90% Motor vehicles (excluding
electromobiles) 2 to 5 years 0% - 5% 50.00% - 19.00% Motor vehicles (electromobiles) 2 years 5% 47.50% Machinery and equipment (excluding
automatic sorting equipment imported from abroad) 2 to 10 years 0% - 5% 50.00% - 9.50%
Machinery and equipment (automatic sorting equipment imported from abroad) 15 years 5% 6.33%
Computers and electronic equipment 2 to 5 years 0% - 5% 50.00% - 19.00% Aircraft and engine bodies 10 years 5% 9.50% Replacement parts for overhaul of
aircraft fuselage 1.5 to 10 years 0% 66.67% - 10.00% Rotables 10 years 5% 9.50% High-value aircraft maintenance tools 5 years 5% 19.00% Office equipment and other equipment 2 to 10 years 0% - 5% 50.00% - 9.50%

S.F. HOLDING CO., LTD. NOTES TO THE FINANCIAL STATEMENTS FOR THE SIX MONTHS ENDED 30 JUNE 2021 (All amounts in RMB Yuan unless otherwise stated) [English translation for reference only]
170
2 Summary of significant accounting policies and accounting estimates (Cont’d) (13) Fixed assets (Cont’d)
(b) Depreciation method for fixed assets (Cont'd)
Replacement parts for overhaul of engines are depreciated using the units-of-production method and taking the expected usable recurring number as the unit of production. The estimated useful life/expected usable recurring number and the estimated net residual value of a fixed asset and the depreciation method applied to the asset are reviewed, and adjusted as appropriate at each year-end.
(c) The carrying amounts of fixed assets are reduced to the recoverable amounts when the recoverable amounts are below their carrying amounts (Note 2(19)).
(d) Disposal of fixed assets A fixed asset is derecognised on disposal or when no future economic benefit is expected from its use or disposal. The amount of proceeds from disposals on sale, transfer, retirement or damage of a fixed asset net of its carrying amount and related taxes and expenses is recognised in profit or loss for the current period.
(14) Construction in progress Construction in progress is measured at actual cost. Actual cost comprises construction costs, installation costs, borrowing costs that are eligible for capitalisation and other costs necessary to bring the construction in progress ready for their intended use. Construction in progress is transferred to fixed assets when the assets are ready for their intended use, and depreciation begins from the following month. The carrying amount of construction in progress is reduced to the recoverable amount when the recoverable amount is below its carrying amount (Note 2(19)).

S.F. HOLDING CO., LTD. NOTES TO THE FINANCIAL STATEMENTS FOR THE SIX MONTHS ENDED 30 JUNE 2021 (All amounts in RMB Yuan unless otherwise stated) [English translation for reference only]
171
2 Summary of significant accounting policies and accounting estimates (Cont’d)
(15) Borrowing costs The Group’s borrowing costs that are directly attributable to the acquisition and construction of a fixed asset that needs a substantially long period of time for its intended use commence to be capitalised and recorded as part of the cost of the asset when expenditures for the asset and borrowing costs have been incurred, and the activities relating to the acquisition and construction that are necessary to prepare the asset for its intended use have commenced. The capitalisation of borrowing costs ceases when the asset under acquisition or construction becomes ready for its intended use and the borrowing costs incurred thereafter are recognised in profit or loss for the current period. Capitalisation of borrowing costs is suspended during periods in which the acquisition or construction of a fixed asset is interrupted abnormally and the interruption lasts for more than 3 months, until the acquisition or construction is resumed. For the specific borrowings obtained for the acquisition or construction of an asset qualifying for capitalisation, the amount of borrowing costs eligible for capitalisation is determined by deducting any interest income earned from depositing the unused specific borrowings in the banks or any investment income arising on the temporary investment of those borrowings during the capitalisation period. For general borrowings utilised for the acquisition and construction of an asset qualifying for capitalisation, the capitalised amount of the general borrowings is determined by the weighted average of the excess of accumulated capital expenditure over capital expenditure of the special borrowings multiplied by the weighted average effective interest rate of the utilised general borrowings. The effective interest rate is the interest rate at which the future cash flows of the borrowings over the estimated life or a shorter applicable period are discounted into the initial recognised amount of the borrowings.
(16) Intangible assets
Intangible assets include software, land use rights, trademark rights, customer relationships, patents, etc. and the Group choose to use cost model.
(a) Software Software is measured at actual cost and amortised on the straight-line basis over 2 to 10 years.
(b) Land use rights Land use rights are amortised on the straight-line basis over 33 to 50 years.
(c) Trademark rights Purchased trademark rights are measured at cost at the time of acquisition. Trademark rights recognised under business combinations involving enterprises not under common control are recorded at fair value. Trademark rights are amortised on the straight-line basis over 5 to 20 years.
(d) Customer relationships
Customer relationships refer to intangible assets recognised under business combinations involving enterprises not under common control. Customer relationships are recorded at fair value and amortised on the straight-line basis over the expected beneficial period.

S.F. HOLDING CO., LTD. NOTES TO THE FINANCIAL STATEMENTS FOR THE SIX MONTHS ENDED 30 JUNE 2021 (All amounts in RMB Yuan unless otherwise stated) [English translation for reference only]
172
2 Summary of significant accounting policies and accounting estimates (Cont’d)
(16) Intangible assets (Cont’d) (e) Patents
Patents are amortised on the straight-line basis over 5 to 10 years.
(f) Periodical review of useful life and amortisation method
For an intangible asset with a finite useful life, review of its useful life and amortisation method is performed at each year-end, with adjustment made as appropriate.
(g) Impairment of intangible assets The carrying amounts of intangible assets are reduced to the recoverable amounts when the recoverable amounts are below their carrying amounts (Note 2(19)).
(17) Research and development The expenditure on an internal research and development project is classified into expenditure on the research phase and expenditure on the development phase based on its nature and whether there is material uncertainty that the research and development activities can form an intangible asset at the end of the project. Expenditure on the research phase is recognised in profit or loss in the period in which it is incurred. Expenditure on the development phase is capitalised only if all of the following conditions are satisfied:
it is technically feasible to complete the intangible asset so that it will be available for use or sales;
management intends to complete the intangible asset, and use or sell it;
it can be demonstrated how the intangible asset will generate economic benefits;
there are adequate technical, financial and other resources to complete the development and the ability to use or sell the intangible asset; and
the expenditure attributable to the intangible asset during its development phase can be reliably measured.
Other development expenditures that do not meet the conditions above are recognised in profit or loss in the period in which they are incurred. Capitalised development expenditures previously recognised as expenses are not recognised as an asset in a subsequent period. Capitalised expenditure on the development phase is presented as capitalised development expenditures in the balance sheet and transferred to intangible assets at the date when the asset is ready for its intended use.

S.F. HOLDING CO., LTD. NOTES TO THE FINANCIAL STATEMENTS FOR THE SIX MONTHS ENDED 30 JUNE 2021 (All amounts in RMB Yuan unless otherwise stated) [English translation for reference only]
173
2 Summary of significant accounting policies and accounting estimates (Cont’d)
(18) Long-term prepaid expenses Long-term prepaid expenses include settling-in allowance and introduction fee for pilots, the expenditure for improvements to right-of-use assets, and other expenditures that have been incurred but should be recognised as expenses over more than one year in the current and subsequent periods. Long-term prepaid expenses are amortised on a straight-line basis over the expected beneficial period (2 to 15 years) and are presented at actual expenditure net of accumulated amortisation.
(19) Impairment of long-term assets Fixed assets, construction in progress, right-of-use assets, intangible assets with finite useful lives, investment properties measured using the cost model and long-term equity investments in subsidiaries, joint ventures and associates are tested for impairment if there is any indication that the assets may be impaired at the balance sheet date; intangible assets not ready for their intended use are tested at least annually for impairment, irrespective of whether there is any indication that it may be impaired. If the result of the impairment test indicates that the recoverable amount of an asset is less than its carrying amount, a provision for impairment and an asset impairment loss are recognised for the amount by which the asset’s carrying amount exceeds its recoverable amount. The recoverable amount is the higher of an asset’s fair value less costs to sell and the present value of the future cash flows expected to be derived from the asset. Provision for asset impairment is determined and recognised on individual asset basis. If it is not possible to estimate the recoverable amount of an individual asset, the recoverable amount of a group of assets to which the asset belongs is determined. A group of assets is the smallest group of assets that is able to generate independent cash inflows. Goodwill that is separately presented in the financial statements is tested at least annually for impairment, irrespective of whether there is any indication that it may be impaired. In conducting the test, the carrying amount of goodwill is allocated to the related asset groups or sets of asset groups which are expected to benefit from the synergies of the business combination. If the result of the test indicates that the recoverable amount of an asset group or a set of asset groups, including the allocated goodwill, is lower than its carrying amount, the corresponding impairment loss is recognised. The impairment loss is first deducted from the carrying amount of goodwill that is allocated to the asset group or the set of asset groups, and then deducted from the carrying amounts of other assets within the asset group or the set of asset groups in proportion to the carrying amounts of assets other than goodwill. Once the above asset impairment loss is recognised, it will not be reversed for the value recovered in the subsequent periods.

S.F. HOLDING CO., LTD. NOTES TO THE FINANCIAL STATEMENTS FOR THE SIX MONTHS ENDED 30 JUNE 2021 (All amounts in RMB Yuan unless otherwise stated) [English translation for reference only]
174
2 Summary of significant accounting policies and accounting estimates (Cont’d)
(20) Employee benefits
Employee benefits refer to all forms of consideration or compensation given by the Group in exchange for service rendered by employees or for termination of employment relationship, which include short-term employee benefits, post-employment benefits, termination benefits and other long-term employee benefits.
(a) Short-term employee benefits Short-term employee benefits include employee wages or salaries, bonus, allowances and subsidies, staff welfare, premiums or contributions on medical insurance, work injury insurance and maternity insurance, housing funds, union running costs and employee education costs. The employee benefit liabilities are recognised in the accounting period in which the service is rendered by the employees, with a corresponding charge to the profit or loss for the current period or the cost of relevant assets. Employee benefits which are non-monetary benefits are measured at fair value.
(b) Post-employment benefits The Group classifies post-employment benefits plans into defined contribution plans and defined benefit plans. Defined contribution plans are post-employment benefit plans under which the Group pays fixed contributions into a separate fund and will have no obligation to pay further contributions; and defined benefit plans are post-employment benefit plans other than defined contribution plans. During the reporting period, the Group’s post-employment benefits mainly included basic pension insurance and unemployment insurance, both of which belong to defined contribution plans. Basic pension insurance The Group’s employees participate in the basic pension plan set up and administered by local authorities of Ministry of Human Resource and Social Security. Monthly payments of premiums on the pensions are calculated according to local regulations for pension plan. When employees retire, the local labour and social security authority is obliged to pay the basic pensions to them. The amounts based on the above calculations are recognised as liabilities in the accounting period in which the service has been rendered by the employees, with a corresponding charge to the profit or loss for the current period or the cost of relevant assets.
(c) Termination benefits The Group provides compensation for terminating the employment relationship with employees before the end of the employment contracts or as an offer to encourage employees to accept voluntary redundancy before the end of the employment contracts. The Group recognises a liability arising from compensation for termination of the employment relationship with employees, with a corresponding charge to profit or loss for the current period at the earlier of the following dates: 1) when the Group cannot unilaterally withdraw an employment termination plan or a curtailment proposal; 2) when the Group recognises costs or expenses related to a restructuring that involves the payment of termination benefits. The termination benefits expected to be settled within one year since the balance sheet date are classified as current liabilities.

S.F. HOLDING CO., LTD. NOTES TO THE FINANCIAL STATEMENTS FOR THE SIX MONTHS ENDED 30 JUNE 2021 (All amounts in RMB Yuan unless otherwise stated) [English translation for reference only]
175
2 Summary of significant accounting policies and accounting estimates (Cont’d)
(20) Employee benefits (Cont’d)
(d) Employee incentives The Group provides incentive plans for on-the-job employees who comply with certain conditions, and makes payments based on the schedule. Provisions for employee incentives are initially measured at the best estimate necessary to settle the present obligation, and expensed as incurred. The Group integrates separation rate, time value of money and other factors into account at initial measurement. Where the effect of the time value of money is material, the best estimate is determined by discounting the related future cash outflows. The increase in the discounted amount of the provision arising from passage of time is expensed as incurred. The carrying amount of provisions for employee incentives is reviewed at each balance sheet date and adjusted to reflect the current best estimate.
(21) Deferred tax assets and deferred tax liabilities Deferred tax assets and deferred tax liabilities are calculated and recognised based on the differences arising between the tax bases of assets and liabilities and their carrying amounts (temporary differences). Deferred tax asset is recognised for the deductible tax losses that can be carried forward to subsequent years for deduction of the taxable profit in accordance with the tax laws. No deferred tax liability is recognised for a temporary difference arising from the initial recognition of goodwill. No deferred tax asset or deferred tax liability is recognised for the temporary differences resulting from the initial recognition of assets or liabilities due to a transaction other than a business combination, which affects neither accounting profit nor taxable profit (or deductible tax losses). At the balance sheet date, deferred tax assets and deferred tax liabilities are measured at the tax rates that are expected to apply to the period when the asset is realised or the liability is settled.

S.F. HOLDING CO., LTD. NOTES TO THE FINANCIAL STATEMENTS FOR THE SIX MONTHS ENDED 30 JUNE 2021 (All amounts in RMB Yuan unless otherwise stated) [English translation for reference only]
176
2 Summary of significant accounting policies and accounting estimates (Cont’d)
(21) Deferred tax assets and deferred tax liabilities (Cont’d) Deferred tax assets are only recognised for deductible temporary differences, deductible tax losses and tax credits to the extent that it is probable that taxable profit will be available in the future against which the deductible temporary differences, deductible tax losses and tax credits can be utilised. Deferred tax liabilities are recognised for temporary differences arising from investments in subsidiaries, associates and joint ventures, except where the Group is able to control the timing of reversal of the temporary difference, and it is probable that the temporary difference will not reverse in the foreseeable future. When it is probable that the temporary differences arising from investments in subsidiaries, associates and joint ventures will be reversed in the foreseeable future and that the taxable profit will be available in the future against which the temporary differences can be utilised, the corresponding deferred tax assets are recognised. Deferred tax assets and deferred tax liabilities are offset when:
the deferred tax assets and liabilities are related to the same tax payer within the Group and the same taxation authority; and,
that tax payer within the Group has a legally enforceable right to offset current tax assets against current tax liabilities.
(22) Provisions
Provisions are recognised when the Group has a present obligation, it is probable that an outflow of economic benefits will be required to settle the obligation, and the amount of the obligation can be measured reliably. A provision is initially measured at the best estimate of the expenditure required to settle the related present obligation. Factors surrounding a contingency, such as the risks, uncertainties and the time value of money, are taken into account as a whole in reaching the best estimate of a provision. Where the effect of the time value of money is material, the best estimate is determined by discounting the related future cash outflows. The increase in the discounted amount of the provision arising from passage of time is recognised as interest expense. The carrying amount of provisions is reviewed at each balance sheet date and adjusted to reflect the current best estimate. The provisions expected to be settled within one year since the balance sheet date are classified as current liabilities.

S.F. HOLDING CO., LTD. NOTES TO THE FINANCIAL STATEMENTS FOR THE SIX MONTHS ENDED 30 JUNE 2021 (All amounts in RMB Yuan unless otherwise stated) [English translation for reference only]
177
2 Summary of significant accounting policies and accounting estimates (Cont’d)
(23) Share-based payments (a) Categories of share-based payments
A share-based payment is a transaction in which an enterprise grants equity instruments or assumes liabilities that are determined based on equity instruments, in exchange for services rendered by employees or another party. Equity instruments include the equity instruments that are linked to the enterprise, the parent company of the enterprise or another accounting entity within the same group. Share-based payments comprise equity-settled and cash-settled payments.
(b) Basis for determining the best estimate of exercisable equity instruments At each balance sheet date in the vesting period, the Group would make best estimate in
accordance with the newly acquired information such as changes in the number of employees entitled to equity instruments, and amend the number of exercisable equity instruments. On the exercisable date, the ultimate estimated number of exercisable equity instruments coincides with the actual number.
(c) Accounting treatment of implementation of share-based payments (i) Equity-settled share-based payments The equity-settled share-based payments where the Group grants shares or other equity
instruments as a consideration in return for services, are measured at the fair value of the equity instruments at the grant date. Where the share-based payments are not exercisable until the service in the vesting period is completed or specified performance conditions are met, then at each balance sheet date within the vesting period, the service obtained in the current period shall be included in relevant cost or expenses and in capital reserve at the fair value of the equity instruments at the grant date based on the best estimates of the quantity of exercisable equity instruments made by the Group, in accordance with latest changes in the number of exercisable employees and subsequent information.
(ii) Cash-settled share-based payments The cash-settled share-based payments where the Group calculates and determines the cash
payments or any other asset obligation on the basis of shares or other equity instruments in return for services, are measured at the fair value of the liabilities calculated based on relevant equity instruments. Where the share-based payments are not exercisable until the service in the vesting period is completed or specified performance conditions are met, then at each balance sheet date within the vesting period, the service obtained in the current period shall be included in cost or expenses and in liabilities at the fair value of the Group’s liabilities based on the best estimates of the quantity of exercisable equity instruments made by the Group. At each balance sheet date and settlement date before relevant liabilities are settled, the fair value of the liabilities is remeasured and the changes are recognised in profit or loss.

S.F. HOLDING CO., LTD. NOTES TO THE FINANCIAL STATEMENTS FOR THE SIX MONTHS ENDED 30 JUNE 2021 (All amounts in RMB Yuan unless otherwise stated) [English translation for reference only]
178
2 Summary of significant accounting policies and accounting estimates (Cont’d) (24) Factoring
The factoring business of the Group mainly represents factoring with recourse. Factoring with recourse is a kind of financing activity where the customer transfers the creditor’s rights of accounts receivable that meet relevant requirements and are accepted by the Group to the Group according to the purchase and sale contract and relevant agreements, so as to obtain short-term trade financing, and agrees to repurchase the financing business in full if the creditor’s rights cannot be recovered in full. The Group’s factoring business is accounted for with factoring receivables based on the amount paid for the creditor’s rights of accounts receivable (Note 2(9)).
(25) Government grants
Government grants refer to the monetary or non-monetary assets obtained by the Group from the government, including tax return, financial subsidy, etc. Government grants are recognised when the grants can be received and the Group can comply with all attached conditions. If a government grant is a monetary asset, it will be measured at the amount received or receivable. If a government grant is a non-monetary asset, it will be measured at its fair value. If it is unable to obtain its fair value reliably, it will be measured at its nominal amount. Government grants related to assets refer to the government grants which are obtained by the Group for the purposes of purchase, construction or to form long-term assets in other ways. Government grants related to income refer to the government grants other than those related to assets. Government grants related to assets are recorded as deferred income and recognised in profit or loss on a systemic basis over the useful lives of the assets. Government grants related to income that compensate the future costs, expenses or losses are recorded as deferred income and recognised in profit or loss, or deducted against related costs, expenses or losses in reporting the related expenses; government grants related to income that compensate the incurred costs, expenses or losses are recognised in profit or loss, or deducted against related costs, expenses or losses directly in the current period. The Group applies the presentation method consistently to the similar government grants in the financial statements. Government grants related to daily activities are included in operating profit. Government grants not related to daily activities are included in non-operating income or expenses. Policy-based loans with prime rate to the Group are recorded at actual amount of borrowing received, and related borrowing costs are calculated with borrowing principal and policy-based prime rate. Financial discounts directly received by the Group are deducted against related borrowing costs.

S.F. HOLDING CO., LTD. NOTES TO THE FINANCIAL STATEMENTS FOR THE SIX MONTHS ENDED 30 JUNE 2021 (All amounts in RMB Yuan unless otherwise stated) [English translation for reference only]
179
2 Summary of significant accounting policies and accounting estimates (Cont’d)
(26) Revenue recognition The Group recognises revenue at the consideration that the Group is entitled to charge as expected when the Group has fulfilled the performance obligations in the contract, that is, the customer obtains control over relevant goods or services. The Group transfers control of a good or service over time and, therefore, satisfies a performance obligation and recognises revenue over time, if one of the following criteria is met:
the customer simultaneously receives and consumes the benefits provided by the Group’s performance as the Group performs;
the Group’s performance creates or enhances an asset that the customer controls as the asset is created or enhanced; or
the Group’s performance does not create an asset with an alternative use to the Group and the Group has an enforceable right to payment for performance completed to date.
Otherwise, revenue is recognised at a point in time when the customer obtains control over relevant goods or services. In respect of a contract obligation that is to be fulfilled within a period, the Group should recognise the revenue based on the progress of the obligation fulfilment within the period, except that the progress of the obligation fulfilment fails to be reasonably determined; in respect of a contract obligation that is to be fulfilled at a point in time, the Group should recognise the revenue once the customer obtains the control over relevant goods or services.
(a) Rendering express & logistics and supply chain services The Group’s revenue from express & logistics and supply chain services includes revenue from inbound express delivery services including time-definite express and economy express, revenue from outbound express delivery services, revenue from cold-chain transportation services, revenue from domestic and international transport services of aviation cargoes, revenue from express delivery agency services; revenue from rendering of warehousing service; revenue from freight services; revenue from intra-city instant delivery and revenue from supply chain service etc. The Group recognises revenue based on the progress of the service performed within period, which is determined based on proportion of costs incurred to date to the estimated total costs. As at the balance sheet date, the Group re-estimates the progress of the service performed to reflect the actual status of contract performance. When the Group recognises revenue based on the progress of the service performed, the amount with unconditional right to consideration obtained by the Group is recognised as accounts receivable, and the rest is recognised as contract assets. Meanwhile, provision for accounts receivable and contract assets is recognised on the basis of expected credit losses (Note 2(9)). If the contract consideration received or receivable exceeds the progress of the service performed, the excess portion will be recognised as contract liabilities. Contract assets and contract liabilities under the same contract are presented on a net basis.

S.F. HOLDING CO., LTD. NOTES TO THE FINANCIAL STATEMENTS FOR THE SIX MONTHS ENDED 30 JUNE 2021 (All amounts in RMB Yuan unless otherwise stated) [English translation for reference only]
180
2 Summary of significant accounting policies and accounting estimates (Cont’d)
(26) Revenue recognition (Cont’d)
(a) Rendering express & logistics and supply chain services(Cont’d) Contract costs include costs to fulfil a contract and costs to obtain a contract. Costs incurred for provision of the aforesaid services are recognised as costs to fulfil a contract, which is carried forward to the cost of revenue when revenue recognised based on the progress of the service performed. Incremental costs incurred by the Group for the acquisition of the aforesaid service contract are recognised as the costs to obtain a contract. For the costs to obtain a contract with the amortisation period within one year, the costs are charged to profit or loss when incurred. For the costs to obtain a contract with the amortisation period beyond one year, the costs are charged in the current profit or loss on the same basis as aforesaid revenue of rendering of services recognised under the relevant contract. If the carrying amount of the contract costs is higher than the remaining consideration expected to be obtained by rendering of the service net of the estimated cost to be incurred, the Group makes provision for impairment on the excess portion and recognises it as asset impairment losses. As at the balance sheet date, based on whether the amortisation period of the costs to fulfil a contract is more than one year when initially recognised, the amount of the Group's costs to fulfil a contract net of related provision for asset impairment is presented as inventories or other non-current assets. For costs to obtain a contract with amortisation period beyond one year at the initial recognition, the amount net of related provision for asset impairment is presented as other non-current assets.
(b) Sales of goods Revenue from sales of goods is recognised when the Group has delivered goods to the agreed delivery location pursuant to the contract and the customer has confirmed the acceptance of the goods, and the delivery note is signed by both parties. The credit terms granted to customers by the Group are generally short, in line with industry practice, and do not have a significant financing component.
(c) Other services The Group’s services also include communication service, maintenance service, research and development and technical service and other services. With regard to certain maintenance service and research and development services, the Group recognises revenue at a point in time when the services are delivered to customers. For other services, the Group recognises revenue based on the progress of the service performed within period, which is determined based on proportion of costs incurred to date to the estimated total costs as at the balance sheet date.

S.F. HOLDING CO., LTD. NOTES TO THE FINANCIAL STATEMENTS FOR THE SIX MONTHS ENDED 30 JUNE 2021 (All amounts in RMB Yuan unless otherwise stated) [English translation for reference only]
181
2 Summary of significant accounting policies and accounting estimates (Cont’d)
(27) Dividend distribution
Cash dividends are recognised as liabilities in the period in which the dividends are approved by the shareholders’ meeting.
(28) Leases
A contract is, or contains, a lease if the contract conveys the right to control the use of an identified asset for a period of time in exchange for consideration.
(a) The Group as the lessee At the commencement date, the Group shall recognise the right-of-use asset and measure the lease liability at the present value of the lease payments that are not paid at that date. Lease payments include fixed payments, the exercise price of a purchase option if the lessee is reasonably certain to exercise that option, and payments of penalties for terminating the lease if the lessee exercises an option to terminate the lease. Variable lease payments in proportion to sales are excluded from lease payments and recognised in profit or loss as incurred. Lease liabilities that are due within one year (inclusive) as from the balance sheet date are included in the current portion of non-current liabilities.
Right-of-use assets of the Group comprise leased buildings, machinery and equipment and motor vehicles etc. Right-of-use assets are measured initially at cost which comprises the amount of the initial measurement of lease liabilities, any lease payments made at or before the commencement date and any initial direct costs, less any lease incentives received. If there is reasonable certainty that the Group will obtain ownership of the underlying asset by the end of the lease term, the asset is depreciated over its remaining useful life; otherwise the asset is depreciated over the shorter of the lease term and its remaining useful life. The carrying amount of the right-of-use assets is reduced to the recoverable amount when the recoverable amount is below the carrying amount (Note 2(19)). For short-term leases with a term of 12 months or less and leases of an individual asset (when new) of low value, the Group may, instead of recognising right-of-use assets and lease liabilities, include the lease payments in the cost of the underlying assets or in the profit or loss for the current period on a straight-line basis over the lease term. The Group shall account for a lease modification as a separate lease if both: (1) the modification increases the scope of the lease by adding the right to use one or more underlying assets; (2) the consideration for the lease increases by an amount commensurate with the stand-alone price for the increase in scope and any appropriate adjustments to that stand-alone price to reflect the circumstances of the contract. For a lease modification that is not accounted for as a separate lease, the Group shall redetermine the lease term at the effective date of the lease modification, and remeasure the lease liability by discounting the revised lease payments using a revised discount rate, except that the contract changes directly resulting from COVID-19 are accounted for by applying the practical expedient. For a lease modification which decreases the scope of the lease or shortens the lease term, the Group decreases the carrying amount of the right-of-use asset, and recognises in profit or loss any gain or loss relating to the partial or full termination of the lease. For other leases which lead to the remeasurement of lease liabilities, the Group correspondingly adjusts the carrying amount of the right-of-use asset.

S.F. HOLDING CO., LTD. NOTES TO THE FINANCIAL STATEMENTS FOR THE SIX MONTHS ENDED 30 JUNE 2021 (All amounts in RMB Yuan unless otherwise stated) [English translation for reference only]
182
2 Summary of significant accounting policies and accounting estimates (Cont’d)
(28) Leases (Cont’d)
(a) The Group as the lessee (Cont’d)
For the rental exemptions directly due to COVID-19 and being granted before 30 June 2022 only, the Group applies the practical expedient and records the exemption amount in profit or loss when the agreement is reached to dismiss the original payment obligation with corresponding adjustment of lease liabilities.
(b) The Group as the lessor A finance lease is a lease that transfers substantially all the risks and rewards incidental to ownership of an asset. An operating lease is a lease other than a finance lease.
(i) Operating leases
Where the Group leases out self-owned buildings, machinery and equipment, and motor vehicles under operating leases, lease income therefrom is recognised on a straight-line basis over the period of the lease. Variable rental that is linked to a certain percentage of sales is recognised in lease income as incurred. For the rental exemptions directly due to COVID-19 and being granted before 30 June 2022 only, the Group applies the practical expedient, accounts for the exemptions as variable lease payments and records the exemption amount in profit or loss in the exemption period. Except that the above contract changes directly resulting from COVID-19 are accounted for by applying the practical expedient, for a lease modification, the Group accounts for it as a new lease from the effective date of the modification, and considers any lease payments received in advance and receivable relating to the lease before modification as receivables of the new lease.
(ii) Finance leases At the commencement date of the lease term, the Group recognises the lease payments receivable under a finance lease and derecognises relevant assets. The finance lease receivables are presented as long-term receivables; finance lease receivables due within one year (inclusive) as from the balance sheet date are included in the current portion of non-current assets.

S.F. HOLDING CO., LTD. NOTES TO THE FINANCIAL STATEMENTS FOR THE SIX MONTHS ENDED 30 JUNE 2021 (All amounts in RMB Yuan unless otherwise stated) [English translation for reference only]
183
2 Summary of significant accounting policies and accounting estimates (Cont’d)
(29) Segment information The Group identifies operating segments based on the internal organisation structure, management requirements and internal reporting system, and discloses segment information of reportable segments which is determined on the basis of operating segments. An operating segment is a component of the Group that satisfies all of the following conditions: (1) the component is able to earn revenue and incur expenses from its ordinary activities; (2) whose operating results are regularly reviewed by the Group’s management to make decisions about resources to be allocated to the segment and to assess its performance, and (3) for which the information on financial position, operating results and cash flows is available to the Group. If two or more operating segments have similar economic characteristics and satisfy certain conditions, they are aggregated into one single operating segment.
(30) Critical accounting estimates and judgements The Group continually evaluates the critical accounting estimates and key judgements applied based on historical experience and other factors, including expectations of future events that are believed to be reasonable.
(a) Critical accounting estimates and key assumptions
(i) Measurement of expected credit losses For financial assets and contract assets at amortised cost, the Group calculates expected credit losses based on exposure at default and expected credit loss rates. The Group refers to internal historical information, such as credit losses, and considers the impact of historical credit loss experience according to current situation and forward-looking information to determine expected credit loss rates. And management takes the customer’s credit status, credit history, operating status as well as collaterals, the guarantee ability of the guarantor and other information into consideration. The Group monitors and reviews relevant assumptions about expected credit losses regularly. Where there is a difference between the actual bad debts and the original estimate, such difference will affect the Group’s provision for bad debts of the above assets in the future period.

S.F. HOLDING CO., LTD. NOTES TO THE FINANCIAL STATEMENTS FOR THE SIX MONTHS ENDED 30 JUNE 2021 (All amounts in RMB Yuan unless otherwise stated) [English translation for reference only]
184
2 Summary of significant accounting policies and accounting estimates (Cont’d)
(30) Critical accounting estimates and judgements (Cont’d)
(a) Critical accounting estimates and key assumptions (Cont’d)
(ii) Risk of impairment on long-term assets other than goodwill As described in Note 2(19), fixed assets with impairment indication, right-of-use assets, construction in progress, intangible assets, investment properties measured using cost model, long-term equity investments and other long-term assets are tested for impairment annually at the end of each year. When assessing whether the above assets are impaired, management mainly evaluates and analyses: (1) whether events affecting asset impairment occurred; (2) whether the present value of expected cash flows arising from the continuing use or disposal of the asset is lower than its carrying amount; and (3) whether the significant assumptions used in the calculation of the present value of the estimated cash flows are appropriate. Relevant assumptions adopted by the Group to determine impairment, e.g. changes in assumptions on discount rate and growth rate used to calculate the present value of future cash flows, may have material impact on the present value used in the impairment test, and cause impairment in the above-mentioned long-term assets of the Group.
(iii) Provision for impairment of goodwill The Group performed impairment assessment of goodwill at each balance sheet date. The recoverable amounts of asset groups and sets of asset groups that include goodwill have been determined by the higher of the fair value less costs of disposal and the present value of the future cash flows expected to be derived from the assets. These calculations require estimations and judgements. When the estimated recoverable amount is marginal, goodwill might suffer impairment. The details of the key assumptions applied by management please refer to Note 4(21).
(iv) Determination of fair value of financial instruments by valuation techniques. The fair value of a financial instrument that is not traded in an active market is determined by valuation techniques. Valuation techniques primarily refer to direct comparison method and income method, including reference to the prices used in recent orderly transactions between market participants, reference to the current fair value of other financial instruments that are substantially identical, discounted cash flow analysis, option pricing models, etc. Observable market information is applied in valuation techniques to the extent possible. When observable market information is not available, management will make estimate of significant unobservable information included in the valuation method. Different valuation techniques or inputs may lead to significant differences between fair value estimates.

S.F. HOLDING CO., LTD. NOTES TO THE FINANCIAL STATEMENTS FOR THE SIX MONTHS ENDED 30 JUNE 2021 (All amounts in RMB Yuan unless otherwise stated) [English translation for reference only]
185
2 Summary of significant accounting policies and accounting estimates (Cont’d)
(30) Critical accounting estimates and judgements (Cont’d)
(a) Critical accounting estimates and key assumptions (Cont’d)
(v) Recognition of deferred tax assets Deferred tax assets are recognised for the deductible tax losses and deductible temporary differences that can be carried forward to subsequent years to the extent that it is probable that taxable profit in the future will be available against which the deductible tax losses and deductible temporary differences can be utilised. Whether to recognise the deferred tax assets arising from deductible tax losses and deductible temporary differences largely depends on the judgement of management on: (i) whether the accumulated deductible tax losses and deductible temporary differences in prior years are still effective, and (ii) whether sufficient taxable income that can be used to deduct deductible tax losses and deductible temporary differences can be obtained in the future period. Where there is a difference between the situation and the original estimate, such difference will affect the Group’s deferred tax assets and income tax expenses in the future period.
(b) Critical judgements in applying the accounting policies
(i) Judgement on significant influence of the Group over investees The investees over which the Group has significant influence are accounted for under the equity method. In judging the significant influence over an investee, management considers based on one or more of the following circumstances and all facts and circumstances: (1) the shareholding in the investee; (2) whether it appoints representative in the Board of Directors or a similar authority of the investee; (3) whether it participates in making decisions on financial and operating policies of the investee; (4) whether it has significant transaction with the investee; (5) whether it assigns management personnel to the investee; (6) whether it provides key technical materials to the investee, and all facts and circumstances are considered.
(ii) Determination of the scope of consolidation As stated in Note 2(6), the Group consolidates a subsidiary from the date of obtaining actual control, and excludes it out of the scope of consolidation from the date of losing the actual control. Control exists when the Group has all three of the following elements: (1) the investor possesses power over the investee; (2) has exposure to variable returns from its involvement with the investee's related activities; and (3) the ability to use the power over the investee to affect the returns. Where variations in relevant facts and circumstances cause a change of these factors, a reassessment will be made.
(31) Significant changes in accounting policies In 2018, the Ministry of Finance released the revised Accounting Standard for Business Enterprises No. 21 - Lease (hereinafter referred to “new lease standard”). In 2021, the "Questions and Answers on the Implementation of Leasing Standards" were released. The Group and the Company initially adopted the new lease standard on 1 January 2021, the financial statements for the six months ended 30 June 2021 were prepared in accordance with the above standards and implementation questions and answers, impacts on the Group and the Company's statements are as follows:

S.F. HOLDING CO., LTD. NOTES TO THE FINANCIAL STATEMENTS FOR THE SIX MONTHS ENDED 30 JUNE 2021 (All amounts in RMB Yuan unless otherwise stated) [English translation for reference only]
186
2 Summary of significant accounting policies and accounting estimates (Cont’d)
(31) Significant changes in accounting policies (Cont’d)
(a) Leases
In accordance with relevant provisions of the new lease standard, the Group and the Company would not reassess the contracts that have already existed prior to the date of initial application. The Group and the Company recognised the cumulative effect of the standard as an adjustment to relevant line items of the financial statements as at 1 January 2021. The comparatives for the six months ended 30 June 2020 were not restated.
The contents and reasons of the changes in accounting
policies The line items affected The amounts affected
1 January 2021
Consolidated Company For the operating lease contracts that have already
existed prior to the initial application of the new lease standard, the Group and the Company distinguish different transitional methods based on the remaining lease term:
If the remaining lease term is more than 12 months, the
Group and the Company recognise lease liabilities based on the remaining lease payments and the incremental borrowing rate as at 1 January 2021, and right-of-use assets are measured at an amount equal to lease liabilities, adjusted by the amount of any prepaid lease payments, on a lease-by-lease basis.
The Group and the Company applied the practical
expedient for leases with a remaining term of 12 months or less and leases of low-value assets existing prior to the initial application of the new lease standard, under which the right-of-use assets and lease liabilities were not recognised. There was no significant impact on the financial statements.
Right-of-use assets 10,507,587,982.89 -
Lease liabilities (6,300,692,884.72) -
Current portion of non-current liabilities (3,663,438,518.83) -
Advances to suppliers (543,456,579.34) -
In applying the new lease standard, the Group and the
Company reclassified fixed assets held under finance leases from “fixed assets” to “right-of-use assets”, and finance lease payments from “long-term payables” to “lease liabilities”.
Right-of-use assets 30,336,729.87 -
Fixed assets (30,336,729.87) -
Long-term payables 3,497,566.20 -
Lease liabilities (3,497,566.20)
Current portion of non-current liabilities - long-term payables 11,634,205.09
-
Current portion of non-current liabilities - lease liabilities (11,634,205.09) -
As at 1 January 2021, the Group and the Company adopted the same discount rate for lease contracts with similar characteristics to account for lease liabilities. The weighted average of incremental borrowing rates adopted was 4.18%.

S.F. HOLDING CO., LTD. NOTES TO THE FINANCIAL STATEMENTS FOR THE SIX MONTHS ENDED 30 JUNE 2021 (All amounts in RMB Yuan unless otherwise stated) [English translation for reference only]
187
2 Summary of significant accounting policies and accounting estimates (Cont’d)
(31) Significant changes in accounting policies (Cont’d)
(a) Leases(Cont’d)
As at 1 January 2021, the Group and the Company reconciled the outstanding minimum operating lease payments disclosed under the old lease standard to lease liabilities under the new lease standard as follows:
Consolidated Company
Future minimum operating lease payments disclosed as at 31
December 2020 13,243,403,728.59 -
Less: lease contract effective after 1 January 2021(excluding tax
amount) (582,861,341.05) -
Value-added tax (689,897,933.24) -
Adjusted future minimum operating lease payments 11,970,644,454.30 -
Present value of the above minimum operating lease payments
discounted using the incremental borrowing rate 10,826,941,779.23 -
Add: Finance lease payable as at 31 December 2020 15,131,771.29 -
Less: Present value of lease payments with a term of 12 months or
less (862,810,375.68) -
Lease liabilities recognised as at 1 January 2021 (including current
portion of non-current liabilities) 9,979,263,174.84 -

S.F. HOLDING CO., LTD. NOTES TO THE FINANCIAL STATEMENTS FOR THE SIX MONTHS ENDED 30 JUNE 2021 (All amounts in RMB Yuan unless otherwise stated) [English translation for reference only]
188
3 Taxation The main categories and rates of taxes applicable to the Group are set out below: Category Tax rate Tax base Enterprise income tax Note (1) Taxable income Value-added tax (“VAT”) Note (2) Taxable value-added amount (Tax payable is
calculated using the taxable sales amount/taxable service income multiplied by the applicable tax rate less deductible VAT input of the current period or taxable turnover amount multiplied by the VAT rate)
City maintenance and construction tax
7%, 5%, 1% Amount of VAT paid
Educational surcharge 3% Amount of VAT paid Local educational
surcharge 2% Amount of VAT paid
Customs duty At applicable tax rate Customs dutiable value through examination and approval of the Customs
In addition, pursuant to the Interim Measures for the Collection, Use and Management of the Civil Aviation Development Fund (Cai Zong [2012] No. 17) issued by the Ministry of Finance, SF Airlines Company Limited (“SF Airlines”) pays the civil aviation development fund based on classification of flight routes, maximum take-off weight, flight mileage and applicable collection standards, and includes such payment in cost. The Announcement on the Cancellation of Port Construction Fees and Adjustment to Relevant Policies of the Civil Aviation Development Fund (Announcement [2021] No. 8) was issued by the Ministry of Finance on 19 March 2021. Since 1 April 2021, the collection standards for the civil aviation development fund payable by airlines has been reduced by 20% in accordance with the Notice of the Ministry of Finance on Adjusting the Relevant Policies of Certain Government Funds (Cai Shui [2019] No. 46) on the basis of a 50% reduction.
(1) Enterprise income tax Pursuant to the Announcement on Implementation of the Policy of Deduction of Relevant Enterprise Income Tax for Equipment and Appliance (Cai Shui [2018] No. 54), the Announcement on Extending the Implementation Period of Certain Preferential Tax Policies (Cai Shui [2021] No. 6) and related regulations issued by the Ministry of Finance and State Taxation Administration, for equipment newly purchased from 1 January 2018 to 31 December 2023 and with a unit value of less than RMB 5 million, the one-time period cost can be deducted against the taxable income in the following month after the asset is put into use, instead of being deducted annually in its useful life. Besides, the preferential enterprise income tax policies to which the Group is entitled mainly include:
(a) Pursuant to the Notice on the Policies and Catalogue of Income Tax Preferences for Enterprises in Guangdong Hengqin New Area, Fujian Pingtan Comprehensive Experimental Zone, and Shenzhen Qianhai Shenzhen-Hong Kong Modern Service Industry Cooperative Zone (Cai Shui [2014] No. 26) and the Notice on Continuing the Policies of Income Tax Preferences for Enterprises in Shenzhen Qianhai Shenzhen-Hong Kong Modern Service Industry Cooperative Zone (Cai Shui [2021] No. 30) jointly issued by the Ministry of Finance and the State Taxation Administration, the Group’s subsidiaries as below are subject to enterprise income tax at the preferential rate of 15% from 2014 to 2025.

S.F. HOLDING CO., LTD. NOTES TO THE FINANCIAL STATEMENTS FOR THE SIX MONTHS ENDED 30 JUNE 2021 (All amounts in RMB Yuan unless otherwise stated) [English translation for reference only]
189
3 Taxation (Cont'd)
(1) Enterprise income tax (Cont’d)
(a) (Cont’d)
Name of subsidiary Local statutory tax rate
Preferential tax rate
Guangdong S.F. E-commerce Co., Ltd. 25% 15% Shenzhen S.F. Supply Chain Co., Ltd. 25% 15% Shenzhen S.F. International Logistics Co., Ltd. 25% 15% Shenzhen S.F Information Service Technology Co., Ltd. 25% 15% Junhe Information Technology (Shenzhen) Co., Ltd. 25% 15% SF Sharing Precision Information Technology (Shenzhen) Co., Ltd. 25% 15%
(b) Pursuant to the Notice on Tax Policy Issues Concerning Further Implementing the Western China Development Strategy (Cai Shui [2011] No. 58) and the Notice on Issues Concerning the Implementation of the Tax Policies for the Development of Western China by Ganzhou City (Cai Shui [2013] No. 4) jointly issued by the Ministry of Finance, the General Administration of Customs and the State Taxation Administration, and the Announcement on Continuing the Enterprise Income Tax Policies for the Development of Western China (Announcement [2020] No. 23) jointly issued by the Ministry of Finance, the State Taxation Administration and the National Development and Reform Commission on 23 April 2020, the Group’s subsidiaries as below are subject to enterprise income tax at the preferential rate of 15% until the end of 2030:
Name of subsidiary Local statutory tax rate
Preferential tax rate
Xi'an Shunlu Logistics Co., Ltd. 25% 15% Chengdu Taishun Logistics Co., Ltd. 25% 15% Chongqing Huiyifeng Logistics Co., Ltd. 25% 15% S.F. Express (Chongqing) Co., Ltd. 25% 15% Guizhou S.F. Express Co., Ltd. 25% 15% Yunnan S.F. Express Co., Ltd. 25% 15% Sichuan S.F. Express Co., Ltd. 25% 15% Ganzhou S.F. Express Co., Ltd. 25% 15% Xi'an S.F. Express Co., Ltd. 25% 15% Guangxi S.F. Express Co., Ltd. 25% 15% S.F. Express (Ningxia) Co., Ltd. 25% 15% Inner Mongolia S.F. Express Co., Ltd. 25% 15% Xinjiang S.F. Express Co., Ltd. 25% 15% Qinghai S.F. Express Co., Ltd. 25% 15% Lanzhou S.F. Express Co., Ltd. 25% 15% Yunnan Shunhe Freight Co., Ltd. 25% 15% Qinghai S.F. Juyi Supply Chain Management Co., Ltd. 25% 15% Gansu Shunhefeng Freight Co., Ltd. 25% 15% Sichuan Wu Lian Yi Da Technology Co., Ltd. 25% 15%

S.F. HOLDING CO., LTD. NOTES TO THE FINANCIAL STATEMENTS FOR THE SIX MONTHS ENDED 30 JUNE 2021 (All amounts in RMB Yuan unless otherwise stated) [English translation for reference only]
190
3 Taxation (Cont'd)
(1) Enterprise income tax (Cont’d) (b) (Cont’d)
Name of subsidiary Local statutory tax rate
Preferential tax rate
Shaanxi S.F. Freight Co., Ltd. 25% 15% Sichuan Shunhefeng Freight Co., Ltd. 25% 15% Xinjiang Shunhefeng Freight Co., Ltd. 25% 15% Chongqing S.F. Zhida Supply Chain Management Co., Ltd. 25% 15% Chongqing Xuefeng Refrigerates Logistics Co., Ltd. 25% 15% Ningxia S.F. Freight Co., Ltd. 25% 15%
(c) Pursuant to the Notice on Tax Policy Issues Concerning Further Implementing the Western China
Development Strategy (Cai Shui [2011] No. 58) jointly issued by the Ministry of Finance, the General Administration of Customs and the State Taxation Administration, and the Announcement on Continuing the Enterprise Income Tax Policies for the Development of Western China (Announcement [2020] No. 23) jointly issued by the Ministry of Finance, the State Taxation Administration and the National Development and Reform Commission on 23 April 2020, the Group’s subsidiaries, which are registered in Tibet Autonomous Region, are subject to enterprise income tax at the preferential rate of 15% as stipulated in the Western China Development Strategy from 1 January 2011 to 31 December 2030. Pursuant to the Notice of the People’s Government of the Tibet Autonomous Region on Issuing the Regulations on Preferential Policies for Investment Promotion of the Tibet Autonomous Region (Provisional) (Zang Zheng Fa [2018] No. 25), the Group’s subsidiaries, which are registered in Tibet Autonomous Region are temporarily exempt from the region’s share of entitlement to enterprise income tax payable from 1 January 2018 to 31 December 2021. In other words, the region’s share of entitlement to 40% in the enterprise income tax payable at the rate of 15% is exempted during the above period.
Name of subsidiary Local statutory tax rate
Preferential tax rate
Tibet S.F. Express Co., Ltd. 25% 9%
(d) In accordance with Article 2 of the Notice on Implementing the Inclusive Tax Deduction and Exemption Policies for Micro and Small Enterprises (Cai Shui [2019] No. 13) jointly issued by the Ministry of Finance and the State Taxation Administration, from 1 January 2019 to 31 December 2021, the portion of the annual taxable income of micro and small enterprises not exceeding RMB 1 million is recognised at 25%, and they are subject to enterprise income tax at the rate of 20%; the portion of annual taxable income exceeding RMB 1 million but not exceeding RMB 3 million is recognised at 50%, and they are subject to enterprise income tax at the rate of 20%. In accordance with the Announcement on the Implementation of Matters Related to Supporting the Development of Policies of Income Tax Preferences for Micro and Small Enterprises and Individual Industrial and Commercial Households (Announcement [2021] No. 12) jointly issued by the Ministry of Finance and the State Taxation Administration on 2 April 2021, from 1 January 2021 to 31 December 2022, for the portion of annual taxable income of micro and small enterprises not exceeding RMB 1 million, on the basis of the above-mentioned preferential policies, the corporate income tax will be halved.

S.F. HOLDING CO., LTD. NOTES TO THE FINANCIAL STATEMENTS FOR THE SIX MONTHS ENDED 30 JUNE 2021 (All amounts in RMB Yuan unless otherwise stated) [English translation for reference only]
191
3 Taxation (Cont'd)
(1) Enterprise income tax (Cont’d)
(d) (Cont'd) Therefore, the portion of annual taxable income of the Group’s subsidiaries not exceeding RMB 1 million is recognised at 12.5%, and they are subject to enterprise income tax at the rate of 20%; the portion of annual taxable income of the Group’s subsidiaries exceeding RMB 1 million but not exceeding RMB 3 million is recognised at 50%, and they are subject to enterprise income tax at the rate of 20%:
Name of subsidiary Local statutory tax rate
Preferential tax rate
Ningbo Shuncheng Logistics Co., Ltd. 25% 20% Guizhou Shunlu Logistics Co., Ltd. 25% 20% Ezhou Shunlu Logistics Co., Ltd. 25% 20% Zhengzhou Shuncheng Logistics Co., Ltd. 25% 20% Shenzhen S.F. Research Institution Co., Ltd. 25% 20% Shanghai Chengbai Technology Co., Ltd. 25% 20% Shenyang Fengtai E-Commerce Industrial Park
Management Co., Ltd. 25% 20% Xuzhou Fengtai Industrial Park Management Co., Ltd. 25% 20% Ezhou Fengtai Qisheng Logistics Development Co., Ltd. 25% 20% Ezhou Fengyutai Helin Logistics Development Co., Ltd. 25% 20% Ganzhou Fengtai Industrial Park Management Co., Ltd. 25% 20% Yangzhou Fengyutai Enterprise Management Co., Ltd. 25% 20% Shanghai Fengtai Yuanxing Property Management Service
Co., Ltd. 25% 20% Shenzhen Fengtai E-Commerce Industrial Park Property
Service Co., Ltd. 25% 20% Taizhou Fengtai E-Commerce Industrial Park Operation
and Management Co., Ltd. 25% 20% Taixing Fengtai Industrial Park Operation and Management
Co., Ltd. 25% 20% Wuxi Jietai Enterprise Management Co., Ltd. 25% 20% Huai'an Fengtai Enterprise Management Co., Ltd. 25% 20% Quanzhou Fengyutai Enterprise Management Co., Ltd. 25% 20% Hefei Jietai Enterprise Management Co., Ltd. 25% 20% Beijing Fengyutai Operations and Management Co., Ltd. 25% 20% Shenzhen Shunfeng Runtai Management Consulting Co.,
Ltd. 25% 20% Guangxi Shunnongfengwei Technology Co., Ltd. 25% 20% Caihuilian Technology (Shenzhen) Co., Ltd. 25% 20% Dongguan Jiada Express Service Co., Ltd. 25% 20% Shenzhen Xuefeng Cold Chain Logistics Co., Ltd. 25% 20% Changsha Xueyuan Cold Chain Logistics Co., Ltd. 25% 20% Shanghai S.F. Cold Chain Co., Ltd. 25% 20% Shanghai Taigenrun Enterprise Management Co., Ltd. 25% 20% Dongguan Fengtai Enterprise Management Co., Ltd. 25% 20% Beijing Fengjietai Enterprise Management Co., Ltd. 25% 20% Dalian Fengtai Industrial Park Operation and Management
Co., Ltd. 25% 20% Liuzhou Fengyutai Industrial Park Management Co., Ltd. 25% 20% Jinan Fengtai Industrial Park Management Co., Ltd. 25% 20% Weifang Fengtai Industrial Park Management Co., Ltd. 25% 20%

S.F. HOLDING CO., LTD. NOTES TO THE FINANCIAL STATEMENTS FOR THE SIX MONTHS ENDED 30 JUNE 2021 (All amounts in RMB Yuan unless otherwise stated) [English translation for reference only]
192
3 Taxation (Cont'd)
(1) Enterprise income tax (Cont'd) (d) (Cont'd)
Name of subsidiary Local statutory tax rate
Preferential tax rate
Exel Supply Chain (Xiamen) Co., Ltd. 25% 20% Shanxi S.F. Zhida Supply Chain Management Co., Ltd. 25% 20% Jinjiang Jietai Enterprise Management Co., Ltd. 25% 20% Xiamen Fengyutai Industrial Park Management Co., Ltd. 25% 20% Nanning Fengyutai Enterprise Management Co., Ltd. 25% 20% Changsha Hongjie Industrial Park Operation and
Management Co., Ltd. 25% 20% Luoyang Fengtai Industrial Park Management Co., Ltd. 25% 20% Shenzhen Kuaichijunma Information Technology Co., Ltd. 25% 20% Huai'an Fengyutai Enterprise Management Co., Ltd. 25% 20% Hebi Fengtai Industrial Park Asset Management Co., Ltd. 25% 20% Suzhou Fengtai E-commerce Industrial Park Management
Co., Ltd. 25% 20% Suzhou Fengtai Cross-border E-commence Industrial Park
Service Co., Ltd. 25% 20% Beijing Yijie Enterprise Management Co., Ltd. 25% 20% Shenzhen S.F. Kuaicha Technology Co., Ltd. 25% 20% Shenzhen S.F. International Industry Co., Ltd. 25% 20% Yirongcheng Information Service (Wuhan) Co., Ltd. 25% 20% Shenzhen Fengwang Holdings Co., Ltd. 25% 20% Chongqing Jieyutai Enterprise Management Co., Ltd. 25% 20%
(e) As per Article 28 of the Enterprise Income Tax Law of the People’s Republic of China, the high and new technology enterprises eligible for key support from the State are entitled to a reduced tax rate of 15%. Through filing with local taxation bureaus, the Group’s subsidiaries as below are qualified as high and new technology enterprises, and entitled to the preferential tax rates for high and new technology enterprises eligible for key support from the State. The subsidiaries as below are subject to a tax rate of 15% in the reporting period. (2020: 10% (SF Technology) and 15%)
Name of subsidiary Local statutory tax rate
Preferential tax rate
S.F. Hengtong Pay Co., Ltd. 25% 15% Beijing S.F. Intra-city Technology Co., Ltd. 25% 15% SF Technology Co., Ltd. (“SF Technology”) 25% 15% Shenzhen Fengyi Technology Co., Ltd. 25% 15% Fengtu Technology (Shenzhen) Co., Ltd. 25% 15%

S.F. HOLDING CO., LTD. NOTES TO THE FINANCIAL STATEMENTS FOR THE SIX MONTHS ENDED 30 JUNE 2021 (All amounts in RMB Yuan unless otherwise stated) [English translation for reference only]
193
3 Taxation (Cont'd)
(1) Enterprise income tax (Cont'd)
(f) Pursuant to the Notice on the Policies of Income Tax Preferences for Enterprises in Hainan Free Trade Port (Cai Shui [2020] No. 31) jointly issued by the Ministry of Finance and the State Taxation Administration, the Group’s subsidiaries, which are registered in Hainan Free Trade Port, are subject to enterprise income tax at the preferential rate of 15% from 1 January 2020 to 31 December 2024.
Name of subsidiary Local statutory tax rate
Preferential tax rate
Hainan S.F. Express Co., Ltd. 25% 15% Hainan SF Freight Co., Ltd. 25% 15% In addition, the Group’s subsidiaries located in Hong Kong, Macao, Singapore, Japan, Korea and USA are subject to enterprise income tax at the rates of 16.5%, 12%, 17%, 23.2%, 22% and 21% respectively in the reporting period. In addition to the above subsidiaries, the Company and the Group’s other major subsidiaries are subject to enterprise income tax at the rate of 25%.

S.F. HOLDING CO., LTD. NOTES TO THE FINANCIAL STATEMENTS FOR THE SIX MONTHS ENDED 30 JUNE 2021 (All amounts in RMB Yuan unless otherwise stated) [English translation for reference only]
194
3 Taxation (Cont'd)
(2) VAT According to different businesses, VAT rates applicable to the Group include: Business type Applicable VAT rates Sales of goods and tangible movable
property leasing 13%
Transportation service (i) (ii) 9% Logistics supporting service (i) (ii) (iii) 6% 3% (applicable to small-scale taxpayers before 1 March
2020) 1% (applicable to small-scale taxpayers excluding those of
Hubei Province from 1 March 2020 to 31 December 2021) 0% (applicable to small-scale taxpayers of Hubei Province
from 1 March 2020 to 31 December 2021) Research and development and
technical service 6%
Information technology service 6% Property leases 9%
(i) Pursuant to the Announcement on Policies for Deepening the Value-Added Tax Reform (Cai Shui [2019] No. 39) and the Announcement on Clarifying the Additional Value-Added Tax Credit Policy for the Life Service Industry (Cai Shui [2019] No. 87), from 1 April 2019 to 31 December 2021, taxpayers whose sales amount from providing postal service, telecommunication service, modern service and life services accounts for more than 50% of the total sales amount are allowed to credit the amount of input tax deductible in the current period plus 10% thereof against the amount of taxes payable; from 1 October 2019 to 31 December 2021, taxpayers whose sales amount from providing life services accounts for more than 50% of the total sales amount are allowed to credit the amount of input tax deductible in the current period plus 15% thereof against the amount of taxes payable.

S.F. HOLDING CO., LTD. NOTES TO THE FINANCIAL STATEMENTS FOR THE SIX MONTHS ENDED 30 JUNE 2021 (All amounts in RMB Yuan unless otherwise stated) [English translation for reference only]
195
3 Taxation (Cont'd)
(2) VAT (Cont'd)
(ii) In accordance with the Announcement on Relevant Tax Policies Supporting the Prevention and Control of the Outbreak of Novel Coronavirus Pneumonia (COVID-19) (Announcement [2020] No. 8) and the Announcement on the Implementation Period of the Tax and Fee Polices Supporting the Prevention and Control of the COVID-19 Outbreak, the Guarantee of Supply During the COVID-19 Outbreak and Other Matters (Announcement [2020] No. 28) jointly issued by the Ministry of Finance and the State Taxation Administration on 6 February 2020 and 15 May 2020 respectively, from 1 January 2020 to 31 December 2020, taxpayers’ revenue from transportation of key supporting materials for epidemic prevention and control, provision of public transportation services, living services as well as the express delivery service of essential living materials for residents will be exempted from VAT, city maintenance and construction tax, educational surcharge and local educational surcharge. Pursuant to the Announcement of the Ministry of Finance and the State Taxation Administration on Continuing the Implementation of Policies of Partial Tax Preferences in Response to COVID-19 (Announcement [2021] No. 7) jointly issued by the Ministry of Finance and the State Taxation Administration on 17 March 2021, the above policies of tax preferences were extended to 31 March 2021.
(iii) Pursuant to the Announcement on the Value-Added Tax Policies on Supporting the Resumption of Work and Business of Individual Industrial and Commercial Households (Announcement [2020] No. 13) and the Announcement on Extending the Applicable Period of the Policies for Reduction and Exemption of Value-added Tax on Small-scale Taxpayers (Announcement [2020] No. 24) jointly issued by the Ministry of Finance and the State Taxation Administration on 28 February 2020 and 30 April 2020 respectively, from 1 March to 31 December 2020, taxable sales revenue of small-scale taxpayers of Hubei Province subject to VAT at the rate of 3% before shall be exempted from VAT; while the prepaid VAT items subject to the prepaid collection rate of 3% before shall be suspended for the prepayment of VAT. Taxable sales revenue of small-scale taxpayers in other provinces, autonomous regions and municipalities directly under the central government excluding Hubei Province subject to VAT at the rate of 3% before shall be subject to VAT at the preferential rate of 1%; while the prepaid VAT items in such regions subject to the prepaid collection rate of 3% before shall be subject to prepaid VAT at the preferential rate of 1%. Pursuant to the Announcement of the Ministry of Finance and the State Taxation Administration on Continuing the Implementation of Policies of Partial Tax Preferences in Response to COVID-19 (Announcement [2021] No. 7) jointly issued by the Ministry of Finance and the State Taxation Administration on 17 March 2021, the above policies of tax preferences were extended to 31 December 2021.

S.F. HOLDING CO., LTD. NOTES TO THE FINANCIAL STATEMENTS FOR THE SIX MONTHS ENDED 30 JUNE 2021 (All amounts in RMB Yuan unless otherwise stated) [English translation for reference only]
196
4 Notes to the consolidated financial statements
(1) Cash at bank and on hand 30 June 2021 31 December 2020 Cash on hand 297,786.76 78,882.36 Cash at bank 16,088,871,140.48 15,197,052,949.11 Balances with central bank from Group
Finance Company 723,418,375.73 1,066,630,262.57
Including: Balances with central bank - statutory reserve (a) 657,359,839.02 1,001,338,112.80
Balances with central bank - excess reserve (b) 66,058,536.71 65,292,149.77
Other cash balances 46,394,025.32 126,993,032.50 Accrued interest 3,377,993.54 27,136,580.65
16,862,359,321.83 16,417,891,707.19
Including: Total overseas deposits 4,102,467,499.29 1,478,584,839.35
(a) On 18 September 2016, the Group incorporated S.F. Holding Group Finance Co., Ltd. (“Group
Finance Company”). Statutory reserve of Group Finance Company deposited with the central bank represents required statutory reserve paid by financial enterprises in the People’s Bank of China (“PBOC”) at 6% of deposits from customers denominated in RMB. Statutory reserve deposits are not available for use by the Group in its day to day operations, which are restricted cash.
(b) Surplus reserve of Group Finance Company deposited with the central bank represents the excess
over the required statutory reserve paid by financial institutions in the central bank, and it is bank deposit that can be readily drawn on demand.

S.F. HOLDING CO., LTD. NOTES TO THE FINANCIAL STATEMENTS FOR THE SIX MONTHS ENDED 30 JUNE 2021 (All amounts in RMB Yuan unless otherwise stated) [English translation for reference only]
197
4 Notes to the consolidated financial statements (Cont’d)
(2) Financial assets held for trading 30 June 2021 31 December 2020 Structural deposits 10,024,343,370.09 6,276,847,839.67 Others 75,403.21 74,830.02
10,024,418,773.30 6,276,922,669.69
(3) Accounts receivable
30 June 2021 31 December 2020
Accounts receivable 18,830,925,667.60 17,076,916,966.24
Less: Provision for bad debts (227,663,464.71) (227,852,715.45)
18,603,262,202.89 16,849,064,250.79
The Group adopts regular settlement method for logistic services provided to some customers. At each month-end, the outstanding part becomes accounts receivable.
(a) The ageing of accounts receivable is analysed as follows:
30 June 2021 31 December 2020
Within 1 year (inclusive) 18,656,574,171.23 16,941,299,144.73
1 to 2 years (inclusive) 140,710,157.16 102,274,081.92
Over 2 years 33,641,339.21 33,343,739.59
18,830,925,667.60 17,076,916,966.24
(b) As at 30 June 2021, the five largest accounts receivable aggregated by debtor were summarised
and analysed as follows:
30 June 2021
Amount Amount of provision
for bad debts % of total balance
Sum of the five largest
accounts receivable 2,038,315,301.26 (10,191,576.51) 10.82%

S.F. HOLDING CO., LTD. NOTES TO THE FINANCIAL STATEMENTS FOR THE SIX MONTHS ENDED 30 JUNE 2021 (All amounts in RMB Yuan unless otherwise stated) [English translation for reference only]
198
4 Notes to the consolidated financial statements (Cont’d)
(3) Accounts receivable (Cont’d)
(c) Provision for bad debts For accounts receivable, the Group recognises the lifetime expected credit loss provision. As at 30 June 2021, accounts receivable for which the related provision for bad debts was provided on the individual basis were analysed as follows:
Ending balance Lifetime expected
credit loss rate
Provision for bad debts Reason
Receivables from
related parties - - - The debtor encountered
financial distress, etc.
Receivables from non-related parties 133,854,731.39 94.20% (126,095,567.10)
133,854,731.39 (126,095,567.10)
As at 31 December 2020, accounts receivable for which the related provision for bad debts was provided on the individual basis were analysed as follows:
Ending balance Lifetime expected
credit loss rate Provision for bad
debts Reason Receivables from
related parties - - - The debtor encountered
financial distress, etc.
Receivables from non-related parties 130,646,629.92 100.00% (130,646,629.92)
130,646,629.92 (130,646,629.92)
As at 30 June 2021, accounts receivable for which the related provision for bad debts was provided on the grouping basis were analysed as follows: 30 June 2021
Ending balance Provision for bad debts
Amount Lifetime expected
credit loss rate Amount Related party grouping 266,873,884.66 - - Non-related party grouping 18,430,197,051.55 0.55% (101,567,897.61)
18,697,070,936.21 (101,567,897.61)

S.F. HOLDING CO., LTD. NOTES TO THE FINANCIAL STATEMENTS FOR THE SIX MONTHS ENDED 30 JUNE 2021 (All amounts in RMB Yuan unless otherwise stated) [English translation for reference only]
199
4 Notes to the consolidated financial statements (Cont’d)
(3) Accounts receivable (Cont’d) (c) Provision for bad debts (Cont’d)
As at 31 December 2020, accounts receivable for which the related provision for bad debts was provided on the grouping basis were analysed as follows: 31 December 2020
Ending balance Provision for bad debts
Amount Lifetime expected
credit loss rate Amount Related party grouping 292,870,255.13 - - Non-related party grouping 16,653,400,081.19 0.58% (97,206,085.53)
16,946,270,336.32 (97,206,085.53)
(d) For the six months ended 30 June 2021, the Group’s provision for bad debts amounted to RMB
21,893,810.94 (for the six months ended 30 June 2020: RMB 205,151,831.67), and there was no provision for bad debts reversed (Note 4(24)).
(e) For the six months ended 30 June 2021, the provision for bad debts of accounts receivable that was
written off amounted to RMB 22,083,061.68 and no accounts receivable with amounts that were individually significant were written off (Note 4(24)).

S.F. HOLDING CO., LTD. NOTES TO THE FINANCIAL STATEMENTS FOR THE SIX MONTHS ENDED 30 JUNE 2021 (All amounts in RMB Yuan unless otherwise stated) [English translation for reference only]
200
4 Notes to the consolidated financial statements (Cont’d)
(4) Advances to suppliers
(a) The ageing of advances to suppliers was analysed below:
30 June 2021 31 December 2020
Ageing Amount % of total balance Amount % of total balance Within 1 year (inclusive) 2,110,439,208.68 91.35% 2,985,169,213.54 93.97% 1 to 2 years (inclusive) 169,014,052.36 7.32% 165,666,219.04 5.22% Over 2 years 30,837,613.52 1.33% 25,683,494.41 0.81%
2,310,290,874.56 100.00% 3,176,518,926.99 100.00%
As at 30 June 2021, advances to suppliers with ageing over one year were mainly materials, transportation expenses, etc. That is because relevant business transactions were still being performed.

S.F. HOLDING CO., LTD. NOTES TO THE FINANCIAL STATEMENTS FOR THE SIX MONTHS ENDED 30 JUNE 2021 (All amounts in RMB Yuan unless otherwise stated) [English translation for reference only]
201
4 Notes to the consolidated financial statements (Cont’d) (4) Advances to suppliers (Cont’d)
(b) As at 30 June 2021, the amount of top five advances to suppliers was analysed as follows:
30 June 2021
Amount % of total balance Sum of the five largest advances to suppliers 483,831,344.88 20.94%
(5) Factoring receivables
As at 30 June 2021 and 31 December 2020, factoring receivables were from Shenzhen Shuncheng Lefeng Factoring Co., Ltd. (“Lefeng Factoring”), a subsidiary of the Group, for provision of factoring business to external parties. 30 June 2021 31 December 2020 Factoring receivables 124,341,330.79 124,396,330.79 Less: Provision for bad debts (124,199,599.35) (124,086,398.51)
141,731.44 309,932.28
(a) Factoring receivables are disclosed by category as follows:
30 June 2021
Amount Proportion Provision for bad
debts Net amount
Factoring with recourse 124,341,330.79 100.00% (124,199,599.35) 141,731.44
31 December 2020
Amount Proportion Provision for bad
debts Net amount
Factoring with recourse 124,396,330.79 100.00% (124,086,398.51) 309,932.28

S.F. HOLDING CO., LTD. NOTES TO THE FINANCIAL STATEMENTS FOR THE SIX MONTHS ENDED 30 JUNE 2021 (All amounts in RMB Yuan unless otherwise stated) [English translation for reference only]
202
4 Notes to the consolidated financial statements (Cont’d)
(5) Factoring receivables (Cont’d)
(b) Overdue factoring receivables are presented by past-due ageing as follows:
30 June 2021
Within 1 month 1 to 6 months 6 months to 1
year Over 1 year
(inclusive) Total Factoring receivables - - - 124,341,330.79 124,341,330.79 Less: Provision for bad
debts - - - (124,199,599.35) (124,199,599.35)
- - - 141,731.44 141,731.44
31 December 2020
Within 1 month 1 to 6 months 6 months to 1
year Over 1 year
(inclusive) Total Factoring receivables - - 476,489.89 123,919,840.90 124,396,330.79 Less: Provision for bad
debts - - (166,557.61) (123,919,840.90) (124,086,398.51)
- - 309,932.28 - 309,932.28
As at 30 June 2021, the book balance of the Group's third-stage factoring receivables was RMB 124,199,599.35 (31 December 2020: RMB 123,919,840.90), and bad debts have been fully accrued. The Group did not have any factoring receivables at Stage 2.
(c) For the six months ended 30 June 2021, the Group’s provision for bad debts amounted to RMB 135,595.95 (for the six months ended 30 June 2020: RMB 49,601,393.26), and there was no provision for bad debts reversed (for the six months ended 30 June 2020: Nil) (Note 4(24)).
(d) For the six months ended 30 June 2021, the provision for bad debts of the Group’s factoring receivables that was written off amounted to RMB 22,395.11 (for the six months ended 30 June 2020: Nil) and no factoring receivable with amounts that were individually significant were written off (Note 4(24)).
(e) As at 30 June 2021, the Group’s factoring receivables for which the provision for bad debts was provided on the individual basis amounted to RMB 124,199,599.35 (31 December 2020: RMB 123,919,840.90), of which the provision for bad debts amounted to RMB 124,199,599.35 (31 December 2020: RMB 123,919,840.90).
(6) Loans and advances As at 30 June 2021 and 31 December 2020, the balance of loans and advances was formed by the external loans issued by S.F. Finance (Hong Kong) Limited, a subsidiary of the Group in Hong Kong, and Group Finance Company.

S.F. HOLDING CO., LTD. NOTES TO THE FINANCIAL STATEMENTS FOR THE SIX MONTHS ENDED 30 JUNE 2021 (All amounts in RMB Yuan unless otherwise stated) [English translation for reference only]
203
4 Notes to the consolidated financial statements (Cont’d)
(6) Loans and advances (Cont’d)
(a) Loans and advances by individual and enterprise 30 June 2021 31 December 2020 Personal loans 73,897.64 74,684.98 Enterprise loans
Non-related party loans 90,146,127.26 92,660,902.41 Related party loans (Note 8(4)(c)) 33,265,058.13 63,938,698.94
Loans and advances - total 123,485,083.03 156,674,286.33 Less: Provision for loan losses (85,622,775.47) (95,756,387.15)
Loans and advances - net 37,862,307.56 60,917,899.18
(b) Loans and advances analysed by type of collateral
30 June 2021 31 December 2020 Credit loans 116,584,070.39 149,699,752.35 Guaranteed loans 6,901,012.64 6,974,533.98
Loans and advances - total 123,485,083.03 156,674,286.33
(c) Overdue loans are presented by pass-due ageing as follows:
30 June 2021
Within 3 months
3 months to 1 year 1 to 3 years Over 3 years Total
Credit loans 2,610,265.83 6,133,365.22 8,536,912.67 548.67 17,281,092.39
31 December 2020
Within 3 months
3 months to 1 year 1 to 3 years Over 3 years Total
Credit loans 1,380,133.04 6,634,930.14 5,292,970.93 - 13,308,034.11
As at 30 June 2021, the book balance of the Group's third-stage loan was RMB 84,654,057.97 (31 December 2020: RMB 94,197,354.49), and bad debts had been fully accrued. The Group did not have any loan at Stage 2.
(d) For the six months ended 30 June 2021, there was no provision for bad debts and the Group’s provision for bad debts reversed amounted to RMB 8,863,724.11 (for the six months ended 30 June 2020: the Group’s provision for bad debts amounted to RMB 89,186,630.95 and there was no provision for bad debts reversed) (Note 4(24)).
(e) As at 30 June 2021, the Group’s loans and advances for which the provision for bad debts was provided on the individual basis amounted to RMB 84,654,057.97 (31 December 2020: RMB 94,197,354.49), of which full bad bebts were provided.

S.F. HOLDING CO., LTD. NOTES TO THE FINANCIAL STATEMENTS FOR THE SIX MONTHS ENDED 30 JUNE 2021 (All amounts in RMB Yuan unless otherwise stated) [English translation for reference only]
204
4 Notes to the consolidated financial statements (Cont’d)
(7) Other receivables 30 June 2021 31 December 2020 Current accounts receivable from related
parties (Note 8(4)(d)) 396,365,227.53 325,199,649.05 Guarantees and deposits 924,363,829.87 844,765,330.84 Cash on delivery service 556,083,837.14 504,889,025.07 Airlines subsidy and financial rebate 220,295,277.50 202,548,660.91 Tax collected by others 180,737,259.18 118,849,744.78 Receivables from equity transfer and capital
reductions 103,638,527.29 207,603,864.00 Employee borrowings and advances 68,786,050.15 76,333,587.99 Entrusted loan principal receivable 27,000,000.00 27,000,000.00 Social insurance premium prepaid 17,134,496.75 18,053,631.18 Dividends receivable 14,710,201.92 - Others 230,567,645.74 296,137,075.61
2,739,682,353.07 2,621,380,569.43 Less: Provision for bad debts (118,402,014.40) (127,816,168.32)
2,621,280,338.67 2,493,564,401.11
(a) The ageing of other receivables based on the point of occurrence is analysed as follows:
30 June 2021 31 December 2020 Within 1 year (inclusive) 2,063,192,055.94 2,001,897,653.15 1 to 2 years (inclusive) 262,084,894.05 333,174,159.82 Over 2 years 414,405,403.08 286,308,756.46
2,739,682,353.07 2,621,380,569.43
As at 30 June 2021, other receivables with ageing over 1 year mainly represented guarantees, deposits, entrusted loan receivable and receivables from equity transfer.

S.F. HOLDING CO., LTD. NOTES TO THE FINANCIAL STATEMENTS FOR THE SIX MONTHS ENDED 30 JUNE 2021 (All amounts in RMB Yuan unless otherwise stated) [English translation for reference only]
205
4 Notes to the consolidated financial statements (Cont’d)
(7) Other receivables (Cont’d)
(b) Provision for losses and changes in book balance statements
(i) The Group measures the loss provision for other receivables based on the expected credit losses for the next twelve months or the entire duration.
Stage 1 Stage 3
Expected credit losses in the following 12
months (Portfolio) Lifetime expected credit losses (credit
impaired) Total
Ending balance Provision for bad
debts Ending balance Provision for bad
debts Provision for bad
debts 31 December 2020 2,495,057,377.43 (12,292,976.32) 126,323,192.00 (115,523,192.00) (127,816,168.32) Net increase/provision in the
current period 131,658,711.17 (3,942,773.61) - - (3,942,773.61) Reversal in the current period - - (10,000,000.00) 10,000,000.00 10,000,000.00 Write-off in the current period (3,356,927.53) 3,356,927.53 - - 3,356,927.53
30 June 2021 2,623,359,161.07 (12,878,822.40) 116,323,192.00 (105,523,192.00) (118,402,014.40)

S.F. HOLDING CO., LTD. NOTES TO THE FINANCIAL STATEMENTS FOR THE SIX MONTHS ENDED 30 JUNE 2021 (All amounts in RMB Yuan unless otherwise stated) [English translation for reference only]
206
4 Notes to the consolidated financial statements (Cont’d)
(7) Other receivables (Cont’d)
(b) Provision for losses and changes in book balance statements (Cont’d) As at 30 June 2021 and 31 December 2020, the Group did not have any other receivables at Stage 1 for which the related provision for bad debts was provided on the individual basis.
As at 30 June 2021, other receivables at Stage 1 for which the related provision for bad debts was provided on the grouping basis were analysed as follows:
Ending balance
Expected credit
loss rate in the following 12
months
Provision for bad
debts Reason
Provided on the grouping basis:
Related party grouping 396,365,227.53 - -
Non-related party grouping 2,226,993,933.54 0.58% (12,878,822.40)
Expected credit
loss method
2,623,359,161.07 (12,878,822.40)
As at 31 December 2020, other receivables at Stage 1 for which the related provision for bad debts was provided on the grouping basis were analysed as follows:
Ending balance
Expected credit
loss rate in the following 12
months
Provision for bad
debts Reason
Provided on the grouping basis:
Related party grouping 325,199,649.05 - -
Non-related party grouping 2,169,857,728.38 0.57% (12,292,976.32)
Expected credit
loss method
2,495,057,377.43 (12,292,976.32)
As at 30 June 2021 and 31 December 2020, the Group did not have any other receivables at Stage 2.
As at 30 June 2021, other receivables at Stage 3 for which the related provision for bad debts was provided on the individual basis were analysed as follows:
Ending balance
Lifetime expected
credit losses
Provision for bad
debts Reason
Provided on the individual basis:
Entrusted loans receivable 27,000,000.00 60.00% (16,200,000.00)
The debtor encountered
financial distress Receivables from equity
transfer and capital reductions 82,455,115.00 100.00% (82,455,115.00)
The debtor
encountered financial distress
Others 6,868,077.00 100.00% (6,868,077.00)
The debtor encountered
financial distress, etc.
116,323,192.00 (105,523,192.00)

S.F. HOLDING CO., LTD. NOTES TO THE FINANCIAL STATEMENTS FOR THE SIX MONTHS ENDED 30 JUNE 2021 (All amounts in RMB Yuan unless otherwise stated) [English translation for reference only]
207
4 Notes to the consolidated financial statements (Cont’d)
(7) Other receivables (Cont’d)
(b) Provision for losses and changes in book balance statements (Cont’d) As at 31 December 2020, other receivables at Stage 3 for which the related provision for bad debts was provided on the individual basis were analysed as follows:
Ending balance Lifetime expected
credit losses Provision for bad
debts Reason Provided on the individual
basis:
Entrusted loans receivable 27,000,000.00 60.00% (16,200,000.00)
The debtor encountered
financial distress Receivables from equity
transfer and capital
reductions 92,455,115.00 100.00% (92,455,115.00)
The debtor encountered
financial distress
Others 6,868,077.00 100.00% (6,868,077.00)
The debtor encountered
financial distress, etc.
126,323,192.00 (115,523,192.00)
As at 30 June 2021 and 31 December 2020, the Group did not have any other receivables at Stage 3 for which the related provision for bad debts was provided on the grouping basis.
(c) For the six months ended 30 June 2021, the Group’s provision for bad debts amounted to RMB 3,942,773.61 (for the six months ended 30 June 2020: RMB 114,672,175.85), and provision for bad debts reversed amounted to RMB 10,000,000.00 (for the six months ended 30 June 2020: Nil) (Note 4(24)).
(d) For the six months ended 30 June 2021, the provision for bad debts of other receivables that was
written off amounted to RMB 3,356,927.53 (Note 4(24)) and no other receivables with amounts that were individually significant were written off.
(e) As at 30 June 2021, the five largest other receivables aggregated by debtor were summarised and analysed as follows: 30 June 2021
Nature of business Ageing Amount
Amount of provision for bad
debts % of total
balance Shenzhen Hive Box
Technology Co., Ltd. (“Hive Box Technology”)
Agency collection and payment Within 3 months 284,560,973.62 - 10.39%
Changsha Municipal People's Government Airlines subsidy Within 1 year 96,197,800.00 (480,989.00) 3.51%
Texas Instruments (Shanghai) Ltd.,
Tax collected by others Within 1 year 55,075,940.80 (275,379.70) 2.01%
Hangzhou International Airport Airlines subsidy Within 1 year 46,125,000.00 (230,625.00) 1.68%
Wuhan TianHe International Airport Airlines subsidy 1 to 2 years 43,978,614.20 (219,893.07) 1.61%
525,938,328.62 (1,206,886.77) 19.20%

S.F. HOLDING CO., LTD. NOTES TO THE FINANCIAL STATEMENTS FOR THE SIX MONTHS ENDED 30 JUNE 2021 (All amounts in RMB Yuan unless otherwise stated) [English translation for reference only]
208
4 Notes to the consolidated financial statements (Cont’d) (8) Inventories
Inventories are summarised by category as follows: 30 June 2021
Ending balance
Provision for decline in the value of
inventories Carrying amount
Raw materials in stock 357,001,905.46 - 357,001,905.46 Aviation consumables 277,619,420.22 - 277,619,420.22 Finished goods 180,982,160.77 (5,240,910.58) 175,741,250.19 Properties under
development 79,095,456.31 -
79,095,456.31 Costs to fulfil a contract 61,712,655.73 - 61,712,655.73 Low-value consumables 30,439,461.86 - 30,439,461.86
986,851,060.35 (5,240,910.58) 981,610,149.77
31 December 2020
Ending balance
Provision for decline in the value of
inventories Carrying amount
Raw materials in stock 423,928,000.21 - 423,928,000.21 Aviation consumables 241,874,487.58 - 241,874,487.58 Finished goods 191,150,994.59 (5,279,698.19) 185,871,296.40 Properties under
development 79,095,456.31 - 79,095,456.31 Costs to fulfil a contract 24,229,843.60 - 24,229,843.60 Low-value consumables 31,951,510.94 - 31,951,510.94
992,230,293.23 (5,279,698.19) 986,950,595.04

S.F. HOLDING CO., LTD. NOTES TO THE FINANCIAL STATEMENTS FOR THE SIX MONTHS ENDED 30 JUNE 2021 (All amounts in RMB Yuan unless otherwise stated) [English translation for reference only]
209
4 Notes to the consolidated financial statements (Cont’d)
(9) Contract assets 30 June 2021 31 December 2020 Contract assets 377,663,003.26 401,040,381.85 Less: Provision for impairment of contract
assets (1,886,009.35) (2,005,201.91)
375,776,993.91 399,035,179.94
(10) Other current assets
30 June 2021 31 December 2020 Input VAT to be offset 5,747,150,040.92 4,536,908,043.47 Prepaid enterprise income tax 112,194,659.04 153,562,561.05 Others 1,717,050.54 2,606,785.14
5,861,061,750.50 4,693,077,389.66
(11) Long-term receivables
30 June 2021 31 December 2020
Interest-free loans to employees receivable
(a) 245,953,714.26
377,265,003.74 Deposit for house purchase 277,904,430.00 277,904,430.00 Finance lease receivables (b) 459,054,509.98 122,344,982.71 Less: Current portion of long-term
receivables (253,525,731.69)
(156,240,777.09) Provision for bad debts (18,237,703.80) (14,169,999.15)
711,149,218.75 607,103,640.21

S.F. HOLDING CO., LTD. NOTES TO THE FINANCIAL STATEMENTS FOR THE SIX MONTHS ENDED 30 JUNE 2021 (All amounts in RMB Yuan unless otherwise stated) [English translation for reference only]
210
4 Notes to the consolidated financial statements (Cont’d)
(11) Long-term receivables (Cont’d)
(a) Interest-free loans to employees receivable 30 June 2021 31 December 2020 Interest-free loans to employees receivable 266,224,243.05 406,677,491.48 Less: Prepaid discount interest (20,270,528.79) (29,412,487.74)
Amortised cost of interest-free loans to employees 245,953,714.26 377,265,003.74
Less: Current portion of interest-free loans to employees (103,902,047.92) (124,107,464.52)
Provision for bad debts (1,331,121.22) (2,033,387.46)
140,720,545.12 251,124,151.76
Interest-free loans to employees receivable represented the interest-free loans to qualified employees with a term of 5 years.
(b) Finance lease receivables 30 June 2021 31 December 2020 Finance lease receivables 513,647,094.79 127,805,355.10 Less: Unrealised finance gains (54,592,584.81) (5,460,372.39)
Amortised cost of finance lease receivables 459,054,509.98 122,344,982.71 Less: Current portion of finance lease
receivables (149,623,683.77) (32,133,312.57) Provision for bad debts (16,906,582.58) (12,136,611.69)
292,524,243.63 78,075,058.45
The minimum lease receivables that the Group will receive after the balance sheet date are analyzed based on undiscounted contractual cash flows (including interest calculated at the contract interest rate (if it is a floating interest rate, at the current interest rate as at balance sheet date)) as follows :
30 June 2021 31 December 2020
Within 1 year(inclusive) 198,287,050.28 44,270,424.29
1 to 2 years(inclusive) 160,551,094.85 37,173,061.64
2 to 3 years(inclusive) 119,928,107.22 33,313,876.98
Over 3 years 34,880,842.44 13,047,992.19
513,647,094.79 127,805,355.10

S.F. HOLDING CO., LTD. NOTES TO THE FINANCIAL STATEMENTS FOR THE SIX MONTHS ENDED 30 JUNE 2021 (All amounts in RMB Yuan unless otherwise stated) [English translation for reference only]
211
4 Notes to the consolidated financial statements (Cont’d)
(12) Long-term equity investments 30 June 2021 31 December 2020 Cost:
- Joint ventures 2,526,594,898.69 2,457,553,213.43 - Associates 2,674,861,868.99 1,337,754,074.20
5,201,456,767.68 3,795,307,287.63
Less: Provision for impairment of long-term equity investments
- Joint ventures - (22,587,342.22) - Associates (125,488,667.51) (125,488,667.51)
(125,488,667.51) (148,076,009.73)
Joint ventures (a) 2,526,594,898.69 2,434,965,871.21 Associates (b) 2,549,373,201.48 1,212,265,406.69
5,075,968,100.17 3,647,231,277.90

S.F. HOLDING CO., LTD. NOTES TO THE FINANCIAL STATEMENTS FOR THE SIX MONTHS ENDED 30 JUNE 2021 (All amounts in RMB Yuan unless otherwise stated) [English translation for reference only]
212
4 Notes to the consolidated financial statements (Cont’d)
(12) Long-term equity investments (Cont’d)
(a) Joint ventures
Movements in the current period
Carrying amount as at 31 December
2020 Increase in
investments Decrease in investments
Share of net profit/(loss)
under equity method
Exchange differences on translation of
foreign currency financial
statements Other changes
in equity
Provision for impairment
loss Carrying amount as
at 30 June 2021
Balance of provision for impairment
loss at the end of the period
Hubei International Logistics Airport Co., Ltd. 1,373,300,976.99 - - (7,980,852.27) - - - 1,365,320,124.72 - Gem-year Logistics Co., Ltd. 490,661,575.24 - - 3,552,133.79 - 1,742,881.88 - 495,956,590.91 - ZBHA Group Co., Ltd. (“ZBHA”) 230,429,226.11 - - 387,713.90 - - - 230,816,940.01 - Jinfeng Borun (Xiamen) Equity Investment
Partnership (Limited Partnership) 149,354,041.48 - - (2,065,706.76) - - - 147,288,334.72 - CC SF China Logistics Properties Investment
Fund,L.P. - 98,984,603.71 - - (901,298.67) - - 98,083,305.04 - Beijing Wulian Shuntong Technology Co., Ltd.
(“Wulian Shuntong”) 89,571,516.18 - - (2,568,511.31) - - - 87,003,004.87 - CR-SF International Express Co., Ltd. 29,754,253.24 - - 2,875,647.08 - - - 32,629,900.32 - POST11OÜ 22,441,110.64 - - (206,899.64) (193,947.07) - - 22,040,263.93 - Shenzhen Fengsu Technology Co., Ltd.
(“Fengsu Technology”) 22,904,934.74 - - (1,738,060.82) - 20,620.13 - 21,187,494.05 - Others 26,548,236.59 3,055,340.31 (1,744,744.89) (2,844,870.43) (117,323.80) 1,372,302.34 - 26,268,940.12 -
2,434,965,871.21 102,039,944.02 (1,744,744.89) (10,589,406.46) (1,212,569.54) 3,135,804.35 - 2,526,594,898.69 -

S.F. HOLDING CO., LTD. NOTES TO THE FINANCIAL STATEMENTS FOR THE SIX MONTHS ENDED 30 JUNE 2021 (All amounts in RMB Yuan unless otherwise stated) [English translation for reference only]
213
4 Notes to the consolidated financial statements (Cont’d) (12) Long-term equity investments (Cont’d) (b) Associates
Movements in the current period
Carrying amount as at 31 December
2020
Increase in investments
Decrease in investments
Share of net profit/(loss)
under equity method
Exchange differences on translation of
foreign currency financial
statement
Share of other comprehensiv
e income
Other changes in equity (i)
Cash dividends or
profits declared
Provision for impairment
loss
Carrying amount as at 30 June 2021
Balance of provision for impairment
loss at the end of the period
Amass Freight International Co.
Ltd. 208,700,000.00 - - 9,748,827.36 - - - - - 218,448,827.36 - Zhejiang Galaxis Technology
Co., Ltd. 205,935,032.24 - - (6,338,288.19) - - (10,391,548.29) - - 189,205,195.76 - Zhuhai Biyao Industrial
Technology Co., Ltd. 112,224,684.70 - - 7,653,302.28 - - - - - 119,877,986.98 (8,031,343.62) Jiangsu Chiata Foton Co., Ltd. 102,710,272.39 - - (771,685.34) - - - - - 101,938,587.05 - Beijing Dazhangfang Network
Technology Co., Ltd. (“Beijing Dazhangfang”) 99,905,867.84 - - (3,994,595.43) - - - - - 95,911,272.41 -
Dunho Weiheng (Zhuhai) Supply Chain Management Co., Ltd. 62,355,846.29 27,546,428.26 - (545,592.39) - - - - - 89,356,682.16 -
KENGIC Intelligent Technology Co., Ltd. (“KENGIC Intelligent”) 76,206,042.27 - - (2,038,027.15) - - - - - 74,168,015.12 -
Ezhou China Communications SF Airport Industrial Park Investment Development Co., Ltd. - 72,000,000.00 - 8,835.77 - - - - - 72,008,835.77 -
Feng Wang Investment Co., Ltd. 47,813,293.06 - - 55,984.34 - (88,282.28) - - - 47,780,995.12 - PT TRI ADI BERSAMA 14,335,506.95 28,702,700.95 - (305,086.45) (509,974.25) - - - - 42,223,147.20 - Langxing UAV System Co., Ltd. 39,286,463.21 - - (1,316,411.84) - - - - - 37,970,051.37 - Beijing GreenValley Technology
Limited 29,927,891.81 - - 326,127.13 - - - - - 30,254,018.94 - Shenzhen Canbeidou Supply
Chain Management Co., Ltd (“Canbeidou Supply Chain”) 31,028,681.02 - - (1,553,145.76) - - - - - 29,475,535.26 -
SCS Logistics Co., Ltd. 29,852,398.77 - - 1,699,585.92 - - - (2,250,000.00) - 29,301,984.69 -

S.F. HOLDING CO., LTD. NOTES TO THE FINANCIAL STATEMENTS FOR THE SIX MONTHS ENDED 30 JUNE 2021 (All amounts in RMB Yuan unless otherwise stated) [English translation for reference only]
214
4 Notes to the consolidated financial statements (Cont’d) (12) Long-term equity investments (Cont’d) (b) Associates (Cont’d)
Movements in the current period
Carrying amount as at 31
December 2020
Increase in investments
Decrease in investments
Share of net profit/(loss)
under equity method
Exchange differences on translation of
foreign currency financial
statements
Share of other comprehensive
income
Other changes in equity (i)
Cash dividends or profits declared
Provision for impairment loss
Carrying amount as at 30 June
2021
Balance of provision for
impairment loss at the end of
the period Shenzhen Zhi Hang UAV
Co., Ltd. 23,791,818.93 - - 617,584.08 - - - - - 24,409,403.01 - KOSPA 22,734,343.41 - - 1,361,271.59 (231,267.30) - - - - 23,864,347.70 - Aerospace Times Feipeng
Co., Ltd. - 20,000,000.00 - - - - - - - 20,000,000.00 - Shenzhen Bai Mi Life Co.,
Ltd. - - - - - - - - - - (93,276,284.55)
Others(ii) 105,457,263.80 1,201,245,788.43 - (2,770,527.73) (2,154,232.82) - 1,400,023.90 - - 1,303,178,315.58 (24,181,039.34)
1,212,265,406.69 1,349,494,917.64 - 1,838,158.19 (2,895,474.37) (88,282.28) (8,991,524.39) (2,250,000.00) - 2,549,373,201.48 (125,488,667.51)
(i) Those represent changes in equity resulting from capital injections by investors other than the Group. (ii) During the reporting period, among others, the newly-added associates were mainly SF Real Estate Investment Trust ("SF REIT") and SF REIT Asset
Management Co., Ltd.( " REIT manager ") (Note 5(2)(i)). The Group's new investment in the above two joint ventures was RMB 1,162,511,280.00 and RMB 25,339,468.34 respectively.

S.F. HOLDING CO., LTD. NOTES TO THE FINANCIAL STATEMENTS FOR THE SIX MONTHS ENDED 30 JUNE 2021 (All amounts in RMB Yuan unless otherwise stated) [English translation for reference only]
215
4 Notes to the consolidated financial statements (Cont’d)
(13) Investments in other equity instruments 30 June 2021 31 December 2020 Equity of listed companies 395,947,836.92 891,158,779.32 Equity of unlisted companies 4,059,207,411.86 4,136,330,274.98
4,455,155,248.78 5,027,489,054.30
Item
Dividend income recognised in the
current period
Accumulated gains or losses recognised in other comprehensive
income Equity of listed companies 14,620,117.03 93,615,739.69 Equity of unlisted companies - 900,040,707.17
14,620,117.03 993,656,446.86

S.F. HOLDING CO., LTD. NOTES TO THE FINANCIAL STATEMENTS FOR THE SIX MONTHS ENDED 30 JUNE 2021 (All amounts in RMB Yuan unless otherwise stated) [English translation for reference only]
216
4 Notes to the consolidated financial statements (Cont’d)
(13) Investments in other equity instruments (Cont’d)
31 December 2020
Increase in the current period
Changes in fair value in the
current period
Decrease in the current period
Exchange differences on translation of
foreign currency financial
statements
30 June 2021 Equity of listed companies 891,158,779.32 28,410,932.19 (84,217,558.22) (432,850,846.22) (6,553,470.15) 395,947,836.92 Equity of unlisted companies 4,136,330,274.98 - 2,885,035.25 (40,000,000.00) (40,007,898.37) 4,059,207,411.86
5,027,489,054.30 28,410,932.19 (81,332,522.97) (472,850,846.22) (46,561,368.52) 4,455,155,248.78

S.F. HOLDING CO., LTD. NOTES TO THE FINANCIAL STATEMENTS FOR THE SIX MONTHS ENDED 30 JUNE 2021 (All amounts in RMB Yuan unless otherwise stated) [English translation for reference only]
217
4 Notes to the consolidated financial statements (Cont’d)
(14) Other non-current financial assets 30 June 2021 31 December 2020 Financial assets held for trading (over 1
year): Industry fund investments 456,428,950.23 441,134,721.34 Special scheme equity-class securities 390,391,319.74 390,391,319.74
846,820,269.97 831,526,041.08
(15) Investment properties
Buildings Land use rights Total Cost 31 December 2020 1,631,375,714.19 816,419,693.45 2,447,795,407.64
Transfer from self-used assets in the current period (Note 4(16), (17), (19)) 529,080,683.85 165,321,128.59 694,401,812.44
Transfer to self-used assets in the current period (Note 4(16), (19)) (255,402,501.06) (63,363,865.21) (318,766,366.27)
Decrease due to disposal of subsidiaries in the current period (603,560,073.87) (663,772,579.41) (1,267,332,653.28)
Effect of translation of foreign currency financial statements (3,600,780.87) (5,352,453.85) (8,953,234.72)
30 June 2021 1,297,893,042.24 249,251,923.57 1,547,144,965.81
Accumulated depreciation 31 December 2020 139,991,563.69 88,399,022.60 228,390,586.29
Transfer from self-used assets in the current period (Note 4(16), (19)) 9,395,260.82 12,564,444.11 21,959,704.93
Provision in the current period 13,489,863.41 6,774,325.08 20,264,188.49 Transfer to self-used assets in the current
period (Note 4(16), (19)) (3,734,619.61) (5,035,489.93) (8,770,109.54) Decrease due to disposal of subsidiaries
in the current period (62,877,836.02) (81,228,890.86) (144,106,726.88) Effect of translation of foreign currency
financial statements (486,789.45) (621,256.08) (1,108,045.53)
30 June 2021 95,777,442.84 20,852,154.92 116,629,597.76
Carrying amount 30 June 2021 1,202,115,599.40 228,399,768.65 1,430,515,368.05
31 December 2020 1,491,384,150.50 728,020,670.85 2,219,404,821.35
As at 30 June 2021, the Group was still in the process of applying for certificates of ownership for certain buildings with carrying amount of RMB 689,347,735.97 (cost of RMB 707,212,093.95) (31 December 2020: carrying amount of RMB 656,266,461.64 and cost of RMB 671,020,713.68). As at 30 June 2021, investment properties with carrying amount of RMB 120,581,681.47 (cost of RMB 129,072,631.92) (31 December 2020: carrying amount of RMB 77,180,832.16 and cost of RMB 81,475,559.44) were pledged as collateral for long-term borrowings (Note 4(34)(b)). As at 30 June 2021 and 31 December 2020, the Group assessed that no impairment loss should be recognised for investment properties.

S.F. HOLDING CO., LTD. NOTES TO THE FINANCIAL STATEMENTS FOR THE SIX MONTHS ENDED 30 JUNE 2021 (All amounts in RMB Yuan unless otherwise stated) [English translation for reference only]
218
4 Notes to the consolidated financial statements (Cont’d)
(16) Fixed assets
Buildings Motor vehicles Computers and
electronic equipment
Aircraft, aircraft engines, rotables and
high-value maintenance tools
Machinery and equipment
Office equipment and other equipment Total
Cost
31 December 2020 7,735,999,172.49 5,475,630,337.92 3,615,717,089.84 9,171,985,407.03 4,456,899,080.81 6,171,336,693.26 36,627,567,781.35 Transfer from construction in progress
(Note 4(17)) 694,395,897.16 134,846,402.17 17,196,629.50 1,061,677,066.36 169,228,440.20 386,337,353.05 2,463,681,788.44 Transfer from investment properties in
the current period (Note 4(15)) 255,402,501.06 - - - - - 255,402,501.06 Increase in the current period 989,480.55 733,424,472.79 378,016,809.80 271,138,650.32 156,298,487.73 139,383,055.29 1,679,250,956.48 Transfer to investment properties in the
current period (Note 4(15)) (261,676,230.28) - - - - - (261,676,230.28) Decrease in the current period - (384,423,511.52) (144,581,267.49) (68,126,800.60) (75,976,492.41) (192,467,928.75) (865,576,000.77) Decrease due to disposal of subsidiaries
in the current period (1,662,921,944.91) - - - (1,050,000.00) (572,388.31) (1,664,544,333.22) Reclassification in the current period - 2,214,084.02 (3,595,016.83) - (109,048,535.88) 110,429,468.69 - Effect of translation of foreign currency
financial statements (11,929,519.11) (2,518,876.36) (921,286.39) - (3,081,302.89) (444,117.69) (18,895,102.44)
30 June 2021 6,750,259,356.96 5,959,172,909.02 3,861,832,958.43 10,436,674,323.11 4,593,269,677.56 6,614,002,135.54 38,215,211,360.62
Accumulated depreciation
31 December 2020 870,501,031.04 3,680,986,257.91 2,331,366,472.96 3,504,465,356.19 1,178,124,698.33 2,705,472,210.32 14,270,916,026.75 Transfer from investment properties in
the current period (Note 4(15)) 3,734,619.61 - - - - - 3,734,619.61 Provision in the current period 123,108,374.64 446,143,881.09 358,310,588.69 506,595,037.49 203,314,608.41 494,370,449.93 2,131,842,940.25 Transfer to investment properties in the
current period (Note 4(15)) (9,395,260.82) - - - - - (9,395,260.82) Decrease in the current period - (358,367,165.05) (123,315,398.61) (63,722,727.70) (37,462,860.68) (152,931,738.87) (735,799,890.91) Decrease due to disposal of subsidiaries
in the current period (180,734,291.43) - - - (224,437.50) (246,527.60) (181,205,256.53) Reclassification in the current period - 2,012,907.77 534,090.75 - (77,550,726.14) 75,003,727.62 - Effect of translation of foreign currency
financial statements (1,533,169.53) (1,637,215.35) (666,733.15) - (1,145,876.95) (287,437.59) (5,270,432.57)
30 June 2021 805,681,303.51 3,769,138,666.37 2,566,229,020.64 3,947,337,665.98 1,265,055,405.47 3,121,380,683.81 15,474,822,745.78
Carrying amount
30 June 2021 5,944,578,053.45 2,190,034,242.65 1,295,603,937.79 6,489,336,657.13 3,328,214,272.09 3,492,621,451.73 22,740,388,614.84
31 December 2020 6,865,498,141.45 1,794,644,080.01 1,284,350,616.88 5,667,520,050.84 3,278,774,382.48 3,465,864,482.94 22,356,651,754.60

S.F. HOLDING CO., LTD. NOTES TO THE FINANCIAL STATEMENTS FOR THE SIX MONTHS ENDED 30 JUNE 2021 (All amounts in RMB Yuan unless otherwise stated) [English translation for reference only]
219
4 Notes to the consolidated financial statements (Cont’d)
(16) Fixed assets (Cont’d) (i) For the sixth months ended 30 June 2021, the amount of depreciation expenses charged to cost of
revenue, selling and distribution expenses, general and administrative expenses and research and development expenses was RMB 2,123,877,059.83 (for the sixth months ended 30 June 2020: RMB 1,730,365,263.08).
(ii) As at 30 June 2021, fixed assets with carrying amount of RMB 138,131,064.70 (cost of RMB 141,376,925.34) (31 December 2020: carrying amount of RMB 181,287,156.79 and cost of RMB 185,653,990.63) were pledged as collateral for long-term borrowings (Note 4(34)(b)).
(iii) Fixed assets with pending certificates of ownership 30 June 2021
Cost Accumulated depreciation
Provision for impairment loss Carrying amount
Buildings 1,477,915,511.67 (52,218,686.24) - 1,425,696,825.43
31 December 2020
Cost Accumulated depreciation
Provision for impairment loss Carrying amount
Buildings 1,782,960,049.03 (96,133,702.99) - 1,686,826,346.04
In addition, as at 30 June 2021, buildings with carrying amount of RMB 21,671,922.43 and cost of RMB 29,844,036.64 (31 December 2020: carrying amount of RMB 22,375,366.18 and cost of RMB 29,844,036.64) represented public rental houses with restricted property rights purchased by the Group for enterprise talents.
(iv) As at 30 June 2021 and 31 December 2020, the Group assessed that no impairment loss should be recognised for fixed assets.

S.F. HOLDING CO., LTD. NOTES TO THE FINANCIAL STATEMENTS FOR THE SIX MONTHS ENDED 30 JUNE 2021 (All amounts in RMB Yuan unless otherwise stated) [English translation for reference only]
220
4 Notes to the consolidated financial statements (Cont’d)
(16) Fixed assets (Cont’d)
(v) Disposal of aircraft engines, rotables and high-value maintenance tools
For the six months ended 30 June 2021
Reason for disposal Cost Accumulated depreciation
Provision for impairment loss Carrying amount
Aircraft rotables Scrapped 487,744.11 (164,146.66) - 323,597.45 Aircraft rotables Sold 5,372,551.58 (437,512.06) - 4,935,039.52 High-value maintenance tools Scrapped 25,249.88 (18,151.70) - 7,098.18
5,885,545.57 (619,810.42) - 5,265,735.15
For the six months ended 30 June 2020
Reason for disposal Cost Accumulated depreciation
Provision for impairment loss Carrying amount
Aircraft rotables Scrapped 6,029,229.78 (2,345,065.20) - 3,684,164.58 Aircraft rotables Sold 49,595.58 (9,868.98) - 39,726.60 High-value maintenance tools Scrapped 34,126.62 (22,908.94) - 11,217.68
6,112,951.98 (2,377,843.12) - 3,735,108.86

S.F. HOLDING CO., LTD. NOTES TO THE FINANCIAL STATEMENTS FOR THE SIX MONTHS ENDED 30 JUNE 2021 (All amounts in RMB Yuan unless otherwise stated) [English translation for reference only]
221
4 Notes to the consolidated financial statements (Cont’d)
(17) Construction in progress
(13) 30 June 2021 31 December 2020 Relocation and Renovation Project of
Distribution Hubs 887,871,189.85 614,476,732.51 Aircraft import and refit 625,092,733.31 848,657,662.30 Qianhai S.F. Headquarters Office 560,107,758.43 724,189,959.49 Wuhan E-Commerce Industrial Park Project 478,216,875.40 522,065,007.56 Xi’an E-Commerce Industrial Park Project 434,538,130.84 304,437,146.68 Chengdu Fengtai E-Commerce Industrial
Park Project 373,609,706.14 256,888,014.72 Tianjin Fengtai E-Commerce Industrial Park
Project 332,741,382.40 268,165,252.88 Guiyang Fengtai E-Commerce Industrial Park
Project 292,992,916.74 194,125,117.04 Nanjing Qixia Project 186,494,079.59 - Hangzhou Beicheng Intelligent Park 181,259,923.88 76,320,340.29 Ganzhou Fengtai Industrial Park Project 161,141,417.19 77,904,906.75 Haikou Fengtai Industrial Park Project 149,802,794.90 77,924,993.11 Jiaxing Xiuzhou Phase I 139,723,728.06 74,696,103.44 Nanchang Fengtai Industrial Park Project 120,793,352.16 61,065,523.07 Shanghai Headquarters & Intelligent Logistics
Technology Industrial Park Project 118,061,342.93 43,260,355.40 Suzhou Wujiang Project 92,561,120.25 1,161,597.16 Intelligent Sorting Hefei Base Project 88,596,325.52 30,750,245.51 Nanning S.F. Innovation Industrial Base 87,183,129.01 19,686,338.93 Guangzhou Airport Base Hub Project 69,020,753.19 16,280,942.15 Xiamen S.F. Innovation Industrial Park 68,805,962.77 - Changchun E-Commerce Industrial Park
Project 66,530,314.06 66,553,674.01 S.F. Ma’anshan Innovation Industrial Park
Project 56,676,373.15 6,480,824.53 Tibet Lhasa E-Commerce Industrial Park
Project 40,949,714.68 40,949,714.68 Shanghai Xinbang Industrial Park 26,934,398.00 - Air station relocation and decoration project 26,584,741.28 - Dongguan Daojiao Project 25,782,534.69 - Xinjiang Smart Industrial Park Project 15,433,855.23 5,391,057.98 Songshan Lake CIMC Smart Valley
Decoration Project 12,593,987.30 - Others 801,849,341.53 1,048,422,951.87
6,521,949,882.48 5,379,854,462.06

S.F. HOLDING CO., LTD. NOTES TO THE FINANCIAL STATEMENTS FOR THE SIX MONTHS ENDED 30 JUNE 2021 (All amounts in RMB Yuan unless otherwise stated) [English translation for reference only]
222
4 Notes to the consolidated financial statements (Cont’d)
(17) Construction in progress (Cont’d)
Name of projects Budget 31 December 2020
Increase in the current period
Transfer to other long-term assets in
the current period (iv)
Decrease due to disposal of subsidiries 30 June 2021
% of project investment in
budget (iii) Progress of
project
Accumulative amount of capitalised
borrowing costs
Including: Borrowing costs capitalised in the current period
(Note 4(53)) Capitalisation rate Source of funds
Qianhai S.F. Headquarters Office 869,742,437.76 724,189,959.49 138,444,894.87 (302,527,095.93) - 560,107,758.43 99.18% 99.18% 84,879,220.97 6,593,009.54 4.76%
Self-owned funds and loans from
financial institutions
Relocation and Renovation Project of Distribution Hubs 5,016,633,039.09 614,476,732.51 859,557,339.90 (586,162,882.56) - 887,871,189.85 75.45% 75.45% - - - Self-owned funds
Aircraft import and refit 3,274,420,480.76 848,657,662.30 844,806,627.35 (1,068,371,556.34) - 625,092,733.31 44.46% 44.46% - - - Self-owned funds
Wuhan E-Commerce Industrial Park Project 834,029,523.00 522,065,007.56 85,436,427.33 (129,284,559.49) - 478,216,875.40 78.18% 78.18% - - - Self-owned funds
Xi’an E-Commerce Industrial Park Project 637,626,719.96 304,437,146.68 130,100,984.16 - - 434,538,130.84 68.15% 68.15% - - - Self-owned funds
Chengdu Fengtai E-Commerce Industrial Park Project 485,234,196.67 256,888,014.72 116,721,691.42 - - 373,609,706.14 77.00% 77.00% - - - Self-owned funds
Tianjin Fengtai E-Commerce Industrial Park Project 704,052,188.06 268,165,252.88 64,576,129.52 - - 332,741,382.40 99.26% 99.26% - - - Self-owned funds
Guiyang Fengtai E-Commerce Industrial Park Project 364,922,527.78 194,125,117.04 98,867,799.70 - - 292,992,916.74 80.29% 80.29% - - - Self-owned funds
Nanjing Qixia Project 256,182,505.86 - 186,494,079.59 - - 186,494,079.59 72.80% 72.80% - - - Self-owned funds
Hangzhou Beicheng Intelligent Park 395,196,165.02 76,320,340.29 104,939,583.59 - - 181,259,923.88 45.87% 45.87% - - - Self-owned funds
Ganzhou Fengtai Industrial Park Project 229,954,633.88 77,904,906.75 83,236,510.44 - - 161,141,417.19 70.08% 70.08% - - - Self-owned funds
Haikou Fengtai Industrial Park Project 282,670,730.15 77,924,993.11 71,877,801.79 - - 149,802,794.90 50.89% 50.89% - - - Self-owned funds
Jiaxing Xiuzhou Phase I 262,502,312.68 74,696,103.44 65,027,624.62 - - 139,723,728.06 53.23% 53.23% - - - Self-owned funds
Nanchang Fengtai Industrial Park Project 259,333,306.42 61,065,523.07 59,727,829.09 - - 120,793,352.16 46.05% 46.05% - - - Self-owned funds
Shanghai Headquarters & Intelligent Logistics Technology Industrial Park Project 502,468,251.85 43,260,355.40 74,800,987.53 - - 118,061,342.93 23.50% 23.50% - - - Self-owned funds
Suzhou Wujiang Project 687,294,397.62 1,161,597.16 91,399,523.09 - - 92,561,120.25 13.30% 13.30% - - - Self-owned funds
Intelligent Sorting Hefei Base Project 591,016,653.07 30,750,245.51 57,846,080.01 - - 88,596,325.52 78.65% 78.65% - - - Self-owned funds
Nanning S.F. Innovation Industrial Base 114,367,745.83 19,686,338.93 67,496,790.08 - - 87,183,129.01 76.23% 76.23% - - - Self-owned funds
Guangzhou Airport Base Hub Project 229,896,382.02 16,280,942.15 52,739,811.04 - - 69,020,753.19 22.94% 22.94% - - - Self-owned funds
Xiamen S.F. Innovation Industrial Park 193,230,600.00 - 68,805,962.77 - - 68,805,962.77 35.61% 35.61% - - - Self-owned funds
Changchun E-Commerce Industrial Park Project 422,481,060.32 66,553,674.02 21,205,582.08 (21,228,942.04) - 66,530,314.06 56.69% 56.69% - - - Self-owned funds
S.F. Ma’anshan Innovation Industrial Park Project 336,007,556.62 6,480,824.53 50,195,548.62 - - 56,676,373.15 55.17% 55.17% - - - Self-owned funds
Tibet Lhasa E-Commerce Industrial Park Project 181,156,907.49 40,949,714.68 - - - 40,949,714.68 20.16% 20.16% - - - Self-owned funds
Shanghai Xinbang Industrial Park 570,948,365.03 - 26,934,398.00 - - 26,934,398.00 4.72% 4.72% - - - Self-owned funds

S.F. HOLDING CO., LTD. NOTES TO THE FINANCIAL STATEMENTS FOR THE SIX MONTHS ENDED 30 JUNE 2021 (All amounts in RMB Yuan unless otherwise stated) [English translation for reference only]
223
4 Notes to the consolidated financial statements (Cont’d) (17) Construction in progress (Cont’d)
Name of projects Budget 31 December 2020
Increase in the current period
Transfer to other long-term assets in
the current period (iv)
Decrease due to disposal of subsidiries
30 June 2021
% of project investment in
budget (iii) Progress of
project
Accumulative amount of
capitalised borrowing costs
Including: Borrowing costs
capitalised in the current period
(Note 4(53)) Capitalisation
rate Source of
funds Air station relocation
and decoration project 84,048,959.58 - 43,508,775.26 (16,924,033.98) - 26,584,741.28 51.77% 51.77% - - -
Self-owned funds
Dongguan Daojiao Project 526,881,417.64 - 25,782,534.69 - - 25,782,534.69 4.89% 4.89% - - -
Self-owned funds
Xinjiang Smart Industrial Park Project 132,028,852.33 5,391,057.98 10,042,797.25 - - 15,433,855.23 7.61% 7.61% - - -
Self-owned funds
Songshan Lake CIMC Smart Valley Decoration Project 44,496,521.79 - 12,593,987.30 - - 12,593,987.30 28.30% 28.30% - - -
Self-owned funds
Others 1,048,422,951.86 1,018,670,805.55 (1,009,397,854.77) (255,846,561.11) 801,849,341.53 - - -
Self-owned funds
5,379,854,462.06 4,531,838,906.64 (3,133,896,925.11) (255,846,561.11) 6,521,949,882.48 84,879,220.97 6,593,009.54
(i) As at 30 June 2021 and 31 December 2020, the Group considered that no impairment loss should be recognised for construction in progress. (ii) As at 30 June 2021, construction in progress with carrying amount of RMB 56,904,866.40 (31 December 2020: RMB 52,268,484.85) was pledged as
collateral for long-term borrowings (Note 4(34)(b)). (iii) For aircraft import and refit, the percentage of project investment in budget is related to the investment for the current period; for the other projects, the
percentage of project investment in budget is related to the accumulative investment. (iv) The construction in progress transferred to long-term assets for the current period amounted to RMB 3,133,896,925.11, including RMB 2,463,681,788.44
transferred to fixed assets, RMB 267,404,453.57 transferred to investment properties and RMB 402,810,683.10 transferred to long-term prepaid expenses.

S.F. HOLDING CO., LTD. NOTES TO THE FINANCIAL STATEMENTS FOR THE SIX MONTHS ENDED 30 JUNE 2021 (All amounts in RMB Yuan unless otherwise stated) [English translation for reference only]
224
4 Notes to the consolidated financial statements (Cont’d)
(18) Right-of-use assets
Buildings Machinery and
equipment Motor vehicles Computers and
electronic equipment Total Cost
1 January 2021 10,521,029,092.39 6,541,430.29 10,221,403.01 132,787.08 10,537,924,712.77 Increase in the current
period 5,827,634,717.51 - 122,592.67 - 5,827,757,310.18 Decrease in the current
period (815,955,923.74) - (360,305.24) - (816,316,228.98)
30 June 2021 15,532,707,886.16 6,541,430.29 9,983,690.44 132,787.08 15,549,365,793.97
Accumulated depreciation
1 January 2021 - - - - - Provision in the current
period 2,323,228,052.74 1,502,977.18 1,341,899.56 20,651.71 2,326,093,581.19 Decrease in the current
period (151,466,329.63) - - - (151,466,329.63)
30 June 2021 2,171,761,723.11 1,502,977.18 1,341,899.56 20,651.71 2,174,627,251.56
Carrying amount
30 June 2021 13,360,946,163.05 5,038,453.11 8,641,790.88 112,135.37 13,374,738,542.41
1 January 2021 10,521,029,092.39 6,541,430.29 10,221,403.01 132,787.08 10,537,924,712.77
As at 30 June 2021, the Group assessed that no impairment loss should be recognised for right-of-use assets.

S.F. HOLDING CO., LTD. NOTES TO THE FINANCIAL STATEMENTS FOR THE SIX MONTHS ENDED 30 JUNE 2021 (All amounts in RMB Yuan unless otherwise stated) [English translation for reference only]
225
4 Notes to the consolidated financial statements (Cont’d) (19) Intangible assets
Land use rights Purchased
software Self-developed
software Patents Trademark rights Customer
relationships Others Total Cost
31 December 2020 6,077,755,513.52 574,252,786.12 3,980,087,756.52 19,100,671.14 224,020,707.27 2,590,204,785.78 85,259,018.32 13,550,681,238.67 Transfer from investment properties in the
current period (Note 4(15)) 63,363,865.21 - - - - - - 63,363,865.21 Transfer from capitalised development
expenditures in the current period (Note 4(20)) - - 639,058,299.45 - - - - 639,058,299.45
Addition in the current period 1,384,923,126.68 59,835,296.03 - 2,624,080.40 2,051,276.98 - 37,435,845.13 1,486,869,625.22 Transfer to investment properties in the
current period (Note 4(15)) (165,321,128.59) - - - - - - (165,321,128.59) Disposal in the current period - (3,259,396.01) (91,297,248.12) - - - (27,433.36) (94,584,077.49) Decrease due to disposal of subsidiaries in
the current period (2,271,420,574.89) (9,983.96) - - - - - (2,271,430,558.85) Effect of translation of foreign currency
financial statements (16,920,209.07) (467,375.49) - (47,490.45) (2,278,982.25) (28,798,372.27) (62,862.22) (48,575,291.75)
30 June 2021 5,072,380,592.86 630,351,326.69 4,527,848,807.85 21,677,261.09 223,793,002.00 2,561,406,413.51 122,604,567.87 13,160,061,971.87
Accumulated amortisation
31 December 2020 558,213,921.94 440,534,287.05 1,524,469,064.59 5,093,076.40 28,191,460.18 280,860,909.13 26,018,388.00 2,863,381,107.29 Transfer from investment properties in the
current period (Note 4(15)) 5,035,489.93 - - - - - - 5,035,489.93 Provision in the current period 69,418,687.94 37,349,280.14 440,080,902.83 1,202,353.83 5,809,976.80 73,564,536.89 5,382,284.78 632,808,023.21 Transfer to investment properties in the
current period (Note 4(15)) (12,564,444.11) - - - - - - (12,564,444.11) Disposal in the current period - (1,191,686.34) (36,231,542.91) (289,215.26) - - - (37,712,444.51) Decrease due to disposal of subsidiaries in
the current period (235,474,890.05) (4,159.98) - - - - - (235,479,050.03) Effect of translation of foreign currency
financial statements (1,974,600.73) (218,006.35) - (31,726.32) (283,575.90) (3,098,738.17) (22,467.63) (5,629,115.10)
30 June 2021 382,654,164.92 476,469,714.52 1,928,318,424.51 5,974,488.65 33,717,861.08 351,326,707.85 31,378,205.15 3,209,839,566.68

S.F. HOLDING CO., LTD. NOTES TO THE FINANCIAL STATEMENTS FOR THE SIX MONTHS ENDED 30 JUNE 2021 (All amounts in RMB Yuan unless otherwise stated) [English translation for reference only]
226
4 Notes to the consolidated financial statements (Cont’d) (19) Intangible assets (Cont’d)
Land use rights Purchased
software Self-developed
software Patents Trademark rights Customer
relationships Others Total Provision for impairment loss
31 December 2020 - - 54,186,041.12 - - - - 54,186,041.12 Increase in the current period - - - - - - - -
30 June 2021 - - 54,186,041.12 - - - - 54,186,041.12
Carrying amount
30 June 2021 4,689,726,427.94 153,881,612.17 2,545,344,342.22 15,702,772.44 190,075,140.92 2,210,079,705.66 91,226,362.72 9,896,036,364.07
31 December 2020 5,519,541,591.58 133,718,499.07 2,401,432,650.81 14,007,594.74 195,829,247.09 2,309,343,876.65 59,240,630.32 10,633,114,090.26
For the sixth months ended 30 June 2021, the amount of amortisation expenses charged to cost of revenue, selling and distribution expenses, general and administrative expenses and research and development expenses was RMB 591,904,873.82 (for the sixth months ended 30 June 2020: RMB 457,822,929.32).

S.F. HOLDING CO., LTD. NOTES TO THE FINANCIAL STATEMENTS FOR THE SIX MONTHS ENDED 30 JUNE 2021 (All amounts in RMB Yuan unless otherwise stated) [English translation for reference only]
227
4 Notes to the consolidated financial statements (Cont’d) (19) Intangible assets (Cont’d) (a) The Group’s land use rights pledged as collateral for long-term borrowings (Note 4(34)(b)):
30 June 2021
Cost Accumulated amortisation Carrying amount
Land use rights 41,788,755.01 (4,457,467.20) 37,331,287.81
31 December 2020
Cost Accumulated amortisation Carrying amount
Land use rights 1,480,732,998.05 (193,471,483.90) 1,287,261,514.15
(b) As at 30 June 2021, the Group was still in the process of applying for certificates of ownership for
land use rights with carrying amount of RMB 695,963,986.26 (cost of RMB 706,617,090.68 ) (31 December 2020: carrying amount of RMB 589,104,756.34 and cost of RMB 595,620,420.23).
(c) As at 30 June 2021, the intangible assets developed by the Group accounted for 25.72% (31 December 2020: 22.58%) of the carrying amount of intangible assets. 30 June 2021 31 December 2020 Carrying amount of self-developed intangible
assets 2,545,344,342.22 2,401,432,650.81 Carrying amount of intangible assets 9,896,036,364.07 10,633,114,090.26 Proportion 25.72% 22.58%
(d) As at 30 June 2021, due to that some self-developed software had been discontinued or to be
discontinued, the balance of the provision for impairment loss made by the Group was RMB 54,186,041.12 upon assessment (31 December 2020: RMB 54,186,041.12).

S.F. HOLDING CO., LTD. NOTES TO THE FINANCIAL STATEMENTS FOR THE SIX MONTHS ENDED 30 JUNE 2021 (All amounts in RMB Yuan unless otherwise stated) [English translation for reference only]
228
4 Notes to the consolidated financial statements (Cont’d) (20) Capitalised development expenditures
31 December 2020
Increase in the current period
Transfer to intangible
assets in the current period
(Note 4(19)) 30 June 2021 Unmanned Aerial
Vehicle Project 60,650,385.66 3,809,679.63 - 64,460,065.29 SF Intra-city projects 21,376,077.83 18,892,379.64 (175,313.06) 40,093,144.41 Settlement Platform
System 18,640,396.52 18,478,839.81 (613,950.45) 36,505,285.88 Customer Service
System 21,456,498.67 43,734,698.54 (35,397,170.90) 29,794,026.31 Warehousing
Management System 20,571,676.85 28,602,174.00 (22,325,887.23) 26,847,963.62 Quick Delivery System 18,073,320.64 8,010,657.32 - 26,083,977.96 International Business
System 36,980,675.88 50,894,379.71 (63,706,143.24) 24,168,912.35 TS Industrial Solutions
System 11,283,814.18 21,368,886.08 (14,362,648.45) 18,290,051.81 Geographic Information
System Project 13,180,285.37 473,768.69 - 13,654,054.06 Car-free Carriage
Platform 13,136,424.61 14,159,566.78 (15,305,405.69) 11,990,585.70 Fengsheng System 10,144,424.25 17,997,196.65 (19,311,259.94) 8,830,360.96 Big Data Platform
System 15,352,609.87 8,518,273.97 (17,210,339.50) 6,660,544.34 Airfreight Capacity
Platform Phase II 11,556,172.95 3,895,368.06 (10,420,218.07) 5,031,322.94 Fengyuan Platform 10,736,220.72 11,744,068.33 (22,480,289.05) - Others 257,764,466.14 433,484,888.75 (417,749,673.87) 273,499,681.02
540,903,450.14 684,064,825.96 (639,058,299.45) 585,909,976.65
As at 30 June 2021, the Group assessed that no impairment loss should be recognised for capitalised development expenditures.

S.F. HOLDING CO., LTD. NOTES TO THE FINANCIAL STATEMENTS FOR THE SIX MONTHS ENDED 30 JUNE 2021 (All amounts in RMB Yuan unless otherwise stated) [English translation for reference only]
229
4 Notes to the consolidated financial statements (Cont’d)
(21) Goodwill
31 December 2020 Increase in the current period
Decrease in the current period
Exchange differences on translation of
foreign currency financial
statements 30 June 2021 Cost: SF Supply Chain Business 2,851,242,766.53 - - (30,056,061.01) 2,821,186,705.52 SF/HAVI China Logistics (Cayman Islands)
(“New Havi”) 340,191,111.08 - - (3,586,147.61) 336,604,963.47 Guangdong Shunxin Freight Co., Ltd.
(“Guangdong Shunxin”) 149,587,124.73 - - - 149,587,124.73 Chongqing Xuefeng Refrigerates Logistics Co.,
Ltd. 24,068,704.92 156,603.78 - - 24,225,308.70 Bon Way Logistics (H.K.) Company Limited - 15,471,616.92 - - 15,471,616.92 Suzhou Hengding Logistics Co., Ltd. 5,677,452.73 - - - 5,677,452.73 Sichuan Wu Lian Yi Da Technology Co., Ltd.
(“Wu Lian Yi Da”) 4,940,247.25 - - - 4,940,247.25 Chengdu Shunyifeng Pharmaceuticals Co., Ltd. 2,434,509.81 - - - 2,434,509.81 Hanxing Industrial Co., Ltd. 1,433,984.47 - - (15,116.19) 1,418,868.28
3,379,575,901.52 15,628,220.70 - (33,657,324.81) 3,361,546,797.41
Less: Provision for impairment loss (Note
4(24)) Chengdu Shunyifeng Pharmaceuticals Co., Ltd. (2,434,509.81) - - - (2,434,509.81)
3,377,141,391.71 15,628,220.70 - (33,657,324.81) 3,359,112,287.60

S.F. HOLDING CO., LTD. NOTES TO THE FINANCIAL STATEMENTS FOR THE SIX MONTHS ENDED 30 JUNE 2021 (All amounts in RMB Yuan unless otherwise stated) [English translation for reference only]
230
4 Notes to the consolidated financial statements (Cont’d)
(21) Goodwill (Cont’d) During the goodwill impairment assessment, the Group compares the carrying amount of the relevant assets or sets of asset groups (including goodwill) with their recoverable amount. If the recoverable amount is lower than the carrying amount, the difference shall be recognised in profit or loss for the current period. The Group’s allocation of goodwill was not changed for the six months ended 30 June 2021. The recoverable amounts of SF Supply Chain Business’s relevant asset group are calculated based on the eight-year forecast approved by management, together with a long-term growth rate in the remaining forecast period, determined by the present value of the future cash flows. The major assumptions applied in cash flows projections are presented as follows: For the six months ended 30 June
2021 2020 Revenue growth rates in the first eight-year forecast period 3.60%~32.10% 3.00%~29.00% Long-term growth rate 3.00% 3.00% Profit margin 0.80%~6.87% 1.70%~8.80% Pre-tax discount rate 12.50% 11.80%

S.F. HOLDING CO., LTD. NOTES TO THE FINANCIAL STATEMENTS FOR THE SIX MONTHS ENDED 30 JUNE 2021 (All amounts in RMB Yuan unless otherwise stated) [English translation for reference only]
231
4 Notes to the consolidated financial statements (Cont’d) (21) Goodwill (Cont’d)
The Group determined revenue growth rates and profit margin based on past performance and expectations of market development. Long-term growth rate is for the remaining forecast period which exclude first eight-year forecast period. According to the long-term inflation rate of Mainland China and Hong Kong, the Group adopts a long-term growth rate of 3%. The discount rate adopted by management is the pre-tax interest rates which is able to reflect the risks specific to the related asset groups and sets of asset groups.
(22) Long-term prepaid expenses
31 December
2020 Increase in the current period
Amortisation in the current period
Scrap/dispose in the current period 30 June 2021
Right-of-use assets improvements 1,297,197,199.41 442,167,684.00 (345,569,782.61) (45,477,784.21) 1,348,317,316.59 Settling-in allowance and introduction fee for pilots 519,548,908.19 81,730,948.23 (39,849,993.12) - 561,429,863.30 Prepaid discount interest on interest-free loans to
employees 29,412,487.74 - (7,818,084.04) (1,323,874.91) 20,270,528.79 Others 14,578,339.55 15,799,212.92 (2,766,086.44) (944,231.88) 26,667,234.15
1,860,736,934.89 539,697,845.15 (396,003,946.21) (47,745,891.00) 1,956,684,942.83

S.F. HOLDING CO., LTD. NOTES TO THE FINANCIAL STATEMENTS FOR THE SIX MONTHS ENDED 30 JUNE 2021 (All amounts in RMB Yuan unless otherwise stated) [English translation for reference only]
232
4 Notes to the consolidated financial statements (Cont’d)
(23) Other non-current assets 30 June 2021 31 December 2020 Advances for engineering equipment 2,252,404,028.70 804,531,338.54 Prepaid land use rights 94,636,613.07 405,424,800.00 Prepaid leases 224,413,084.42 222,391,070.65 Prepaid equity - 30,300,000.00
2,571,453,726.19 1,462,647,209.19

S.F. HOLDING CO., LTD. NOTES TO THE FINANCIAL STATEMENTS FOR THE SIX MONTHS ENDED 30 JUNE 2021 (All amounts in RMB Yuan unless otherwise stated) [English translation for reference only]
233
4 Notes to the consolidated financial statements (Cont’d)
(24) Asset/Credit impairment and provision for losses Decrease in the current period
31 December 2020 Provision in the
current period Reversal in the current period
Write-off in the current period
Other Decrease for the period
Exchange differences on translation of
foreign currency financial
statements 30 June 2021
Provision for bad debts 369,838,882.92 29,904,289.20 (10,000,000.00) (25,439,989.21) - - 364,303,182.91
Including: Provision for bad debts of accounts receivable (Note 4(3)) 227,852,715.45 21,893,810.94 - (22,083,061.68) - - 227,663,464.71
Provision for bad debts of other receivables (Note 4(7)) 127,816,168.32 3,942,773.61 (10,000,000.00) (3,356,927.53) - - 118,402,014.40
Provision for bad debts of long-term receivables (Note 4(11)) 14,169,999.15 4,067,704.65 - - - - 18,237,703.80
Provision for impairment of factoring receivables (Note 4(5)) 124,086,398.51 135,595.95 - (22,395.11) - - 124,199,599.35
Provision for impairment of loans and advances (Note 4(6)) 95,756,387.15 - (8,863,724.11) - - (1,269,887.57) 85,622,775.47
Sub-total 589,681,668.58 30,039,885.15 (18,863,724.11) (25,462,384.32) - (1,269,887.57) 574,125,557.73
Provision for impairment of long-term
equity investments (Note 4(12)) 148,076,009.73 - - - (22,587,342.22) - 125,488,667.51 Provision for impairment of intangible
assets (Note 4(19)) 54,186,041.12 - - - - - 54,186,041.12 Provision for impairment of
inventories (Note 4(8)) 5,279,698.19 711,212.39 - (750,000.00) - - 5,240,910.58 Provision for impairment of contract
assets (Note 4(9)) 2,005,201.91 - (119,192.56) - - - 1,886,009.35 Provision for impairment of goodwill
(Note 4(21)) 2,434,509.81 - - - - - 2,434,509.81
Sub-total 211,981,460.76 711,212.39 (119,192.56) (750,000.00) (22,587,342.22) - 189,236,138.37
801,663,129.34 30,751,097.54 (18,982,916.67) (26,212,384.32) (22,587,342.22) (1,269,887.57) 763,361,696.10

S.F. HOLDING CO., LTD. NOTES TO THE FINANCIAL STATEMENTS FOR THE SIX MONTHS ENDED 30 JUNE 2021 (All amounts in RMB Yuan unless otherwise stated) [English translation for reference only]
234
4 Notes to the consolidated financial statements (Cont’d)
(25) Short-term borrowings 30 June 2021 31 December 2020 Unsecured borrowings(a) 14,400,721,897.14 7,438,650,702.16 Discounted notes (b) 500,000,000.00 - Rediscounted notes(c) 117,861,459.91 102,356,334.16 Guaranteed borrowings(a) - 440,749,083.34 Re-factoring - 14,814,193.07
15,018,583,357.05 7,996,570,312.73
(a) As at 31 December 2020, guaranteed borrowings of RMB 440,749,083.34 were guaranteed by
subsidiaries within the Group. As of 30 June 2021, after renegotiated by the Group and the bank, the loan was changed to unsecured borrowings. Therefore, as at 30 June 2021, borrowing of RMB 333,030,000.00 is listed as unsecured borrowings.
(b) As at 30 June 2021, the amount of unmatured notes held by the Group that are discounted by commercial banks was RMB 500,000,000.00 with a discount rate of 3.10% (31 December 2020:Nil).
(c) As at 30 June 2021, the amount of unmatured notes held by the Group that are rediscounted by the
PBOC was RMB 117,861,459.91 (31 December 2020: RMB 102,356,334.16) with a rediscounted interest rate of 2.00% (31 December 2020: 2.90%).
(d) As at 30 June 2021, the range of annual interest rate of short-term borrowings was 2.90% to 3.50% (31 December 2020: 2.50% to 4.35%).
(26) Accounts payable 30 June 2021 31 December 2020 Payables to related parties (Note 8(4)(h)) 371,684,516.61 314,264,984.33 Outsourcing cost payable 10,040,349,188.93 10,065,154,438.11 Transportation cost payable 2,398,910,343.29 2,044,198,469.96 Supply and material expenses payable 1,287,052,211.35 1,261,801,093.96 Office and rental fees payable 607,538,903.42 1,005,735,544.46 Customs cost payable 34,549,435.26 37,069,556.32 Others 1,156,157,493.17 756,716,264.81
15,896,242,092.03 15,484,940,351.95

S.F. HOLDING CO., LTD. NOTES TO THE FINANCIAL STATEMENTS FOR THE SIX MONTHS ENDED 30 JUNE 2021 (All amounts in RMB Yuan unless otherwise stated) [English translation for reference only]
235
4 Notes to the consolidated financial statements (Cont’d)
(26) Accounts payable (Cont’d) Accounts payable with ageing over 1 year are analysed as follows:
30 June 2021 31 December 2020 Main reason for
unsettlement
Outsourcing cost payable 18,679,556.16 12,029,708.68 No invoice issued
by supplier
Transportation cost payable 11,948,077.04 5,657,852.76 No invoice issued
by supplier
Office and rental fees payable 8,463,554.75 25,312,773.48 No invoice issued
by supplier Supply and material expenses
payable 6,407,011.21 10,962,158.40 No invoice issued
by supplier Others 86,054,600.62 50,095,317.02
131,552,799.78 104,057,810.34
(27) Advances from customers
30 June 2021 31 December 2020 Advances from related parties (Note 8(4)(i)) 45,002.04 37,417.86 Advances of rental and others 23,987,175.96 27,538,251.61
24,032,178.00 27,575,669.47
As at 30 June 2021, the Group had no advances from customers with ageing over 1 year (31 December 2020: Nil).
(28) Contract liabilities 30 June 2021 31 December 2020 Advances from related parties (Note 8(4)(j)) 4,895,873.06 19,977,073.17 Advances of freight charges and others 1,811,846,061.09 1,519,287,022.97
1,816,741,934.15 1,539,264,096.14
The contract liability of RMB 1,507,413,548.97 which was included in the balance of 31 December 2020, was transferred into revenue during the six months ended 30 June 2021.

S.F. HOLDING CO., LTD. NOTES TO THE FINANCIAL STATEMENTS FOR THE SIX MONTHS ENDED 30 JUNE 2021 (All amounts in RMB Yuan unless otherwise stated) [English translation for reference only]
236
4 Notes to the consolidated financial statements (Cont’d)
(29) Employee benefits payable 30 June 2021 31 December 2020 Short-term employee benefits payable (a) 3,215,426,459.63 4,276,901,616.86 Defined contribution plans payable (b) 43,855,127.11 33,927,529.94
3,259,281,586.74 4,310,829,146.80
(a) Short-term employee benefits payable
31 December 2020 Increase in the current period
Decrease in the current period 30 June 2021
Wages and salaries, bonus,
allowances and subsidies 3,859,956,333.28 11,370,998,443.93 (12,467,401,804.74) 2,763,552,972.47 Employee welfare 7,083,268.99 291,657,286.89 (273,588,343.97) 25,152,211.91 Social security contributions 17,822,651.94 286,991,574.28 (285,628,759.34) 19,185,466.88
Including: Medical insurance 16,515,722.63 253,290,688.16 (251,993,179.68) 17,813,231.11 Work injury
insurance 729,692.12 22,168,407.53 (21,957,897.72) 940,201.93 Maternity
insurance 577,237.19 11,532,478.59 (11,677,681.94) 432,033.84
Housing funds 11,705,939.65 170,402,038.50 (169,645,745.74) 12,462,232.41 Labour union funds and
employee education funds 352,958,990.39 103,662,484.86 (85,416,452.77) 371,205,022.48 Non-monetary welfare 24,042,556.28 713,457,640.58 (720,192,457.94) 17,307,738.92 Others 3,331,876.33 195,256,009.58 (192,027,071.35) 6,560,814.56
4,276,901,616.86 13,132,425,478.62 (14,193,900,635.85) 3,215,426,459.63
Non-monetary welfare provided by the Group for employees primarily was non-monetary subsidies in various forms which were measured at fair value.
(b) Defined contribution plans
31 December 2020 Increase in the current period
Decrease in the current period 30 June 2021
Basic pension insurance 33,021,819.46 498,973,396.43 (489,315,707.56) 42,679,508.33 Unemployment insurance 905,710.48 15,785,892.12 (15,515,983.82) 1,175,618.78
33,927,529.94 514,759,288.55 (504,831,691.38) 43,855,127.11
(30) Taxes payable
30 June 2021 31 December 2020 Enterprise income tax payable 766,410,256.71 1,264,422,727.03 Unpaid VAT 486,917,359.84 448,742,681.47 Individual income tax payable 69,039,081.04 90,188,333.18 City maintenance and construction tax
payable 20,513,733.48 20,748,815.50 Educational surcharge payable 15,441,476.32 15,255,154.95 Others 16,734,898.06 15,905,797.11
1,375,056,805.45 1,855,263,509.24

S.F. HOLDING CO., LTD. NOTES TO THE FINANCIAL STATEMENTS FOR THE SIX MONTHS ENDED 30 JUNE 2021 (All amounts in RMB Yuan unless otherwise stated) [English translation for reference only]
237
4 Notes to the consolidated financial statements (Cont’d)
(31) Other payables
30 June 2021 31 December 2020
Current accounts payable to related parties (Note 8(4)(j)) 287,699,143.26 375,953,817.77
Engineering equipment payable 3,661,315,290.69 3,681,941,835.74
Payables of cash on delivery service 1,077,573,514.41 1,393,659,038.39
Deposits payable 1,032,880,471.34 901,720,755.25
Recharge card payable 372,543,200.49 294,040,210.32
Management fees payable 184,508,625.67 186,269,115.84
Warranty deposits payable 152,278,300.32 128,945,874.86
Temporary collection payable 49,988,637.13 65,391,753.40
Professional service fee payable 10,893,441.27 11,551,338.02
Investments payable 10,100,000.00 -
Others 741,405,626.57 491,320,044.65
7,581,186,251.15 7,530,793,784.24
Other payables with ageing over 1 year:
30 June 2021
31 December 2020 Main reason for
unsettlement
Deposits payable 297,374,469.97 282,912,917.46 Continuing business not
expired
Engineering equipment payable 95,843,768.34 63,932,116.06
Project payment unsettled
Management fees payable 53,119,089.27 66,999,357.73
Management service fees unsettled
Warranty deposits payable 30,214,649.51 30,852,760.05 Warranty in effect
Others 34,540,811.48 29,589,206.06 Other payments on hold
511,092,788.57 474,286,357.36

S.F. HOLDING CO., LTD. NOTES TO THE FINANCIAL STATEMENTS FOR THE SIX MONTHS ENDED 30 JUNE 2021 (All amounts in RMB Yuan unless otherwise stated) [English translation for reference only]
238
4 Notes to the consolidated financial statements (Cont’d) (32) Current portion of non-current liabilities
30 June 2021 31 December 2020 Current portion of lease liabilities (Note 4(36)) 4,865,932,822.38 -- Current portion of debentures payable (a) 1,993,935,324.84 1,939,714,467.86 Current portion of long-term borrowings (Note
4(34)) 855,213,514.60 803,722,191.93 Current portion of employee incentives (Note
4(38)) 12,625,000.00 189,480,233.50 Current portion of long-term payables (Note
4(37)) - 12,434,000.99
7,727,706,661.82 2,945,350,894.28

S.F. HOLDING CO., LTD. NOTES TO THE FINANCIAL STATEMENTS FOR THE SIX MONTHS ENDED 30 JUNE 2021 (All amounts in RMB Yuan unless otherwise stated) [English translation for reference only]
239
4 Notes to the consolidated financial statements (Cont’d)
(32) Current portion of non-current liabilities (Cont’d)
(a) Current portion of debentures payable
31 December 2020 Interest accrual
Amortisation of premium/ discount
Repayment for the current period
Reclassification from debentures payable in the current period
(Note 4(35))
Exchange differences on
translation of foreign currency financial
statements 30 June 2021 The First Debentures of
2017 3,641,666.67 - - - 8,740,000.02 - 12,381,666.69 The First Debentures of
2018 814,009,100.82 17,160,000.00 166,833.54 - - - 831,335,934.36 The First Middle-term
Notes of 2018 1,012,511,953.20 22,300,000.02 87,009.48 - - - 1,034,898,962.70 Overseas debentures
denominated in USD of 2018 58,609,191.04 - - (66,657,421.87) 65,561,683.42 (535,162.45) 56,978,290.14
The First Debentures of 2019 3,105,750.00 - - - 5,535,000.00 - 8,640,750.00
Overseas debentures denominated in USD of 2020 47,836,806.13 - - (65,041,484.38) 63,972,309.41 (436,799.11) 46,330,832.05
Green Corporate Debentures of 2021 (1st instalment) - - - - 3,368,888.90 - 3,368,888.90
1,939,714,467.86 39,460,000.02 253,843.02 (131,698,906.25) 147,177,881.75 (971,961.56) 1,993,935,324.84

S.F. HOLDING CO., LTD. NOTES TO THE FINANCIAL STATEMENTS FOR THE SIX MONTHS ENDED 30 JUNE 2021 (All amounts in RMB Yuan unless otherwise stated) [English translation for reference only]
240
4 Notes to the consolidated financial statements (Cont’d)
(33) Other current liabilities 30 June 2021 31 December 2020 Super&short term commercial paper (a):
The Second Phase of 2021 504,188,541.86 - Short term corporate debentures (b):
The First Phase of 2021 1,002,830,256.89 - The Second Phase of 2021 500,802,978.32 -
Output VAT to be transferred (contract liabilities) 130,340,080.79 92,355,845.77
2,138,161,857.86 92,355,845.77
(a) The super&short term commercial paper is detailed as follows:
Par value (RMB) Date of issue Term Interest rate
The Second Phase of 2021 500,000,000.00 17 March 2021
to18 March 2021 180 days 3.00%
(b) The short term corporate debentures are detailed as follows: Par value (RMB) Date of issue Term Interest rate
The First Phase of 2021 1,000,000,000.00
From 20 May 2021 to 21 May
2021 270 days 2.94%
The Second Phase of 2021 500,000,000.00
From 3 June 2021 to 4 June
2021 1 year 2.98%

S.F. HOLDING CO., LTD. NOTES TO THE FINANCIAL STATEMENTS FOR THE SIX MONTHS ENDED 30 JUNE 2021 (All amounts in RMB Yuan unless otherwise stated) [English translation for reference only]
241
4 Notes to the consolidated financial statements (Cont’d)
(34) Long-term borrowings 30 June 2021 31 December 2020 Unsecured borrowings 1,034,292,715.10 1,955,997,660.72 Guaranteed borrowings (a) 170,621,875.00 202,750,385.20 Secured borrowings (b) 93,396,950.83 510,794,412.06 Pledged borrowings (c) 1,315,288,781.45 -
2,613,600,322.38 2,669,542,457.98
Less: Current portion of long-term borrowings
(Note 4(32)) Unsecured borrowings (482,101,555.55) (636,019,395.23) Guaranteed borrowings (50,621,875.00) (102,750,385.20) Secured borrowings (20,126,950.83) (64,952,411.50) Pledged borrowings (302,363,133.22) -
(855,213,514.60) (803,722,191.93)
1,758,386,807.78 1,865,820,266.05
(a) As at 30 June 2021, the Group’s guaranteed borrowings of RMB 120,000,000.00 (31 December
2020: RMB 140,000,000.00) were guaranteed by subsidiaries within the Group and guaranteed borrowings of RMB 50,000,000.00 (31 December 2020: RMB 60,000,000.00) were guaranteed by Taisen Holdings and Havi Group LP (U.S.).
(b) As at 30 June 2021, the secured bank borrowings of RMB 93,270,000.00 (31 December 2020: RMB
103,270,000.00) were secured by construction in progress with carrying amount of RMB 56,904,866.40 (31 December 2020: RMB 52,268,484.85), fixed assets with carrying amount of RMB 138,131,064.70 (31 December 2020: RMB 181,287,156.79), investment properties with carrying amount of RMB 120,581,681.47 (31 December 2020: RMB 77,180,832.16) and intangible assets with carrying amount of RMB 37,331,287.81 (31 December 2020: RMB 110,836,987.85) respectively and were fully guaranteed by Taisen Holdings. The interest is paid quarterly. The principal should be repaid during the period from 19 October 2020 to 20 October 2033 by instalments. In addition, as of 31 December 2020, the secured bank borrowings of RMB 406,788,098.16 which were secured by intangible assets with carrying amountof RMB 1,176,424,526.30 was repaid in advance in April 2021.
(c) On 30 June 2021, the bank borrowings of RMB 1,308,830,202.77 (31 December 2020: Nil) were pledged by Shunyuan Financial Leasing (Tianjin) Co., Ltd. ("Shunyuan Financial Leasing")’s receivables arising from the aircraft financial leasing business with SF Airlines, another subsidiary. Quarterly.shall the interests be paid, while principal shall be repaid in installments from 16 January 2022 to 23 June 2026. As at 30 June 2021, the balance of pledged receivables was RMB 1,497,068,068.69.
(d) As at 30 June 2021, the rate of long-term borrowings ranged from 3.20% to 4.90% (31 December 2020: 3.20% to 5.39%).

S.F. HOLDING CO., LTD. NOTES TO THE FINANCIAL STATEMENTS FOR THE SIX MONTHS ENDED 30 JUNE 2021 (All amounts in RMB Yuan unless otherwise stated) [English translation for reference only]
242
4 Notes to the consolidated financial statements (Cont’d)
(35) Debentures payable
31 December
2020 Issued in the
current period Issuance expenses Interest accrual
Amortisation of premium/ discount
Exchange differences on translation of
foreign currency financial
statements
Current portion of debentures
payable (Note 4(32)) 30 June 2021
The First Debentures of 2017 380,000,000.00 - - 8,740,000.02 - - (8,740,000.02) 380,000,000.00 The First Debentures of 2019 299,815,626.62 - - 5,535,000.00 52,476.54 - (5,535,000.00) 299,868,103.16 Overseas debentures
denominated in USD of 2018 3,243,911,307.97 - - 65,561,683.42 3,223,547.10 (29,620,382.79) (65,561,683.42) 3,217,514,472.28 Overseas debentures
denominated in USD of 2020 4,501,703,534.18 - - 63,972,309.41 3,013,957.75 (41,105,369.46) (63,972,309.41) 4,463,612,122.47 Green Corporates Debentures
of 2021 (1st instalment) - 500,000,000.00 (712,264.15) 3,368,888.90 40,627.69 - (3,368,888.90) 499,328,363.54
8,425,430,468.77 500,000,000.00 (712,264.15) 147,177,881.75 6,330,609.08 (70,725,752.25) (147,177,881.75) 8,860,323,061.45

S.F. HOLDING CO., LTD. NOTES TO THE FINANCIAL STATEMENTS FOR THE SIX MONTHS ENDED 30 JUNE 2021 (All amounts in RMB Yuan unless otherwise stated) [English translation for reference only]
243
4 Notes to the consolidated financial statements (Cont’d)
(35) Debentures payable (Cont’d)
Currency Par value Date of issue Term Amount
(equivalent to RMB)
The First Debentures of 2017 (a) RMB 530,000,000.00 17 October 2017 3+2 years 530,000,000.00 The First Debentures of 2018
(Note 4(32)(a))(a) RMB 800,000,000.00 From 1 August 2018
to 2 August 2018 3 years 800,000,000.00 Overseas debentures
denominated in USD of 2018 (b) USD 500,000,000.00 27 July 2018 5 years 3,230,050,000.00
The First Middle-term Notes of 2018 (Note 4(32)(a))(c) RMB 1,000,000,000.00 19 September 2018 3 years 1,000,000,000.00
The First Debentures of 2019 (a) RMB 300,000,000.00 20 September 2019 3 years 300,000,000.00 Overseas debentures
denominated in USD of 2020 (d) USD 700,000,000.00 20 February 2020 10 years 4,522,070,000.00
Green Corporate Debentures of 2021 (1st instalment) (e) RMB 500,000,000.00
From 23 April 2021 to 26 April 2021 3 years 500,000,000.00
(a) Taisen Holdings was approved to issue corporate debentures of no more than RMB 2 billion
(inclusive) in instalments to the public under the Regulatory Permission [2017] No. 1015 as issued by the China Securities Regulatory Commission. In 2017, Taisen Holdings publicly issued the corporate debentures (1st instalment) (“the First Debentures of 2017”) to qualified investors. The debenture interest shall be annually calculated at simple interest rate, and the nominal interest rate is 4.6%, with interest paid annually and the final instalment of interest paid with the principal. The debenture has the put options for investors, and investors are entitled to the right to choose to put all or part of the debenture held by them at par value to Taisen Holdings on the interest payment date for the third year since issued such debenture. In October 2020, the debenture at par value of RMB 150,000,000.00 was paid in advance. In 2018, Taisen Holdings publicly issued the corporate debentures (1st instalment) (“the First Debentures of 2018”) to qualified investors. The debenture interest shall be annually calculated at simple interest rate, and the nominal interest rate is 4.29%, with interest paid annually and the final instalment of interest paid with the principal. Such debentures are included in current portion of non-current liabilities as they will be due in August 2021.

S.F. HOLDING CO., LTD. NOTES TO THE FINANCIAL STATEMENTS FOR THE SIX MONTHS ENDED 30 JUNE 2021 (All amounts in RMB Yuan unless otherwise stated) [English translation for reference only]
244
4 Notes to the consolidated financial statements (Cont’d)
(35) Debentures payable (Cont’d) (a) (Cont’d)
Taisen Holdings was approved to issue corporate debentures of no more than RMB 2 billion (inclusive) in instalments to the public under the Regulatory Permission [2019] No. 388 as issued by the China Securities Regulatory Commission. In 2019, Taisen Holdings publicly issued the corporate debentures (1st instalment) (“the First Debentures of 2019”) to qualified investors. The debenture interest shall be annually calculated at simple interest rate, and the nominal interest rate is 3.69%, with interest paid annually and the final instalment of interest paid with the principal.
(b) On 26 July 2018, S.F. Holding Investment Limited, a wholly-owned overseas subsidiary of the
Company, issued debentures of USD 500 million overseas (“Overseas debentures denominated in USD of 2018”). The debentures were listed on the Stock Exchange of Hong Kong Limited (“SEHK”) on 27 July 2018. The nominal interest rate is 4.13% per annum, and the interest is paid semi-annually, for which the Company provides unconditional and irrevocable cross-border guarantee.
(c) According to the Notice of Acceptance of Registration issued by the National Association of Financial Market Institutional Dealers (Zhong Shi Zhu Xie [2017] MTN443), Taisen Holdings’ quota of middle-term notes was RMB 2 billion. On 19 September 2018, Taisen Holdings issued the first middle-term notes of 2018 (“the First Middle-term Notes of 2018”) totalling RMB 1 billion at a nominal interest rate of 4.46%, with interest paid annually and the final instalment of interest paid with the principal. The middle-term notes will mature in September 2021, thus reclassified to the current portion of non-current liabilities.
(d) On 20 February 2020, S.F. Holding Investment Limited, a wholly-owned overseas subsidiary of the Company, issued debentures of USD 700 million overseas (“Overseas debentures denominated in USD of 2020”). The debentures were listed on SEHK on 21 February 2020. The nominal interest rate is 2.875% per annum, and the interest is paid semi-annually, for which the Company provides guarantee.
(e) Taisen Holdings was approved to issue corporate debentures of no more than RMB 2 billion (inclusive) in instalments to the public under the Regulatory Permission [2019] No. 388 as issued by the China Securities Regulatory Commission. In 2021, Taisen Holdings publicly issued the Green Corporate Debentures (1st instalment) (specially for carbon neutrality) (“Green Corporate Debentures of 2021 (1st instalment)”) to qualified investors. The debenture interest shall be annually calculated at simple interest rate, and the nominal interest rate is 3.79%, with interest paid annually and the final instalment of interest paid with the principal.

S.F. HOLDING CO., LTD. NOTES TO THE FINANCIAL STATEMENTS FOR THE SIX MONTHS ENDED 30 JUNE 2021 (All amounts in RMB Yuan unless otherwise stated) [English translation for reference only]
245
4 Notes to the consolidated financial statements (Cont’d)
(36) Lease liabilities
30 June 2021 31 December 2020 Lease liabilities 13,006,217,787.93 -- Less: Current portion of non-current liabilities
(Note 4(32)) (4,865,932,822.38) --
8,140,284,965.55 --
(i) On June 30, 2021, the lease payment related to the lease contract that the Group has signed but
has not yet begun to execute was RMB 2,633,332,669.38 (Note 10(2)).
(37) Long-term payables 30 June 2021 31 December 2020 Finance leases payable - 15,131,771.29 Others - 7,503,856.60 Less:Current portion of long-term payables
(Note 4(32)) - (12,434,000.99)
- 10,201,626.90
(38) Long-term employee benefits payable
30 June 2021 31 December 2020 Cash-settled share-based payments 143,072,578.78 119,062,850.83 Employee incentives 33,643,233.50 189,480,233.50 Long-term service bonus 27,815,439.20 26,477,376.10 Less: Current portion of employee incentives
(Note 4(32)) (12,625,000.00) (189,480,233.50)
191,906,251.48 145,540,226.93

S.F. HOLDING CO., LTD. NOTES TO THE FINANCIAL STATEMENTS FOR THE SIX MONTHS ENDED 30 JUNE 2021 (All amounts in RMB Yuan unless otherwise stated) [English translation for reference only]
246
4 Notes to the consolidated financial statements (Cont’d)
(39) Deferred income
31 December
2020 Increase in the current period
Decrease in the current period 30 June 2021 Source
Government grants (a) 414,736,204.81 182,442,212.45 (41,037,181.29) 556,141,235.97
Received government
grants pending for future recognition
in income
Consideration of land acquisition - 38,736,401.94 - 38,736,401.94
Received consideration
pending for future recognition in
income
414,736,204.81 221,178,614.39 (41,037,181.29) 594,877,637.91
(a) The government grants related to deferred income in the current period are presented as follows:
Government grants 31 December
2020
Increase in grants in the
current period
Amount recognised in
other income in the current
period (Note 4(55))
Decrease in disposal of
subsidiaries in the current
period 30 June 2021 Related to
assets/income
Huanggang Baitan Lake Organising Committee Project 203,324,004.00 125,060,960.00 - - 328,384,964.00
Related to assets
Construction development fund for Tianjin Project 41,330,343.47 - (206,165.64) - 41,124,177.83
Related to assets
Grant for maintenance of aircraft engines 28,505,473.01 - (933,035.81) - 27,572,437.20
Related to assets
Ancillary grant of infrastructure for Wuhu E-Commerce Industrial Park 25,307,870.49 - (187,083.92) (25,120,786.57) -
Related to assets
Comprehensive pilot program of Shanghai modern service industry 24,918,263.92 - (168,263.92) - 24,750,000.00
Related to assets
Weihai industrial development support fund 16,311,231.45 - (93,322.26) - 16,217,909.19
Related to assets
Ma’anshan Industrial Park Project 14,200,888.14 4,409,500.00 (170,785.62) - 18,439,602.52
Related to assets
Subsidy for new energy vehicles 9,131,381.94 - (835,470.90) - 8,295,911.04
Related to assets
Guangzhou Modern Supply Chain System Construction Project 9,066,364.80 - (1,575,147.54) - 7,491,217.26
Related to assets
Subsidy for investment and construction of Ganzhou Development Zone 6,488,685.00 - - - 6,488,685.00
Related to assets
Special fund for service industry development in Changchun 4,160,966.55 - (46,840.14) - 4,114,126.41
Related to assets
Subsidy for Guangdong Yue Cai Ke Jiao Projects 3,200,000.00 - - - 3,200,000.00
Related to assets
Subsidy for Nanjing Fengtai Industrial Park Project 3,000,000.00 2,000,000.00 (34,305.32) - 4,965,694.68
Related to assets
Shenzhen intelligent logistics project fund 2,822,222.20 - (833,333.34) - 1,988,888.86
Related to assets

S.F. HOLDING CO., LTD. NOTES TO THE FINANCIAL STATEMENTS FOR THE SIX MONTHS ENDED 30 JUNE 2021 (All amounts in RMB Yuan unless otherwise stated) [English translation for reference only]
247
4 Notes to the consolidated financial statements (Cont’d)
(39) Deferred income (Cont’d)
(a) (Cont’d)
Government grants 31 December
2020
Increase in grants in the
current period
Amount recognised in
other income in the current
period (Note 4(55))
Decrease in disposal of
subsidiaries in the current
period 30 June 2021 Related to
assets/income
Special fund of Shenzhen
industrial design development 2,769,473.64 - (115,166.68) - 2,654,306.96
Related to assets
Commercial circulation development project 1,783,369.12 - (463,712.07) - 1,319,657.05
Related to assets
Tianjin Port Free Trade Zone supply chain system construction project 1,713,955.56 - (505,172.34) - 1,208,783.22
Related to assets
Enterprise Expansion Fund 683,212.40 - - - 683,212.40 Related to
assets Special subsidy for logistics
standardisation granted by the Bureau of Commerce 343,627.38 - (144,839.22) - 198,788.16
Related to assets
Special municipal supporting fund for Ezhou Transhipment Centre Project - 29,194,200.00 - - 29,194,200.00
Related to assets
Others 15,674,871.74 21,777,552.45 (9,603,750.00) - 27,848,674.19 Related to
assets
414,736,204.81 182,442,212.45 (15,916,394.72) (25,120,786.57) 556,141,235.97

S.F. HOLDING CO., LTD. NOTES TO THE FINANCIAL STATEMENTS FOR THE SIX MONTHS ENDED 30 JUNE 2021 (All amounts in RMB Yuan unless otherwise stated) [English translation for reference only]
248
4 Notes to the consolidated financial statements (Cont’d) (40) Deferred tax assets and deferred tax liabilities (a) Deferred tax assets not taking into consideration the offsetting of balances
30 June 2021 31 December 2020
Deductible temporary
differences and deductible tax
losses Deferred tax
assets
Deductible temporary
differences and deductible tax
losses Deferred tax
assets Deductible tax losses 6,147,286,611.42 1,471,680,634.86 4,293,803,363.96 1,019,822,622.30 Accrued expenses 972,784,517.67 223,525,167.94 916,494,818.02 211,149,453.98 Employee incentives 21,018,233.50 5,254,558.38 - - Unrealised profits from
internal transactions 568,259,661.49 142,064,915.37 567,805,482.90 141,951,370.73 Provision for asset
impairment 442,029,238.05 101,887,759.50 418,871,236.81 97,647,556.61 Deferred income 160,817,532.73 38,841,927.78 379,953,251.04 93,473,271.68 Depreciation and
amortisation differences 825,684,933.95 180,802,412.01 803,136,041.33 176,076,498.61
9,137,880,728.81 2,164,057,375.84 7,380,064,194.06 1,740,120,773.91
Including: Expected to be
recovered within 1 year (inclusive) 358,870,678.14 385,849,550.76
Expected to be recovered after 1 year 1,805,186,697.70 1,354,271,223.15
2,164,057,375.84 1,740,120,773.91
(b) Deductible tax losses and deductible temporary differences that are not recognised as deferred tax
assets are analysed as follows:
30 June 2021 31 December 2020 Deductible tax losses (c) 9,200,159,487.25 6,200,346,659.44 Deductible temporary differences 210,300,530.35 229,507,703.41
9,410,460,017.60 6,429,854,362.85

S.F. HOLDING CO., LTD. NOTES TO THE FINANCIAL STATEMENTS FOR THE SIX MONTHS ENDED 30 JUNE 2021 (All amounts in RMB Yuan unless otherwise stated) [English translation for reference only]
249
4 Notes to the consolidated financial statements (Cont’d) (40) Deferred tax assets and deferred tax liabilities (Cont’d)
(c) The following table shows unrecognised deductible tax losses based on its expiration date:
30 June 2021 31 December 2020 2021 207,482,250.02 221,049,045.31 2022 243,199,045.64 249,846,567.01 2023 517,305,652.81 523,916,110.63 2024 1,499,345,677.80 1,508,970,519.19 2025 2,648,511,718.02 2,548,822,310.72 2026 and subsequent years 4,084,315,142.96 1,147,742,106.58
9,200,159,487.25 6,200,346,659.44
(d) Deferred tax liabilities before offsetting
30 June 2021 31 December 2020
Taxable temporary
differences Deferred tax
liabilities Taxable temporary
differences Deferred tax
liabilities Changes in fair value of
investments in other equity instruments 859,659,896.85 214,914,974.21 932,870,364.02 233,217,591.00
Changes in fair value of other non-current financial assets 27,391,319.76 6,847,829.94 27,391,319.76 6,847,829.94
Changes in fair value upon reclassification of remaining equity of Hive Box Technology 446,796,225.96 111,699,056.49 446,796,225.96 111,699,056.49
Changes in fair value upon reclassification of remaining equity of Shenzhen Fengyi Technology Co., Ltd. ("Fengyi Technology") - - 28,000,000.00 7,000,000.00
Depreciation of fixed assets 4,649,660,323.11 1,100,824,505.16 3,824,110,621.39 905,252,293.68 Appreciation in asset value
arising from business combination involving enterprises not under common control 2,516,133,974.89 587,014,662.71 2,629,788,996.63 613,610,691.51
Changes in fair value of financial assets held for trading 17,253,781.41 4,313,445.35 16,847,854.84 4,211,963.71
Others 1,370,102.95 342,525.74 26,478,052.63 6,619,513.16
8,518,265,624.93 2,025,956,999.60 7,932,283,435.23 1,888,458,939.49
Including: Expected to be recovered
within 1 year (inclusive) 362,894,017.36 323,259,120.82 Expected to be recovered
after 1 year 1,663,062,982.24 1,565,199,818.67
2,025,956,999.60 1,888,458,939.49

S.F. HOLDING CO., LTD. NOTES TO THE FINANCIAL STATEMENTS FOR THE SIX MONTHS ENDED 30 JUNE 2021 (All amounts in RMB Yuan unless otherwise stated) [English translation for reference only]
250
4 Notes to the consolidated financial statements (Cont’d)
(40) Deferred tax assets and deferred tax liabilities (Cont’d)
(e) The net balances of deferred tax assets and liabilities after offsetting are as follows: 30 June 2021 31 December 2020 Deferred tax assets - net 1,776,170,609.17 1,539,267,775.98
Deferred tax liabilities - net 1,638,070,232.93 1,687,605,941.56
(41) Share capital
31 December 2020 Increase in the current period
Decrease in the current period 30 June 2021
Ordinary shares
denominated in RMB 4,556,440,455.00 - - 4,556,440,455.00
31 December 2019 Increase in the
current period(i)
Decrease in the current period
(Note 4(43)(ii)) 30 June 2020 Ordinary shares
denominated in RMB 4,414,585,265.00 36,244,799.00 (2,456,568.00) 4,448,373,496.00
(i) The Company publicly issued convertible corporate debentures totalling RMB 5.8 billion
(“Convertible Corporate Debentures”) on 18 November 2019 under the Regulatory Permission [2019] No. 1903 as issued by the China Securities Regulatory Commission. The Convertible Corporate Debentures have a term of six years, that is, from 18 November 2019 to 18 November 2025. Holders of the Convertible Corporate Debentures can exercisethe right to convert the Convertible Corporate Debentures into shares of the Company at the current conversion price during the period which is from the first trading day after six months following the end of the issuance of Convertible Corporate Debentures to the maturity date. For the six months ended 30 June 2020, Convertible Corporate Debentures with carrying amount of RMB 1,479,651,803.09 were converted into 36,244,799 A-share ordinary shares upon the exercise of conversion rights. The share capital was increased by RMB 36,244,799.00 and the capital reserve by RMB 1,443,407,004.09. As of 31 December 2020, the Convertible Corporate Debentures have been fully converted,the share capial was increased by RMB 144,311,758.00 and the capital reserve by RMB 5,758,688,018.73.

S.F. HOLDING CO., LTD. NOTES TO THE FINANCIAL STATEMENTS FOR THE SIX MONTHS ENDED 30 JUNE 2021 (All amounts in RMB Yuan unless otherwise stated) [English translation for reference only]
251
4 Notes to the consolidated financial statements (Cont’d)
(42) Capital reserve
31 December 2020 Increase in the current period
Decrease in the current period 30 June 2021
Share premium
- Capital contribution by shareholders 15,768,464,376.95 - - 15,768,464,376.95
- Transfer of convertible corporate debentures to equity
(Note 4(41)(i)) 5,758,688,018.73 - - 5,758,688,018.73 - Transfer of convertible corporate
debentures issued by subsidiaries to equity 1,980,870,478.56 - - 1,980,870,478.56
-Capital reserve generated from transactions with minority shareholders 325,672,503.93 1,045,858,766.68 - 1,371,531,270.61
- Share-based payments in capital contribution by shareholders
(Note 4(43)(ii)) 31,448,407.31 - - 31,448,407.31 - Business combinations involving
enterprises under common control (76,633,221.35) - - (76,633,221.35)
Other capital reserve - Amount of share-based
payments recognised in capital reserve (Note 9(2)) 264,637,027.21 104,555,342.61 - 369,192,369.82
- Others (i) 352,069,695.16 - (5,855,720.04) 346,213,975.12
24,405,217,286.50 1,150,414,109.29 (5,855,720.04) 25,549,775,675.75
31 December 2019 Increase in the current period
Decrease in the current period 30 June 2020
Share premium
- Capital contribution by shareholders 15,768,464,376.95 - - 15,768,464,376.95
- Business combinations involving enterprises under common control (76,633,221.35) - - (76,633,221.35)
- Transfer of convertible corporate debentures to equity (Note 4(41)(i)) - 1,443,407,004.09 - 1,443,407,004.09
- Share-based payments in capital contribution by shareholders
(Note 4(43)(ii)) 88,760,253.39 - (57,311,814.73) 31,448,438.66 -Capital reserve generated from
transactions with minority shareholders - 343,545,387.57 - 343,545,387.57
Other capital reserve - Amount of share-based
payments recognised in capital reserve (Note 9(2)) 47,011,172.79 47,180,411.55 - 94,191,584.34
- Others (i) 296,416,012.38 5,209,476.53 - 301,625,488.91
16,124,018,594.16 1,839,342,279.74 (57,311,814.73) 17,906,049,059.17
(i) Movements in the current period represent changes in equity resulting from the changes of the
Group’s share of the investee’s equity other than those arising from the net profit or loss and other comprehensive income.

S.F. HOLDING CO., LTD. NOTES TO THE FINANCIAL STATEMENTS FOR THE SIX MONTHS ENDED 30 JUNE 2021 (All amounts in RMB Yuan unless otherwise stated) [English translation for reference only]
252
4 Notes to the consolidated financial statements (Cont’d)
(43) Treasury stock
31 December 2020 Increase in the current period
Decrease in the current period 30 June 2021
Treasury stock 394,992,892.71 - - 394,992,892.71
31 December 2019 Increase in the current period
Decrease in the current period(ii) 30 June 2020
Treasury stock 454,761,306.79 - (59,768,382.73) 394,992,924.06
(i) On 31 January 2019, at the 19th session of the 4th Board of Directors, the Proposal of
Repurchasing Shares by Centralised Price Bidding was approved, under which the Company repurchased a portion of corporate shares for employee stock ownership plan or share-based incentive plan through centralised price bidding by self-owned funds; a total of 11,010,729.00 shares were repurchased and treasury stock of RMB 394,992,892.71 was recognised.
(ii) In addition, ordinary A shares, which were issued by the Company to the incentive recipients of the restricted shares incentive plan in 2017 and 2018, counted at 7,788,643.00 shares with raised funds totalling RMB 202,255,537.22, including an increment of share capital of RMB 7,788,643.00 and an increment of capital reserve of RMB 194,466,894.22. In addition, the repurchasing obligation is recognised in liabilities (as purchase of treasury stock) at the number of restricted shares issued multiplied by the repurchasing price. During the period from 2018 to 2020, the Company would consistenly adjust the restricted stocks at the end of each period according to the resignation of the original incentive objects and the fulfillment of the restricted stock sales restrictions. In 2018, 2019 and 2020, treasury shares were offset by RMB 1,327,069.94, RMB 141,160,053.20, and RMB 59,768,414.08 respectively. (The share capital was reduced by RMB 2,456,568.00 and the capital reserve was reduced by RMB 57,311,846.08). The restricted share incentive plan mentioned above was fully implemented in 2020.
(44) Special reserve
31 December 2020 Increase in the current period
Decrease in the current period 30 June 2021
Safety reserve - 12,520,064.22 (12,520,064.22) -
31 December 2019 Increase in the current period
Decrease in the current period 30 June 2020
Safety reserve - 12,187,435.48 (12,187,435.48) -
Pursuant to the Administrative Measures for the Collection and Utilisation of Enterprise Work Safety Funds (Cai Qi [2012] No. 16) issued by the Ministry of Finance and the State Administration of Work Safety on 14 February 2012, 1% of the income from the “Common cargo transportation business” which is operated by certain subsidiaries of the Group is appropriated to safety reserve. The safety reserve is recognised in profit or loss as the “Special reserve” item for the current period. When the accrued safety reserve is used under the prescribed conditions, it is written off against the original amount directly.

S.F. HOLDING CO., LTD. NOTES TO THE FINANCIAL STATEMENTS FOR THE SIX MONTHS ENDED 30 JUNE 2021 (All amounts in RMB Yuan unless otherwise stated) [English translation for reference only]
253
4 Notes to the consolidated financial statements (Cont’d)
(45) Surplus reserve
31 December 2020 Increase in the current period
Decrease in the current period 30 June 2021
Statutory surplus reserve 745,043,348.45 - - 745,043,348.45
31 December 2019 Increase in the current period
Decrease in the current period 30 June 2020
Statutory surplus reserve 601,241,237.54 - - 601,241,237.54
(46) Retained earnings
For the six months ended 30 June
2021 2020
Retained earnings at the beginning of the period 25,708,230,458.34 19,769,413,015.66
Add: Net profit attributable to shareholders of the parent company for the current period 759,921,074.24 3,761,593,296.43
Transfer from other comprehensive income to retained earnings 113,136,152.81 -
Less: Ordinary share dividends payable (a) (1,499,991,809.58) (1,188,301,851.36)
Appropriation to general risk reserve (3,940,692.75) (2,344,717.97)
Retained earnings at the end of the period 25,077,355,183.06 22,340,359,742.76
(a) The Company held a shareholders’ meeting on 9 April 2021. On the basis of the total share capital
at the registration date on which the 2020 profit distribution plan was implemented less the special shares repurchased by the Company, a total of RMB 1,499,991,809.58 of cash dividends were distributed to all shareholders at RMB 3.30 (including tax) per 10 shares, without bonus shares being given or capital reserve being transferred into the share capital.

S.F. HOLDING CO., LTD. NOTES TO THE FINANCIAL STATEMENTS FOR THE SIX MONTHS ENDED 30 JUNE 2021 (All amounts in RMB Yuan unless otherwise stated) [English translation for reference only]
254
4 Notes to the consolidated financial statements (Cont’d)
(47) Minority interests
30 June 2021 31 December 2020
Hangzhou SF Intra-city Industrial Co., Ltd. (“Intra-city Industrial”) 468,201,998.84 64,563,927.89
New Havi 188,474,736.17 186,219,284.07
Chongqing Fonair UAS Technology Co., Ltd. 106,321,323.63 68,350,562.60
Shenzhen S.F. Express Co., Ltd. 96,036,490.75 204,187,038.94
Guangdong Fengxing Zhitu Technology Co., Ltd. 88,542,138.28 57,772,424.84
Beijing Fengjietai Enterprise Management Co., Ltd. 79,764,766.15 -
Beijing S.F. Intra-city Technology Co., Ltd. 38,185,015.03 35,220,504.42
Shanghai Taigenrun Enterprise Management Co., Ltd. 29,773,601.44 -
Chongqing Xuefeng Refrigerates Logistics Co., Ltd. 29,261,049.21 27,715,827.08
Wu Lian Yi Da 15,683,112.60 24,022,486.09
Chengdu Fengcheng Logistics Co., Ltd. (10,518,494.73) (10,909,045.82)
Shenzhen Fengwang Holdings Co., Ltd. (69,836,622.41) -
Guangdong Shunxin (498,409,679.83) (395,350,884.73)
Others 63,086,458.98 54,858,695.26
624,565,894.11 316,650,820.64

S.F. HOLDING CO., LTD. NOTES TO THE FINANCIAL STATEMENTS FOR THE SIX MONTHS ENDED 30 JUNE 2021 (All amounts in RMB Yuan unless otherwise stated) [English translation for reference only]
255
4 Notes to the consolidated financial statements (Cont’d)
(48) Revenue and cost of revenue For the six months ended 30 June
2021 2020 Revenue from main operations (a) 88,203,059,310.59 71,028,669,391.17 Revenue from other operations (b) 140,870,513.19 100,338,347.04
Total revenue 88,343,929,823.78 71,129,007,738.21
Cost of revenue from main operations (a) 79,334,613,584.16 57,799,242,648.49 Cost of revenue from other operations (b) 86,740,004.24 63,886,252.92
Total cost of revenue 79,421,353,588.40 57,863,128,901.41
(a) Revenue and cost of revenue from main operations:
For the six months ended 30 June 2021 For the six months ended 30 June 2020
Revenue from main
operations
Cost of revenue from main operations
Revenue from main operations
Cost of revenue from main operations
Express & logistics and
supply chain services 87,099,464,261.56 78,446,298,960.60 70,188,001,144.10 57,121,320,304.19 Sales of goods 563,159,220.18 538,123,428.16 452,123,296.72 427,084,226.66 Others 540,435,828.85 350,191,195.40 388,544,950.35 250,838,117.64
88,203,059,310.59 79,334,613,584.16 71,028,669,391.17 57,799,242,648.49
(b) Revenue and cost of revenue from other operations:
For the six months ended 30 June 2021 For the six months ended 30 June 2020
Revenue from other
operations
Cost of revenue from other operations
Revenue from other operations
Cost of revenue from other operations
Disposal of materials 3,183,096.84 1,910,079.34 3,792,612.75 1,628,114.57 Others 137,687,416.35 84,829,924.90 96,545,734.29 62,258,138.35
140,870,513.19 86,740,004.24 100,338,347.04 63,886,252.92
(c) The Group's revenue for the six months ended 30 June 2021 is disaggregated as follows:
For the six months ended 30 June 2021
Express & logistics and supply chain
services Sales of goods Others Total Revenue from main
operations Including: At a point in time - 563,159,220.18 145,262,134.98 708,421,355.16
Over time 87,099,464,261.56 - 337,311,788.61 87,436,776,050.17 Lease income - - 57,861,905.26 57,861,905.26
87,099,464,261.56 563,159,220.18 540,435,828.85 88,203,059,310.59
Revenue from other
operations Including: At a point in time - - 27,000,813.77 27,000,813.77
Over time - - 40,722,829.27 40,722,829.27 Lease income - - 73,146,870.15 73,146,870.15
- - 140,870,513.19 140,870,513.19
As at 30 June 2021, the performance obligation of the Group that had been contracted but not yet performed or not fulfilled was part of the contracts with expected maturity within one year.

S.F. HOLDING CO., LTD. NOTES TO THE FINANCIAL STATEMENTS FOR THE SIX MONTHS ENDED 30 JUNE 2021 (All amounts in RMB Yuan unless otherwise stated) [English translation for reference only]
256
4 Notes to the consolidated financial statements (Cont’d)
(49) Taxes and surcharges For the six months ended 30 June Payment criteria
2021 2020 City maintenance and
construction tax 74,975,014.24 70,719,764.91 Refer to Note 3 Educational surcharge 56,453,056.26 51,122,638.61 Refer to Note 3 Stamp tax 51,766,674.89 33,782,373.62 Property tax 22,459,416.12 20,500,315.63 Land use tax 4,042,127.54 4,540,245.80 Flood-control project expenses 288,146.85 102,619.07 Others 664,464.28 1,083,730.16
210,648,900.18 181,851,687.80
(50) Selling and distribution expenses
For the six months ended 30 June
2021 2020 Employee benefits 462,049,331.65 400,354,453.54 Outsourcing expenses of information
technology service 438,407,058.41 277,321,643.40 Marketing expenses 97,897,901.36 93,535,249.52 IT and information platform expenses 87,196,421.66 100,204,009.91 Depreciation and amortisation expenses 84,732,867.55 89,629,461.92 Office and rental fees 30,367,129.66 50,945,774.92 Travelling and transportation expenses 15,462,551.69 9,382,883.02 Depreciation expenses of right-of-use assets 13,875,278.07 -- Supply and material expenses 12,909,315.03 11,194,918.81 Others 67,335,799.07 24,090,306.89
1,310,233,654.15 1,056,658,701.93
(51) General and administrative expenses
For the six months ended 30 June
2021 2020 Employee benefits 5,391,964,944.40 4,858,862,486.41 Depreciation and amortisation expenses 190,266,916.06 148,253,379.17 Office and rental fees 139,310,035.81 255,935,823.26 Professional service fees 160,150,002.39 115,324,486.22 Outsourcing expenses 151,553,189.38 118,052,450.55 Depreciation expenses of right-of-use assets 90,764,300.85 -- Entertainment expenses 86,066,720.41 68,271,706.15 Supply and material expenses 69,175,828.78 76,137,816.90 Brand royalties 65,372,508.50 55,109,364.65 IT and information platform expenses 59,603,746.02 52,851,185.87 Travelling and transportation expenses 58,429,812.92 42,838,862.22 Taxes 9,188,688.27 6,201,858.42 Others 57,199,595.34 63,603,742.91
6,529,046,289.13 5,861,443,162.73

S.F. HOLDING CO., LTD. NOTES TO THE FINANCIAL STATEMENTS FOR THE SIX MONTHS ENDED 30 JUNE 2021 (All amounts in RMB Yuan unless otherwise stated) [English translation for reference only]
257
4 Notes to the consolidated financial statements (Cont’d)
(52) Research and development expenses
For the six months ended 30 June
2021 2020 Employee benefits 551,445,200.18 425,321,626.35 Depreciation and amortisation expenses 236,356,466.83 148,462,487.06 IT and information platform expenses 103,392,458.56 29,352,477.08 Outsourcing expenses 70,198,778.34 47,050,197.27 Office and rental fees 9,038,353.66 22,823,668.49 Professional service fees 7,985,474.07 16,619,041.55 Supply and material expenses 6,878,661.93 34,290,640.40 Travelling and transportation expenses 6,212,443.72 2,769,613.47 Depreciation expenses of right-of-use assets 4,570,420.66 -- Others 11,138,445.73 6,649,876.74
1,007,216,703.68 733,339,628.41
(53) Financial costs
For the six months ended 30 June
2021 2020 Interest on borrowings 436,297,215.58 578,195,340.26 Add: Interest expenses on lease liabilities 236,897,641.83 -- Less: Capitalised interest (Note 4(17)) (6,593,009.54) (10,137,901.97)
Interest expenses 666,601,847.87 568,057,438.29 Less: Interest income (93,386,299.49) (78,055,138.82) Net losses/(gains) on exchange 18,965,643.62 (32,405,986.92) Commission expenses and others 29,721,030.77 15,371,157.37
621,902,222.77 472,967,469.92

S.F. HOLDING CO., LTD. NOTES TO THE FINANCIAL STATEMENTS FOR THE SIX MONTHS ENDED 30 JUNE 2021 (All amounts in RMB Yuan unless otherwise stated) [English translation for reference only]
258
4 Notes to the consolidated financial statements (Cont’d)
(54) Expenses by nature
The cost of revenue, selling and distribution expenses, general and administrative expenses and research and development expenses in the income statement are listed as follows by nature: For the six months ended 30 June
2021 2020 Outsourcing costs 51,806,901,786.42 36,000,601,551.98 Employee benefits 13,236,891,370.56 12,286,229,366.65 Transportation cost 9,568,946,290.55 6,127,474,359.27
Including: Aircraft maintenance costs 193,181,905.52 153,749,892.99
Depreciation and amortisation expenses 3,119,807,430.78 2,600,262,280.82 Office and rental fees 2,664,406,182.54 3,814,075,460.69 Supply and material expenses 2,513,313,727.93 2,183,349,831.19 Depreciation expenses of right-of-use assets 2,326,093,581.19 -- Claims expenses 710,495,607.10 511,571,470.00 Cost of revenue of goods 538,123,428.16 427,084,226.66 IT and information platform expenses 499,809,345.98 529,974,865.83 Professional service fees 172,112,387.51 132,959,967.33 Customs cost 166,224,906.15 190,902,692.93 Travelling and transportation expenses 126,311,026.83 98,215,008.51 Marketing expenses 97,897,901.36 93,535,249.52 Brand royalties 65,372,508.50 55,109,364.65 Taxes 10,155,528.23 7,446,679.90 Others 644,987,225.57 455,778,018.55
88,267,850,235.36 65,514,570,394.48
(i) For the six months ended 30 June 2021, the Group’s government grants which were offset against
cost and expenses amounted to RMB 228,710,426.59 (for the six months ended 30 June 2020: RMB 121,775,212.56) and were fully offset against the cost of revenue. Therein, the amount that was recognised in non-recurring profit or loss amounted to RMB 94,628,590.07 (for the six months ended 30 June 2020: RMB 121,775,212.56).
(ii) As stated in Note 2(28), lease payments of short-term leases and low-value leases are directly recognised in profit or loss by the Group. The amount for the six months ended 30 June 2021 was RMB 1,382,359,403.01.

S.F. HOLDING CO., LTD. NOTES TO THE FINANCIAL STATEMENTS FOR THE SIX MONTHS ENDED 30 JUNE 2021 (All amounts in RMB Yuan unless otherwise stated) [English translation for reference only]
259
4 Notes to the consolidated financial statements (Cont’d) (55) Other income
For the six months ended 30 June Related to
assets/income
2021 2020 Tax preference 500,764,555.57 363,926,959.65 Related to income Fiscal appropriation for
logistics 176,753,913.75 212,152,645.32 Related to income Grant from Social Security
Bureau 23,126,260.04 52,657,030.26 Related to income Amortisation of deferred
income (Note 4(39)) 15,916,394.72 16,973,417.75 Related to assets
716,561,124.08 645,710,052.98
For the six months ended 30 June 2021, the Group received other income amounting to RMB 716,561,124.08 (for the six months ended 30 June 2020: RMB 645,710,052.98). Among them, RMB 268,244,801.26 was recognised as non-recurring profit or loss (for the six months ended 30 June 2020: RMB 291,103,512.49).
(56) Investment income
For the six months ended 30 June
2021 2020
Investment income from disposal of subsidiaries(Note 5(2)) 942,964,204.15 -
Investment income from financial assets held for trading 159,182,930.38 213,247,428.71
Dividends of financial assets measured at fair value 22,455,487.52 1,110,356.12
Gains on disposal of other long-term equity investments 7,555,560.97 17,260,427.11
Investment income from wealth management products 1,185,903.34 10,247,466.29
Share of net gains or losses of investees under equity method (Note 4(12)) (8,751,248.27) (18,447,519.77)
Others 5,905,905.90 -
1,130,498,743.99 223,418,158.46
There is no significant restriction on recovery of investment income of the Group.

S.F. HOLDING CO., LTD. NOTES TO THE FINANCIAL STATEMENTS FOR THE SIX MONTHS ENDED 30 JUNE 2021 (All amounts in RMB Yuan unless otherwise stated) [English translation for reference only]
260
4 Notes to the consolidated financial statements (Cont’d)
(57) Gains arising from changes in fair value For the six months ended 30 June
2021 2020 Structural deposits 17,396,126.73 16,384,538.57 Others 12,193,119.55 29,414.59
29,589,246.28 16,413,953.16
(58) Credit impairment losses
For the six months ended 30 June
2021 2020 Losses on bad debts of accounts receivable 21,893,810.94 205,151,831.67 (Reversal)/losses on bad debts of other
receivables (6,057,226.39) 114,672,175.85 (Reversal)losses on impairment of loans and
advances (8,863,724.11) 89,186,630.95 Losses on impairment of factoring
receivables 135,595.95 49,601,393.26 Losses on impairment of long-term
receivables 4,067,704.65 929,070.18
11,176,161.04 459,541,101.91
(59) Asset impairment losses
For the six months ended 30 June
2021 2020 Inventory impairment losses 711,212.39 - Reversal on impairment of contract assets (119,192.56) - Losses on impairment of intangible assets - 23,599,356.05 Losses on impairment of long-term equity
investments - 3,869,728.47
592,019.83 27,469,084.52

S.F. HOLDING CO., LTD. NOTES TO THE FINANCIAL STATEMENTS FOR THE SIX MONTHS ENDED 30 JUNE 2021 (All amounts in RMB Yuan unless otherwise stated) [English translation for reference only]
261
4 Notes to the consolidated financial statements (Cont’d)
(60) Losses on disposal of assets
For the six months ended 30 June
2021
Amount recognised in non-recurring
profit or loss in 2021 2020
Amount recognised in non-recurring
profit or loss in 2020
Losses on disposal of
fixed assets 13,799,742.03 13,799,742.03 8,253,122.38 8,253,122.38 Losses on disposal of
right-of-use assets 387,972.88 387,972.88 - - Losses on disposal of
intangible assets - - 1,393,369.11 1,393,369.11
14,187,714.91 14,187,714.91 9,646,491.49 9,646,491.49
(61) Non-operating income and expenses (a) Non-operating income
For the six months ended 30 June
2021
Amount recognised in non-recurring
profit or loss in 2021 2020
Amount recognised in non-recurring
profit or loss in 2020
Government grants (i) 20,470,670.39 20,470,670.39 13,929,041.59 13,929,041.59 Compensation income 12,863,204.98 12,863,204.98 9,155,484.11 9,155,484.11 Others 91,689,197.22 91,689,197.22 66,649,259.92 66,649,259.92
125,023,072.59 125,023,072.59 89,733,785.62 89,733,785.62
(i) Details of government grants
For the six months ended 30 June 2021
Related to assets /income
For the six months ended 30 June 2020
Related to assets /income
General fiscal
appropriation 19,632,384.22 Related to income 13,301,583.00 Related to income Others 838,286.17 Related to income 627,458.59 Related to income
20,470,670.39 13,929,041.59

S.F. HOLDING CO., LTD. NOTES TO THE FINANCIAL STATEMENTS FOR THE SIX MONTHS ENDED 30 JUNE 2021 (All amounts in RMB Yuan unless otherwise stated) [English translation for reference only]
262
4 Notes to the consolidated financial statements (Cont’d) (61) Non-operating income and expenses (Cont’d)
(b) Non-operating expenses
For the six months ended 30 June
2021
Amount recognised in non-recurring
profit or loss in 2021 2020
Amount recognised in non-recurring
profit or loss in 2020
Losses on scrapping of
long-term assets 77,046,391.04 77,046,391.04 39,789,802.73 39,789,802.73 Compensation
expenses 25,542,208.33 25,542,208.33 19,230,955.69 19,230,955.69 Penalties and overdue
fines 11,899,596.80 11,899,596.80 6,876,977.69 6,876,977.69 Donation expenses 4,065,870.08 4,065,870.08 21,610,987.55 21,610,987.55 Others 7,541,659.53 7,541,659.53 11,964,928.43 11,964,928.43
126,095,725.78 126,095,725.78 99,473,652.09 99,473,652.09
(62) Income tax expenses
For the six months ended 30 June
2021 2020 Current income tax 926,731,792.97 1,466,179,044.85 Deferred income tax (249,373,089.77) 248,819,602.15
677,358,703.20 1,714,998,647.00

S.F. HOLDING CO., LTD. NOTES TO THE FINANCIAL STATEMENTS FOR THE SIX MONTHS ENDED 30 JUNE 2021 (All amounts in RMB Yuan unless otherwise stated) [English translation for reference only]
263
4 Notes to the consolidated financial statements (Cont’d) (62) Income tax expenses (Cont'd)
The reconciliation from income tax calculated based on the applicable tax rates and total profit presented in the income statement to the income tax expenses is listed below:
For the six months ended 30 June
2021 2020 Total profit 1,093,149,030.85 5,338,763,806.22
Income tax expenses calculated at the
standard tax rate of 25% 273,287,257.71 1,334,690,951.56 Income not subject to tax (211,487,223.75) (6,209,467.41) Costs, expenses and losses not deductible
for tax purposes 30,225,495.33 38,667,142.36 Effect of last-year tax filing differences (869,368.57) 13,660,450.66 Effect of different tax rates among
subsidiaries and branches on income tax expenses (74,396,824.52) (93,873,206.20)
Effect of tax preference (973,354.30) (5,000,000.00) Deductible tax losses and deductible
temporary differences for which no deferred tax asset was recognised in the current period 671,511,207.45 413,291,203.23
Reversal of deductible tax losses for which deferred tax assets were recognised in prior periods 67,338.68 68,065,341.58
Utilisation of deductible tax losses and deductible temporary differences for which no deferred tax asset was recognised in prior periods (9,813,603.47) (46,570,727.68)
Recognition of deductible tax losses and deductible temporary differences for which no deferred tax asset was recognised in prior periods (192,221.36) (1,723,041.10)
Income tax expenses 677,358,703.20 1,714,998,647.00

S.F. HOLDING CO., LTD. NOTES TO THE FINANCIAL STATEMENTS FOR THE SIX MONTHS ENDED 30 JUNE 2021 (All amounts in RMB Yuan unless otherwise stated) [English translation for reference only]
264
4 Notes to the consolidated financial statements (Cont’d) (63) Earnings per share (a) Basic earnings per share
Basic earnings per share are calculated by dividing consolidated net profit attributable to ordinary shareholders of the parent company by the weighted average number of outstanding ordinary shares of the parent company: For the six months ended 30 June
2021 2020 Consolidated net profit attributable to ordinary
shareholders of the parent company 759,921,074.24 3,761,593,296.43 Weighted average number of outstanding
ordinary shares of the Company 4,545,429,726.00 4,401,118,670.17
Basic earnings per share 0.17 0.85
Including:
- Basic earnings per share from continuing operations 0.17 0.85

S.F. HOLDING CO., LTD. NOTES TO THE FINANCIAL STATEMENTS FOR THE SIX MONTHS ENDED 30 JUNE 2021 (All amounts in RMB Yuan unless otherwise stated) [English translation for reference only]
265
4 Notes to the consolidated financial statements (Cont’d) (63) Earnings per share (Cont’d) (b) Diluted earnings per share
Diluted earnings per share are calculated by dividing consolidated net profit attributable to ordinary shareholders of the parent company adjusted based on the dilutive potential ordinary shares by the adjusted weighted average number of outstanding ordinary shares of the Company. For the six months ended 30 June 2021, the Company had no dilutive potential ordinary shares (for the six months ended 30 June 2020: the Company had dilutive potential ordinary shares): For the six months ended 30 June
2021 2020 Consolidated net profit attributable to ordinary
shareholders of the parent company 759,921,074.24 3,761,593,296.43 Add: Interest expenses from convertible
corporate debentures of the company (net of tax) - 98,688,033.29
Less: Effect of convertible corporate debentures issued by subsidiaries on net profit attributable to the parent company - (3,995,114.22)
Adjusted consolidated net profit attributable to ordinary shareholders of the parent company for calculation of earnings per share 759,921,074.24 3,856,286,215.50
Weighted average number of outstanding ordinary shares of the Company 4,545,429,726.00 4,401,118,670.17
Add: Weighted average number of ordinary shares which convertible corporate debentures assumed to be fully converted into ordinary shares - 143,843,934.67
Weighted average number of outstanding diluted ordinary shares 4,545,429,726.00 4,544,962,604.84
Diluted earnings per share 0.17 0.85

S.F. HOLDING CO., LTD. NOTES TO THE FINANCIAL STATEMENTS FOR THE SIX MONTHS ENDED 30 JUNE 2021 (All amounts in RMB Yuan unless otherwise stated) [English translation for reference only]
266
4 Notes to the consolidated financial statements (Cont’d) (64) Other comprehensive income
Other comprehensive income, the related income tax effect and the reclassifications to profit or loss for the six months ended 30 June 2021 and 2020: Other comprehensive income in the balance sheet Other comprehensive income in the income statement for the six months ended 30 June 2021
31 December 2020
Attributable to the parent company in the current period - net of
tax
Other comprehensive
income transferred into retained earnings 30 June 2021
Amount incurred before income tax for the
current period Less: Income tax
(expenses) /credits
Attributable to the parent company - net of
tax Attributable to minority
shareholders - net of tax Other comprehensive income
items which will not be reclassified subsequently to profit or loss
Changes in fair value of
investments in other equity instruments 1,213,254,523.81 (76,803,722.97)
(113,136,152.81) 1,023,314,648.03 (81,332,522.97) 4,528,800.00 (76,803,722.97) - Other comprehensive
income items which will not be transferred to profit or loss under the equity method (1,186,906.18) (88,282.28)
- (1,275,188.46) (88,282.28) - (88,282.28) - Other comprehensive income
items which will be reclassified subsequently to profit or loss
Cash flow hedging
reserve (22,857,620.11) (5,527,991.60)
- (28,385,611.71) (5,527,991.60) - (5,527,991.60) - Exchange differences on
translation of foreign currency financial statements (45,240,906.00) (83,895,126.41)
- (129,136,032.41) (84,697,852.81) - (83,895,126.41) (802,726.40)
1,143,969,091.52 (166,315,123.26) (113,136,152.81) 864,517,815.45 (171,646,649.66) 4,528,800.00 (166,315,123.26) (802,726.40)

S.F. HOLDING CO., LTD. NOTES TO THE FINANCIAL STATEMENTS FOR THE SIX MONTHS ENDED 30 JUNE 2021 (All amounts in RMB Yuan unless otherwise stated) [English translation for reference only]
267
4 Notes to the consolidated financial statements (Cont’d) (64) Other comprehensive income (Cont'd)
Other comprehensive income in the balance sheet Other comprehensive income in the income statement for the six months ended 30 June 2020
31 December 2019
Attributable to the parent company in the current period - net of
tax 30 June 2020
Amount incurred before income tax for the
current period Less: Income tax
(expenses) /credits
Attributable to the parent company - net of
tax Attributable to minority
shareholders - net of tax Other comprehensive income items which will not be
reclassified subsequently to profit or loss Changes in fair value of investments in other equity
instruments 721,903,970.41 40,865,087.90 762,769,058.31 38,610,400.40 2,254,687.50 40,865,087.90 - Other comprehensive income items which will not be
transferred to profit or loss under the equity method (2,059,919.82) 873,013.64 (1,186,906.18) 873,013.64 - 873,013.64 - Other comprehensive income items which will be
reclassified subsequently to profit or loss Exchange differences on translation of foreign
currency financial statements 282,871,556.79 104,744,398.17 387,615,954.96 104,615,596.10 - 104,744,398.17 (128,802.07)
1,002,715,607.38 146,482,499.71 1,149,198,107.09 144,099,010.14 2,254,687.50 146,482,499.71 (128,802.07)

S.F. HOLDING CO., LTD. NOTES TO THE FINANCIAL STATEMENTS FOR THE SIX MONTHS ENDED 30 JUNE 2021 (All amounts in RMB Yuan unless otherwise stated) [English translation for reference only]
268
4 Notes to the consolidated financial statements (Cont’d) (65) Notes to the cash flow statement (a) Cash received relating to other operating activities
For the six months ended 30 June
2021 2020 Inflows from cash on delivery service 40,790,509,753.56 34,825,543,143.63 Recovered of receivables from disposed
subsidiaries related to SF REIT 2,272,140,801.41 - Government grants 667,914,957.45 389,538,947.63 Interest income 108,138,443.16 85,061,683.52 Others 1,148,001,942.78 820,792,110.16
44,986,705,898.36 36,120,935,884.94
(b) Cash paid relating to other operating activities
For the six months ended 30 June
2021 2020 Outflows from cash on delivery service 41,106,595,372.77 34,807,712,241.80 Office and rental fees 2,824,668,066.33 4,033,369,059.71 Claims expenses 710,495,607.10 511,571,470.00 IT and information platform expenses 529,797,906.74 561,773,357.78 Professional service fees 183,097,027.52 139,203,648.33 Travelling and transportation expenses 133,889,688.44 104,107,909.02 Marketing expenses 103,771,775.44 99,147,364.49 Customs cost 168,745,027.21 198,763,824.92 Entertainment expenses 93,900,298.13 73,637,732.75 Bank charges 29,721,030.76 15,371,157.37 Compensation and penalty 37,441,805.13 26,107,933.38 Donation expenses 4,065,870.08 21,610,987.55 Others 982,151,534.20 894,418,352.01
46,908,341,009.85 41,486,795,039.11
(c) Net cash received from disposal of subsidiaries and other business units
For the six months ended 30 June
2021 2020 Consideration 2,987,199,525.23 - Less: Cash and cash equivalents that will
receive in future periods (40,213,874.56) - Less: Cash and cash equivalents held by the
subsidiaries at the date of disposal (390,382,431.47) - Add: Cash and cash equivalents received in
the current period from the disposal of subsidiaries in previous periods 10,000,000.00 30,000,000.00
2,566,603,219.20 30,000,000.00
Less: SF REIT shares acquired (i) (1,152,527,376.00) - Net cash received from dispopal of
subsidiaries 1,414,075,843.20 30,000,000.00

S.F. HOLDING CO., LTD. NOTES TO THE FINANCIAL STATEMENTS FOR THE SIX MONTHS ENDED 30 JUNE 2021 (All amounts in RMB Yuan unless otherwise stated) [English translation for reference only]
269
4 Notes to the consolidated financial statements (Cont’d) (65) Notes to the cash flow statement (Cont’d)
(c) Net cash received from disposal of subsidiaries and other business units (Cont’d)
(i) As stated in Note 5(2), the Group transferred its subsidiary which owns three underlying assets to SF
REIT. At the same time, the Group purchased 35% of the fund shares of SF REIT. The fund shares
amounted to HKD 1,394,400,000.00, equivalent to RMB 1,152,527,376.00.
(d) Net cash paid to acquire subsidiaries
For the six months ended 30 June
2021 2020 Cash and cash equivalents paid in the current
period for acquisition of subsidiaries incurred in the current period 236,554,680.97 -
Less: Cash and cash equivalents held by subsidiaries at the acquisition date (37,012,969.90) -
199,541,711.07 -
(e) Cash received relating to other investing activities
For the six months ended 30 June
2021 2020 Redemption of bank wealth management
products and structural deposits 46,455,050,489.87 52,830,000,000.00
(f) Cash paid relating to other investing activities
For the six months ended 30 June
2021 2020 Purchase of bank wealth management
products and structural deposits 50,185,229,111.50 66,895,117,931.29 Net cash paid for disposal of subsidiaries - 36,217,441.31
50,185,229,111.50 66,931,335,372.60

S.F. HOLDING CO., LTD. NOTES TO THE FINANCIAL STATEMENTS FOR THE SIX MONTHS ENDED 30 JUNE 2021 (All amounts in RMB Yuan unless otherwise stated) [English translation for reference only]
270
4 Notes to the consolidated financial statements (Cont’d) (65) Notes to the cash flow statement (Cont’d) (g) Cash payments relating to other financing activities
For the six months ended 30 June
2021 2020 Payment of lease liabilities (i) 2,479,709,656.48 -- Repurchase of shares - 58,663,220.22 Payment of financing expenses 22,499,999.16 16,994,486.97 Acquisition of minority interests 50,038,474.35 7,308,000.00 Others 598,273.18 379,410.22
2,552,846,403.17 83,345,117.41
(i) For the six months ended 30 June 2021, the total cash outflows relating to leases paid by the Group
amounted to RMB 3,945,408,136.51 . The amount paid for payment of lease liabilities stated above was included in financing activities, while the remaining cash outflows were recognised in operating activities.
(66) Supplementary information to the cash flow statement (a) Reconciliation from net profit to cash flows from operating activities
For the six months ended 30 June
2021 2020 Net profit 415,790,327.65 3,623,765,159.22 Add: Asset impairment losses 592,019.83 27,469,084.52
Credit impairment losses 11,176,161.04 459,541,101.91 Depreciation of right-of-use assets 2,326,093,581.19 -- Depreciation of fixed assets 2,123,877,059.83 1,730,365,263.08 Depreciation of investment properties 20,264,188.49 27,251,110.81 Amortisation of intangible assets 591,904,873.82 457,822,929.32 Amortisation of long-term prepaid
expenses 396,003,946.21 393,322,855.05 Losses on disposal of long-term assets 91,234,105.95 49,436,294.22 Gains arising from changes in fair value (29,589,246.28) (16,413,953.16) Financial costs 677,749,407.46 524,673,273.00 Investment income (1,130,498,743.99) (223,418,158.46) Recognised expenses on equity-settled
share-based payments 122,360,610.58 54,253,366.54 Decrease/(Increase) in deferred tax
assets (269,254,291.71) 54,902,793.10 Increase in deferred tax liabilities 19,881,201.94 193,916,809.05 Amortisation of deferred income (15,916,394.72) (16,973,417.75) Decrease in inventories 4,629,232.88 47,227,069.11 Increase in operating receivables (2,659,996,146.31) (2,163,201,334.61) Increase in operating payables 1,635,330,949.30 1,707,772,075.15
Net cash flows from operating activities 4,331,632,843.16 6,931,712,320.10

S.F. HOLDING CO., LTD. NOTES TO THE FINANCIAL STATEMENTS FOR THE SIX MONTHS ENDED 30 JUNE 2021 (All amounts in RMB Yuan unless otherwise stated) [English translation for reference only]
271
4 Notes to the consolidated financial statements (Cont’d) (66) Supplementary information to the cash flow statement (Cont'd) (b) Net increase/(decrease) in cash and cash equivalents
For the six months ended 30 June
2021 2020 Cash and cash equivalents at the end of the
period 16,243,660,679.07 9,390,724,718.39 Less: Cash and cash equivalents at the
beginning of the period (15,466,483,805.74) (17,764,448,498.26)
Net increase in cash and cash equivalents 777,176,873.33 (8,373,723,779.87)
(c) Cash and cash equivalents
30 June 2021 31 December 2020 Cash on hand 297,786.76 78,882.36 Cash at bank that can be readily drawn on
demand 16,154,929,677.19 15,262,345,098.88 Other cash balances that can be readily
drawn on demand 46,394,025.32 126,993,032.50 Other balances that can be readily drawn on
demand 42,039,189.80 77,066,792.00
16,243,660,679.07 15,466,483,805.74
(67) Monetary items denominated in foreign currency
As at 30 June 2021 and 31 December 2020, the Group’s companies whose recording currency is RMB held financial assets and liabilities denominated in non-recording currency (mainly USD, HKD and EUR), excluding financial assets and liabilities denominated in non-recording currency held by related parties within the Group, of which the equivalent amounts in RMB (presentation currency of these financial statements) are listed as below: 30 June 2021
Amount in the
original currency Exchange rate to
RMB Equivalent
to RMB Cash at bank and on hand - USD 15,006,818.24 6.4601 96,945,546.51 HKD 9,581,093.64 0.8321 7,972,236.40 EUR 99,829.77 7.6862 767,311.58 Receivables - USD 73,876,806.63 6.4601 477,251,558.51 HKD 810,546.20 0.8321 674,439.28 EUR 120,493.01 7.6862 926,133.37 Payables - USD 20,231,148.98 6.4601 130,695,245.52 HKD 9,408,284.68 0.8321 7,828,445.51 EUR 899,441.52 7.6862 6,913,287.41 SGD 770,909.91 4.8027 3,702,449.02

S.F. HOLDING CO., LTD. NOTES TO THE FINANCIAL STATEMENTS FOR THE SIX MONTHS ENDED 30 JUNE 2021 (All amounts in RMB Yuan unless otherwise stated) [English translation for reference only]
272
4 Notes to the consolidated financial statements (Cont’d)
(67) Monetary items dominated in foreign currency (Cont’d) 31 December 2020
Amount in the
original currency Exchange rate to
RMB Equivalent
to RMB Cash at bank and on hand - USD 10,721,146.84 6.5249 69,954,411.02 HKD 11,806,587.62 0.8416 9,936,424.14 EUR 99,878.10 8.0250 801,521.75 Receivables - USD 10,074,431.73 6.5249 65,734,659.60 HKD 191,100.03 0.8416 160,829.79 EUR 115,688.92 8.0250 928,403.58 Payables - USD 9,251,234.57 6.5249 60,363,380.45 HKD 2,245,888.08 0.8416 1,890,139.41 EUR 424,100.74 8.0250 3,403,408.44
As at 30 June 2021 and 31 December 2020, the Group’s overseas subsidiaries, except for those operating in Hong Kong, held no significant financial assets and liabilities denominated in non-recording currency. Those companies operating in Hong Kong with HKD as recording currency held financial assets and liabilities denominated in non-recording currency (mainly USD, RMB and EUR), excluding financial assets and liabilities denominated in non-recording currency held by subsidiaries within the Group, of which the equivalent amounts in HKD (recording currency of companies operating in Hong Kong) and RMB (presentation currency of these financial statements) are listed as below: 30 June 2021
Amount in the
original currency Exchange rate
to HKD Equivalent to
HKD Equivalent to
RMB Cash at bank and on
hand - RMB 54,822,393.51 1.2018 65,885,552.52 54,822,393.51 USD 34,718,699.22 7.7638 269,549,037.00 224,287,765.85 EUR 1,154,045.38 9.2373 10,660,263.39 8,870,247.45 Accounts receivable - RMB 92,134,276.27 1.2018 110,726,973.23 92,134,276.27 USD 18,818,575.26 7.7638 146,103,654.60 121,570,689.47 Accounts payable - RMB 1,304,351.70 1.2018 1,567,569.87 1,304,351.70 USD 3,465,584.09 7.7638 26,906,101.76 22,388,169.21 EUR 4,015,251.40 9.2373 37,090,081.76 30,862,108.30

S.F. HOLDING CO., LTD. NOTES TO THE FINANCIAL STATEMENTS FOR THE SIX MONTHS ENDED 30 JUNE 2021 (All amounts in RMB Yuan unless otherwise stated) [English translation for reference only]
273
4 Notes to the consolidated financial statements (Cont’d) (67) Monetary items dominated in foreign currency (Cont’d)
31 December 2020
Amount in the
original currency Exchange rate
to HKD Equivalent to
HKD Equivalent to
RMB Cash at bank and on
hand - RMB 16,364,222.86 1.1882 19,443,969.60 16,364,222.86 USD 25,396,509.42 7.7526 196,888,978.93 165,703,567.54 EUR 343,595.25 9.5350 3,276,180.71 2,757,263.68 Receivables - RMB 1,799,469.88 1.1882 2,138,130.11 1,799,469.88 USD 6,779,714.69 7.7526 52,560,416.11 44,235,327.48 Payables - RMB 1,976,784.46 1.1882 2,348,815.30 1,976,784.46 USD 4,829,945.98 7.7526 37,444,639.20 31,513,751.22 EUR 3,994,210.37 9.5350 38,084,795.88 32,052,512.95

S.F. HOLDING CO., LTD. NOTES TO THE FINANCIAL STATEMENTS FOR THE SIX MONTHS ENDED 30 JUNE 2021 (All amounts in RMB Yuan unless otherwise stated) [English translation for reference only]
274
5 Changes in the consolidation scope (1) Business combinations involving enterprises not under common control (a) Business combinations involving enterprises not under common control during the six months ended 30 June 2021
AAcquiree Timing of
acquisition Acquisition cost
Proportion of equity acquired
Method of acquisition
Acquisition date
Basis for determining
the acquisition
date
Revenue of the acquiree from
the acquisition date to the end
of the period
Net profit of the acquiree from
the acquisition date to the end
of the period
Cash flows from operating
activities of the acquiree from
the acquisition date to the end
of the period
Net cash flows of the acquiree
from the acquisition date to the end of the
period
Jiangsu Senyuan Household Appliance Technology Co., Ltd.
3 February 2021 202,000,000.00 100.00%
Acquired by cash
3 February 2021
Equity delivery
completed -
(580,385.38)
(534,630.87)
930,668.58
Bon Way Logistics (H.K.) Company Limited 30 April 2021 16,872,891.00 100.00%
Acquired by cash
30 April 2021
Equity delivery
completed 3,599,429.81
224,778.52
6,844,822.84
8,873,002.12
218,872,891.00 3,599,429.81 (355,606.86) 6,310,191.97 9,803,670.70

S.F. HOLDING CO., LTD. NOTES TO THE FINANCIAL STATEMENTS FOR THE SIX MONTHS ENDED 30 JUNE 2021 (All amounts in RMB Yuan unless otherwise stated) [English translation for reference only]
275
5 Changes in the consolidation scope (Cont'd) (2) Disposal of subsidiaries
Aggregated information of subsidiaries disposed for the six months ended 30 June 2021:
Name of subsidiary Proceeds from
disposal Disposal
proportion Method of
disposal Timing of losing
control
Basis for judgement of
timing of losing control
Difference between proceeds from disposal after deducting disposal
costs and corresponding shares of net assets in the
consolidated financial statements
Amount transferred from other comprehensive income etc. related to
initial equity investment to investment income or loss
Zhengzhou Fengtai E-commerce Industrial Park
Management Co., Ltd. 170,824,003.04 100.00% Sales of
equity 31 March 2021 Transfer of
control right 17,450,301.50 - Beijing Huabao Lutong Automobile Investment
Co., Ltd. 392,097,354.12 100.00% Sales of
equity 28 February 2021 Transfer of
control right 30,002,375.96 -
Company related to SF REIT (i) 2,424,278,168.07 100.00% Sales of
equity 13 May 2021 Transfer of
control right 890,114,535.24 5,396,991.45
2,987,199,525.23 937,567,212.70 5,396,991.45

S.F. HOLDING CO., LTD. NOTES TO THE FINANCIAL STATEMENTS FOR THE SIX MONTHS ENDED 30 JUNE 2021 (All amounts in RMB Yuan unless otherwise stated) [English translation for reference only]
276
5 Changes in the consolidation scope (Cont'd)
(2) Disposal of subsidiaries(Cont'd)
(i) SF Real Estate Investment Trust (“SF REIT”) The REIT manager(Note 4 (12)(b)) entered into a trust deed with DB Trustees (Hong Kong) Limited and used Foshan Guicheng Fengtai Industrial Park, Wuhu Fengtai Industrial Park and Asia Logistics Centre located in Tsing Yi, Hong Kong(SF Building)(collectively "three property assets") held by the Group as underlying assets to establish the SF REIT. The Group purchased 35% of the fund shares of the SF REIT, and SF REIT became an associate of the Group (Note 4(12)(b)). On May 13, 2021, the Group transferred the three property assets, which were respectively held by three subsidiary wholly owned by the Group (Foshan Runzhong Industrial Investment Co., Ltd., Wuhu Fengtai E-commerce Industrial Park Management Co., Ltd., and Goodear Development Limited) to a subsidiary of SF REIT. As a result, the Group lost control over the underlying asset company. Therefore, these companies were no longer included in the consolidation scope.The price of the equity transfer transaction was approximately HKD 2,908 million (equivalent to approximately RMB 2,424 million) and the Group recognised investment income of approximately HKD 1,083 million (equivalent to approximately RMB 896 million). SF REIT has been listed on the Hong Kong Stock Exchange from May 17, 2021.
(3) Other changes in the consolidation scope (a) For the six months ended 30 June 2021, the Group set up the following subsidiaries by cash:
Chongqing Xuefeng Zhiyuan Supply Chain Management Co., Ltd. Chongqing Jieyutai Enterprise Management Co., Ltd. Chongqing Fengyutai Enterprise Management Co., Ltd. Chongqing Fonair Aviation Engineering Technology Co., Ltd. Exel Logistics (Tianjin) Co., Ltd. Exel Aolong Logistics (Zhanjiang) Co., Ltd. Yirongcheng Information Service (Wuhan) Co., Ltd. New Havi (Hubei) Supply Chain Management Co., Ltd. Xinjiang E-Plus Technology Co., Ltd. Xi'an Fengle Apartment Management Co., Ltd. Wuhan Fengyu Apartment Management Co., Ltd. Tianjin E-Plus Technology Co., Ltd. Tianjin Shunxin Freight Co., Ltd. Tianjin Bingzhi Supply Chain Management Co., Ltd. Taizhou Jietai Enterprise Management Co., Ltd. Sichuan E-Plus Technology Co., Ltd. Sichuan Jieyutai Enterprise Management Co., Ltd. S.F. (Chengdu) International Logistics Co., Ltd. Shijiazhuang E-Plus Technology Co., Ltd. Shenyang E-Plus Technology Co., Ltd. Shenzhen Fengwang Holdings Co., Ltd. Shenzhen Chenfeng Industrial Investment Development Co., Ltd. Shenzhen Fengzan Technology Co., Ltd. Shanghai Zhihui Fenghe Trading Co., Ltd. Shanghai E-Plus Technology Co., Ltd. Shanghai Xijie Supply Chain Technology Co., Ltd. Shanghai Shunzijia Technology Co., Ltd. Shanghai S.F. E-commerce Co., Ltd.

S.F. HOLDING CO., LTD. NOTES TO THE FINANCIAL STATEMENTS FOR THE SIX MONTHS ENDED 30 JUNE 2021 (All amounts in RMB Yuan unless otherwise stated) [English translation for reference only]
277
5 Changes in the consolidation scope (Cont'd)
(3) Other changes in the consolidation scope (Cont’d) (a) For the six months ended 30 June 2021, the Group set up the following subsidiaries by cash
(Cont’d): Shanghai Gejie Supply Chain Technology Co., Ltd. Shanghai Fengji Technology Co., Ltd. Shanxi E-Plus Technology Co., Ltd. Shandong E-Plus Technology Co., Ltd. Ningxia E-Plus Technology Co., Ltd. Nanning E-Plus Information Technology Co., Ltd. Chongqing E-Plus Technology Co,.Ltd. Nanchang Jietai Industrial Park Management Co., Ltd. Luohe Fengtai Industrial Park Management Co., Ltd. Jinhua Jietai Enterprise Management Co., Ltd. Jiangxi E-Plus Technology Co., Ltd. Jiangsu S.F. Information Service Technology Co., Ltd. Jilin E-Plus Technology Co., Ltd. Huai'an Fengyutai Enterprise Management Co., Ltd. Huai'an Fengtai E-Commerce Industrial Park Co., Ltd. Heilongjiang E-Plus Technology Co., Ltd. Hebi Fengtai Industrial Park Asset Management Co., Ltd. Henan E-Plus Information Technology Co., Ltd. Hefei E-Plus Technology Co., Ltd. Hefei Jiafeng Industrial Park Management Co., Ltd. Hefei Fengyutai Enterprise Management Co., Ltd. Hainan E-Plus Technology Co., Ltd. Hainan S.F. International Supply Chain Management Co., Ltd. Guizhou E-Plus Technology Co., Ltd. Guangzhou Fengyi Supply Chain Management Co., Ltd. Guangzhou Fengle Apartment Management Co., Ltd. Guangzhou Fengda Express Co., Ltd. Gansu Yishoufa Information Technology Co., Ltd. SF Supply Chain (Hainan) Co., Ltd. Dongguan S.F. Information Technology Service Co., Ltd. Dongguan Chengfeng Technology Co., Ltd. Chengdu Shengyutai Enterprise Management Co., Ltd. Changzhou Fengyutai Enterprise Management Co., Ltd. Beijing Yishoufa Technology Co., Ltd. Beijing Tongchen Human Resource Service Co., Ltd. Beijing Fengzan Technology Co., Ltd. Bengbu S.F. Logistics Co., Ltd. Zhentai Industrial Park Limited

S.F. HOLDING CO., LTD. NOTES TO THE FINANCIAL STATEMENTS FOR THE SIX MONTHS ENDED 30 JUNE 2021 (All amounts in RMB Yuan unless otherwise stated) [English translation for reference only]
278
5 Changes in the consolidation scope (Cont'd) (3) Other changes in the consolidation scope (Cont’d) (a) For the six months ended 30 June 2021, the Group set up the following subsidiaries by cash
(Cont’d): Zhentai Industrial Park (Hong Kong) Limited YouTai Investment Limited YiJie Investment Limited Yifeng Industrial Park Limited Yifeng Industrial Park (Hong Kong) Limited Taichen Industrial Park Limited Taichen Industrial Park (Hong Kong) Limited ShunJie Investment Limited Shunda Industrial Park Limited Shunda Industrial Park (Hong Kong) Limited SF International Express (Malaysia) SDN. BHD SF Logistics Brasil LTDA. SF Holding Investment 2021 Limited SF Express Spain Global,S.L. SF Express International Bangladesh Ltd. SF Express (Mauritius) SF Express (Italy) S.R.L. SF Express (Hungary) Kft. Ruilifeng Industrial Park Limited Ruilifeng Industrial Park (Hong Kong) Limited Ruifeng Industrial Park Limited Ruifeng Industrial Park (Hong Kong) Limited Jietai Industrial Park Limited Jietai Industrial Park (Hong Kong) Limited Jiafeng Industrial Park Limited Jiafeng Industrial Park (Hong Kong) Limited Hongtong Industrial Park Limited Hongtong Industrial Park (Hong Kong) Limited Hongtai Industrial Park Limited Hongtai Industrial Park (Hong Kong) Limited Hengfeng Industrial Park Limited Hengfeng Industrial Park (Hong Kong) Limited

S.F. HOLDING CO., LTD. NOTES TO THE FINANCIAL STATEMENTS FOR THE SIX MONTHS ENDED 30 JUNE 2021 (All amounts in RMB Yuan unless otherwise stated) [English translation for reference only]
279
5 Changes in the consolidation scope (Cont'd) (3) Other changes in the consolidation scope (Cont’d) (a) For the six months ended 30 June 2021, the Group set up the following subsidiaries by cash
(Cont’d): Hefeng Industrial Park Limited Hefeng Industrial Park (Hong Kong) Limited Fengyutai Industrial Park Limited Fengyutai Industrial Park (Hong Kong) Limited Fengruntai Industrial Park Limited Fengruntai Industrial Park (Hong Kong) Limited Fengruikai Industrial Park Limited Chengtai Industrial Park Limited Chengtai Industrial Park (Hong Kong) Limited
(b) For the six months ended 30 June 2021, the Group cancelled the following subsidiaries: Zonghao Supply Chain Consulting (Shenzhen) Co., Ltd. Exel Supply Chain Management (Shanghai) Co., Ltd. S.F. Intra-city Holding Co., Ltd. Shenzhen Fengkong Technology Co., Ltd. Dunhuang Fengzhao Technology Co., Ltd. Dingxi Fengnong Technology Co., Ltd.
(c) For the six months ended 30 June 2021, subsidiaries acquired by the Group are as follows:
Flourish Harmony Holdings Company Limited Advance Harmony Holdings Company Limited Ultra Wise Investment Limited Sunny Sight Limited Fortune Up Development Limited In addition, the company's indirect subsidiary SF Digital Technology (Shenzhen) Services Co., Ltd. acquired 100% of the equity of Weishi Internet Insurance Agency Co., Ltd. in April 2021. Since Weishi Internet Insurance Agency Co., Ltd. does not constitute a business, the transaction does not form a business combination.

S.F. HOLDING CO., LTD. NOTES TO THE FINANCIAL STATEMENTS FOR THE SIX MONTHS ENDED 30 JUNE 2021 (All amounts in RMB Yuan unless otherwise stated) [English translation for reference only]
280
6 Interests in other entities (1) Interests in subsidiaries (a) First-tier and second-tier subsidiaries of the Group are listed as follows:
Shareholding (%) Place of
registration Major business
location Registered capital Nature of business Direct Indirect Method of acquisition
Taisen Holdings Shenzhen Shenzhen RMB 2,010 million Investment holding 100.00% - Reverse acquisitions S.F. Express Co., Ltd. Shenzhen Shenzhen RMB 150 million International freight forwarding,
inbound and outbound express deliver, etc.
- 100.00% Business combination involving enterprises
under common control SF Technology Shenzhen Shenzhen RMB 60 million Technical maintenance and
development service - 100.00% By new establishment
Shenzhen Shunlu Logistics Co., Ltd. Shenzhen Shenzhen RMB 160 million Cargo transportation and freight forwarding
- 100.00% Business combination involving enterprises
under common control Anhui S.F. Telecommunication Service Co., Ltd. Anhui Anhui RMB 50 million Value-added telecommunication
service - 100.00% By new establishment
Shenzhen Yuhui Management Consulting Co., Ltd. Shenzhen Shenzhen RMB 250 million Consulting service - 100.00% Business combination involving enterprises
under common control Shenzhen S.F. Supply Chain Co., Ltd. Shenzhen Shenzhen RMB 1,500 million Supply chain management and
other services - 100.00% By new establishment
SF Airlines Shenzhen Shenzhen RMB 1,510 million Transport service of aviation cargo - 100.00% Business combination involving enterprises
under common control Shenzhen Fengtai E-commerce Industrial Park
Management Co., Ltd. Shenzhen Shenzhen RMB 5,860 million E-Commerce industrial park asset
management - 100.00% Business combination
involving enterprises under common control
Shenzhen Fengtai E-Commerce Industrial Park Investment Ltd.
Shenzhen Shenzhen RMB 58 million Management consulting - 100.00% By new establishment
Shenzhen S. F. Airport Investment Co., Ltd. Shenzhen Shenzhen RMB 100 million Industrial investment - 100.00% By new establishment SF Holding Limited Hong Kong Hong Kong HKD 2,260.01
million Investment holding - 100.00% Business combination
involving enterprises under common control
Group Finance Company Shenzhen Shenzhen RMB 1,000 million Financing, wealth management and consulting services
- 100.00% By new establishment

S.F. HOLDING CO., LTD. NOTES TO THE FINANCIAL STATEMENTS FOR THE SIX MONTHS ENDED 30 JUNE 2021 (All amounts in RMB Yuan unless otherwise stated) [English translation for reference only]
281
6 Interests in other entities (Cont’d) (1) Interests in subsidiaries (Cont'd) (a) First-tier and second-tier subsidiaries of the Group are listed as follows (Cont'd):
Shareholding (%) Place of
registration Major business
location Registered capital Nature of business Direct Indirect Method of acquisition
Shenzhen SF Chuangxing Investment Co., Ltd. Shenzhen Shenzhen RMB 150 million Industrial investment - 100.00% By new establishment Shenzhen Fengnong Technology Co., Ltd. Shenzhen Shenzhen RMB 15 million Retail - 100.00% By new establishment Shenzhen Fenglang Supply Chain Co., Ltd. Shenzhen Shenzhen RMB 30 million Supply chain management and
other services - 100.00% By new establishment
Shenzhen Shunfeng Runtai Management Consulting Co., Ltd.
Shenzhen Shenzhen RMB 5 million Consulting service - 100.00% By new establishment
Shunyuan Financial Leasing Tianjin Tianjin RMB 1,500 million Leasing business - 100.00% By new establishment SF Multimodal Co., Ltd. Shenzhen Shenzhen RMB 242 million Goods delivery services - 100.00% By new establishment Shenzhen Shunxi Management Consulting Co., Ltd. Shenzhen Shenzhen RMB 2 million Management consulting - 100.00% By new establishment S.F. Insurance Broker (Shenzhen) Co., Ltd. Shenzhen Shenzhen RMB 50 million Insurance business - 100.00% By new establishment S.F. Duolian Technology Co., Ltd. Dongguan Dongguan RMB 150 million Technology development - 100.00% By new establishment Dongguan SF Taisen Enterprise Management Co., Ltd. Dongguan Dongguan RMB 30 million Property management - 100.00% By new establishment SF Innovative Technology Co., Ltd. Dongguan Dongguan RMB 450 million Information technology service - 100.00% By new establishment Shenzhen Shunheng Rongfeng Supply Chain
Technology Co., Ltd. Shenzhen Shenzhen RMB 100 million Consulting service - 100.00% Business combination
involving enterprises under common control
Shenzhen Hengyi Logistics Service Co., Ltd. Shenzhen Shenzhen RMB 100 million Freight forwarding service - 100.00% Business combination involving enterprises
under common control Lefeng Factoring Shenzhen Shenzhen RMB 62.5 million Factoring - 100.00% Business combination
involving enterprises under common control

S.F. HOLDING CO., LTD. NOTES TO THE FINANCIAL STATEMENTS FOR THE SIX MONTHS ENDED 30 JUNE 2021 (All amounts in RMB Yuan unless otherwise stated) [English translation for reference only]
282
6 Interests in other entities (Cont’d) (1) Interests in subsidiaries (Cont'd) (a) First-tier and second-tier subsidiaries of the Group are listed as follows (Cont'd):
Shareholding (%) Place of
registration Major business
location Registered capital Nature of business Direct Indirect Method of acquisition
Intra-city Industrial Hangzhou Hangzhou RMB 802.28
million Supply chain management and
other services - 77.17% By new establishment
Shenzhen SF Express Zhongyuan Network Technology Co., Ltd.
Shenzhen Shenzhen RMB 10 million Technology development and consulting services
- 100.00% By new establishment
SF Sharing Precision Information Technology (Shenzhen) Co., Ltd.
Shenzhen Shenzhen RMB 32 million Information technology service - 100.00% By new establishment
Hangzhou Shuangjie Supply Chain Co., Ltd. Hangzhou Hangzhou RMB 50 million Supply chain management and other services
- 100.00% By new establishment
S.F. Express Shenzhen Shenzhen RMB 1,695 million Corporate management and supply chain management
- 87.80% By new establishment
Huanggang Xiufeng Education Investment Co., Ltd.
Huanggang Huanggang RMB 90 million Consulting services regarding business information and
business management
- 100.00% By new establishment
Junhe Information Technology (Shenzhen) Co., Ltd.
Shenzhen Shenzhen RMB 10 million Information technology and development services
- 51.00% By new establishment
S.F. Digital Technology (Shenzhen) Services Co., Ltd.
Shenzhen Shenzhen RMB 250 million Technology and consulting services
- 100.00% By new establishment
Shenzhen S.F. International Industry Co., Ltd. Shenzhen Shenzhen RMB 10 million Information technology and consulting services
- 100.00% By new establishment
Shenzhen S.F. Investment Co., Ltd. Shenzhen Shenzhen RMB 1,100 million Investment holding - 100.00% By new establishment SF Cold Chain Logistics Co., Ltd. Shenzhen Shenzhen RMB 50 million Cargo transportation and freight
forwarding - 100.00% By new establishment

S.F. HOLDING CO., LTD. NOTES TO THE FINANCIAL STATEMENTS FOR THE SIX MONTHS ENDED 30 JUNE 2021 (All amounts in RMB Yuan unless otherwise stated) [English translation for reference only]
283
6 Interests in other entities (Cont’d) (1) Interests in subsidiaries (Cont'd) (b) Subsidiaries in which the Group has significant minority interests
As at 30 June 2021 and 31 December 2020, minority interests of the Group’s subsidiaries had no significant influence on the Group.
(2) Interests in joint ventures and associates
(a) The Group’s associates have no significant influence on the Group and are summarised as follows:
Ending balance/ Opening balance/
Amount in the current
period Amount in the prior
period Aggregated carrying amount of investments
(Note 4(12)(b)) 2,549,373,201.48 1,212,265,406.69 Aggregation of the following items in
proportion: Net profit/(loss) 1,838,158.19 (20,352,940.06) Other comprehensive income (88,282.28) 873,013.64
Total comprehensive income 1,749,875.91 (19,479,926.42)
(b) The Group’s joint ventures have no significant influence on the Group and are summarised as
follows:
Ending balance/ Opening balance/
Amount in the current
period Amount in the prior
period Aggregated carrying amount of investments
(Note 4(12)(a)) 2,526,594,898.69 2,434,965,871.21 Aggregation of the following items in
proportion: Net (loss)/profit (10,589,406.46) 1,905,420.29 Other comprehensive income - -
Total comprehensive income (10,589,406.46) 1,905,420.29

S.F. HOLDING CO., LTD. NOTES TO THE FINANCIAL STATEMENTS FOR THE SIX MONTHS ENDED 30 JUNE 2021 (All amounts in RMB Yuan unless otherwise stated) [English translation for reference only]
284
7 Segment information
The reportable segments of the Group are the business units that provide different express & logistics and supply chain services. Different businesses require different technologies and marketing strategies, and the Group, therefore, independently manages their operations and evaluates operating results, in order to make decisions about resources allocations and performance evaluations. For the six months ended 30 June 2021, the Group mainly had three reportable segments, including: - Express segment, which provides time-definite express, economy product and cold chain
delivery service; - Freight segment, which provides freight service; - Other segments, including other services and undistributed parts such as supply chain and
intra-city delivery.
Inter-segment transfer prices are determined by reference to pricing policy of related party transactions.
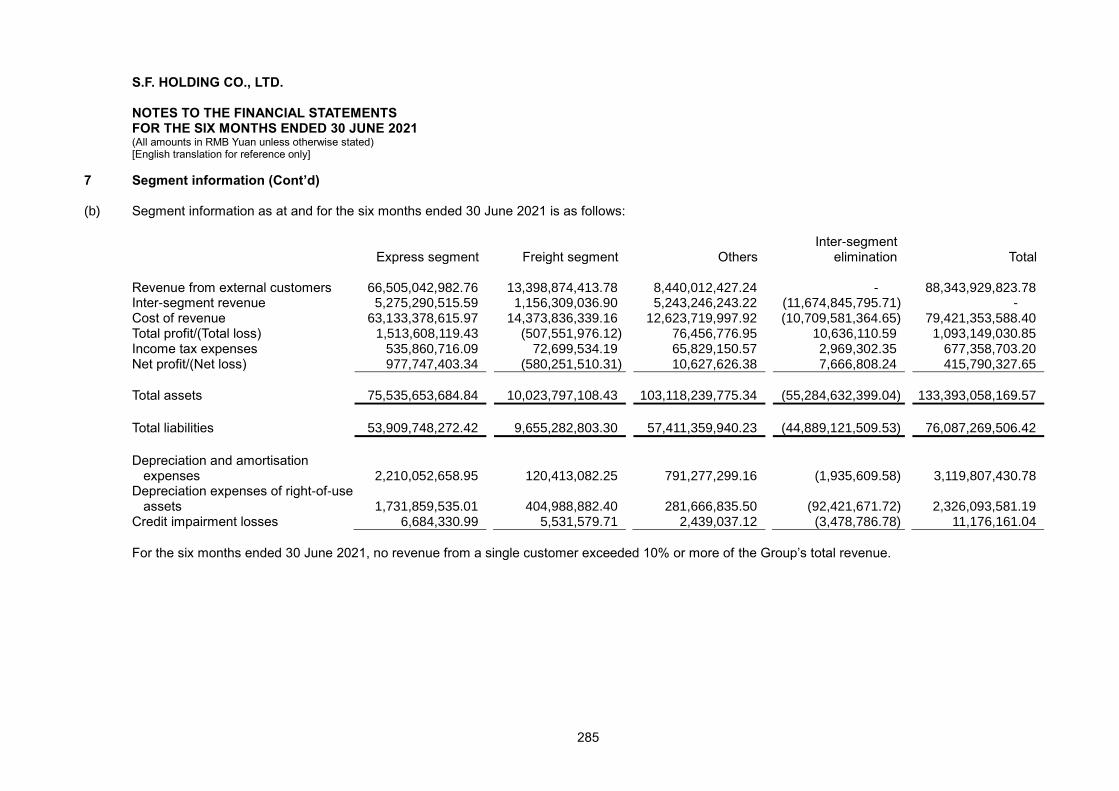
S.F. HOLDING CO., LTD. NOTES TO THE FINANCIAL STATEMENTS FOR THE SIX MONTHS ENDED 30 JUNE 2021 (All amounts in RMB Yuan unless otherwise stated) [English translation for reference only]
285
7 Segment information (Cont’d)
(b) Segment information as at and for the six months ended 30 June 2021 is as follows:
Express segment Freight segment Others Inter-segment
elimination Total Revenue from external customers 66,505,042,982.76 13,398,874,413.78 8,440,012,427.24 - 88,343,929,823.78 Inter-segment revenue 5,275,290,515.59 1,156,309,036.90 5,243,246,243.22 (11,674,845,795.71) - Cost of revenue 63,133,378,615.97 14,373,836,339.16 12,623,719,997.92 (10,709,581,364.65) 79,421,353,588.40 Total profit/(Total loss) 1,513,608,119.43 (507,551,976.12) 76,456,776.95 10,636,110.59 1,093,149,030.85 Income tax expenses 535,860,716.09 72,699,534.19 65,829,150.57 2,969,302.35 677,358,703.20 Net profit/(Net loss) 977,747,403.34 (580,251,510.31) 10,627,626.38 7,666,808.24 415,790,327.65
Total assets 75,535,653,684.84 10,023,797,108.43 103,118,239,775.34 (55,284,632,399.04) 133,393,058,169.57
Total liabilities 53,909,748,272.42 9,655,282,803.30 57,411,359,940.23 (44,889,121,509.53) 76,087,269,506.42
Depreciation and amortisation
expenses 2,210,052,658.95 120,413,082.25 791,277,299.16 (1,935,609.58) 3,119,807,430.78 Depreciation expenses of right-of-use
assets 1,731,859,535.01 404,988,882.40 281,666,835.50 (92,421,671.72) 2,326,093,581.19 Credit impairment losses 6,684,330.99 5,531,579.71 2,439,037.12 (3,478,786.78) 11,176,161.04
For the six months ended 30 June 2021, no revenue from a single customer exceeded 10% or more of the Group’s total revenue.

S.F. HOLDING CO., LTD. NOTES TO THE FINANCIAL STATEMENTS FOR THE SIX MONTHS ENDED 30 JUNE 2021 (All amounts in RMB Yuan unless otherwise stated) [English translation for reference only]
286
7 Segment information (Cont’d)
(c) Segment information as at and for the six months ended 30 June 2020 is as follows:
Express segment Freight segment Others Inter-segment
elimination Total Revenue from external customers 58,700,225,248.72 7,750,367,602.00 4,678,414,887.49 - 71,129,007,738.21 Inter-segment revenue 4,243,818,870.50 1,235,296,332.45 2,775,963,920.46 (8,255,079,123.41) - Cost of revenue 49,918,288,054.99 8,728,357,347.68 6,619,494,144.79 (7,403,010,646.05) 57,863,128,901.41 Total profit/(Total loss) 6,430,087,979.51 (81,655,316.45) (997,247,322.63) (12,421,534.21) 5,338,763,806.22 Income tax expenses 1,627,289,539.13 84,097,711.27 5,845,053.97 (2,233,657.37) 1,714,998,647.00 Net profit/(Net loss) 4,802,798,440.38 (165,753,027.72) (1,003,092,376.60) (10,187,876.84) 3,623,765,159.22
Total assets 52,773,533,529.76 6,680,912,238.06 83,918,961,339.36 (41,327,576,438.18) 102,045,830,669.00
Total liabilities 33,950,839,154.75 6,431,762,082.64 48,651,164,074.00 (34,120,796,110.60) 54,912,969,200.79
Depreciation and amortisation
expenses 1,764,779,778.80 70,779,169.76 765,922,470.93 (1,219,138.67) 2,600,262,280.82 Depreciation expenses of right-of-use
assets -- -- -- -- -- Credit impairment losses 180,777,347.68 1,798,569.34 284,265,921.73 (7,300,736.84) 459,541,101.91
For the six months ended 30 June 2020, no revenue from a single customer exceeded 10% or more of the Group’s total revenue.

S.F. HOLDING CO., LTD. NOTES TO THE FINANCIAL STATEMENTS FOR THE SIX MONTHS ENDED 30 JUNE 2021 (All amounts in RMB Yuan unless otherwise stated) [English translation for reference only]
287
8 Related parties and related party transactions (1) General information of the controlling shareholder and subsidiaries
The general information and other related information of the subsidiaries are set out in Note 6(1). (a) General information of the controlling shareholder
Place of registration Nature of business Mingde Holdings Shenzhen Investment The Company’s ultimate holding company is Mingde Holdings, and the ultimate controlling person is Wang Wei.
(b) The balances and changes of registered capital of the controlling shareholder
31 December
2020 Increase in the current period
Decrease in the current period
30 June 2021
Mingde Holdings 113,405,734.21 - - 113,405,734.21
(c) The percentages of shareholding and voting rights in the Company held by the controlling
shareholder 30 June 2021 31 December 2020
Shareholding
(%) Voting rights
(%) Shareholding
(%) Voting rights
(%) Mingde Holdings 59.30% 59.30% 59.30% 59.30%

S.F. HOLDING CO., LTD. NOTES TO THE FINANCIAL STATEMENTS FOR THE SIX MONTHS ENDED 30 JUNE 2021 (All amounts in RMB Yuan unless otherwise stated) [English translation for reference only]
288
8 Related parties and related party transactions (Cont’d)
(2) Nature of related parties that do not control / are not controlled by the Company Major related parties are listed as follows: Relationship with the Company in the reporting period Fengyi Technology Controlled by the ultimate controlling person of the
Company Shenzhen Shunshang Investment Co., Ltd. Controlled by the ultimate controlling person of the
Company Suzhou Fengchengda Network Technology Co., Ltd. Controlled by the ultimate controlling person of the
Company Shenzhen S.F. Hefeng Microfinance Co., Ltd. Controlled by the ultimate controlling person of the
Company Hangzhou Fengtai E-Commerce Industrial Park Management
Ltd. Controlled by the ultimate controlling person of the
Company Guangdong Youxuanyipin Commerce Co., Ltd(Youxuanyipin
Commerce Holdings) and its subsidiariesNote 1 Controlled by the ultimate controlling person of the
Company before November 2020 Hive Box Technology and its subsidiaries Held by the ultimate controlling person Beijing Dazhangfang and its subsidiaries The Group’s associate Chongqing Boqiang Logistics Co., Ltd. The Group’s associate Canbeidou Supply Chain and its subsidiaries The Group’s associate Kin Shun Information Technology Limited The Group’s associate Dunho Weiheng (Zhuhai) Supply Chain Management Co., Ltd. The Group’s associate Qingdao Dakai Cargo Agency Co., Ltd. The Group’s associate Shenzhen Zhongwang Finance and Tax Management Co., Ltd. The Group’s associate Shenzhen Shunjie Fengda and its subsidiaries The Group’s associate Wuhan Shunluo Supply Chain Management Co., Ltd. The Group’s associate Xi’an Huahan Air Passenger and Freight Service Co., Ltd. The Group’s associate Hubei Jiuzhou Tongda Technology Development Co., Ltd. The Group’s associate Zhongshun Xintean Supply Chain Co., Ltd. The Group’s associate Shanghai EYouTong Technology Development Co., Ltd. The Group’s associate Little Red Hat and its subsidiaries The Group’s associate before August 2020 State Grid E-Commerce Yunfeng Logistics Technology (Tianjin)
Co., Ltd. The Group’s associate since
the second half of 2020 KENGIC Intelligent and its subsidiaries The Group’s associate since
the second half of 2020 SCS Logistics Co., Ltd. The Group’s associate since
the second half of 2020 Shenzhen Fengxiang Information Technology Co., Ltd. The Group’s associate since
the second half of 2020 SF REIT and its subsidiaries The Group’s associate since
the second half of 2020 Beijing Shunhe Tongxin Technology Co., Ltd. The Group’s joint venture Geling Information and its subsidiaries The Group’s joint venture Global Connect Holding Limited The Group’s joint venture POST11OÜ The Group’s joint venture
Shenghai Information The Group’s joint venture Wenzhou Fengbaoke Technology Co., Ltd. The Group’s joint venture Wulian Shuntong and its subsidiaries The Group’s joint venture ZBHA and its subsidiaries The Group’s joint venture CR-SF International Express Co., Ltd. The Group’s joint venture Zhongyunda Aviation Ground Services Co., Ltd. The Group’s associate before June 2021 Fengsu Technology The Group’s subsidiary before December 2020 and now
the Group’s joint venture CITIC Securities Co., Ltd. (“CITIC Securities”) and its business
departments Significantly influenced by the key management of
the Company Golden Arches (China) Co., Ltd. ("Golden Arches") and its
subsidiaries Significantly influenced by the key management of
the Company Ping An Insurance (Group) Company of China, Ltd. (“Ping An
Insurance”) Note 2 Significantly influenced by the key management of
the Company Zhaoguang Investment Note 3 Significantly influenced by the key management of the
Company China Vanke Co., Ltd. and its subsidiaries Significantly influenced by the key management of
the Company since the second half of 2020

S.F. HOLDING CO., LTD. NOTES TO THE FINANCIAL STATEMENTS FOR THE SIX MONTHS ENDED 30 JUNE 2021 (All amounts in RMB Yuan unless otherwise stated) [English translation for reference only]
289
8 Related parties and related party transactions (Cont’d) (2) Nature of related parties that do not control / are not controlled by the Company (Cont’d)
Relationship with the Company in the reporting period China International Marine Containers (Group) Ltd. (“China
International Marine”) Significantly influenced by the key management of
the Company since the second half of 2020 China Pacific Insurance (Group) Co., Ltd. (“Pacific Insurance”)
Note4 Significantly influenced by the key management of the
Company before July 2019 SF Charity Foundation Organisation sponsored by controlling shareholders and
the Company’s subsidiaries, in which director and senior managers of the company serve on the Board
of Management
Note 1:The company was formerly known as S.F. Holding (Group) Commerce Co., Ltd.), which is a
company disposed of by the ultimate controlling person of the Group in November 2020. Pursuant to the Listing Rules of Shenzhen Stock Exchange, Youxuanyipin Commerce Holding and its subsidiaries were still related parties of the Group as at 30 June 2021.
Note 2: It was a company significantly influenced by the key management of the Company before July 2019. Pursuant to the Listing Rules of Shenzhen Stock Exchange, it was no longer a related party of the Group since August 2020. Then it was a company significantly influenced by the key management of the Group since April 2021. Therefore, the Group's related-party transactions refer to the transaction volume for the six months ended June 30, 2020 and the period from April 2021 to June 2021.
Note 3: It used to be the shareholder that hold more than 5% of the Company's shares. After passive dilution, the related party held less than 5% of the Company's shares on June 30, 2021. However, since the key management personnel of the Group can exert significant influence on the entity, it was still a related parties of the Group during the reporting period.
Note 4: It was a company significantly influenced by the key management personnel of the Group before
July 2019, according to the Listing Rules of Shenzhen Stock Exchange , it was no longer a related party of the Group since August 2020. Therefore, the Group’s related-party transactions refer to the transaction volume from January to June 2020, and its related-party transactions during the six-month period ending June 30, 2021 and the related party balance as of December 31, 2020 are listed as "Not applicable".

S.F. HOLDING CO., LTD. NOTES TO THE FINANCIAL STATEMENTS FOR THE SIX MONTHS ENDED 30 JUNE 2021 (All amounts in RMB Yuan unless otherwise stated) [English translation for reference only]
290
8 Related parties and related party transactions (Cont’d)
(3) Related party transactions
(a) Pricing policies The pricing method of transactions and transaction price between the Group and related parties are determined, following arm’s length principle, by making reference to the market price or through negotiation between both parties.
(b) Income from courier service, combined transport and freight forwarding services
For the six months ended 30 June
2021 2020
Golden Arches and its subsidiaries 768,085,387.49 549,826,934.82
CR-SF International Express Co., Ltd. 88,609,696.59 30,684,995.23
Fengyi Technology 9,915,403.17 13,789,903.01 State Grid E-Commerce Yunfeng Logistics
Technology (Tianjin) Co., Ltd. 3,084,234.46 Not applicable Suzhou Fengchengda Network Technology
Co., Ltd. 3,059,745.17 1,314,952.65 China International Marine and its
subsidiaries 3,054,344.29 Not applicable CITIC Securities and its business
departments 2,671,835.65 1,749,086.07
SCS Logistics Co., Ltd. 2,204,955.02 Not applicable
Zhongshun Xintean Supply Chain Co., Ltd. 2,125,591.27 188,519.26
Canbeidou Supply Chain and its subsidiaries 1,905,359.59 171,947.75
Hive Box Technology and its subsidiaries 1,383,690.68 893,147.41 Youxuanyipin Commerce Holdings and its
subsidiaries 954,166.81 21,087,072.32
Geling Information and its subsidiaries 704,600.66 566,861.00
Wenzhou Fengbaoke Technology Co., Ltd. 253,796.21 837,218.83
SF Charity Foundation 181,616.56 16,656,918.94
Ping An Insurance 49,107.55 56,372,650.09
Pacific Insurance Not applicable 11,325,878.60
Others 3,550,906.31 2,973,306.65
891,794,437.48 708,439,392.63

S.F. HOLDING CO., LTD. NOTES TO THE FINANCIAL STATEMENTS FOR THE SIX MONTHS ENDED 30 JUNE 2021 (All amounts in RMB Yuan unless otherwise stated) [English translation for reference only]
291
8 Related parties and related party transactions (Cont’d) (3) Related party transactions (Cont’d) (c) Communication income
For the six months ended 30 June
2021 2020
Hive Box Technology and its subsidiaries 11,655,313.89 10,540,933.95
Shenzhen S.F. Hefeng Microfinance Co., Ltd. 1,862,327.77 809,538.64
Fengyi Technology 1,733,712.00 1,480,366.98
Others 690,060.04 -
15,941,413.70 12,830,839.57
(d) Commission income for collection and settlement on behalf of related parties
For the six months ended 30 June
2021 2020 Shenzhen S.F. Hefeng Microfinance Co., Ltd. 2,338,766.81 2,361,931.14 Others 596,161.19 117,618.69
2,934,928.00 2,479,549.83
(e) Income from platform and other services
For the six months ended 30 June
2021 2020 Fengyi Technology 25,377,551.03 5,236,762.32 CR-SF International Express Co., Ltd. 3,506,975.74 3,737,098.33 Others 705,400.90 510,730.15
29,589,927.67 9,484,590.80
(f) Technology development service income
For the six months ended 30 June
2021 2020 Fengyi Technology 1,910,701.20 - Hive Box Technology and its subsidiaries 788,218.12 - Others 440,950.70 498,435.44
3,139,870.02 498,435.44
(g) Revenue from property management
For the six months ended 30 June
2021 2020
Hangzhou Fengtai E-Commerce Industrial Park Management Ltd. 3,798,499.91 511,585.06
Others 635,858.13 124,623.77
4,434,358.04 636,208.83

S.F. HOLDING CO., LTD. NOTES TO THE FINANCIAL STATEMENTS FOR THE SIX MONTHS ENDED 30 JUNE 2021 (All amounts in RMB Yuan unless otherwise stated) [English translation for reference only]
292
8 Related parties and related party transactions (Cont’d) (3) Related party transactions (Cont’d)
(h) Revenue from sales of goods
For the six months ended 30 June
2021 2020
Shenzhen Shunjie Fengda and its subsidiaries 3,409,557.59 7,813,123.87
Hive Box Technology and its subsidiaries 2,209.96 3,488,105.88 Others 74,297.38 253,909.31
3,486,064.93 11,555,139.06
(i) Interest income
For the six months ended 30 June
2021 2020
Wuhan Shunluo Supply Chain Management Co., Ltd. 1,156,568.42 321,986.83
Others 507,319.28 398,109.78
1,663,887.70 720,096.61
(j) Sales of equity to related parties
For the six months ended 30 June
2021 2020 Mingde Holdings 40,000,000.00 -
(i) Shenzhen SF Chuangxing Investment Co., Ltd., a subsidiary of the company, sold all the equity in
Fengyi Technology held to Mingde Holdings for a price of 40,000,000.00 in June 2021.
(k) Leases
(i) Lease income recognised by the Group as the lessor in the current period For the six months ended 30 June
Type of the
leased assets 2021 2020 Fengyi Technology. Buildings 907,476.42 770,120.28 Others Buildings 800,482.60 708,570.33
1,707,959.02 1,478,690.61

S.F. HOLDING CO., LTD. NOTES TO THE FINANCIAL STATEMENTS FOR THE SIX MONTHS ENDED 30 JUNE 2021 (All amounts in RMB Yuan unless otherwise stated) [English translation for reference only]
293
8 Related parties and related party transactions (Cont’d) (3) Related party transactions (Cont’d) (k) Leases (Cont’d) (ii) Right of use assets increased by the Group as the lessee in the current period
For the six months ended 30 June
Type of the
leased assets 2021 2020 SF REIT and its
subsidiaries Buildings 974,663,570.20 -- Shenzhen Shunshang
Investment Co., Ltd. Buildings 15,214,307.18 -- Hangzhou Fengtai
E-Commerce Industrial Park Management Ltd. Buildings 3,397,451.22 --
993,275,328.60 --
(iii) Depreciation expenses and interest expenses of the Group as the lessee for the current period
For the six months ended 30 June
Type of the
leased assets 2021 2020
SF REIT and its subsidiaries Buildings 36,287,780.38 -- Shenzhen Shunshang
Investment Co., Ltd. Buildings 14,392,630.21 -- Hangzhou Fengtai
E-Commerce Industrial Park Management Ltd. Buildings 3,168,328.83 --
Others Buildings 150,116.66 --
53,998,856.08 --

S.F. HOLDING CO., LTD. NOTES TO THE FINANCIAL STATEMENTS FOR THE SIX MONTHS ENDED 30 JUNE 2021 (All amounts in RMB Yuan unless otherwise stated) [English translation for reference only]
294
8 Related parties and related party transactions (Cont’d) (3) Related party transactions (Cont’d) (l) Combined transport and freight forwarding expenses
For the six months ended 30 June
2021 2020 CR-SF International Express Co., Ltd. 291,231,896.62 191,128,674.20 Wulian Shuntong and its subsidiaries 182,454,542.96 41,165,451.85 SCS Logistics Co., Ltd. 140,805,835.99 Not applicable Shenzhen Shunjie Fengda and its
subsidiaries 139,252,262.92 96,126,152.00 Xi’an Huahan Air Passenger and Freight
Service Co., Ltd. 9,863,549.85 11,108,419.89 Zhongyunda Aviation Ground Services Co.,
Ltd. 8,750,838.13 5,470,688.84 Qingdao Dakai Cargo Agency Co., Ltd. 7,306,629.96 13,907,375.89 Chongqing Boqiang Logistics Co., Ltd. 6,325,442.21 4,040,564.96 Kin Shun Information Technology Limited 5,882,868.30 63,050,647.89 POST11 OÜ 3,275,201.18 18,348,348.24 Shanghai EYouTong Technology
Development Co., Ltd. 4,979,752.68 - Little Red Hat and its subsidiaries Not applicable 3,459,587.20 Others 535,834.18 371,846.29
800,664,654.98 448,177,757.25
(m) Express delivery agent and other service fees
For the six months ended 30 June
2021 2020
Hive Box Technology and its subsidiaries 61,845,847.54 41,693,321.90 Beijing Dazhangfang and its subsidiaries 34,521,968.13 2,138,162.91 Global Connect Holding Limited 7,192,829.89 1,479,642.95 Shenzhen Zhongwang Finance and Tax
Management Co., Ltd. 4,156,676.25 1,352,984.67 Fengyi Technology 3,779,339.61 - Others 1,298,337.20 1,684,942.72
112,794,998.62 48,349,055.15

S.F. HOLDING CO., LTD. NOTES TO THE FINANCIAL STATEMENTS FOR THE SIX MONTHS ENDED 30 JUNE 2021 (All amounts in RMB Yuan unless otherwise stated) [English translation for reference only]
295
8 Related parties and related party transactions (Cont’d)
(3) Related party transactions (Cont’d) (n) Interest expenses
For the six months ended 30 June
2021 2020
Shenzhen Zhongwang Finance and Tax Management Co., Ltd. 21,853.93 45,109.62
Others 74.96 375.91
21,928.89 45,485.53
(o) Collection commissions fee
For the six months ended 30 June
2021 2020
Hive Box Technology and its subsidiaries 34,418,097.24 60,944,717.00
(p) Security service fee
For the six months ended 30 June
2021 2020
ZBHA and its subsidiaries 82,049,925.84 76,196,898.98 Others 207,054.76 -
82,256,980.60 76,196,898.98
(q) Rent and property management fees
For the six months ended 30 June
2021 2020 SF REIT and its subsidiaries 7,939,461.47 Not applicable Shenzhen Shunshang Investment Co., Ltd. 668,398.97 23,392,845.68 Shenghai Information 922,675.30 5,938,741.66 Beijing Dazhangfang and its subsidiaries - 4,153,106.44 Canbeidou Supply Chain and its subsidiaries - 2,020,087.78 Others 248,302.99 418,511.36
9,778,838.73 35,923,292.92
The rental expenses incurred during the six-month period ended 30 June 2021 have been included in Note 8(3)(k)(iii). This is only the property management fee expenditure with related parties during the reporting period. The amount for the six-month period ended 30 June 2020 includes rental expenses.

S.F. HOLDING CO., LTD. NOTES TO THE FINANCIAL STATEMENTS FOR THE SIX MONTHS ENDED 30 JUNE 2021 (All amounts in RMB Yuan unless otherwise stated) [English translation for reference only]
296
8 Related parties and related party transactions (Cont’d) (3) Related party transactions (Cont’d)
(r) Technology development and operation & maintenance service fee
For the six months ended 30 June
2021 2020
Shenghai Information 12,070,990.65 14,266,853.37 Fengsu Technology 3,803,482.94 Not applicable Beijing Shunhe Tongxin Technology Co., Ltd. 1,208,836.90 2,853,845.58 Others 389,773.83 231,900.20
17,473,084.32 17,352,599.15
(s) Promotion fee
For the six months ended 30 June
2021 2020
Hive Box Technology and its subsidiaries 611,775.84 9,292.45 Youxuanyipin Commerce Co., Ltd 580,021.95 306,314.75 Others 138,384.68 134,799.54
1,330,182.47 450,406.74
(t) Purchase of materials
For the six months ended 30 June
2021 2020
KENGIC Intelligent and its subsidiaries 142,702,602.74 Not applicable Fengyi Technology 92,683,803.39 110,164,700.38 China International Marine 27,558,254.79 Not applicable Youxuanyipin Commerce Co., Ltd 22,289,134.28 43,975,730.70 Wenzhou Fengbaoke Technology Co., Ltd. 7,492,020.54 15,714,549.49 Shenzhen Fengxiang Information Technology
Co., Ltd. 1,583,383.12 Not applicable Hubei Jiuzhou Tongda Technology
Development Co., Ltd. 873,731.25 114,605,000.79 Others 18,404.11 19,055.01
295,201,334.22 284,479,036.37

S.F. HOLDING CO., LTD. NOTES TO THE FINANCIAL STATEMENTS FOR THE SIX MONTHS ENDED 30 JUNE 2021 (All amounts in RMB Yuan unless otherwise stated) [English translation for reference only]
297
8 Related parties and related party transactions (Cont’d) (3) Related party transactions (Cont’d) (u) Insurance premium
For the six months ended 30 June
2021 2020
Pacific Insurance Not applicable 36,409,014.15 Ping An Insurance - 15,821,191.55
- 52,230,205.70
Insurance premium represents the amount amortised over the benefit period of insurance policies.
(v) Donation expenses
For the six months ended 30 June
2021 2020
SF Charity Foundation 51,126.48 20,000,000.00
(w) Remuneration of key management
For the six months ended 30 June
2021 2020
Remuneration of key management 16,700,000.00 16,980,000.00

S.F. HOLDING CO., LTD. NOTES TO THE FINANCIAL STATEMENTS FOR THE SIX MONTHS ENDED 30 JUNE 2021 (All amounts in RMB Yuan unless otherwise stated) [English translation for reference only]
298
8 Related parties and related party transactions (Cont’d) (4) Receivables from and payables to related parties (a) Accounts receivable
30 June 2021 31 December 2020 Golden Arches and its subsidiaries 196,069,744.55 163,467,065.39 CR-SF International Express Co., Ltd. 32,866,366.42 27,064,970.00 Fengyi Technology 14,979,994.65 50,109,913.29 Hive Box Technology and its subsidiaries 4,901,662.15 3,335,084.30 Shenzhen Shunjie Fengda and its
subsidiaries 2,447,106.38 30,567,588.38 Hangzhou Fengtai E-Commerce Industrial
Park Management Ltd. 2,446,635.67 929,865.04 Shenzhen S.F. Hefeng Microfinance Co., Ltd. 2,266,981.81 1,907,815.33 SF REIT and its subsidiaries 1,779,317.06 Not applicable State Grid E-Commerce Yunfeng Logistics
Technology (Tianjin) Co., Ltd. 1,625,123.93 3,684,971.98 Suzhou Fengchengda Network Technology
Co., Ltd. 1,379,446.12 1,465,961.90 China International Marine 892,509.20 538,172.82 Zhongshun Xintean Supply Chain Co., Ltd. 806,719.65 100,541.85 Youxuanyipin Commerce Co., Ltd 668,045.04 465,834.80 Wenzhou Fengbaoke Technology Co., Ltd. 436,802.00 701,034.00 China Vanke Co., Ltd. and its subsidiaries 46,378.80 537,775.10 Zhongyunda Aviation Ground Services Co.,
Ltd. Not applicable 4,003,205.75 Others 3,261,051.23 3,990,455.20
266,873,884.66 292,870,255.13
(b) Advances to suppliers
30 June 2021 31 December 2020 CR-SF International Express Co., Ltd. 34,153,818.36 23,154,566.76 Hive Box Technology and its subsidiaries 5,703,436.49 15,601,911.29 Hangzhou Fengtai E-Commerce Industrial
Park Management Ltd. 2,781,243.65 3,256,643.57 Youxuanyipin Commerce Co., Ltd 1,431,049.64 503,741.24 Others 1,937,708.77 1,909,712.37
46,007,256.91 44,426,575.23

S.F. HOLDING CO., LTD. NOTES TO THE FINANCIAL STATEMENTS FOR THE SIX MONTHS ENDED 30 JUNE 2021 (All amounts in RMB Yuan unless otherwise stated) [English translation for reference only]
299
8 Related parties and related party transactions (Cont’d) (4) Receivables from and payables to related parties (Cont’d) (c) Loans and advances
30 June 2021 31 December 2020
Wuhan Shunluo Supply Chain Management Co., Ltd. 33,265,058.13 24,406,159.15
Dunho Weiheng (Zhuhai) Supply Chain Management Co., Ltd. - 34,352,402.78
Kin Shun Information Technology Limited - 5,180,137.01
33,265,058.13 63,938,698.94
(d) Other receivables
30 June 2021 31 December 2020 Hive Box Technology and its subsidiaries 284,611,545.00 279,996,905.15 SF REIT and its subsidiaries 67,334,657.99 Not applicable Golden Arches and its subsidiaries 28,756,626.65 29,396,756.33 China International Marine 9,705,463.00 9,385,463.00 Youxuanyipin Commerce Co., Ltd 2,571,951.28 3,039,688.93 Shenzhen Shunjie Fengda and its
subsidiaries 2,325,690.98 1,948,867.55 Beijing Dazhangfang and its subsidiaries 378,917.81 693,347.52 Others 680,374.82 738,620.57
396,365,227.53 325,199,649.05
(e) Other non-current assets
30 June 2021 31 December 2020
KENGIC Intelligent and its subsidiaries 205,687,460.69 22,178,241.29
China International Marine 163,341,000.00 5,847,429.00 Hubei Jiuzhou Tongda Technology
Development Co., Ltd. 15,124,000.00 -
Others - 394,633.86
384,152,460.69 28,420,304.15
(f) Long-term receivables(including current portion of long-term receivables)
30 June 2021 31 December 2020
Shenzhen Shunjie Fengda and its
subsidiaries 5,233,556.41 -

S.F. HOLDING CO., LTD. NOTES TO THE FINANCIAL STATEMENTS FOR THE SIX MONTHS ENDED 30 JUNE 2021 (All amounts in RMB Yuan unless otherwise stated) [English translation for reference only]
300
8 Related parties and related party transactions (Cont’d) (4) Receivables from and payables to related parties (Cont’d)
(g) Deposits from customers
30 June 2021 31 December 2020
Shenzhen Zhongwang Finance and Tax
Management Co., Ltd. 2,785,918.25 3,530,459.67
Others 503.76 573.80
2,786,422.01 3,531,033.47
(h) Accounts payable
30 June 2021 31 December 2020
Wulian Shuntong and its subsidiaries 94,835,269.88 71,206,423.49
CR-SF International Express Co., Ltd. 85,777,811.57 98,127,753.58
SCS Logistics Co., Ltd. 55,820,624.85 - Shenzhen Shunjie Fengda and its
subsidiaries 41,369,934.05 29,564,305.16 Hubei Jiuzhou Tongda Technology
Development Co., Ltd. 30,724,668.14 32,040,569.87
Fengyi Technology 12,401,513.20 15,059,348.69
ZBHA and its subsidiaries 12,258,662.46 16,083,449.36
Youxuanyipin Commerce Co., Ltd 5,030,521.70 13,641,816.30
Hive Box Technology and its subsidiaries 5,287,749.50 2,429,841.97
SF REIT and its subsidiaries 4,283,812.41 Not applicable Xi’an Huahan Air Passenger and Freight
Service Co., Ltd. 3,984,708.00 2,692,517.44
Shenghai Information 3,122,935.24 8,378,757.78
Wenzhou Fengbaoke Technology Co., Ltd. 2,884,437.87 8,889,063.90
Qingdao Dakai Cargo Agency Co., Ltd. 2,672,050.39 1,344,356.56 Shanghai EYouTong Technology
Development Co., Ltd. 2,328,771.72 418,086.11
Shenzhen Shunshang Investment Co., Ltd. 1,607,644.80 -
Beijing Dazhangfang and its subsidiaries 1,290,395.77 1,108,614.10
Beijing Shunhe Tongxin Technology Co., Ltd. 1,281,847.07 2,359,931.55 Shenzhen Fengxiang Information Technology
Co., Ltd. 920,946.02 Not applicable
Fengsu Technology 917,647.76 2,176,036.69
POST11OÜ 761,470.59 4,056,630.21 Shenzhen Zhongwang Finance and Tax
Management Co., Ltd. 674,994.71 1,530,237.94 Zhongyunda Aviation Ground Services Co.,
Ltd. Not applicable 1,983,543.81
Others 1,446,098.91 1,173,699.82
371,684,516.61 314,264,984.33

S.F. HOLDING CO., LTD. NOTES TO THE FINANCIAL STATEMENTS FOR THE SIX MONTHS ENDED 30 JUNE 2021 (All amounts in RMB Yuan unless otherwise stated) [English translation for reference only]
301
8 Related parties and related party transactions (Cont’d) (4) Receivables from and payables to related parties (Cont’d) (i) Advances from customers
30 June 2021 31 December 2020
Fengyi Technology 18,517.52 2,660.36
KENGIC Intelligent and its subsidiaries 8,640.84 6,989.74
Hive Box Technology and its subsidiaries 7,953.06 17,273.73
Wulian Shuntong and its subsidiaries 7,267.83 7,871.21
ZBHA and its subsidiaries 2,622.79 2,622.82
45,002.04 37,417.86
(j) Contract liabilities
30 June 2021 31 December 2020
Golden Arches and its subsidiaries 1,597,592.98 5,194,604.30 Hangzhou Fengtai E-Commerce Industrial
Park Management Ltd. 1,496,518.00 360,000.00
Fengyi Technology 841,526.82 9,024,111.33 Shenzhen Shunjie Fengda and its
subsidiaries 159,389.34 4,816,000.00
Others 800,845.92 582,357.54
4,895,873.06 19,977,073.17
(k) Other payables
30 June 2021 31 December 2020
KENGIC Intelligent and its subsidiaries 170,328,291.91 216,779,866.78
China International Marine 79,877,377.15 102,948,509.14
Golden Arches and its subsidiaries 16,600,550.45 18,474,046.06 Hubei Jiuzhou Tongda Technology
Development Co., Ltd. 13,095,995.16 29,842,072.53
Wulian Shuntong and its subsidiaries 2,240,682.70 306,098.71
Fengyi Technology 1,435,373.92 2,713,575.77 Shenzhen Shunjie Fengda and its
subsidiaries 1,312,240.32 464,840.65
SF REIT and its subsidiaries 1,012,718.56 Not applicable Hangzhou Fengtai E-Commerce Industrial
Park Management Ltd. 604,864.00 219,049.00
Shenghai Information 205,934.58 834,287.27
Zhaoguang Investment - 2,180,000.00
Others 985,114.51 1,191,471.86
287,699,143.26 375,953,817.77

S.F. HOLDING CO., LTD. NOTES TO THE FINANCIAL STATEMENTS FOR THE SIX MONTHS ENDED 30 JUNE 2021 (All amounts in RMB Yuan unless otherwise stated) [English translation for reference only]
302
8 Related parties and related party transactions (Cont’d) (4) Receivables from and payables to related parties (Cont’d)
(l) Lease liabilities(including current portion of lease liabilities)
30 June 2021 31 December 2020
SF REIT and its subsidiaries 927,925,930.64 --
Shenzhen Shunshang Investment Co., Ltd. 9,756,755.89 -- Hangzhou Fengtai E-Commerce Industrial
Park Management Ltd. 3,358,800.41 --
941,041,486.94 --
(5) Commitments in relation to related parties
Commitments with related parties contracted for by the Group but not yet necessary to be recognised on the balance sheet as at the balance sheet date are as follows: Leases 30 June 2021 31 December 2020 - Lessee Hangzhou Fengtai E-Commerce
Industrial Park Management Ltd. 56,634,442.61 - Shenzhen Shunshang Investment
Co., Ltd. 1,607,644.80 - CR-SF International Express Co.,
Ltd. 557,287.20 806,650.08 Others 747,954.00 100,973.40
59,547,328.61 907,623.48
As of 30 June 2021, the Group had no significant lease commitments to related parties.

S.F. HOLDING CO., LTD. NOTES TO THE FINANCIAL STATEMENTS FOR THE SIX MONTHS ENDED 30 JUNE 2021 (All amounts in RMB Yuan unless otherwise stated) [English translation for reference only]
303
9 Share-based payments
(1) Overview of share-based payments Expenses recognised for the period arising from share-based payments were as follows:
For the six months ended 30 June
2021 2020
Equity-settled share-based payments 122,360,610.58 54,253,366.54
Cash-settled share-based payments 32,338,291.01 25,351,380.63
154,698,901.59 79,604,747.17
(2) Information on equity-settled share-based payments
(a) Information on share-based payments of the Company
On 17 May 2018, the Company held the 2nd interim shareholders’ meeting in 2018, at which the proposal of the Restricted Shares Incentive Plan (Draft) and Summary for 2018 was approved. Authorised by the 2nd interim shareholders’ meeting in 2018, the Company held the 15th meeting of the 4th Board of Directors on 13 June 2018, at which the Proposal of Granting Restricted Shares to Incentive Recipients for 2018 was approved. The grant date of restricted shares is 13 June 2018. The post lock-up periods and their schedules for the restricted shares for 2018 are presented in the table below:
Post lock-up period Timing
Proportion of shares
exercisable
1st post lock-up period From the first trading day after 12 months since the
registration of granting to the last trading day within 24 months after the registration of granting
50.00%
2nd post lock-up period From the first trading day after 24 months since the
registration of granting to the last trading day within 36 months after the registration of granting
50.00%
In addition to the Company’s performance, individual performance assessment, which is specified in the Restricted Shares Incentive Plan, has also to be satisfied to unlock the restricted shares. After it comes into the post lock-up period, the Group deals with unlocking procedures for the holders that meet unlocking conditions as well as repurchases and cancels the restricted shares that do not meet unlocking conditions. The repurchasing price comprises the granting price plus the interest accruing thereon at the current deposit rate. If the Company transfers capital reserve to paid-in capital, distributes share dividends, splits shares, pays dividends, allocates shares or reduces shares after restricted shares are granted, the number and the price of repurchasing restricted shares shall be adjusted in accordance with the Restricted Shares Incentive Plan.

S.F. HOLDING CO., LTD. NOTES TO THE FINANCIAL STATEMENTS FOR THE SIX MONTHS ENDED 30 JUNE 2021 (All amounts in RMB Yuan unless otherwise stated) [English translation for reference only]
304
9 Share-based payments (Cont’d)
(2) Information on equity-settled share-based payments (Cont’d)
(a) Information on share-based payments of the Company (Cont'd) As at 23 March 2020, at the 3rd meeting of the 5th Board of Directors, the Proposal of Repurchasing and Cancelling Certain Restricted Shares was approved: the criteria of the performance assessment for the second post lock-up period for the restricted shares incentive plan for 2018 were not met, therefore the Company repurchased and cancelled the restricted shares previously held by these incentive recipients The Restricted Shares Incentive Plan mentioned above has been implemented in 2020.
(b) Information on share-based payments of the Company’s subsidiaries
The Group granted some equities or share options of several subsidiaries, to the senior management and other employees of the aforesaid companies or other subsidiaries within the Group respectively. As at 30 June 2021, the equity-settled share-based payments of these companies recognised by the Group accumulated to RMB 392,366,739.74 (31 December 2020: RMB 270,006,129.16), including accumulated amounts attributable to shareholders of the parent company of RMB 345,559,707.03 (31 December 2020: RMB 241,004,364.42). For the six months ended 30 June 2021, expenses recognised for equity-settled share-based payments amounted to RMB 122,360,610.58 (for the six months ended 30 June 2020: RMB 54,253,366.54). The fair value at the grant date was recognised based on the discount cash flow model and the binomial tree model etc.
(3) Information on cash-settled share-based payments Information on share-based payments of the Company’s subsidiaries
The Group granted the senior management of subsidiaries with the equity or options of the subsidiaries with repurchase terms.
As at 30 June 2021, the accumulated liabilities arising from cash-settled share-based payments amounted to RMB 161,924,735.07 (31 December 2020: RMB 129,586,444.06). For the six months ended 30 June 2021, expenses recognised for cash-settled share-based payments amounted to RMB 32,338,291.01 (for the six months ended 30 June 2020: RMB 25,351,380.63).The fair value on the balance sheet date was recognised based on the discount cash flow model and the binomial tree model etc.

S.F. HOLDING CO., LTD. NOTES TO THE FINANCIAL STATEMENTS FOR THE SIX MONTHS ENDED 30 JUNE 2021 (All amounts in RMB Yuan unless otherwise stated) [English translation for reference only]
305
10 Commitments
(1) Capital commitments
(a) Capital expenditures contracted for by the Group but are not yet necessary to be recognised on the balance sheet as at the balance sheet date are as follows:
30 June 2021 31 December 2020
Buildings, machinery and equipment 9,008,905,102.21 4,169,824,245.83 Investment contracts that have been signed
but not fulfilled or not absolutely fulfilled 1,951,177,350.00 2,200,898,059.29
Others 9,511,896.51 4,897,375.00
10,969,594,348.72 6,375,619,680.12
(b) In addition to the above-mentioned capital commitments, as approved in the eleventh session and
the sixteenth session of the fifth Board of Directors and the 3rd interim shareholders’ meeting in 2021, the Company intended to, through its wholly-owned subsidiary, Flourish Harmony Holdings Company Limited, issue tender offers to eligible shareholders and share option holders of Kerry Logistics Network Limited (Kerry Logistics, listed on the Main Board of the Hong Kong Stock Exchange), to acquire 931,209,117 shares (approximately 51.8% of the issued share capital or 51.5% of the fully diluted share capital) of Kerry Logistics in cash, and cancel 51.8% of Kerry Logistics’s share options that had not been exercised as at the final vesting date held by Kerry Logistics’s share option holders. As far as this transaction is concerned, the total consideration payable is approximately HKD17,555 million based on the above partial offers and share option offers. As of the date when this financial statement is approved for issuance, all the pre-conditions for this transaction have been fulfilled or waived. Flourish Harmony Holdings Company Limited and Kerry Logistics have jointly dispatched in accordance with the requirements of the Hong Kong Special Administrative Region "Company Acquisition and Merger Contract" comprehensive offer document.
(2) Lease commitments
On 30 June 2021, for the lease contracts that the Group has signed but not yet executed, the cash flows are listed as follows based on the maturity date:
30 June 2021
Within 1 year(inclusive) 1,212,509,790.01
1 to 2 years(inclusive) 512,434,582.68
2 to 3 years(inclusive) 438,506,178.64 Over 3 years 469,882,118.05
2,633,332,669.38

S.F. HOLDING CO., LTD. NOTES TO THE FINANCIAL STATEMENTS FOR THE SIX MONTHS ENDED 30 JUNE 2021 (All amounts in RMB Yuan unless otherwise stated) [English translation for reference only]
306
10 Commitments (Cont'd)
(3) Other commitments
(i) In November 2020, the Group issued asset-backed securities through the Special Scheme set up by Huatai Securities (Shanghai) Asset Management Co., Ltd. by using five logistics industrial parks held by it as underlying assets. Yiwu Fengyutai Enterprise Management Co., Ltd., Quanzhou Fengyutai Enterprise Management Co., Ltd., Wuxi Jietai Enterprise Management Co., Ltd. and Huai'an Fengtai Enterprise Management Co., Ltd. (collectively “Property Operators”), wholly-owned subsidiaries of the Group, worked as the property operators of the Special Scheme. In case that the actual operating income of the property assets does not reach 90% but is not lower than 80% of the target amount, the Property Operators were committed to compensating the insufficient part of the target amount with Taisen Holdings providing guarantee for the compensation obligation.
At the end of each three years, the manager of the above Special Scheme accepts open-ended withdrawal and subscription of preferred securities within the withdrawal registering period. If the preferred securities shares that have not completed open-ended withdrawal are less than 20% of total undistributed principal of the preferred securities of RMB 788 million, at the extension operation announcement date, Taisen Holdings will purchase such preferred securities.
(ii) In September 2019, the Group issued asset-backed securities through the Special Scheme set up
by Huatai Securities (Shanghai) Asset Management Co., Ltd. by using three logistics industrial parks held by it as underlying assets. Shenzhen Fengtai E-Commerce Industrial Park Property Service Co., Ltd., Yiwu Fengyutai Enterprise Management Co., Ltd. and Huai’an Fengtai Enterprise Management Co., Ltd. (collectively “Property Operators”), wholly-owned subsidiaries of the Group, worked as the property operators of the Special Scheme. In case that the actual operating income of the property assets does not reach 90% but is not lower than 80% of the target amount, the Property Operators were committed to compensating the insufficient part of the target amount with Taisen Holdings providing guarantee for the compensation obligation. At the end of each three years, the manager of the above Special Scheme accepts open-ended withdrawal and subscription of preferred securities within the withdrawal registering period. If the preferred securities shares that have not completed open-ended withdrawal are less than 20% of total undistributed principal of the preferred securities of RMB 765 million, at the extension operation announcement date, Taisen Holdings will purchase such preferred securities.
(iii) In December 2018, the Group issued asset-backed securities through the Special Scheme set up by Huatai Securities (Shanghai) Asset Management Co., Ltd. by using two logistics industrial parks held by it as underlying assets. Shanghai Fengtai Yuanxing Property Management Service Co., Ltd. (“Fengtai Yuanxing”), a wholly-owned subsidiary of the Group, worked as the property operator of the special scheme. In case that the actual operating income of the property assets does not reach 90% but is not lower than 80% of the target amount, Fengtai Yuanxing was committed to compensating the insufficient part of the target amount with Taisen Holdings providing guarantee for the compensation obligation. At the end of each three years, the manager of the above Special Scheme accepts open-ended withdrawal and subscription of preferred securities within the withdrawal registering period. If the preferred securities shares that have not completed open-ended withdrawal are less than 20% of total undistributed principal of the preferred securities of RMB 1.12 billion, at the extension operation announcement date, Taisen Holdings will purchase such preferred securities.

S.F. HOLDING CO., LTD. NOTES TO THE FINANCIAL STATEMENTS FOR THE SIX MONTHS ENDED 30 JUNE 2021 (All amounts in RMB Yuan unless otherwise stated) [English translation for reference only]
307
11 Events after the balance sheet date As of the date when this financial statement was approved for issuance, there are no significant events after the balance sheet date that need to be disclosed.

S.F. HOLDING CO., LTD. NOTES TO THE FINANCIAL STATEMENTS FOR THE SIX MONTHS ENDED 30 JUNE 2021 (All amounts in RMB Yuan unless otherwise stated) [English translation for reference only]
308
12 Operating lease proceeds after the balance sheet date As the lessor, the undiscounted lease proceeds receivable after the balance sheet date are as follows: 31 December 2021
Within 1 year(inclusive) 98,604,940.81 1 to 2 years(inclusive) 64,143,693.55 2 to 3 years(inclusive) 35,798,412.67 3 to 4 years(inclusive) 12,998,878.06 4 to 5 years(inclusive) 1,255,416.21 Over 5 years 43,968.26
212,845,309.56
13 Business combinations
Refer to Note 5(1).
14 Financial instrument and risk The Group’s activities expose it to a variety of financial risks: market risk (primarily including foreign exchange risk, interest rate risk and other price risk), credit risk and liquidity risk. The above financial risks and the Group’s risk management policies to mitigate the risks are as follows: The Board of Directors is responsible for planning and establishing the Group’s risk management framework, formulating the Group’s risk management policies and related guidelines, and supervising the implementation of risk management measures. The Group has established risk management policies to identify and analyse the risks faced by the Group. These risk management policies specify the risks such as market risk, credit risk and liquidity risk management. The Group regularly evaluates the market environment and changes in the Group’s operating activities to determine whether to update the risk management policies and systems or not. The Group’s risk management is carried out by the Risk Management Committee under policies approved by the Board of Directors. The Risk Management Committee encourages the departments of the Group to work closely together to identify, evaluate and avoid relevant risks. The internal audit department of the Group conducts periodical audit to the controls and procedures for risk management and reports the audit results to the Audit Committee of the Group.
(1) Market risk (a) Foreign exchange risk
The Group’s major operational activities are carried out in Mainland China and a majority of the transactions are denominated in RMB. Some operational activities are carried out in regions/countries including Hong Kong, America, Korea and Europe and relevant transactions are settled in HKD, USD, KRW and EUR. The Group is exposed to foreign exchange risk arising from the recognised financial assets and financial liabilities denominated in non-recording currencies, and future transactions denominated in non-recording currencies. Management is responsible for monitoring the amount of financial assets and liabilities, and transactions denominated in non-recording currencies, to reduce foreign exchange risk to the greatest extent. As at 30 June 2021 and 31 December 2020, the Group entered into foreign exchange forward contracts amounting to USD 500 million to hedge foreign exchange risk of long-term debentures of USD 500 million.

S.F. HOLDING CO., LTD. NOTES TO THE FINANCIAL STATEMENTS FOR THE SIX MONTHS ENDED 30 JUNE 2021 (All amounts in RMB Yuan unless otherwise stated) [English translation for reference only]
309
14 Financial instrument and risk (Cont’d) (1) Market risk (Cont’d) (a) Foreign exchange risk (Cont’d)
(i) Foreign exchange risk of companies whose recording currency is RMB
As at 30 June 2021 and 31 December 2020, the Group’s companies whose recording currency is RMB held the financial assets and the financial liabilities denominated in non-recording currencies (mainly USD, HKD and EUR), exclusive of those financial assets and the finaical liabilities raised with internal companies, of which the equivalent amounts in RMB are listed as below: 30 June 2021
USD HKD EUR Total (RMB) (RMB) (RMB) (RMB) Financial assets
denominated in foreign currency
Cash at bank and on hand 96,945,546.51 7,972,236.40 767,311.58 105,685,094.49
Receivables 477,251,558.51 674,439.28 926,133.37 478,852,131.16
574,197,105.02 8,646,675.68 1,693,444.95 584,537,225.65
Financial liabilities
denominated in foreign currency Payables 130,695,245.52 7,828,445.51 6,913,287.41 145,436,978.44
31 December 2020
USD HKD EUR Total (RMB) (RMB) (RMB) (RMB) Financial assets
Cash at bank and on hand 69,954,411.02
9,936,424.14 801,521.75 80,692,356.91
Receivables 65,734,659.60 160,829.79 928,403.58 66,823,892.97
135,689,070.62 10,097,253.93 1,729,925.33 147,516,249.88
Financial liabilities Payables 60,363,380.45 1,890,139.41 3,403,408.44 65,656,928.30

S.F. HOLDING CO., LTD. NOTES TO THE FINANCIAL STATEMENTS FOR THE SIX MONTHS ENDED 30 JUNE 2021 (All amounts in RMB Yuan unless otherwise stated) [English translation for reference only]
310
14 Financial instrument and risk (Cont’d) (1) Market risk (Cont’d) (a) Foreign exchange risk (Cont’d)
(i) Foreign exchange risk of companies whose recording currency is RMB(Cont’d)
In light of that the functional currencies of the subsidiaries within the Group are different, even though the transactions and balances within the Group are offset, foreign exchange risk arising from the use of different functional currencies still exists. As at 30 June 2021, companies whose recording currency is RMB held financial assets and financial liabilities which are due from or to other subsidiaries in the Group and dominated in non-recording currencies (mainly USD and HKD), of which the equivalent amounts in RMB are listed as below:
30 June 2021
USD HKD Total
(RMB) (RMB) (RMB)
Financial assets denominated in foreign
currency
Receivables 10,213,309.76 - 10,213,309.76
Financial liabilities
Payables 88,519,846.16 25,589,611.98 114,109,458.14
As of 31 December 2020, the non-recording currency financial assets and financial liabilities held by companies whose recording currency was RMB that raised within internal companies of the Group were not significant. As at 30 June 2021, If the RMB had strengthened/weakened by 5% against the USD while all other variables had been held constant, the Group’s profit before tax for the year would have been approximately 18,260,000.00 (31 December 2020: approximately RMB 3,766,000.00) lower/higher for various financial assets and liabilities denominated in RMB. The changes in exchange rate of other foreign currencies against RMB have no significant influence on the Group’s operating activities.

S.F. HOLDING CO., LTD. NOTES TO THE FINANCIAL STATEMENTS FOR THE SIX MONTHS ENDED 30 JUNE 2021 (All amounts in RMB Yuan unless otherwise stated) [English translation for reference only]
311
14 Financial instrument and risk (Cont’d) (1) Market risk (Cont’d) (a) Foreign exchange risk (Cont’d)
(ii) Foreign exchange risk of companies whose recording currency is HKD
As at 30 June 2021 and 31 December 2020, those companies operating in Hong Kong with HKD as recording currency held financial assets and liabilities denominated in non-recording currency (mainly USD, RMB, EUR and GBP), of which the equivalent amounts in HKD and RMB are listed as below: 30 June 2021
RMB USD EUR GBP Total Total (HKD) (HKD) (HKD) (HKD) (HKD) (RMB) Financial assets
denominated in foreign currency Cash at bank and on hand 65,885,552.52 269,549,037.00 10,660,263.39 - 346,094,852.91 287,980,406.81 Receivables 110,726,973.23 146,103,654.60 - - 256,830,627.83 213,704,965.74 Investments in other equity
instruments - 2,476,220,924.21 - 33,831,944.97 2,510,052,869.18
2,088,564,791.39
176,612,525.75 2,891,873,615.81 10,660,263.39 33,831,944.97 3,112,978,349.92 2,590,250,163.94
Financial liabilities
denominated in foreign currency
Payables 1,567,569.87 26,906,101.76 37,090,081.76 - 65,563,753.39 54,554,629.21
31 December 2020
RMB USD EUR Total Total (HKD) (HKD) (HKD) (HKD) (RMB) Financial assets
Cash at bank and on hand 19,443,969.60 196,888,978.93 3,276,180.71 219,609,129.24 184,825,054.08 Receivables 2,138,130.11 52,560,416.11 - 54,698,546.22 46,034,797.36 Investments in other equity
instruments - 2,477,430,490.86 - 2,477,430,490.86 2,085,104,598.33
21,582,099.71 2,726,879,885.90 3,276,180.71 2,751,738,166.32 2,315,964,449.77
Financial liabilities
Payables 2,348,815.30 37,444,639.20 38,084,795.88 77,878,250.38 65,543,048.63

S.F. HOLDING CO., LTD. NOTES TO THE FINANCIAL STATEMENTS FOR THE SIX MONTHS ENDED 30 JUNE 2021 (All amounts in RMB Yuan unless otherwise stated) [English translation for reference only]
312
14 Financial instrument and risk (Cont’d) (1) Market risk (Cont’d) (a) Foreign exchange risk (Cont’d)
(ii) Foreign exchange risk of companies whose recording currency is HKD(Cont’d)
As of 30 June 2021 and 31 December 2020, companies whose recording currency is HKD held financial assets and financial liabilities which are due from or to other subsidiaries in the Group and dominated in non-recording currencies (mainly USD and RMB), of which the equivalent amounts in HKD and RMB are listed as below:
30 June 2021
RMB USD Total Total
(HKD) (HKD) (HKD) (RMB)
Financial assets denominated in
foreign currency
Receivables 136,431,355.85 520,658,713.69 657,090,069.54 546,754,925.56
Financial liabilities
Payables 190,139,046.63 9,348,329,234.82 9,538,468,281.45 7,936,818,340.36
31 Deceber 2021
RMB USD 合计 合计
(HKD) (HKD) (港币) (人民币)
Financial assets denominated in
foreign currency
Receivables 278,312,022.66 340,907,453.65 619,219,476.31 521,140,781.27
Financial liabilities
Payables 589,648,223.90 9,332,604,285.73 9,922,252,509.63 8,350,658,567.18
As at 30 June 2021, if the HKD had strengthened/weakened by 0.5% against the USD after considering the impact of movements in exchange rate offset against forward exchange hedging, while all other variables had been held constant, the Group’s profit before tax for the period would have been approximately HKD 22,785,000.00, equivalent to approximately RMB 18,959,000.00 (31 December 2020: approximately HKD 24,517,000.00, equivalent to approximately RMB 20,634,000.00) higher/lower, and other comprehensive income before tax been approximately HKD 12,381,000.00, equivalent to approximately RMB 10,302,000.00 (31 December 2020: approximately HKD 12,387,000.00, equivalent to approximately RMB 10,425,000.00) lower/higher for the above various financial assets and liabilities denominated in USD. As at 30 June 2021, if the HKD had strengthened/weakened by 5% against the RMB while all other variables had been held constant, the Group’s profit before tax for the period would have been approximately HKD 6,067,000.00, equivalent to approximately RMB 5,048,000.00 (31 December 2020: approximately HKD 14,605,000.00, equivalent to approximately RMB 12,292,000.00 higher/lower) lower/higher for the above various financial assets and liabilities denominated in RMB. The changes in exchange rate of other foreign currencies against HKD have no significant influence on the Group’s operating activities.

S.F. HOLDING CO., LTD. NOTES TO THE FINANCIAL STATEMENTS FOR THE SIX MONTHS ENDED 30 JUNE 2021 (All amounts in RMB Yuan unless otherwise stated) [English translation for reference only]
313
14 Financial instrument and risk (Cont’d) (1) Market risk (Cont’d)
(a) Foreign exchange risk (Cont’d)
As of 30 June 2021, except for companies in Hong Kong, other overseas subsidiaries within the Group did not hold significant non-recording currency financial assets and financial liabilities.
(b) Interest rate risk
The Group’s interest rate risk arises from long-term interest bearing debts including long-term bank borrowings and debentures payable. Financial liabilities issued at floating rates expose the Group to cash flow interest rate risk. Financial liabilities issued at fixed rates expose the Group to fair value interest rate risk. The Group determines the relative proportions of its fixed rate and floating rate contracts depending on the prevailing market conditions. As at 30 June 2021, the Group’s long-term interest bearing debts were mainly related to the contracts of floating rate long-term borrowings denominated in RMB and HKD, and fixed rate debentures payable denominated in RMB and USD. Among them, the contract amount of floating rate long-term borrowings denominated in RMB was RMB 1,758,386,807.78 (31 December 2020: RMB 1,865,820,266.05); the contract amount of fixed rate debentures payable denominated in RMB was 1,180,000,000.00 (31 December 2020: RMB 680,000,000.00), and the contract amount of fixed rate debentures payable denominated in USD was USD 1,200,000,000.00, equivalent to RMB 7,752,120,000.00 (31 December 2020: USD 1,200,000,000.00, equivalent to RMB 7,851,480,000.00). The Group continuously monitors the interest rate position of the Group. Increases in interest rates will increase the cost of new interest bearing borrowings and the interest expenses with respect to the Group’s outstanding floating rate borrowings, and therefore could have a material adverse effect on the Group’s financial performance. Management makes adjustments timely with reference to the latest market conditions and may enter into interest rate swap agreements to mitigate its exposure to interest rate risk. As at 30 June 2021, if interest rates on borrowings had risen/fallen by 50 basis points while all other variables had been held constant, the Group’s profit before tax would have decreased/increased by approximately RMB 8,790,000.00 (31 December 2020: RMB 9,310,000.00).
(c) Other price risk
The Group’s other price risk arises mainly from movements in price of various equity instruments measured at fair value that will not be sold within 1 year. As at 30 June 2021, if the price of various investments in equity instruments had risen/fallen by 10% while all other variables had been held constant, the Group’s profit before tax and other comprehensive income before tax would be approximately RMB 84,680,000.00 (31 December 2020: approximately RMB 83,150,000.00) and RMB 445,520,000.00 (31 December 2020: approximately RMB 502,750,000.00) higher/lower respectively.

S.F. HOLDING CO., LTD. NOTES TO THE FINANCIAL STATEMENTS FOR THE SIX MONTHS ENDED 30 JUNE 2021 (All amounts in RMB Yuan unless otherwise stated) [English translation for reference only]
314
14 Financial instrument and risk (Cont’d)
(2) Credit risk The Group’s credit risk mainly arises from cash at bank and on hand, notes receivable, accounts receivable, factoring receivables, loans and advances, other receivables, contract assets, current portion of non-current assets, long-term receivables, investments in debt instruments measured at fair value through profit or loss that are not included in the assessment of impairment, etc. At the balance sheet date, the Group’s maximum exposure to credit risk represents the carrying amount of the Group’s financial assets, except that the maximum exposure to credit risk of long-term receivables represents its undiscounted contractual cash flows. The Group expects that there is no significant credit risk associated with cash at bank and on hand, bank wealth management products measured at amortised cost and placements with and loans to banks and other financial institutions since they are mainly deposits at state-owned banks and other medium or large size listed banks with good reputation and a higher credit rating. The Group does not expect that there will be any significant losses from non-performance by these counterparties. The Group’s notes receivable, accounts receivable, other receivables, contract assets, current portion of non-current assets and long-term receivables include receivables from related parties and receivables from non-related parties. In respect of receivables from related parties, the Group considers that they have low credit risk; in respect of receivables from non-related parties, the Group will develop relevant policies to control the exposure to credit risk. The Group evaluates customers’ credits based on their financial position, possibility of obtaining guarantees from third parties, credit history and such other factors as current market conditions, and determines the length of the credit period based on the evaluation results. The length of the credit period of accounts receivable ranges from 30 days to 90 days. The Group monitors customers’ credit history on a regular basis. In respect of customers with a poor credit history, the Group will use payment reminders, or shorten or cancel credit periods, to ensure the overall credit risk of the Group is limited to a controllable extent. The Group’s notes receivable, accounts receivable and contract assets mainly arise from rendering of express & logistics and supply chain services and other related services or sales of goods, while other receivables, current portion of non-current assets arising from rendering of express & logistics and supply chain services and long-term receivables represent advances, cash on delivery service, deposits and guarantees, and interest-free loans to employees. Management maintains ongoing evaluation on debtors’ financial position, but generally does not require debtors’ mortgage for outstanding debts. The Group monitors and reviews expected credit losses on outstanding amounts on a regular basis, and takes into account important macroeconomic assumptions and parameters in the calculation of expected credit losses, including the risk of economic downturn, external market conditions, changes in customer conditions, gross domestic product and the consumer price index Management makes the provision for bad debts based on the evaluation results thereof. Where it is impossible for the Group to reasonably estimate the recoverable amount, the relevant outstanding amount shall be written off accordingly. Indicators for impossibility to reasonably estimate the recoverable amount include debtors’ failure to make contract payments as planned or make overdue contract payments, significant financial difficulties, bankruptcy liquidation, etc.

S.F. HOLDING CO., LTD. NOTES TO THE FINANCIAL STATEMENTS FOR THE SIX MONTHS ENDED 30 JUNE 2021 (All amounts in RMB Yuan unless otherwise stated) [English translation for reference only]
315
14 Financial instrument and risk (Cont’d) (2) Credit risk (Cont’d)
For factoring receivables and loans and advances, the Group developed credit policies and operational implementation rules in accordance with the requirements of relevant state regulatory authorities, and implemented standardised management over the entire process of credit granting. In addition, the Group further improved the systems for credit risk monitoring and early warning and defective credit extension management. The Group actively responded to the changes in the credit environment, regularly analysed the situation and dynamic of credit risks and took risk control measures on a forward-looking basis. The Group also established an optimisation management mechanism for defective credit and accelerated the optimisation progress of defective credit to avoid non-performing loans. As at 30 June 2021, the Group had no significant collateral or other credit enhancements held as a result of debtor’s mortgage.
(3) Liquidity risk
Cash flow forecasting is performed by each subsidiary of the Group and aggregated by the Group’s finance department in its headquarters. The Group monitors rolling forecasts of the Group's short-term and long-term liquidity requirements to ensure it has sufficient cash and securities that are readily convertible to cash to meet operational needs, while maintaining sufficient headroom on its undrawn committed borrowing facilities from major financial institutions so that the Group does not breach borrowing limits or covenants on any of its borrowing facilities to meet the short-term and long-term liquidity requirements. The financial liabilities of the Group at the balance sheet date are analysed by their maturity date below at their undiscounted contractual cash flows:
30 June 2021
Within 1 year 1 to 2 years 2 to 5 years Over 5 years Total
Deposits from
customers 2,925,182.37 - - - 2,925,182.37
Accounts payable 15,896,242,092.03 - - - 15,896,242,092.03
Other payables 7,581,186,251.15 - - - 7,581,186,251.15
Short-term borrowings 15,237,727,137.00 - - - 15,237,727,137.00
Other current liabilities 2,044,074,379.81 - 2,044,074,379.81 Current portion of
non-current liabilities 8,002,790,951.30 - - - 8,002,790,951.30
Long-term borrowings 71,185,823.65 440,034,330.16 1,412,028,178.18 28,095,294.43 1,951,343,626.42
Debentures payable 310,897,812.50 970,054,826.20 4,147,247,566.35 4,999,338,738.01 10,427,538,943.06
Lease liabilities - 3,729,307,088.76 3,957,507,489.36 900,530,992.27 8,587,345,570.39
49,147,029,629.81 5,139,396,245.12 9,516,783,233.89 5,927,965,024.71 69,731,174,133.53
In addition, on the balance sheet date, the Group has lease contracts that has been signed but not yet executed, which will cause cash outflows. Thus such impact is listed by maturity dates in Note 10(2).

S.F. HOLDING CO., LTD. NOTES TO THE FINANCIAL STATEMENTS FOR THE SIX MONTHS ENDED 30 JUNE 2021 (All amounts in RMB Yuan unless otherwise stated) [English translation for reference only]
316
14 Financial instrument and risk (Cont’d) (3) Liquidity risk (Cont’d)
The financial liabilities of the Group at the balance sheet date are analysed by their maturity date below at their undiscounted contractual cash flows (Cont'd): 31 December 2020
Within 1 year 1 to 2 years 2 to 5 years Over 5 years Total Deposits from
customers 3,654,785.86 - - - 3,654,785.86 Accounts payable 15,484,940,351.95 - - - 15,484,940,351.95 Other payables 7,530,793,784.24 - - - 7,530,793,784.24 Short-term borrowings 8,094,272,062.48 - - - 8,094,272,062.48 Current portion of
non-current liabilities 2,826,483,705.02 - - - 2,826,483,705.02 Long-term borrowings 76,284,318.10 574,531,015.93 1,305,305,241.34 129,527,438.94 2,085,648,014.31 Debentures payable 294,374,475.00 967,689,159.93 3,731,796,741.44 5,110,498,430.45 10,104,358,806.82 Long-term payables - 8,634,317.84 1,592,920.35 204,491.33 10,431,729.52
34,310,803,482.65 1,550,854,493.70 5,038,694,903.13 5,240,230,360.72 46,140,583,240.20
15 Fair value estimates
The level in which fair value measurement is categorised is determined by the level of the fair value hierarchy of the lowest level input that is significant to the entire fair value measurement: Level 1: Quoted prices (unadjusted) in active markets for identical assets or liabilities. Level 2: Inputs other than quoted prices included within Level 1 that are observable for the asset or liability, either directly or indirectly. Level 3: Unobservable inputs for the asset or liability.

S.F. HOLDING CO., LTD. NOTES TO THE FINANCIAL STATEMENTS FOR THE SIX MONTHS ENDED 30 JUNE 2021 (All amounts in RMB Yuan unless otherwise stated) [English translation for reference only]
317
15 Fair value estimates (Cont'd) (1) Financial assets and liabilities measured at fair value on a recurring basis
As at 30 June 2021, the financial assets measured at fair value on a recurring basis by the above three levels were analysed below:
Level 1 Level 2 Level 3 Total
Financial assets held for trading - Structural deposits - - 10,024,343,370.09 10,024,343,370.09 Others 75,403.21 - - 75,403.21
Other non-current financial assets -
Special scheme
equity-class securities - - 390,391,319.74 390,391,319.74 Industry fund investments - - 456,428,950.23 456,428,950.23
Investments in other equity instruments - Equity instruments 395,947,836.92 - 4,059,207,411.86 4,455,155,248.78
Total financial assets 396,023,240.13 - 14,930,371,051.92 15,326,394,292.05
As at 31 December 2020, the financial assets measured at fair value on a recurring basis by the above three levels were analysed below:
Level 1 Level 2 Level 3 Total
Financial assets held for trading - Structural deposits - - 6,276,847,839.67 6,276,847,839.67 Others 74,830.02 - - 74,830.02
Other non-current financial assets -
Special scheme
equity-class securities - - 390,391,319.74 390,391,319.74 Industry fund investments - - 441,134,721.34 441,134,721.34
Investments in other equity instruments - Equity instruments 891,158,779.32 - 4,136,330,274.98 5,027,489,054.30
Total financial assets 891,233,609.34 - 11,244,704,155.73 12,135,937,765.07
As at 30 June 2021, the financial liabilities measured at fair value on a recurring basis by the above
three levels were analysed below::
Level 1 Level 2 Level 3 Total
Derivative financial liabilities- Foreign exchange forward
contract - 23,703,392.07 - 23,703,392.07
As at 31 December 2020, the financial liabilities measured at fair value on a recurring basis by the
above three levels were analysed below::
Level 1 Level 2 Level 3 Total
Derivative financial liabilities- Foreign exchange forward
contract - 22,155,013.53 - 22,155,013.53

S.F. HOLDING CO., LTD. NOTES TO THE FINANCIAL STATEMENTS FOR THE SIX MONTHS ENDED 30 JUNE 2021 (All amounts in RMB Yuan unless otherwise stated) [English translation for reference only]
318
15 Fair value estimates (Cont'd)
(1) Financial assets and liabilities measured at fair value on a recurring basis (Cont’d) The Group takes the date on which events causing the transfers between the levels take place as the timing specific for recognising the transfers. There were no transfers between levels for the current period. The fair value of financial instruments traded in an active market is determined at the quoted market price; and the fair value of those not traded in an active market is determined by the Group using valuation technique. The valuation models used mainly comprise discounted cash flow model and market comparable company model. The inputs of the valuation technique mainly include risk-free interest rate, benchmark rate, exchange rate, credit spread, liquidity premium, EBITDA multiplier, liquidity discount, etc. The changes in Level 3 financial assets are analysed below:
Financial assets held for trading
Other non-current financial assets
Other non-current financial assets
Other equity instruments
- Structural deposits - Special scheme
equity-class securities - Industry fund
investments - Available-for-sale equity instruments
31 December 2020 6,276,847,839.67 390,391,319.74 441,134,721.34 4,136,330,274.98
Increase in the current period 50,185,100,000.00 - 13,942,550.57 -
Decrease in the current period (46,614,182,953.51) - (10,568,692.12) (40,000,000.00)
Gains or losses recognised in profit or loss 176,578,483.93 - 12,193,119.55 - Gains recognised in other comprehensive
income - - - 2,885,035.25 Exchange differences on translation of foreign
currency financial statements - - (272,749.11) (40,007,898.37)
30 June 2021 10,024,343,370.09 390,391,319.74 456,428,950.23 4,059,207,411.86

S.F. HOLDING CO., LTD. NOTES TO THE FINANCIAL STATEMENTS FOR THE SIX MONTHS ENDED 30 JUNE 2021 (All amounts in RMB Yuan unless otherwise stated) [English translation for reference only]
319
15 Fair value estimates (Cont'd) (1) Financial assets and liabilities measured at fair value on a recurring basis (Cont’d)
Financial assets held
for trading Other non-current
financial assets Other non-current
financial assets Other equity instruments
- Structural deposits - Special scheme
equity-class securities - Industry fund
investments - Available-for-sale equity instruments
31 December 2019 2,909,852,581.06 260,424,488.45 218,615,943.17 4,127,308,996.79
Increase in the current period 61,765,000,000.00 - 56,616,465.82 500,000.00
Decrease in the current period (51,432,770,887.14) - - -
Gains or losses recognised in profit or loss 229,159,591.69 - 272,668.05 - Gains recognised in other comprehensive
income - - - (10,728,054.93) Translation of foreign currency financial
statements - - 341,390.36 74,227,041.20
30 June 2020 13,471,241,285.61 260,424,488.45 275,846,467.40 4,191,307,983.06
(2) Financial assets and financial liabilities not measured at fair value but disclosed
The Group’s financial assets and liabilities measured at amortised cost mainly include cash at bank and on hand, bank wealth management products included in other current assets, placements with and loans to banks and other financial institutions, receivables, factoring receivables, loans and advances, current portion of non-current assets, long-term receivables, short-term borrowings, payables, long-term borrowings, debentures payable, current portion of non-current liabilities, other current liabilities and long-term payables.
The carrying amount of the financial assets and liabilities not measured at fair value is a reasonable approximation of their fair value. The fair value of financial assets and financial liabilities over one year is the present value of the contractually determined stream of future cash flows discounted at the rate of interest applied at that time by the market to instruments of comparable credit status and providing substantially the same cash flows on the same terms, and categorised within Level 3 of the fair value hierarchy.

S.F. HOLDING CO., LTD. NOTES TO THE FINANCIAL STATEMENTS FOR THE SIX MONTHS ENDED 30 JUNE 2021 (All amounts in RMB Yuan unless otherwise stated) [English translation for reference only]
320
16 Capital management The Group’s capital management policies aim to safeguard the Group’s ability to continue as a going concern in order to provide returns for shareholders and benefits for other stakeholders, and to maintain an optimal capital structure to reduce the cost of capital. In order to maintain or adjust the capital structure, the Group may adjust the amount of dividends paid to shareholders, refund capital to shareholders, issue new shares or sell assets to reduce debts. The Group’s total capital is calculated as “Equity” as shown in the consolidated balance sheet. The Group is not subject to external mandatory capital requirements. As at 30 June 2021 and 31 December 2020, the Group's gearing ratio was as follows:
30 June 2021 31 December 2020
Gearing ratio 57.04% 48.94%
17 Notes to the Company’s financial statements (1) Cash at bank and on hand
30 June 2021 31 December 2020
Cash at bank 56,435,522.39 58,098,498.15
(2) Other receivables
30 June 2021 31 December 2020
Dividends receivable from Taisen Holdings - 1,500,000,000.00 Funds raised by convertible corporate
debentures granted to subsidiaries 5,454,806,766.73 5,454,806,766.73
Others 6,098,431.27 6,052,075.25
5,460,905,198.00 6,960,858,841.98
Less: Provision for bad debts (231.78) -
5,460,904,966.22 6,960,858,841.98
The ageing of other receivables is analysed as follows:
30 June 2021 31 December 2020
Within 1 year(inclusive) 2,901,731,192.41 4,784,120,657.19
1 to 2 years(inclusive) 2,559,174,005.59 2,176,738,184.79
5,460,905,198.00 6,960,858,841.98

S.F. HOLDING CO., LTD. NOTES TO THE FINANCIAL STATEMENTS FOR THE SIX MONTHS ENDED 30 JUNE 2021 (All amounts in RMB Yuan unless otherwise stated) [English translation for reference only]
321
17 Notes to the Company’s financial statements (Cont’d)
(3) Long-term receivables
30 June 2021 31 December 2020
Funds raised by a non-public offering of
shares granted to subsidiaries - 82,496,567.74
The above funds raised granted to subsidiaries constitute substantially a long-term equity in the net investment in the subsidiaries.
(4) Long-term equity investments
30 June 2021 31 December 2020
Subsidiaries (a) 50,997,087,817.91 50,997,093,513.91
Less: Provision for impairment of long-term equity investments - -
50,997,087,817.91 50,997,093,513.91
There is no significant restriction on sales of the long-term equity investments held by the Company.

S.F. HOLDING CO., LTD. NOTES TO THE FINANCIAL STATEMENTS FOR THE SIX MONTHS ENDED 30 JUNE 2021 (All amounts in RMB Yuan unless otherwise stated) [English translation for reference only]
322
17 Notes to the Company’s financial statements (Cont’d) (4) Long-term equity investments (Cont’d) (a) Subsidiaries
Accounting
method 31 December 2020
Movements in the current
period 30 June 2021 Shareholding
(%) Voting rights
(%)
Explanation of disparity between
percentages of shareholding and
voting rights
Provision for impairment
loss
Cash dividends
declared in the current
period
Taisen Holdings Cost method 50,997,093,513.91 (5,696.00) 50,997,087,817.91 100.00% 100.00% Not applicable - -

S.F. HOLDING CO., LTD. NOTES TO THE FINANCIAL STATEMENTS FOR THE SIX MONTHS ENDED 30 JUNE 2021 (All amounts in RMB Yuan unless otherwise stated) [English translation for reference only]
323
17 Notes to the Company’s financial statements (Cont’d)
(5) Investment income
For the six months ended 30 June
2021 2020
Investment income from financial assets held
for trading 2,664,607.92 39,274,743.44 Investment income from wealth management
products - 5,629,216.85
2,664,607.92 44,903,960.29

S.F. HOLDING CO., LTD.
SUPPLEMENTARY INFORMATION TO THE FINANCIAL STATEMENTS
FOR THE SIX MONTHS ENDED 30 JUNE 2021 (All amounts in RMB Yuan unless otherwise stated) [English translation for reference only]
324
1 Statement of non-recurring profit or loss
For the six months ended 30 June
2021 2020
Investment income from disposal of subsidiaries 942,964,204.15 -
(Losses) /Gains on disposal of other non-current assets (6,632,153.94) 7,613,935.62
Government grants recognised in profit or loss for the current period (government grants recognised in non-operating income, other income and deducted against related cost and expenses) 383,344,061.72 426,807,766.64
Gains/(Losses) arising from changes in fair value of financial assets and liabilities held for trading and investment income/(loss) arising from disposals of financial assets and liabilities held for trading 21,622,194.25 (1,429,156.76)
Income generated where investment cost of enterprises’ acquisition of subsidiaries is less than the share of the fair value of the investee’s identifiable net assets at the time of acquisition of investment 2,375,341.81 -
Reversal of impairment provision for receivables individually assessed for impairment 18,564,776.44 -
Net amount of other non-operating income and expenses (23,918,665.39) (23,668,908.06)
Sub-total 1,338,319,759.04 409,323,637.44
Less: Income tax effect (94,158,037.89) (90,886,652.95) Less: Non-recurring profit or loss attributable
to minority shareholders (7,151,872.09) (1,605,088.81)
Non-recurring profit or loss attributable to shareholders of the parent company 1,237,009,849.06 316,831,895.68
Including: Non-recurring profit or loss from continuing operations 1,237,009,849.06 316,831,895.68
Basis for preparation of statement of non-recurring profit or loss Pursuant to the Explanatory Announcement for Information Disclosure of Companies Offering Securities to the Public No. 1 - Non-recurring Profit or Loss (2008) issued by the China Securities Regulatory Commission, non-recurring profit or loss refers to profit or loss arising from transactions and events those are not directly related to the company’s normal course of business, also from transactions and events those even are related to the company’s normal course of business, but will interfere with the right judgement of users of the financial statements on the company’s operation performance and profitability due to their special nature and occasional occurrence.

S.F. HOLDING CO., LTD.
SUPPLEMENTARY INFORMATION TO THE FINANCIAL STATEMENTS
FOR THE SIX MONTHS ENDED 30 JUNE 2021
(All amounts in RMB Yuan unless otherwise stated) [English translation for reference only]
325
2 Return on net assets and earnings per share
Weighted average return on net asset (%)
Earnings per share
Basic earnings per share Diluted earnings per share
For the six months ended 30
June For the six months ended 30
June For the six months ended 30
June
2021 2020 2021 2020 2021 2020
Net profit attributable to
ordinary shareholders of the Company 1.34% 8.51% 0.17 0.85 0.17 0.85
Net profit attributable to ordinary shareholders of the Company after deducting non-recurring profit or loss
(0.84%) 7.79% (0.10) 0.78 (0.10) 0.78
Including:
- Continuing operations Net profit attributable to
ordinary shareholders of the Company 1.34% 8.51% 0.17 0.85 0.17 0.85
Net profit attributable to ordinary shareholders of the Company after deducting non-recurring profit or loss (0.84%) 7.79% (0.10) 0.78 (0.10) 0.78

S.F. HOLDING CO., LTD.
SUPPLEMENTARY INFORMATION TO THE FINANCIAL STATEMENTS
FOR THE SIX MONTHS ENDED 30 JUNE 2021
(All amounts in RMB Yuan unless otherwise stated) [English translation for reference only]
326