Sex‐linked strategies of human reproductive behavior
13
JOBNAME: 7-34 dlh PAGE: 1 SESS: 3 OUTPUT: Thu Nov 1818:15:181993 /xycomp/ - main - /journals/socbio/springsum/jaffe Sex-linked Strategies of Human Reproductive Behavior Klaus Jaffe, Debora Urribarri, Grace C. Chacon, Gerardo Diaz, Alfredo Torres, ancl Gabriele Herzog Departalllfl1l0 de lJiologia de Organismos. Universidad .'limon Bolivar. Apdo. 89000. Cara- cas 10SO. l'('//cwela; Mcvenea. Ca/'{/eas, VellcZ1Iela; Celltl'o de IlIvestigaciones Politicas, Ca- meas. VeneZ/lela; ,\1ax Plallck Illstit/lt f/ll' Verhaltemforsch/lllg, Seell'iese11, Ger11lany ABSTH,\CT: \Ve present data on fertility characteristícs in the Venezuelan populatíon for each sex separately. aJ10wing a detailed comparative analysis of the variance in fertility between males [111(1 females. \Ve show that the fertility distributíOl1 for both sexes is discontinllOUs, that the average fe¡nale has a Inrger number of offspring per indiYidunl tha'n the average male, allu that highly fertile males oulnumber highly fertile females so that the total number of offspring produced by males and females is balnnced. Hesults indicate that a few males are responsible for n reJa!j\'e higher fertility of the average female ami that interactions between polyandric females with rnonogamic nnd polyg)'nic males are comino!!. Among the Yanomami, ti relatÍ\'ely unac- culturélted hllnter-gatherer-horticulturist tribe, similar differences in fertility distribution of both sexes are apparent. The dala sllggest that hllman populations contain statistically distínct subpopulations, with different reproducti\'e strategies, sllggesting the existence of complex interactiolls aIllong human poplllations which me not evident fron1 the stllcly of individuals 01' groups. Recent studies have shown that many species traditionally thought of as monogamolls in their pairing habits are polygamous in their reprodllctive Itabits, making it necessary to rcstlldy the mating systems and reprocluctive strategies of most specíes (Clutton- Brock, 198?), In aclclition,the sex ratio of most species, even in polygamous ones, is c10se to onc (Fisher, 1930). As fecundily differs markedly between the sexes, oplimaJ reproduction (maximiz- ing direct <lnd inclusive fitness in the long term) varíes oetwcen sexcs, l:md each sex has to use a different repro- ductive stra.legy. A result of such strat- egies can be seen in the presence of síze dimorphism bctween the sexes, i.e., spccies wit\¡ polygynous males produce males which are larger than thcir females (Wilson, 1976). 61 1t is gene rally assumed that Homo sapicns is essentially polygynous, where the varianee in reproductive suc- cess is greater among men than among women (Daly and Wilson, 1983;Chag- non, 1980). The polygynous behavior accordingly explains a slight sex dil11or- phism in human body size (Wilson, 1976; Alexander et al., 1979; Daly and Wilson, 1983; Eibl-Eibesfeldt, 1984). Polygyny is caused by differences in the amount of paren tal investment given by each sex for' the survival of their offspring. Femnles invest more in metabolic costs and in time dedicated to child rearing and thus Can bear tll1d rear a limited number of offspring (Trivers, 1972; Trivers ai1d Willard, 1973; Maynard-Smith, 1976). Extreme polygyny in bumans is Iimited by fe- male behavior. Hidden estrus, cOlitin-
-
Upload
independent -
Category
Documents
-
view
0 -
download
0
Transcript of Sex‐linked strategies of human reproductive behavior

JOBNAME: 7-34 dlh PAGE: 1 SESS: 3 OUTPUT: Thu Nov 1818:15:181993/xycomp/ - main - /journals/socbio/springsum/jaffe
Sex-linked Strategiesof Human Reproductive Behavior
Klaus Jaffe, Debora Urribarri, Grace C. Chacon, Gerardo Diaz,Alfredo Torres, ancl Gabriele Herzog
Departalllfl1l0 de lJiologia de Organismos. Universidad .'limon Bolivar. Apdo. 89000. Caracas 10SO. l'('//cwela; Mcvenea. Ca/'{/eas, VellcZ1Iela; Celltl'o de IlIvestigaciones Politicas, Cameas. VeneZ/lela; ,\1ax Plallck Illstit/lt f/ll' Verhaltemforsch/lllg, Seell'iese11, Ger11lany
ABSTH,\CT: \Ve present data on fertility characteristícs in the Venezuelan populatíon for each sexseparately. aJ10wing a detailed comparative analysis of the variance in fertility between males[111(1 females. \Ve show that the fertility distributíOl1 for both sexes is discontinllOUs, that theaverage fe¡nale has a Inrger number of offspring per indiYidunl tha'n the average male, allu thathighly fertile males oulnumber highly fertile females so that the total number of offspringproduced by males and females is balnnced. Hesults indicate that a few males are responsible forn reJa!j\'e higher fertility of the average female ami that interactions between polyandric femaleswith rnonogamic nnd polyg)'nic males are comino!!. Among the Yanomami, ti relatÍ\'ely unacculturélted hllnter-gatherer-horticulturist tribe, similar differences in fertility distribution of bothsexes are apparent. The dala sllggest that hllman populations contain statistically distínctsubpopulations, with different reproducti\'e strategies, sllggesting the existence of complexinteractiolls aIllong human poplllations which me not evident fron1 the stllcly of individuals 01'
groups.
Recent studies have shown that
many species traditionally thought ofas monogamolls in their pairing habitsare polygamous in their reprodllctiveItabits, making it necessary to rcstlldythe mating systems and reprocluctivestrategies of most specíes (Clutton
Brock, 198?), In aclclition,the sex ratioof most species, even in polygamousones, is c10se to onc (Fisher, 1930). Asfecundily differs markedly between thesexes, oplimaJ reproduction (maximizing direct <lnd inclusive fitness in thelong term) varíes oetwcen sexcs, l:mdeach sex has to use a different reproductive stra.legy. A result of such strategies can be seen in the presence ofsíze dimorphism bctween the sexes,i.e., spccies wit\¡ polygynous malesproduce males which are larger thanthcir females (Wilson, 1976).
61
1t is gene rally assumed that Homosapicns is essentially polygynous,where the varianee in reproductive success is greater among men than amongwomen (Daly and Wilson, 1983;Chagnon, 1980). The polygynous behavioraccordingly explains a slight sex dil11orphism in human body size (Wilson,1976; Alexander et al., 1979; Daly andWilson, 1983; Eibl-Eibesfeldt, 1984).Polygyny is caused by differences inthe amount of paren tal investmentgiven by each sex for' the survival oftheir offspring. Femnles invest more inmetabolic costs and in time dedicated
to child rearing and thus Can bear tll1drear a limited number of offspring(Trivers, 1972; Trivers ai1d Willard,1973; Maynard-Smith, 1976). Extremepolygyny in bumans is Iimited by female behavior. Hidden estrus, cOlitin-

JOBNAME: 7 -34 dlh PAGE: 2 SESS: 3 OUTPUT: Thu Nov 1818:15:18 1993/x)'comr/ -main- /journals/socbío/spríngsum/jaffe
62 Jaffc el al. Social Blology
uous sexual receptivity, and syncl1ronizatiol1 of menstrual cyc\es, and otherfactors, make it difficult for males to
control large harems (Daniels, 1979;Burley, 1979). These facts suggest thatthe optinml reproductive strategy forcach sex ShOllld be different among humans (Daly and WiIson, 1983; Grammer, 1989: Buss, 1989).
Thc existence of clifferent combina
tiol1s of optimal reprodllctive strategiesjmplies that fertility will be distribllteddifferently among individllals 01' eachscx in a given population. Unfortunatel)', fe¡-¡ility data for hllmnn populations, obtainecl through populationCeI1S11S,is availnble on]y for fel118les,ami the few publisbed data availabIe011male fertility (1'01'example, Howell,1979: Chagnon, 1980; Da]y and \Vi]son, 1983: 13rown, 1988; Hewlett,
1988) stem froIn studies conducted011 population isolates and minorities\\hich do not permit the plotting 01'detailed, statistically meaningful, fertilitydistribution cUl·ves. However, all these
stlldies showed a greater variance formale fertility compared to that 1'01'females, althollgh detai]ed ana]ysis ofthe source 01' this greater variability ismissing. On the other hand, data 011femaIe fertility distributions from 13angladesh (13ongaarts and Potter, 1983)and from U.S. cenSllses (David anclS~nderson, 1987) showed c1ear discontinuOlls distriblltions of fertility charactcristics between the populations, indicating complex reproductive patternsin human populations.
We had the opportllnity to partidpate in a survey based onlarge regionalpopulations and to obtain clata on fertility for both males and females,thanks to the inclusion of questions onfcrtility in tlle political polls for the
Venczuelan presidential elections of1988. We studied the Venezuelan vot
ing population (agecl 18 years andover) and estimated direct individualfitness, using the total number of offspring (TO) ever boril for each individual and the number of living offspring(LO) at the moment of the data col
lection. We also studied fertility amongthe Yanomami, a relatively unaccul~turated tribe which inhabit the upperOrinoco River in Venezuela. Yanomami are swidden horticulturists w110
supp]ement their diet with hunting andgathering (Lizot, 1988). These data allowed a comparative analysis of thevariance in fertility, between males andfemales.
MA TERIALS AND METHODS
Data from al1 Yanomami present inthe community wel'e collected throllghinformants and direct conversa tion byanthropologist Gabriele Herzog in1988 at Seroana, Tayariteri, Mahehototeri, Nahetipe, and Tortitha, all ofwhich are located in the Territorio
Federal Amazonas. Only informationabout living children could be obtainedas Yanomami will 110t speak abouttheir dead. Age of subjects \Vas not
possib]e to obtain as Yanomami do notkeep track of their age in number ofyears. In addition, it \Vas not possiblefor LIS to estimate the end of the re
productive life of sllbjects. Thus, allsubjects who were recognized byYanomami as "marriageable" were inc1uded. Results of the 227 individuals
represent the total population at, thattime in the five communities sampled,which in turn have cultural character
istics unique to these commllnities anddifferent from those of other Yano-

JOBNAME: 7 - 34 dlh P AGE: 3 SESS: 5 OUTPUT: Thu Nov 18 19:30:56 1993/xycomp/ - main - /journals/súcbio/springsum/jaffe
Vol. 40, No. 1-2 Reproductive Behavior 63
mami. Thus, statistical analysis ofthese datil is meaningless.
Data frol11 6,500 subjects over 17yearsqf age (including 1,098 femaJesover 40 amI 985 males over 45 years),in 15 urban areas, as representative ofthe total voting population of Venezuela, were collected throllgh the stratifIcd (by geograpbical area, economicstatus, age, and sex, based on the 1981national census) polls prepared bySímevcn, measuring voting in tentions for Carlos Andres Perez and byjvlevenca for other c1ients, as part ofthe presitlentiaI campaign of 1988 inVenezuela. (The reprcsentativcness ofthe sample was sho\Vn a posli?I'iori to beaccurate, with Simeven predicting themain reslllts with an accuracy of 99per cent). The following qllestions",cre given to the subjects (female or
mate) to answer confidenti31ly and indiviclllally: 1. How many living children (legitimate or not) do you have?2. Ho\V many children did you bearduring )'our' life? 3. Age of children?4. Sex and age of informant? AII ínterviews were conducted confidentially,in Spanish, by trained local staff.
Although data collection tbrollghqllestionnaires could seem to be a dubiolls l1lethod for estimating male fertility, this stlldy shows that data provided by males is as reliable as thatprovided by females, which is the standard procedllre for collecting fertilitydata in hllman populations, since bolhsamples reported statisticaJly the sametotal nllmber of children (see results).
Few reliable methods for statistical
analysr.s of mixed samples exist, andamong those, the most simple and reIjable method available is the Bhatta
char)'a plot (Everitt and Hand, 1981;Bhattacharya, 1967), which detects
discontinuities on a normal frequencydistribution through changes in theslope of the distribution curve. Thus,\Ve chose this method to analyze ourdata.
RESUL TS AND DISCUSSION
The fertiJity distríbution among thetotal adult population sampled, for theYanomami as well as for the rest of the
population studied, showed a differentdistribution of fertiJity characteristicsfor males and (emales. In Figure 1wepresent a snapshot of the total adultpopulatiol1. Here, the number of adultindividllals is plotted according to thenllmber of living children they reported (LO). In both samples \Ve findmore childless males compared to females, but females olltnumbered males
in the lo\V fertility categories. Maleshaving very many offspring outnumbered females.
This common pattern atnong totallydifferent cultures seems neither to be
an artifact of the sampling procedurenor a particular characteristic of thesamples, as similar sex-diffel'entiatedfertility distributions were found fol'cllltures which differ in many otheraspects. Among the adult Yanomami,males outnumbered females by a ratio of 1.25. Within a sample of 13Yanomami villages, Chagnon et al.(1979) found a similar average sexratio of 1.29. In contrast, among thepolled population, females outntunbered males by a ratío of 1.05. AIso,higher child mortality among Yanomami, a general featúre of societieslacking modern medieal facilities(Campbell and Wood, 1990) explainstheír compal'atively lower fertílity, asmeasured by LO. In spite of these

JOBNAME: 7 -34 dlh PAGE: 4 SESS: 3 OUTPUT: Thu Nov 18 18:15:18 1993Ixycomp/- main -/journals/socbio/springsum/jaffe
64
1.1
Jaffc ct al. Social Biology
0.8
en
-o:::l 0.7T.I >
.--oc:4-
0.5
o \...
Q).0E0.3
:;¡z
0.1O
Ó
Ferlilily Colegory (LO)
12 14
FIG. 1. -Number of indh'jduals (females in continuous lines; males in discontinuous lines). inIhollsal)ds for the \"oting population (Ihíck lines) and in hundreds for the Yanomami (thin lines).in ench fertility category determined through LO (Iil'e offspring). (Chi-square between the male andfemale fertility distributions: x~ = 164. p < 0.001. df = 20)
dissimilarities, common patterns in thesex-linked fertility distribution between both samples (Le., both cultures) are evident.
Differential fitness for males and fe
males could be estimated by eliminating sL!bjects from the analysis who hadnot completed their reproductive lifespan (only for the polled population).By comparing the age of the last childwith that of the informant, we ca\cu
lated ¡he probability of bearing a childfor subjects over 40 years, which \Vas0.27 for males and 0.07 for females.
Su bjects agecl over 45 years had a probability of child bearing of 0.08 formales and 0.02 for females, and for
subjccts over 50 years of age the prob-
ability was O for females and 0.07 for
males. Accordif!g to these data, \Ve defined the end of the reproductive lifespan at 45 years for males and 40 yearsfor females. We could thus estimate
TO and LO for any individual duringhis 01' her reproductive Iife span withan error smaller than 8 per cent. AIthough an analysisof age cohorts wasnot possible with the data (and thus thecontribution of individuals who died
earlier, was not taken into accounthere), the frequency distributions fremindividuals above 35 01' 55 yearsshowed qualitatively the same resultsas reported here (not showll). Thus,the distribution presented is a reliablerepresentation of a specific character of

JOBNAME: 7-34 dlh PAGE: 5 SESS: 3 OUTPUT: Thu Nov 18 18:15:18 1993/xycomp/ - main - /journals/socbio/springsum/jaffe
Yol. 40, No. 1-2
140
Reproductive llehavior 65
VI-o:J'D 80> ue.- 60
..•... o'-OJLl 40 -E :JZ
20
0-
O
2
4 6
Fertility
8 10 12
Colegory ( LO)
14 16 18 20 >20
[IG. 2. --Number of indiyiduals ([emales in continuous and males in discontinuous lines) perfertility category. l11easured through LO. for subjccts who completed their reproductive years. (Chisquared test between sexes: Xc = 33.1) < 0.05. df = 20)
a given population (Le., distribution ofthe maximal probable individual fitness among the poputation of individuals) ancllhlls serves to analyze fertilityciiffercnces among sexes.
A plot of fertility distributions usingthese data (Fig. 2), showed a cIear sexdifferenliated discontinuous dislribll
(ion, confirming the findings givenabove. Here, the sex difference for
chilcl\ess individuals was greatly redllced, indicating lhat males deJay theiniliation of their reproductive lifelonger than do females. Again, agreater number of females had a highernumber of offspring than males, andonly among.individuals with more than12 children, did males outnumber fe-
males. Integrating the total outpllt ofoffspring (LO) for each sex renderedcomparable nllmbers. That is, in oursample, all the females prodllced a total of 4,661 offspring, whereas ali themales together reported 4,690 children(a difference smaller than 0.62 percent). These results can only be explained if we assume that a relativelysmall nllmber of males (those withmore than 12 children) were responsible for the differential offspring prodllclion between the average femaleand lhe average maleo The equivalencein the total number of offspring prodllced by each sex is even more striking, if \Ve remember that more females
than males were present in the sample

JOBNAME: 7-34 dlh PAGE: 6 SESS: 3 OUTPUT: Thu Nov 18 18:15:181993/xycomp/ - main - /journals/socbio/springsum/jaffe
20 >20181614e 10 12
Category (LO)
4 6
Ferlility
2
66 .Jaffe et al.Social Blology
600 500~ 400
o::J""O.->u 300c:'+-o
\...
200a.> .oE::JZ 100
f'10. 3. - TOlalnumber of li\'ing children (number of individllals) prodllced by females (continllOllslines) and by males (discontinllOlls lines) in each fertility category. who completed their reprodllcti\'eycars (LO x NI' of individuals gi\'en in Fig. 2; ,Y1 = 450. p < 0.001. df = 20)
dlle to differential mortality amongsexcs (se e also CowgilI and Hutchinson. 1963; Teitelbaum, 1972) and thatthe duration of the reproductive lifewas different for each sexo
The formo of the distribution curve is
similar for' both sexes, although thevarious modes do not overIap (Fig. 2);but the variance in fertility differed significantly among the sexes. Variancefor LO of fem<\les was 10.92, whereasthat of males was 15.44 (p < 0.001).Clearly. males may have a higher m3Xil11ulll number of children than females.
The differences in the pattern of thefertility distribution of each sex wereamplified ,in Fig. 3, where the proportional contriblltion of each rertility cat-
egory to the total number of offspringsproduced is shown. Here the principalmodes which have the major impact onpopulation growth are clearly distinguishable, showing one for men with 5children and one for females with 8
children. Again, children produced bymales \Vith ayer 12 children were more
numerous than those produced by theequivalent females ..
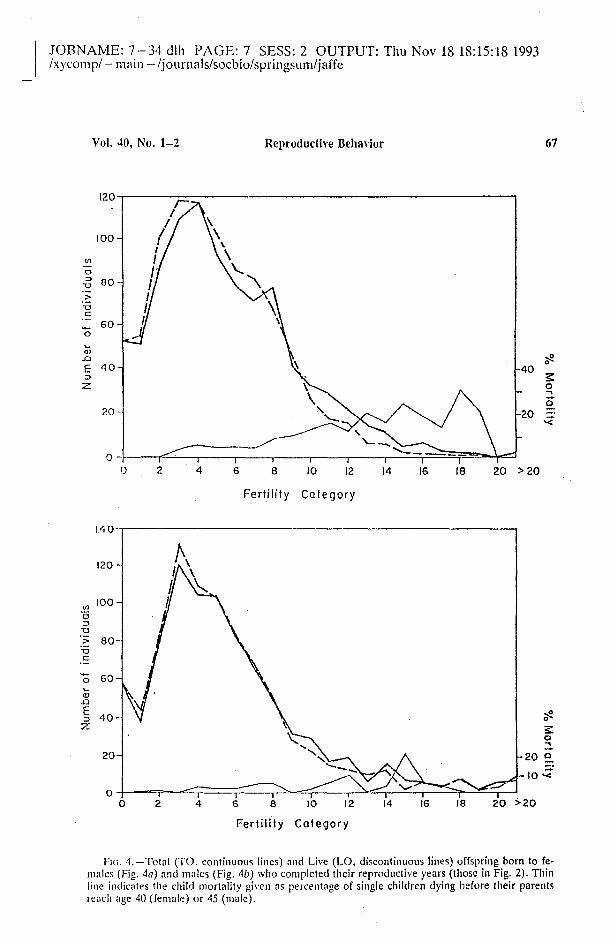
Child l1lorfalil)'. - Data fl'Om thepolIs also permitted estimation of theeffect of child mortality on the fertilitydistribution curves. Although the measure of LO may be overestimated, itindicates trends in child mortality ifcompared to TO. Figure 4 gives thefertility distribution for females andmales respectively, estimated through
JOBNAME: 7-34 dlh PAGE: 7 SESS: 2 OUTPUT: Thu Nov 18 18:15:18 1993/xycomp/ -main - /journaIs/socbio/springsum/jaffe
Vol. 40, No. 1-2
120
100
Ul
o.g 80.:::uc:
.•... 60o'Q).oE::lZ
20
o
Reproductive Behavior 67
40 s:o..,o
20 _'<
o 2 4 6 8 10 12 14 16 18 20 > 20
140
Ferfilify Cofegory
120
Ul 100"O::l.~.:: 80uc:
'O 60•..Q).o~ 40z
20-
oO 2 4 6 8 10 12 14 16 lB 20
20 !:!.
10 .:;
Ferlilily Colegory
FIG. 4. - Total (TO, eontinuous Hnes) and Live (LO, diseontinuous Hnes) offspring born to females (Fig. 4a) and males (Fig. 4b) who eompleted their reproductive years (those in Fig. 2). Thinline indieates the ehild mortality gh'cn as percentage of single children dying befote their parentslcae\¡ age 40 (female) or 45 (malc).

JOBNAME: 7 - 34 cllh P AGE: 8 SESS: 3 OUTPUT: Thu Nov 18 18: 15: 18 1993/xycomp/ - main - /journals/socbio/springsum/jaffe
68 Jnffe et al. Social Diology
1'0 ane! LO, ane! at the same time it
sho\Vs Ihe percentage of children dying .at each fertility category. Clearly, theeffect on the fertility distribution ofchild 11l0rtality is different for men ane!women. Chile! mortality affects the fertility distribution of the female populatíon much more than that of males
(Fig. 4). Women with more childrenreport more clead offspring than lessferti1e \\'omen. That is, the frequencyclistribution curve of LO for [emales isdoser to a Poisson distribution than
that of TO. partly due to the fact thatthe death rate mnong children increased linearly with fertility. [emalesscem to register TO 1110re accuratelythan do males, which could explainthe significantly (p < O.(JOI, Students[-test) higher child mortality dec1areclby [emales, more than twice that givenby males. This sex differenee in the re
porting of deaths validates the use ofLO instead oí TO for inter-sex COI11
parisons of fertility.A11 important factor that might bias
our results could be the fact that males
do no! know or do not recognize alltheir children, Le., they may report alower number of offspring. If so, ourresuIts shoulcl show a smaller number
of total children produced by malesthan that produced by females. To the
cOl~trary, our sample showed thatmales reported on the average aslightly higher number of chilclren thanfemales. The mean number of children
per female was 5.10, whereas that ofmales was S.41 children per individual.This figure may be a close approximation of reality, as surviving males haveto compensate somehow for the COI11paratively greater mortality rate oftheir sexo However, it may also reflectthe fact that males tend to overesti-
mate their numbers of offspring. lndependent evidence suggests that malesoften recognize as their own (consciously or not) children who have adifferent biological father (Wiener,1943; Schacht and Gershowitz, 1963).Contrary to this expectation, our resuIts shO\ved that the female fe rtilitydistribution peaked at a higher fertilitycategory than that of males (Figs. 2 and3), strongly suggesting that the averagefemule in the low-fertility categories(fewer than 12 children) has moremates (in time or space) than the average male, whereas the inverse occursin the high feitility categories (morethan 12 children).
Although fertility data do not characterize reproductive strategies cIirectIy, here t!ley serve to estimate therelative importance of the various re
productive strategies and to describethe sex-clependent variance in reprodllctive success. The data are consis
tent with a population consisting of alarge proportíon of polyandrous females (possibly sequentially and not simultaneously in time) and an averagemonogamic male with so me highly polygy110us males. The polygamous reproductive systems found !lere do notnecessarily correlate with polygamousmarriage syst~ms, although this couldbe checked, for example, by correlating data on fertílity with ínformationon divorce.
Mixed population samples. -Noneof t!le fertility distributions presentedcouid be adjusted to a Poisson distribution (nor any normal distribution:p « 0.001; SPSS's goodness of fittests). 11lUS, a11important point whichemerges frol11 t!lis stucIy is that averagevalues do not accurately reflect thestrllcture of populations. There is more

JOBNAtvlE: 7-34 dlh PAGE: 9 SESS: 3 OUTPUT: Thu Nov 18 18:15:181993/xycomp/ -main - /journals/socbio/springsum/jaffe
Vul. 40, Nu. 1-2 Reproductivc nehavior 69
than one modal point within a populatian. For a finer analysis of human societies. populatiol1s should be studied
as being made up of individuals whouse different noncompatible, but finite, strategies. Thus, techniques forl1lixed samples analysis (Bhattacharya,1967; Everítt and Hand, 1981) are usefui for hUl1lan population studies.
In one sllch approach, two statistically recognizable SUbpoplllations inthe United States have been det1nedas "birth controllers" and "non
controllers" (David and Sanderson,1987). In our study, we recognizé atieast three subpopulations: infertile,wcakly fertile, and highly fcrtile individuals, respectively, although a Dllattachar)'a plot, rebounding the madesof the curve (by plotting the derivativeof the curve, Le., the slope at eachpoin t of the curve), shows the presence
of an even more complex pattern (Fig.5). Here we see that females constitute
four statistically distinct subpopulations which on average have 3.8,6, 7.5,al' ] 2 living children, whereas malesconstitute at least four distinct sllbpoplllations which on average have 2.5,4.5, 8.5, al' over 12 living childrell (Table 1). That is, the fertility of femaleSUbpoplliations does 110t match that ofmales, although the total productiol1 ofchildren is balanced. For the two sub
populatíons with low fertility, femaleshave more children than males, but for
the subpopulations with high fertility.males have more chilclren than fe
males. Thus, non e of the subpopulations are mainly monogamous. For lowfertility, poiyandry seems to prevail; athigh fertility, polygamous males are1110re cOl11l11on.
More individuals were found in the
two low-fertility categories (see Fig. 2),
indicating that most females are morefertile than males and a few males
compensate for tbis fertility differentia!. Although no appropriate data onmale fertility are available for otherpopulations, data exist on female fertility. Fertility data from Bangladeshfemates (Bongaarts and Potter, 1983,Figure 6), if analyzed with a Bhattacharya plot, also show distinct subpoplllations. where two subpopulatiol1s(those with a mean of 4 and 13 children) resemble those of the Venezuetan population with a mean of 3.8 and12 children (Table 1).
Sexual selectioll through fe/1lalechoice. - Independent support to ourt1ndings (Le .• the existence of a highproportion of polyandrous femalesinhuman populations) comes from studies on sexual selection of animal genitalía (Eberhard, 1985). Morphologicalevidence indicates that sexual selection
of genitalía through female choice is atwork in most animal species, includingprimates. That is, Eberhard found thatmale genitalia are subjected to strongel' selection pressures than femalegenitalía, thanks to female choice. Sexual selection of genitalia through female choice will occur (Eberhard,1985) when (1) females normally matewith more than one male, and (2) a single copulation" do es not always result infertilization of the female's entire com
plement of eggs. The latter is certainlytrue for humans (Tietze, 1960), and theformer seems to be confirmed by outstudy.
In addition, data from British fe
males support the hypothesis that females promote sperm competition(Bellis and Baker, 1990), adding to theevidence that females tend to be polyandric.

JOBNAME: 7 -34 dlh PAGE: 10 SESS: 3 OUTPUT: Thu Nov 18 18:15:18 1993/xycomp/ - main - /journals/socbio/springsum/jaffe
70
0.31 ••.°0.2
0.1---
c:~
O
..--0.1+
c:§- -0.2(J1
0-0.3--0.4
-0.5O24
Jnffe ct nI.
6 8 10 12
n (LO)
14. 16
Social Blology
18 20
0.4
0.2~
c:'0.O
'-.-0.1..- +c:
"3 -0.3(J1
O-0.5
-0.7. -0.9
O2
4 6 8 10 12 14 16 18 20
n (LO)
FIG. 5. -Bhattachnrya plot for femnle (Fig. 5a) and male (Fig. 5b) fertility distributions with dntafwm Fig. 2. The abscissa shows the log of the slope at each point of the ctlrve in Fig. 2. The intercept",¡th log O (given in the ordinate as LO) gives the average fertility of each sub-population, whereasIhe angle al Ihe intercept is proportional to the standard deviation (Bha1l3charya 1967).

JOBNAME: 7-34 dlh PAGE: 11 SESS: 3 OUTPUT: Thu Nov 1818:15:18 1993Ixycomp/- main -/journals/socbio/springsum/jaffe
Vol. 40, No. 1-2 Reproducti\'e Behavior
TABLE 1
11
STATISTICS OF TIlE REGRESSIONS USE!) TO CAlCl'lATE TIlE MODES OF TIlE BIlATTACHARYA PLOTS IN
FiGlTRES 5a (FEMAlES). 5b (MALES) AND 6 (FEMALES)
~fodcFigure (Mena Nr Df LO)
rig:. 5a (F) 3.86.07.5
12.0
Fig. 5b (1\'1) 2.5-1.5
8.512.5
.................... 4.0Flg. 6 (F) 13.0
:W.O
r1 dfP
0.912<0.05
0.982< 0.01
0.981< 0.1
0.681> 0.1
0.92
1> 0.10.79
3< 0.050.996
1< 0.0010.81
2< 0.1
0.82
2< 0.10.94
5< 0.0010.98
-1< 0.001
050
~
~000'-... ---1I><l.L.••.....•
-050(9 O-1
-100
o-150
2 4 6 8 10 12 14 16 18 20 22 24
n (LO)
FIG. 6.-Bhattacharya plol for female fertilily dístributioll with data froro Bangladesh (deducedfrorn Bongaarts and Potter 1983). Interprctation of the graph as in Fig. 5.

JOBNAME: 7 -34 dlh PAGE: 12 SESS: 3 OUTPUT: Thu Nov 18 18:15:18 1993/xyeomp/ - main - /journals/soebio/springsum/jaffe
72 Jarfe et al. Social Biology
CONCLUSION
.Our results eontraclict the prevaJentassllmption that humans are sJightJypolygynie and rather suggest tbat amore eompJex pattern exists, where interactions between poJyandric femaleswith monogamic and polygynic malesare eommon.
The anaJysis shows that humanpopulations are a mixture of subpopulations wilh c1ifferent fertiJity charaeteristics and that the fertility charaeteristics are not continuously distributedamong a given populatíon. Indiviclualsseem to eongregate at dísercte fertility"optima." Tbese optima eould beplaeed on a j'-K gradient (Rushlon.1985) where caeh may represent aspeeífie adaptatíon, maximizing e¡lberpopulation growth 01' possibilities ofsUl'vival of a rather limited numbcr
of offspring. The faet that this r- K gradicnt is not eontinuous, as had been
supposed by Rushlon (1985), inclicatesthe existence of a compJex pattern ofadaplive strategies in hUl11an popuJations whieh should be further investi
gated. Eaeh bJend of reproductivestrategies, together witb the specificferlility characteristics of the popuJation, wil! produce a specifie assemblage
of subpopulations based on fertilityeharacteristics which wil! in turn produce specific fertiJity frequency distributions,\vhieh can be charaeterized, as
done here. This method alIows us to
compare populations with differenteultures, deteeting the various statisti
cal subpopulations, estimating theirrelative proportions, and eventuaIlytelling us about the factors which alIowthese subpopulations to segrega te statisticalIy.
It would be of great interest to assess an eventual effect of inereasing industrializatiOI1 (and thus inereased so
phisticatiol1 of Jarger populations) onbasic reproduetive behavior at the pop1I1ution leve\. If the sex-related fertilitydifferences are at least partly biological!y deterl11in~d, similar proportionsof 1110nogamic, polygynic, and polyundric individuals should exist in alI
human poplllations. 1'0 confinn this,we need to co\lect male fertility datathrough nutionwide' surveys worldwide, \vhich will help us to get a deeperinsighl into our reproductive behavior.With this knowJedge \Ve may eventualIy formulate more effective policiesfor popuJation control.
ACKNOWLEDGMENTS
Thanks are due to Carlos Andres Perezfor allowing access to his political machinery during his presidential campaign; to Dr.Richarc1Wall al Cambriclge, UK, for accessto bis Iibrary and for heIpful discussions;and to Drs. I. Eibl-EibesfeIdt, P. Wiessner,M. DaIy, P. E. Howse, and C. Bosql!e rOl'helpful comments on the manuscript.
REFERENCES
ALEXANflER. R. D. 1979. Evollltion and cllltllre.p. 59-70. /11 N. A. Chagnon anu W. 1rons(Cd5.). Evolutionary biology and hllJll3n social bchador. Duxbury Press. North Scituate. ¡'olA.
BELLls. 1'01.A .. and R. R. 8AKER. 1990. Do fe
males promote sperm competition? Data forhuman5. Anim. Beha\'. 40:997-999.
BIIAnACHAR\'A. C. G. 1967. A simple method ofrcsollltion of a distribution ¡nlo Gaussian
components. 8iomelr. 23:115-135.BONG.\ARTS. J .• and R. G. POTTER. 1983. Fertil
ity. biology and behavior. Academic Press,New York.
BROWN, D., ane! D. HOTRA. 1988. Are prescripI¡\,e monogamolls societies effectively mo-

JOBNAME: 7-34 dlh PAGE: 13 SESS: 4 OUTPUT: Thu Nov 18 18:15:18 1993/xycomp/ - main - /journals/socbio/springsum/jaffe
Vol. 40, No, 1-2 Reproductive llehavior 73
nogmnous?, p. 153-159. 11/ L. Betzig, M..BorgerhoffJ\Julder. and P. Turke (eds.), HuIllan reproducth'e behador. Call1bridge Uniwrsity Pre~s, Call1bridge.
BURLEY, N. 1979. The evolution of concealedo\'ulation. Al11er. Nal. 114:835-858.
BIISS, D. 1989. Sex differences in human matepreferences: E,'olutionary hypotlteses testedin 37 cultures. Behav. Brain Sci. 12:1-49.
CA~IPnEU., K. L., anó J. W. WOOD. 1989. Fertility intraditional societies 11/ P. Diggory andS. Teper (eds.), Natural human fertility: Social and biolog.icalmechnnisms. Macll1illan,London. ~
CII.\GNON, N. A. 1980. Kin-selection theorv.
kinship, marriage. alld fitlless among tlíeYanomamo indiano, p. 545-57l. 11/ G. W.Bario\\' and l. Sih'erberg (eds.), Sociology:Beyond naturefnurture? Colorado.
CH,\GNON. N. A .. M. FUNN. and T. J\ln.·\NcoN.
1979. Sex ratio \'ariances among the 'YanOll1ami.indians, p. 308-310. /1/ M. Chagnonanu W. 'Irons (eds.). E\'olutionary biologyand hUl11an social behavior, an anthropological.perspective. Duxbury Press. Mass.
CLUTTEN·BROCK, T,A. 1989. Mamalian matingsystell1s. Proc. Royal Soco London, Biol.236:339-372.
CO\\'GIU., U. M., and G. E. HUTCHINSON. 1963.Differential mortality among the sexes inchildhood and its possible significance in hurnan e\·oIlItion. Proc. Nat. Acad. Sci. 49:425429.
DALY, M., and l\t WILSON. 1983, Sex, e\'olutionand behador. \Vads\Vorth.
DANIElS. D. 1983. The e\'01ut10n of concealed
oVlllation and self-deception. Ethol. Sociobiol. 4:69-87.
DAVID, P. A., and W. C. SANDERSON. 1987. The
emergence of a two-child norm among American birth-controllers. Popul. Devel. Re\'.13:1-4l.
EDERH\RD, W, G. 1985. Sexual selection and an
imal genitalia, Harvard University Press,Cambridge, MA.
EIDL-EIRESFELDT. 1. 1984. Die bíologie desmenschlichen verha!tens. Piper, 1\1unchen.
EVERITT. B. S .. and D. l. R\ND. 1981. Finitemixture -distributions. Chapman and Hall,LOl1(lon.
FISHER, R. A. 1930. The geneticaltheory of natural selection. Clarendon Press, OxforQ.
GRAMMER, K. 1989, Human courtship be ha\'iour: Biological basís and cognitive processing. 111A. Rasa, C. Voget, and E. Voland(eds.), The sociobiology of sexual and reproducti\'e strategíes. Chapman and Hall, NewYork.
HE\VlETT. B. 1988. In L. Betzig, M. BorgerhoffMulder. and P. Turke (eds.), Human reproductive behavior. Cambridge Univ. Press,Call1bridge.
HO\\'ELL N. 1979. Del110graphy of ¡he Dobe!Kullg. Acadel11ic Press, NY.
LIZOT, l, 1988. Los Yanomami, p.479-584. 111
Los aborígenes de Venezuela, Vol. 3. Funclacion La Salle/Monte A\'í1a, Caracas.
1\1,\\'N,\RD-S~lITH. J. 1976. The evotution of sex,
Cambridge Univ. Press, Cambridge, U.K.RUSIlTON, J. P. 1985. Dífferential K theory: The
sociobiology of individual and group differences. Persono Individ. Diff. 6:441.
SCfL\CIIT, L. E .. and H. GERSHO\\'lTZ. 1963. Frequency of extramarital chíldren as determined by btood groups, p, 894-997. Proc.Seco ¡nler. Congo Human gelletics, Vol. 2,Instituto G. Mendel, Rome,
TEITELBAUM,M. S, 1972, Factors associated withthe sex ratio in human populations, p. 91109. 111 G. A. Harrison and A. J. Boyce(eds.), The structure of human poputations.Clarendon Press, Oxford.
TIETZE, C. 1960. Probability ofpregnancy reSulting from a single unprotectecl coitus. Fertil.Steríl. 11 :485.
TRlvERS, R. L. 1972. Parentat investment and
sexual selectioll, p. 136-179. lit B. Campbell(ed.), Sexual selection alld the descent ofman, 1871-1971. Atdine, London.
TRIVERS, R. L., and D. E. WILlARD. 1973. Not
ural selection of paren tal abílíty to vory ¡hesex ratio of offspring. Science 179:90-92.
VINING, D. R. 1986. Social versus reproductivesuccess: The central theoretical problem ofhuman sociobiology. Behav. Brain Sci.9:167-215,
WIENER, T. 1943. Blood groups and transfusion.3rd ed. Thomas, Springfield, IL.
WILSON, E. O. 1976. Sociobiology. BelknapPress, Harvard.