Asia-Pacific -Hotels & Motels MarketLine Industry Profile Hotels & Motels in Asia-Pacific
Upload
khangminh22Category
view
2download
0
Proceedings Book - IX International Tourism Congress (ITC’17), 29-30 November 2017, Peniche, Portugal
241
Setting up operating indicators and ratios for independent hotels
Conceição Gomesa, Luís Lima Santosb, Cátia Malheirosc and Paula Cardosod
a Polytechnic Institute of Leiria, Centre of Tourism Applied Research (CITUR) [email protected]
b Polytechnic Institute of Leiria, Centre of Tourism Applied Research (CITUR)
c Polytechnic Institute of Leiria, Centre of Tourism Applied Research (CITUR) [email protected]
d Polytechnic Institute of Leiria, Centre of Tourism Applied Research (CITUR)
Abstract Hospitality managers need to optimize the decision making process. Therefore, hotel chains use
operating ratios and indicators for their performance evaluation. The Uniform System of Accounts on Lodging Industry (USALI) provides a range of ratios and indicators for all hotel departments in its Part III. However, this information is prepared for hotel chains, given the fact that it is used to support information processing, standardization and comparability.
Some of these ratios and indicators are used, on one hand, by public entities, and, on the other hand, to make comparisons among the hospitality performances of different countries.
The Portuguese corporate structure is composed by micro and small enterprises. This fact has directed us to build a set of suitable ratios and indicators to be used on the management accounting of micro and small independent hotels, since it is possible to adapt USALI to the independent hotels.
The research analyses the importance and the adaptability of USALI indicators and ratios in independent hotels. To accomplish the aim and objectives, the Portuguese case was analysed by conducting a survey to obtain data, which has then been submitted to a statistical analysis. The questionnaire was applied to hotels in the Leiria and Western regions (95 hotels) of the country. The sample was defined considering a percentage of independent hotels.
It was concluded that, regarding operating indicators and ratios, the most frequently used per independent hotels are: room occupancy percentage, average daily rate (ADR), revenue per available room (RevPAR) and average occupancy per room. According to the findings, a tableau de bord was created, to be used by small and micro independent hotels. Keywords: USALI; independent hotels; lodging industry; ratios and indicators
1. Introduction The lodging industry is a crucial contributor to Portuguese global tourism revenues. Similarly to
other European countries, Portugal has many small independent hotels that have to compete in a global scale. In order to obtain success, hospitality managers need to optimize the decision making process. To this aim, management accounting provides useful information.
In order to evaluate the performance of a company, ratios and indicators can be used. There are several kinds of ratios: financial and operating. Financial ratios can be used by all businesses, while operating ratios are specific to a particular industry. This study is about independent hotels and it was focused on operating indicators, which concern only the lodging industry. The hotel industry has got peculiarities that make the use of operating ratios as essential.
There are several operating ratios and miscellaneous formulas. It is possible to find a different formula, according to each author, which complicates the comparison of hotels among them, because there is not any standardization. A synthesis of operating ratios was elaborated through the literature, in order to determine the most used ones and their method of calculation. The USALI allows uniformity at the level of large hotels, which can also be used in relation to small and medium hotels. It would be
Proceedings Book - IX International Tourism Congress (ITC’17), 29-30 November 2017, Peniche, Portugal
242
convenient to resume the information in a tableau de bord, so that small hotels would know what to use in order to compare their information with other hotels and the industry average.
In the lodging industry some operating indicators and ratios are commonly used, namely occupancy rate, ADR and RevPAR. However, there are many other operating indicators and ratios that can be useful to measure the performance through management accounting, either in the rooms department or in the F&B department.
This research focuses on the use and importance of operating ratios in Portugal. Thus, the aim of this study is to identify the ratios and indicators that are being used and their importance for the small independent hospitality units.
This article is structured as follows: first, there is a literature review about the operating ratios and indicators. Then, the methodology used on the research is described. The last part is dedicated to a detailed analysis of research findings, the preparation of the tableau de bord and conclusions.
2. Literature review The travel and tourism industry is an important sector for the Portuguese economy. Indeed, in
2016, it represents a direct contribution of 6.4% for the Gross Domestic Product (GDP) and a direct contribution of 8.1% for employment. However, as the tourism activity is multidisciplinary, its contribution goes beyond the direct effect and, if we look at the statistics, we find a total contribution of 16.6% for the GDP and a total contribution of 16.9% for employment (WTTC, 2016).
In Portugal, without considering guest houses and rural tourism establishments, 74% of the tourist lodging facilities are hotels and the 4-star hotels (34%) are the majority of this supply (INE, 2016). As the other European countries, the Portuguese hospitality sector is composed by a majority of small independent hotels. In fact, 94% of the lodging enterprises have less than 10 employees (INE, 2017). On the other hand, the hospitality chains represent an important part of the supply: Pestana and Vila Galé are Portuguese and the two biggest in terms of supply, followed by Accor Group, Tivoli and Marriott. Regarding the performance of the sector, the occupancy rate of bed reaches 50.2% in 2016 with a 2 823 619 € total revenue and a Revpar of 44.60 €.
Hospitality managers use financial indicators more frequently (Atkinson & Brander-Brown, 2000 and Haktanir & Harris, 2005, cited by Melia & Robinson, 2010) but, in their study, Sainaghi et al. (2013) conclude that it is necessary to use both kind of ratios: financial and non-financial. This need is more important when the hotel does not belong to a chain; in fact, those are more able to reach higher profitability efficiency (Chiu & Huang, 2011).
In an increasingly competitive environment, each company inserted in the hotel industry needs to constantly evaluate its performance, transversely to the organization. In this sense, the performance evaluation based on operating ratios appears to be a useful tool for day-to-day operation of companies seeking success and future expansion. Schmidgall (2011) refers that operations ratios aid hotel managers in evaluating the operating activities of a hotel.
Anderson et al. (1999) state that managers have been using performance indicators with the objective of attaining efficiency, like average occupancy rates and average room rates. Other indicators are revenue/wage cost, gross profit/revenue, net profit/revenue, according to Baker and Riley (1994) cited by Anderson et. al. (1999). Wijeysinghe (1993) cited by Anderson et al. (1999) and Chen (2009) refer breakeven room occupancy, highlighting that the indicator is accurate in its results. Kimes (1989), cited by Anderson et al. (1999), introduces a basic concept, Perishable Asset Revenue Management (PARM), which has the aim of finding out an optimal point between average daily rates and occupancy rates. Wassenaar and Stafford (1991), cited by Anderson et al. (1999), recommend a lodging index - average revenue per room (vacant or occupied).
Similarly, Chin and Barney (1995) refer some of the indicators that should be used by hotels for a best performance: room or bed occupancy, average room rate, revenue per available room, sales per employee hour worked, average spend per head and seat turnover.
More specifically, the most commonly used ratios in the studies of the operating performance of hotels are occupancy rate, ADR and RevPAR (Tuţă and Micu, 2013; Sainaghi et al., 2013; Hua et al., 2015; Lamelas & Filipe, 2012; O´Neill & Carlback, 2011; Phillips, 1996; Chin & Barney, 1995).
In their literature review, Sainaghi et al. (2013) also mentioned the total revenue per available room (TrevPar) and the gross operating profit per available room (GOPPAR).
Proceedings Book - IX International Tourism Congress (ITC’17), 29-30 November 2017, Peniche, Portugal
243
In a study dedicated to the clubing industry, Schmidgall & DeFranco (2004) identified three operating ratios considered important and adopted by the inquired (controllers and financial officers): payroll, food and beverage cost percentages. These three ratios are also used in hotel industry in the F&B department. It seems clear that the type of activity influences the results. According to Bhamornsathit & Katawandee (2016), occupancy rate, ADR and RevPAR are the most common ratios. Related with costs, the food cost percentage, beverage cost percentage and labor cost percentage are the most used ratios.
The F&B department is frequently considered less profitable than rooms department (Moser, 2002). In fact, the weight of contribution margins is lower and most of the costs are variable. Thus, these kind of operations requires a closed control to reduce wastage, to make good pricing, to buy at the right price and quality, in order to obtain a higher profit (Louise, 2004).
Food, beverage and labor costs are the most regularly used by hospitality and restaurant managers (Miller et al., 2002; Dittmer, 2003), but there are other relevant ratios and indicators that can be very useful to improve the operating result, such as seat turnover, average check (average meal price) and techniques like menu analysis (for example, menu engineering, that uses contribution margin and sales percentages of each menu item) (Jagels & Coltman, 2004). Besides these, there are other lesser-known and underused, like RevPASH (Otto, 2012; Louise, 2004).
The use of ratios is imperative to measure the performance of hotels. Nevertheless, there are some principles that have to be assumed: ratios have to be carefully chosen; managers have to understand what kind of number originated the ratios; they have to allow corrective actions; they have to be periodically analysed (Schmidgall & DeFranco, 2004).
At this moment, the Uniform System of Accounts for the Lodging Industry (USALI) has reached the 11th edition. In its Part III it provides several financial ratios and operating metrics. It is not a complete list, but even so it is the most widespread. The objective of USALI is to provide a uniform list and a definition of ratios and metrics (HANYC, 2014). Moreover, according to HANYC (2014), ratios and metrics are a way to simplify the huge statement and schedule’s data.
There is a huge number of ratios useful in analysis (Schmidgall, 2011; HANYC, 2014). Schmidgall (1989) cited by Schmidgall (2011) conducted a research with the objective of getting ratios to be more useful for hotel general managers.
As this paper is the first step to a wider research, and as there are not many studies in this area, particularly about small independent hotels, it was necessary to identify all the operating ratios and indicators that are being referred to in the literature review. The operating ratios considered as the most useful were divided into three categories: rooms, F&B and all operating departments.
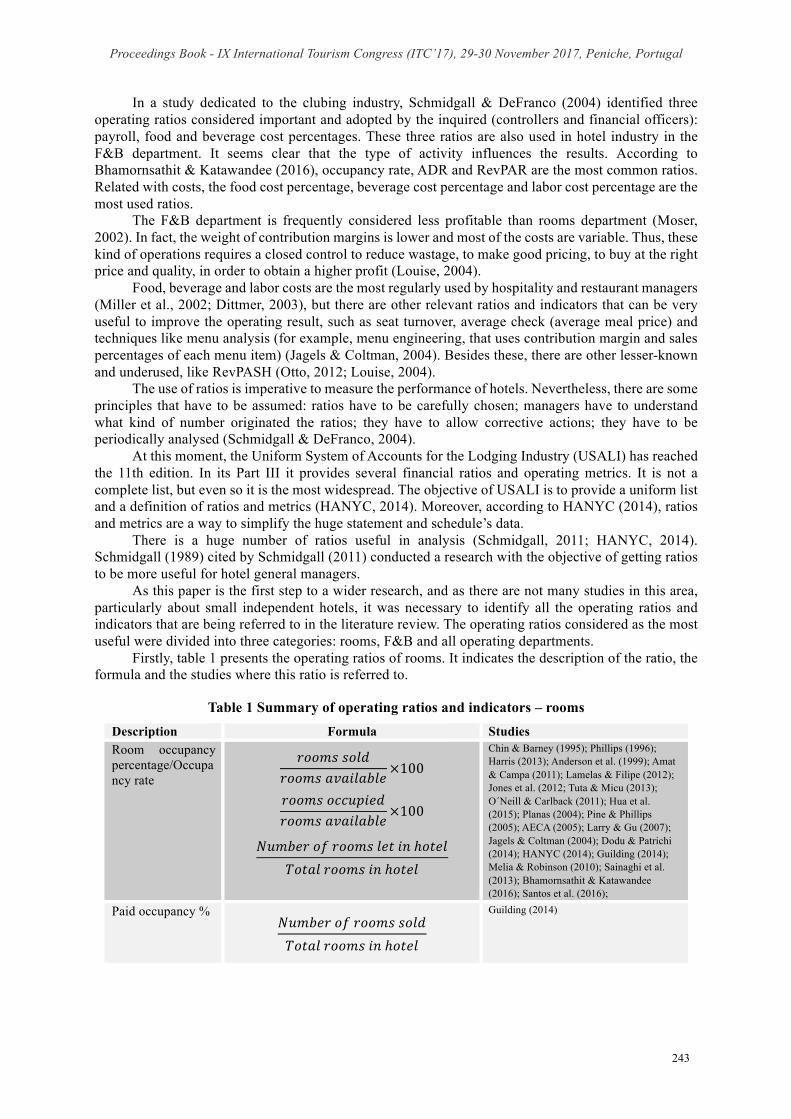
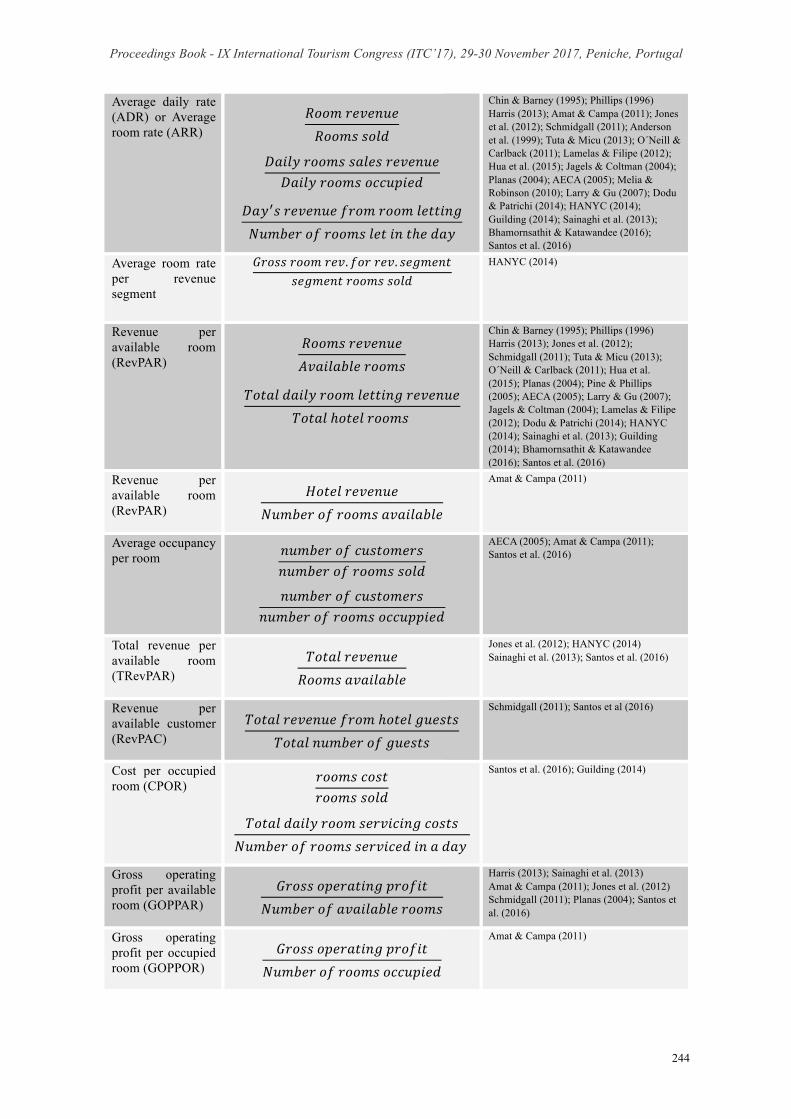
Firstly, table 1 presents the operating ratios of rooms. It indicates the description of the ratio, the formula and the studies where this ratio is referred to.
Table 1 Summary of operating ratios and indicators – rooms Description Formula Studies Room occupancy percentage/Occupancy rate
𝑟𝑜𝑜𝑚𝑠𝑠𝑜𝑙𝑑𝑟𝑜𝑜𝑚𝑠𝑎𝑣𝑎𝑖𝑙𝑎𝑏𝑙𝑒
×100
𝑟𝑜𝑜𝑚𝑠𝑜𝑐𝑐𝑢𝑝𝑖𝑒𝑑𝑟𝑜𝑜𝑚𝑠𝑎𝑣𝑎𝑖𝑙𝑎𝑏𝑙𝑒
×100
𝑁𝑢𝑚𝑏𝑒𝑟𝑜𝑓𝑟𝑜𝑜𝑚𝑠𝑙𝑒𝑡𝑖𝑛ℎ𝑜𝑡𝑒𝑙𝑇𝑜𝑡𝑎𝑙𝑟𝑜𝑜𝑚𝑠𝑖𝑛ℎ𝑜𝑡𝑒𝑙
Chin & Barney (1995); Phillips (1996); Harris (2013); Anderson et al. (1999); Amat & Campa (2011); Lamelas & Filipe (2012); Jones et al. (2012; Tuta & Micu (2013); O´Neill & Carlback (2011); Hua et al. (2015); Planas (2004); Pine & Phillips (2005); AECA (2005); Larry & Gu (2007); Jagels & Coltman (2004); Dodu & Patrichi (2014); HANYC (2014); Guilding (2014); Melia & Robinson (2010); Sainaghi et al. (2013); Bhamornsathit & Katawandee (2016); Santos et al. (2016);
Paid occupancy % 𝑁𝑢𝑚𝑏𝑒𝑟𝑜𝑓𝑟𝑜𝑜𝑚𝑠𝑠𝑜𝑙𝑑𝑇𝑜𝑡𝑎𝑙𝑟𝑜𝑜𝑚𝑠𝑖𝑛ℎ𝑜𝑡𝑒𝑙
Guilding (2014)
Proceedings Book - IX International Tourism Congress (ITC’17), 29-30 November 2017, Peniche, Portugal
244
Average daily rate (ADR) or Average room rate (ARR)
𝑅𝑜𝑜𝑚𝑟𝑒𝑣𝑒𝑛𝑢𝑒𝑅𝑜𝑜𝑚𝑠𝑠𝑜𝑙𝑑
𝐷𝑎𝑖𝑙𝑦𝑟𝑜𝑜𝑚𝑠𝑠𝑎𝑙𝑒𝑠𝑟𝑒𝑣𝑒𝑛𝑢𝑒𝐷𝑎𝑖𝑙𝑦𝑟𝑜𝑜𝑚𝑠𝑜𝑐𝑐𝑢𝑝𝑖𝑒𝑑
𝐷𝑎𝑦<𝑠𝑟𝑒𝑣𝑒𝑛𝑢𝑒𝑓𝑟𝑜𝑚𝑟𝑜𝑜𝑚𝑙𝑒𝑡𝑡𝑖𝑛𝑔𝑁𝑢𝑚𝑏𝑒𝑟𝑜𝑓𝑟𝑜𝑜𝑚𝑠𝑙𝑒𝑡𝑖𝑛𝑡ℎ𝑒𝑑𝑎𝑦
Chin & Barney (1995); Phillips (1996) Harris (2013); Amat & Campa (2011); Jones et al. (2012); Schmidgall (2011); Anderson et al. (1999); Tuta & Micu (2013); O´Neill & Carlback (2011); Lamelas & Filipe (2012); Hua et al. (2015); Jagels & Coltman (2004); Planas (2004); AECA (2005); Melia & Robinson (2010); Larry & Gu (2007); Dodu & Patrichi (2014); HANYC (2014); Guilding (2014); Sainaghi et al. (2013); Bhamornsathit & Katawandee (2016); Santos et al. (2016)
Average room rate per revenue segment
𝐺𝑟𝑜𝑠𝑠𝑟𝑜𝑜𝑚𝑟𝑒𝑣. 𝑓𝑜𝑟𝑟𝑒𝑣. 𝑠𝑒𝑔𝑚𝑒𝑛𝑡𝑠𝑒𝑔𝑚𝑒𝑛𝑡𝑟𝑜𝑜𝑚𝑠𝑠𝑜𝑙𝑑
HANYC (2014)
Revenue per available room (RevPAR)
𝑅𝑜𝑜𝑚𝑠𝑟𝑒𝑣𝑒𝑛𝑢𝑒𝐴𝑣𝑎𝑖𝑙𝑎𝑏𝑙𝑒𝑟𝑜𝑜𝑚𝑠
𝑇𝑜𝑡𝑎𝑙𝑑𝑎𝑖𝑙𝑦𝑟𝑜𝑜𝑚𝑙𝑒𝑡𝑡𝑖𝑛𝑔𝑟𝑒𝑣𝑒𝑛𝑢𝑒𝑇𝑜𝑡𝑎𝑙ℎ𝑜𝑡𝑒𝑙𝑟𝑜𝑜𝑚𝑠
Chin & Barney (1995); Phillips (1996) Harris (2013); Jones et al. (2012); Schmidgall (2011); Tuta & Micu (2013); O´Neill & Carlback (2011); Hua et al. (2015); Planas (2004); Pine & Phillips (2005); AECA (2005); Larry & Gu (2007); Jagels & Coltman (2004); Lamelas & Filipe (2012); Dodu & Patrichi (2014); HANYC (2014); Sainaghi et al. (2013); Guilding (2014); Bhamornsathit & Katawandee (2016); Santos et al. (2016)
Revenue per available room (RevPAR)
𝐻𝑜𝑡𝑒𝑙𝑟𝑒𝑣𝑒𝑛𝑢𝑒𝑁𝑢𝑚𝑏𝑒𝑟𝑜𝑓𝑟𝑜𝑜𝑚𝑠𝑎𝑣𝑎𝑖𝑙𝑎𝑏𝑙𝑒
Amat & Campa (2011)
Average occupancy per room 𝑛𝑢𝑚𝑏𝑒𝑟𝑜𝑓𝑐𝑢𝑠𝑡𝑜𝑚𝑒𝑟𝑠
𝑛𝑢𝑚𝑏𝑒𝑟𝑜𝑓𝑟𝑜𝑜𝑚𝑠𝑠𝑜𝑙𝑑
𝑛𝑢𝑚𝑏𝑒𝑟𝑜𝑓𝑐𝑢𝑠𝑡𝑜𝑚𝑒𝑟𝑠𝑛𝑢𝑚𝑏𝑒𝑟𝑜𝑓𝑟𝑜𝑜𝑚𝑠𝑜𝑐𝑐𝑢𝑝𝑝𝑖𝑒𝑑
AECA (2005); Amat & Campa (2011); Santos et al. (2016)
Total revenue per available room (TRevPAR)
𝑇𝑜𝑡𝑎𝑙𝑟𝑒𝑣𝑒𝑛𝑢𝑒𝑅𝑜𝑜𝑚𝑠𝑎𝑣𝑎𝑖𝑙𝑎𝑏𝑙𝑒
Jones et al. (2012); HANYC (2014) Sainaghi et al. (2013); Santos et al. (2016)
Revenue per available customer (RevPAC)
𝑇𝑜𝑡𝑎𝑙𝑟𝑒𝑣𝑒𝑛𝑢𝑒𝑓𝑟𝑜𝑚ℎ𝑜𝑡𝑒𝑙𝑔𝑢𝑒𝑠𝑡𝑠𝑇𝑜𝑡𝑎𝑙𝑛𝑢𝑚𝑏𝑒𝑟𝑜𝑓𝑔𝑢𝑒𝑠𝑡𝑠
Schmidgall (2011); Santos et al (2016)
Cost per occupied room (CPOR)
𝑟𝑜𝑜𝑚𝑠𝑐𝑜𝑠𝑡𝑟𝑜𝑜𝑚𝑠𝑠𝑜𝑙𝑑
𝑇𝑜𝑡𝑎𝑙𝑑𝑎𝑖𝑙𝑦𝑟𝑜𝑜𝑚𝑠𝑒𝑟𝑣𝑖𝑐𝑖𝑛𝑔𝑐𝑜𝑠𝑡𝑠𝑁𝑢𝑚𝑏𝑒𝑟𝑜𝑓𝑟𝑜𝑜𝑚𝑠𝑠𝑒𝑟𝑣𝑖𝑐𝑒𝑑𝑖𝑛𝑎𝑑𝑎𝑦
Santos et al. (2016); Guilding (2014)
Gross operating profit per available room (GOPPAR)
𝐺𝑟𝑜𝑠𝑠𝑜𝑝𝑒𝑟𝑎𝑡𝑖𝑛𝑔𝑝𝑟𝑜𝑓𝑖𝑡𝑁𝑢𝑚𝑏𝑒𝑟𝑜𝑓𝑎𝑣𝑎𝑖𝑙𝑎𝑏𝑙𝑒𝑟𝑜𝑜𝑚𝑠
Harris (2013); Sainaghi et al. (2013) Amat & Campa (2011); Jones et al. (2012) Schmidgall (2011); Planas (2004); Santos et al. (2016)
Gross operating profit per occupied room (GOPPOR)
𝐺𝑟𝑜𝑠𝑠𝑜𝑝𝑒𝑟𝑎𝑡𝑖𝑛𝑔𝑝𝑟𝑜𝑓𝑖𝑡𝑁𝑢𝑚𝑏𝑒𝑟𝑜𝑓𝑟𝑜𝑜𝑚𝑠𝑜𝑐𝑐𝑢𝑝𝑖𝑒𝑑
Amat & Campa (2011)
Proceedings Book - IX International Tourism Congress (ITC’17), 29-30 November 2017, Peniche, Portugal
245
Yield percentage/room yield
𝑅𝑜𝑜𝑚𝑟𝑒𝑣𝑒𝑛𝑢𝑒𝑀𝑎𝑥𝑖𝑚𝑢𝑚𝑝𝑜𝑡𝑒𝑛𝑡𝑖𝑎𝑙𝑟𝑜𝑜𝑚𝑟𝑒𝑣𝑒𝑛𝑢𝑒
Harris (2013); Jones et al. (2012); Guilding (2014)
Cost per available room (CostPAR) 𝑅𝑜𝑜𝑚𝑒𝑥𝑝𝑒𝑛𝑠𝑒𝑠
𝑁𝑢𝑚𝑏𝑒𝑟𝑜𝑓𝑟𝑜𝑜𝑚𝑠𝑎𝑣𝑎𝑖𝑙𝑎𝑏𝑙𝑒
Harris (2013)
Number of rooms serviced per employee
𝑁𝑢𝑚𝑏𝑒𝑟𝑜𝑓𝑟𝑜𝑜𝑚𝑠𝑠𝑒𝑟𝑣𝑖𝑐𝑒𝑑𝑁𝑢𝑚𝑏𝑒𝑟𝑜𝑓𝑒𝑚𝑝𝑙𝑜𝑦𝑒𝑒𝑠
Harris (2013)
GOP per employee 𝐺𝑂𝑃𝑁𝑢𝑚𝑏𝑒𝑟𝑜𝑓𝑒𝑚𝑝𝑙𝑜𝑦𝑒𝑒𝑠
Planas (2004)
Revenue per occupied room (RevPOR)
𝐻𝑜𝑡𝑒𝑙𝑟𝑒𝑣𝑒𝑛𝑢𝑒𝑁𝑢𝑚𝑏𝑒𝑟𝑜𝑓𝑟𝑜𝑜𝑚𝑠𝑜𝑐𝑐𝑢𝑝𝑖𝑒𝑑
AECA (2005); Amat & Campa (2011); Schmidgall (2011)*
Complimentary occupancy 𝐶𝑜𝑚𝑝𝑙𝑖𝑚𝑒𝑛𝑡𝑎𝑟𝑦𝑟𝑜𝑜𝑚𝑠𝑜𝑐𝑐𝑢𝑝𝑖𝑒𝑑
𝑅𝑜𝑜𝑚𝑠𝑎𝑣𝑎𝑖𝑙𝑎𝑏𝑙𝑒
Schmidgall (2011); Guilding (2014); HANYC (2014)
Multiple occupancy/Double occupancy
𝑅𝑜𝑜𝑚𝑠𝑜𝑐𝑐. 𝑏𝑦𝑡𝑤𝑜𝑜𝑟𝑚𝑜𝑟𝑒𝑝𝑒𝑜𝑝𝑙𝑒𝑅𝑜𝑜𝑚𝑠𝑜𝑐𝑐. 𝑏𝑦𝑔𝑢𝑒𝑠𝑡𝑠
Schmidgall (2011); Jagels & Coltman (2004); AECA (2005); Harris (2013); Jones et al. (2012); Santos et al. (2016)
Employees per available room 𝑁𝑢𝑚𝑏𝑒𝑟𝑜𝑓𝑒𝑚𝑝𝑙𝑜𝑦𝑒𝑒𝑠
𝑅𝑜𝑜𝑚𝑠𝑎𝑣𝑎𝑖𝑙𝑎𝑏𝑙𝑒
Planas (2004); AECA (2005)
Average length of stay 𝑅𝑜𝑜𝑚𝑠𝑜𝑐𝑐𝑢𝑝𝑖𝑒𝑑
𝐴𝑟𝑟𝑖𝑣𝑎𝑙𝑠
AECA (2005); HANYC (2014)
Source: prepared by authors
Table 1 allows us to see that there are several ways to calculate ratios. If the aim is to standardize, the same calculation will be necessary among hoteliers. Sometimes different variables are used to calculate the same ratio. For example, regarding occupation ratio, some authors use occupied rooms while others use rooms sold. Occupied rooms are different from rooms sold, because a room can be occupied but not be sold, like complimentary rooms. According to Bhamornsathit & Katawandee (2016), ADR is typically different, because it depends on the room type, market segment and seasonality. Nonetheless, it is considered as a critical indicator of operations. Even if the country does not have a database in relation to hotel operating ratios, there are advantages to compare the ratios over a period of time for the same hotel.
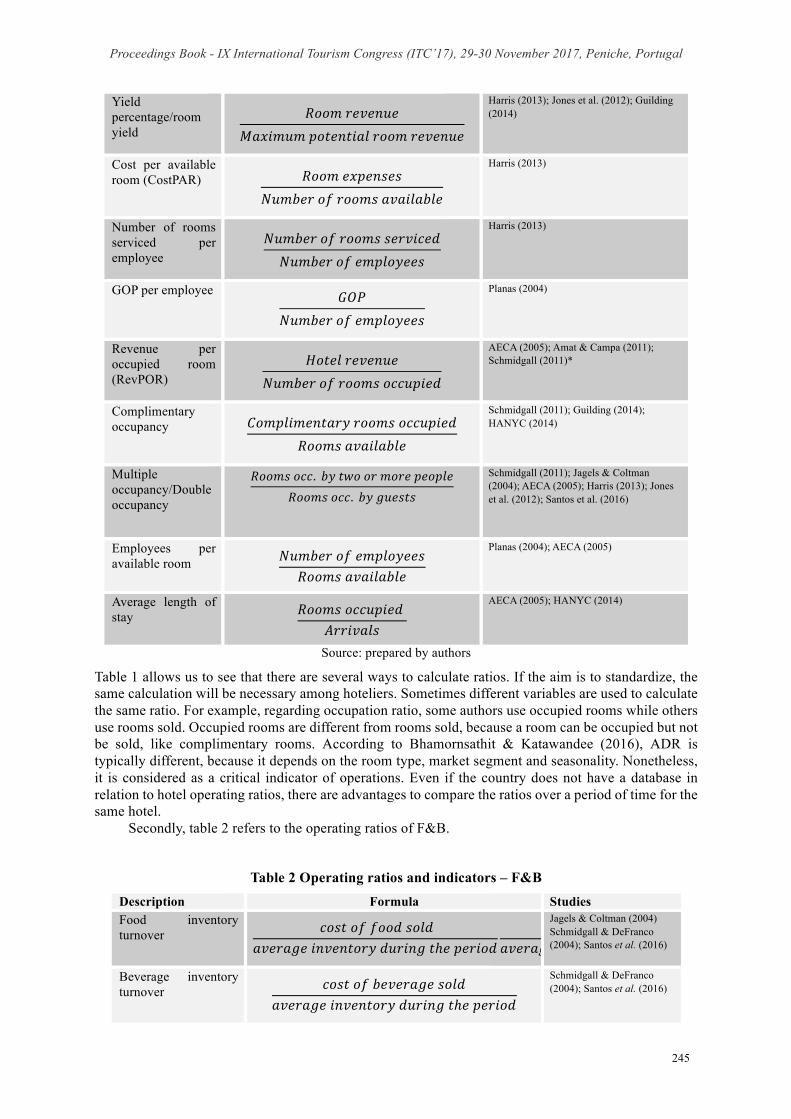
Secondly, table 2 refers to the operating ratios of F&B.
Table 2 Operating ratios and indicators – F&B Description Formula Studies Food inventory turnover 𝑐𝑜𝑠𝑡𝑜𝑓𝑓𝑜𝑜𝑑𝑠𝑜𝑙𝑑
𝑎𝑣𝑒𝑟𝑎𝑔𝑒𝑖𝑛𝑣𝑒𝑛𝑡𝑜𝑟𝑦𝑑𝑢𝑟𝑖𝑛𝑔𝑡ℎ𝑒𝑝𝑒𝑟𝑖𝑜𝑑𝑐𝑜𝑠𝑡𝑜𝑓𝑓𝑜𝑜𝑑𝑢𝑠𝑒𝑑
𝑎𝑣𝑒𝑟𝑎𝑔𝑒𝑖𝑛𝑣𝑒𝑛𝑡𝑜𝑟𝑦𝑑𝑢𝑟𝑖𝑛𝑔𝑡ℎ𝑒𝑝𝑒𝑟𝑖𝑜𝑑
Jagels & Coltman (2004) Schmidgall & DeFranco (2004); Santos et al. (2016)
Beverage inventory turnover 𝑐𝑜𝑠𝑡𝑜𝑓𝑏𝑒𝑣𝑒𝑟𝑎𝑔𝑒𝑠𝑜𝑙𝑑
𝑎𝑣𝑒𝑟𝑎𝑔𝑒𝑖𝑛𝑣𝑒𝑛𝑡𝑜𝑟𝑦𝑑𝑢𝑟𝑖𝑛𝑔𝑡ℎ𝑒𝑝𝑒𝑟𝑖𝑜𝑑
Schmidgall & DeFranco (2004); Santos et al. (2016)
Proceedings Book - IX International Tourism Congress (ITC’17), 29-30 November 2017, Peniche, Portugal
246
Food cost percentage 𝑐𝑜𝑠𝑡𝑜𝑓𝑓𝑜𝑜𝑑𝑠𝑜𝑙𝑑𝑓𝑜𝑜𝑑𝑟𝑒𝑣𝑒𝑛𝑢𝑒
×100 Harris (2013); Miller et al. (2002); Dittmer (2003); Schmidgall (2011); Cote (2012); Schmidgall & DeFranco (2004); Jagels & Coltman (2004); Bhamornsathit & Katawandee (2016); Melia & Robinson (2010); HANYC (2014); Santos et al. (2016)
Beverage cost percentage 𝑐𝑜𝑠𝑡𝑜𝑓𝑏𝑒𝑣𝑒𝑟𝑎𝑔𝑒𝑠𝑜𝑙𝑑
𝑏𝑒𝑣𝑒𝑟𝑎𝑔𝑒𝑟𝑒𝑣𝑒𝑛𝑢𝑒×100
Harris (2013); Schmidgall (2011); Cote (2012); Jagels & Coltman (2004); Schmidgall & DeFranco (2004); Dittmer (2003); Bhamornsathit & Katawandee (2016); HANYC (2014); Melia & Robinson (2010); Miller et al. (2002); Santos et al. (2016)
Covers per employee hour worked 𝑁𝑢𝑚𝑏𝑒𝑟𝑜𝑓𝑐𝑜𝑣𝑒𝑟𝑠𝑠𝑒𝑟𝑣𝑒𝑑𝑖𝑛𝑝𝑒𝑟𝑖𝑜𝑑
𝐸𝑚𝑝𝑙𝑜𝑦𝑒𝑒ℎ𝑜𝑢𝑟𝑠𝑤𝑜𝑟𝑘𝑒𝑑𝑖𝑛𝑎𝑝𝑒𝑟𝑖𝑜𝑑
Guilding (2014)
Number of guests per employee 𝐺𝑢𝑒𝑠𝑡𝑠𝑒𝑟𝑣𝑒𝑑
𝑛𝑜. 𝑜𝑓𝑒𝑚𝑝𝑙𝑜𝑦𝑒𝑒𝑠
Harris (2013); Jagels & Coltman (2004); Santos et al. (2016)
Revenue per employee 𝐹𝑜𝑜𝑑𝑎𝑛𝑑𝑏𝑒𝑣𝑒𝑟𝑎𝑔𝑒𝑟𝑒𝑣𝑒𝑛𝑢𝑒
𝑁𝑢𝑚𝑏𝑒𝑟𝑜𝑓𝑒𝑚𝑝𝑙𝑜𝑦𝑒𝑒𝑠
Harris (2013); Santos et al. (2016)
Revenue per employee hour worked
𝑅𝑒𝑠𝑡𝑎𝑢𝑟𝑎𝑛𝑡𝑟𝑒𝑣𝑒𝑛𝑢𝑒𝑁𝑢𝑚𝑏𝑒𝑟𝑜𝑓𝑒𝑚𝑝𝑙𝑜𝑦𝑒𝑒ℎ𝑜𝑢𝑟𝑠𝑤𝑜𝑟𝑘𝑒𝑑
Chin & Barney (1995); Guilding (2014)
Seat turnover ratio 𝑛𝑢𝑚𝑏𝑒𝑟𝑜𝑓𝑔𝑢𝑒𝑠𝑡𝑠𝑠𝑒𝑎𝑡𝑠𝑎𝑣𝑎𝑖𝑙𝑎𝑏𝑙𝑒
𝑁𝑢𝑚𝑏𝑒𝑟𝑜𝑓𝑐𝑜𝑣𝑒𝑟𝑠𝑠𝑒𝑟𝑣𝑒𝑑𝑝𝑒𝑟𝑑𝑎𝑦𝑁𝑢𝑚𝑏𝑒𝑟𝑜𝑓𝑟𝑒𝑠𝑡𝑎𝑢𝑟𝑎𝑛𝑡𝑠𝑒𝑎𝑡𝑠
𝐶𝑜𝑣𝑒𝑟𝑠𝑠𝑒𝑟𝑣𝑒𝑑𝑖𝑛𝑎𝑝𝑒𝑟𝑖𝑜𝑑𝑛𝑢𝑚𝑏𝑒𝑟𝑜𝑓𝑠𝑒𝑎𝑡𝑠×𝑛𝑢𝑚𝑏𝑒𝑟𝑜𝑓𝑑𝑎𝑦𝑠𝑜𝑝𝑒𝑛
Harris (2013); Santos et al.(2016); Guilding (2014); Cote (2012); Schmidgall (2011); Chin & Barney (1995)
Revenue per available seat (RevPAS)/average food sale per seat
𝑡𝑜𝑡𝑎𝑙𝐹&𝐵𝑟𝑒𝑣𝑒𝑛𝑢𝑒𝑛𝑜. 𝑜𝑓𝑎𝑣𝑎𝑖𝑙𝑎𝑏𝑙𝑒𝑠𝑒𝑎𝑡𝑠
Cote (2012); Jagels & Coltman (2004); Melia & Robinson (2010); HANYC (2014); Lukianoff (2005); Santos et al. (2016)
Revenue per available seat hour (RevPASH) 𝑑𝑎𝑖𝑙𝑦𝐹&𝐵𝑟𝑒𝑣𝑒𝑛𝑢𝑒
𝑛𝑜. 𝑜𝑓𝑎𝑣𝑎𝑖𝑙𝑎𝑏𝑙𝑒𝑠𝑒𝑎𝑡𝑠×𝑛𝑜. 𝑜𝑓𝑤𝑜𝑟𝑘𝑖𝑛𝑔ℎ𝑜𝑢𝑟𝑠 Kimes, Barrash & Alexander (1999); Kimes (1999); Lukianoff (2005) Santos et al. (2016);
Revenue yield per seat 𝑇𝑜𝑡𝑎𝑙𝑟𝑒𝑠𝑡𝑎𝑢𝑟𝑎𝑛𝑡𝑟𝑒𝑣𝑒𝑛𝑢𝑒𝑁𝑢𝑚𝑏𝑒𝑟𝑜𝑓𝑟𝑒𝑠𝑡𝑎𝑢𝑟𝑎𝑛𝑡𝑠𝑒𝑎𝑡𝑠
Guilding (2014)
Percentage of Beverage Revenue to Food Revenue/Beverage/fo
𝑏𝑒𝑣𝑒𝑟𝑎𝑔𝑒𝑟𝑒𝑣𝑒𝑛𝑢𝑒𝑓𝑜𝑜𝑑𝑟𝑒𝑣𝑒𝑛𝑢𝑒
Cote (2012); Jagels & Coltman (2004);Santos et al. (2016)
Proceedings Book - IX International Tourism Congress (ITC’17), 29-30 November 2017, Peniche, Portugal
247
od sales ratio Average food service check (AFSC)/average spend per head/sales revenue per server/F&B venue revenue per customer/ Average food check
𝑇𝑜𝑡𝑎𝑙𝑓𝑜𝑜𝑑𝑟𝑒𝑣𝑒𝑛𝑢𝑒𝑁𝑢𝑚𝑏𝑒𝑟𝑜𝑓𝑓𝑜𝑜𝑑𝑐𝑜𝑣𝑒𝑟𝑠
𝑓𝑜𝑜𝑑𝑟𝑒𝑣𝑒𝑛𝑢𝑒𝑛𝑢𝑚𝑏𝑒𝑟𝑜𝑓𝑔𝑢𝑒𝑠𝑡𝑠
Chin & Barney (1995); Schmidgall (2011); Cote (2012); Harris (2013); Guilding (2014); Planas (2004); Jagels & Coltman (2004); HANYC (2014)
Average food cost per guest (AFCG) 𝑓𝑜𝑜𝑑𝑐𝑜𝑠𝑡
𝑛𝑢𝑚𝑏𝑒𝑟𝑜𝑓𝑔𝑢𝑒𝑠𝑡𝑠
Jagels & Coltman (2004)
Average cost per guest (ACG) 𝑡𝑜𝑡𝑎𝑙𝑐𝑜𝑠𝑡
𝑛𝑢𝑚𝑏𝑒𝑟𝑜𝑓𝑔𝑢𝑒𝑠𝑡𝑠
Jagels & Coltman (2004)
Average operating income per guest (AOIG)
𝑜𝑝𝑒𝑟𝑎𝑡𝑖𝑛𝑔𝑖𝑛𝑐𝑜𝑚𝑒𝑛𝑢𝑚𝑏𝑒𝑟𝑜𝑓𝑔𝑢𝑒𝑠𝑡𝑠
Jagels & Coltman (2004)
Average beverage spend 𝐵𝑒𝑣𝑒𝑟𝑎𝑔𝑒𝑟𝑒𝑣𝑒𝑛𝑢𝑒
𝑁𝑢𝑚𝑏𝑒𝑟𝑜𝑓𝑐𝑜𝑣𝑒𝑟𝑠
Harris (2013)
Catering/banquet per square foot 𝐶𝑎𝑡𝑒𝑟𝑖𝑛𝑔𝑎𝑛𝑑𝑏𝑎𝑛𝑞𝑢𝑒𝑡𝑟𝑒𝑣𝑒𝑛𝑢𝑒
𝑆𝑞𝑢𝑎𝑟𝑒𝑜𝑓𝑓𝑢𝑛𝑐𝑡𝑖𝑜𝑛𝑠𝑝𝑎𝑐𝑒
HANYC (2014)
Profit per available seat hour (ProPASH) 𝑃𝑟𝑜𝑓𝑖𝑡
𝑡𝑜𝑡𝑎𝑙𝑛𝑢𝑚𝑏𝑒𝑟𝑜𝑓𝑎𝑣𝑎𝑖𝑙𝑎𝑏𝑙𝑒𝑠𝑒𝑎𝑡𝑠
Heo (2017)
Profit per available square meter (ProPASM)
𝑃𝑟𝑜𝑓𝑖𝑡𝑎𝑣𝑎𝑖𝑙𝑎𝑏𝑙𝑒𝑠𝑝𝑎𝑐𝑒𝑖𝑛𝑠𝑞𝑢𝑎𝑟𝑒𝑚𝑒𝑡𝑒𝑟
Heo (2017)
Total F&B revenue per available room 𝑃𝑟𝑜𝑓𝑖𝑡𝑇𝑜𝑡𝑎𝑙𝐹&𝐵𝑟𝑒𝑣𝑒𝑛𝑢𝑒
𝑟𝑜𝑜𝑚𝑠𝑎𝑣𝑎𝑖𝑙𝑎𝑏𝑙𝑒
HANYC (2014)
Cost per customer 𝑡𝑜𝑡𝑎𝑙𝑙𝑎𝑏𝑜𝑟𝑐𝑜𝑠𝑡𝑠𝑎𝑛𝑑𝑟𝑒𝑙𝑎𝑡𝑒𝑑𝑒𝑥𝑝𝑒𝑛𝑠𝑒𝑠𝑛𝑢𝑚𝑏𝑒𝑟𝑜𝑓𝑐𝑢𝑠𝑡𝑜𝑚𝑒𝑟𝑠
HANYC (2014)
Source: prepared by authors
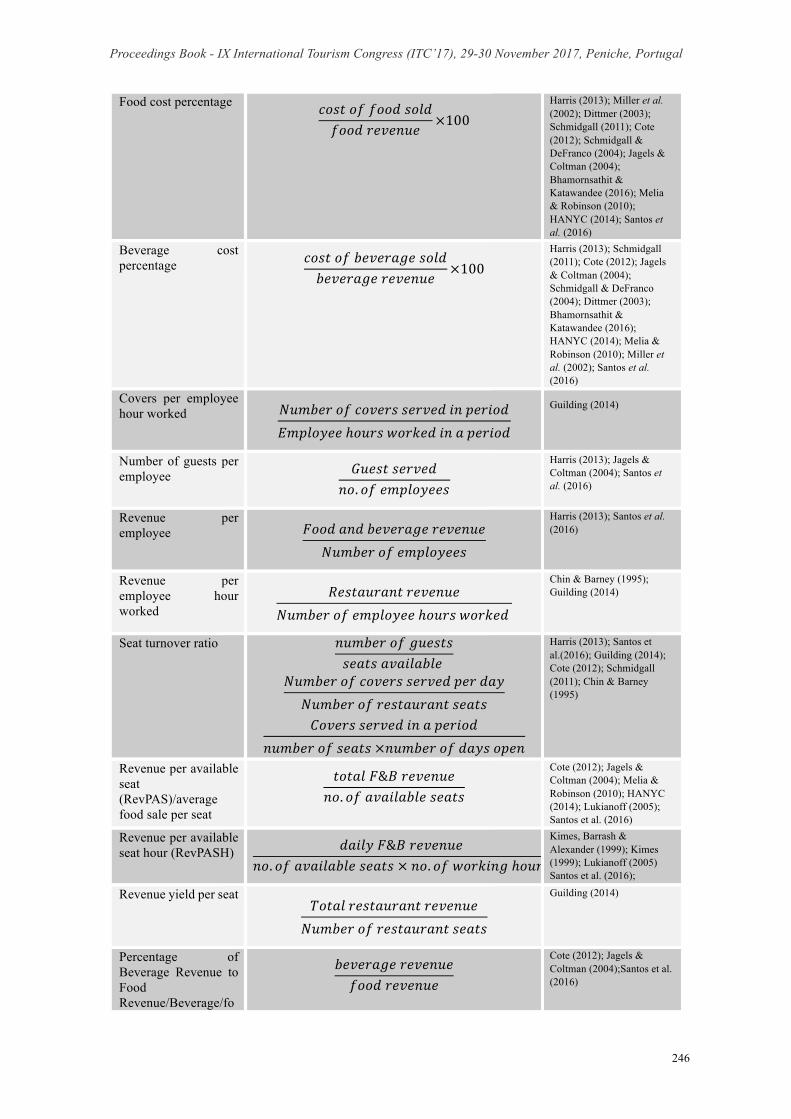
The problem repeats itself, in other words, there are ratios calculated differently. According to Bhamornsathit & Katawandee (2016) there is a cost target to compare food cost percentage and beverage cost percentage.
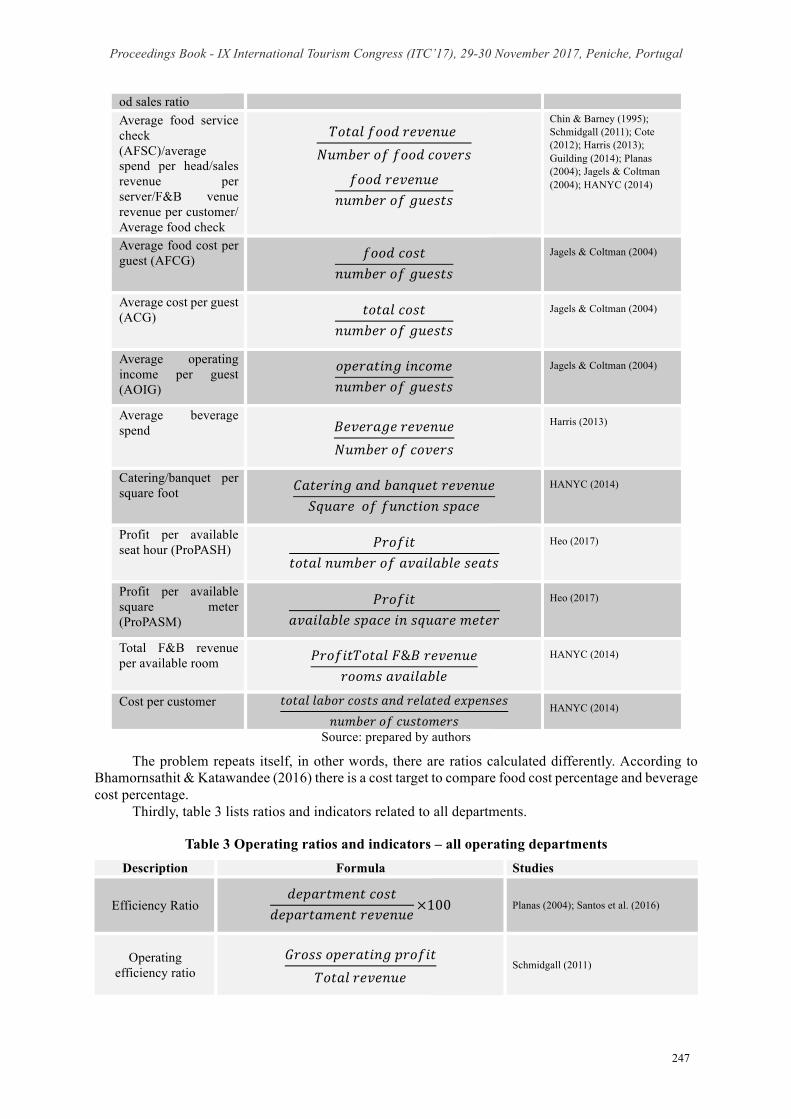
Thirdly, table 3 lists ratios and indicators related to all departments.
Table 3 Operating ratios and indicators – all operating departments Description Formula Studies
Efficiency Ratio 𝑑𝑒𝑝𝑎𝑟𝑡𝑚𝑒𝑛𝑡𝑐𝑜𝑠𝑡
𝑑𝑒𝑝𝑎𝑟𝑡𝑎𝑚𝑒𝑛𝑡𝑟𝑒𝑣𝑒𝑛𝑢𝑒×100 Planas (2004); Santos et al. (2016)
Operating efficiency ratio
𝐺𝑟𝑜𝑠𝑠𝑜𝑝𝑒𝑟𝑎𝑡𝑖𝑛𝑔𝑝𝑟𝑜𝑓𝑖𝑡𝑇𝑜𝑡𝑎𝑙𝑟𝑒𝑣𝑒𝑛𝑢𝑒
Schmidgall (2011)
Proceedings Book - IX International Tourism Congress (ITC’17), 29-30 November 2017, Peniche, Portugal
248
Labour cost percentage
𝐷𝑒𝑝𝑎𝑟𝑡𝑚𝑒𝑛𝑡𝑝𝑎𝑦𝑟𝑜𝑙𝑙𝑎𝑛𝑑𝑟𝑒𝑙𝑎𝑡𝑒𝑑𝑒𝑥𝑝𝑒𝑛𝑠𝑒𝑠𝐷𝑒𝑝𝑎𝑟𝑡𝑚𝑒𝑛𝑡𝑟𝑒𝑣𝑒𝑛𝑢𝑒
𝑡𝑜𝑡𝑎𝑙𝑙𝑎𝑏𝑜𝑟𝑐𝑜𝑠𝑡𝑠𝑡𝑜𝑡𝑎𝑙𝑟𝑒𝑣𝑒𝑛𝑢𝑒
OPQRSTTUSVWVXSWPTRYZY[\Y
Harris (2013); Schmidgall(2011);Santos et al. (2016) Jones et al. (2012); Schmidgall & DeFranco (2004); Planas (2004); Jagels & Coltman (2004); Melia & Robinson (2010); Bhamornsathit & Katawandee (2016)
Department gross operating profit per
available room
𝐷𝑒𝑝𝑎𝑟𝑡𝑚𝑒𝑛𝑡𝑔𝑟𝑜𝑠𝑠𝑜𝑝𝑒𝑟𝑎𝑡𝑖𝑛𝑔𝑝𝑟𝑜𝑓𝑖𝑡𝑁𝑢𝑚𝑏𝑒𝑟𝑜𝑓𝑟𝑜𝑜𝑚𝑠𝑎𝑣𝑎𝑖𝑙𝑎𝑏𝑙𝑒
Amat & Campa (2011)
Department gross operating profit per
occupied room
𝐷𝑒𝑝𝑎𝑟𝑡𝑚𝑒𝑛𝑡𝑔𝑟𝑜𝑠𝑠𝑜𝑝𝑒𝑟𝑎𝑡𝑖𝑛𝑔𝑝𝑟𝑜𝑓𝑖𝑡𝑁𝑢𝑚𝑏𝑒𝑟𝑜𝑓𝑟𝑜𝑜𝑚𝑠𝑜𝑐𝑐𝑢𝑝𝑖𝑒𝑑
Amat & Campa (2011)
Source: prepared by authors
Labor cost percentage is the most discussed ratio. It is clear because according to Bhamornsathit & Katawandee (2016) labor cost is the largest proportion of hotel operating cost.
These ratios are, on the one hand, commonly used by public entities (for example, the Portuguese tourism office, Turismo de Portugal, I.P.) and, on the other hand, used to make comparisons between the hospitality performance of different countries (see travel research of Hotel and Motel Management – H&MM- studies, for example: Lomanno, 2004).
In Portugal, if hotels are associated to Associação da Hotelaria de Portugal (AHP, in English, Portuguese Association of Hospitality) and provide some information, they can obtain information about average values of operating ratios. There is a database called hotel monitor, where the average values of hotel industry ratios are calculated. The ratios provided by the hotel monitor are ARR, RevPAR, GMTH, Mise en Faire PAR, Average length of stay, Multiple occupancy/Double occupancy, TRevPAR.
The case of small independent hotels is specific, as analysed in a study similar to this one, developed in Ireland. Its findings indicate that small and medium-size independent hotels need an adapted structure to measure their performance. It also concludes “that there is a need for these hotel operators to adopt a more structured formal approach to performance measurement” (Melia & Robinson, 2010:2). In that study, a model for this kind of hotels was proposed and, regarding operating ratios, the following indicators were suggested: wage percentage, labour cost, food cost, beverage cost, occupancy rate, RevPAR, RevPas, average room rates, budget variances and waste management measures.
After gathering the most important indicators in the literature review with the most important for hoteliers involved in this study, and also considering the ratios included in the AHP platform (Hotel Monitor), it will then be possible to set a tableau de bord adapted to the small independent hotels.
The concept of tableau de bord has emerged in France in the thirties and represents one of the instruments for management control system and for decision making process (Bessire & Baker, 2005). A tableau de bord contains financial and non-financial indicators (Lebas. 1994, Epstein et Manzoni 1997, 1998, Mendoza et al., 2002, Gervais. 2000, mentioned in Cauvin & Bescos, 2005). Malo (1992), referred to in Bessire & Baker (2005, p.650) describes that the tableau de bord consists of a one to several page document, containing between five and nine key indicators accompanied by comparisons with prior periods. The main limitation pointed out is that this tool only considered an economic perspective without considering the other variables of the companies, such as political environment and strategy, for example (Bessire & Baker, 2005; Nunes & Machado, 2014).
3. Methodology In order to elaborate a tableau de bord with operating ratios for independent hotels, the research
was carried out in three steps. The first step consisted of a literature review, where the most discussed ratios were found out. In the second step, the ratios belonging to the AHP database were analysed. Finally, a structured survey was developed to serve as main data for this study. The survey was
Proceedings Book - IX International Tourism Congress (ITC’17), 29-30 November 2017, Peniche, Portugal
249
available on an online platform and was conducted between March and December 2016. The questionnaire was applied to hotels in the Leiria and West regions (95 hotels) of Portugal. The sample was defined considering a percentage of independent hotels in the order of 60% (Deloitte, 2015), making a total of 57 independent hotels. Assuming a confidence interval of 95% and a margin of error of 5%, a sample of 49 questionnaires was determined. An email was sent to the CEOs of these hotels, containing an individual link to the online survey.
CEOs were asked to provide information about the hotel unit description (management type, number of stars, employees, rooms and available F&B seats, last available year turnover, existing departments) and they were also asked to indicate the significant operating ratios that should be used by hoteliers.
A total of 49 survey responses was collected, but only 41 were from independent hotels, so 8 responses needed to be removed from the sample. These 8 hotels belong to a chain. Data were processed using SPSS. Descriptive statistics was used, in order to characterize the sample, ascertain what ratios were used and determine their importance. In this sample, there are only micro, small and medium-sized hotels, taking into account EU recommendation 2003/361.
4. Findings and discussion In this study, 41 hotels in Portugal were analysed and the majority of hotels falls under the 4-star
classification (41.5%). Regarding the number of employees, the sample is featured with a mean of 27 employees. The turnover confirms this profile (small enterprise), with a mean of 1.8 EUR millions.
When asked about departmental management, 63% of hoteliers replied that their units were organized by departments. The two most common departments are the two traditional major operating departments: “Rooms” and “Food & Beverage” (F&B). Considering other mentioned departments, some hoteliers mentioned the following: “Maintenance”, “Housekeeping” (floors), “Conferences and Banquets”, “Swimming pool”, “Laundry”, “Marketing”, “Human resources”, “Administrative” and “Surf”.
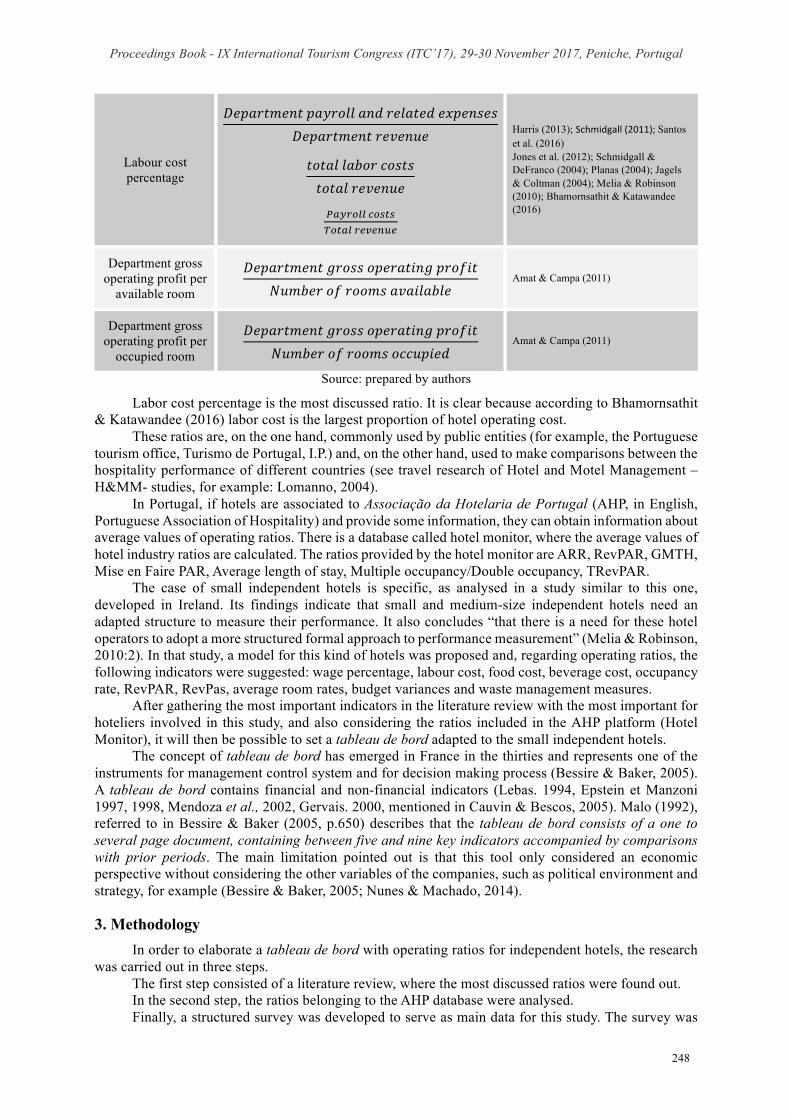
To analyse the results about the use of the operating ratios and indicators, three groups were created: rooms and F&B ratios and indicators and another group of ratios that can be used in all operating departments. As we can see in Figure 1, five of the nine room ratios are being used by more than half of hospitality managers. This half includes ratios that were found in literature review as the most used, namely “ADR”, “occupancy room rate”, “RevPAR”, “average occupancy room” and “TrevPAR”.
On the other hand, “GOPPAR” and “multiple occupancy rate” were also described in the literature review as the most used but aren’t being used in the same proportion by the managers that participated in this study.
Figure 1 - Usage rate of operating ratios - rooms
Source: prepared by authors
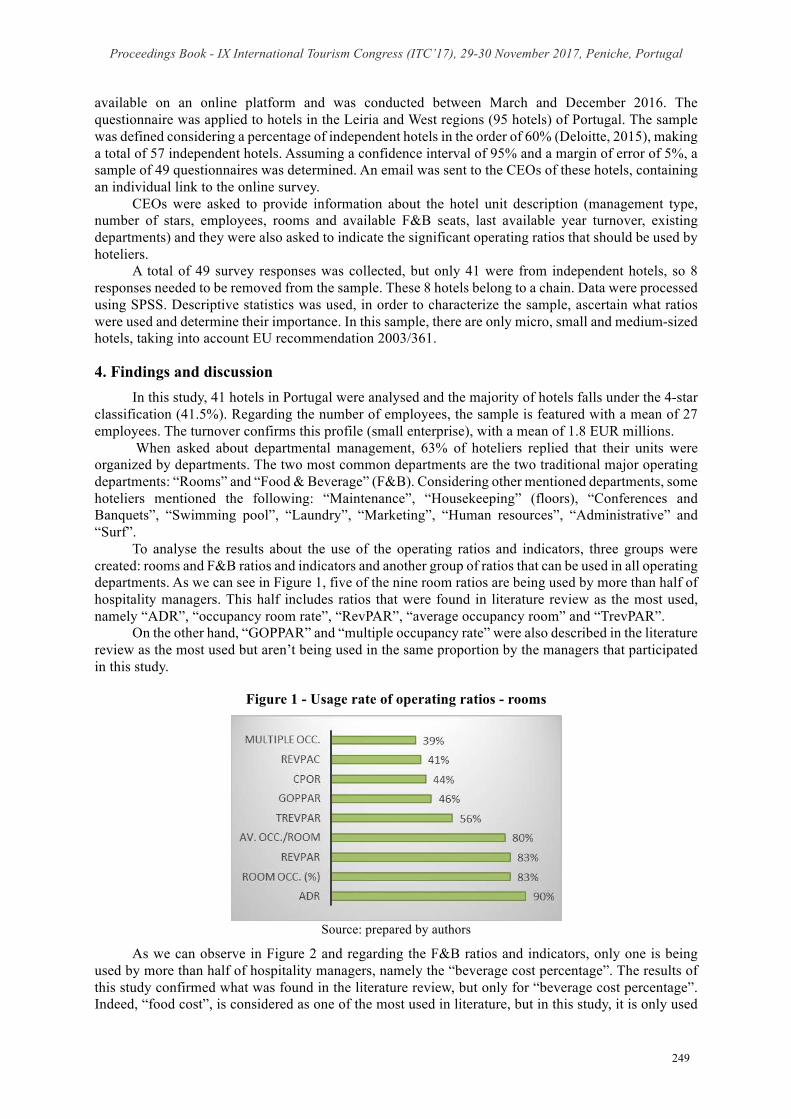
As we can observe in Figure 2 and regarding the F&B ratios and indicators, only one is being used by more than half of hospitality managers, namely the “beverage cost percentage”. The results of this study confirmed what was found in the literature review, but only for “beverage cost percentage”. Indeed, “food cost”, is considered as one of the most used in literature, but in this study, it is only used
Proceedings Book - IX International Tourism Congress (ITC’17), 29-30 November 2017, Peniche, Portugal
250
by 44%. Other ratios like “beverage inventory turnover”, “food inventory turnover”, “number guest per employee”, “revpash” and “sales revenues per employee” are under 50% in this study, but still represent a relevant percentage, higher than 30%.
Figure 2 - Usage rate of operating ratios – F&B
Source: prepared by authors
Consistent with the findings in the literature review, “revpas” is used only by 24% of the CEOs of the participating hotels and seat turnover only by 22%. This means that, for example, these two ratios are also being underused.
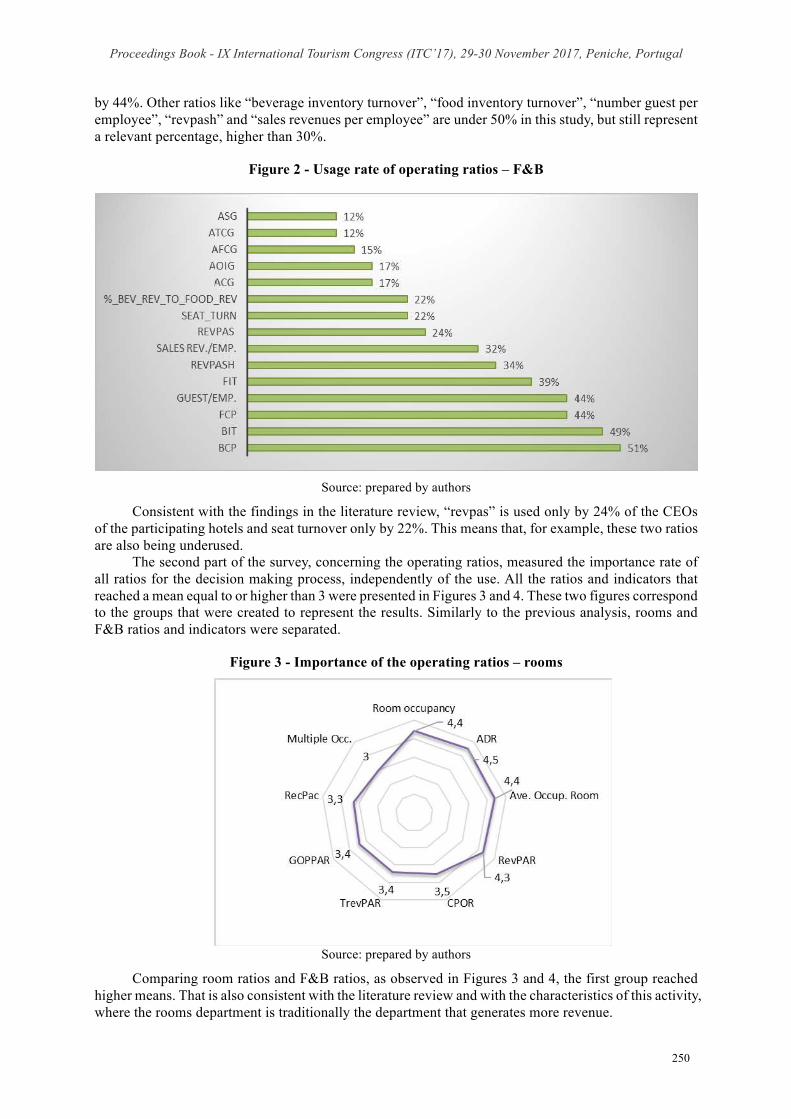
The second part of the survey, concerning the operating ratios, measured the importance rate of all ratios for the decision making process, independently of the use. All the ratios and indicators that reached a mean equal to or higher than 3 were presented in Figures 3 and 4. These two figures correspond to the groups that were created to represent the results. Similarly to the previous analysis, rooms and F&B ratios and indicators were separated.
Figure 3 - Importance of the operating ratios – rooms
Source: prepared by authors
Comparing room ratios and F&B ratios, as observed in Figures 3 and 4, the first group reached higher means. That is also consistent with the literature review and with the characteristics of this activity, where the rooms department is traditionally the department that generates more revenue.
Proceedings Book - IX International Tourism Congress (ITC’17), 29-30 November 2017, Peniche, Portugal
251
Figure 3 shows that “room occupancy”, “ADR”, “average occupancy room” and “RevPAR” are the four ratios with the higher means of importance (higher than 4), although in a different order, compared to the result obtained in the usage analysis. There is a correspondence, since these ratios have also obtained the highest percentage. That means they are used and considered important too.
We can highlight the case of “CPOR” which isn’t in the group of the most used ratios (44%) but obtained an interesting result regarding the importance given by hoteliers, as it appears immediately after the most important room ratios.
The other ratios “TrevPar”, “GOPPAR”, “revpac” and “multiple occupancy” stand in the last positions, only in a different order.
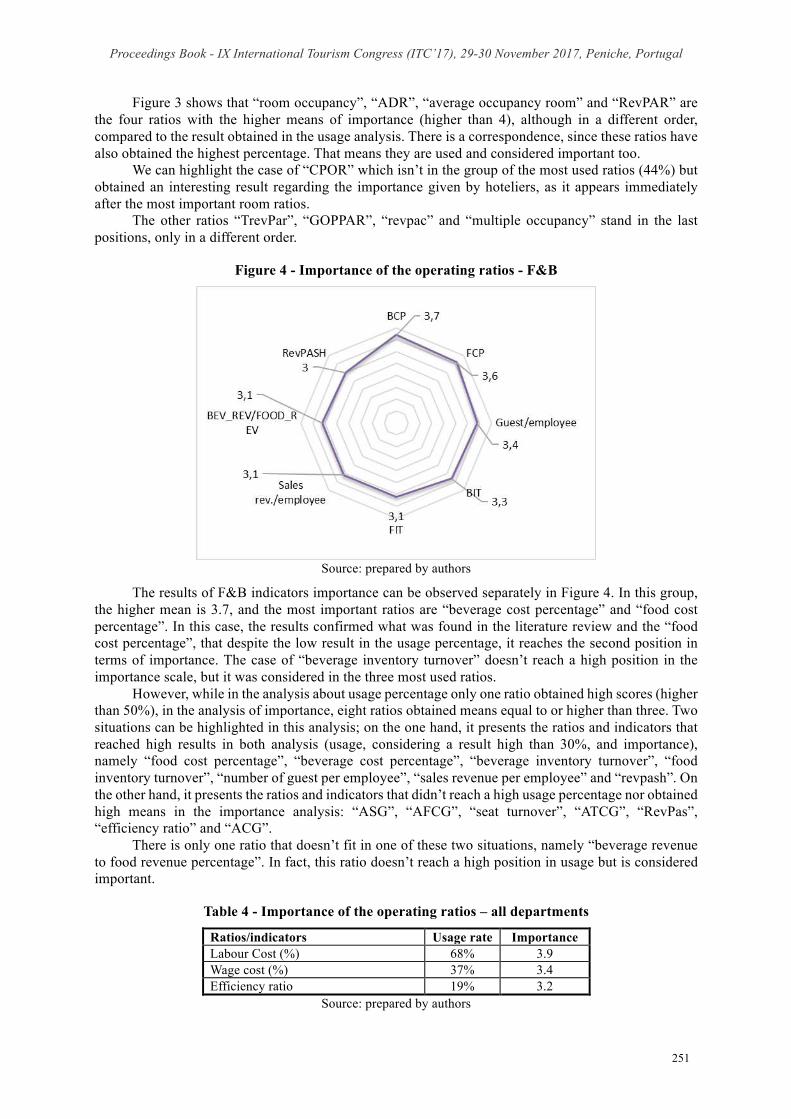
Figure 4 - Importance of the operating ratios - F&B
Source: prepared by authors
The results of F&B indicators importance can be observed separately in Figure 4. In this group, the higher mean is 3.7, and the most important ratios are “beverage cost percentage” and “food cost percentage”. In this case, the results confirmed what was found in the literature review and the “food cost percentage”, that despite the low result in the usage percentage, it reaches the second position in terms of importance. The case of “beverage inventory turnover” doesn’t reach a high position in the importance scale, but it was considered in the three most used ratios.
However, while in the analysis about usage percentage only one ratio obtained high scores (higher than 50%), in the analysis of importance, eight ratios obtained means equal to or higher than three. Two situations can be highlighted in this analysis; on the one hand, it presents the ratios and indicators that reached high results in both analysis (usage, considering a result high than 30%, and importance), namely “food cost percentage”, “beverage cost percentage”, “beverage inventory turnover”, “food inventory turnover”, “number of guest per employee”, “sales revenue per employee” and “revpash”. On the other hand, it presents the ratios and indicators that didn’t reach a high usage percentage nor obtained high means in the importance analysis: “ASG”, “AFCG”, “seat turnover”, “ATCG”, “RevPas”, “efficiency ratio” and “ACG”.
There is only one ratio that doesn’t fit in one of these two situations, namely “beverage revenue to food revenue percentage”. In fact, this ratio doesn’t reach a high position in usage but is considered important.
Table 4 - Importance of the operating ratios – all departments
Ratios/indicators Usage rate Importance Labour Cost (%) 68% 3.9 Wage cost (%) 37% 3.4 Efficiency ratio 19% 3.2
Source: prepared by authors
Proceedings Book - IX International Tourism Congress (ITC’17), 29-30 November 2017, Peniche, Portugal
252
The “labour cost percentage”, “wage cost percentage” and the “efficiency ratio” can be used in the two departments and, for this reason, they were separated. As we can see in Table 1, all of the three reached high levels of importance, but only “labour cost percentage” was indicated as one of the most used ratios.
Findings of this research show that small independent hoteliers use the best known operating indicators and ratios, in particular in the case of rooms department, but demonstrate also that they consider as important other indicators and ratios that they are not using. The fact that some ratios are neither used nor considered important could be explained by the fact that hoteliers do not know that they exist and what is their interest for hotel management. This gap can represent an opportunity to the research in this field. It is similarly urgent to also standardize ratios.
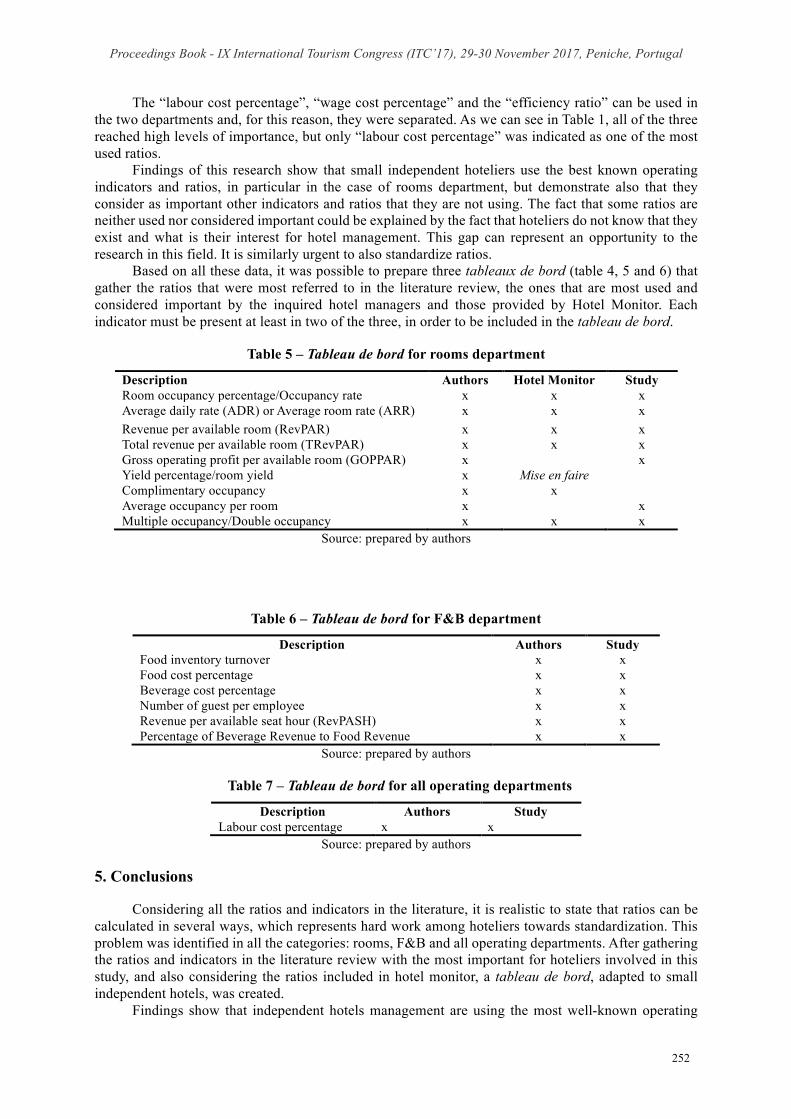
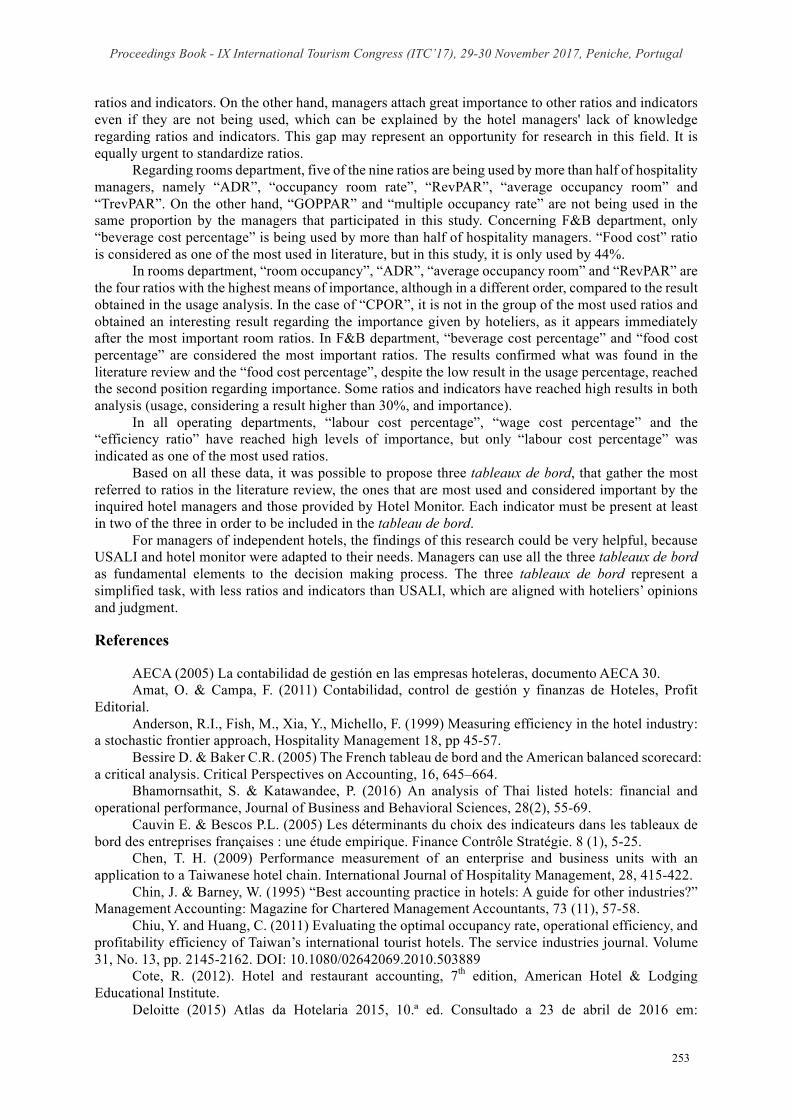
Based on all these data, it was possible to prepare three tableaux de bord (table 4, 5 and 6) that gather the ratios that were most referred to in the literature review, the ones that are most used and considered important by the inquired hotel managers and those provided by Hotel Monitor. Each indicator must be present at least in two of the three, in order to be included in the tableau de bord.
Table 5 – Tableau de bord for rooms department
Description Authors Hotel Monitor Study Room occupancy percentage/Occupancy rate x x x Average daily rate (ADR) or Average room rate (ARR) x x x Revenue per available room (RevPAR) x x x Total revenue per available room (TRevPAR) x x x Gross operating profit per available room (GOPPAR) x x Yield percentage/room yield x Mise en faire Complimentary occupancy x x Average occupancy per room x x Multiple occupancy/Double occupancy x x x
Source: prepared by authors
Table 6 – Tableau de bord for F&B department
Description Authors Study Food inventory turnover x x Food cost percentage x x Beverage cost percentage x x Number of guest per employee x x Revenue per available seat hour (RevPASH) x x Percentage of Beverage Revenue to Food Revenue x x
Source: prepared by authors
Table 7 – Tableau de bord for all operating departments
Description Authors Study Labour cost percentage x x
Source: prepared by authors 5. Conclusions
Considering all the ratios and indicators in the literature, it is realistic to state that ratios can be calculated in several ways, which represents hard work among hoteliers towards standardization. This problem was identified in all the categories: rooms, F&B and all operating departments. After gathering the ratios and indicators in the literature review with the most important for hoteliers involved in this study, and also considering the ratios included in hotel monitor, a tableau de bord, adapted to small independent hotels, was created.
Findings show that independent hotels management are using the most well-known operating
Proceedings Book - IX International Tourism Congress (ITC’17), 29-30 November 2017, Peniche, Portugal
253
ratios and indicators. On the other hand, managers attach great importance to other ratios and indicators even if they are not being used, which can be explained by the hotel managers' lack of knowledge regarding ratios and indicators. This gap may represent an opportunity for research in this field. It is equally urgent to standardize ratios.
Regarding rooms department, five of the nine ratios are being used by more than half of hospitality managers, namely “ADR”, “occupancy room rate”, “RevPAR”, “average occupancy room” and “TrevPAR”. On the other hand, “GOPPAR” and “multiple occupancy rate” are not being used in the same proportion by the managers that participated in this study. Concerning F&B department, only “beverage cost percentage” is being used by more than half of hospitality managers. “Food cost” ratio is considered as one of the most used in literature, but in this study, it is only used by 44%.
In rooms department, “room occupancy”, “ADR”, “average occupancy room” and “RevPAR” are the four ratios with the highest means of importance, although in a different order, compared to the result obtained in the usage analysis. In the case of “CPOR”, it is not in the group of the most used ratios and obtained an interesting result regarding the importance given by hoteliers, as it appears immediately after the most important room ratios. In F&B department, “beverage cost percentage” and “food cost percentage” are considered the most important ratios. The results confirmed what was found in the literature review and the “food cost percentage”, despite the low result in the usage percentage, reached the second position regarding importance. Some ratios and indicators have reached high results in both analysis (usage, considering a result higher than 30%, and importance).
In all operating departments, “labour cost percentage”, “wage cost percentage” and the “efficiency ratio” have reached high levels of importance, but only “labour cost percentage” was indicated as one of the most used ratios.
Based on all these data, it was possible to propose three tableaux de bord, that gather the most referred to ratios in the literature review, the ones that are most used and considered important by the inquired hotel managers and those provided by Hotel Monitor. Each indicator must be present at least in two of the three in order to be included in the tableau de bord.
For managers of independent hotels, the findings of this research could be very helpful, because USALI and hotel monitor were adapted to their needs. Managers can use all the three tableaux de bord as fundamental elements to the decision making process. The three tableaux de bord represent a simplified task, with less ratios and indicators than USALI, which are aligned with hoteliers’ opinions and judgment. References
AECA (2005) La contabilidad de gestión en las empresas hoteleras, documento AECA 30. Amat, O. & Campa, F. (2011) Contabilidad, control de gestión y finanzas de Hoteles, Profit
Editorial. Anderson, R.I., Fish, M., Xia, Y., Michello, F. (1999) Measuring efficiency in the hotel industry:
a stochastic frontier approach, Hospitality Management 18, pp 45-57. Bessire D. & Baker C.R. (2005) The French tableau de bord and the American balanced scorecard:
a critical analysis. Critical Perspectives on Accounting, 16, 645–664. Bhamornsathit, S. & Katawandee, P. (2016) An analysis of Thai listed hotels: financial and
operational performance, Journal of Business and Behavioral Sciences, 28(2), 55-69. Cauvin E. & Bescos P.L. (2005) Les déterminants du choix des indicateurs dans les tableaux de
bord des entreprises françaises : une étude empirique. Finance Contrôle Stratégie. 8 (1), 5-25. Chen, T. H. (2009) Performance measurement of an enterprise and business units with an
application to a Taiwanese hotel chain. International Journal of Hospitality Management, 28, 415-422. Chin, J. & Barney, W. (1995) “Best accounting practice in hotels: A guide for other industries?”
Management Accounting: Magazine for Chartered Management Accountants, 73 (11), 57-58. Chiu, Y. and Huang, C. (2011) Evaluating the optimal occupancy rate, operational efficiency, and
profitability efficiency of Taiwan’s international tourist hotels. The service industries journal. Volume 31, No. 13, pp. 2145-2162. DOI: 10.1080/02642069.2010.503889
Cote, R. (2012). Hotel and restaurant accounting, 7th edition, American Hotel & Lodging Educational Institute.
Deloitte (2015) Atlas da Hotelaria 2015, 10.ª ed. Consultado a 23 de abril de 2016 em:
Proceedings Book - IX International Tourism Congress (ITC’17), 29-30 November 2017, Peniche, Portugal
254
http://atlasdahotelaria.com/2015/ Dittmer, P. R. (2003) Principles of food, beverage and labor cost controls, 7 th edition. New York:
Jonh Wiley and Sons, Inc. Dodu, P. & Patrichi, I. (2014) Bucharest hotel market in the European context, The USV Annals
of Economics and Public Administration, 14,2(20), 48-57. Guilding, C. (2014) Accounting essentials for hospitality managers, 3rd edition, Routledge. Harris, P. (2013) Profit planning for hospitality and tourism, 3rd edition. Goodfellow Publishers. Heo, C. (2017) New performance indicators for restaurant revenue management: ProPASH and
ProPASM, International Journal of Hospitality Management, 61, 1-3. Hotel Association of New York City (HANYC). (2014) Uniform System of Accounts for the
Lodging Industry, 11th. New York: Revised Ed. Hua, N., Morosan, C. and DeFranco (2015) The other side of technology adoption: examining the
relationships between e-commerce expenses and hotel performance. International Journal of Hosptality Management, 45, 109-120.
INE – Inquérito à Permanência de Hóspedes na Hotelaria e Outros Alojamentos 2016. INE - Empresas (N.º) por Atividade económica (Subclasse - CAE Rev. 3) e Escalão de pessoal ao
serviço; Anual - INE, Sistema de contas integradas das empresas, Quadro extraído em 23 de Outubro de 2017 (10:21:14) em http://www.ine.pt .
Jagels, M. G. and Coltman, M. M. (2004) Hospitality management accounting 8 th edition. New York: Jonh Wiley and Sons, Inc.
Jones, T., Atkinson, H., Lorenz, A. & Harris, P. (2012) Strategic managerial accounting, 6th edition, Goodfellow Publishers Ltd.
Kimes, S. E., Barrash D. I., & Alexander, J. E. (1999) Developing a restaurant revenue-management strategy [Electronic version]. Cornell Hotel and Restaurant Administration Quarterly, 40(5), 18-29, from Cornell University, School of Hospitality Administration site: http://scholarship.sha.cornell.edu/articles/462/
Kimes, S. E. (1999) Implementing restaurant revenue management: A five-step approach [Electronic version]. Cornell Hospitality Quarterly, 40(3), 16-21. Retrieved [insert date], from Cornell University, School of Hospitality Administration site: http://scholarship.sha.cornell.edu/articles/461/
Lamelas, J. and Filipe, J. A. (2012) Co-leadership and Hotel Management. The account systems USALI and BSC to improve effectiveness and efficiency. The Portuguese case. International Journal of latest trends in Finance & Economic Sciences, 2 (4), 286-297.
Lomanno, M. V. (2004) Demand, occupancy on the rise for full-service U.S. properties. H&MM studies, pp.18.
Louise, F. (2004) Emília e o food cost. Lisboa: Edições do Gosto. Lukianoff M. (2005) Restaurant Revenue Management. Is It on the Menu? Hospitality Upgrade,
www.hospitalityupgrade.com. P.36-37 Melia, D., Robinson, L. (2010) Towards performance measurement in hotels: an incremental
approach. In Contemporary Issues in Irish and Global Tourism and Hospitality (Gorham, G., Mottiar, Z. eds). Available at: http://arrow.dit.ie/tfschhmtbook/36/.
Miller, J. E., Hayes, D. K. and Dopson, L. R. (2002) Food and beverage cost control, 2nd edition. New York: Jonh Wiley and Sons, Inc.
Moser, F. (2002) Manual de gestão de alimentação e bebidas. Mem Martins: Edições Cetop. Nunes C. & Machado M. J. (2014) Performance evaluation methods in the hotel industry. Os
métodos de avaliação de desempenho na hotelaria. Tourism & Management Studies, 10(1), 24-30. O´Neill, J. W. and Carlback (2011) Do brands matter? A comparison of branded and independent
hotels’ performance during a full economic cycle. International Journal of Hospitality Management, 30, 515-521.
Otto, G. (2012). Revenue Management, os segredos do controle de inventário. HotelNews (hoteliernews.com.br) Available at: http://gabrielaotto.com.br/blog/revenue-management-os-segredos-do-controle-de-inventario/
Phillips, Paul A. (1996) Strategic planning and business performance in the quoted UK hotel sector: results of an exploratory study. International Journal of Hospitality Management, 15 (4), pp. 347-362.
Phillips, P. (1999) Performance measurement systems and hotels: a new conceptual framework,
Proceedings Book - IX International Tourism Congress (ITC’17), 29-30 November 2017, Peniche, Portugal
255
Hospitality Management 18, pp 171-182. Pine, R. & Phillips, P. (2005) Performance comparisons of hotels in China, Hospitality
Management, 24, 57-73. Planas, F. (2004) La contabilidad de gestión en la industria hotelera: estudio sobre su implantación
en las cadenas hoteleras en españa. Tesis doctoral, Universitat Rovira i Virgili. Sainaghi, R., Phillips, P. and Corti, V. (2013) Measuring hotel performance: using a balanced
scorecard perspectives’ approach. International Journal of Hospitality Management, 34, 150-159. Schmidgall, R. (2011) Hospitality industry managerial accounting 7 th edition. USA: American
Hotel & Lodging Educational Institute. Schmidgall, R. S. and DeFranco, A. L. (2004) Ratio analysis: financial benchmarks for the club
industry. Journal of Hospitality Financial Management, 12 (1), 1-14. Santos, L., Gomes, C., Faria, A., Lunkes, R., Malheiros, C., Rosa, F. e Nunes, C. (2016)
Contabilidade de Gestão Hoteleira, ATF Edições Técnicas. Turismo de Portugal I. P. (2015) Os resultados do turismo. Lisboa: Turismo de Portugal, IP.
Consultado a 23 de abril de 2016 em: http://www.turismodeportugal.pt/Portugu%C3%AAs/ProTurismo/estat%C3%ADsticas/quadrosestatisticos/ofertahoteleira/Pages/OfertaHoteleira.aspx
Tuţă, Loredana and Micu, Cristina (2013) The evolution of the performance indicators specific to the hotel offer in Europe. Lucrări Ştiinţifice, Seria I, Vol. XVI (4), 65-70. Available at: http://lsma.ro/index.php/lsma/article/view/509.
Yu, L. & Huimin, G. (2007) An Analysis of Hotel Financial Management in China, The Journal of Hospitality Financial Management, 15:2, 39-48, DOI: 10.1080/10913211.2007.10653841.
World Travel and Tourism Council (WTTC), Travel and Tourism Economic Impact 2017 Portugal. Available in https://www.wttc.org/-/media/files/reports/economic-impact-research/countries-2017/portugal2017.pdf
Copyright © 2022 FDOKUMEN