Crop Plant Anatomy This page intentionally left blank Crop Plant Anatomy
Upload
khangminh22Category
view
3download
0
SESSION 8C
ADVANCESIN THEINTEGRATED MANAGEMENT
OF PESTS
SESSIONORGANISER MR R. A. UMPELBY
POSTERS 8C-1 to 8C-15
BRIGHTON CROP PROTECTION CONFERENCE—Pests and Diseases—1992
MONITORING AND BIOLOGICAL CONTROL AS THE MAIN COMPONENTS OF IPM IN VINEYARDS
M P TESHLER
Institute of Biomethods in Plant Protection, 58 Mira Ave, Kishinev 277072, Moldova
ABSTRACT
On the base of systemic approach, monitoring and biological control of noxious
organisms are considered with particular’ reference to vine leafrollers,
Trichogramma and microbial preparations. Monitoring of the insect pest population
includes short-term forecasting and density estimation based on the sequential sampling
combined with negative-binomial distribution model. Entomophage and preparations are
applied on the base of the mathematical model describing parasite-host relationship
and the model of a desirability function.
INTRODUCTION
Grape vine growing is one of the most ancient cultures and vines were cultivated on the
territory of the present Moldova from about 600 BC. The most important species is Vitis
vinifera, fruits of which are used fresh or for processing. Grape moth (Lobesia botrana) and
cochylis moth (Clysia ambiguella) cause a considerable damage to the grape field. To control
these pests organophosphorus preparations and pyrethroids, which can cause a number of negative
consequences, are applied. These negatives include outbreaks of red spider mite and scale which
result from the death of their natural enemies and the depression of grape leaf photosynthesis
and respiration. In addition, the cytogenetic activity on warm-blooded animals of some chemical
products widely applied in vineyards has been marked.
Recent research has demonstrated the prospects for vineyard integrated pest management in
which emphasis is placed on non-chemical methods, particularly, the application of parasitoid
Trichogramma and other biological means.
MATERIALS AND METHODS
The results of more than 10 years examination of vineyards in the central and southern zones
of Moldova are presented. Jrichogramma embyrophagum is the dominating species in vineyards and
it was collected from the eggs of vine leafrollers. It was mass reared on the eggs of angoumois
grain moth (Sitotroga cereallela), preparations on the base of Bacillus thuringiensis were used.
To build the logic model of the monitoring-noxious organisms biological control system the
method of parastrophic matrix is utilised (Vasil’yev, Tanskiy,1978). The leafroller density
estimation is founded on the approaches applied in forest entomology (Vorontsov et.al., 1983).
The study of the parasite-host relationship of Trichogramma and leafrollers and the optimisation
of the pheromone trap application to forecast pests has been carried out on the basis of the
mathematical method of multifactorial biological experiment planning founded by R Fisher at the
Rothamsted Experimental Station in England. To find the optimal rate of bacterial preparations
the desirability function was synthesised (Mencher and Zemshman, 1986).
8C—1
RESULTS AND DISCUSSION
Logical model
Applying the principles of the system analysis, monitoring and biological control of noxious
organisms can be considered as a complex of inter-related and interacting processes occurring in
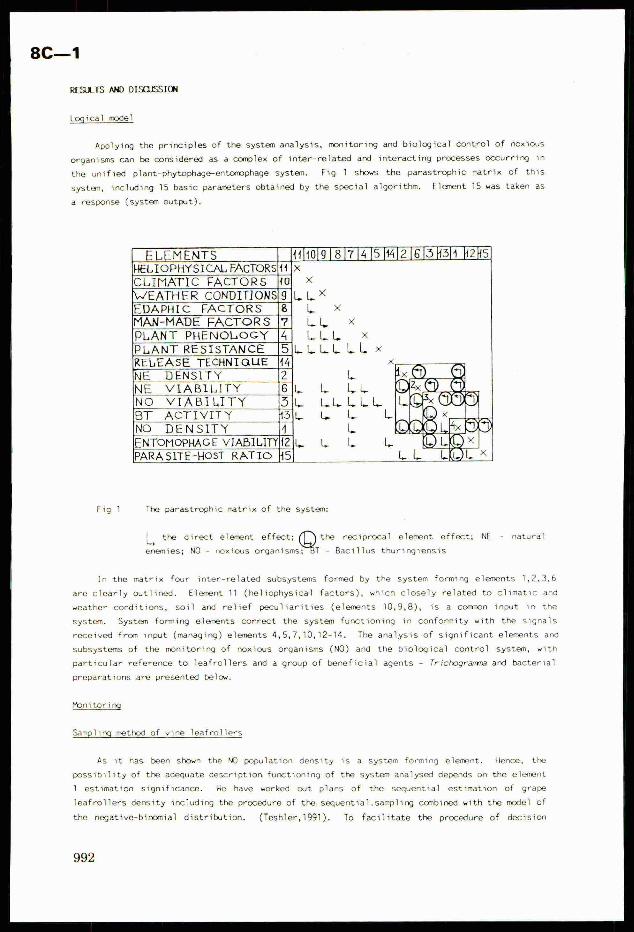
the unified plant-phytophage-entomophage system. Fig 1 shows the parastrophic matrix of this
system, including 15 basic parameters obtained by the special algorithm. Element 15 was taken as
a response (system output).
ELEMENTS 441019 [817 [4 [5 P4J2 [613 h3l4 H2H5
HELIOPHYSICAL FACTORS|14 |xCLIMATIC FACTORSNWEATHER CONDITIONSEDAPHIC FACTORS
MAN-MADE FACTORSPLANT PHENOLOGYPLANT RESISTANCERELEASE TECHNIQUE
DENSITYVIABILITYVIABILITYACTIVITYDENSITY
ENTOMOPHAGE VIABILITYPARA SITE-HOST RATIO
-
x
x
x
= rere
*
rea - f
x
x
ff
-
-
fFF
Fff
repreey
Fig 1 The parastrophic matrix of the system:
| the direct element effect; Q@* reciprocal element effect; NE - naturalLyenemies; NO - noxious organisms; T - Bacillus thuringiensis
In the matrix four inter-related subsystems formed by the system forming elements 1,2,3,6
are clearly outlined. Element 11 (heliophysical factors), which closely related to climatic and
weather conditions, soil and relief peculiarities (elements 10,9,8), is a common input in the
system. System forming elements correct the system functioning in conformity with the signals
received from input (managing) elements 4,5,7,10,12-14. The analysis of significant elements and
subsystems of the monitoring of noxious organisms (NO) and the biological contro] system, with
particular reference to leafrollers and a group of beneficial agents - Trichogramma and bacterial
preparations are presented below.
Monitoring
Samp ling method of vine leafrollers
As it has been shown the NO population density is a system forming element. Hence, the
possibility of the adequate description functioning of the system analysed depends on the element
1 estimation significance. We have worked out plans of the sequential estimation of grape
leafrollers density including the procedure of the sequential.sampling combined with the model of
the negative-binomial distribution. (Teshler,1991). To facilitate the procedure of decision
992

taking, from the results of preliminary estimation, convenient nomogrames have been built. One
of them, allowing estimation of generalised harmfulness of pests (B), confined at the different
phases and instars of its development is shown on Fig 2.
40 80 120 ‘160 200
Noe SAMPLE UNITS
Fig 2 The interval estimation of B
In the paper (Mencher, Teshler,1991) the detailed schene of B calculation is given, here we
adduce only the final formula:
where N is the average number of eggs and caterpillars of the i-th instar with the account ofjtheir mortality; C is the harmfulness of caterpillars of different instars in the conventional!
scale; L is a nase of caterpillar instars. Having made estimation and found the definite
number of caterpillars and pest eggs we transfer them (with the help of the formula) into the
conventional units of harmfulness B and plot them on the graph. The hit into the zone "strong"
invasion indicates the necessity of carrying out protective measures; "middle" means that the
insect density is near to the threshold one, it is necessary to Carry out estimations more
frequently; "weak" means protective measures are not necessary; “ambiguity zone" means estimates
should be continued. Under field conditions it is convenient to carry out the calculation of the
generalised harmfulness on the programmed calculator.
Short-term forecast of the leafroller density
The study of cross-correlation Jinks between the male flight to pheromone traps and
leafroller eggs density indicated on average, a lag of 3 days from the males flight to egg lay
(cross-correlation coefficient 0.95). A mathematical model has been built allowing a forecast of
the density of eggs taking into account 3-day lag. Possessing the information on the dynamics of
8C—1
the male flight to pheromone traps, knowing the trend of the generation development (heuistic
forecast) and sex ratio we can forecast the insect egg density for the next 5 days a sufficient
precision.
Pheromone traps are important elements of such forecast. The correlation between caught
adults and egg density depending on the pheromone dose and trap height above the ground have been
studied. The maximal correlation (r=0.8 and more) is achieved when traps are located at a height
of 100-140 cm and pheromone dose at the range of 200-600 pkg.
Biological control
Studies of the parasite-host-system
The analysis of the parastrophic matrix showed that the output parameter of the system, the
optimal parasite-host ratio fer the entomophage, depends on a number of abiotic and biotic
factors. A field model experiment, including both regulated (pests egg and Trichogramma density,
and location over the vineyard), and non-regulated factors (weather conditions, planting density
etc) has been conducted. The quadratic model of the relationship of the Trichogramma biological
efficiency to the factors studies has been developed. For the convenience of the application the
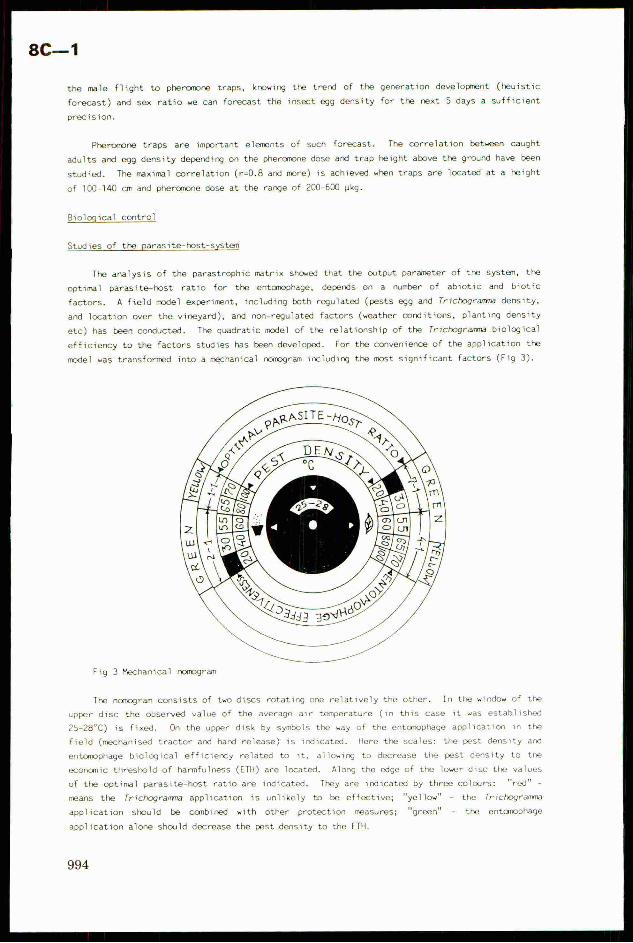
model was transformed into a mecnanical nomogram including the most significant factors (Fig 3).
Fig 3 Mechanical nomogram
The nomegram consists of two discs rotating one relatively the other. In the window of the
upper disc the observed value of the average air temperature (in this case it was established
25-28°C) is fixed. On the upper disk by symbols the way of the entomophage application in the
field (mechanised tractor and hand release) is indicated. Here the scales: the pest density and
entomophage biclogical efficiency related to it, allowing to decrease the pest density to the
economic threshold of harmfulness (ETH) are located. Along the edge of the lower disc the values
of the optimal parasite-host ratio are indicated. They are indicated by three colours: "red" -
means the Trichogramma application is unlikely to be effective; "yellow" the Trichogramma
application should be combined with other protection measures; "green" - the entonophage
application alone should decrease the pest density to the ETH.
994
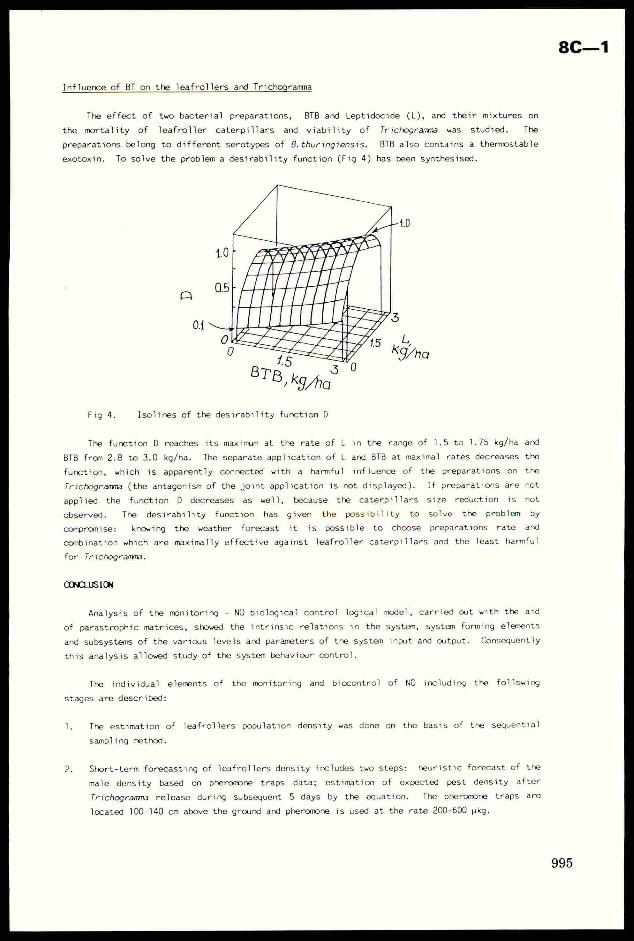
Influence of BT on the leafrollers and Trichogramma
The effect of two bacterial preparations, BTB and Leptidocide (L), and their mixtures on
the mortality of leafroller caterpillars and viability of Jrichogramma was studied. The
preparations belong to different serotypes of B. thuringiensis. BTB also contains a thermostable
exotoxin. To solve the problem a desirability function (Fig 4) has been synthesised.
Fig 4. Isolines of the desirability function D
The function D reaches its maximum at the rate of L in the range of 1.5 to 1.75 kg/ha and
BIB from 2.8 to 3.0 kg/ha. The separate application of L and BIB at maximal rates decreases the
function, which is apparently connected with a harmful influence of the preparations on the
Trichogramma (the antagonism of the joint application is not displayed). If preparations are not
applied the function D decreases as well, because the caterpillars size reduction is not
observed. The desirability function has given the possibility to solve the problem by
compromise: knowing the weather forecast it is possible to choose preparations rate and
combination which are maximally effective against leafroller caterpillars and the least harmful
for Trichogramma.
CONCLUSION
Analysis of the monitoring - NO biological control logical model, carried out with the aid
of parastrophic matrices, showed the intrinsic relations in the system, system forming elements
and subsystems of the various levels and parameters of the system input and output. Consequently
this analysis allowed study of the system behaviour control.
The individual elements of the monitoring and biocontrol] of NO including the following
stages are described:
The estimation of leafrollers population density was done on the basis of the sequential
sampling method.
Short-term forecasting of leafrollers density includes two steps: heuristic forecast of the
male density based on pheromone traps data; estimation of expected pest density after
Trichogramma release during subsequent 5 days by the equation. The pheromone traps are
located 100-140 cm above the ground and pheromone is used at the rate 200-600 pkg.
Plant protection measures were carried out on the basis of forecast data when past density
exceeded its ETH. When leafrollers density exceeds ETH Trichogramma is applied. In other
cases when the pest density exceeds the ETH and the weather is unfavourable for the
entomophage, bacterial preparations are used as a supplement.
It is recommended to take into account the gereralised harmfulness of the pest, these
contained various pest instars and development phases. The estimation of that kind is done
using the nomogrames realised by programmed calculator.
The evaluation of the optimal Trichogramma-leafrollers ratio is carried out by nomogram.
The option of the dose and the combination of bacterial preparations effective against
leafrollers caterpillars and non-harmful for Trichogramma is conducted using the model of
desirability function.
REFERENCES
Mencher, E£; Zemshman, A. (1986) Grounds for experiment design with elements of mathematical
statistic for viticulture research. Kishinev. 238 p. (in Russian).
Mencher, £.; Teshler, M. (1991) Biological plant protection: new methodical approaches.
Kishinev. 64 p. (in Russian).
Teshler, M. (1991) Monitoring and biological control of noxious organisms. Systemic approach.
Kishinev. 1991. 64 p.
Vasil'yev, S.; Tanskiy V. (1978) Construction and analysis of logical mode's for dynamics of
noxious species density using the technique of parastrophic matrices/In:Metody prognoza razvitia
vreditelei.Moscow, 227-265 (in Russian).
Vorontsov, A. et al. (7983) Modern methods for counting and forecast of pine-needles and
leafcutting insects. Lesnaia entomologia 65. Leningrad, Nauka, 4-19.
BRIGHTON CROP PROTECTION CONFERENCE—Pests and Diseases—1992
ALTERNATIVE CROPS AS FLORAL RESOURCES FOR BENEFICIAL HOVERFLIES (DIPTERA:SYRPHIDAE)
A. MacLEOD
Insect Ecology Group, University of Southampton, Department of Biology,Biomedical Sciences Building, Bassett Crescent East, Southampton, Hants, SO93TU.
ABSTRACT
Alternative or novel crops may have a role to play in biocontrol aswell as producing a useful crop. Studies on five alternative cropsshowed buckwheat and coriander were the two most preferred by twospecies of beneficial hoverfly. Reasons why the flies should favourthese particular crops are discussed.
When coriander was sown around a field of winter wheat in an attemptto influence syrphid distribution between fields, it failed tosignificantly increase syrphid diversity or species numbers withinthat field, this is in contrast to more positive effects when otherplant species have been used by co-workers.
INTRODUCTION
Aphidophagous hoverfly larvae (Diptera: Syrphidae) have beenextensively studied because of their potential as aphid biocontrol agents.Several studies have demonstrated an association between the presence ofsyrphid larvae and the cessation of aphid population growth (Dean, 1974;Chambers et al., 1983; Holmes, 1984; Entwistle & Dixon, 1990). Proteins frompollen are needed by adult syrphids to mature their reproductive system(Schreiber, 1948) and hoverflies are often recorded feeding on wild flowers,from which they take both pollen and nectar. Understanding the selection offloral resources used by adult syrphids is important because of thepotential it may have for manipulating syrphid distribution in theagroecosystem (Cowgill, 1991; Cowgill et al., 1992). The study reportedlooked at hoverfly foraging on some potential alternative crops. Alternativecrops or crops that may become more widely grown in the U.K. are shown inTable 1 with their uses.
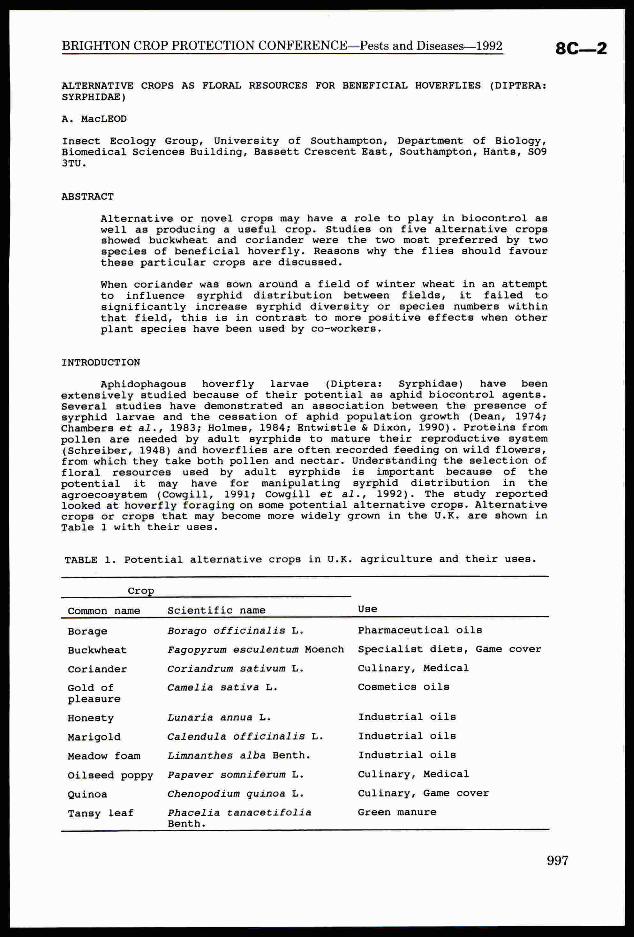
TABLE 1. Potential alternative crops in U.K. agriculture and their uses.
Crop
Common name Scientific name Use
Borage Borago officinalis L. Pharmaceutical oils
Buckwheat Fagopyrum esculentum Moench Specialist diets, Game cover
Coriander Coriandrum sativum L. Culinary, Medical
Gold of Camelia sativa L. Cosmetics oilspleasure
Honesty Lunaria annua L. Industrial oils
Marigold Calendula officinalis L. Industrial oils
Meadow foam Limnanthes alba Benth. Industrial oils
Oilseed poppy Papaver somniferum L. Culinary, Medical
Quinoa Chenopodium quinoa L. Culinary, Game cover
Tansy leaf Phacelia tanacetifolia Green manureBenth.
8B—2
Alternative crops are being experimentally grown in the UK for anumber of reasons. Advances in breeding technology and the development ofcrop management together with the European Communities Common AgriculturalPolicy (CAP) resulted in agricultural over-production during the 1970's and1980’s (Anon. 1988). Recent proposals to reform the CAP should reduce over-production but alternative crops could help this reduction by substitutingnovel crops for traditional ones without taking land out of productionaltogether. In the UK oilseed rape has been successfully introduced and isnow a major breakcrop. More recent is the development of linseed and cold-adapted varieties of sunflower (eg, cvs Allegro and Avante) which are nowincreasingly grown commercially in the UK.
This study investigated the potential of a number of crops which mayhave commercial uses and which could be used by Syrphidae as sources ofpollen and nectar.
MATERIALS AND METHODS
Flower selection by adult Syrphidae: summer 1991
Five potential alternative crops were observed for syrphid foragingactivity. The crops were borage, buckwheat, coriander, marigold andsunflower. Crops were sown in individual plots 6m x 12m (no replication)under bird proof netting at Bridget’s E.H.F., Winchester, Hampshire during
spring 1991.
On four dates during the crops’ period of flower, between July 23 andAugust 21, each crop was observed for hoverfly foraging activity (pollen ornectar feeding). The netting prevented the observer from walking along theplots in a standard manner, so an area of one square metre was observed fora ten-minute period, five times on each date, in each crop by rotationbetween 06:30 BST and 15:30 BST, weather permitting. Weather conditions were
noted. Results were recorded on a micro-cassette recorder.
In order to test for any effect of the netting itself on syrphidactivity a plot of buckwheat outside the netting was surveyed in the sameway as the plot of the buckwheat under the netting.
Field trial of an alternative crop: summer 1992
Coriander was sown in a strip, 0.75m x 200m at 25kg ha! along thenorthern and eastern edges of a field of winter wheat (cv. Galahad) duringspring 1992. The field was bounded along the northern edge by a hawthorn(Crataegus monogyna Jacq.) hedge and by a post and wire fence with a grassybase along the eastern edge. Two transects of fluorescent yellow water trapswere put in the field at right angles to each of the two coriander borders.In each transect, the traps were placed at distances of 1m, 5m, 15m, 25m and50m from the nearest coriander. The same arrangement of traps was placed ina nearby control field of winter wheat (cv. Galahad) which had a hawthornhedge as a southern boundary and a post and wire fence with a grassy base asan eastern boundary but which was not sown with coriander. Umbelliferae andother flowers on which Syrphidae could forage were cut down around thecontrol field. On 13 dates from June 17 to July 26, Syrphidae were collectedfrom the water traps in each field and aphid numbers on ten marked ears ofwheat around each trap were recorded. On a warm, dry sunny and still day, 24standard census walks lasting 15 min each were performed along one 200mstrip of the coriander from 06:30 to 12:30 BST. Syrphids were identified tospecies when possible and behaviour when first noted recorded onto amicrocasette recorder.
RESULTS
Flower selection by adult Syrphidae: summer 19912
A total of 601 observations of the foraging behaviour of syrphids wasrecorded on six plots of five crops during four dates of the crops’
998
8B—2
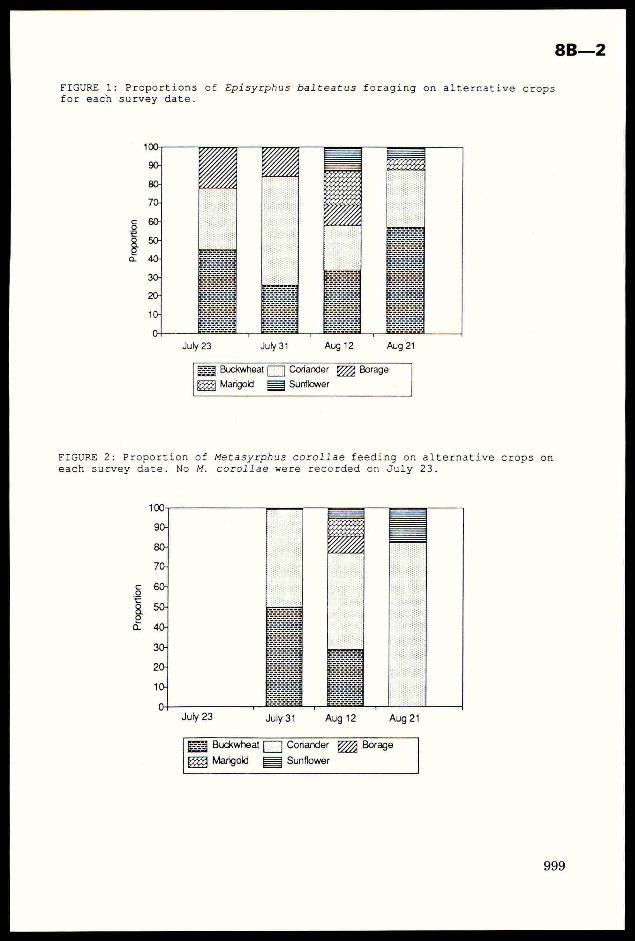
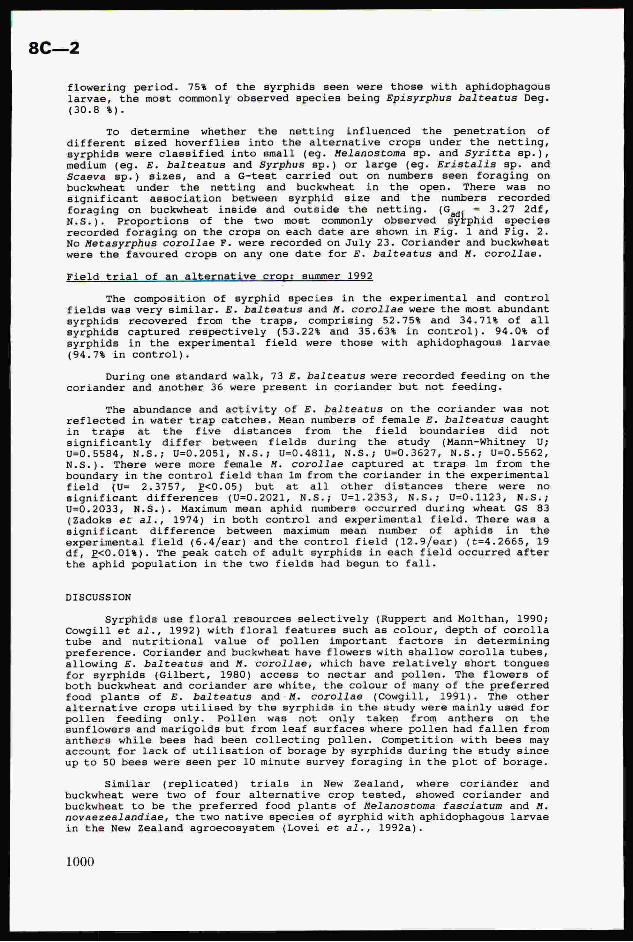
FIGURE 1: Proportions of Episyrphus balteatus foraging on alternative cropsfor each survey date.
July 23 July 34 Aug 12 Aug 21
Buckwheat|] Coriander Borage
Marigold 3 Sunflower
of Metasyrphus corollae feeding on alternative crops oncorollae were recorded on July 23.
FIGURE 2: Proportioneach survey date. No M.
WW:
Prop
orti
on
July 23 July 31 Aug 12 Aug 21
Buckwheat fF] Coriander 777 Borage
ex Mangold £3 Sunflower
8C—2
flowering period. 75% of the syrphids seen were those with aphidophagouslarvae, the most commonly observed species being Episyrphus balteatus Deg.(30.8 %).
To determine whether the netting influenced the penetration ofdifferent sized hoverflies into the alternative crops under the netting,syrphids were classified into small (eg. Melanostoma sp. and Syritta sp.),medium (eg. E. balteatus and Syrphus sp.) or large (eg. Eristalis sp. andScaeva sp.) sizes, and a G-test carried out on numbers seen foraging onbuckwheat under the netting and buckwheat in the open. There was noSignificant association between syrphid size and the numbers recordedforaging on buckwheat inside and outside the netting. (G,,, = 3.27 2df,N.S.). Proportions of the two most commonly observed gytphid speciesrecorded foraging on the crops on each date are shown in Fig. 1 and Fig. 2.No Metasyrphus corollae F. were recorded on July 23. Coriander and buckwheatwere the favoured crops on any one date for E. balteatus and M. corollae.
Field trial of an alternative crop: summer 1992
The composition of syrphid species in the experimental and controlfields was very similar. E. balteatus and M. corollae were the most abundantsyrphids recovered from the traps, comprising 52.75% and 34.71% of allsyrphids captured respectively (53.22% and 35.63% in control). 94.0% ofsyrphids in the experimental field were those with aphidophagous larvae
(94.7% in control).
During one standard walk, 73 E, balteatus were recorded feeding on thecoriander and another 36 were present in coriander but not feeding.
The abundance and activity of E. balteatus on the coriander was notreflected in water trap catches. Mean numbers of female E. balteatus caughtin traps at the five distances from the field boundaries did notsignificantly differ between fields during the study (Mann-Whitney U;U=0.5584, N.S.; U=0.2051, N.S.; U=0.4811, N.S.; U=0.3627, N.S.; U=0.5562,N.S.). There were more female M. corollae captured at traps lm from theboundary in the control field than 1m from the coriander in the experimentalfield (U= 2.3757, P<0.05) but at all other distances there were nosignificant differences (U=0.2021, N.S.; U=1.2353, N.S.; U=0.1123, N.S.;u=0.2033, N.S.). Maximum mean aphid numbers occurred during wheat GS 83(Zadoks et al., 1974) in both control and experimental field. There was asignificant difference between maximum mean number of aphids in theexperimental field (6.4/ear) and the control field (12.9/ear) (t=4.2665, 19df, P<0.01%). The peak catch of adult syrphids in each field occurred afterthe aphid population in the two fields had begun to fall.
DISCUSSION
Syrphids use floral resources selectively (Ruppert and Molthan, 1990;Cowgill et al., 1992) with floral features such as colour, depth of corollatube and nutritional value of pollen important factors in determiningpreference. Coriander and buckwheat have flowers with shallow corolla tubes,allowing E. balteatus and M. corollae, which have relatively short tonguesfor syrphids (Gilbert, 1980) access to nectar and pollen. The flowers ofboth buckwheat and coriander are white, the colour of many of the preferred
food plants of E. balteatus and M. corollae (Cowgill, 1991). The otheralternative crops utilised by the syrphids in the study were mainly used forpollen feeding only. Pollen was not only taken from anthers on thesunflowers and marigolds but from leaf surfaces where pollen had fallen fromanthers while bees had been collecting pollen. Competition with bees mayaccount for lack of utilisation of borage by syrphids during the study sinceup to 50 bees were seen per 10 minute survey foraging in the plot of borage.
Similar (replicated) trials in New Zealand, where coriander and
buckwheat were two of four alternative crop tested, showed coriander andbuckwheat to be the preferred food plants of Melanostoma fasciatum and M.novaezealandiae, the two native species of syrphid with aphidophagous larvaein the New Zealand agroecosystem (Lovei et al., 1992a).
1000
Molthan and Ruppert (1989) reported an increase in syrphid numbers anddiversity in herbaceously rich strips but many native wild flowersidentified as attractive to economically important species of syrphid arepernicious weeds and their encouragement would be agronomically unacceptable(Cowgill, 1989). However a crop that was attractive to aphidophagous speciesof syrphids should have added value to any farmer where aphid outbreaks mayoccur.
The lack of a significant difference between the treated and controlfield could be due to the high mobility of syrphids. Further trials withmore fields as replicates should give a clearer indication of the rolealternative crops may have to play in influencing beneficial syrphiddistribution on arable land.
That plants can be sown in an agricultural environment and influencehoverfly distribution has been shown in New Zealand where P. tanacetifolia,was sown in strips within cereal fields. Three to eight times as manyhoverflies were captured in fields containing P. tanacetifolia than inadjacent fields without P. tanacetifolia strips (Lovei et al., 1992b).
P, tanacetifolia has been used to influence hoverfly distribution inthe agroecosytem in the U.K.. More hoverflies have been captured in cerealfields bordered by P. tanacetifolia than in fields without P. tanacetifoliaborders (Hickman pers. comm.). The surface patterning of the pollen grainsof P. tanacetifolia is very distinctive and the pollen can readily bedistinguished in the guts of dissected hoverfly specimens. The pollen hasconsequently been used as a biological marker and it has been found that ahigher proportion of hoverflies in the P. tanacetifolia bordered fieldscontained the distinctive pollen in their guts than in the control fields(Hickman pers. comm.)
The aim of providing attractive floral resources for hoverflies in anarable environment is to enhance the potential for biocontrol, by theiraphidophagous larvae, by influencing oviposition. That coriander, as analternative crop, can significantly influence the distribution of beneficialhoverflies is yet to be confirmed in the U.K.
ACKNOWLEDGEMENTS
The author thanks the staff at ADAS Bridgets Experimental HusbandryFarm for access to the alternative crops during 1991 and Mr. D. Owen and Mr.B. Gibbons of Leckford Estates for allowing field work on the farm during1992. I thank Dr. S.D. Wratten for his helpful criticism of the manuscript.This work was funded by a Science and Engineering Research CouncilCooperative Award in Science and Engineering between Southampton Universityand The Game Conservancy.
REFERENCES
Anon. (1988) Our Common Future: a perspective by the United Kingdom on theReport of the World Commission on Environment and Development.Department of the Environment.
Cowgill, S., (1989) The role of non-crop habitats on hoverfly (Diptera:Syrphidae) foraging on arable land. Brighton Crop ProtectionConference - Weeds, 8, 1103-1108.
Cowgill, S.E. (1991) The foraging ecology of hoverflies (Diptera: Syrphidae)and the potential for manipulating their distribution on farmland.Ph.D. Thesis Southampton University.
Cowgill, S.E., Wratten, S.D. & Sotherton, N.W. (1992) The selective use offloral resources by the hoverfly Episyrphus balteatus (Diptera:Syrphidae) on farmland. Annals of Applied Biology. In press.
Dean, G.J. (1974) Effects of parasites and predators on the cereal aphidsMetopolophium dirhodum and Macrosiphum avenae (Hemiptera: Aphididae).Bulletin of Entomological Research, 63, 411-422.
Chambers, R.J., Sunderland, K.D., Wyatt, I.J. & Vickerman, G.P. (1983) Theeffects of predator exclusion and caging on cereal aphids in winterwheat. Journal of Applied Ecology, 20, 209-224.
1001
8C—2
Entwistle, J.C. & Dixon, A.F.G. (1990) The effect of augmenting grain aphid
Sitobion avenae numbers in a field of winter wheat in spring on the
aphid’s abundance in summer and its relevance to the forecasting of
outbreaks. Annals of Applied Biology, 114, 397-408.
Gilbert, F.S. (1980) Flower visiting by hoverflies (Syrphidae). Journal of
Biological Education 14, 70-74.
Holmes, P.R. (1984) A field study of the predators of the grain aphid,
Sitobion avenae (F.) (Hemiptera: Aphididae), in winter wheat in
Britain. Bulletin of Entomological Research, 74, 623-631.
Lovei, G.L., Hodgson, D.J., MacLeod, A. & Wratten, S..D. (1992a)
Attractiveness of some novel crops for flower visiting hoverflies
(Diptera: Syrphidae) : comparisons from two continents. Proceedings of
the Australian Applied Entomology Conference, Canberra, 1992 (In
press).
Lovei, G.L., McDougal, D., Bramley, G., Hodgson, D.J. & Wratten, S.D.
(1992b) Floral resources for natural enemies: the effect of Phacelia
tanacetifolia (Hydrophyllaceae) on within-field distribution of
hoverflies (Diptera: Syrphidae) New Zealand Crop Protection
Conference, Wellington, 1992 (In Press).
Molthan, J. & Ruppert, V. (1989) Zur Bedeutung bluhender Wildkrauter in
Feldrainen und Ackern fur blutenbesuchende Nutzinsekten. Mitteilungen
aus der Biologischen Bundesanstalt fur Land und Forstwirtschaft, 247,
85-99.
Ruppert, V. & Molthan, J. (1990) Augmentation of aphid antagonists by field
margins rich in flowering plants. Aphidophaga 4, Proceedings of
Symposium Godollo, Hungary, 1990.
Schreiber, F. (1948) Beitrag zur kenntnis der Generationsuerhaltnisse and
Diapause rauberischer Schwebfliiegen. Mitteilungen der Schweizerischen
Entomologischen Gesellschaft, 21, 249-285.
Zadoks, J.C., Chang, T.T. & Konzak, C.F. (1974) A decimal code for the
growth stages of cereals. Weed Research, 14, 415-421.
BRIGHTON CROP PROTECTION CONFERENCE—Pests and Diseases—1992
USE OF FIELD SIMULATORS TO INVESTIGATE INTEGRATED CHEMICAL AND BIOLOGICAL
CONTROL TACTICS AGAINST THE COTTON WHITEFLY, BEMISIA TABACI
L.C. BIRNIE, I. DENHOLM
Institute of Arable Crops Research, Rothamsted Experimental Station,
Harpenden, Herts. AL5 2JQ.
ABSTRACT
The need to rationalise pesticide use and exploit non-chemical
control of multiresistant whitefly populations is being addressed
by evaluating insecticides against B. tabaci and its Aphelinid
parasitoid Fretmocerus mundus under simulated field conditions in
the laboratory. These species are cultured on cotton in large
chambers, exposed to formulated insecticides at recommended rates
using an integral track-mounted sprayer, and resulting effects on
insect numbers are documented with minimal interference toinsects or plants. Experiments conducted in the absence of
pesticides are compared with those incorporating two applicationsof a pyrethroid (cypermethrin) or an organophosphate(profenofos). The design of simulation experiments, and their
potential to assist with the choice and timing of pesticide
applications on cotton and other crops is discussed.
INTRODUCTION
Problems with managing the whitefly, Bemisia tabaci, on cotton in
several countries highlight clearly the need for reliable methods to
validate and improve Integrated Pest Management (IPM) tactics. Based onevents documented throughout the tropics and sub-tropics, insecticidesalone offer little prospect for controlling this highly polyphagous andvery damaging pest. Indeed, large-scale reliance on chemicals has oftenappeared counter-productive in this respect, increasing rather than
reducing the severity of whitefly infestations and selecting for strongresistance to most insecticide groups (Dittrich et al., 1990; Byrne et al.,
1992). Reasons for these outbreaks remain contentious, but almost certainly
include over-reliance on broad-spectrum chemicals and their adverse effect
on parasitoids and predators (Gameel, 1969; Eveleens, 1983).
The most widely-reported enemies of B. tabaci are hymenopteran
parasitoids of the Aphelinid genera Eretmocerus and Encarsia. Despite
doubts over the taxonomic relationships, geographical distributions and
host ranges of constituent species (Gerling, 1990), one species -Eretmocerus mundus - has been reported from much of the Old World
distribution of B. tabaci and has been shown, in some cases, to imposesignificant mortality on whitefly populations (eg Abdelrahman, 1986).
Information on how insecticides affect E. mundus is very fragmentory,
the only comprehensive data of potential relevance being that from
laboratory bioassays against Encarsia formosa, the standard biocontrolagent for glasshouse whitefly, Trialeurodes vaporariorum (Oomen, 1989). In
this paper, we describe new techniques for studying interactions between B.
tabaci and E.mundus in both the presence and absence of insecticides under
simulated field conditions in the laboratory.
1003
8C—3
MATERIALS AND METHODS
Field simulators
'Field simulators’ (Rowland et al., 1990) consist of three contiguous
units: a sprayer in its metal housing unit at the front; a central cage
holding plants and insects; and a plenum chamber at the rear housing a 0.3m
diameter fan to draw air uniformly through the cage simulating a light
breeze. The cage itself (1.7 x 1.2 x 1.0 m) is glazed with perspex, but has
fine steel mesh at each end to provide ventilation. Banks of fluorescentand tungsten lights to promote plant growth are mounted above the roof of
each cage, and provide an 18h photoperiod within the simulators.
Temperature in the surrounding room is maintained at 26+1°C.
Insect strains
The SUD-R B. tabaci strain used for this work was collected fromsprayed cotton in the Sudan in 1987. Despite being reared at Rothamsted
without further insecticide pressure, it has maintained low (3-5 fold)
resistance to pyrethroids and moderate (20-40 fold) resistance to the
organophosphates profenofos and monocrotophos (M. Cahill, unpublisheddata). E. mundus was collected from Israeli cotton in 1990, and has since
been cultured in large numbers using SUD-R B. tabaci as hosts.
Establishment and monitoring of experimental populations
Experiments are initiated by releasing 100 B. tabaci females ontoeight cotton (cv. Deltapine) plants at the 2-3 node stage spaced evenly on
the floor of each cage. Adult parasitoids are added 10 days later, at anstarting density of 50 females/cage (Birnie and Denholm, 1992), to coincide
with the first cohort of immature whiteflies reaching the preferred stage
for parasitism by E. mundus.
Following release, whitefly numbers are monitored at least twice-
weekly by counting adults through a rigid 55 cm borescope (Olympus KeymedLtd.) inserted through brush-bordered apertures in the cage wall (Rowland
et al., 1990). Adult parasitoids, which are smaller than whiteflies and
better camouflaged against the leaf surface, are assessed at similar
intervals by viewing insects through a small mirror held obliquely to an
illuminated leaf surface. Both techniques entail minimal disturbance to
insects and plants.
Application of insecticide
Insecticides are applied using an track-mounted sprayer running onrails in the roof of each cage (Rowland et al., 1990). For work reported
below, commercial formulations of cypermethrin ('Polytrin’; Ciba Geigy AG)or profenofos (‘'Curacron’; Ciba Geigy AG) were diluted with distilled water
and applied at recommended field rates of 50 and 500g a.i./ha respectively,28 and 35 days after the initial release of whiteflies into the simulators.
Design of simulator experiments
Sustaining experiments for a sufficient period (ca. 60 days) to discern how
insecticides affect at least one post-treatment generation of pests and
parasitoids imposes a major constraint on the number and scale of trialsthat can be conducted. Decisions regarding controls are of particular
1004
importance in this respect, since in each trial there are four levels of
complexity that could potentially be compared simultaneously: (i)whiteflies alone; (ii) whiteflies + parasitoids; (iii) whiteflies +
pesticide; and (iv) whiteflies + parasitoids + pesticide. Having proved
highly predictable in preliminary trials, the first of these is now judgedunnecessary. Combination (ii), although very repeatable over time, provides
a valuable check on the comparability of trials. Combinations (iii) and(iv) appear essential for an adequate evaluation of a test compound againstboth species. Thus, in recent experiments, two simulators have incorporated
each of combinations (iii) and (iv), with a fifth containing combination
(ii) acting as the major control. To illustrate the development of this
approach, all four possible combinations are presented below.
RESULTS AND DISCUSSION
No insecticide applied
In the absence of parasitoids and any insecticide application,
whitefly numbers show a characteristic pattern whereby a slow initial
decline in the number of the founders is followed by a sharp increase fromday 17 onwards as adult progeny appear in the cage (Figure la). Emergence
of the next generation from ca. day 37 onwards results in adult numbersrapidly exceeding 10,000/cage. Accumulation of honeydew then becomes a
major factor limiting further growth, and greatly impedes the accuracy and
ease of population monitoring.
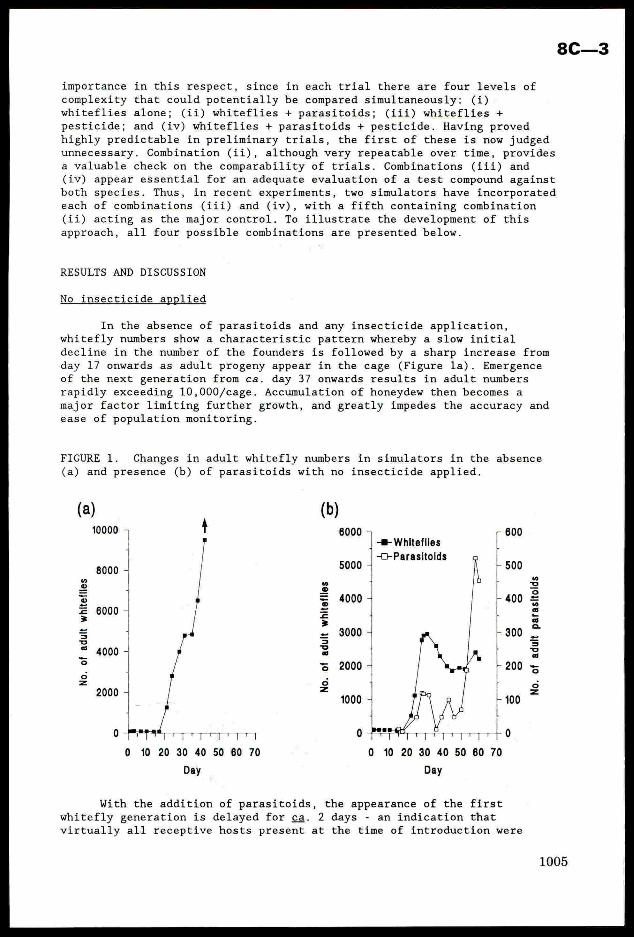
FIGURE 1. Changes in adult whitefly numbers in simulators in the absence
(a) and presence (b) of parasitoids with no insecticide applied.
(a) (b)10000
| -& Whiteflies
++ Parasitolds
8000
6000
No.
ofad
ult
whliteflles
No.
ofadult
whit
eflies
No.
ofad
ult
parasitolds
0 + T
0 10 20 30 40 50 60 70 0 10 20 30 40 50 60 70
Day Day
With the addition of parasitoids, the appearance of the firstwhitefly generation is delayed for ca. 2 days - an indication that
virtually all receptive hosts present at the time of introduction were
8C—3
successfully parasitized - and there is little or no further increase in
whitefly numbers over subsequent generations (Figure 1b). The first
generation of £. mundus adults appears ca. day 26-28, coinciding very
closely with the first wave of second generation host larvae reaching the
preferred age for parasitism. This 'plateauing’ of whitefly numbers appears
due to the similar development times of the two species enabling £. mundus
to track whitefly development sufficiently closely to maintain the host at
a relatively constant population size (L.C. Birnie, unpublished data).
The initial extent of this suppression is very dependent on the
starting density of parasitoids (Birnie and Denholm, 1992). The density
used here (50 females/cage), and now adopted routinely, appears optimal for
establishing E. mundus in the cages, yet avoiding it reducing B. tabaci to
the extent that insecticide effects would not be readily discernible.
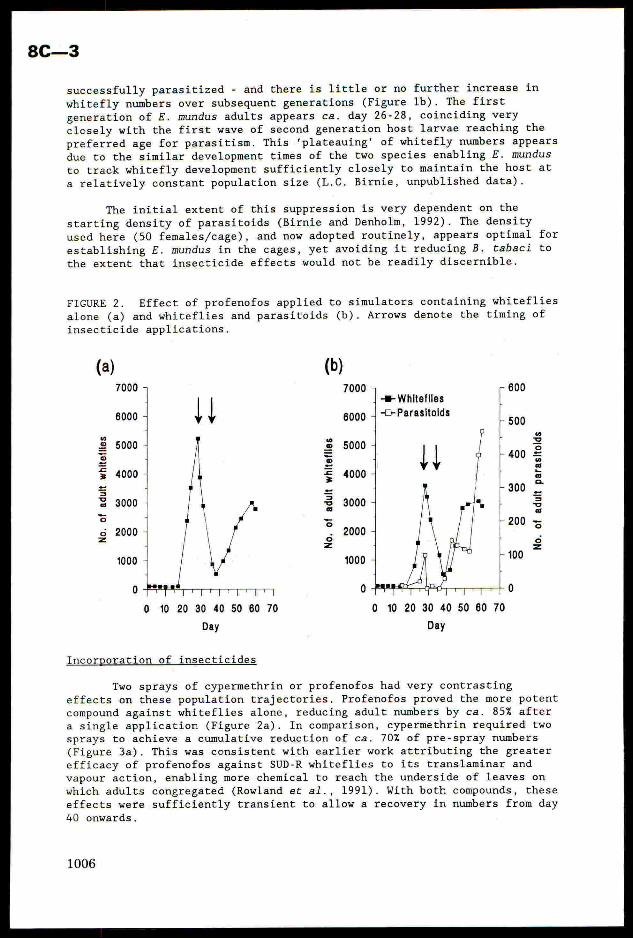
FIGURE 2. Effect of profenofos applied to simulators containing whiteflies
alone (a) and whiteflies and parasitoids (b). Arrows denote the timing of
insecticide applications.
(a) (b)-# Whiteflies
| | --Parasitoids
“
£=o==
=
==molos
-°
Soz
No.
ofad
ult
whiteflles
No.
ofad
ult
para
sito
lds
PTT0 10 20 30 40 50 60 70 0 10 20 30 40 50 60 70
Day Day
Incorporation of insecticides
Two sprays of cypermethrin or profenofos had very contrastingeffects on these population trajectories. Profenofos proved the more potentcompound against whiteflies alone, reducing adult numbers by ca. 85% aftera single application (Figure 2a). In comparison, cypermethrin required two
sprays to achieve a cumulative reduction of ca. 70% of pre-spray numbers
(Figure 3a). This was consistent with earlier work attributing the greaterefficacy of profenofos against SUD-R whiteflies to its translaminar and
vapour action, enabling more chemical to reach the underside of leaves onwhich adults congregated (Rowland et al., 1991). With both compounds, these
effects were sufficiently transient to allow a recovery in numbers from day
40 onwards.
1006
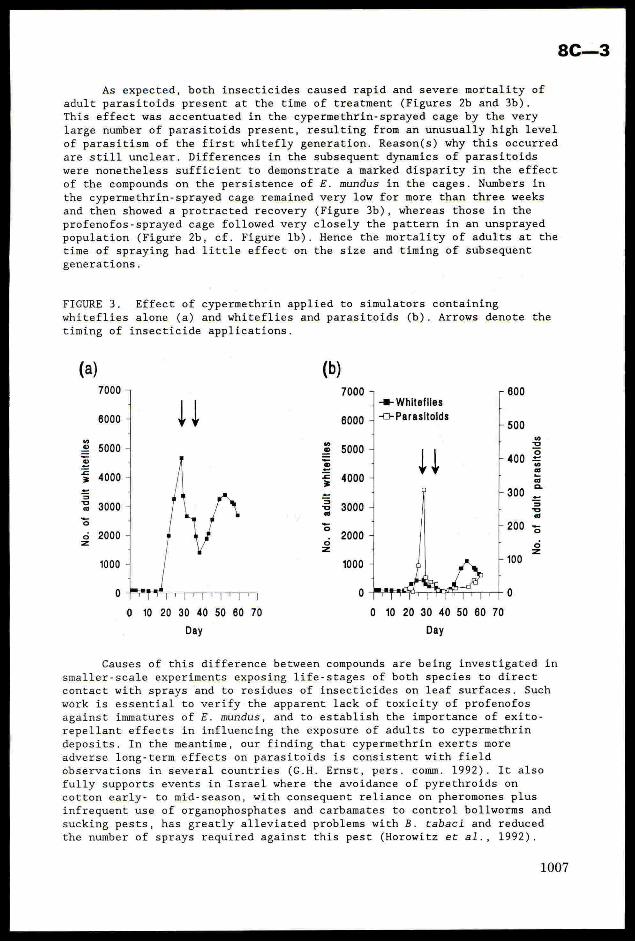
As expected, both insecticides caused rapid and severe mortality of
adult parasitoids present at the time of treatment (Figures 2b and 3b).
This effect was accentuated in the cypermethrin-sprayed cage by the very
large number of parasitoids present, resulting from an unusually high level
of parasitism of the first whitefly generation. Reason(s) why this occurred
are still unclear. Differences in the subsequent dynamics of parasitoids
were nonetheless sufficient to demonstrate a marked disparity in the effectof the compounds on the persistence of FE. mundus in the cages. Numbers in
the cypermethrin-sprayed cage remained very low for more than three weeks
and then showed a protracted recovery (Figure 3b), whereas those in the
profenofos-sprayed cage followed very closely the pattern in an unsprayedpopulation (Figure 2b, cf. Figure 1b). Hence the mortality of adults at the
time of spraying had little effect on the size and timing of subsequent
generations.
FIGURE 3. Effect of cypermethrin applied to simulators containing
whiteflies alone (a) and whiteflies and parasitoids (b). Arrows denote the
timing of insecticide applications.
(a) (b)7000 5 7000 5
1 | -& Whiteflies6000 - | | 6000 1 ++ Parasitolds
4
5000 | | |
4000 -
5000 -
4000 +
3000 + | {‘
2000 - 1
1000 ~ 1000 —
3000 +
2000 -
“2=o=<==
=Ssoa
3
3=
No.
ofad
ult
whit
efll
es
No.
ofad
ult
parasitolds
0
S
(kialicaLnLD 0-H =! + 0
0 10 20 30 40 50 60 70 0 10 20 30 40 50 60 70
Day Day
Causes of this difference between compounds are being investigated in
smaller-scale experiments exposing life-stages of both species to directcontact with sprays and to residues of insecticides on leaf surfaces. Such
work is essential to verify the apparent lack of toxicity of profenofos
against immatures of E. mundus, and to establish the importance of exito-
repellant effects in influencing the exposure of adults to cypermethrin
deposits. In the meantime, our finding that cypermethrin exerts more
adverse long-term effects on parasitoids is consistent with fieldobservations in several countries (G.H. Ernst, pers. comm. 1992). It also
fully supports events in Israel where the avoidance of pyrethroids oncotton early- to mid-season, with consequent reliance on pheromones plus
infrequent use of organophosphates and carbamates to control bollworms and
sucking pests, has greatly alleviated problems with B. tabaci and reduced
the number of sprays required against this pest (Horowitz et al., 1992).
1007
8C—3
CONCLUSIONS
Based on experience to date, the simulators offer exciting scope as
IPM research tools, providing opportunities to compare chemicals with
contrasting properties and active against different life-stages under
realistic conditions in the laboratory. Despite obvious limitations imposed
by the cost of equipment and the time-scale of experiments (Birnie and
Denholm, 1992), we forsee that the present system, or derivations of it,
could contribute greatly to work on several other natural enemies and
phytophagous pest species.
ACKNOWLEDGEMENTS
We thank Stephen Moore for invaluable technical assistance, and the
UK Natural Resources Institute for financial support of this work.
REFERENCES
Abdelrahman, A.A. (1986) The potential of natural enemies of the cotton
whitefly in the Sudan Gezira. Insect Science and its Application, 7,
69-73.
Birnie, L.C.; Denholm, I. (1992) Field simulators: A novel approach to
evaluating the impact of pesticides on beneficial arthropods in the
laboratory. Aspects of Applied Biology, 31, (in press).
Byrne, F.J.; Denholm, I.; Birnie, L.C.; Devonshire, A.L.; Rowland, M.
(1992) Analysis of insecticide resistance in the whitefly, Bemisia
tabaci. In Resistance ‘91: Achievements and Developments in Combating
Pesticide Resistance, I. Denholm, A.L. Devonshire & D.W. Hollomon
(Eds), Elsevier, Barking, UK. pp 165-178.
Dittrich, V.; UK, S.; Ernst, G.H. (1990) Chemical control and insecticide
resistance of whiteflies. In: Whiteflies: Bionomics, Pest Status and
Management, D. Gerling (Ed.), Intercept, Andover, UK. pp 263-286.
Eveleen, K.G. (1983) Cotton-insect control in the Sudan Gezira: analysis of
a crisis. Crop Protection, 2, 273-287.
Gameel, 0.1. (1969) Studies on whitefly parasites Encarsia lutea and
Eretmocerus mundus. Revue de zoologie et de botanique africaines, 79,
65-77.Gerling, D (1990) Natural enemies of whiteflies: predators and parasitoids.
In: Whiteflies: Bionomics, Pest Status and Management, D. Gerling
(Ed.), Intercept, Andover, UK. pp 147-185.
Horowitz, A.R.; Ishaaya, I.; Forer, G. (1992) Insecticide resistance
management strategy in cotton fields in Israel. Resistant Pest
Management Newsletter, 4, 26-27.
Oomen, P. (1989) Guideline for the evaluation of side-effects of plant
protection products-Encarsia formosa. Bulletin of the European and
Mediterranean Plant Protection Organisation, 19, 355-372.
Rowland, M.; Hackett, B.; Stribley, M. (1991) Evaluation of insecticides in
field-control simulators and standard laboratory bioassays against
resistant and susceptible Bemisia tabaci (Homoptera: Aleyrodidae)
from Sudan. Bulletin of Entomological Research, 81, 189-199.Rowland, M.; Pye, B.; Stribley, M.; Hackett, B.; Denholm, I.; Sawicki, R.M.
(1990) Laboratory apparatus and techniques for the rearing and
insecticidal treatment of whitefly Bemisia tabaci under simulated
field conditions. Bulletin of Entomological Research, 80, 209-216.
BRIGHTON CROP PROTECTION CONFERENCE—Pests and Diseases—1992
DEVELOPMENT OF AN INTEGRATED CONTROL STRATEGY FOR SUMMER APHIDS IN WINTER
WHEAT.
J.N. OAKLEY
ADAS Bridgets, Martyr Worthy, Winchester, Hampshire, S021 1AP
ABSTRACT
Trials on the integration of selective aphicides with naturallyoccurring populations of aphid specific predators and parasites have
been carried out in England from 1990 to 1992. Trials compared the
efficacy of commercially recommended rates of pirimicarb and
alpha-cypermethrin with substantially reduced rates when applied at
flag leaf emergence or early flowering stages. The results
demonstrate a good control of aphid infestations by parasitoids bythe grain filling stages where aphids had overwintered on the crop,
with no response to treatments. Where parasitoids were present, but
visible parasitism was below critical levels, the use of low rate
specific aphicides gave similar levels of control to that given by
recommended rates. Where levels of parasitism were very low full
rate aphicides were required to control aphid reproduction.
INTRODUCTION
The use of reduced rate selective aphicides to restrict aphidpopulation growth with minimal effects on aphid predators and parasitoids
was proposed by Poehling (1987). Field trials in Germany between 1983
and 1988 demonstrated that under certain circumstances a better economic
return could be obtained by using reduced quantities of activeingredients (Mann ef al., 1991). A series of field trials were done in
England between 1990 and 1992 applying either the full recommended rate
or a reduced rate of insecticides at two timings against naturally
eccurring aphid populations. This was to establish whether reduced rates
were applicable under English conditions and to define the circumstances
under which reduced rate applications were viable.
MATERIALS AND METHODS
Sites were located in 15 farm crops as detailed in Table 1. Apart
from insecticides applied during the summer, inputs were according to
normal farm practice. Treatments consisted of pirimicarb (Aphox), at
full (140 g Al/ha) or reduced (25 g Al/ha) rates, or alpha-cypermethrin
(Fastac er Acquit), at full (15 g Al/ha) or reduced (5 g Al/ha) rates.
Each treatment was applied to separate plots at flag leaf emergence (GS
37, Tottman & Makepeace 1979) or early flowering (GS 61). Sprays were
applied by Oxford precision or motorised knapsack sprayer in 200 1 of
water/ha using medium quality spray nozzles and pressures of 2-3 bar.
Plots were 4 by 24 metres with 0.5 metre paths, and were laid out in
randomised blocks with 4 replications.
8C—4
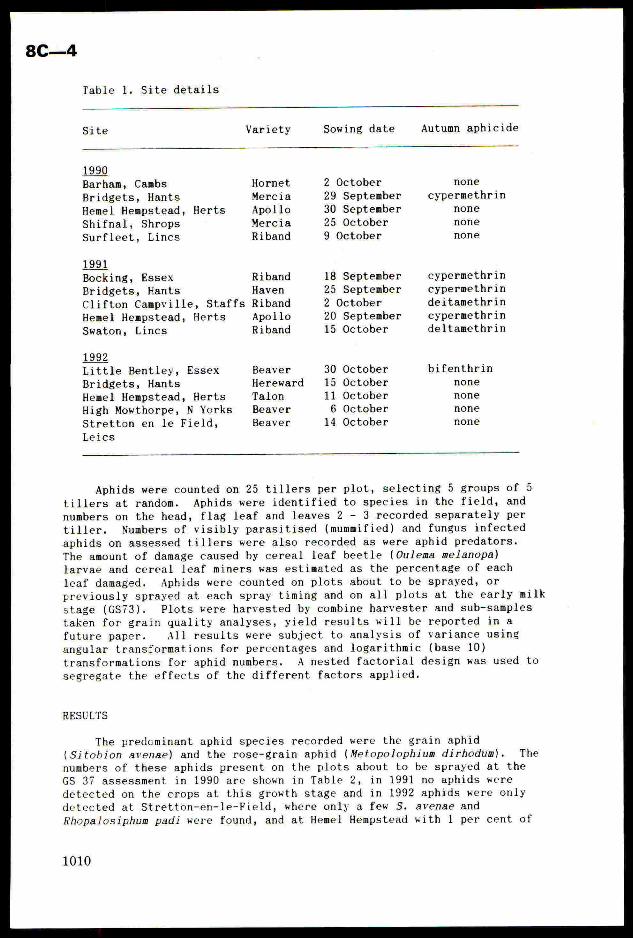
Table 1. Site details
Site Variety Sowing date Autumn aphicide
199
Barham, Cambs Hornet 2 October none
Bridgets, Hants Mercia 29 September cypermethrin
Hemel Hempstead, Herts Apollo 30 September none
Shifnal, Shrops Mercia 25 October none
Surfleet, Lincs Riband 9 October none
1991
Bocking, Essex Riband 18 September cypermethrin
Bridgets, Hants Haven 25 September cypermethrin
Clifton Campville, Staffs Riband 2 October deitamethrin
Hemel Hempstead, Herts Apollo 20 September cypermethrin
Swaton, Lincs Riband 15 October deltamethrin
199
Little Bentley, Essex Beaver 30 October bifenthrin
Bridgets, Hants Hereward 15 October none
Hemel Hempstead, Herts Talon 11 October none
High Mowthorpe, N Yorks Beaver 6 October none
Stretton en le Field, Beaver 14 October none
Leics
Aphids were counted on 25 tillers per plot, selecting 5 groups of 5
tillers at random. Aphids were identified to species in the field, and
numbers on the head, flag leaf and leaves 2 - 3 recorded separately per
tiller. Numbers of visibly parasitised (mummified) and fungus infected
aphids on assessed tillers were also recorded as were aphid predators.
The amount of damage caused by cereal leaf beetle (Oulema melanopa)
larvae and cereal leaf miners was estimated as the percentage of each
leaf damaged. Aphids were counted on plots about to be sprayed, or
previously sprayed at each spray timing and on all plots at the early milk
stage (GS73). Plots were harvested by combine harvester and sub-samples
taken for grain quality analyses, yield results will be reported in a
future paper. All results were subject to analysis of variance using
angular transformations for percentages and logarithmic (base 10)
transformations for aphid numbers. A nested factorial design was used to
segregate the effects of the different factors applied.
RESULTS
The predominant aphid species recorded were the grain aphid
(Sitobion avenae) and the rose-grain aphid (Metopolophium dirhodum). The
numbers of these aphids present on the plots about to be sprayed at the
GS 37 assessment in 1990 are shown in Table 2, in 1991 no aphids were
detected on the crops at this growth stage and in 1992 aphids were only
detected at Stretton-en-le-Field, where only a few S. avenae and
Rhopalosiphum padi were found, and at Hemel Hempstead with 1 per cent of
1010
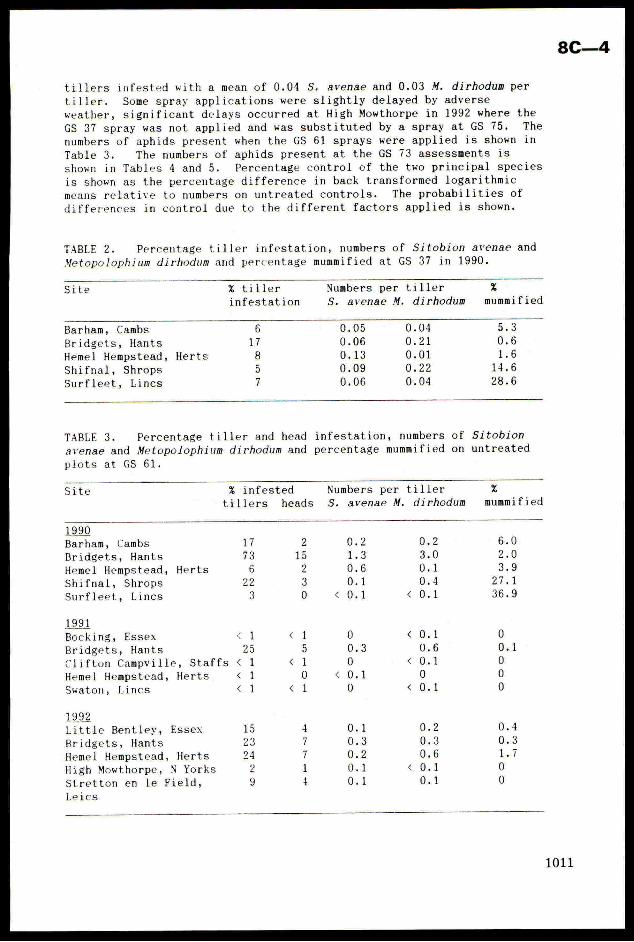
tillers infested with a mean of 0.04 S. avenae and 0.03 M. dirhodum per
tiller. Some spray applications were slightly delayed by adverse
weather, significant delays occurred at High Mowthorpe in 1992 where the
GS 37 spray was not applied and was substituted by a spray at GS 75. The
numbers of aphids present when the GS 61 sprays were applied is shown in
Table 3. The numbers of aphids present at the GS 73 assessments is
shown in Tables 4 and 5. Percentage control cf the two principal species
is shown as the percentage difference in back transformed logarithmic
means relative to numbers on untreated controls. The probabilities of
differences in control due to the different factors applied is shown.
TABLE 2. Percentage tiller infestation, numbers of Sitobion avenae and
Metopolophium dirhodum and percentage mummified at GS 37 in 1990.
Site % tiller Numbers per tiller %infestation S. avenae M. dirhodum mummified
Barham, Cambs 0.05 0.04
Bridgets, Hants 0.06 0.21
Heme] Hempstead, Herts 0.13 0.01
Shifnal, Shrops 0.09 0.22
Surfleet, Lincs 0.06 0.04
TABLE 3. Percentage tiller and head infestation, numbers of Sitobion
avenae and Metopolophium dirhodum and percentage mummified on untreated
plots at GS 61.
Site % infested Numbers per tiller %
tillers heads S. avenae M. dirhodum mummified
1990Barham, Cambs 17
Bridgets, Hants no
Hemel Hempstead, Herts 6
Shifnal, Shrops 22
Surfleet, Lincs 3
1991Bocking, Essex
Bridgets, Hants
Clifton Campville, Staffs
Hemel Hempstead, Herts
Swaton, Lincs
1992Little Bentley, Essex
Bridgets, Hants
Hemel Hempstead, HertsHigh Mowthorpe, N Yorks
Stretton en le Field,
Leics
8C—4
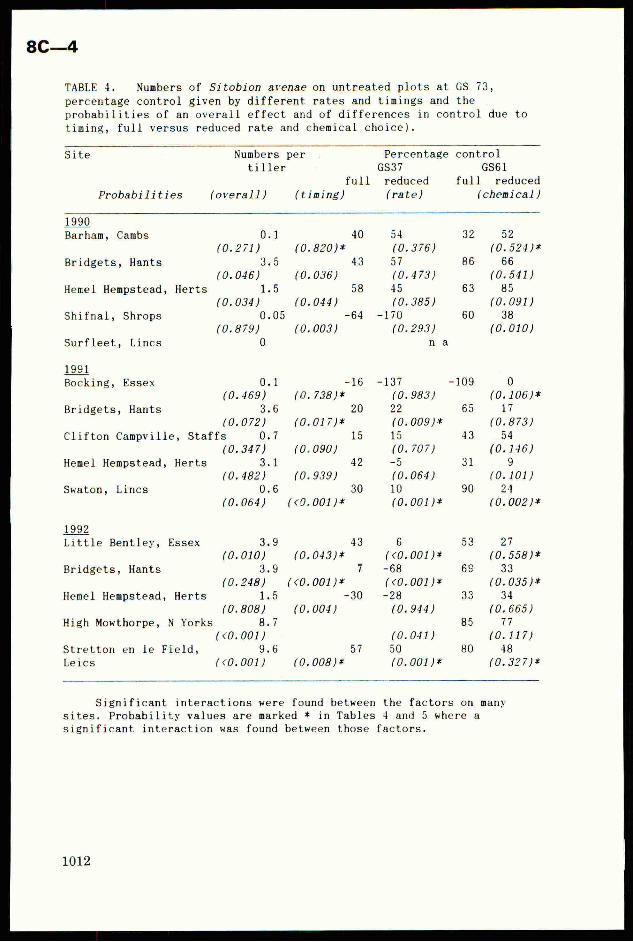
TABLE 4. Numbers of Sitobion avenae on untreated plots at GS 73,
percentage control given by different rates and timings and the
probabilities of an overall effect and of differences in control due to
timing, full versus reduced rate and chemical choice).
Site Numbers per Percentage control
tiller GS37 GS61
full reduced full reduced
Probabilities (overall) (timing) (rate) (chemical)
99Barham, Cambs 0.1 a4 é 52
(0.271) ‘ (0. (0.524 )*
Bridgets, Hants Ries] : 57 66
(0.046) ‘ (0,475 (0.541)
Hemel Hempstead, Herts 1.5 45 85
(0.034) 3 (0. (0.091)
Shifnal, Shrops 0.05 4 -170 38
(0.879) , (0. (0.010)Surfleet, Lincs 0
1991Bocking, Essex Oak 5 0
(0.469) (0. (0. (0.106)*Bridgets, Hants 3.6 Z2 I7
(0.072) (0. (0. (0.873)
Clifton Campville, Staffs 057 15 54(0.347) (0. (0. (0.146)
Hemel Hempstead, Herts Be L d -5 9
(0.482) (0. (0. (0.101)
Swaton, Lincs 0.6 10 24
(0.064) (<0. (0. (0,002 )*
99Little Bentley, Essex 39 6 27
(0.010) (0. (<0.001)* (0.558) *Bridgets, Hants 3.9 -68 33
(0.248) (<0. (<0.001)* (0.035 )*
Hemel Hempstead, Herts 1S -28 34
(0.808) (0. (0.944) (0.665)High Mowthorpe, N Yorks 8.7 } 77
(<0.001) (0.041) (0.117)
Stretton en le Field, 9.6 57 50 48
Leics (<0.001) (0.008)* (0.001)* (0.327)
Significant interactions were found between the factors on many
sites. Probability values are marked * in Tables 4 and 5 where a
significant interaction was found between those factors.
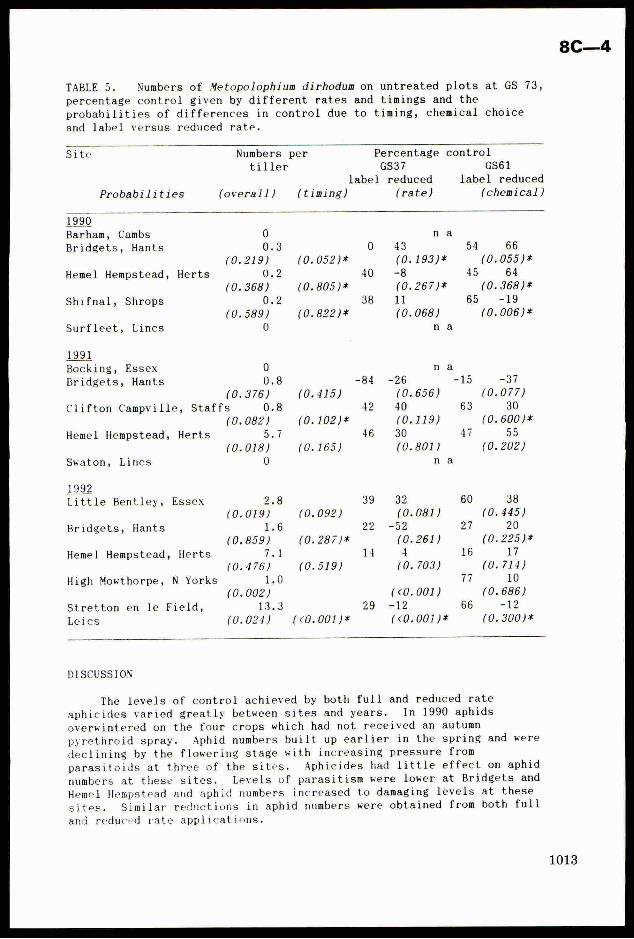
TABLE 5. Numbers of Metopolophium dirhodum on untreated plots at GS 73,
percentage control given by different rates and timings and theprobabilities of differences in control due to timing, chemical choice
and label versus reduced rate.
Site Numbers per Percentage controltiller GS37 GS61
label reduced label reduced
Probabilities (overall) (timing) (rate) (chemical)
1990Barham, Cambs
Bridgets, Hants
Hemel Hempstead, Herts
Shifnal, Shrops
Surfleet, Lincs
991Bocking, Essex
Bridgets, Hants
(03.8
Clifton Campville, Staffs
(0.
Hemel Hempstead, Herts(0.
Swaton, Lincs
1992
Little Bentley, Essex 38
445)
Bridgets, Hants 2% 20
-225)*
Hemel Hempstead, Herts . 17
714)
High Mowthorpe, N Yorks : 10
686)
Stretton en le Field, Bex ‘ é -12
Leics . - 300) *
DISCUSSION
The levels of control achieved by both full and reduced rate
aphicides varied greatly between sites and years. In 1990 aphids
overwintered on the four crops which had not received an autumn
pyrethroid spray. Aphid numbers built up earlier in the spring and were
declining by the flowering stage with increasing pressure from
parasitoids at three of the sites. Aphicides had little effect on aphid
numbers at these sites. Levels of parasitism were lower at Bridgets and
Hemel Hempstead and aphid numbers increased to damaging levels at these
sites. Similar reductions in aphid numbers were obtained from both full
and reduced rate applications.
8C—4
In 1991 no aphids were found to have overwintered at any of the
sites, all of which received autumn pyrethroid sprays. Aphid immigration
to the crops was delayed by cold, wet weather, and numbers on the crops
peaked late in the grain filling stages. Natural enemy effects were
less important and reduced rate aphicides were significantly less
effective than full rates in controlling S. avenae at two sites.
In 1992 few, or no, overwintered aphids were found on the sites.
Aphid immigration was earlier than in 1991 and potentially damaging aphidinfestations were recorded at all sites. Natural enemy levels were much
lower than in 1990 and reduced rate aphicides gave a significantly poorer
control than full rates at 4 sites.
Reduced rate aphicides were shown to be effective where natural
enemies were established within a field at intermediate levels which were
insufficient to give adequate control unaided. Where natural enemy
levels were slightly lower reduced rates were significantly less
effective. Whilst ‘mummy counts’ are known to give a variable estimate
of parasitism (Walton et al. 1990), the proportion of mummified aphids
found during assessment gave a useful indication of aphid build-up at
these sites and merits further investigation. More sophisticated
techniques of electrophoresis or rearing are available but would he too
slow to be of value either in experiments or commercially. Reduced rates
can not be recommended with confidence unless a reliable and economic
means of assessing natural enemy levels is established.
ACKNOWLEDGEMENTS
The author thanks the farmers concerned for providing sites and S.
Ellis, D. Green, M. Holliday, K. Walters, J. Young and colleagues in ADAS
and CSL for managing sites. This work was funded by the Pesticides
Safety Division of MAFF as part of project PIO0101.
REFERENCES
Mann, B.P.; Wratten, S.D.; Poehling, M.; Borgemeister, C. (1991) The
economics of reduced-rate insecticide applications to control aphids
in winter wheat. <Annals of Applied Biology, 119, 451-464.
Poehling, H.M. (1987) Effects of reduced dose rates of pirimicarb and
fenvalerate on aphids and beneficial arthropods in winter wheat.
Bulletin SROP, 10, 75-82.
Tottman, D.R.; Makepeace, R.J. (1979) An explanation of the decimal
code for the growth stages of cereals, with illustrations. Annals
of Applied Biology, 93, 221-234.
Walton, M.P.; Powell, W.; Loxdale, H.D.; Allen-Williams L. (1990)
Electrophoresis as a tool for estimating levels of hymenopterousparasitism in field populations of the cereal aphid, Sitobion
avenae. Entomologica experimentalis et applicata, 54, 271-279.
BRIGHTON CROP PROTECTION CONFERENCE—Pests and Diseases—1992
SUPERVISED CONTROL OF FOLIAR PESTS IN BRASSICA CROPS
J. A. BLOOD SMYTH
ADAS March, 93A High Street, March, Cambs, PE15 9LT
B. J. EMMETT
ADAS Leeds, Government Buildings, Lawnswood, Leeds, LS16 5PY
A. MEAD
HRI Wellesbourne, Wellesbourne, Warks, CV35 9EF
ABSTRACT
Damage thresholds were tested for cabbage aphid (Brevicoryne
brassicae) and cabbage caterpillars, mainly large white
butterfly (Pieris brassicae), small white butterfly
(Pieris rapae), diamond-back moth (Plutella xylostella) and
cabbage moth (Mamestra brassicae) in crops of cabbage,
calabrese and Brussels sprouts. In three of the seven
experiments the systematic sampling method (Hommes et al.,
1988) was adopted. In the remainder a sequential sampling
method was tested (Theunissen, 1988). Spray treatments
were reduced from a mean of 6.1 applications on routinely-
treated plots to means of 0.85 and 1.6 for aphid and
caterpillar control respectively on the supervised plots.
Percentage marketable produce was greatest from routinely-
treated plots. There was unacceptable internal pest damage
in calabrese spears, eg small white butterfly caterpillar
damage and in Brussels sprouts buttons eg cabbage aphid at
three of the sites.
On the basis of this work the thresholds will be modified to
reflect changing susceptibility to pests at different plant
growth stages. The sequential sampling method will be used
to permit more rapid assessments than are feasible with the
systematic method.
INTRODUCTION
There is increasing pressure on growers to reduce insecticide
input, yet produce blemish-free produce. On market brassicas in the
UK there is widespread routine spraying for control of aphids and
caterpillars (Thomas, Davis and Garthwaite 1992), because there are no
proven and established treatment thresholds.
The aim of the work is to evaluate different sampling methods for
monitoring cabbage aphid (Brevicoryne brassicae) and cabbage
caterpillars mainly the small white butterfly (Pieris rapae), large
white butterfly (Pieris brassicae), green-veined white butterfly
(Pieris napi), garden pebble moth (Evergestis forficalis) diamond-back
moth (Plutella xylostella) and cabbage moth (Mamestra brassicae) and
8C—5
to establish robust treatment thresholds. The 3 year MAFF
(Ministry of Agriculture, Fisheries and Food)-funded project involves
collaboration between entomologists and horticulturalists at ADAS
Arthur Rickwood Experimental Husbandry Farm and HRI (Horticulture
Research International) Kirton, Stockbridge House and Wellesbourne.
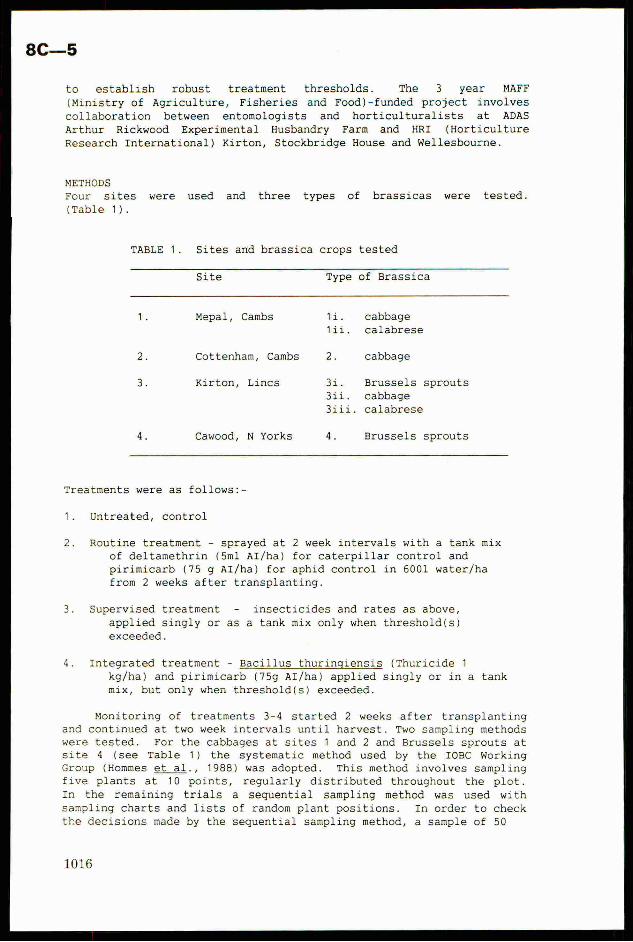
METHODS
Four sites were used and three types of brassicas were tested.
(Table 1).
TABLE 1. Sites and brassica crops tested
Site Type of Brassica
Mepal, Cambs L cabbage
calabrese
Cottenham, Cambs 3 cabbage
Kirton, Lincs L. Brussels sprouts
cabbage
calabrese
Cawood, N Yorks : Brussels sprouts
Treatments were as follows:-
Untreated, control
Routine treatment - sprayed at 2 week intervals with a tank mix
of deltamethrin (5ml AI/ha) for caterpillar control and
pirimicarb (75 g AI/ha) for aphid control in 6001 water/ha
from 2 weeks after transplanting.
Supervised treatment - insecticides and rates as above,
applied singly or as a tank mix only when threshold(s)
exceeded.
Integrated treatment - Bacillus thuringiensis (Thuricide 1
kg/ha) and pirimicarb (75g AI/ha) applied singly or in a tank
mix, but only when threshold(s) exceeded.
Monitoring of treatments 3-4 started 2 weeks after transplanting
and continued at two week intervals until harvest. Two sampling methods
were tested. For the cabbages at sites 1 and 2 and Brussels sprouts at
site 4 (see Table 1) the systematic method used by the IOBC Working
Group (Hommes et_al., 1988) was adopted. This method involves sampling
five plants at 10 points, regularly distributed throughout the plot.
In the remaining trials a sequential sampling method was used with
sampling charts and lists of random plant positions. In order to check
the decisions made by the sequential sampling method, a sample of 50
1016
plants was always assessed. The results were transferred to sampling
charts.
Sampling charts were constructed using theory based on Wald’s
Sequential Probability Ratio Test (Wald, 1947) and the practice of
Dutch scientists (Theunissen, 1988). In the charts the x-axis
represented the accumulated sample size and the y-axis represented the
difference between the number of infested plants and the number of
non-infested plants. The chart was divided into three areas by two
parallel lines representing the upper and lower thresholds, the upper
threshold being 10% above the lower threshold. The slopes of the
lines depended on the values of the thresholds. The distance between
the parallel lines depended on both the values of the thresholds and
the probabilities of under or overestimating the pest population (set
to 0.05).
Using the sampling charts sampling continued until:-
either 1. The upper line was crossed - treatment necessary.
or 2. The lower line was crossed - treatment unnecessary.
or 3. The maximum sample size was reached (resample a week later).
Each selected plant was examined for presence or absence of live,
wingless cabbage aphid and live caterpillars. The thresholds tested
were 10% infested plants for the first two sample dates and 5%
infested for further samples until harvest for both aphids and total
caterpillars.
Assessments of yield and percentage marketability were made at
harvest.
Assessments of internal damage were made eg samples of calabrese
spears and Brussels sprout buttons.
RESULTS AND DISCUSSION
Spray treatments for aphid control were reduced from a mean of
6.1 (range 3-10) on routinely-sprayed plots to 0.85 (range 0-2) on
supervised plots. Spray treatments for control of caterpillars were
reduced from a mean of 6.1 (range 3-10) on routinely-treated plots to
1.6 (range 0-3) on the supervised plots.
There was a very late spring migration of cabbage aphid as
indicated by the Rothamsted Insect Survey (M. Tatchell, Pers.comm.).
Caterpillar pests, especially small white butterfly and diamond-back
moth built up slowly.
The percentage marketable produce (free from pests and pest
damage) was greater from routine than from supervised plots (Table
2) This assessment of marketability did not include internal
pest damage. Cabbage aphids were found under wing leaves of Brussels
sprouts buttons on the lower third of the stem at 10% on the
supervised plots and 0.7% on the routinely-sprayed plots. The
anomalous result in trial 1i. was due to a localised and severe attack
by caterpillars of green-veined white butterfly (Pieris napi). The
percentage marketable produce was less on supervised plots than
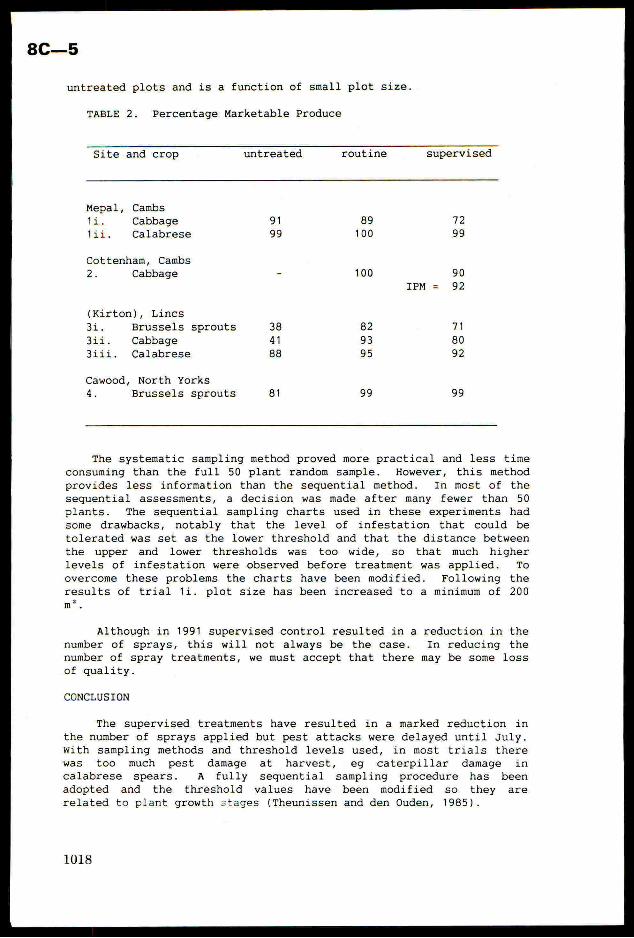
8C—5
untreated plots and is a function of small plot size.
TABLE 2. Percentage Marketable Produce
Site and crop untreated routine supervised
Mepal, Cambs
1i. Cabbage
lii. Calabrese
Cottenham, Cambs
2. Cabbage
(Kirton), Lincs
Bi. Brussels sprouts
3ii. Cabbage
3iii. Calabrese
Cawood, North Yorks
4. Brussels sprouts
The systematic sampling method proved more practical and less time
consuming than the full 50 plant random sample. However, this method
provides less information than the sequential method. In most of the
sequential assessments, a decision was made after many fewer than 50
plants. The sequential sampling charts used in these experiments had
some drawbacks, notably that the level of infestation that could be
tolerated was set as the lower threshold and that the distance between
the upper and lower thresholds was too wide, so that much higher
levels of infestation were observed before treatment was applied. To
overcome these problems the charts have been modified. Following the
results of trial 1i. plot size has been increased to a minimum of 200
m*.
Although in 1991 supervised control resulted in a reduction in thenumber of sprays, this will not always be the case. In reducing the
number of spray treatments, we must accept that there may be some loss
of quality.
CONCLUSION
The supervised treatments have resulted in a marked reduction in
the number of sprays applied but pest attacks were delayed until July.
With sampling methods and threshold levels used, in most trials there
was too much pest damage at harvest, eg caterpillar damage in
calabrese spears. A fully sequential sampling procedure has been
adopted and the threshold values have been modified so they arerelated to plant growth stages (Theunissen and den Ouden, 1985).
ACKNOWLEDGEMENTS
The authors thank J. Davies, HRI Stockbridge House, C. Paterson,
HRI Kirton, S. Runham, ADAS Arthur Rickwood Experimental Husbandry
Farm and M. Lole, ADAS Wolverhampton. The work was funded by MAFF
subcontracted from HRI.
REFERENCES
Hommes, M.; Dunne, R.; Ellis, P.R.; Fischer, J.; Kahrer, A.;
Terrataz, C. (1988)
Testing damage thresholds for caterpillars and aphids on cabbage
in five European countries - report on a collaborative project
done in 1985 and 1986. International Organisation for Biological
and Integrated Control of Noxious Animals and Plants. West
Palearctic Regional Section Bulletin. Working Group "Integrated
Control in Field Vegetable Crops" XI/I 118-126.
Theunissen, J. (1988)
Sequential sampling of insect pests in Brussels’ sprouts.
International Organisation for Biological and Integrated Control of
Noxious Animals and Plants. West Palearctic Regional Section
Bulletin. Working Group "Integrated Control in Field Vegetable Crops"XI/I, 111-117.
Theunissen, J.; Den Ouden, H. (1985)
Tolerance levels for supervised control of insect pests in
Brussels sprouts and white cabbage. Zeitschrift flr angewandte
Entomologie 100: 84-87.
Thomas, M.R.; Davis, R.P.; Garthwaite, D.G. (1992)
Survey Report 101. Vegetables for Human Consumption 1991. MAFF,
Ministry of Agriculture, Fisheries and Food.
Wald, A. (1947) Sequential Analysis, New York: Wiley.
BRIGHTON CROP PROTECTION CONFERENCE—Pests and Diseases—1992
THE DEVELOPMENT OF PRACTICAL AND APPROPRIATE IPM METHODS
FOR IRRIGATED RICE IN EASTERN INDIA.
G.C. GHOSH, M.H.ALI.
Hindustan Fertiliser Corporation, 52a Shakespeare Sarani, Calcutta, India
S.V. FOWLER.
International Institute of Biological Control (CAB International), Ascot SL5 7TA.
N.R. MASLEN.
Natural ResourcesInstitute, Chatham ME4 4TB.
ABSTRACT
The paperreports on progressin rice insect pest managementin the
Indo-British Fertiliser Education Project. Over 100 pest and natural enemy
taxa were identified. Established economic threshold levels were exceeded in
24% of the trials in farmersfields, by 7 pest types. The most frequent pests
were stemborers and planthoppers. Rice IPM systemsare often complex, but a
practical guide to methods of pest monitoring using simple economic
thresholds was developed. The guide includes step by step instructions and
clear photographs of key pests and natural enemies. These IPM methodsallow
a reduction in insecticide use, but sustain yields, giving 20% higher net
profits. Techniques for training farmers and extension workersare outlined,these concentrate on demonstrations of simple IPM methods in farmersfields.
INTRODUCTION
For 10 years the Indo-British Fertiliser Education Project (IBFEP) has operated in 6
states in eastern India. A major aim wasto improvethe yield andprofitability of irrigated
rice in this important rice producing region. Rice yields in eastern India have not increased as
muchasin other areas in responseto high yielding varieties and improved agronomic
methods (Barker & Pal, 1979). As the project progressed, inputs to rice cultivation increased,
and the need to improve the managementof insect pests, particularly brown planthopper
(Nilaparvata lugens), became apparent. Results from IBFEP Phase | (1982-7) showed that
yields and pest densities were increased by raised levels of nitrogenousfertilisers. However,economic threshold levels for insect pests were seldom exceeded, emphasising the
importance of need-basedinsecticide use (Chakraborty et al., 1990). Consequently, IBFEP
Phase 2 (1987-1992) included an integrated pest management (IPM) programmefor insect
pests ofirrigated rice. The IBFEP IPM programmeaimedto adaptexisting rice insect pest
managementtechnologyto local conditions. It operated in 6-8 villages in West Bengal and
Orissa each season,but has recently expandedto cover a total of 40 villages per season inWest Bengal, Orissa, Bihar and Assam.If the benefits to farmers are sustained, the
programmecould be enlarged to cover more villagesin this large rice producingregion.
8C—6
THE RICE FAUNA
The programmeidentified 56 insect herbivore species found commonly in D-Vac,
sweep andvisual samples. Extension staff consider planthoppers (PH) (N./ugens and
Sogatella furcifera), stemborers (SB) (mostly Scirpophagaincertulas), gall midge (Orseolia
oryzae), leaf-folders (mostly Cnaphalocrocis medinalis) and gundhi bug (GB)(Leptocorisa
spp.) as major pests. Cutworms/armyworms (CUT)(Lepidoptera; Noctuidae), leafhoppers
(GLH)(Nephotettix spp.), hispa (Dicladispa armigera), caseworm (CASE)(Nymphula
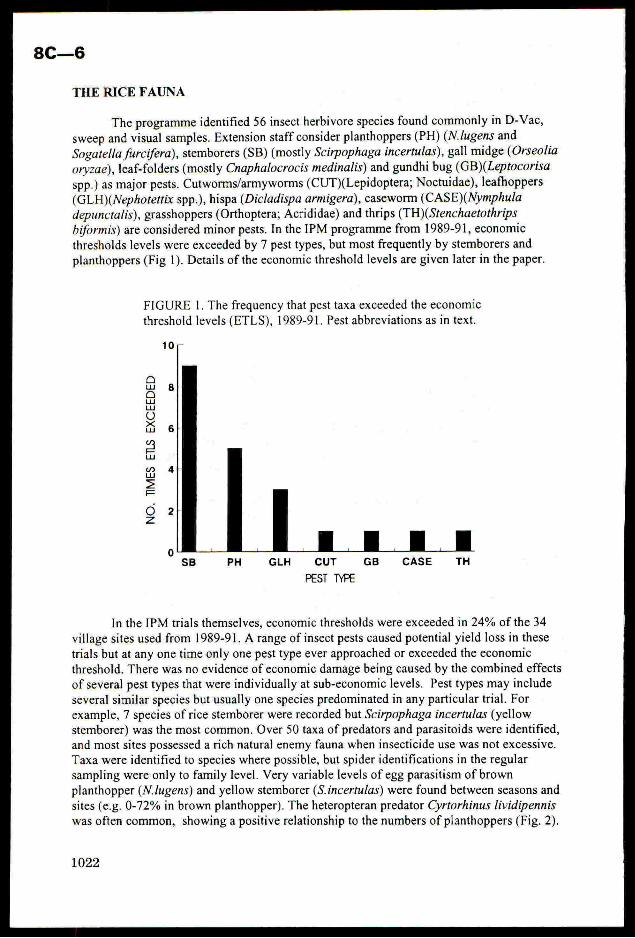
depunctalis), grasshoppers (Orthoptera; Acrididae) and thrips (TH)(Stenchaetothripsbiformis) are considered minorpests. In the IPM programmefrom 1989-91, economic
thresholds levels were exceeded by7 pest types, but most frequently by stemborers andplanthoppers (Fig 1). Details of the economic thresholdlevels are given later in the paper.
FIGURE 1. The frequencythat pest taxa exceeded the economic
threshold levels (ETLS), 1989-91. Pest abbreviations asin text.
10/;-
atualuWwOx<lw
BSnuw
=Ee
OZz a 1 a 4 a 1 a
PH GLH CUT GB CASE TH
PEST TYPE
In the IPM trials themselves, economic thresholds were exceeded in 24% ofthe 34
village sites used from 1989-91. A range of insect pests caused potential yield loss in these
trials but at any one time only onepest type ever approached or exceeded the economic
threshold. There was no evidence of economic damage being caused by the combinedeffects
of several pest types that were individually at sub-economiclevels. Pest types may include
several similar species but usually one species predominatedin any particulartrial. For
example, 7 species of rice stemborer were recorded but Scirpophagaincertulas (yellow
stemborer) was the most common.Over50 taxa of predators and parasitoids were identified,
and mostsites possessed rich natural enemy fauna when insecticide use was not excessive.
Taxa were identified to species where possible, but spider identifications in the regular
sampling were only to family level. Very variable levels of egg parasitism of brown
planthopper (N./ugens) and yellow stemborer (S.incertulas) were found between seasons and
sites (e.g. 0-72% in brown planthopper). The heteropteran predator Cyrtorhinus lividipennis
was often common, showinga positive relationship to the numbers of planthoppers (Fig.2).
1022
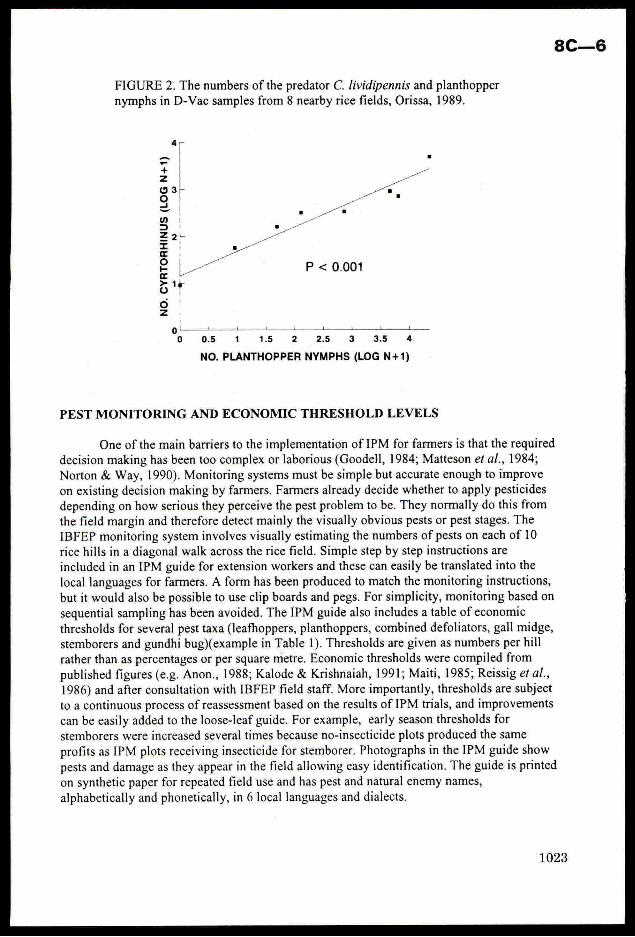
FIGURE 2. The numbersofthe predator C. /ividipennis and planthoppernymphs in D-Vac samples from 8 nearbyrice fields, Orissa, 1989.
eSa
no
P < 0.001
NO.CYRTORHINUS(LOGN+1)
r 4 40 1 4 1 1
0 0.5 1 1.5 2 2.5 3 3.5 4
NO. PLANTHOPPER NYMPHS(LOG N+1)
4
PEST MONITORING AND ECONOMIC THRESHOLD LEVELS
Oneofthe main barriers to the implementation of IPM for farmers is that the requireddecision making has been too complex or laborious (Goodell, 1984; Matteson et al., 1984;
Norton & Way, 1990). Monitoring systems must be simple but accurate enough to improve
on existing decision making by farmers. Farmers already decide whetherto apply pesticides
depending on howseriousthey perceive the pest problem to be. They normally do this from
the field margin and therefore detect mainly the visually obvious pests or pest stages. The
IBFEP monitoring system involves visually estimating the numbers ofpests on each of 10
rice hills in a diagonal walk acrossthe rice field. Simple step by step instructions are
included in an IPM guidefor extension workersand these can easily be translated into the
local languages for farmers. A form has been produced to match the monitoring instructions,
but it would also be possible to use clip boards and pegs. For simplicity, monitoring based onsequential sampling has been avoided. The IPM guide also includes a table of economic
thresholds for several pest taxa (leafhoppers, planthoppers, combined defoliators, gall midge,
stemborers and gundhi bug)(example in Table 1). Thresholds are given as numbersperhill
rather than as percentages or per square metre. Economic thresholds were compiled from
publishedfigures (e.g. Anon., 1988; Kalode & Krishnaiah, 1991; Maiti, 1985; Reissig et al.,
1986) andafter consultation with IBFEPfield staff. More importantly, thresholds are subject
to a continuousprocess of reassessmentbased on the results of IPM trials, and improvements
can beeasily addedto the loose-leaf guide. For example, early season thresholds for
stemborers were increased several times because no-insecticide plots produced the same
profits as IPM plots receiving insecticide for stemborer. Photographsin the IPM guide show
pests and damageasthey appearin the field allowing easy identification. The guide is printed
on synthetic paperfor repeated field use and has pest and natural enemy names,
alphabetically and phonetically, in 6 local languages anddialects.
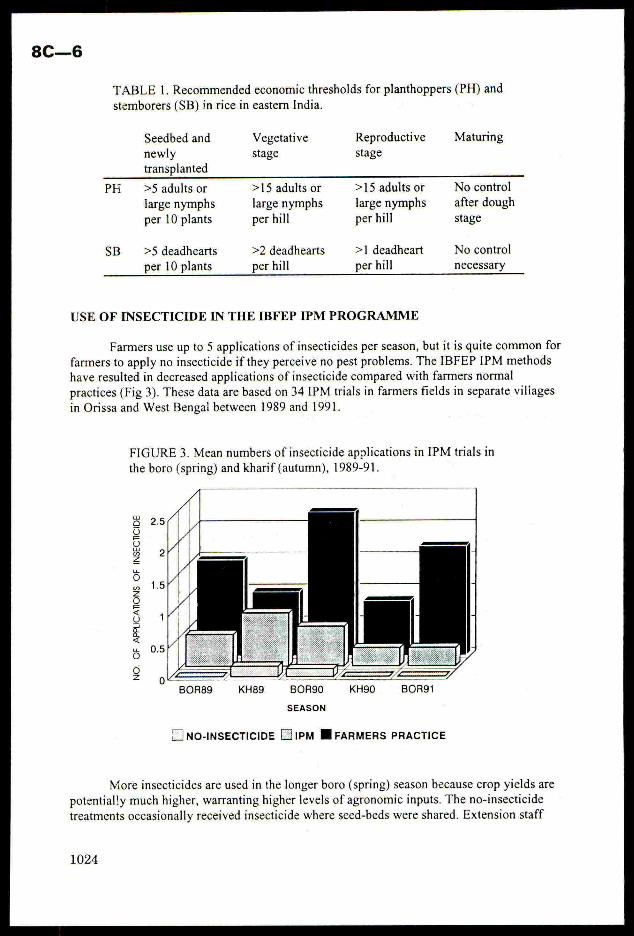
TABLE1. Recommended economicthresholds for planthoppers (PH) and
stemborers (SB) in rice in eastern India.
Seedbed and
newly
transplanted
>5 adults or
Jarge nymphs
per 10 plants
>5 deadhearts
per 10 plants
Vegetative
stage
>15 adults or
large nymphs
per hill
>2 deadhearts
perhill
Reproductive
stage
>15 adults or
large nymphs
per hill
>1 deadheart
per hill
USE OF INSECTICIDEIN THE IBFEP IPM PROGRAMME
Maturing
No control
after dough
stage
Nocontrol
necessary
Farmersuse up to 5 applicationsofinsecticides per season, but it is quite commonfor
farmers to apply no insecticide if they perceive no pest problems. The IBFEP IPM methods
have resulted in decreased applications of insecticide compared with farmers normal
practices (Fig 3). These data are based on 34 IPMtrials in farmersfields in separate villages
in Orissa and West Bengal between 1989 and 1991.
FIGURE 3. Mean numbersofinsecticide applications in IPM trials in
the boro (spring) and kharif (autumn), 1989-91.
NO.
OF
APPLICATIONSOF
INSE
CTIC
IDE
ed a
rh
a oa
=
° a
v=
BOR89
__|NO-INSECTICIDE [1PM Ml FARMERS PRACTICE
KH89 BORSO
SEASON
KH90 BOR91
Moreinsecticidesare used in the longer boro (spring) season becausecrop yields are
potentially much higher, warranting higher levels of agronomic inputs. The no-insecticide
treatments occasionally received insecticide where seed-beds were shared. Extensionstaff
1024
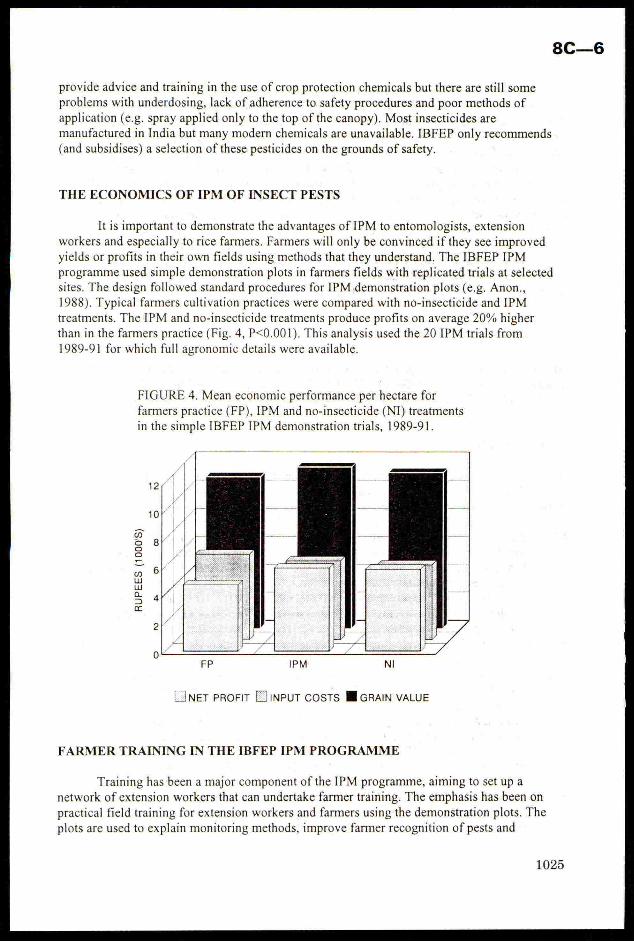
provide advice and training in the use of crop protection chemicals butthere arestill some
problems with underdosing, lack of adherence to safety procedures and poor methods of
application (e.g. spray applied only to the top of the canopy). Most insecticides are
manufactured in India but many modern chemicals are unavailable. IBFEP only recommends
(and subsidises) a selection of these pesticides on the groundsofsafety.
THE ECONOMICSOF IPMOF INSECT PESTS
It is important to demonstrate the advantages of IPM to entomologists, extensionworkers and especially to rice farmers. Farmers will only be convinced if they see improved
yields or profits in their own fields using methodsthat they understand. The IBFEP IPM
programme used simple demonstration plots in farmers fields with replicatedtrials at selected
sites. The design followed standard procedures for IPM demonstration plots (e.g. Anon.,
1988). Typical farmers cultivation practices were compared with no-insecticide and IPM
treatments. The IPM and no-insecticide treatments produce profits on average 20% higher
than in the farmers practice (Fig. 4, P<0.001). This analysis used the 20 IPM trials from
1989-91 for which full agronomic details were available.
FIGURE 4. Mean economic performanceper hectare for
farmers practice (FP), IPM and no-insecticide (NI) treatments
in the simple IBFEP IPM demonstrationtrials, 1989-91.
IPM NI
(_}NET PROFIT [INPUT CosTS IIGRAIN VALUE
FARMER TRAINING IN THE IBFEP IPM PROGRAMME
Training has been a major component of the IPM programme,aimingto set up a
network of extension workers that can undertake farmertraining. The emphasis has been onpractical field training for extension workers and farmers using the demonstration plots. The
plots are used to explain monitoring methods, improve farmer recognition of pests and
8C—6
increase awarenessofthe natural enemiesusing visually obvious predatorsin thefield.
Farmertraining meetings are held at each IPM demonstration site early in the season when
stemborers are often a problem, andthen later to coincide with peak levels of planthoppers.
The aimsare to increase farmer awarenessof natural enemies and to emphasise the
importance of need-based useof insecticides. Demonstrations of natural enemieskilling pests
in small containers are used, together with otherlive specimens and photographs with
legendsin the local language. Similarly the harmful effect of someinsecticides on natural
enemies is demonstrated as well as emphasising the need for safe practices to avoid harmful
effects on humans. The basic economics of need-based use of insecticides are presented,
together with the importance of weekly monitoring for pests. The method of monitoringis
explained again priorto a session offield training on natural enemy awareness and
monitoring. By simplifying the methods for the managementofinsect pests of rice and by
concentrating on field demonstrations andtrainingit is anticipated that the transfer of IPM
technology to Indian rice farmers should be moresuccessful thanin the past.
ACKNOWLEDGEMENTS
IBFEPis a collaborative programme between the Hindustan Fertiliser Corporation (HFC)
and the U.K. Government (ODA). Staff at HFC , NRI, ODA, IIBC andthe British Council
assisted with the IPM programme and commentedonearlier versions of the manuscript.
REFERENCES
Anon. 1988. Rice pest surveillance manual. Thai-GermanPlant Protection Programme.
Department of Agriculture, Bangkok.Barker, R.; Pal, T.K. (1979) Barriers to increased rice productionin eastern India. JRRIJ
Research Paper Series, No. 25, March 1979. IRRI, Manila, Philippines.
Chakraborty, D.P.; Maslen, N.R.; Holt, J. (1990) Effects of nitrogenous fertiliser ,
insecticides and plant spacing oninsect pests and yields of flooded rice in eastern
India. In: Pest Managementin Rice, B.T. Grayson, M.B. Green, L.G. Copping(eds),
London: Society of Chemical Industry, pp. 167-176.
Goodell, G. (1984) Challengesto international pest managementresearch and extension in
the third world: do we really want IPM to work? Bulletin ofthe Entomological
Society ofAmerica 33: 18-26.Kalode, M.B.; Krishnaiah, K. (1991) Integrated pest managementin rice. Indian Journal of
Plant Protection 19: 117-132.
Maiti, R.K. (1985) Insect pests associated with rice and recommended control measures.
Plant Protection Bulletin No. 24. Indo-British Fertiliser Education Programme,
Calcutta, India.
Matteson, P.C.; Altieri, M.A.; Gagne, W.C. (1984) Modification of small farmerpractices
for better pest management. Annual Review ofEntomology 29: 383-403.
Norton, G.A.; Way, M.J. (1990) Rice pest management systems- past and future. In: Pest
Managementin Rice, B.T. Grayson, M.B. Green, L.G. Copping (eds), London:
Society of Chemical Industry, pp. 1-14.Reissig, W.H.; Heinrichs, E.A.; Litsinger, J.A.; Moody, K.; Fiedler, L.; Mew, T,W.,; Barrion,
A.T. (1986) //lustrated guide to integratedpest managementin rice in tropical Asia.
International Rice Research Institute, Los Banos, Philippines.
BRIGHTON CROP PROTECTION CONFERENCE—Pests and Diseases—1992 8C—7
AN ANALYSIS OF INSECTICIDE USE IN KENYA COFFEE IPM AND OUTBREAKSOF ICERYA PATTERSONI
M.T.K. KAIRO, S.T. MURPHY
International Institute of Biological Control (IIBC), Silwood Park, Buckhurst Road, Ascot,
Berks., SL5 7TA,
ABSTRACT
Pest control measures with particular reference to insecticide use patterns on
large-scale coffee estates in Kenya were surveyed through formalquestionnaires and informal farm visits. It was found that between 1970 and1985, farmers relied less and less on insecticides for pest control as IPMprinciples became more widely adopted. It was therefore concluded thatinsecticides were unlikely to be responsible for the upsurge of J. pattersoni
although subsequent spraying may have exacerbated thesituation.
INTRODUCTION
In Kenya, coffee is attacked by a large pest complex (LePelley, 1968), but during the
later part of this century the Kenya Coffee Research Foundation (CRF) has developed a viableIPM programme, based on conservation ofinvertebrate natural enemies, against most ofthe
major pests (Bardner, 1985). However, from 1980, /cerya pattersoni, a previously rare
indigenousinsect, attained pest status on large-scale coffee farms in central Kenya (Wanjala etal., 1986). This scale insect is usually found aggregated on the undersides of leaves but quitecommonly forms colonies on branches and stems during severe attacks. In mild infestations,
the scale causesleaf-fall while severe infestations result in dieback and sometimes tree death.
Kinuthia and Mwangi (1986) have shown that a sizable natural enemy complex is
associated with I. pattersoni on coffee; this complex is dominated by a coccinellid beetle,
Rodolia iceryae. More recent studies by Kairo and Murphy (unpublished) have indicated that
the combination of R. iceryae along with other natural enemiesis able to suppress /. pattersoni
population outbreaks whenpesticides are used at the CRF-recommendedfield rates. In view
of these observations, the International Institute of Biological Control (IIBC) in collaboration
with the CRF and farmers began a project in 1985 to research the cause of the disruption to
the natural enemies; this information was to be used as a basis for evaluating and possibly
adjusting current IPM programmesagainst other pests and thus prevent further outbreaksofJ.
pattersoni.
Although there are several factors that could have disrupted the population dynamics
of J. pattersoni, initial attention was focussed on insecticides because of their possible
detrimental effects on natural enemies. This paperreports: firstly, the results of a survey to
determine general insecticide use patterns against coffee pests from 1970 to 1985 and their
association with J. pattersoni outbreaks; secondly, observations on the effects of spraying on
the population structure of /. pattersoni and its natural enemies.
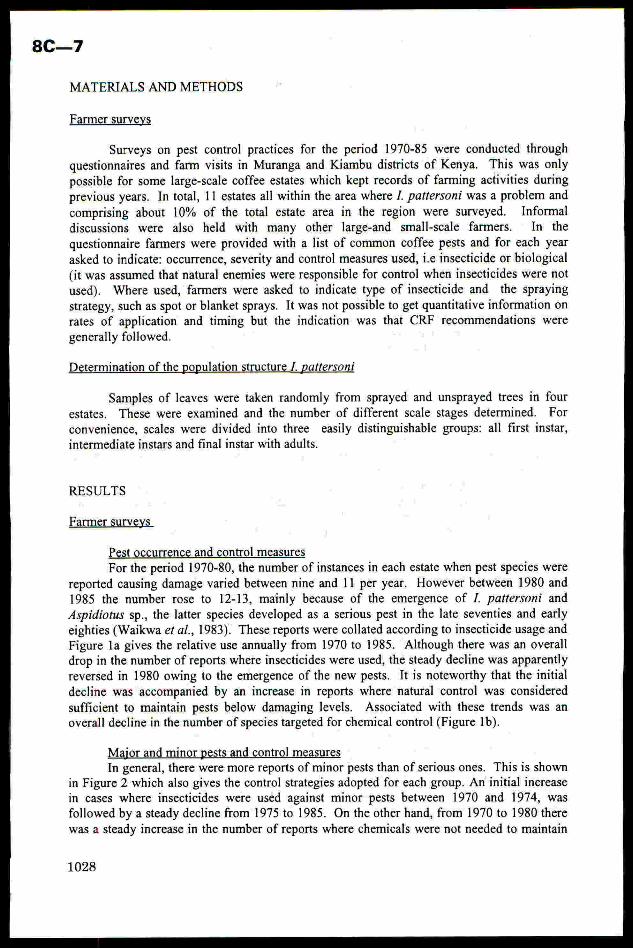
8C—7
MATERIALS AND METHODS
Farmersurveys
Surveys on pest control practices for the period 1970-85 were conducted throughquestionnaires and farm visits in Muranga and Kiambudistricts of Kenya. This was onlypossible for some large-scale coffee estates which kept records of farming activities duringprevious years. In total, 11 estates all within the area where /. pattersoni was a problem and
comprising about 10% of the total estate area in the region were surveyed. Informaldiscussions were also held with many other large-and small-scale farmers. In thequestionnaire farmers were provided with a list of common coffee pests and for each yearasked to indicate: occurrence, severity and control measures used,i.¢ insecticide or biological
(it was assumedthat natural enemies were responsible for control when insecticides were notused). Where used, farmers were asked to indicate type of insecticide and the sprayingstrategy, such as spot or blanket sprays. It was not possible to get quantitative information onrates of application and timing but the indication was that CRF recommendations were
generally followed.
Determination of the population structure J. pattersoni
Samples of leaves were taken randomly from sprayed and unsprayed trees in fourestates. These were examined and the numberofdifferent scale stages determined. For
convenience, scales were divided into three easily distinguishable groups:all first instar,intermediate instars and final instar with adults.
RESULTS
Farmer surveys
Pest occurrence and control measures
For the period 1970-80, the numberof instances in each estate when pest species were
reported causing damage varied between nine and 11 per year. However between 1980 and1985 the number rose to 12-13, mainly because of the emergence of J. pattersoni and
Aspidiotus sp., the latter species developed as a serious pest in the late seventies and earlyeighties (Waikwaet al., 1983). These reports were collated according to insecticide usage and
Figure la gives the relative use annually from 1970 to 1985. Although there was an overall
drop in the numberof reports where insecticides were used, the steady decline was apparently
reversed in 1980 owing to the emergence of the new pests. It is noteworthy that the initialdecline was accompanied by an increase in reports where natural control was consideredsufficient to maintain pests below damaging levels. Associated with these trends was anoverall decline in the numberofspecies targeted for chemical control (Figure 1b).
Major and minorpests and control measures
In general, there were more reports of minor pests than of serious ones. This is shown
in Figure 2 which also gives the control strategies adopted for each group. An initial increase
in cases where insecticides were used against minor pests between 1970 and 1974, was
followed by a steady decline from 1975 to 1985. On the other hand, from 1970 to 1980 therewas a steady increase in the number of reports where chemicals were not needed to maintain
1028
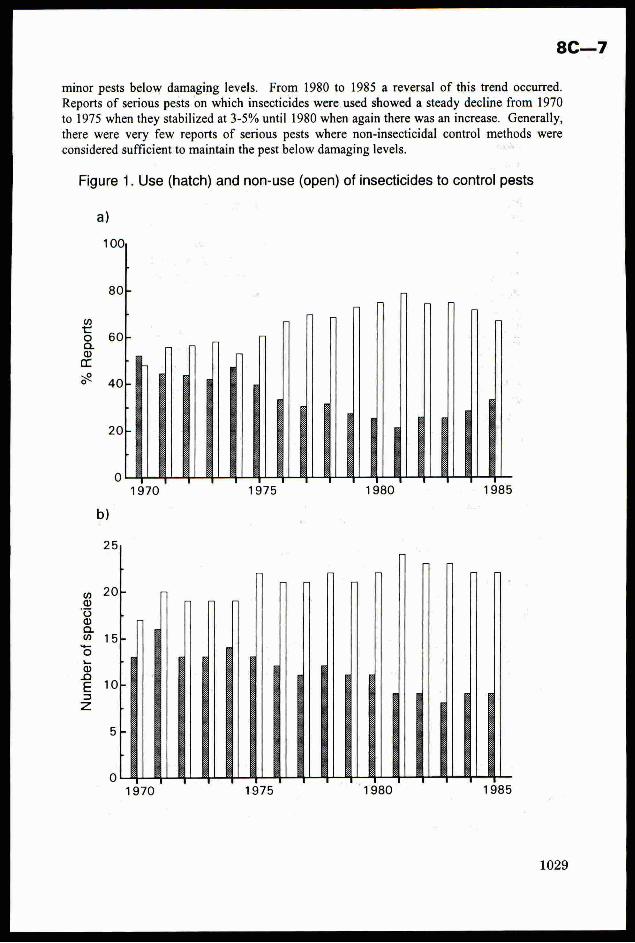
8C—7
minor pests below damaging levels. From 1980 to 1985 a reversal of this trend occurred.Reports of serious pests on which insecticides were used showed a steady decline from 1970to 1975 whenthey stabilized at 3-5% until 1980 when again there was an increase. Generally,
there were very few reports of serious pests where non-insecticidal control methods wereconsidered sufficient to maintain the pest below damaginglevels.
Figure 1. Use (hatch) and non-use (open)of insecticides to control pests
a)
=ee
)ol
oO
Numberof
species
3}
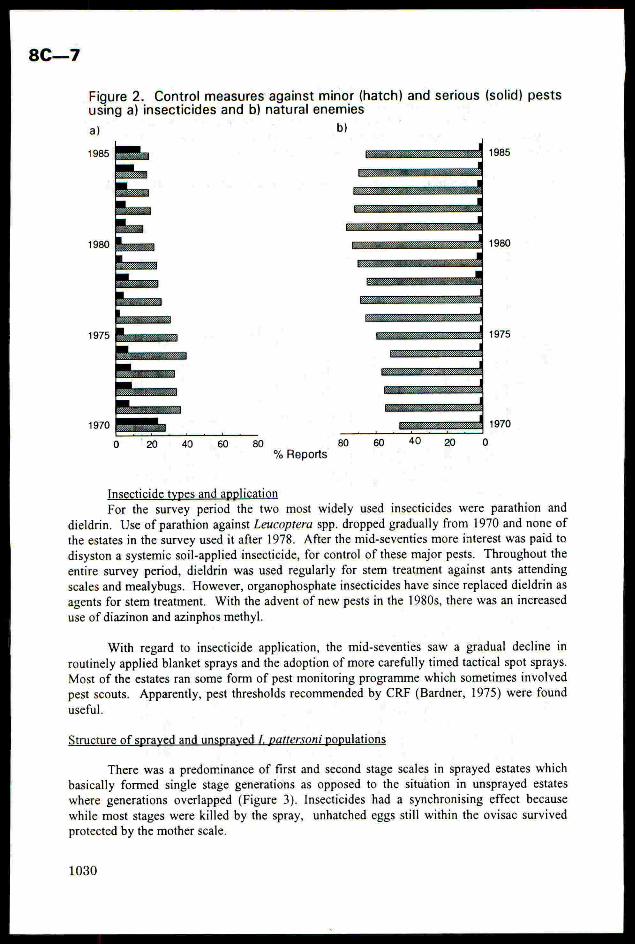
Figure 2. Control measures against minor (hatch) and serious (solid) pestsusing a) insecticides and b) natural enemies
a) b)
20 40 60 80 80 60% Reports
Insecticide types and applicationFor the survey period the two most widely used insecticides were parathion and
dieldrin. Use of parathion against Leucoptera spp. dropped gradually from 1970 and none ofthe estates in the surveyusedit after 1978. After the mid-seventies more interest waspaid to
disyston a systemic soil-applied insecticide, for control of these major pests. Throughoutthe
entire survey period, dieldrin was used regularly for stem treatment against ants attending
scales and mealybugs. However, organophosphateinsecticides have since replaced dieldrin as
agents for stem treatment. With the advent of newpests in the 1980s, there was an increased
use of diazinon and azinphos methyl.
With regard to insecticide application, the mid-seventies saw a gradual decline in
routinely applied blanket sprays and the adoption of more carefully timed tactical spot sprays.
Most of the estates ran some form of pest monitoring programme which sometimes involved
pest scouts. Apparently, pest thresholds recommended by CRF (Bardner, 1975) were found
useful.
Structure of sprayed and unsprayed J. pattersoni populations
There was a predominanceoffirst and second stage scales in sprayed estates which
basically formed single stage generations as opposed to the situation in unsprayed estates
where generations overlapped (Figure 3). Insecticides had a synchronising effect because
while most stages were killed by the spray, unhatched eggsstill within the ovisac survived
protected by the motherscale.
1030
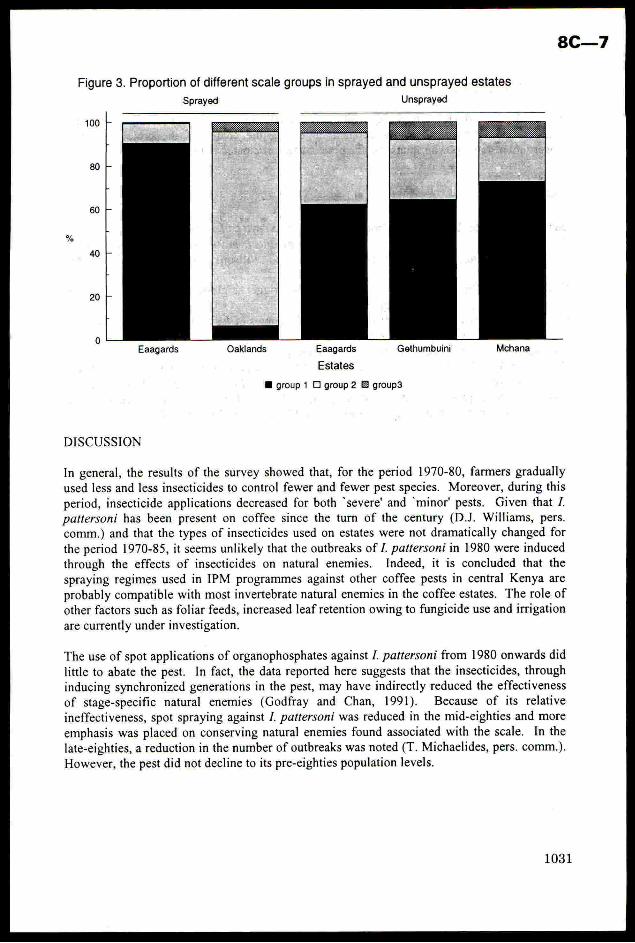
Figure 3. Proportion of different scale groups in sprayed and unsprayed estates
Sprayed Unsprayed
100
Eaagards Oaklands Eaagards Gethumbuini Mchana
Estates
@ group 1 O group 2 group3
DISCUSSION
In general, the results of the survey showedthat, for the period 1970-80, farmers gradually
used less and less insecticides to control fewer and fewer pest species. Moreover, during thisperiod, insecticide applications decreased for both ‘severe’ and ‘minor’ pests. Given that /.
pattersoni has been present on coffee since the turn of the century (D.J. Williams, pers.
comm.) and that the types of insecticides used on estates were not dramatically changed for
the period 1970-85, it seems unlikely that the outbreaks of /. pattersoni in 1980 were induced
through the effects of insecticides on natural enemies. Indeed, it is concluded that the
spraying regimes used in IPM programmes against other coffee pests in central Kenya are
probably compatible with mostinvertebrate natural enemiesin the coffee estates. The role of
other factors such as foliar feeds, increased leaf retention owing to fungicide use andirrigation
are currently underinvestigation.
The use ofspot applications of organophosphates against /. pattersoni from 1980 onwardsdid
little to abate the pest. In fact, the data reported here suggests that the insecticides, through
inducing synchronized generations in the pest, may haveindirectly reduced the effectiveness
of stage-specific natural enemies (Godfray and Chan, 1991). Because of its relative
ineffectiveness, spot spraying against /. pattersoni was reduced in the mid-eighties and more
emphasis was placed on conserving natural enemies found associated with the scale. In the
late-eighties, a reduction in the numberof outbreaks was noted (T. Michaelides, pers. comm.).
However,the pest did not decline to its pre-eighties population levels.
8C—7
ACKNOWLEDGEMENTS
We thank the Director Kenya Agricultural Research Institute, for providing laboratoryfacilities, the Director, CRF, for cooperation during the course of the project and theconsortium of farmers who sponsoredthe project and participated in the surveys.
REFERENCES
Bardner, R. (1975) Integrated control of coffee pests. Kenya coffee, 40, 62-66.Bardner, R. (1985) Pest control. In Coffee: Botany, biochemistry and production of beans
and beverage. Edited by M.N.Clifford and K.C. Willson. London: Croom Helm,pp.208-218.
Godfray, H.C.J; Chan, M.S. (1990) Howinsecticides trigger single-stage outbreaksin tropical
insects. Functional Ecology, 4, 329-337.Kinuthia, M.W; Mwangi, R.W. (1986) The natural enemies of /cerya pattersoni (Newst.) in a
coffee estate. Kenya Coffee, 51, 351-352.LePelley, R. H. (1968) Coffee pests. Longmans 590 pp.
Waikwa, J.W.; Wanjala, F.M.E.; Mwang, S.N. (1983) Notes on preliminary measures for
control of Aspidiotus sp. on coffee in Kenya (part I). Kenya Coffee, 48, 101-102.Wanjala, F. M. E.; Kinuthia, M. W.; Mwangi, S. N.; Dooso, B. S. (1986) Incidence of Icerya
pattersoni Newst. in Kenya. Tropical Pest Management, 34, 169-170.
BRIGHTON CROP PROTECTION CONFERENCE—Pests and Diseases—1992 8Cc—8s
THE EFFECT OF MANAGED FIELD MARGINS ON HOVERFLY (DIPTERA: SYRPHIDAE)DISTRIBUTION AND WITHIN-FIELD ABUNDANCE
R. W. J. HARWOOD, S.D.WRATTEN
Insect Ecology Research Group, Department of Biology, School of BiologicalSciences, University of Southampton, Southampton SO9 3TU.
M. NOWAKOWSKI
Willmot Industries (Conservation Department), West Yoke, Ash, Wrotham, Kent
TN15 7HU.
ABSTRACT
Hoverfly activity around two floristically different types offield margin was monitored over a two-month period. Margins wereeither managed and drilled with a mixture of native wildflowers,or left unmananaged. Hoverfly activity was estimated usingfluorescent yellow water traps in transects at right angles to thefield margins.
The establishment of wild-flower strips around field marginsinfluenced the local abundance of syrphids leading to increasedhoverfly activity within the adjacent crop, thus enhancing thepotential for syrphids to have a major influence on the regulationof aphid populations.
INTRODUCTION
Through the careful management of field margins it is possible toestablish a diverse floral sward which is visually attractive and has thepotential to prevent ingress of pernicious weeds, as well as provide a habitatfor beneficial insects and spiders (Marshall & Nowakowski, 1992). Thepotential benefits of managed field margins for beneficial entomofauna are,at least, twofold: the sites may provide an improved habitat for overwinteringpolyphagous beetles (Harwood in prep.), whilst providing a pollen and nectarsource for foraging adult hoverflies in the summer. By contrast unmanaged wildfield margins may often be dominated by a few agriculturally unacceptable weedspecies which may spread into the adjacent crop reducing yields and offeringa limited resource to beneficial insects.
Both male and female adult hoverflies feed on pollen and nectar. Nectar(or aphid honeydew) is used as a source of energy. Schneider (1948)established that female hoverflies require amino acids available in pollenprotiens for the maturation of their reproduction system. Many syrphid larvae(e.g. Metasyrphus corollae and Episyrphus balteatus) are predatory on cerealaphids have the potential to limit aphid population growth (Chambers & Adams1986, Entwhistle & Dixon 1990). By improving the provision of floral resourcesin land which may often hve few naturally occuring wildflower species it maybe possible to enhance natural syrphid populations within cereal fields andthus enhance their intrinsic biocontrol potential.
MATERIALS AND METHODS
Wildflower margins
Three pre-established experimental floral margin strips were used forthe study, strips A and B were in their first year of establishment (drilledSeptember 1991), with strip C in its third year (drilled September 1989).Commercially available seed mixtures were used, the compositions of which areshown in tables 1 and 2. These mixtures were chosen to produce a sward of non-invasive indigenous wildflowers and grasses which would be visuallyattractive, whilst containing a range of species with flowering times spread
throughout the summer.
8C—8
Strips were approximately 220m long and either 3m (strip C) or 5m
(strips A and B) wide, and were positioned at the edge of fields of winter
wheat, following the line of existing farm tracks. Five representative
unmanaged margins (dominated by Crataegus monogyna, Urtica dioica and Galium
aparine), surrounding three different winter wheat fields were chosen for
comparison with the wildflower strips.
TABLE 1. Seed mixture used to establish grass and wildflower strips A and B
(percentage of total by weight).
Species Species
chillea millefolium Leucanthum vulgare
Agrostis castellana Malva moschata
Cynosaurus cristatus Plantago lanceolata
Festuca rubra Prunella vulgaris
subsp. commutata Rumex acetosa
subsp. purinosa
subsp. rubra
TABLE 2. Seed mixture used to establish grass and wildflower strip C
(percentage of total by weight).
oe oe
Species Species
Knautia arvensisLeontodon hispidus
Leucanthemum vulgareLotus corniculatus
Malva moschataOnobrychis spp.Phleum pratense
subsp. bertolonii
Plantago mediaPoa pratensis
Primula veris
Achillea millefoliumAgrostemma githagoAgrostis tenuisAlopecurus pratensisAnthemis arvensisAnthilhilis vulnerariaAnthoxanthum odoratumCentauria cyanusCentauria nigraCentauria scabiosaCerastium fontanum
Cynosaurus cristatus Prunella vulgaris
Daucus carota Ranunculus acris
Festuca rubra Rhinathus minor
subsp. commutata Rumex acetosa
subsp. purinosa Sanguisorba minor
Galium verum Silene alba
Geranium pratense Silene dioica
Hypocheirus radicata Tricetum flavescens
NRPRrRPOOF
SNOW
WMW
OCWORRPEUPOYNWRO
OUNMNOONFWOUWND
on
SMOONOFRFPRFOOYNOF
OCOUMrFMdAWOWMWOUA]
aMaNAaADdCO
Trapping methods
Six lines of six fluorescent yellow water traps extending out from the
field margin into the crop were used to assess hoverfly activity around either
unmanaged or managed margins. The traps were positioned at ear height (65 to
95cm),at distances of 1, 5, 10, 25, 50, and 100m from the field margins. Traps
were filled with a water/detergent solution with 10ml1/1 glycerol and 10m1/1
ethalene diol added as an humectant / preservative. Trapping commenced lst
June 1992 and ended 24th July 1992. Traps were emptied twice weekly.
Hoverflies caught were identified to species and sex in the field when
emptying traps. Data was log transformed and tested for goodness of fit toa
normal distribution using a chi squared test. One way analysis of variance was
used to examine differences between treatment and non-treatment traps.
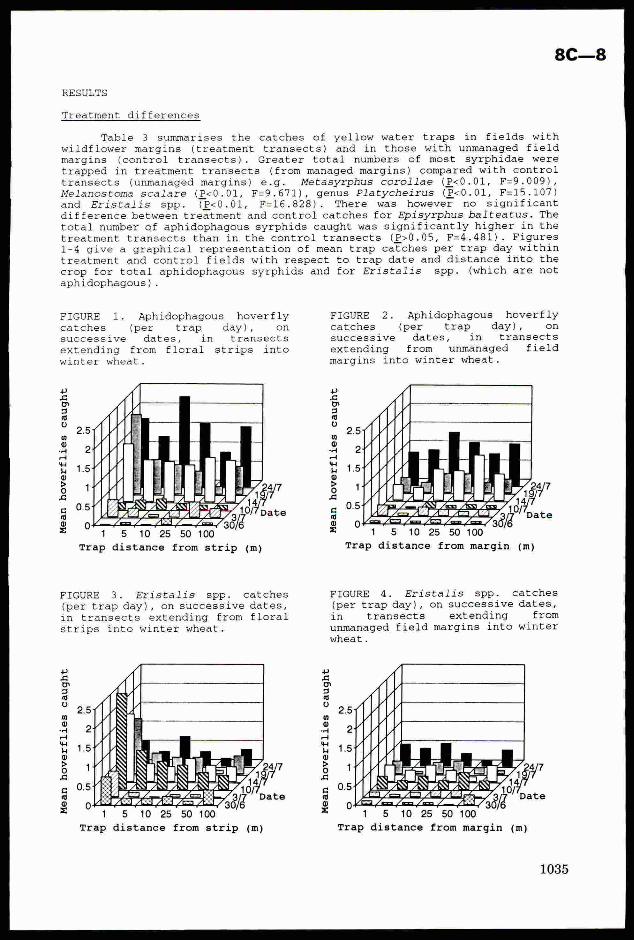
RESULTS
Treatment differences
Table 3 summarises the catches of yellow water traps in fields withwildflower margins (treatment transects) and in those with unmanaged fieldmargins (control transects). Greater total numbers of most syrphidae weretrapped in treatment transects (from managed margins) compared with controltransects (unmanaged margins) e.g. Metasyrphus corollae (P<0.01, F=9.009),Melanostoma scalare (P<0.01, F=9.671), genus Platycheirus (P<0.01, F=15.107)
and Eristalis spp. (P<0.01, F=16.828). There was however no significantdifference between treatment and control catches for Episyrphus balteatus. Thetotal number of aphidophagous syrphids caught was significantly higher in thetreatment transects than in the control transects (P>0.05, F=4.481). Figures1-4 give a graphical representation of mean trap catches per trap day withintreatment and control fields with respect to trap date and distance into thecrop for total aphidophagous syrphids and for Eristalis spp. (which are not
aphidophagous) .
FIGURE 1. Aphidophagous hoverfly FIGURE 2. Aphidophagous hoverflycatches (per trap day), on catches (per trap day), onsuccessive dates, in transects successive dates, in transects
extending from floral strips into extending from unmanaged fieldwinter wheat. margins into winter wheat.
i |se) oe Ee
eta PA FAL,|TRSANOS is asABADSSS10/ Date
04 A 4
1 5 10 25 50 100 1 5 10 25 50 100
Trap distance from strip (m) Trap distance from margin (m)
Mean
hoverflies
caughtBS)
amo3®o
aoodat
44ao>°a
ga@=
FIGURE 3. Eristalis spp. catches FIGURE 4. Eristalis spp. catches
(per trap day), on successive dates, (per trap day), on successive dates,
in transects extending from floral in transects extending from
strips into winter wheat. unmanaged field margins into winter
wheat .
2.5
2
1.5
1
0.5
0
LIN URN A
Z CSNWNSaeeZot 3AdAssAS“aaA .
5 10 25 50 100 1 5 10 25 50 100Trap distance from strip (m) Trap distance from margin (m)
Mean
hoverflies
caught
Mean
hoverflies
caught
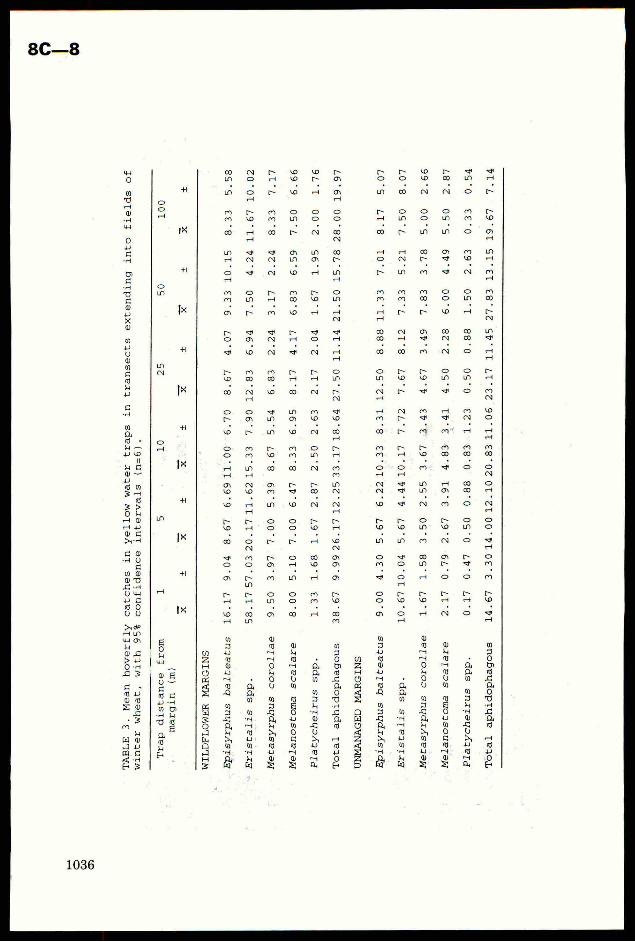
TABLE
3.
Mean
hoverfly
catches
inyellow
water
traps
in
transects
extending
into
fields
of
winter
wheat,
with
95%
confidence
intervals
(n=6).
Trap
distance
from
1S
10
25
50
100
margin
(m)
x
WILDFLOWER
MARGINS
Episyrphus
balteatus
16.17
9.04
8.67
6.6911.00
Eristalis
spp.
58.1757.03
20.017
11..6215.33
Metasyrphus
corollae
9.50
3.97
7.00
5.39
8.67
Melanostoma
scalare
8.00
5.10
7.00
6.47
8.33
Platycheirus
spp.
1.33
1,68
1.67
2.87
2.56
Total
aphidophagous
9.9926.17
12.25
3317
UNMANAGEDMARGINS
Episyrphus
balteatus
6.022
10..33
Eristalis
spp.
4.4410.17
Metasyrphus
corollae
1.67
2.55
3:67
Melanostoma
scalare
2e47
3.91
4.83
Platycheirus
spp.
O.17
0.88
.0.83
Total
aphidophagous
14.67
3.3014.0012.1020.8311.06
Hoverfly distribution
Regression analysis of [log (n+l)] transformed total trap catches vs{log distance from strip] revealed a significant negative gradient in thetreatment transects for Eristalis spp. (P<0.001, r (corrolation co-efficient)= -0.58). Both Episyrphus balteatus (P=0.053, r=-0.32), Metasyrphus corollae(P=0.076, r=-0.29) and the total for aphidophagous syrphids caught (P=0.058,r=-0.31) approached a significant negative gradient. The transects of thecontrol fields did not give any significant negative gradients.
DISCUSSION
A significantly greater number of hoverflies were caught in treatmenttransects than in control transects, including many species with aphidophagouslarvae. This suggests that wildflower strips are able to increase within-fieldpopulations of hoverflies in adjacent fields, which in turn may increaseoviposition of aphidophagous hoverflies within the field and hence enhanceaphid predation. Possible mechanisms include increasing the reproductivesuccess of the hoverflies through the provision of pollen, increasing larvalsurvival through the provision of alternative hosts or by attractinghoverflies from other areas. The results from the regression analysis indicatethat in treatment transects hoverfly activity is greatest close to thewildflower margins, whereas conventional unmanaged field margins showed noincreased activity; this was most apparent for Fristalis spp., as is suggestedby figures 1 to 4. During the experimental period hoverflies were observedfeeding, courting and mating within the wildflower margins before ovipositingin the crop. The importance of the wildflower strips may not be solely inproviding a pollen resource. Continued studies will assess the behaviour andresource use of hoverflies within the wildflower strips and the effect ofenhanced syrphid numbers on within-crop oviposition.
ACKNOWLEDGEMENTS
The research was funded by a SERC CASE award at Southampton Universityin collaboration with Willmot Industries (Conservation Department).
REFERENCES
Chambers, R.J.; Adams, T.H.L. (1986) Quantification of the impact of
hoverflies (Diptera:Syrphidae) on cereal aphids in winter wheat - ananalysis of field populations. Journal of Applied Ecology, 23, 895-904.
Entwistle, J.C.; Dixon, A.F.G. (1991) The effect of augmenting grain aphidnumbers in a field of winter wheat in spring on the aphid’s abundancein summer and its relevance to the forecasting of outbreaks. Annals of
Applied Biology. 114, 397-408.Marshall, E.J.P.; Nowakowski, M. (1992) Herbicide and cutting treatments for
establishment and management of diverse field margin strips. Aspects of
Applied Biology. 29, 425-430.Schneider, F. (1948) Beitrag zar kenntris generationsverhaltnisse und diapause
rauberisher schwebfliegen. Mitteilungen der SchweizerischenEntomologischen Gesellschaft, 21, 249-285.
BRIGHTON CROP PROTECTION CONFERENCE—Pests and Diseases—1992
BRENT GOOSE DAMAGE TO OILSEED RAPE AND IMPLICATIONS FOR
INTEGRATED MANAGEMENT
H. V. MCKAY, J. D. BISHOP
Central Science Laboratory, Ministry of Agriculture, Fisheries
and Food, Tangley Place, Worplesdon, Surrey, GU3 3LQ
ABSTRACT
The Brent goose (Branta bernicla) is a protected species,
which feeds inland on agricultural land while over
wintering in England. Using a paired-plot design, yield
loss of oilseed rape due to feeding by the dark-bellied
subspecies of the Brent goose was measured on five fields
in Essex, UK. A mean of 11% loss in dry weight of seed
was found, with a maximum of 27% in the worst-affected
field. Early damage (before January) was associated with
the greatest loss in yield. Intensive scaring in this
period, along with the provision of alternative feeding
areas and luring of birds using decoys, is suggested as an
integrated management system likely to reduce damage.
INTRODUCTION
Approximately half the world population of the dark-
bellied subspecies of Brent goose (Branta bernicla bernicla)
overwinter on the south coast of England, in a zone streching
from the Wash to the river Exe. In the winter of 1962/63 these
British birds numbered approximately 15,000 (Ogilvie & St.
Joseph, 1976). Since then, numbers have increased dramaticallyand in 1990/91 they reached 115,000 (Kirby, 1991)
Traditionally the birds fed on vegetation in the intertidal
zone of saltmarshes, mudflats and estuaries but since the early
1970s, large numbers have fed inland (St Joseph, 1979) onwinter wheat and barley and, most recently, oilseed rape
(Brassica napus).
Work on Brent goose damage to winter wheat funded by the
Ministry of Agriculture, Fisheries and Food (MAFF),
demonstrated an average 7% yield loss (Summers, 1990). Grazing
of grassland by geese can lead to a reduction in biomass of
live matter in the sward (Summers & Stansfield, 1991).
Faced with this damage, most farmers attempt to scare
geese from their fields. The most common method used employs
gas guns reinforced by shooting small numbers under licence
from MAFF. Other techniques include the use of model birds in
an alert position (Inglis and Isaacson, 1978) and the constantpresence of a person on an all-terrain vehicle, backing up his
scaring by shooting (Vickery & Summers, in press). Summers &
1039
8cC—9
Hillman (1990) found that suspension of red tape across wheatfields reduced damage by Brent geese as long as there wereuntaped fields on which the birds could feed. Such
"alternative feeding areas' have been recommended for some time
(Owen, 1973), though usually specially managed grass is the
suggested forage (Countryside Premium for Set-aside Land; Anon,
1989) «
Many of Britain's Brent goose sites hold internationally
important numbers over the winter (Kirby et al., 1990) and thespecies is protected under both EC and UK legislation,
(Wildlife & Countryside Act, 1981). There is therefore an
obligation to conserve Brent geese and seek solutions to the
problem of the conflict with agricultural interests.
This paper describes a study to measure the loss in yield
of oilseed rape due to Brent goose grazing in south-east Essex,
UK, during the winter of 1990/91. Implications of the results
for the integrated management of Brent geese are discussed.
METHODS
In October 1990, six fields of oilseed rape which had
suffered goose damage in previous years were selected. In
order to determine loss in yield, grazed areas were compared
with ungrazed. In each field ten 2m x 2m wire exclosures were
set up, and each one paired with two unenclosed plots available
for geese to graze. The exclosures were erected in late
October before the start of grazing and removed in April when
all grazing had ceased.
During this five month grazing period, all 180 plots were
monitored every 14 days. This involved counting and removing
all goose droppings within a 1.5m radius of marker sticks. The
number of droppings counted is a measure of grazing intensity.
After the cessation of grazing the exclosures were replaced
with marker flags. The height of the plants was measured at
all plots every two weeks from March until the crop was
harvested in August. At harvest, a sample 1m? was cut from the
exclosed and grazed plots and the stems were counted. These
samples were dried and threshed and from each the total dry
weight of seed, 1000-seed weight, and percentage oil content
were measured.
RESULTS
One field, 'Abbots', was not grazed but full data was
collected. The timing and intensity of grazing differed among
the five grazed fields, 'Big' and 'Little' field being grazed
early in the season and 'Sea' field having the highest
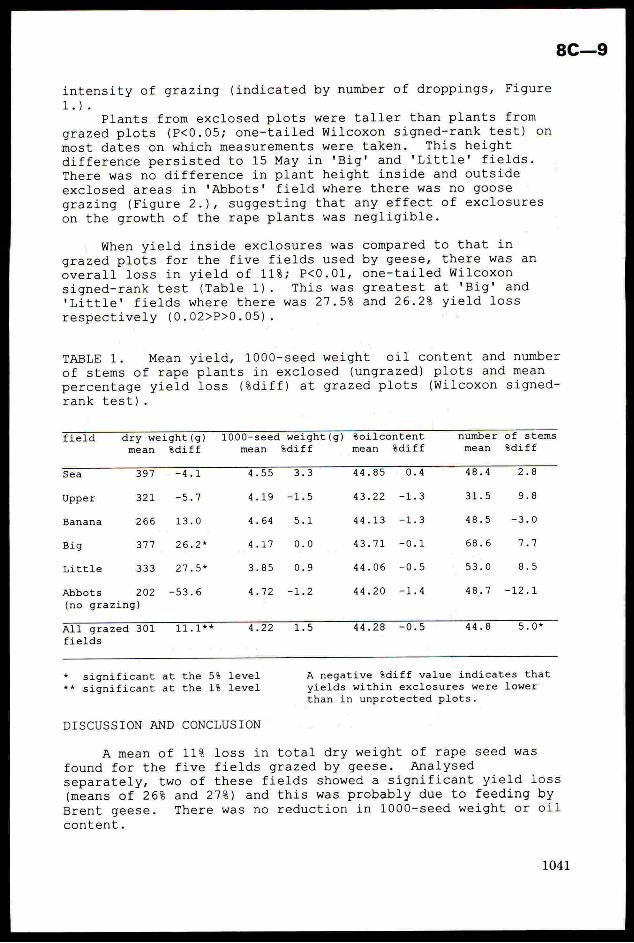
8C—9
intensity of grazing (indicated by number of droppings, Figure
La)»Plants from exclosed plots were taller than plants from
grazed plots (P<0.05; one-tailed Wilcoxon signed-rank test) on
most dates on which measurements were taken. This height
difference persisted to 15 May in 'Big' and 'Little' fields.
There was no difference in plant height inside and outside
exclosed areas in 'Abbots' field where there was no goose
grazing (Figure 2.), suggesting that any effect of exclosures
on the growth of the rape plants was negligible.
When yield inside exclosures was compared to that in
grazed plots for the five fields used by geese, there was an
overall loss in yield of 11%; P<0.01, one-tailed Wilcoxon
signed-rank test (Table 1). This was greatest at 'Big' and
"Little' fields where there was 27.5% and 26.2% yield loss
respectively (0.02>P>0.05).
TABLE 1. Mean yield, 1000-seed weight oil content and number
of stems of rape plants in exclosed (ungrazed) plots and mean
percentage yield loss (%diff) at grazed plots (Wilcoxon signed-
rank test).
field dry weight(g) 1000-seed weight(g) toilcontent number of stems
mean %diff mean %sdiff mean %diff mean %diff
Sea 397 : 4.55 3:3 44.85 0.4 48.4 -8
Upper 321 ‘ 4.19 -1.5 43.22 23 31.5 8
Banana 266 : 64 ‘ 44.13 a 48.
Big 377 . -17 . 43.71 i 68.
Little 333 ‘i -85 ; 44.06 . 53.
Abbots 202 Z 72 5 44.20 : 48.
(no grazing)
All grazed 301 : ~22 i 44.28 s 44,
fields
* significant at the 5% level A negative diff value indicates that
** significant at the 1% level yields within exclosures were lower
than in unprotected plots.
DISCUSSION AND CONCLUSION
A mean of 11% loss in total dry weight of rape seed wasfound for the five fields grazed by geese. Analysed
separately, two of these fields showed a significant yield loss
(means of 26% and 27%) and this was probably due to feeding by
Brent geese. There was no reduction in 1000-seed weight or oil
content.
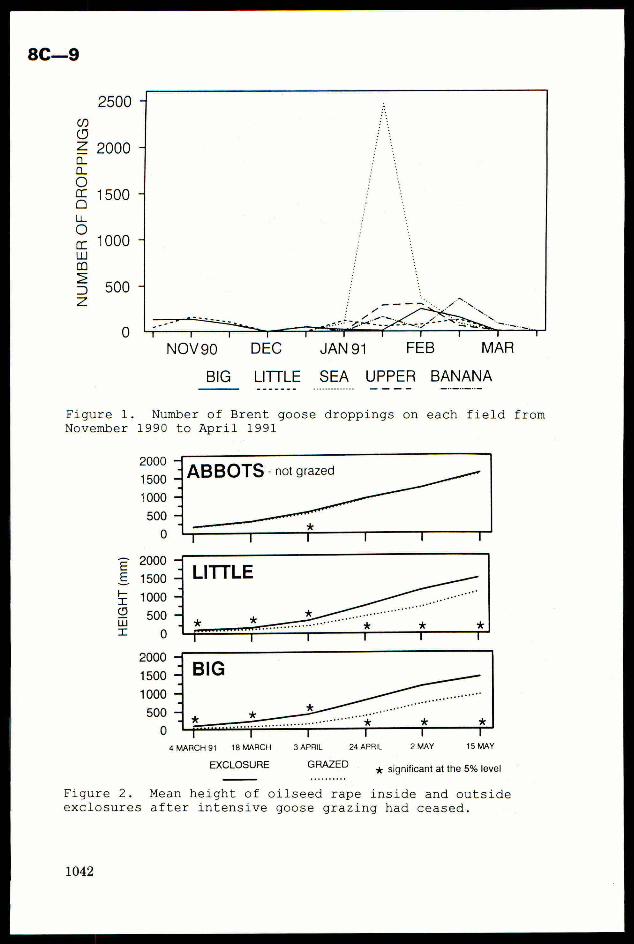
NUMBEROFDROPPINGS
Number of Brent goose droppings on each field from
1990 to April 1991
2000
1500
1000
500
0
ABBOTS- not grazed“
=
4
2000
1500
1000
500
0
2000
1500
1000
500
0
otitis
ti
rilititil
4 MARCH 91 18 MARCH 3 APRIL 24 APRIL 2 MAY 15 MAY
EXCLOSURE GRAZED significantat the 5% level
Figure 2. Mean height of oilseed rape inside and outside
exclosures after intensive goose grazing had ceased.
8C—9
The two worst-affected fields were those that were grazed
early in the season (before January), but not those on whichthe most goose droppings were deposited. Although this study
indicates that early damage is most important, further
controlled experiments are required in order to determine thestage of growth at which rape is most vulnerable to damage by
Brent geese.
If early damage causes greatest loss in yield, we would
recommend that farmers concentrate scaring measures at the
beginning of the season. Scaring is most successful if the
birds have somewhere else to feed and the provision ofalternative feeding areas is likely to form the basis of any
integrated management system of Brent geese. A model is
currently being constructed to help identify the most suitable
fields for conversion to alternative feeding areas. Field
experiments are also underway to determine optimum management
of grass/clover swards to satisfy the birds' behavioural and
nutritional requirements.
In addition to grass/clover, sacrificial crops could be
sown on alternative feeding areas. Autumn-sown wheat and
barley have been used by some farmers and the levels of damage
recorded have indicated that oilseed rape might also be
sufficiently attractive. Such crops are required to grow
throughout the winter, be palatable and nutritional to the
geese and support high numbers of birds per unit area.
The area required to accommodate a population of Brent
geese, numbering several thousand at some sites, is greater
than one farm could provide. There is therefore a need for
farms within 'normal flying distance' of a roost to cooperate.
The number of alternative feeding areas, their size, situation
and management, the integration of these areas of grass and
sacrificial crops into normal farming practices and the use of
scaring and luring to move the birds, are among the problems
being addressed by current research at the Central Science
Laboratory.
ACKNOWLEDGEMENTS
The authors thank the Essex farmers for allowing them to
carry out this work on their land. Thanks also to Matthew
Stevens, Geoff Sellars and the Department of Nutritional
Chemistry, ADAS, Brooklands Avenue, Cambridge.
REFERENCES
Anon. (1989). The countryside premium for set-aside land.Countryside Commission, Cambridge.
8C—9
Inglis, I.R.; Isaacson, A.J. (1978) The responses of dark-
bellied Brent geese to models of geese in variouspostures. Animal Behaviour, 26, 953-958.
Kirby, J.S. (1991) Numbers of dark-bellied Brent geese in
Britain, January/February 1991. National Wildfowl Counts,The Wildfowl and Wetlands Trust, Slimbridge.
Kirby, J.S.; Waters, R.J.; Prys-Jones, R.P. (1990) Wildfowl and
wader counts 1989-90. The Wildfowl and Wetlands Trust,
Slimbridge.
Ogilvie, M.A.; St. Joseph, A.K.M. (1976) Dark-bellied Brent
geese in Britain and Europe, 1955-76. British Birds, 69,
422-439,
Owen, M.O. (1973) The management of grassland areas for
wintering geese. Wildfowl, 24, 123-130.
St Joseph, A.K.M. (1979) The development of inland feeding
Branta bernicla bernicla in southeastern England. In:
Proceedings of the First Technical Meeting on Western
Palearctic Migratory Bird Management, M. Smart (Ed.),Slimbridge: I.W.R.B, pp 132-139.
Summers, R.W. (1990) The effect on winter wheat of grazing by
Brent geese Branta bernicla. Journal of Applied Ecology,
27, 821-833.
Summers, R.W.; Hillman, G. (1990) Scaring Brent geese Branta
bernicla from fields of winter wheat with tape. Crop
Protection, 9, 459-462.
Summers, R.W.; Stansfield J. (1991) Changes in the quantity and
quality of grassland due to winter grazing by Brent geese
(Branta bernicla). Agriculture, Ecosystems and
Environment, 36, 51-57.
Vickery, J.A.; Summers, R.W. (in press) Cost-effectiveness of
scaring Brent geese (Branta bernicla bernicla) from fields
of arable crops by a human bird scarer. Crop Protection.
BRIGHTON CROP PROTECTION CONFERENCE—Pests and Diseases—1992 8C—10
RECENT ADVANCES WITH THE MATING DISRUPTION TECHNIQUE IN APPLES AND
GRAPES - FACTORS INFLUENCING THE SUCCESS OF PHEROMONES
U. NEUMANN, V. HARRIES, A. GASSER
BASF Agricultural Research Station, Limburgerhof, Germany
W. WALDNER
South Tyrol Advisory Ring for Fruits and Viticulture, Lana, Italy
W.K. KAST
LVWO, Weinsberg, Germany
ABSTRACT
In Germany, the mating disruption technique using sex pheromones has
been employed commercially against grape-berry moth (Eupoecilia
ambiguella Hbn.) since 1986. Meanwhile in other countries this
technique for other species have been introduced: - on oriental fruit
moth (Grapholita molesta Busck.) in peaches (Spain, France, Italy) as
well as on codling moth {Cydia pomonella L., (Austria, Italy)} and
summer fruit tortrix moth {Adoxophyes orana F.v.R., (Italy)}. In the
UK the introduction of mating disruption is being delayed by
regulatory injunctions. Based on the experience gathered from
numerous trials, it has been possible to reduce the dosage rates far
enough to make the mating disruption technique economic and therefore
commercially acceptable. In order to safeguard the optimum performance
of this technique, any high initial population densities have to be
reduced by using an appropriate insecticide. To obtain maximum
success, the immigration of mated females from surrounding areas not
treated with pheromones has to be reduced. This can be achieved by
using the method on large areas, on a cooperative basis between grower
communities.
INTRODUCTION
The development of the mating disruption technique using sex
pheromones has made great advances over the last years. The first
commercially available pheromone developed by BASF, "RAK 1 - Eupoecilia
ambiguella Hbn.", was presented at the Brighton Conference in 1986 (Neumann
et al., 1986). In the meantime other pheromones have been introduced on
the market. Table 1 lists the formulated pheromones being developed or
marketed by BASF at this time.
8C—10
Table 1: Pheromones being tested and on the market
Pheromones Target Species Crop Coupery *
Sales Testing
Z9-12Ac Eupoecilia ambiguella Grapes |DE,AT,CH!|FR,Slovenia
E7Z9-12Ac Lobesia botrana DE,AT,CH,FR
ES,IT,GR
Z8/E8-12Ac |Grapholitha molesta Peaches|FR,ES,IT
E5-10Ac/ES-|Anarsia lineatella IT
100H
E8E10-120H |Cydia pomonella DE,BE,NL,FR
CH,AT
Z11-14Ac Adoxophyes orana DE,BE,NL,FR
Pandemis spp.
Archips spp.
Z23Z13-18Ac |Synanthedon myopaeformis DE,BE,NL,FR
AT,IT,ES * Abbreviations: AT - Austria, BE - Belgium, CH - Switzerland,
DE - Germany, ES - Spain, FR - France, GR - Greece,
IT - Italy, NL - Netherlands
Of the listed pheromones still in the testing stage, registration in
Germany is planned for 1993 for 23213-18Ac and E7Z9-12Ac. The pheromone
for A. lineatella Z. is being used commercially in Italy, even though
optimum application rate and composition have not yet been completely
evaluated. Fruit growers and government advisors wish to use it asa
safeguard in order to minimize the risk of A. lineatella, which occurs
irregularly. In the UK, where fruit growers also show great interest in the
use of pheromones, there are more impediments, even for the experimental
use of pheromones, due to registration restrictions. Documents on
toxicology are needed for the pheromone relevant in UK, Z11-14ac, which are
not yet available. Codling moth and summer fruit tortrix usually occur
simultaneously in the apple orchards in most parts of England, so tests
against codling moth alone is not considered practical.
CONDITIONS AND PREREQUISITES FOR SUCCESSFUL USE OF THE MATING DISRUPTION
TECHNIQUE
More than 5000 ha of trial area were available to work out the
prerequisites for the success of the mating disruption technique. First of
all, adequate pheromone rates must be used.
1046
8C—10
Adequate means such quantities that will ensure the resulting pheromone
atmosphere in the vineyard or orchard will be/remain concentrated enough to
be effective. This must take account of strong and persistent winds (such
as in the mistral of the Rhéne Valley) and/or when population densities are
somewhat higher (though still within the prescribed range). The dosages
used in the trials and in practice range between 30 and 50 g a.i./ha per
month. For the codling moth in England, for example, that corresponds to a
total dose of 80 to 100 g a.i./ha.
The actual amount of pheromone that diffuses, however, is dependent on the
prevailing weather conditions. The release rate would probably be lower in
very low temperatures. The applied quantity must be diffused at a steady
rate, to maintain the correct pheromone concentrations at flight peaks. An
even pheromone density in the orchard is best achieved with a symmetrical
arrangement of 500 dispensers/ha {4.5 mx 4.5 m, (Karg, G et. al., 1990)}.
The plantations in which the pheromones are to be used should consist
of trees of the same height, stretching for at least 50 m, Narrower plot
widths would require dispenser densities above 500/ha. The number of
dispensers also must be raised when the trees are taller than 3.5 m, since
the moths are active in a larger air volume space in which the correct
pheromone concentration must be maintained. There is always some degree of
wind blowing along the borders of a plot, which may result in a lower
pheromone concentration. To counteract this, the dispensers around the
edges should be spaced only 2 m apart.
Immigration of mated females from neighboring areas can be limited by
treating the adjacent crops (grapes, apples) with a pheromone buffer about
30 m deep.
As was already noted at the 1986 Brighton Conference (Neumann et.
al., 1986), the decisive factor for the success of mating disruption is the
population density. It must be sufficiently low, but currently there is no
way to measure it. Instead we must go by the infestation level of the
previous generation (meaning the juvenile phase of the adults that are to
be controlled by the pheromones in question). The preceding larval
generation should not exceed the infestation thresholds listed in Table 2,
if future pheromone treatments are to be successful.
Table 2: Suggested thresholds for employing the mating disruption method
Species Threshold at previous generation
Grape-berry |Eupoecilia ambiguella 5 Z% (Lobesia), 10 % (Eupoecilia)
moth Lobesia botrana infested inflorescences,
5 Z infested grapes (both spp.)
Codling moth|Cydia pomonella 1 % infested fruit
Fruittree Adoxophyes orana 1 % infested fruit or
tortix Pandemis spp. 5 % infested shoots
Archips spp.
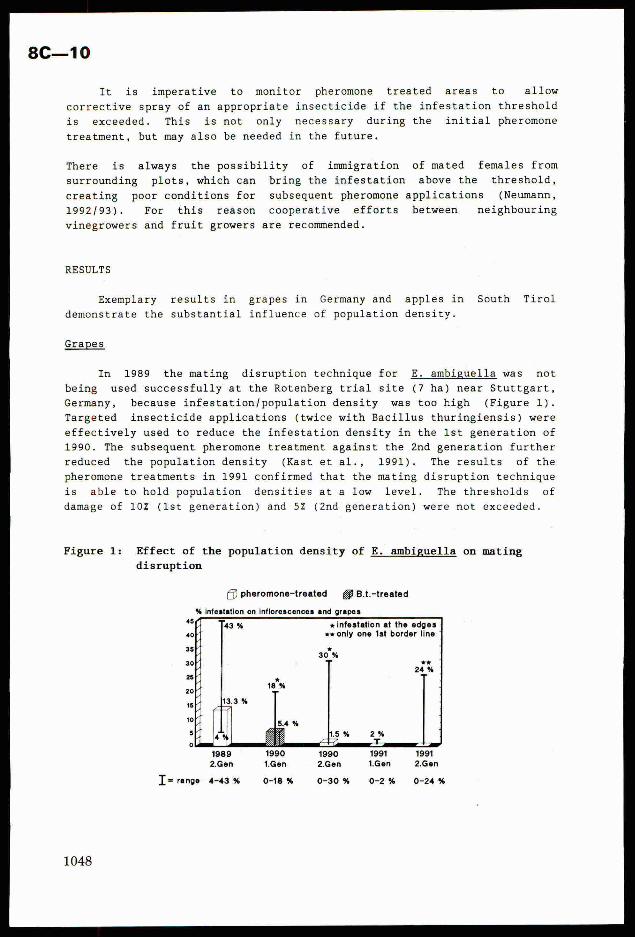
8C—10
It is imperative to monitor pheromone treated areas to allow
corrective spray of an appropriate insecticide if the infestation threshold
is exceeded. This is not only necessary during the initial pheromone
treatment, but may also be needed in the future.
There is always the possibility of immigration of mated females from
surrounding plots, which can bring the infestation above the threshold,
creating poor conditions for subsequent pheromone applications (Neumann,
1992/93). For this reason cooperative efforts between neighbouring
vinegrowers and fruit growers are recommended.
RESULTS
Exemplary results in grapes in Germany and apples in South Tirol
demonstrate the substantial influence of population density.
Grapes
In 1989 the mating disruption technique for E. ambiguella was not
being used successfully at the Rotenberg trial site (7 ha) near Stuttgart,
Germany, because infestation/population density was too high (Figure 1).
Targeted insecticide applications (twice with Bacillus thuringiensis) were
effectively used to reduce the infestation density in the lst generation of
1990. The subsequent pheromone treatment against the 2nd generation further
reduced the population density (Kast et al., 1991). The results of the
pheromone treatments in 1991 confirmed that the mating disruption technique
is able to hold population densities at a low level. The thresholds of
damage of 10% (lst generation) and 5% (2nd generation) were not exceeded.
Figure 1: Effect of the population density of E. ambiguella on mating
disruption
(J pheromone-treated @B.t.-treated
% infestation on inflorescences and grapes.
48 x infestation at the edges40f7 xx only one 1st border line
35 *30 %
30|
ola 1989 1990
2.Gen 1.Gen
T= range 4-43 % 0-18 %
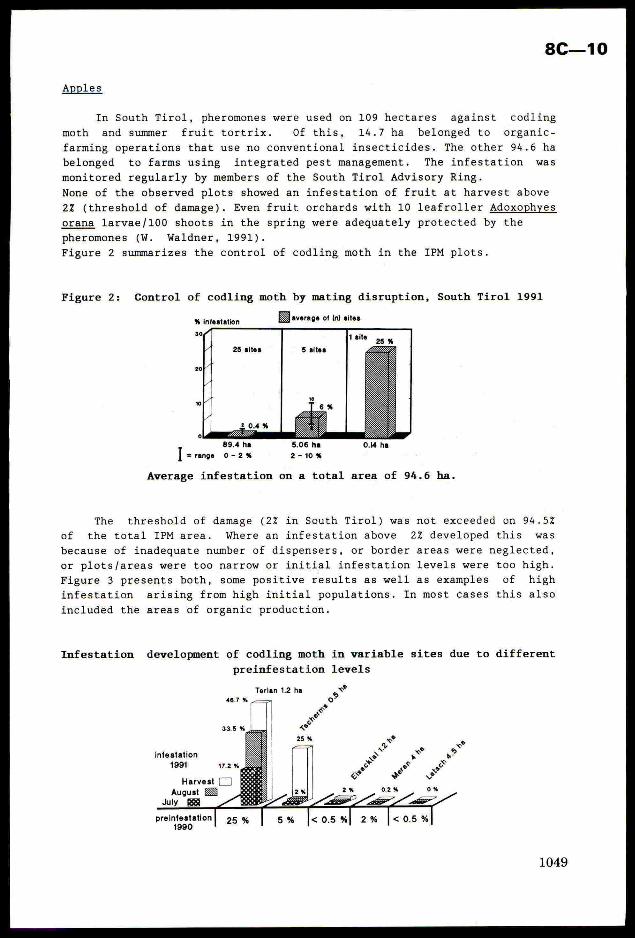
Apples
In South Tirol, pheromones were used on 109 hectares against codling
moth and summer fruit tortrix. Of this, 14.7 ha belonged to organic-
farming operations that use no conventional insecticides. The other 94.6 ha
belonged to farms using integrated pest management. The infestation was
monitored regularly by members of the South Tirol Advisory Ring.
None of the observed plots showed an infestation of fruit at harvest above
2Z (threshold of damage). Even fruit orchards with 10 leafroller Adoxophyes
orana larvae/100 shoots in the spring were adequately protected by the
pheromones (W. Waldner, 1991).
Figure 2 summarizes the control of codling moth in the IPM plots.
Figure 2: Control of codling moth by mating disruption, South Tirol 1991
WW average of (n) sites% infestation
5 sites
89.4 ha 5.06 ha
I range 0-2% 2-10%
Average infestation on a total area of 94.6 ha.
The threshold of damage (2% in South Tirol) was not exceeded on 94.5%
of the total IPM area. Where an infestation above 2% developed this was
because of inadequate number of dispensers, or border areas were neglected,
or plots/areas were too narrow or initial infestation levels were too high.
Figure 3 presents both, some positive results as well as examples of high
infestation arising from high initial populations. In most cases this also
included the areas of organic production.
Infestation development of codling moth in variable sites due to different
preinfestation levels
Terlan 1.2 ha
infestation
1991 17.2% XS
Harvest [__]
AugustJuly aa
preinfestation1990
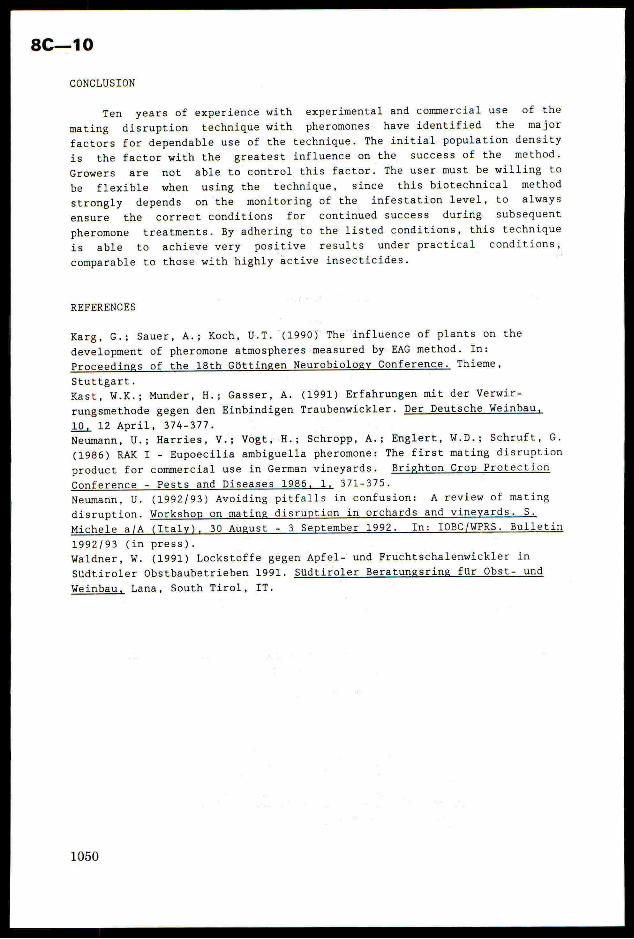
8C—10
CONCLUSION
Ten years of experience with experimental and commercial use of the
mating disruption technique with pheromones have identified the major
factors for dependable use of the technique. The initial population density
is the factor with the greatest influence on the success of the method.
Growers are not able to control this factor. The user must be willing to
be flexible when using the technique, since this biotechnical method
strongly depends on the monitoring of the infestation level, to always
ensure the correct conditions for continued success during subsequent
pheromone treatments. By adhering to the listed conditions, this technique
is able to achieve very positive results under practical conditions,
comparable to those with highly active insecticides.
REFERENCES
Karg, G.; Sauer, A.; Koch, U.T. (1990) The influence of plants on the
development of pheromone atmospheres measured by EAG method. In:
Proceedings of the 18th Gittingen Neurobiology Conference. Thieme,
Stuttgart.
Kast, W.K.; Munder, H.; Gasser, A. (1991) Erfahrungen mit der Verwir-
rungsmethode gegen den Einbindigen Traubenwickler. Der Deutsche Weinbau,
10, 12 April, 374-377.
Neumann, U.; Harries, V.; Vogt, H.; Schropp, A.; Englert, W.D.; Schruft, G.
(1986) RAK I - Eupoecilia ambiguella pheromone: The first mating disruption
product for commercial use in German vineyards. Brighton Crop Protection
Conference - Pests and Diseases 1986, 1, 371-375.
Neumann, U. (1992/93) Avoiding pitfalls in confusion: A review of mating
disruption. Workshop on mating disruption in orchards and vineyards. S.
Michele a/A (Italy), 30 August - 3 September 1992. In: IOBC/WPRS. Bulletin
1992/93 (in press).
Waldner, W. (1991) Lockstoffe gegen Apfel- und Fruchtschalenwickler in
Sidtiroler Obstbaubetrieben 1991. Stidtiroler Beratungsring fiir Obst- und
Weinbau, Lana, South Tirol, IT.
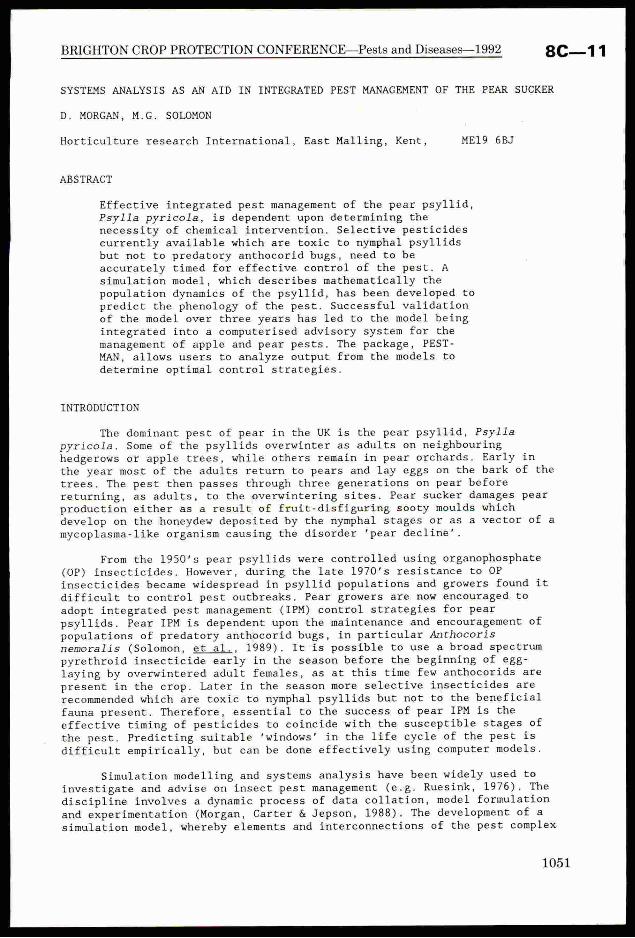
BRIGHTON CROP PROTECTION CONFERENCE—Pests and Diseases—1992 8C—11
SYSTEMS ANALYSIS AS AN AID IN INTEGRATED PEST MANAGEMENT OF THE PEAR SUCKER
D. MORGAN, M.G. SOLOMON
Horticulture research International, East Malling, Kent, ME19 6BJ
ABSTRACT
Effective integrated pest management of the pear psyllid,Psylla pyricola, is dependent upon determining the
necessity of chemical intervention. Selective pesticidescurrently available which are toxic to nymphal psyllidsbut not to predatory anthocorid bugs, need to beaccurately timed for effective control of the pest. Asimulation model, which describes mathematically thepopulation dynamics of the psyllid, has been developed topredict the phenology of the pest. Successful validationof the model over three years has led to the model beingintegrated into a computerised advisory system for themanagement of apple and pear pests. The package, PEST-MAN, allows users to analyze output from the models todetermine optimal control strategies.
INTRODUCTION
The dominant pest of pear in the UK is the pear psyllid, Psyllapyricola. Some of the psyllids overwinter as adults on neighbouringhedgerows or apple trees, while others remain in pear orchards. Early inthe year most of the adults return to pears and lay eggs on the bark of thetrees. The pest then passes through three generations on pear beforereturning, as adults, to the overwintering sites. Pear sucker damages pearproduction either as a result of fruit-disfiguring sooty moulds whichdevelop on the honeydew deposited by the nymphal stages or as a vector of amycoplasma-like organism causing the disorder ‘pear decline’.
From the 1950's pear psyllids were controlled using organophosphate(OP) insecticides. However, during the late 1970's resistance to OP
insecticides became widespread in psyllid populations and growers found itdifficult to control pest outbreaks. Pear growers are now encouraged toadopt integrated pest management (IPM) control strategies for pearpsyllids. Pear IPM is dependent upon the maintenance and encouragement ofpopulations of predatory anthocorid bugs, in particular Anthocoris
nemoralis (Solomon, et_al., 1989). It is possible to use a broad spectrumpyrethroid insecticide early in the season before the beginning of egg-laying by overwintered adult females, as at this time few anthocorids are
present in the crop. Later in the season more selective insecticides are
recommended which are toxic to nymphal psyllids but not to the beneficial
fauna present. Therefore, essential to the success of pear IPM is the
effective timing of pesticides to coincide with the susceptible stages of
the pest. Predicting suitable ‘windows’ in the life cycle of the pest is
difficult empirically, but can be done effectively using computer models.
Simulation modelling and systems analysis have been widely used to
investigate and advise on insect pest management (e.g. Ruesink, 1976), The
discipline involves a dynamic process of data collation, model formulation
and experimentation (Morgan, Carter & Jepson, 1988). The development of a
simulation model, whereby elements and interconnections of the pest complex
1051
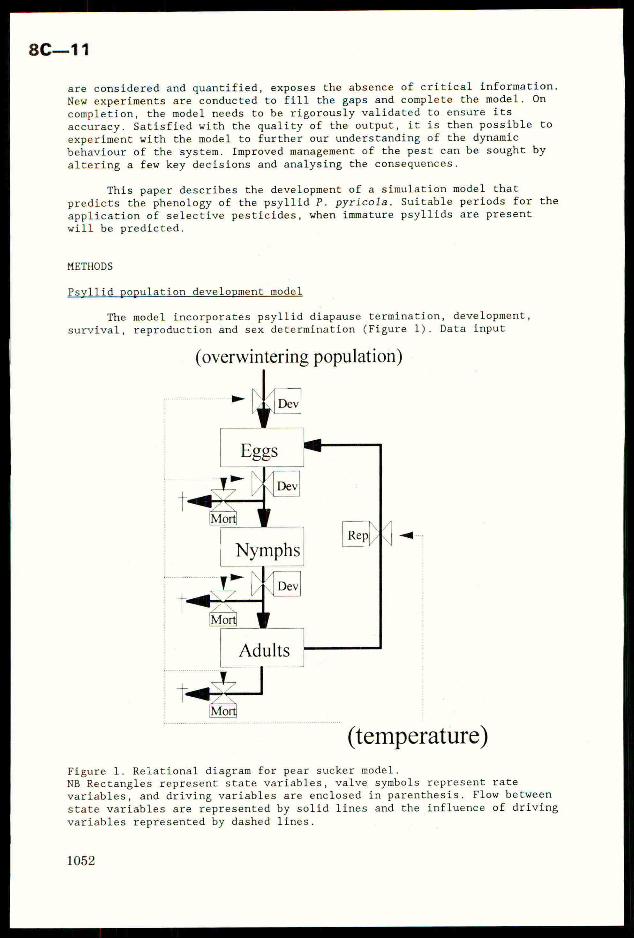
8C—11
are considered and quantified, exposes the absence of critical information.New experiments are conducted to fill the gaps and complete the model. Oncompletion, the model needs to be rigorously validated to ensure itsaccuracy. Satisfied with the quality of the output, it is then possible toexperiment with the model to further our understanding of the dynamicbehaviour of the system. Improved management of the pest can be sought byaltering a few key decisions and analysing the consequences.
This paper describes the development of a simulation model thatpredicts the phenology of the psyllid P. pyricola. Suitable periods for theapplication of selective pesticides, when immature psyllids are present
will be predicted.
METHODS
Psyllid population development model
The model incorporates psyllid diapause termination, development,survival, reproduction and sex determination (Figure 1). Data input
(overwintering population)
(temperature)
Figure 1. Relational diagram for pear sucker model.NB Rectangles represent state variables, valve symbols represent ratevariables, and driving variables are enclosed in parenthesis. Flow betweenstate variables are represented by solid lines and the influence of driving
variables represented by dashed lines.
1052
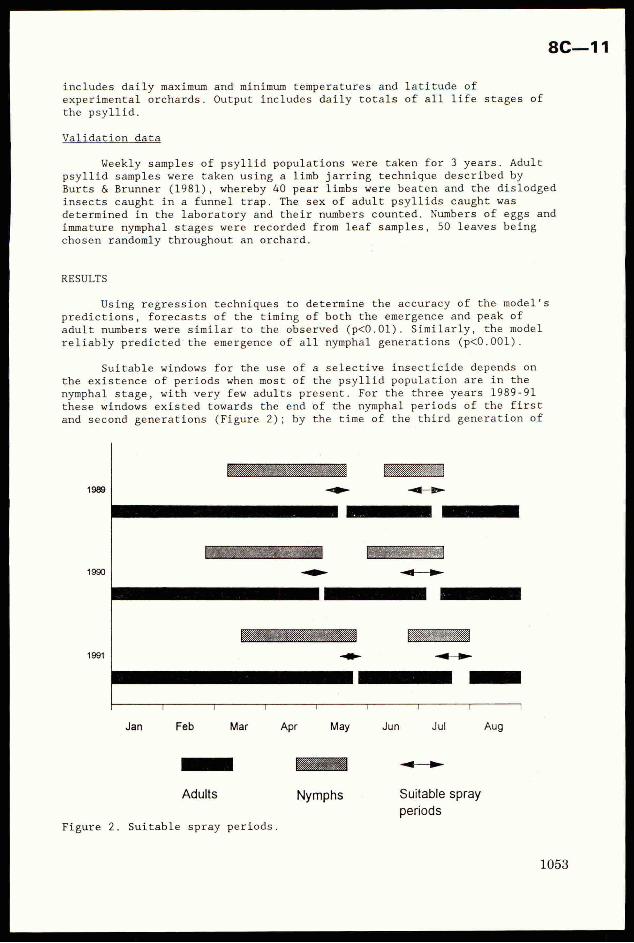
includes daily maximum and minimum temperatures and latitude ofexperimental orchards. Output includes daily totals of all life stages ofthe psyllid.
Validation data
Weekly samples of psyllid populations were taken for 3 years. Adultpsyllid samples were taken using a limb jarring technique described byBurts & Brunner (1981), whereby 40 pear limbs were beaten and the dislodgedinsects caught in a funnel trap. The sex of adult psyllids caught wasdetermined in the laboratory and their numbers counted. Numbers of eggs andimmature nymphal stages were recorded from leaf samples, 50 leaves beingchosen randomly throughout an orchard.
RESULTS
Using regression techniques to determine the accuracy of the model’spredictions, forecasts of the timing of both the emergence and peak ofadult numbers were similar to the observed (p<0.01). Similarly, the model
reliably predicted the emergence of all nymphal generations (p<0.001).
Suitable windows for the use of a selective insecticide depends on
the existence of periods when most of the psyllid population are in the
nymphal stage, with very few adults present. For the three years 1989-91these windows existed towards the end of the nymphal periods of the firstand second generations (Figure 2); by the time of the third generation of
Adults Suitable spray
periods
Figure 2. Suitable spray periods.
8C—11
nymphs (not shown in Figure 2) there was sufficient overlap of adults ofthe second and third generations to obscure any potential windows for the
treatment of nymphs.
DISCUSSION
The model accurately predicted the phenology of immature and adultstages of P. pyricola. No attempt was made to describe psyllid populationdynamics quantitatively as insufficient data were available to formulate
the necessary mortality rates.
Given the accuracy of the model, suitable spray periods forselective pesticides were derived. The predictions highlighted periods when
nymphal stages of psyllid were accessible to pesticides and adults werenot. The occurrence and duration of these periods varied between years as aresult of the differing phenology of psyllids in response to the differingtemperatures. Therefore, it is important to input accurate temperature data
into the models (Morgan, 1990). Another potential problem of forecasting
for pest management is the reliability of predictions of weatherconditions. One possible solution would be to use five-year meantemperatures, with associated errors, to predict the best and worst case
short-term forecasts (Rabbinge & Rijinski, 1983).
As a result of the satisfactory validation of the model, developmentis under-way to integrate the program into a computerised advisory systemfor apple and pear pests. PEST-MAN, as the advisory package is known, usesan intuitive style of presentation, involving simple pull-down menus, helpstatements and colour graphics, to allow users to quickly familiarizethemselves with the system and to make the necessary advisory decisions for
their pest problems.
ACKNOWLEDGEMENTS
The research was funded by an award from the Apple and Pear ResearchCouncil and by a Ministry of Agriculture Fisheries and Food commission onthe biology of top fruit pests and their natural enemies.
REFERENCES
Burts E.C.; Brunner J.F. (1981). Dispersion statistics and sequential
sampling plan for adult pear psylla. Journal of Economie Entomology. 74.
291-294.Morgan, D. (1991). The sensitivity of simulation models to temperature
changes. EPPO Bulletin 21. 393-398.Morgan, D.; Carter, N.; Jepson, P.C. (1988). Modelling principles in
relation to the epidemiology of barley yellow dwarf virus. Bulletin of the
IOBC (WPRS). XI/2. 27-32.Rabbinge, R.; Rijsdijk, F.H. (1983). EPIPRE : A disease and pest managementsystem for winter wheat, taking into account micrometeorological factors.
EPPO Bulletin. 13,297-305.Ruesink, W.G. (1976). Status of systems approach to pest management. Annual
Review of Entomology. 21. 27-46.Solomon, M.G.; Cranham, J.E.; Easterbrook, M.A.; Fitzgerald, J.D. (1989).
Control of the pear psyllid, Cacopsylla pyricola, in South East England by
predators and pesticides. Crop Protection. 8. 197-205.
BRIGHTON CROP PROTECTION CONFERENCE—Pests and Diseases—1992 8C—12
SALICYLIC ACID AS AN ENDOGENOUS SIGNAL OF RESISTANCE INDUCTION IN PLANTS
S. Schneider, F. Kurosaki, A. Nishi
Faculty of Pharmaceutical Sciences, Medical and Pharmaceutical University,
2630 Sugitani, Toyama 930-01, Japan
ABSTRACT
Treatment of carrot suspension culture (Daucus carrota cv Kintoki)
with a fungal cell wall preparation of Chaetomium globosum induceschitinase and the export into the extracellular space. The induc-
tion of chitinase activity, however, was preceded by the appea-
rance of salicylic acid in the cells and to a greater extent in
the extracellular space. Salicylate treatment of carrot suspension
cultures induced chitinase activity more rapidly than the fungalcell wall inducer. Culture medium of induced cells, containing
salicylic acid, was able to increase chitinase in suspension cul-tures without a direct contact between cells and fungal cell wall
("indirect induction"). Moreover experiments with reagents that
influence the intracellular level of calcium ions, such as verapa-
mil, EGTA (ethylene glycol-bis(8-aminoethylether)-N,N,N',N'-te-
traacetic acid) and the calcium ionophore A23187 indicated that
ca2+ may play an important role in induction and release of sali-
cylic acid and chitinase during resistance induction.
INTRODUCTION
Infection of plants can activate a number of plant defense mechanisms
against pathogen reproduction and secondary infection. Resistance mechanisms
like for example the formation of antimicrobial phytoalexins, the reinforce-
ment of plant cell walls and the induction of certain hydrolytic enzymes
(for review see McIntyre 1982). Similar to a previous infection, thepretreatment of plants with organic or inorganic substances is able to in-
duce plant resistance. In addition to local responses induced resistance isoften widespread within the plant and provides protection against a wide
range of pathogens. Hence, it is likely that a superposed factor is control-
ling resistance induction. In the present report we describe salicylic acid
as an inducer of resistance and as a possible plant substance for signal
transmission. For the detection of resistance chitinase provides a good in-
dicator, due to the marked increase after infection.
Recently, Métraux et al. (1990) observed an increase of salicylic acid
concentration in phloem sap of cucumber plants before the establishment of
systemic acquired resistance by inoculation with pathogens. Salicylic acid
is known as an exogenous inducer of several pathogenesis related genes, thus
it was thougth to be a signal molecule in the induction of induced resis-
tance. As an approach to elucidate the role of salicylic acid in resistance
induction we developed a test system for indirect-resistance-induction in
cell suspension cultures.
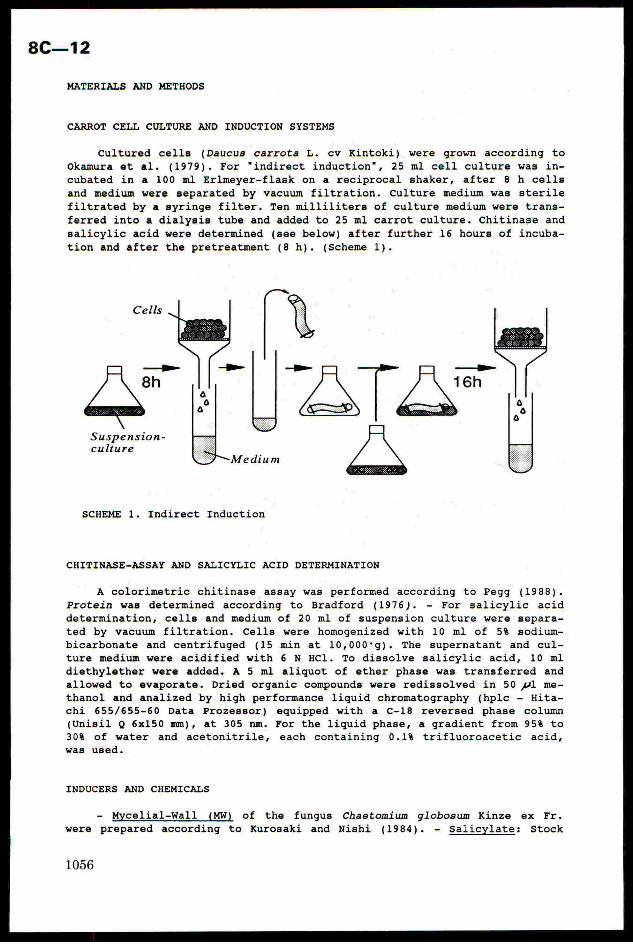
8C—12
MATERIALS AND METHODS
CARROT CELL CULTURE AND INDUCTION SYSTEMS
Cultured cells (Daucus carrota L. cv Kintoki) were grown according to
Okamura et al. (1979). For “indirect induction", 25 ml cell culture was in-
cubated in a 100 ml Erlmeyer-flask on a reciprocal shaker, after 8 h cells
and medium were separated by vacuum filtration. Culture medium was sterile
filtrated by a syringe filter. Ten milliliters of culture medium were trans-
ferred into a dialysis tube and added to 25 ml carrot culture. Chitinase and
salicylic acid were determined (see below) after further 16 hours of incuba-
tion and after the pretreatment (8 h). (Scheme 1).
8h
Suspension-culture
SCHEME 1. Indirect Induction
CHITINASE-ASSAY AND SALICYLIC ACID DETERMINATION
A colorimetric chitinase assay was performed according to Pegg (1988).
Protein was determined according to Bradford (1976). - For salicylic aciddetermination, cells and medium of 20 ml of suspension culture were separa-
ted by vacuum filtration. Cells were homogenized with 10 ml of 5% sodium-
bicarbonate and centrifuged (15 min at 10,000°g). The supernatant and cul-
ture medium were acidified with 6 N HCl. To dissolve salicylic acid, 10 ml
diethylether were added. A 5 ml aliquot of ether phase was transferred and
allowed to evaporate. Dried organic compounds were redissolved in 50 wl me-
thanol and analized by high performance liquid chromatography (hplc - Hita-
chi 655/655-60 Data Prozessor) equipped with a C-18 reversed phase column
(Unisil Q 6x150 mm), at 305 nm. For the liquid phase, a gradient from 95% to
30% of water and acetonitrile, each containing 0.1% trifluoroacetic acid,
was used.
INDUCERS AND CHEMICALS
- Mycelial-Wall (MW) of the fungus Chaetomium globosum Kinze ex Fr.
were prepared according to Kurosaki and Nishi (1984). - Salicylate: Stock
1056
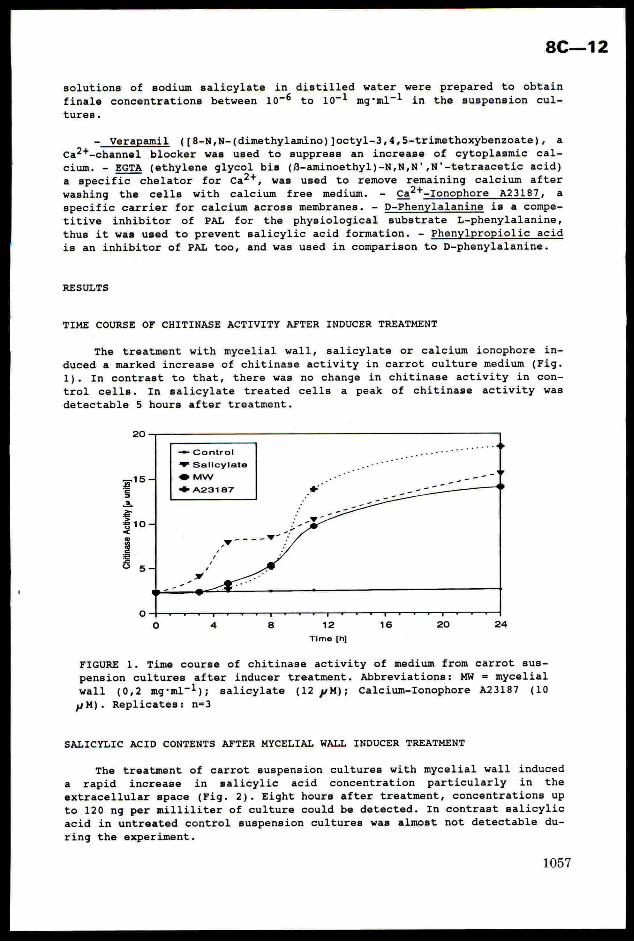
8C—12
solutions of sodium salicylate in distilled water were prepared to obtain
finale concentrations between 10-© to 1071 mg‘m1~1 in the suspension cul-
tures.
-_Verapamil ([8-N,N-(dimethylamino) Joctyl-3,4,5-trimethoxybenzoate), a
ca2+-channel blocker was used to suppress an increase of cytoplasmic cal-
cium. - EGTA (ethylene glycol bis (f-aminoethyl)-N,N,N',N'-tetraacetic acid)
a specific chelator for ca2t, was used to remove remaining calcium after
washing the cells with calcium free medium. - ca*t-1onophore A23187, a
specific carrier for calcium across membranes. - D-Phenylalanine is a compe-
titive inhibitor of PAL for the physiological substrate L-phenylalanine,thus it was used to prevent salicylic acid formation. - Phenylpropiolic acid
is an inhibitor of PAL too, and was used in comparison to D-phenylalanine.
RESULTS
TIME COURSE OF CHITINASE ACTIVITY AFTER INDUCER TREATMENT
The treatment with mycelial wall, salicylate or calcium ionophore in-
duced a marked increase of chitinase activity in carrot culture medium (Fig.
1). In contrast to that, there was no change in chitinase activity in con-
trol cells. In salicylate treated cells a peak of chitinase activity was
detectable 5 hours after treatment.
20
— Control
F Salicylate
@ Mw
# A23187
= a
Chitinase
Activity
[yunits]
°
12
Time [h]
FIGURE 1. Time course of chitinase activity of medium from carrot sus-
pension cultures after inducer treatment. Abbreviations: MW = mycelial
wall (0,2 mg‘ml-!); salicylate (12 yM); Calcium-Ionophore A23187 (10
WM). Replicates: n=3
SALICYLIC ACID CONTENTS AFTER MYCELIAL WALL INDUCER TREATMENT
The treatment of carrot suspension cultures with mycelial wall induced
a rapid increase in salicylic acid concentration particularly in the
extracellular space (Fig. 2). Eight hours after treatment, concentrations up
to 120 ng per milliliter of culture could be detected. In contrast salicylic
acid in untreated control suspension cultures was almost not detectable du-
ring the experiment.
1057
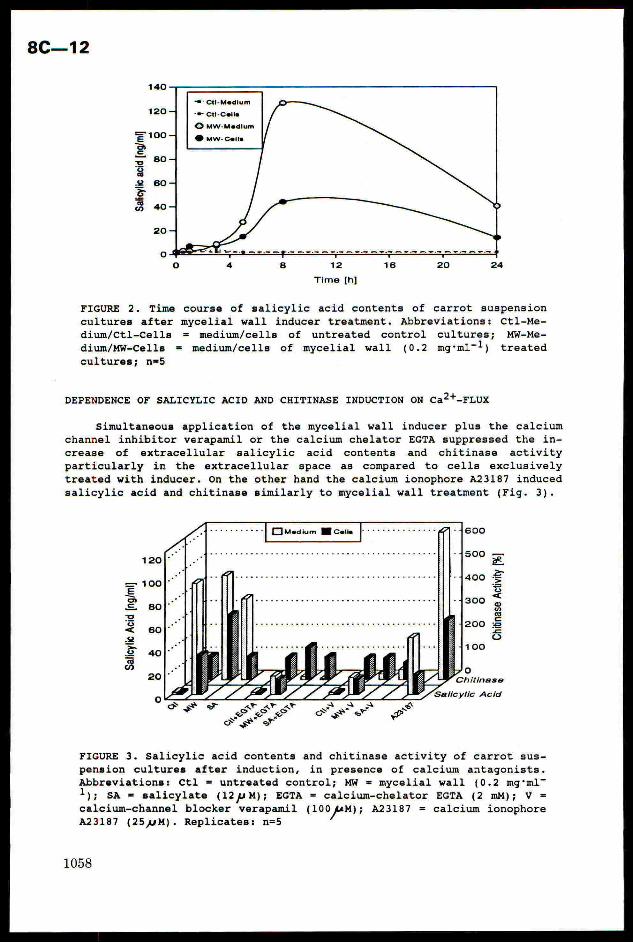
= Ctl-Medium
"® Cti-Celis
© Mw-Medium
@ uw-celis= fe]
°o ! Salicylicacid
[ng/
ml]
9 SSeeeeeeT T T T
4 8 12 16 20 24
Time [h]
FIGURE 2. Time course of salicylic acid contents of carrot suspension
cultures after mycelial wall inducer treatment. Abbreviations: Ctl-Me-
dium/ctl-cells = medium/cells of untreated control cultures; MW-Me-
dium/MW-Cells = medium/cells of mycelial wall (0.2 mg*mi-!) treated
cultures; n=5
DEPENDENCE OF SALICYLIC ACID AND CHITINASE INDUCTION ON ca2+_FLux
Simultaneous application of the mycelial wall inducer plus the calcium
channel inhibitor verapamil or the calcium chelator EGTA suppressed the in-
crease of extracellular salicylic acid contents and chitinase activity
particularly in the extracellular space as compared to cells exclusively
treated with inducer. On the other hand the calcium ionophore A23187 induced
salicylic acid and chitinase similarly to mycelial wall treatment (Fig. 3).
see eee | EE) Medium Hi Celie [occ
Chitinase
Acti
vity
[%]
Salicy
licAcid
[ng/ml
]
FIGURE 3. Salicylic acid contents and chitinase activity of carrot sus-
pension cultures after induction, in presence of calcium antagonists.
Abbreviations: Ctl = untreated control; MW = mycelial wall (0.2 mg*ml7~
1); SA = salicylate (122M); EGTA = calcium-chelator EGTA (2 mM); V =
calcium-channel blocker verapamil (100fem) A23187 = calcium ionophoreA23187 (25,4sM). Replicates: n=5
1058
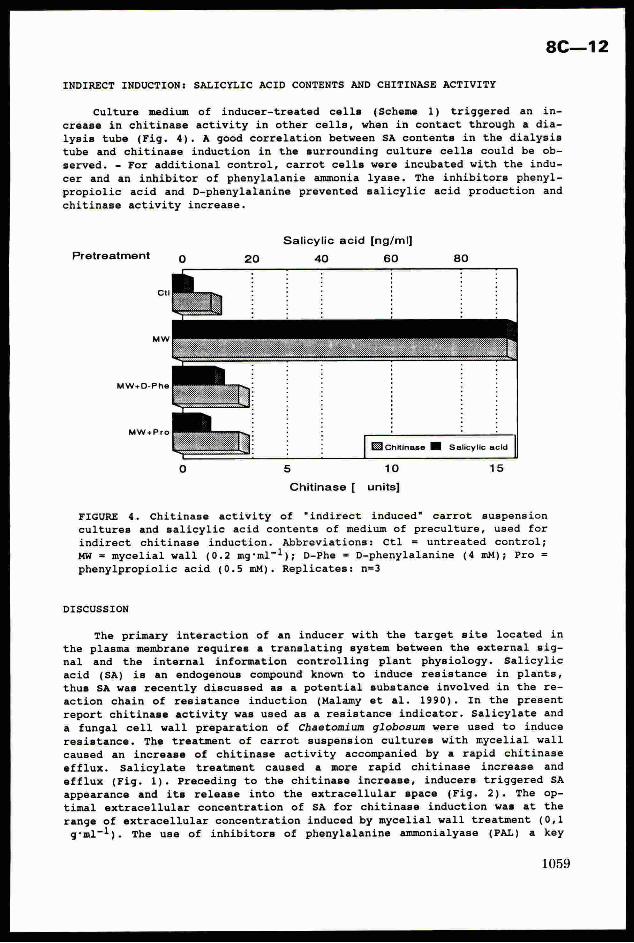
INDIRECT INDUCTION: SALICYLIC ACID CONTENTS AND CHITINASE ACTIVITY
Culture medium of inducer-treated cells (Scheme 1) triggered an in-
crease in chitinase activity in other cells, when in contact through a dia-lysis tube (Fig. 4). A good correlation between SA contents in the dialysis
tube and chitinase induction in the surrounding culture cells could be ob-
served. - For additional control, carrot cells were incubated with the indu-
cer and an inhibitor of phenylalanie ammonia lyase. The inhibitors phenyl-
propiolic acid and D-phenylalanine prevented salicylic acid production and
chitinase activity increase.
Salicylic acid [ng/ml]
Pretreatment 40 60
Eichitinase MM Salicylic acid
5 10 15
Chitinase [ units]
FIGURE 4. Chitinase activity of “indirect induced" carrot suspensioncultures and salicylic acid contents of medium of preculture, used for
indirect chitinase induction. Abbreviations: Ctl = untreated control;
MW = mycelial wall (0.2 mg‘ml~1); D-Phe = D-phenylalanine (4 mM); Pro =
phenylpropiolic acid (0.5 mM). Replicates: n=3
DISCUSSION
The primary interaction of an inducer with the target site located in
the plasma membrane requires a translating system between the external sig-
nal and the internal information controlling plant physiology. Salicylic
acid (SA) is an endogenous compound known to induce resistance in plants,
thus SA was recently discussed as a potential substance involved in the re-
action chain of resistance induction (Malamy et al. 1990). In the present
report chitinase activity was used as a resistance indicator. Salicylate and
a fungal cell wall preparation of Chaetomium globosum were used to induce
resistance. The treatment of carrot suspension cultures with mycelial wall
caused an increase of chitinase activity accompanied by a rapid chitinase
efflux. Salicylate treatment caused a more rapid chitinase increase and
efflux (Fig. 1). Preceding to the chitinase increase, inducers triggered SA
appearance and its release into the extracellular space (Fig. 2). The op-
timal extracellular concentration of SA for chitinase induction was at the
range of extracellular concentration induced by mycelial wall treatment (0,1
g'ml-!). The use of inhibitors of phenylalanine ammonialyase (PAL) a key
1059
8C—12
enzyme in salicylic acid synthesis indicated that an increase in intra- and
extracellular concentration depends on de novo biosynthesis of SA. - Verapa-
mil, a calcium channel blocker also inhibited the amount of SA. A comparable
inhibition profile could be detected for chitinase (Fig. 3). The calcium io-nophore A 23187 was able to substitute the inducer in salicylic acid and
chitinase induction. The results suggest, that ca2t-influx is essential for
SA and chitinase induction and export during resistance formation.
To investigate whether salicylic acid, produced from inducer-treated
plant cells, is able to induce resistance we developed a biotest system for
“indirect induction". Culture medium from induced carrot cells induced
chitinase activity and salicylic acid in other carrot cells without a direct
contact to the inducer mycelial cell wall. Experiments with inhibitors of
salicylic acid synthesis indicated that salicylic acid is a signal in the
resistance induction chain. Recently Malamy et al. (1990) described an in-
crease of salicylic acid contents of tobacco leaves resulting from tobacco
mosaic virus (TMV) infection and correlating with the expression of patho-
genesis-related proteins. Métraux et al. (1990) reported an increase of sa-
licylic acid contents in the phloem of cucumbers and its correlation with
systemic acquired resistance responding to a challenge with TMV or the fun-
gal pathogen Colletotrichum lagenarium. All investigations indicate in-dependently that salicylic acid is likely to be a missing link in the trans-duction chain of inducer interaction and plant response. Further research
will be done to elucidate whether the calcium ions and salicylic acid invol-
ved in plant resistance induction are a part of a common eucaryotic signal
transduction via protein phosphorylation.
REFERENCES
Bradford, M.M (1976) A rapid and sensitive method for quantitation of micro-gram quantities of protein utilizing the principle of protein-dye bin-
ding. Analytical Biochemistry, 62, 248-254.
Kurosaki, F.; Nishi, A. (1984) Elicitation of phytoalexin production in cul-
tured carrot cells. Physiological Plant Pathology, 24, 169-176.
Malamy, J.; Carr, J.P.; Klessig, D.F.; Raskin, I. (1990) Salicylic acid: a
likely endogenous signal in the resistance response of tobacco to viral
infection. Science, 250, 1002-1004.
Métraux. J.P. Signer; H., Ryals, J.; Ward, E.; Wyss-Benz. M.; Gaudin, J.;
Raschdorf, K.; Schmid, E.; Blum, W.; Inverardi, B. (1990) Increase in
salicylic acid at the onset of systemic acquired resistance in cu-
cumber. Science, 250, 1004-1006.
McIntyre, J.L. (1982) Induced Resistance. In: Phytopathogenic Procaryotes,
M.S. Mount and G.H. Lacy (Eds), New York: Academic Press, 2.
Okamura, S.; Sueki, K.; Nishi, A. (1979) Physiological changes of carrot
cells in suspension culture during growth and senescence. Physiologia
Plantarum, 33, 251-255.
Pegg, G.F. (1988) Chitinase from Tomato Lysopersicum esculentum. In: Methods
in Enzymology, J.N. Abelson, and M.J. Simon (Eds), 161, San Diego:
Academic Press
BRIGHTON CROP PROTECTION CONFERENCE—Pests and Diseases—1992 8C—13
ACTIVITY OF Bacillus thuringiensis var. kurstaki AGAINSTHelicoverpa zea AND Heliothis virescens (LEPIDOPTERA:NOCTUIDAE) ON COTTON
ABBAS ALI, S. Y. YOUNG
Department of Entomology, University of Arkansas,Fayetteville, AR 72701, USA
ABSTRACT
Activity of Bacillus thuringiensis against 1stinstars of Helicoverpa zea (Boddie) and Heliothisvirescens (F.) was studied on cotton. In thelaboratory, percent mortality of H. zea and H.
virescens increased significantly (P=0.05) withincreases in B. thuringiensis rate. Mortalities ofH. virescens were significantly (P=0.05) higher thanof H. zea at 0.56 and 1.12 kg/ha rates of B.thuringiensis 4 and 7 days post-treatment. LDsgovalues were 2-, 2.5- and 1.6-fold higher for H. zeathan the H. virescens 4 and 7 days post-treatment
and at pupation, respectively. Most mortalityoccurred by 4 days post-treatment. Results from thefield for 3 and 7 days post-treatment indicated apattern of mortality similar to laboratory data 4and 7 days post-treatment.
INTRODUCTION
Helicoverpa zea (Boddie), the corn earworm, and Heliothisvirescens (F.), the tobacco budworm, are important pests ofcotton in the United States. Pyrethroids are considered to bethe most effective insecticides against both species. Inrecent years, H. virescens has developed resistance againstpyrethroids (Luttrell et al., 1987) and this has prompted
development of resistance management strategies includingavoidance of use of pyrethroids in early season. Current pestmanagement strategies are directed toward the use of
biological insecticides in early season.
Commercial Bacillus thuringiensis Berliner var. kurstakipreparations have been on evaluation for use in early seasoncontrol of H. zea and H. virescens on cotton. Most fieldstudies show that B. thuringiensis reduces heliothine spp.populations on cotton (Bell & Romine, 1980; Ali & Watson,1982) but overall control has not been adequate under highpopulation pressures. Laboratory studies show that H. zea ismore tolerant to B. thuringiensis than H. virescens.MacIntosh et al. (1990) reported that LC,, for purifiedproteins from B. thuringiensis were higher for H. zea than forH. virescens for HD-73 and HD-1.
These studies report on the activity of a series of B.thuringiensis rates against H. zea and H. virescens on cotton.
1061
8C—13
MATERIALS AND METHODS
Studies were conducted during 1991 on the Arkansas
Agricultural Experiment Station Research Farm, Fayetteville,
Ark. Cotton (DPL 50) used in these studies was thinned at
pre-squaring stage to obtain a density of approximately 74,100to 98,800 plants/ha. Effective growth of plants wasmaintained by furrow irrigation as needed. Plants were64+10.6 cm (mean+SEM) tall, had 11.9+0.37 main stem nodes,
18.7+6.3 squares, 1.3+0.8 blooms, and 0.4+0.18 bolls per plant
at the time the studies were conducted. Both H. zea and H.
virescens larvae were from a laboratory colony maintained at
the University of Arkansas. Javelin WG (Sandoz Inc., SanDiego), containing 6.4% of the active ingredients with B.thuringiensis var. kurstaki delta endotoxin potency of 52863Spodoptera Units/mg, was the formulation used.
Laboratory Study
A randomized complete block with four replications wasused to determine the activity of B. thuringiensis andcypermethrin, a standard pyrethroid insecticide, against H.zea and H. virescens on cotton terminals. Cotton plants inthe field were sprayed with five doses of B. thuringiensis(0.56, 1.12, 2.24, 4.48 and 8.96 kg/ha of commercial product),
cypermethrin (0.05 kg [ai]/ha as Cymbush 3EC), or water(control plants). Applications were made with a CO, poweredbackpack sprayer equipped with two TX-6 nozzles per row.Treatments were applied in a volume of approximately 93 l/haand at a nozzle pressure of 275.6 kPa.
Terminals were collected and brought to the laboratory inplastic bags. Twenty five, two-day-old larvae (1st instar) ofH. zea or H. virescens were placed individually on a terminalin 30-ml plastic containers lined with moist filter papers.Terminals were searched for larvae after 48 h to record themortality and surviving larvae were transferred tosemisynthetic diet (Burton, 1969) in 30-ml plastic containers.Larvae were observed 4 and 7 days post-treatment and then
every 4 to 5 days until pupation.
Field Study
Plots consisted of two rows, 3 m in length each, with 7-mand 3-row buffers between the ends and sides of the plots,
respectively. No blanket insecticide treatments were madebefore or during the experiment. Plants in all plots wereartificially infested with one-day-old H. zea or H. virescenslarvae (7 larvae/plant). Larvae were placed on plantterminals with a camel's hair brush.
Plots were arranged as a split plot in a randomizedcomplete block with four replications. Two species (H. zea
and H. virescens) were the main plots with seven treatments
(O, 0.56, 1.12, 2.24, 4.48, or 8.96 kg/ha of B. thuringiensisand 0.05 kg [ai]/ha of cypermethrin) as subplots. Plots were
1062
treated one day after the release of larvae on plants. The
application method was similar to that described above.
Three and 7 days post-treatment, 10 plants inapproximately 1 row meter from each subplot were cut and
transferred to the laboratory in plastic bags. Each of the 10
plants was thoroughly searched for larvae. All the survivinglarvae were transferred individually to semisynthetic diet in30-ml plastic containers. Larvae were held at 28°C and
mortality was recorded every 4 days until pupation.
Mortality data were analyzed by analysis of varianceprocedure. LDg,g values were calculated by using the probit
procedure. Because of the variation in survival of larvae incontrols of the species, field data were standardized bytransforming them to survival ratios (survival ratio=no. oflarvae in a treatment/no. of larvae found in the control).
RESULTS AND DISCUSSION
Laboratory Study
Interactions between species and treatments for 4 and 7days post-treatment periods were significant (F=2.71; for 4days and F= 2.5 for 7 days post-treatment; df=5, 33; P=0.05).
Within a species, mortality increased with application rate ofB. thuringiensis 4 and 7 days post-treatment (Table 1).Comparisons between species showed significantly highermortality in H. virescens than in H. zea at 0.56 and 1.12kg/ha rates of B. thuringiensis at 4 and 7 days post-treatment. Helicoverpa zea mortality at 1.12 and 2.24 kg/harates corresponded to H. virescens mortality at 0.56 and 1.12
kg/ha rates, respectively, both for 4 and 7 days post-treatment. However, no treatment differences were detectedbetween species at B. thuringiensis rates of 2.24, 4.48, and8.96 kg/ha 4 and 7 days post-treatment. Within species,percent mortality rose with increased B. thuringiensis rateseven though mortality did not differ between species at
pupation. The highest rate of B. thuringiensis (8.96 kg/ha)caused mortality similar to cypermethrin in H. virescens atall post-treatment periods and 7 days and pupation in H. Zea.
LDgg values for H. zea were 2-, 2.5- and 1.6-fold higher
than H. virescens for 4 and 7 days post-treatment and
pupation, respectively (Table 1). Based on 95% CI, LDso
values for H. zea were significantly higher than H. virescens
only at 4 days post-treatment.
Most mortality in both species (60 to 91% in the H. zeaand 76 to 98% in the H. virescens) occurred within four daysof treatment (Fig. 1). Between species, cumulative percentmortality was significantly higher for H. virescens than forH. zea for all B. thuringiensis rates tested at 4 days post-treatment. All H. virescens mortality occurred by 16 dayspost-treatment. Some H. zea larvae survived up to 40 days
8C—13
post-treatment indicating more chronic type of activity.
Field Study
Significant interaction between species and treatmentsfor 3 and 7 days post-treatment was not detected (F=1.86 for 3
days and F=0.22 for 7 days post-treatment; df=5, 30; P=0.05).
Between species, comparisons showed a significantly highersurvival in H. zea than the H. virescens for 1.12 and 2.24kg/ha rates of B. thuringiensis 3 and 7 days post-treatment.Results from the field for 3 and 7 days post-treatment mimicthe pattern of mortalities in our laboratory data on cotton
terminals 4 and 7 days post-treatment.
The course of mortality is an important factor in insectcontrol (Fast & Regniere, 1984). Although mortalities were
similar between species at high rates, lethal times weresignificantly shorter for H. virescens than H. zea at all B.thuringiensis rates tested 4 days post-treatment. Fast &Regniere (1984) reported that exposure time of B.thuringiensis can affect LT,,g as much as LDgg and may have agreater relevance to field efficacy, because larvae that livelonger will have better chances of recovery as the
environmental degradation of the material progresses andchances of further ingestion of active material are decreased.
These data indicate that at currently recommended rates
of B. thuringiensis for cotton, mortality in first instar H.zea larvae will be lower than that in H. virescens. LDsovalues indicate that the current B. thuringiensisrecommendations closely relate to mortality data of the H.virescens. These results signify the importance of theknowledge of heliothine species composition for effective useof B. thuringiensis in their control on cotton. Initialmortality is the most important factor in control; therefore,field recommendations should be based on H. zea mortality datain areas where these species occur on cotton at the same time.
However, because of cost constraints, using appropriateinsecticide-B. thuringiensis mixtures in early season cottonmay prove to be more effective than B. thuringiensis alone inareas where H. zea is the most abundant species.
ACKNOWLEDGMENTS
This research was supported in part by Grant No. 89-34195-4378, CSRS-USDA.
REFERENCES
Ali, A. A.; Watson, T. F. (1982) Effects of Bacillusthuringiensis var. kurstaki on tobacco budworm(Lepidoptera: Noctuidae) adult and egg stages. Journal ofEconomic Entomology. 75, 596-598.
Bell, M. R.; Romine, C. L. (1980) Tobacco budworm field
1064
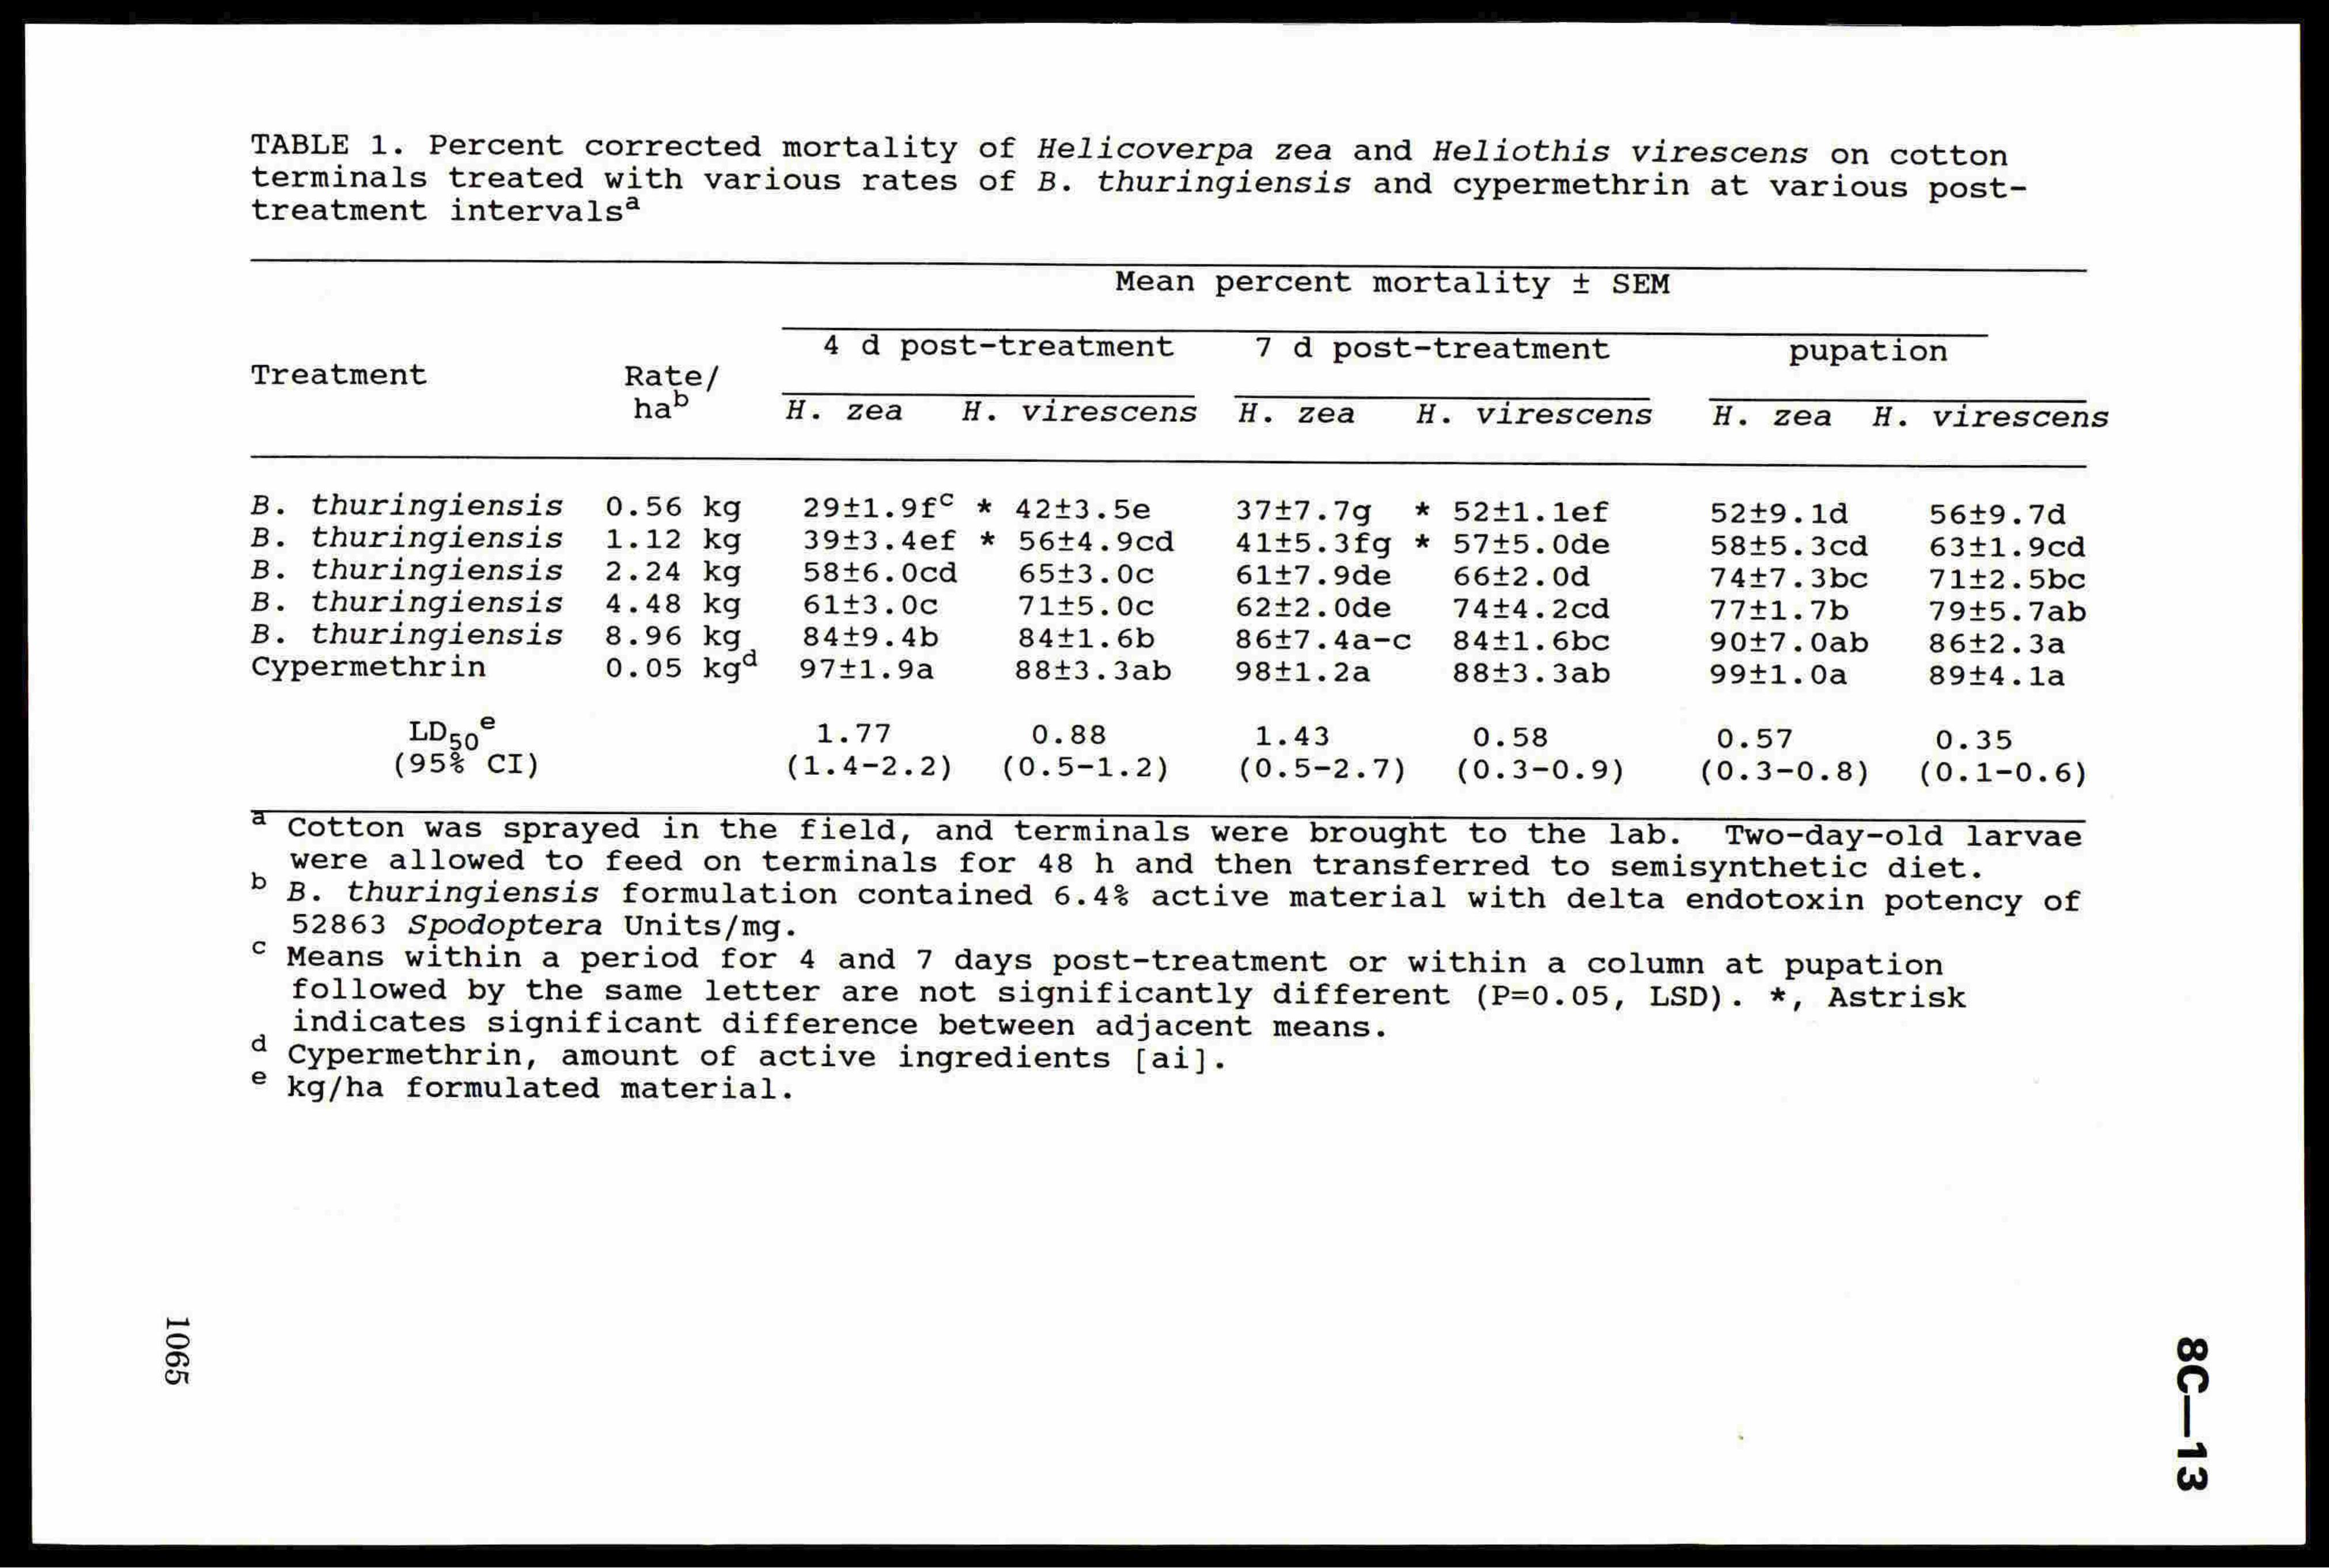
TABLE 1. Percent corrected mortality of Helicoverpa zea and Heliothis virescens on cottonterminals treated with various rates of B. thuringiensis and cypermethrin at various post-treatment intervals®
Treatment4 da post-treatment
H. zea
Mean percent mortality + SEM
virescens
7 d post-treatment
H. zea virescens
pupation
H. zea virescenspees
29+1.9f° * 42+3.5eB. thuringiensisB. thuringiensisB. thuringiensisB. thuringiensisB. thuringiensisCypermethrin
394+3.4ef * 564+4.9cd58+6.0cd61+3.0c
844+9.4b974+1.9a
65+3.0c71+5.0c
84+1.6b
884+3.3ab
374+7.7g414+5.3fg *61+7.9de62+2.0de864t7.4a-c98+1.2a
52+1.1lef
57+5.0de
66+2.0d
7444.2cd
84+1.6bc
88+3.3ab
52+9.1d58+5.3cd74+7.3be77t1LsS7b90+7.0ab994+1.0a
56+9.7d63+1.9cd71+2.5be79+5.7ab86+2.3a89+4.1la
EDeg®* 1.77 0.88 1.43 0.58 0.57 0.35(95% CI) (1.4-2.2) (0.5-1.2) (0.5-2.7) (0.3-0.9) (0.3-0.8) (0.1-0.6)
Cotton was sprayed in the field, and terminals were brought to the lab. Two-day-old larvaewere allowed to feed on terminals for 48 h and then transferred to semisynthetic diet.B. thuringiensis formulation contained 6.4% active material with delta endotoxin potency of52863 Spodoptera Units/mg.Means within a period for 4 and 7 days post-treatment or within a column at pupationfollowed by the same letter are not significantly different (P=0.05, LSD). *, Astriskindicates significant difference between adjacent means.Cypermethrin, amount of active ingredients [ai].kg/ha formulated material.
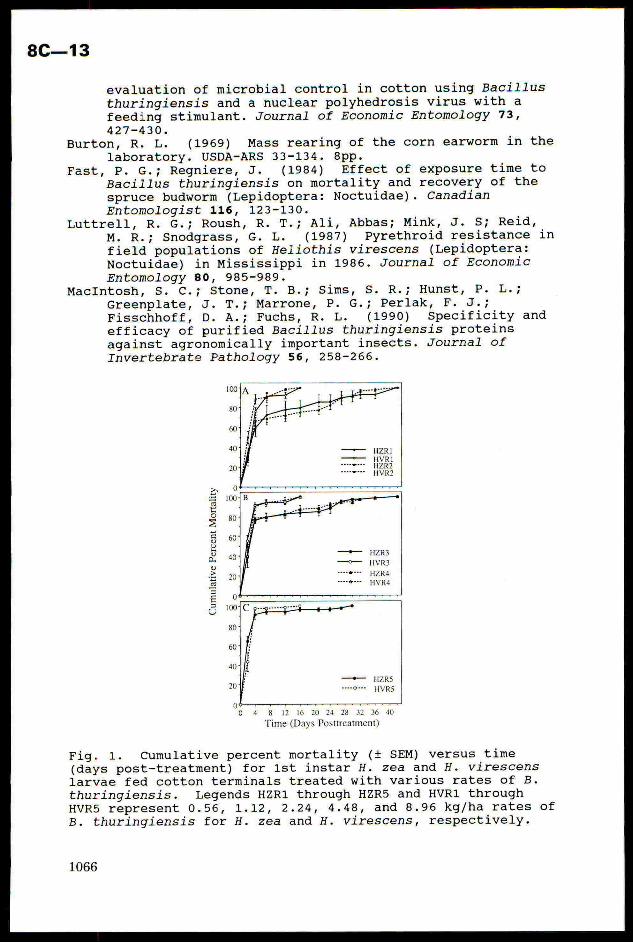
evaluation of microbial control in cotton using Bacillus
thuringiensis and a nuclear polyhedrosis virus with a
feeding stimulant. Journal of Economic Entomology 73,
427-430.
Burton, R. L. (1969) Mass rearing of the corn earworm in the
laboratory. USDA-ARS 33-134. 8pp.
Fast, P. G.; Regniere, J. (1984) Effect of exposure time to
Bacillus thuringiensis on mortality and recovery of thespruce budworm (Lepidoptera: Noctuidae). CanadianEntomologist 116, 123-130.
Luttrell, R. G.; Roush, R. T.; Ali, Abbas; Mink, J. S; Reid,
M. R.; Snodgrass, G. L. (1987) Pyrethroid resistance in
field populations of Heliothis virescens (Lepidoptera:
Noctuidae) in Mississippi in 1986. Journal of Economic
Entomology 80, 985-989.
MacIntosh, S. C.; Stone, T. B.; Sims, S. R.; Hunst, P. L.;
Greenplate, J. T.; Marrone, P. G.; Perlak, F. J.;
Fisschhoff, D. A.; Fuchs, R. L. (1990) Specificity and
efficacy of purified Bacillus thuringiensis proteins
against agronomically important insects. Journal of
Invertebrate Pathology 56,
60
40—o— HVR3
sree HZR4sree HVRA
20
0
100
CumulativePercentMortality
80
60
404 fi
20 0 .
O 4 8 12 16 20 24 28 32 36 40
Time (Days Posttreatment)
Fig. 1. Cumulative percent mortality (+ SEM) versus time(days post-treatment) for ist instar H. zea and H. virescens
larvae fed cotton terminals treated with various rates of B.thuringiensis. Legends HZR1 through HZR5 and HVR1 through
HVR5 represent 0.56, 1.12, 2.24, 4.48, and 8.96 kg/ha rates of
B. thuringiensis for H. zea and H. virescens, respectively.
1066
BRIGHTON CROP PROTECTION CONFERENCE—Pests and Diseases—1992 8C—14
THE SPHINX PROJECT - A COMPUTER BASED IPM SYSTEM FOR COTTON
Y, Osman
First Undersecretary to the Minister of Agriculture, Ministry of Agriculture, Cairo,
Egypt
W. F. Nicholson
Ciba-Geigy, Agrochemical Research Station Kaha, P.O. Box 135 (MC 12311)Dokki, Giza--Egypt
ABSTRACT
The Sphinx Project is a cooperative effort which began in 1989between Ciba-Geigy, Ltd. and the Egyptian Ministry of Agriculture.The major objective of the Sphinx Project is to assist production ofao in Egypt through development of a computerized IPMatabase.
This paper introduces the Sphinx Project. It includes descriptions ofguidelines followed in developmentof the project; the database anddata reporting system; and benefits of the project.
INTRODUCTION
Egypt hasa history of following IPM practices in cotton. The early seasonmanual collection of Spodopteralittoralis egg massesis the primary meansof controlling this pest (McKinley et al., 1989).
A lot of data are collected annually in the present Ministry of Agriculture(MAG) pest management program. However; minimal data are collectedabout crop development, beneficial insects and some insect pests. Also,data collected in the MAG program can not always easily be transferred tocomputers, and information is often not readily available to otherdepartments in MAG.
The MAG aimsto standardize data collection procedures in cotton andto develop a computer based system which can serve decision makers inthe field and national policy makers in Cairo. The Sphinx Project is acooperative effort between Ciba-Geigy and the Egyptian Ministry ofAgriculture, which has as its major objective the development of acomputerized integrated pest management database.
SPHINX PROJECT ORGANIZATION
The Sphinx Project is planned to last up to 10 years and will have 5phases, Phase 1, the present phase and the phase discussed herein, has asits objective the collection and retrieval of data from cotton, its pests,beneficials and agricultural practices. Work will progress through 4 additionalphases ending with the use of simulation models and expert systems.
8C—14
A local steering committee wasestablished in Egypt in 1989. The function
of this committee is to coordinate, evaluate and approve Sphinx Projectactivities, and to set guidelines for operation.
The steering committee selected the El Mansoura district of Dakhalia
Province as the location for the Sphinx Project. This province, located in the
Nile Delta, is a major cotton production area. In 1992 a second area,located in Assiut Province, in Upper Egypt was added.
SPHINX PROJECT IPM DATABASE
General Characteristics
The Sphinx database is designed as a national database for cottonproduction. Information such asfertilizer use, irrigation, pesticide use, andcottonfruiting, will be available to any organization in the MAG. This gives
it a multi-purpose and multi-level role in the MAG.
The basic principles of IPM are the same for any crop pest. This is
considered in development of the Sphinx IPM computer software, Thesystem, although developedfor use in cotton, is designed for adaptation to
other crop systems with minimal effort.
Information Categories
Data in the Sphinx Project database are grouped into severalinformationcategories. Data are collected from these categories in both the MAGprogram and the Sphinx Project. However, the Sphinx Project includes dataabout crop development, and pest and beneficial populations which arenot collected in the MAG program.
Site informationData collected includefield identification, field size, crop rotation, crop
variety, planting date, emergence date, stand density, and weather data.
Cultural PracticesThese data are closely related to site information, and include land
preparation. irrigation, fertilization, and non-chemical methods of pestcontrol.
Pesticide Use InformationThese data include target organism, compoundused,rate of application,
and time of application.
Cotton Plant Phenology andInsect InformationData collected under these two categories include pest and beneficial
insect numbers, insect damaged and non-damagedfruit, and pheromonetrap data.
SPHINX PROJECT - PRESENT STATUS
Phase One Goals
Phase one of the Sphinx Project beganin 1990 and will be completed in
1068
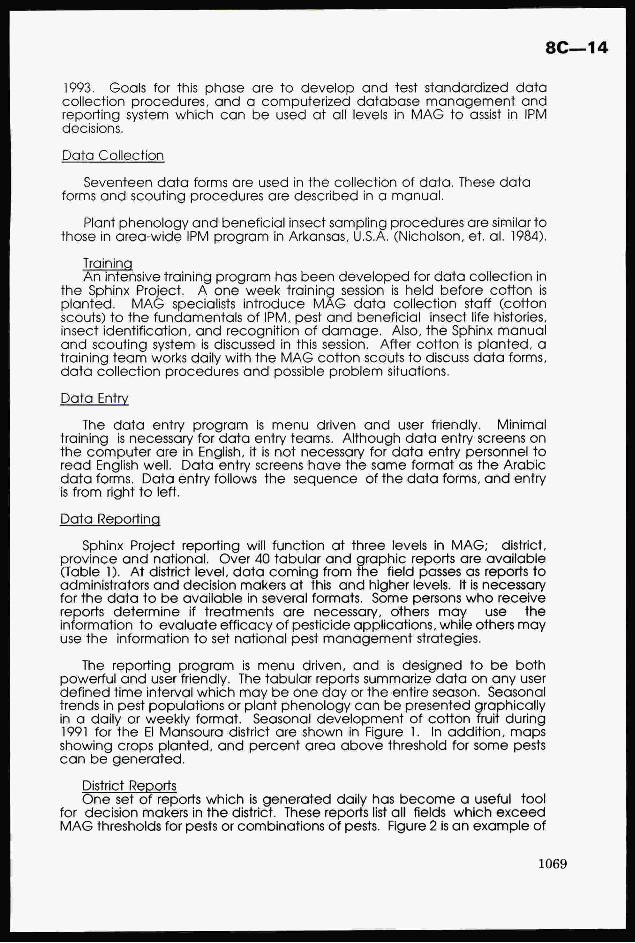
8C—14
1993. Goals for this phase are to develop and test standardized datacollection procedures, and a computerized database management andreporting system which can be used at all levels in MAG to assist in IPMdecisions,
Data Collection
Seventeen data forms are used in the collection of data. These dataforms and scouting procedures are described in a manual.
Plant phenology and beneficial insect sampling procedures are similar tothose in area-wide IPM program in Arkansas, U.S.A. (Nicholson, ef. al. 1984).
TrainingAn intensive training program has been developedfor data collectionin
the Sphinx Project. A one weektraining session is held before cottonisplanted. MAG specialists introduce MAG data collection staff (cottonscouts) to the fundamentals of IPM. pest and beneficial insectlife histories,insect identification, and recognition of damage. Also, the Sphinx manualand scouting system is discussed in this session. After cotton is planted, atraining team works daily with the MAG cotton scouts to discuss data forms,data collection procedures and possible problem situations.
Data Entry
The data entry program is menu driven and userfriendly. Minimaltraining is necessary for data entry teams. Although data entry screens onthe computer are in English, it is not necessary for data entry personnel toread English well. Data entry screens have the same format as the Arabicdata forms. Data entry follows the sequence of the data forms, and entryis from right to left.
Data Reporting
Sphinx Project reporting will function at three levels in MAG; district,province and national. Over 40 tabular and graphic reports are available(Table 1). At district level, data coming from the field passes as reports toadministrators and decision makers at this and higherlevels. It is necessaryfor the data to be available in several formats. Some persons who receivereports determine if treatments are necessary, others may use theinformation to evaluate efficacy of pesticide applications, while others mayuse the information to set national pest management strategies.
The reporting program is menu driven, and is designed to be bothpowerful and userfriendly. The tabular reports summarize data on any userdefined time interval which may be one day or the entire season. Seasonaltrends in pest populations or plant phenology can be presented graphicallyin a daily or weekly format. Seasonal development of cotton fruit during1991 for the El Mansoura district are shown in Figure 1. In addition, mapsshowing crops planted, and percent area above threshold for some pestscan be generated.
District ReportsOne set of reports which is generated daily has become a useful tool
for decision makers in the district. These reportslist all fields which exceedMAGthresholds for pests or combinations of pests. Figure 2 is an example of
1069
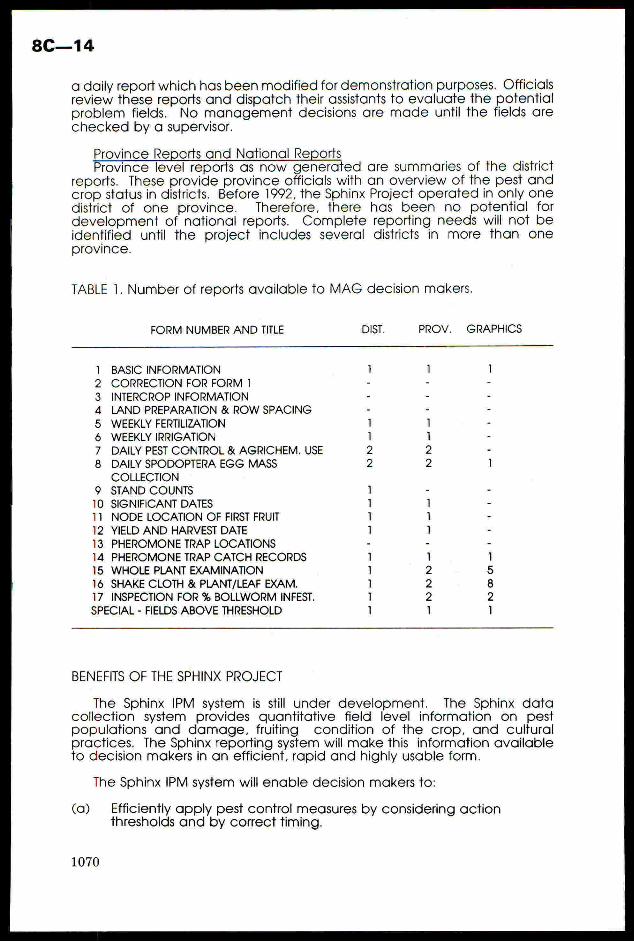
8C—14
a daily report which has been modified for demonstration purposes. Officialsreview these reports and dispatchtheir assistants to evaluate the potentialproblem fields. No management decisions are made until the fields arechecked by a supervisor.
Province Reports and National ReportsProvince level reports as now generated are summaries of the district
reports, These provide province officials with an overview of the pest andcrop status in districts. Before 1992, the Sphinx Project operated in only onedistrict of one province. Therefore, there has been no potential fordevelopment of national reports. Complete reporting needs will not beidentified until the project includes several districts in more than oneprovince.
TABLE 1. Numberof reports available to MAG decision makers.
FORM NUMBER ANDTITLE DIST. PROV. GRAPHICS
BASIC INFORMATIONCORRECTION FOR FORM 1INTERCROP INFORMATIONLAND PREPARATION & ROW SPACINGWEEKLY FERTILIZATIONWEEKLY IRRIGATIONDAILY PEST CONTROL & AGRICHEM.USEDAILY SPODOPTERA EGG MASSCOLLECTIONSTAND COUNTSSIGNIFICANT DATESNODE LOCATIONOFFIRST FRUITYIELD AND HARVEST DATEPHEROMONETRAP LOCATIONSPHERCMONETRAP CATCH RECORDSWHOLE PLANT EXAMINATIONSHAKE CLOTH & PLANT/LEAF EXAM.INSPECTION FOR % BOLLWORMINFEST.
SPECIAL- FIELDS ABOVE THRESHOLD
]234
5678 N
hwO——
+
NON——!
et)asss
ss)
es
=[—=NPWDNNMN—]—]!'
]=——'!
BENEFITS OF THE SPHINX PROJECT
The Sphinx IPM system is still under development. The Sphinx datacollection system provides quantitative field level information on pestpopulations and damage,fruiting condition of the crop, and culturalpractices. The Sphinx reporting system will make this information availableto decision makers in an efficient, rapid and highly usable form.
The Sphinx IPM system will enable decision makers to:
(a) Efficiently apply pest control measures by considering actionthresholds and by correct timing.
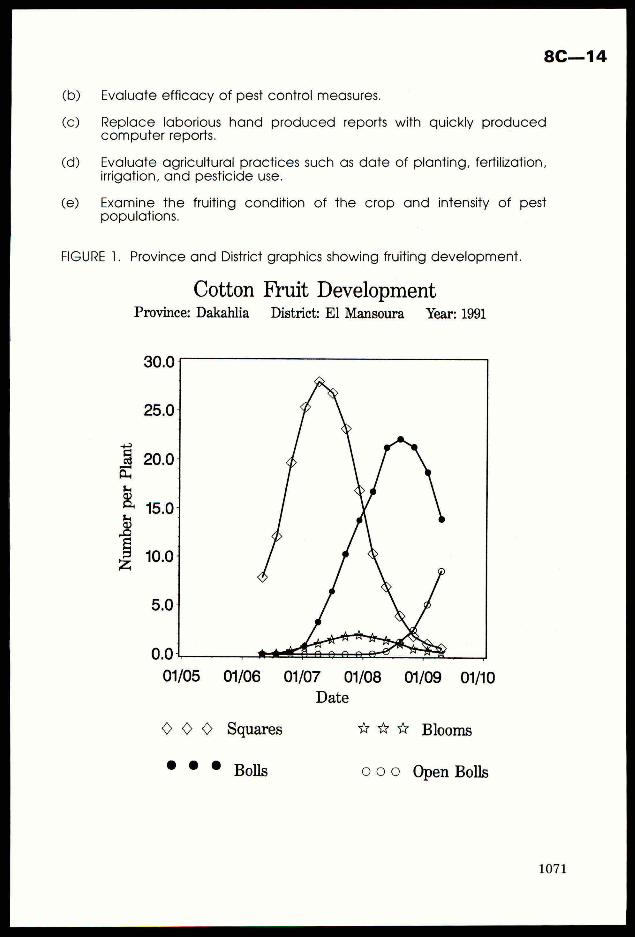
Evaluate efficacy of pest control measures.
Replace laborious hand produced reports with quickly producedcomputer reports.
Evaluate agricultural practices such as date of planting, fertilization,irrigation, and pesticide use.
(e) Examine the fruiting condition of the crop and intensity of pestpopulations.
FIGURE 1. Province andDistrict graphics showing fruiting development.
Cotton Fruit DevelopmentProvince: Dakahlia District: El] Mansoura Year: 1991
i) a oO
nD o °o
~
aAy
+
5 45.05
5z —
_k,
o oO
5.0; 0.04 sett A oo RS01/05 01/06 01/07 01/08 01/09 01/10
Date
> © © Squares * ¥% ¥ Blooms
© ¢° © Bolls OOO Open Bolls
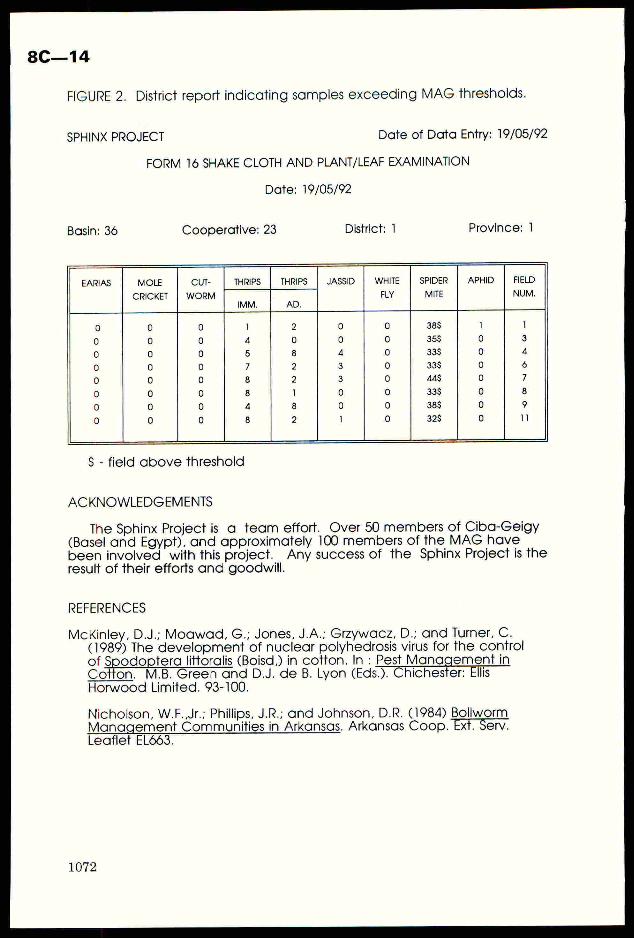
8C—14
FIGURE 2. District report indicating samples exceeding MAG thresholds.
SPHINX PROJECT Date of Data Entry: 19/05/92
FORM 16 SHAKE CLOTH AND PLANT/LEAF EXAMINATION
Date: 19/05/92
Basin: 36 Cooperative: 23 District: 1 Province: 1
MOLE THRIPS THRIPS JASSID SPIDER
CRICKET MITEIMM.
> 9
38S
35$338
33$Aas
33$
38$
32$
oooooocosg
ooooo0o90c;o
ooooo0ocqc;o
oOnhROONOR
—
NO
@OwH-NON
WOO
NY
-OOww
nRO]O
oooooo0o9”cjao
ooo
0ooqcoo
S$ - field above threshold
ACKNOWLEDGEMENTS
The Sphinx Project is a team effort. Over 50 members of Ciba-Geigy(Basel and Egypt), and approximately 100 members of the MAG havebeen involved with this project. Any success of the Sphinx Project is the
result of their efforts and goodwill.
REFERENCES
McKinley, D.J.; Moawad, G.; Jones, J.A.; Grzywacz, D.; and Tumer, C.(1989) The development of nuclear polyhedrosis virus for the controlof Spodopteralittoralis (Boisd,) in cotton. In : Pest ManagementinCotton. M.B. Green and D.J. de B. Lyon (Eds.). Chichester: EllisHorwoodLimited. 93-100.
Nichoison, W.F.,Jr.; Phillips, J.R.; and Johnson, D.R. (1984) BoliwormManagement Communities in Arkansas. Arkansas Coop.Ext. Serv.Leaflet EL663.
BRIGHTON CROP PROTECTION CONFERENCE—Pests and Diseases—1992 8C—15
LOWRATE MULTIPLE APPLICATION OF BT+OVICIDE FOR HELIOTHIS CONTROL IN
COTTON
A.M. PLATO, T.A. PLATO
BACTEC CORPORATION,9601 Katy Freeway, Suite 350, Houston, Texas 77024 USA
ABSTRACT
A logical and important insect managementstrategy is to assist the cotton plant in retaining
its early, most profitable and/or valuable fruit. Since physiological stresses are usually
neither evident nor occurring at that growth stage, insect damage is the dominant cause of
fruit loss. Thus, for cotton insects, a good integrated pest management program is a
combination ofboth preventative and corrective tactics to save early squares and bolls.
A preventative, early season Heliothis spp. control program incorporating the use ofBacillus thuringiensis (BT) larvicides, combined with "soft" ovicides, and applied at low
rates on a regular 3 to 6 day schedule, was evaluated in several large plot tests in 1991. The
program prevented "below threshold" damage and subsequent delays in harvest of the
bottom bolls, and thus reduced the "in season" numbers of 2nd and 3rd generation
bollworms. By employing preventative, early season applications of BT, and BT plus
ovicide (thiodicarb) at ovicidal rates, beneficial insects were preserved and overall economic
returns increased over those of a conventional insecticide program.
INTRODUCTION
Preventative strategies utilize control methods which manage pests before they reach economic
threshold treatment levels. Such strategies put the grower "ahead of the game," but few end users
(growers/consultants) knowingly focus on whether an application for insect control is based on corrective or
preventative tactics. When a systemic insecticide is used at planting for thrips (Thrips tabact) control without
treatment thresholds, or when diapause and pinhead square applications are made for boll weevils
(Anthonomus grandis), based on trap catches, preventative tactics are being employed. However, fleahopper
(Pxeudatomoscelis seriatus) and bollworm (Heliothis zea) spray applications are corrective and are based on
sweep net and/or whole plant inspections or terminal counts. An efficient cotton insect management program
1s a combination of both tactics (Roach er al., 1989; Durant, 1991).
Insect threshold treatment levels can change throughout the growing season or may have to be
adjusted due to environmental, toxicological (resistance) and economic restraints (Cox ef al., 1991). For
example, if 10 pests per 100 terminals result in threshold damage, 1 pest per 100 terminals will cause 10% as
much damage. Obviously, less than threshold numbers of certain pests cause economic damage. If the
preventative system reduces or avoids threshold damage without significantly increasing costs, then it will
increase yield and economic returns. Potentially, it would seem that this is preferred to the corrective
approach, A preventative early season Heliothis management program would incorporate the use of Bacillus
thuringiensis, var. kurstaki (BT) larvicides combined with "soft" ovicides applied on a regular, short interval
(3 to 6 day) to prevent "below threshold" damage and subsequent delays in harvest. Such a program would
reduce numbers of 2nd and 3rd generation worms during the early and mid-season. With preventative,
economical, low rate, early season applications of BTs and BT plus ovicides, beneficial insects can be
preserved. It has been determined that spray application regimes based on egg thresholds produced the
greatest economic retums (Bacheler & Bradley, 1989). Tests have shownthat the efficacy of BTs and amitraz
(OVASYN®) wassignificantly reduced when treatments were delayed until "traditional" larval thresholds
were reached (Durant, 1991). BT and ovicide applications timed to coincide with peak moth flights (trap
captures) and egg lays can be successful in controlling the early and mid-season bollworm complex when
applications are timed correctly.
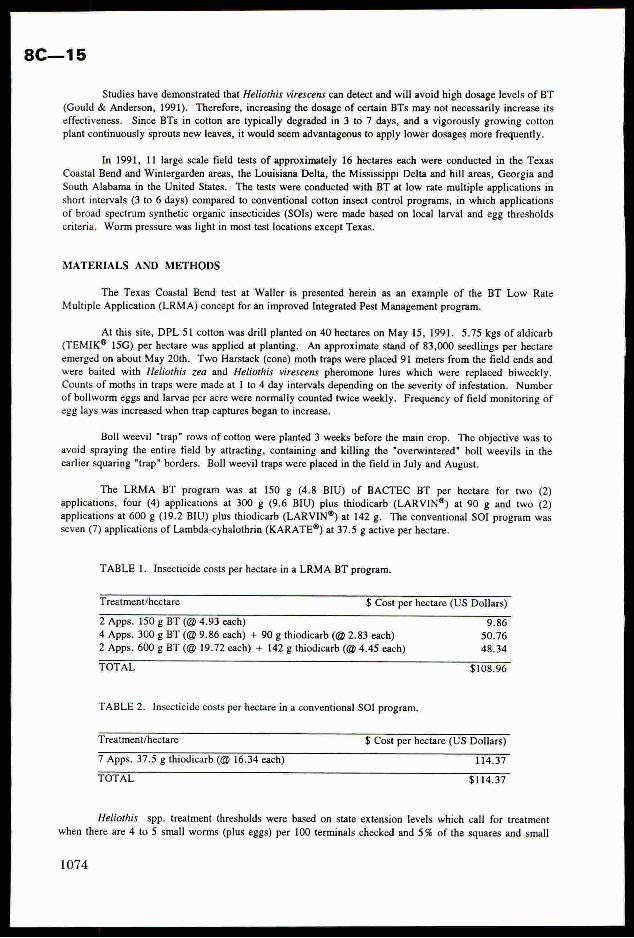
8C—15
Studies have demonstrated that Heliothis virescens can detect and will avoid high dosage levels of BT
(Gould & Anderson, 1991). Therefore, increasing the dosage of certain BTs may not necessarily increase itseffectiveness. Since BTs in cotton are typically degraded in 3 to 7 days, and a vigorously growing cotton
plant continuously sprouts new leaves, it would seem advantageous to apply lower dosages more frequently.
In 1991, 11 large scale field tests of approximately 16 hectares each were conducted in the TexasCoastal Bend and Wintergarden areas, the Louisiana Delta, the Mississippi Delta and hill areas, Georgia and
South Alabama in the United States. The tests were conducted with BT at low rate multiple applications in
short intervals (3 to 6 days) compared to conventional cotton insect control programs, in which applicationsof broad spectrum synthetic organic insecticides (SOIs) were made based onlocal larval and egg thresholds
criteria. Worm pressure waslight in mosttest locations except Texas.
MATERIALS AND METHODS
The Texas Coastal Bend test at Waller is presented herein as an example of the BT Low RateMultiple Application (LRMA)concept for an improved Integrated Pest Management program.
At this site, DPL 51 cotton wasdrill planted on 40 hectares on May 15, 1991. 5.75 kgsof aldicarb(TEMIK® 15G) per hectare was applied at planting. An approximate stand of 83,000 seedlings per hectare
emerged on about May 20th. Two Harstack (cone) moth traps were placed 91 meters from the field ends and
were baited with Heliothis zea and Heliothis virescens pheromone lures which were replaced biweekly.Counts of moths in traps were made at 1 to 4 day intervals depending on the severity of infestation. Number
of bollworm eggs andlarvae per acre were normally counted twice weekly. Frequency of field monitoring of
egg lays was increased when trap captures beganto increase.
Boll weevil “trap” rows of cotton were planted 3 weeks before the main crop. The objective was toavoid spraying the entire field by attracting, containing and killing the "overwintered" boll weevils in theearlier squaring “trap" borders. Boll weevil traps wereplaced in the field in July and August.
The LRMA BT program was at 150 g (4.8 BIU) of BACTEC BT per hectare for two (2)applications, four (4) applications at 300 g (9.6 BIU) plus thiodicarb (LARVIN®) at 90 g and two (2)
applications at 600 g (19.2 BIU)plus thiodicarb (LARVIN®) at 142 g. The conventional SOI program was
seven (7) applications of Lambda-cyhalothrin (KARATE®)at 37.5 g active per hectare.
TABLE1. Insecticide costs per hectare ina LRMABT program.
Treatment/hectare $ Cost per hectare (US Dollars)
2 Apps. 150 g BT (@ 4.93 each) 9.864 Apps. 300 g BT (@ 9.86 each) + 90 g thiodicarb (@ 2.83 each) 50.76
2 Apps. 600 g BT (@ 19.72 each) + 142 g thiodicarb (@ 4.45 each) 48.34
TOTAL $108.96
TABLE2. Insecticide costs per hectare in a conventional SOT program.
Treatment/hectare $ Cost per hectare (US Dollars)
7 Apps. 37.5 g thiodicarb (@ 16.34 each) 114.37
TOTAL $114.37
Heliothis spp. treatment thresholds were based on state extension levels which call for treatmentwhen there are 4 to 5 small worms (plus eggs) per 100 terminals checked and 5% of the squares and small
1074
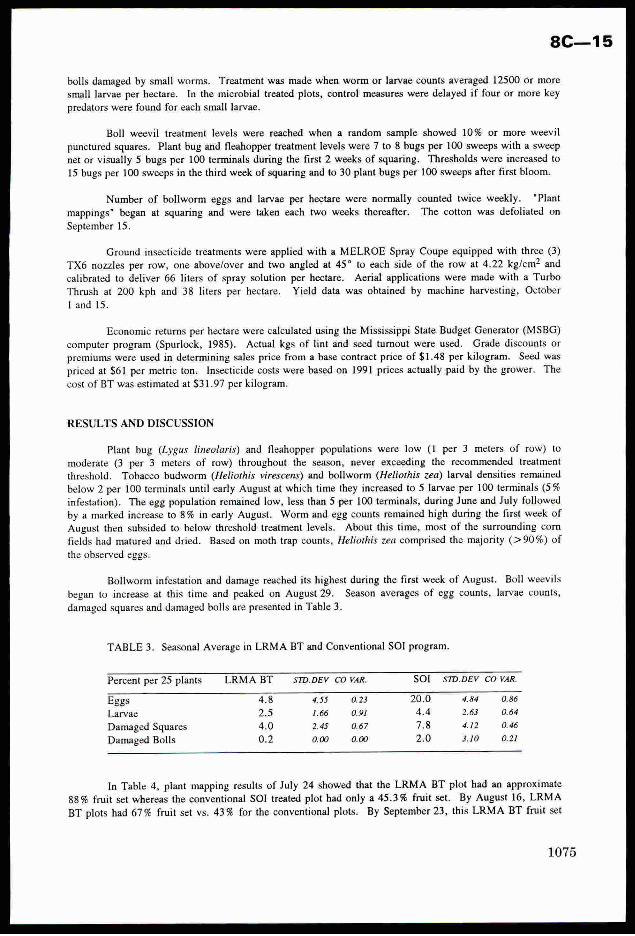
8C—15
bolls damaged by small worms. Treatment was made when worm orlarvae counts averaged 12500 or more
small larvae per hectare. In the microbial treated plots, control measures were delayed if four or more key
predators were found for each small larvae.
Boll weevil treatment levels were reached when a random sample showed 10% or more weevil
punctured squares. Plant bug and fleahopper treatment levels were 7 to 8 bugs per 100 sweeps with a sweepnet or visually 5 bugs per 100 terminals during the first 2 weeks of squaring. Thresholds were increased to15 bugs per 100 sweepsin the third week of squaring and to 30 plant bugs per 100 sweepsafter first bloom.
Number of bollworm eggs and larvae per hectare were normally counted twice weekly. “Plant
mappings” began at squaring and were taken each two weeks thereafter. The cotton was defoliated on
September 15.
Ground insecticide treatments were applied with a MELROE Spray Coupe equipped with three (3)TX6 nozzles per row, one above/over and two angled at 45° to each side of the row at 4.22 kg/cm? andcalibrated to deliver 66 liters of spray solution per hectare. Aerial applications were made with a Turbo
Thrush at 200 kph and 38 liters per hectare. Yield data was obtained by machine harvesting, October
1 and 15.
Economic returns per hectare were calculated using the Mississippi State Budget Generator (MSBG)computer program (Spurlock, 1985). Actual kgs of lint and seed turnout were used. Grade discounts or
premiums were used in determining sales price from a base contract price of $1.48 per kilogram. Seed was
priced at $61 per metric ton. Insecticide costs were based on 1991 prices actually paid by the grower. The
cost of BT was estimated at $31.97 per kilogram.
RESULTS AND DISCUSSION
Plant bug (Lygus lineolaris) and fleahopper populations were low (1 per 3 meters of row) to
moderate (3 per 3 meters of row) throughout the season, never exceeding the recommended treatment
threshold. Tobacco budworm (Heliothis virescens) and bollworm (Heliothis zea) larval densities remained
below 2 per 100 terminals until early August at which time they increased to 5 larvae per 100 terminals (5%
infestation). The egg population remained low, less than 5 per 100 terminals, during June and July followedby a marked increase to 8% in early August. Worm and egg counts remained high during the first week ofAugust then subsided to below threshold treatment levels. About this time, most of the surrounding corn
fields had matured and dried. Based on moth trap counts, Heliothis zea comprised the majority (>90%) of
the observed eggs.
Bollworm infestation and damage reached its highest during the first week of August. Boll weevils
began to increase at this time and peaked on August 29. Season averages of egg counts, larvae counts,
damaged squares and damaged bolls are presented in Table 3.
TABLE3. Seasonal Average in LRMA BTand Conventional SOI program.
Percent per 25 plants LRMA BT STD.DEV CO VAR. SOI STD.DEV CO VAR.
Eggs 4.8 4.55 0.23 20.0 4,84 0.86
Larvae 2.5 1.66 0.91 4.4 2.63 0.64Damaged Squares 4.0 2.45 0.67 7.8 4.12 0.46Damaged Bolls 0.2 0.00 0.00 2.0 3.10 0.21
In Table 4, plant mapping results of July 24 showed that the LRMABTplot had an approximate
88% fruit set whereas the conventional SOItreated plot had only a 45.3% fruit set. By August 16, LRMA
BT plots had 67% fruit set vs. 43% for the conventional plots. By September 23, this LRMA BT fruit set
1075
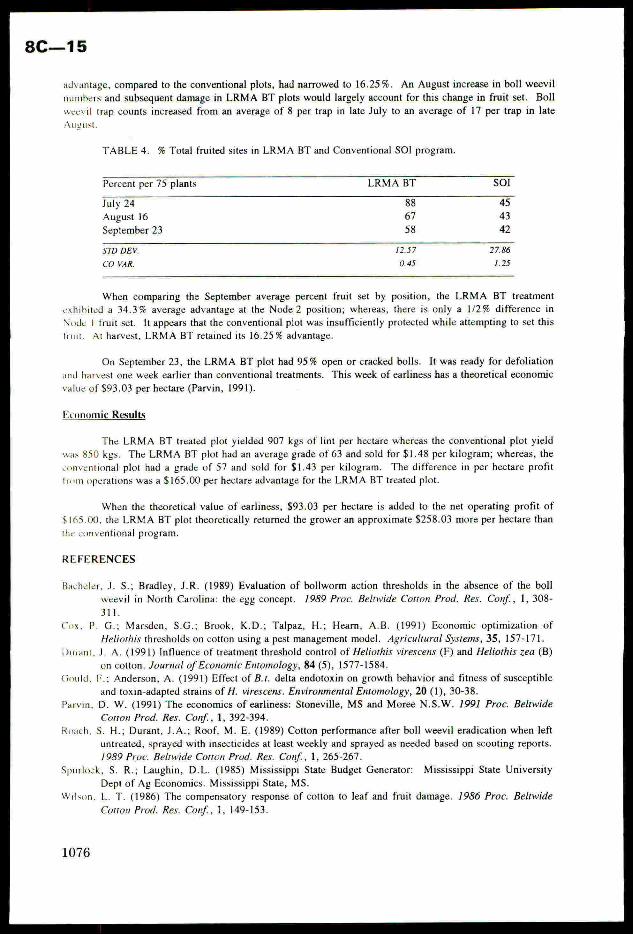
8C—15
advantage, compared to the conventional plots, had narrowed to 16.25%. An Augustincrease in boll weevilnumbers and subsequent damage in LRMABTplots would largely account for this change in fruit set. Bollweevil trap counts increased from an average of 8 per trap in late July to an average of 17 per trap in late
August.
TABLE 4. % Total fruited sites in LRMA BT and Conventional SOI program.
Percent per 75 plants LRMA BT
July 24 88
August 16 67
September 23 58
STD DEV. 12.57
CO VAR. 0.45
When comparing the September average percent fruit set by position, the LRMA BT treatment
exhibited a 34.3% average advantage at the Node 2 position; whereas, there is only a 1/2% difference in
Node | fruit set. [t appears that the conventional plot wasinsufficiently protected while attempting to set this
truit. At harvest, LRMA BTretained its 16.25% advantage.
On September 23, the LRMA BT plot had 95% open or cracked bolls. It was ready for defoliationand harvest one week earlier than conventional treatments. This week of earliness has a theoretical economic
value of $93.03 per hectare (Parvin, 1991).
Economic Results
The LRMABTtreated plot yielded 907 kgs oflint per hectare whereas the conventional plot yield
was 850 kgs. The LRMABTplot had an average grade of 63 and sold for $1.48 per kilogram; whereas, the
conventional plot had a grade of 57 and sold for $1.43 per kilogram. The difference in per hectare profit
from operations was a $165.00 per hectare advantage for the LRMABTtreatedplot.
When the theoretical value of earliness, $93.03 per hectare is added to the net operating profit of
$165.00, the LRMABTplottheoretically returned the grower an approximate $258.03 more per hectare than
the conventional program.
REFERENCES
Bacheler, J. S.; Bradley, J.R. (1989) Evaluation of bollworm action thresholds in the absence ofthe boll
weevil in North Carolina: the egg concept. 1989 Proc. Belrwide Cotton Prod. Res. Conf., 1, 308-
S11.
Cox, P. G.; Marsden, S.G.; Brook, K.D.; Talpaz, H.; Hearn, A.B. (1991) Economic optimization of
Heliothis thresholds on cotton using a pest management model. Agricultural Systems, 35, 157-171.Durant, J. A. (1991) Influence of treatment threshold control of Heliothis virescens (F) and Heliothis zea (B)
on cotton. Journal of Economic Entomology, 84 (5), 1577-1584.
Gould, F.; Anderson, A. (1991) Effect of B.r. delta endotoxin on growth behavior and fitness of susceptible
and toxin-adapted strains of H. virescens. Environmental Entomology, 20 (1), 30-38.
Parvin, D. W. (1991) The economics of earliness: Stoneville, MS and Moree N.S.W. 199] Proc. Beltwide
Cotton Pred. Res. Conf., 1, 392-394.
Roach, S. H.; Durant, J.A.; Roof, M. E. (1989) Cotton performance after boll weevil eradication whenleft
untreated, sprayed with insecticides at least weekly and sprayed as needed based on scouting reports.
1989 Proc. Beltwide Cotton Prod. Res. Conf., 1, 265-267.
Spurlock, S. R.; Laughin, D.L. (1985) Mississippi State Budget Generator: Mississippi State University
Dept of Ag Economics. Mississippi State, MS.
Wilson, L. T. (1986) The compensatory response of cotton to leaf and fruit damage. 1986 Proc. Beltwide
Corton Prod. Res. Conf., 1, 149-153.
SESSION 9A
ASSESSMENT OF THE NON-TARGET EFFECTS OF
AGROCHEMICALS
CHAIRMAN DR P. GREIG-SMITH
SESSIONORGANISER MRS R. HIGNETT
INVITED PAPERS 9A-1 to 9A-4
BRIGHTON CROP PROTECTION CONFERENCE—Pests and Diseases—1992
THE EFFECTS OF HOME PROCESSING ON RESIDUES OF FUNGICIDES ON CITRUS FRUIT:
WASHING ORANGES
S L REYNOLDS
Food Science Laboratory, Ministry of Agriculture, Fisheries and Food,
Norwich Research Park, Colney, Norwich, Norfolk NR4 7UQ
P M K FRIAR
Department of Food Science and Technology, University of Reading,
Whiteknights, PO Box 226, Reading, Berkshire RG6 2AP
ABSTRACT
The effect of culinary washing procedures on the levels of residuesof the fungicides imazalil, 2-phenylphenol and thiabendazole onpostharvest treated oranges has been studied. Washing was performed
using a variety of wash solvents which are readily available in thehome, such as water, washing-up liquid and vinegar. Analysis of the
solvents after washing showed that up to 40% of imazalil and 30% ofthiabendazole had been removed whereas only traces (<1%) of2-phenylphenol residues were detected in any of the wash solvents
used.
INTRODUCTION
Following harvest, citrus fruit for the fresh fruit market are
commonly washed, waxed and treated with formulations containing fungicides,
such as imazalil, 2-phenylphenol and thiabendazole which provide protection
from fungal attack during transport and storage (Dezman et al., 1986).Residues of these fungicides are, therefore, present on citrus fruit aspurchased by the consumer. Studies on the penetration of postharvestfungicides into the fruit showed that residues were highest on the surface
of the fruit and in the peel, and much lower in the flesh (Abd-Allah et
al., 1974; Lafuente et _al., 1987; Tadeo et_al., 1988).
When citrus fruit are consumed the peel is normally removed and mostof the fungicide residues present will also be discarded, although small
amounts may be transferred to the flesh during peeling (Koniger and
Wallndfer, 1990). However, as many recipes for home-made marmalades,chutneys, cakes, desserts, etc include whole fruit or the zest of sweet
oranges and/or lemons, it is important to acquire information on theeffects of various culinary processing procedures on these residues.
The limited information available on the fate of fungicide residues oncitrus fruit following processing prompted this investigation into theeffectiveness of a variety of household wash solvents in removing imazalil,
2-phenylphenol and thiabendazole residues from the peel of oranges.
Late Valencia oranges known to have been commercially waxed andtreated with imazalil, 2-phenylphenol and thiabendazole were used. Theoranges (five boxes, in each approximately 76 fruit weighing 15kg) wereobtained almost immediately after import into the UK, around four weeks
after picking. For each experiment fruit were selected randomly from each
of the five boxes.
Washing procedures
Five types of washing treatments were performed. In each case 16
oranges were washed individually. The basic washing procedure at 20°C + 1°Cwas as follows:-—
Each orange was immersed in a volume of wash solvent (550-600m1). The
solvent was gently agitated by means of a magnetic stirrer set at constant
speed for 15 minutes. The temperature of the wash solvent was recorded at
the beginning and end of each wash with the following modifications:-—
i) A wash with water (glass-distilled) at both 20°C and 50°C.
ii) The application of 0.25ml and 0.50ml of washing-up liquid tothe surface of the peel of the orange using a soft brush prior
to the wash.
iii) A wash in dilute distilled malt vinegar (45/560 V/V).
The washed oranges were dipped in 10 litres of water for 15 minutes to
rinse off the washing—-up liquid or vinegar. Wash solvent from individual
oranges was pooled. Suitable aliquots of both wash solvents and rinse water
were taken for analysis.
Extraction of residues from unwashed oranges
25 individual oranges were peeled. The peel was chopped up andcombined to form one composite sample. Similarly the flesh from each fruit
was macerated together to form a second composite sample. Portions of the
composite peel and flesh were taken for analysis which corresponded to the
original proportions of each present in the whole fruit.
The peel, macerated with anhydrous sodium sulphate, was added to the
flesh to form a reconstituted sample of whole fruit. This sample was soakedovernight in acetone and filtered under suction. The filtrate and filter
cake were extracted with dichloromethane. A second extraction was performedafter the addition of 1M sodium hydroxide solution to produce an alkalinePH. The dichloromethane extracts of filtrate and filter cake were combined.
Clean-up of residues
Thiabendazole and imazalil in the combined extracts were partitionedinto 0.1M sulphuric acid (extract A). The organic layer containing2—-phenylphenol was retained (extract B) whilst the acidic aqueous extract Awas made alkaline with sodium hydroxide solution (pH 11.5) and the imazalil
and thiabendazole partitioned back into dichloromethane.
Extract B was evaporated carefully to dryness and the residuedissolved in methanol/water (90/10 V/V). After the addition of dilutesulphuric acid, the 2—-phenylphenol was partitioned into hexane. Thedichloromethane extract containing the imazalil and thiabendazole, and the
hexane extract containing the 2—-phenylphenol were both carefully evaporatedto dryness and the residues dissolved in a suitable volume of methanol for
analysis using high performance liquid chromatography (hplc).
Extraction of residues from wash solvents and rinse water
Extraction of the three fungicide residues from the wash solvents andrinse water was also performed using dichloromethane. Again, two
extractions were undertaken, one at the original pH of the wash solvent and
the second after adjustment to pH 11. Addition of sodium chloride was usedto prevent the formation of emulsions, particularly when washing-—up liquidwas present in the wash solvent. Dichloromethane extracts were evaporatedjust to dryness and the resultant residues dissolved in a suitable volume
of methanol ready for hplc analysis.
Hplc analysis
Aliquots (20u1) of the methanolic extracts of orange, wash solventsand rinse water were injected onto a 250 x 4.6mm Hichrom RPB, 5yum column
via a 10 x 4.6mm id guard column of the same packing material. A mobilephase of methanol/water (75/25 V/V) was employed with a flow rate of1ml1/min at ambient temperature.
Imazalil residues were detected with a UV detector at wavelength204nm. 2—Phenylphenol and thiabendazole were monitored using a fluorescencedetector. For extracts of whole oranges, thiabendazole residues weremonitored at excitation 296nm, emission 350nm and 2—phenylphenol residues
at 285nm and 350nm, respectively. For wash solvents and rinse water, the
2-phenylphenol and thiabendazole residues were both measured at excitation
285nm and emission 350nm. Quantitation was achieved by comparing peak
heights from chromatograms of sample extracts with peak heights obtained
using standard solutions of known concentrations. Results were based ontriplicate analyses and duplicate injections of each extract and standard.
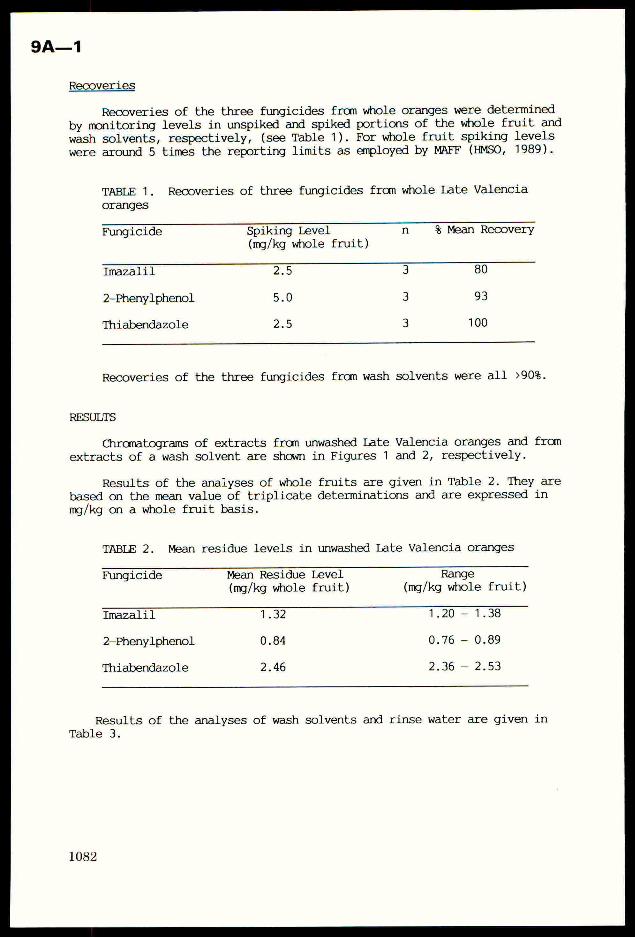
SA—1
Recoveries
Recoveries of the three fungicides from whole oranges were determined
by monitoring levels in unspiked and spiked portions of the whole fruit and
wash solvents, respectively, (see Table 1). For whole fruit spiking levels
were around 5 times the reporting limits as employed by MAFF (HMSO, 1989).
TABLE 1. Recoveries of three fungicides from whole Late Valencia
oranges
Fungicide Spiking Level % Mean Recovery
(mg/kg whole fruit)
Imazalil 2.5 80
2—Phenylphenol 5.0 93
Thiabendazole 2.5
Recoveries of the three fungicides from wash solvents were all »>90%.
RESULTS
Chromatograms of extracts from unwashed Late Valencia oranges and from
extracts of a wash solvent are shown in Figures 1 and 2, respectively.
Results of the analyses of whole fruits are given in Table 2. They are
based on the mean value of triplicate determinations and are expressed in
mg/kg on a whole fruit basis.
TABLE 2. Mean residue levels in unwashed Late Valencia oranges
Fungicide Mean Residue Level Range(mg/kg whole fruit) (mg/kg whole fruit)
Imazalil 1.32 1.20 — 1.38
2—Phenylphenol 0.84 0.76 — 0.89
Thiabendazole 2.46 2.36 -— 2.53
Results of the analyses of wash solvents and rinse water are given in
Table 3.
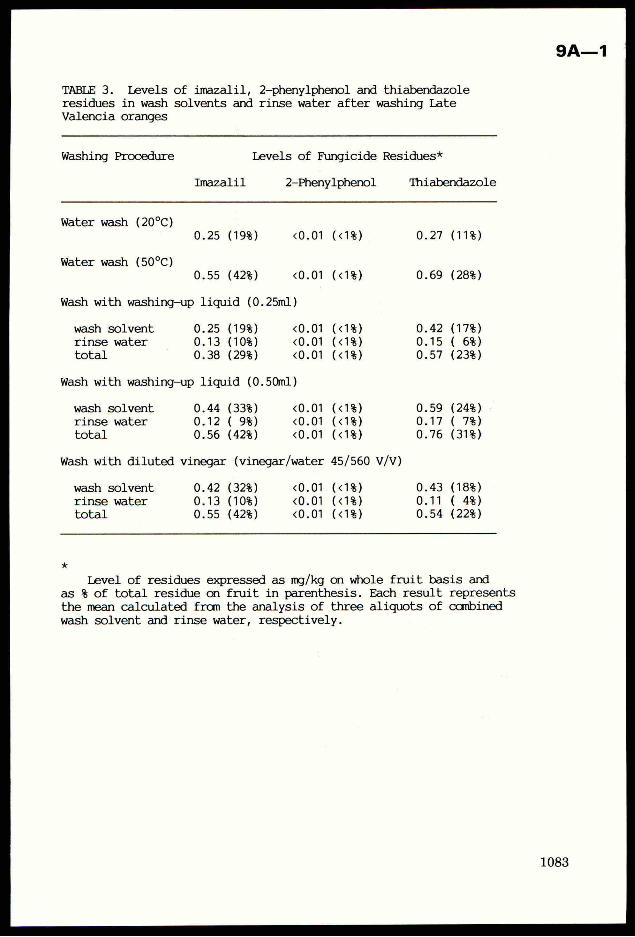
TABLE 3. Levels of imazalil, 2—phenylphenol and thiabendazoleresidues in wash solvents and rinse water after washing Late
Valencia oranges
Washing Procedure Levels of Fungicide Residues*
Imazalil 2—Pheny1phenol Thiabendazole
Water wash (20°C)0.25 (19%) <0. (<1%)
Water wash (50°C)0.55 (42%) <0. (<1%)
Wash with washing-up liquid (0.25m1)
wash solvent 0.25 (19%) <0.
rinse water 0.13 (10%) <0.total 0.38 (29%) <0.
Wash with washing-up liquid (0.50m1)
wash solvent 4 (33%) <0.01 (<1%)0.4rinse water 0.12 ( 9%) <0.01 (<1%)
total 0.56 (42%) <0.01 (<1%)
Wash with diluted vinegar (vinegar/water 45/560 V/V)
wash solvent 0.42 (32%) <0.01 (<1%)
rinse water 0.13 (10%) <0.01 (<1%)total 0.55 (42%) <0.01 (<1%)
*
Level of residues expressed as mg/kg on whole fruit basis and
as % of total residue on fruit in parenthesis. Each result represents
the mean calculated from the analysis of three aliquots of combinedwash solvent and rinse water, respectively.
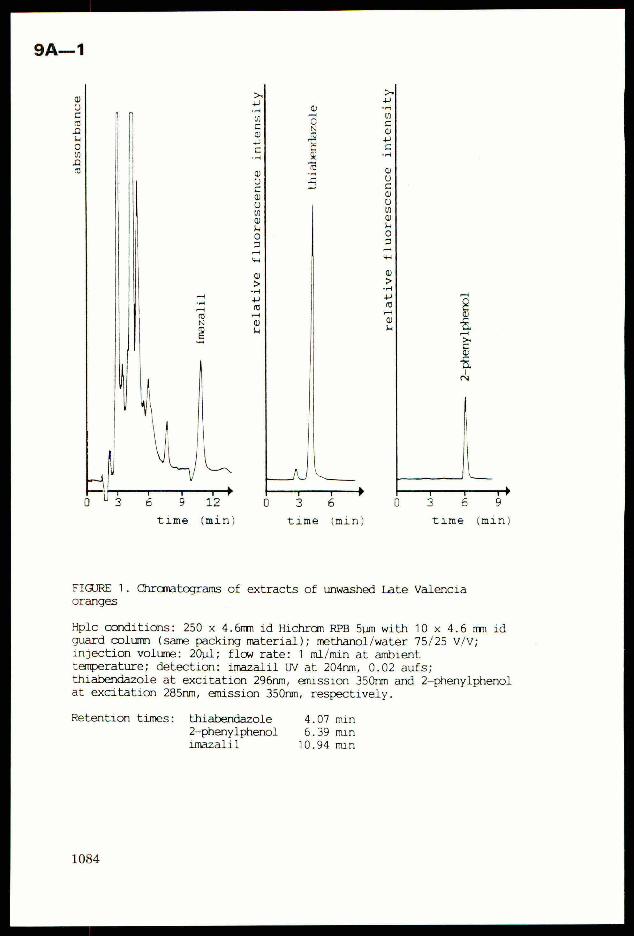
absorbance
thiabendazole
relative
fluorescence
intensity
relative
fluorescence
intensity
imazalil
2-phenylphenol
=
T qT T
8 6 3 6 g
time (min) time (min) time (min)
>v
»vy
FIGURE 1. Chromatograms of extracts of unwashed Late Valenciaoranges
Hplc conditions: 250 x 4.6mm id Hichrom RPB 5yum with 10 x 4.6 mm idguard column (same packing material); methanol/water 75/25 V/V;injection volume: 20u1; flow rate: 1 ml/min at ambient
temperature; detection: imazalil UV at 204nm, 0.02 aufs;thiabendazole at excitation 296nm, emission 350nm and 2-phenylphenolat excitation 285nm, emission 350nm, respectively.
Retention times: thiabendazole 4.07 min
2—pheny1lphenol 6.39 minimazalil 10.94 min
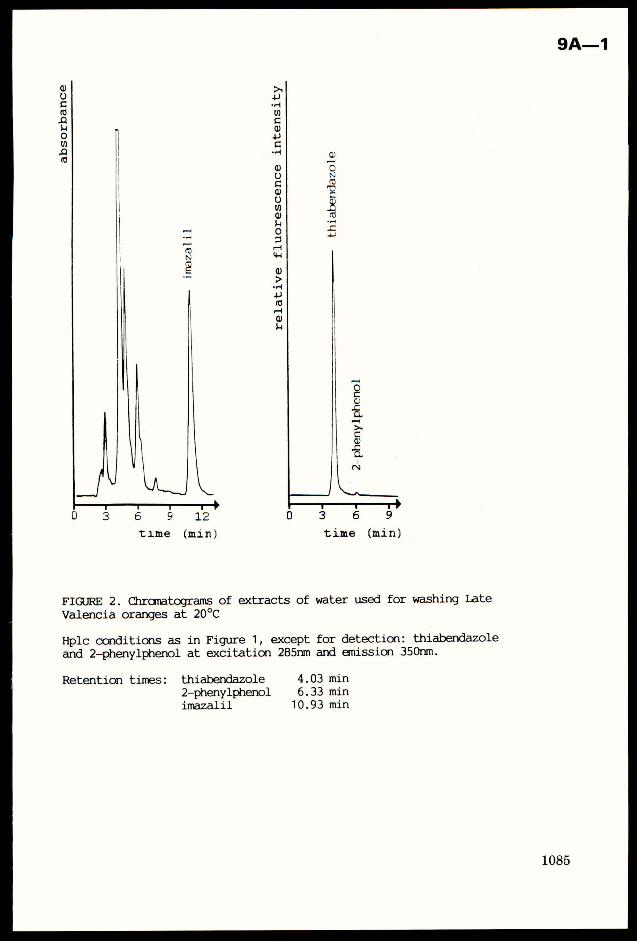
absorbance
imazalil
relative
fluorescence
intensity
thiabendazole
2-pheny1phenol
6 9 12 3 6 9
time (min) time (min)
FIGURE 2. Chromatograms of extracts of water used for washing Late
Valencia oranges at 20°C
Hplc conditions as in Figure 1, except for detection: thiabendazole
and 2-phenylphenol at excitation 285nm and emission 350nm.
Retention times: thiabendazole 4.03 min2-phenylphenol 6.33 minimazalil 10.93 min
9A—1
DISCUSSION
Almost half of the imazalil and one third of the thiabendazoleresidues could be removed from the peel of Late Valencia oranges. However,residues of 2—phenylphenol were not reduced significantly by any of the
washing solvents tested. Washing with hot water at 50°C, washing-up liquid
or dilute vinegar at room temperature produced very similar results for all
three fungicides.
Further work is required to determine how different varieties of
orange, the age of the fruit after harvest and particular wax formulations
effect the removal of fungicides using the above washing procedures.
ACKNOWLEDGEMENT
The authors thank Mack Multiples for supplying the Late Valencia
oranges used in this work.
REFERENCES
Abd-Allah, M.A.; Abu-Salem, F.M.; Ismail, F.A. (1974) Fungicidal residueson and in Egyptian oranges. Qualitas Plantarum — Plant Foods for Human
Nutrition, 24, 127-136.Dezman, D.J.; Nagy, S.; Brown, G.E. (1986) Postharvest fungal decay
control chemicals: Treatment and residues in citrus fruit. Residue
Reviews, 97, 37-92.HMSO (1989) Food Surveillance Paper No. 25: Report of the Working Party
on Pesticide Residues: 1985-88. ISBN 0—-11—242870-3.
KOniger, M. ; Wallndfer, P.R. (1990) Ubertagung vonThiabendazol-Ruickstanden beim Schdalen von Citrusfruchten auf Handeund Fruchtfleisch. Deutsche Lebensmittel—Rundschau, 86, 251-253.
Lafuente, M.T.; Tadeo, J.L.; Tuset, J.J. (1987) GLC analysis ofthiabendazole residues in citrus fruit. Journal of Chromatographic
Science, 25, 84-87.Tadeo, J.L.; Lafuente, M.T.; Tuset, J.J.; Garcia, J. (1988) Actividad,
niveles residuales y penetracion de los fungicidas tiabendazol,imazalil, prochloraz y fenpropimorf frutos citricos. Investigacion
Agrarica: Produccion y Proteccion Vegetables, 3, 99-110.
BRIGHTON CROP PROTECTION CONFERENCE—Pests and Diseases—1992
THE EFFECTS OF PESTICIDES ON BENEFICIAL ARTHROPODS
RICHARD A. BROWN
ICI Agricultural Products, ICI Americas Inc, Wilmington, DE 19897, USA.
ABSTRACT
Beneficial arthropods are defined as mutualists, natural enemies and "others".Assessment techniques for mutualists, at least in the case of the honey bee, areagreed and have proved to be workable and useful in practice; i.e. bothhazardous and non-hazardous products have been identified and successfullylabelled. Systems for the assessment of natural enemies and other species arecurrently under discussion and are considered in more detail here. The successof developments in this area to date appear to have been hampered by anexcess of interest in methods at the expense of defining whatis a significanteffect on these beneficials in the field. Agreement on this will facilitateagreement on how lowertier experiments are to be conducted.
INTRODUCTION
This paper will consider what beneficial arthropods are, why they should bestudied at all, how it is currently done, what problemsthis creates and a proposedsolution. In the interests of brevity, only work on natural enemies and "others" will beconsidered. This is merely a reflection of the confusion surrounding their assessmentand the interpretation of these assessments compared to those for honey bees, asrepresentatives of mutualists. Honey bee assessment schemesare already in operationand have proved to be successful in that both hazardous and non-hazardous productshave been identified and successfully labelled.
WHAT ARE BENEFICIAL ARTHROPODS
Beneficial arthropods can be considered as three groups, mutualists, naturalenemies and others (Brown 1989), Beneficial arthropods are extremely diverse andcome from all insect orders, with the possible exception of the Mallophaga (biting andbird lice) and the Anoplura (sucking lice) who are unloved beyond the ranks of medicaland veterinary entomologists. In addition, there are numerous examples of beneficialspiders and mites.
Mutualists
In this context, mutualists are largely pollinators of plants but a wide diversityof mutualisms between arthropods and other species exist. Typically, these are morefrequent in the tropics than in boreal ecosystems (Farnworth & Golley 1974), perhapsbecause of the greater "predictability" of these systems (May 1983). These species areeither (a) introduced seasonally into crops, (b) managed or (c) wild and unmanaged.Examples of seasonally introduced pollinators (a) are the honey bee (Apis melifera) inoilseed rape or pomefruit or the bumble bee (Bombusterrestris) in green houses foregg-plant, peppers and tomatoes. Managed wild pollinators (b) include Megachilerotunda and Nomia melanderi in seed alfalfa in the USA and unmanaged wild species(c) include a wide range of Bombusspecies in temperate fruit and oilseed crops andceratopogonid Diptera in tropical cocoa. In this category the released and nowestablished oil-palm pollinating weevil Elaeidobius kamerunicus should also be
9A—2
considered, though during the process ofits establishment in Malaysia it was considered
a pest by someplantations.
Natural enemies
Natural enemies are either native or introduced and feed on pest species to the
extent that pest populations are decreased. The degree to which this happensis the
subject of much heated debate, however there are clear cases where some pests are held
entirely in check by natural enemies and others where they are not. Natural enemiescome fromthe spiders and mites as well as from a variety of insect orders, especiallythe Hymenoptera, Coleoptera, Diptera and Neuroptera. Thysanoptera and Dermaptera
are also believed to important predators in a number of crops around the world.
Others
The “others” category is the service industry of the environment. There are twomain groups, which sometimes overlap, they are decomposers and food species.Decomposers are a wide range of cryptosigmatid and astigmatid mites, primitive insectsand numeroushigher insect larvae that process plant material, greatly increasing itssurface area and therefore its ease of degradation and mineralisation by micro-organisms.The food species are those arthropods which are sufficiently numerous and juicy to acteither as a principal food source for birds (eg Sotherton & Moreby 1992) or as analternate food source for polyphagous predators such as carabid beetles. Highpopulations of food species in a field may sustain a relatively high density of suchpolyphagous predators which may influence pest populations by taking occasionalindividuals during the winter time that found colonies ofpests later in the crop growingseason, Alternatively, as pest populations develop, polyphagous predators may "switch"(Rauscher 1978) from food species to them however, switching can be a double-edgedsword as it is always possible for the beneficial food species to be moreattractive inquantity and quality than the pest so that the polyphagouspredators will switch to itentirely and be distracted from controlling the pest. For completeness, the otherscategory must also contain industrial insects of which the principal example is the SilkMoth (Bombyx mori). This species will not be further discussed here as the issuessurrounding it are specific to particular forms of orchard cultivation in Japan and areadequately covered by local regulations.
WHY SHOULD THEY BE STUDIED
From the view-point of environmental protection, it is not unreasonable thatbeneficial arthropods should be studied. They necessarily spend much time inagricultural fields and plantations and are an integral part of the agricultural ecosystem,in some cases conferring positive benefits to the grower through enhanced pollination orthe suppression of injurious species. Beneficial arthropods are one of the most highlyexposed groups of non-target organisms in comparison with many of the species that areroutinely tested in pesticide registration. However, the fact that beneficial arthropods areso intrinsically linked with agricultural fields has been one of the very reasons whytesting has been slow to develop. In the past, much concern has centered around effectsin non-target habitat. It has been accepted that pesticides are a cultural practice and aswith any other practice taking place in a field there will be consequences for theresidents. The view wasthat if there were any adverse effects then these were anefficacy disadvantage of the product and not an environmental issue per se. Currently,this view is changing in Europe as agricultural fields are no longer perceived by thecommunity at large as units of production but as an environmental resource to bemanaged. As a result of this changing view, standardised testing systems are now beingdeveloped for the species involved. In the USA, development of interest in beneficial
arthropod testing has been overtaken by interest in other areas of the environment,namely aquatic, avian and more recently plant testing. Though the FIFRA code containssome beneficial arthropod testing requirements, they are officially on hold and areunlikely to be re-activated before 1997 due to the current volumeofactivity associatedwith the current registration and re-registration programmes.
Should the agrochemical industry view growth in this regulatory area as anopportunity or as a threat ? The industry supports the rigorous testing of products,believing that each should be assessed on an individual basis consistent with the currentstate of scientific knowledge (ICI 1992). This newerarea of testing is introducinggreater costs in registration than in the past and could in theory lead to the restriction ofsome outlets, However, it must be remembered that synthetic pyrethroids were notapproved for summeruse in cereals in the UK for the entirety of the 1980’s because ofconcernsover the effects on beneficials. In practice it appears that this testing is leadingto changesin label safety-statements. Such changes allow customers to be better advisedabout products and this allows them to make a more informed choice. A confidentindustry should see this as an opportunity, however, excessive or unsubstantiable claimsaboutthe safety of individual products will not only ultimately discredit those products,as the claimed benefits will not be delivered, but the industry as a whole,
CURRENT APPROACHES
Germany
From the 28 July 1989, the German Plant Protection Law was enacted whichrequired natural enemy beneficial arthropod testing on registration applications from1 December 1989. Dueto the continuing re-registration process, this meant that datawas required on all products where exposure of beneficials was likely to occur. Thegeneral approach is described by Bode, Brasse & Kotke (1989) and Brasse (1990);it isadapted from the IOBC system (eg Hassan et_al,1987). Crops were considered to be oneof seven types (Table 1) and example natural enemies were to be tested, a minimum oftwo per crop and a maximumofsix species where multiple crop uses were applied for.Originally IOBC guidelines were used as a basis and since 1989, a number of moredetailed BBA guidelines on testing individual species have been issued. Thesetestswere also required to GLP, this caused somedifficulties as many of the laboratories inwhich they were done were unable to operate GLP procedures. If a trigger value of>30% effect was exceeded, the product would be considered harmful to that speciesunless this could be refuted in higher tier studies, for which there are no set protocols atpresent.
United Kingdom and EPPO/CoE
Aldridge & Carter (1992) have presented the proposed UK approach to naturalenemytesting as being based on the EPPO model(Fig 1), Carter et_al.(1992). Choice ofspecies is flexible, as are methods. Trigger values are as recommended by IOBC.Currently this model has been simplified to allow for two choices at each decision pointrather than three. The honey bee data requirement stage has been dropped and the tier Iscreen altered to be a minimumof twospecies, typically four but no more thansix.
BARTgroup
The beneficial arthropod registration testing (BART) group has proposed thesequential testing scheme shown in Figure (2). This requires the testing of between twoand four species, representative of the taxonomic diversity, importance andsensitivity ofbeneficials (Barrett 1992)
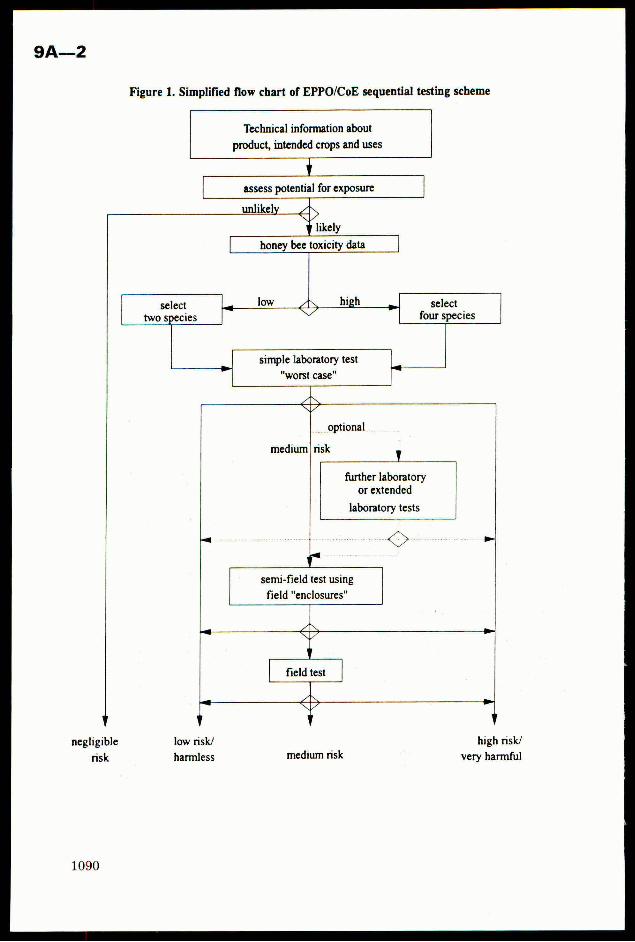
Figure 1. Simplified flow chart of EPPO/CoE sequential testing scheme
Technical information about
product, intended crops and uses
!assesspotential for exposure
unlikely 4
likely
honey beetoxicity data
select > select
two species four species
simple laboratory test
"worst case"
<q
optional _
risk 1
further laboratoryor extended
laboratory tests
<>
semi-field test using
field "enclosures"
LZNQ
field test
Y v Y
negligible low risk/ high risk/
risk harmless medium risk very harmful
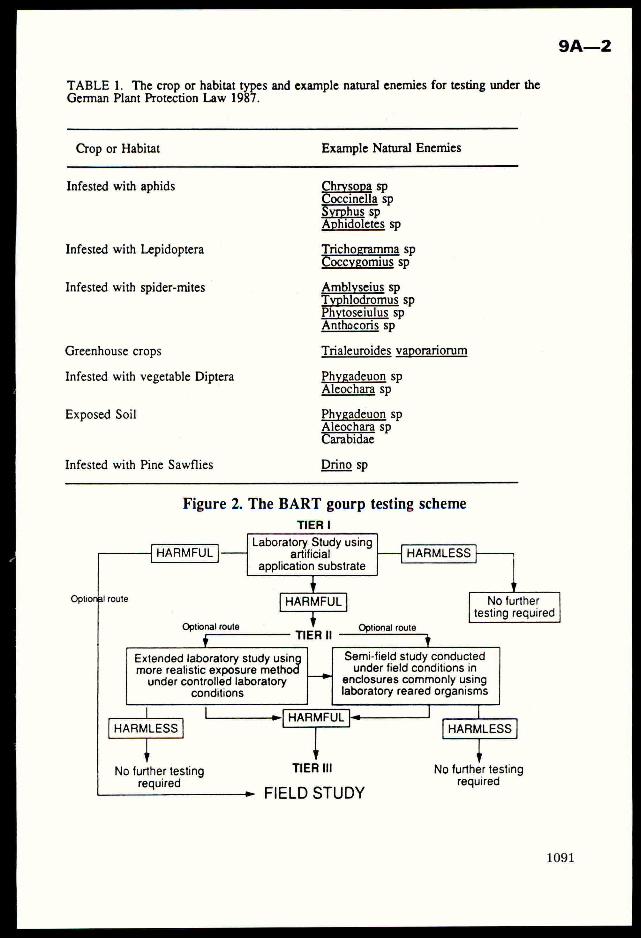
TABLE1. The crop or habitat types and example natural enemies for testing under theGerman PlantProtection Law 1987.
Crop or Habitat Example Natural Enemies
Infested with aphids Chrysopa spCoccinella sp
hus spAphidoletes sp
Infested with Lepidoptera Tricho ma spCoccygomius sp
Infested with spider-mites Amblyseius spTyphlodromusspPhytoseiulus spAnthocoris sp
Greenhouse crops Trialeuroides vaporariorum
Infested with vegetable Diptera Phygadeuon sp
Aleochara sp
Exposed Soil Phygadeuon sp
Aleochara spCarabidae
Infested with Pine Sawflies Drino sp
Figure 2. The BARTgourptesting scheme
TIER |
Laboratory Study usingHARMFUL |——— artificial HARMLESS
application substrate j
Optiongl route HARMFUL Nofurthertesting required
Optionalroute TIERI! Optional routei
Extended laboratory study usin Semi-field study conductedmore realistic exposure metho under field conditions inunder controlled laboratory enclosures commonly using
conditions laboratory reared organisms
| | »{ HARMFUL | J FiHARMLESS| 1 [ HARMLESS
No furthertesting TIER Ill Nofurthertestingrequired required
|______» FIELD STUDY
9A—2
EEC
The system finally adopted under Annexes2, 3 and 6 of Council Directive
91/414/EEC Concerning the Placementof Plant Protection Products on the Market 15
July 1991; is thoughtultimately to be an amalgam of EPPO/CoE, BART and German
BBAproposals.
PROBLEMS
Trigger values
All the systems discussed take the IOBCtrigger value of >30% effect at tier Iand II, triggering field work. In practice, this means that all insecticides will inevitablyprogress to field experiments with at least some species. This has caused considerableconcer within industry asthere is little agreement about the design andinterpretation ofsuch field studies. The system appears to be driven from the "bottom up" in terms ofmethodology, rather than "top down"in termsof deciding what the ultimate criteria ofacceptability or non-acceptability are in the field.
What is an acceptable effect ?
There is no agreement over the acceptability or non-acceptability of a directpesticide-induced effect on beneficial arthropods. A lack ofcriteria by which to judgefield experiments is the biggest hurdle in this area of testing. Despite repeated calls forthis to be rectified, little progress has been made.
Large-scale, long term studies, such as Boxworth, have shownthathigh levelsof input of many different chemicals canresult in a slight decrease in the levels ofpredation due to a mixture of direct and indirect effects (Burn 1989). Effects areparticularly apparent on speciesresidentin fields all year round and with low dispersalability, such as Bembidion obtusum. However, some more dispersive species such asTrechus quadristriatus actually seem to increase at the expense of the affected species,though notsufficiently to replace all the lost predation capacity. How should sucheffects be interpreted as to what is acceptable and whatis not, when the role ofindividual products is not completely clear ?
An empirical approach currently proposed under the EPPO/CoEsystem,is todecide a priori that the effects of a toxic standard chemical, yet to be identified, areunacceptable and would result in a harmful classification. The criteria would then bethat the effects of the test chemical on a species of concern were significantly less thanthe toxic standard or not significantly different from control, with sufficient replicationand relevant techniques. Indirect effects could be accounted for by the addition of acharacterised selective material to the test, however, it is not clear at present howindirect effects may be regulated.
Another empirical approach could be to consider how species respond to knownnon-chemical perturbations, otherwise known as "the great ploughing debate". This hasproved useful in microbiology in setting significant effect criteria for pesticide effects(Domsch, Jagnow and Anderson 1983). It can also be shownthat cultivation isdeleterious to both the abundance and diversity of soil organisms. Is it therefore
acceptable to say that the effects of a pesticide are acceptable if they do not exceedthese values ? Finally, I have come to the conclusion that although responses tocultivation can identify some species that are able to tolerate some disturbance in theirenvironment, it is not necessarily a useful criterion for beneficials. Unlike the soilmicroflora, where generation time can often be measured in hours or days, europeanbeneficial arthropods frequently have only one or two generations per year. Any lossesdue to cultivation and a numberofdifferent pesticide applications are therefore additivewithin a generation of beneficials, whereas soil micro-flora may only experiencedisturbance once in every several hundred generations and will have a much higherintrinsic rate of increase to speed recovery. Perhaps the species which “proves”this ruleis Bembidion obtusum. This carabid beetle is obviously able to tolerate cultivation as itis frequent in fields that have been cultivated for hundreds of years. However,it isparticularly intolerant of pesticides and is usually the most severely affected whenautumn or winter treatments have been made.
Ultimately, it would appear sensible not to gather any more additional datafrom a variety of field experiments but to use the research money and time employed tobetter understand the population process governing the abundance and diversity ofbeneficial arthropods, so that we may identify the critical values that we should actuallybe measuring. A framework within which suchcritical values can be interpreted isproposed by Greig-Smith (1992).
The importance of methodology
There is a considerable amount of debate in the literature as to the mostappropriate methods to be used in assessing the populations of beneficial arthropods,Pitfall traps are the most frequently used and the most frequently criticised method.Catches from properly set pitfall traps are a function of the population density andground-activity of the species in the field. Necessarily, plant active predators or spiderswho sit in their webs catching prey are under-represented in pitfall catches. However, aproperly maintained set of pitfall traps will produce a repeatable sample which, becauseofits ease of handling can be well replicated, producing comparative data for somespecies. Critics of pitfall waps usually prefer suction samplers. These will produce amore balanced assessment of absolute density, under some conditions, but also sufferdrawbacks. The cardinal error of those who prefer these systems to the the exclusion ofall others are centered on the assumption that these techniques are absolute; where inreality different species and different life stages are differentially catchable. The catch ishighly weather dependent, making the study of mediumterm affects inaccurate. Thecatch is not integrated over time and only represents those individuals catchable at thetime of the assessment. Because of the considerable additional short-term effortinvolved in suction sampling compared to some other methods, the ability to replicate isfrequently limited. Ideally, a mix of methods is preferable, I have found the mix ofpitfall trap and evening sweep-net sampling in cereals to produce consistent andinterpretable data, once the suitability of each method is taken into account and it’slimitations understood. A similar mix of methods has also proved effective in Brasiliansoya under very different climatic circumstances to those found in the UK.
Perhaps the most important point is to ensure that which ever partly imperfect method isused,it is used consistently. One of the biggest concerns in arthropod field trials is theuse of poorlytrained and poorly supervised staff, often temporary student Jabour.Additional errors at this stage merely result in an inability to detect differences betweentreatments, type II errors (false negatives).
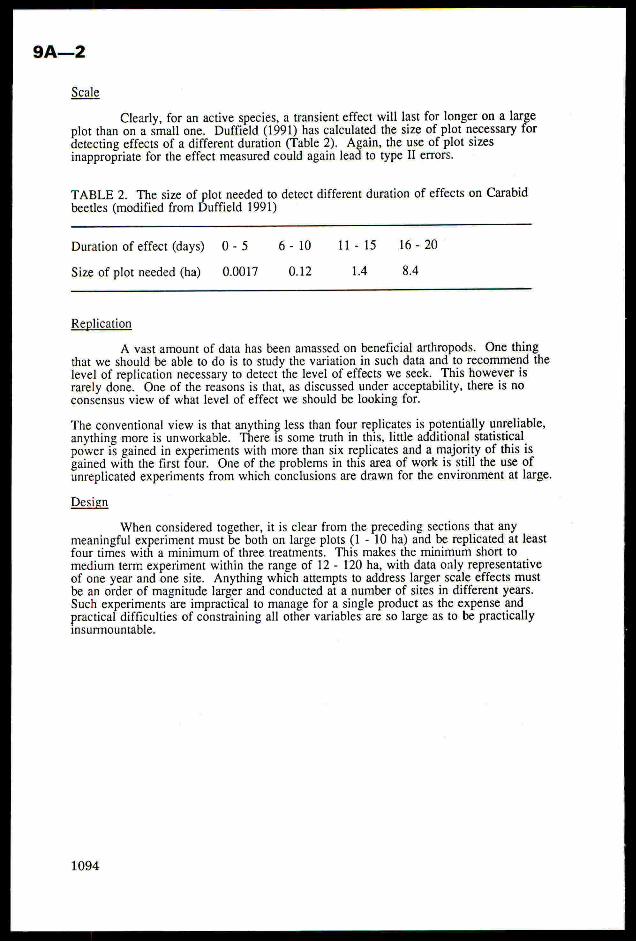
Clearly, for an active species, a transient effect will last for longer on a large
plot than on a small one. Duffield (1991) has calculated the size of plot necessary fordetecting effects of a different duration (Table 2). Again, the use of plot sizesinappropriate for the effect measured could againlead to type II errors.
TABLE 2. Thesize of plot neededto detect different duration of effects on Carabidbeetles (modified from Duffield 1991)
Duration of effect (days) 0-5 6- 10 11-15 16-20
Size of plot needed (ha) 0.0017 0.12 1.4 8.4
Replication
A vast amount of data has been amassed on beneficial arthropods. One thingthat we should be able to do is to study the variation in such data and to recommendthelevel of replication necessary to detect the level of effects we seek. This howeverisrarely done. Oneofthe reasonsis that, as discussed under acceptability, there is noconsensus view of whatlevel of effect we should be looking for.
The conventional view is that anything less than four replicates is potentially unreliable,anything more is unworkable. There is sometruth in this,little additional statisticalpower is gained in experiments with morethan six replicates and a majority of this isgained with the first four. One of the problems in this area of work is still the use ofunreplicated experiments from which conclusions are drawn for the environmentatlarge.
Design
Whenconsidered together, it is clear from the preceding sections that anymeaningful experiment must be both on large plots (1 - 10 ha) andbe replicated at leastfour times with a minimum ofthree treatments. This makes the minimum short tomedium term experiment within the range of 12 - 120 ha, with data only representativeof one year and onesite. Anything which attempts to address larger scale effects mustbe an order of magnitude larger and conducted at a numberof sites in different years.Such experiments are impractical to manage for a single product as the expense andpractical difficulties of constraining all other variables are so large as to be practicallyinsurmountable.
SOLUTIONS
To further pursue the answer to fundamental questions of the significance ofeffects on beneficial arthropods using trials of current size and design would appear tofollow the law of diminishing returns. To move to a larger scale would add nothing butexpense and confusion. The solution would appear to be to take stock of the existingbiological data and to attempt to model whatit is so difficult to measure in the field.Taking an analytical approach, Brown and Sharpe (1988) have investigated the role ofdifferent population processes in the survival or extinction of arthropod populationsexposed to pesticides. However to investigate more specific points, a simulationapproach is necessary. A suitable starting point for such a modelis the metapopulationdynamic model of Jepson & Sherratt (1991). From this it should be possible to definewhatare thecritical factors affecting the relationship between some beneficial speciesand pesticides and in the process identify what areas of these species’ biology need to bebetter understood. I believe that we should proceed in such iterative cycles in an attemptto refine our approach to this subject and to move on our current experimental designs.Failure to do this will, I fear, result in a failure to find a solution to this ultimatelysoluble problem, a regrettable but all too commontwentieth century mistake !
REFERENCES
Aldridge, C. and Carter, N. (1992) The principles of risk assessment for non-targetarthropods: a UK registration perspective. The Interpretation of PesticideEffects on Beneficial Arthropods. (Eds R.A. Brown, N.D. Sotherton & P.C.Jepson) Aspects of Applied Biology 31. (In press)
Barrett, K.L. (1992) The BART group approachto regulatory testing. TheInterpretation of Pesticide Effects on Beneficial Arthropods. (Eds R.A. Brown,N.D. Sotherton & P.C. Jepson) Aspects of Applied Biology 31. (In press)
Bode, E.; Brasse, D. and Kotke, C. (1989) Auswirkungen von Pflanzenschutzmittelenauf Nutzorganismen und Bodenfauna: Uberlegungen zur Prufung imZulassungseverfahren. Gesunde Planzen 40, 239 - 244.
Brasse, D. (1990) Einfuhrung der obigatorischen Prufunf der Auswirken vonPlanzenschutzmitteln auf Nutzorganismen in das Zulassungsverfharen.Nachrichtenbl. Deut. Pflanzenschutzd. 42, 81 - 86.
Brown, R.A. (1989) Pesticides and non-target terrestrial invertebrates: an industrialapproach. In Pesticides and non-target invertebrates. (Ed. P.C. Jepson).Intercept Press, Wimbourne, Dorset. pp 19 - 42.
Brown, R.A. and Sharpe, J.C. (1988) Interpreting the results of terrestrial impact studieswith reference to modelling an ecologically significant approach. In FieldMethods for the Study of Environmental Effects of Pesticides, BCPCMonograph No. 40 (Eds M.P. Greaves, B.D. Smith & P.W. Greig-Smith), pp283 - 291. BCPC publications, Thornton Heath.
Bum, A. (1989) Longterm effects of pesticides on natural enemies of cereal pests. InPesticides and non-target invertebrates. (Ed. P.C. Jepson). Intercept Press,Wimbourne, Dorset. pp 177 - 194.
9A—2
Carter, N.; Oomen, P.A.; Inglesfield, C.; Samsoe-Petersen, L.; de Clerg, R. & Dedreyver,C.A. (1992) A European guideline for testing the effects of plant protectionproducts on arthropod natural enemies. The Interpretation of Pesticide Effectson Beneficial Arthropods. (Eds Brown, R.A.; Sotherton, N.W. & Jepson, P.C.)Aspects of Applied Biology 31. (In press)
Domsch, K.H. Jagnow, G. and Anderson, T-H. (1983) An ecological conceptfor theassessmentof side effects of agrochemicals on soil micro-organisms, ResidueReviews 86, 65 - 105.
Duffield, S.J. (1991) Spatial Dynamics of invertebrate population recovery in cerealsfollowing treatment with the insecticide dimethoate. Unpublished Ph. D.Thesis, University of Southampton.
Farnworth, E.G. and Golley, F.B. (1974) Fragile Ecosystems: Evaluations ofResearch Applications in the Neotropics. Springer-Verlag, New York.
Greig-Smith, P.W. (1992) The acceptability og pesticide effecst on non-targetarthropods. The Interpretation of Pesticide Effects on Beneficial Arthropods.(Eds R.A. Brown, N.D. Sotherton & P.C. Jepson) Aspects of Applied Biology31. (In press)
Hassan, S.A.; Albert, R.; Bigler, F.; Blaisinger, P; Bogenshutz, H.; Boller, E.; Brun, H.;Chiverton, P.; Edwards, P.; Englert, W.; Huaung, P.; Inglesfield, C.; Nanton,E.; Oomen, P.; Overmeer, W.; Rieckman, W.; Samsoe-Petersen, L.; Staubli, A.;Tuset, J.; Viggiani, G.; & Vanwetswinkle, G. (1987) Results of the third jointpesticide testing programme by the IOBC/WPRS Working Group "Pesticidesand Beneficial Organisms". Zietschrift ftir Angenwandte Entomologie 103,92-107.
ICI (1992). Europe lobbied on active ingredients directive. Ag World, 4, July/August 1992.
Jepson, P.C. & Sherratt, T.N. (1991) Predicting the long-term impact of pesticides onpredatory invertebrates. Proceedings 1991 Bitish Crop Protection Conference -Weeds 2, 911 - 919.
May, R.M. (1983) Models for two interacting populations. In Theoretical EcologyPrinciples and Applications (Ed. R.M. May) pp 78 - 104. Blackwell ScientificPublications, Oxford.
Rauscher, M.D. (1978) Search Image for leaf shape in a butterfly. Science 200,1071 - 1073.
Sotherton, N.D. and Moreby, S.J. (1992) The importance of arthropods other thannatural enemies in cereal fields. The Interpretation of Pesticide Effects onBeneficial Arthropods. (Eds Brown, R.A.; Sotherton, N.W. & Jepson, P.C.)Aspects of Applied Biology 31. (In press)
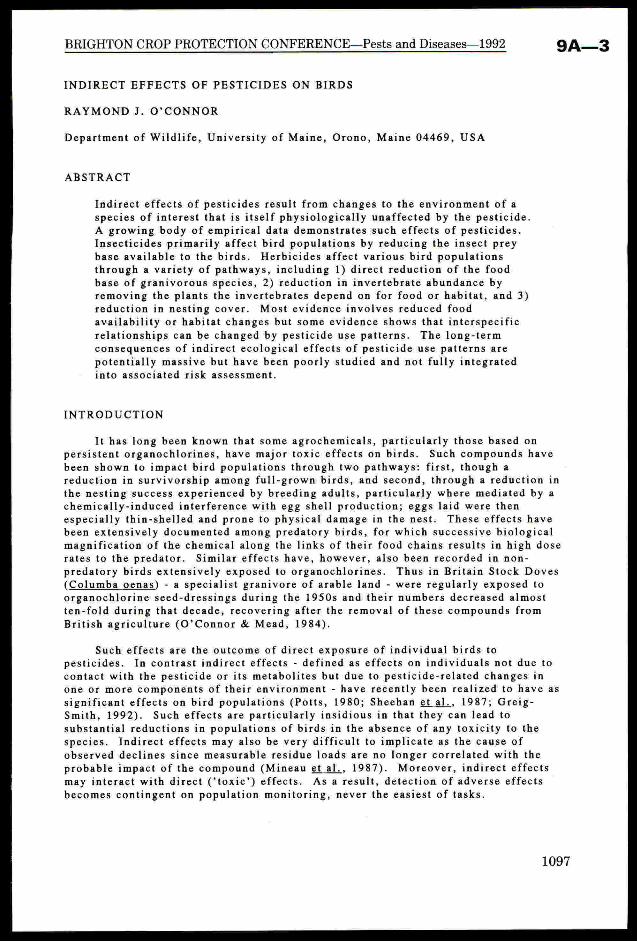
BRIGHTON CROP PROTECTION CONFERENCE—Pests and Diseases—1992
INDIRECT EFFECTS OF PESTICIDES ON BIRDS
RAYMONDJ. O’CONNOR
Department of Wildlife, University of Maine, Orono, Maine 04469, USA
ABSTRACT
Indirect effects of pesticides result from changes to the environment of aspecies of interest that is itself physiologically unaffected by the pesticide.
A growing body of empirical data demonstrates such effects of pesticides.Insecticides primarily affect bird populations by reducing the insect preybase available to the birds. Herbicides affect various bird populationsthrough a variety of pathways, including 1) direct reduction of the foodbase of granivorous species, 2) reduction in invertebrate abundance byremoving the plants the invertebrates depend on for food or habitat, and 3)reduction in nesting cover. Most evidence involves reduced foodavailability or habitat changes but some evidence showsthat interspecific
relationships can be changed by pesticide use patterns. The long-termconsequences of indirect ecological effects of pesticide use patterns are
potentially massive but have been poorly studied and not fully integratedinto associated risk assessment.
INTRODUCTION
It has long been known that some agrochemicals, particularly those based onpersistent organochlorines, have major toxic effects on birds. Such compounds havebeen shown to impact bird populations through two pathways: first, though areduction in survivorship among full-grown birds, and second, through a reduction in
the nesting success experienced by breeding adults, particularly where mediated by achemically-induced interference with egg shell production; eggs laid were thenespecially thin-shelled and prone to physical damage in the nest. These effects havebeen extensively documented among predatory birds, for which successive biological
magnification of the chemical along the links of their food chains results in high doserates to the predator. Similar effects have, however, also been recorded in non-
predatory birds extensively exposed to organochlorines. Thus in Britain Stock Doves(Columba oenas) - a specialist granivore of arable land - were regularly exposed to
organochlorine seed-dressings during the 1950s and their numbers decreased almostten-fold during that decade, recovering after the removal of these compounds fromBritish agriculture (O’Connor & Mead, 1984).
Such effects are the outcome of direct exposure of individual birds topesticides. In contrast indirect effects - defined as effects on individuals not due tocontact with the pesticide or its metabolites but due to pesticide-related changes inone or more components of their environment - have recently been realized to have as
significant effects on bird populations (Potts, 1980; Sheehan etal., 1987; Greig-Smith, 1992). Such effects are particularly insidious in that they can lead tosubstantial reductions in populations of birds in the absence of any toxicity to thespecies. Indirect effects may also be very difficult to implicate as the cause of
observed declines since measurable residue loads are no longer correlated with theprobable impact of the compound (Mineau et al., 1987). Moreover, indirect effects
may interact with direct (‘toxic’) effects. As a result, detection of adverse effects
becomes contingent on population monitoring, never the easiest of tasks.
9A—3
In this paper I discuss the evidence for indirect effects on bird populations due
to pesticide-induced changes in food base, in habitat, and in interactions with otherspecies, and then consider the problemsin identifying and regulating such effects.
PESTICIDE-INDUCED CHANGES IN AVIAN FOOD BASES
A well-studied case history
The grey partridge (Perdix perdix) provides one of the clearest demonstrations
of how a bird population may decrease as a result of the use pattern of pesticides thatare themselves not toxic to birds. This species typically nests along the margins of
arable fields and the precocial chicks follow their parents through the crop in searchof arthropods. Southwood & Cross (1969) showed that recruitment to the population,measured as the juvenile to adult ratio, was highly correlated with the abundance of
insects present. Where herbicides had been applied, brood movementsin search of
food were 3-4 times greater than in untreated fields. Potts (1980) summarized a longseries of autecological studies that showed that arthropod abundance was a crucialfactor for chick survival and a key element in maintaining recruitment at levels highenough for population balance. However, pesticide use has brought about steepdeclines in the abundances of three groups of insects in cereal fields - species thatfeed upon field weeds, polyphagous species that feed on a variety of other insects,and species that feed on fungi - and many of these were favoured foods of partridgechicks. For example, among similar fields each extra plant bug (Heteroptera) per m2
of cereal crops increased chick survival by 1.5%; each extra leaf beetle(Chrysomelidae) was worth 3%; and each extra sawfly larva (Hymenoptera:
Symphyta) was worth 4%. Herbicide use has been responsible for a long-term 50%reduction in the numbers of these groups whilst the direct effects of insecticides weresmaller, though as high as 20% in particular crops such as winter wheat. Subsequent
experiments (Rands, 1985), in which herbicide and fungicide spray patterns weremanipulated along the field margins to promote a reservoir of arthropods, showedconclusively that the reduction in food base was indeed implicated in the observed
declines in partridge numbers. Brood survival was markedly greater on theexperimental farms where spraying was reduced along the field margins but was
unaffected on the control fields,
Indirect effects of herbicide use
Herbicides are used at three stages of cultivations, namely pre- and post-emergence, and during crop cleaning. Pre-emergent herbicides may be particularlysignificant for species such as the grey partridge since their use inhibits weeddevelopment at the time of crop establishment, often assisted by rapid tilleringstimulated by heavy nitrogen doses delivered to rapid-growing varieties of cereals.Most weeds never get established, and those that do are eliminated by the application
of post-emergent herbicides during the early stages of crop growth. With so fewweeds maturing, habitat for arthropod species dependent on these weeds is reduced,impacting insectivorous birds. Herbicidal cleaning of crops comes later in theseason, but attacks those weeds that spring up in response to light penetration ascereals approach maturity and lose their lower leaves. These plants thus never setseed, with consequent reductions in over-winter food supplies for granivorous birds.Combined with the effects of early stubble-cleaning and greater use of autumn-sowncrops, this results in cereal fields now offering many fewer weeds to winter-feedingbirds (finches and buntings, in particular) than in the past, when individual weed
species yielded anything from 20,000 to 300,000 g seed/ha (O’Connor & Shrubb,
1986). Root crops are similarly now much poorer as winter feeding areas for thesespecies since pre-emergent herbicide use at their sowing now eliminate much of theweed biomass that used spring up between the widely-spaced rows of these crops.
Yellowhammers (Emberiza citrinella), reed buntings (E. schoeniclus), chaffinches
1098
(Fringilla coelebs), house sparrows (Passer domesticus) and tree sparrows (P..
montanus) are among the species that occur in smaller numbers where arable weedseeds are less abundant (ibid.).
In Potts’ study the reduction in the food base for partridge chicks wasitself an
indirect effect, in that the herbicide use reduced the abundance of weeds that formed
the habitat of the chick prey species. A direct effect of herbicide use on arableweeds has been shown by Green (1978), for skylarks (Alauda arvensis) in easternEngland. This species has a rather varied diet for most of the year but in late winteruses one of two major feeding strategies depending on food availability. Thepreferred strategy is to forage on ploughed land for the seeds of arable weeds whichhave relatively high energy content. However, where herbicides are used for weedcontrol on sugarbeet crops such seeds are scarce and the skylarks then switch to
grazing the lower energy beet seedlings at levels that make the species a significantpest of beet. O’Connor & Shrubb (1986) similarly attributed a sustained decline in
regional populations of the linnet (Carduelis cannabina) in Britain to the introductionof herbicides to reduce arable weeds. Since the linnet specializes on the seeds ofarable weeds, it is particularly vulnerable to reductions in the abundance of theseweeds. The resulting decline in linnet numbers has continued, taking the linnet fromthe status of a rather common bird on agricultural land to an extremely rare one.Bunyan & Stanley (1983) suggest that other common farmland birds that utilize seedsin this manner e.g. the woodpigeon (Columba palumbus), rook (Corvus frugilegus),and some granivorous passerines - might also be affected in this way. O’Connor &
Pearman (unpublished data) analyzed long-term (1950-85) national data on trends innesting success of some 18 species common on farmland in Britain. They found that
most species improved in nesting success with the introduction of restrictions on theuse of persistent agrochemicals, a pattern also apparent in North America according
to recent analysis of data from the Cornell Laboratory of Ornithology nest recordcard scheme (G. S. Butcher personal communication). However, in Britain manyspecies showed evidence of decreasing success over the last ten years of O'Connor &Pearman’s study, a pattern they attributed to the ecological changes due to modern
agricultural management.
Indirect effects of insecticide use
Insecticide use has also been implicated in reductions in the numbers ofinsectivorous birds in a variety of habitats. In Norway scrub control by herbicidesbrought about a 30% decrease in breeding bird density on the site, primarily becauseof the reduction in food (Slagsvold, 1977). The application of the carbamateinsecticide Sevin (carbaryl) to the control of gypsy moth (Porthetria dispar) in NewJersey forests was accompanied by reductions of 45-55% in the abundanceof forest
birds (Moulding, 1976). Some species disappeared completely and numbers anddiversity decreased during the eight weeks after spraying and numbers werestill
depressed the following summer. Canopy insect abundance was markedly reduced butboth canopy feeding and ground feeding birds were affected. Moulding also cites
several other studies that recorded decreases of 10-16% in bird abundance followingapplications of organophosphorus or carbamate insecticides. However, in another
study the use of organophosphates for gypsy moth control yielded so many deadinsects that an overt increase in their consumption by birds was apparent (Stehn etal., 1976) and carbamate use against spruce budworm also resulted in birds feedingon the dead insects.
Indirect effects on wetland food webs
Several authors have expressed concern about the possible effects of pesticide
contamination of wetlands (Sheehan etal., 1987; Mineau et al., 1987). The latter
authors identify ducks in the prairie potholes of North America as particularly
9A—3
vulnerable to the indirect effects of pesticides. Taxonomically, waterfowl areespecially vulnerable to shortage of aquatic invertebrates for food, with the young ofmany species (especially among the diving ducks) having especially long periods ofdependency on such foods. The prairie pothole region produces about 22 millionducks annually, about a quarter of the entire North American production, but is also
an area of intensive agriculture. The potholes or sloughs are analogous to islands ina sea of cropland, with many of them being less than 1 ha in size and therefore highlyintegrated with their environs. As a result, large parts of the waterfowl breedinghabitat in the region are directly oversprayed during insecticide applications,especially during aerial spraying. Mineau et al. estimated that about 2% of theCanadian population of diving ducks nesting in the prairie potholes would be within
the spray zone during a typical canola pest outbreak. The potential populationconsequences of this have been demonstrated by Sheehan et al. (1987) who developed
a computer simulation model comparing persistence and concentration of pesticidesin prairie ponds with levels of toxicity to the aquatic invertebrates present. Byincorporating duckling growth they concluded that an overspray with a high hazardcompound such as permethrin could reduce macroinvertebrate levels by 90% or more,abundances inadequate to support the growth of mallard (Anas platyrhynchos) or
lesser scaup (Aythya affinis) broods of typical size. Such results leave regulators ina dilemma, in that the compounds with lowest toxicity to vertebrates e.g. the
synthetic pyrethroids, offer the greatest hazard to the food supply of breedingwaterfowl. Amongst those chemicals found to be especially hazardous in this waywere azinphos methyl, chlorpyrifos, malathion, and methoxychlor.
Some empirical data in support of these ideas are available. A large part of the
distribution of the American black duck (Anas rubripes) coincides with the
distribution of the eastern spruce-fir forest. Many millions of acres of this forest are
sprayed with insecticides during treatment of spruce budworm (Choristoneurafumiferana) outbreaks, typically (since about 1970) using short-lived chemicals such
as carbamates that are not acutely toxic to vertebrates but that may be toxic to
aquatic invertebrates in lakes accidentally over-sprayed. Experimental addition ofcarbamate insecticides to a lake in Maine led to reductions (relative to a control lake)in the abundance of macroinvertebrates and mallard and black duck ducklings on the
treated pond then spent more time searching for food than did birds on the untreated
pond (Hunter etal., 1984). Large scale run-off or accidental spraying of the lakesmight therefore be expected to have population-level effects on such waterfowl,paralleling the processes documented for partridge populations by Potts (1980).Concern about such large scale effects has led to recent experimental investigation ofthese issues (C. Grue personal communication). In one experiment ethyl parathionwas applied aerially and in normal doses to a sunflower crop. Despite the pilotattempting to avoid over-spray of the wetlands, local air movements led tocontamination of the water in sufficient amounts to kill off the invertebrates present.As a result the number of mallard ducklings present fell by 96% within 4d of theoriginal application. Thus both experimental and observational data indicate that
prairie wetland birds are very vulnerable to indirect effects of pesticides.
Mineau etal. (1987) remark the lack of empirical data as to the likely effects ofherbicides on waterfowl. Herbicides are of even greater concern than insecticides forseveral reasons. First, the use of herbicides is usually far greater than insecticides,Second, the herbicides target plants, so that overspraying of prairie sloughs is likelyto reduce the density of the macrophytes on which herbivorous invertebrates in the
sloughs depend for food, thereby reducing invertebrate densities. Finally, certaincompounds, notably 2,4-D, atrazine, simazine, and trifluralin, can be significantly
toxic to key macroinvertebrate groups in the duckling diet.
Summarizing, a variety of pesticides have been shown to reduce the invertebrateprey base of insectivorous birds by ecologically significant amounts, either through
1100
toxicity to invertebrates or because the chemical destroys plants that provide
invertebrate food or habitat.
HABITAT CHANGES INDUCED BY PESTICIDES
Herbicide use has been implicated in changes in habitat structure that reduced
the carrying capacity of a site for birds. Dwernychuck & Boag (1973) reported theeffects on ducks of 2,4-D treatment to improve grassland in Alberta for agriculture.Following application, nesting ducks initially crowded together into the remainingpatches of broad-leaved vegetation but nest densities declined by 75% over the long-term. O'Connor & Shrubb (1986) noted that the disappearance of reed buntings fromcereal fields in Hertfordshire, England, followed the herbicidal removal of weeds that
formerly provided nesting sites and suggested that a larger regional decline in thenumbers of this species in England was closely enough correlated in space and time
with the use of cereal herbicides to consider the two causally linked.
In the cases just cited the habitat changes constituted instances of habitatmodification rather than habitat destruction. However, several cases of larger-scale
habitat destruction by use of herbicides have been documented in North America,particularly within sagebrush habitats. Thus in central Montana Brewer's sparrows
(Spizella breweri) decreased sharply in sagebrush treated with 2,4-D (Best, 1972) andin a Wyoming study had largely disappeared two years after the treatment (Schroeder
& Sturges, 1975). The significance of these results is more than merely as casehistories: sagebrush covers about 87 million acres in North America and isextensively treated with herbicides for conversion to grazing. Changes on this scalehave almost biogeographic consequences for a species as closely coupled to the
habitat as the Brewer’s sparrow. Other examples of indirect effects of herbicidescome from forestry studies, with species totals and individuals both decreasing in a
Californian pine plantation treated for brush removal (Savidge, 1978) and with redalder removal from Oregon clearcuts accompanied by decreased densities of nesting
birds (Morrison & Meslow, 1982). Again, the extensive acreage of such forestrypractices has major conservation implications for bird species affected.
There have been few attempts to estimate the population consequences of
indirect effects of such large-scale use patterns. In one such attempt Mineauet al.(1987) incorporated the results of Dwernychuck & Boag (1987) into a computer model
of normal herbicide use in the Canadian prairies. They calculated that the resultingloss of nesting cover would bring about a decrease in total duck production of 7-18%,rising to perhaps 30% if the reduced cover additionally allowed increased predation.
Summarizing, herbicides provide a very effective means of manipulating thevegetative component of bird habitats. Sufficient evidence has now accumulated to
show that the avian carrying capacity of these habitats can be significantly reduced asa result and that these effects have the potential to be nationally or regionally
significant.
INTERACTIONS WITH OTHER SPECIES
Rather few examples of pesticide-mediated interactions between species havebeen recorded, in part no doubt because of the difficulty of documenting the
simultaneous occurrence of two indirect processes. Bracher & Bider (1982) report acase in which many dead insects accumulated on the ground following aminocarb
applications to control spruce budworm. As a result many more birds than usualstarted feeding on the ground and this in turn attracted mustelids (Mustela spp.) in to
prey on the birds. Bird mortality thus increased as a consequence of the normalinsecticidal properties of the chemical.
9A—3
ASSESSING THE INDIRECT EFFECTS OF USE PATTERNS
Two distinct issues arise when considering the indirect effects of pesticides.
The first concerns the extent to which regulatory decisions should incorporateindirect effects of pesticides, the other concerns the environmental consequences of
the use patterns that develop as pesticides do the work they were designed to do.
Regulatory reviews of individual chemicals are expected to take account of
unintended side-effects of each compound and historically have focussed on adversedirect effects on non-target organisms. This manifests itself in the "hazard =toxicity x exposure” model typically used in North American risk assessments (Urban
and Cook, 1986). What is emerging from the research reviewed here is a growingneed to recognize that adverse effects may also manifest themselves through indirect
pathways and that their cumulative effect on the environment increasingly needsconsideration. There are actually two separate issues involved here. The first is that
chemicals may have adverse effects that arise along pathways that the chemical wasnot intended to follow, as when a herbicide incidentally possesses insecticidalproperties. The second is that the elimination of, or reduction in, the size of pest
species populations by use of pesticides may have consequences for the environment,even though the pesticides may be absolutely safe for all except the target organism.
Unintended toxic side-effects of pesticides are possibly adequately taken intoconsideration within current regulatory practices in the United States and in Europe,at least in comparative evaluations (Greig-Smith, 1992). Given two equally effective
herbicides, each without toxic effects on birds, but one of which has an insecticidal
side-effect, it is clear that the adverse effects of the latter can potentially be larger.This point might then be validly factored into the environmental cost-benefits of that
chemical.
A philosophically different issue arises, however, when one considers the
environmental consequences of using a safe insecticide to kill insects on which one ormore bird species depend. From a species conservation standpoint it matters littlewhether a bird population goes to extinction because the adults were poisoned by atoxic chemical or whether they starved to death because a non-toxic insecticide
eliminated their insect food base. This dilemma is one well-considered by regulatoryauthorities neither in the United States nor in Britain, though it is beginning to
emerge as an issue in developing broader risk assessment and management strategies(Greig-Smith, 1992). In effect, this issue turns on the question of the extent to
which the agricultural community can be allowed to deploy, in the interests ofagricultural production, practices that impinge on society's larger interests, here the
maintenance of biodiversity.
In evaluating this question, there is much to be said for recognizing that the
scale and duration of the effects of agricultural practices are distinct aspects of theindirect effects of interest here (Greig-Smith, 1992). Indirect effects may be quite
extensive in spatial scale, as the end-result of treating a widely grown crop, forexample, but if their effects are transient they pose little concern for conservation,Where the effects are persistent, however, the populations affected are permanently
held to low levels and may then either be cumulatively driven towards extinction or
may be simply more vulnerable to stochastic extinction at low numbers. Given the
enormous scale on which some crops are grown either nationally or regionally, any
associated permanent reduction in ecological resources critical for individual species
is undesirable.
Cost-benefit analysis of proposed or current chemical use pattern, currently a
major tool in the US Environmental Protection Agency’s regulatory approach to
1102
9A—3
pesticides, can be extended to accommodate these ideas, though there are practical
problems in determining the population consequences of the indirect effects involved.On the one hand, case-histories such as those considered here provide evidence as to
processes but cannot demonstrate population changes. On the other hand, monitoringof population status through such schemes as the US Fish and Wildlife Service’s
Breeding Bird Survey or the British Trust for Ornithology’s Common Birds Censusdocuments changes but not causes. Monitoring detects the results of some mixture ofthe direct and indirect effects of pesticide use, often further confounded with landmanagement changes that do not involve pesticide use. Separation of these effectsone from another poses major analytical problems that may in fact be insurmountable.O’Connor & Shrubb (1986) emphasize that many farming practices take place withindistinct agricultural regimes or suites of mutually supporting practices that cannotpersist independently of each other. For example, direct drilling of cereals isimpractical without the use of herbicides to control weeds. Ultimately theconsequences of indirect effects of pesticides on bird populations may prove to be anenvironmental problem that cannot be addressed in their own right. They may insteadneed to be considered as merely one component of the larger problem of the
environmental consequences of human ability to manipulate, and in particular to bringabout very rapid changes in, land use patterns on landscape and regional scales.
ACKNOWLEDGEMENTS
I thank Drs Chris Grue and Greg Butcher for permission to use unpublishedresults. The manuscript benefitted from valuable discussions with Drs Rick Bennett,
Peter Greig-Smith, and Chris Grue, and from review by Carol Aldridge, Rick
Bennett, and Rosemary Hignett.
REFERENCES
Best, L.B. (1972) First-year effects of sagebrush control on two sparrows. Journalof Wildlife Management, 36, 534-544.
Bracher, G.A.; Bider, J.R. (1982) Changes in terrestrial animal activity of a forestcommunity after an application of aminocarb (Matacil). Canadian Journal ofZoology, 60, 1981-1997.
Bunyan, P.J.; Stanley, P.I. (1983) The environmental cost of pesticide usage in the
United Kingdom. Agriculture, Ecosystems, and Environment, 9, 187-209.Dwernychuk, L.W.; Boag, D.A. (1973) Effects of herbicide-induced changes in
vegetation on nesting ducks. Canadian Field-Naturalist, 87, 155-165.
Green, R.E. (1978) Factors affecting the diet of farmland skylarks. Journal of
Animal Ecology, 47, 913-928.Greig-Smith, P.W. (1992) The acceptability of pesticide effects on non-target
arthropods. Aspects of Applied Biology, 30.Hunter, M.L.; Witham, J.W.; Dow, H. (1984) Effects of a carbaryl-induced
depression in invertebrate abundance on the growth and behavior of American
black ducks and mallard ducklings. Canadian Journal of Zoology, 62, 452-456.
Mineau, P.; Sheehan, P.J.; Baril, A. (1987) Pesticides and waterfowl on the
Canadian prairies: a pressing need for research and monitoring. ICBPTechnical Publication No.6, pp.133-147.
Morrison, M.L.; Meslow, E.C. (1982) Impacts of forest herbicides on wildlife:
toxicity and habitat alteration. Transactions of the North American Natural
Resources and Wildlife Conference, 48, 175-185.
Moulding, J.D. (1976) Effects of a low-persistence insecticide on forest and birdpopulations. Auk, 93, 692-708.
O’Connor, R.J.; Mead, C.J. (1984) The Stock Dove in Britain, 1930-80. BritishBirds, 77, 181-201.
9A—3
O’Connor, R.J.; Shrubb, M. (1986) Farming and birds. Cambridge: Cambridge
University Press.Potts, G.R. (1980) The effects of modern agriculture, nest predation and game
managementon the population ecology of partridges (Perdix perdix andAlectoris rufa). Advances in Ecological Research, 11, 2-79.
Rands, M.R.W. (1985) Pesticide use on cereals and the survival of grey partridge
chicks: A field experiment. Journal of Applied Ecology, 22, 49-54.
Savidge, S.K. (1978) Wildlife in a herbicide-treated Jeffery pine plantation in eastern
California. Journal of Forestry, 1978, 476-478.
Schroeder, M.H.; Sturges, D.L. (1975) The effect on the Brewer’s sparrow of
spraying big sagebrush. Journal of Range Management, 28, 294-297.
Sheehan, P.J.; Baril, A.; Mineau, P.; Smith, D.K.; Harfenist, A.; Marshall, W.K.
(1987) The impact of pesticides on the ecology of prairie nesting ducks.
Technical Report Series No.19, Canadian Wildlife Service.Slagsvold, T. (1977) Bird population changes after clearance of deciduous scrub.
Biological Conservation, 12, 229-244.
Southwood, T.R.E.; Cross, D.J. (1969) The ecology of the partridge. III. Breeding
success and the abundanceof insects in natural habitats. Journal of Animal
Ecology, 38, 497-507.Stehn, R.A.; Stone, J.A.; Richmond, M.E. (1976) Feeding response of small mammal
scavengers to pesticide-killed arthropod prey. American Midland Naturalist,
95, 253-256.Urban, D.J.; Cook, N.J. (1986) Hazard Evaluation Divisions Standard Evaluation
Procedure, Ecological Risk Assessment. Washington, D.C., U.S. Environmental
Protection Agency, Office of Pesticide Programs.
BRIGHTON CROP PROTECTION CONFERENCE—Pests and Diseases—1992
A LINK COLLABORATIVE RESEARCH PROGRAMME ON TECHNOLOGIES FOR
SUSTAINABLE FARMING SYSTEMS
C. WALL
Chief Scientist's Group (Agriculture), Ministry ofAgriculture, Fisheries and Food, Nobel House, 17 Smith
Square, London, SW1P 3JR.
ABSTRACT
A research programme on sustainable agriculture, whichis funded jointly by industry and government, is
described against the background of the LINK Schemewhich currently involves some 400 companies and 200
academic research groups. The scope and objectives of
the programme are outlined and, by way of example, aproject on Integrated Farming Systems is described insome detail. This project sets out to integrate the
latest results coming from research into an arableproduction system which will optimise the use of inputs
compatable with production needs, profitability andenvironmental concerns. The project involves comparing
the integrated system of production and conventional
practice for profitability, energy balance and
environmental effects.
THE LINK SCHEME
LINK is a government scheme which supportscollaborative research between industry and the research
base (academia, research institutes and organisations).There are now 30 programmes with a value in excess of £380M,involving approximately 400 companies and 200 academicresearch groups. It is the first truly government-wideinitiative of its kind, and so far has active participation
from eight government departments and four research
councils.
Its key objective is to help the UK exploitdevelopments in science and technology, bridging the gap
between industry and the research community. This will
create a channel through which academic research can be
influenced by the needs of industry, thus increasing the
likelihood that results will be utilised. LINK provides a
framework for research, and a portfolio of well focussed
programmes within which partners from a variety of
backgrounds can come together in collaborative projects.
Government support at 50% is offered for suitable
projects, with the remainder coming from industry, and
participation of small and medium-sized enterprises is
the actively encouraged.
9A—4
The LINK initiative is overseen by a steering group
comprising representatives from industry, academia and
sponsoring agencies. LINK programmes support long-termenabling or generic research rather than curiosity-drivenwork or specific product development. The initiative is
intended to help whole sectors of industry or communities ofinterest, rather than individual companies or groups. The
LINK Steering Group is particularly keen to encourage a two-way flow of ideas and information, with industry's needs
feeding into programmes of basic research. LINK iseffective in drawing industry and the research base more
closely together.
Most LINK programmes are run by a Programme Management
Committee (PMC) whose membership is drawn from industry,academia (including research institutes and organisations)
and Government.
Most programmes also have the support of a technical
co-ordinator or programme manager, who plays a key roleassisting potential applicants in ‘project building’.
The LINK Steering Group approves new programmes in
key areas of science, technology and engineering.Individual PMC's are then responsible for the approval of
projects within these programmes.
LINK PROGRAMME: TECHNOLOGIES FOR SUSTAINABLE FARMING SYSTEMS
Technologies for Sustainable Farming Systems is a newLINK programme which was started in 1991 to run for threeyears. The present value of the Programme is £4.4M, ofwhich half has been committed by the sponsoring Government
departments (MAFF, SOAFD, DTI) and the AFRC.
Rationale of Programme
Farming is facing a difficult future with increasing
constraints on profits as Governments seek to decrease the
costs of agricultural support. At the same time farmers arebeing asked increasingly to protect the countryside and tominimise the adverse effects of farming on the environment.The adoption of less intensive production systems can helpto meet these concerns but there is a very real risk that
such production will be less profitable. There is,therefore, a need to foster research into technicaldevelopments which will help develop systems of farming
better attuned to future needs but which will still besufficiently profitable to be sustainable.
The term 'sustainable farming’ can mean differentthings depending on the circumstances, and is therefore
extremely difficult to define in a general sense.
"Sustainable' does, however, encompass three main elements,namely economic viability, conservation of the means of
production and having acceptable effects on the environment.
The aim of the programme is, therefore, to stimulate
research in new technologies which, when combined with
knowledge of agricultural ecosystems, would create viable
production methods which will meet both environmental and
consumer requirements.
Nature of Industrial Support
The nature of this programme differs from many of the
other LINK programmes in that support comes predominantly
from farmers and growers rather than from companies
supplying the agricultural industry. The organisations
representing the farmers are the various commodity levy
bodies who have authority to administer research programmes
from the levies paid by producers and processors.
In order to justify their investment to levy-payers,
the levy bodies need speedy economic gain from their
research programmes. Therefore, many of the research
projects supported through levies are of a directly applied
nature. However, farmers and growers are aware also of the
need to support research work in its earlier stages, and of
the need to take account of the potentially harmful
environmental effects of their production systems. It is
the research into technical innovation, and the integration
of this into new production systems to help meet these
needs, which is being funded by this LINK programme.
Scope and Objectives of the Programme
The Programme seeks to utilise research in a range of
sciences to investigate technical innovations for their
potential as new practices in agriculture. The following
priority areas have been identified:
techniques that will lead to lower costs of
production while maintaining profitability;
making production methods responsive to consumer
preferences and sensitive to environmental needs;
control of crop pests by manipulating ecosystems
and novel methods of pest control;
optimising the use of agrochemicals;
the latest diagnostic techniques for disease
detection;
manipulating leaf canopies for maximum
photosynthetic metabolism;
identifying and propogating desirable genetic
characters;
spatial analysis for quiding machine operations;
novel conservation methods for animal feed stocks;
innovations in animal management systems;
Exploitation
A principal aim of LINK Programmes is to obtain the
maximum commercial use of research results. Intellectual
Property Rights have to be agreed between the collaborating
partners prior to the commencement of a project.
SUSTAINABLE FARMING SYSTEMS PROJECTS
Nine projects have, so far, been approved and receivedfunding. They are all due to start during the 1992/93
financial year.
LINK: TECHNOLOGIES FOR SUSTAINABLE FARMING SYSTEMS
PROJECTS STARTING IN 1992/93
Spatially selective treatments in agriculture
Parasites of seed weevil and pod midge
Integrated farming systems
Improving the welfare and meat quality of pigs
Integrated nitrogen nutrition for wheat
Decision models for the use of fungicides on wheat
Molecular detection/diagnosis of blackcurrant
reversion virus
Mode of action of fungicides
Whole crop cereals
The largest of these projects is the multi-site, arableIntegrated Farming Systems project.
Integrated Farming Systems
The Integrated Farming Systems project seeks, in part,
to compare the profitability and environmental effects of
integrated and conventional farming practices. The project
is funded by the Ministry of Agriculture, Fisheries and Food
and the Scottish Office, Agriculture and FisheriesDepartment on the one hand, together with the industrial
partners - the Home-Grown Cereals Authority, Imperial
Chemical Industries and the British Agrochemical
Association. It is hoped that other industrial partners
will join.
Background
During the past decade output values for agricultural
products have decreased progressively in real terms, while
at the same time input costs have increased. There has been
a consequent squeeze on margins. This generalisation is
particularly pertinent in the arable crop sectors. There is
downward pressure on CAP support prices for budgetary (cost
of subsidies) and international (GATT/export subsidies)
reasons. Such pressures are expected to continue and
possibly intensify. The recent reform of CAP takes much
greater account of the environmental impact of farming on
the countryside.
The adoption of organic farming is, and will continue to
be, an extreme response to such pressures. The system is
made viable only if the premia obtained for organic products
offset the reduced yields. Such premium payments arise only
if consumer demand exceeds supply. It seems that, although
organic farming will continue to grow during the next
decade, it is unlikely to supply more than 10% at most of
the UK farm output.
Response to the prevailing pressures by the majority of
farmers will be dependent upon many factors, including the
relationship between fixed and variable costs on individual
farms. On some a continuation of high-input, intensive
farming will be essential if they are to remain economically
viable. On others a reduction of inputs to optimise output
will be the only option. The need, overall, will be to
ensure that the systems adopted will produce adequate food
supplies for the nation, by methods which are acceptable to
the consumer and environmentally, whilst ensuring
profitability and sustaining rural communities.
High-input farming practices, which have evolved over
the last 25 years, have resulted in major changes to the
structure and the degree of specialisation of farms in
the UK. Specialist arable farms in the eastern counties
produce the majority of arable crops, and use most of the
pesticides and fertilisers applied in the country. For such
9A—4
farms it would be particularly difficult to revert to, Say,
mixed farming, because of the capital investment and
additional labour required. For these reasons, a much more
likely development is the reduction of inputs to the
specialised farming systems which exist now.
However, simply cutting back on agrochemical inputs,
without modifying husbandry practices, has potentially
serious consequences. Crops receiving high levels of
nitrogen, but denied full protection by fungicides, are
likely to be uneconomic unless varieties and husbandry
techniques appropriate to low-input situations are
developed. Systems which integrate cropping sequences,
husbandry techniques (such as delayed drilling, mechanical
weeding, minimum cultivations and use of cover crops),
disease resistant varieties and limited agrochemical use are
potentially commercially viable and environmentally more
acceptable. Such integrated farming is being researched in
several other EC countries, but differences in climate, farm
structure and cropping sequences make it unlikely that
results from continental work could be applied directly to
UK conditions. Consequently, it is important that work on
integrated farming systems is done in the UK, which is why
this project has been supported under LINK.
Data from previous research have yielded qualitativelyuseful information to aid the design of an integrated arable
farming system, but they will not give quantitativelyreliable information on which to base decisions.Experimental work is necessary, therefore, to develop an
arable farming system which integrates the best scientificknowledge to achieve acceptable levels of output andprofitablity with acceptable levels of agrochemical input.
Objectives1. To integrate the latest results coming from research
into an arable production system which will optimise
the use of inputs compatible with production needs,profitability and environmental concerns.
To make valid comparisons between the integratedsystem of production and conventional practice forprofitability, energy balance and environmental
effects.To investigate scientifically the interactions
between component parts of the systems.
Definitions
Conventional Practice
Crop husbandry which maximises profitability usingexternal inputs applied within permitted limits to overcome
constraints on production.
Integrated Farming Practice
A crop husbandry system which maximises profitabilitywith a different balance of inputs, and aims to achieve
environmental benefits.
SitesThe experiment is located at six sites, five in England
and one in Scotland:1. Institute of Arable Crops Research/Royal
Agricultural Society of England - Sacrewell,
HuntingdonshireADAS - Boxworth, Cambridgeshire
ADAS - High Mowthorpe, North YorkshireADAS - Rosemaund, HerefordshireGame Conservancy Trust/Southampton University -
Manydown Estates, Hampshire6. Scottish Agricultural College- Pathhead, Midlothian
The sites selected constitute a good sample of climatic
zones, soil types and agronomic practices in the main
farming belt of the UK.
Rotations
The basis of the experiment is a five-course rotationwith crops chosen to be appropriate for the locality and
soil-type of the site. Each course of rotation isrepresented in each of the five years, and there is abaseline year at the start of the project. Set-aside will
be included in both the conventional and integratedrotations, to represent typical cropping sequences resultingfrom the CAP reforms. The exact details of the form and
position of set-aside are still being discussed in the light
of the rules of the scheme, as they become known.
Design
Comparisons are by half or quarter fields (paired
plots), one half managed on an ‘integrated system, and the
other according to conventional practice. The experiment is
partially replicated within sites.
Crop Husbandry
The details of husbandry practice are being decided by
a small team composed of site leaders with Mr A W Pexton
(NFU) as adviser. All husbandry will at least be to the
Code of Good Agricultural Practice.
Assessments
A wide range of measurements and samples are being taken
to enable the effects of the two main approaches to be
assessed. These include:
Weed and weed-seedbank surveys
Routine monitoring of pests and diseases
Environmental monitoring in the form of pitfall
trapping and D-Vac sampling of selected species, autumn
sampling for pH, P, K, Mg and O.M.%, and autumn and
spring assessments of soil mineral nitrogen
Crop growth as shown by weekly crop inspections during
the main growing season, autumn and spring plant
population assessments, and yields from defined areas.
Profitability as shown by the gross margins for each
crop in each system
In addition, other assessments will be done if more
funding becomes available. These would include harvest
indices for each crop, analyses of grain and straw for
nutrient offtake, earthworm and more detailed invertebrate
monitoring, detailed floral studies in field margin and
crops, and evaluation of interfield grass banks.
One of the intentions of the project is that it should
form a 'work-bench' onto which additional studies can be
bolted. Suggestions for additional work are, therefore,
very welcome - provided they come forward with the backing
of industry.
Benefits
These will arise from the successful development of
techniques and farming systems which maintain profitability
for producers by environmentally accepable means, which also
meet consumer requirements. The expected outcome will be:
reduced energy inputsenhanced biological diversityoptimised use of pesticides and nutrientsintegrated alternative control measures for insect
pests, diseases and weedsenhanced rural environmentsincreased protection of water supplies
Copyright © 2022 FDOKUMEN


![10 11 Session HR Session Seri Management[1]](https://static.fdokumen.com/doc/165x107/6314ba61fc260b71020fb0ee/10-11-session-hr-session-seri-management1.jpg)