Service and Southwest Regional Resource Cen - ERIC
401
DOCUMENT RESUME ED 108 398 EC 072 930 AUTHOR Buffmire,' Judy Ann TITLE Rocky Mountain Regional Resource Center: Service and Training. Volume, II of III. Final Repott. INSTITUTION Southwest Regional Resource Center, Salt Lake City, _Utah. SPONS AGENCY Bureau of Education for the Handicapped (DREW /OE), Washington, D.C. Div. of Educational Services. BUREAU NO 542930 PUB DATE Nov 74 IL I GRANT 0PG-0-70-4178 (608) NOTE 398p.; For related documents, see EC 072929,, and EC / 072931 EDRS PRICE MF -$0.76 HC- $19.67 PLUS POSTAGE DESCRIPTORS Eiceptional Child Services; *Handica ed Children; *Instructional Materials Centers; *Pro an 1 escriptions; Program Evaluation; *Begio 1 rograms IDENTIFIERS . .Rocky Mountain Regional Resource Center ) ABSTRACT The second volume of a three-volume report on the NoCky Mountain Regional ReSource Center provides data on service and training components of the Center's functioning from its inception in 1970,-through 1974. Provided are analyses of three 1-year stages in the development of the stratistician model which was originally designed-to provide a mechanism.. for lbcating the unidentified handicapped not receiving appropriate, services and to establish . resources necessary for helping the handicapped in -a regular class setting. Reported are such developments as the following: that the original work done in the first stage was the collection of data to define inservice training, needs; that the measurement of that process ceased in the second stage and was not reinstated; and that although service intentions were defined initially, they became lost in the process of implementation as the stratistician'becoae an effective vice provider instead of a data collector. Described is the . training sessions for teachers in the stratisticiansl schools and preservice training activities in teacher training institutions. Research and evaluation activities ate discussed.. Appendixes, which comprise more than half the volume,Icontain such items as stratistician data collection forms/ and the problem thesaurus, -a the b bibliography on affect-interaction-c a bibliography on he competencies and skills needed stratistician/generalists, and an affective study on student teachers in special education. (GW)
-
Upload
khangminh22 -
Category
Documents
-
view
0 -
download
0
Transcript of Service and Southwest Regional Resource Cen - ERIC
DOCUMENT RESUME
ED 108 398 EC 072 930
AUTHOR Buffmire,' Judy AnnTITLE Rocky Mountain Regional Resource Center: Service and
Training. Volume, II of III. Final Repott.INSTITUTION Southwest Regional Resource Center, Salt Lake City,
_Utah.SPONS AGENCY Bureau of Education for the Handicapped (DREW /OE),
Washington, D.C. Div. of Educational Services.BUREAU NO 542930PUB DATE Nov 74 IL I
GRANT 0PG-0-70-4178 (608)NOTE 398p.; For related documents, see EC 072929,, and EC
/ 072931
EDRS PRICE MF -$0.76 HC- $19.67 PLUS POSTAGEDESCRIPTORS Eiceptional Child Services; *Handica ed Children;
*Instructional Materials Centers; *Pro an
1
escriptions; Program Evaluation; *Begio 1
rogramsIDENTIFIERS .
.Rocky Mountain Regional Resource Center)
ABSTRACTThe second volume of a three-volume report on the
NoCky Mountain Regional ReSource Center provides data on service andtraining components of the Center's functioning from its inception in1970,-through 1974. Provided are analyses of three 1-year stages in
the development of the stratistician model which was originallydesigned-to provide a mechanism.. for lbcating the unidentifiedhandicapped not receiving appropriate, services and to establish .
resources necessary for helping the handicapped in -a regular classsetting. Reported are such developments as the following: that theoriginal work done in the first stage was the collection of data todefine inservice training, needs; that the measurement of that processceased in the second stage and was not reinstated; and that althoughservice intentions were defined initially, they became lost in the
process of implementation as the stratistician'becoae an effectivevice provider instead of a data collector. Described is the .
training sessions for teachers in the stratisticiansl schools andpreservice training activities in teacher training institutions.Research and evaluation activities ate discussed.. Appendixes, whichcomprise more than half the volume,Icontain such items asstratistician data collection forms/ and the problem thesaurus, -a
the bbibliography on affect-interaction-c a bibliography onhe competencies and skills needed stratistician/generalists, and
an affective study on student teachers in special education. (GW)

.B511114 i1:1,1111 11,1 11°. Nftl
OH111
tIM
11

COCI%hCOCD
1.11
Final Report
Project No. 542930Grant Wo. OEG-0-70-4178 (608)
THE ROCKY MOUNTAIN REGIONAL RESOURCE CENTER:SERVICE AND TRAINING
Volume II of III
Judy Ann BuffmireRocky Mountain Regional Resource Center
Department of Special EducationUniversity of Utah
Salt Lake City, Utah
November, 1974
The work reported herein was performed pursuant to a grant withthe Office of Education, U. S. Department of Health, EduCation and
Welfare. Contractors undertaking such projects under Governmentsponsorship are encouraged to express freely their professional
judgment in the conduct of the project. Points of view or opinionsstated do not, therefore, necessarily represent official Office ofEducation position or policy.
U. S. DEPARTMENT"HEALTH, EDUCATION AND WELFARE
Office of Education
Bureau of Education for the Handicapped

TABLE OF CONTENTS
Chapter 1.
Direct Service Delivery Program- 1
The Stratidtician 2
Chapter 2.
Stratistician, Stage One 1970-1972 11
Data and Results from Stage One # 23
Identification Assessment 42
Administrative Evaluation of theStratistician 48
Chapter 3.
Stratistician Stage Two, 1972-1973 55
1Chapter 4.
Stratistician, Stage Three, 1973-1974 69
Final Evaluation Design 82
Test--Retest Retention Study 93
Report on Program Analysis Questionnaire 97
Discussion 104
i Stratistician Summary 107
Chapter 5..
Summary of Stratistician Development 109
Chapter 6.
Training Program 115
.
Workshop Program 115
'Training Program 1973-1974 118
Development of The Training Program 130
Training Program 134
Evaluation and Discussion 141
Summary 142
.

Table of Contents (continued)
Chapter 7.
Research and Evaluation Activity 143
Evaluation and. Research Interaction 144
Bibliography 153
Appendix A: Stratistician Data Collection Formsand Problem Thesaurus 155
Appendix B: Cross-Peer Tutor Program 167
Appendix C: Program Analysis Questionnaire 191
Appendix D: Preliminary Interview forGeneralist Training Program 209
Appendix E: Post Training Interview forGeneralist Training Program 239
Appendix F: Bibliography on CompetencyliedTraining Programs 261
Appendix G: Bibliography on.CoMpetencies and SkillsNeeded bpi Stratistician/Generalists 265
AppendixH: Summary Content Analysisof Stratistician/Generalist Training Program 273
Appendix I: Problem Children: An Assessment of t
Teacher Observations and Attitudes 287
Appendix J: Observation of Teacher' Behaviorfor Use in Student Placement 315
Appendix K: Bibliography on Affect-Interaction-Communication 343
Appendix L: Affective Study on Student Teachersin Special Education 349
1.-
c)

LIST OF FIGURES
Figure
1.1 The stratistician as a linking agentthrough the RMRRC 6
2.1 Stratistician assignmerits 162.2 Location of stratisticians, 1971-72 172.3 A schematic of the operational process
and dissemination 222.4 Stage one stratistician process model 242.5 Number _of__children-contacted by-
strAtisticians by age 292.6 Number of stratistician referrals by
class size 302.7 Number of stratisticiari referrals by
grade level 312.8 Number of children referred, teachers
referring and principals referring by sex 332.9 Number of referrals by,source and type 342.10 Number of referials by type of class 353.1 Location of stratisticians, 1972-73 593.2 1972-1973 data collection form . 614.1 location of stratistician/generalists,
1973-74 724.2 Evaluation development process 84
_6../- Workshop work flow procedure 1176.2 Timeline for generalist training program 1317.1 Evolution of evaluative activities 145

.LIST OF TABLES
Table
2.1 Age and grade placement of students 444.1 Summary of stratistician placements,
1973-1974 734.2 Formative questions 794.3 iSummative questions 804.4 Goal structure and objectives outline for
stage three stratistician/generalist model 874.5 Scords of the evaluations of S/G training
sessions 954.6 Percentage use by S/G of services available
from I/S as seen by the S/G 1024.7 Performance objectives 1056.1 General types of training provided by
RMRRC 1166.2 RMRRC training activities. 1196.3 RMRRC available workshops, June, 1974... 1276.4 Placement of learning modules by number
on the- content - process grid 1356.5 Competency statements 1366.6 Module 1: identification source list 139
vii

a
Chapter 1
DIRECT SERVICE DELIVERY PROGRAM:
The Stratistician
The Rocky Mountain Regional Resource Center(RMRRC), as pa.rt of its overall program of services,desired to provide direct services to schools, insteadof through a regional diagnostic center.- Discussionswere held with the Special Education Division, UtahState Board.of Education (USBE) and' with administratorsfrom various LEAs throughout the state to determinehow existing needs could be met. These educators wereconcerned that a large percentage (42 percent) of theestimated handicapped children.of Utah were not beingserved, and that the RMRRC could make a significantcontribution if a method for providing services. couldbe determined.
The center staff considered alternative` ways ofproviding requested services, but decided that therewas not sufficient information to use in designing aneffective resource support system. Part of this lackof information was a description of the unserved popu-lation and their location. In response to this situ-ation, an important ingredient of the center's initialactivity was a needs assessment for planning future
--activity:-
In keeping with the center's child-centered fOcus,the core element, about which the direct service (andneeds assessment) would be provided, utilized instruc-tional resources. Resources werecorisidered as thatportion of instruction that dealt with the developmentand application of the educational prescription,including-external support services (without mediaand materials). The two main on-site approaches toresource services. provision were the resource roomand the itinerant resource teacher. In consideringthese two existing service-delivery models, the RMRRCstaff was concerned that limitations often imposed bythe direct assignment of students to the resourcestaff seriously limited its effectiveness in providing
1N1. 1

direct services to all the children in a school whoneeded their services.
The center's basic philosophic guideline in thesefirst years of operation was to develop methods forproviding services to the educationally handicappedchild, and to the child in the regular classroom. Thecenter envisioned a resource person' who would workprimarily supporting the teacher in the classroom, inan effort to.helpiceep the exceptional child in thatregular classroom whenever possible. The objectiveof the resource-person would be to work with the ___
teacher to solve problems; in effect, it would provideon-the-job training for techniques of coping with andteaching of the handicapped child.
. The center also decided that these interventionswould be most effective in the elementary school years.During these years, it was hypothesized, the childwith learning problems becomes separated from hispeers and enteks the special class. The ability tokeep the child in theTegular class and to increasehis learning skills so that peer pressures would notfurther separate the student was a major goal of theresource program.
The RMRRC developed an approach to providing this/service focused on a sequence of activities (model)centered on a person called a "stratistician." Thischapter will present the activities that were part ofthis service delivery model. The sections of thischapter will focus on the evolution of the modelthrough three distiAct stages, and then will presentsome general findings on this resource servicedelivery. This discussion will begin, by providing ageneral dc..finition of the "stratistician."
The Stratistician
The Rocky Mountain Regional Resource Center(RMRRC) after a year of researching and exploringmethodkfor effecting educational change, developedthe concept of a special educator who would workprimarily with elementary teachers in their class-rooms. This person, with a special education back-ground and classroom experience, would help theteacher find alternate strategies to meet a child'slearning problem; he would be a specialist in helpingteacher facilitate the affective domain in curriculum;
2

he would work in each teacher's classroom and see thatthe child who needed help was neither singled out norlabeled.
To clarify the role of this educational resource,the RMRRC staff felt a special name was needed--a namewhich would not carry preconceived implications aboutthe role. Since the development and use of specificstrategies was to be the forte of this special educa-tor c the idea,of a strategist evolved. This personwould not supplant the services supplied by thepsychologist, speech therapist, or social worker, buthe would nevertheless be a educational diagnosticianconsidering such variables as the affective domain,classroom olimate_changes, social interactions betweenteacher and student and between peers, and the effectsof socioeconomic background. From the above jobdescription and the combined roles of'a strategistand a diagnostician evolved the title: stratistician.
In addition to the above-named qualificationsand abilities, the stratistician was seen as anindividual who would effectively interact with othersin a nonthreatening manner. T person would need tobe viewed by the teachers as an ally who was willingand capable of helping whereve necessary. (Oftenwhen a child is taken from the regular class theteacher may infer that she can of cope with theyoungster's problem, or that the situation demandsexpertise that she does not possess. Conversely, ateacher may request the reassignment of a childunnecessarily.)
The center expected that the stratistician, inhelping the teacher solve an immediate problem, wouldwiden the teacher's experience and help her improveher teaching skills. Positive educational change wasto be effected in each school possessing,a stratisti-cian. Of more importance, the daily school, experiencefor the educationally handicapped child should beconsiderably altered. It was anticipated that thiscombination of-fActors would help reduce special-class placements.
Another way to describe the stratistician is bylisting roles this special educator would not fill.The stratistician would not be a psychologist andwould undertake little, if any, psychological testingor therapeutic counseling. If a need existed, districtpersonnel would be used, support personnel from the

RMRRC could be utilized, or the child could be referredto the center or to a demonstration program fordiagnosis. The stratistician would not be an adminis-trator nor a disciplinarian, since, the structure ofschool dynamics, evaluation, and control of teachersor students was not within the stratistician function.The stratistician "'resource to teacher) would notbe a resource t het, although through observation ofa studentkoblem and through appropriate programmingassistance, the services of the resource teacher couldbe enhanced.
In positive terms, the stratistician, as ageneralist-type special educator, could offer any orall of the following services to a teachbr:
1. Class screening in specific areas;
2. Observation of a'single student or of a
3. Planning (with to hers, administrators,aides,-committees, pupil service personnel,tutors, university personnel, graduatestudents, interns,\RMRRC personnel, districtsupervisors, etc.) .n classr,-,m management,program development\ use of specificcurricula, etc.;
4. EvaluLtion of programs, systems, methods',curriculum, etc.; 1
whole class;
5. Diagnosis: informal or formal;
6. Instructional skills: individual inservice;
7. Interaction skills: methods, techniques(i.e., role playing, reflective listening,congruent sending, "I" messages, etc.) withchildrSn, administrators, teachers, agencies,parents, etc.;
8. Evaluation of interventions and recycling;feedback to teachers, children, parents,other school personnel;
9. Data collecting, recording, systematizing,and reporting for RMRRC research programs.
The stratistician could be viewed as a link
4

between available resources and the teacher. One suchlink is'through the center as depicted-graphically inFigure 1.1. The stratistician is/an information .
channel between teacher and resources. This modelassumes that the stratistician has a,resource pool_dfneeded resources. The stratisticiamWould recommenduse of existing resources or variations-of-edildationalprocedures located by the stratistician, and wouldteach the needed skills to the teacher to.help,adjustthe program to ,f it the child's needs.
Part of the stratistician's role would be theability to effectively communicate with the teachersand to apply good intervention 'skills. Through thiseffective twotway communication, the stratisticianwould develop'the basis for constructive classroom_change. Ili this context the stratistidian wouldeffect change' by selecting viable interventionstrategies and by disseminating them. As\suggestedby the Titlq III ESEA guidelines (1967), the criteriafor this dissemination included the following; elements:clarity, validity, perirasiveness, impact, timelinessand practicality..
To enable the stratistician to functiop)
effectively in the classr9om, the stratisticianwould demonstrate the following skills: /
Observation 1. To demonstrate the'ability to observebehavior of the teacherand children in aclassroom and to deter-mine the relevance ofthis interaction to theeducational objective.
Screening Diagnosis
Coordination ofResources
To be familiar with'diagnostic techniquesin order to facilitate\
\teacher isola 'on ofclassroom prob ems,i.e., intellect al,social, personal, etc.
3. To coordinate all avail-able resources on behalfo4,the child. Thisiribludes resources in
5'

IP
Fig. 1.1
The Stratigtician as a Lining
Agent through the mnRa0
6

Planning
Instruction organiz-ing ideas, selectingclues
the school (principal, otherteachers, other specialeducators if available),the district (psychologists,social workers, nurses,counselors, curriculum spe-cialists, speech therapists,vocational rehabilitation-ists, community groups,etc.) resources in inter=mediate or multi-districtcenters where available,and from state and regionalagencies.
4. To learn how to developstudent and teacher pro-files that could be utilizedin working out interactionstrategies.
5. To create an individualizedapproach for each teacherto include her personal andprofessional strengths inpinpointing student,problemsand to utilize the most use-ful curriculum materials.
interaction i 6. To demonstrate throughmodeling and role playingthe interpersonal approachesto problem solving; utiliz-ing the strategy of reflec-tive listening and congruentsending.
Evaluation, recycling 7. To indicate to teachers thebehavioral changes inteacher/student interactionbasic to reevaluation andcontinued programming.
8. Td demonstrate these skillsan inservice training
apacity as needed.
On-the-job training;classroom modeldevelopment
would be important that the stratistician beable to intervene in the school setting as a changeagent when necessary. If the existing value system
14

did not provide optimal learning opportunities forthe handicapped child, the stratistician Would developa strategy for introduction of new ideas that wouldoptimize opportunities for all children.' Some con-sideration would include: 1) the approach to explain-ing the proposal to each audience; 2) the amount andtype of inforMation; 3) the method; 4) the point atwhich information is released;.5) the media; 6) thetechniques to implement change; 7) the methods ofpublicizing the effected change. In addition to theabove, the strategy\would also have to incorporatemethods 'by which the dissemination agent could collect-,feedback for evaluation, measurement of audiencereaction, and, if necessary, selection of a newstrategy by changing the approach.
The intervention procedure would begin by anassessment of the school program and its operations.This would 'Evolve the procedures, staff relation-ships, space, Materials, and organizational aspects.The next item of importance would be the identifica-tion of concerns. This would include the school starget p5iTriETOn, the age, economic factors,
-geographic and cultural considerations, and teachervariables.
Part of the description of teacher variableswould have to-include the-identification of thecharacteristics of the teacher in relation to instruc-tion and the tedaei-Ti perception of her role withinthe school. The stratistician, as part of the inter-vention procedure, would have to recognize theteacher's uniqueness as an individual and her abilityto cooperate, interact, accept, innovate, and utilizeresource support services.. The intervention procedurewould provide a method for developing a case studyteacher profile to determine the best provision ofservices. Instrumental in all work would be teachercharacteristics and teacher concerns, founded or\pn-founded. It seemed the best approach would be toAart where the teacher was and then to move on to
'other plans of action and interactions in the class.
The stratistician then would be aware of manytypes of instructional materials, procedures, methods,and their uses. In this sense the stratisticianwould be a facilitator between available resourcesand the school in which the stratistician works byvaiding in coordinatioh and organization of educationalprograms.
8r

The preceding discussion presents the basic modelfor the stratistician. The general historic perspec-tive of this development relative to other ,activitiesis in Chapter 2 of this report. Of immediate interestare the changes and development of the model duringthe project and how services werealtered. Threedistinct developmental periods of the concept will bediscussed.
The first period reflects the stratistician as aneeds-assessment mechapism by which data were gatheredby direct intervention' in the school. In the secondperiod the needs assdssment role is minimal and high-lights the involvement in the ditect educational serv-ices. The third period is the development of a two-level hierarchy of stratisticians with an intermediatestratistician between the resource center and theservice 'stratistician. Each of these periods will beexamined separately in the following sections, andthe results and problems of each stage will be dis-cussed also.
An important element in this model's review isthat the majority of services are aimed towardchildren who were less severely handicapped and whowere in the regular classroom. In terms of classicalcategories the population of children who receivedservicesOare primarily learning disabled, educablementally retarded, and minimally emotionally disturbed.A small number of children with mild physical handi-'caps, hearing impairments, or visual impairments arealso in the regular schools' primary target popula-tion.
A determining force in the evaluation of the.stratistician model is the availability or absenceof special services. In urban areas, where thestratistician model was primarily testedthere existsa relatively wide range of services for the severelyhandicapped child. These include special schools,hospital and state health programs, as well aseducational programs involving resource rooms, self-contained classrooms, and itinerant specialists.Therefore, the child who is found in the regular i
classroom is usually less severely involved and does ,jnot meet the criteria for a more intensive program.
In the rural areas a different situation existsSince there are virtually no special educationservices in many areas and only a few self-containe
0- 6 0
9
.00

classrooms, the more severely handicapped child ismore likely to be placed in the regular classroom.The stratistician in a rural setting is more likelyto be involved in planning for a severely handicappedchildtthan will his counterpart in an urban setting.During the first year of placement, the rural,itinerant stratistician set up a program for train-able mentally retarded who were not being served,and thus, dealt with a higher incidence of the severelyinvolved. These rural areas provided some basis forpiloting the stratistician model with a severelyinvolved population. On the whole, however, becauseof the availability of services in the urban stratis-tician placements, the predominant influence in thedevelopment of the stratistician role was the need ofthe less seriously handicapped child.
r
10

Chapter 2
STRATISTICIAN, STAGE ONE 197-0 -1972
The first year of the RMRRC project, was theplanning year for the development of the stratis-tician concept. During this rmative period the Utah1pSEA and selected LEAN helped fh developing a perspec-tive of the needs within Utah. As stated earlier,these needs related to about 40 percent'of thees imated handicapped population who were in regularcla Brooms, but who were not identified nor receivingspec al services. The SEA staff indicated that thelarge majority of severely and/or profoundly handi-capped children were identified and were receivingserices within a range of-programs.
ard data were not available to substantiate thisperception, but the RMRRC accepted the SEA's assessmentand sought to meet the needs thus identified. Theaccepl4nce of the assessment was important from anotherview, because it limited the population and the typeof services. This limitation was crucial to thecenter's planning, as it allowed the center to-focus"its energies and develop resource staff on a morelimited rangeof problems. This limitation allowed
-.the implemented services to be more thorough, and, inturn,. responsive to client demands.
the RMRRC, therefore, sought to meet a definedneed within Utah by determining the number of unservedchildren in the regular classroom, and by theprovision of special services on a,cost-effectiVebasis. The role of the stratistician was directly:related to the needs-assessment function, and, ineffect, became the key link to the target population..The stratistician's function, (as discussed earlier)was envisioned as a method in which an itinerantresource person would collect data on unserved handi-capped children within a school.
The stratistician maintained records on"interventions" with teachers, and through theserecords an assessment was made of educational handi-capping conditions in schools. The records also
?"

provided a compilation of teacher needs for instruc-tion. Each child was viewed without categorizationby educational problem, and was served in terms ofindividual learning needs.
The transition from planning to implementationoccurred toward the end of the first year. Thestratistician conbept was transferred into-a definedrole as outlined in the preceding section. Based onthis defined ole, a job description was formulated.Because of the nature of the project and the need tobe able to rel to well to all professionals in theschool system, he personal qualities of "openness,""nonjudgmental ttitude," "high tolerance forambiguity," "pr blew solving approach oeattitude,""acceptance of elf and of others" were included asimportant selec ion criteria. The formally definedrequirements included:
a. A minimum of a master-degree level prepare-x tion in special education or a related
area;
b. Training and field experience in educationalevaluation;
c. Field instructional experience.
Duties included:
a. Primary/responsibility for the developmentand application of student-evaluationprocedures and instruments;
N.b. Primaz'y responsibility for the development
of instructional programs for usage inprescribed programs;
c. Organization and implementation of trainingfor field personnel in evaluative proceduresand instructional programey
d. Field consultative functio s;
e. Maintenance of all data on evaluativeprocedures and instructions programs.
Six stratisticians were chosen with experience inboth the regular and special education fields. Allindividuals had been highly successful in previous
12
1 -'i

work and had been perceptive in their work withteachers and children. In addition to these qualifi-cations, they were flexible, were able to' adjust toproblems, and were creative (as measured by the ThisI Believe instrument, Harvey, et al., 1966 and 1968).In order to utilize and direct those skills towardthe stratistician role, a training program was con-ceptualized.
The training program was developed Around theskills of the individuals. Several questions wereconsidered in setting up the training model.
1. What is the role of the stratistician inrelation to the total resource system?
a.' What skills, information and attitudesshould the stratistician have to beeffective in his relationship withother component parts of the totalresource system?
2. What skills, information and attitudesshould the stratistician have to be effectivein his relationship to other service systems
.in the community, especially in.his relation- .
ship to the school system?
Hpi can the needs and competencies of allstratisticians be evaluated so that thesestrengths or deficiences can be consideredin the training model?
4. How can the training model be monitored forits relevancy to the present educational andservice needs of the community so that latertraining models can be made more "real."
As the role evolved, several integral partsemerged.
1. Retriever of data, information, needs,attitudes on school personnel (teacher,ancillary, administration), from literature(journal, books, mailing list), throughtraining activities (workshops, seminars,confeiences) and programs (local, national).
\
. 2. Disseminator of data, information, needs,/attitudes, through direct interactions with
13
shool personnel, training activities,workshops, seminars, conferences,lectures or indirect interactions, i.e.,production of letters, materials anditerat-tre
3. valuator (incoming and outgoing data fromretrieval system).
4. qhange Agent (facilitation of the dissemina-flon process).
A questionnaire was given to each stratlsticianto survey*his perceptions regarding role, effective-ness and expectations (of him and by him)_. A casestudy method was used in several instances to initiatethought. Information from the questionnaires wasthen compiled and used 14 discussion groups and alsoas material in the training which was directed torespond/to identified needs and concefas. In thisway each stratistician/participated in-Sloortion ofhis own training, utilizing'his interests and strengths.Stratistician interactions with other center personnelenhanced their understanding of how they, could help._one another and develop into a working group.
Materials were available for individual studyand presentations were made by knowledgeable.peoplein the following-areas:
Learning disability
Affective education
Defiant children
Social casuality
Illinois Test of Psycholinguistic Abilities
SEIMC; Olathe Retrieval System
Creativity
Administration
Behavior modification
Systems for change
14

Materials were recommended in all of these,areasfor reading and future reference. In some cases
mmaterial was distributed, tapes were made of presenta-tionsand note taking was' encouraged.
During thetraining period interaction betweenstatisticians and 'other RMRRC staff members wasencouraged, concerns were noted for future sessionsand modeling took place for future interactions in,the schools. Role playing also played a part ofseveral phases.
Through the training activities, the stratis-ticians were geared toward field data collection inselected schools during the 1971-1972 funding period.Six stratisticians were placed at the beginning ofthat school year in schools with a variety ofeducational environments. Two stratisticians wereplaced in Provo area schools that have high studentturnover rates (transient); one of the two was located -in a low socioeconomic area. Three stratisticiansworked for schools having stable student populations,but in socioeconomic areas ranging from low middleto upper middle class. One stratistician worked withseveral school districts (at an intermediate level)in a rural area.
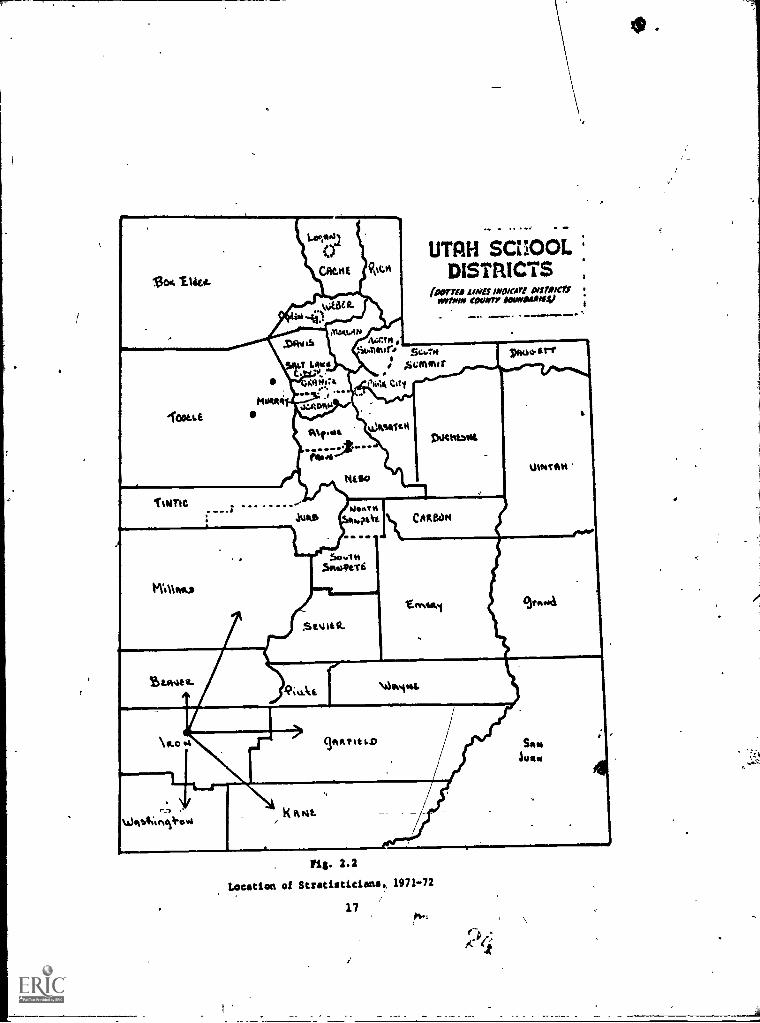
Figure 2.1 is a paradigm of the distribution ofstratisticians by school. The paradigm also providesinformation about the schoole, the status of theirspecial education programs, and the focus or specialarea of the stratistician. The variation insituational parameter was quite large and was expectedto prdiride,a good test of the stratistician concept.The geographic location of the stratisticians isshown in.Figure 2.2.
The stratisticians and RMRRC administrators wereoriented to each of their school's plans by districtpersonnel. The first plans centered on the orienta-tion of the school teaching staff to the stratis-tician role and to the RMRRC. Plans were furtherrefined later, but the goals established a link ofcommunications between all participants.
The stratisticians were in the schools four daysand in the RMRRC one day each week. They keptanecdotal records for the first few weeks of activityand carefully observed their school's operation. Allinteractions with teachers were documented, and the
15
.1A- ,v;,
r -

No SpecialEd.
Props=
u, Gus 04casino"
.No sad
'LimitedProgramofSpecial
Ed.
(6-Cauety Region SV Utah)Special
EducationProgramProvided
(Tooele Central)
LimitedSnecialEducationProgram
Consid-erableSpecialJacili-tiasIsinurceProgram
Fig. 2.1
Stra istician Assiaments
16
SesourcsTeacherL.D.BehaviorMod
(Salt Lake City)
Indicates EnviromantalArea
Information inside circlesdetails Otf*tistiCillft
. training and background
'lac Vies
UTAH SCI1001.DISTRICTS
(tornasteditoguartilvsMIO'sWah'IN MOW 1......+
2).0o-err
Iii. 2.2
Location of Stratisticianst 1971-72
17
U1,4110,
Sao4141

case studies were discussed during Friday meetings.
A back-up resource staff including a psychologist,special educators, evaluation director, materialsspecialist and communications\specialist was availablewhen requested. All impacts from the resources werealso documented. Any case opened was to be followedwith the recommended remediative strategies. and theireffectiveness. The center was responsible for monitor-ing this process.
The service director worked closely with thefield operation. Continuous contact was maintainedwith the local administration, district personnel andthe stratistician. When necessary, communicationlines were ektended across district lines when itappeared helpful for both districts/ or when clarifica-tion of operations was needed.
A measure of stratistician effectiveness was to'be developed during the year, and this measure would,be used in establishing where the stratisticians were,helpful in the schools and where new directions wereneeded. As concerns and needs become clear, it wasthe service director's responsibility to hear themand to establish ,a plan for resolution.
The Friday meetings were an integial part ofthe service process--a place to share the problemsand cases under study, to gain input information frailnew sources, to evolve general policies and guide-lines, and to evaluate the center's responsivenessto the stratisticians' needs, and the stratisticians'to school needs. It was the service director'sresponsibility to set up and to conduct these meet-ings.
When special information\ was needed ,at any meet-ing, advance notice was givento the stratistician.Each key resource person provided input into planningeach meeting, a program was distributed, and theactivities were evaluated. The evaluation was usedto change the format and to make the meetings moreuseful. Some of the topics initially defined forconsideration at these sessions were:
1. Case studies.
2. Interaction skills
3. Data collection
40

4, New curriculum
5. Video taping'
6. Observation techniques
The six stratisticians had a two-fold, overlap7ping function in the schools, serving both asintervention agents with teachers and as datacollection agents. Data collection was viewed as_exploratory--since'the stratisticians were developingaspects of their roles--andwasfocused on twogeneral areas: (a) descriptive data and (b) processdata. Several specific dimensions were then definedunder-the!e two areas.
Three types of descriptive' data were collected:support, spedific educational problems, and inter-vention strategies. The information classified as ksupport data repesented a demographic description ofthe referrals made to a stratisticians, and wasviewed as vital to the intervention of the'other twotypes of data (specifie educational problems and typeof intervention.) All these types of data aredescribed under the subsequent headings.
Support data. The types of support data whichwere to be collected were:
a. Frequency of referral by child's age;
b. Frequency of referral by child's classsize;
c. Frequency of referral by grade level;
d. Sex of referred child and referring person;
e. The number of referrals by source (i.e.,teacher, principal) and\type (i.e., formalreferral, informal);
f. Number of referrals by type of classteam taught, taught by single teacher).
Specific educational problems. The frequency/ofspecific educational problems were those reported bythe teacher and stratistician. These educationalproblems were the basis for a:problem thesaurus, whichwas developed by center staff in collaboration with
19t.

the field personnel on the basis of preliminary field_observations.
Many initial categories did not prove useful andwere either deleted or broken down into more discretebehavioral descriptions. This ongoing process wasnecessary- to further refine the categorization ofeducatidbal problems and to facilitate data tabula-tioj-ki In addition to the description of the educa-tional problems, data were collected detailing thelocation whet% the difficulty arose (i.e., ciassroom,playground, lunchroom).
The various Cate ries of specific educationalproblems were vie rom two frameworks. Firstly,each problem rep ented a problem which detractedfrom instructio 1 effectiveness. This detraction ofeffectiveness s of interest because of what thestratistician ould do in altering, that educationalenvironment ana in attempting to reestablish instruc-tional effectiveness. It also represented a teacher'sapparent inability to handle a given behavior orbehaviors. It was ypothesized that high-frequencyoccurence of specif c problems represented areas whereteachers did not h ve adequate skills or preparation,or were not receiving the necessary inservice train-ing. Intervention strategies, a two-part rationalefor specific responses to problems evolved from / \
collected data. ,Within the major context of the 'twodata bases, the RMRRC identified thrle major thrustswhich would guide the services program: (1) inter-ention(etratisticians); (2) ecological aspects;and (3) resource system. The intervention approach(stratistician) provided services as well as informa-tion in needed inservice and in preservice packaging.As a result of experiences (data), input of variousagencies and schools, and brainstorming sessions, asecond thrust emerged on the need to know more aboutthe ecological aspects of the stratistician schoolsand districts. The ecological aspects includedsocioeconomic status, culture, mobility, transiency,population density, religious preferences, school
' policies that influenced development of thd children,and the school's acceptance of change.
The resource system involved gathering informa-tion on available resources in the state and region,identifying needs, and providing information tovarious. Schools and/or agencies on relevant resources.The resource system was to function through
20
(41

dissemination of inTorMation about ongoing educa-tional approaches in addition to the center'sactivities. The three types of descriptive datawould generate information for better services toteachers, for pre'service and inservice training andfor assistance in developing a resource system forthe region on service, training, and resources.
The procedures promoting changes in the educa-tional establishment consisted of the following steps:,(1) identify needs; (2) conceptualize models to meetthe perceived needs; (3) establish working relationswith cooperating schools; (4) implement the model;(5) identify and capture the variablesinherent inthe interaction generated by the implementation; (6)analyze the factors involv,1; (7) develop implicationsfor practice from the analysis, (8) ascertain effec-*tiveness through pilot projects and/or other appliedtechniques; (9) refine; and (10) apply the resultswith appropriate evaluation components (feedbackloops) for further refinement and tuning to meet theneeds of an environment (schools, inservice and/orpreservice training). The overall procedure wasdesigned to incorporate changes in" esponse to newinformation, to adjust direction for change, and alsoto continually provide the information if a majoroverhaul was required.
Figure 2.3 presents a schematic representationof the center's model for collection, analysis,packaging, implementation, and dissemination of datafor both preservice and inservice training and rorresource system development. The process identifica-tion model shows the discrete steps of center opera-tions. The process flow model relates to theidentification model, but isolates the responsibilityand accountability of personnel. The numericallyidentified stages noted by circled Arabic numbersabove each phase of the models show the relationshipbetween the two models.
The dissemination model identifies the stageswhen information can be provided to interested con-sumers. For example, if a school were interested ininformation on simulation models of teacher-childinteractions, the information could be provided inPhase I (gross examples), in Phase II (examplesimulations have been prepared), in Phase III (apilot assessment has been conducted) or Phase IV(simulations are now being utilized in either preservice
21

MODELS#i 0 / Qi
Om am, MO Ira ONO OilireMillfr liaal wim M14114 MM MID,
PPCCESSIOIMtinf4110P
MGOEL
Dint MINAT100PA0n111.,
PROCESS!Lowwicroct-
cou4saw4.4Atota.
sommosts
r4
ono11044,444
...tt.....=..
coma
aa, ....oi.....saw.
11:41:4TiTo
-,...ti.r..L.D.-1.44.44 : LC9--- /.*".".""." itEsou.ct I I
-7(57-; -00-4.04 1-715F--1 @tt----WT- LITIV,irr--
) I- -161r....1 :
SP111144444444
....r 1041.:r".*MN Cia
[smarm"emit
causayleat
PRIMO.44*
PACita0144
IMO
161.1.0.4m1
toucletcm/6.111
..1.1.6.&r ,Irar...11.w
141640T/41C4.10401K Paralei
pMwLf iptu.se
111 331
Asigemsaa.TA
$0444.44441t
1111144144:444.4w4484
It5414.111.141...41VW
411Nq SS4Nita.$1161A141164..layi
WM.%
WU:1K-641.1014
14rino. SN1Zr
'4\ tittOth. .44,A"
1
SCHOOLS
LFig. 2.3
A Schematic of the Operational Process and DIA1118/114r1011
1
.wg moo

or inservice training programs). This disseminationmethod provides for the use of materials at variousstages, for ccusuaer information on material sophisti-cation and for a vehicle for dissemination beforefinal implementation, if requested.
The Roman numerals on the process flow model area guide to understanding the function and rationaleof the feedback system. The feedback process isrepresented by the dotted lines in the schematicmodel. An example of the feedback process follows:After the implementation (7) of the materials ineither inservice or preservice-training, it may be-decided that corrections or adjustments of thematerial or packaging is required. In such an event,the material could be referred from the Implementationphase (X) back to Media (VIII, a, b) for reworkingif the "overlaps" were not clear; or back to DataManagement (V) if the implications are not clear; orback to the Design Component (I) if different oradditional questions need to- be asked to align thepackaged training materials with questions from the
trainees.
The built-in feedback process provided amechanism to incorporate corrections in the defined
process. When the model became fully operational,it was anticipated that changes or revisions wouldbe required to maximize data flow 'and the corrective
process. The stratistician formed an important /link
to the school and the needs-assessment base f7/regional operation in this approach.
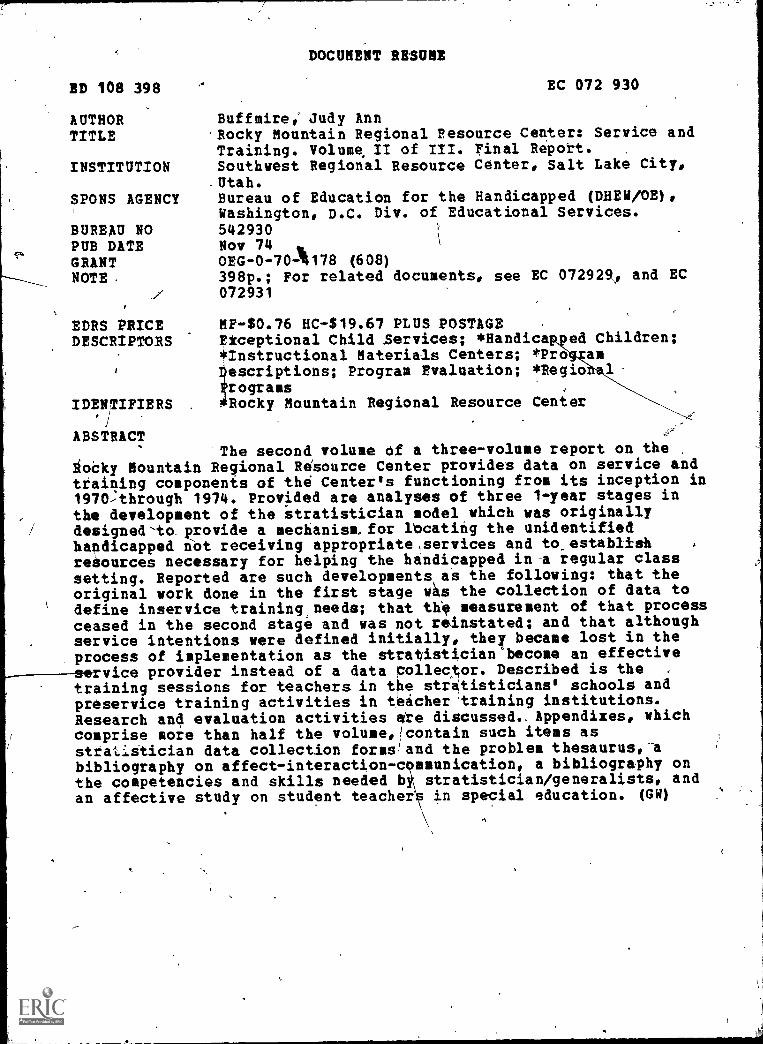
The overall operation during Stage One of thestratistician program (recounted in the precedingdiscussion) is outlined in the schematic of. Figure
2.4. The process flow shows the planned combinationof the interventions with the data collection effortand the interaction with the center. The procedurefor data analysis is shown as a separate process,producing the desired descriptions of interventions
and alternative "instructional strategies. Theprocess is clearly defined and expectation is estab-lished. The following section presents the results
of the activities undertaken.
Data and Results from Stage One it
At the end of the first school year, the response
23
ti 0

StratisticianModel
Criteria
Year 1
Year 2
Select
Stratisticians
Train Place
'Stratisticians Stratisticians
DevelopAssessment Tools &Recording Forms
ImplementRecording
AnalyticProcedure
ContinuingDescription
of Interventionsand Strategies
SelectSchools
Anecdotal Recordsof Interventions
Data Base 4---
GenerationInterventions
EstablishReview Committee
Operate WeeklyMeeting
Fig. 2.4
Stage One Stratistician Process Model
24
Case Reviews
Additional.
Input

from the districts was enthusiastic and supportive.By focusing on the teacher as opposed to the student,the stratisticians felt more students benefited fromtheir services 'than if they had been used in roomsor self-contained classes. A large number of teachersreceived inservice training in total faculty groups,in small groups and on a one-to-one basis. More than90 percent of the teachers in the five schools witha full-time stratistician utilized the stratisticianin some way. This high-use rate was attributed tothe type of role which allowed the stratistician tomove freely and to actually draw together manyresources, thus serving all the school's exceptionalchildren.
It was particularly difficult to measure theeffectiveness of the stratisticians placed in themulti-district service unit, compared to those inindividual schools. The service unit covered alarge geographical region in southwestern Utah thatcontained more than 50 schools. The service renderedwas better than none, probably better than previousservice, but it was spread over too large an area tohave any measurable impact. Perhaps the biggest'problem in getting a true assessment of the value ofthe stratistician model is the fact that the centerstarted out with unique, highly skilled individualswho would probably have been successful in anynumber of roles. The principals were also carefullyselected and reviewed by the RMRRC and the districtofficials before they received a stratistician.
At the end of the year, the stratisticians wereasked to describe the skills they felt were necessaryto be effective in this role. The identified skillsincluded diagnosis (formal as well as informal),prescription, knowledge of programs, evaluationskills and interpersonal interaction skills. Theseidentified necessary skills matched the RMRRC's andwere included in the stratistician training programs.
The stratisticians faced the operational,difficulty of "serving two masters," the school andschool system where they were placed and the RMRRC.They functioned as regular faculty members--anintegral part of the school for four days a week-7andthen returned to the RMRRC on Friday for a weeklytraining meeting. So the stratisticians faced someproblems in becoming an integral part of a schoolwhen they were out of the school one day each week.
25

Although this arrangement was clear be the districtsand to the school principals before school startedand was facilitated by the fact that the RMRRC paidvarious portions of the stratisticians' salaries(from 25 percent to 100 percent) there were stillsome feelings about their absence.
An even greater problem was that of keeping thestratisticians focused on defining the process oftheir role for later transportability, rather thanonly on solving immediate.problems for teachers andchildren. They faced the dilemma of providingservice while doing research. Collecting the neces-,sary data was time conspming and was occasionallylimiting in the types of services that could beprovided. Strit:Lsticians indicated they often foundthemselves meeting service needs "on their own time"because of the limitations of the guidelinei on thedata needs. The additional service needs were definedas activities such as working with students; teachersof students, parents, school projects or communityorganizations that did not necessarily relate tohandicapping conditions. In most cases, the data onthe stratisticians' provision of services wasaccurate in regard to handicapped students, but itdid not reflect the total picture of a stratistician's'work for a school, a district, or a community.
The history of this first stage included aheavy conflict between the operation of servicesdefined in the proposals and the role developmentthe stratistician. The conflict was strongly spelledout in the resentment voiced by the stratisticiansagainst data collection and record keeping and the
/ requirement to focus on handicapping' conditions. Inmany ways the process was carried out without the Billcooperation of the stratisticians.
In retrospect, the clear role definition--thatof defining general problem classes and of identifyingthe target 40 percent of the handicapped populationnot being served--was not transferred to the stratis-ticians. A resource agent's perspective on developmentof regional services was not maintained by the stratis-ticians relative to the immediate gratifications of alimited service. To the stratisticians, all actionsand their worth were measured in terms of immediateservice and ofthe program at each stratistician'sschool.
26

In this focus, the stratisticians developed aresentment of data collection, an did not utilizethe center as a resource. A separation in theirfunctional roles relative to the organizations theyserved was made and forced, upon the center. In thisprocess ._the value -of the ,stratistician model couldnot,,lbe ascertained nor did the broader needs state-ment for regional planning\and services evolve. Thecrucial difficulty was the inability to transfer tothe staff the concept of a regional service role andof each individual's responsibility to the region'schildren.
The data collection instruments developed foruse by the stratisticians are included in Appendix A.The instruments were sought so that the center coulduse the stratisticians' diagnostic prescriptive proc-ess as its data base and avoid the imposition ofspecific data collection activities. The materialswere developed, but the use rate and thoroughness oftheir completion were inconsistent. Even withhindsight, it is difficult to clearly establish thespecific causes which created difficulties in thecollection of data.
The conflict between intent'and outcome wasintegral to developing an expanded data base oneducational problems, intervention strategies, andthe unserved handicapped. The process neverfunctioned effectivelyfr-and staff members assignedthis function collected the data as best they could,but the concept of the stratistician as a classroom-based, needs-assessment mechanism was not applied.Data were collected through secondary sources andreported (and is presented in the following disCus,.sion), but the important feature that initiated themodel was lost.
The stratistician evolved into a service deliveryperson with few, if any ties, to the center. Thesoft link and the revised role established Stage Twoof model development, which constituted service in thethird funding year described in a subsequent section.Part of the role transition and the work "overload"of the stratisticians was the effect of the non-discriminability of the noncategorical approach. Allchildren, in effect, become exceptional and the specialneeds of each child must be met. The result is alower level of service to the handicapped child.
27

The-causes of the problems encountered in imple-menting the Stage One model were numerous. They can-not be weighted accurately yet, but can be outlinedonly. Role definition of the center's goals andpurpose was not apparently clear to the stratisticians,so their response was to serving a school, not aregion. The communication between the center's needsassessment and the data collection effort was poorand compounded the problem of an inadequately definedrole. Data collection requires more definitionsthat, in a totally noncategorical approach, appearto be labels. Therefore, part of the stratistician'sresistance to data collection was the inability toestablish the difference between definition of prob-lems and child-centered educational responses.Intertwined with these factors was a problem ofeffective management of a directed program withstated goals and purposes.
Within the context of these general problems,data were collected and tabulations made in January,1972; the results were reviewed in April, and June onadditional data. The data tabulation from mid-Januarylooked at 72 children who represented a populationrequiring extensive intervention. These children didnot represent the total number of contacts (approxi-mately 800 referred children) but represented themore severe educational problems as perceived by theirteachers. The data collection was not as complete asdesired due to the ongoing nature of many inter-'ventions.
The descriptive data indicated that most childrenreferred to the stratisticians were between sevenand eight years old. Figure 2.5 pictorially summa-rizes the frequencies of child contacts by age withstratisticians. Figure 2.6 summarizes the referralfrequency by class size and indicates that referralspredominantly came from classes with 25 to 29 chil-dren. These data should not be strictly interpretedas an indication that this size of class (25 to 29students) generates educational problems, since alarge portion of the classrooms in stratisticianschools contained 25 to 29 students.
Figure 2.7 presents a summary of referral fre-quency by grade level. The most frequent referralswere in the third grade. These data cannot be sim-plistically interpreted. Two trends, however, wereabstracted from the tabulation and verified by the
28
io5

24--
20--
16
g11ti
464 12a11
a
4
5 6 8 9 10 11
Pig. 2.5'
Number of Children' Contacted byStratieticiane by Age (N=72)
29

35
30
25
20
15.4
10
3 a
11.61111.11.
15-1110-I 115-1 ;201 ,25, 30.4 I)401
119 1,14 id 119 i24! 129 :34; ,39 '11 .1 I II SI
hiss Size
Fig. 2.6
Number of Stratistician Referrals by Class Size
3"1
30

5
30 -7-
25
20
15-6-
10
5
IONIMIN=
K 1 2 3 4 5 6
Grade
Fig. 2.7
Number of Stratistician Referrals by Grade Level
31
[I-1sp.
Ed.
stratisticians subjective impressions. One trendevident in Figure 2.7 was that educational problemssurface more frequently as the child progressesthrough school. This was supported by stratis-ticians' observations and impressions. And, thestratisticians also noted that in certain schoolsthe third-grade teachers required more support,which may'have been why more third-grade childrenwere referred. These data reflected two majorunderlying influences.
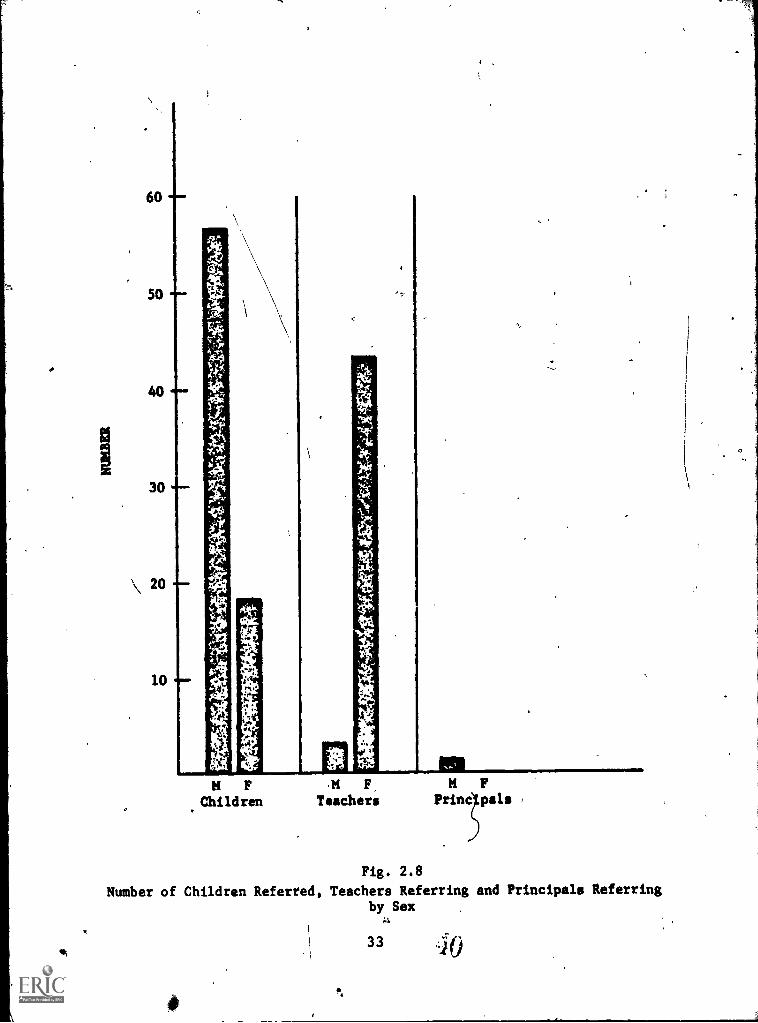
Figure 2.8 graphically depicts the frequency ofreferrals by the sex of the child and of the referringperson. The referrals were primarily made by femaleteachers. This was expected since the school person-nel in the pilot schools were predominately; female.The substantially higher frequency of referrals ofmale children followed the general tftnd.of a higherincidence of handicapping conditions and behavioralproblems of koys for the age range.
The data presented in Figure 2.9 indicate theprimary source of referrals was the teacher who pre-ferred an informal referral process. As defined forpurposes of data recording, the informal referralrepresented a passing or exploratory mention of astudent problem, as opposed to the category where theteacher seeks out the interventionist formally. Thedata in Figure 2.10 indicate that the most'frequentreferrals were generated in educational settingswhere the only services readily available were in theregular class. Substantially fewer referrals weregenerated in settings with supplemental instructionof a resource room or self-contained special class.Although preliminary, these data suggested high needwhere suppott services are not readily available orspecifically programmed.
Data on the specific educational problemsindicated substantial variation on frequency ofoccurrence. This preliminary data indicated priorityareas for attention. These data, categorized by theuse of descriptors defined in the descriptor listwere viewed as undergoing refinement in a continuingfashion. The thesaurus of educational problems wasdeveloped at this time. The thesaurus is presentedas Exhibit A.2 in Appendix A.
The data collected, indicated a very low usage ofmany descriptors. Of the key descriptors used there
32
10
N F
Children
.M F,
Teachers
M FPrinc pals
Fig. 2.8
Number of Children Referred, Teachers Referring and Principals Referringby Sex
33 .40

60-
50-'-
30-
20-
10
0
IMM11.1
r"--1
Informal
Formal
Ei2Existing
Teacher Strat Principal Other
Fig. 2.9
Number of Referrals by Source and Type
34
LA


was some variation between the number of teachers andstratistician referrals for a specific behavior. Thefollowing listing presents key descriptors and thereferral sources:
% of % ofteacher stratistician
referrals referrals
Restless 17 10
Nonattending Behavior 15 35
Disruptive Behavior 33_ 22
Insecure--withdrawn 10 12
Insecure--attention seeking 10 15
Aggressive--acting Out 25 22
Underachieving 33 28
The data suggested some variation did exist inthe teachers and stratisticians perceptions. Themajor differences centered on behaviors which weredefined as problem behaviors but were basically non-descriptive. The stratistician who could sit andobserve the class tended to notice behaviors such asrestlessness and non-attendance more frequently,whereas the teachers responded to disruptive behaviorsmore frequently. The data base was not sufficientlydiscriminating to warrant drwing further hypothesesor implications.
An example of the inference problem is thedifference between the referred children: stratis-ticians identified 28 percent as,not achieving (per-forming below the level expected by the.teacher)while the teachers identified a slightly larger groupof the referred children as not achieving (33 percent).The category of nonachieving seemed quite broad andnecessitated considerable further diagnostic informa-tion to permit effective curriculum planning orreprogramming. This category, however, raised severalinteresting possibilities. seemed useful in termsof the initial description of the broad area of thechild's difficulty. The fact that the child was notachieving certainly served as a cue for the inter-ventionist to look into why the child was below par.
36

This may speak to ineffective curricular programmingfor the child. Secondly, by definition, the child'sperformance was not at a level expected by theteacher. Depending, of course, upon what the /expectation level was, the teacher's goals may aveneeded examination. Of additional interest w thefact that the teacher was referring only 33 rcentof all problem children for not achieving. hiswould imply some 67 percent of all referra s were notviewed as having achievement difficulties Thismight be indicative of the general frequ ncy ofproblems in the class which could perhaps be consideredpsycho-social.
Teachers and stratisticians observation of_
t task orientation. The threereferred chiluren Bred to result in a cluster ofbehaviors related
.
behavioral categories comprising /this cluster were:
1. "Doesn't attempt work" (will not, withoutconside able pressure, attempt an assign-ment) as identified as being a behaviorfor 12 percent of the referred children bystratisticians and teachers.
2. "Doesn't follow.directions" (forgetful ordoes not understand instructions) was abehavior identified for 10 percent of thereferred children (by stratistician) to 18percent (by teacher).
3. "Doesn't complete work" (attempts but doesnot complete the work, without considerablehelp or attention) was identified in 15percent of the referred children (bystratistician) to 17 percent (by teacher).
The first two behavior categories may havesuggested a breakdown in task orientation provided bythe teacher for the child. These two areas mighthave indicated a rather -specific need for inserviceand preservice training. The third behavior category,although somewhat different, seemed related to con-tinuing task orientation. Such an area may suggestthat the contingencies were not arranged by theteacher to promote sufficient ongoing task-orientedbehavior which caused work completion.
Over the period from September, 1971, throughmid-January, 1972, teachers were the primary
37
4
If

implementors of intervention strategies (more than62 percent). The remaining interventions (more than37 percent) were implemented with nearly equalfrequencies by stratisticians, teacher aides, peers,parents, principals, auxiliary school personnel, andcommunity resources. Of these other categories,,auxiliary school personnel was the only implementor,group that stood out (15 percent).
Two types of intervention strategies were usedmost frequently: behavior modification was asuggested strategy in 28 percent of the interventionalternatives; and the use of "one-to-one instructionof a single child by teacher, aide, or, older student"was used in 18 percent of the interventions. Otherintervention strategies occurred with substantiallyless frequency and with the exception of specificcurricula (11 percent), other intervention categorieswere used less than 10 percent of the time. For allalternatives, the stratisticians formulated 40 percentof the interventions, 39 percent of the alternativeswere formulated by a stratistician-teacher team inwhich the stratistician was the initiator. Using theteam approach (stratistician and teacher), teacherswere responsible for initiating 11 percent of thestrategies. Interventions were predominantlyimplemented in the classroom (72 percent).
In mid-April, 1972, a summary data tabulationwas repeated for 121 children who required extensivehelp. The major chatItges in,the descriptive data onthe referred childre indicated that most referralswere between 6 and 9 ars old. The data also-indicated_a heavy clOs er of referrals from grades 1,2, and 3. These isoiat data mean little except topinpoint the age group. Previous data suggested thatproblems might be referred more often as the childprogressed through the first three grades. Anotherhypothesis was that at different times, differenttrends emerged in_rbsponse to system needs; i.e.,testing requests. The data tabulation did notsupport either hypothesis.
In reviewing the data on frequency of referral(i.e., formal, informal, records, existing problems)the tabulation maintained the essentially same patternas the smaller sample. Referrals were predominantlyinformal teacher contacts, with less than 8 percentof the stratistician referrals involving problemsthat were on the child's records or that were
38

previously identified in some other way. The teacher,therefore, remained the primary referral source forchildren (more than 81 percent).
The data tabulations from the larger sample(N-121, April) on the specific educational problemsemphasized the cluster of behaviors, including."rest-lessness," "not attending," and "disruptive." Theinitial interpretation of this cluster was stronglysupported by these data (along with high frequenciesof aggressive. behavior as a problem, and the highly/frequent use of behavior modification techniques asinterventions). Based on this work, it was suggestedthat all product-oriented thrusts of the projectshould be related to the needs assessment and to thedevelopment of classroom management skills andpackages for preservice and inservice training.The resource-support system was similarly engaged inidentifying and in cataloging resources in classroommanagement.
One teacher-related category which was nothighly frequent in the January tabulation increasedsubstantially, in the April data--the category of"distractable." This increase was accompanied by asimilar increase in the frequency with which "shortattention span" was noted as a problem. Due to thepreliminary nature of the data, inferences could notbe drawn. Within these limitations the data didserve as somewhat of a qualitative crosscheck onobservations because "short attention span" was partof the definition in the "distractable" category.
"Lack of motivation" also was noted in thesecond tabulation. As with the "distractable" and"short attention span" behaviors, "lack of motivation"was beginning to appear as a noteworthy problem dueto the change in relation to previous data. Evensuch fragmentary data, however, were considered toprovide some guidance for product-oriented activities.For example, with motivation and aggression, informa-tion searches were initiated. It was planned thatif these data' -were supported by further data accumula-tion, these preliminary searches would most probablybe recycled into other product areas. If not, theywere to become a part of the resource support systemand perhaps a bibliography.
The problem category of "not achieving toexpectancy" maintained the pattern set by early data
39lei

as a high frequency area. Some rather. distinctchanges in frequency occurred in the categories of"doesn't understand task," "doesn't follow directions.,"and "auditory perception." These categories mightbe viewed as a cluster of behaviors which are related.Subjective impressions had hinted at the area ofauditory discrimination as perhaps influencing theseyeas. It is worth noting that auditory receptionad not been indicated as a frequent problem. Thisarea seemed to warrant closer scrutiny because boththe frequency of problems which might be generatedby auditory discrimination difficulties and becauseof the lack of clear implications from the data athand. A specific information search and alliedresearch project were initiated in response to thesefield data..
Some change was evident in the April data oninterventions. Behavior modification and the use ofa tutor were still by far the most frequent inter-vention approaches, but this trend was even moreexaggerated. The resource aide was used with notablygreater frequency, as was task analysis and modalitychange. Implications from these data, though frag-mentary, similarly began to suggest areas whereteachers needed either help or a skill improvement.
During the 1971-72 school year the stratisticianswere involved in extensive interventions with 159students, an increase of 38 over the mid-April report.The 159 students represented approximately one fourthof the total served directly, by the stratisticians.
The largest number of children contacted remainedin the 6 through 9. years age range, in grades 1, 2 and3. Most referrals were for children in the regularclassrooms, with less than 4 percent of the totalreferral list requiring extensive intervention inspecial education classes.
At least two explanations were available: one,the stratisticians were placed in schools that had nospecial education facilities. This, in fact, wastrue in one case, but the other five stratisticianswere in schools with other special education resources.A more likely explanation was that the special educa-tion teachers could serve their handicapped childrenwith minimal help from the stratisticians, thus thereferrals did not show up in the tabulations of exten-sive interventions by the stratisticians.
40

Approximately two-thirds of the children referredand accepted for extensive interventions were male butonly 20 percent of the referring teachers were males.This was descriptive data with no inferences suggested.
The referrals usually came from teachers (85percent) as would be expected. In addition, more thanhalf of the referrals were informal ones, i.e. nowritten request through established channels. Approx-imately one-third of the referrals were processed ina formal, written manner, with the other 15 percentcoming from existing case loads or records. When achild with behavior problems was referred, most prob-lem descriptions were labeled "disruptive," "notattending," "distractable," "aggressive," and "rest-less." Although most problems were easily recognizable,there was a substantial number of children who hadwithdrawal and isolation problems.
Theproblemslems, ce,academic"doesn'ttions."and motospecifiprobabland thatwas more
largest single complaint for academicwas under-achievement. Other academic prob-ered around a general disorganization ofskills, i.e., "doesn't understand tasks,"complete work," and "doesn't follow direc-In addition, auditory perception problemscoordination received some notice. Many
problems were indicated, but were infrequentbecause of the specificity of the categoryone of the larger, more general categoriesappropriate.
The usually suggested interventions were tutoringand behavior modification procedures. Parent con-ferences and recommending an aide were also suggestedin many cases.
Stratisticians scored the success of the inter-vention on the child's performance. The rating wason a 6 point scale, ranging from little change (ratingof 1) to solution (rating of 6). Approximately 10percent of the interventions produced little change,while 15 percent were rated as 2 and 3. The largestgroup received a 4 (33 percent), while 2 percentreceived a rating of 5 and 5 percent were judgedeffective since the problem was solved. Follow-upplans were readied to gather data on these childrenover a two-to-five year period.
The data collection process that was initiatedand produced the above data did begin to follow the
41

plan of implementation of the assessment of classroom\needs. A general summary of the data was not developed,nor\was the initial work refined or expanded into anactive guidance element for center activities. Thestrat\tician model slowly evolved into a servicemodel nd the data collected became more removed fromthe original purpose as will be discussed in the nextsection.
Identification Assessment
The second objective of the stratistician modelwas to help locate the 40 percent unserved handicappedchildren. It was intended to undertake this indenti-fication as part of the ongoing data collection effortof the stratisticians. This procedure never workedout on an ongoing basis, hence a study was designedto collect data. The study complemented an assessmenteffort by the Utah State Board of Education to identifyall handicapped children in the state's school system.
The USBE assessment effort (Project ID) utilizedthe classroom teacher as the initial screening agentin the identification processes by reporting thenames of all students who, according to teacher per-ceptions, were handicapped. A pilot study of thisidentification technique in May, 1971, in the SaltLake City School District, indicated that 80 percentof referred students were, in fact, handicapped asdefined by placement standards of the USBE and asdetermined by the results of a test battery adminis-tered by a competent school psychologist.
This identification program was expanded to afull-scale identification effort during the schoolyear 1971-72, with all districts participating (Nelson,1971). The assessment instruments were improved fromthe initial effort, but the same procedure was used.From the referred students a random selection wasagain made and identification tests were administered.The correct identification of handicapped childrenby teachers increased to 90 percent using the improvedinstruments.
Simultaneous ly with the Project Identificationstudy of 1971-72, the RMRRC began the unrelateddemonstration program that was designed to deliverservices to handicapped children in regular class-rooms. The service delivery system of the RMRRC
42

placed a statistician in a reg ar school on a full-time basis. The stratistician as expected to provideassistance and advice in dealing with "problem" chil-dren through teacher focused clas room intervention.Five stratisticians were placed i five elementaryschools during 1971-72. It was ass ed by the RMRRCthat those children referred to the tratistician bya teacher's request would be handicap d. It washypothesized that a comparison of-stat ProjectIdentification roles and the roles of students refer-red to stratisticians would be identical
Contrary to this hypothesis, of 320 studentsserved by stratisticians, only 162 were lit ed onProject Identification rolls or were already in otherspecial education programs. Of students sery d bythe stratisticians,' 158 were not listed as han 1-capped on any state roll. By implication, theunidentified 158 students referred to the strat s-tician were. not perceived by the classroom teacheras.handicapped. It was then asked why these 158students were referred to the stratisticians. In anattempt to provide the answer, a study was undertaken,describing the students referred to stratisticiansbut not included in Utah's Project Identificationnor on special education program rolls.
The 158 unidentified students were distributedin four schools. A sample was selected consistingof all 19 students in one school; 25 percent of thepopulation of the remaining three schools (17 addi-tional students) was randomly chosen for psychologicalevaluation. The 36 student sample represented 22.8percent of the unidentified population, and includedchildren with a'chronological-age (CA) range frOmfive years, ten months to twelve years, six months ingrades from K to 6. A breakdown of number of studentsby age'and by grade placement is presented in Table2.1.
Several tests--Weschler Intelligence Scale forChildren (WISC), Bender-Gestalt, and Draw-a-Person--were administered to students in the sample. Thistest battery was used by the USBE for identifyingyoungsters in Project ID and was adopted by the RMRRCto make comparable evaluations. The Bender-Gestaltwas scored by the Koppitz method (Koppitz, 1963).The Draw-a-Person was scored by both Goodenough-Harris and Koppitz methods (Koppitz, 1968). Both theBender-Gestalt and Draw-a-Person yielded scores for
434
50

Table 2.1 Age and Grade Placement of Students
Age
5-6 to 5-11 6-0 to 6-11 7-0 to 7-11 8-0 to 8-11
N 1 5 4 , 5
Age
9-0 to 9-11 10-0 to 10-11 11-0 to 11-11 12-0 to 12-6
N 5 6 , 8 2
Grade
K 1 2 3 4 5 6
N 2 5 8 3 6 8 4
Vv.
5 t
44

intellectual maturity, brain damage, and emotionaldifficulty indicators.
A competent psychometrist in a single sittingadministered the test battery in a minimal distractionroom. The tests were given An the following order:WISC, Bender-Gestalt, and Draw-a-Person. Standardizedtest presentations were followed.
Of the thirty-six evaluated students, twenty-four (66.6 percent) were identified as learningdisabled*, eight (22.2 percent) as emotionally dis-turbed, two (5.5 percent) as mentally retarded, andthree (8.3 percent) as nonhandicapped. One childwas identified as LD and ED because of the severityof both problems; therefore, for these data, N=37 andthe total percentage exceeds 100 percent. Within theLD group, 25 percent of the students displayed abovenormal scores on the WISC greater than or equal to110. Another 45.8 percent of these students exhibitedIQs within normal limits, with a full-scale score onthe wisp between 90 and 110. Of those childrenidentified as learning diabled, 29.1 percent displayedbelow normal intelligence (full-scale score below 90).Of this subject population, 70.8 percent were shownto have normal or above normal intelligence.
The.prOtocols of the LD students were interesting.Of the subjectp,.33.3 perbent had, at least a 15 pointdifference between the two scores, with the verbalscore being the lOwer. _Only 8.3 percent,shOwed a per-formance score loWer.by 15 or,more points. Less thana 15 point difference in the two scales was exhibitedby 58.3 percent. The higher fierformance scale inindividuals with an exceptional number of errors onthe Bender-Gestalt was'of special (but unresolved)-interest-as it represented a paradox, and invitesspeculation about this population.
-The ED population (N=8) also was extremely
interesting. Three youngsters (37.5 percent) were'identified as ED with LD characteristics. Two of.these youngsters, had superior intelligence (IQ-123and 133). Further, the child'Who was identified asboth ED and LD produced an intelligence measure of 133.
*The USBE definitions of handicapping conditionswere used.
45

Within the ED population, without LD characteristics,a total of five students yielded only one belowaverage IQ (86) and one aVerage IQ (93). All otherswere above average.
The referral of nonhandicapped children wasdiscussed with the appropriate stratisticians to tryto determine the cause of the referral. Explanationsranged from a teacher-student personality conflict to"other children in the family have been problems,"and "the teacher thought the child should be referredas a cautionary move." The stratisticians' subjectiveevaluation of these referrals indicated an inappro-priate teacher perception of the student.
The LD and ED referrals of this study were notso easily explained. 0.Nor was it immediately obviouswhy these students were not perceived as handicappedby their teachers. The stratisticians were, again,interviewed for subjective impressions about thesestudents and the reasons for their referrals. Thestratisticians were questioned on student academicachievement, particularly with those students whosefull-scale IQ scores of 115 or more were consideredLD or ED with LD characteristics.
Stratisticians' statements about the referralconditions included the following comments: "He wasdaydreaming," "She (the teacher) doesn't know how tomanage that child," "He was creating a behaviorproblem for the teacher. We moved him to Mrs.and we've had no More trouble." "That little fen6W---has a hard time controlling himself." Academicachievement was described in such terms as: "He's alittle slow in reading, but he's making it," "Atgrade level, at least," the students with above normalintelligence were all described as achieving at gradelevel. Neither stratistician nor teacher perceivedthese students as having a leatning disability althoughthe stratisticians, after viewing test protocols, con-curred with the psychometrist's evaluation.
The group of school children displaying learningdisabilities has been the subject of much discussionand research. Generally, the term "learning disabled"has been applied to a child who displays an IQ oneither the verbal scale or the performance scale ofthe WISC from 90 to 110, and a score 15 or more pointsbelow the higheracore on the remaining scale.
46

The typical LD child is retarded at least one-grade level in reading or arithmetic (Reed, 1967;Reed, 1968; Blank & Bridger, 1964; Brich & Belmont,1964; Belmont & Birch, 1966; Sabatino & Hayden, 1970;Silver & Hagin, 1966). For those children displayingreading retardation, the typical pattern on the WISChas been a lowered verbal scale as compared to per-formance scale (Reed, 1968; Blank & Bridger, 1964).
\
The group of normal and above-normal intelligence,LD and ED:designated students, who were referred tothe stratisticians, displayed definite indicators oflearning problems and emotional disturbances. Eventhough those students had been achieving academicallyat or above grade level does not alter the fact thatthey may not be achieving their potential. Althoughthe very bright child with learning disabilities maybeable to cope with classroom activities, a highintelligence level may mask the child's disabilityfrom the teacher and the special education expert,preventing remediation. Faced with the gap betweentheir potential and real achievement, these brightyoungsters may retreat with defense mechanisms andincreased emotional maladjustment. Coping may beachieved at the expense of emotional adjustment.
\\\1alertTth: :gccillar:VlcIZIortill:LnItri:::11osicirglicul-ies in teacher referral of "handicapped" children.eachers participating in Project ID were accurate
.1
in their reporting of children who they consideredwere handicapped. A 90 percent accuracy indicatedthat few referred students were, in fact, nonhandi-capped. However, the results of the RMRRC study ofstatistician referrals suggested that the lists ofhandicapped students did not include all handicappedstudents. Although in this study the students werereferred to the stratisticians as children with aproblem, it is possible that in the absence of astratistician-type service, no special planning orprogramming would have been implemented. It wasrecommended that future identification projects shouldaccommodate to this problem by assuming that somehandicapped students will not be referred,.or bybroadening the screening instructions to include allpotentially handicapped children. The second alter,-native would lower the level of accuracy of identifi-cation, but should result in delivery of Services tomore children.
47
While the number of subjects in the study was,admittedly, too small to allow for more than specula-tion, it appears that LD students and ED studentswith normal or above normal intelligence (as measuredon the WISC) were achieving at or above grade level,and were not perceived as ,handicapped ..;cudentsbecause of adequate academic achievement (as indicatedby grade level performance). The child's copingattempts may have resulted in emotional disturbancethat lowered his psycho-social adjustment level aswell as his academie: level.
Administrative Evaluationof the Stratistician
To gain a perspective in the adm. strators'r-..:tion to the stratisticians, a questionnaire wasadministered to principals of schools in which stratis-ticians were placed. The responses are tabulated bythe questions and the numbers relate to a specific
2
principal; i.e., all numbers 1 were from the samerrinci al.
In what ways has the work of the stratistician beenhelpful?
1. The stratistician has worked with teach\rson problems such as positive reinforceme t,voice and tonal qualities,-curriculumadjustment for specific children, behavioralmodifi6ation of specific children, plusserved as liaison between resource personneland classroom teachers and backup and suppottfor the social worker.
2. The stratistician has improved teacherattitude toward students, upgraded teacherdiscipline methods, and mproved remedialactivities.
3. The stratistician has assisted teachers inidentifying, diagnosing, and planning
,strategies for children with learningdisabilitic.d, and has supplied support forteachers with innovative classroom practices.
4. The stratistician has helped all.
5. The stratistician has .solved student problems,
a;48

such as helping the student see himself asa productive citizen. He has given teachersa valuable resource that is readily acces-sible, and has provided a basic security asa nonjudgmental person to whom the teacherscan talk.
What are the limitations?
tl. Each staff member ha$ been different and theproblem has been defining'a specific role.What do the RMRRC people expect of thestratistician? What has been the role? Afuture limitation is that the stratisticiansneed to be a special kind of person. Thereshould' have been planned activities away fromschool in the summer.
2. Specific definitions of a role will limitthe effectiveness of a competent stratis-tician.
3. Time. There have not been enough hours todo everything that is necessary. I fear wehave been working our stratistician todeath.
4. The stratistician has been limited by thetemporary nature of our half-day schoolsessions; by putting ideas into practiceand by working through the resistance ofsome teachers.
S. The acceptance by most teachers has made itdifficult for the stratistician to meetrequests and expectations. It is surprisingthe number of conferences that have beenvoluntarily requested to discuss personalproblems of the school staff.
What recommendations do you have?
1. The stratistician should be continued in theschool for more than just this year.
2. Inservice for teachers should be focused onlearning process, rather than curriculum.
3. The role of the stratistician should be leftup to what a "good" one sees as needed in thesituation.
49

4. The same number of stratisticians in the sameschools should be continued.
5. The program should be kept going.
In what ways have other RMRRC staff members beenhelpful?
1. Thek-haye been helpful in writing programs,and helping teams.
2. I don't know specifically. However, I doknow they are available.
3. They have been helpful to our stratistidianby supplying information and/or material.
4. They have provided educational benefits to me.
5. The exchange of ideas and experiences hasgiven a continous flow of new ideas andsupport for the meeting and handling ofsituations within our school. Visits to theschool by members of the RMRRC have beenenlightening and educational. Their observa-tions and comments have been both accurateand helpful. More visits would be welcomed.
Are you aware of what the RMRRC staff can do?
1. I realize that hAlp can be obtained uponrequest.
2. Haphazardly.
3. Yes.
4. Yes and no.
5. (No response.) ,
What recommendations do you have?
1. They should help plan academic units forchildren with learning problems.
2. I would like the names and specialities ofeach staff member with role descriptions.
3. The principals should be tolc of the RMRRC
50

staff's availability and of the areas inwhich they can help.
4. Perhaps a better understanding of the RMRRCprogram is needed by district specialists.I suppose we have not been using staffpeople to the extent we could have; possiblythere is fear on our p;:rt of bypassingdistrict psychologists, etc.
Are the needs of handicapped children being met?
1. Yes.
2. No, but some progress is being made.
3. In our situation we have special educationclasses which are immediately available forthe noticeably handicapped. However, morecan be done with borderline cases.
4. Better than ever. . We are attempting toserve everyone, but there are still someobvious needs that are not being met.
5. More so than I have ever seen before.Teachers are more aware of helping thesestudents and there is more willingness totreat these students within the classroom.
What are the limitations?
1. Time and resources are limitations. Alsoteachers are not skilled enough to handleproblems.
2. None.
3. The lack of aides and specialized materialsare limitations.
4. (No response.)
5. (No response.)
What recommendations do you have?
1. None
2. Because of the personality of the present
51
stratistician, I have seen very few limita-tions, but I do foresee a need for adefinitive role.
3. I would recommend inservice for teachers;fbr example, the Norma Randolph SelfEnhancing Education workshop that was givento RMRRC staff members.
4. (No response.)
5. (No response.)
The responses were generally favorable to theuse of the stratistician in the school, but aprecise definition of the role was requested. Thepoor role definition level led to an overreliance byteachers on the stratistician, causing an overloadof the stratisticians. The linkage to the RMRRC andits support was apparently not clear to administra-tors, and better inservice training programs wererequested. The feedback loop to development ofresource programs obviously was not working effec-tively.
In addition to this data collected from thequestionnaire, the RMRRC received requests for par-ticipation in the stratistician program from severaldistricts who were not involved. These requestsreinforced the positive beliefs held by RMRRC staffmembers of the value of the stratistician model. How-ever, it was felt that the pilot program must be keptto a size which could be easily observed, measured,evaluated and changed, if change were indicated. Also,clear-cut role definitions for the stratisticianshad to evolve throughout the year, and would involveintense and immediate'comMunication between officestaff members and field workers. Frustration arosefrom the immediate needs conveyed by those requestingparticipation and the expansion limitations. Carefulpublic relations had to beimaintained to communicatethe RMRRC goals of supporting and facilitatingeducational improvement, while limiting the pilotproject to a workable level.
The ambiguity of the evolving stratistician role,while not a serious problem, remained an ongoingchallenge; the needs for structure and role definitionwere felt, but could not be specified. Those personschosen for stratisticians were open and nonjudgmental,
i.
52

traits which seemed to include tolerance for ambiguity.After the end of the second year, the actual needs ofteachers and of handicapped children dictated thestratistician role, while evaluators tried to maintaindata collection. This stratistician role, if it provedsuccessful, should be more easily filled in the future,once the qualities, behaviors, and skills needed weremore clearly defined.
53

Chapter 3
STRATISTICIAN STAGE TWO, 1972-1973
At the end of the first year of placement ofstratisticians, twu of the original six were reassignedto positions in the RMRRC office and a third left thestate to pursue a doctorate. In addition to thosethree openings, two more were created when the RMRRCdecided to try the model in a school with a heavyminority population and in two rural schools in arural district to be served by one stratistician. Theselection criteria for stratisticians again requireda strong background in special education and/or educa-tional psychology and the defined personal attributes.Because of the one year's experience with stratisticians,the RMRRC provided better job descriptions for theapplicants and structured interviews on the problemsthe stratisticians would face. Again, an attempt wasmade to get the best possible personnel available toassure the success in the stratistician's variety ofroles.
Those stratisticians who had just completed ayear of service briefed newly hired personnel onactivities and problems. Informally the "new" stratis-ticians assessed their own, capabilities either byworking on their own, or with another staff member,and they individually improved their skills. Themajor group activities focused in two areas: 1) thedevelopment of an instrument that would enable a class-room observer to record events of educational signifi-cance in sequence, and 2) the simulations of possibleclassroom incidents.
The observation instrument grew out of the needfor gathering classroom information. It was developedby using stratisticians' individual ideas, reviewingthe literature for models and theories, and combiningthe creative resources of these highly skilled people.It was named the "Systematic Observation of Behavior"(affectionately called the S.O.B.).
Derivation of the items in the observation codewas not a product of model theory nor a deductive

approach to climate analysis of the classroom. Rather,the development was based upon the following parameters,which have contributed to the code structure in itscurrent form:
A. Empirical Information: "Units" of behaviorwere generated from observed and itemizeddata, descriptive of actual responses oractivities within the regular classroom.Behaviors of both student and teacher wereaccountable, and subjective or interpretedinformation was not recorded or considered.
B. Frequency of Occurence: Although an ineffi-cient number of specific items were producedby this method, the terminal items were thosewhich commonly remain stable because of thenumber of times they occurred in a sampledobservation continuum. Those units occurringwith less than 5 percent frequency were dis-carded. Retained items resulted in thefinal 10 categories and subsumed sub-categories.
The rationale for the S.O.B. development was pre-dicated on the desire for a utilitarian, yet non-categorical instrument for informal, observation. Per-tinent to the development of theinstrument was adesire to construct an instrument that removed thestigma.of categorization in diagnosis. With this tool,the needs of a child could be assessed on an individualbasis without placing him in a traditional mold.
As previously stated, the essential elements ofinformal diagnosis were compiled and integrated throughan empirical method in developing this tool. Becausethe instrument was developed by direct classroomobservations, the yielded information would be highlyrelevant to the classroom teacher. For the teacher aswell as the observer, the instrument would provide afactual schema of the child in his mainstream environ-ment. Consequently, the S.O.B. was seen as providinga common communication base between the teacher andthe observer in talking about children; it would allowfor ready interpretation prior to developing inter-ventions for desired outcome skills.
Again because its codes were meaningful to ateacher, the instrument would be learned readily. Theinformation yielded by this instrument could proveuseful in reinforcing and expanding teacher and/or

observer skills. It promised to become a highly usefulinservice tool for teacher self-assessment or forrecording behavior change.
The code recorded various types of student-teacherinteractions. The instrument was structured so it hadmulti-dimensional application. Interpretations wereyielded on any of several preselected dimensions. Thisadaptable informal instrument promised to provide short-cuts in evaluating academics, behaviors, and learningmodes on specific teacher-student interactions. Encour-aging the teacher or specialist to informally assessbehaviors of children and develop appropriate inter-ventions may have reduced the numbers of referrals sentto psychologists for formal assessment.
As field studies progressed, the instrument wasvisualized as encouraging further exploration into theutilization of informal diagnostic approaches.
Sample items and recording code are listed:
A AcceptingAA Assumes AuthorityAK AcknowledgeAK- Teacher ignoresAMP AmplifyingAP AppropriateAR Accepting with reinforcementARG Arguing, Disagreeing
BB BlackboardBK BookBOT Back on taskBO Blaming otherBS Blaming self
CA Calling for attentionCAU CautionCC Call for confirmationCHB Chair behaviorCL Clues
After the S.O.B. instrument wasAeveloped duringthe training period of the second group of stratis-ti.ians, the evaluation and research group analyzed it.A pilot reliability study was initiated, using tworaters. The preliminary results indicated a low-interrater reliability, and further reliability checkswere discontinued as the regional effort had been
57 ".

initiated and core staff members turned their attentionto working with three new states. This outcome of theS.O.B. instrument is, a strong data point stressing thevalue of planning and coordination in the operation ofa complex center.
The Stage Two activity generally reflected adecrease in data collection for analysis of the stratis-tician as a service delivery-model. Concurrently, theneeds assessment function and the use of the RMRRC asa resource declined. The stratistician became more ofa direct service agent within regular schools in theregion.
Stratisticians were placed in the same fiveschools and one multi-district region that were usedin the preceeding year. In addition two new placementswere made; on stratistician was placed in a school witha high minority population, and the other in a ruralsetting with the stratistician serving two schools.New people replaced the two stratisticians who weregiven other assignments. The transition from a personwho "pioneered" the model in a school to the "stranger"who takes their place was studied. The arrangementwith the multi-county service region was maintained,but a new person in the service unit replaced theoriginal stratistician who left to pursue a doctorate.The geographic locations of the placements are presentedin Figure 3.1.
Essentially the same subjective results werereported by the RMRRC staff as after the first year.The districts and schools were enthusiastic about theservice. A large number of students benefited directlyand a large number of teachers received inservicetraining for skill Improvement. This second year'sexperience reinforced the previous year's informationthat the necessary skills fell in the categories ofdiagnosis, prescription, knowledge of programs, evalua-tion and human interaction skills. It also reinforcedthe notion that there was a large number of mildlyhandicapped students in regular education classroomswho needed special education and the stratistician wasa cost-effective way of delivering services. Thepreceding overview of the results of the servicesprovided in 1972-1973 were based on subjective judgmentsby RMRRC staff members and district administrators andprincipals of stratistician schools.
The difficulty of "serving two masters" still
58

$od. Vita.
l'OOLt.E
"t"
afts4.*
CALM. 1cten
MOO
\ co
AN4oS
SALT tawtE
Olmift
.140410
AA4TH,tiNAIAMti
AunIwor,.
Pf144 Cal
UTAH SCO.001.DISTRICTS
(Oorria LINES smart oisfoler1wimp. cow, sowawfsi
%vat WMattA
...... ;7..INIttitwat,
tiESOott.tati
WedIAN
kurItAt CARSON , .
,50..111Snoorre
SoNs41 c)rfoRk
E4IER
t,11Poi OIL
...404;%ne0-6.4
CIAllftt1.1)
ANL
Saw3U*114
Fig. 3.1
Location of Stratisticians, 1972-73
59

remained a complaint of stratisticians although thetime the stratisticians spent at the RMRRC was reducedto every other Friday. The major problem persisted--that of gathering data to objectively evaluate tothe model and to also provide service. The provisionof service continued to be the key factor in thestratistician's role.
The-provision of service between the two schoolsin a rural school district by a single stratisticiandid work, but needed adjustments. Ideally an ,assignedperson in each school would have been helpful so hecould carry out the responsibility of maintaining theprograms initiated by the stratistician when thestratistician was in the other school. It also wouldhave been helpful if both schools allocated the timebased on the needs of students. The continuedexperience with the multi-county service unit servedby a single stratistician again demonstrated thatsome service is probably better than no service, butit was unrealistic to expect impact from someone whois serving over 50 schools in a large geographic area.
Generally, after two successful years with the .
model, the dilemma still existed as to whether or notthe success was due to the design of the model or tothe uniqueness of the individual stratisticians.
Some data on the services provided by the stratis-ticians were collected using the data form shown inFigure 3.2. The stratisticians provided individualeducational services to 370 elementary school-agedchildren. In addition, another 200 children wereserved directly by the stratisticians in group situa-tions. This made a total of 570 children who were seendirectly by stratisticians. Of this total, approxi-mately 100 children were members of minority groups(approximately 10 were Black and 90 had Spanish sur-names).
The children served directly were typically chil-dren with specific academic or behavioral problems,fOr whom programs were designed and implemented in theclassrooms or through direct work with the stratistician.The severity of the handicaps varied from mild educa-tional problems to rather complicated educational,emotional, or sensory difficulties. Based on the opera-tional definition of severly handicapped as thosechildren typically not served in public school programs,the stratisticians generally served less severely
60
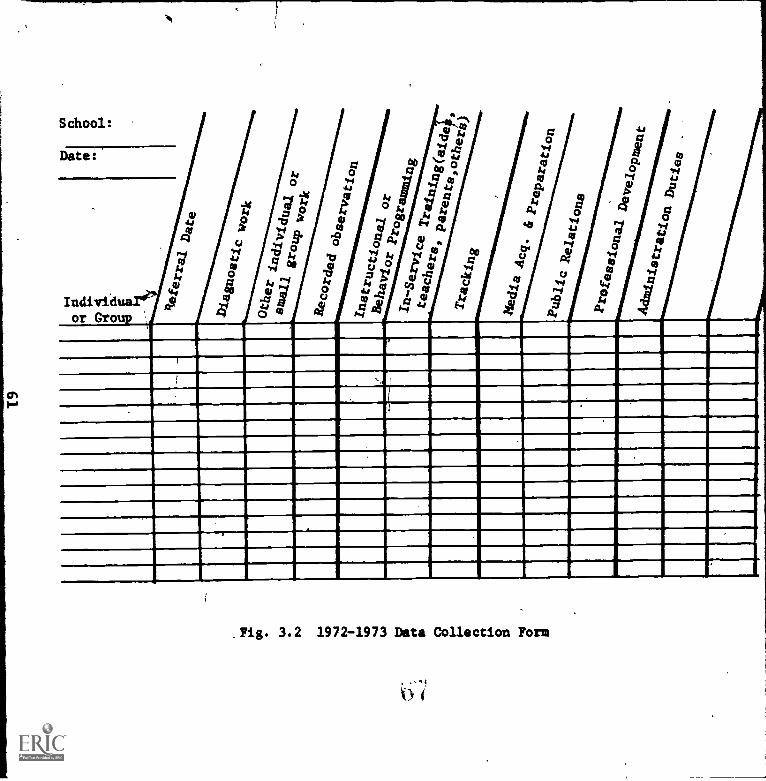
.
.
.
c
I
..
.
o 1111111111111111
1111111111111111
1111111111111111111
1111111111111111
1111111111111111
I 11111111111111
111111111111MM
n111111111111111111111M
111111
I III 11 1111111111111111111111
IIIIIIIIIIIIIIII111111111111111111

involved children in all categories.
The services were provided by eight stratisticiansworking in roughly three different situations. Asdefined earlier, six stratisticians were assigned toone school each'and functioned totally within thatschool. One stratistician split his time between twoschools in a rural district incentral Utah. Theeighth stratistician was assigned to a six-county (six-district) region in southwestern Utah. Theoretically,this regional stratistician had responsibility for 52schools in the six districts. In each differentsituation students were referred directly to thestratisticians by the teachers, principals or otherschool personnel. The stratisticians typically reviewedschool records, obserVed the child in various situations,administered various standardized ana criterion refer-enced instruments, shared the results with the interestedpersons (teacher, principal, parents) and participatedas a member of the team that planned and implemented ,the program designed to assist the handicapped child.The first priority was to try to implement the programin the child's regular classroom with the teachermanaging the program, rather than the stratisticianproviding the child individual assistance external tothe child's regular education setting.
It was estimated that approximately 1,500 handi-capped children, representing a cross7section ofcategorical types, received indirect Services from theRMRRC during the 1972-73 school year. These figureswere obtained by taking 16 percent of the number ofchildren in schools served by the stratisticians. Thisestimate was based on the USBE's estimate that 16 per-cefit of the school-aged population has edacationalhandicaps. Further, the stratistician provided indirectservice through inservice training and program planningwith practically every teacher in the participatingschools plus assistance to parents and other schooldistrict personnel, such(as school psychologists, socialworkers, and nurses.
Direct referrals to the stratistician were thebasis for service to almost al 'of the 570 childrenserved directly. The overwhel ng majority of referralscame from teachers. Some refer als, however, Came fromprincipals or parents. The sou ces of referralsundoubtedly were a function of the way stratisticiansworked within a school and their relationships with thefaculties. Additional formal diagnosis of 36 childrenwag provided in stratigtician schools by center staff.
62

Seventeen children.were referred to the center fr mschools without a stratiskician. Each child wasvisited in his school environment, diagnosed and/oprograms develOped and follow-up provided by centesteff. Eligibility for,those services was based oneed and because no other existing personnel or ag pcieswere available.
Parent services were extended primarily to tho;ewhose children were in the participating stratisticianschools. Approximately 150 parents were provideddirect service by the stratisticians. ',lost contacts
were individUal, concentrating on the bents' particularchildren,.. but some assistance was given to small groupsof parents meeting on a regular basis.
The referral for entry into the stratisticianservice program was represeh'ced by the following generaloutline.
I. Classroom PerformancE! (initial teacherreferral):
A. Description of performance on school tasks.
B. Descriptions of curriculum and/or method/materials being used with the child.
Response:
--Interpretation of information
--Recommendations based on information
1. Make change within classroomcurriculum or procedure, andtherefore no need for furtherreferral;
2. Indicated further diagnosis(what and where).
II. Informal Diagnosis:
A. Description of informal testing done andperformance noted:
Response:
--Interpretation of the findings fromdiagnosis.
63

1. Assign priorities to thedifficulties found.
--Recommendations:
1. Specific remedial procedureand/or
2. Formal testing (if so, whichtypes of tests are indicated).
Note: Depending on recommendation, the orderof III and IV may be reversed.
1114 Remediation--Stage one:
A. A concise statement of techniques andmaterials used and results. This state-ment would be made in terms of short-rangeand long-range remedial goals.
B. Statement of ry change during this period.
Response:
--Interpretation of the methodsemployed (that is, why certaintechnique or material was used),and the results achievd.
--Recommendations:
1. Continue remed ation on sameproblem with s e end goal.
2. Shift remediaiion to differentproblem with/same (or different)end goal.
3. Do formal testingif so, whattests and for what information?
4. End remedial procedures.
IV. Formal Diagnosis:
A. Presentation Of test results, data, exam-iner, etc. in tabular form.
Response:
/0
64
1

--Interpretation (will follow each ofthe formal tests given) of testresults,
1. Confirming information withother testa or data.
2. Indicating specific remedialprocedures.
--Recommendation (may come at end ofentire section on formal diagnosis)
1. Indicate specific remedialsuggestions.
V. Remediation--Stage, Two:
A. Same as remediation Stage One.
Note: From this point the format would vary,alternating between additional stagesof remediation and posttesting resultsand procedures.
VI. Prognosis:
VII. Background Information:
A. A concise statement of such factors asfamily, environmental, school and medicalhistory, etc.
--Interpretation
1. Which of the above factors areessential for the teacher toknow in order to work effec-tively with this child's learn-ing problem?
2. What diagnostic-remedialprocedures and/or interpreta-tions would you have changedhad you been cognizant of allof these factors?
3. Has your prognosis changed asas result of this information?
65rte'

During both Stage One and Stage Two, the individstratisticians evolved service patterns to meet theneeds in the individual schools. Some examples ofactivities initiated by the stratisticians includeregularly scheduled meetings for parents of handicappedchildren, an after-school Spanish club for Chica ochildren, and active participation in a communi y basedorganization dedicated to improving all educat onal
services.
An example of another stratistician-in4iatedservice comprises Appendix B: A Cross-Peer Tutor Pro-gram. This program was established in response to theschool district's efforts to move most handicapped chil-dren into the mainstream. The teachers felt unprepared,and the tutor program helped in easing/the increaseddifferentiated class load for the teachers.
The tutorial program accomplished more than its
goals. Forty-four tutors were placed in classrooms,and each worked with one to ten children. Every clasfrom kindergarten to fourth grade, includi g,special education class, had a cross r
than 100 children were served directly. Advancement ofsome kind was reported for nearly every child.
Of the beginning tutors, 33 were still tutoringon the last day of school. Six had moved, two droppedout voluntarily and three were removed for not abidingby the contract agreement. The remaining 33 tutorshad favorable reports from their teachers and parents.They became class leaders, were more organized, moreresponsible and had high class performance. A highschool tutorial program was established based on thesame format. The fourth, fifth and,sixth grades wereserved by the older tutors. It, too', was reported asa success by the school and the high school.
Primarily, the program won acceptance for themainstreaming of handicapped students. Tutors had animportant status in the school and the job was soughtby other students. Teachers felt they had beenrelieved and helped and were willing to open theirclass doors for more assistance. On "Special PeopleDay" all the tutors were honored by the entire student-body. Twelve tutors received special awards as themost significant contributors to the school.
The analysis of the 1972-1973 program by the RMRRCstaff indicated that if the stratistician role were to
66

be validated as a service model, a population ofspecial educators selected by and part of the publicschool system would have to be identified and utilizedin a stratistician role for field verification. Thisdecision was made on the basis of the wide field
"MOW acceptance of the center stratisticians and the concernthat this acceptance was based upon these individuals'unique capabilities rather than upon the service roledescription. In light of this decision, Stage Threeof the stratistician model was planned.
67

Chapter 4
STRATISTICIAN, STAGE THREE, 1973-1974
In addition to field testing the stratisticianservice model in 1973-74, the RMRRC staff continuedto work on solving some of the same difficultiesreported during the first two years of operation(1971-73): to utilize the experience base to identifythe competencies of a stratistician, and to developa training program for those competencies. Thestrategy (elected to address the question of whetherit was the selection of highly skilled, uniqueindividuals and specific placements that made themodel work) was to invite the majority of the state'sschool districts to pilot the model with their ownspecial educators in their own schools. Thus theselection of the person and the school site wouldbecome the choice of the districts and hopefully morerepresentative of a "real world" situation. Theselected strategy for solving the problem of "serving
atwo masters" was to have the districts hire and paythe special educators (stratistician/generalists)involved. In order to reduce the time the stratis-tician/generalists would have to spend out of theirschools, the RMRRC meetings were reduced to one permonth. The eight RMRRC stratistician placements ofthe previous year, both in single schools and in themulti-county region, were discontinued.
The district selection process for the field testbegan with a letter to most Utah districts from theUSBE Deputy Superintendent for Instructional Services.The letter briefly explained the stratistician/generalist program and. invited districts to respondto the RMRRC if they were interested in completedetails. (Some administrators at the USBE, both inregular and special education, had participatedifromthe first planning meetings that led to the strtis-tician model, and had followed the progress of andsupported the stratistician program.)
The inducement for the districts and the specialeducators to be involved in the stratistician programin 1973-74 was that the RMRRC would provide two weeks

training for the selected special educators, per diemand travel expenses while they attended to trainingsessions, plus a stipend. The.RMRRC was to provideto the schools and the districts copies of all datacollected by the RMRRC at the RMRRC's expense. Inaddition, the RMRRC was to-provide a staff member tomeet at least twice a month in each special educator'sschool to provide any follow-up training or necessaryassistance. The role of the RMRRC staff person was toserve as an "intermediate stratistician" to the specialeducators, who were called "stratistician/generalists."Three intermediate stratisticians provided this backupsupport for up to six stratistician/generalists each.
The intermediate stratisticians were selectedfrom the preceding year's stratisticians. The stratis-tician/generalists were selected by their districtdirector of special education or someone in anequivalent position, based on district-establishedcriteria. In some smaller districts, the person mayhave been the only special educator in the district.Some of the larger districts chose to send threepersons.
The districts that participated with the RMRRCwere selected on their desire to be involved, on theirwillingness to cooperate in the evaluation requirementsof the project, on their willingness to release thestratistician /generalist one day a month to attendRMRRC meetings, and on the availability of theirselected stratistician/generalists to participate inthe training sessions before school started in Septem-ber, 1973. Of the 21 districts that expressed aninitial interest, 11 agreements were completed.Because some districts asked to send more than one per-son, a total of 17 stratistician/generalists partici-pated from those 11 districts.
The training was based on the skills and compe-tencies identified during the two previous years withthe stratisticians in the field. The major contentareas included: identification, diagnosis, prescrip-tion, programming, evaluation, and interpersonalskills. These areas were broken down into processlevels of knowledge, comprehension, application,analysis, synthesis, and evaluation. Learning moduleswere constructed to fit on a content-process matrix.The training materials were constructed on a perform-ance base to individualize the training program basedon the needs of each participant in each content area.
70
j,)

A more detailed explanation of the training programprovided to the generalists is presented in Chapter 6.
The stratistician/generalists were placed bytheir districts. The intermediate stratisticianswere assigned based on geographic considerations. Thelocation of the stratistician/generalists is depictedin Figure 4.1. The majority of programs were locatedwithin a 75-mile radius of Salt Lake City. A tabula-tion of the program by location, distance from theRMRRC, type of .program, background of stratistician/generalist, and the number of children in the servicepopulation is presented in Table 4.1.
The transition from the service delivery type ofstratistician of the two previous years to a two-tiered structure was a major change in the stratis-tician model. The intermediate stratisticians at theRMRRC became linkage agents between the resourcesystem represented by the RMRRC and the actualproviders of services in schools (stratistician/generalists). In terms of operations relative todirect service to the instructional process throughteachers, the school-based stratistician/generalistsassumed the role the stratistician had played in theschools during the 1972-73 school year (Stage TwoModel).
The intermediate stratistician was envisionedas providing training and back-up support to theschool-based stratistician/generalists. The trainingwas to include workshops, monthly training meetings,on-the-job training during two monthly visits to eachschool, and back-up support as needed on specificproblem cases; the intermediate stratisticians werealso to serve as a link to regional and nationalresources through the RMRRC. Relative to the schoolsthe intermediate stratisticians were itinerant resourcepersons who did not provide any supervisory orregulatory function.
The intermediate stratisticians were also toserve 'as a training resource to the Outreach programof the center, and respond to requests from LEAs, SEAs,or universities or colleges in the region for workshopsand/or presentations. The intermediate stratisticians'role grew into more of a training role with a secondaryresource consultant function, rather than the directservice activity that was provided as part of the_StageTwo service mod-61.
71

at. 1.1e1EL
toi
%.e
CACHE %CA
1.081.E
.D644,1 s5:31...rohors 5
MI I"
'1,114 Citi
SRO Lowe
t4,7%
.1.140114
UT111-1 SCHOOLDISTAICTS
00770 imir mogyre Donner!wife", (am& dow/04art5)
OtsItoiMvest.
*
tif.So
ANTIC , -
NVIIrina
tliNIE R.
boulhSnoOtTE
StJite..
v.kt
-_-_-_-_.
pottibmi.
Csitoot4
Roc- rr
trestai C3raria
\slepiot.
Ito .44 gnaftts.D
F( PINE
S4NJuAr
Fig. 4.1Location of Stratisticion/Genaralists, 1973-74
72
v

Table 4.1
Summary of Stratistician Placement1973-1974
Location Distance
fromRMRRC
Type of
ProgramProfessional
Preparationof
Stratisti-cian/Gen'list
umber
il-
.ren. n
-ervic'opula-J
ion
RMRRC
Inter-med.
Strat.
Assign -
ment
Vernal 182
ResourceRoom
L.D. Certi.Remedialteacher
:pprox.
18
...
S1
Coalville 63Resource Soc.Ed.Bus.
L.D. Cert. 58 S1Gen.
Heber 58Self-ConrT.M.R.
teacher 45 S1Resource
Park City 35 ResourceSecond.Eng.
30 S1Elem. Ed.
Morgan 75
Resource Secondary90 SiGen. Cert.
Harris 38
ResourcelM.Ed.Spec.Ed.L.D.
120 S2Self-Conq,.D. Cert.Grants-ville 47
Resource Spec. Ed.Cert. 80 S2Self-ContIL.D.
Crescent 23 ResourceComm.Disorderppeech Path. 65 S2
Edgemont 22 ResourceComm.DisorderSpeech Path. 60 S2
So.Jordan 21ResOurce Comm.Disorder
Speech Path. 80 S2ItinerantSelf-Cont,
Dugway 79
Resource Spec. Ed.Gen. Cert. 70 S2Self-Cont
Brookside 55 Resource Ed. 14 S3
Milford 220 Resource
5p...pp. Ed.'fusic 30 S3
Hopkins 50 Resource3p. Ed.L.D. 45 S3
No. Ogden 50 ResourceSpecialAchievement 24 S3
Roosevelt 40 ResourceSpecialAchievement 40 S3
ValleyView 45 Resource
MAfpecial Ed. 40 S3
Taylor ontrastPolk ontrast
73

Another function of the intermediate stratisticianwas to participate in the development of trainingpackages being developed by the RMRRC for general usein preservice and inservice training programs. Theintermediate stratisticians were assigned modules ofthe training manual being developed. The manual isdescribed in Chapter 6 of this report. This assignmentfurther accentuated the training function of the inter-mediate stratisticians. Other formal workshops orseminars were developed by each intermediate stratis-tician for inservice training use.
A last function of the intermediate stratisticianwas to help build the links to districts necessary inestablishing the project's evaluative program. Theintermediate stratisticians worked with the schoolpersonnel to explain the need for the evaluation, toprovide feedback on the data collected to the dis-tricts, and generally to facilitate the flow ofinformation between the RMRRC and the district staff.The process of evaluation and its goals will be out-lined at the end of this section.
The 17 stratistician/generalists, working inessentially 17 different situations, were to producedata that would verify the flexibility and adaptabilityof the stratistician concept to the needs of the "realworld." In the transition students were still beingserved, teacher skills were being improved, andgenerally the schools and districts felt, good aboutthe service. The transition to the two -tier model wasa change from the original "pure" concept of thestratistician model. In some rural and remote areasthe stratistician/generalist was the only availablespecial educator and it was necessary for that personto serve in a self-contained classroom part of thetime to meet specific needs of some students. In suchcases, the stratistician/generalist.also tried to assistthe rest of the teachers in the school whenever possi-ble. In some cases the stratistician/generalist wasthe only special educator in the district and had to-provide part-time service to both the elementary andsecondary schools.
One major problem facing the analysis of theapproach's effectiveness was the wide variance in theactual functioning of the stratistician/generalists ineach of the 17 schools. In addition, new state fund-ing guidelines went into effect after the school yearbegan which required assignment of students to each
74

special educator in a school for district.reimbUrse-ment of state money. Assignment of students to thestratistician/generalist was opposed to the conceptof serving as a resource person to teachers; such arole requires time flexibility and immediate avail-ability to meet teacher needs. The RMRRC requestedthat the districts allow the stratistician/generaliststo function as closely to the originally agreed uponguidelines as possible, but in view of the new con-straints facing districts it was not demanded.
The RMRRC staff attributed additional problems topersons in at least three key positions. These three--directors of special education, principals andspecial educators -- needed to be committed to theparticular model in order to allow its implementation.There was some evidence that some of the persons inthese key positions were not committed to trying themodel. If a district administrator likes an idea andestablishes a resource model in a school without con-sulting the principal and/or the Special educator,some resentment and resistance to use of that modelcan be anticipated. If a principal decides againsta particular model and prefers another, he structures
ithe situation to meet his desires. Also, if thespecial educator decides that he would rather work-ina self-contained or resource room but is forced tooperate from another model, he gradually shapes thatmodel.
Another problem was the "heavy data gatheringeffort." In order td-pa#icipate, districts agreedto administer a battery Of tests in the schools wherea stratistician/generaligit would be placed. The prob-lem as viewed by the center training component wasthat the burden for administering the instruments fellupon the schools facultir,meTbers who were not involvedin the decision to give.the tests, and therefore, feltit was thrust upon them.
Part of the history of the stratistician modelhad been the efforts to evaluate the model. Theseefforts were discussed in the preceding sections. Inthe development of the Stage Three model a renewedeffort was initiated to try to determine the validityand impact of the approach. The evaluation plan wascomprised of two parts: 1) the evaluation of thetraining given to the stratistician/generalists duringa two-week session prior to the opening of school; and2) evaluation of the model's impact on aspects of theschool.
75

In order to accomplish the first evaluationaspect, a member of the evaluation component wasassigned the responsibility of working with the serviceand training components in the development of thetraining modules and in preparing pretraining and post-training assessment instruments. Due to poor planning,this effort was not effectively implemented and fewdata are available on the training program's effective-ness.
The impact of the model on the educational programand, ultimately, on the .handicapped children in theselected schools, was evaluated on the basis of datacollected from teachers, children and administrators.The types of data included achievement, socio-emotional,attitude, and demographic data from teachers andadministrators on the general educational environment.A similar effort had been ongoing in Texas and this ,
methodology was reviewed andselected for us= in Utah.Afrangements were made to modify and to use everalrelevant instruments (previously developed ay a BEHintramural research project, Project PRIME to collectall data except achievement data which we e collectedvia standardized,-published, commerciall availableachievement tests. The original purpose was theevaluation of the Stage Three model, bu severalintervening factors affected, that inte tion. Theoriginal design will be presented al,' then modifica-tions and actual outlines discussed.
Subjects for the Project PRIME instruments fellinto three major groups: students (n = 6000), teachers(n = 300) and administrators (n = 40). The studentgroup included all students in grades 1 through 6 inparticipating schools. For the administration of oneinstrument (Teacher Rating Scale--TRS) a subsamplestudent group was formed.
The subsample student group (n = 2000) consistedof handicapped and nonhandicapped students. Handi-capped students were defined as meeting one or more ofthe following criteria:
1. Included in a special education program(except for speech therapy students).
2. Reported in the state Project ID census in1972 or 1973.
3. Referred to the generalist assigned to theschool.
76

All handicapped students in participating schoolswere included. Nonhandicapped students comprisedroughly 20 percent of the combined 19-school popula-tion and were chosen without systematic bias from eachclassroom in the particiPating-schools, with thefollowing exception: a teacher load of six studentswas established for the TRS. In those instances inwhich handicapped students in a classroom equaled orexceeded stx,nonhandicaPped students were not selectedfrom that classroom. If the handicapped student num-ber was less than six, enough nonhandicapped studentswere selected to reach the teacher load of six. Theteacher subject group included all teachers in grades1 through 6.in participating schools. No furtherdifferentiation of the teacher subject group was made.
The, administrator subject group included threesubgroups: principals, special education directorsand superintendents. The principals' group (n = 21)consisted of/principals of participating schools..Directors of special education formed a slightlydifferent group because participating districtsincluded duties of director of special education undersuch positions-as pupil personnel director orpsychologist. Also, three rural districts formedmulti-district cooperative in which one perso ul-filled the duties of director of special educationfor the three districts. In any case, e question-naire for director of special education was completedby the person charged-with responsibilities suitableto the director of special education. N for thisgroup equalled 8.
The materials from Project PRIME selected for usein Utah included:
Instrument Subject Response Respondee
1. About You And All Ss Yes/No StudentYour Friends
.2:: Your School All Ss Yes/No StudentDays
3. Metropolitan All SS StudentAchievementTest (MAT)
77

4..Teacher Rating All Handi- 5 pt. rat- TeacherScale capped Ss ing scale
Selected non-handicappSs
5. Teacher...Attitude andClassroomClimate
6. Superintend-entQuestionnaire
7. Sp. Ed.DirectorQuestionnaire
8. PrincipalQuestionnaire
All 5 pt. rat- TeacherTeachers ing scale
Superin-tendent
Spec. Ed.Director
Principal
Superin-tendent
Superin-tendent
Principal
These materials were adapted for use-in Utah byeither deleting inappropriate response items such asthe reference to educational diagnostician or sub-stituting equivalent response items such as TEAchanged to UEA. The questions used in the design arepresented in Tables 4.2 and 4.3.
Test instruments 1 through 5 were designated aspretest and posttest instruments with initial adminis-tration projected for September, 1973. Variousunavoidable delays (e.g., approvals, printing, schedul-ing) resulted in pretest-administration in some schoolsas late as December, 1973. These delays, althoughfrustrating and potentially detrimental, frequentlyaccompany field-based studies, and were unfoieseen atthe time of planning. The posttest date was projectedfor April, 1974, and was achieved. Instruments 6through 8 were not included in the pretest-posttestdesign, and were admiaistered on schedule in April,1974.
Instruments 1, 2 and 3 were administered by eachteacher to his/her classrote. This method constituteda possible source of error in that certain items vori,instruments 1 and 2 may be considered by teachers Up.be evaluative and/or threatening. The data gatheredfrom ttlese items will have to be interpreted withextreme caution..
'78I

7
Table 4.2 Formative Questions
A. How is the generalist perceived by regular teacher_?(Teacher attitude and classroom climate questionnaire)
1. Role 5.
2. Activities/extent ofaction. 6.
3. Usefulness of activities.4. Types of regular teachers'
problems with generalist 7.
role.
Types of needs not beingnet by generalist.Types of scheduling prob-lems relating to gen-eralist.Types, extent and wet-fulness of media andmaterials made availableby generalist.'
B. How is the generalist perceived by a4ministratore (principalsprimarily but will go to pupil services, and other dietrict per-sonnel)?
1. Principal 2.
a. ..$hat activities of
generalist are viewedas most favorable?b. What sorts of prob-lems does the principalget from other teachersin regird to\ generalistwho does not work di,
rectly with children?c. What does the prin-cipal do to facilitateand to build acceptanceof generalist in hisbuilding?d: How does the prin-cipal perceive the gen-eralist role, responsi-bilities?e. What are the typesof needs he still hasin serving handicappedchildren that generalistdoes not fulfill?f. What is the principal'sfeeling about a person Whodoss-not work with handi-capped children?
79
Questions for directorof special education.a. What is his attituderegarding teachers whodo not work with chil-dren directly?b. What does he do tofacilitate acceptance?C. What are needs thatthe generalist does notfill for handicapped'children?
0.1

Table 4.3 Summa_lve Questions
Instrument Questions answered by group data.
M. A. T. A. Does a generalist effect greaterresidualized gain scores across
classes?
Your Schoo' Days B. Does the classroom climate changeas a function of generalist?
1. Teacher's influence?
About You and Your C. Do children in generalist schools
Friends. have better self-concepts,attitudes toward school?
Questions regarding individual (targetchild) data.
N. A. T. A. Do handicapped children in classeswith a generalist make greatergains then when there is no gen-
eralist?
Teacher's Rating B. In classrooms where generalists
Scale are available is classroom be-
havior of specific targeted kidsbetter then\with no generalist?
About You and Your C. Do handicapped children in schools
Friends with generalists have better
Your School Days attitudes and self-concepts thanwithout generalist?
Questions regarding class as a whole.
Teacher Attitude aid A. Do teacher styles differ between
Classroom Climate generalist/nongeneralist schools?
Questionnaire B. Do types of activities differ ingeneralist/nongeneralist schools?
C. Does teachers' willingness to workwith handicapped children change?
80

As-of May 1, 1974, pretest data received initialprocessing and were returned to the RMRRC as a computerprintout on computer tape (Instruments 1, 2, 4, and 5).Results from Instruments 1, 2, 4 and 5 required factoranalyses and scaling. It was decided that the tapesbe sent to Dr. Donald Veldman at the University ofTexas at Austin for analysis since he'hadalreadydeveloped programming procedures when analyzing PRIMEdatiic The posttest data were received in early Mayfrom participating schools. RMRRC clerical personnelprepared the data, for initial processing by AmericanSurvey Research Corporation by mid-May. The achieve-ment test results were returned from ASR in mid-June.However, the scoring of the PRIME instruments tookmuch more time and were not returned until lateSeptember.
Data analysis of all Project PRIME instrumentswith the exception of the MAT utilize factor analysis.Methodology for the factor analysis on Project P MEdata are found in Scale Structure of Teacher Rat ngScale, Scale Structure of About You and Your Friendsand Scale Structure of Your School Days, all authoredby Donald J. Veldman ancri fiii-Taernal workingpapers of Project PRIME (Texas).
Since the Utah data included grades 1-6 in thestudent sample and Project PRIME dealt only withgrades 3-6, it remained to be determined if !the factorstructure of the student instruments obtained by theVeldman analysis held for the Utah data analysis.However, for orientation to the instruments, thefactor structure for Teacher Rating Scale:, About Youand Your Friends and Your School Days wi/1 bereported. Factor structures are not available in theRMRRC office for the other in ruments. For thefollowing instruments the f for structures are:
Teacher Rating Scale: four factors reported
Factor I: Academic Concentration
Factor II: MisLehavior
Factor III: Outgoing, Expressive
Factor IV: Anxious, Depressed
About You and Your Friends: four factors reported
Factor I: Loneliness and Rejection
81

Factor II: Enjoys School
Factor III: Does Well in School
Factor IV: Misbehavior
Your School Days: four factors reported
Factor I: Enjoyment, Positive Reinforcement
Factor II: Unhappiness, Misbehavior
Factor III: Cognitive Emphasis
Factor IV: Variety, Individualization
The difficulties encountered by the evaluationwere compounded by the new funding structure ofspecial education in Utah. The change sharpened thedefinition'of handicapping conditions and requiredassignment of children to personnel reimbursed asgeneralists. This influenced the operation of thestratistician/generalists and further reduced theclarity of the role definition since stratistician/generalists were to work primarily with teachers.Becaus the effectiveness of the intermediatestratisticians must be through this variable inter-face-, _clearly__-defined- cause -and-effectscould- not beanticipated. she lateness of the pretesting alsoendangered the validity of the pretest-posttestdesign. The collected data, however, will providethe best RMRRC data base to date on the special educa-tion process in Utah. The results of this effortwill be reported under separate cover due to theanalysis of the data occurring at the closing of theproject and the amount of time needed to process thevolume of data.
Final Evaluation Design
Prior to the termination of the fourth year ofthe RMRRC project, the initial evaluation design wasreviewed,. The review indicated that the desired datato evaluate the Stage Three model would in mostlikelihood not be obtained from the original designbecause of the indicated unexpected confoundingvariables. Aware of the likelihood of this occurence,the project staff decided to use a planned year-enddebriefing session for generalists and administrators
82

as the basis for an evaluation of the Stage Threestratistician model. The design was constrained tothe development of a measurement within the contextof the year-end debriefing and within a three-weekplanning and execution timeframe.
The process by which the evaluation was designedis presented in Figure 4.2. The first portion of theprocess was to elicit from the principal staff involvedin the stratistician program their intentions orgoals for the operation of the model, and the expectedoutcomes from\the planned activities. The procedurewas to first meet individually with the principalstaff who were most immediately involved in the develop-ment of the model and the training program associatedwith it; the aim of these meetings was to evolve thegoals and objectives that were the basis for staffdesign of the program and staff expectation from thework for the year. The goals and expectations werein most cases drawn from memorandums, notes andinformal planning documents, as well as from personalrecollection.
The basic goal structure was to be used to deter-mine the evaluation design by forming the measurementbaseline. The goals/objectives were to be formed inhierarchal arrangement and then analyzed to determinethe critical variables in the intended activities. Ineffect the goal /objective structure was being used todefine the process by which the project operated forthe year. The analysis of the goal structure wasexpected to provide the analysis of the desired opera-tion of the intermediate stratistician/generalistprogram including all supporting activities.
The evaluation design was to define a process anddesired outcomes that would result from the enactmentof that process. In turn the evaluation instrumenta-tion would be selected to determine if the processwas enacted and its degree of effectiveness. Supple-mental questions were to be used to determine ifcritical issues or peripheral activities occurred thatrelated to the operation of the desired model. Someof these questions were to be open-ended to elicitthe general feelings and views of the respor$ents interms of the issues they saw as important.
The data collected on the goals and objectivesand the desired outcomes separated into two distinctparts: the provision of educational services using
83

Meeting of SelectionEvaluation of staff Initial
Staff to .-----)oand.----------*Evaluationestablish assignment Design
- process of'roles
T (Changes)
iReview designwith projectstaff anddirector
(no changes)
Def The Review
preliminary <_....._existinggoal program
materials
Meet withproject staff
7) to completegoal/objectivestructure
Analyze datacollected
Review withdirector
Define types of Analyze goal/objective
instruments to structure to determine
be used critical factors
Outline instrument------30Develop instrumentsformat
1Develop applicationprocedure
Collect datIC Implement Defineanalysisprocedures
>Undertake, .]analysis
Report findings
Fig. 4.2 Evaluation Development Process
84
1,

the stratistician program, and the,evolution of atraining support process. The following outlinespresent an overview of the basic questions and assump-tions in each area to provide a perspective of thegoal-setting process to be discussed in the followingpages.
Basic Questions
1. Are the relationships between the RMRRC, theintermediate stratisticians (IS)*, thestratistician/generalist (S/G) and schools .
necessary as operative in the Stage ThreeS/G model?
A. What are the relationships?
1. What is the role of the S/G?
2. What is the role of the IS?
a. What is role of the RMRRC?I
3. What is the role of other-personnel?
a. DA?
b. Other resource personnel?
B. What do the roles and relationshipsrequire to operate?
1. What competencies?
2. What support?
C. Could they operate without the RMRRCinvolvement?
1. Contributions of the RMRRC:
a. Training
*The initials IS, S/G and DA will be used through thebalance of this chapter to signify intermediatestratistician(s), stratistician /generalist(s) anddistrict administrator(s), respectively.
85
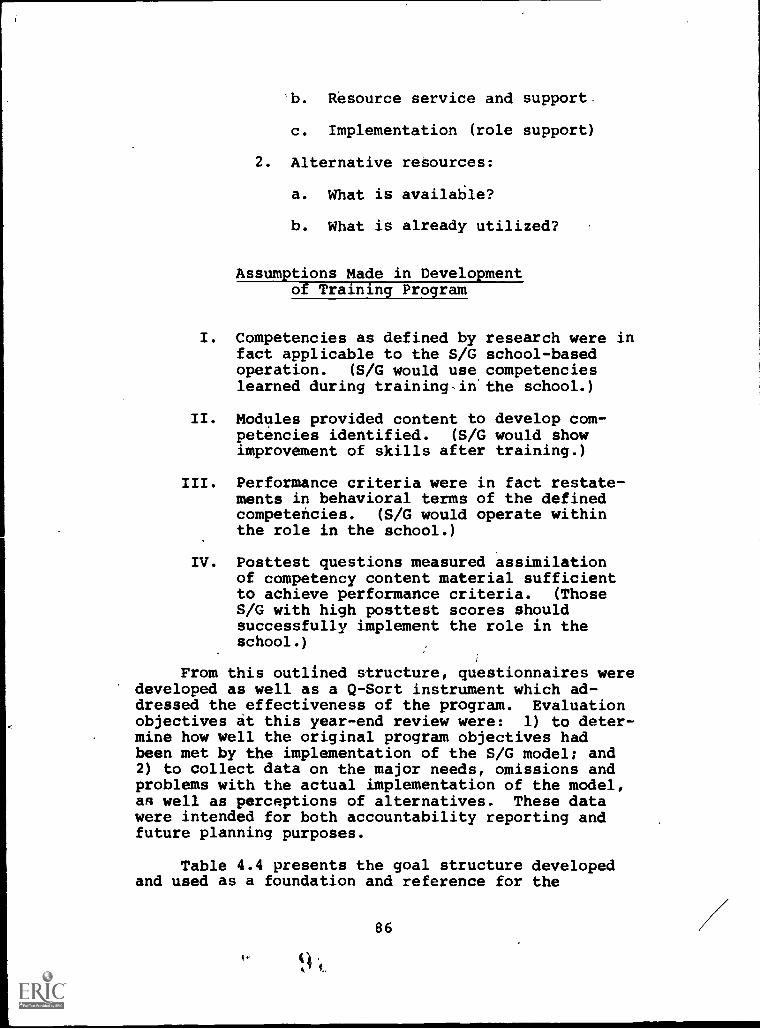
b. Resource service and support.
c. Implementation (role support)
2. Alternative resources:
a. What is available?
b. What is already utilized?
Assumptions Made in Developmentof Training Program
I. Competencies as defined byfact applicable to the S/Goperation. (S/G would uselearned during trainingin
II. Modules provided content topetencies identified. (S/Gimprovement of skills after
research were inschool-basedcompetenciesthe school.)
develop com-would showtraining.)
III. Performance criteria were in fact restate-ments in behavioral terms of the definedcompetencies. (S/G would operate withinthe role in the school.)
IV. Posttest questions measured assimilationof competency content material sufficientto achieve performance criteria. (ThoseS/G with high posttest scores shouldsuccessfully implement the role in theschool.)
From this outlined structure, questionnaires weredeveloped as well as a Q-Sort instrument which ad-dressed the effectiveness of the program. Evaluationobjectives at this year-end review were: 1) to deter-mine how well the original program objectives hadbeen met by the implementation of the S/G model; and2) to collect data on the major needs, omissions andproblems with the actual implementation of the model,an well as perceptions of alternatives. These datawere intended for both accountability reporting andfuture planning purposes.
Table 4.4 presents the goal structure developedand used as a foundation and reference for the
86
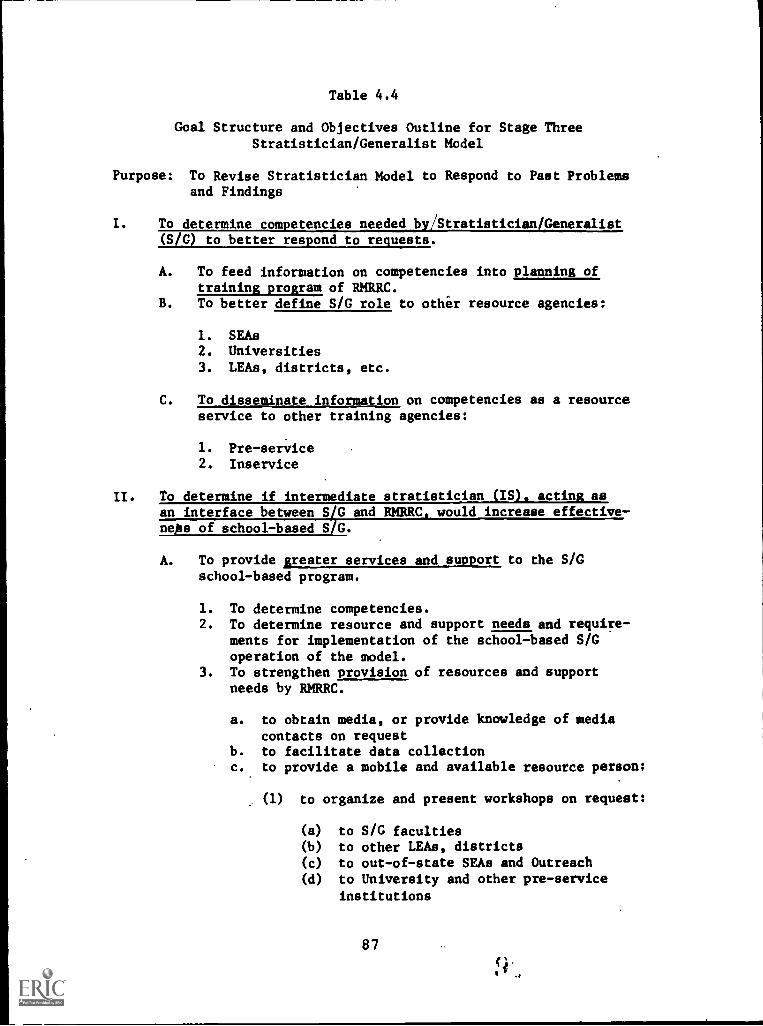
Table 4.4
Goal Structure and Objectives Outline for Stage ThreeStratistician/Generalist Model
Purpose: To Revise Stratistician Model to Respond to Past Problemsand Findings
I. To determine competencies needed by/Stratistician/Generalist(S/G) to better respond to requests.
A. To feed information on competencies into planning oftraining program of RMRRC.
B. To better define S/G role to other resource agencies:
1. SEAs2. Universities3. LEAs, districts, etc.
C. To disseminate information on competencies as a resourceservice to other training agencies:
1. Pre-service2. Inservice
II. To determine if intermediate stratistician (IS), acting asan interface between S/G and RMRRC, would increase effective-ness of school-based S/G.
A. To provide Greater services and support to the S/Gschool-based program.
1. To determine competencies.2. To determine resource and support needs and require-
ments for implementation of the school-based S/Goperation of the model.
3. To strengthen provision of resources and supportneeds by RMRRC.
a. to obtain media, or provide knowledge of mediacontacts on request
b. to facilitate data collectionc. to provide a mobile and available resource person:
(1) to organize and present workshops on request:
(a) to S/G faculties(b) to other LEAs, districts(c) to out-of-state SEAs and Outreach(d) to University and other pre-service
institutions
87

4. To establish a resource bank.5. To establish a training program to insure a minimal
level of S/G competencies.
a. to develop a training resource to respond totraining requests, inservice.
b. to feedback into preservice training.c. to plan and conduct an effective two -week train-
ing workshop for S/G:
(1) to provide an organizational structure forserving all handicapped children (identifi-cation, diagnosis, prescription, program-ming, evaluation).
(2) to influence S/Gs to focus equally on allaspects of above service sequence (identi-fication, diagnosis, prescription, program-ming, evaluation),' not differentaially onone only.
(3) to teach the content areas of competenciesinvolved in the sequence and mandated byPL 91-230:
(a) identification(b) diagnosis(c) prescription(d) programming(e) evaluation
(4) to describe level of proficiency by measur-ing process skill level in the implementationof above content areas:
(a) knowledge(b) comprehension(c) application(d) analysis(e) synthesis(f) evaluation
B. To adapt training to personalized, specific school andS/G needs.
1. To administrate training:
a. to organize, retrieve information for the contentof training
b. to allocate format for trainingc. to develop training packages
88

F.
2. To implement training in an individualized manner:
a. to instruct SIGsb. to support S/Gsc. to monitor S/Gs learning and provide personal
feedback
3. To continually assess competency'ability level of
S/G, formally and informally.
4. To continually volunteer assistance based on assess-
ment of S/G ability'ss deemed appropriate.
5. To act as a resource to teachers:
a. to demonstrate a variety of teaching and problemr
%solving methodsb. to maximize and support creative use of limited
materialscs to introduci knoOledte of new techniques, games
d. to assist in test,battery development for specific
problems ,
e. to assist in organizational problems: lesson
planning, flowcharting, profiling' on students,
outlining objectives, etc.
f. to demonstrate concept of various areas of
exceptionality, provide information
g. consultation with 'teacher regarding a specific
childh. mutual problem-solving with teacher
with administratorwith groupwith child_
i. mutual decision making with teacherwith groupwith childwith administrator.
6. To continually respond to requests from S/G for.
resources or assistance.
T. To provide work hops.
8. 'To continually provide emotional /psycho - social
support in the /G role.
9. To continually 'lather input on needs, raquirements_
of the S/G in school-based role',
10. 'To get feedback on effectiveness of suggestions
provided by IS. k
11. To increase lob efficiency of S/G by/assistance on
organizational aspects of therole:
a. .efficient use of time'
,b. 'objective writing, decision' sking
c. record keeping
89
9;

C. To maintain focus initiated in the training program,in context of individual schools:
1. To provide continuing systematic, comprehensiveoutlook on provision and programming of specialeducation services.
2. To maintain focus on logical adaptation of schoolvariations in instruments and techniques to thecomprehensive process (identification, diagnosis,prescription, programmini4 evaluation), i.e., tocontinuously refer to model presented in training,fitting it to school - based \variations in instru-
mentation.
D. To adhere to contractual sched 1. lin: a reements withschools:
1. Two meetings per month with each S/G individually2. One monthly group meeting o S/G and IS at the
RMRRC Center
III. To establish a service process for th S/C.
A. To implement and operate the S/G model in the school:
1. To establish cooperative, con ractual relationshipswith teachers rather than take over direct instruc-tional responsibilities.
2. To take responsibility for overseeing evaluationprocedures
a. not necessarily to do testi g or act aspsychometrist, but to model and demonstrateand-teach evaluation, diagn is, prescriptiontechniques
(1) to do some observation f classroom be-havior with systematic recording of data
b. refer students for testing an4 evaluation
3. To take responsibility for coordi'ation of program-ming:
a. to maximize efficiency of avai able staff re-sources, outside resources, me is
(1) to refer to other resource personnel andagencies
b. to serve greatest number of students
90

(1) to deal indirectly with mainstreamed handi-capped children in classroom
c. to facilitate as many teachers as possible
4. To become mediating force in schools, acting fromnonadministrative, nonthreatening position.
5. To utilize and demonstrate: interpersonal interactionskills:
a. environmental- reading skills
b. mutual problem-solving techniquesc., message, sending and receiving skills
6. To-increase voluntary referrals and requests fromteachers over the year.
B. To become an increasingly more independent resource co-ordinator, less dependent on the RMRRC.
IV. To reduce organizational demand of the RMRRC the school-
based S /G.
To free S/G to better respond to requests and needs of
school.
1. To eliminate time syent my/center resource activitiessuch as technical assist ce out of state, presenta-
tion of workshops to L ,districts, etc. -
2. To eliminate eat tion demands.
B. To increase district low, vement and support.
1. To cut federal costs by having district providefinancial support.
2. To have district administrators avoid unitary deci-.sions regarding,special education.services, andrather -act as part of staffing group with faculty andS/G to program services to the child.
3. To have district administrators provide informationon resources available in district to S/G.
4. To have district'adminittrators provide informationon district constraints to S/G:
a. staff time constraintsb. budgetary constraints.
c. 'physical facility constraintsd. constraints'of attitude and climate ofIresistance/
acceptance in disttict
91
sit

#
5. To have district administrators provide public re-lations support and facilitation forthe SIG!simplementation of comprehensive special educationprogramming:
a. discussion of SIG role; presentition of accom-plishments; discussion of function changes;suggestions for cooperation regarding the S/Goperation
1) to school faculty(2) to higher level district and administrgtive
personnel
6. To have district administrators uPe pogitions'of
unique contacts in obtaining necess y tools,assistance:
a. to file for fees,b. to request services
7. To have district administrators form a Participatigir ---Districts Advisory Committee (PDAC) to provideongoing assessment of needs and feedback on operation
of S/G model
V. To determine if school seiected'and placed S/G could implementthe-stratistician model.
A. To apply and 1621:model across school-_systems
B. To apply and adapt model across school personnel
1 \1, To enlarge number of gtratisticians available for
evaluation of the model..
C. To determine if exiSting conpetencies1 as representedby minimal baseline /educatiOn requirement of a B.A.
degree, were suffic ent to'implement the model.D. To establish select on criteria for a resource poolE. To provide more service to rural areas.
7
92

evaluation questions. Full questionnaires showingformat and sequence of items appear in Appendix C.Finally, the'results of the data analysis and descrip-tion are reported, and' conclusions drawn.
The remainder of this chapter contains data'obtained from post-school-year sessions held with theIS, sx and DA. The first set of data relates to theimpact 'and effectiveness of the RMRRC training (Test--Retest Retention Study). The remainder of the datarelates to the rolei of the IS, the S/G, the DA, andcomments regarding the S/G as obtained from theProgramAnalysis Questionnaire.
Test--Retest Retention Study
The original design of the retention study calledfor one pretest (termed a preliminary interview) priorto the August, 1973 training session, and two post-tests (termed post-training interviews). Posttest Iwas to-be administered immediately following the August,1973 training session, and posttest II at the end ofthe school year, 1973-74. These instruments are
-included.as Appendices D and E.
The tests followed a format of one question foreach of the 24 modules of the trainiig program. Eachquestion was to be written specifically to measurethe implementation Of the performance criteria foreach module and was assumed; therefore, to have facevalidity. The same questions were to be used in eachadministration of the tests in an attempt to insurethe reliability of the instruments.
IS were designated as the appropriate persons toformulate the questions since they were felt to bethe only personnel with sufficient content knowledgeof the modules. The exception to this plan relatedto modules 23 and 24--evaluation content areamodules--which were assigned to a member of theevaluation team. Further assignment of responsibilityfor question-writing narrowed this task so that each1S wrote the questions associated with the modulesthat were his/her responsibility for development;e.g., IS I had responsibility to develop and writemodules 1 to 4 and 6, therefore, IS I wrote the testquestions for modules 1 to 4 and 6.
All three tests were scored by the followingsystem:
93

1. All questions were arbitrarily assigned amaximum score of 6 points;
2. Each question was divided into several items:e.g., question 7 of-the posttests consistedof a 16 -part matching question and, therefore,contained 16 items;
3. Each item within a question was assumed towarrant an equal rating; therefore, the 6possible' points for each question weredistributed equally among question items;
4. The same IS who wrote the question scoredthe question.,
This plan was modified following the administra-,tionioi the pretest when the training program evaluatordiscovered that the face validity assumption was 4inappropriate. Face validity could not be assumedbacause the individual IS hid written the test ques-tions prior to development of either the performancecriteria for each module or of the module itself.
Post hoc Axaminationof the performance criteria ,
and of the questions indicated that, despite thiserror, questions 16through ;2 did appear to measurethe performance criteria. Therefore, questions 16through 22 were retainea'in the posttests and new .
questions designed to measure the performance criteriawere written for all questions except for module 5.Materials for moddle 5 were not presented to the S/Geither in the August, 1973 training session nor duringthe Workshops of 1973-74.
Except for the above modification, the evaluationdesign was implemented. Caution is needed in inter-preting the results of the pretest and posttest I onall' but modules 16 through 22. These results, appear-ing in Table 4.5, suggeit-that the August, 1973 Train-ing Program was successful for these modules with theexception of Modules 17. and 18.
.._
The results from posttest II are considerablydifferent, with all modules from 16 through 22 (withthe exception of 19) yielding a mean score of 3;00 orless and with 17, 18, 21 and 22 producing a mean scoreof 2.00 or less. With the notable exception of module19, it would appear that the training for modules 16through ;2 was not successful for long-term retention.
94
99

re-Test
197)
Post Test I
Post Testi!
Table 4.5 Scores of the Ivaluattoes of SIC Italian 69**10oo
Module
IA 11 IS 1/ In 11 1Range
Mean
S.D.
,2.58.
4.73
3.91
0.',4
0.00
6.00
2.4g
2.00
0.00
6.00
3.44
1.79
0.006.00
3.60
1.59
0.006.00
0.8g
1.85
0.004.50
1.97
1.22
2.195.11
1.00
0.81
0.004.14
2.11
1.29
0.004.8,
1.11
1.46
0.685.89
4.37
1.49
0.004.80.
1.02
1.45
3.606.00
4.34
0.87
0.00
6.00
5.26
1.94
0.006.00
1.16
2.13
0.001.71
0.11
0.61
0.003.00
1.18
0.82
0.004.20
1.16
1.14
,1'..13
:.l0
2.14
1.16
0.006.00
1.18
2.33
0.006.00
4.00
2.91
0.006.00
3.25
2.03
0.006.00
3.73
2.01
2.01
8401
3.18
0.81
Range 0.00. 0.00 1.34 0.00 0.00 3.80 1.80 2.40 2.40 2.25 1.61 0.00 0.00 0.00 0.00 0.00 1.20 2.10 0.00 0.00 0.30 0.00 0.01
6.00 6.00 6.00 6.00 6.00 6.00 5.40 6.00 6.00 5.251 5.68 5.60 6.00 S.60 6.00 3.00 5.40 6.00 6.00 6.00 6.30 3.00 6.04
i
H640 5.07 4.42 4.22 5.06 5.00 5.72 3.85 3.72 4.25 3.44' 4.18 2.58 2.91 3.81 3.17 1.11 2.98 4.48 4.10 4.23 2.21 1.11 4.52
S.D. 1.60 2.71 1.80 1.68 1.82 0.59 1.07 1.22 1.13 1.32 1.07 1.68 1.27 1.62 1.57 0.78 1.20 1.66 2.32 2.24 f.88 1.01 2.11
Range 0.00. 0.00 2.66 5.36 3.00 4.94 1.00 3.00 2.00 2.62 4.14 2.24 0.00 1.40 0.60 1.50 1.20 1.20 0.00 0.00 0.00 0.00 6.01
6.00 6.00 6.00 6.00 6.00 6.00 4.80 4.80 3.60 6".00 6.00 5.04 3.00 5.25 4.80 3.00 4.20 6.00 6.00 6.00 2.50 3.00 6.011
,!csin 3.70 5.60 4.77 5.95 5.80 5.88 3.96 3.88 4.05 4.45 4.56 3.90 2.10 3.71 2.78 1.18 2.31 5.28 2.40 1.86 1.23 1.66 4.40
S.D. 2.33 1.54 0.97 0.16 0.77 0.31 0.59 0.50 1.34 0.48 0.45 0.80 0.84 1.05 1.12 0.62 0.78 1.33 2.17 1.92 0.82 1.11 2.21
* Mean Equal to or less than 3.00** es Mean equal to or less than 2.00
DO

Of those questions for which comparison must belimited to posttest I and posttest II, questions 13,14, and 23 warrant attention. The mean score on post-test I, question 13, was. less than 3.00. On posttestII, this mean score exceeded 3.00 (actual value was3.90). It is assumed that either the monthly trainingsessions or field application of the skills in module13 produced this result. Question 14 produced meanscores below 3.00 (2.92 and 2.70) on both posttests Iand II, and question 23 yielded mean scores below2.00 (1.57 and 1.86) on both posttests I and II. Theinformation in these modules was apparently notretained on either a short-term or long-term retentionbasis. Qustions 1 thrbugh 12, 19,-and 24 all yieldedmean scores greater than 3.00on posttests I and II.
(i) It may then be assumed that the content in modules 1through 12, 19 and 24 was retained.
The retention study data yield some interestingresults. Retention from posttest I to posttest IIwas, in general, very good. Posttest II questions2 through 17, 19 and 23,.in fact, yielded a mean scorethe same as or higher than on posttest,I. Thisrepresents aitotal of 18 of the 24 modules for whichmeasured retention levels indicated that the skill waseither maintained or improved through the school year.On the other hand, results from,qab-stions 1, 18, 20,21, 22 and 24 indicate that retention declined through.the school year. Mean scores for these questions werelower for posttest II than for posttest I. In thecase of questions 20 and 21, the mean scores wereseparated by 1.70 and 2:37 pbints respectively.
Results from questions 16 through 22 (questions16 through 18 cover prescription and questions 19through 22, programming) as noted earlier, may becompared across all three tests. This is noteworthy'since the scores for 16, 17, 18, and 20 were excep-tionally low on the pretest, (mean scores below 2.00).
The pretest mean score on question 19 was alsolow (below 3.00). On posttest I questions 17 (mean =1.57) and 18 (mean = 2.90) retained a low score. Meanscores on questions 16, 19, and 20 on the posttest _-exceeded 3.00 (mean for 16 = 3.17; mean for 19 = 4:48;mean for 20 = 4.10).
96
10 t

Report on Program Analysis Questionnaire
From June 5-7, 1974, a three-day, year-end debrief-ing meeting of XS, S/G, DA and RMRRC staff members washeld. During that time the questionnaire developedfrom the goal structure was administered. Due to timeconstraints of the meetings, it had been decided thatquestions would be restricted to various types of self-report measures: checklists of types of activitiesand resources used during the year, frequency andpercentage estimates of types of activities andresources used, open-ended questions describing process,and self-ratings on role effectiveness and programoperation.
Self-reporting was used in the following ways:1) polling the S/Gs as consumers of the RMRRC resourceservices (including training)' regarding their satis-faction; and 2) polling the DA as consumers of bothdirect service by the S/G and indirect resourceservice by the IS. Representing the consumer opinion,this data gave an estimate of perceived _effectiveness,and projected needs of the program. The same person-nel, as well as the. IS in their alternate roles asproviders of services and resources, were then polledfor their individual descriptions of the processesand problems involved in the delivery of services andresources to the schools. It was felt that the.com-bined perceptions of these personnel, noting similar-
and differences, would reveal a reasonablyvalid description of the process and effectiveness ofthe program operation, although all respondents wouldnot have access to information on all program facets.'
In the following sections, the objectives drawnfrom the desired operation goal structure will be-related to the questions developed, and the dataresults presented. A copy of the complete question-naire is included as Appendix C.
There were four groups responding to the ProgramAnalysis Questionnaire: 1) stratistician/generalists'(S/G); 2) control group generalists (C/G); 3) inter-mediate stratisticians (I/S); and 4) district adminis-trators (DA). The groups are defined as follows:
1. S/G: A school based geneialist who receivedthe RMRRC training in August, 1973, and thefollow-up training of workshops during theschool year 1973-74. An S/G is assumed to
97

have worked at least part of each day in thestratistician model and received supportfrom an I/S.
2. C/G: A field-based contrast generalist whodid not receive the August, 1973, trainingand may or may not have attended the train-ing workshops &ming the 1973-74 year. AnCA received support from an IS during theyear and may or may not have functiOned inthe stratistician model. Because of thesmall number (n = 7) of the C/G and becauseof the lack of consistency among the groupon training and/or function, no attempt willbe made to interpret the results from theirquestionnaires.
3. IS: An RMRRC full-time employee who hadfunctioned as a field-based stratisticianduring the preceding year (1972-73). AnIS provided resources and support for S/G .
and C/G during 1973-74 and also provided thelink between the RMRRC and the S/G and C/G.
4. DA: This group consisted of principals ofparticipating schools, and superintendentsand directors of special education (orindividuals whose role definitions includedthe duties of director of special education)from participating districts.
In the administration of the questionnaire S/G andC/G responded to all questions through question 44.I/S and DA responded only to questions that appearedapplicable from questions 1 through 44. Questions 45through 50 were for DA only.
The data from questions 1 to 11 relate to Goal II,A5, as is stated in the outline of the goal structure.The main statement is: "to establish a training pro-gram to insure a minimal level of S/G competencies."
The results from questions 1 and 2 of the ProgramAnalysis Questionnaire indicate a striking differencein skill-level perception between the S/G repofting onthemselvei and the IS reporting on their perception ofS/G skill level. The S/G tended to rate themselvesat a higher skill level than where the IS placed them.For example, the IS did not place any S/G at the evalu-ation skill level, while from 5 to 13 S/G placed their

own skill levels at evaluation depending on the con-tent area.
Another result worthy of mention is that the S/Gand the DA value high skill levels (i.e., towardsynthesis and evaluation) in all content areas. IS,however, tend to feel that competency at the analysislevel in all content areas is sufficient for function-ing as an S/G.
Regarding provision of services, it was hopedthat S/G would eventually achieve the objectivestated in III.B, "to become an increasingly moreindependent resource coordinator, less dependent onthe RMRRC." in working toward this goal, the RMRRC-based IS was to teach the process of resource coordina-tion by modeling, as well as by providing the resource.The IS,'in fulfilling his role, was hopefully meet-ing the\goal of II.A.3 and 4, "to strengthen provisionof resources and support needs by the RMRRC; toNestablish a resource bank," as well as that of,II.B3 to 10, "to adapt training . . . by assessing com-petencies, volunteering assistance, responding torequests, providing workshops and support, gatheringinput, getting feedback, increasing job efficiency,".and II.C, "maintaining the focus initiated in 'train-
Questions 19 to 29 plus 35were takendirectlyfrom the foregoing list of objectives for the IS rolein providing services. Obviously the categories ofimplementation and resource provision overlap at thepoint of the IS role, and the results apply to both /
design components.
S/G indicate a consensus of opinion that the ISwere supportive of the S/G school-based functioning.The examples suggest that the IS remained flexible inthis:support and served primarily as a resource tothe S/G. It is interesting to note the frequency ofmention of acquisition of materials for the S/G--afunction that might normally be ascribed to the SEIMCs.In addition, responses to question 24 indicate the ISwas regularly available and more likely, frequentlyavailable to the S/G when needed.
Question number 3 on the Program AnalysisQuestionnaire relates to the S/G's utilization ofinterpersonal skills (operationally defined as reflec-tive listening, congruent sending, problem solvingand acceptance in school) with four consumer groups(teachers, administrators, students and parents).
99

Tabulation of the responses to question number 3yields consistent results across the four content areas.For example, in reflective listeding, with teachers asthe target group, the S/G rated themselves either pro-ficient or very proficient whereas the IS rated theS/G as either slightly proficient or moderately pro-ficient. These same lowered perceptions of the S/G'sskills by the IS were consistent'across the other con-
, tent areas.
Using the DA as the target group, the S/G ratedthemselves lower than with the teacher groups. Thisresult suggests that 'the DA authority position possiblyinhibits the S/G's uses of interpersonal skills. Aswith the consumer group of teachers, the IS rated theS/G lower than the self-perceptions of S/G in theinterpersonal skills areas related to DA.
The'data relating to students and parents as tar-get groups yield essentially the same patterns asthose for teachers and DA. All respondents agree thatthe skills are important to have, i.e., rated themvery useful to essential on question number 4.
Questions 5 and 6 relate to the usefulness of th\\Zervice sequence ranging from identification, diag- /
nosis, prescription and programming to evaluation.The S/G and IS all viewed the sequence as very usefulor moderately useful. The S/G not only_ perceived thesequence as useful, but in fact, utilized thesequence with many of the children referred to themfor treatment.
In rating the degree of usage (i.e., question 9)the S/G rated identification first (used mostfrequently), diagnosis used next most frequently andthen programming. Although the three components wereranked, they were in effect fairly evenly distributed.The IS perceived the S/G as using programming the mostby a wide margin. The implication is that the S/Gsaw themselves working over a broader area than theIS saw them working. In addition a second implicationwas that the S/G, as seen by the IS, tended to moveinto programming with minimal diagnostic or prescrip-tive groundwork being done.
Questions 12 to 14Questionnaire relate toindividualized training.12, 13 and 14 indicated
of the Program AnalysisGoal II.8.2, regarding
The results of questionsthe S/G were very much
100

satisfied with the training as it related to theirown needs and for making efficient use of their time.
Determining service needs and providing mechanismsfor meeting those identified heeds are valuable compo-nents of a resource service agency. Attemps were madethrough the Program Analysis Questionnaire to assessthe RMRRC's success in providing these resources. Inresponding to question 17, the S /G' indicated the ISlistened to, asked for and responded to needs thatthe S/G had.- The discrepancy indicated the the S/Gfelt the IS were more useful than the IS perceivedtheir own role.
Table 4.6 indicates a summary of responses toquestion 28. The table depicts the proportion of timethe IS used to respond to various activities. ,As canbe seen, the activities most frequently engaged inwere consultation regarding the teacher, consultationregarding the child and modeling new techniques to theS/G. The interesting result gleaned; from the datasummary, perhaps, is the relatively c.ow usage of theIS in most of the activitie listed, with one implica-tion being that the S/G wer moving to a more independ-ent role as was stated in 0 jective
In ranking the RMRRC c ntribution to the S/G forthe year in response to que tion number 35, the S/G'sand the IS's perceptions w re essentially congruent.The training program, IS assistance and regularinservice meetings with other generalists receivedthe top rankings. Inservice workshops received thelowest rankings as helpful contributions.
Question 30 was designed to get an idea of thechanging demand on the IS by the S/G as the yearprogressed. The RMRRC had postulated that as the S/Gbecame more independent, the IS would be less andless called upon. The results indicated that the peakof request for support from the IS came around mid-year as opposed to the beginning, as was hypothesized.One explanation may be that it just\took time forthe S/G to formulate the requests for service fromthe IS. It is interesting to note that the IS formeda lelsource that wag used slightly more than all theother specified resources combined.
It was hoped that the RMRRC support could bewithdrawn at the end of the year and the model wouldbe operational without RMRRC support. Responses to
101

Table 4.6 Percentage Use by S/G of Services Available from I/S as Seen by the S/G
28. Activities / .Range Mode F*
**Consultation regarding_ acher with sin 00 - 402 05-102 4
**Consultation regarding child with S/G 00 - 652 10-25% 3
with teacher 00 ..! 207 002 5
Modeling new techniques to S/G 00 - 302 10% 6
to teacher 00 - 052 002 10
Mutual problem solving with S/G ADO - 202 052 5
with teacher 00 - 05 002 8
with principal 00 - 1 2 002 6
with a group 00 - 252 002 13**
Mutual decision-making with S/G ,
with teacher
00 - 202
00.- 10%
00-052
002
5
10
with administrate 00,- 052 002 10
with group ,
,
Demonstrating creative use of limited materialswith S/G ,
with teacherI
00 - 102
00-i.-152
00 -,,,R5%
002
00%
002'
12,
6
13
Test battery developmeni for specific problems 00 -10% 002 10
Special project devel4ment ,
t, 00 - 40% 00% 6
Other activities ' 00 - 322 002 11, .
11
Frequen of Modal Response
04I 0 Bimodal Distribution
N 16

question 34 indicated that if the other resources(i.e., existing community support)-continued, the S/Gcould and would continue without the RMRRC. However,if community resources could not be utilized for what-ever reason, the S/G felt they could not and would notoperate as they had done in the1973-74 school year.
Since the role of the IS was reported, in thefirst section of the Program Analysis Questionnaire,'the remaining components of the school-based modelimplementation are for the school-based personnel--theS/G and the DA. Questions 38 to 43 of the ProgramAnalysis Questionnaire regarding the S/G role weredeveloped: directly from the objectives listed underGoals and IV.A.
Ae'single theme that appears' to run through theS/G in responses to their roles.is i\need for increasedcommunication. 'Other than this theme; responses ofall gro0s do not yield an apparent pattern. 'Thismay be an artifact of individual situations and/orindividual reactioh to context specific conditions.Of further interest, in these responses ip the'apparentlack of overlap among respondent groups that issuggestive of viewing the problem from,differingperspectives or of lapk of communication among profes-sional groups.
The scope-of S/G service in the school was varied.The number of children served directly by the S/Granged from 20 to 123 whereas the number of childrenserved indirectly was reported to range from 5 to 200.Service to teachers also varied widely. Some S/Greported serving no teachers, either directly orindirectly, while some S/G served as many as 22teachers.
In performing their varied functions, the S/Gnecessarily had considerable contact with the IS\andother RMRRC staff and/or programs. S/G were questionedif such contacts were hinderances, and i so in what\way. Responses to question 42 indicated that by andlarge the contact with RMRRC staff and/orlprograms wasnot a hinderance, although there was some concern overthe amount of data collection required.
Data related to the type of handicapped childrenserved and the degree of "mnstreaming" made possibleindicated that, as expected, most of the children seenby, the S/G could be classified in three categories of
103
a
/
V

exceptionality: mental retardation, emotionaldistrubance and learning disability. As was expectedthere was a very small percentage of severely handi-capped children served by this model.
The degree of success for mainstreaming isdifficult to assess. Responses indicated that from1 to 25 children from self-contained classes werereturned to the regular classes. The problem, how-evef, is that there are no data to tell what percentagethis is of -the total number of children worked withfrom self-contained classes.
'In coMparing the S/G role to other ry'personnel in the district, the S/G and aboutevenly split on whether the services we.... A replace-ment of an existing role specification or whether theywere an-addition. The truth probably varied with theparticular role definition in specific school situa-tions.
Discussion
The data obtained from the Program Analysi2Questionnaire were presented here in ways that describedthe roles of the various participating components of aschool-based intervention model. The data from varioussections speak for themselves. However, as a type ofsummary statement the partipipants--IS, S/G, and DA--were asked to Late the achievement of performanceobjectives stated birthe RMRRC. These objectivesappear in a'able 4.7.
Each participant was asked to sort those objec-tives achieved and those not achieved. In addition,the participants were asked to rank each group inorder of degree of success.
Criteria for achievement of the objectives wereestablished at 50 percent or more of the respondentgroup rating the objective as "achieved." This figurefor the S/G group was 8 or more responses; for the IS,2 or more; for the DA, 11 or more. S/G rated allobjectives except 3, 5, 8, and 10 as "achieved.". ISrated 3, 6, 7, 9, and 12 as "not achieved." All otherswere achieved. By the above criteria, DA rated all,objectives except-1 as "achieVed." However, objectives3, 6, 10 and 12 received the Owest frequencies ofratings of achievement. Concurrence of all groups on
CAI
174
104

4.7 Performance Objectives
1. To feed information on competencies into planning of trainingprogram of RMERC0
2. To determine if an intermediate level stratistician, actingto interface between school-based generalist and the =MCI. increase effectiveness of the generalist.
3. To disseminate information on competencies as a resource ser-vice to other training agencies, both preiervice and inser-vice.
4. To provide greater services and support to the school-basedgeneralist program, through training, assessment of resourceneidm; and provision of resource services and support.
S. T maintain the focus intitiated in the Ran training pro-ram within the context of individual schools, fitting
/school-based variations in techniques into the general Model
for service delivery.
6. To reduce organizational demand of the MAC center activi-ties on the school-based generalist, in order to free thegeneralist to better respond to requests and needs of the
school.
7. To determine if district-selected and placed generalists,from varied' backgrounds and styles, could implement thestratistician model across school systems and personnel.
8. To determine competencies needed py stratistician /generalist to
better respond to request.
9. To adapt training to the personalized and specific needs of
the school and generalist.
10. To-better define stratistician/generalist role to other resourceagencies such as SEAs, LEAs, universities.
11. To provide more service to rural areas.
12. To establish selection iteria for.a resource pool.
13. To increase district d administrative involvement andsupport, by utilizing hem as information sources on ser-vices and constraints, and as facilitators of the general-
ist operation.
1

14. To establish a service process for the generalist to impleleant and operate in the school, including methods of pro-viding resources to teachers, evaluation and programmingcoordination, and mediation of conflicts.
106
1."

C
objective 3 as "not achieved" and of two groups ofobjectives 6, 10, and 12 suggests- that these objectiveswere, in fact, not met. Reasoning inversely, then,all objectives except 3, 6, 10 and 12 were met.
Stratistician Summary
The current chapter on the stratistician modelhas ended without closure. Hard evaluation data arenot yet available on child change due to stratisticianintervention or op model adoption by district person-nel. The signifibant efforts of center staff toobtain conclusive data were frustrated by unendingblocks and design changes necessitated by district,school and child-centered needs. The subjectivereality of needs being met by the model appear validand are reinforcing. Adoption of the model is underway in several distFicts throughout the state, buttotal impact is not possible to assess at this time.A longitudinal view will need to be made at somefuture time.
The data on child change, obtained by the PRIMEinstrumentation, although fruitful for the schoolsand state, will not confirm the usefulness of thestratistician rol as planned: This disappointmentis 4enly felt b RMRRC staff members. The variabilityin the functioning of the generalists in the schoolsdue to the change in state financing was unavoidable.Thus the question still remains unanswered if successor failure of the model is a variable of.the particularstratistician/generalist or of the model itself.
Post hoc performance objectives indicate asignificant ratio of achievement, 10 to 4, but eventhis must be viewed with caution. The performanceobjectives were generated from center-wide objectivesfor the model, and may ar may not have been relevantto the specific group or groups asked to respond.
The RMRRC staff feels strongly, however, thatthe stratistician modal is relevant and that it /
provides a needed alternative as a backup fear teachersin mainstreaming efforts. The staff also feel,strongly the potential for rural teacher support,,1 byan itinerant stratistician.
(The training package, based on identified co m-
petencies for this role is a significant contri ution.
107
J. t

It is hoped further field testing and refinement willbe undertaken by other projects involved in examiningalternative service patterns.
Time and reality seem the opponents of field-based research--but time is reality and the educationfield the only valid laboratory for obtaining field-based data. The RMRRC staff is proud of the accom-plishments in this arena and of the stratisticianmodel with its reported weaknesses and strengths.
r
'108

Chapter 5
SUMMARY OF STRATISTICIAN DEVELOPMENT
A summarizing of the effectiveness of the stratis-tician model during its four year history is, at thistime, mainly a subjective ilperpretation. The analysis,however, is important to thaFfuture development oflarge-scale special education programs, as programdevelopment issues outweigh the desired outcomes of aservice delivery model. The stratistician model wasnceptualized to extend noncategorical service to
all handicapped children possible. The stratisticianservice'delivery model, as an outgrowth of the move-ment toward noncategorical education for the handi-c4pped, includes the strengths and weaknesses of themovement. The summary and analysis of the results ofth model development must be undertaken in thiscon xt.
The stratisticians were to serve the unservedhandicapped children in public schools. The datacollected in the first operational year of the stratis-tician concept (1971-1972) indicated this populationconsisted of the less involved children within theregular classroom. The category of descriptors usedin the interventions on problem classroom behaviorsmay have influenced this selection process. A clearseparation in the service delivery was drawn betweenthe more severely involved child who was treated inthe special class, since those handicapped childrenwere receiving needed services. The distinctionbetween a child's learning problem and handicap wasnever clearly drawn, and since most children experiencesome learning problems, the target population becameall children with learning problems rather thanfocusing on handicapped children, per se. This wasa strength of the model if viewed as movement toward.,noncategorical education.
The original intent of the stratistician modelwas to provide a mechanism for locating the uniden-tified handicapped who were not receiving appropriatelydesigned services, and secondly, to establish whattypes of resources were needed to help the handicapped

child within the regular classroom. Concurrently,by working in rural Utah, the MEW sought answerson the same questions for the more severely involvedchildren where little or no special support serviceswere available.
The service intentions were defined, initially,but they became lost in the implementation as thestratistician became an effective service providerinstead of a data collector. This change can beseen in the shifting focus of the role of thestratistici n in each of the three operational years.zWithin mont of initiation, the data collection- r-mechanism we kened (since the needs assessmentindicated th service model need was paramount), andthe stratist cian value to a more global resourcesystem decli ed, except in the development and fieldtesting of a service delivery model.
This change in role was apparent long before it\,was articulated, in a continual confrontation betweenthe center's service component and the research andevaluation component assigned to .operate the needsassessment mechanism. Either the selection processand training of the stratisticians did not clearlydefine theii crucial role in developing data for moreglobal application, or the daily needs in a schooloutweighed the more distant needs originally expressed.The emphasis on noncategorical education and directservice became the key focus, and the assessmentfeature drifted into a secondary role of decreasingimportance. /By the second year the service roledominated and further analysis or needs assessmentswere not undertaken,\but a validation of the stratis-tician model was initiated.
The shift in focus was not alien to the role thecenter served at that time, for it was assigned tofacilitate development of services for handicappedchildren in Utah, and not to the later-assignedregion. This initial limitation by BEH to a one-state service mode made the lat r shift to a regionalfocus more difficult, since much effort and timehad been invested in the development of the stratis-tician model. The proposal for he third-year opera-tion had been submitted and accep ed and commitmentshad been made in Utah for continu tion of the stratis-tician model before the center was requested toexpand services to the region. A key decision hadto be made at that time regarding the completion of
110
j

the field tests and the initiation of regional services.
The decision was made to complete the projectedfield testing of the stratistician model by completingit as quickly as possible, while expanding regionalefforts as rapidly as possible.
The different priorities of the stratistiCiansor service component and of the research/evaluationcomponent were also influenced by a basic disagreementover formal testing. Formal testing has historicallybeen difficult to apply to educational programmingand test results often have been unused or misused.The service staff members preferred to use informaltechniques, and to avoid labeling of children whereever possible with formal test measures. Thisposition resulted in limited uniform data resultingin a relatively uninterpretable data base; hence theevaluative function was reduced to an obscure andineffective level.
The difficulties in development of reportingtechniques were compounded by the efforts of school-based personnel to. reduce record keeping. Yet therewas no evidence of the use of alternative approachessuch as the individualized instruction techniqueswith criterion references for evaluative data base.Alternatively, formalized diagnostic efforts couldave been used and more effort could have been placed
into interpreting results and establishing educationalprescriptions. Neither approach was utilized.Instead, a free-form effort, whose value cannot beestablished, evolved.
The original work in Stage One was to collectdata to define inservice training needs. Measurementof this process was lost in the second year, and areplacement was not instituted.
The occurrence was not unusual for special educa-tion. The issue of measured control versus immediateneed gratification has been a central and controversialissue in many projects. Intentions in projects oftenbecome subverted to the generation of positive feed-back by adopting postures acceptable to the educa-tional community. A continuing cycle is started andthe initiating purpose is lost. In a center withthe complexity of the RMRRC, this process can lilyoccur if staff focuses on specific approaches tither
/
than on the global questions and goals of the enter.
111
1 6

From a program analysis view, the problems wereinherent in poor planning techniques that did notdevelop expected outcomes desired for specific needs.The established goals and objectives were general anddid not specify small component, measurable activities.In this situation, guidelines for program operationbecome obscure and,, direction of the organization is-established by immediate needs instead of by theorganization goals.
Inherent in this problem was the development ofconflicts between individuals. The likelihood wasthat mutually supportive activities decreased becausethey are not generated by common planning, althoughthe coordinators for training and evaluation, asmembers of the RMRRC executive board,-participated inall center planning. These flaws were typical oflarge educational,ventures. By trial and error overa span of years the programs develop a workablesource of operations. The data would suggest thatthis general situation has defined in those last twoparagraphs) existed within the center and particularlyin the stratistician program.
The few indicators from the data Stage One modelindicated that it was very likely that the stratis-tician model wail an effective mechanism for providingservices to children in regular classes, and that itcould effectively provide a needs assessment mechanism.The model also showed that it could potentially serveas a resource link and that it could support childrenin regular special class placements. That thisindication was never proven conclusively, was unfortu-nate.
The fourth year model (Stage Three) was aninteresting paradox relative to privious programdirections. The intermediate stratistician becamea resource linker and inservice training person7 andbegan to serve more of a regional function as anitinerant resource person. The person; by servicingsix districts, began to provide a more cost-effectiveservice and in the training role, workshops evolvedon common problems which began to meet some of theinitial goals of the stratistician concept firststated four years earlier. In the fourth year,training models also were developed based on theexperience of the. preceding four years; the originalModel had earlier sought to formally evolve thatprocess so a resource system and better measurement
112

of handicapping conditions would develop.
One result of the direction variation and thenonprogrammed activity was a rather small number ofmeasureable outcomes and products. The data outcomeswere generated in the project's second year and thetraining models in the fourth year. These productswere the basic measureable outcomes that could bestated in May, 1974. The remaining effort was lostin the experiences of the people who served and insome unmeasured gains for a number of children in Utahsubregions.
These problems could have been avoided bystructuring the program as discussed in Chapter 4 ofVolume I. The relationship of'organizationalelements to specific purposes was crucial, but, moreimportantly, itestablished the flow of goods andservices from the center to specific target groups.Purpose and expenditure would have been bettermatched, and a better probability would have existedthat outcomes would have been achieved.
Consistency in the overall center role would bea basic ingredient to such program structuring. Theinitial RMRRC proposal envisioned a regional role, butBEH requested that the center serve Utah only. Thethird year of funding had begun when BEH requestedthat the RMRRC expand services to the region. Thisinconsistency of role is reflected in changes in thegoals of the RMRRC and the functions relative toachieving these goals. Clarity and consistencyappear to be basic ingredients needed for successfulintervention by a regional service agency, plus aguaranteed longevity of service to enable developmentof alternative models, regional support, andacceptance.
113
J

Chapter 6
TRAINING PROGRAM
The RMRRC has included training as an activeingredient of its program of services. The programhas included a range of preservice and inserviceactivities which are summarized in Table 6.1. Theseactivities have often been in response to specificrequests by the general educational community of theregion. Other training activities were directed toskills improvement of RMRRC stratisticians and thestratistician/generalist. To simplify the presenta-tion an overview of the workshop activity since earlyin 1972 will be presented, as well as the integratedtraining program for the Stage Three stratisticianmodel (1973-1974). The workshops represent a combina-tion of inservice and preservice activities. Includedwithin the workshops are responses to needs of Outreachprograms.
The training program for the stratisticians in1973-1974 is used to provide an example of how theRMRRC developed integrated training programs, anddesigned evaluations to measure their worth. Theprocess was still under development when the currentRMRRC program ended, and reflected the evaluativeredesign process that was an inherent ingredient inall RMRRC activities.
Workshop Program
The workshop program was an in-demand servicethat followed a standard sequence after initiationof a request from the user. The requests werereviewed by the RMRRC executive committee to determinetheir appropriateness. ; If they were approved, theactivity was assigned to an appropriate RMRRC staffmember to prepare and implement the workshop. Anevaluation instrument was developed by the responsibleRMRRC member and used as a part of the workshop. Thework flow sequence is shown in Figure 6.1.
The workshops presented spanned a range of

Table 6..1
General Types of Training Provided by RMRRC
I. Inservice
II: Pre-service
A. Appraisal (diagnosis, prescription,programming, evaluation, etc.)
B. Needs Assessment
C. Student Consultation and/or Demon-stration
D. Comeunication Skills
E. The Role of the Generalist
F. Outreach Activities
A. The Stratistician Model
B. Communication Skills
C. Curriculum (appraisal)
D. Competencies
116

Request made),to RMRRC fora workshop
Staff memberdocuments and
'refates to exist-ing workshops
Notify RMRRC Executive Notify ofrequester Committee reviews- acceptance
'1*
file and establish
IRefe
I
ral Not Appropriate, HavIe aappropriate but no work- workshop
shop exists available
Cannot Willdevelop ( >developworkshop workshop
schedule
Develop Assignworkshop(-.develop-
ment re -
pponsi -
bility
1 Plan andmake final
arrangements
Apply ------->Collectstandard dataevaluationprocedure
Figure 6.1 Workshop Work Flow Procedure
117

situations. A listing of the workshops presented bythe RMRRC staff since August 1972, is compiled inAppendix B, Vol. I; Table 6.2 summarizes the informa-tion from the appendix. A listing of the workshopsavailable on request from LEAs, SEAs, Training Pro-grams, and other service agencies is contained inTable 6.3.
Ideally an evaluation staff member participatedin the workshop evaluation, but scheduling problemssometimes precluded this interaction. The analysisof the center program highlighted this problem andchanges were instituted based on that analysis in thelast six months of operation. The changes included.
=the following:
1. Evaluations were based more on contentvariables, i.e., the substance of what waspresented rather than on the mechanics ofpresentation;
2. the evaluative data were analyzed and feed-back provided to the workshop staff;
3. evaluation/research became more directlyinvolved in the planning process;
4. the center management sought more directinformation for the overall operation of thecenter program.
Training Program 1973-1974
The training activities of the RMRRC in its fourthyear of operation were focused to'support the stratis-tician, service program. The stratistician programwas to be developed in the two-level design discussedas the Stage Three stratistician model. The integra-tion of the program design was to test the concept ina large number of schools, andit was decided that to
imake the effort successful an integrated trainingactivity would have to be incorporated into theplanned program.
The objective of the center was involve 18 to20 special educators in the program, with the districtsproviding the financial support for teachers assignedin the districts. These teachers were to be qualified
118
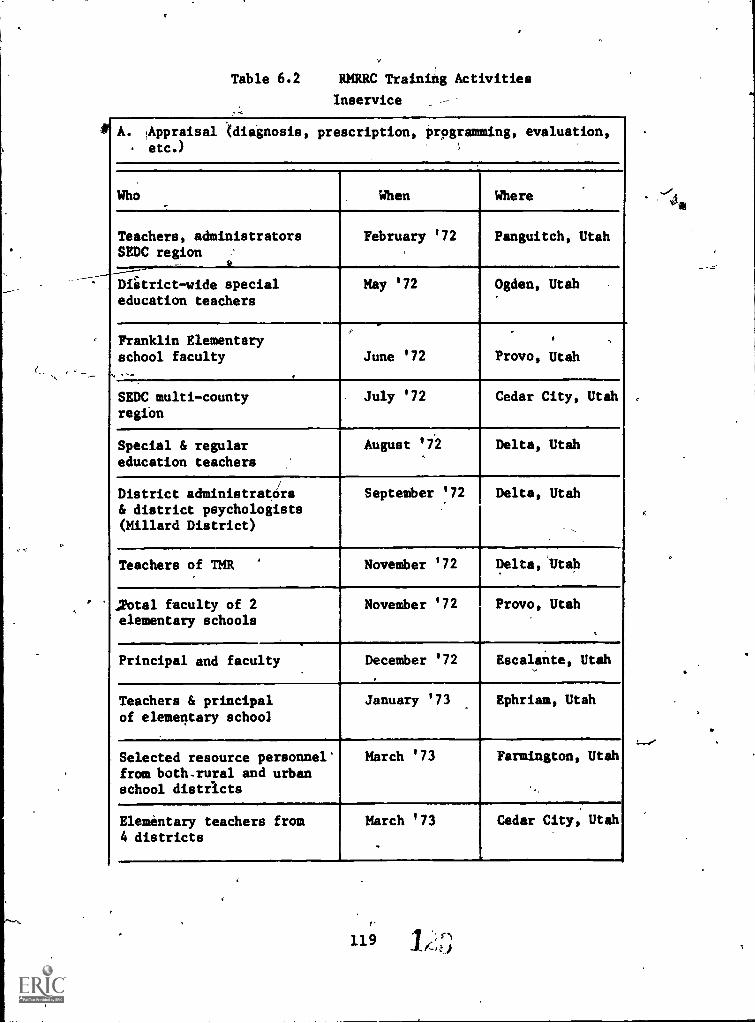
Table 6.2 RMRRC Training Activities
Inservice
A. Appraisal (diagnosis, prescription, programming, evaluation,etc.)
Who When Where
Teachers, administratorsSEDC region
February '72 Panguitch, Utah
District -wide specialeducation teachers
May '72 Ogden, Utah
Franklin Elementaryschool faculty June '72
,
Provo, Utah
SEDC multi-countyregion
July '72 Cedar City, Utah
Special & regulareducation teachers
August '72 Delta, Utah
District administrator/s
& district psychologists(Millard District)
September '72 Delta, Utah
Teachers of TMR November '72 Delta,'Utah
,Total faculty of 2elementary schools
November '72 Provo, Utah
.
Principal and faculty December '72 Escalante, Utah
Teachers & principalof elementary school
January '73 Ephriam, Utah
Selected resource personnel'from both-rural and urbanschool districts
March '73 Farmington, Utah
Elementary teachers from4 districts
March '73 Cedar City, Utah

A. ,Appraisal (continued)
Who When Where
Total school faculty (emphasison students with behavioralproblems)
April '73 [ Mt. Pleasant, Ut,
Teachers (35) in community,coordinated child care center
May '73 Butte, Montana
Special education teachers,principal
June '73 Provo, Utah
Teachers and district person-nel, including District Dir.of Special Education
October '73 Vernal, Utah
AMID October '73 Denver, Colorado
Resource teachersJordan School Dist.
Nov./Dec. '73 Sandy, Utah
LD teachers SEDC region Nov./Dec. '73 St. George, Ut.
Special education facultyand students
Jan. '74 Billings, Mont.
School faculty and principalSandy Elementary School
March '74 Sandy, Utah
Six district teams - in-cluding teachers, admin-istrators, supt.
March '74 Phoenix, Ariz.
Curriculum conference forAlpine District specialeducation personnel
March '74 Orem, Utah
Participating DistrictsAdvisory Committee (PDAC)
April '74 Salt Lake City,Utah
School facultyAlpine School Dist.
April '74 American Fork,.
Utah
120
ei

B. Needs Assessmerit
Who When Where
PDAC - SEDC region March '72 Cedar City, Ut.
School faculty at Gar-rison School regardingneeds of Chicano students
April '73 Garrison, Utah
Rural/Remote Conference December '73 Portland, Ore.
Montana special educationadministrators (state-wide)
February '74 Big Sky, Mont.
District administrators, spec-ial and regular teachers(6 districts)
March '74 Scottsdale, Ariz.
Wyoming State Dept. of Ed. March '74 Cheyenne andTorrington, Wyo.
State Director of Spec. Ed.and staff
March '74 Billings, Mont.
C. Student Consultation and/or Demonstration
Whb When Where
Faculty and administrationBryce Valley High School
August '72 Bryce Valley, Ut.
Escalante Elementary Schoolworkshop and progress check
February andApril '73
Escalante, Ut.
Fifth and sixth gradestudents (60) to initiatecross-peer tutoring system(Beaver School District)
October '73 Milford, Utah
121

C. Student Consultation and/or Demonstration (continued
Who
Idaho State Dept. of Ed.
When, Where
March '74 Boise, Idaho
D. Communication Skills
Who . When Where
Parents of students inspecial education and13 district specialeducators
May '72 Provo, Utah
Paraprofessionals and TMRteachers(Jordan School District)
July '72 Sandy, Utah
Southern Utah SupervisorsAssociation
March '73 St. George, Ut.
Outreach staff members May '73 Easlacier,'Montana
/
Millard District personnel August '73 /Delta, Utah
E. The Role of the Generalist
Who When Where
Garfield Districtsuperintendent and cur-riculum supervisor
May '72 Panguitch, Utah
District administrators& generalists (Weber Dist)
August '72 Ogden, Utah
122

'E. The Role of a Generalist (continued)
Who When Where
Utah Education Assn. Conv.for CEC members
September '72
4
Salt Lake City, t
Utah
WICHIE Conference June '73 Albuquerque, N.M.
-
Milford ElementarySchool faculty
August '73
.
Milford, Utah
State conference on M.R. September '73 Salt Lake City,Utah
Tooele County DistrictBoard of Education
October '73 Tooele, Utah
Resource teachers March '74 Cheyenne, Wyo.
F. Outreach Activities - Severely Handicapped, etc.
Who When Where
District pupil personneland special educationdirectors
October !72 Salt Lake City,Utah
Parents, students of Dixie
College
October '72 St. George, Utah
Montana Outreach personnel December '72 Billings,,Mont.
RMRRC staff, LEA, Universityof Utah and Outreach repre-
sentatives ,
March '73,
Salt Lake City,Utah
,.
Montana,CEC Conference March '73 Helena, Mont.
123
7-:

F. Outreach Activities - Severely Handicapped, etc. (cont.)
Who When Where
Univ. of Utah personnel,USBE, Utah State Training 1
School and parents
August '73(2 times)
Salt Lake City,Utah
Special education teachers October '73 Casper, Wyoming
AAMD October '73 Denver, Colorado
Faculty and students atEastern Montana College
November '73 Billings, Mont.,
150 participants from six-county area served by Utah'sThird District JuvenileCourt
March '74 Provo, Utah
124

Preservice-,
A. The StratisticianModel
Who When Where
Graduate Students August '72
....
Utah Statte UniversityLogan, Utah
...
District specialeducation and pupilpersonnel directors
,
November '72
.
USBESalt Lake City, Ut.
NIW
National CECConference April '73 Dallas, Texas ,
.1.
Special educationstudents and faculty
I
July '73
---,
Eastern MontanaCollegeBillings, Montana
B. Communication Skills
Who When Where
Special EducationFaculty and GraduateStudents .April '73 University of Utah
Salt Lake City, Ut.
C. Appraisal Curriculum
Who
Summer Seminar -Graduate Students
When Where
July '73
Faculty, students November '73
125
University of UtahSalt Lake City, Ut.
Eastern MontanaCollegeP411ingst Montana
I : 9

C. Appraisal Curriculum (continued)
WhenWho Where
Graduate student class January '74 University of UtahSalt Lake Cit Ut.
Faculty, Outreach Coor-,dinators, State Depart-ment Personnel January '74 Helena, Montana
D. Competencies
Who
...
When Where
Special EducationGraduate Students
..
July '73 Utah State University
Logan, Utah
Outreach SteeringCommittee September '73 Moran, Wyoming
126
la()

Table 6.3RMRRC Available Workshops
June, 1974
Identification of Handicapped Children. Workshop focuses on teach-er identification of a handicapped child through observation, com-parison, and informal testing. The child's developmental discrep-ancies are noted to develop program objectives so that the childcan achieve to his potential.
Pre-Assessment of Kindergarten Students. A process for preassess-ing kindergarten students for grouping and instructional objectives.For kindergarten teachers, administrators or aides.
Early Identification of Potential Learning Problems in the Pre-School or Kindergarten Child. Training in the administration of atest for early identification of high-risk kindergarten children:Diagnosis, prescription, and programming in the following areas:medical referral, visual acuity, auditory acuity, speech and artic-ulation, cognitive processes, fine and gross motor abilities,visual perception, auditory perception, auditory discrimination,verbal expression and general knowledge. Also includes an intro-duction to several parent and teacher questionnaires and how theymay relate to high-risk children.
Identification of the --and Program Establishment. Quickmethods of identifyin Urea:Oho are above average academically
or creatively. Prograd evelopment based on group components.
Referral to Diagnosis. The process which resource people use fromthe referral to the decision to make a diagnosis, and/or the proper
diagnostic instrument.
Procedures in Diagnosis. Overview of processes used traditionallyin standardized diagnosis and contemporary methods in informal
diagnosis.
Synthesizing Diagnostic Information. Critical analysis of diag-nostic test data and task - observational data to be summarized andinterpreted for single diagnostic conclusions.
Systematic Obeervation of Behavior. Organizational technique inobserving, recording and interpreting behavior of school children.
Selection and Training of Student Tutors. The training of astudent tutor group or the tutor trainer in role identification,techniques for reading and math, material development, behavior
management, and record keeping.
12f
/
(continued)

Table 6.3 (continued)
School ResourceTeam. How to utilize team members in the groupprocess and skills of identification, diagnosis, presecriptionand programming.
Task Analysis. How to task analyze any teaching objective; makingterminal objectives, en route behaviors, and deciding entry behav-iors.
Competency Based Training Procedures. Investigation of identifiedcompetencies of selected specialized personnel. Methods in defin-ing teaching units and measurement of proficiency in training.
Reading,Instruction. A comparison of strengths and weaknesses ofvarious programs and of problems created as students move from one/reading program to another.
Reading and Math. Specific steps in teaching thematics and read-ing skills. Efficient ways of constructing wo sheets and devel-oping games to provide practice in reading and/math.
Behavioral Intervention and Management Techniques. A model for anoverview of comparative approaches for monitoring behavior relatedto student-to-student interaction, teacher-tO=student interaction,
administrative arrangement and classroom organization plans.
Precision Teaching., Precise measurement o, behavior and steps to,change the behavior.
Application ql,Glasser's Reality Therapy in the Classroom. Step -
by-step guidren how to get children to assume responsibility fortheir own behavior.
Interpersonal Skills.a. Relating as a human being
(1) avoiding power struggles(2) honoring the other's state of being
b. Communication skills(1) sending, and(2) receiving messages
c. Gaining acceptance in the school systemd. Problem-solving methodologies
(1) interpersonal(2) group(3) establishing goals.
10(.04 14*4
128
generalists*. The generalists were to function asstratisticians with their main service activitiesdirected to teachers of handicapped children. A groupof 30 school districts, primarily located...in ruralareas, were invited .to participate by the USBE.Twenty school dist icts replied to the invitation bythe Deputy Superin endent for Instructional Services.
All districtsfresponding were presented withfurther program details, and expectations for boththe RMRRC and the district. Superintendents who wereinterested agreed: (1) to assign teachers on theirdistrict payroll; (2) to release the teachers one daya month durfkg the school year for training; and (3)to participate in the evaluation of the effectivenessof the model. In return the RMRRC would: (1) providea two-week training session during the month ofAugust, prior to school; (2) provide personnel (anintermediate stratistician) from the,center to supportand backup the stratistician/generalist as he workedin the field; (3) cover the costs of the training,which would include travel, a stipend, and per diem;and (4) cover the cost of evaluation and share allevaluation data with the districts. These arrangementswere to continue throughout the school .year. Agree-ments were reached with 11 districts, and 17 specialeducators from 17 elementary schools.
.As each participant entered the RMRRC'trainingprogram he was assigned to an RMRRC intermediatestratistician, based on the geographic location ofthe participant's school. The intermediate stratis-tician followed the assigned generalists from theirentry into the program to the completion of the schoolyear. The generalists' individual needs and abilitieswere analyzed and responded to by the intermediatestratisticians beginning with the training session.
*The official state certification requirementsfor a generalist have not yet been published.According to a USBE spokesman, the generalistconcept was developed to meet the needs of handi-capped children in rural areas. A generalist mustbe certified in some area of special education,but should be more broadly trained to serve handi-capped children in several categories. A generalistcategory provides an option for districts tocreatively meet the needs of their particulararea.
r-
129

The training session was felt to be an importantelement of the program since the RMRRC had littlecontrol over the selection of the generalists. Theprocedure was for the district to mate the selectionjust as it would select staff for a* other positionin a school. The participants in the program there-fore would have a range of backgrounds and experiencelevels. The RMRRC hoped to minimizerEhis variationby providing a training program prior to the schoolyear that would first assess each generalist's skilland knowledge levels,,and then individualize a train-ing effort to meet each persons's needs.
In order to facilitate the development of theprogram within school districts the training and theevaluation coordinators of the RMRRC tried to meetduring August with all 17 principals of the schoolsand the district, directors of special education fromthe 11 districts to orient them tosthe program. Thisorientation included an overview of the stratisticianconcept, an overview of the development and structureof the training program, the support service modelfrom the RMRRC to the schools, and the evaluationprocess to be employed. In addition, an attempt wasmade to orient the faculty members of the 17 schoolsjust prior to the start of school, or.during thefirst two weeks of school. This procedure wasundertaken to familiarize the regular classroomteachers in the 17 schools with the concept, to createawareness of the support services available to them,and to specify what the program could mean to eachof them 'in the classroom.
Development of The Training Program
Planning of the training program began early inthe year, as depicted in the work plan of Figure6.2; and was directed toward solving potentialproblem areas in implementation of the trainingactivity. Once a general framework was selected andspecific planning began, three major types of con-straints were determined to exist:
1. Variety of professional backgrounds intraining. To function as a,resourceteacher or a generalist in the state ofUtah, a person may hold one of four differentspecial education endorsements: learningdisabilities, mental retardation, behavioral
130

Raw Data(training)
March 30
Trainingprogramsreviewed
Competen
cies fortrainingstatedMay 4
IMINI,Objec-tives
stated
June 1
April 27
Training Training Workshopmodel progenies formatselected develop- structur
ed edJune 1 July 13 July 21 .!
Workshop
Adminis-trators
nrkti~ shopformat
Workshop
workshopdeveloped
14--- structured
June 15 July 27 August
Adminis-trators
selected
Districts Responte Districts
notified deadline selected
March 23 April 20 General-ists
selectedCalendarsreviewed
Workshopdates sat
Pig. 6.2 Timeline for Generalist Training Program

disorders, or speech and hearing. Thepeople coming into the training programcould come from any or all of these fourspecial education backgrounds. Furthermore,they would have been trained at vagpusteacher training institutions; certificationprograms in the four areas vary greatly.between institutions in course content.
2.\ Variance of professional experiences. Becausethe districts selected the special educatorsho would be participating in the program, its anticipated that some of the special
educators would have previous experience inre ource rooms, some would have previousexperience in regular classrooms, and some--just graduated--would not have any actualteaching experience. There were also someparticipants who had previously served insupport roles, such as psychologist, socialworker and counselor.
3. Variance in school beginning dates. Beinginvolved in 11 districts across the statemeant that some classrooms were opening asearly as August 24, and.others not untilSeptember 6. This variance affected theavailability of the participants for trainingin August.
Analyses of the constraints suggested that thetraining program could best neutralize the negativeeffects of three constraints if it were designed tobe individualized to each participant and competencybased. These combined,approaches would allow for thevariance in profession i..1 expertise and experience,as well as the staggered starting dates. A period ofthree weeks was set aside in August, and participantscould begin the training activity in any of six start-ing dates and would then participate for ten days.
Information upon which the competency basedtraining program was developed came 'from three generalsources. First, a search was made of the literatureon competency based programs (Appendix F). Thenseveral individuals working on competency basedprograms from across the country were contactedindividually, and materials obtained/from them. Dataalso were collected from special educators in Utah asto what skills were needed for a person to provide
i32

educational services to all types of handicappedlearners. Ih the process, data also were collectedon various methods Of training for these competencies.Based. on these data a decision was then made as tothe most effective training model to meet the needs
. of the generalists.
Within the context of the training model selectedan extensive evaluation was undertaken to identify thespecific competencies needed to function in thegeneralist ,role. In addition to data collected inpast years by the RMRRC stratisticians while they wereworking in the.role, additional data were collectedfrom three school districts where special educatorswere working in resource room /generalist programs.These resource teachers or generalists were asked tolisethe skills they felt were needed to fill theirrole -- whether they had the skills or not. In someinstances they were asked to prioritize the lists of
. - skills.
Data on the skills needed to respond to specificstudent problems were collected through a workshopconducted by the USBE in cooperation with the RMRRC,and sponsored by Project Outreach-Utah. The partici-pants of the workshop were invited to brainstorm theirperceptions of student problems. Over 100 problemswere listed and compiled into major groupings. Fromthis data, lists-of teacher skills needed to help meetthe identified needs were then generated. (A list ofthe printed materials on needed skills comprisesAppendix G.)
To summarize, a data base on individualized 4ndcompetency-based teacher training was gathered fl-mRMRRC stratisticians, local districts, and the USBEworkshop. The data were then pooled with informationgathered from various...universities, teacher training
--Institution d-state departments of education--allo involved in competency based or performance-based programs. An RMRRC staff member gestalted thismaterial and provided a list of all competenciessuggested as well as a frequency count to determinethose most frequently suggested. The competencies,fell into the content areas of identification, diag-nosis, prascription, programming, evaluation andim,.rpersonal skills. The first five content areaswe.... consistent with the Regional Resource Centermandate for service under PL 91 -230. Interpersonalskills was a high-frequency compentency area, especially
133

in the field data,
During the period in which competencfes werebeing identified, the structure of existing competencybased training programs was being reviewed. Mosttraining programs reviewed identified important contentareas, but few training programs specified clearly thelevels to which one should "know" a content area, orthe process level at which one would use the informa-tion. Two notable exceptions are the Meyen and Altmantraining program (1973) at the University of Missouri,and L. E. McCleary's training program (1973) at theUniversity of Utah. Meyen and Altman talked about anawareness, understanding, application level; McClearyabout familiarity, understanding, and applic tionlevels of utilizing information.
In order to build a similar definition ostructure the RMRRC staff adopted, from Bloom'sTaxonomy of Educational Objectives (1956), the processlevel from the data base generated on skills andcompetencies. The resultant Intent-process areasform a matrix (presented in .le 6.4) from which com-petency statements were generated.
This matrix aided the decision-making process indeveloping training modules; i.e., to which level doesa given person need to know certain information, andin which certain content areas. Decisions were madeas to what a stratistician needs only to know comparedwith what he actually needs to be able to do. Thecompetency statements were crystallized into state-ments around which training modules were developed.(Table 6.5). These modules were numbered 1 through24 dnd the numbers were placed in the appropriatecontent-process square in the matrix. Each modulewas to be developed based on the content area and theprocess involved.
Training Program
RMRRC staff members, utilizing the proceduredescribed, developed the training program. The com-petencies that were to be required of participants inthe training are defined in Table 6.5. The statementswere related to specific training packages. The'outline of the content of these packages is presentedin Appendix H. The outline was developed from thematerial described in the preceding section; as module
134
1t S

Table 6.4 Placement of Learning Modules by Number on the Content-Process Grid
Content
IDENITY DIAGNOSE PRESCRIBE PROGRAM EVALUATE
KNOWLEDGE(recall)
COMPREHENSION 1 7 19
(understanding) 2 8
APPLICATTON 3
1 , (use) 4 10 20
... ._
ANALYSIS 11 16
.
(clarify) 12
13
SYNTHESIS,(regestalt) 17 21 23
'22IVALUATION 6 14 18 24
(judgment) 15
INTER SKILLS
abcd

Table 6.5
COM?ETENCY STATEMENTS
IDENTIFICATION
Module No.1. The generalist shall demonstrate an un rstanding of
specific speciality areas and classif cation criteria.
2. The generalist shall demonstrate an understanding oflearning theories.
3. The generalist shall utilize conventional task analysisof basic sub).ect areas.
4. The generalist 0.111 utilize conventional processanalysis/Of basic subskills (in task analysis).
5. The gerieralist shall interpret personality behavioral
patterhs.
6. The generalist shall synthesize identification factorsand derive a diagnostic direction.
DIAGNOSIS
7. The generalist shall demonstrate an understanding ofstudent demographic variables.
8. The generalist shall demonstrate an understanding of
formal test batteries,
9. The generalist shall administer formal test batteries.
10. The generalist shall administer informal test batteries.
11. The generalist shall interpret formal test batteries.
12. The generalist shall interpret informal test batteries.
13.. The generalist shall interpret pupil interviews andobservations.
14. The generalist shall formulate a diagnostic statementfrom a single test.
15. The generalist shall formulate diagnostic conclusions
from cumulative information.
.ij
136
11
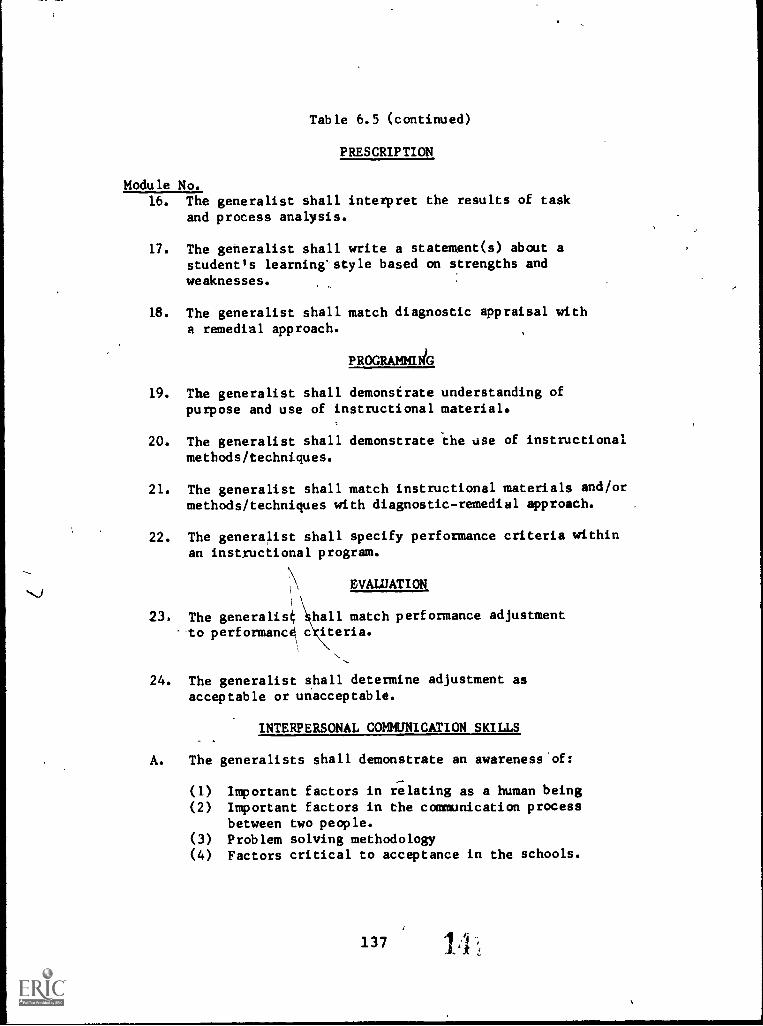
Table 6.5 (continued)
PRESCRIPTION
Module No.16. The generalist shall interpret the results of task
and process analysis.
17. The generalist shall write a statement(s) about astudent's learning'style based on strengths andweaknesses.
18. The generalist shall match diagnostic appraisal witha remedial approach.
PROGRAMMING
19. The generalist shall demonstrate understanding ofpurpose and use of instructional material.
20. The generalist shall demonstrate the use of instructionalmethods/techniques.
21. The generalist shall match instructional materials and/ormethods/techniques with diagnostic - remedial approach.
22. The generalist shall specify performance criteria withinan instructional program.
EVALUATION
23. The generalist hall match performance adjustment--to performance c iteria.
24. The generalist shall determine adjustment asacceptable or unacceptable.
INTERPERSONAL COMMUNICATION SKILLS
A. The generalists shall demonstrate an awareness'of:
(1) Important factors in relating as a human being
(2) Important factors in the communication processbetween two people.
(3) Problem solving methodology(4) Factors critical to acceptance in the schools.
1371..

development proceeded, however, modifications in theoutlined items were made to improve the scope oftraining.
The transformation of the material from an out-line to a complete module was undertaken by givingeach module outline to an individual with specifictraining in the given competency area. Most of themodules were completed by RMRRC staff members. How-ever, material for module 1, on identification, wascontributed by several prominent university, localand state educational leaders from Utah. The sourcelist for Module 1 is presented in Table 6.6. Thisapproach was designed to utilize the range of resourceskills and expertise available to the RMRRC.
A pretest question, a posttest question, and aperformance objective were also written for eachmodule. The pretest questions were a placement testto determine whether or not a particular participantneeded further training in each competency area.Each participant's responses to the pretest question-naire created a profile that defined which of the 24modules could be skipped, and which would require theprovision of training. The performance objective ofeach competency area was used to enable the trainerto know when the participant was finished with aparticular module, and the posttest question was usedto evaluate the effectiveness of the training program.
The pretest questions were sent to the participat-ing stratistician/generalists during the month of July.As.answers were returned, they were scored and usedto develop individual profiles indicating whichmodules each individual needed or did not need. Withthis information the staff at the RMRRC geared atraining-program to fit the individual needs of eachprogram participant.
Using the above method the RMRRC intermediatestratistician assigned to each participant had aprofile of the individual's needs. Through the useof the content-process matrix the stratistician workedout a time schedule, by dividing each of the ten daysinto two three-hour blocks. The participant wouldthen be grouped in those time blocks with othersgoing through the same material at specific times. Aparticipant could be pert of the total group, in asmall group (perhaps with just one other), or be work-ing by himself--depending on his needs and the needs
138

Table 6.6 Module 1: Identification Source List
1. Emotionally Disturbed
2. Educable Mentally Retarded
Anthony LaP ray, Ed. D.
University of Utah
Robert L. Erdman, Ed. D.University of Utah
Phil Chinn, Ed. D.University of Utah
3. Trainable Mentally RetardedMabel Eide, B.A.Granite Training Center
4. Learning Disabled
5. Hearing Impairment
6. Visually Handicapped
C. W. Freston, Ph. D.University of Utah
Betty D. Harrison, Ph.D.Brigham Young University
Grant Bitter, Ed. D.University of Utah
Ruth Craig, M. A.Brigham Young Unversity
7. Speech and Hearing Impairment
Mae Taylor, M.S.Utah State Board of Education
8. Cerebral Palsy
9. Kirk Profiles
10. Supplementan? Reading
Compiled SourcesBrigham Young University
Reprinted by Permission fromHoughton Mifflin Company
139
of the others in the training program.
Each participant received copies of the 24 modulesfor reference, even if the person did not need toundertake training in all 24 areas. At the end ofthe two-week training, the participant completed aposttest. The intermediate stratistician who wasresponsible for guiding the participant through thetraining program was the one assigned to provide back-up support and ongoing training to the participantthroughout the school year.
To augment, the initial training, a resourcesupport system was developed by the RMRRC (includingfurther training) and was administered by the assignedintermediate stratistician. The RMRRC support systemwas meant to supplement--not supplant--any othersupport. service the classroom teacher had available.The classroom teacher was encouraged to use districtpsychologists, social workers, nurses, counselors, aswell as the USBE specialists or any other availableres rce. The ultimate goal was to provide the bestpos ible educational support to the student.
The generalists were visited in their schoolti atlea t twice a month, and often more frequently by,on of the .three RMRRC intermediate stratisticians.These sessions allowed generalists regular interchange
h a highly skilled professional who could respondt their needs for assistance or for personalizedtraining (if needed). In addition to receiving regularpersonal visits from intermediate stratisticians, thestratistician/generalists had monthly meetings at theRMRRC for additional training. Information presentedat these meetings included:
Initial referralsSelection of diagnostic instrumentsSystematic observation of behavior instrumentChildren with behavioral disordersVisits to exemplary centers
a) in school districtsb) in private clinics
Presentations by stratistician/generalists onunique plans they have instituted in theirschools.
140

EValuation and Discussion
\In order to evaluate the impact of the stratis-
tic4n/generalist model, the RMRRC decided to collectdata from several sources including children (handi-capped and non-handicapped), teachers and adminis-trators. The diagram below presents a brief outlineof the scope of the evaluation plan:
Children
1. Achievement
2. Intelligence
3. Socio-emotional
Teachers
1. Perceptions of classroom climate andattitudes toward certain philosophies ofeducation.
2. Impressions and observations of selectedchildren in the classroom.
Administrators
1. Questionnaires for principals, directors ofspecial education and superintendents, ondescriptive information from the schooldistrict.
The above evaluation plan was based on the useof materials developed in Project PRIME. The designand its problems are discussed in Chapter 4. Thedesign illustrates the integration of the evaluationof the service delivery model with the trainingactivity. The integrated nature of both activitiesmade it difficult to evaluate the component activitiesseparately.
An effort at evaluating the competency levels ona pre-post-post basis (July, 1973; August, 1973; andJune, 1974) wasNundertaken using other instrumentation.The instrumentation sought to establish knowledgeabout competency areas and the results are reportedin Chapter 4. Additional information was gatheredusing a questionnaire at a June, 1974debriefing andis also discussed in Chapter 4.
14114:4
Summary
RMRRC training, activiti s began with programsto prepare the stratistician to serve as a resourceperson for teachers; the firs expansion of trainingactivities included workshops r inservice trainingsessions for teachers in the st atisticians schools.From there, activities expanded o include teachersand others outside the stratistic an schools, includ-ing preservice training activities in teacher traininginstitutions. The experience gaine from respondingto workshop requests and from analys s of the typesof requests received formed the basis for developmentof the sratistician/generalist trainin program.
The RMRRC training manual is curren ly beingrevised and updated to include informati from theoriginal program plus modifications and a itionssuggested by the year's experience with thstratistician/generalists and their input-4 the endof the year. The content in the revised program willinclude material used in workshops, inservice andpreservice training sessions, and presentations madeby the RMRRC over the four-year period.
142

Chapter 7
RESEARCH AND EVALUATION ACTIVITY
Of all of the activities of the center, the mostdifficult to separately chronicle is the research andevaluation component. In most instances research andevaluation fused into one activity and that activityin turn fused into the component activites of thecenter. Pure research was never considered anappropriate center activity. Applied research wasconsidered appropriate if it were related to servicedevelopments which were based upon state and/orregional needs. Therefore, the overall researchthrust of the center was minimal. Specific activitiesrelated to Outreach programs and flow-through moniesare discussed in Volume III of this report.
Evaluation, from the center's inception, wasconsidered an integial part of center design, bothfor accountability and for program monitoring andguidance. The development of an evaluation modelwhich would address planning, management and operationsof a large-scale regional program was never success-fully completed. No existing model was found that wasapplicable; the problems of developing a model werecompounded when the thrust was changed from a stateto a regional program. The specified entry into theeducational systems was at an indirect service level(SEA) and the required accountability was at a directservice level (LEA). This issue' was addressed withvarious methods, but none completely satisfied thecenter evaluation staff.
Inherent in the problem of accountability is thatchild counts are not particularly good measures of acenter's impact on educational programs. The numberof regional forces and programs that jointly impact
;0
on a child is rather large; hence the development ofan accountability syste requires methods of seekingto assign weight to chan es in children (or servicesto children) so that a multiplicity of agencies donot all count the child change as due solely to their
efforts. Also, child counts do not represent qualita-tive change.

Specific research issues were investigated duringthe project. These research activities focused on thedevelopment of supportive data for the ongoing serviceprogram and almost exclusively revolved about thestratistician program. The general history of theresearch program is depicted graphically in Figure7.1. The integration of the evaluation function intothe other center programs is also visible in thegraphic model. The following section will discussthis overall activity; appendices on the three primaryresearch efforts provide examples of the researchactivity.
Evaluation and Research Interaction ,
The shifts in the focus of the evaluationactivity paralleled the shifts in the service processdescribed in the review of the stratistician model.The early evaluation activities were envisioned aspart of an applied research activity that includedneeds assessment and measure development. This evalu-ation activity continued through the second, year.The study of affective teacher behavior, stemmingfrom, the first year's research, was initiated andcontinued through the third year of the project as aseparate study rather than as an evaluative activity.
Changes in the focus of the evaluation componentare documented in the yearly proposals. The yearlyreplanning, based upon feedback from the previousyear and on BEH directives, resulted in changes instaff or,organizational structure which in turninfluenced the design and implementation of evaluativeactivities. These changes will be reported in thefollowing chronological description of the concep-tualization'and outcomes of separate evaluationprojects.
During the first year of the project, two of thethree research studies reported in the appendices wereinitiated. One study undertook a needs assessmentthat,,provided the preliminary information for launch-ing of the stratistician model. The other study wasdesigned to validate the use of a teacher observationinstrument measuring the affective behaviors ofteachers and their relationship to student achievement.These two studies bequeathed two separate lines ofevaluation activity. The main activity stemmed fromthe needs assessment and supported the stratistician
144

(1970-71)
SERVING UNSERVED HANDICAPPED CHILDREN'IN PUBLIC SCHOOLS
440More Advantegous Classroom EnVirosTent for Handicapped Children
4 ! 4Help fo'r Teachers Of Handicapped Better Placement Strategies
At°IResearch Model I
Needs &AttitudesAssessmentTeachers
4Instrumentfor Observation
of of Teachers
(1971-72)
BEH Directives
ifService Model j
evaluation modelbuilding; datacollection onstratisticians
Dl 't Model-tot
(1972-73)Model building
IdentificationProject
Continuation ofIdentification ProjectO
(1973-74)
Development ofT.A. evaluationforms
Fig.
!TIM ogicaI Study
1111111110141JIIMUt
report
completedreportcompleted
40
data on present search freferral policies affective
instruments
S.O.B.
Continuationof modelbuildingm 1
Continuation of evaluationmodel using PRIME Instruments
49Affect/ObservationStudy
1
Training Model
filmwnuanninmentimmilkiptutMil llorgior
munalviummuntiommi
wit;Wzber Dis rict )lability
note: i
SE are cancelled activitiesME
7.1 Evolution of Evaltiative Activities
IIIIM
4ProposalContinua-tion
IlkomumiifiNillivim
Effectiveness testing of training modules and program

model; it will be through before reportingon the lesser activity irk the affective area.
The needs assessment was undertaken with a teacherquestionnaire intended to determine the types ofclassroom problems the stratistician would likely face(Appendix I). Knowledge of these existing problemswas to be used i both the selection of the stratis-ticians and in t e L development of a training programto prepare them for working,with the teacher in tileregular classroom. Included in the survey were qUes-tions concerning basic issues such as nonlabeling!and normalization; questions concerning the avail-tability of resources; and items eliciting reactionsto the proposed stratistician model.
The analysis of the data from the assessmentconfirmed the existence of classroom behavior problems,solutions for which teachers had few resources. Inaclass of 30 children, an average of 5.3 children wereclassified as "difficult." Teachers estimated thatthis 17.6 percent of the class occupied 26.4 percentof their classroom time. Of the respondents, 84 per-cent requested more special services; the teachersexpressed a generally positive attitude toward the'proposed service model. .
With respect to issues involved in n rmalization,teachers agreed that' integration into the classroomwould improve the handicapped child's Acceptance by"normal" peers. .However traditional attitudes.werestrongly eviddrlded in agreement that nonlabeling wasidealistic and would never be fully achieved; thatmajor problems would be created by large-scale trans-'fers of the handicapped into regular classrooms; andthat special education classes were justified. Basedon this information, it was decided that the stratis-tician model would be implemented to help teachersdeal with identified handicapped children placed intheir class, as well as with the "difficult" 17 percentpopulation in their classrooms which was expected toi-include a large number of the unidentified handicapped..
Data were to be gathered by.stratisticians inthe process of providing services to determinewhether the 17 percent difficult classroom studentswere part of the estimated 40 percent of Utah'sunidentified, unserved handicapped children. A databank was to be established at the center using thestratistician-developed data and would include
100
146

information on incidence and types of handicappingconditions, diagnoses, prescriptions, interventionsand their relative successes.
At the end of this research phase, major staffadditions were made to enable the implementation ofthe service phase at the beginning of the project'ssecond year. Stratisticians were hired, and theevaluation component was enlarged to include additionalresearch assistants, a research psychologist, and anevaluation director.
The research undertaken in preparation forinitiating services had been oriented toward deter-mining the feasibility of the stratistician model,but not tow. 'ts implementation, specific operation,nor evaluatic,. Theassessment data had indicated astrong difference in attitudes existed between subur-
ban and rural school district personnel. The centerinterpreted this difference among districts toindicate that the stratistician role must be allowedto evolve differentially in response to the situationalvariables of a particular placement. In fact, a studyof differential pladements in a stratified rural/suburban sample was intended to demonstrate if it wasnecessary for -pies to differ between educationalsettings. The study also was to test the overalleffects of the placement of a special educator whowould serve as a resource to teachers. Both stratis-tician and evaluator were placed in the position ofresponding to immediate'demands of the specificenvironment as well as building a model which wouldtranscend any specific environment.
The evaluation team engaged in searching foralternative measures which would satisfy both thefield and evaluation needs. Evaluators were chargedwith tracking not only the incidence of referrals andtheir outcomes, but the affective prOcess of inter-action between stratistician and teacher which con-tributed to or diminished the success of the stratis-tician intervention. The process was to be describedacross and between schools, and was to be measuredunobtrusively. As successive data collection formswere found unsuitable, resisted, or forestalled,evaluators settled for the collection of frequencydata only, and turned their attention toward plansfor the third year of funding.
It was at this time that'the results of the
147t-Jo

initial year's study on teacher observation becamesalient. If the observation technique could bevalidated as a formal instrument, the measurementproblems of tl-e second year could be circumvented.If successfully validated, the observation techniquewould have served the following purposes: a tool forstratisticians to use in their feedback to teachers;an objective measure of affective interaction processesbetween stratisticians and teachers for purposes ofevaluation; a baseline and post-stratistician datacollection instrument fcr teachers in their classrooms.
A group of raters trained in this observationtechnique could serve as a resource to the region aswell as to the RMRRC and local districts. The exist-
,
ing literature concerning the observation techniqueand its theoretical base could provide a foundationfor interpretation of and training in affective inter-action processes. Lastly, the observation data couldbe used for the experimental matching of childrenwith particular handicapping condition to individualteachers.
The study undertaken showed that the observerstrained the first year failed to discriminate dif-ferences in characteristics among the sample of targetteachers. As measured by the self-report validationinstrument, there was not enough variance in thesample to enable a satisfactory interrater reliabilityto be obtained: The negative outcomes of the studymeant that the objectives outlined had to be achievedusing other techniques. (See Appendix J.)
Additions in staffing that occurred between thefirst and second year influenced the transition be-tween conceptualization and outcome. The consultantswho had supervised the two original research projectshad an idealogical bent toward the affective domain.Their objectives for the project were to developtechniques of matching teachers appropriately to theneeds of the individual handicapped child, and tohave the stratistician influence classroom atmosphereon the affective level.
In August, 1971, a research director and anevaluation staff with a more behavioristic orientationwere hired. The affective dimension was de-emphasizedand overshadowed by the aforementioned struggle withevaluation program design and the search for stratis-tibian-tracking instrumentation.
148

Only two other research activities were maintainedoutside the major forces of the 1971-72 evaluation andboth of these activities were undertaken on a minimallevel. One of these, a survey of district policiesand procedures for placement of the handicapped, wasinitiated to obtain information relevant to placemeatand matching of handicapped students and specializedservices. ALsample of twelve schools in six districtswas chosen; fhe,schools represented urban and ruraldistricts. Complete responses were received fromeight schools in five districts. The responsesindicated that larger districts with more availableresources generally implement a more complicatedreferral process. All schools, however, follow thesame general process: 1) teacher refers student; 2)psychologist sees student; 3) committee or team reviewscase; 4) student placement is determined.
The last of the research projects gained impetusfrom two sources. Following the first year's failureto validate an affective observation instrument, aliterature survey was continued through the secondyear to find new materials which could be adapted forclassroom observation of teacher-student interactionon the affective level. From this survey, a biblio-graphy (Appendix K) was produced which served as thefoundation for the affective research.
Another factor which encouraged the affectiveresearch was a site visit during the spring of 1972;site team members had emphasized the importance of"individualization"' as a general thrust. This led tothe development of two research proposals, one onecological differences among schools and one onaffective differences among, teachers and students;staff expertise lent itself to these directions andthe site team members supported the ideas.
The affective research proposal was approved,completed, and appears ih Appendix L, as a thirdexample of research. The',oUtcomes from the affectivestudy included a working paper, a battery of assess-ment techniques in teacher attitudes and classroomaffective styles, a video-tape library for use inpreservice and inservice training or observed training,a data baseline in teacher styles emerging from thepreservice program in the Department of Special Educa-tion, University of Utah, and a modification of thenaive-observer-rating method for quick, comparativelysimple training of future raters.
149

The ecological research proposal was deniedapproval by the RMRRC Executive Board on the basisthat a majority of the questions concerned religiousaffiliation and minority status and were consideredinvasions of privacy. This proposal was never resub-mitted due to an extended sick leave by the principaldeveloper.
The "invasion of privacy" concern also was raisedby the Utah State Board of Education (USBE) withrespect to another proposal, which would have provideda comprehensive evaluation design comparing schoolswith stratistician placements. With the cooperationof the USBE, the data would.have been collected fromthe state's computerized Student Information System(SIS). The deisgn would have provided a largerpopulation and a functional feedback system regardingneeds, problem-solving data, etc, for planning use bythe USBE.
The evaluation staff concentrated on the problemof measuring the effect of the stratistician role,and developing a system for tracking. As the data inChapter 2 indicates, the latter problem was partiallysolved, but not the former.
A second evaluation project was undertaken towardthe end of the 1972-73 year, in an effort to determineif the stratistician model of informal teacher referralwere a valid method for identifying handicappedstudents, and if it were an effective model for reach-ing the unserved handicapped population. During theprevious year, the results of Project Identification(undertaken by USBE) indicated that teachers hadcorrectly identified handicapped children 85 percentof the time. This had been confirmed by a post-hocpsychometric analysis of a large sample of the teacher-identified children.
A staff member was assigned to determine theoverlap between children referred by teachers toProject I.D. as handicapped and those referred to thestratistician in that school for that year. The over-lap was roughly 33 percent; i.e., 33 percent of thetotal number of students referred were referred toboth Project I.D. and to the stratistician.
This data seemed to warrant future involvementwith Project I.D. Plans were made for a second deter-mination of overlap (in 1973-74) with the addition of
150

psychometric testing of a sample of those served bythe stratistician but not referred to Project I.D.The results of this effort were discussed in Chapter
2.
During the fourth and final year of the RMRRCgrant, ancillary evaluation events were: (a) follow-through on plans for involvement with Project I.D.which is reported in Chapter 2; (b) further develop-ment of the Outreach model with one evaluation staffmember reassigned as specialist in evaluation for
Outreach exclusively (discussed in Volume III of thisreport), and (c) the proposal of an in-depth studycontinuing the affective focus. Subjects for theproposed affective study were to be obtained fromstudents enrolled in an adult education class, Univer-sity of Utah. However, enrollment was not sufficientfor the sample nor to sustain the class, and theproposal could not be carried through.
Except for the Outreach evaluation assignment,evaluation during the fourth year concentrated onevaluating the training and service models. Thiseffort is detailed in Chapter 4 of this report.Briefly, there were three major points where evalua-tion was needed: first, evaluation of the stratis-tician model utilizing district-hired personnel(stratistician/generalists) and supervised by theexperienced center stratisticians (then called inter-
mediate stratisticians); secondly, reliability testing
on the observation measure developed by the stratis-ticians in the summer of 1973, the SystematicObservation of Behaviors (SOB); finally, evaluationof the training program (with training modules)developed by the intermediate stratisticians for train-
ing of the stratistician/generalists. Those resultsare reported in the chapter discussing the last yearof the stratistician project. Appendices at the endof this volume present three of the working papersthat resulted from the research discussed.
151

BIBLIOGRAPHY
Belmont, L., & Birch, H. G. The intellectual profileof retared readers. Perceptual and Motor Skills,1966, 22.
Birch, H. G., & Belmont, L. Auditory-visual integra-tion in normal and retarded readers. AmericanJournal of Ortho Psychiatry, October 1964, 34,852-861.
Blank, M., & Bridger, W. H. Deficiencies in verballabeling in retarded readers. American Journalof Ortho Psychiatry, October 1964, 34, 852-856.
Bloom, Benjamin S. (ed.). Taxonomay of educationalobjectives: The classification of educationalgoals. Handbook I: Cognitive Domain. New York:David McKay, 1956.
Bruse, B. Personal Communication Concerning ProjectIdentification. Utah State Board of Education,April, 1973.
Clements, S. D., & Peters, John E. Minimal brain dys-functions in the school-age child. Archives ofGeneral Psychiatry, 1962, 3, 6.
Harvey, 0. J., Prather, M., White, B. J., & Hoffmeister,J. K. Teachers' beliefs, classroom atmosphere andstudent behavior. American Educational ResearchJournal, 1968, 5, 151-166.
Harvey, O. J., White, B. J., Prather, M., & Alter, R. D.Teacher's belief systems and preichool atmospheres.Journal of Educational Psychology, 1966, 57,373-381.
Koppitz, E. M. The Bender Gestalt Test for YoungChildren. New York: Grune and Stratton, 1963.
Koppitz, E. M. Psychological Evaluation of Children'sHuman Figure Drawings. New York: Grune andStratton, 1968.
Nelson, J. D. Summary Report: Project Identification.Utah State Board of Education, October 20, 1971.
153

Reed, J. C. Reading achievement as related to differ-ences between WISC verbal and performance IQ's.Child Development, September 1967, 38, 835-840. (b)
Reed$, J. C. The ability deficits of good and poorreaders. Journal of Learning Disabilities, 1968,2, 1.
Sabatino, D. A., & Hayden, D. L. Psycho-educationalstudy of selected behavioral variables with chil-dren failing the elementary grades. Journal ofExperimental Education, 1970, 38, 4.
Silver, A. A., & Hagin, R. A. Maturation of perceptualfunctions in children with specific reading dis-ability. The Reading Teacher, January 1966, 19,253-259.
154

Appendix A
Exhibit A.1. Stratistician Data Collection Forms
Exhibit A.2. Problem Thesaurus

U1
Appendix A.1. Stratistician Data Collection Forms*
(01) PROBLEM IDENTIFICATION PHASE(Descriptive Data
Date
Stratistician's NameStudent's Name
Student School
NameAge (date of birth) Teacher.Sex Sex EthnicityEthnicity Class SizeGrade Years of teachingOther Type of teaching
Home
Implements
suggestions 1 2 3Consistent inimplementing) 2 3
Understandingor nature
4
4
Does not5 6 implement
5 6 Inconsistent
Referral Method (Mark)
formal initiated by:
of problem 1 2 3
Apathetic
4 5 6 Non-under-standing
informalrecords
teacher
stratisticianabout prob- 1lem
2 3 4 5 6 Concerned
previously principal Actively Passivelyexisting other personnel supportive 1
of efforts
2 3 4 5 6 Supportive
Actively re- Passivelysistant to 1
efforts2 3 4 5 6 resistant
Hostile to Ac ceptingchild 1 2 3 4 5 6
Source of information
Problem Description
By Teacher By Strat
Location of problem: class hall cafeteria lavaStudent observed by Strat. class hall cafe
* All information on forms is reported
Teacher Description
By Strat
ory playground home otherteria lavatory playground home other
, but form has been altered to fit required report margins.
1 ',7;(1Soo
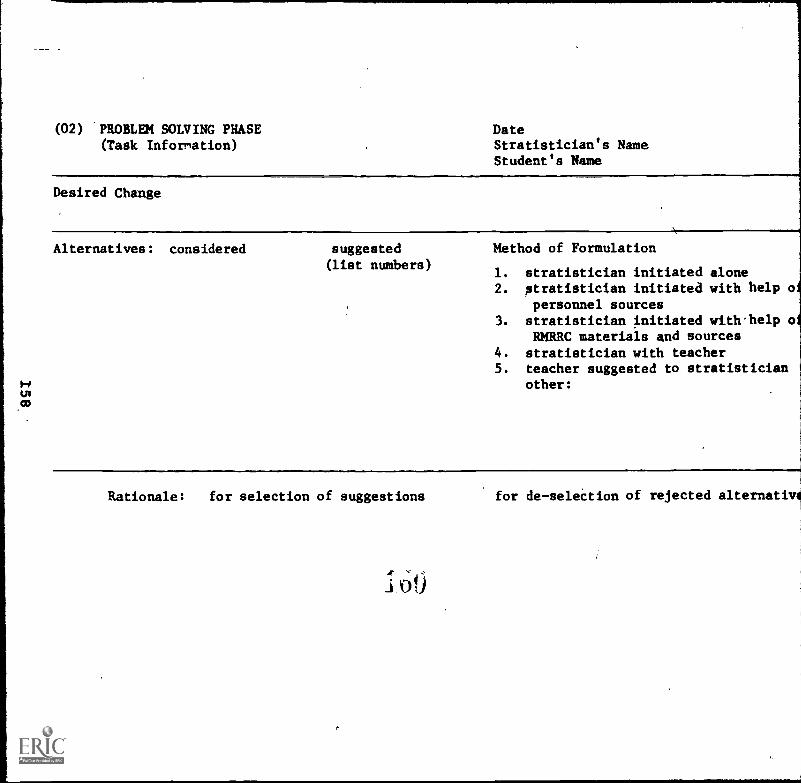
(02) PROBLEM SOLVING PHASE(Task Information)
DateStratistician's NameStudent's Name
Desired Change
Alternatives: considered suggested Method of Formulation(list numbers)
1. stratistician initiated alone2. stratistician initiated with help o
personnel sources3. stratistician initiated with help o
RMRRC materials and sources4. stratistician with teacher5. teacher suggested to stratistician
other:
Rationale: for selection of suggestions for de-selection of rejected alternativ

(03) PROBLEM EVALUATION PHASE(Outcome Information)
Date
Stratistician's NameStudent's Name
Outcome With StudentPositive change1 2 3 4 5 61 2 3 4 5 61 2 3 4 5 61
Change in AcademicSocialHome
Negative change1 2 3 4 5 61 2 3 4 5 61 2 3 k 5 6
Comments
Alternatives Utilized
Teacher's opinion Strat's bpinion
Reasons for Success or Failure
Teacher's opinion Strat's Opini
Other Outcome: Ripple Effect
Teacher making own suggestions no yes 1 2no yes 1 2
no yes 1 2with subjectwith other students
Teacher following strat'ssuggestions no yes few
with subject no yes fewwith other students no yes few
Additional referrals tostratistician no yes few
Administrative support of strat no yes less
3 4 5 6 many3 4 5 6 many3 4 5 6 many
1 2 3 4 5 6 many1 2 3 4 5 6 many1 2 3 4 5 6 many
1 2 3 4 5 6 many1 2 3 4 5'6 more
Comments

Appendix A.2. Problem Thesaurus
EDUCATIONAL
Association---investing meaning in the stimulus
Auditory association---appears to hear and remember stimulus- -can repeat--but stimulus has no meaning and is not relatedrelevantly to other stimLli
Auditory memory---appears to hear but does not remember stimulus- -no meaning yet attached
Auditory perception---does not appear to hear stimulus in presenceof evidence of adequate organ function--no meaning yetattached
Auditory receptive---intake through hearing
Auditory sequencing---cannot repeat an auditory stimulus, as wouldbe expected for MA and CA, correctly and in order
Developiental delay---abilities below expected CA norms
Doesn't attempt work---will not without much pressure attempt anassignment
Doesn't complete work---attempts but does not, without much helpor attention, complete the work
Doesn't follow directions---either seems to forget or not tounderstand instructions
Doesn't understand task - -- attempts and ever completes the assign-ment (in the child's perception) but the completed work isinappropriate to the task
Handedness---handedness incompletely established; mixed dominance
Impulsive - - -an inappropriate, seemingly sudden response to astimulus
Inconsistent achievement---works well, comparatively, at one timeand poorly at others so that teacher thinks he could if hewould
Memory---storage of stimuli
Memory-agnosia---can't find the right word; doesn't recognize it
Motor apraxia---can't remember the motor pattern of the word
Not achieving---not able to do work at level expected la teacher
Perception---reception of stimuli implies adequate sense organfunctions
Perseveration---continuation of a response after the cessationof an appropriate stimulus
160
6

Reading---the apparent inability to read, the apparent inability
to learn to read or a significant difference in readingability and grade placement and/or MA
Sequencing---order memory of the stimulus
Sequencing---telegraphic speech, articulation errors, can't findthe right word, but can recognize it
Short attention span---in relation to peers, age, or development;appears to be attending less time than would be expected for
MA and CA
Verbal expressive---oral language
;Visual acuity----physical inability after correction, verified bya qualified examination or ophthalmologist of stimulus through
vision
MOTOR
Motor---lack of coordination
Tactual association---appears to note and remember characteristicsof stimulus, but stimulus has no meaning and is not relatedto other relevant stimuli
Tactual memory---appears to note characteristics of stimulus butdoes not remember--no meaning attached
Tactual perception---does not appear to note characteristics ofstimulus in presence of adequate organ function--no meaningyet attached
Tactual receptive---intake through sense of touch
Visual association---appears to see and remember stimulus--can re-produce, but stimulus has no- meaning and is not related
relevantly
Visual memory---appears to see stimulus but does not remember--nomeaning attached to visual stimulus .
Visual perception---does not appear to see stimulus in presenceof evidence (examination by licensed optometrist or ouhthal-mologist) of adequate organ function--no meaning attached
to visual stimulus
Visual receptive---intake through vision
Visual sequencing---cannot reproduce a visual stimuli correctly
and in order
ti
161

PSYCHO - SOCIAL
# Aggressive---acting out; hostile; primitive
Anti-sOcial behaviors - -- cheating; stealing; lying; etc.
Anxious---crying, wet palms; etc.
Compulsivemust complete task; must have desk arranged.just so;perfectionist; never satisfied with finished work
Depressedsullen; unwilling to try; "flat" affect; crying
Disruptive - -- noisy; disturbing other children; poking; hitting;pushing others more frequently than other children in room
Distractible---short attention span; attending to all, some in-appropriate stimuli
Inappropriate reaction - -- extreme mood fluctuation; laUghing whenothers are crying; etc.
Inconsistent and highly variable---work, emotion and social be-haviors varying a great deal from-day to day
Insecure-attention seeking---frequently asking for teacher'sassistance or attention; showing off;,etc.
Insecure-withdrawn---shy; doesn't try tasks; doesn't establishpeer relationships; doesn't ask for needed instruction fromteacher; etc.
Isolated---peers and/or adults seem to ignore
Messy---beyond what might be expected for age and grade
Motivation---goal seeking by the individual in response to in-.
trinsic or extrinsic rewards
Not attending---daydreaming; looking out of window, attentionfocused on an inappropriate task
Psycho-somatic---physical disturbance such as headache, dizziness,stomach-ache, without known physiological bases
Rejected---peers and /or adults seem to actively dislike
Restless---out of chair and.moving about room much more frequentlyc than other children when expected to be quiet; if in chair,
moving frequently; rustling papers; dropping pencils; etc.
Sex-related---any problems related to sexual activities or develop-ment in the child
162..).

WRITTEN LANGUAGE
7
Association---vistial-motor dysfunction; can't generate ritten
language; doesn't recognize (dysgraphia)
Memory-7-doesn't recognize or generate written language
Sequencing---doe.sn't get numbers, letters or words in proper order
(dysgraphia or dyscalculia)
INTERVENTIONS
Alter emiornment---change conditions that might affect the child's
behavior (educationally or psycho-socially), e.g., changeteaetrs if personality differences exist, rearrange class-room, provide quiet study time at home
Behavior modification---application of conditi,.)::ing techniques to
alter behavior of a child or of a class
Counseling---discussion with a child, teacher, or other staffmember on a perceived school or personal problem
Informal diagnosis---attempt to determine child's level of function,disability area or areas and "best" learning modality throughteaching, analysis of work examples, or non-standardized orformalized tests
Medical exam---examination by licensed physician of school nurse
to determine the presence or absence of physical conditions
that might affect the child's behavior
Modality change---instruction through a modality other than theone used predominantly in the past; e.g., if classroom (or
personalized instruction) has been predominantly visual, thechange could be to auditory presentation (or tactual)
Patent conference---discussion with the parent, parents or parentsurrogate about the child; the discussion may include the
teacher, stratistician, child and any other member of the
school staff or any combination thereof
Peer interaction---provision of an opportunity for the referred
child,to work with or engage socially with _a peer or peers
Program level---grade level at which the child's acadenkis programmed
isychological testing---administration of Any standardized achieve-
ment, intellectual, psycho-linguistic, psycho-motor and/or'
personality tests
163
Nib
O

Resource aide---any person within school district personnelasked to intervene in problem solution
Resource agency---any person or institution outside of schooldistrict personnel asked to intervene in problem solution
Special placement---placement in special education program on fullor part-time basis
Specific curricula---any materials used to meet a child's needsother than state-adapted texts and supplementary materials'
Staff interaction---discuPsion of or information gathering fordiagnosis and prescription for an individual child with anyother school staff or RMRRC staff member
Status improvement---manipulation from the environment to providea more positive response, e.g., appointment of the child toa classroom assignment, encouragement of an older child to bea "friend"
Task analysis---examination of sub-skills required for adequateperformance of an academic task
Teacher in-aervice---explanation of training in educational pro-gram, materials, methyds, guiding in modelihg of elicitingfrom a teacher or teadhers in or implementation of pre-scriptions and/or classroom techniques
PRESCRIPTIONS
Aversive reinforcement---punis:,nent; verbal,/ physical or social
Change activities---change the :situation in which undesired be-haviors are occurring in an effort to reduce those behaviors
Confrontation---reality theory--discussin child's behavior and
consequences of behavior with him,
Consistency---responding in the same Way/to all examples of the
behavior
Contingency---instrumental itionin --positive reinforcementgiven only in the present.- of des red behaviors; some time-lapse between performance and regard may be included
Dissonance--introduction of unexpected stimuli to attract the
/ child's attention or to distract the child from undesiredbehavior
Motor development---program of physical activities desPgned toimprove coordination, etc. .
164.f rly

Negative reinforcementactually no reinforcement; extinction
Positive reinforcementreward of desired behaviors
Proximitystanding or sitting near the child
Reduce stimulus---removal from the group, screening of desk, move
desk away from window, etc.; any or all to reduce distraction
Tutoringinstruction of single child by teacher, aide, older
student, etc.
165
I

Appendix B
Cross-Peer Tutor Program
i;

Appendix B
CROSS-PEER TUTOR PROGRAM1
Susan B. Harrison
Working Paper No. 7
August, 1973
ROCKY MOUNTAIN REGIONAL RESOURCE CENTER
DEPARTMENT OF SPECIAL EDUCATION
UNIVERSITY OF UTAH
1Preparation of this paper supported by Grant No. OEG-0-70-4178 (608).
Project No. 542930, from the Department of Health, Education and Welfare,
United Stares Office of Education, Bureau of Education for the Handi-
capped, Washington, D.C. 20202.
Susan B. Harrison is an Intermediate Stratistician at the Rocky Mountain
Regional Resource Center, Department of Special Education, University of
Utah, Salt Lake City, Utah, 84112. At the time the paper was written,
Mrs. Harrison was placed as a stratistician in an elementary school.
Presently, she is supporting five stratistician/generalists as they fill
the same type of role in their respective schools.
These papers are intended primarily as informal communications to, and
among members of the RMRRC staff and faculty of the Department of Special
Education. The materials contained herein are generally not in final
stages of refinement and are not to be cited without the author's permission.
161,,
0.)

CROSS-PEER TUTOR PROGRAM
Susan B. Harrison
I. Introduction
This report concerns a cross-peer tutor program establishedin 1972-73 in one elementary school in Utah. It is a school
with extensive special service including a resource teacherand six teaching aides, plus a stratistician assigned fromthe Rocky Mountain Regional Resource Center (RMRRC). Still,
only a small portion of the handicapped students or studentsreferred to the resource teacher were being served. An ef-fort to mainstream most students in the school 4ietricthad begun in full during the year, and most of the teachershad little preparation for mainstreaming. Many were eitherinadequately trained, or, at least felt as though they
were inadequately trained. A tutor program was establishedby the stratistician both to help ease the increaseddifferentiated class load, and to serve as an in-service
tool.
II. Rationale
Cross-peer tutoring was established for the classroom teacher,for the tutors, for the tutees, and for the stratistician.For the teachers, it was a service that aided in the main-streaming of handicapped students in their classrooms; forthe tutors, it was an opportunity for responsibility andgrowth; for the tutees, it was individualized, personalizedinstruction. For the stratistician, it was an additionalopening for ongoing contact with the teachers, their programs,and the handicapped children in the school. Eventually, 80%of the teacher-identified, handicapped students had individ-
ual programming.
III. Selection: Three types of selections were made:
A. Originally, fifth and sixth grade teachers hadthe objectives of the tutorial program explainedto them. The teachers were asked to select tento twenty possible tutors on the following teacherdefined criteria:
1. Shows responsibility2. Has skills in math, reading or a special
area.
3. Shows kindness and willingness to share.
171

B. After the first group was placed in classrooms,the students in the intermediate grades reactedto the group of tutors as privileged. Many re-quests were made to teachers and the stratisticianfor the same privilege. Students who were not ascapable or who were not generally cooperative orwho had low self-esteem requested the Same oppor-tunity. The teacher and the stratistician regardedthese.requests from less successful students asa possible indication of willingness to tryto perform. Contingency contracts were drawn upwith twelve students who were considered by theteachers as needing the most help. Each contractwas individualized according to the student'sperformance. The teacher and student outlinedexpectations of changes in the "student's"accomplishments. Contingent on these accomplish-ments were in-service and placement for tutoring.
C. A third group of tutors was established for otherchildren who were less successful than the firstgroup and who had not made contracts as had thesecond group. They were students who had workedhard and made academic or social adjustments, usingtheir own initiative, to demonstrate they couldsucceed as tutors. For each of the three groups,the stratistician screened the selected child byobserving him in the classroom, and by having apersonal interview. All teacher nominations wereaccepted.
IV. Commitment:
An orientation was held, and a letter explaining the tutor
role was given to each tutor (Exhibit B.1). During orienta-
tion, a contract of responsibility was given to each tutor(Exhibit B.2). Each tutor also read every clause with thestratistician, and then signed a contract. It was under-stood that the responsibilities defined had to be assumedand persist for the student to remain a tutor. Parents alsohad to sign the contract allowing their child to be out ofclass for no more than five hours per week. The third sig-nature, the stratistician's, was added following the tutor'ssuccessful completion of the initial in-service training.
V. In-Service
Those who returned the contracts were scheduled for in-servicetraining. Five students decided they either could not acceptor sustain the contract. The initial in-service was a general
172

overview of skills, taught in five sessions of fifty minutes
each.
The first session was used to make a role description for
the tutor. The stratistician role-played different teacher
personalities and demonstrated class-control techniques.Roles demonstrated included bossy, threatening, illogical,
harsh, unclear, humiliating, baiting and patronizing be-haviors.. Tutors expressed their reactions to the roles;they then explained how they would respond in the classroom.An invitation was made for anyone in the group to demonstrateor explain a "technique" which would encourage their per-
formance.
In all three groups there was participation. The second and
third groups were most spontaneous. The tutors made energetic
promises to be positive teachers. Resolution of this activity
was a group-written description of the tutor role. Descrip-
tions were similar.
The second group's read: "A tutor is a teacher. The tutor is
a friend that will make him a special teacher. The tutor's
job is to help, not boss, and be kind."
Following the first session, two assignments were made. Each
tutor was given a reading-task and math-task worksheet to think
through and answer by himself, or with help if necessary
(Exhibit B.3), This assignment was to generate ideas or
questions, and to begin the "tutor profile." The second as-
signment was to be completed for the last session. Each
tutor was to develop a_game or teaching device to teach one
skill that was demonstrated.
The second and third sessions were used for die teaching of
reading. The second-session activities were based on the
thinking assignment question (Exhibit B.3): How do you teach
the word "sitting" in the phrase, "Sam is sitting in the
sand?" All the tutors had the opportunity to explain, dis-
cuss or demonstrate their ideas.
This was a productive session. Questions arose and were
solved by the tutors. In all groups many original methods
were contributed that were used throughout the year. The tu-
,tors revealed their own methods for learning. A list of
clues and methods were compiled. To teach the word
"sitting," for example, at least twenty ideas were given.
Some ideas were conventional such as breaking the word into
syllables finding the small word "it," or blending sounds
with the students. Other ideas were more creative, such as
173

making the "s" into a long snake seated or drawing a chair
over the word, or sitting in a chair saying and spelling or
singing the word. Other phrases were treated in the same
manner as the first. A phonetic checklist was distributed
for reference (Exhibit B.4).
A question from a member of the first group precipitated
a change in the content of the third session. The question
was, "How do you get kids to know that the letter is 'g'
and what side is right-side up?"
Letter recognition was difficult to explain in a one-
sentence answer. It was to be, in fact, a primary focus for
most of the tutors in working in the primary grades. First
grade teachers aided in the preparation of the content. They
delineated their expectations for tutors and tutees and
contributed materials. Tutors divided into two groups; one
group pretended not to know the letters and the other group
served as tutors. Activities included games, word cards,
Frostig-type worksheets and blackboard exercises. The
"tutee" group worked hard at being difficult to teach and
to handle. Ideas were shared following the activities;
methods were added to their notebooks.
The fourth session was devoted to mathematics. The tutors,
as a group, made a brief task breakdown ,of the math functions.
Prerequisites were noted for the major function. Four prob-
lems from Question 2 of the thinking assignment were reviewed.
Then the tutors were given twenty incorrect problems to
analyze for mistakes in computations. Summary sheets of
possible mistakes and the reasons for the mistakes were
added to their notebooks (Exhibit B.5). Summary sheets, which
started with only a few examples increased as new errors
were encountered.
The fifth session was a double-time slot for sharing. The
stratistician familiarized the tutors with the reading pro-
grams and math programs used in the primary grades. Then
tutor-developed projects were demonstrated to the group for
ideas.
In-servicing was a continuous process. Monthly meetings,
with all tutors divided into two groups, were used for
positive reinforcement and sharing of new ideas. Also
training was presented in areas such as reflective listening,
behavior management, blending skills and log-recording
methods.
Groups working in just one classroom or one grade also met
at other times. Specific training was based on needs
1741
.; I

J
expressed by the classroom teacher, tutor, or based on )b-servations by the stratistician. Tutors for kindergarten,for example, learned how to do visual motor training whenit was discovered that fifteen children were unable to holdor draw with a crayon. Individual in-servicing was a thirdmethod for continuous learning. The stratistician orteacher made on-the-spot observations, modeled techniquesor gave advice. The speech teacher also had sessions withselected tutors. The stratistician set asise one afternoonevery week for the tutors to visit if they had questions,needed re-direction, or needed support.
VI. Placement and programming:
Following in-service, a profile of each tutor was made forplacement. This was the profile form:
1. PersonalA. NameB. AgeC. GradeL. Sex
2. Preference for TuteeA. SubjectB. GradeC. Sex preference
3. 'teacher's reason for recommendation
4. Stratistician's evaluationA. Ability areaB. Passive-aggressive, scaled 5/4/3/2/1C. Clear-unclear (at giving instruction), scaled
5/4/3/2/1D. Creative, scaled 5/4/3/2/1
All the teachers in the school were informed of the program'sdirect purpose: to individualize and assist in programmingfor children with special needs. From their requests aneeds profile was drawn:
A. SubjectB. ChildC. Time and day
As the referrals were received, a match of tutor and teacherprofiles was made by the stratistician. Placements were basedon this match. The tutor was given a permission formlisting subject, time and dav, and to be signed by histeacher (Exhibit B.6). If the time slots were approved, the
175

tutor went to the classroom teacher who made the requestand established a time for programming. The approved permis-sion slip was returned to the stratistician and recorded ona weekly time chart.
Programming for the tutee was originally done by the teacher.Variations of this procedure occurred throughout the year.The resource teacher, speech teacher, or stratisticianwrote a program for the tutors in cooperation with theteacher, or alterations were made by the teacher after sug-gestions from the special services.
The tutor was to work with a child using a prewritten lessonapd materials obtained by the teacher or tutor. Outcomeswere to be reported regularly.
VII. Tracking:
Tutors were tracked by observation and by daily logs. Eachtutor was observed at least one day a week while he was tu-toring. These observations defined in-service needs forboth the teacher and for the tutor. Notes were kept on thetutors' and tutees' progress.
The tutors kept logs each time they tutored. The date, thetime of arrival and departure, total time spent and a descrip-tion of the activity were recorded. Logs were difficult formost of the tutors at first. After an in-service meeting, logsimproved. The stratistician made notes op them weekly. Dia-logues were established between the stratistician and thetutors. The "Description" category soon developed into arecord of success, failure or feeling. The log was the mosteffective method of monitoring all activity. It precludedmisuse of time or possible teacher complaints of misuse oftime. At the end of the year the logs were used in self-eval-uation of progress.
VII. Evaluation:
Three formal evaluations of the tutorial program were madeby the teachers. Several weeks after the first placement,the teachers were given an evaluation form (Exhibit B.7).At this time they commented on the tutors adjustment andcooperativeness. Each teacher had the option to continueor discontinue the program and submit a critique. Allteachers felt it should continue and several more began toparticipate.
176

At mid-term the director had an interview with each
teacher. Following the interview,a report was written
for report cards of the tutors.
Year-end evaluations were made by the entire faculty (Exhi-bit B.8). Individual tutors as well as the program were
evaluated. Results from the evaluations indicated that
every teacher opted for tutors the next year. Also, the
teachers could now list exact needs and personality typesthey felt could best work in their classrooms. The
teachers stated a philosophy of acceptance for programming
of handicapped children in the classroom.
Tutors made on-going evaluations in their logs. At the
end of the year a final evaluation was completed (Ex-hibit B.9). The tutor evaluated his personal success, his
view of the effect he had, and the program.
IX. Conclusion:
,The tutorial program accomplished more than its goals.
Forty-four tutors were placed in classrooms. Each tutor
worked with one to ten children. Every class from kinder-
garten to the fourth grade, including the special
education class, had a cross-peer tutor. Over 100
children were served directly. Advancement of some kind
was reported for nearly every child. Two first grade readers
joined an average reading group. Ten kindergarten students
obtained better fine motor coordination. The second grade
'math students caught up with their group. A third grade
teacher reported three of her students learned to read.
Successes were numerous.
Of the beginning tutors, only thirty-two were still tutoring
on the last day of school. Six had moved, two dropped out
voluntarily and four were removed for not abiding by the con-
tract agreement. The remaining thirty-Woo tutors had fa-
vorable reports from their teachers and parents. They became
class leaders, were more organized, more responsible and
had high class performance. Eight of the twelve tutors on
contingency contracts had discontinued the contract and were
operating by self-motivation.
A high school tutorial program was established based on the
same format. The fourth, fifth and sixth grades made use of
the older tutors. It too was reported as a success by the
school and high school involved.
Primarily, the program won acceptance for the mainstreaming
of handicapped students. Tutors had an important status in
177

the school. The job was sought by other students. Each
tutored student felt important to be served by his owntutor. Teachers felt they had been relieved and helpedand were willing to open their class doors for more assist-ance. On "Special People Day," all the tutors were honoredby the entire school. Twelve tutors received special awardsfor being the most significant contributors to the schoolthat year.
178

Dear
Exhibit B.1
Letter to Tutors
October 3, 1972
You have been selected as a upossibleistudent tutor. Who
is a student tutor? Alta View's definition is a student
who has strong academic (reading and math) and social skills
and is willing to kindly share these skills unselfishly
with other students* Tutoring will be arranged during times)
of your day that you and your teacher agree upon and when
other students need your help.
Why "possible"? You may decide this is not the kind of
service you wish to give. You may want to wait as an
alternate and give yourself more time. Your parents must
also agree to your time being used this way. Or there may
not/be some other student who needs your time immediately.
Being a student tutor is difficult, a large responsibilfiY.
and very rewarding.
To become a student tutor you must sign acdriiracti tinder
your name your parents must add theirsignature. And you
must complete an assignment. It is designed to help me
see how you will work and to help you think through the job
you will be doing.
Your teachers and I are sure you will think carefully about
this.
Sincerely,
*This sentence was altered for the second and thirdgroups co read:....a student who is willing to teach
and to share time unselfishly...
179

Exhibit B.2
Contract of Responsibaltv for a Student Tutor
It is understood that a student tutor:
4) Is willing to help other Students with his work.
2) Will assist the student with materials the teachergives him.
3) Will allow the student to find his own answers.
4) Is a friend as well as a tutor and therefore will
not talk abo- those they help to others.
5) Will report every time he is scheduled to, ifthattime has been approved by the teacher: ne may be
excused for special events by the tutor director.
6) Will attend three classes of instruction.
7) Will report monthly to classes for tutors.
8) Will receive instruction and help before each newstudent and during tutoring.
9) Will ask for help if needed.
10) Will try to be understanding and kind.
11) Will keep up with his assignments in his class.
And it is therefore understood that the studegt tutor willtry to live up to this agreement so that he may maintain hisresponsibility.
In return he will receive the satisfaction of being one ofAlta View's most responsible and trustworthy Students. And
he receive the reward Of helping others.=
I understard and agree to workunder this contract.
We (I) agree that my child may take On thisresponsibility and be excused from classfor no more than five hours a week.1
180
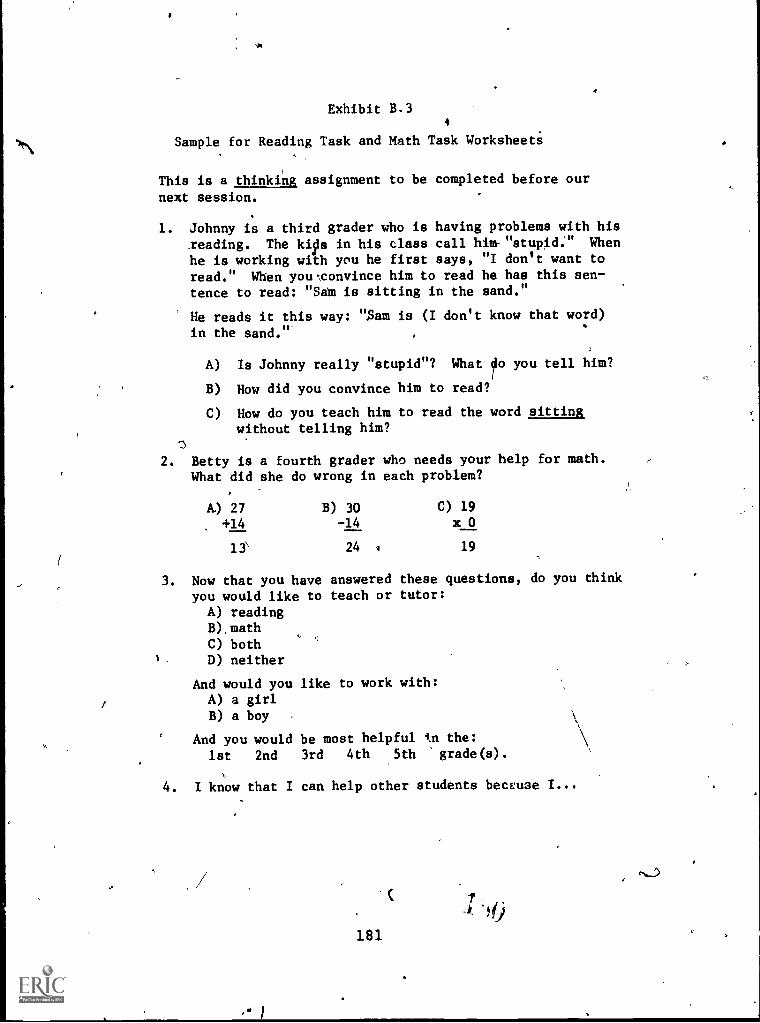
Exhibit B.3
Sample for Reading Task and Math Task Worksheets
This is a thinking assignment to be completed before our
next session.
1. Johnny is a third grader who is having problems with his
reading. The kip in his class call him- "stupid." Whenhe is working with you he first says, "I don't want to
read." When you convince him to read he has this sen-tence to read: "Sam is sitting in the sand."
He reads it this way: "Sam is (I don't know that word)
in the sand."
A) Is Johnny really "stupid"? What ylo you tell him?
B) How did you convince him to read?
C) How do you teach him to read the word sittingwithout telling him?
2. Betty is a fourth grader who needs your help for math.What did she do wrong in each problem?
A) 27 B) 30 C) 19
+14 -14 x 0
13 24 19
3. Now that you have answered these questions, do you thinkyou would like to teach or tutor:
A) readingB)mathC) bothD) neither
And would you like to work with:A) a girlB) a boy
And you would be most helpful tn the:1st 2nd 3rd 4th 5th grade(s).
4. I know that I can help other students becEude I...
181

Exhibit B.4
Phonetic Checklist
SOUNDS
1. SOUNDS OF CONSONANTS
continuents: plosives:
c, h, j, 1, m, q, s, v, w, x, y, z p, b, t, d, k, g
2. SOUNDS OF SHORT VOWELS (a)cap rid hop cut
3. SOUNDS OF LONG VOWELS (i)
cape ride hope cute
4. SOUNDS OF DIPTHONGS (4)4
of oy ou ow (oil) (boy) (out) (cow)
'5. SOUNDS OF VOWELS DIGRAPHS
aw ai ay ie oa oe ow ue ew ee ea au oo
6. SOUNDS or CONSONANT DIGRAPHS
pp sh ph tch ck th wh nk ng' on WT
(f) (sh)
7. CONSONANT BLENDS
ch tch nk st str is tr pl bl qu (j -g -k)
8. PHONOGRAMS
ail ain all and ate ag con eep ell en ent er est
icfc ight ill in ing c-k ter tion
PRINCIPLES,
1. Vowels are shortexcept when modified by position.
2. Final "e" lengthens the preceding vowel.
3. In vowel digraphs: first vowel long, second is silent.
(heap slay tie sheep own how)
4. Vowels followed by "r" have sounds modified, making the
"murmur" dipthongs (clerk corn care dirt ctrl)
Sodnd of "c" is soft (s) before e, f, y.
Sound of "c" is hard (k) before a, o, u.
182

Exhibit B.4 continued
6. Sound of "g" is soft (j) before e, i, y.
Sound of "g" is hard (g) before a, o, u and words ending
with "ge."
7. In open accented syllables the vowel is usually long
na - tion/ di - ner/ no - to - tion
8. Silent letters
k(knife) w(write) 1(talk) t(catch) g(gnat)
c(black) h(hour)
EXTRA SOUNDS
1. Sounds of "y."a. first yet, yard
b. short i gym
c. long i my, cry
2. Sounds of "s."a. "S" before e, i, y (at end of word) souflds like
"z" (fuse, desire, easy).
b. Other times it sounds with a hiss.
3. Sounds of "sh."a. ci
b. ti
c. si
specialactionpension
SYLLABIZATION
1. When two consonants between two vowels/dividebetween them.
win-dow/ prin-ci-pal/ com-mon/
2. When only one consonant between two vowels divide before it.
ti-ger/ spi -der) (open vowel is long.)
3. Most words ending in " put preceding consonant with "li."
sim-ple tur-tle
4. "ed" ending is separate syllable in root words ending "d"
or "t."
test-ed bond-ed("ed" endings are not separate on most other words:
walked raked.)
5. Adding suffix usually doesn't change the division of the
root word: im-prov-ing.
6.7 Some letter groups are not separated:
a. dipthongs: boiling coward
b. blends: between thoughtful embrace
183

Exhibit B.5 Summary Math Sheet
ADDITION PROCESS ANALYSIS
2--i- I
2t.
Z no one-
1 I to-one........
relation-7 ship.
2't 1
11.
memory
..±.....L.
spatialconfusion
i
subtracted
3, 2.
7 Li
3 added
1 first
two in1" series
3 addedz last
4 two inseries
3 memory2 orAi factual
..-- error
/o
3 spatiala con-Al fusion---'Ivy---
e5....---....
a3
-t 1 4
a added., only
4.P one1 Li col-
..',,,--.
9 umn
17 con-
:: fusion3 of
1 ii tens-......
1
aconfu-3 sion of:: place
i I value
181
IL memory3 or
gy frus-
----1 3
tration
47Lt.
47 can
.115 not)2. it rename
117 did sN-Ajidri
"tiS notI-ff. carry
arriedii wrong17number
117 place
# 5 value277
ZZ -----4h2.1 34,+3 (p Tre
mixedfunctions
2,2---+ 3 4,
5 9spatial
17 8
1. 1) Li
115-1. / 4,
17g
iqt.once
,
/ 4
Pie
/'1addsadde leftto right
no 232.'renaming-------'
$z97Si 'Pi
2. . i 3
0 Z8911. IN
i.zs8.13q,
$281.L17.41.2.3
.1184,
decimalconfusionerror in
copy- -
"perceptual?'
4

Exhibit 3.5 continued
SUBTRACTION PROCESS ANALYSIS
,
ii?. 0
zero con-fusion
sr
-oo
spatial con-
fusion.
.... 1..... 3
4)
7error in copy
--perceptuall
34...........
factuall or
memory error9
added
a....- 1.1
/8... 14
........--
2.2added
0inverse--small4 from
..,---1$23 large
place value.
18
,;.y12 tens.-# recog-.,..«.
tens .# Cs/nized
not recog- and
nized. subtracted.
ill..
i 36-
I 8added
1.3 inverse
S --smallfrom
12. large
133 unnec- 0li
5
essary -. s-
, borrowl --,y-
/1, ing. memofyerror
2i// ao
2'1mixed
.../ 4, func-
tions
41) added
subtradnfeni
zdi...//4.
......:--""
IZno renaming
two renaming viirenaming117 without 44, increas-
"Iii, diminish-l'hilwing tens
9ing tens.'"
si 1
9 02.6) .1'
-......---.....
ii0121ZO zero
confusion
Acannot
"13.3 bridge37q zeros
6.2.0q
- 5304.11............
//
1,20ii
- 53074
did not re-name twice.
4 2 0i/530
W374zero con-
fusion.
6209
to 3 3 Li
inverse,smallfromlarge .
185

Exhibit B.5 continued
MULTIPLICATION PROCESS ANALYSIS
zA I
2.X 1
2x....L..
1
subtracted
2x 14
memory orfactual error
aadded
3A 0
3x 0
3zero confu-sion
5 5.
x 2.
7added
Cx 2-...,....-St.
spatialerror
2.9
X 2-
ZitX 2-...........--Z. 6
added
2..ii
x aI..........o.we
Z.Efmultipliedonly ones
lb&X 2-.-------/-mixed
functions
gr
X 3
99X '3
2.4 z7no renaming
91x 1
v9.3spatialerror
9 /-I-1-1adiri
no add ition
in renaming
sl rever-x 3 sals cE
7:::- tens &
40'47dreds.
6'07
)( 3...--......
60 ri
X 4g
zero gliock
60 fi double_12_multi-
plica-i if fl tion cfcarr ea num-ber.
60071'3
6,00/2-copyerror
0X24
#8im..00sl, place......--' value
86
inx2.0Z_Licg
functionerror
32X / 2.-----.
32repetition A/ 2.of ones' bymultiplier eg,--------.
`7O4
3 2..X 12
....---.......... error in611 addition...-----3--2
3 q Ai
711
X 4 1
7/A ____,4P7
perservationof number
iili
4449.-------Si 4 q Ur____186

Exhibit B.6
Tutor Periiision Form
May be excused to be a student tutor
in the
at
grade for
on
Thank you
Mrs. Harrison
Teacher's Sigiature
187
4/

Exhibit B.7
Form for Teacher Evaluation of Tutor
November 7, 1972
Dear
Your tutor(s) have been working for a few weeks now with
jour students. Will you please make a few comments about
each one. Reference could be made to a) their acceptance
of responsibility, b) co-operativeness, c) creativity
and d) if you would like to continue with their tutoring.
Also, any helpful comments would be appreciated.
188
Thank you,
Susan Harrison

Exhibit B.8
Form for Year-end Evaluation by Teacher
If you have a tutor now, please answer the questionnaire.If you do not have a tutor now, please answer Question 11.
1. Who were the tutors assigned/ to you?
2.
3. How much didvery helpful
4. How did theyindividuals
Did they come regularly?
they help your class?some help no help
tutor in your class?small groups whole class
5. Did they help you to better understand the children and/or the children to better understand you?
6. Do most students seem to welcome o- resent the use oftutors?
7. In selecting tutors, what characteristics should belooked for?
Can you give an example how your tutor(s) helpedone student?
9. Please give an example of how the tutor helped a small
group or a whole class.
10. Do you have any criticisms or suggestions for thetutor program for next year?
11. Will you be interested in having a tutor next year?
yes no when for what
any special person or kind of person
will you consider this again next year?
Your name
For those of you that have worked with these tutors, 5th, 6thor high school, thank you. Thank you You've set an example,
reached out and helped each of them to feel worthwhile.
189

Name
Exhibit B.9
Form for Year-end Evaluation by Tutor
Assignment Your Grade
I. What is the most important thing you did as a tutor?
2. How much do tutors help a class? very helpfulsome help no helpComments:
3. How much tutoring time did you spend with: individualssmall groups whole class
4. Did you help the students and teacher understand each otherand get along better together? How?
5. Do most students seem to welcome or resent the use of tutors?
6. Do you feel you worked better with students who were:younger your own age older
7. In selecting tutors, what characteristics (kind of person)should be looked for?
8. Who should evaluate the tutors work?
9. How should the tutors'work be evaluated?
10. Should tutors meet now and then? If so, how often?
11. How much did the beginning classes help you?
12. Has your Work as a tutor been helpful to you?very helpful some help no help
13. Will you be a better studentor no better studentExplain:
a much better student
14. Give an example how you helped one student. (If possible a.case study.)
15. Give an example how you helped a small group or a whole clas4.
16. D6 you have any criticisms or suggestions for next year?If so, please take time to express them all.
17. Will you be interested in tutoring next year?Where What Who
1
190

Appendix C
Program Analysis Questionnaire
/
/
1'
01
1

Section 1
PROGRAM ANAMIS QUESTIONNAIRE
RhRRC YEAR-END CONSULTATION WORKSHOP, JULIE, 1974
Directions: Questions in the following section are for the purpose of revising
and analyzing the training progran workshop presented v the RMRRC in Aupust of
1973. Please answer all items according to your Terso al feelin.,s as accurately
as possible. Where approximate frequencies or tines a e reouested, give your best
estimate from memory. This is NOT a personal evaluation of the Strat/Generalist,
the Intermediate Strat., the school or the district.
S/G: fill out on self
US: fill out one on each of vourS Gs separately
DA: answer only Question 2
1. Please complete the first column in the following ma
the appropriate block. You are to estimate your skiprehension, application, analysis, synthesis, evaluatcontent areas (identification, diagnosis, prescriptioThere should be one (X) in each column when you are fassumes skill at lower levels. An X at analysis, for
assume skill at knowledge, comprehension and applicat
an area you do not have knowledge of, mark it NA.
e
rix by placing an (X) in
1 level (knowledge, cos-on) for each of the five, programming, evaluation).
niched. An X at any level'example, would
On levels. If there is
I
Your 'Skill
Skill 'LevelLevel 'Needed
Identification
i
Your , Skill
Skill' LevelLevel; Needed
Diagnosis
i
Your 'Skill\
Skill .LevelLevel ;Needs
Prescription
i
Your 'SkillSkill,LevelLevellNeeded
Programming
Your SkillSkill LevelLevel,Needed
Evaluation
Knowledge I
1
1
1
I1
*
I
I
,
i
1
1
1
I
I
1
Comprehension(understandingof content)
1
1
4
1I
,
I/
-I-
I
I
1
1
I
1
4
Application(make usecontent)
I
1
i
4
1
1
l'
i
I
I
Analysis
(interpret
Information)
1
,
1
,
,
.
i
1
I
I
I
1
Synthesis(Gestalt
information)
.
I I
I
.
1
1
1
,
I
I
I I
i
1
i
t
.
1
Evaluation(make judgmentabout infor-elation)
I
1-
1
i
1
I
1 i
1
1!
1
i
,
.
193

2. Please return to the preceding matrix, and place a number rating in thesecond section of EACH block according to how important you felt the skillcontent and process represented in that block to be to Your functioningas a Generalist in the school this year.
Rating Scale: 0 - Not important1 - Slightly important2 - Moderately important3 - Very important4 - Essential
3. Using the following Interpersonal Skills matrix, place a number it the1st column of each block representing your skill level in these- areas.
0 - No proficiency1 - Slightly proficient2 - Moderately proficient
3 - Proficient4 - Very proficient
Interpersonal Skills
Your I Skill
Skill I Useful-
Level ImesI
ReflectiveListening
Your t Skill
Skill 1 Useful7/
Level 1 ness /
/Congruent
SemdAn
,;Your i Skill
Skill 1 Useful
Level, nese
ProblemSolving
Your o Skill
Skill I Useful-
Level1
ness
Acceptancein School
?ditchers
1
1
i_
//1
/ I
1
I
o
I
I
Administrators1
I
4:
I
I
I
I
1
I
I
Students1
1
1
I
1
1
1
1
1
1
1
I
Parents1
I
I
1
1
1
1
1
I
1
i
Others1
1 ,
I
f
I
I
i
I
1
I
I
1
4. Using the same Interpersonal Skills matrix place a number in the 2nd columnof each block representing the usefulness of these skills.
0 - Not useful1 - Slightly useful2 - Moderately useful3 - Very useful4 - Essential
194
q

/
Movement through the content areas from Identification through Evaluation might
be conceived as following a service sequence.
5.' Evaluate usefulness of the service sequence of Identification, Diagnosis,
Prescription, Programming,Evaluation as defined by the RMRRC training
program.
-3' Very much a problem-2 Moderitelv a problem
-1 Somewhat of a problem
+1 Somewhat useful
+ 2 Moderately useful+ 3 Very useful
6. Approximate the % of referrals with which you used th service sequence.
7. If you used this service sequence(I,D,P,P,E), give at least thr;iC-matkaples
on the accompanying pages of children with whom you used it. Civil ttit
identified problem, method of diagnosis, prescription,program outline or
referral, add method of evaluation briefly for each example.
8. If you did not find this sequence(I,D,P,P,E) useful, give example(n) on
the accompanying pages of other service structures orsequences you did ,
We.
9. Please rank from 1 to S the 'items of the service sequence (I,D,P,P,E)..
Rank as 1 the item you used the most; 5 the item you used the least. '
Place numbers in the 1st column of blanks.
a. 'Identification
b. Diagnosis
c. Prescription
d. Programming
Questiot 9 Question 10
a, Evaluation
10. Regardless of how often 'You used the item, now rank the scaleAtens frets
1 to 5 putting a 1 next t the service item that You personally find the'
easiest to perform,' and a 5 next to the service You personally find the
hardest; most difficult to perform. Place answers for this question in
the second column of blank .
11. Of the handicapped children ou servid, what % fell into the following
categories: MR BD/ED LD Hearing Impaired
Blind Physically Handicapped
195
1 ;

12. Within the structure of the training program, were you able to meet yourown individual training needs. Circle the appropriate response.
0 - not at all
1 - somewhat, but not to my satisfaction
2 - moderately satisfactory
3 - very much; much to my satisfaction
4 - 'always, completely to my satisfactiona
13.. Were you allowed sufficient time to complete training modules and achievean appropriate level o proficiency. Circle the appropriate response.
0 - not at all
1 - somewhat, but not to my satisfaction
2 - moderately satisfactory
3 - very much, much to my satisfaction
4 - always, completely to my satisfaction
14, Did you feel the overall time scheduling was an effiCient use of your 21time, rather than being wasted in non-applicable or-non-useful activities?Circle the appropriate response.
L0 - not at all
1 - somewhat, but not to my satisfaction
2 - moderately satisfactov
3 - very much, much to my estisfaction
4 always, completely to my satisfaction
15. Would you have preferred an alternative to the training program presentedin August, 1913? Ir so, describe the alternative on the back of this page.
Yes No
16. What omissions did you see in the August, 1973 training program? That is,what information, materials, skills, etc.would you have liked to receivewhich you did not receive? List and describe on the back of this page.
196

a
Section 2
PROGRAM ANALYSIS QUESTIONNAIRE
Directions: Questions in this section of the program analysis are for the purposeof defining the roles of the Intermediate Stratistician, IMIRC and other personnelas resources. Please answer all items according to your best estimate of how time'was spent in Your particular situation. This is NOT a personal evaluation, but anattemptto generalize a definition of roles across individual school situations andpersonnel.
Oeseritlists and Intermediates: fill out all quiitions referring to the utilisationof resources in your school or district.
District Administrators: answer only questions #29 - 036.
17. How often did the Intermediate Stratistician (I/S) listen to, ask for,or respond to needs that the Generalist (S/G) had?
0 - not at-all1 - occasionally2 - regularly3 - frequently4 - always
Rank for each item:
listen toask forrespond to
1$. Haw often did the S/G make direct service or support requests of the I/8?Circle appropriate. response.
0 - not at all,
1 - occasionally
2 - regularly
3 - frequently
4 - always_
19. How often did the I/S make a direct respbnse of service? Circle appropriateresponse.
0 not at all
1 - occasionally
2 - regularly
3 7 frequently
4 - always
197

20. Now applicable, useful were the service or suggestions provided by the I/StCircle appropriate response.
0 not at all
1 - only slightly
2 - ;oderately
3 - frequently
4 - always
21. Now supportive was the 1/S to the functioning of the S/C in the school-basedrolet Cirgle appropriate response.
O 4 not at all
1 - only slightly
2 - roderately
3 - frequently
4 - always
Mow? List and.dascribe examples.
22. ' Now often did I/S volunteer service or suggestions that'had not been directlyrequested by anyone? Circle appropriate response.
O -*not at all
1 - only slightly
2 - moderately
- frequently
4 - always
On these occasions was the service/suggestions: 2 useful
2 not useful
23. How often did the t/S ask for direct feedback from S/C regarding the I/S'sfunctioning as a resource? Circle appropriate response.
O - not at all
1 - occasionally
2 - regularly
3 - frequently
4 - always
4 4,
198

24. How available was-the I/S when the S/C needed assistance? Circle appropriateresponse.
0 - not available
1 - occasionally available
2 - regularly available
3 - frequently available
4 - always available
2S. How often did the I/S assist in admidistration/management duties not directlyconnected with service to handicapped children, but improving operation ofS/G in general? f
0 - not at all ,
1 - occasionally
2 - regularly
3 - frequently
4 - always
Rate each of the following:
a. efficient use of time
b. objective writing
c. decision making
d. record keeping
26. How often did the I/S refer to the service sequence model, as presentedand defined in the August 1973 training program (Identification, Diagnosis,Prescription, Programming, Evaluation)? Circle appropriate response.
0 - not at all
1 - occationally
2 - regularly
3 - frequently
4 - always
27. How often did I/S assist the s/G to adapt the training program servicesequence to 'the school's service pattern. Circle appropriate response.
0 - not at all
1 - occasionally
2, - regularly
frequently
4 f- always
Give an example.
199

A
241. the following list of activities represents only a few of the services whichcould have been requested or provided to the S/C by the i/S in each of theactivities. Add any,activities which were engaged in, but not listed, and
0 rate X of tine for those.
a. Consultation regarding a specific teacher with S/C
b. Consultation regarding a specific child with S/C
with Teacher
c. Modeling new techniques to S/C
to teacher- - _
d. Mutual problem- solving with S/6
with teacher
with administrator (principal)
with a group
t.. Mutual decision-making with S/C
with teacher
with administrator-
with group
f. Demonstrate how to maximise creative use of limitedmaterials with S/0
with teacher
g. Assist in test battery development for specific problems
h. Assist in special project deVelopment
i. Other activities
IIMEM=IIIMMINs
\29. What other personnel, agencies, institutions, etc. were utilised as resources?
a. List examples :.
b. What type of service did they provide? list examples:
206
-11-Z i";)

c. Approximate number of times per month other resources than US were
utilized.
d. Who initiated contact with these other resources?
30. Because of location and availability of services, there should be differentWeems of utilization of resources in different schools and districts.Please fill out the following chart in term of ,the pattern of utilizationof resources in your school(s) this year, showing if and how the patternchanged from the beginning to end of the veer.
To fill out the chart, estimate in each block the relative use made by vourschool (district) of the R.MRRC I/S as a resource contact compared to other
available contacts in the school, district, region,etc. Estimate the
average number of hours per week utilization of each service
of S Mid - School Year Lid of School Y
I/S i Other I/S 1 Other . I/S 1 Other
i Resources 'Resources t Resources
11 1
I
L
o
I1
31. Will you continue to operate a S/C program in your school next year?
Yes
32. If yes, what problems, if any, do you see operating the S/C role next year
without the DIRRC US?
Please list.
33. Where do you see sources of assistance and support resources for the S/Cin the school next veer? 'Check if available:
a. School staff-teachers
b. School staffprincioal
c. District peribronel
d. Other community agencies What?
e. Universities
f. State Dept. personnel
g. State Dept. programs
h. Other special education personnel What?
201
1 99

33. (coat.)
/ Which resources did you (or the SIC) utilise this year? Mark with an (0)if utilised in your school(s).
a. School staff-teachers
b. School staff-principal
c. District pefionnel
d. Other community agencies What ?'
a. Universitie,
f. State Dept. personnel
g. State Dept. programs
h. Other special ed4cation personnel What?
34. Will you (or the SIC) be Ale to function in the role of stratistician nextyear without the MAC-based I/S? Circle one:
with the above resources yes no
"without the above resource yes no
33. What have been the most important contributions to your (or your S /C's)
functioning by the RMR C this year. Check:
Training proven
I/S assistance
Iseervice meetings with other Generalists
*service workshops
Other
36. Has the S/C service allowed you to return handicapped. children to ;regular
education from a self-contained classroom?'
Yes No
If so, approximately how many?
37. Do you view yourself (your S/G) as an'addition to other special educationservices or as a replacement to previously existing services.
Addition
Replacement
If replacement, what role or service delivery person wnuld the SIG replace?
Resource Room Teacher
Self - contained Teacher
Other (specify)
202
(4,?

Section 3
PROGRAM ANALYSIS QUESTIONNAIRE
Directions: Questions in this section deal with the definitions and analysisof the school-based rolei of the Generalist and the District Administrators.Please answer all questions according to.your own personal Judgement of howthe role'operated in your particular situation. Again, this is NOT a per-sonal evaluation, but an attempt to clarify and generalize functions acrossindividual school situations and personnel.
GaMeralists, Intermediate Stratisticians, and District Administrators fillout all questions.
Use the slumbers from the following rating scales to answer questions 3S and39.
0 - Mot at all1 - only slightly2 - modirately3 - very much°4 always
36. Rate the amount of time spent per month (on the average) by the 5/9 inyour school in the following activities: (list continues on 2nd page)
a. contracting with teachers (i.e., making mutual agreements as towho will do what in serving a handicapped child)
b. demonstrating nemathods, techniques of identification,diagnosis, prescription, programming, evaluation
c. demonstrating creative use of limited materials
d. discussing, referring to new techniques of identification,diagnosis, prescription, programming, evaluation _
e. assisting in test bittery development
f. providing information on areas of exceptionality
g. consultation with teacher regarding a specific child
h. mutual problem solving with teacherwith administrator
with groupwith child
i. mutual decision-making with teacherwith administrator '
with group
with chi -Id
203
011MMINIM

--------
3. modeling or teaching process of identification, diagnosis,prescription, programming, and evaluation
----Jk. classroom observation
1.. re Oral of students for testing, diagnosis, evaluation
referral of'students for services
n. coordination of programming among a number of other resources
o. madiating.personal conflicts between staff members
p. mediating personal conflicts between teacher /child
39. a. What do you see as necessary to mutates efficient use of resourcesin your school or district?
0.0.1101.MNi
011111111011101A0
01.01111.11111..
b. Who do you see as rasp sible for coordinating thee, resources?
40. In mediating conflicts, the 3/0 nay engage in the following activities.Rate the importance of skill in dealing with the following activitiesfor the 0/0.
8. listening to complaints
b. listening to infra -staff gossip
e. listening to specific problems
d. giving feedback on behavior to a teacher
e. giving feedback on behavior to a child
f. mutual problem solving techniques
g. ieceiving feedback on own behavior
0 i 12 3 4
not slightly moderately very,,important important important important aesential
204
ti
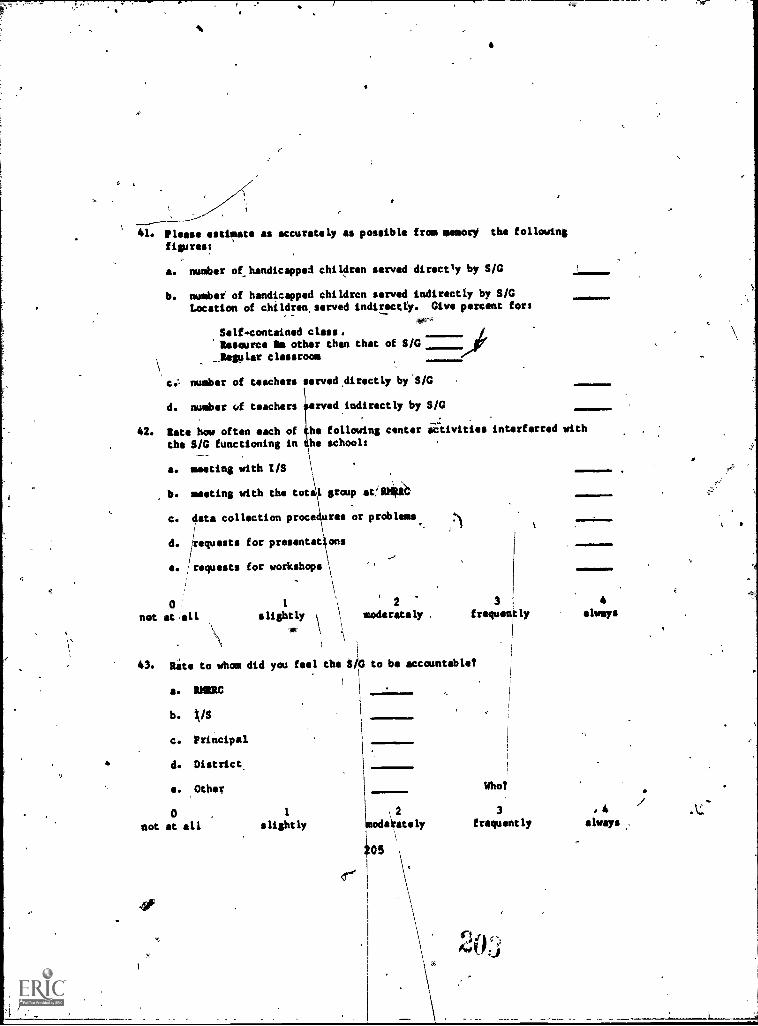
C
41. Please estMoste as accurately as possible from memorY the following
figures:
a. number of handicapped children served directly by S/G
b. number of handicapped children served indirectly by S/C
Location of children, served indirectly. Give percent fort
Self- contained class.Resource Oa other than that of S/C
_.Regular classroom
ci number of teachers served, directly by'S/G
d. number of teachers erved indirectly by S/C
42. Rate how often each of he following center activities interferred with
the S/C functioning in he schools
a. netting with I/S
b. meeting with the total group st!RMilib'
c. data collection proc res or problems
d. //requests for presentat ons
e. requests for workshops
li 1 I.
0not at all
1
slightly
\
.
moderately .
43. Rite to whom did you feel the iiG to be accountable?1
a. MUG
b. /S
c. Principal
d. District,
e. Other
0not at all
4always
Who?
1 \2 3 ,4slightly moderately frequently always
() S
cl''''
tilt);

- --44. In introdUcing and supervising the S/C program in 'the school (or 4istrict),
what methods were utilised by the District Administrators (Principalsincluded)? Rate the following possibilities using the 0 - 4 scale.
a. discussion of the S/C role by principal or administrators
im faculty meetings
in-district metitings
1 , b. presentation of accomplishments,of the SA:
in\imulty'meetings'
in districts meetings
c. discussion of changes wrougttby the S/Gs
\ ,in faculty meetings
in district 'kitings
d. suggestions for cooperation with tb4 S /G, rograms
in facu y
in district
e. participating in staffing or group decision about programming fora particular handicapped child
f. providids information to the S/C on district; school resources
g. providing infdrmation to the S/C cin district, school constraints
b. obtaining tools, funds, services through district contacts
i. giving feedback to S/G
to I/S
to DUG
0.
1 '2 1 3not at all occassionally regularly frequently very frequently
Note: I/S 4 3/0 do not need to answer questions from here on.
\ 206
. 4

45. How many SIC were operating in your school(s) this year/
in your district?
46. What other resources for education of handicapped children other than SIC
4 were available ?, Please list.
/
47. What:is your school(s) geographically located? Cbeck: rural
4$. How was the S/G in your school (district)' selected
urban
suburbei6
for his/her Job?
How was the S/C in your school (district) selected for inclusion inthe RM101C training program?
49. What would you see to be the ideal selection crreria for a S/G?
,50. What constraints operate in achieving that ioesa
207

Appendix D
Preliminary Interview for
Generalist Training Program

The Rocky Mountain Regional-Resource Center (Project
Assistance (:rant No. 542930, BEH) in cooperation with the
University of,Utah, Department of Special Education is
adopting a personnel model designed to maximize the effec-
tiveness of\enhancing classroom.teacher skills and provide
remedial services to handicapped children. The training
program providnd by RIIRRC is designed to prepare tho generalist
as the agent to best demelop and expand these functions.
The following questionnaire is designed to better our
familiarity with your jnterests and experience in special
education. This information shall be most beneficial, in
allowing us to individualize our instructional designs in
the generalist training prOgram,so that this program shall
be profitable as well es convenient for participants.,
Please answer briefly but informatively-the included
questions, And consider your given-risponses to be confidential.

joereonal Backgrovnd
Naas Agn Sex IP M
District School
University gradUated rear
Major minor
Degree/Certifiation
Other education (include inservice)
Past teaching experiences
Past related experiences
Contributions to Special $ducations (publications, projects,etc.)
Professional Organizations s,
Area of Special Education interests
212

Pre-assessment questions:
Learning Module 1: Identification
The list below contains fourteen characteristics of exceptional
children. To some extent each area of exceptionality overlaps
other groups. Place the number of each characteristic under
the area of exceptionality with which it is most commonly associated.ru r,
1. learning rate 1/2 to 3/144-rate of average student ,
2. a large discrepancy between expected performance and actual
performance
3. wide range of academic ability in inverse relationship to
the range of sensory loss
4. awkward hand-eye coordination
5. 'monotonic speech quality
6. overly aggressive or overly withdrawn
7. process discrepancy
8. intellectual impairment
9. psyche-maladjustment
10. no deviation in developmentaligrowth patterns
11. strong forcible expressions
12. inappropriate reactions to life situations
13. perceptual dysfunctions
14. inattentive to visual objects and tasks
AuditorilyHandicapped
PartiallySighted .
LearningDisabled
EducableMentallyRetarded
EmotionallyDisturbed
213
41410Ar4V

Pre-assessment Question:
Learning Module 2: Learning Theories
How and why learning takes place is formulated in a multitude of
learning theories. There are three major classes of learning
theories: (type) theory
deals with organismic variables'in life space,
(Name) believes that le ring takes place in develOpmental stages;
and the most well known theory, the (type) is
based' on a single stimulus paired with a single response.
Pre«assessment Question:
Learning Module 3: Task Analysis
A fifth grader can give change for a five dollar bill. He decides
which syllable is accented in a three syllable word.
Describe three sub-tasks that are necessary to be competent in
each skill.
214

Pre-assessment Questions
Learning Module 4: Process Analysis
What perceptual channels or processes are needed
for each of the following\activities.
a) Writing your name
b) fi ding similarities of sounds
c) de cribing an accident
d) 'di riminating (b) from (d)
e) repeating a word in French
Pre - assessment Questions
Learning Module 5: Identification of Interactional Patterns
.1. What are the 3 essential personal attributes (not skills) to have.
for a Orson in a "helping role" to be effective?
1r
2. What are at least 4 conversational symptoms of dysfunctional'
disagreements?
215

7 7-
3. Define a double message, Give an example of a double message.
4. What 3 conditions must be present for the persons associatedwith a double-bind to lead to deviant behavior.
5. Give 5 ways of communicating other than by verbal context.
6. Name at least 2 things a child must have to developself-esteem.
216
4 ;,!

7. What is the main personal factors leading to dysfunctionalinteraction.
8. It is impossible for a person to avoid defining, or taking
control of the definition of his relationship with another.
trUe false 0
9. Control in a relationship operates two ways. Name the two
Sys.
/
10. Which of.,phe two ways is the most stable?
WhichWay allows most self-esteem?
11. All conflicts in a relationship can be characterized as a
(Fill in the blanks. More than one word.)
12. All dysfunctional behavioral or psychiatric symptoms are Insome degree . 0111 in the blank. One word.)
13. Communication or interaction theory is in conflift withbehavior modification theory and techniques.
true false
217
14. What are the 4 stages of group process ihich must be allowedif a group is to function effectively?
15. Which of the following body positioni;aignify relaxation asopposed to tenseness, excitement, involvement?
a. leaning forwatdb. shifting positionc. symmetryd. asymmetry
16. What is the-best single tool the individual has at hisdisposal in any therapeutic interpersonal interaction2
218
1
/

Pre-assessment question;
Learning ModUle 6: Synthesis of Identification Factors
Frank is a third grader. The teacher reports that he is like a
first grader. After a task analysis it appeared that he didn't
understand concepts such as big, bigger, biggest or that
(f) and (1) could be blended to make one sound. Also, no
one could make him "get to work." What type of diagnostic
inskaument would you select to find more information?- Why?
219

Pre-assessment question:
Learning Module 7: Demographic Variables
The following categorization provides areas for consideration'in
defining a child's background and demcgraphic variables.' Ii
each case two examples are given for the main category. List
two more appropriate suggestions as defining variables for
each category.
I. Physical II. Educational
A.
B.
C.
D.
Birth history
Development
(1) walking
(2) talking ,
A.
B.
C.
Grades skippedor repeated..
Change of schoo
D.
II. Social-Environmental
A. Child's maturity
(1) sense of responsibility
(2) play habits and interests
(3)- .relationships with other children
B. Foreign language
C.
D.
220

Pre-assessment question:
Learning Module 8; Part A: Nature of Intelligence
(1) Check below the names of those individuals who are familiar
to you as being closely associated with the study of human
Guilford. Kephart, Wechsler
Thurston ,, Hebb Cattell!
1Faleski -------Bypinals '" Chronkovith\
'Sint' Bender Simon
(2) Select from the list below statements you think would be
found within a course outline for a class studying the
Nature of Human Intelligence.
11MIMMOM
ilN..111.
Figure-ground perception
Spache Diagnostic Scales
Ability, personality and achievement
Eye-hand coordination
The influence of heredity
The Dubnoff School Program
Problem solving and concept attainment
Qualitative interpretation of vocabulary responses
Consideration of the "G" factor
Study of spatial relations
Fluid and crystapized abilities
Operational definitions: their purpose- and -pis
Learning Module 8; Part B: Measurement
Match statements from Column A to the most descriptive statements
in Column B. (more than one match possible) (see next page)
ti
221

1
Coltman A
1. California Test of Mental Maturity (CTMM)
2. Slosson Intelligence Test (SIT)
3. Illinois Test of Psycholinguistic Abilities (ITPA)
4. Stanford Diagnostic Arithmetic Test (SDAT) ,
5. Detroit Test of Learning Abilities (DTLA)
6. Gates McKillop Reading (GM)
7. Metropolitan Achievement Test (MAT)
Column B
Contains items measuring e'sdblect's ability to seevisual absurdities.
Has a subtest requiring subject to match pictured objeCtson the basis of function or common association.
SW'
3. Asks for similarities and differences between twoobjects.
4. Has items utilizing words as content for measuring audi-tory attention span. .-
5. Has items purporting to measure visual sequehtialmemory.
6. Provides a measure of-oral reading ability.
7. Has:a subtest measuring ability to recall the contentsof a story.
8. Has items that, even though specific numbers change,maintain similar relationa'between numbers.
9. Level I of this instrument does not require an extensivereading response from the subject.
10. Tests child's knowledge of laterality with pictures ofpeople.
11. General measure of level in academic subject areas.--
222o
4

Pre-assessment question:
Learning Module 9: Formal Test Batteries
Match the items in Column A with the best fitting statements
in Column B. (more than one match is possible)
Column A,
2. SIT
3. ITPA
4. DTLA
S. MAT
Column B
1. Yields information in terms of,ne tal age. ,
2. Useful' for children above age 10.
3. Provides differential measures of process functioning.
4. Provides a limas estimate of intelligenc .
5. Require = testee to read the items.
6. Provid grade level scores.
Pre-assessne uestion:
Learning Module 10: Informal Test Batteries
A. An informal reading and/or math inventory yields diagnostic
informationi (check correct responsi4)
1. useful,for comparing one child to several children
2. indicating a child'b level on a general sequenceof skills
3. not usually descriptive of "proficiency rates".of response.
4. which must next be compared to tables of norms,. standard scores.
B. Match the items in Column A with the best fitting stet ments
in Column B. (more than one match possible for Column A/B items)
(see next'page)
223
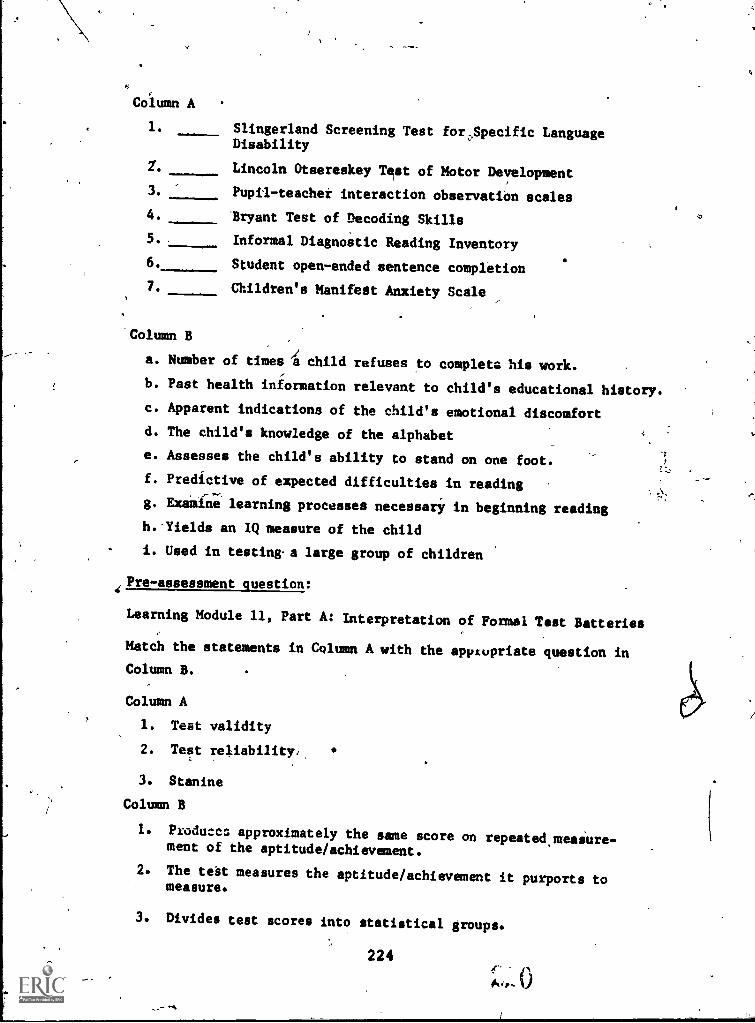
Column A
1. Slingerland Screening Test for,Specific LanguageDisability
Lincoln Otsereskey Test of Motor Development3. Pupil-teacher interaction observatiOn scales
4. 'Bryant Test of Decoding Skills
5. Informal Diagnostic Reading Inventory
6. Student open-ended sentence completion
7. Children's Manifest Anxiety Scale
'Column B
a. Number of times a child refuses to complete his work.
b. Past health information relevant to child's educational history.
c. Apparent indications of the child's emotional discomfort
d. The child's knowledge of the alphabet
e. Assesses the child's ability to stand on one foot.
f. Predictive of expected difficulties in readingwY
g. Examine learning processes necessary in beginning reading
h.Yields an IQ measure of the child
i. Used in testinga large group of children
Pre-assessment question:
Learning Module 11, Part A: Interpretation of Formal Test Batteries
Match the statements in Column A with the appLupriate question in
Column B.
Column A
1. Teat validity
2. Test reliability.
3. Stanine
Column B
1. Preducce approximately the same score on repeated,maiure.ment of the aptitude/achievement.
2. The test measures the aptitude/achievement it purports tomeasure.
3. Divides test scores into statistical groups.
224

Learning Module' 11, Part B:
1. Mean is one description of a group of scores. It is de
as: (mark all correct responses)
a. the average of a sum of scores
b. the middle score in a distribution of scores
c. the most frequent score in a group of scores
2. Standard deviation is one way scores vary around the averagescore. Standard deviation is used to describe: (mark all
correct responses)
a. the norming procedures for criterion referenced tests
b. the scores on a test that will include approximately 2/3of the group
c. how much a score can vary from the average scores and\still be normal
3. Standard scores: (mark all correct responses)
a. are derived from raw scores
b. have an average score of 5
c. allow comparison of scores from many different tests
4. A norm referenced test is used when: (check one)
a. we want to compare a subject's present performance tohis past performance on criterion referenced tasks
b. we want an index of how a subject's performance on atask compared to others' performances on the same task
we are concerned with the test administration resultingin scaled scores
225
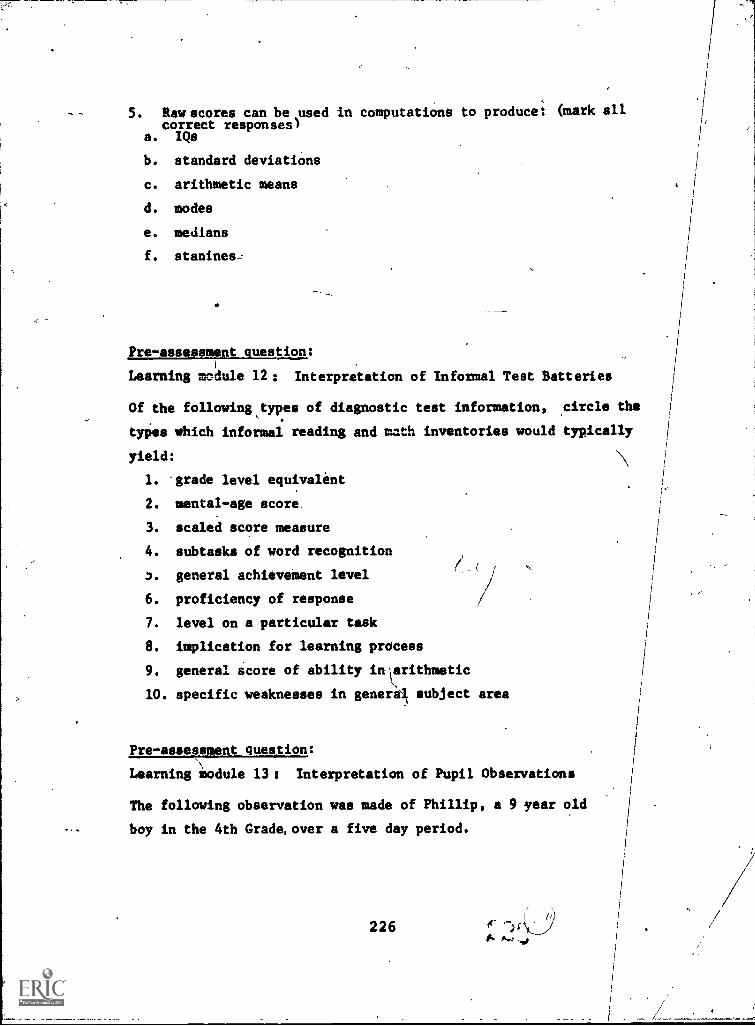
5. Raw scores can be used in computations to produce: (mark allcorrect responses)
a. 'Qs
b. standard deviatiOns
c. arithmetic means
d. modes
e. medians
f. stanines--
Pre-assessment question:
Learning module 12: Interpretation of Informal Test Batteries
Of the following types of diagnostic test information, ,circle the
types which informal reading and math inventories would typically
yield: N\
1. grade level equivalent
2. mental-age score.
3. scaled score measure
4. subtasks of word recognition
general achieveMent level
6. proficiency of response
7. level on a particular task
8. implication for learning process
9. general score of ability inarithmetic
10. specific weaknesses in general subject area
Pre-assessment question:
Learning module 13: Interpretation of Pupil Observations
The following observation was made of Phillip, a 9 year old
boy in the 4th Grade, over a five day period.
226

Teacher Response: 10. Times Phillip's Response No.' Tioes
1. "Stop doing that:" 3 1. (continues talking) 3
2. "Go to the office." 4 2. goes to office 1
3. "If you finish the page,you may recess early." 4
3. finishes the page 3
4. "Why are you acting this 4. continues acting thatway? Are you tired? 5 way 4
5, "Phillip, we don't do that
in this class.
4 5. continues doing that 3
It is predictable from the given information that, for a possibly
effective control approach by the teacher: (mark all correct responses)
1. The teacher may control Phillip more consistently by punish-ing him for his misbehivior.
2. Better control results should be attained by attempting toprobe Phillip and investigate what may be disturbing him.
3. Classroom rules and standards should be established sothat Phillip clearly understands limits and guidelines.
4. Phillip will probably respond to positive consequence andsocial reinforcement techniques. /.=
5. Phillip simply needs to be authoritatively managed andtold "no" for his misbehaviors.
Pre-assessment question:
Learning module 14 : Formulation of a Diagnostic Statement41
The following description provides diagnostic information fromI
a standard diagnostic reading test. Results of\the/various
subtests are reported in grade-level equivalent terms. Read
the test data carefully and choose the most appropriate diagnostic
statement among the given alternatives.
227

0
Jobn, a seven and a half year old 2nd grader, attained the
following end of the year subscores in reading.
SUBTEST GRADE LEVEL
1. Word recognition 3.1
2. Sound blending 2.9
3. Comprehension 1.1
4. Oral vocabulary .9
5. Letter sounds 2.2
Diagnostic statements:
1. John's scores indicate normal achievement in reading and he
will not,require individual skill practice.
2. The amount of difference in the subtest scores is an
expected variability. typical of early readers and does not
require further attention.
3. John should receive additional practice in strengthening
his letter sounds so that his abilities in other areas
shall increase.
4. The possibility of a language deficit is apparent, and
further diagnosis in this area is warranted by John's
scores.
5. Further practice in building sight word recognition is the
best remedial approach for John.
Pre-assessment question:
Learning module 15: Synthesize Diagnostic Conclusion
Utilize the following test data and referral information to
make a diagnostic statement descriptive of both the process
difficulty and a possible remedial-prescriptive approach.
228

I. Referral information:
Sex: male
Grade placement: 3rd grade regular education classroom
Teacher to student ratio:i 1 to 28
Socio-economic status of home: Lower end of the middle incomebracket.
Referral statements:
a. daydreaming
b. teasing other children by poking pencils, etc.
c. noisemaking with objects, i.e., banging books, tapping, etc.
d. frequently refuses-to do social studies assignments
e. works well during art projects
f. likes gym period activities
g. poor reading comprehension (Gilmore Oral Test);
slightly below average in word recognition.
II. Test Battery: CTMM, DTLA, WISC, ITPA
-A. The following test data indicates subtext performances
resulting in scores one or more standard deviations
below the mean for each test.*
CTMM DTLA
opposites (visual stimuli) pict. absurdities-
similarities verbal absurdities
analogies verbal oppositet
inference likenesses and differences
delayed recall oral directions
free associations
WISC ITPA
information auditory reception
similarities visual reception
vocabulary auditory association
visue., association
1
229 ,
,
,
4

B. The following test data indicates those performances
on subtests resulting in scores at or near the mean
for each test.*
STMN
Right and left
Manipulation of areas
Immediate recall
WISC
Comprehension
Picture completion
Picture arrangement
Object assembly'
Block design
Digit span
04/
DTLA
Pictorial opposites
Disarranged pictures
Motor speed
Designs
Orientation
Auditory attention for
Unrelated words
Auditory attention span forrelated syllables
ITPA
Auditory closure
Visual closure
Auditory memory
Visual memory
Sound blending
Grammatie closure
Verbal expression
Manual expression
*Note: Not all subtests given are listed
230
Mot#.;4'.

Pre-assessment question:
In answering the following questions refer to the diagnostic pro-file attached. Keep your answers brief..
Learning Module 16: Intergration of Task and Process Analysis
1. What strength and weaknesses does the diagnostic profile pre-sent that could be considered in writing a prescription? Listthe strengths and weaknesses' and state the educational impli-cations of each. Do not write a prescription.
Strengths Weaknesses
/ 231

h- *! MIKAINPAZ:lorMill f-ilunrn-onrimmrminrOimmmirmmolimr.._ 1WIYFT;r4MIN L., . &-
MINIVF,P.. TA C INIIIIME . _ _.. . IMETIPMEW.PRIMI - - - rninnumummarionaammainnesammu
II
1
!
grlsotAWAVAN,IIINIMMIPIM !WPM ffiRMITIg NIIIIIMIN
A Aril 1
11 11
IIlr!
1!_t___
f - r
0'
wrormsafillifoOrr
ai-Prt-hmrar
ir..rmmtcmriminfair9;
11.

1111111MIMMIMIll11.191719111N2111
IRMININEMEMMIMMIER__11111:Tirir OEM II IrM"11friWriligli till NI _filliatatill11111111111111111111111

Learning Module 17: Student Learning Style
2. What statement(s) could you make about how the student learns,best? (from the profile above)
.Learning Module 18: Matching Appraisal and Remediation
3. .What remedial approach would you recommend given the aboveprofile?
4. Rewrite the following into an objective making it specificand measurable.
Jan is an eight year old girl with inadequate auditory>,discrimination skills. She will be taught to discrimi-nate short vowel sounds in daily oral sessions.
233
200

'Learning Module 19: Instructional Materials
Instructionallmaterials (games, commercial programs, c.) can be
gestalted into five main educational areas: 1) mat ics; 2)
resdinelanguage arts; 3) perceptual; 4) sensory - motor, 5)
psychosocial. For each area list from 4 to 8 materials whichcould be utilised when a student has difficulty within that parti.
cular area For example, the Distar Math Program can be used to
ramediate math difficulties.
6'A
234
Learning Module 20: Use of Instructional Methods/Techniques
Instructional methods or techniques can be gestalted into five
main educational areas: (1) mathematics; (Z) reading/language
arts; (3) perceptual; (4) sensory motor; and (5) psiihosocial.
For each area list from 2 to 5 methods or techniques, including
indivi ual or group activities based on each, which could. be uti-
lized en a student has difficulty within that particular area.
For ex le, in the psychosocial area, letting a child earn points
on numbe of math pages completed for extra recesses is an acti-,
vity unde the technique of reinforcement. Use extra sheets of
paper as n cessary.
r
Learnin'g Module 21: Matching Instructional Methods with Remedia-
tion
Combine 1 to 3 materials, techniques aaWirrumthods you would usein programming the child based on the prescriptive - remedial ap-
proach from question 18.
235

.00
Learning Module 22 s Specification' of Performance Criteria
Define, performance criteria. Decide on the performance criteriafor:the two giiren examples.
Examples:
1. . Given a spelling test with ten words, what would the perform-ance criteria be?
2. Given an assignment of long division probldms involving a 2digit division and a 4 digit dividend, what would the perform-ance criteria be and how would it change for a hyperactivechild?
236

S
Learning Module #23 Matching Performance Adjustment to
Performance Criteria
1. You have established as a performance criteria
fifth grader, that-he shall multiply a 3 digit
2 digit number. Performance criteria include
lams in 30 minutes with an 80% accuracy. Bill
task in 15 minutes with-the following results:
for Bill, a:lumber by a
deing 10 prob-finishes the--
236 433 192 352
13 24 46 1
698 1622 3
236 866 428 35
3058 10,282 38
134 521 139 43
12 12 36 15
268 1042 684 2050
134 521 397 432
1608 6252. 4654 6370
691 197
37 14
4527 465
1873
23,257
197
2435
Analyze the task results for arithmetic sub-tasks required for
performance of this task.
Place these sub-tasks in a hierarchial sequence.
237
et -4
t 41i

Learning Module #24: Determining Acceptable PerformanceAdjustment
1. Analyze Bill's (from Mod. 23) performance for:
a. Source(s) of student difficulty
b. What feedback would you give Bill on his performance?
c. What suggestions,would'you,make to Bill's teacher(mark responses)
1. modify presentation
2. reteach without modifiiation
3. introduce'new task
d. Mastery of the task, i.e., was the accuracyrequirement met?
Yes No

////1
/
I Appendix E'
/ /
_
/Post Training Interview
or,' Generalist raining Program
(/ /
/
/
!

Post-assessment questions:
Learning Module #1 Identification
Write a practical definition including a minimum of five identifi-cation criteria for three areas of exceptionality.
Learning Module #2 Learning Theory .
Name as many of the principles of learning as you can.
241

Learning Module #3 Task Analysis
1. What are the three. "behaviors" described in a task analysis?
2. What does the number 35-3 mean in Criterion Reading?
3. What are the implications if a third grade child has an entrybehavior in an arithmetic analysis of adding skill number 223and the expected skill is number 231?
4. What do the Barsch Dimensions and the Gesell Scales measure?
Learning Module #4 Process Analysis
1. Name the response channels, levels and processes for theseskills.
a. Writing the alphabet
b. Writing dictated words
c. Repetition of a series of numbers
Learning Module #6 Synthesis of Screening
Decide a diagnostic direction for the folloWing case study -
John demonstrates difficulty in the acquisition of learning.He appears "different" to his teacher. Also, he's unmanage-able for teachers and auxilliary personnel.
What diagnosis needs to be administered for pertinent infor-mation?
4), 1 (1242As/ij cl
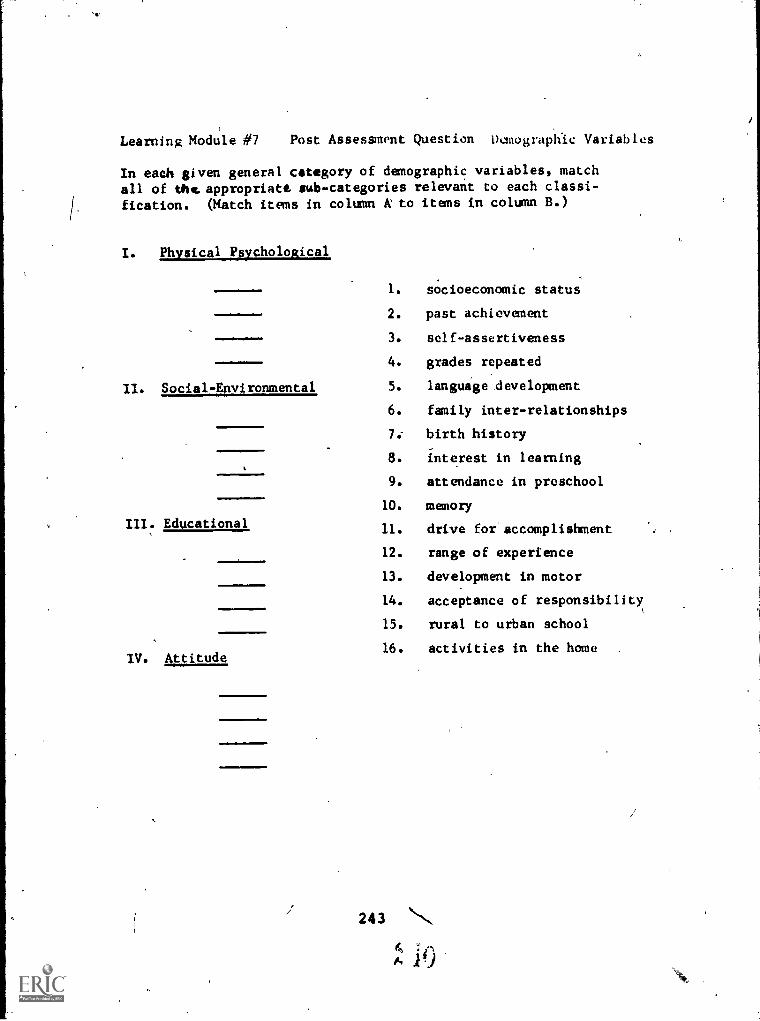
'4
Learning Module #7 Post Assessment Question Ounographic Variables
In each given general category of demographic variables, match
all of thcappropriate sub-categories relevant to each classi-
fication. (Match items in column A to items in column B.)
I. Physical Psychological
IIMIIIMO1111111
II. Social- Environmental
.,.III. Educational
IV. Attitude
OliMMIN
1. socioeconomic status
2. past achievement
3. self-assertiveness
4. grades repeated
5. language development
6. family inter-relationships
7; birth history
8. interest in learning
9. attendance in preschool
10. memory
11. drive for accomplishment
12. range of experience
13. development in motor
14. acceptance of responsibility
15. rural to urban school
16. activities in the home
243

Learning Module 8 Post Assessment Measurement-Intelligence,
Match statements from Column A to the most descriptive statementsin Column B.
Column A
1. Illinois Test of Psycholinguistic Abilities (ITPA)
2. Thurstone
3. Metropolitan AchieVement Test (MAT)
4. Stanford Diagnostic Arithmetic Test (SDAT)
5. J.P. Guilford
6. Slosson Intelligence Test (SIT)
7. Verbal - Performance Factors
8. "TOtal" Intelligence
Column B
M11=1.1,
III
Problem solving and concept attainment
"Fluid" and "crystallized" mental abilities
Correlated to Otis-Lennon Mental Abilities Test
Yields a task analysis in mathematics skills
Reports the general mental 'age of a child
Level of petrformance in basic subject areas
Describes information-processing abilities
Stanford-Binet Intelligence Test
Defines intelligence as separate language & perceptual entities
Wechsler Intelligence Scale for Children
Intelligence factored into 120 separite abilities
244
21t

\Learning Module #9 Post Assessment Question Standardized IstingInstruments
1. For what grade levels is the Intermediate MetropolitanAchieVement Test appropriate?
2. What is the "basal age" described in the Slosson IhtelligenceTest?
3. In the Stanford Diagnostic Arithmetic Test, what is the diff,erencebetween "number computation" and "numberkfacts"?
4. What is the IQ of a child who is chronologically eight years old,with a mental age of 6-years old?
5. What may be two sources of difficulty with the child who, in the
Stanford Diagnostic Reading Test, achieves acceptably with "be-
,ginning sounds", but deficiently in "ending sounds"?
Learning Module #10 Post Assessment Informal Test Batteries
A. An.informal reading and/or math inventory yields diagnostic infor-
mation useful for: (3 correct responses)
1. Atnowledge of "enroute" skills of the prescribed task.
2. Generally assessing the child's mental age.
3. Graphing and showing relevance to other diagnostic data.
4. Teaching definite and refined skills.
N(continued next page)
'245
ti

5. "Absolute" informati n based upon a criterion.
6. Comparing the child's bility to his grade level.
B. Give brief answers to following questions:
1. The Bryant Test of Basic coding Skills uses "nonsense"linguistic items because:
2. The Boswell-John Test of "Individual Difficulties in Funda-mental Processes in Arithmetic" in iagnostically based upon4,
3. The Slingerland.Language Screening Test fo Children useslinguistic tasks for measuring:
4. Classify the response items in Column B to the given basiccategories of the Systematic Observation of Behavior inColumn A: (Only one correct match per category).
A: Categories
1. Information (I)
2. COntrol (C)
3. Participation (P).
4. Self Involved (SI)
5. Response (R)
6. Miscellaneous (M)B. Response Items
a. "How am I doing on this math problem?"b. "I'm not ready, wait a minute"c. Child leaning back in his chaird. Child is sleeping in his deske. "Today we are going to study China"f. "OK, you can return to your seat now"
246
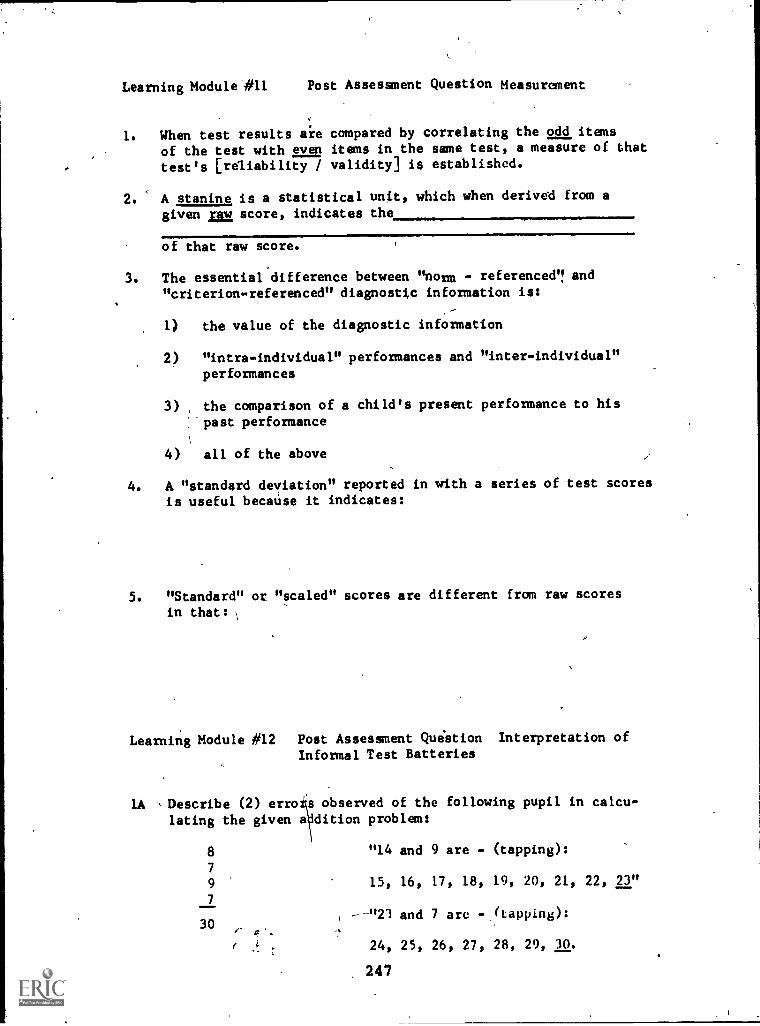
Learning Module #11 Post Assessment Question Measurement
1. When test results are compared by correlating the odd itemsof the test with even items in the same test, a measure of that
test's [reliability / validity] is established.
2. A stanine is a statistical unit, which when derived from a
given raw score, indicates the
of that raw score.
3. The essential difference between "norm - referenced" and"criterion-referenced" diagnostic information is:
1) the value of the diagnostic information
2) "intra-individual" performances and "inter-individual"
performances
3) ,the comparison of a child's present performance to his
past performance
4) all of the above
4. A "standard deviation" reported in with a series of test scores
is useful because it indicates:
5. "Standard" or "scaled" scores are different from raw scores
in that:
Learning Module #12 Post Assessment Question Interpretation of
Informal Test Batteries
lA Describe (2) erro s observed of the following pupil in calcu-lating the given a dition problem:
8 "14 and 9 are - (tapping):
7
9 15, 16, 17, 18, 19, 20, 21, 22, 23"
7
30--"23 and 7 arc -Aapping):
24, 25, 26, 27, 28, 29, 30.
247

(Space to answer 1A)
B. The above diagnostic information may be used later for:
a) Indicating the child's general achievement level inarithmetic
Orb) Indicating the child's level of proficiency of
response in addition.
2A In the administration of the Bryant Test of Decoding Skills,a child responds accordingly:
Stimulus: Response:
1. bof 1. "daf"
2. cal 2. "lac"
3. peke 3. "keep"
4. nime 4. "mane"
2B The errors observed above may best be described according to whichtype of classification used in the instrument? (use best singlepossibility)
a) Apparent difficulty with ability to produce accuratesound associations
b) Apparent difficulty with perceptual organization
c) Apparent difficulty in the ability to blend ot gestalta word unit
d) Would really need more information to classify thenature of the errors.
3A If a child is administered the Slingerland Language ScreeningTest for children and his correct response total for each subtestis about 50-601, what conclusion may be drawn regarding hisperformance? (mark all correct responses)
a) He is about average in development of language processingability.
LL
248

b) A perceptual deficit is a possibility, as the initial.subtests are generally higher scores than the remaining,for an "average" child.
c) Knowledge o the perform of other children his approxi-mate age on /Or grade rivel would be needed to determinethe significance of 50-60%.
d) Because the Slingerland Test is an informal instrument, a50-60% rating indicates that he is only 50-60% accomplishedin language ability.
e) None of the above
f) All of'the above
Learning Module #13 Post Assessment Question Interpretationof Pupil Observations
The following behavior observation wasold boy in the 4to grade.
Monday:
Tuesday:
Wednesday
Thursday
(1) Teachet:
(A) John:
(2), Teacher:
(3) Teacher:
(B) John:
(4) Teacher:
(5) Teacher:
(C) John:
(6) Teacher:
(7) Teacher:
(D) John:
(8) Teacher:
(E) John:
recorded for John, a 9-year
Instructing a lesson in reading
Gives answer to her instructionalquestion
Smiles and continues instruction
Further instruction 4n reading lesson
"I need to sharpen my pencil first."
Ignores his statement
Continued instruction in thereading lesion
(Speaks out) "Hey, I don't get this!"
"Take another look and try it again,John."
Reading instruction
Daydreaming
Talks louder
Reaching in desk
249
10\

Friday ( (9) Teacipr:
(F) John:
(10) Teacher:
Reading instruction
(talking to another student)"Go tell Johnny he's stupid."
"Co stand outside in the hall,
right now!'' (physically shufflesJohnny outside).
(1) Bri fly describe the behavior pattern observed of theteacher over recordings (1) 7 (10)
(2) Briefly ribe the behavior pattern observed of Johnover r cord4,ngs (A) - (F)
3. Place in rank order number the following Systematic Observationof Behavior categories as they describe the progressive Patternof John.
MINIMM110=.1
I IN I= I.
Participation
Response
Self-Involved
Other-Involved
250

f
Learning Module #14 Post Assessment Question Formulation of aDiagnostic Statement
A diagnostic conclusion may be formulated from any singlemoasureof a child, provided that conclusion does not extend beyonddiasnostic information supplied by the measure. List 4 generaltypes of diagnostic conclusions which might be obtained from aMetropolitan Achievement Test for a 6th grade child, other thansimply discussing outcome levels in each subtest area.
Learning Module #15 Post Assessment Question Synthesizing aDiagnostic Conclusion
The fol'owing RMRRC Student Profile provides diagnostic informationfrom the Slosson Intelligence Test, the Metropolitan AchievementTest, the Stanford Dit4nostic Reading Test, the informal BryantTest of Decoding Skills, and the Illinois Teit of PsycholinguisticAbilities. Not all test information is reported, however, thevariables tco be considered are designated on the profile.
Each variable is numbered (1-20).
A. Starting at the right end of the diagnostic sheet drawa continuous solid line, connecting at least 8 variables,which may lead you to conclude an average intelligencerating as a function of visual-perceptual weakness._
B. Starting at the right end of the diagnostic sheet, drawa continuous dotted line, connecting at least 9 variables,which may lead you to conclude only an average "wordknowledge" ability, as a function of an average auditory-perceptual ability.
c.
251.
or

pJ
.14.stilket`
CA p-c1 % vIr
ROCKY MOUNTAIN RE4IIONAL RE.SOURCE CIINTER
r.vatuatinSTJDFNT PROFILE
gr-75.7711
Crile leveli
33 Staff vise rt. II St
!_o
I I MI 1 -Achiovm-ont.' Dia-n*,.?.4:
le s.d r 'or ,41 .41.1114.. kS)4,
.1 r 1,0
5".
C f cr'iSCNrt
MAT 5 T"
-r
r
1 I-
ITPA
.1' ?
twaeral:
Physical 13IC ' atioa
Sucech:Psviho-Szciilolustinont D,sc rirr z
Vision:
lieu cal:
Hearing:
Pro'cct Questionnaire:
Behavior Obr,0rvar4^- (SO4)

APIMINNPI.I.MIIM.M0111WWIMMIIIMIIIMIWONnerg...1111111,ROCKY 40UNTAIN ?a:TONAL RF.SOURCE CENTER STUDFNT PROF/LE
S_Qe:=1.61"_g_t_i 1 torjxrc !stetCrilc level 3 Staff -s(..en o,Pr iSf
AIIIMILAIMMAIm.Mitch I cv of. t
-or- a. '.:1.1114...is)
Ia CO I.
';--Y
r.
-6--
...Mell11111P.-;rnes P
Contort
boh.GJosts
S n s :
1,9 it
726
14.:$111.1
0
cc
41(.....12
rJ
MAT 51)1?..1" Iayj It<S7 - -DEC C. 1:.t .4 (4 I TPA
or at :(,:t PsyL 110-S.-.c i iiSpeech: iustwent Descrirl=,1.
MLA ca I
Visions Pro cc t Questionnaire:
Tiehav, ^r c)bs, rvat nu SOH

In answering the following questions refer to the diagnostic pro-file attached. Keep your answers brief.
Learning Module 16: Integration of Task and Process Analysis
1. What strengths and weaknesses does the diagnostic profile pre-sent that could be considered in writing a prescription? Listthe strengths ana weaknesses and state the educational impli-cations of each. Do not write a prracription.
Strengths Weaknesses
253

* a score of 5 represents the average scoreIra a score of 3 or 7 represents 1 standard deviation above or below the average
_Una=_.C.bnanalan
C:1°-
tiD
S..44.Z1
1.:,1.112t
C StD.11,7t: ""at..-%41.si
5 IA Af coAk 40.Na
.
Sddts.huixg
Culture. fla.c......11.4
sCarle1'4.4
1.44 a -1
Tjarrratm...._.G enere: )11.calAsiash1.-,peed:
Meal atr3.1..af
Tri
412..... ACIjUS*Ce'ent NSCr1f): ..Z&2.*.
. r-e 41.,me. 4'.4,t, -....e.leo-1-0,"4404..A.Z.Z4-1
27:-Te:tteocte-e-*, --4 ..., p- - 4fter_lbnflzus..geet:-.1HOr 061.rvZkiat, f,ae..SIA
4":4.4,_...:4 ,..v.t.:..dige. .....tost..e.7..r.s..C7ad.4..4.,i'
-4 44.1. ..h.''-i.d.1.1.41L:a.e,

iera of 5 represents the average stoicre of 3 or 7 represents 1 standard deviation above. or below the average
cctih.C1 11 3:
Shasmi amPRx! Rpr_
AB a7;?,
..,11111r
.5.1.c10
IL - Cm, ria....aut,
:,0 '- .
A .*. ..:.4-1-1Z1,.A Ied.
t t.;-21.. VarrnaltG tnerel: [ Speech,
witaceit _
. tP._ew ir' 11
1.1
117C
4 .-1 .0
70-
;44
7 4. .
sauae
B..it..1" - S07,,C3I
E
, I A
AcijuSirment cs'; pg. rs
Ato_t,/ -TA'et, ..- 041 iv.it
oti' ifs
get:fror 061.1-v2t*P.sr, Z. Ays1.1.41
. amok:I:Am.A. -

Learning Module 17: Student Learning Style
2. What statement(s) could you make about how the student learnsbest? (from the profile above)
Learning Module 18: Matching Appraisal-and Remediation
3. What remedial approach would you recommend given the aboveprofile?
4. Rewrite the following into an objective making it specificand measurable.
Jan is an eight year old girl with inadequate auditorydiscrimination skills. She will be taught to discrimi-nate short vowel sounds in daily oral Sessions.
254255
Learning Module 19: Instructional Materials
Instructional materials (games, commercial programs, etc.) can begestalted into -five main educational areas: 1) mathematics; 2)
reading/language arts; 3) perceptual; 4) sensory-motor; and 5)
psychosocial. For each area list from 4 to 8 materials whichcould be utilized when a student has difficulty within that parti-cular area. For example, the Dieter Math Program can be used toremediate math difficulties.
4.1
256

Learning Module 20: Use of Instructional Methods/Techniques
Instructional methods or techniques can be gestalted into five
main educational areas: (1) mathematics; (2) reading/languagearts; (3) perceptual; (4) sensory motor; and (5) psychosocial.For each area list from 2 to 5 methods or techniques, includingindividual or group activities based on each, which coup be uti-lised when a studeit has difficulty within that particula area.
For example, in the psychosocial area, letting a child ea points
on number of math pages completed.for extra recesses is an acti-vity under the technique of reinforcement. Use extra sheet of
paper as necessary.
Learning Module 21: Matching Instructional Methods with Remedia-
tion
Combine 1 to 3 materials, techniques and/or methods you would usein programming the child based on the prescriptive-remedial .
approach from question 18.
4,
OD.17 if
257
Learning Module #22: Specification of Performance Criteria
Define performance criteria. Decide on the performance criteria for
the two given examples.
Examples:
1. Given a spelling test with five words, what would the performancecriteria be?
2. Given an assignment of multiplication problems involving a 2digit multiplier and a 4 digit multiplicand, what would theperformance criteria be and how would it change for a hyper-active child? State performance criteria for both non-handicappedand hyperactive child.
Learning Module #23: Matching Performance Adjustment to PerformanceCriteria
Billy has been in a remedial math program conducted by his teacher.He has just taken, along with his classmates, a teacher made teston division (2 numbers into 3 numbers). Performance criteria forthe class has been stated as: the student will correctly multiply7 out of 10 problems in 20 minutes. Billy's performance level was6 correct problems in 25 minutes. Johnny and Mary, his classmates,got 5 and 9 correct problems respectively. Two weeks ago, Billy
achieved, on a similar test, 3 correci. problems out of 10, Johnny'sscorewas 5, and Klry's was 8.
1. How would you use this test as an intra/individual measurement?
2. How would you use this test as an inter/individual measurement?
6A f.f I
a
258

Learning Module #24 Determining Acceptable Pertormanve Adjustment
Billy's teacher wants some feedback from you, the generalist, aboutleaving Billy in the remedial math program, his achievement in re-lation to his peers and the effectiveness of the ranediation program.What would you tell her about each of these?
259

Appendix F
Bibliography on Competency Based Training Programs

BIBLIOGRAPHY ON COMPETENOY BASED TRAINING PROGRAMS
Deever, R. M., Deneke, H. J., & Wochner, R. E. TheEvaluation of Teaching Competence. Tempe, ArizonaCollege of Eduction: Arizona State University,1970.
Gentry, C. G. Defining Characteristics of a Competency-Based Training Education Management System7-ARationale. University of Toledo, 1972.
Houston, W. R. Strategies and Resources for Develop-ing a Competency-Based Teacher Education Program.New York State Education Department Multi-StateConsortium on Performance-Based Teacher Education,1973.
Johnson, C. E. Some Basic Assumptions UnderlyingCompetency-Based Teacher Education Programs.Georgia Educational Models, University of Georgia,
1972.
Kass, C. E. A System of Objectives Based on Bloom'sTaxonomy (Cognitive Domain) Applied to PersonnelPreparation in Learning Disabilities. LTI FinalReport. Depatment of Special Education, Uni-versity of Arizona, 1973, 423-431.
McCleary, L. E., Brown, P. C., Gale. Assessing Com-petency Needs in Administration. University ofUtah, 1973.
McCleary, L. E., McIntyre, K. E. Competency develop-ment and university methodology. NASSP Bulletin,
. March, 1972, 53-59.
McCleary, L. E., & Pol,,G. Quadrant assessment model(QAM) for the assessment of competencies. CCBCNotebook--The Compentency Based Curriculum,University of Utah, 1973, 3, 4-6.
Meyen, E. L., & Altman, R. Individualizing instructionfor pre-service teachers: An applicable competency-based training model. Focus on Exceptional Chil-dren, 1973, 5, 1-12.
Mitzel, H. E. CARE Trains Teachers While They're onthe Job. Computer-Assisted Renewal Education.Penn State University, 1973.
263

1973 Administrative CompetenciesSeminar. Arizona StateUniversity, Tempe, Arizona, 1973.
Shearron, G. F., 6 Johnson, C. E. A prototype for acOmpttency-based proficiency module. GEM Bulletin,Athefs, University of Georgia, College!tion, 1969.
t
264
r

Appendix G
Bibliography on CompetenvLss an0 Skills NeededBy Stratistician/Generalists_

BIBLIOGRAPHY ON COMPETENCIES AND SKILLS NEEDED
BY STRATISTICIAN/GENERALISTS
An Annotated Bibliography. Performance Based TeacherEducation. American Association of Colleges forTeacher Education and ERIC Clearinghouse on TeacherEducation, Washington, D.C., 1972.
Annotated Listing of Competency Based Modules. Catalogue.Florida Center for Teacher' Training Materials,Chipley, Florida, December, 1972.
Bartel, Nettie R., & Hammill, Donald. Teaching Childrenwith Learning Problems: A Handbo k for Teachers.riadelph1a: Temple Univers ty.
Berard, Walter R. Categorical Versus Ion- CategoricalTraining for Sparsely Populated Areas. RegionalTED/CEC Conferepce. Salt Lake Ci y, February, 1972.
Bessel, Harold, & Palomares, Uvalda. Methods in HumanDevelopment. San Diego, Califor is HumanDevelopment Training Institute, 970.
Buchanan, Mary. The Acceptance of S ratisticians inthe Schools. Salt Lake City, U ah: Rocky MountainRegiohal Resour71.. Center, Univ rsity of Utah,November, 1972
Caldwell, Erin Kent. Competency ased Special EducationUndergraduate Internship at estern Carolina Centerfor Mentally Retarded. Boo e, North Carolina:Appalachian State (no. da.,:e)/.
Chinn, Philip, & Drew, Cliffor . Summary and Recom-mendations: Te-:cher Educ tion Division, ATD/CECConference on £p3cial Ed ation, February, 1972.
Christoplos, Florence, & Vallitiitti, Peter. A non-categorical and field competency model for teacherpreparation in special education. The Journalof Special Education, 1972, 6 (2), 115-120.
Clinical Teacher Model for Interrelated Areas of SpecialEducation. Tallahassee, Florida: Oepartment ofHabilitative Sciences, College of Education,Florida State University, 1972.
267
Competency Based Instructional Model for the Universityof Minnesota. University of Minnesota, Departmentof Special Education, 1972.
Competency Based Modules for Strategist Training. Coral-ville, Iowa: Iowa Training Program, MidwesternEducational Resource'SYstem, 1972.
Competencies for Graduate PrograFts in Special Education.Eugene, Oregon: University of Oregon (no date).
Competency Lists. Provo, Utah: Provo District, 1973.
Consulting Resource Teacher Training Program. Univer-sity of Minnesota, Department of Special Education,1972.
Consulting Teacher Model and Program. Burlington,Vermont: University of Vermont, February, 1973.
Coordinated Helps in Language Development. Portland,
Oregon: Northwest Regional Educational Labora-tory, 1970.
Development of Higher Level Thinking Abilities. Port-land, Oregon: Northwest Regional EducationalLaboratory, 1972.
Elam, Sianley. "What Is the State of the Art? Per-formance Based Teacher Education. Washington,D.C.: American Association for Teacher Educa-tion, December, 1971.
Facilitating Inquiry in the Classrooms. Portland,Oregcn: Northwest Regional Educational Laboratory,1970.
Fifield; Marvin G. Summation of Regional TED/CECTeacher Education.' Salt Lake City, Utah:Regional Conference, February, 1972.
Generalist Questionnaires. Weber District, Utah, Spring,1973.
Gentry, Castelle. Defining Characteristics of a CBTEManagement System. Toledo: University of Toledo,1972.
Gentry, Castelle. Heuristics for the Development of aCBTE Program. Toledo: University of Toledo,1971.
268

Glass, Raymond, & Meckler, Roy. Training Eleme taryTeachers to Instruct Mildly Handicapped C ildrenin Regular Classrooms: A Summer WorkshoIndiana University.
Glass, Raymond, & Newman, Roger. Develop nt of Auto-Instructional Units Designed to Imp ve the Teach-ing of Mildly Handicapped Children, in RegularElementary Classrooms. Center fo Innovation inTeaching the Handicapped. India a University,January, 1972.
Gordon, Thomas. Human Effectiveness Training.Pasadena, California: Effectiveness TrainingAssociates, 1972.,,
Hall, Keith, & Mitzel,' Harold. /ennsylvania StateUniversity. Mobile Inservice Training to RecognizeChildren's Handicapping Cpnditions for Teachersin Regular Classrooms. A paper given atConference on Instructional Deyglopmeiff-ind Dis-semination in Teacher Edueetibn.1973.
Havelock, Ronald G. The Change Agent's Guide to Inno-vation in Education. Inglewood ClaYsT-New.Jersey:Educational Technology Publications, 1973.
Houston, W. Robert. Resources for Performance-BasedEducation. Performance Education. New York StateEducation Department--Division of Teacher Educa-tion and Certification and Multi-State Consortiumon Performance-Based Teacher Education. March,1973.
' Houston, W. Robert. Strategies and Resources forDeveloping a Compentency Based Teacher EducationalProgram. Performance Education. New York StateEducation Department--Division of Teacher Educa-tion-and Certification and Multi-State Consortiumon Performance-Based Teacher Education. October,1972.
Improving Motor-Perceptual Skills. Portland, Oregon:Northwest Regional Educational Laboratory, 19706
Individualized, Competency-Based Learning Programs inEducation. Salt Lake City, Utah: ILM Publishers,1973.
Instructional Specialist for Teachers of ExceptionalLearners. Eugene, Oregon: Northwest RegionalResource Center, December, 1972.
6' ,..
4.0269

Interim Report on Development of Competency Based Train-ing Program. Lexington, Kentucky: University ofKentucky, Department of Special Education (nodate).
Interpersonal Communications. Portland, Oregon: North-west Regional Educational Laboratory, 2nd printing,1972.
Johnson, Charles. Some Basic Assumptions UnderlyingCompetency Based Teacher Education Programs.Athens, Georgia:. University of Georgia, February,1972.
Lambie, John, & Sorensen, Randolph. Suggestions Concern-ing Teacher Education Programs. TED/CEC Conference,Salt Lake City, Utah, February; 1972.
Leadership Training Institute in Learning Disabilities.Department of Special Education, University ofArizona. Program Development Branch, Division of-Education Service. Bureau of Education for theHandicapped. U.S. Office of Education. 1 and 2.1972.
Mann, Phil, & McClung, Rose. A Learning Problem Approachto Teacher Education. University of Miama. Apaper given at the Conference of InstructionalDevelopment and Dissemination in Teacher Educa-tion, Chicago, January, 1973.
Mourtisen, Roger. The Impact of Competency Based Teachern Education and Certification Programs in Utah. Un-
J published paper, 1972.
Ojemann, Ralph H. A Teaching Program in Human Behaviorand Mental Health. Cleveland, Ohio: EducationalResearch Council, 1967.
Overview of Non-Categorial Special Education TeacherOriented Models. Clarion, Pennsylvania: ClarionState College.
Pappanikou, John, & Cawley, J. F. Decision SystemModules fo1 Adminstrators. University of Connecticut.A paper given at the Conference on InstructionalDevelopment and Dissemination in Teacher Education,Chicago, January, 1973.
Problemat. Davis District, Utah. March 3,.1973. Un-published paper from conference sponsored by theUtah State Board of Education.
ti , 270

r.
Problemat. Tooele, Utah. November 2, 1972. Unpub-lished paper, Participating Districts AdvisoryCommittee Meeting, sponsored by the Rocky Mountai,Regional Resource Center, University of Utah.
Problemat on Special Educator Competencies. JordanDistrict. Jordan, Utah. March 1973.
Prospectus of the Prescriptive Teaching and DiagnosticPrescriptive Teaching; Training Programs in SpecialEducation Area. Laramie, Wyoming: Department ofGuidance and Counselor Education, University ofWyoming.
Prototype--Training Program for the Preparation ofCurriculum Consultants for Exceptiona4 Children.Columbia, Missouri: University of Missouri,Competency Research Phase--January, 1972. ModuleSpecification Stage--February, 1973. Meyen,Edward L., Director.
Randolph, Norma, & Howe, William. Self-Enhancing Educa-tion. Palo Alto, California: Stanford Press,1966.
Regulations for Teachers--Exceptional Child Education(K-12). Tallahassee, Florida: Department ofEducation, State Board of Educational Regulations,Chap. 6A-4, Section 17, March, 1972.
Requirements for Certification in Learning Disabilitiesand for Certification of Special Education Ad-ministrators. Department of Special Education,The University of Texas at Austin.
Resource'and Principal Role Expectations. Ogden SchoolDistrict, Utah, 1972.
Seward University Project. University of Minnesota,Department of Special Education, 1972.
Special Education Resource Teacher Trainipg. Universityof Minnesota, Department of Special Education, 1972.
Stamm, John. A General Model for the Design of anInterrelated, Competency-Based Professional Train-ing Program for Teachers of Handicapped Children.University of Oregon. A paper given at the RegionalTED/CEC Conference, Salt Lake City, Utah, February,1972.
271

Stratistician Dialogue. Unpublished paper, RockyMountain Regional Resource Center, University ofUtah, June 8, 1972.
Stratistician Questionnaire and Problemat. Salt LakeCity, Utah: Rocky Mountain Regional ResourceCenter, University of Utah, February, 1973.
Systematic and Objective Analysis of Instruction.Portland,"Oregon: Northwest Regional EducationalLaboratory, 1972.
Teacher/Cons'ultant Competencies. Eugene, Oregon:Northwest Regional Resource Center, October, 1972.
Thiagarajan, Sirasailom, Semmel, Melvyn, & Semmel,Dorothy. Source Book on Instructional Developmentfor Training Teachers of Exceptional Children.Center for Innovation in Teaching the Handicapped.Indiana University, Bloomington, Indiana. Apaper given at the Conference of InstructionalDevelopment and Dissemination in Teacher Education,Chicago, January, 1973.
Training Institute for Special Education Teachers.Educational Service Center. Austin, Texas. Papergiven at the Conference on Instructional Develop-ment and Dissemination in Teacher Education.Chicago, January, 1973.
Wilkits (Weber Individualized Learning Kits). Ogden,Utah: Weber State College, various dates.
4
272
Appendix H
Summary Content Analysis ofStratistician/Generalist Training Program

Summary content analysis of 24 competency statements developed inRMRRC Competency Based Generalist Training.
Competency statements were placed in each of thi,appropriate process
cells, for the "Identification", "Diagnosis", "Prescription", Pro-gramming", and "Evaluation" content columns. For the purposes ofgroup consensus, content itemization, (by which "training components"and performance objectives were written) were clustered into basiccategories, so that individualized groups could later develop these
into methods of approach.
Identification
The following "Identification" outline for content was developed:
Module No.
1. The generalist shall demonstrate an understanding ofspecific speciality areas and clafsification criteria
A. Educable Mentally Retarded
1. Legal definition'2. Practical definition3. Personal criteria and/or informal methods for
identifying this disabled child
4. Characteristics
a. Behavioralb. Academicc. Functional capacities
5. Profile
a. Totalb. RMRRC
B. Trainable Mentally Retarded
1. Legal definition2. Practical definition
3. Personal criteria and/or informal methods foridentifying this disabled child
4. Characteristics
275

a. Behavioralb. Academicc. Functional capacities
5. Profile
a. Totalb. RMRRC
C. Emotionally Disturbed
1. Legal definition2. Practical definition3. Personal criteria and/or informal methods for
identifying this disabled child4. Characteristics
a. Behavioralb. Academicc. Functional capacities
5. Profile
a. Totalb. RMRRC
D. Blind and Partially Seeing Children
1. Legal definition2. Practical definition
3. Personal criteria and/or informal methods foridentifying this disabled child
4. Characteristics
a. Behavioralb. Academicc. Functional capacities
5. Profile
a. Totalb. RMRRC
E. Deaf and Hard of Rearing
1. Legal definition2. Practical definition3. Personal criteria and/or informal methods for
identifying this disabled child
276e

4. Characteristics
a. Behavioral
b. Academicc. Functional capacities
5. Prdfile
a. Totalb. RMRRC
F. Speech Impaired Children
1. Legal definition2. Practical definition3. Personal criteria and/or informal methods for
identifying this disabled child4. Characteristics
a. Behavioralb. Academicc. Functional capacities
5. Profile
a. Totalb. RMRRC
G. Learning Disabled
1. Legal definition2. Practical definition3. Personal criteria and/or informal methods for
identifying this disabled child4. Characteristics
a. Behavioralb. Academicc. Functional capacities
5. Profile
a. Totalb. RMRRC
H. Cerebral Palsy and Associated Areas
1. Legal definition2. Practical definition3. Personal criteria and/or informal methods for
identifying this disabled child
277

4. Characteristics
a. Behavioralb. Academicc. Functional capacities
5. Profile
a. Totalb. RMRRC
Module No.
2. Generalist shall demonstrate an understanding of learning
theories
A. Mind-Substance
. 1. Titchner-Apperception
B. Conditioning Theories
1. Thorndike Connectionism
2. Watson ,,,Conditioning- Behaviorism
3. B.F. Skinner Reinforcement-Conditioning
C. Cognitive Theories of Gestalt-field
1. Kurt Lewin-Field Theory
D. Developmental
1. Jean Piaget
Organismi"
1. Werner
F. Principles of Learning
3. The generalist shall utilize conventional task analysis
of basic subject areas
A. Reading-Criterion ReadingB. Mathematics - Revised Developmental MathC. Motor - Barsch-Kephart CombinationD. Task Analysis Technique
4. The generalist shall utilize conventional process analysisof basic subskills (in task analysis)
278

A. Process - Osgood-Wepman "Model"B. Process Analysis Technique
5. The generalist shall interpret personality-behavioralpatterns
A. Affective Conflict Isolation Models
1. Description2. Uses
B. Model of "Man"
1. Need for self-esteem2. Evidences
C. Group Models
1. Description2. Uses
D. Communication Models
1. Description2. Uses
E. Pathology Models
1. Types of distortions2. Uses
F. Therapy Models
1. Bases2. Techniques3. Uses
G. Personal Insight Model
1. Need2. Techniques
6. The generalist shall synthesize identification factorsand derive a diagnostic direction.
Diagnosis
The following "Diagnosis" outline for content was
developed:
7. The generalist shall demonstrate an understanding of
student demographic variables
279dr' LA,
A /

pattern - home visitation, parent interviews
1. Sibling2. Age\3. Health
B. CulturalAiescription - environment
1. SES2. Nationality'
8. The generalist shall demonstrate an understanding of
formal test batteries
A. Nature of Intelligence
1. Theoretical concepts
a. total factor (g) Binet
b. split factor
1) V - P2) multi
Measurement
1. CTMM - SIT - - - -IA measure
2. MAT SDRT---- achievem- and subject survey
CAT SDAT3. ITPA- - -Process'
DTLA, May 174
9. The generalist shall administer formal test batteries
A. Measurement
1. Achievement (CTMM)2. Intelligence (SIT)
3. Process (ITPA, DTLA, May '74)
10. The generalist shall administer informal test batteries
A. Subject area
1. Reading Inventory (Bryant Decoding, etc.)
2. Math (CTBS, Scagliotti)
B. Psycho - social
1. Pupil interview andoebservation e
280

a. Sentence - open end (Completion) source:Taylor, Edith
b. SOB
c. Sociom is techniquesd. Cop rsmith, Children's Manifest Anxiety
Test, Anxiety Scale, Social DesirabilityScale. tY,
C. Motor
1. Lincoln Otseresky
D. Integration
1. Slingerland
11. The generalist shall interpret formal test batteries
A. Description base
1. Grade level2. Mental factors3. Processes4. Sub Tasks5. Informal implications (test behavior)
B. Recording - measurement unit
1. Raw-scaled2. Standard deviation3. Stanine4. Tables5. Norm referenced
12. The generalist shall interpret informal test batteries
L. Description base
1. Grade level2. Mental factors3. Processes4. Sub tasks
5. Informal implicationsOR, 6. Criterion basis
13. The generalist shall interpretobservations
A. SOB - summarizing
B. Indicators, affective
281
(test behaviors, etc.)
pupil interviews and

14. The generalist shall formulate a diagnostic statement
from a single test4
A. Rate of learningB. Function - process discrepancyC. Relate to school tasksD. Make statement
15. The generalist shall formulate diagnostic conclusion
frowiumulative information
A. Balance and weigh information
1. Test battery (formal-informal)2. Demographic information3. School history
4. Other agency information
B. Conclusion
prescrlption.
16. The generalist shall interpret the results of task and
irocess analysis
A. Performance conditions
1. Power of learning
a. qualityb. quantityc. rate
2. Environmental conditions
a. total environmentb. learning environment
B. Level of difficulty
1. Task analysis
a. readingb. mathc. sensory motor
2. Process analysis'
Qs perceptualb. sensory motor
(282

17. The generalist shall write a L:atement(s) about astudent's learning style based on strengths and weak-
nesses
A. List of variables (strengths and weaknesses)
1. Reading2. Math3. Sensory motor
4. Perceptual5. Physical6. Psycho-social7. Environmental
B. Write learning style statements
1. Reading2. Math3. Sensory motor4. Perception5. Physical6. Psycho-social7. Environmental
18. The generalist stall match appraisal with a remedial
approach
A. Interpret the profile
B. Write an educational prescription
Programming
The following "Programming" outline for content was
developed:
10. The generalist shall demonstrate understanding of purpose
and use of instructional material
A. Remedial approaches (see monograph)
1. Auditory Perception (and others) - (self-help
.experiences)
a. Instructional materials
(1) Commercial
(a) Modifying existing(b) Teacher-developed
283

b. Self-Contained programs (rationale)c. Enrichment Programs (rationale)d. Retrieval- Location (rationale)
20. The generalist shall demonstrate the use of instructionalmethods/techniques
A. Instructional methods and techniques
1. Math (Lehtinen, Fernald, Stern, PrecisionTeaching)
2. Reading (Fernald, Spalding, Gates, Monroe, Gilling-ham, Arillman, Precision Teaching)
3. Psychosocial (Conferences and Student Contracts,Space Arrangement, Behavior Modification, TokenEconomy)
4. Perceptual (Barsch, Myklebust, Barry)5. Sensory-Motor (Barsch, Kephart)
B. Classroom Activities based on above techniques and. methods worksheets
21. The generalist shall match instructional materials and/ortechniques with diagnostic - remedial approach
A. Match materials and/or techniques and methods todisability areas
B. Apply to practice profile5 (1 in each area) to work on individually
2. The generalist shall specify performance criteria withinan instructional program
A. Limitations to implementing/program(s) (time, teacher,ability, materials)
B. Deciding upon rformance criteria applied to praCticeprofile
C. Performance Criteria applied to the 5 program profiles
2
Thedev
23. The generalist shall matchperformance criteria
Evaluation
following "Evaluation"loped:
284
'outline for content was
performance adjustment to
A. k
A. CriteriaB. Ranges ,
C. LimitsD. Confidence interval
24. The generalist shall determine adjustment as acceptableor, unacceptable
A. Alternatives 0
1. Reteach2. Continue3. Recycle4. Educated alternatives
Interpersonal. Communication Skills
25. , The generalist shall demonstrate an awareness of humaninteraction processes
A. Factors in relating aS'a human being
B. Communication processes
1. Hearing where the other person is
a. Roadblocks to communicationb. Reflective/active listening
2. Sending where you are
a. Congruent forthright sendingb. "I" messages
/
C. Problem solving methodology
1. InterpersonalapIlemmr-----
a. Where you are involved
b. Mediating between two people
2. Group problem solving
D. Factors critical to acceptance in the school
1. Reading the environment2. Basic stances about your role
3. Basic stances about teachers
285
4

Appendix I
Problem Children: An Assessment of
Teacher Observations and Attitudes

PROBLEM CHILDREN: AN ASSEFAENT OF
TEACHER OBSERVATIONS AND ATTITUDES'
Judy Ann Buffmire
Glenn W. Moseley
David C. Bradford
Working Paper No. 2
October, 1971
ROCKY MOUNTAIN REGIONAL RESOURCE CENTER
DEPARTMENT OF SPECIAL EDUCATION'
UNIVERSITY OF UTAH
'Preparation of this paper supported by Grant No. OEG-0-70-4178(608),
Project No. 542930, from the Department of Health, Education and Welfare,
United States Office of Education, Bureau of Education for the Handi-
capped, Washington, D.C. 20202.
Judy Ann Buffmire is Assistant Professor of Special Education, Uni-
versity of Utah, and Project Director, Rocky Mountain Regional Resource
Center. Glenn W. Moseley is Clinical Instructorof Special Education,
University of Utah, and Service Director, Rocky Mountain Regional Resource
Center. David C. Bradford is Research Assistants Rocky Mountain Regional
Resource Center
These papers are intended primarily as informal communications to,
and among members ;of the Rocky Mountain Regional Resource staff and faculty
of the Department 'of Special Education. The materials contained herein
are generally not in final stages of refinement and are not to be cited
without the authors' permission.
289

Problem Children - An Assessment of Teacher Observations and Attitudes
Rocky Mountain Regional Resource. Center
In the early part of 1971, the Rocky Mountain Regional ResourceCenter (RMRRC) developed a questionnaire (Exhibit I.1) designedto assess generally how typical classroom teachers perceive and
deal with "difficult" children. By difficult is meant any sortof behavioral, attitudinal or learning problem that has not beenjudged severe enough to warrant assigning the child to a specialclass, but of sufficient consequence to interfere with the
educational process. The rationale of the questionnaire was
based on two major premises: (1) There are many children in Utahwho need special educational help who are not yet getting it.
An estimated 40% of the expected population of exceptional children
in Utah are not being served by special educational services.(2) The mere fact of label ing a child almost certainly influencesin some significant way th manner in which teachers, mental}
health professionals, adm nistrators and the child's peersinteract with him. Rosenthal and Jacobsen (1968) present a
strong case for the reality of the interpersonal "self-fulfillingprophecy"--i.e., knowing that a student is "mentally retarded"very often causes his parents, teachers, and others to deal
with him in ways different from the ways they deal with "normal"
students. Though not the cause of the child's conditionr thesedifferences in interaction may serve to accentuate and magnifythat condition rather than improve it.
Proceeding then on the above premises, a questionnaire wasdevised to ascertain how teachers assess classroom problems andwhat strategies they use to solve them. Some of the terms used
in the questionnaire were purposely rather general and ambiguousin the expectation that lack of specificity would cause theteacher to report problems on the basis of what, were actuallydifficulties in the classroom rather than interpreting thoseproblems on the basis of an individual, conception of thecriteria for "mentally retarded," "emotionally disturbed," etc.However, complete avoidance of labelling is obviously undesirablein this type of questionnaire, because some questions simplycannot be asked without using such terms as 'mildly retarded" ;Cr"mildly educationally handicapped."
Method
The basic purpose of the questionnaire is to provide the necessaryinformation for selection and training of special "resource"
291

personnel called stratisticians. The purpose of a sttatistician
as seen by the RMRRC is to aid the classroom teacher in dealing
with her "difficult" students. Because the stratisticiaufaccording to the model, would be working closely with the teacher
(actually working through the teacher), it seemed appropriate togather responses about various attitudes from a sample of teachers
from various kinds of schools with the intent of discovering anydifferences among schools that might affect stratistician
assignments. It was decided to gather a sample stratified along
such lines as socioeconomic level, teaching method used in the
school, percent of ethnic minorities in the school, and location
of the school (rural, suburban, central-city). This sample was
taken in four of the five Salt Lake area districts: Murray,
Granite, Davis, and Salt Lake. To give added depth to thesample, questionnaires were sent to the rural area in the south-
west region of Utah. Five of the seven districts responded,with a total return of over 175 questionnaires from Kane, Gar-field, Iron, Washington, and Millard districts. Another 81
questionnaires came from Tooele District, for a total return of
356 questionnaires. This total reprelents 67. of the State's
teachers and 59% of the teachers in the schools chosen for the
study. The percentage of questionnaire completion and returnwas 60% for the Salt Lake area districts, 55% for Tooele
District, and 81% for the five Southwest Utah districts. Total
return was 67.5%.
A more explicit explanation of the stratified sample is in order.
Initially, steps were taken to gain approval for the project
from the State Board of Education. The State Board reviewed thequestionnaire and the proposal and wrote a letter to the districtsinvolved (Salt Lake, Granite, Murray, Jordan, and Davis) urging
their cooperation, with the understanding that cooperation would
be entirely voluntary. Personnel at the districts involved were
then contacted. The purpose of the visit to the district
offices was not only to gain permission to approach the schools
on the matter, but also to obtain a jUdgment about what schools
appropriately fall into the categories mentioned above, i.e.,high and low socioeconomic area, high and low percentage ofethnic minorities, location (central-city, suburban, rural) and
teaching method. No effort was made here to check rater relia-
bility. Since only a few of the most extreme cases in any givencategory were selected, the estimates by district personnel were
assumed to be accurate and reliable. The districts involved
gave permission to conduct the study on the condition that
cooperation be entirely at the discretion of the individual school
principals. It would be well to mention here that not all of
the schools chosen were subsequently contacted, for the reasonthat the school year was very nearly over when the study was
begun and time did itot suffice. However, this did not differ-
entially affect any part of the sample stratification. Principals
were then contacted, and despite the closeness of the end of the
////292

school year, nearly all of them cooperated.
The questionnaires from the Southwest region were obtained bymailing a number of questionnaires to the various district offices,with whom prior contact had been made, whereupon the-districtsthemselves distributed and collected then, and mailed them to
the RMRRC offices. Questionnaires from Tooele had already been
obtained incident to a previous st/udy:
Results and Discussion
This section consists of two main parts. The first part deals
with analyses of the body of the questionnaire, questions 1-22.These questions are oriented to unique RKRRC data needs and areof principal interest in this study. Analyses were threefold:
(1) summary data (means, percentages) of the total sample;(2) comparison according to predetermined lines of samplestratification; and (3) comparison among school districts and
areas of the state. Inasmuch as this study was primarilyintended to be a search for some general guidelines, a minutelydetailed analysis was not made. TreLds, large differences, andhigh correlatiOns comprise the bulk of the analysis. Also, only
those questions that easily lend themselves to quantitativeanalysis are discussed; questions 4 and 12 are omitted.
Fxhibits 1.2 and 1.3 summarize the data from the first section.
Computer analysis was done in cooperation with the Universityof Utah Computer Center with the CLANG processor, a demand-mode, multi-purpose data processing system developed by JohnHawkins of the University.'
The second part is an analysis of the last page of the question-naire, a checklist of 48 behaviors taken from a list of 50behaviors used in a study by Kutimer and Rosemier (1967) andoriginally developed by Wickman (1928). Their study and numerous
previous studies have dealt with the moral, legal, or socialseriousness of certain behaviors. The present study dealsexclusively with behaviors as they actually exist as problemsin the classroom. A detailed,. report on this phase of the study
will be available from the-Center separately. A summary of these
results comprises Appendix D. This information will be used for
training of stratisticians in methods to most effectively dealwithbehaviors most often a problem in the classroom.
Section I
The first part of the questionnaire deals with four separatetopics. They are:
a. magnitude and scope of the problem (questions 1, 2, 3
and 6);
293
of

b. assessment of the help presently available (questions
4, 11, 13, 14);
c. attitudes about the stratistician model (questions
7-10);
d. attitudes about general aspects of special education.
(questions 15 -22).
A. Magnitude of the Problem (see Exhibit 1.2, Table 1)
Teachers in the sample estimated from their total teaching
experience that in a class of 30, about 5.3 students would be
classified as difficult. They estimated that this 17.6% of the
class required about 26.47.iof their classroom time. Male
teachers estimated more problem students than female teachers
(5.5 vs. 5.2), but spent a smaller proportion of the school day
dealing with them (22.4% vs. 28.4%). The most striking drYfer-
ences, however, were between teachers in central-city schools and
those in suburban schools. The central-city teachers averaged
6.7 difficult students and spent more than a third of their
school day (36.37.) dealing with them, whereas suburban teachers
reported about 4.7 students and used 24.9% of their dLy with
them. Rural teachers averaged very close to the sample mean on
both questions (5.3, 26.0%). Similar differences occur between
teachers in areas with a high percentage of ethnic minorities
versus a low percentage and high versus low socioeconomic areas.
Question 6 revealed some interesting attitudes regarding the number
of "mildly retarded" children a teacher would be willing to accept
(or could effectively handle) in a class of 30 (part "a") or in
a class of 20 (part "b"). The sample average for part "a" was
2.2, significantly lower than the average for question 1. The
average for part "b" was 3.5. Male teachers reported a willing-
ness to accept more ',mildly retarded" students than female
teachers did, regardless of class size (2.8 vs. 2.0 for a class
of 30; 4.2 vs. 3.3 for a class of 20). Central-city teachers
averaged higher than suburban teachers on both parts of this
question, but rural teachers were the most "accepting" of the
three. There were no other striking differences on question 6.
B. Help Presently Available for the Teacher (see Exhibit 1.2,
Table 2)
Help for the teacher normally comes from two different levels
!the school (question 5) and the district (quemtions 11, 13, and
14)'. Question 5 asked for a rating of helpfulness of various
persons in the school--the principal, fellow teachers, special
class teachers, and "other." Since not every /school has persons
for all of these functions, the analysis is bised only on those re-
sponded on the various parts or.the questidn. On the average,
principals were viewed as the single most helpful individual
294

in the school, with a score of 2.89 ("highly helpful") on a
four-point helpfulness scale. Fellow teachers were the next
most helpful (2.65) and "other" - psychologists, district
personnel, social. workers, and most frequently, parents--closebehind at 2:58. Special class teachers ranked fourth (2.49)
and counselors fifth (2.18, or "mildly helpful"). Also, it can
be assumed that since special education teachers, customarilyhave children assigned to them throughout the day, little timeis available for consultation with other teacherd. Since very
few elementary schools have counselors at all, the low helpful--ness score for counselors could be attributed in part to a strong
bias in the resultant sample.
The responsibility of providing special education services falls
almost without exception to the district. Obviously, then,
an assessment of the effectiveness of special education in the
schools is a reasonable measure of how well the district program
is meeting teacher needs.
For the sample as a whole, 53% reportediusing a special education
service in the ongoing work of the class. Those services were
rated slightly higher than "mildly effective," and 84% said they
wanted more special services than are now available.
C. The Stratistician Model (see Exhibit 1.2, Table 3)
In interpreting this sectio/of the results, it must be borne in
mind that the stratistician model is new and that teachers weregiven only a very limited explanation of it in the cover letter
to the questionnaire (Exhibit 1.1). These conditions
notwithstanding, the responses to questionI-7-10 seen to indicate
reasonably good teacher conceptualization of the model. In
summary, here is the picture of the preferred person and role for
a stratistician from the teacher's standpoint: It is highly
important for the stratistician to share my educational philosophy,
but his age and sex do not matter. It is only mildly important
that I have a voice in choosing the stratistician in my school.I would prefer to share responsibility for problems equally with
a stratistician (65%), or at least have him available to me for
consultation (25%), and would find release time to plan with astratistician desirable (48%) or imperative (38%).
In this section of the questionnaire there were only minordifferences among the major divisions of the sample.
D. General Attitudes About Issues in Special Education (see-Exhibit 1.2, Table 4)
The fifth page of the questionnaire contains seven questionsdealing with attitudes-taken from the Missouri,Conference onthe Categorical/Non-Categorical issue in Special EduCation
(1971). The teacher was instructed to indicate in whatposition'he viewed himself on these issues on a six-point
29511

continuumfrom "strongly agree" (1) to "strongly disagree" (6).
Following is a discussion of where the teachers in the sample
placed themselves on this scale, with interesting differences
among central-city, suburban, and rural teachers nuted. It
should be noted that the midpoint of the scale is 3.5, but this
does not mean "no opinion," or lack of either agreement or dis-
agreement. A mean of 3.5 simply indicates a fairly equal number
and range of agreements and disagreements among the teachers in
the sample. There are indications that the response distribu,.
tions for all the questions are unl.modal and fair approximations
to the normal distribution.
Question #15: "The presence f a handicapped child in a
regular classroom impedes the ducational progresi of the
child's 'normal' peers."
On the average, teachers slightly d sagreed with this statement
(3.75). Central-city teachers were strong in their disagreement
(4.54), while suburban teachers agre d slightly more (3.57).
Question #16: "Integration of he handicapped child into
the regular class will improve he child's acceptance by
his 'normal' peers."
There was slight agreement in genera on #16 (2.56), with no
major differences among groups.
question 62: "An immediate larg scale transfer of special
class children to regular classes would create no major
problems other than the need for ersonnel."
There was general disagreement (4.33), th suburban teachers
disagreeing a little more (4.54) and ru al teachers a little
less (4.014. -
Question #18: "Not labelling the h ndicapped child is
idealistic and can never be ully/a hieved in special
education."
Excepting central -city teachers (3.46) t ere was overall agree-
ment (2.85) with this statement.
Question #19:' "Labelling the child ncourages isolation
from his 'normal' peers."
Teachers showed a good deal of agreement .n 'the average (2.26),
with central-city teachers agreeing sligh.ly more (2.05) and
rural teachers slightly less (2.48).
Question #20: "Self-contained special classes for the
handicapped contibute to discriminati n against children
of the poor."
41 4,3( )
296

Mild disagreement was general (4.21), although central-City
teachers disagreed less (4.00). Teachers, in high socio- economic
(SEC) schools disagreed less (3.85) than teachers in low SEC
schools (4.18).
Question #21: "Special classes for handicapped children are
justified."
Here was the strongest agreement on any of the questions (1.92).
On Question #22, 71% said they would be interested-ina workshop,
while 20% would not.4111.
It is interesting to note that there are no consistent patterns
of agreement and disagreement between central-city, suburban, and
rural school teachers. However, central-city teachpts disagreed
more .with both suburban and rural teachers than 5wihrurban and
rural teachers did with each other.
Correlational Data
Intercorrelations among such things as/ he location and socio-
economic (SEC),level of the school, iXber of years experience of
the teacher, the number of difficul children teachers perceive
and the number they feel they cou handle in a classroom are
reported in Exhibit 1.3. The on significant correlations are-
'the following:
Location and ethnic min it . The proportion of ethnic
minorities in a centre f ci y school is higher than the
proportion in a subur n school, which is in turn higher
than in a rural school.
Location and SEC level. The closer a school is to central -
city,,, the lower its SEC level. The correlation is somewhat
poorer than the preceding one because of the weak 'relation-
ship between SEC levels of suburban and rural schools.
Question #1 and eueltion #2. There is a positive, fairly
high correlation between the numberef difficult children
perceived in a class and the amount of time spent dealing
with them.
'Question #6a and. question #6b. This high correlation simply
states that there is a positive association between the
number of "mildly retarded" chiliren A teacher would feel
capable of handling in a class of 20 and the number of the
same children she could handle in a class of 30.
There are no surprisingly high correlatiOns in the table--the
297

results reported above seem almost obvious. If there are any
surprises at all, they might be found amoung the non- significant
correlations that one might,expect to be higher (question 2 and
question 6, for example).
Section II
Ratings of a list of 48 behiviors on the Last page of the
questionnaire (Exhibit I.1) were obtained'from the present
,group of teachers in a significantly different manner than they
have been previously obtained. In asking teachers how much of a
'problem each of the various behaviors posed to them in the class
room, this study aimed at assessing what behaviors werS cousidered
most disruptive or problematic and to what degree they posed such
a problem. Other -studies have examined primarily the "s riousness".
Of thesame behaviors, but by seriousness was meant eithe the
`degree to which the behaftors violated the rater's moral or
.social code or the direness of the consequences to the student
should%he exhibit those behaviors. In his studies, Wickman (1928)
/ alio obtained ratings of frequency for each of the 5Q behaviors
/ on his list. However, neither "seriousness". nor "frequency,"
either separately or combined, is the same as the degree to which
a given behavior is a problem to,a teacher in her classroom.
'In the preient study, teachers were asked to rate each of the 48
behaviors on a scale from 1 (Not a problem) to 6 (A severe pro-
blem/. The =mean rating for each of the behaViors was calculated,
and the behaviors were then ranked from the highest (most severe
problem) to the lowest (least severe problem). ,Appendix D shows
the mean rating on each behavior and compares the present rank-
ings with Wickman's rankings according tc\seriousness (1928,
p. 124) and Hunter's (1957) later replication of Wickman's study.
Rank-order correlation coefficients Were computed for the RNRRC
results vs. Wickman's original results and for the RNRRC-results
vs. Hunter's results. Neither correlation was significant, but
the present results correlated bettSr With Hunter's more recent
results (r = .142) than with Wickma4'i study done in 1926
(r = -.035). This lends support to,l.the hypothesis that the present
study is in fact asking a different *estiot (and one probably
more useful in determining atrategiets for helping teachers) than
Wickman's study or any of the latercreplications and modifications
\s
of his work. Since the present.version of Wickman's list omits
two behaviors (masturbation and heter sexual activity), the
same items were dropped from the othe lists-for purposes of
comparison. the remaining items were ratked from 1 to 48. In
cases where items received the same mesh rating by teachers, the
ranks of those items were averaged and the average rank then
was assigned to each tied item.
298

\
The ten items rated most serious by the RIIRRC sample of teachers
are these:
1. Inattention2. Tattling
3. guarrielsomeness4. Cruelty, bullying5. /Interrupting6. Carelessness in work
7. Attracting attention
8. ,Laziness
9. Restlessness16. Disorderliness in class
It is interesting to note that these 10 items are very classroom
oriented. That is,- they are behaviors most often found disrupting -
in a classroom, whereas Hunter's teachers' most serious item was
steiling, indeed a serious behavior but hardly one that oftenidisrupts the total educational process. A person interested in
Making an important contribution to education would find effec-tive ways of helping the teacher deal with these problems, start-ing-at the most serioucand proceeding down the list. The
stratistician, as conceived in the DIRRC model, is a knowledgeable,
available person a teacher could turn to for help in order to
begin solving thete problems. Assuming the reason many such
problems arise is that there are children in the class who need
special help and who are not getting it, the stratistician is
getting at the very roots of the difficulty by Working with the
teacher to devise and implement strategies to help those children.
The list of problem behaviorsican be of value in determining
strategies for administering help to teachers.1.7
299

REFERENCES
0
Hunter, E.C. Changes in teachers' attitudes toward children's
behavior over the last thirty years. Mental Hygiene,
'1957, 41(1), 3-11.
Proceedings of the Missouri Conference on the Categorical/Non-
categorical Issue in Special Education, University of
Missouri- Columbia, July, 1971, p. 130.
Mk:timer, Dorothy D. and Rosemier, Robert A. Behavior problems o
children as viewed by the teachers and the children
themselves. Journal of Consultinsjsvcholoav,, 1967,
31(6), 583-187.
1
Roienthal, Robert and Jacobson,*Lenore.k !van:al-ion in the gligisms
Teacher Expectation, and Milk' intellectual, Development.
New York: Holt, Rinehart, and Winston, 1968.
Wickman, E.K, Children's Behavior and Teachers' Attitudes. New Yorks
The Commonwealth Fund, Division of Publications, 1928.
300

Exhibit Id
ROCKY MOUNTAIN RESOURCE CENTER
710 East Second South; 3-G
Salt Lake City, Utah
322-6281
Date: April 22, 1971
Dear Teachers
One of the purposes of the Rocky Mountain Resource Center is
to help regular classroom teachers devise ways to produce more
desirable educationaloutcomes with their more "difficult" students --
-students who; forwhatever reason, have been unable to make an ade-
quate adjustment to the educational environment. Our preliminary \
interviews with teachersindicate that it is commonplace for
a small minority of difficult students to command a dispropor-
tionately large share of the teacher's classroom time.
The purposes of this questionnaire are threefold:. (1) to ask
you to provide us with an estimate of the percentage of students
you would cle*sify as difficult so that we will know more about the
magnitude of the problem that faces teachers; (2) to ask you what
Methods you have found successful in coping with such students so
that we can use this information in trainingpeople, called
stratisticians; and (3) to determine your feelings about-having
a stratistician in your school whose sole function would be to work
with you in developing programs to attain your educational goals
with difficult students.
We will appreciate your cooperation in completing thcat-
tached questionnaire. If you have suggestions that will improve
the questionnaire wewould be pleased to have you note them where
appropriate. Any comments or elaborations would also be welcomed.
Thank you for your cooperation.
301f t
dr.! (.):)Pr-

Your name Sam Tears of teaching experisece
School name Glade level currently taught
Subject taught (if appropriate)
1. Used upon your total teaching experience, in a class of 30 students
bow many would you estimate.would be classified as difficult?
2, On the average, Au percentage of your classroom time have these students
demanded of you?
Now much of your outside regular school tinelo these students deemed
of you?
4. Describe a behavior problem you have successfully dealt with recently.
Indicate the method (strategies) used:
v..
S. Rats the extent to which you find discussing difficult students with the
following people helpful:
principal;not helpful__mildly helpful_highly helpful
extremely helpful
fellow teethenot helpful__
r:mildly helpful_highly helpful___extrevely helpful__
special classnot helpful__
teacher:helpful highly helptul_extresely helpful__
counselor:mildly helpful_highlyhelpful___extremely helpful__
not helpful__
other: (specify)not holpfol_nlildly notofni_htshly helpful extremely helpfuL__
302

L. Assuming you had a normal class load of 30, how many mildly retarded
children would you be willing to accept in your class?
If your class load were 20, how any mildly retarded students would
you be willing to accept in your class?
7. To what degree would the following be of importance to you in developing
working relations with a stratistician?
- a. that the stratistician have-the- educational philosophy
u mine:, not important mildly rtant
highly important oatremely impor ant
b. that the stratistician's age be rable to mine:
not Important mildly important hi hly iiportant
extremely important
c. that I have a voice in choosing the str tistician in my school:
not important mildly important highly important
extremely important 1
prefer that the stratistician be:
sole female doesn't matter
9. Which of the following roles would you prefer the stratistician to assume:
a. take responsibility of problo7ir__
b. equally share responsibility on problems
c. have no responsibility, but be available to me for consultation
d. no role at all
10. Release time to plan with a stratistician would be
a. .imperative
b. desirable, but would try to work without it
c. if not provided, T couldn't flo4 tine to work with stratistician
d. not neada4_303
_ _ _

1
11. Do you Use a special education service inthe ongoing work of your
class? Yes No
12. If Via, what types of service do you use,
13. Now Would you evaluate the effectiveness of the present special edu-
cational services as they apply to your classroom? not affective
wildly effective highly effective extremely effective
14. 'Would you like more special services to help you with difficult
students than now are available? Yes NO
304
(rev. ,410/71)

Please use THE MILDLY EDUCATIONALLY HANDICAPPED as the criterion reference
for the following questions. Check the appropriate space on a stele of six,
from Strongly Agree (first blank), to .Strongly Disagree (sixth blank).
1$. The presence of a handicapped child in.& regu-
lar classroom impedes the educational progress
of the child's "normal" peers.
16. Integration of the handicapped child into the
regular class will improve the child's ac-
ceptance by his "normal" peers.
.17. An immediate large scale transfer of
Strongly Strongly
Agree Disagree
MINNIMir Mil/Mme. =0.
special class children to regular classes
mould create no major .problems other then
for personnel.
1S. Not beling the handicapped child is
,idealistic and can never.be fully
achieved in special education.
19. Labeling the child encourages isolation
from his "normal' peers.
20. Self-contained special classes for the
handicapped contribute to discrimination
against the children of the poor.
21. Special classes for handicapped children
are justified.
22. Mould you be interested in a workshop? yes no
305
..MMIMI111 .arp01.
.11.111.. AMMMIMNI, . .0001 oli

A. Please rate the degree to which the-following behaviors have been a problem
in your classroom. The scale of six is from.Eot a Problem (first blank) to
A Severe Problem (sixth blank). "eke your ratings quickly and attempt to .
ratbbsch item.Nbt a A Severe
Problem Problem
1.2.
3.
Stealing 1
Cruelty, bullying (picking on others)
Truancy (skip school)
1.
2.
.
4. Unhappy, depressed (sad) 4.
5. Impertinence, defiance (t ng back) S.
6. Destroying school proper 6.
7. Unraliableness (can't d pond on) 7.
S. Untruthfulness (lie) , 8.
9. Disobedience (not obey/, not do as told) 9.tomeemeo
10. Tepper tantrums (temper outbursts) 10.
11: Resentfulness (against -- dislike) 11.
12. Unsocial, withdrawing (not friendly) 12.
13. Obscene notes/talk (dirty notes, talk) 13.
14. Nervousness (jittery) 14.
15. Cheating (copying) 13.
16. Selfishness (not 4haring) 16.
17. Quarrelsomeness (aryue. fight) 17. ....
18. Domineering (bossy) 16.
19. Lack of interest in school 19.
20. Impudence; rudeness (not polite) 20.
21. Easily discouraged (give up) 21.
22. Fearfulness (afraid) 22.
23.
24.
Suggestible (easily led)Enuresis (wet the bed or the self)
23.
24....NM laMI11Ww= M1111..
25. Laxiness.(not active) 25.
26. Inattention (not paving attention) 26.
27. Disorderliness in class (actitg up) 27.
28. Sullenness (sulk, pout) 28.
29. Physical coward (sissy) 29.
30. Overcritical of others (finding fault) 30.
31. Sensitiveness (easily hurt) 31.
32. Carelessness in work (messy) 32.
33. Shyness (bashful) 33.
34. Suspiciousness (suspecting others) 34.
35. Smoking (use of tobacco) 35.
36. Stubbornness (bull-heeded) 36.
37. Dreaminess (day drean) 37.
38. Profanity (swearing) 38. j
39. Attracting attention (cutting up in class) 39.
40. Slovenly in personal appearance (sloppy) 40.
41. Restlessness (over-active) 41.
42. Tardiness (late) 42.
43. Thbughtlessness (forrettine) 43.
44. Tattling (telling on others) 44.
45. Ingnisitiveness (asking questions) 45.
46. Interrupting (butting in) 46..111
47. Imaginative lying (exaggerating) 47.
48. Whispering (talking softly) 48.
B. Please circle the numbers of those behaviors for which you would ask help from
a special education consultant, if one were available.306
(riv.5/10/71)

y -
SE"E
III"Z
V*9
L'EZ
96',
LI '
.
fc'E
6I*Z
9'6
E'9Z
OZ'S
04Z
0,'E
frE'Z
S'Il
-I'VE
It'9
6,
f6'Z
Et*I
C't
6'01
'I'S
Z,
-,
.
09'E
9ZZ
9'9
Z'SZ
66',
99Z
6I*E
IO'Z
°
9'0I
O'IE \
6L'S
It
,
ittff
ZfrZ
t*OI
O'9Z
EC'S
VII
1
Ol'E
L61
Z't
6"VZ.
OL't
4261
Z9'E
9E'Z
S'Et
E'9E
01'9
LE
tZ'E
IO'Z
1'6
'rill
CZ'S
C9I
ZZ't
LVZ
6'L
47'll
ZS'S
6t
tt'E
tEl
0'6 ,:.
,
ft',I
6I'S
9SC
uuss ' q
Uing' 9
uses - E
.uses Z
sees I
II
voT2sona- wail touol* -Trill.
Rol om Awl gym Inns uwqin LiT3
.cins /mull* .
3o122810 -*Timm 'Ism 'gaol -
------
--.....
1
. 11
01113911.
t
13A1'I
11739
"01309'
931.LIO3141H
DMUS 10 11091811011311
NOLIV301
Apps
z. 3.icivizi

TABLE 2
esti
Exhibit 1.2 (continued)
0 356 79 _____263s
5.
2.83 2.80 2.84a-mean
b-mean 2.65 2.66 2.62c-mean 2.49 2.54 2.46 .
d-mean ,
e-mean
2.18
2.58
2.16
2.38
2.21
2.65
11.__,53% 48% ' 55%% Yes
% NO 43% 48% 41% .
% No re s .k% 4% 4%
13. 2.28 2.42 2.27
14.
% Yes 78% 81% 78%
%-No 14% 14% 12%
% No re' 8% 5% 9%
i
TABLE 3
otal !late Female
N 35¢ 79 263
21.-a-rsean 2.62 2.64 2.61
b-mean 1.15 1.24 1.10
c-mean 2.16 2.30 2.02
10% 28% 5% \\ft;k Male% Ferrel : 1% 1% 2% f.
% Does.notmatter 88% 71% 93%
9.
% a . 7% 6% 7%
% b 63% 63% 61%
% c 26% 25% 30%
% d 4% 6%' 2%
10.
% a 38% 30% 41%
% b 68% 61% 45%
% c 8% 5% 10%
i d 3% 4% 3%
-

Exhibit (continued)table 4
Erotic SOCIO-
-4.
TEACHING
. '..Central
r.
II
moan
356
3.752.564.332.852.264.211.92
65
26
9
79
4.022.52
4.2 2
2.66 ,2:413.9t2.1
11
67I
27
6
.
263
:3.732.56
9
4.392.882.214.301.90
.
65
25
10
.
'
\ -
\
37
4.542.734.303.462.054.002.16
194
l' 3.57/.2456
4.542.74N
2,.18
4.221.93
124
3.782.514.012.82
48
.4.i\1.83
.
.
72
4.032.584.49
N. .
3:19
2.284.36
'4.04,,
)
_
.
268
3.6841144.252.762.254.16
'1.89-,
.
42
3.392.374.563.022.003.851.90
,
.
49
4.6'2.68
4.443.26
2.244.182.14
.
240/3.692.64 -4.382.78,
2.2.3'4.23' /1.87
87 L-.1
UV2.464.183.002.414.142.07
-. 1
.15.t
16. mean
t7. amen18. mean
19. wan20. mean,
21, mean
Ust yes*... no
Z noresprse
,

if
LOCATION
/ PIPPORTIONOf £T* I4NINORITI ES
socio-EONLEVEL
lo
Exhibit 1.3
SOME mum= OMMAAMONS
PROPORTION ' ?RACIER ' S011e ETIO;C SOCIOECON YEARS
LOCATION MINORITIES LEyEL , EXPERIENCE '
a

Exhibit 1.4
Me;in\ratings and rankings from the present study compared with_result
obtained by Wickman in 1926 and Hunter in 1955
356 Teachers (1971)*
(MIRC)
LnaitentioC(3.38) 1.
308 Teachers (1955)**(Hunter)
Stealing 1.
2. Tattling (3.34), 12. Destroying school materials 2.
3. Quarrelsome (3.24)/ 3. Truancy 3:
4. Cruelty, bullying (3.22) 4. Cruelty, bullying 4.
5. Interrupting'(3.10) 5.5. Unhappy, depressed 5.
6.(
Careless ess in work (3.09) 5.5. Impertinence, defiance 6.
::: 7.y Attra ing attention 13.08) 7. Untruthfulness 7.
8. Laziness (2.90) 8. Unreliableness 8.
9. Restlessness (2.88) 9. Disobedience 9.
10. Disorderliness-in 10. Resentfulness
class (2.86)
11. Impudence* rudeness (2.83)
12. Domineering (2.82)
'13. Thoughtlessness (2.81)
14.5 Easily discouraged (2.77)
14.5 Cheating (2.77)
16. Dreaminess(day dream) (2.76)
11. Impudence, rudeness
12. Lack of interest in work
13. Quarrelsomeness
14.5 Easily discouraged
14.5 Cheating
16. 'Carelessness in work
511 Teacher(Wi
Stealing
Obsce e note
Unth thfuln
Tru cy
Impertinence,
Cruelty, bul
Cheating
Destroying s
Disobedience
10. Unreliablenes
11. Temper tantrIZ
12. Lack of,inter
13. Profanity
14.5 Impudence, ru
14.5 Laziness
16. Smoking
34
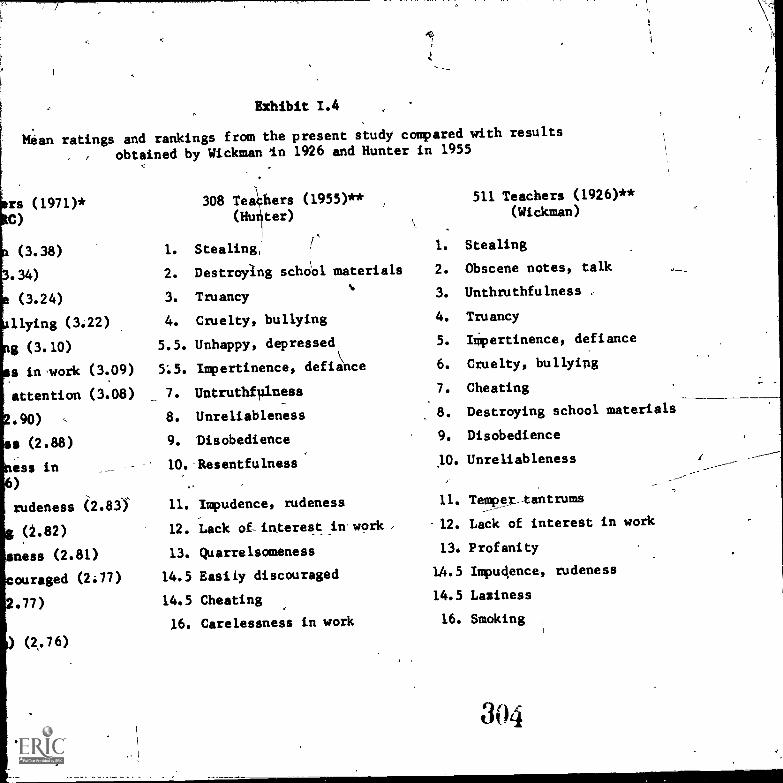
Exhibit 1.4
Mean ratings and rankings from the present study compared with results
obtained by Wickman In 1926 and Hunter in 1955 \
rs (1971)*C)
(3.38)34)
(3.24)
flying (3.22)
g (3.10)
s in work (3.09)
attention (3.08)
.90)
(2.88)'
ess in LO.-Resentfulness
.
308 Tea hers (1955)**Ohl ter)
1. Stealing,'
2. Destroying schoOl materialsti
3. Truancy
4. Cruelty, bullying
5.5. Unhappy, depressed
5:5. Impertinence, defiance
7. Untruthfulness
8. Unreliableness
9. Disobedience
511 Teachers (1926)**(Wickman)
1. Stealing
2. Obscene notes, talk
3. Unthruthfulness
4. Truancy
5. Iipertinence, defiance
6. Cruelty, bullying
7. Cheating
8. Destroying school materials
9. Disobedience
rudeness 6.831 11. Impudence, rudeness
(2.82) 12. Lack of- interest in. work ,
sness (2.81) 13. Quarrelsomeness
ouraged (2.77) 14.5 Easily discouraged
.77) 14.5 Cheating
16. Carelessness in work
) (2.76)
10. Unreliableness
11. Temper tantrums
-12. Lack of interest in work
13. Profanity
L4.5 Impudence, rudeness
14.5 Laziness
16. Smoking
304

356 Teachers (1971)*
,(RMRRC)
17` 1: Overcritical of
others .(2:74)
18. Sensitiveness (2.70)
19. Unreliableness (2.65)
20.5 Untruthfulness (264)
20.5 Lack of interestin school (2.64)
22. Impertinence,defiance (2.62)
te, 24. Suggestible (2.61) /
24. Disobedience (2.61)
24. Stealing (2.61)
26. Tardiness (2.60)
27. Destroying schoolproperty (2447)
28. Stubbornness (2.51)
29. Profanity (2.45)
30.'5 Selfishness (2.44)
30.5 Slovenly in appearance
32. Nervousness (2.41)
33. Sullenness (2.37)
315(.!
308 Teasbbers (1955)**(Hunter)
17. Temper tantrums
19. Unsocial, withdrawing
19. Selfishness
19. Laziness
21.5 Disorderliness in class
21.5 Obscene notes, talk
23. Suggestible
24. Domineering
25.5 Inattention
25.5 Nervousness
27..Profanity
28. Fearfulness
29.5 Sullenness
29.5 Attracting attention
(2.44) 31. Stubbornness
32.5 Overcritical of others
32.5 Physical cowardice
511 Teac
(Wric
17. Enuresis
18.5 Nervousne
18.5 Disorder'
20.5 Unhappy,
20.5 Easily di
22.5 Selfishne
22.5 Carelessn
24. InattentQ
25. Quarrels
26. Suggestib
27. Resentful.,4
28. Tardiness
29. Physical
30.5 Stubbornnl
30.5 Domineeri
32. Slovenly
33. Sullrogresi
OA)

chers (1971)*C)
ical of
(2.74)
veness (2.70)
bleness (2.65)
fulness (2.64)
interest01 (2.64)-
nence,e (2.62)
able (2.61)
fence (2.61)
g (2.61)
as (2.60)
ing schooly (2.47)
ness (2,71)
ty (2.45)
ess (2.44)
308 Teachers (1955)** 511 Teachers (1926)**
(Hunter)
17. Temper tantrums
19. Unsocial, withdrawing
19. SelfishnessC-'
'19. Laziness
21.5 Disorderliness in class
21.5 Obscene notes, talk
23. Suggestible
24. Domineering
25.5 Inattention
25.5 Nervousness.
27. Profanity
28. Fearfulness
29.5 Sullenness
29.5 Attracting attention
y in appearance (2.44) 31. Stubbornness
ness (2.41) 32.5 Overcritical of others
ess (2.37)- 32.5 Physical cowardice
(Wickman)
17. Enuresis
18.5 NervousneSs
18.5 Disorderliness in class
20.5 Unhappy, deprepsed
20.5 Easily discouraged
22.5 Selfishness
22.5 Carelessness in work
24. Inattention
25. Quarrelsomeness
264 Suggestible
27. Resentfulness
28. Tardiness
29. Physical cowardice
30.5 Stubbornness
30.5 Domineering
32. Slovenly in appearance
33. Sull,enness
0:1-j

356 Teachers (1971)*(R1 RC)
34.5 Unhappy, depressed (2.
34.5 Whispering (2.31)
36.5 Imaginatively lying (2
36.5. Resentfulness (2.29)
38. Obscene notes, talk (2
39. Shyness (2.20)
40. Inquisitiveness (2.16)
45 Temper tantrums (2.15)
41.5 UnsOcial, withdrawing
\43. Suspiciousness (2.14)
Fearfulness (2.07)
4\ Physical coward' (1.97)
46. \Enuresis (1.79)
47. Truancy (1.70)
48. Smoking1(1.37)
308 Teachers (1955)**(Hunter)
31) 35. Thoughtlessness
35. Tardiness
.29) 35. Slovenly in appearance
-37. Sensitiveness
.26) II 38.5 Shyness
38.5 Suspiciousness
40. Enuresis
41..Interrupting
(2.15) 42.5 Inquisitiveness
42.5 Dreandness
44. Restlessness
45. Tattling
46. Imaginative lying
47. Smoking
48. Whisperi4
511 e
Wi
34. Fearfulne
35. Suspiciau
36. Thoughtle
37.,Attractin
38.5 Unsocial,
38.5 Dreamines
40. Imaginati
41.5 Interrupt
41.5 Inquisiti
43. Overcriti
44.5 Tattling'
44.5 Whisperi
46. Sensitiv
i47. Restlessn
48. Shyness
* Items were rated on a scale from 1 (Not a problem) to 6 (A:Severe problem).
** Two items, masturbation and heterosexual activity, were dropped from the list f
purposes. All items on this list were ciriginally rated on a 20-point scale--h
not comparable with the preseht study.

7
hers (1971)*C)
depressed (201)
ng (2.31)
tively lying (2.29)
lnesi (2.29)
notes, talk (2.26)
\(2.20)
iiveness (2.16)
tantrums (2.15)
1,\, withdrawing (2.15)
ouaness (2.14)
asS (2.07)
coward (1.97)
(1.79)
(1.70)
(1.37)
308 Teachers (1955)**(Hunter)
35. Thoughtlessness
35. Tardiness
35. Slave' ly in appearance
37. Sensit veness
38.5 Shyness
38.5 Suspici sness
40. Enuresi4
Interruiting
42.5, Inquisitiveness
42.5 Dreaminess
44. Restlessness
45. Tattling
46. Imaginative lying
47. Smoking
48. Whispering
511 Teachers (1926)**(Wickman)
34. Fearfulness
35. Suspiciousness
36. Thoughtlessness
37. Attracting attention
38.5 Unsocial, withdrawing
38.5 Dreaminess
40. Imaginative lying
41.5 Interrupting \
41.5 Inquisitiveness
43. Overcritical of other
44.5 Tattling
44.5 Whispering
46.1Sensitiveness
47. Restlessness
48. Shyness
re rated on a scale from 1 (Not a problem) to 6 (A severe problem).
masturbation and heterosexualtivity, were'dropped from the list for comparative
a. All items on this list were originally rated on a 20-point scale--hence, ratings are.
rf
arable with the present study. /

Appendix J
Observation of Teacher BehaviorsFor .Use in Student Placement
30fSc.
Observation of Teacher BehaviorsFor Use in Student Placettient"
France* R. Schwan/tiger
WorkintPaper No. 4
May, 1972/
/0
ROCKY MOUNTAIN ;REGIONAL RESOURCE CENTER
DEPART OF SPECIAL EDUCATION
UNIVERSITY OF UTAH'
1Preparatin of this paper supported by Grant No. 0110-0-70-4178
(608), Project/No. 542930, from the Department4if Health, Education
and WeliareOlnited States Office of Education, Bureau of Education
for the' Handicapped, Washington, D.C.-20202.
Frances R. Schwaninger is Staff Specialist, Rocky Mbuntaii
Regionel Resource Center, University of Utah, Department of Special
Education, Salt Lake City, Utah 84112. Miss Schwaninger is a doc-
toral Candidate in Psychology.
These papirs are intended primarily as informal communications
to, and among members of the RMRRC staff and faculty of the Depart-
ment of Special Education. The materials contained herein are
generally not in final 'tali' of refinement and are not to be cited
without the author's permiiiion.
317306 0*9

OBSERVATION OF TEACHER BEHAVIORS FOR USE-IN STUDENT PLACEMENT
Placement of handicapped children has become a paramount prob-.
lee in school districts where special classrooms are limited. Iden-
tification of characteristics of teachers who appear to have suc-ceeded in integrating exceptional children into a regular classroomwould be useful data for other placements of, handicapped children.In an attempt to develop behavioral profiles of teacher character-
istics and/or classroom milieu for more effective placement pro-cedures, the RMRRC trained a cadre of observers to observe ind rateelementary classrooms for qualities that appear basic in facilitat-
eing interaction and education, and which are supported in the
I literature.
Measurement of such qualities has long presented 'a problem to
those interested in defining variables Involved in affective levels
of behavior. Written measures demand more expressive abilitythan ,
is usually found among elementary students, and are too reactive tobe considered valid indices of feeling. Teacher reports are too
biased by their own involvement, and are often rightfully considefeden imposition on the teacher's already limitedtime. It follows that
observation by a trained, impartial judge would lend a solution to
the definition of salient teacher qualities and their effect on
students.
There is considerable support in the literature for the use of
such observers in the classroom to record the teacher variables most
influential on students. One line of research in particular which
has been directed toward the educational settineis that based on
the theory of perceptual Systems and cognitive functioning proposed
by Harvey, Hunt,,ind Schroeder (1961).
Central to this theory is the assumption'that anindividual'spredisposition to interpret highly ego-involving events in a pre-dictable-manner determines his reactions to those events. Those
individuals who function in what is termed a "concrete" manner, have
a limited repertoire of interpretations of such events, and there-
fore a limited repertoire of reactions. This limitation results in 1
a dependence on traditional forms of behavior, and adherence to
establishid rules of conduct, a general need for structure, and a .
Vack, of spontaneity and novelty when faced with a new and/or am-
biguous set of events. Those individuals whose functioning could
be termed "abstract" have developed their repertoire of interpreta-
,tions and reactions through exploration,of their environments.'These individuals react to new events by responding to, the Use-diately relevant cues ligthe environment with less dependence on
already established.exPiitations or predisposed ideas of appropriate
behavior. This results in behavior which is generally more open,novel, spontaneous, and less rigid than concrete persons.
319
30?

The position Of a person on the continuum of concreteness-abstractness is represented most readily by the expression of a
certain consistent'pattern of beliefs which is representative of a
certain mode of cognitive functioning. These patterns of belief '
are called "belief systems," and formal methods of scoring these
belief systems have been developed.
Two studies in particular which focus on'teacher beliefs and -
their measurement (Harvey, White, Prather, Alter, and Hoffmsister,
1966; Harvey, Prather, Whits, and Hoffmeister, 1968) relate directly
to the present attempt to observe teacher effect on student behavior
and classroom atmosphere.
'in the 1966 study, headstart teachers of different beliefsystems wertrated by observers on.26 dimensions assumed to reflect
educationally desirable or undesirable behaviors toward students.These dimensions were such thing:
s-
ing: es: expression of warmth toward
children, perceptiveness Children's and needs, flexibility
in meeting needs and interests of children. ability to maintain re-
lazed relationships.wiih,children, attention to individual children,'
encouragement of free expresiion of feeling", diversity of activity
simultaneously permitted, rule orientation, etc. On all dimensions,
teachers who had belief systole which were gore abstract differed
from those who were'concrete in what is presumed to be a more edu-
catiaeally favorable direction.
The 1968study provided a replication of the teaderobservationand added the observation of student behavior on a number of '-
dimensions such as adherence_to teacher rules, information seeking,
independence, cooperativeness with the teacher, enthusiasts, voluntary
participation in classroom activities, free expression of feelings,
student-initiated activity, amount of interaction with classmates,
novelty of response to teachheipiestinne, etc. This study asain
demonstrated that classificatiod of tesehers according to belief
systems resulted in significant differences in classroom behaviors'
on the part of students in the same direction is thfirst-study. '
The 1968 research further demonstrated that 'significant differences
in student response could be shown when analysed according to either
the global teacher belief system designation or the ratings of overt
teacher behavior. loth sets of data yielded three main factor
clusters from the analysis Of 'teacher behaviors. These clusters
were called resourcefulness, dictatorialness, acid punitiVeness.
This evidence oftabcher-effect_is_ini.ine with other infor-
mation describing the development of belief :patens--and-coiplitive
functioning. Parent -child relations, as antecedents to conceptual
functioning, ware' reviewed by Catherine lelknor and O.J. Harvey
(1968). Their findings largely supported the theoretical predictions
that antecedent conditions of restrictiveness, control, and punitiite-
miss tend to produce concrete functioning individuals, whereas
320
30'10
-H

conditions high in fairness, freedom of exploration, indep- ence,
warmth, and approval allow the development of more abstract cogni-
tive functioning. Such conditions have an obvious relation to thedevelopment of the child on the affective level as well as thepdrely cognitive, although the_two are interrelated in reality,
if not in scientific research.
With such research providing the theoretical and practicalfoundation, it was decided to focus on this observational scaledeveloped by Harvey and White for the definition of variables lead-ing to better teacher-student matching. Also influencing thedecision was the information that one of the school districts withwhich the RMRRC was to be involved had available on each teachertwo measures of concreteness-abstractness used in other researchon this theory. It seemed advantageous to RMRRC goals to-determineif particular systems of teachers as identified by these testscould tolerate and facilitate the educatioi of different handi-capped children more effectively than other systems. For example,
some emotionally disturbed - children might benefit from a structured
environment with stable limits set by a concrete teacher. Or some
mentally retarded children might-beet be placed with a warm, open,abstract teacher who would encourage exploration of the environment.Such placement would enhance the success of the recent trends towardserving the needs of handicapped students in the regular classroom.If observation of overt teacher practices identified the differentstrategies of classroom management, then specific effects on handi-capped students could be recorded in a later research-program andcomplete data for the process of matching could be obtained. With
this goal in mind, the training of observers and the sUbsequeittobservation of classrooms was undertaken.
METHOD
One-hundred-and-eleven elementary teachers from ToOele SchoolDistrict participated in the study. They agreed.to.being classified
according to belief system on the written measures of the TIE andCST (see below), and to serving as target-teachers for classroomobservation on the teacher-rating scale. f scores on all measures
correlated, it was then planned that they uld serve as pilot sub-jeits for matching of teachers and studen s to facilitate inter-
action on the affective level.
flitiasUres of Concreteness-Abstract-es. of Belief Systems.
These measures served as the criteria/to whih the observationratings were compared for final testing of apparent validity, after
acceptable interrater reliability.was achieved.
308

The first measure was the This I Believe Test (TIB), an open-ended essay test specifically designed to measure the generalcognitive property of concreteness-abstractness. The subject is
required to express his beliefs about a number of referents. Thenrelativism, tautology of thinking, novelty, richness of connotation,cynicism, openness, and other relevant dimensions are scored bytrained judges, and each subject is given a system designationwhich represents either concrete or abstract functioning. Inter-Judge reliability for three and four trained judges scoring the=ranges from .85 to .95 over several years of testing (Reed,1971). Validity has been demonstrated in over two dozen studies(Harvey, 1966).
An objective measure, the Conceptual Systems Test (CST),which reveals in individual profile on six relevant content dimen-,pions was alsolempleyed. -Each-S-receiVeS a score' on the dimensionsof Divine FatelControl, Need for Structureand Order, Need to Help\People, Need for People (socially), Inter-Personal Agression, and I.
General Distrust. These profiles were thought to proilde greatervariance for the purposes of correlation with the observation scaleratings than the single eystem.designation provided by the Tit.
Teacher Observation Rating Scale. This scale was a furthermodification by Harvey and White of those scales referred toearlier (1966;.1968). It consisted of 33 items which are rated one
a six-point scale-ranging from -3 to 4.3. These 33 categories wereexplained and discussed repeatedly during the training sessions.Assumptions which guided the use of this scale were the same asthos&reported in the Coates, Harvey and White refinement of scales(1970). It was first assumed that the validity of observations ofsuch complex behavior as teaching would be enhanced by the use 'ofnonliteral, nondiscrete categories of behavior, which requiredsome inference on the part of the observer. It was expected thatresponses which would be meaningless in isolation could be inter-preted in context as meaningful parts of an ongoing process. Itwas further assumed that categories derived from a theoreticallycoherent rationale, together with the context of the total classroomsetting; would provide'more predictably reliable and valid ratings .
of classroom behavior and lend dirction to the interpretation ofresults. 1
Training of Observers
-- Training of 11 women was undertaken by O. J. Harvey and B. J.White, who served as Consultants to the project during this period.After defining the behavior categories operationally, Drs. Harveyand White supervised the rating and discussion of a number of videotapes of actual classroom performances of teachers of different
belief systems. This allowed for free interaction between traineesand observers concerning specific areas, and replay of any behavior
322

sections about which there was interrater disagreement. After two
full days of video tape training, interrater reliability was assessed
by Comparing the observer ratings with the known systems (unknown
to the observers) of the taped teachers. When-ratings correlated
.60 or higher, the second phase of training was initiated wherein
observers were exposed (as a grdup) to live classroom situations
at the Utah State Industrial School. Further discussion and re-
liability checks resulted in correlations of .80 and above. Four
observers were dropped at this point for failure to maintain con-
sistent reliability. The remaining observers (who maintained the
reliability of .80 or above) were paired on a rotating basis and
allowed to observe all elementary teachers in the.Tooele School
District. (See schedule at the end of this report.) One group
reliability check was to half-way through the paired observe-
tiont-to,eheck for concep-driftrand _high rellability_was found
to have beetrmaintained. aired observations, were then continued
for the categorization of t e subject samPle.of teachers.
Proiedure
Thelllclassrooms were observed in'13 working days. Six of
the seven observers who, had maintained high reliability were ro-
tated into different paired combinations daily with one observer
on call (see discussion). Interrater reliability was checked on
the 7th and 12th days, and the weighted mean correlations between
every pair of judges were .880-And ;715 respectively. Three or
four teacher observations of 45-60 minutes were completed in a
day by each pair. Rater sheets were scored after thedbservation.
observers had no informatiop as to TIE or CST classifications of
the teachers prior to the observations.
RESULTS AND DISCUSSION
The results of the cluster analysis (Tryon and Bailey, 1966)
yielded the same two factors of Fostering Exploration (FE) and
Dictatorialness (D) as were found in the replication and refine-
ment of observational scats carried out by Coates, Harvey and
White (1970). 'However, the correlation matrix indicated no sig-
nificant relationships between any of the predictor variables from
the CST dimensions and the observer 'rating clusters of FE and D.
This indicates a consistency of observer ratings with previous
ratings by observers using this goals as far as'ooncalitualisation
of categories, but a lack of validity concerning the immediate
phenomena observed.
This was disappointing as it precluded the use of this data
for selection and matching of teachers and students, and it was
difficult to ascertain why this occurred. T kyossible reasons
which together or separately could have accounted for the results
were explored.
323

The first hypothesized explanation vu the lack of variance
ding twitcher profiles in the CST and 'yawl designations on theTill..*Of the 350 teachers measured in Tooele Diitrict, only six
showed no concreteness of functioning. All other teachers were
scored' as having at least a mixture of concrete-abstract belief
systems if not totally concrete. Of the 111 teachers observed,
only one showed no concreteness. This could mean that the statis-
tical variance required, for the generation of decent correlations
was absent. It was highly suspected that this fact largelyac-coutjud-for-the absence of significant correlations.
Another explanation offered represented a possible problemwith the raters. Although raters'had achieved high interraterreliability, it is possible thatthey-were heavily influenced byiimilar-global judgments that had little to do with accuraterjudgingof the phenomenon and resulted in a common bias away from accuracy.
Certain training conditions resultingfrmethe inexperienceof the IOURC staff in dealing with reliability assessment proce-
dures sake thii second explanatioi fairly plausible. Although no
observer saw the same teacher twice, each pair saw a prolonged
series of concrete-funct ' teachers dieto the nonexistence
of'abstract teachers. P rs of Observers were rotated daily, but
each-pair spent an anti day together, which night have. resulted
in mutual, conceptual drift of pairs. Furthetmore, all observers
were going to lunch together, and discussion of rating categories
Pand suites had a high probability of occurrence, which
to possible common error. Especially since raters' sheets re
scored after rather than during observation, the globil eff tofsuch discussionmould be made more influential. There was also
a problemin that some of the teachers observed' during the formal .
observation period had been previously observed during the trainingperiodi'the influence of, this mistake in'plannincbannot clearly .
be defined.
In a post-hoc analysii an attempt was made to deteriine
whether observers had discriminated finer differentiations amongteacher,profiles on the CST within concrete systems. A profile
high on Inter - personal Aggression and General Distrust while low
on Need for People and Need to Help People was termed a "cold"
system. A profile showing theexact reverse trend was termed a
"warm" system. It was found that warm and cold systems fellinto different ranges on the observer cluster of 11 and D, but
the restate were again nonsignificant. Cold systems showed a
range beginning and ending higher on the dimension 'of D than did
warm systems, whereas warm systems fell into a range beginning and
ending higher on the dimension of PE than did cold systems.
These data, though nonsignifiCant, suggest that the observerscould have been fairly accurate in their rating of the phenomenon.
324

Consequently the prime reason hypothesized for the absence of sig-
nificant matrix correlations was the lack of gross variance among
teacher profiles.
It was decided that though the use of observers trained in a
single measurement scale would be discontinued, the idea of, observ-
ers as a method of measurement would be retained for further con-
siderition In order to avoid the recurrence of such lack of vari-
ance in the phenomenon to be observed, a proposal was initiated to
add, additional specific skills as well as other global traits from
other theoretical bases to the affective research program. From
this decision sprung the affective research thrust for the, coming
year.
325.

REFERENCES
Coates, Catherine, Harvey, 0.J., and White, B.J. Observationscales of classroom atmosphere and student behavior; a replica-tion and refinement. Paper presented at American EducationalResearch Association, Minneapolis, Minn., 1970.
Telkno., Catherine, and Harvey, 0.J. Parent-child relationships.Paper presented at a conference on early, experience sponsoredby the Psychology Department, University of Miami, Oxford,
. Ohio, 1968.
Harvey, 0.3. System structure, flexibility, and creativity. In
Experience, Structure, and Adaptability. 0.J. Harvey (Ed.),Springer Publishing Company: N.Y., 1966.
Harvey, 0.J., Prather, Misha, White, B.J. and Hoffmeister, J.K.Teachers' beliefs, classroom atmosphere and student behavior.The American Educational Research Journal, 1968, 5, 151-166.
Harvey, 0.3., White, B.J., Prather, Misha, Alter, R.K., and Hgff-meister, J.K. Teachers' belief systems and preschool atmos-pheres. Journal of Educational Psychology, 1966, 57, 373-381.
Reed, Catherine. Test analysis of This I Believe Test. Paper sub-mitted in partial fulfillment of requirements for EducationalPsychology 790,. University of Utah, 1971.
Tyron, R.C., and Bailey, D.E. Try User's Manual. -Boulder:University of Colorado Computer tenter, 1975, p. 186.
326CIt. If_ At)

OPINION SURVEY
Name Date
Position
INSTRUCTIONS
In the following pagee you will be asked to write your opinions
or beliefs about several topics. Please write at least three-(3)
sentences about each topic. You-will be timed on each topic at a
pace that will make ft necessary for'you to work rapidly._
Be sure to write what you genuinely believe.
You must write on the topics in the order of their presentation.Wait to turn each page until the person in charge gives the signal.
OnCe you have turned a page, do NOT turn back to it.
PLEASE DO NOT OPEN THIS BOOKLET UNTIL YOU ARE INSTRUCTED TO
BEGIN.
(Note: in the usual administiation of this test, the follOw-
ing statements each appear on a separate half-sheet of paper.)
This I believe about the American way of life.
This I believe about compromise.
This I believe about faith.
This I believe about religion.
This I believe about punishment.
This,I believe about friendship.
This I believe about marriage.
This I believe about people on welfare.
This I believe about immorality.
This I believe about delinquents.
327
)1
I

PERSONAL OPINION SCALE
Form GTD (166)
The following is a study of what the general public thinks andfeels about a number of important social and personal questions.The best answer to each stateliest below is your personal opinion.The survey covers many different topics--you nay find yoursellagree-Ins strongly with some statements, disagreeing just as strongly withothers, and perhaps uncertain about others. Try to work as fast as
possible. Since we are interested in your first iMpressions, thereis no need to spend much timeoi any statement. We iambi ilks totaws you answer each question but you may skip any that you reallyden% want to answer for personal reasons.
DIRECTIONS: You are to decide how much you agree or disagree
with WNW-ES following statements. Circle the number a the
separate answer sheet that but describes how strongly you agreeor disagree with the statement. The meaning of the numbers on the
answer sheet is as follows:,
+3 agree: very such
+2 agree moderately+1 sgreer-:a little
- 1 0 disagree a little- 2 us disagree :moderately
- 3 0 disagree very much
PLEASE CIRCLE ONLY ONE NUMBER !OR EACH STATEMENT.
328
3 1
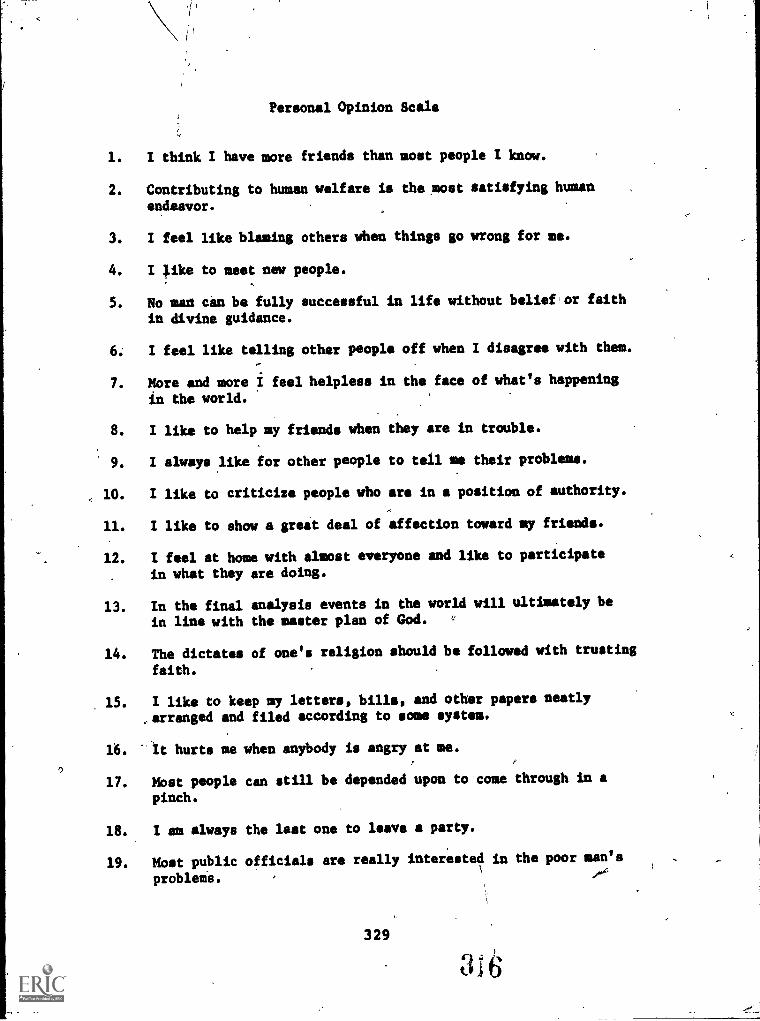
0
Personal Opinion Scale
1. I think I have more friends than most people I know.
2. Contributing to human welfare is the most satisfying human
endeavor.
3. I feel like blaming others when things go wrong for me.
4. I Like to meet new people.
5. No UM can be fully successful in life without beliefior faith
in divine guidance.
6. I feel like telling other people off when I disagree with them.
7. More and more I feel helpless in the face of what's happening
in the world.
8. I like to help my friends when they are in trouble.
9. I always like for other people to tell as their problems.
10. I like to criticize people who are in a position of authority.
11. I like to show a great deal of affection toward my friends.
12. I feel at home with almost everyone and like to participate
in what they are doing.
13. In the final analysis events in the world will ultimately be
in line with the master plan of God.
14. The dictates of one's religion should be followed with trusting
faith.
15. I like to keep my letters, bills, and other papers neatly
..arranged and filed according to some system.
16. It hurts me when anybody is angry at me.
17. Most people can still be depended upon to'come through in a
pinch.
18. I am always the last one to leave a party.
19. Most public officials are really interested in the poor man's
probleis.
329

20. I like to join clubs or social groups.
21. Any written work that I do I like to have precise, neat and
well organized.
22. It is safest to assume that all people have a vicious streakand it will come out when they are given a chance.
23. I like to have try Meals organized and a definite time setaside for eating.
24.' klike to do things with my friends rather than by myself.
25. I like to have a place for everything and everything in itsplace.
26. I enjoy very much being a part of ft group.
27. Religion is best viewed an a social institution.
28. Most people in public office are really interested in theproblems of the poor man.
29. Tfiere is no excuse for lying to someone else.
30. I like to help other people who are less fortunate than.I am.
31. I like to have my life so arranged that it rune smoothly andwithout much change in my plans.
32. I like my friends to confide in me and to tell me,their troubles.
33. I like to have my work organized and planned before beginningit.
34. Government officials are as interested in serving the poor asothers.
35. I enjoy making sacrifices for the sake of the happiness.ofothers.
36. I feel like making fun of people who do things thatl regardas stupid.
37.- Sin is but a cultural concept built by man.
38. I like to keep my things neat and orderly on my desk or work-space.
39. I prefer to do things alone, rather than with my friends.
3306 ,7r

40. I prefer clear-cut fiction over involved plots.
41. Honesty is the best policy in all bases.
42. I this*, I am stricter about right and wrong than most people.
43. I believe thei-to atta my goals it is only necessary for me
to live as God would have me live.
44, I prefer a story that has twe- themes rather than one that has
five or SiX themes going at once.
45. I find that a well - ordered mode of life with regular hours is
suitable to my personality.
46. I like to form new friendships.
47, These days a person doesn't really know whom he can count on.
48. There are some things which God will never permit man to know.
49. /Politicians have to bribe people.
50. I like to start conversations.
51. I feel like getting revenge-When'someone has insulted me.
52. I am a very sociable person who gets along easily with nearly
everyone.
53. I like to treat other people with kindness and sympathy.
54. All in all, it is better to be humble and honest than to be
important and dishonest.
55.- I don't like to work on a problem unless there is a possibility
of coming out with a clear-cut answer.
56. I like to sympathize with my friends when they are hurt or sick.
57. I don't like for thins to be uncertain and unpredictable.
58. You sometimes can't help wondering whether anything's worth-
while anymore.
59. I like to plan and organize the details of say work,/ under-'
take.
60. The way to peace in the world is through religion.
331
318

61. Most people who get ahead in the World lead clean, mO61 lives.
62. - Guilt results from violation of God's law.
63. Anyone who completely trusts anyone else is asking for trouble.
54. I like to give lots of parties.
65. One should take action only when sure it is morally right.
66. Marriage is the divine institution for the glorification ofCod.
67. 1 like to make as many friends as I can.
332
t: t)

March 15, 1971
TEACHER RATING SCALE
1. Warmth -3 -2
2. Perceptiveness -3 -2
3; Flexibility -3 -2
4. Involvement -3 -2
5. Attention to and concern 'for
the Individual -3 -2
6. Enjoyment -3 -2
7. Enlistment of Child participation -3 -2
8. Eniourage individual self-relianceor individual judgment -3 -2/
Allowi expression of feeling -3
10; Encourage creativity-diversity -3 //2
11. Teach concepts-(concept approachvs. factual approach) -3 //-2
12.' Ingenuity -2
13. Multiplicity of themes orapproaches. to concepts -$ -2
14. Use of nonfunctional rules 3 -2
15. Needless digtion of proceduraldetail 3 -2
16. Personal need for structure - reactsnegatively to diversity -3 -2
17. Punitiveness -3 -2
18. Fairness -3 -2
19. Encourages questioning -3 -2
20. Respect for student's ideas oropinions -3 -2
21. Emphasises student-teacher role and
status distinctions -3 -2
22. Phoniness (insecurity) -3 -2
23. Patience -3 -2
24. Classroom command -3 -2
333
-1 1
-1 1
2 3
2 3
2 3
2 3
2 3
2 3
2 3
2 3
2 3
2 3
2 3
2 3
2 3
2 3
2 3
2 1
2 3
2 3
2 3
2 3
2 3
2 3
2 3
2 3
1
1
1
1
I.

25. Solicitousness (entreaty) -3 -2 .-1 1 2 3
26. Allows expressioh of disagreement'without rancor -3 -2 -1 1 2 3
Motivates by:
27. Affection -3 -2 -1 1 2 3
28. Providing information orfunctional explanation -3 -2 -1 1 2 3
29. Rejection -3 -2 -1 1 2 3
30. Threat or fe# induction -3 -2 -1 1 2 3
31. Eibarrassment -3 -2 -1 1 2 3
32. Use of praise' -3 -2 -1 1 2 .3
33. Criticism -3 -2 -1 1 2 3
334.

1. Warmth
2. Perceptiveness
3. Flexibility
Involvement
5. Attention to and concernfor the individual
6. Enjoyment
7. Enlistment of child in
participation
8. Encourage individual self- %.
reliance or individualjudgment
9. Allows expression offeeling
10. Encourage creativity-diversity
11. / Teach concepts - (conceptapproach vs. factual approach)
12. Ingenuity
335
March 16, 1971
Sensitivity; awareness orneedsand wishes of kids though notnecessarily able to changesituation.
Ability to change quickly; easeand speed of transition tocapitalize or incorporate di-verse information into continu-ing direction; ability to change
set.
Not anxiety; task involvement- -concern-- trying to solve a prob-
lemtask set.
No teacher's pets; differentialresponse; recognizing individual-
ity.
Get A big out of teaching.
Voluntary; not coerced
Encourage to question, define,pursue own interest; oppositeof structure seeking by student.
Wide variety of feeling (purpose--ful feeling); teacher reinforcedor supported.
Look out for high hamogeniety;watch for diversity in answersand products; can be verbal.
Opposite of rote explanation
of "why".
Improvising (play-class)materials and using them; canimprovise with verbal concepts
as well.

13. Multiplicity of themesor approaches to concepts
14. Use of nonfunctional rules
15. Needless dictation ofprOcedutal detail
16. Personal need for structure
17. Punitiveness'
18. Fairness
19. Encourages questioning
20. Respect for student ideasor opinions
21. Emphasizes student=teacherrole and status distinctions
22. Phoniness (insecurity)
23. Patience
24. Classroom command
25. Solicitousness (entreaty)
26. Allows expression ofdisagreement without rancor
336
Explanthat'saround
tions like "becausethe way we do thingsere"; meaningless
reasons,
(Reliance 4on rules) Degreeto which rules are enforced;frequency other verbalizedor not low olerance forambiguityL les used becauseteacher needeNthem, not be-cause structure requires.
\
Verbal as wallas physical;'sarcasm would bi an exampleof verbal.
No ill-will or spite towardchild.
34.'43

Rocky Mountain Regional Resource Center,1.10 East Second South, 3-GSalt Lake City, Utah 84102322-6281
To: TooeleSchool District
Fmk Judy Euf ire
Date: March \17, 17l
Re: Observers tn Elementary Clserooms in Tooele School District
The Rockylieuntain Resource Center isitttempting to collect datarelevant to placement of stratisticians in,school districts in thefall of 1971. Tooele District has a paper-end-pencil measure on the-system of Meet teachers in the district; however, there is no be-
havioral measure to indicate if the paper-and-pencil classificationis valid in distinguishing classroom behaviors, or if there are
differences Within systems. We at the Resource Center are mostinterested in comparing the ways in which teachers of differenteystems handle problem children in their classrooms. We feel that
this data will be lawful to Tooele District as a behavioral referenceto comPare with paper-and-pencil data. The collection of data oe
the affective methods different teachers employ with problem child-
ren will be useful to the Reschirce Center in developing strategies
to work with handicapped children in the regular classroom.
`se
0.
337
324%.3

ROCKY MOUNTAIN RESOURCE CENTER,710 East Second South, 3-GSalt Lake City, Utah 84102
322-6281'
Date: April 19, 1971
Subject: Observers' schedules, April 15 to May 3,District
01. Rita Patton787 East 4255 SouthSalt Lake City, Utah 84107
26f -2888
02. Dopna Gough2059 Sahara DriveSalt Lake City, Utah 84117278-3187
03. Gerry Ure4369 Camille DriveSalt Lake City, Utah277-3932
05.
Tooele School
Ilene McKenna'4938 Emilio: DriveSalt Lake City, Utah 84117278-8703
06. Peggy Nelson4265 Camille DriveSalt Lake City, Utah 84117277-9545
07. Pat White2541 Skyline Drive
84117 Salt Lake City, Utah 84108484-3986
04. Patty Johnson1800 East 3990 SouthSalt Lake City, Utah 84117
278 -1055
The above dates'have been established by the Tooele District. Some
days itamay not be possible to observe four teachers; one may be ill;there may be otl:er events scheduled which interfere with the schoolschedule; you may simply be unable.to handle four °betty:Alone. It
is important to stay within the days designated by the district,
however. If you are unable to work on a scheduled day, pleasearrange to trade with the-Unassigned observer.
TEACHER TEACHER NUMBER
April 15, East Elementary School, 135 SouthJames R. Gowan', Principal
George B. ApplegateLucy H. Bauer;11a J. BigelowDorothy H. EgeluneHelen B. MortensenConnie J. MurphyMary A. NielsonGaye PesoutKathryn D. Wilson
. 338
0
Seventh, Tooele
2627
28
29
30
313233
34

OBSERVERS TEACHER TEACHER NUMBER
April 16th, Sterling R. Harris Elementary, 251 North First Street,
Tooele. Donald R. Lindsay, Principal
04/07 Dean S. Aldous 35
Carolyn Bodrero 36
Albert R. Arellano 37
Nancy Belliston ' 38
02/03/05 Kaye P. Horrocks 39
George N. Erickson 40
Thomas M. Irvine 41
Linda Baumgarten 42
April 19th, Sterling R. Harris Elementary
01/03 Maxine Hullinger 43
Grace Jackson 44
Beverly S. Jensen 45
Garrett Sc.rrnson 46
05/06 Eloise Mart. tee 47
Venice Munro 48
Carolyn Musgrave 49
Leila H. Stewart 50
04/07 Nola Neilson 51
Carolyn Pickering 52
'Bonnie J. Rimington 53
Geraldine E. Sagers 54
April 20th, Sterling R. Harris Elementary
04/11 Geraldine B. Sagers 55
Kathryn J. Shelby 56
Dahlia S. Webster 57
02/03.//
Zelma J. KellyIlene D. Hatton'
58
59
Mary H. Fillmore 60
April 21st, Tooele Central, 55 North First West St., Tooele
Se nett Baldwin, Principal
01/05 Bernadette Arellano 61
Susan D. Bennion 62
Ora Lyn Bridges 63
339

April 21st (continued)
04/02 Bonnie B. Berry 64
Byron V. Brunson 65
Clara H. Chang 66
07/06 Carolee B. Colovich 67
Sylvia Ann Child 68
Susan Z. Dandrea 69
April 22nd, Tooele Central
06/01 Carla 'Cook 70
Karen L. Cox 71
Florence T. Evans 72
05/02 Marie D. Dickerson 73
Marcene May Gaylen '74
Patricia.P. Hanks 75
04/03 Evelyn G. Jankovich 76
Dorothy A. House 77
Hanora H. Long 78
April 23, East Elementary, 135 South Seventh, Tooele
All Jessie Powers 79
Tooele Central
07/01/04 Mildred M. Millburn 80
Edwina F. Mohler 81
06/02 Mary St. Clair 82
Eladrin P. Traver 83
03/05 Elaine T. Wilkinson 84
Calvin D. Wilson 85
April 26th, Dugway Elementary School, Building 5000, Dugway, UtahKenneth S. Rupp, Principal
07/02 Candice M. Benoit 86
Pauline Burton 87
Jacqueline P, Kendall 88
06/03 Leola K. Clarke 89
Dawn J. Perch 90
Margaret P. Lacy 91
340

April 26th, (continued)
05/04 Jacqueline LeppertStel a T. CozzaEloi e W. Griffith
April 27th, Dugway Elements
02/01 Evelyn E. HarrisVirginia S. McBrideShar4n Shepherd
06/04 Fawnii. Madsen /x 98I
1
John 1. Southwick 99
&lid W. Stevens -// 100
April 28th, Grantsville/Elementary School, 175 W. Main St. Grantsville
LrVar J. Hansen, Principal
03/01 / Thelma S. Anderson 101
Gary L. Canister 102
Cleo Carson 103
Leona W. Charles 104
1
07/04 Marrium T. Croo' 105
Diane- IL Hunstker 106
Mary Lou Jeffries 107
Clara P. Jeppson 108
06/05 Ronald Johnson 109
Barbara T. Jones 110
Gloiia C. Lloyd 111
Beatrice L. Markham 112
April 29th, Grantsville Elementary
04/01 Ruth C. Matthews 113,
Sunny Mae Miller 114
Irene W. Millward 115
03/02 Berkley C. Orr 116
Carol Petty 117
Sherry L. Repscher 118
07/05 Lowell S. Watson 119
Mary Ann Whitehead 120
Marilyn T. Worthington 121
341

April 30th, West Elementary School, 440 S. 400 West St., Tooele,
John Rex Shepherd, Principal
05/01 Elmo Kay Barton. 122
Georgena Beardall 123
Milo C. Berry 124
04/02 Alice S. Bevan 125
Arita L. Blanchard 126
Margaret M. Castagno 127
07/06 Nellie M. Castagno 128
L.C. Cummings 129
Lawrence M. Downey 130
May 3rd, West Elementary
06/02 June B. Gillette 131Ilene B. Batton 59
Dora C. Jacobs 132
04/03 Mauna Phillips '133Maureen M. Pino 134
Gwenevere A. Stookey 135
342 4'1 .1-;
t...= .1
//
Appendix
Bibliography on Affect-Interaction-Communicatio
ado
BIBLIOGRAPHY ON AFFECT-INTERACTION-COMMUNICATION
Beier, Ernst G. The Silent Language of Psychotherapy.Chicago, Ill.: Araiiii Publishing Co., 1966.
Bach, G. R., & Wyden, P. The Intimate Enemy. New York:William Morrow and Co., IRE771Vg8.
Berne, Eric. Transactional Analysis, in Psychotherapy.New York; Giove Press, Inc., 19gr.
Bower, E. M. Early Identification of Emotionally Handi-capped Ch ldren in School. Spangfield, Ill.:Charles C. Tar-
Bower, E. M., & Hollister, W. G. Behavioral ScienceFrontiers in Edu9ation. New York: Wile77rigT.
Brissey, F. L., Fosmire, F. R., & Hills, R. J. Prob-lems, ProblemlSolvin , and Human Communication:rtiboratory Approach to Tram3nq in InterpersonalCommunication. Eugene, Ore.: University of Oregon,1969. Prepared for the Directorate of Informa-tion Sciences of therAir Force Office of Scienti-fic Research and the Center of the Advanced Studyof Educational Administration.
Brown, Bob B. The Experimental Mind in Education. NewYork: Harper and Row, 1968.
Brown, R. Social Psychology. New York: The FreePress,MIT:
Campbell, D. T., & Fiske, D. W. Convergent and dis-criminant validation by the multi-trait-multi-method matrix. Psychological Bulletin, 1959,56 81-105.
Collins, B. E., & Raven, B. H. Group structure:Attraction, coalitions communication, and power.In GI'Lindzey & E. Aronsen (eds.), Handbook ofSocial Psychology, Vol. IV. Reading, Mass.:Addison Wesley Pub. Co., 1969, 102-205.
Cowen, E. L., Gardner, E. A., & Zax,,M. Emergent,Approaches to Mental Health Problems. New York:Appleton-Century-CrbfriTTW67.
345
.33190

deCharms, R. Personal Causation: The Internal Affec-tive Deteaa of Behavior. New York:Academic Press, 1968.
Fagan, J., & Shepherd, I. L. Gestalt Therapy Now. NewYork: Harper and Row, 1970.
Fairweather, G. W. Methods for Experimental SocialInnovation. Nei-Yria7 Wiley, 1967.
Gibb, Cecil A. Leadership. In G. Lindzey & E.Aronsen (eds.), Handbood of Social Psychology,Vol. IV. Reading, Mass.: Addison Wesley Pub.Co., 1969, 205-283.
Gordon, Thomas. Parent-Effectiveness Training. NewYork: Peter H. Wyden, Inc., 1970.
Haley, Jay. Changing Families. New York:. Grune andStratton, 1971.
Harvey, 0. J., Hunt, D. E., & Schroeder, H. M. Con-. tual Systems and Personality Organization.
ew York: John ilTey and Sons, Inc., 1961.
Harve O. J., White, B. J., Prather, M., & Alter, R. D.eacher's belief systems and preschool atmospheres.
/Journal.of Educational Psychology, 1966, 57,373 81.+
Harvey, O. J., Prather, M., White, G. J., & Hoffmeister,J. K. Teacher's beliefs, classroom atmosphereand student behavior. American EducationalResearch Journal, 1968,-g7-13.1:166.
Heider, Fritz. The Psychology of Interpersonal Rela-tions. New York: John Wiley and Sons, Inc.,1958.
Hills, R. J. The Concept of System. Eugene, Ore.:University of Oregon,-r967, prepared for Centerfor Advanced Study of Educational Administration.
Jourard, Sidney, M. Self-Disclosure: An ExperimentalAnal sis of the Transparent Self. New York:John Wiley aria-tons, Inc.
Kelly, H. H., & Thibaut, J. W. Group problem solving.In G. Lindzey & E. Aronsen (eds.), Handbook ofSocial Psychology, Vol. IV. Reading, Mass.:Addison Wesley Publishing Co., 1969, 1-102.
346,

Marlowe, D., & Gergen, K. J. Personality and socialinteraction. In G. Lindzey & E. Aronsen (eds.),Handbook of Social Psychology, Vol. III. Reading,
Addison Wesley Publishing Co., 1969,590666.
Muuss, R. E. The effects of a one- and two-year causallearning program. Journal of Personality, 1960,28, 479-491.
Muuss, R. E. The relationship between causal orienta-tion, anxiety, and insecurity in elementary schoolchildren. Journal of Educational Psychology,1960, 51, 122-129.
Newcomb, T. M. An approach to the study of communica-tive acts. Psychological Review, 1953, 60.
Ojemann, R. H. The causes and consequences of behavior.Education, 1964, 85, 78-83.
Ojemann, R. H. Incorporating psychological concepts inthe school curriculum. Journal of School Psych-ology, 1967, 5, 195-204.
Ojemann, R. H., Levitt, E. E., Lyle, W. H., Jr., &Whitesides, M. F. The effects of a "casuarteacher-training program and certain curricularchanges on grade school children. Journal ofExperimental Education, 1955, 24, 93=1 ur-
Ojemann, R. H., & Snider, B. C. F. The effect of Ateaching program in behavioral science on changesin causal behavior scores. Journal of EducationalResearch, 1964, 57, 255-260.-7-----
Palmer, Ted. B. California's Community Treatment Pro-jeci\in 1969, prepared for U.S. JoiRtilEariaimERT-on Correctional Manpower and Training, 1969.
Palmer, Ted 11 Patterns of Adjustment Among DelinquentAdolescent Conformists. Community TreatmentProject Report Series, No. 1, 1971.
Polanyi, Michael. The Tacit Diminsion. Garden City,New York: Douraday and Co., Inc., 1966.
Randolph, N., Howe, W., & Achterman, E. Self-Enhancing Education: A Training Manual. PACEProject, Title III ESEA, 1968.
347
334,./
Rokeach, M: The Open and Clo ed Mind. New York: BasicBooks, 1960.
Satir, Virginia. Conjoint Famil Therapy. Palo Alto,Calif.: Science and Behavi Books, Inc., 1967.
Shaw, M. E., & Sulzer, J. L. An e irical test ofHeider's levels of attribution f responsibility.Journal of. Abnormal and Social cholo , 1964,69, 39-4'67
Siu, R. G. H. The Tao of Science. ridge, Mass.:The M.I.T. Press, 19577-----
Soreno, K. K., & Mortensen, C. D. Foundat ons ofCommunication Theory. New York: Harp r aid Row,1970.
Stiles, F. S. Developing an understanding of umanbehavior at the elementary school level: Journalof Educational Research, 1950, 43, 516-52 .
Taylor, C. W., Ghisein, B., & Yagi, K. ExploratoryResearch on Communication Abilities and CreativeAbilities. Technical Repori, Grant No. WEITUNK-144-63, Directorate of Information Sciences, Officeof Aerospace Research, 1967.
Taylor, C. W., & Williams, F. E. Instructional Mediaand Creativity. New York: John Wiley and Sons,Inc., 1966.
Warren, M. Q., & Staff of the Cpmmiinity Treatment Pro-ject. Interpersonal Maturity Classification:Juvenile:, Diagnosis and Treatment of Low, Middle,and High Maturity Delinquents, preparea-for U.S.Nat Commission on CorreEITEnal Manpower and.Training, 1966.)
Watzlawick, Paul. An Anthology of Human Communication.Palo Alto, Calms.: Sc anii-IiKavior Books,Inc.
Willems, E. P., & Rausch, H. C. Naturalistic Viewpointsin Psychological Research. New York: Holt,Rinehart, and winifEW77569.
348'

Appendix L
Affective Study on Student Teachers
in Special Education

AFFECTIVE STUDY ON STUDENT TEACHERS
IN SPECIAL EDUCATION1
Frances Schwaninger -Morse
David C. Bradford
Working Paper No. 9
November, 1973
-
ROCKY MOUNTAIN REGIONAL RESOURCE CENTER
DEPARTMENT OF SPECIAL EDUCATION
UNIVERSITY OF UTAH
'Preparation of this paper supported by Grant No. 0EG-0-70-4178(608),
Project NO. 542930. The project presented or reported herein was performed
pursuant to a gralif-t* the U.S. Office of Education, Department of Health,
Education and Welfare. opinions expressed herein, however, donotmeces-
eerily reflect the position or policy of the U.S.' Office of Education, and
no official, endorsement by the U.S. Office of Education should be inferred.
Frances Schwaninger-Morse and David C. Bradford are both members of
the Rocky Mountain Regional Resource Center (RMIRC).evaluation team.
These papers are intended primarily as informal communications to
and among members of the MSC and faculty members of the Department of
Special Education. The materials contained herein are generally not in
final stages of refinement and are not to be cited without the authors'
permission.
351

TABLE OF CONTENTS
I. Introduction.
A. Statement of need1. Specific to IMRIC.2. General need
B. Statement of goals
II. Method
A. Instruments1. Written measures2. Observation scale3. Raters
B. Subjects
C. Procedure1. First pilot: written measures
2. Second pilot: observation techniques
3. Actual studya. Video-tapingb. Observer selection and training
(1) reliability estimates
III. Results and Discussion
A. First analysis: descriptive data
B. Second analysis: factors extracted
1. Primary factor descriptiona.% Test data factorsb. Observation factors: Scale
c.\ Observation factors: Scale IId. Observation factors: Scale III
e. Observation factors: Scale IV
2. Secondary factor description
C. Third analysis: pattern predictions
IV. Summary
A. Bibliography.
B. Appendix A: Description of Measures
C. Appendix B: Auxiliary Research Procedures
353
3,6

LIST OF 'FIGURES' AND TABLES
Figure 1. Averages onjestScores for Sub-Areasin Special Education
Figure 2.
I
Average Test cores (Affect) for Sub-Areasof Special Ed cation.
Figure 3, Average Test Scores (Verbal) for Sub-Areasof Special Education
Figuv 4. Individual Feedback Chart (Example Only)
Table 1. Correlation Table for Written Test Material
Table 2. Rotated Factor Matrix fot Written Test Material
Table 3. Correlation Table forthe Twenty-Nine Items ofObservation Scale I
Table 4. Rotated Factor Matrix for Observation Scale I
Table 5. Correlation Table forObservation Scale II
Table 6. Rotated Factor Matrix
Table 7. Correlation Table forObservation Scale III
Table
,Table
8. Rotated FactorAatrix
the Twenty -Three Items of
for Observation Scale II
the Fifteen Items of
for Observation Scale III
9. Correlation Table for the Nineteen Items ofObservation Scale IV
Table 10. Rotated Factor Matrix for Observation Scale IV
Table 11. Correlation Table for the Observation ScaleFactors (16 Factors)
Table 12. Rotated Matrix of Second-Order Observation
Scale Factors
C
(
354(4
%)

Affective Study on Student Teachersin Special Education
by Francei Schwaninger-Morseand David C. Bradford
INTRODUCTION
During the school year 1972-73, the Rocky Mountain Regional ResourceCenter (RMRRC) was involved in a search for variables' influencingcompetencies in the affective area. It is readily apparent thatin our school systems, as elsewhere, persons differ in their abili-ties to convey affective messages on both overt and covert levels,in the Ai' ;:.y to read or perceive accurately those messages, andin the type Ifective feeling they habitually display. Thesedifferences be....se very important when faced with the task ofmatching teachers and students, or in training teachers and otherpersonnel who are increasingly obliged to deal with the "wholechild." As resource people become involved with daily schooloperation, it also becomes more important for them to deal withother adults as "whAe persons." It was intended that the findingof certain variables which seem to indicate different affectivestyles would be useful in the forthcoming yearPs training pro-grams, both on the part of the RMRRC staff and of other interested,institutions..
In its commitment to serve handicapped children on a "whole child"basis, that RMRRC has repeatedly posed questions whose answerslie at least partial .y in the affective domain. Among these are:
What are the qualities that make a stratistician (teacher, resource__person) effective? Can these qualities be taught? If they mustbe only selected, what is the best method of selection? .Whatchanges need to .be made in pre- and in-service teacher trainingprogtams to produce teachers better Able to deal with specialeducation problems in and out of the regular classroom? On what
dimensions could students and teachers be matched to facilitateinteraction and maximize benefits for both? While-Looms answers
were being sought through data collection on the stratisticianmodel and the Outreach programs, special emphasis on affectiveprocesses was maintained as a concentrated evaluation effort inorder to focus more clearly on specific, definable parameters.The results of such concentration will hopefully support informa-tion gathered from other evaluatio' thrusts, and aid in inter-preting and integrating the data collection of the program as
-a whole.
On the first page of the RMRRC Bequest for Third Year Funding,"affect" was introduced as one parameter of the general problemof inadequate services to handicapped children. Focusing on
affect ill hopefully help insure that the development of new
355

models described in that proposal will indeed proceed on a widefront, rather than depend on traditional, more easily measurableacademicor achievement-oriented goals. On the second page, the
proposal stated that a reconceptualization of special educationservices is needed, and that a thorough study of student-teacherinteractions and processes be projected. In.general, resource
people, staff members of pre-service and in-service training pro-grams, and trainees themselves, overhwhelmingly agree-that affectis an area where information and definition are crucially needed,yet are easily avoided.
In contrast to the emphasis on language skills apparent in thepublic school system, an absence of explicit instruction on covert,affective communication, skills is evident. Many persons can neither
conceal nor express feelings to their own satisfaction. This in-
abilityleads to mispercepticn in reading imperfectly concealedor expressed feelings in others--a sad state of affairs when one
notes that "the central ingredient in the psychotherapeuticprocess (whether clinical or educational) appears to be the ability
to perceive and communicate accurately, and with sensitivity,the feelings of another and the meaning of those feelings (Truaxand Mitchell, 1971)." Inability to effectively communicate has ledto serious social consequences, among which are pervasive feelingsof loneliness, alienation, and sterility in interpersonal rela-tionships. It seems likely that disruptive behavior in the class-room may be an attempt to compensate for lack of effective com-munication in more constructive ways.
Preliminary inroads have been made into the area of instruction inaffect by such interaction training programs as Thomas Gordon'sParent Effectiveness Training (1970) and Norma Randolph's SelfEnhancing Education (1968), among other.. Although these programs
represent helpful beginnings in improving interpersonal interaction,they are still only beginnings. Many persons still find themselves
bewilderingly unable to consistently utilize such tools. Forsuch people, and even for those who are moderately successful,resource persons must be ready with an "advanced course" in com-
munication training. They must be prepared to look at the diversity
of styles in which such tools may be used. For instance, subtle
nuances of expression can change the simple phrase, "Good morning,"
from a greeting to a warning. Mehrabian (1972) has estimated fromresearch in communication "channels" that 7% of a person's communi-cation is expressed verbally, 382 extraverbally (voice tone,pauses, inflection, etc.), and 55% by facial and body gestures.A person able to help others integrate covert and overt channelswould be a very valuable resource. Indeed,- greater awareness of
such covert, affective levels of interaction may, by itself, bea catalytic factor in making regular as well as special education
more effective. Hopefully, by becoming aware of implicitaffective extraverbal and volverbal communications, teachers and
356

students will grow more adept as using them, thus creating anatmosphere more conducive to everyone's personal development.
This initial research effort explored only a few of the questions
dealing with affect. It was an attempt to delineate the mostelimentary dimensions along which persons could be differentiatedrelating to their affective communication styles.
Attention was focused-on three broad research questions: (1) What
is the description of a sample of student teachers in terms ofspecific affective constructs? (2) Can relatively stable factors
of variables be identified by which we can describe the affectivedomain in teaching of the handicapped? (3) Can we identify easily
measurable factors which are involved in the biasing or distortionof affective communication, either in sending or in receiving,and their role in determining a person's initial impact on others?Systematic evaluation of even basic factors such as these has
only recently begun.
The particular factors and constructs chosen for study resultedfrom assumptions common in recent research in communication theory. '
They are: (1) All parsons send messages on the affective level
either through their behavior or their nonbehavior. *images in
both modes are interpreted. (2) Relationships evolve according to
the way people affect each other through their message-givingbehavior. They confirm or disconfirm each other's feelings of
mastery and self-worth. The feelings accompanying the confirmation
or disconfirmation of self are the basic elements in the operation,
of what we have pilled affect. (3) These feelings subsequently
determine one's expectations with regard to further interactionswith others, determine his bias to perceive others in a certainway (e.g., positively or iuspiciously), and determine the manner
in which he chooses to conve his messages (e.g., passive-aggres-
sively or straightforwardly). ) Biases toward certain styles
of sending and perceiving messages\further influence the person's
entire experience of relationship and development, thus trulyaffecting the,"whole person." As investigators of self-esteem
have noted, such a process is'usually circular: persons who
habitually perceive messages a negative (whether they are or
not) tend to send negative mess es, which in turn cause othersto send back genuinely negative m ssages, and the cycle goes on.
If a person is to interrupt or take voluntary control of suchdestructive communication cycles heojest have (1) feedback as to
what messages are being predominantly perceived by others from his
behavioral cues, and (2) recognition of\the way he distorts com-munication input from others. (This second requirement is quite
complex as it involves private desires, disappointments, and
angers, which are often not admitted even tb\oneself.) The types
of measures selected for this study were intended to provide the
tools to meet both requirements.
357

METHOD
Instruments
Instruments were selected from the communication research literature
which provided: (1) data on attitudes and preferences whichseem to determine the bias involved in interpretation of incoming
and outgoing messages; and (2) data on the feelings elicited in
an observer by a subject.
A rather large test battery was employed, in order to avoid the
pitfalls of the previous observation study (Working Paper #41'
wherein only one measurement device was used and was found not to
discriminate among the subjects. Within the (battery, an attempt
was made to select measures of complex attitude constellations
relating directly to behavior biases, as determined by previous
research. A number of test methods were selected, representingfive important theoretical orientations. Types of measures
were: direct self-report from open-ended essay'response; direct,
but objeCtive questions concerning specific feelings in specific
situations; indirect, objective questions of a general, philo-
sophical nature; and written verbal-behavior skill tests.
The first written measure was the This I Believe test (TIB). The
test was developed from the conceptual systems and personality or-
ganization theory of 0. G, Harvey, David Hunt, and Harold Schroeder
(1961). This theory integrates a number of complex attitudinal and
behavioral predilections into categories or "systems" by which
people may be differentiated. The test is based on a person's
response to novel stimuli in his environment and-his reaction to
threat. It is postulated that_a person in any given system in-
terprets or construes ego-involving stimuli in consistent ways.
These ways of constructing arrange themselves along two dimensions,
the first being dependence/independence/interdependence, and the
second, abstractness/concreteness. As an example of the contrasts,
concrete behavior is characterized by polarized judgments; depen-.
dence on social cues relating to role, status, and authority;
inability to change set; and high need for structure and rule
orientation. These attitudes result in behavior which discourages
others from taking individual responsibility, lead to indirectness
in communication, and other similar situationally specified patterns.
Abstract behavior, conversely, is typified as more flexible, more
relevant to evaluation of possibilities and alternatives on their
own merits rather thin with regard to social consequences, more
task-oriented, more "open" to novel stimuli, with communicationstyles being more interpretive and clarifying than evasive or
judgmental.
The second body of research represented is related to the first.
Bob Burton Brown, in The Experimental Mind in Education (1968),
likewise hypothesizes a continuum much like the above. He terms
the dimension "experimentalism vs. non-experimentalism." His
358
3`1'l

"experimental" person is similar to Harvey's abstract person in anopposition to fixed, unchanging principles of belief and conduct,in the active development of ongoing alternative hypotheses, de-liberate introduction of change into the environment, and emphasison curiosity, growth, and mastery, rather than structure, status
quo, and self protection. Behayiorally, the experimental person
(teacher, in Brown's studies) differs from the nonexperimental
in specific ways. Examples of differences are: providing studentswith many options rather than a set schedule, allowing students
to direct their own activity and focus on their own problems,
rather than relying solely on the teacher for such direction,encouraging students to venture "over their heads" rather than
trying to fit everyone into the same mold, changing plans in
response to feedback rather than trying to force new events to
fit a pre-established schedule.
Brown's work, however, goes one step farther into the complex in-terdependence between belief and behavior. Although the stage of
one's "experimentalism in thinking" is an important influence in
its own right, it is also important that one behave congruently
with one's thinking. This emphasis on genuiness and congruence
leads further into the area of communication. Brown gathers
evidence to show that a gap between the experimentalism shown in
personal beliefs and the degree of experimentalism one displays in
public leads to more disruptive and ineffective interaction than
merely a lack of experimentalism in both areas. Two measures were
borrowed from this research: Personal Beliefs (PB) and Teacher's
Practices (TP).
Logical extensions of the implications of Brown's work led to the
choice of the third theoretical area: self- disclosure (Jourard,
1971). If, as Brown postulates, the disruptive factor in large"belief gap" victims is the inability to express and operate ontheir actual beliefs for fear of public disapproval, then-these
persons should, be less willing to disclose themselves than highly
congruent persons. Jourard's questionnaires, Disclosure to
Best Friend (DBF) and Disclosure to Casual Acquaintance (DCA),
indicate to what extent a person has revealed personal experiences
to another with regard to various; sometimes "touchy" topics. It
was expected that high self-disclosure would correlate with the
experimentalism and abstractness measures to form a factor
indicating general openness.
The fourth area of assessment included several tests of simple
verbal skill (Taylor, Ghiselin, and Yagi, 1967). Though they
represent factors of verbal fluency and flexibility, their rela-
tionship to patterns of belief or behavior have not been well
researched. These measures were included on the reasonable as-
sumption in much of education that a teacher's effectiveness
depends more on his verbal ability than on his affective style.
359

Lastly, measures developed as a direct consequence of nonverbalbehavior research were included. It was expected that these
measures would correlate most closely with the results of the
observation scales, since they were developed from the same re-
search. The tests are Affiliation Tendency, Empathetic Tendency,
and Sensitivity to Rejection (Mehrabian, 1972).
The observation rating scale used was not a traditional recordingof discrete behavior unitsin.code form, but an attempt to rate
the feeling, induced in the rater by observing the subject. The
semantic differential scale used by Mehrabian (1972) was adopted
and expanded slightly. A-few bi-polar constructs drawn from the
written measures were included to determine how well they cor-relate with their Counterparts in the other two methods of assess-
ment. The value of this assessment technique lies in the fact thatraters are not asked to "decoder' (interpret) what the targetperson intends by his communication, but simply to record the im-
pact of the'subject's messages upon himself as an outside observer.
Raters were trained only for consensus in terminology and constructsto be used for recording the impact, the target areas to be ob-
served (e.g., head, body, voice), and the methodological ritualsto be observed (e.g., timing, order of presentation, etc.).
This is reported in the procedure section.
In experiments of this type, raters are considered representativeof the "naive observer" rather than as experts in the behavioralsciences. It is postulated that the naive observer responds toothers on the basis of subjective, internal norms--a sort of per-
sonal average of situations that have occurred previously. Averages
such as these form the basis for psychological stereotypes, and
stereotypes frequently serve as reference points for evaluating
new people.,
It has been shown that such psychological stereotypes or personal
averages are relatively consistent within a culture and influence
the interaction between strangers. An understanding of the stereo-
type one evokes in another person should better enable one to pre-.
dict how that person will respond in turn. Stereotypic expecta-
tions with respect to a new person serve to determine communicationpatterns in all first encounters.
With increased interpersonal contact, the stereotype may become
less important in determing the pattern of the interaction, but
its importance in the initial stages of a relationship should
not be minimized. Situations such as applying for a job or making
contact with the parents of a student are good examples of situ-
ations where first impressions are important, and Prior expectations
powerful. This research paradigm is designed to enable considera-tion of stereotypes as whole units, but not to make possible
an analysis of the components of individual stereotypes.
360
re ;-6'itt)

/t was expected that nonverbal ratings would reveal meaningful dif-lerences in the behavior of student teachers with their handicappedstudents. Mehrabian (1972)discusses numerous studies which indi-cate that verbal or explicit coding of messages (especially nega-
tive ones) is strictly controlled by social approval; because ofthis, implicit channels are used to transmit the socially disap-
proved components. However, patterns of encoding on differentnonverbal channels vary among people according to their consis-
tency, intensity, and congruency, thus making interpretationof nonverbal cues a difficult task that often yields incorrectand inconsistent results. The effi;ctsof many specific behavioral
cues on the observer have been investigated. For example, it has
been found that a person has more eye contact with one he likesthan with one he dislikes; generally more eye contact is perceived
as more positive (up to a point); moderately direct:shoulder
orientation indicates intense liking; very indirect shoulder ori-entation indicates intense disliking; backward lean of the torsodecreases as liking increases; smaller distances indicate morepositive interpersonal attitudes. It was hoped that by narrowing
observation to more specific cues that have been consistentlyfound to be important in previous-research, and by averagingresponses of several raters, that consistent patterns of nonverbal
affective behaviors could be identified and their relationship
to written tests evaluated.
Reliability (primarily ,test-retest) for alrmeasures selectedranges from .78 to .95;,which was considered acceptably high.
More extensive information regarding reliability is available
in. the published material for each measure described.
Subjects
Subjects (Ss) in all cases were volunteers from the students en-rolled in the Department of Special Education, University of Utah.
Thirty-two students in their first year of training volunteered
to participate in pilot testing of the instruments;. 11 of them
completed the battery. Six students who were doing early (Winter
quarter) student teaching were requested to participate inadditional testing in order to help familiarize the researchers
with the student-teaching situation. In the actual study, all
students enrolled for student teaching during Spring quarterwere requested to participate as part of the teaching experience.
Forty-six of them did so, but the few with strong objections were
allowed alternatives to fulfill course requirements. Of the
46 Ss, only 28 participated in the video taping. Objections by
parents, cooperating teachers, or school districts made video
taping of the remainder impossible. SeVen school districts in
the Salt Lake City, Provo and Ogden 'areas cooperated in the study,
with only one district failing to respond to the request for
taping permission.
361
t

Procedure
The study was preceded by two pilot testing sessions. Pilot Session
1 was designed to investigate the written measures, and Pilot Session
2, the observation scales.
First Pilot: During Autumn quarter, 1972, volunteers were recruited
from first-year special education students. Thirty-two volunteers
took a battery of written tests during a series of arranged group-
testing sessions. From the results of these tests, it was deter-
mined whether or not a meaningful range of scores could be dis-
'criminated by these measures. In addition, some measures were found
to be superfluous, others too lengthy-or too unpleasant for the
subjects. Those which appeared to have discriminatory power and
were practical were selected for use in the study.
At this time it was also decided that using volunteers was too
costly and undependable since only 11 Ss completed all tests in the
battery. Arrangements were then made with the Department of
Special Education to include participation in the affective re-
search as part of the regular student-teaching experience, with
individual feedback to be provided at a service from the RMIRC.
Second Pilot: During Winter quarter, the selected written
measures were administered, in the same group format and the same
test order, to a class of six student teachers in the area of
mental retardation. After an initial "settling" period, these
-six subjects were observed repeatedly in their classroom settings.
During such observation periods, decisions were made about the
kinds,of observation techniques to be used, the number and selection
of variables to be included, and extraneous, environmental peculi-
arities which might need to be considered during the actual study.
Recording technique: It was decided to video tape the inter-
action of student teachers in a one-to -one tutoring situation
with a handicapped pupil. This insured that raters would receive
similar stimuli for each S. Students teachers were given feed-
back later as they watched a replay of their own behavior and were
given the chance to judge how representative they felt the video-
taped sample was. A side benefit for the RMRRC was the creation
of a tape library for futuve use in classes, in-service workshops, etc.
Behavioral sample: The choice of variables to be rated
proved more difficult. Interaction scales (such as Ober, Flanders,
etc.) from the field of education were either tob extensive in terms
of overall classroom behavior, or insufficient with respect to
affective communication. It was finally decided, after much ex-
perimentation, to adopt an affective rating scale in a semantic
differential format from social. psychology (Mehrabian, 1972).
This allowed behavioral styles to be evaluated with regard to the
specific affective responses engendered in the observer (see
362

discussion under Instruments). Mehrabian and his colleagueshave reported extensively on the interpretation (decoding) of
affective messages in multi-dimensional, nonverbal behaviors.His work provided a basis for relating the _interpretations ofcomplex communications of feelings such as "warmth" to already
charted patterns of behavior.
The decision to video taps students in a one-to-one setting rather than
in a group interaction was made to simplify the stimulus as muchas possible and still maintain a real-life, relevant situation.
It was felt that the everyday teaching interaction should be usedto provide the spontaneous covert clues fort observation, since
that was the context to Waal we wished to Ieneralize the findings.Therefore, no artificial conflicts-or other c rcumstances weredeliberately staged, other than the video tapi itself. Al-
though it is likely that merely being video tap changes be-
havior to some extent, and that different persont\react dif-ferently to that kind of observation) attempts to circumventthose problems bycovertrecordingwereboth technologically andethically impossible.
Actual Study: During Spring quarter, the written measures wereadministered to 46 special education students who were participatingin student teaching that quarter. Presentation of the program was
made to a joint meeting of students and cooperating teachers.Individual appointments were then made for a video-taping session
in their classrooms. Reminder phone calls were made to each S
one week in advance of the appointment. Each student was in-
structed to prepare an individual tutoring task lasting fromfifteen minutes to one-half hour. They were requested to have
two students prepared in case one did not come to class. They
were further asked to get parental releases for each pupil who
would be taped; release forms were provided through theirstudent-teaching coordinators. Twenty -eight student teachers
were able to participate in the taping.
Video taping: Taping procedures in the classroom were as
follows: experimenter greeted student teacher and pupil while the
cameraman set up the equipment; environmental restrictions on the
tutoring setting were explained (the camera must face away fromthe window, bodies of both teacher and pupil must be visiblefrom at least the waist up, the faces of both persons must beoriented toward the camera as much as possible, that is, in a
side-by-side seating arrangement). It was explained that the
camera would be turned on before the signal was given to enterthe setting, then teacher and student should enter and proceedwith task as naturally as possible until signal was given tostop--about 20 minutes later. After taping, both student teacher
and pupil were offered the opportunity to review the tape im-
mediately through a play-back system built into the camera.
363
a48

During this period, both student any! student teacher were informally,questioned as to their feelings and stress level during the taping,their goals for the tutoring session, and the nature of the re-ferral or handicapping'condition, age, and grade level of the
pupil. This information was filed along with the parental re-
lease for future investigation as independent variables.
Observer selection_ and training: A list of volunteers for
observation of tapes had been compiled by solicitation at thespecial education student advisory committee meeting during
Winter quarter. The first 6 observers who were available for the
arranged viewing times were hired. They were then individually
trained in a two-hour training session by the experimenter.The semantic differential scale was reviewed and meanings at-tributed to each bi -polar set el,f adjectives were presented and
discussed until consensus was reached. The two training tapes
were observed and agreement with the experimenter was checked.
After obtaining satisfactory agreement, the observer then wasinstructed in viewing procedures, a copy of which follows:
1) Start all tapes at number 100 and watch a five-minutesegment. The timer should be set for five minutes as thetape machine is turned to the "forward" position. Watch
this five-minute segment three times, starting each timeat number 100; first two viewings without sound; lastviewing with sound but without picture.
2) Scale I: Facial. First, read through the list of adjective
pairs until you are familiar with them. Then view the
specified tape aegment with picture and no sound. Concen-
trate your eyes on the facial area only. Lastly, go straight
through the scale, marking your affective impression. Do
not go back to change ratings.
3) Scale II: Gestures. First read through the list of adjec-
tive pairs until you are familiar with them. Then view
the.specified tape segment with picture and no sound. Con-
centrate your eyes on just the lower body, the torso, from
the neck down only. Lastly, go straight through the scale,
marking your affective impression. Do not go back to change
ratings.
4) Scale III: Vocalization. First, read through the list of
adjective pairs until you are familiar with them. Then view
the specified tape segment with sound and no picture. Con-
centrate on the voice. Lastly go straight through the scale,
marking your affective impression. Do not go back to change
ratings.
5) Scale IV: General Impression. No further viewing of the
tape is necessary for this rating. Take a two-minute break
364
3
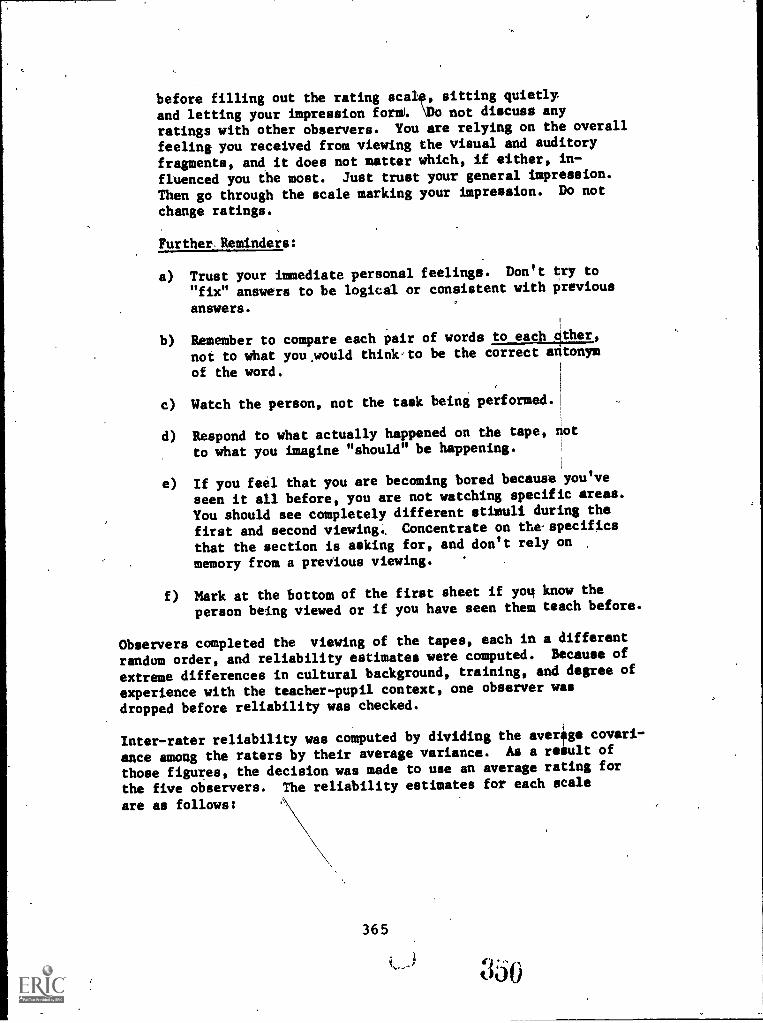
before filling out the rating scale, sitting quietly
and letting your impression forme. \Do not discuss any
ratings with other observers. You are relying on the overall
feeling you received from viewing the visual and auditory
fragments, and it does not matter which, if either, in-
fluenced you the most. Just trust your general impression.
Then go through the scale marking your impression. Do not
change ratings.
Further-. Reminders:
a) Trust your immediate personal feelings. Don't try to
"fix" answers to be logical or consistent with previous
answers.
b) Remember to compare each pair of words tovIctglther,
not to what youyould think-to be the correct antonym
of the word.
c) Watch the person, not the task being performed.
d) Respond to what actually happened on the tape, not
to what you imagine "should" be happening.
e) If you feel that you are becoming bored because you've
seen it all before, you are not watching specific areas.
You should see completely different stimuli during the
first and second viewing:. Concentrate on the specifics
that the section is asking for, and don't rely on
memory from a preVious viewing.
f) Mark at the bottom of the first sheet if you know the
person being viewed or if you have seen them teach before.
Observers completed the viewing of the tapes, each in a different
random order, and reliability estimates were computed. Because of
extreme differences in cultural background, training, and degree of
experience with the teacher-pupil context, one observer was
dropped before reliability was checked.
Inter-rater reliability was computed by dividing the averime covari-
ance among the raters by their average variance. As a result of
those figures, the decision was made to use an average rating for
the five observers. The reliability estimates for each scale
are as follows:
365

Single Rater
Average of5 Raters*
Scale I (facial ekpression) .41 .78
Scale II (body gestures) .24 .61
Scale III (vocals Zation)
st
.44 .80
Scale IV (general) .23 .60
*Computed by Spearman-Brown coefficient.
RESULTS AND DISCUSSION
Results were analyzed in three sections. e first to be pre-
sented here are results of the written mess res considered to .be
descriptive tools only. The total subject s le of 46 student'
teachers was described in terms of group meaile,and standard devia-tions; comparisons were made to known standards where possible.Comparisons between sub-areas of special education were made,addressing the question of whether different "types" of students(according to these measures) were drawn to- different areal.These data were analyzed primarily for their value to departmentarea coordinators and those people specifically interested int.
issues related to selection of students.
Tangentially, this descriptive data proved useful as feedback co
individual students. A number of subjects were shown their in-dividual profiles on this battery of tests and reported the feed-back to be both enlightening and encouraging.' (See figure 4.)
First Analysis: The "average" student teacher in 'Special education
was described from these measures ass high in affiliation tendency;average in sensitivity to rejection; high in empathy; more openabout disclosing intimate personal information to close friendathan the average; not willing to disclose more than the normalamount of personal information to casual acquaintances; and feeling
a much lesser degree of conflict between the amount of experimental-
ism (openness) they experience in their personal lives and that
which they feel is seeded in the classroom. One -third of the sample
tended toward the abstract end of the continuum on the TIB, whereasonly 02e-fifth of most samples studied tend toward the abstract.
The 'data are presented in the matrix in figure 1. The averages
are especially interesting when compared to the means recorded in
original research on the measures. Mehrabian (1972) reported a
mean affiliation tendency among his subject's of 30, with a
standard deviation (SD) of 23 (RMRRC figures: 48.85; 24.16);
the mean empathetic tendency was 41, with SD of 26 (RMRRC:
366
,
tei.1

48.84; 23.98);the mean sensitivity to rejection was comparable,
-6, with SD of 23 (RNRRC figures: -6.59: -70.85). As stated
above, the special education University of Utah student teachers
were somewhat more empathetic and affiliative than the averages.
Bob Burton Brown's (1968) averages on belief gap scores of teacher
groups ranged from 40 to 100, showing a much higher degree of
conflict between personal beliefs and beliefs dealing specifically
with teacher practices than do our figures. In Jourard's re-
search on self-disclosure, an individual score above 25 on the
Best Friend measure was considered as a "high discloser"; 67%
of this sample had scores of 25 or greater.
Unfortunately, data on the scales dealing with verbal usage from
prior research have been ambiguous and difficult to interpret, so
nn useful comparisons were available.
There were no statistically significant differences among the
various specialty areas of special education, although there were
some provocative trends that may prove to be important ialater
research. For example, on the basis of those data, it appears
student teachers in the behavioral disorder area are the least
sensitive to rejection, teachers of the deaf are most sensitive,
and teachers in the field of mental retardation are most empathetic.
Teachers in the learning disability area seem to display more skill
on the verbal measures, which seems logical since they deal more
directly with language skills. It may be that some sort of
"Matching" between teachers and students is occurring spontaneously,
either in the process of specialty area selection or as a result
ofiactual classroom or teaching experience. The subtle matching
could certainly be made more efficient if the relevant matching
dimensions were specified and understood. (See figures 2 and 3.)
Second Analysis: Preliminary to the factor analysis section, wheri
such specification was attempted, a correlation matrix of the text
data for all 46 was cmpleted'(table 1). A few correlations
higher than .37 (approximate sig. level foroC0.01 and'df=44)
appear in the matrix. These were as follows:
1) CW(I) - CW(Tot) .72
2) Affil - Emp .49
3) Simil - CW(Tot) .49
4) P B - T P ' .46
5) Topics- CW(Tot)--- .43
6) T P -WA .39
7) WA - CW(I) .39
8) S-R - P .38
It is apparent that correlations 1, 3, 5, and 7 were between
measures of verbal fluency which reduced to a single factor in the
later analysis. With such test correlations, itmight be feasible
in future research to administer only one of the fluency tests
367
C4r".',.

Anstea&-feur. The remaining correlations (2, 4,-6, 8) in-
dicated more complex factor groupings, as well as a probablecomponent of method correlation on 2 and 4. According to later
factor groupings and predictive abilities of-the test, it wasdecided that the test for teacher practices could be eliminatedfor future economy.
Factor analysis allows a relatively clear, parsimonious de-scription of the relationship in a set of variables. This kind
of "data distillation" may be very useful in relating variables tothe theoretical constructs that empirical factors appear torepresent.
In an attempt to reduce the number of variables to a manageablenumber of dimensions, six vqiarate factor analyses were performed,one including only the written test measures, an analysis of eachof the observation scales, and a second -order analysis of phe ob-servation scale factors taken all together. All.factoring was
done by the principal component technique (University of UtahComputer Center Program FACTOR) and in all of the analyses,factors with an eigenvalue greater than 1.0 underwent varimax
rotation. Additional technical information regarding the analYaos
can be obtained from the authors at the RMRRC.
The correlation matrices (with communalities in the diagonals) andthe rotated factor matrices for all of the analyses can be foundin tables 1-12 at the end of the report.
The relationship between a variable (e.g., a test) and a factor is
expressed as a correlation, commonly called's loading. The
square of the loading is the proportion of variance that the vari-
able and the factor have in common. Obviously, the higher a
variable correlates with a factor, the more important it is in an
interpretation of what the factor "means." In the tables that
follow, only variables with loading of .40 or greater are included.
Description of Factors Extracted: Test data factors. The
first factor extracted from the analysis of written measures seemsrelated to verbal ability on(the behavioral tests of verbal
fluency.
Written_ Test MeasuresFactor I: Ability to Associate
item-IT Topics .60
, 4) Similarities .55
2) Compound Words (I),, .84
1) Compound Words (Total) .89
368

Compound words (total) is a measure of verbal output for a given
time period. Compou.ru words (I) is a measure of flexibi ity.
The remaining two tests are,also measuresof ability ,to ke verbal
associations, hence the name of the factor, Abilit to As ociate.
Factor II of the teat data was more important in terms of affect,
but also more dif cult to interpret.
Written Test MeasuresFactor II: High Experlierfalism
Personal Beliefs--; .79--
Sensitivity to Rejection -.71
Word Associations .56
Teacher Practices .49
wl....10 ..This factor seems to relate to the work of Bob Burton Brown
mentioned earlier, and was designated as high Experimentalism;
Factor III was derived from the grouping of tests of Affiliation
Tendency, Empathy, and Teacher Practices. The predoWinant con-
struct may be called Person Orientation.
Written Test MeasuresFaCtor III: Person Orientation
Affiliation Tendency .85
Empathy .73
Teacher Practices .44
The last two factors seem to be essentially specific factors.
Factor IV is related most strongly to Disclosure to Casual Ac-
quaintance and may be termed Superficial Openness.
64 a."1.,..Written Test MeasuresFactor IV: Superficial Openness
, .
Disclosure to Casual Acquaintance .86
Similarities.....,a0rachaprwroAretoo*
.46Vil.By way of contrast, the last factor seems, to be a measure of
Non-Superficial Openness.-.141.0*.
Written Test Measures.Factor V: Non-Superficittl Openness
Disclosure to Best Friend .83
Topics -.51
369

Observation data factors. Scale I: Facial Expressiveness. The'first factor extracted from table 1 seems to describe a person who,is relaxed, genuine, warm, responsive, stimulated, encouraging,curious,,congruent, involved, expectant, consistent, interestedand intense. This description may be thought to express Inter-personal Responsiveness.IM.IIIIrmm.N..ar.s.aIMIBIsIIMa.....G.MM.a.V
Observation Scale IFactor I: Interpersonal Responsiveness
Feelings about :ace
item
1) relaxed - (bored) .85
2) genuine -(artifical) .88. .
3) (distant) - warm .79 \
4) _ responsive - (dull) .73
5)' stimulated - ( relaxed) .74
6) (foreboding) - encouraging .731
13) (approval-oriented) - curious .62
14) congruent - (nisleading)- .81I
15) intense - (bored) .90
16) (phoney) - involved .84
17) (calm) - expectant .65
18) consistent - (inconsistent) .7
19) involved - (self-conscious) .6
Eye Contact,
23) (ritualisti - interested 1.65
Observation
24) expectant - (bored) / .83
25) interested - (self -conscipUs .82
The second factor extractod,from Scale emphasized the .ivalities
of appearing dominant, cc-zcrolling, inf uencing, important, andparent-like. It was called the Dominan e factor.111.
Observation Scale I
/Factor II: Dominance
Feelings About Face
item
7) dominant - (unsure)
8) controlling - (controlled) .78
.79
continued
370

9) (influenced) - influencing
10) imporzant\- (unsure) .50
11) (guided) autonomous .83
12) parent:like - (child-like) .56
The third factor was dra mainly from eye contact, which was
frequent, direct, steady, d interested, with head nodding.
This was labeled Facial En a ement.
Observation Scale IFactor III: Facia,1 Engagement
Eye Contact
item20) frequent - (absent) .75
21) (fleeting) - direct .92
'22) steady - (quick) .85
23) (ritualistic) - interested .57
Head Nodding (+)
26) often - (none) .53
The remaining` factors seemed to express qualities subsumed under
high experimentalism in the previous section, Calmness, Poise/
Self-Confidence, and Appropriateness of Head Gestures.
Observation Scale IFactor IV: Calmness
Feelings About Face
item
12) parent-like - (child-like) .58
17) calm - (expectant) .48
Head Shaking (-)
28) (often) - none
,,MINNpr....**.
.69
Observation Scale I
Factor V: Poise or Self-Confidence
Feelings About Face
item
7) dominant - (unsure) .43
10). important -` (unsure) .77
19) involved - (self-conscious) .66
371

.4.1......8011110
Observation Scale IFactor VI: Appropriateness of Head Gestures
Head Nodding. (+)
item26) often - (none)27) appropriate - (random)
.50
.79
Head Shaking (-)
29) appropriate - (random) .7%
Observation data factors,_Scale II: Gestures. Thefirst factor on this scale grolved the resp uses of the observersto target behavior which included: touchi g,which was frequent,,r
appropriate, genuine, adequate, and effec ive; distance of teachesfrom the pupil, which was close,appropri te, warm, and facilitating;a concerned, possibly over-protective degree of leaning forward-and an open involved, relaxed, moving body orient ...:
--,
was termed Open Warm Involvement.
Observation Scale IIFactor I: Open, Warm Involvement
Touching
item1) appropriate - (inappropriate) .79
2) (none) - much .71
3) enuine - (stilted) .854) skimpy) - adequate, .84
5) effective - (ineffective) .88
Distance
.756) close - (distant)7) appropriate - (uncomfortable) .83
8) (cool) - warm .92
9) facilitating - (disruptive) .87
Degree of Leaning
.5610) smothering, - (self-protective)
11) concerned - (manipulative) .67
continued-werea../...ftdo,10.14.111.1.1....41.11MN
372

Orientation
item
13) open - (closed) .77
14) (avoiding) - involved .82
15) moving - (stiff) .77
16) relaxed - (uptight) .79
Hand Relaxation
20) manipulating - (still) .81
Trunk Swivel
23) often - (none) .69.1.The second factor consisted of judgments that the subject wasself-protective and rather rigid as to distance, degree of leaning,
and head position. It was called a Body Tension factor.
Observation Scale IIFactor II: Body Tension
Distance
item6) (close) - distant .48
Degree of Leaning
(smothering) - self-protective .65
NiC Relaxation
21) (head supported) - not supported .83
22) (angled) - straight .77
The last factors seem to.exprpcs familiar constructs. They are
Patience, Relaxation, and Casualness.---_----
Observation Scale IIFactor III: Patience /
Touching
item2) none - (much)4) skimpy - (adequate)
..paa.*......* asanIM11101110
373
.54
.45continued
47!-L,tbtl )

De 2,191 Leaning,
item
12) patient - (pushy) .92
Observation Scale IIFactor IV: Relaxation
Orientation
item16) relaxed - (uptight) .42
Hand Relaxation
19) (tense) - relaxed .91
Observation Scale IIFactor V: Casualness
Orientation
item13) open - (closed)15) moving - (stiff)
.43
.44
Relaxation: Arm Position
17) (symmetrical) - asymmetrical .88
Relaxation Body Position
6..
18) (symmetrical) - asymmetrical .81.
01111111mwmagr....:- 1- .Observation data factors, Scale III: Vocalizations. The
vocal channel produced fewer factors than the other scales, pos-sibly due to more experience on the part of the observers with at-tention to the voice, resulting in more accurate perception of vocal
affect. The two factors, although labeled similarly, were orthog-
onal. That is, they do not correlate with each other. The first
factor was called Clear, Reinforcing Communication. It Itclescribed
verbal-vocal messages which were: clear, reinforcing, Helpful,
enthusiastic, sympathetic, enjoying, positive, smooth icongruent,
and straight.
374
ri

Observation Scale III
Factor I: Clear, Reinforcing Communication
item4) clear - (confusing) .89
5) reinforcing - (disruptive) .95
0) (unnecessary) - helpful, .92
7) (mechanical) - enthusiastic .86
8) sympathetic - (important) .76
9) enjoying - (annoyed) .88
10) (negative) - positive .92
11) smooth - (halting) .86
13) (misleading) - congruent .91
14) straight - (double-messaged) .91
The second factor described messages which were concise and short,
called Conciseness.
Observation Scale III
Factor II:
item1)
2)
3)
12)
15)
Conciseness
short - (long) 1.89
1.66
1.60
I.67V1/ .84
choppy - (drawn -out)(overdone) - insufficient(loud) - soft(wordy) - concise
Observation data factors, Scale IV: General Impression.
/Alter observing the visual and audio channels separately, the ob-
servers rated each subject as to overall impression. The factor
analysis of these ratings produced genera (attitudes factors which
resembled closely the first two factors dawn from each of the
visual scales. As suspected, this *Lied
1
that the visually
0encoded messages had more impact on the #erall response than did
the vocal channel, despite the fact thatithe vocal portion was the
one most recently played back before making an overall rating.
1
The first factor may be described in the following terms: self-
confident, patient, optimistic, flexible, task-oriented, congruent,'
effective, open, trusting, sensitive, empathetic, comfortable,
likable, competent, attentive, and informal. The factor label
chosen is Likable Competence. Since task-orientation and flexibility
had the highest loadings, this factor was probably akin to that
set of qualities embodied in Syltem IV in Harvey's research--the
most abstract functioning of his conceptual systems. The experi-
mental-minded person in Brown's research would also possess the
qualities contained in this factor.
375

Observation Scale IV,Factor I:
item
Likable Competence
2) (approval-seeking) - self-confident .61
4) (demanding) - patient .78
5) (cynical) - optimistic .79
6) flexible - (rigid) .
.86
7) person-oriented - (task oriented) .90
8) (misleading) - congruent .51
10) (ineffective) - effective .58
11) 9...-, - (closed) .61
12) lsuspicious) - trusting .69
13) (impervious) - sensitive .67
14) empathetic - (aloof) .81
15) (anxious) - comfortable .58
16) likable - (not very likable) .67
17). competent - (incompetent) .61
18) (inattentive) - attentive .60
19) (formal) - informal .69
,
The second factor was predominantly composed of items that givethe general impression of being directing, structured, confident,and formal. It was termed Directiveness, similar to Dominanceon Scale I, though implying more activity.
Observation Scale IVFactor II: Directiveness
item1) structured - (unclear) .34
2) approval seeking) - self-confident .56
3) directing - (loose) .94
19) formal - (informal) .69
A person with a high score on Factor III might be considered struc-tured, congruent, consistent, effective, open, trusting, sensi-tive, comfortable, likable, competent, and attentive. The factor
say be called Congruent Openness.
bservation Scale IV, Factor III; Congruent Openness1) structured - (unclear) .66
8) (misleading) - congruent .75
'e 9) consi tent - (inconsistent) .87
10) ineffective) - affective .63
11) ava - (closed) .67
12) (suspicious) - trusting .49
13) (impervious) - sensitive .56±/' continued
1
376 g?,.
0
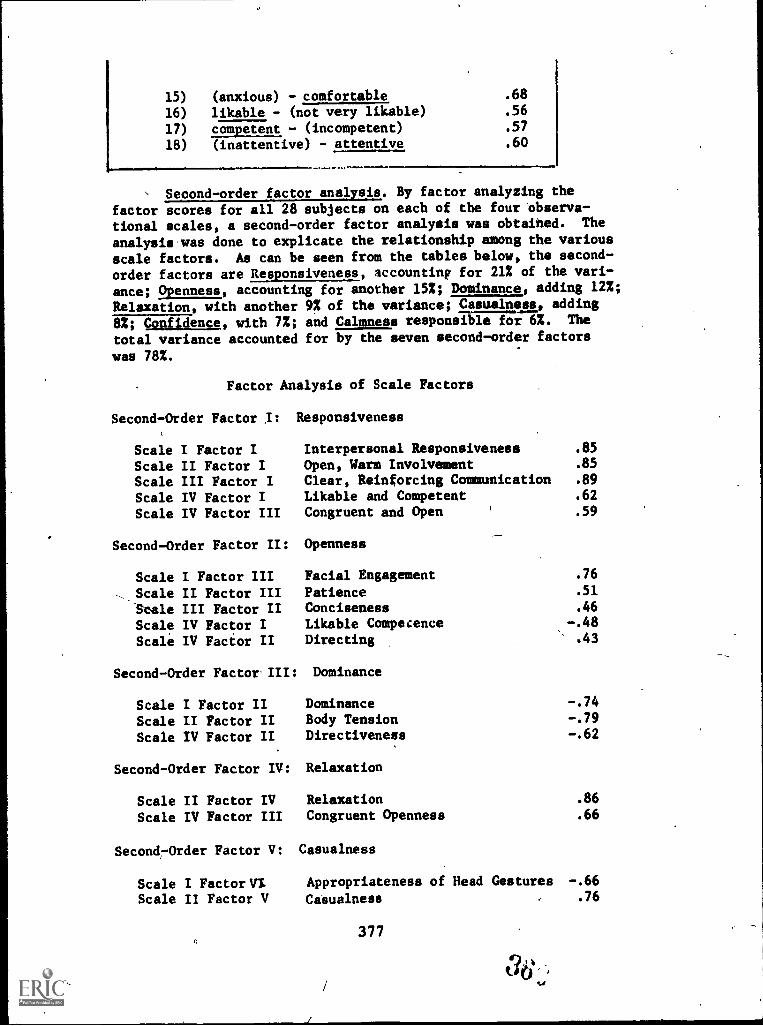
15) (anxious) - comfortable .68
16) likable - (not very likable) .56
17) competent - (incompetent) .57
18) (inattentive) - attentive .60
Second-order factor analysis. By factor analyzing the
factor scores for all 28 subjects on each of the four Observa-tional scales, a second-order factor analysis was obtaihed. The
analysis was done to explicate the relationship among the various
scale factors. As can be seen from the tables below, the second-order factors are Responsiveness, accounting for 21% of the vari-
ance; Openness, accounting for another 15%; Dominance, adding 122;
Relaxation, with another 9% of the variance; Casualness, adding82; Confidence, with 7%; and Calmness responsible for 6%. The
total variance accounted for by the seven second-order factors
was 78%.
Factor Analysis of Scale Factors
Second-Order Factor I: Responsiveness
Scale I Factor IScale II Factor IScale III Factor IScale IV Factor IScale IV Factor III
Interpersonal ResponsivenessOpen, Warm InvolvementClear, Reinforcing CommunicationLikable and CompetentCongruent and Open
Second-Order Factor II: Openness
Scale I Factor IIIScale II Factor IIIStale III Factor IIScale IV Factor IScale IV Factor II
Facial EngagementPatienceConcisenessLikable CompetenceDirecting
Second-Order Factor III: Dominance
Scale I Factor II Dominance
Scale II Factor II Body Tension
Scale IV Factor II Directiveness
Second-Order Factor IV: Relaxation
Scale II Factor IV Relaxation
Scale IV Factor III Congruent Openness
Second-Order Factor V: Casualness
.85
.85
.89
.62
.59
.76
.51
.46
-.48.43
-.74-.79-.62
.86
.66
Scale I Factor Vi Appropriateness of Head Gestures -.66
Scale II Factor V Casualness .76
377
86./

Second Order Factor VI:
Scale I Factor VScale III Factor II
Second-Order Factor VI:
Scale I Factor IVScale II Factor III
Confidence
Self-ConfidenceConciseness
Calmness
CalmnessPatience
.82
-.63
.92
.51
The similarity of factors across scales implies that the affectivevariables which are consistently important in the response of one
person to another are those dealing with: attentiveness or re-eponsiveness to another; need to control the other; confidence,calmness, relaxation, casualness, or expression of positive feelings
ihgut the self. The complex relationshiptbetween these areas havebeen dealt with repeatedly in myriad theories of behavior. Our
task here was to affirm'or reaffirm the existence and operation ofthese variables'in a relatively natural setting, based on a rela-tively natural affective response,
It was encouraging to find affective factors in response to ateaching nituation which were so similar to factors-found to beimportaht in therapy and other "helping" roles: genuiness, ac-
curate empathy, nonpossessive warmth (Truax and Mitchell, 2971)and the issue of interpersonal control of relationship (Haley, 1971.)According to research on such interperson skills in relation to,the process and outcome of, therapy, it has been shown that theseaffective areas of behavior can be brought under voluntary control.Affective skills can be taught because they, in themselves, areresponses which can be modified by feedback. The first require-
ment mentioned in the.introduction for voluntary control of af-fective style has been tt; a technique for feedback as to whatmessages are being pred ately perceived by others from one's
behavioral cues.
Once it is accepted in teaching (as in other fields) that nonverbalcues are as important as verbal cues, specific changes in the in-
stitution can 'be initiated. The scope of changes implied and theirrelation to behavioral theories introduced at the beginning ofthis paper will be fully discussed in a second working paper, as
a sequel to this study. For the present, we can only report on
the degree of success in predicting from attitude constellations(bias) to nonverbal cues.
Third Analysis: Initially, it was intended to have area super-
visors turn in rankings for each of the Ss. These rankings
were to serve as additional criterion measures against which the
predictive power of the test variables could be checked. These
would represent the "affective style" of the S as judged by an
378

official evaluator over a period:of time. It was feared by some
that one sample of videotaped behavior would be misleading, al-
though there is research indicating that people habitually
exhibit only a limited variety of affective communication styles
across situations (Ekman, Friesen, and Ellsworth, 1972). Due to
thepressures of the end of the school gear, etc., not all rankings
were obtainable, however, and could not be analyzed.
In the canonical analysis (which is roughly a factor analysis Of two
sets of variables rather than one set of variables) relationships
were determined between patterns of test data and patterns of ob-
servation ratings. Such predicting from patterns to patterns isdifficult to interpret, but logically more realistic than pre-
diction from one variable. Certain strong trends did appear, re-
volving mostly around the issues of affiliation tendency, self-
disclosure or openness, and experimentalism. Predictions are re-
ported from measures of these traits only to the nonverbal areas
of body gestures, vocalizations, and general impression. Statis-
tical complications indicated the omission of Scale I, Facial
Expressiveness.
Canonical Correlation Pattern I
DBF .78 Closed Body Orientation .95
CW (Tot) .64 Infrequent Touchingt .96
PB .54 Genuine Touching .88
Involved .81
Sim -.81 Moving .63
Intense .58
Straight Neck Position .50
One pattern emerging from the analysis seemed to describe the ex-
perimental or abstract person as explained in the introduction.
High scores on measures of experimentalism (PB), disclosure to best
friend (DBF), and flexibility (CW Tot), with,a lower score onfluency (Sim) correlated with nonverbal cues of infrequent, but
genuine touching; active, involved, but physicilly closed orienta-
tion; and straight head angle for listening, which is indicative
of a symmetrical relationship rather than an approval-oriented
or authoritarian one. In other words, a .teacher who was fairly
open, flexible, curious, unafraid of change, etc., would be ex-
pected to convey interest, involvement, genuineness, without
necessarily using physical closeness. From the theoretical
backgrounds provided by both Harvey and Brown, this would be
expected.
Canonical Correlation Pattern 2
DBF -.56 Sensitive
DCA -.40 Aloof
379
3.012.26
continued

Comfortable 1.67
Closed 1.60
Trusting 1.28
Misleading .99
Another pattern showed that a person who was low on self-disclosureto both best friend (DBF) and caual acquaintances (DCA) was seen
overall as aloof and closed about themselves in general,,and some-what misleading, but still sensitive, comfortable, and trusting.This would not necessarily mean that a low-discloser was, in fact,sensitive, comfortable, and trusting.
Theoretically, Jourard might disagree. It does suggest that a lot
of verbal output is not the only way to create a positive impact;that people tend to attribute such qualities to one who is rela-
tively quiet. (This possibly stems from such folk culture as
"silence is golden," or "still water runs deep.") Other hypotheses
could follow the line of reasoning that low disclosers typicallyexperience situations where they learn to behave in-ways which aregenerally interpreted to be sensitive, comfortable and trusting.On the other hand, low disclosers mightactually be more sensitive,'comfortable and trusting, and therefore not as anxious to manipu-
late the environment verbally. Such causal relationships cannot
be examined here. The most that can be said is--for whateverreason--low disclosers were seen in this way; or, conversely,people who were seen in this way were frequently low-disclosers.
Canonical Correlation Pattern 3
CW (I) 1.22 Inappropriate 3.01
DCA .60 Disruptive 2.65
Sim .53 Effective To ping 2.01
Adequate Touching 1.88
DBF -.55 1.39StiffGenuine Touching 1.26
Ma.iipulative 1%09
Contrast was provided by a third pattern, which indicated the corol-
lary of the low-disclosure patterns. Those with high scores on
disclosure to casual acquaintances (DCA), high verbal-fluencyscores on two measures (CWI, Sim), but low disclosure to best
friend (DBF) were rated as being able to use physical touch ade-
quately, effectively and genuinely at times, but also using itdisruptively, as well as using contextual cues of distance, body
lean, orientation, and movement in an inappropriate, manipulative,
stiff manner. This suggests some inconsistency in the ability to
read environmental cues (possibly the "babbling brook" syndrome).
It might possibly suggest,, also, a homeostatic relationship be-
tween the verbal and nonverbal channels. Low verbal contact results in
high nonverbal contact and vice versa; a purposeful inconsistency
between messages on different communication channels might exist.
3 80

Canonical Correlation Pattern 4
DCA .74 Not likable 1.34
'Affil .59 Directing 1.09
Trusting .76
CWI -1.07 Rigid .75
T Prac -.55 Patient .62
Aloof .61
Misleading .59
To complicate conclusions, a fourth pattern emerged, simigar to the
casual high-disclosure pattern just reported, but with the addition
of high affiliation tendency (UM), high fluency (Sim), lowexperimentalism (T Prac), low flexibility (CWI), and low disclosure
to best friend (DBF). In this case, affective perceptions of the
S were not at all clear, being described as patient, but rigid;
trusting, but also aloof; especially directing, misleading, and
unlikable. Apparently, too much glibness combined with the need
to be accepted and low flexibility and experimentali is a,disas-
trous affective combination, resulting in much chann 1 discrepancy
and predominantly negative impact.
Canonical Correlation Pattern 5
DBF .62 Enjoying Self 1.64
Affil .61 Unnecessary Verbalize ion 1.19
Disruptive Verbalizations .98
Emp -.67 Confusing Verbalizations .53
Negative Verbalizations .53
Canonical Correlation Pattern 6
Effective Touching.
Affil .74 Tense (Symmetrical) BodyInappropriate Touching
Emp -.86 Relaxed Body PositionDisruptive DistanceCool Distance
2.60
Position 1.781.611.541.401.02
A possible explanation for the negative effect of such a combination
might derive from the final two patterns (5 and 6), both of which
combined high disclosure and high need for affiliation with low
empathy. Verbalizations of Ssiwith.this pattern were responded
to as unnecessary, negative, confusing and disruptive,, although
raters thought the S was enjoying himself. Body gestures wereagain inconsistent, with manner of touching being rated both as
effective at times and inappropriate at times; distance rated as
disruptive and cool; and,body position rated as both relaxed and
tense. Again remembering that causal inferences cannot be drawn,
it might be hypothesized that this represents a situation where
motivation to meet a given need (affiliation) is so strong that
381
elti 0
1.

AVE81.1GES 0) TUT scams FOR Stir*ReASIR SPECIAL EDUCATION
Figure 1
Affiliaticat jaasittvItv S,q kW Mask 11122i1 DEW If M121Lja Flax. Ate. t. Ia. F1.1 Id. F1.2
* 42.00 1.38 34.1311.30 19.06 23.31 24.06 22.68
19.19 28.88
A016
ID 33.47
u-17
35.17
-11.29
-29.30
45.06
311.30,
18.18
13.80
26.8.1
27.80
11.90
13.17
19.33
18.67
30.12
26.33
23.17
19.'10
16.94
18.33
DF 25.71
nal
6.14 54.86 17.29 26.40 14.57 18.43 27.58 18. 15.57
WEAL1 36.22 -6.39 48.85 17.83 27.63 12.28 19.09 26.87 22.28 18.90
SD* 24.16 20.83 23.98 9.39 3.05 6.60 4.40 6.45 10.31 3.12
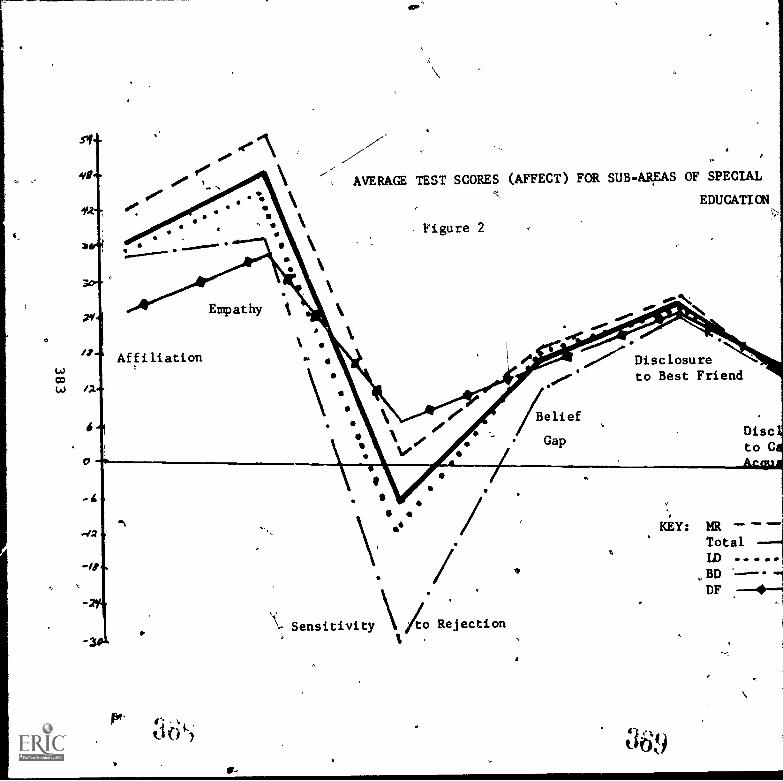
AVERAGE TEST SCORES (AFFECT) FOR SUB-AREAS OF SPECIAL
EDUCATION
Figure 2
a
Empathy
/ P
L.)coL.) /2
Affiliation
.42
-/I
0
Sensitivity /o Rejection
KEY: MRTotal
MN.
ID . .BDDF

AVERAGE TEST SCORES (AFFECT) FOR SUB-AREAS OF SPECIAL
EDUCATION
Figure 2
Apathy.0`
Disclosure')
to Best Friend
Belief
GapDisclosureto Casual
111
\Sensitivity xo Rejectionr
KEY: MR --TotalLDBD -r-.DF

3o
25
-40
4-
A
KEY: u...)
TotalMRBD
DF
d111. - NNWPONIAN
VerbalFlexibility
AssociationalFluency
IdeationalFluency
(Creation of Words)
......1111
14F
(S
AVERAGE TESTS SCORES (VERBAL) FOR SUB-AREAS OF SPECIAL EDUCATIO
Figure 3
,J

KEY: LD 0 0
'TotalMRBDDF
O.. amp. MEM
AssociationalFluency
111999.999
Ideational
VerbalFluency
Flexibility(Creation of Words)
IdeationalFluency(Similies)
AVERAGE TESTS SCORES (VERBAL) FOR SUB-AREAS OF SPECIAL EDUCATION
Figure 3

to
0
20
3 c, 2.
5b -24.14Empathy
Affi liation
s> -.t 3.91?
Individual Feedback Chart (Example Only)
Figure 4
KEY: Group Norm
Individual
27 6 3-
Belief ao ,I3
Gap DI7akre/743 to Best
sh-1;39 Friend Disc
Cas.11-4.
\I X
k
IC
- o
fSk 2 0. fr
/7
Sensitivity to Rejection
")f

iN
\
Pit rs-sD -.t 7.98
Individual. Feedback Chart (Example Only)
Figure 4
Empathy
_ KEY: Group Norm
Individual. Score
2%163
Belief le
Gap // /743
sb-f.39
DT.Z.A.ostie
to DistFriend
Affi liation
-44 srsh 20 vs"
\/7
Sensitivity to Rejection
Disclosure tflo
Casual Acquintance
(

TABLE 1
Correlation Table for Written Test Material
AFFIL
AFFIL
.74
EVP S-R T PRAC P BLF F CA TOPICS WA SIMI
EMP .49 .71
S-R .12 .16 .65 ,
T PRAC .20 .16 -.09 .61
P BLF .05 .09 -.38 .46 .70
BF .21 .31 .03 .07 -.15 .77
to CA -.05 .08 .03 .19 .00 .19 .81
a TOPICS -.07 -.22 .00 .04 .08 -.17 -.12 .63Ch WA -.03 .02 .23 .39 .33 .04 .11 -.09 .61
SIMIL -.14 .08 .13 -.05 -.03 .27 -.31 .21 -.09 .6
CW1 .09 .17 .13 .17 .13 .16 -.15 .29 .39 .3
CW TOT .05 .10 .10 .11 .03 .18 -.17 .43 .28 .4

TABLE 1
Correlation Table for Written Test Material
FIL
.74
.49
.12
.20
.05
.21
.05
.07
.03
.14
.09
.05
EMP
.71
.16
.16
.09
.31
.08
-.22
.02
.08
.17
.10
S-R
1..65
-.09-.38.03
.03
.00
.23
.13
.13
.10
T PRAC
.61
.46
.07.,
.19-
.04
.39
-.05.17
.11
P BLF
.70
-.15.00.08
.33
-.03.13
.03
BF
.77
.19-.17
.04
.27
.16
.18
CA
.81
-.12.11
-.31-.15-.17
TOPICS
.63
-.09.21
.29
.43
WA
.61
-.09.39
.28
SIMIL
.69
.33
.49
CW1
.77
.72
CW TOT
.81
t..i

Table 2
Rotated Factor Matrix for Written Test Material
Factor 1. Factor 2 Factor 3 Factor 4 Facto
TIB -.25 .57* -.22 .10 -.08
AFFIL .01 -.11 .65* .01 -.01
EMP -.05 .04 .73* -.13 -.39
S-R -.26 -.71* .23 .18 .05
T PRAC -.06 .49* .44* .40 .09
P BLF -.02 .79* .21 -.03 .19
lolOD
BF
CA
,.16.15
-.09
-.02
.18
-.13
.15
..86*
-.83-.20
...I TOPICS -.60* -.02 -.13 -.03 .51
WA -.36 .56* .07 .40 .03
SIMIL -.55* -.04 -.14 -.46* -.38
CW1 -.84* .17 .16 .04 -.07
CW TOT -.89* .00 .00 -.12 -.09
Eigenvalues 2.67 2.14 1.90 1.19 1.05
Accumulative PercentVariance Accounted ..
for 20.55 37.04 51.67 o0.62 66.9
Accumulative percentcommon variance 29.83 53.76 14.99 ((.:&.27 100.0

alueslative Percent
nce Accounted
lative percenton variance
Table 2
Rotated Factor Matrix for Written Test Material
Factor 1 Factor 2 Factor 3 Factor 4 Factor 5
-.25 .57* -.22 .10 -.08
.01 -.11 .85* .01 -.01
-.05 .04 .73* -.13 -.39
-.26 -.71* .23 .13 .05
-.06' .49* .44* .40 .09
-.02 .79* .21 -.03 .19
-.16 -.09 .18 .15 -.83*
.15 -.02 -.13 .86* -.20
-.60* -.02 -.13 -.03 .51*
-.36 .56* .07 .40 .03
-.55* -.04 -.14 -.46* -.38
-.84* .17 .16 .04 -.07
-.89* .00 , .00 , -.12 -.09
2.67 2.14 1.90 1.19 1.05
20.55. 37.04 51.67 00.82 68.90
29.83 53.76 i4.99 100.00

rtz:4 ,S;; ::
,ot54::=V4U
Ast:;z5==',1,;l11.`.7T.F.8,1.t.z gr.;11
zz-izit=ef.:e2v1",17-4=7-"-,"
388

_

Table 4
Rotated Factor Matrix for Observation Scale I
1 .85*2 .88*3 -.79,
4 .73*
5 .74*
-.09
-.0»
.02
-.07
-.09
.30
-.35
-.10b -.73* .13 .327 .10 .79: -.10 .
8 -.15 .78, -.22.9 -.19 -.86* -.10 \
10 .11 .50, -.0611 -.03 -.83" .1012 -.28 .50 * .0, 1
13 -.62* .31 .10 1
14 .81* .1- -.3615 .90* .23 -.0116 -.84* -.02 .21
17 -.65* -.12 .0918 .70* .10 -.24 --_
19 .00* .lo -.0820 .27 .19 -.75*21 -.26 -.Of .9222 .41 .08 -.85*23 -.63* .i2 .5724
_
.83* .05 -.17
25 .82* . .3c -.2726 .35 .,- -.53,27, .14 .1u -.4028 .24 .22 -.2129 .44 .0u -.14
Eigenvaluell:
13.65 3.94 2.31
Accumulative percent accounted for:
47.07 60.65 68.60
Accumulative percent comron varimace:
57.6 83.97
-.07 .13 .27,
-.19 .03 .13
.33 .02 -.21-.25 .08 .36
-.38 .05 -.16.06 -.07 -.25.11 .43 .14
-.05 .23 .12
-.01 -.01 -.18-.07 .77*
.02
-.07
.20 .08
.58* -.18 -.24-.28 -.21 -.26.24 -.02 .07
-.101
.07 . .- 10
-.06 -.12.48* .03 .03
.31 .12 .25-.10 .66* .17
-.06 .15 .41
.13 -;07 -.14-.07 -.02 .09
.15 -.21 -.19-.29 .08 .18
-.13 .08 .00
.,-.24 -.30 .50*
L.00 -.06 .79*
9*\ /.6 .04 .10
.11 -N17 .73*
1.58 1.16 1.05
74.0. 78.07 81.70
.65 95.56 100.00

Table 5
Correlation Table foi the Twenty -Three Items of Observation Scale II,,
1
.6o
2 3 8 9 10 11 12 13 14 15' 16 17 18 19
2 -.71 .8o3 .77 -.72 .8.
-.90 .82 -.7o .4»5 .84 -.78 .84 -.83 .870 ,42 -.So .58 -.53 ,,o8 .8-7 .70 -.53 .60 -.08 .80 ,7"8 -.68 .65 -.77 .lo -.80 -.85 .92
9 -.72 -.69 .70 -.73 .86 .82 .88 -.90 .88
10 .49 -.52 .33 -.45 .61 .72 -.68 .67 .84
11 ,37 -.47 .00 -.40 .o4 .33 .34 -.62 .55 .36 .02
12 -.24 .46 -.05. .33 -.07 .1- -.0o -.09 -..10 .17 /737
13 .65 -.54 .84 -.62 .75 .70 -.83 .83 .01 .64 /.07 .95
14 -.65 .59 -.81 .63 -.80 -.77 ..79 .89 -.85 -.73 -.ob,/ -.14 -.92 .91
15 .67 -.67 .84 -.72 .75 .66 . . -.8b .80 .b1 -.04 .88 -.87 .87
16 .56 -.64 .7o -.o2 .75 .78 .78 -.89 .88 .61 65 -.00 .90 -.89 .91 .91--
17 -.40 1.27 -.44 .31 -.38 -.28 -.51 .33 -.44 -.39 / -.19 -.01 -.56 .50 -.52 -.44 .84
18 -.39 .47 -.58 .36 -.54 -.26 .41 -.41 -.34/ -.40 .09 -. 511 .33 -.64 -.56 .64 .77
19 -.11 .19 -.25 .11 -.16 -.10 -.21 .22 -.35 - -.37 .26 -.50 .30 -.36 ..49 .10 .19 .89
20 .49 -.54 .68 -.57 .64 .62 .A0 -.71 .61 .51 .54 .24 .51 -.59 .58 .58 -.17 .22 .08
21 -.07 -.19 .01 -.05 .17 .32 .08 -.13 .15 (.42 .03 -.04 .08 .08 .17 .25 .00 -.11
22 -.04 -.19 .04 -.fll .18 .i6 .21 -.21 .13 .58 .23 .28 .02 -.17 .11 .13 -.04 -.04 .25
23 .59 -.06 .74 n08 .67 .60 .62 -.71 .53 .46 -.08 .14 -.7u .73 .64 -.37 -.55 -.20

.7,7+771'
5
y
Table 5
Correlation Table for the Twenty-Three Use's of Observation Scale II
-9 10
.76 .94
4
004 -.83 .87.../
436 ..53 0001,
.440 ..60 .80...r. .74
.27 .76 -.80 -.83 .92
76 -.75 .86 .82 .88 -.90 .88
.33 -.45 '.61 .72 .o3 -.68 .67
.60 -.40 .04 .33 .39 -.02 .55
.05 .33 -.07 .1- '.1, -.00 -.09
.44 -.62 .75 .70 79 -.83 .83
Al .63 -.80 ..77, 1..74 .89 -.85
.44 -.72 .75 .66 I .71 -.86 .80
..76 -.02 .73 .18 I .78 -.89 .88
44 .31 -.38 -.28 ) -.31 .33 -.44
.Si .36 r.54 ...26) -.4 .41 -.41
.25 .11 -.16 -.to -.21 .22 -.35
Ai .4.37 .64 .62 .60 -.71 .61
.01 -.05 .17 ' .72 .08 -.13 .15
.04 -.01 .18 6 .21 -.21 .13
4 -.68 .67 .60 .62 -.71 .62
1
;84
'36
1
- 1061
- 73.61
.61
-.39-.34-.04.51
.42
.58
.53
IL 12 13 14 15 16 17 18 19 20. 21 22 23
I
.62
.17 .87
.64 .07 .95
-.66 -.14 -.92 .91
.55 -.04 .88 -.87 .87
.65 r.00 .90 -.89 .91 .93
-.19 -.01 r.56 .50 -.52 -.44 .84 .-
-.40 .09 -.58 .53 -.64 -.56 .64 .77
-.37 .26 -.50 .30 -.36 -.49 .10 .19 .89
.54 .24 .51 -.59 ..58 .58 -.17 .22 .08 .78
.03 -.04 / .08 .08 .17 .25 .06 -.11 .03 .81
.23 .28 .02 -.17 .11 .13 -.04 -.04 .25 .36 .38 .80
.46 -.08 .74 -.70 .73 .64 -.37 -.55 -.20 ',- .55 .15 .17 .r.l.

Table 6
RotSted Factor Matrix for Observation Scale II
1 -.79* ,14 -.38 -.14 .22
2 .71* .20 .54 .02 -.16
3 -.85* .04 -.12 .08 .32
4 .84* -.03 .45 .10 -.10
5 -.88* -.13 -.18 -.00 .22
6 -.75* -.48 .16 .12 .08
7 -.83* -.14 .11 ..08 .26
8 .92* .18 -,05 -.13 -.14
9' -.87* 0 -.17 -.09 .22 .20
10 -.56* -e65* .03 -.06 .31
11 -.67* -.06 2 .26 .31 .06
12 -.05 -.06 ' -.92* -.15 -.01
13 -.77* -.06 .07 .40 .43
14 .82* .16 -.12 -.23 -.37
15 ...77* -.10 -.07 .24 .44
16 -.79* -.18 .03 .42 .31
17 .25 ...01 -.04 .03 -.88*
18 .31 .02 ,12 -.12 -.81*
19 .16 -.05 .13 -.91* -.06*
20 -.81* -.11 .21 -.25 -.05
21 -.01 -.83* -.19 .22 ..20
22 -.14 -.77* .26 -.33 .05
23 ...69* -.17 -.7 .05 .34
Eigenvalues12.78 2.27 1.64 1.45 1.15
Accumulative percent of variance accounted for:
55.55 65.42 72.57 78.87 83.89
Accumulative percent common variance66.22 77.98 86.51 94.02 100.00

W"
N.
Table 7
Correlation Table for the Fifteen Items of Observation Scale III
1 2 3 4 5 6 7 8 9 10 11 12
1 .802 .48 .433 -.52 -.27 .574 .17 -.05 .35 .815 .13 -.06 .39 .92 .906 -.23 -.03 -.31 -.77 -.85 .877 .10 .15 -.43 --.63 -.76 .81 .798 4.02 -.08 .37 .50 .66 -:71 -.79 .609 -.16 -.22 .45 .72 .85 -.81 -.90 .7510 '.04 .12 -.56 _-.78 -.86 .80 .84 -.8111 .08 -.05 .39 .74 .77 -.74 -.76 .6312 -.46 -.36 .41 .28 .27 -.22 -.38 .1613 -.05 .19 -.52 -.91 -.88 .76 .70 -.5914 .10 -.04 .53 .85 .81 -.82 -.70 .6015 -.71 -.41 .29 -.41 -.37 .49 .04 -.09
.87
-.83
*.86
-.74 -.79 .74.51 -.29 .37 .55
-.79 .78 -.73 -.32.71 -.78 .76 .26-.04 .19 -.28 .42

Tible 7 .
Correlation Table for the Fifteen Items of Observation Scale III
2 3 4 5 6 7 8 9 10 11 12 13 14' 15.
.432 -.27 .577 -.05 .35 .81
-.06 .39 .92 .90-.03, -.31 -.77 -.85 .87
0 .15 -.43' -.63 -.76 .81 .792 -.08 . .37 .50 .66 '-.71 -.79 .606 -.22 .45 .72 .85 -.81 7.90 .75 .$7
.12 -.56 -.78 -.86 .80 .84 -.81 -.83 .86..05 .39 .74 .77 -.74 -.76 .63 -.74 -;79 -.74
6 -.36 .41 .28 .27 -.22 -.38 .16 .51 -.29 .37 .555 .19 7.52, -.91 -.88 .76 .70 -.59 -.79 .78 -.73 -.32 .830 -.04 .53 .85 .81 -.82 -.70 .60 .71 -.78 .76 .26 -.91 .83
-.41 .29 .-:41 -.37 .49 .04 -.09 -.04 .19. -.28 .42 .26 -:40 .83

e
TABLE 8
ROTATED FACTOR MATRIX FOR OBSERVATION SCALE III
1 2
l '.11 .89*
2 -.06 .66*
3 .47
4 .89* .9995* .04. 1.
6 -.92* -.15 'I,
7 -.86* .23 :
8 .76* -.12 '
9 .88* -.29 ,
10 -.92* .14
11 .86* -.0312 .31 -.47*13
,..-.91* Ati'
14i
.91* .03
15 -.36 -.84*
Eigenvalues8.42 2.87
Accumulated Percent of Variance Accounted for56.10 . 75.22
Accumulated Percent of Common Variance74.58 100.00

CORRELATION TAME FOR THE NINETEEN ITEMS OF OBSERVATION SCALE IV
1 2 3 4 5 6 7 8 9 10 11 12 3 14 15
1 .732 -.49 .773 .54 -.54 .934 -.29 .53---;04-5 -.48 .69 -.36 .71 .84
40 6 .14 -.48 -.00 -.68 -.80 .81
a. 7 .03 -.51 -.05 -.65 -.65 .79 .848 -.62 .59 -.26 .53 .73 -.68 -.55 .849 .49 -.34 .30 -.33 -.40 .38 .24 -.69 .77,
10 -.60 .72 -.46 .58 .76 ..62 -.57 .81 -.66 .8611 .40 -.57 .12 -.56 -.63 .65 .65 -.76 .58 -.71 .8212 -.42 .65 -,29 .52 .80 -.77 -.68 .82 -.51 .75 ,-.75 .7413 -.54 .65 -.35 .64 .76 -.67 -.70 .76 -.60-- .82 -.84 .67 .8314 .43 -.61 .27 -,73 -.80 .77 .77 -.70 .45 -.76 .74 -.77 -.84 .8415 -.48 .64 -.11 .58 .65 -.64 -.57 -80 -.56 .70 -.86 .77 .66 -.72 .7916 .49 -.74 .36 -.61 -.73 .67 .64 .70 .57 .57 -.80 .88 -.73 -.90 .8117 .66 -.71 .29 -.66 -.74 .61 .58 -.75 .53 -.80 .69 -.67 '-.79 .70 -.7118 -.60 .72 -.44 .59 .74 -.64 -.55 .76 -.61 .90 -.71 .70 .83 -.78 .7319 .07 420 .51 .55 .42 -.62 -.65 .40 -.14 .35 -.54 .45 .46 -.34 .51

TAKE go
CORRELATION TABLE FOR THE NINETEEN ITEMS OF OBSERVATION SCALE IV
694851593472
57'
6565
6164747172
'20
3
.93
.04-.36-.00-.05
-.26.30
-.46.12
-.29-35.27
-.11
.36
.29-.44.51
4
.6f.
.71-.68-.65..53
-.33.58
-.56.52.64
--.73.58
-.61-.66.59.55
5
:84-.804.65.73
-.40.76
-.63.80.76
-.80.65
-.73-.74.74
.42
6
.81
.79
-.68.38
-.62.65
-.77-.67
.77
-.64.67
.61-.64-.62
7
.84-.55.24
-.57
.65
-.68-.70.77
-.57
.64
.58
-.55-.65
8
.84-.69.81
-.76
.82
.76-.70.80.70
-.75.76.40
9
.77
-.66
.58
-.51-.60.45
-.56.57
.53-.61-.14
10
.86
-.71.75.82-.76
.70
.57
-.80.90.35
11
.82
-.75-.84.74
-.86-.80.69
-.71-.54
12
.74
.67
-.77.77
.88
-.67'
.70
.45.
13
.83-.84.66
-.73-.79.83
.46
14
.84-.72
-.90.70,
-.78-.54
15
.79
.81-.71.73.51
16
.83
.78
-.85-.43
17
.77
-.82-.42
18
r'
.84
.39
19
.84
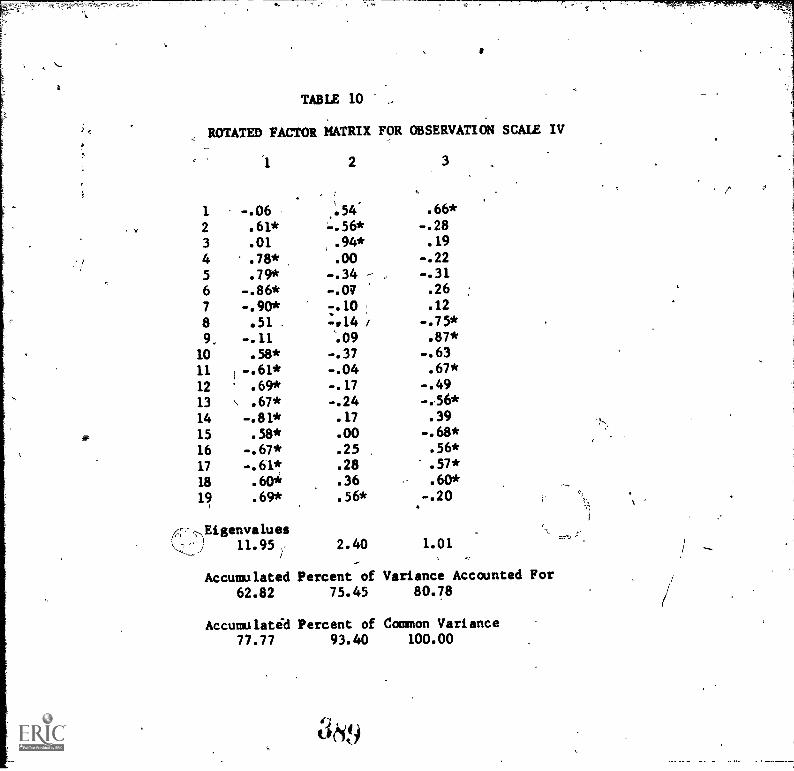
;
TABLE 10
ROTATED FACTOR MATRIX FOR OBSERVATION SCALE IV
1 -.062 .61*
2 3
.66*
-.28
3 .01 .94* .19
4 .78* .00 -.22
5 .79* -.34 -.31
6 -.86* -.0? .26
7 -.90* -.10 .12
8 .51 , -014 -.75*
9., -.11 .09 .87*
10 . 58* -.37 -.63
11 1 -.61* -.04 .67*
12 .69* -.17 -.49
13 \ .67* -.24
14 -.81* .17 .39
15 . 58* .00 -.68*
16 -.67* .25 .56*
17 -.61* .28 .57*
18 .60* .36 .60*
19 .69* .56* -.20
.;7',;,Eigenvalues
11.95y 2.40 1.01
Accumulated62.82
Accumulated77.77
Percent of Variance Accounted For75.45 80.78
Percent of Common Variance93.40 100.00

TABLE 11
CORRELATION TABLE FOR THE OBSERVATION SCALE FACTORS (16 FACTORS)
SIF1
'S1F1
.78
S1F2 S1F3 S1F4 S1F5 S1F6 S2F1 S2F2 S2F3
S1F2 .00 .65
S1F3 .00 .00 .64
.S1F4 .00 .00 -:00- .86
S1F5 .00 .00 .00 -.00 .76
S1F6 .00 .00 .00 .00 .00 .69
S2F1 -.73 .02 .25 .18 -.28 -.26 .86
S2F2 -.12 .26 .05 -.04 .03 .14 .00 .74
S2F3 .13 -.28 .20 .31 -.21 -.14 .00 .00 ,..78
S2F4 -.05 .15 .23 -.16 -.28 .18 .00 .00 .00
a S2F5 .24 -.04 -.04 -.12 .07 -.09 .00 .00 .00
S3F1 .64 .05 -.07 -.02 -.10 .I5 -.63 -.01 .32
S3F2 .07 -.17 .24 .07 -.32 -.34 .22 -.40 .39
S4F1 -.40 -.05 .25 .04 -.11 -.17 .48 .09 .02
S4F2 .26 .34 .21 -.35 -.05 .11 -.24 .46 , .i4
S4F3 -.09 .06 .01 -.05 .09 -.50 -.12 .12
S2F4 S2F5 S3F1 S3F2
.85
.00 .68
.26 .19 .89
.17 .01 .00 .80
.24 -.10 -.58 .37
.03 -:03 .35 .08
.50 47 .64 .09'

TABLE 11
1011 TABLE FOR THE OBSERVATION SCALE FACTORS (16 FACTORS)
81F2 S1F3 S1F4 IS1F5 S1F6 S2F1 S2F2 S2F3 S2F4 S2F5 S3F1 S3F2 S4F1 S4F2 S4F3
.65
.00 .64
.00 .00 .86
-.00 .00 .00 .76
.00 .00 .00 .00 .69
.02 .25 .18 -.28 -.26 .86
.26 .05 -.04 .03 .14 .00 --=-74
-.28 .20 .31 -.21 -.14 .00 .00 .78'
.15 .23 -.16 -.28 .18 .00 .00 .00 .85
-.04 -.12 .07 -.09 .00 .00 .00 .00
.05 -.07 -.02 1-.10 .15 -.63 -.01 .32 .26
-.17 24 -.17 -.32 -.34 .22 -.40 .39 .17
-.05 .25 .04 -.11 -.17 .48 .09 .02 .24
,.34 .21 -.35 -.05 .11 -.24 .46 .14 .03
-.09 .06 .01 -.05 .09 -.50 -.12 .12 .50,
:68
.19 .89
.01 .00 .80
-.10 -.55
.37 .71
-.03 .3 .08 .00 .90
.27 .64 .09 .00 .00 .88

the very skills required (empathy) to achieve the need are
overlooked. Or possibly the ambivalence inherent in a strong de-pendency on affiliation with others is coded through low empathyand inconsistent verbal messages.
In short, this section seemed to indicate that the written measures
of experimentalism, disclo re, affiliation and empathy had the
most predittive value, eadvice to be drawn from the resultsmight be stated-ai ep'your mind open and your mouth shut if youwant to have a positive affective impact onLothers."-Mbreseriously, the data do seem to.call into question some of therecent propaganda advocating closer physical contact and sharingof self-revelation as techniques to enchance affective communication.If these ratings are to be believed, the naive observer prefersmore self-containment and genuineness with his warmth. The mostchannel discrepancy was found in combinations of high needs foraffiliation with low experimentalism and openness, or low empathy.Possibly this rePresentear"belief gap" or ambiguity in feelingsabout others whiCh4lessens the person's affective impact.
In summary, we.have found that (1) tudents in different specialtyareas have differing profiles on ce tain affective measures,-at least
to some extent;, 2).-factors ewer ing from written and behavioraldata corroborate' other findings Gish abian, 19N) that affectivevariables are influential in three- in areai,orresponsivenessto others,' power or control over oth rs, and positiveness--especi-ally about the self; /and finally (3) atterns which combine a ; t
degree of self-disclisure with a degr e of open-mindedness 1
(experikentaliam) an degrees of affil ation and empathetic todencies best predict the affective response Created in others by
one's nonverbal behavior. With this, e have fulfilled these cond.requirement mentioned in the introducti n for the voluntary controland training of afiectir behavior: \a preliminary insight is 'to
patterns of bias whichdistort the seeding of messages. The I
needs at this point are for further explanation of interrelation-ships among these variables, and further study of their effectsin an ongoing behavioral situation, both* which are planned.
ti
397

TABLE 12
.
ta
co
ROTATED MATRIX OF SECOND-ORDER OBSERVATI( N-SCALE FACTORS
#
FACTOR 1 FACTOR 2 FACTOR 3 FACTOR 4 FACTOR 5
S1F1 '.85 .05 .051 -.03 .22
S1F2 -.05 -.24 7.7k.._.,. -.12 .12S1F3 -.12 .76 -.06 -.17 -.01'S1F4 -.07 -.02 .04 .03 -.02S1F5 .06 .10 .07 .23 .11S1F6 /
).17 -.09 -.12 \ -.36 -.66
S2F1 -.85\
.10 ',N-.45 .03 .16S2F2 -.05 .18 -.79 .04 -.12s2Faf .51 .a .20 -.02S2F4, .91 .14 -.07'-
.28
-.86 -.08S2F5\ .18 -.05 -.05 -.17 .76S3F1 .89\ -.02 -.12 -.21- .01
,...
S3F2, ° -.05 \ .46 .36, .01 .23S4F1 -.62 \ .48 .04 ) -.27 .10S4F2 .35 .43 -.62 / .17 -.11S4F3 .59 .14 .16 / -.66 .22
Eisen- 3.39 2.36 1.9/; 1.42 1.27valuesAccumulated percent of variance accounted for
.21.18 35.91 48.00 56.91 64.84
Accumulated percent of common variance27.15 46.03 , 61.52 72.94 83.11
//
:
%-,49 ')J
FACTOR
.
-.2
g.18.0
- .6444
. .17
...',9
1.06
71..58
91.73

TABLE 12
iOTATED MATRIX Of SECOND-ORDER OBSERVATICW SCALE FACTORS
FACTOR 1
Z/85.05.12'
j-.07/ .06
''
/
.17
-.85
-.05
.01
. .28
.18
.89
r.05.-.62.35
.59
.39
FACTOR 2 FACTOR.3 FACTOR 4 FACTOR 5
.05 .05 -.Q3 .22-.24.76
-.74 -.12 .12
. -.06 -.17 -.01
-.02 .04 ... .03 -.02\ .10 .07 .23 .11
, 1 -.09 -.12 -.36 -.66 ,
.10 -.05' .03 .16
.18_ 79 .04 .-.12
.14 -.07 -.86Z
-.08.51
1
.09 .20 -.0
-.05 -.05 -.17 .76 '
-.02 -.12 -.21 .01
.36 .01 .23
.48, .04 -.27 .10 (
.43 -.62 .17 -/11
.14 .16 -.66 .22,
np
3 , 2.36 1.95, 1.42 1.2
FACTOR 6 FACTOR 7
.00 .02
.11 409
-.05 .00
01 -.92,
.82 .06
-.29 -.03
.26 -.18
-.23 -.08
.11
.37 -.51
.25
-.18 .00
.17 -.09
.63 .04
.10 .05
.17 .38
-.03 -.08
1.08 1.03
A 1
slated percent of variance accountekfor s'21.18 35.91 48.00' 156.91 64.84 71.58 78.02
lated percent of common variance 0 z,
27.15 46.03 . 61.52 72.94 83.11 91.75 100.00
t.,t i

, 1\__REFERENCES
/ -
Brown, Bob IttWOAVILOOlIA.,12.1k20,11 New York:22'Harper and Row, 1968.--
, Paul, Friesen, WV., and Ellsworth, Phoebe.. Emotion in
the Human Fate:: Gtidelines Research and Inte ration ofFindings. New York: Tress, Inc., 1972..
,
Gordon; Thomas. Parent*factiveness Training. New York: Peter
H. Wyden, Inc., 191.0.
H*vey, 0.J., Hunt .E.110 and Schroeder, H.M. Conceptual; Systems
and Pere na t Orl,.ization. New York:- John Wileyl.and Sons,
Inc., 4.96.
\
. '
Jourard, Si ney M. Selfi-Disclosure: An Experimental Analysis of -:.
the'T ans arent Self. New York; John Wiley and Sone, Inc.,
1971:
Mehrabian, Albert. NOnVerbal Communication. Chicago: Aldine-
Atherton; Inc., 1972.
Randolph, ,Norma, Howe, W.!, and Achterman, E. Self Enhancing
Education: A Training Manual. PACE Project, Title III
ESEA, 1968.
Taylor, C.V., Ghiselin, B., and Yagi, K. Exploratory Research onCommunication Abilities and Creative Abilities. Technical
Report, Grant No. AFrAFOSR-144-63, Direittorate of InformationSciences, Office of Aerospace Research,1967.
Truax, C.B., and Mitchell; K.M., "Research on Certain TherapistInterpersonal Skills in Relation to Process and Outcome."In Allen E. Bergin and Sol L. Garfield (Eds.), Handbook ofPsycholtherapy and Behavior Change: An Empirical Analysis.
New York: John Wiley and Sone, Inc., 1971.
Watzlawick, Paul An Anthology of Human Communication. Pilo
Alto,Cilifornia: Science and Behavior Books, Inc., 1969.
399
395
VV.

Exhibit L.1
DESCRIPTION OF WRITTEN MEASURES
I. Measure of openness about disclosing personal information;Self-Disclosure Questionnsite(SDQ). S answers true orfalse to priifiously rated items of intimate content, accord-ing to whether's. has or has not truthfully disclosed that
. information t a given target person. Target person may bedefined by th experimenter, and is usually designated as"best friend Of theisame sex," or "casual acquaintance of thesame sex," or both,'if comparison is desired.' S is rated asa high-, medium-, or low-discloser according to toal numberof "true" answers. Studies have determined related behiviorpatterns.
II. Measure of consistency between beliefs about people and theworld in general, and injunctions about proper teachingpractices: Belief-Gap Questionnaire, given in two parts asTeacher's Practices Questionnaire (TPQ) and Personal Beliefs_Questionnaire (PBQ), respectively. Objective testswhere S agrees or disagrees with statements of metaphysicalor educational belief and classroom practices. Score is thesubtrection of one total from the other, and represents thewidth of the S's "belief gap," or inconsistency in thinking.Studies shOw that large belief gap teachers are lasetive than are small gap teachers, regardless-Ofbeliefcontent;
Measure of structure of belief systems in terms of rigidity/flexibiliO: This I Believe test (TIB) is an open-ended,short essay test in which S responds to several referentssuch as religion, immorality, myself, people, etc., in termsof his beliefs. Content and process of beliefs ii scored bytrained raters on a number of dimensions, including rigidity,flexibility, evaluativeness,,cynicism, integration, etc.Studies relate patterns of scores on these dimensions tobehavior. Cumbersome because of the need for two or moreraters and inter-rater reliability criterion.
IV. Measures of empathetic tendency toward others, sensitivityto rejection, and affiliation tendency: Measures of thesame names drawn from studies by Mehrabian (1972); sets ofdirect questions concerning preferences for certain responsesover others in given eliciting circumstances. S ratespreference over the stated response on a bi-directional scalewith reversed items. Total scores after items are re-reversedindicate level of that factor of that S. Related to definedsets of nonverbal behavior by research.
400
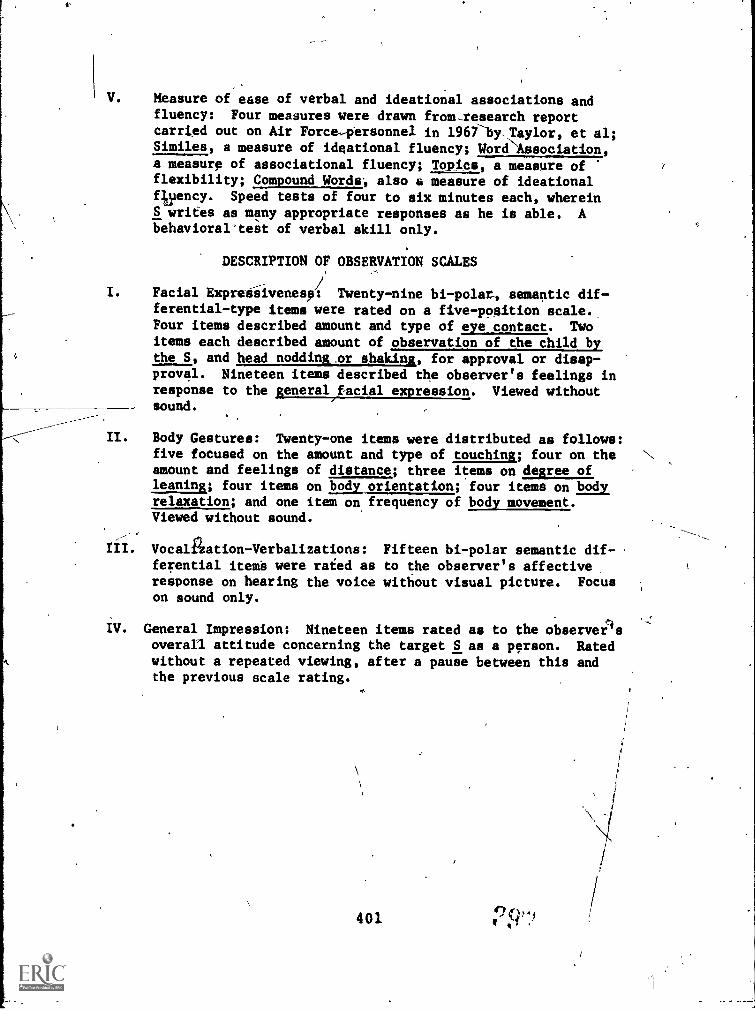
Measure of ease of verbal and ideational associations andfluency: Four measures were drawn from-research reportcarried out on Air Force-personnel in 1967by.Taylor, et al;Similes, a measure of ideational fluency; WoreAasociation,
a measure of associational fluency; Topics, a measure offlexibility; Compound Words; also a measure of ideational4yency. Speed tests of four to six minutes each, whereinS writes as many appropriate responses as he is able. Abehavioral-test of verbal skill only.
DESCRIPTION OF OBSERVATION SCALES
I. Facial Exprediivenese: Twenty-nine bi -polar, semantic dif-ferential-type items were rated on a five-position scale.Four items described amount and type of eye contact. Twoitems each described amount of observation of the child bythe S, and head nodding.or shaking, for approval or disap-proval. Nineteen items described the observer's feelings inresponse to the general/facial expression. Viewed withoutsound.
II. Body Gestures: Twenty-one items were distributed as follows:five focused on the amount and type of touching; four on theamount and feelings of distance; three items on degree ofleaning; four items on body orientation; four items on bodyrelaxation; and one item on frequency of body movement.Viewed without sound.
III. Vocalization- Verbalizations: Fifteen bi-polar semantic dif-ferential item's were rated as to the observer's affectiveresponse on hearing the voice without visual picture. Focuson sound only.
IV. General Impression: Nineteen items rated as to the observesoverall attitude concerning the target S as a person. Ratedwithout a repeated viewing, after a pause between this andthe previous scale rating.
401
\,/

STRATEGIES TACTI
TO
IMPROVE
PIE-SERVICE
(:AND
IN-SERVICE,
TEACHER
TRAINING
IN
?ML
TO MATE
AWARENESS
Gather andsake bibliographlread referencestake notes on
types of tests
read
suggestedarticles free
resources ,
.organisereading categories
-methodology,training,
content
select behaviocat.goriess....:.
observatimicontext/task
beh. to be rateg
select Inbred-
elan
AND
INTEREST
SY
DI1LLLEP
ISSUES of
information
collect testswrite synopsisevaluateselect for use
arrange contactwith resource*for feedback ondevelopment
type /print scales
pilot scales:written tobservation
select raters:Minh checkreliability
DESCRIBING
PATTERNS or
AFFECTIVE
COMMLNICATINN
.
elthl.
data, c,
arrange appts. wispecial ed. orescoordinators
pro-tell
arrange appts.with studentsubjects
.
pre-test
contact districtscoop. teachers,
principals forobservation
observe.' tape Si
arrange eppr.
sheets for tapingcopies to all -Jamie:der phone
calls-make-up spots.-
Analyse_
data
score tests correlate global score scales
group tests factor analyseand spt-stsecific
analyse test correlate id
patterns predictors
analyze dais,*
according to"anchor" data -u wiser ranks
'AMOR
AFFECT .
TO "SELL",
DISSIMINAT.
AFFECTIVE
FINDINGS
TO THE
ccosoint
rarsEavzcs
AGENCY
Writesals
palitil.to'facultr orally present copies to SEEto ROC staff - renewal prop
copies to faculty copies to UMW-
discuss w/ faculty discuss w/ PARCsite visit
1
Contact
011,mFYPersonnel
'
appts. w/ facultyfaculti contact students speak to specie maintain art.
to arrange meet.,,groupst classes, of contact w/to get fneeds, requests
to get feedback h groups. research *slit
O -mutual needs cooed., teach's
feedback to
agency
regular contacts make appte. w/ discuss with progress rep- BEI
arranged t students for RMIC staff atear-end partial
iniomi, end. feedback research report, final
meetin s eking paper
Maintainestablish system akton meetings.
fill specie
ease's, special requests:
of Towel aid presentations, letters of info,
intense& commun. parties of sec. copies of tests_JuL_etatistical Melo
enhance contact
/ interested '.
outside OVIRCif-NEED, CCS, IT
to
Mandy.....-.....
%38
O