Service and Business Plan for City Bus Operations - Mira ...
55
Service and Business Plan for City Bus Operations - Mira Bhayandar Project Consultancy-7 (PC-7) Service and Business Plan for City Bus Operations for two ESCBS Cities Chandigarh and Mira-Bhayandar under the World Bank – GEF assisted Efficient and Sustainable City Bus Services (ESCBS) Project December 2020 Volume II - ANNEXURE Submitted by: Centre of Excellence in Urban Transport CEPT Research and Development Foundation
-
Upload
khangminh22 -
Category
Documents
-
view
3 -
download
0
Transcript of Service and Business Plan for City Bus Operations - Mira ...
Service and
Business Plan for City Bus Operations -
Mira Bhayandar
Project Consultancy-7 (PC-7)
Service and Business Plan for City Bus Operations for two ESCBS Cities Chandigarh and
Mira-Bhayandar under the World Bank – GEF assisted Efficient and Sustainable City
Bus Services (ESCBS) Project
December 2020
Volume II - ANNEXURE
Submitted by:
Centre of Excellence in Urban Transport
CEPT Research and Development Foundation

Service and Business Plan for City Bus Operations for Mira Bhayandar and Chandigarh
Final Report (Volume II - Annexure) – Mira Bhayandar
CoE-UT, CRDF, CEPT University, KL Campus, University Road, Navrangpura, Ahmedabad-380009, India Page i
Table of Content
Annexure 1: List Existing City Bus Routes (February 2020) ................................................................. 4
Annexure 2: Boarding – Alighting and section load for each existing route (one sample trip in peak
hour) ........................................................................................................................................................ 5
Annexure 3: Alignment of Bus Routes – Business As Usual ............................................................... 20
Annexure 4: Alignment of Proposed Bus Routes– Alternative Scenario 2 .......................................... 31
Annexure 5: Evaluation of Proposed Network Scenarios ..................................................................... 43
Annexure 6: Proposed routes frequency and fleet requirement for fleet mix scenarios ....................... 50
Annexure 7: Operating cost estimates, revenue estimation, operating ratio and load factor for fleet mix
scenarios ................................................................................................................................................ 52
List of Tables
PART A – Mira Bhayandar
Table 1: List of Existing City Bus routes (February 2020) .................................................................... 4
Table 2: Route wise performance parameters details .......................................................................... 19
Table 3: Scenario evaluation based on supply analysis ........................................................................ 44
Table 4: Bus procurement phasing plan – Scenario 2 ........................................................................... 47
Table 5: Scenario Evaluation based on SLB indicators – Scenario 2 ................................................... 49
Table 6: Proposed Routes frequency and fleet requirement for fleet mix scenarios ............................ 51
Table 7: Operating cost estimates, revenue estimation, operating ratio and load factor for fleet mix
scenarios ................................................................................................................................................ 53
List of Figures
PART A – Mira Bhayandar
Figure 1: Peak hour Boarding & Alighting pattern along with line load of Route 1 (Up and Down) .... 6
Figure 2: Peak hour Boarding & Alighting pattern along with line load of Route 2 (Up and Down) .... 7
Figure 3: Peak hour Boarding & Alighting pattern along with line load of Route 15 (Up and Down) .. 8
Figure 4: Peak hour Boarding & Alighting pattern along with line load of Route 16 (Up and Down) .. 9
Figure 5: Peak hour Boarding & Alighting pattern along with line load of Route 21 (Up and Down) 10
Figure 6: Peak hour Boarding & Alighting pattern along with line load of Route 22 (Up and Down) 11
Figure 7:Peak hour Boarding & Alighting pattern along with line load of Route 24 (Up and Down) . 12
Figure 8: Peak hour Boarding & Alighting pattern along with line load of Route 4 (Up and Down) .. 13

Service and Business Plan for City Bus Operations for Mira Bhayandar and Chandigarh
Final Report (Volume II - Annexure) – Mira Bhayandar
CoE-UT, CRDF, CEPT University, KL Campus, University Road, Navrangpura, Ahmedabad-380009, India Page ii
Figure 9: Peak hour Boarding & Alighting pattern along with line load of Route 6 (Up and Down) .. 14
Figure 10: Peak hour Boarding & Alighting pattern along with line load of Route 8 (Up and Down) 15
Figure 11: Peak hour Boarding & Alighting pattern along with line load of Route 10 (Up and Down)
.............................................................................................................................................................. 16
Figure 12: Peak hour Boarding & Alighting pattern along with line load of Route 14 (Up and Down)
.............................................................................................................................................................. 17
Figure 13: Peak hour Boarding & Alighting pattern along with line load of Route 29 (Up and Down)
.............................................................................................................................................................. 18
Figure 14: Existing Route 1 (Bhayandar Station to Chowk Church) .................................................... 21
Figure 15: Existing Route 2 (Bhayandar Station to Uttan Naka) .......................................................... 21
Figure 16: Existing Route 15 (Mira Road Station to Rasmi Complex) ................................................ 22
Figure 17: Existing Route 16 (Mira Road Station To Laxmi Park) ...................................................... 22
Figure 18: Existing Route 21 (Mira Road Station to Ramdev Park) .................................................... 23
Figure 19: Existing Route 22 (Mira Road Station to Shanti Vidhya Nagari) ....................................... 23
Figure 20: Existing Route 24 (Mira Road Station To Western Park) ................................................... 24
Figure 21: Existing Route 4 (Bhayandar station to Essel World) ......................................................... 24
Figure 22: Existing Route 6 (Uttan Naka to Manori Tar) ..................................................................... 25
Figure 23: Existing Route 8 (Uttan Naka to Gorai Tar)........................................................................ 25
Figure 24: Existing Route 10/10AC (Bhayandar Station to Thane Station) ......................................... 26
Figure 25: Existing Route 14 (Bhayandar station to Magathane Depo) ............................................... 26
Figure 26: Existing Route 29 AC/ 29AC (Mira Road Station To Thane Kopari) ................................ 27
Figure 27: Existing non-operational Route 5 (Bhayandar Station to Maxus Mall) .............................. 27
Figure 28: Existing non-operational Route 20 (Bhayandar Station to Morva) ..................................... 28
Figure 29: Existing non-operational Route 23 (Bhayandar Station to Royal College) ......................... 28
Figure 30: Existing non-operational Route 28 (Mira Road Station to Ideal Park) ............................... 29
Figure 31: Existing non-operational Route 3 (Bhayandar Station to Manori Tar) ............................... 29
Figure 32: Existing non-operational Route 12 (Bhayandar Station To Magathane Depot) .................. 30
Figure 33: Proposed Route 1 (Bhayandar Station to Chowk Church) .................................................. 32
Figure 34: Proposed Route 2 (Bhayandar Station to BP Road) ............................................................ 32
Figure 35: Proposed Route 3 (Bhayandar station to Kashmira via Golden nest ) ................................ 33
Figure 36: Proposed Route 4 (Bhayandar station to Kashmira via Ghodev) ........................................ 33
Figure 37: Proposed Route 5 (Bhayandar Station to Navagarh) ........................................................... 34
Figure 38: Proposed Route 7 (Bhayandar Station to Kashmira via Mira Road) ................................... 34
Figure 39: Proposed Route 10 (Bhayandar Station To Varsova Bridge) ............................................. 35
Figure 40: Proposed Route 11 (Mira Road Station to Kashmira) ......................................................... 35
Figure 41: Proposed Route 15 (Mira Road Station to Unique Garden) ................................................ 36
Figure 42: Proposed Route 16 (Mira Road Station to Oswal Garden).................................................. 36

Service and Business Plan for City Bus Operations for Mira Bhayandar and Chandigarh
Final Report (Volume II - Annexure) – Mira Bhayandar
CoE-UT, CRDF, CEPT University, KL Campus, University Road, Navrangpura, Ahmedabad-380009, India Page iii
Figure 43: Proposed Route 17 (Mira Road Station to Navgarh Phata) ................................................. 37
Figure 44: Proposed Route 20 (Bhayandar station (W) To Uttan Naka) .............................................. 37
Figure 45: Proposed Route 21 (Mira Road Station To Ramdev Park).................................................. 38
Figure 46: Proposed Route 22 (Mira Road Station To Hatkesh) .......................................................... 38
Figure 47: Proposed Route 24 (Mira Road Station To Western Park).................................................. 39
Figure 48: Proposed Route 23 (Bhakti Vedanata to Navghar Naka) .................................................... 39
Figure 49: Proposed Route 6 (Bhayandar Station to Manori Tar via Gorai) ........................................ 40
Figure 50: Proposed Route 8 (Uttan Naka to Pagode) .......................................................................... 40
Figure 51: Proposed Route 9 (Bhayandar Station to Thane) ................................................................ 41
Figure 52: Proposed Route 12 (Bhayandar Station to Dahisar Check) ................................................. 41
Figure 53: Proposed Route 14 (Bhayandar Station to Borivali) ........................................................... 42
Figure 54: Proposed Route 29 (Mira Road Station to Thane) .............................................................. 42
Figure 55: Scenario comparison: Public transport network and developed area coverage ................... 45
Figure 56: Scenario comparison: Proposed Public transport service levels and routes structure ......... 46
Figure 57: Scenario comparison: Proposed Bus supply and Passenger demand (FY2023) .................. 48

Service and Business Plan for City Bus Operations for Mira Bhayandar and Chandigarh
Final Report (Volume II - Annexure) – Mira Bhayandar
CoE-UT, CRDF, CEPT University, KL Campus, University Road, Navrangpura, Ahmedabad-380009, India Page 4
Annexure 1: List Existing City Bus Routes (February 2020)
Table 1: List of Existing City Bus routes (February 2020)
Sr.
No.
Route
no.
EMME
Code Description
Length
(km)
Headways (min.) Travel Time
(min)
No. of
Buses
City / Sub
urban service
Daily
Ridership Peak Off Peak
1 1 MB1 Bhayandar st.(W) to Chowk 14.2 20 20 52 5 City 4812
2 2 MB2 Bhayandar st.(W) to Uttan Naka 10.3 14 14 36 5 City 4462
9 15 MB15 Mira Road St.(E) to Rasmi Comp.via. s.k.ston
Bevaly park cine max 4.1 10 10 25 4 City 3604
10 16 MB16 Mira Road St.(E) to laxmi Park Tiwari College
vai Cinemax 3.2 8 8 20 5 City 3802
11 21 MB21 Mira Road Station [E] to Ramdev Park Via
Rasaz Theater Bharati Park Shivar Garden 3.1 14 14 17 3 City 2217
12 22 MB22 Mira Road Station [E] to Shanti Vidhya Nagari
Via Jain Mandir Vijay Park Silver Park 4.4 13 13 21 4 City 1719
13 24 MB24 Mira Road Station [E] to Western Park 5.7 10 10 29 6 City 6651
3 4 MB4 Bhayandar st.(W) to Essel World 16.1 40 40 41 3 Sub 1680
4 6 MB6 Uttan Naka to Manori Tar 11.6 27 27 39 3 Sub 1975
5 8 MB8 Uttan Naka to Gorai Tar 9.7 30 30 24 2 Sub 173
6 10 MB10 Bhayandar st.(W) to Thane St. (E) Kopari) Via
W.E.H Majiwada 34.5 23 23 105 8 Sub 4752
7 AC 10 MB10AC Bhayandar st.(W) to Thane St. (E) Kopari) Via
W.E.H Majiwada 34.5 60 60 122 3 Sub 408
8 14 MB14 Bhayandar st.( E) to Magathane Depot Via
Kashimira Borivali St (E) 13.5 15 15 64 8 Sub 4586
14 29 MB29 Mira Road to Thane Kopari 30.2 28 28 88 5 Sub 2634
15 AC 29 MB29AC Mira Road to Thane Kopari 30.2 70 70 77 2 Sub 368
Source: ETM Data from MBMTU, February 2020

Service and Business Plan for City Bus Operations for Mira Bhayandar and Chandigarh
Final Report (Volume II - Annexure) – Mira Bhayandar
CoE-UT, CRDF, CEPT University, KL Campus, University Road, Navrangpura, Ahmedabad-380009, India Page 5
Annexure 2: Boarding – Alighting and section load for each existing route (one sample
trip in peak hour)

Service and Business Plan for City Bus Operations for Mira Bhayandar and Chandigarh
Final Report (Volume II - Annexure) – Mira Bhayandar
CoE-UT, CRDF, CEPT University, KL Campus, University Road, Navrangpura, Ahmedabad-380009, India Page 6
Route no. 1: Bhayandar Station (W) - Chimaji Appa Chowk via Rai Gaon Morva, Uttan and Dongri.
80% passengers are boarding from first 7 bus stops out of 53 bus stops. Uttan Naka stop accounts for 34% and
60% B&A activity in up and down direction respectively. Bhayandar stop accounts for 47% boarding and 33%
alighting activities during peak hour. 23 bus stops do not perform any B&A activity in both directions.
Figure 1: Peak hour Boarding & Alighting pattern along with line load of Route 1 (Up and Down)
Two trips are scheduled during peak hour along this route and occupancy levels are greater than 60 passengers
during peak hours. The average passenger load is greater than full seating capacity of 42 passengers per bus
during peak hour in both directions. Also, the average trip length of passengers on this route is about 7 km
indicating that the bus remains crowded for longer distance. In up direction, non-peak hour passenger load is
almost half of the peak hour which clearly indicates there is spare seating capacity on the bus through-out the
64 70
0
20
40
60
80
100
120
BH
AYA
ND
AR
STA
TIO
N (
W)
BO
MB
AY
MA
RK
ET
CR
OSS
GA
RD
EN
BH
AYA
ND
AR
PO
LIC
E ST
ATI
ON
NET
AJI
SU
BH
ASH
CH
AN
DR
A…
MU
RD
HA
GA
ON
SAD
AN
AN
D N
AG
AR
RA
I GA
ON
SALA
SAR
AP
T
MO
RV
A G
AO
N
MO
RV
A B
HA
AT
ALK
EN P
AD
A
TAR
OD
I
KH
AD
AN
AN
AN
D N
AG
AR
TALA
VA
LI
CH
ECK
PO
ST
TALA
THI O
FFIC
E
UTT
AN
(R
OSA
RY
AP
T.)
UTT
AN
MA
RK
ET
SAIN
T FR
AN
SIS
NA
GA
R
PA
LI C
HU
RC
HE
PA
LI H
OSP
ITA
L
St. R
OC
K
U T
UR
N…
CH
OW
K G
AO
N /
CH
OW
K…
CH
IMA
JI A
PP
A C
HO
WK
No
. o
f p
asse
nge
rs
Bus stops
Route 1 (Up) Length - 14.2 km ATL - 7.4 km Headway - 30 mn
Boarding Alighting Volume Capacity
96 105
0
20
40
60
80
100
120
CH
IMA
JI A
PP
A C
HO
WK
CH
OW
K G
AO
N /
CH
OW
K…
U T
UR
N…
St. R
OC
K
PA
LI H
OSP
ITA
L
PA
LI C
HU
RC
HE
SAIN
T FR
AN
SIS
NA
GA
R
UTT
AN
MA
RK
ET
UTT
AN
(R
OSA
RY
AP
T.)
TALA
THI O
FFIC
E
CH
ECK
PO
ST
TALA
VA
LI
AN
AN
D N
AG
AR
KH
AD
AN
TAR
OD
I
ALK
EN P
AD
A
MO
RV
A B
HA
AT
MO
RV
A G
AO
N
SALA
SAR
AP
T
RA
I GA
ON
SAD
AN
AN
D N
AG
AR
MU
RD
HA
GA
ON
NET
AJI
SU
BH
ASH
CH
AN
DR
A…
BH
AYA
ND
AR
PO
LIC
E ST
ATI
ON
CR
OSS
GA
RD
EN
BO
MB
AY
MA
RK
ET
BH
AYA
ND
AR
STA
TIO
N (
W)
No
. o
f p
asse
nge
rs
Bus stops
Route 1 (Down) Length- 14.2 km ATL - 7.3 km Headway - 30mn
Boarding Alighting Volume Capacity

Service and Business Plan for City Bus Operations for Mira Bhayandar and Chandigarh
Final Report (Volume II - Annexure) – Mira Bhayandar
CoE-UT, CRDF, CEPT University, KL Campus, University Road, Navrangpura, Ahmedabad-380009, India Page 7
route during this time period and the fleets are underutilized. This suggests the need for a mechanism to increase
bus frequency during the peak periods and reduce the supply during the non-peak hours.
Route no. 2: Bhayandar station. (W) to Uttan Naka via jain mandir, Rai Gaon and Morva
Figure 2: Peak hour Boarding & Alighting pattern along with line load of Route 2 (Up and Down)
From above figure, it can be seen around 68% of passengers are boarding and alighting at Bhayandar station.
All intermediate stops show almost same pattern which is less than 10% boarding. In up and down direction 18
and 22 out of 38 total bus stops respectively, does not perform any BA activity. In up direction, the passenger
load is equal to the seating capacity of bus half of the trip, for other half of the trip, passenger load is much less
than seating capacity even during peak hour. In down direction, both peak hour and non-peak hour passenger
load is same through-out the trip. The maximum load in both the direction is lower than the capacity indicating
0
20
40
60
80
No
. o
f p
asse
nge
rs
Bus stops
Route 2 (Up) Length - 10.2 km ATL - 6.7 km Headway - 30 mn
Boarding Alighting Volume Capacity
0
20
40
60
80
No
. o
f p
asse
nge
rs
Bus stops
Route 2 (Down)
Length - 10.2 km ATL - 7.1 km Headway - 30 mn
Boarding Alighting Volume Capacity

Service and Business Plan for City Bus Operations for Mira Bhayandar and Chandigarh
Final Report (Volume II - Annexure) – Mira Bhayandar
CoE-UT, CRDF, CEPT University, KL Campus, University Road, Navrangpura, Ahmedabad-380009, India Page 8
the fleet is underutilized even in peak hour. The average trip length of passengers on this route is about 7 km
indicating people travels for around 70% of the route length.
Route no. 15: Mira Road St.(E) to Rasmi Comp. via. S.k.Stone, Beverly park and Cinemax
Figure 3: Peak hour Boarding & Alighting pattern along with line load of Route 15 (Up and Down)
Mira road station accounts for 98% boarding and 82% alighting activities. Only 3 bus stops perform zero BA
activity. More than 40 passengers/trip are boarding from the first stop itself in peak hour. The figure shows, the
passenger load is near to seating capacity in peak hour and non-peak hour along up direction. In down direction,
passenger load is very less than seating capacity of bus even during peak hour. Non-peak hour passenger load is
very less and it shows this route needs some updation in bus scheduling.
0
20
40
60
80
No
. o
f p
asse
nge
rs
Bus stops
Route 15 (Up) Length - 4.5 km ATL - 2.3 km Headway - 20 mn
Boarding Alighting Volume Capacity
0
20
40
60
80
No
. o
f p
asse
nge
rs
Bus stops
Route 15 (Down) Length - 4.5 km ATL - 2.2 km Headway - 20 mn
Boarding Alighting Volume Capacity

Service and Business Plan for City Bus Operations for Mira Bhayandar and Chandigarh
Final Report (Volume II - Annexure) – Mira Bhayandar
CoE-UT, CRDF, CEPT University, KL Campus, University Road, Navrangpura, Ahmedabad-380009, India Page 9
Route no. 16: Mira Road St.(E) to Laxmi Park Tiwari College vai Cinemax
Figure 4: Peak hour Boarding & Alighting pattern along with line load of Route 16 (Up and Down)
All the bus stops perform BA activities. Mira road station accounts for 91% boarding and 96% alighting
activity. Total six trips are running along route 16 during peak hour, as 3 trips in each direction. Average
passenger load is near to capacity in both up and down direction during peak hour. Non-peak hour passenger
load is having same pattern as peak hour with two by third passengers of peak hour.
0
20
40
60
80
No
. o
f p
asse
nge
rs
Bus stops
Route 16 (Up) Length - 4.3 km ATL - 2.3 km Headway - 20 mn
Boarding Alighting Volume Capacity
0
20
40
60
80
No
. o
f p
asse
nge
rs
Bus stops
Route 16 (Down) Length - 4.3 km ATL - 2.5 km Headway - 20 mn
Boarding Alighting Volume Capacity

Service and Business Plan for City Bus Operations for Mira Bhayandar and Chandigarh
Final Report (Volume II - Annexure) – Mira Bhayandar
CoE-UT, CRDF, CEPT University, KL Campus, University Road, Navrangpura, Ahmedabad-380009, India Page 10
Route no. 21: Mira Road Station [E] to Ramdev Park Via Rasaz Theater, Bharati Park and Shivar
Garden
Figure 5: Peak hour Boarding & Alighting pattern along with line load of Route 21 (Up and Down)
Mira road station accounts for 99% boarding and 92% alighting activities. Among 13 bus stops, 5 bus stops do
not perform any B&A activity. This route serves short trips as trip length is limited to 4.5 kmand it scheduled a
total of six trips during peak hours. The figure shows the passenger load during peak hour is much less than
seating capacity of 42 passengers in the bus.
0
20
40
60
80
No
. o
f p
asse
nge
rs
Bus stops
Route 21 (Up) Length - 4.5 km ATL - 2.7 km Headway - 20 mn
Boarding Alighting Volume Capacity
0
20
40
60
80
No
. o
f p
asse
nge
rs
Bus stops
Route 21 (Down) Length - 4.5 km ATL - 2.6 km Headway - 20 mn
Boarding Alighting Volume Capacity

Service and Business Plan for City Bus Operations for Mira Bhayandar and Chandigarh
Final Report (Volume II - Annexure) – Mira Bhayandar
CoE-UT, CRDF, CEPT University, KL Campus, University Road, Navrangpura, Ahmedabad-380009, India Page 11
Route no. 22: Mira Road Station [E] to Shanti Vidhya Nagari Via Jain Mandir, Vijay Park and Silver
Park
Figure 6: Peak hour Boarding & Alighting pattern along with line load of Route 22 (Up and Down)
80% of passengers are boarding from first four bus stops. Comparatively higher B&A activity is performed by
intermediate bus stops. Out of total 17 bus stops, 3 bus stops perform zero B&A activity in up direction and 9
bus stops perform zero B&A activity in down direction. The line load shows the average passenger load is about
to fill only half the seating capacity of 42 passengers in the bus. The non-peak hour passengers are even less
than peak hour passengers.
0
20
40
60
80
No
. o
f p
asse
nge
rs
Bus stops
Route 22 (Up) Length - 5.0 km ATL - 2.5 km Headway - 20 mn
Boarding Alighting Volume Capacity
0
20
40
60
80
No
. o
f p
asse
nge
rs
Bus stops
Route 22 (Down) Length - 5.0 km ATL - 2.3 km Headway - 30 mn
Boarding Alighting Volume Capacity

Service and Business Plan for City Bus Operations for Mira Bhayandar and Chandigarh
Final Report (Volume II - Annexure) – Mira Bhayandar
CoE-UT, CRDF, CEPT University, KL Campus, University Road, Navrangpura, Ahmedabad-380009, India Page 12
Route no. 24: Mira Road Station [E] to Western Park along Mira Bhayandar road via Kashimira
Mira road station accounts for nearly 85% of B&A activity. Kashimira stop act as major transfer point as it
accounts for more than 20% of B&A activity. Among 19 bus stops, only 3 bus stops have zero B&A activity
and 2 trips are scheduled along up and down direction during peak hour. The figure shows that in both up and
down direction, peak hour and non-peak hour passenger load is nearer to seating capacity of bus.
Figure 7:Peak hour Boarding & Alighting pattern along with line load of Route 24 (Up and Down)
0
20
40
60
80
No
. o
f p
asse
nge
rs
Bus stops
Route 24 (Up) Length - 6.5 km ATL - 3.1 km Headway - 30 mn
Boarding Alighting Volume Capacity
0
20
40
60
80
No
. o
f p
asse
nge
rs
Bus stops
Route 24 (Down) Length - 6.5 km ATL - 3.0 km Headway - 30 mn
Boarding Alighting Volume Capacity

Service and Business Plan for City Bus Operations for Mira Bhayandar and Chandigarh
Final Report (Volume II - Annexure) – Mira Bhayandar
CoE-UT, CRDF, CEPT University, KL Campus, University Road, Navrangpura, Ahmedabad-380009, India Page 13
Route no. 4: Bhayandar station.(W) to Essel World via Rai Gaon, Morva, Uttan, Gorai and Jui pada
Figure 8: Peak hour Boarding & Alighting pattern along with line load of Route 4 (Up and Down)
In route 4, major B&A activities are occurring at starting and ending bus stops i.e., Bhayandar station and
Pagoda bus stop. Hence, the line load remains almost horizontal along the down trip. In up direction, passenger
load is continuously getting reduced. Number of bus stops perform zero activity in up and down direction are 34
and 30 (out of 51 bus stops) respectively. The line load shows, for half of the trip length, peak hour passenger
load is higher than seating capacity of 42 passengers. But in down direction, the passenger load is nearer to
capacity.
0
20
40
60
80
No
. o
f p
asse
nge
rs
Bus stops
Route 4 (Up) Length - 16.1 km ATL - 7.4 km Headway - 60 mn
Boarding Alighting Volume Capacity
0
20
40
60
80
No
. o
f p
asse
nge
rs
Bus stops
Route 4 (Down) Length - 16.1 km ATL - 11.6 km Headway - 60 mn
Boarding Alighting Volume Capacity

Service and Business Plan for City Bus Operations for Mira Bhayandar and Chandigarh
Final Report (Volume II - Annexure) – Mira Bhayandar
CoE-UT, CRDF, CEPT University, KL Campus, University Road, Navrangpura, Ahmedabad-380009, India Page 14
Route no. 6: Uttan Naka to Manori tar via Gorai
Figure 9: Peak hour Boarding & Alighting pattern along with line load of Route 6 (Up and Down)
Uttan Naka stop accounts for 56% boarding and 54% alighting activities. All intermediate bus stops, B&A
activities are very less except Gorai bus stop. Gorai bus stop accounts for around 25% B&A activity. Nearly 12
bus stops (out of 35 bus stops) perform zero B&A activity in both directions. The line load shows the passenger
load is almost uniform throughout the trip, and it is higher than seating capacity even though 4 trips were
scheduled along this route during peak hour.
0
20
40
60
80
UTT
AN
NA
KA
UTT
AN
(R
OSA
RY…
GA
VD
EVI…
TALA
THI O
FFIC
E
STEL
LA M
AR
IS…
CH
ECK
PO
ST
HO
TEL
SAN
VER
S
CH
AV
LY C
RO
SS
MA
XW
ELL
MA
HA
RA
SHTR
A…
RA
M R
ATA
N…
VR
UD
DH
A…
SAA
VA
NT
WA
DI
KO
LLYA
CH
I…
SHEF
ALI
PA
KH
AD
I
VA
IRA
ALA
TA
LAV
VA
LE
GO
RA
I PO
LIC
E…
GO
RA
I CR
OSS
GO
RA
I CH
REC
H
KU
LAV
EM
HA
UD
PA
DA
AM
BED
KA
R…
SUM
LAIE
TA
LAV
SAI M
AA
ULI
…
DA
RG
A
ASH
WIN
WA
DI
DO
MN
IKA
WA
DI
MA
NO
RI…
BH
AN
DA
R W
AD
I
KO
LI W
AD
A
MA
NO
RI C
HU
RC
H
BU
DD
H W
AD
I
MA
NO
RI T
AR
No
. o
f p
asse
nge
rs
Bus stops
Route 6 (Up) Length - 11.6 km ATL - 5.5 km Headway - 30 mn
Boarding Alighting Volume Capcity
0
20
40
60
80
MA
NO
RI T
AR
BU
DD
H W
AD
I
MA
NO
RI C
HU
RC
H
KO
LI W
AD
A
BH
AN
DA
R W
AD
I
MA
NO
RI…
DO
MN
IKA
WA
DI
ASH
WIN
WA
DI
DA
RG
A
SAI M
AA
ULI
…
SUM
LAIE
TA
LAV
AM
BED
KA
R…
HA
UD
PA
DA
KU
LAV
EM
GO
RA
I CH
REC
H
GO
RA
I CR
OSS
GO
RA
I PO
LIC
E…
VA
LE
VA
IRA
ALA
TA
LAV
PA
KH
AD
I
SHEF
ALI
KO
LLYA
CH
I…
SAA
VA
NT
WA
DI
VR
UD
DH
A…
RA
M R
ATA
N…
MA
HA
RA
SHTR
A…
MA
XW
ELL
CH
AV
LY C
RO
SS
HO
TEL
SAN
VER
S
CH
ECK
PO
ST
STEL
LA M
AR
IS…
TALA
THI O
FFIC
E
GA
VD
EVI…
UTT
AN
(R
OSA
RY…
UTT
AN
NA
KA
No
. o
f p
asse
nge
rs
Bus stops
Route 6 (Down) Length - 11.6 km ATL - 6.4 km Headway - 30 mn
Boarding Alighting Volume Capcity

Service and Business Plan for City Bus Operations for Mira Bhayandar and Chandigarh
Final Report (Volume II - Annexure) – Mira Bhayandar
CoE-UT, CRDF, CEPT University, KL Campus, University Road, Navrangpura, Ahmedabad-380009, India Page 15
Route no. 8: Uttan Naka to Gorai Tar
Figure 10: Peak hour Boarding & Alighting pattern along with line load of Route 8 (Up and Down)
Along route 8, operating buses are midi buses and its maximum capacity is of 45 passengers. The figure above
indicates in up direction the number of passengers are same as the capacity and in down direction it is less than
capacity. The trip length of passengers on this route is about 6 km indicating that the bus remains crowded for
longer distance. Almost 38 stops serves zero boarding and alighting along this route.
020406080
100120
UTT
AN
NA
KA
UTT
AN
UTT
AN
(R
OSA
RY
AP
T.)
GA
VD
EVI M
AN
DIR
…
TALA
THI O
FFIC
E
STEL
LA M
AR
IS H
OSP
ITA
L
HO
TEL
SAN
VER
S
CH
AV
LY C
RO
SS
MA
XW
ELL
MA
HA
RA
SHTR
A J
UD
ICIA
L…
RA
M R
ATA
N…
VR
UD
DH
A A
ASR
AM
SAA
VA
NT
WA
DI
KO
LLYA
CH
I BA
VA
DI
SHEF
ALI
PA
KH
AD
I
VA
IRA
ALA
TA
LAV
VA
LE
GO
RA
I PO
LIC
E ST
ATI
ON
GO
RA
I CR
OSS
KH
AJU
RI W
AD
I
JUEI
PA
DA
AD
IVA
SHI P
AD
A
ESSA
L W
OR
LD P
AR
KIN
G
ESSA
L W
OR
LD B
US
STO
P
PA
GO
DA
GO
RA
I TA
R
No
. o
f p
asse
nge
rs
Bus stops
Route 8 (Up) TL - 9.7 km ATL - 6.21 Headway - 30mnts
Boarding Alighting Volume Capacity
020406080
100120
GO
RA
I TA
R
PA
GO
DA
ESSA
L W
OR
LD B
US
STO
P
ESSA
L W
OR
LD P
AR
KIN
G
AD
IVA
SHI P
AD
A
JUEI
PA
DA
KH
AJU
RI W
AD
I
GO
RA
I CR
OSS
GO
RA
I PO
LIC
E ST
ATI
ON
VA
LE
VA
IRA
ALA
TA
LAV
PA
KH
AD
I
SHEF
ALI
KO
LLYA
CH
I BA
VA
DI
SAA
VA
NT
WA
DI
VR
UD
DH
A A
ASR
AM
RA
M R
ATA
N…
MA
HA
RA
SHTR
A J
UD
ICIA
L…
MA
XW
ELL
CH
AV
LY C
RO
SS
HO
TEL
SAN
VER
S
STEL
LA M
AR
IS H
OSP
ITA
L
TALA
THI O
FFIC
E
GA
VD
EVI M
AN
DIR
…
UTT
AN
(R
OSA
RY
AP
T.)
UTT
AN
UTT
AN
NA
KA
No
. o
f p
asse
nge
rs
Bus stops
Route 8 (Down) TL - 9.7 km ATL - 6.07 km Headway - 30mnts
Boarding Alighting Volume Capacity
Service and Business Plan for City Bus Operations for Mira Bhayandar and Chandigarh
Final Report (Volume II - Annexure) – Mira Bhayandar
CoE-UT, CRDF, CEPT University, KL Campus, University Road, Navrangpura, Ahmedabad-380009, India Page 16
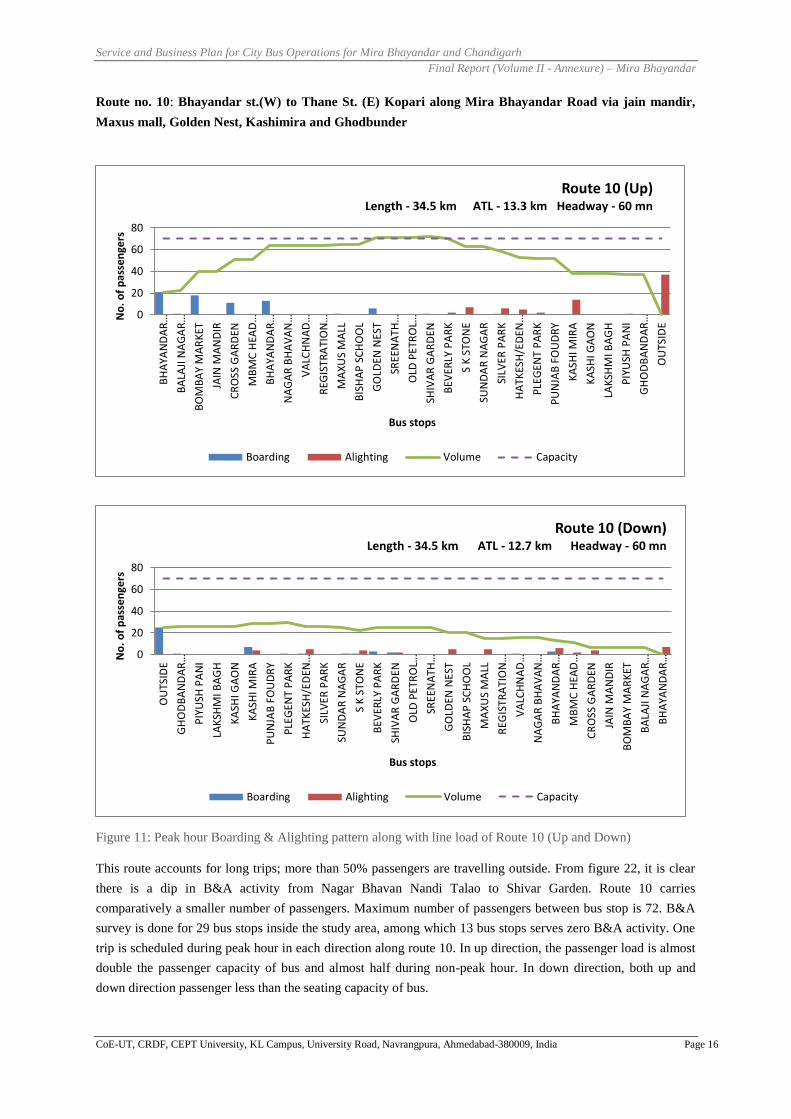
Route no. 10: Bhayandar st.(W) to Thane St. (E) Kopari along Mira Bhayandar Road via jain mandir,
Maxus mall, Golden Nest, Kashimira and Ghodbunder
Figure 11: Peak hour Boarding & Alighting pattern along with line load of Route 10 (Up and Down)
This route accounts for long trips; more than 50% passengers are travelling outside. From figure 22, it is clear
there is a dip in B&A activity from Nagar Bhavan Nandi Talao to Shivar Garden. Route 10 carries
comparatively a smaller number of passengers. Maximum number of passengers between bus stop is 72. B&A
survey is done for 29 bus stops inside the study area, among which 13 bus stops serves zero B&A activity. One
trip is scheduled during peak hour in each direction along route 10. In up direction, the passenger load is almost
double the passenger capacity of bus and almost half during non-peak hour. In down direction, both up and
down direction passenger less than the seating capacity of bus.
0
20
40
60
80
BH
AYA
ND
AR
…
BA
LAJI
NA
GA
R…
BO
MB
AY
MA
RK
ET
JAIN
MA
ND
IR
CR
OSS
GA
RD
EN
MB
MC
HEA
D…
BH
AYA
ND
AR
…
NA
GA
R B
HA
VA
N…
VA
LCH
NA
D…
REG
ISTR
ATI
ON
…
MA
XU
S M
ALL
BIS
HA
P S
CH
OO
L
GO
LDEN
NES
T
SREE
NA
TH…
OLD
PET
RO
L…
SHIV
AR
GA
RD
EN
BEV
ERLY
PA
RK
S K
STO
NE
SUN
DA
R N
AG
AR
SILV
ER P
AR
K
HA
TKES
H/E
DEN
…
PLE
GEN
T P
AR
K
PU
NJA
B F
OU
DR
Y
KA
SHI M
IRA
KA
SHI G
AO
N
LAK
SHM
I BA
GH
PIY
USH
PA
NI
GH
OD
BA
ND
AR
…
OU
TSID
E
No
. o
f p
asse
nge
rs
Bus stops
Route 10 (Up) Length - 34.5 km ATL - 13.3 km Headway - 60 mn
Boarding Alighting Volume Capacity
0
20
40
60
80
OU
TSID
E
GH
OD
BA
ND
AR
…
PIY
USH
PA
NI
LAK
SHM
I BA
GH
KA
SHI G
AO
N
KA
SHI M
IRA
PU
NJA
B F
OU
DR
Y
PLE
GEN
T P
AR
K
HA
TKES
H/E
DEN
…
SILV
ER P
AR
K
SUN
DA
R N
AG
AR
S K
STO
NE
BEV
ERLY
PA
RK
SHIV
AR
GA
RD
EN
OLD
PET
RO
L…
SREE
NA
TH…
GO
LDEN
NES
T
BIS
HA
P S
CH
OO
L
MA
XU
S M
ALL
REG
ISTR
ATI
ON
…
VA
LCH
NA
D…
NA
GA
R B
HA
VA
N…
BH
AYA
ND
AR
…
MB
MC
HEA
D…
CR
OSS
GA
RD
EN
JAIN
MA
ND
IR
BO
MB
AY
MA
RK
ET
BA
LAJI
NA
GA
R…
BH
AYA
ND
AR
…No
. o
f p
asse
nge
rs
Bus stops
Route 10 (Down) Length - 34.5 km ATL - 12.7 km Headway - 60 mn
Boarding Alighting Volume Capacity

Service and Business Plan for City Bus Operations for Mira Bhayandar and Chandigarh
Final Report (Volume II - Annexure) – Mira Bhayandar
CoE-UT, CRDF, CEPT University, KL Campus, University Road, Navrangpura, Ahmedabad-380009, India Page 17
Route no. 14: Bhayandar st.( E) to Magathane Depot Via Kashimira and Borivali St (E)
Figure 12: Peak hour Boarding & Alighting pattern along with line load of Route 14 (Up and Down)
Along route 14, occupancy levels are greater than 60 passengers during peak hours. The average passenger load
is greater than full seating capacity of 42 passengers per bus during peak hour in both directions. The average
trip length is about 4 km. Almost 25 bus stops serves zero boarding and alighting along this route.
0
20
40
60
80
No
. o
f p
asse
nge
rs
Bus stops
Route 14 (Up) TL - 13.5 km ATL - 4.50 km Headway - 15 mnts
Boarding Alighting Volume Capacity
020406080
100120140
No
. o
f p
asse
nge
rs
Bus stops
Route 14 (Down) TL - 13.5 km ATL - 4.30 km Headway - 15 mnts
Boarding Alighting Volume Capacity

Service and Business Plan for City Bus Operations for Mira Bhayandar and Chandigarh
Final Report (Volume II - Annexure) – Mira Bhayandar
CoE-UT, CRDF, CEPT University, KL Campus, University Road, Navrangpura, Ahmedabad-380009, India Page 18
Route no. 29: Mira Road to Thane Kopari via Mira Bhayandar Road, Kashimira and Ghodbandar
Village
Figure 13: Peak hour Boarding & Alighting pattern along with line load of Route 29 (Up and Down)
Total trip length of Route 29 is 27.7 km. In up direction, 100% passengers are travelling outside the study area
and 80% of passengers are boarding from Mira station and sector 4. In down direction, 77% of people are
traveling external to internal out of which 38% of passengers are travelling to end bus stop. Kashimira junction
accounts for nearly 30% of trips, i.e., this stop act as a major transfer point along this route. In down direction,
40% of passengers are traveling from external to internal. Five bus stops serve zero B&A activity. In down
direction both peak and non-peak hour passenger load is same and is less than the seating capacity of bus.
0
20
40
60
80
No
. o
f p
asse
nge
rs
Bus stops
Route 29 (Up) Length - 27.7 km ATL - 15.8 km Headway - 60 mn
Boarding Alighting Volume Capacity
0
20
40
60
80
No
. o
f p
asse
nge
rs
Bus stops
Route 29 (Down) Length - 27.7 km ATL - 13.4 km Headway - 60 mn
Boarding Alighting Volume Capacity

Service and Business Plan for City Bus Operations for Mira Bhayandar and Chandigarh
Final Report (Volume II - Annexure) – Mira Bhayandar
CoE-UT, CRDF, CEPT University, KL Campus, University Road, Navrangpura, Ahmedabad-380009, India Page 19
Table 2: Route wise performance parameters details
Route
no. Dir Description
Route
Length
(km)
Avg. trip
Length
(km)
Headway
(min)
Total
B/A Peak Hour
Max_Pax
load Type of bus
Load
factor
1 U Bhayandar Station (W)-Chimaji Appa Chowk
14.2 7.4
20 82 9 – 10 am 68 Standard 0.97
D Chimaji Appa Chowk-Bhayandar Station (W) 7.3 117 6 - 7 am 105 Standard 1.50
2 U Bhayandar Station (W)-Uttan Naka
10.2 6.7
14 41 8 - 9 am 39 Standard 0.56
D Uttan Naka-Bhayandar Station (W) 7.1 62 6 - 7 am 49 Standard 0.70
4 U Bhayandar Station (W)-Pagoda
16.1 7.4
40 62 5 - 6 pm 54 Standard 0.77
D Pagoda-Bhayandar Station (W) 11.6 60 5 - 6 pm 49 Standard 0.70
6 U Uttan Naka-Manori Tar
11.6 5.5
27 57 7 - 8 pm 35 Midi bus 0.78
D Manori Tar-Uttan Naka 6.4 41 7 - 8 pm 36 Midi bus 0.80
8 U Uttan Naka to Gorai Tar
9.7 6.2
30 56 8 - 9 am 54 Midi bus 1.20
D Gorai Tar-Uttan Naka 6.1 43 6 – 7 pm 32 Midi bus 0.71
10 U Bhayandar Station (W)-Thane (Outside)
34.5 13.3
23 74 9 - 10 am 72 Standard 1.03
D Thane (Outside)-Bhayandar Station (W) 12.7 45 11 - 12 pm 30 Standard 0.43
10
(AC)
U Bhayandar Station (W)-Thane (Outside) 34.5
20.2 60
29 9 - 10 am 29 AC Standard 0.41
D Thane (Outside)-Bhayandar Station (W) 22.3 6 11 - 12 pm 6 AC Standard 0.09
14 U Uttan Naka to Gorai Tar
13.5 4.5
15 118 9 – 10 am 70 Standard 1.00
D Gorai Tar-Uttan Naka 4.3 150 7 – 8 pm 123 Standard 1.76
15 U Mira Road Station -Rashmi Complex
4.5 2.3
10 76 10 - 11 am 76 Standard 1.09
D Rashmi Complex-Mira Road Station 2.2 44 9 - 10 am 40 Standard 0.57
16 U Mira Road Station -Kd Empire
4.3 2.3
8 52 7 - 8 pm 49 Standard 0.70
D Kd Empire-Mira Road Station 2.5 47 6 - 7 pm 47 Standard 0.67
21 U Mira Road Station -Kd Empire
4.5 2.7
14 35 9 - 10 am 35 Standard 0.50
D Kd Empire-Mira Road Station 2.6 19 9 - 10 am 19 Standard 0.27
22 U Mira Road Station -Shanti Vidya Nagari
5 2.5
13 28 5 - 6 pm 26 Standard 0.37
D Shanti Vidya Nagari-Mira Road Station 2.3 17 7 - 8 pm 17 Standard 0.24
24 U Mira Road Station -Western Park
6.5 3.1
10 55 6 - 7 pm 50 Standard 0.71
D Western Park-Mira Road Station 3 51 6 - 7 pm 46 Standard 0.66
29
(AC)
U Mira Road Station -Thane (Outside) 27.7
21.1 28
15 9 - 10 am 15 AC Standard 0.21
D Thane (Outside)-Mira Road Station 23.2 7 11 - 12 pm 7 AC Standard 0.10
29 U Mira Road Station -Thane (Outside)
27.7 15.8
70 50 9 - 10 am 50 Standard 0.71
D Thane (Outside)-Mira Road Station 13.4 39 11 - 12 pm 33 Standard 0.47
Service and Business Plan for City Bus Operations for Mira Bhayandar and Chandigarh
Final Report (Volume II - Annexure) – Mira Bhayandar
CoE-UT, CRDF, CEPT University, KL Campus, University Road, Navrangpura, Ahmedabad-380009, India Page 20
Annexure 3: Alignment of Bus Routes – Business As Usual

Service and Business Plan for City Bus Operations for Mira Bhayandar and Chandigarh
Final Report (Volume II - Annexure) – Mira Bhayandar
CoE-UT, CRDF, CEPT University, KL Campus, University Road, Navrangpura, Ahmedabad-380009, India Page 21
Route 1: Bhayandar Station (W) to Chowk Church via Balaji Nagar, Jain Mandir, Murdha, Rai, Morva,
Dongri, Keshav Srushti, Manori, Uttan, Mahar Dongri
Figure 14: Existing Route 1 (Bhayandar Station to Chowk Church)
Route 2: Bhayandar Station (W) To Uttan Naka Via Bombay Market, Shivneri, Moarva Gaon, Ice Factory,
Check Post
Figure 15: Existing Route 2 (Bhayandar Station to Uttan Naka)

Service and Business Plan for City Bus Operations for Mira Bhayandar and Chandigarh
Final Report (Volume II - Annexure) – Mira Bhayandar
CoE-UT, CRDF, CEPT University, KL Campus, University Road, Navrangpura, Ahmedabad-380009, India Page 22
Route 15: Mira Road Station (E) To Rasmi Complex Via S.K.Ston, Bevaly Park, Cine Max
Figure 16: Existing Route 15 (Mira Road Station to Rasmi Complex)
Route 16: Mira Road Station (E) To Laxmi Park Via Sector 4, S K Stone, Cinemax, Kd Empire, Tiwari
College
Figure 17: Existing Route 16 (Mira Road Station To Laxmi Park)

Service and Business Plan for City Bus Operations for Mira Bhayandar and Chandigarh
Final Report (Volume II - Annexure) – Mira Bhayandar
CoE-UT, CRDF, CEPT University, KL Campus, University Road, Navrangpura, Ahmedabad-380009, India Page 23
Route 21: Mira Road Station [E] To Ramdev Park Via Sector 4, Rasaz Theater, Shivar Garden, Kd Empire
Figure 18: Existing Route 21 (Mira Road Station to Ramdev Park)
Route 22: Mira Road Station [E] To Shanti Vidhya Nagari Via Sector 4, Jain Mandir, Vijay Park Silver Park,
Mangal Nagar
Figure 19: Existing Route 22 (Mira Road Station to Shanti Vidhya Nagari)

Service and Business Plan for City Bus Operations for Mira Bhayandar and Chandigarh
Final Report (Volume II - Annexure) – Mira Bhayandar
CoE-UT, CRDF, CEPT University, KL Campus, University Road, Navrangpura, Ahmedabad-380009, India Page 24
Route 24: Mira Road Station [E] To Western Park Via Sector 4, MTNL, Plegent Park , Kashi Mira, Green
Village
Figure 20: Existing Route 24 (Mira Road Station To Western Park)
Route 4: Bhayandar Station (W) To Essel World Via Bombay Market, Shivneri, Check Post, Maxwell, Gorai
Cross, Pagoda
Figure 21: Existing Route 4 (Bhayandar station to Essel World)

Service and Business Plan for City Bus Operations for Mira Bhayandar and Chandigarh
Final Report (Volume II - Annexure) – Mira Bhayandar
CoE-UT, CRDF, CEPT University, KL Campus, University Road, Navrangpura, Ahmedabad-380009, India Page 25
Route 6: Uttan Naka To Manori Tar Via Stella Maris Hospital, Maxwell, Vale, Kulavem, Domnika Wadi
Figure 22: Existing Route 6 (Uttan Naka to Manori Tar)
Route 8: Uttan Naka to Gorai Tar Via Stella Maris Hospital, Maxwell, Gorai Cross, Essal World Bus Stop,
Pagoda
Figure 23: Existing Route 8 (Uttan Naka to Gorai Tar)
Service and Business Plan for City Bus Operations for Mira Bhayandar and Chandigarh
Final Report (Volume II - Annexure) – Mira Bhayandar
CoE-UT, CRDF, CEPT University, KL Campus, University Road, Navrangpura, Ahmedabad-380009, India Page 26
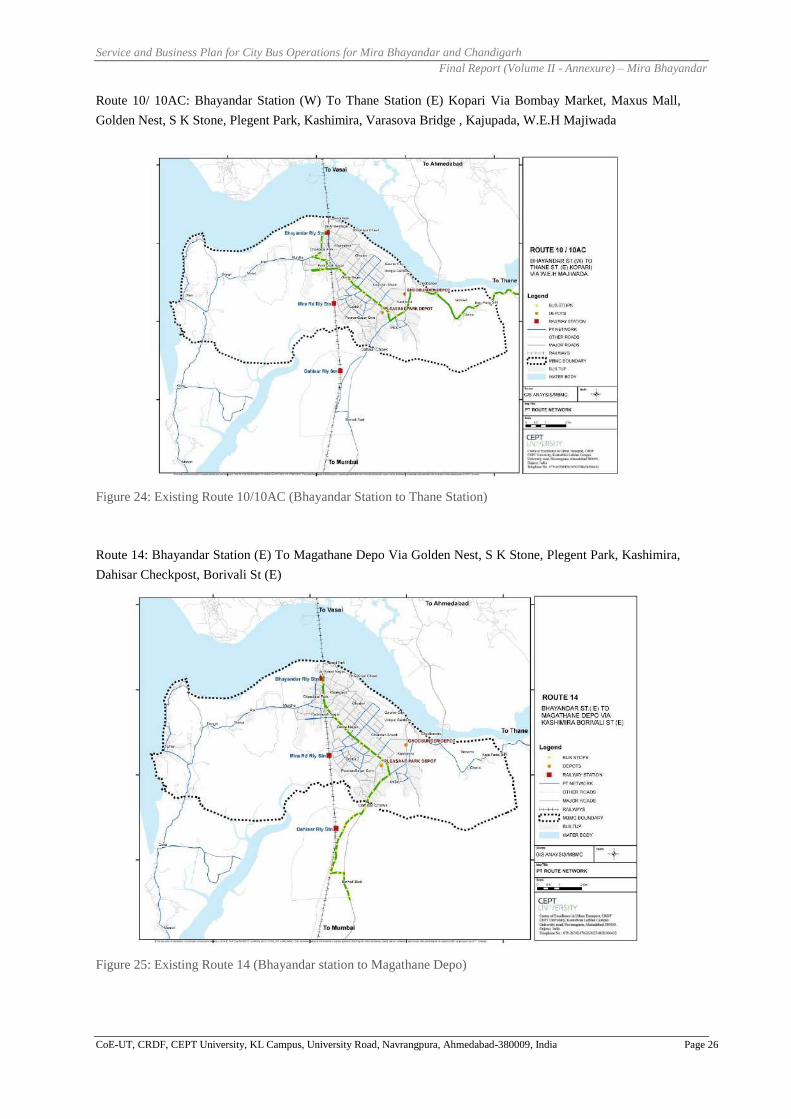
Route 10/ 10AC: Bhayandar Station (W) To Thane Station (E) Kopari Via Bombay Market, Maxus Mall,
Golden Nest, S K Stone, Plegent Park, Kashimira, Varasova Bridge , Kajupada, W.E.H Majiwada
Figure 24: Existing Route 10/10AC (Bhayandar Station to Thane Station)
Route 14: Bhayandar Station (E) To Magathane Depo Via Golden Nest, S K Stone, Plegent Park, Kashimira,
Dahisar Checkpost, Borivali St (E)
Figure 25: Existing Route 14 (Bhayandar station to Magathane Depo)

Service and Business Plan for City Bus Operations for Mira Bhayandar and Chandigarh
Final Report (Volume II - Annexure) – Mira Bhayandar
CoE-UT, CRDF, CEPT University, KL Campus, University Road, Navrangpura, Ahmedabad-380009, India Page 27
Route 29/ 29AC: Mira Road Station (E) To Thane Kopari Via Sector 4, S K Stone, Plegent Park, Kashi Mira,
Lakshmi Bagh, Varasova Bridge, Kaju Pada
Figure 26: Existing Route 29 AC/ 29AC (Mira Road Station To Thane Kopari)
Route 5: Bhayandar Station [W] To Maxus Mall Via Balaji Nagar (Union Bank), Bombay Market, Jain
Mandir, Registration Office
Figure 27: Existing non-operational Route 5 (Bhayandar Station to Maxus Mall)

Service and Business Plan for City Bus Operations for Mira Bhayandar and Chandigarh
Final Report (Volume II - Annexure) – Mira Bhayandar
CoE-UT, CRDF, CEPT University, KL Campus, University Road, Navrangpura, Ahmedabad-380009, India Page 28
Route 20: Bhayandar Station [W] To Morva Via Bombay Market, Cross Garden, Bhayandar Police Station,
Murdha Khadi, Rai Gaon, Shivneri
Figure 28: Existing non-operational Route 20 (Bhayandar Station to Morva)
Route 23: Bhayandar Station [E] To Royal College Vai Ghoddev Naka, Indralok, Golden Nest, Lakshmi
Park, Mira Road Station, Poonam Sagar Complex
Figure 29: Existing non-operational Route 23 (Bhayandar Station to Royal College)

Service and Business Plan for City Bus Operations for Mira Bhayandar and Chandigarh
Final Report (Volume II - Annexure) – Mira Bhayandar
CoE-UT, CRDF, CEPT University, KL Campus, University Road, Navrangpura, Ahmedabad-380009, India Page 29
Route 28: Mira Road Station To Ideal Park Via Sector 4, Rasaj Cinema, Old Petrol Pump, Sreenath Complex
Figure 30: Existing non-operational Route 28 (Mira Road Station to Ideal Park)
Route 3: Bhayandar Station (W) To Manori Tar Via Bombay Market, Shivneri, Check Post, Maxwell, Gorai
Cross, Kulavem, Koli Wada
Figure 31: Existing non-operational Route 3 (Bhayandar Station to Manori Tar)

Service and Business Plan for City Bus Operations for Mira Bhayandar and Chandigarh
Final Report (Volume II - Annexure) – Mira Bhayandar
CoE-UT, CRDF, CEPT University, KL Campus, University Road, Navrangpura, Ahmedabad-380009, India Page 30
Route 12: Bhayandar Station (E) To Magathane Depot Via Golden Nest, Holy Cross School, Mira Road
Station, Poonam Sagar Complex, Dahisar Checkpost, Devipada Borivali Station
Figure 32: Existing non-operational Route 12 (Bhayandar Station To Magathane Depot)
Service and Business Plan for City Bus Operations for Mira Bhayandar and Chandigarh
Final Report (Volume II - Annexure) – Mira Bhayandar
CoE-UT, CRDF, CEPT University, KL Campus, University Road, Navrangpura, Ahmedabad-380009, India Page 31
Annexure 4: Alignment of Proposed Bus Routes– Alternative Scenario 2

Service and Business Plan for City Bus Operations for Mira Bhayandar and Chandigarh
Final Report (Volume II - Annexure) – Mira Bhayandar
CoE-UT, CRDF, CEPT University, KL Campus, University Road, Navrangpura, Ahmedabad-380009, India Page 32
Route 1: Bhayandar Station (W) to Chowk Church via Balaji Nagar, Jain Mandir, Murdha, Rai, Morva,
Dongri, Keshav Srushti, Manori, Uttan, Mahar Dongri
Figure 33: Proposed Route 1 (Bhayandar Station to Chowk Church)
Route 2: Bhayandar Station (W) to BP Road via Khare gaon, Maxus Mall, Cross Garden, Bombay market
Figure 34: Proposed Route 2 (Bhayandar Station to BP Road)

Service and Business Plan for City Bus Operations for Mira Bhayandar and Chandigarh
Final Report (Volume II - Annexure) – Mira Bhayandar
CoE-UT, CRDF, CEPT University, KL Campus, University Road, Navrangpura, Ahmedabad-380009, India Page 33
Route 3: Bhayandar station (W) to Kashmira via Balaji Nagar (Union Bank), Cross Garden ,Golden Nest,
Pleasant Park Depot
Figure 35: Proposed Route 3 (Bhayandar station to Kashmira via Golden nest )
Route 4: Bhayandar station (W) to Kashmira via Ghodev, S K Stone, Pleasant Park, Silver Park
Figure 36: Proposed Route 4 (Bhayandar station to Kashmira via Ghodev)

Service and Business Plan for City Bus Operations for Mira Bhayandar and Chandigarh
Final Report (Volume II - Annexure) – Mira Bhayandar
CoE-UT, CRDF, CEPT University, KL Campus, University Road, Navrangpura, Ahmedabad-380009, India Page 34
Route 5: Navaghar Phata to Bhayandar Police Station (W) via BP Road via, Maxus Mall, Balaji Nagar
(Union Bank), Bombay Market
Figure 37: Proposed Route 5 (Bhayandar Station to Navagarh)
Route 7: Bhayandar Station (E) To Kashmira Via Mira Road, Apna Bazar , Plegent Park
Figure 38: Proposed Route 7 (Bhayandar Station to Kashmira via Mira Road)

Service and Business Plan for City Bus Operations for Mira Bhayandar and Chandigarh
Final Report (Volume II - Annexure) – Mira Bhayandar
CoE-UT, CRDF, CEPT University, KL Campus, University Road, Navrangpura, Ahmedabad-380009, India Page 35
Route 10: Bhayandar Station (E) To Varsova Bridge Via Kashimira, Kharegaon, Golden Nest, S K Stone,
Pleasant Park Depot, Kasigaon,
Figure 39: Proposed Route 10 (Bhayandar Station To Varsova Bridge)
Route 11: Mira Road Station (W) to Kashmira Via Cross Garden, Golden Nest, Pleasant Park Depot
Figure 40: Proposed Route 11 (Mira Road Station to Kashmira)

Service and Business Plan for City Bus Operations for Mira Bhayandar and Chandigarh
Final Report (Volume II - Annexure) – Mira Bhayandar
CoE-UT, CRDF, CEPT University, KL Campus, University Road, Navrangpura, Ahmedabad-380009, India Page 36
Route 15: Mira Road Station (E) To Unique Garden Via Sector 4, Sheetal Garden Cinemax, Gaurav
Residency
Figure 41: Proposed Route 15 (Mira Road Station to Unique Garden)
Route 16: Mira Road Station (E) to Oswal Garden Via Sector 4, Cinemax, Lakshmi Park, Ram Nagar
Figure 42: Proposed Route 16 (Mira Road Station to Oswal Garden)

Service and Business Plan for City Bus Operations for Mira Bhayandar and Chandigarh
Final Report (Volume II - Annexure) – Mira Bhayandar
CoE-UT, CRDF, CEPT University, KL Campus, University Road, Navrangpura, Ahmedabad-380009, India Page 37
Route 17: Mira Road Station (E) To Navgarh Phata Via Sector 4, Golden Nest, Indralok Phase 2, Salasar
Nagar
Figure 43: Proposed Route 17 (Mira Road Station to Navgarh Phata)
Route 20: Bhayandar station (W) To Uttan Naka Via Navghar Naka, Aazad Nagar , Maxus Mall, Rai Gaon,
Shivneri
Figure 44: Proposed Route 20 (Bhayandar station (W) To Uttan Naka)

Service and Business Plan for City Bus Operations for Mira Bhayandar and Chandigarh
Final Report (Volume II - Annexure) – Mira Bhayandar
CoE-UT, CRDF, CEPT University, KL Campus, University Road, Navrangpura, Ahmedabad-380009, India Page 38
Route 21: Mira Road Station To Ramdev Park Via Rasaj Cinema, N.H.School, Ram Nagar, Woodland Hotel
Figure 45: Proposed Route 21 (Mira Road Station To Ramdev Park)
Route 22: Mira Road Station To Hatkesh Via Sector 4, Poonam Complex, Silver Park
Figure 46: Proposed Route 22 (Mira Road Station To Hatkesh)

Service and Business Plan for City Bus Operations for Mira Bhayandar and Chandigarh
Final Report (Volume II - Annexure) – Mira Bhayandar
CoE-UT, CRDF, CEPT University, KL Campus, University Road, Navrangpura, Ahmedabad-380009, India Page 39
Route 24: Mira Road Station To Western Park Via Sector 4, Hatkesh, Kashi Gaon, Green Village
Figure 47: Proposed Route 24 (Mira Road Station To Western Park)
Route 23: Bhakti Vedanata to Navghar Naka via Poonam Sagar Complex, Mira Road Station ,Sheetal
Garden, Ram Nagar
Figure 48: Proposed Route 23 (Bhakti Vedanata to Navghar Naka)

Service and Business Plan for City Bus Operations for Mira Bhayandar and Chandigarh
Final Report (Volume II - Annexure) – Mira Bhayandar
CoE-UT, CRDF, CEPT University, KL Campus, University Road, Navrangpura, Ahmedabad-380009, India Page 40
Route 6: Bhayandar Station (W) to Manori Tar via Raigaon, Dongri, Uttan Naka, Check post, Gorai,
Domnikawadi
Figure 49: Proposed Route 6 (Bhayandar Station to Manori Tar via Gorai)
Route 8: Uttan Naka to Pagode via Maxwell, Gorai, Essal World
Figure 50: Proposed Route 8 (Uttan Naka to Pagode)

Service and Business Plan for City Bus Operations for Mira Bhayandar and Chandigarh
Final Report (Volume II - Annexure) – Mira Bhayandar
CoE-UT, CRDF, CEPT University, KL Campus, University Road, Navrangpura, Ahmedabad-380009, India Page 41
Route 9: Bhayandar Station (E) to Thane via Kharegaon, Kd Empire, Varsova Brideg, Kajupada
Figure 51: Proposed Route 9 (Bhayandar Station to Thane)
Route 12: Bhayandar Station (E) to Dahisar Check Via Aazad Naga, Mira Road Station, Poonam Sagar
Complex, Ganesh Mandir
Figure 52: Proposed Route 12 (Bhayandar Station to Dahisar Check)

Service and Business Plan for City Bus Operations for Mira Bhayandar and Chandigarh
Final Report (Volume II - Annexure) – Mira Bhayandar
CoE-UT, CRDF, CEPT University, KL Campus, University Road, Navrangpura, Ahmedabad-380009, India Page 42
Route 14: Bhayandar Station (W) To Borivali (E) Via Bombay Market, Cross Garden, Golden Nest, S K Stone,
Pleasant Park Depot, Dahisar Check post
Figure 53: Proposed Route 14 (Bhayandar Station to Borivali)
Route 29: Mira Road Station To Thane Via Poonam Sagar Complex, Silver Park, Varasova Bridge, Kajupada
Figure 54: Proposed Route 29 (Mira Road Station to Thane)

Service and Business Plan for City Bus Operations for Mira Bhayandar and Chandigarh
Final Report (Volume II - Annexure) – Mira Bhayandar
CoE-UT, CRDF, CEPT University, KL Campus, University Road, Navrangpura, Ahmedabad-380009, India Page 43
Annexure 5: Evaluation of Proposed Network Scenarios

Service and Business Plan for City Bus Operations for Mira Bhayandar and Chandigarh
Final Report (Volume II - Annexure) – Mira Bhayandar
CoE-UT, CRDF, CEPT University, KL Campus, University Road, Navrangpura, Ahmedabad-380009, India Page 44
1. Evaluation of Proposed Network Scenarios
Evaluation Framework was prepared and has been used for comparative analysis of the three scenarios.
Each scenario has been evaluated at three levels, i.e. supply indicators and Service Level Benchmark
(SLB) criteria by MoUHA.
1.1 Supply Indicators
The following table shows the evaluation of the three scenarios with respect to supply characteristics -
public transport network and area coverage, service headways, fleet size requirements, high frequency
network coverage. Assessment year has been considered as 2023.
Table 3: Scenario evaluation based on supply analysis
Indicators BAU Scenario_1 Scenario_2
No. of routes 21 39 22
No. of routes with headway <=10 min 3 (14%) 5 (13%) 11 (50%)
No. of routes with headway <=15 min (& >10min) 6 (29%) 4 (10%) 11 (50%)
No. of routes with headway <=20 min (& >15min) 2 (10%) 18 (46%) 0
No. of routes with headway >20 min 10 (48%) 12 (31%) 0
PT Network length - km 96 105 111
PT network length (km) <=10 min 9 (10%) 16 (15%) 82.8 (74%)
PT network length (km) <=15 min 30 (31%) 8 (8%) 28.9 (26%)
PT network length (km) <=20 min 4 (4%) 61 (58%) 0
PT network length (km) >20 min 54 (56%) 19 (18%) 0
Developed area coverage 20 (91%) 20.7 (94%) 20.8 (94%)
Accessibility to PT service
FY2023 Population served total PT network within 500mt. 12,31,285 12,84,819 12,47,474
% Population served total PT network within 500mt. 92% 96% 93%
% population served with high frequency service (<=10min) 27% 50% 90%
Total number of PT stops served 274 285 336
No of PT stops with effective <=10min bus route 100 (36%) 188 (65%) 258 (77%)
(Stops with avg. 5min waiting time)
Fleet size (On road) 79 190 234
The maps below show the spatial network and area coverage.

Service and Business Plan for City Bus Operations for Mira Bhayandar and Chandigarh
Final Report (Volume II - Annexure) – Mira Bhayandar
CoE-UT, CRDF, CEPT University, KL Campus, University Road, Navrangpura, Ahmedabad-380009, India Page 45
BAU scenario Scenario 1 Scenario 2
Figure 55: Scenario comparison: Public transport network and developed area coverage

Service and Business Plan for City Bus Operations for Mira Bhayandar and Chandigarh
Final Report (Volume II - Annexure) – Mira Bhayandar
CoE-UT, CRDF, CEPT University, KL Campus, University Road, Navrangpura, Ahmedabad-380009, India Page 46
BAU scenario Scenario 1 Scenario 2
Figure 56: Scenario comparison: Proposed Public transport service levels and routes structure

Service and Business Plan for City Bus Operations for Mira Bhayandar and Chandigarh
Final Report (Volume II - Annexure) – Mira Bhayandar
CoE-UT, CRDF, CEPT University, KL Campus, University Road, Navrangpura, Ahmedabad-380009, India Page 47
1.2 Model Outputs
The PT model outputs were also used to compare the four scenarios. The analysis has been undertaking for the year 2023 where about 30% shift from IPT is
assumed. The purpose of this exercise is only to see how different scenarios perform with the same demand. However detail demand analysis has been
conducted in Business Plan section.
It can be seen from the table below that average trip length is about 3.7 km. with such trip lengths and looking at city structure, for such a short trip length
transfers becomes very critical. Scenario 2 offers less transfer compared to BAU and Scenario 1. Scenario 3 also scores well marginally compared to BAU
and Scenario1.
Table 4: Bus procurement phasing plan – Scenario 2
BAU Scenario 1 Scenario 2
Total PT demand assigned (FY2023) 1,45,191 1,45,191 1,45,191
Demand not served by PT 1,686 65 0
Total Boarding in system 2,22,700 2,29,346 1,90,422
Transfer rate 1.53 1.58 1.31
Avg. trip length per passenger 3.81 3.72 3.70
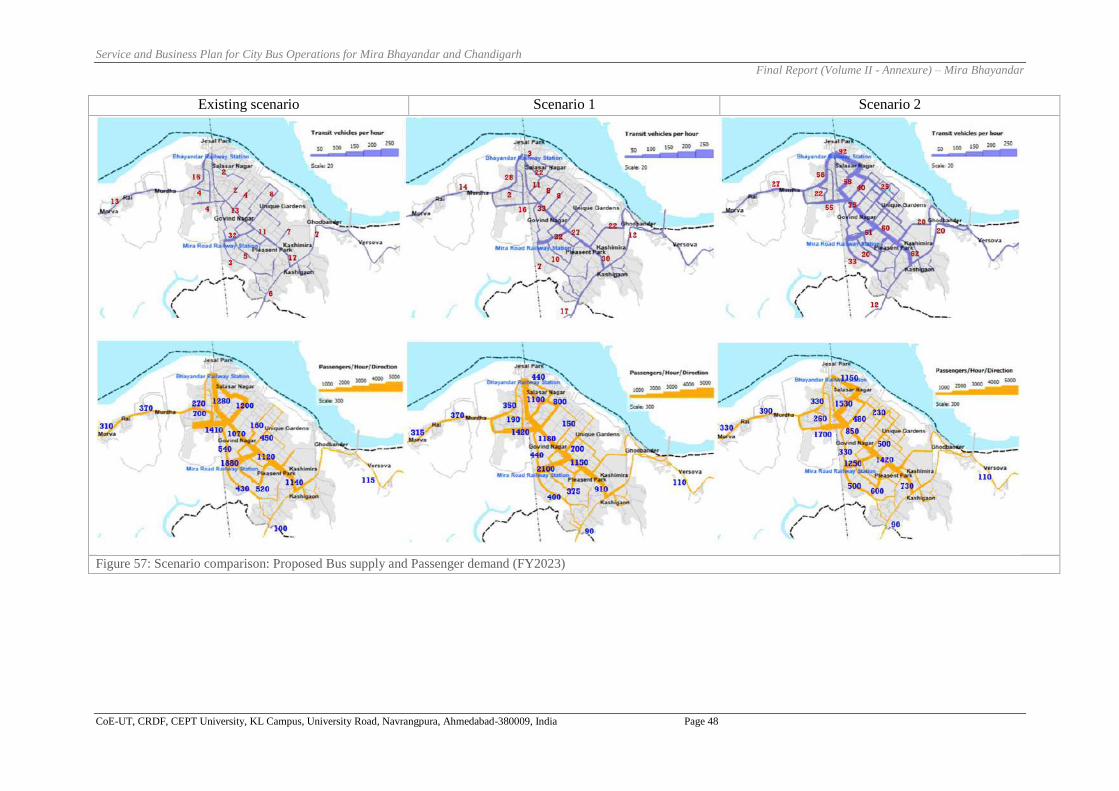
The figures below show the bus supply and demand on the network. Scenario 2 seems to have better distribution of flows rather than it getting concentrated
on Mira road.
1.3 Service Level Benchmark
In addition to the above, MoHUA’s Service Level Benchmark indicators for urban public transport have been used to evaluate the scenarios. Scenario 2
performs better with respect to waiting time, fleet size and service coverage levels. The outputs are shown in the table below.
Service and Business Plan for City Bus Operations for Mira Bhayandar and Chandigarh
Final Report (Volume II - Annexure) – Mira Bhayandar
CoE-UT, CRDF, CEPT University, KL Campus, University Road, Navrangpura, Ahmedabad-380009, India Page 48
Existing scenario Scenario 1 Scenario 2
Figure 57: Scenario comparison: Proposed Bus supply and Passenger demand (FY2023)

Service and Business Plan for City Bus Operations for Mira Bhayandar and Chandigarh
Final Report (Volume II - Annexure) – Mira Bhayandar
CoE-UT, CRDF, CEPT University, KL Campus, University Road, Navrangpura, Ahmedabad-380009, India Page 49
Table 5: Scenario Evaluation based on SLB indicators – Scenario 2
Service Level Benchmark BAU Scenario 1 Scenario 2 Service
Standards
1 Presence of Organized Public Transport System in Urban Area (%)
Total number of buses operating on road (a) 79 190 234 >=60% 1
Total number of buses under the ownership of STU/SPV or under concession agreement (b) 79 190 234 40-60% 2
Presence of Organized Public Transport System in Urban Area(%)=(b/a)*100 100% 100% 100% 20-40% 3
SLB levels obtained 1 1 1 <20% 4
2 Extent of supply availability of public transport
No. of Buses available in a city on any day (a) 79 190 234 >0.4 1
Total Population of the study area (b) - FY 2023 Population 13,38,353 13,38,353 13,38,353 0.25-0.4 2
Availability of Public transport/1000 population= (a/b)*1000 0.06 0.14 0.17 0.1-0.25 3
SLB levels obtained 4 3 3 <0.1 4
3 Service Coverage of Public Transport in Study Area
Total length in road km of the corridor on which public transport system ply in the study area (in km) (a) (Corridors along which the service frequency is one hour or less are only consider compute the length)
57 69 116.26 >=1 1
Total study area (Sq.km) (b) --> Total road network length in the study area (km) 197 197 197 0.7-1 2
Service coverage =(a/b) 0.3 0.4 0.6 0.3-0.7 3
SLB levels obtained 3 3 3 <0.3 4
4 Average Waiting time for Public Transport Users (min) <=4 1
Waiting time for headway 6.1 4.6 2.5 4-8 2
Calculate the average waiting time of passenger for each route as half of the average headway for that particular route.
8-12 3
SLB levels obtained 2 2 1 >12 4
Service and Business Plan for City Bus Operations for Mira Bhayandar and Chandigarh
Final Report (Volume II - Annexure) – Mira Bhayandar
CoE-UT, CRDF, CEPT University, KL Campus, University Road, Navrangpura, Ahmedabad-380009, India Page 50
Annexure 6: Proposed routes frequency and fleet requirement for fleet mix scenarios
Service and Business Plan for City Bus Operations for Mira Bhayandar and Chandigarh
Final Report (Volume II - Annexure) – Mira Bhayandar
CoE-UT, CRDF, CEPT University, KL Campus, University Road, Navrangpura, Ahmedabad-380009, India Page 51
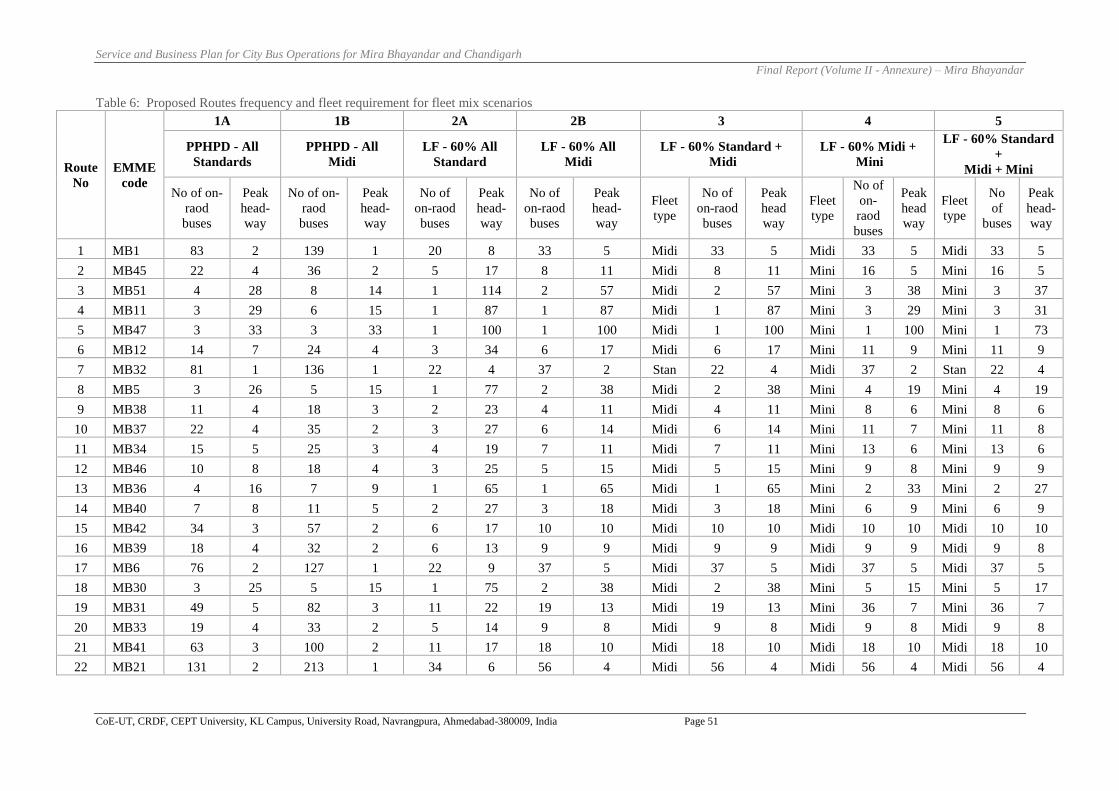
Table 6: Proposed Routes frequency and fleet requirement for fleet mix scenarios
Route
No
EMME
code
1A 1B 2A 2B 3 4 5
PPHPD - All
Standards
PPHPD - All
Midi
LF - 60% All
Standard
LF - 60% All
Midi
LF - 60% Standard +
Midi
LF - 60% Midi +
Mini
LF - 60% Standard
+
Midi + Mini
No of on-
raod
buses
Peak
head-
way
No of on-
raod
buses
Peak
head-
way
No of
on-raod
buses
Peak
head-
way
No of
on-raod
buses
Peak
head-
way
Fleet
type
No of
on-raod
buses
Peak
head
way
Fleet
type
No of
on-
raod
buses
Peak
head
way
Fleet
type
No
of
buses
Peak
head-
way
1 MB1 83 2 139 1 20 8 33 5 Midi 33 5 Midi 33 5 Midi 33 5
2 MB45 22 4 36 2 5 17 8 11 Midi 8 11 Mini 16 5 Mini 16 5
3 MB51 4 28 8 14 1 114 2 57 Midi 2 57 Mini 3 38 Mini 3 37
4 MB11 3 29 6 15 1 87 1 87 Midi 1 87 Mini 3 29 Mini 3 31
5 MB47 3 33 3 33 1 100 1 100 Midi 1 100 Mini 1 100 Mini 1 73
6 MB12 14 7 24 4 3 34 6 17 Midi 6 17 Mini 11 9 Mini 11 9
7 MB32 81 1 136 1 22 4 37 2 Stan 22 4 Midi 37 2 Stan 22 4
8 MB5 3 26 5 15 1 77 2 38 Midi 2 38 Mini 4 19 Mini 4 19
9 MB38 11 4 18 3 2 23 4 11 Midi 4 11 Mini 8 6 Mini 8 6
10 MB37 22 4 35 2 3 27 6 14 Midi 6 14 Mini 11 7 Mini 11 8
11 MB34 15 5 25 3 4 19 7 11 Midi 7 11 Mini 13 6 Mini 13 6
12 MB46 10 8 18 4 3 25 5 15 Midi 5 15 Mini 9 8 Mini 9 9
13 MB36 4 16 7 9 1 65 1 65 Midi 1 65 Mini 2 33 Mini 2 27
14 MB40 7 8 11 5 2 27 3 18 Midi 3 18 Mini 6 9 Mini 6 9
15 MB42 34 3 57 2 6 17 10 10 Midi 10 10 Midi 10 10 Midi 10 10
16 MB39 18 4 32 2 6 13 9 9 Midi 9 9 Midi 9 9 Midi 9 8
17 MB6 76 2 127 1 22 9 37 5 Midi 37 5 Midi 37 5 Midi 37 5
18 MB30 3 25 5 15 1 75 2 38 Midi 2 38 Mini 5 15 Mini 5 17
19 MB31 49 5 82 3 11 22 19 13 Midi 19 13 Mini 36 7 Mini 36 7
20 MB33 19 4 33 2 5 14 9 8 Midi 9 8 Midi 9 8 Midi 9 8
21 MB41 63 3 100 2 11 17 18 10 Midi 18 10 Midi 18 10 Midi 18 10
22 MB21 131 2 213 1 34 6 56 4 Midi 56 4 Midi 56 4 Midi 56 4

Service and Business Plan for City Bus Operations for Mira Bhayandar and Chandigarh
Final Report (Volume II - Annexure) – Mira Bhayandar
CoE-UT, CRDF, CEPT University, KL Campus, University Road, Navrangpura, Ahmedabad-380009, India Page 52
Annexure 7: Operating cost estimates, revenue estimation, operating ratio and load
factor for fleet mix scenarios

Service and Business Plan for City Bus Operations for Mira Bhayandar and Chandigarh
Final Report (Volume II - Annexure) – Mira Bhayandar
CoE-UT, CRDF, CEPT University, KL Campus, University Road, Navrangpura, Ahmedabad-380009, India Page 53
Table 7: Operating cost estimates, revenue estimation, operating ratio and load factor for fleet mix scenarios
Built Up
Cost (by component) per Km
Total Annual
Veh. Km
Total
No of
Buses
Total
Operational
Cost (inc.
Depr & Cost
of fund)
(in crore)
Total
Operational
Cost (w/o
Depr & Cost
of fund)
(in crore)
Total
Revenue
(with
Concession
&
Discount)
(in crore)
Operating Ratio
(Revenue/ Op.Cost
w/o Depr & Cost of
fund)
Load
Factors Fuel Cost R & M
Cost
Insurance
+ MVT +
MACT +
RR Tax
Staff
Cost
ITMS
Operating
Cost
Cost of
Depreciation
- Total
Cost of
Fund -
(Expected
returns
and
Interests)
Miscellaneous
Cost
CPKM (with
depreciation
and Interest)
Scenario 1A: Demand based (PPHPD) - All Standard buses
FY2023 33.13 15.20 1.63 21.23 0.81 7.42 7.12 4.19 90.73 1,27,60,400 162 116 97 21 0.22 0.12
FY2024 34.48 14.63 2.12 21.86 0.49 9.76 8.77 4.45 96.55 2,26,66,500 285 219 177 36 0.20 0.12
FY2025 37.13 15.98 2.12 22.73 0.50 9.76 7.36 4.55 100.14 2,26,66,500 285 227 188 68 0.36 0.20
FY2026 39.31 16.38 2.29 24.62 0.32 10.59 8.17 4.81 106.50 3,88,68,850 509 414 341 97 0.28 0.17
FY2027 42.34 17.89 2.29 25.61 0.33 10.59 6.65 4.93 110.62 3,88,68,850 509 430 363 132 0.36 0.20
FY2028 44.82 18.34 2.41 26.63 0.29 11.17 6.66 5.09 115.41 4,81,87,300 631 556 470 150 0.32 0.18
FY2029 48.29 20.03 2.41 27.69 0.29 11.17 5.33 5.23 120.45 4,81,87,300 631 580 501 195 0.39 0.20
FY2030 51.12 20.54 2.41 28.80 0.26 11.17 5.33 5.36 125.00 5,66,66,250 743 708 615 203 0.33 0.18
Totals/ Average 112.52 28,88,71,950
3,250 2,752 901 0.33 0.17
Scenario 1B: Demand based (PPHPD) - All Midi buses
FY2023 21.54 12.70 1.01 21.12 0.58 4.57 4.39 3.19 69.10 1,83,85,050 233 127 111 21 0.19 0.12
FY2024 20.13 12.54 1.19 21.81 0.33 5.48 4.92 3.20 69.60 3,57,62,700 449 249 212 36 0.17 0.12
FY2025 21.53 13.70 1.19 22.68 0.34 5.48 4.13 3.29 72.34 3,57,62,700 449 259 224 68 0.30 0.20
FY2026 21.78 13.68 1.25 24.62 0.22 5.77 4.45 3.39 75.16 6,31,30,400 827 474 410 97 0.24 0.17
FY2027 23.29 14.93 1.25 25.61 0.23 5.77 3.62 3.48 78.17 6,31,30,400 827 493 434 132 0.30 0.20
FY2028 23.88 15.04 1.29 26.63 0.20 5.96 3.55 3.53 80.07 7,99,20,400 1047 640 564 150 0.27 0.18
FY2029 25.51 16.42 1.29 27.69 0.20 5.96 2.84 3.64 83.56 7,99,20,400 1047 668 597 195 0.33 0.20
FY2030 27.01 16.84 1.29 28.80 0.18 5.96 2.84 3.73 86.65 9,40,24,000 1232 815 732 203 0.28 0.18
Totals/ Average 79.25 47,00,36,050
3,725 3,284 901 0.27 0.17
Scenario 2A: All Standard Buses - 60%LF in 2030
FY2023 33.71 16.19 0.99 21.50 1.43 4.39 4.21 3.96 86.37 70,51,800 91 61 55 17 0.31 0.18
FY2024 35.08 15.58 1.67 22.05 1.15 7.65 6.85 4.32 94.36 90,66,600 115 86 72 20 0.28 0.17
FY2025 37.78 17.02 1.67 22.94 1.18 7.65 5.75 4.44 98.43 90,66,600 115 89 77 29 0.38 0.21
FY2026 40.00 17.45 2.01 24.62 0.95 9.24 6.78 4.75 105.79 1,16,69,050 153 123 105 36 0.34 0.20
FY2027 43.10 19.05 2.01 25.61 0.97 9.24 5.45 4.88 110.30 1,16,69,050 153 129 112 46 0.41 0.23
FY2028 44.82 18.34 2.41 26.63 0.99 11.17 6.00 5.09 115.45 1,17,53,000 154 136 116 50 0.43 0.25
FY2029 48.29 20.03 2.41 27.69 1.02 11.17 4.77 5.23 120.62 1,17,53,000 154 142 123 63 0.51 0.26
FY2030 52.05 21.87 2.41 28.80 0.89 11.17 5.03 5.47 127.70 1,38,51,750 182 177 154 65 0.42 0.23
Totals/ Average 109.71 8,58,80,850
942 814 326 0.40 0.22
Scenario 2B: All Midi Buses - 60%LF in 2030
FY2023 26.29 14.71 0.67 21.40 1.19 2.95 2.83 3.36 73.41 84,78,950 109 62 57 19 0.33 0.20
FY2024 22.58 13.46 1.03 21.95 0.80 4.68 4.23 3.29 72.01 1,33,48,050 169 96 84 27 0.32 0.22
FY2025 24.20 14.69 1.03 22.83 0.82 4.68 3.55 3.39 75.20 1,33,48,050 169 100 89 45 0.51 0.33
FY2026 23.29 14.22 1.17 24.62 0.59 5.34 4.02 3.44 76.69 1,94,76,400 255 149 131 61 0.46 0.32
FY2027 24.93 15.53 1.17 25.61 0.61 5.34 3.25 3.54 79.97 1,94,76,400 255 156 139 81 0.58 0.38
FY2028 23.88 15.04 1.29 26.63 0.58 5.96 3.25 3.53 80.16 2,09,03,550 274 168 148 91 0.61 0.43
FY2029 25.51 16.42 1.29 27.69 0.60 5.96 2.57 3.64 83.68 2,09,03,550 274 175 157 117 0.75 0.46
FY2030 27.27 17.93 1.29 28.80 0.56 5.96 2.50 3.79 88.09 2,32,54,150 305 205 185 122 0.66 0.43
Totals/ Average 79.83 13,91,89,100
1,111 992 563 0.57 0.35

Service and Business Plan for City Bus Operations for Mira Bhayandar and Chandigarh
Final Report (Volume II - Annexure) – Mira Bhayandar
CoE-UT, CRDF, CEPT University, KL Campus, University Road, Navrangpura, Ahmedabad-380009, India Page 54
Built Up
Cost (by component) per Km
Total Annual
Veh. Km
Total
No of
Buses
Total
Operational
Cost (inc.
Depr & Cost
of fund)
(in crore)
Total
Operational
Cost (w/o
Depr & Cost
of fund)
(in crore)
Total
Revenue
(with
Concession
&
Discount)
(in crore)
Operating Ratio
(Revenue/ Op.Cost
w/o Depr & Cost of
fund)
Load
Factors Fuel Cost R & M
Cost
Insurance
+ MVT +
MACT +
RR Tax
Staff
Cost
ITMS
Operating
Cost
Cost of
Depreciation
- Total
Cost of
Fund -
(Expected
returns
and
Interests)
Miscellaneous
Cost
CPKM (with
depreciation
and Interest)
Scenario 3: Standard & Midi Buses - 60%LF in 2030
FY2023 27.28 15.13 0.70 21.41 1.23 3.07 2.95 3.44 75.20 82,27,100 105 62 57 19 0.33 0.20
FY2024 23.78 13.64 1.09 21.96 0.83 4.97 4.48 3.39 74.14 1,27,60,400 161 95 83 27 0.32 0.22
FY2025 25.50 14.90 1.09 22.84 0.85 4.97 3.77 3.49 77.41 1,27,60,400 161 99 88 45 0.52 0.33
FY2026 24.88 14.61 1.25 24.62 0.62 5.71 4.30 3.57 79.56 1,85,52,950 243 148 129 61 0.47 0.32
FY2027 26.66 15.95 1.25 25.61 0.63 5.71 3.48 3.68 82.97 1,85,52,950 243 154 137 81 0.59 0.38
FY2028 25.65 15.32 1.39 26.63 0.61 6.40 3.50 3.67 83.16 1,98,12,200 260 165 145 91 0.63 0.43
FY2029 27.44 16.73 1.39 27.69 0.63 6.40 2.76 3.78 86.81 1,98,12,200 260 172 154 117 0.76 0.46
FY2030 29.35 18.26 1.39 28.80 0.59 6.39 2.68 3.93 91.38 2,19,94,900 288 201 181 122 0.67 0.43
Totals/ Average 82.62 13,24,73,100
1,095 973 563 0.58 0.35
Scenario 4: Midi & Mini Buses - 60%LF in 2030
FY2023 26.02 13.83 0.58 21.40 1.19 2.53 2.43 3.26 71.23 84,78,950 109 60 56 20 0.35 0.23
FY2024 21.55 11.68 0.92 21.92 0.69 4.17 3.81 3.09 67.82 1,55,30,750 196 105 93 31 0.34 0.26
FY2025 23.08 12.75 0.92 22.80 0.71 4.17 3.21 3.19 70.82 1,55,30,750 196 110 99 57 0.58 0.41
FY2026 22.45 12.17 1.01 24.62 0.54 4.64 3.45 3.22 72.10 2,17,43,050 285 157 139 79 0.57 0.45
FY2027 24.02 13.29 1.01 25.61 0.55 4.64 2.78 3.31 75.21 2,17,43,050 285 164 147 106 0.72 0.53
FY2028 23.10 12.61 1.11 26.63 0.52 5.11 2.78 3.29 75.15 2,39,25,750 314 180 161 120 0.75 0.60
FY2029 24.68 13.77 1.11 27.69 0.53 5.11 2.18 3.38 78.45 2,39,25,750 314 188 170 156 0.92 0.65
FY2030 26.37 15.03 1.11 28.80 0.47 5.11 2.29 3.53 82.71 2,81,23,250 369 233 212 162 0.77 0.58
Totals/ Average 75.23 15,90,01,300
1,196 1,077 732 0.68 0.46
Scenario 5: Standard, Midi & Mini Buses - 60%LF in 2030
FY2023 26.72 14.11 0.60 21.41 1.22 2.62 2.51 3.31 72.50 83,11,050 107 60 56 20 0.36 0.23
FY2024 22.83 11.90 0.94 21.94 0.78 4.30 3.90 3.18 69.78 1,36,83,850 173 95 84 31 0.37 0.28
FY2025 24.48 12.99 0.94 22.82 0.80 4.30 3.28 3.28 72.90 1,36,83,850 173 100 89 57 0.63 0.44
FY2026 23.71 12.39 1.07 24.62 0.55 4.92 3.77 3.32 74.35 2,10,71,450 276 157 138 79 0.57 0.44
FY2027 25.39 13.53 1.07 25.61 0.56 4.92 3.06 3.42 77.56 2,10,71,450 276 163 147 106 0.73 0.53
FY2028 24.51 12.73 1.18 26.63 0.53 5.43 3.05 3.39 77.45 2,30,86,250 303 179 159 120 0.76 0.60
FY2029 26.22 13.90 1.18 27.69 0.55 5.43 2.40 3.49 80.85 2,30,86,250 303 187 169 156 0.93 0.65
FY2030 28.02 15.17 1.17 28.80 0.49 5.43 2.46 3.63 85.17 2,71,15,850 355 231 210 162 0.77 0.57
Totals/ Average 77.56 15,11,10,000
1,172 1,052 732 0.70 0.47
All costs are at constant prices taking base year of 2020.