Series 2014B - State of Delaware
249
SUPPLEMENT Dated November 5, 2014 TO OFFICIAL STATEMENT Dated October 22, 2014 regarding $306,870,000 THE STATE OF DELAWARE General Obligation Bonds – Series 2014B The foregoing Official Statement is amended and supplemented as follows: The chart on page 7 of the Official Statement entitled “The 15% Test” is deleted in its entirety and is hereby replaced with the following information: The 15% Test (in millions) Fiscal 2016 (1) General Obligation Debt Service ................................................................. $ 252.1 Less: Excluded Debt Service (2) .................................................................. (65.5) Other Tax-Supported Debt Service (3) ......................................................... 26.9 Total Tax-Supported Debt Service........................................................ $ 213.5 Delaware Transportation Authority (TTF) Debt Service ............................ $ 101.4 Total Debt Service ................................................................................ $ 314.9 Estimated Aggregate Budgetary General Fund and TTF Revenue (4) ......... $ 4,362.8 Total Debt Service as Percent of Total Revenue ......................................... 7.2% ____________________ (1) Year of maximum annual debt service. Totals in column may not add due to rounding. (2) Portion of general obligation debt service to be reimbursed by local school districts and the Trust Fund. (3) Includes projected payments on lease obligations of the State. (4) Based upon September 15, 2014 revenue projections of DEFAC for fiscal year 2016. See “STATE FINANCIAL OPERATIONS - Revenue and Expenditure Forecasting.” The chart on page 8 of the Official Statement entitled “The Cash Balances Test” is deleted in its entirety and is hereby replaced with the following information: The Cash Balances Test (in millions) Fiscal 2016 (1) General Obligation Debt Service ....................................................... $ 252.1 Less: Excluded Debt Service (2) ........................................................ (65.5) Net General Obligation Debt Service ........................................ $ 186.6 Projected Cumulative Cash Balances (3) ............................................ $ 528.3 ____________________ (1) Year of maximum annual debt service. Totals in column may not add due to rounding. (2) Portion of general obligation debt service to be reimbursed by local school districts and the Trust Fund. (3) As estimated by the Secretary of Finance based upon September 15, 2014 budgetary General Fund revenue projections by DEFAC for fiscal year 2016.
-
Upload
khangminh22 -
Category
Documents
-
view
1 -
download
0
Transcript of Series 2014B - State of Delaware

SUPPLEMENT Dated November 5, 2014
TO OFFICIAL STATEMENT Dated October 22, 2014
regarding
$306,870,000 THE STATE OF DELAWARE
General Obligation Bonds – Series 2014B
The foregoing Official Statement is amended and supplemented as follows:
The chart on page 7 of the Official Statement entitled “The 15% Test” is deleted in its entirety and is hereby replaced with the following information:
The 15% Test (in millions)
Fiscal 2016(1) General Obligation Debt Service ................................................................. $ 252.1 Less: Excluded Debt Service (2) .................................................................. (65.5) Other Tax-Supported Debt Service (3) ......................................................... 26.9 Total Tax-Supported Debt Service ........................................................ $ 213.5 Delaware Transportation Authority (TTF) Debt Service ............................ $ 101.4 Total Debt Service ................................................................................ $ 314.9 Estimated Aggregate Budgetary General Fund and TTF Revenue (4) ......... $ 4,362.8 Total Debt Service as Percent of Total Revenue ......................................... 7.2% ____________________ (1) Year of maximum annual debt service. Totals in column may not add due to rounding. (2) Portion of general obligation debt service to be reimbursed by local school districts and the Trust Fund. (3) Includes projected payments on lease obligations of the State. (4) Based upon September 15, 2014 revenue projections of DEFAC for fiscal year 2016. See “STATE FINANCIAL
OPERATIONS - Revenue and Expenditure Forecasting.”
The chart on page 8 of the Official Statement entitled “The Cash Balances Test” is deleted in its entirety and is hereby replaced with the following information:
The Cash Balances Test (in millions)
Fiscal 2016 (1)
General Obligation Debt Service ....................................................... $ 252.1 Less: Excluded Debt Service (2) ........................................................ (65.5) Net General Obligation Debt Service ........................................ $ 186.6 Projected Cumulative Cash Balances (3) ............................................ $ 528.3 ____________________ (1) Year of maximum annual debt service. Totals in column may not add due to rounding. (2) Portion of general obligation debt service to be reimbursed by local school districts and the Trust Fund. (3) As estimated by the Secretary of Finance based upon September 15, 2014 budgetary General Fund revenue
projections by DEFAC for fiscal year 2016.

NEW ISSUE Ratings: Fitch “AAA” Moody’s “Aaa” S&P “AAA”
In the opinion of Bond Counsel, interest on the Bonds (as defined herein) is not includable in gross income for purposes of federal income taxation under existing statutes, regulations, rulings and court decisions, subject to the condition described in “Tax Matters” herein. Interest on the Bonds is not treated as an item of tax preference under Section 57 of the Internal Revenue Code of 1986, as amended (the “Code”) for purposes of the individual and corporate alternative minimum taxes. However, under the Code, such interest may be subject to certain other taxes affecting corporate holders of the Bonds. In addition, under existing statutes, interest on the Bonds is exempt from personal and corporate income taxes imposed by The State of Delaware (the “State” or “Delaware”). For a more complete discussion, see “Tax MaTTeRS” herein.
$306,870,000THE STATE OF DELAWARE
General Obligation Bonds – Series 2014B
Dated: Date of Issuance Due: July 1 as shown onthe Inside Front Cover
The Bonds consist of the $306,870,000 General Obligation Bonds, Series 2014B (the “2014B Bonds” or the “Bonds”). The Bonds are general obligations of the State and the full faith and credit of the State will be pledged for the payment of the principal of and interest on the Bonds.
Interest on the Bonds is payable semiannually on January 1 and July 1 of each year commencing July 1, 2015.
The 2014B Bonds maturing on or after July 1, 2025 are subject to redemption prior to maturity in whole or in part at any time and from time to time, at the option of the State, in any order of maturity and interest rate selected by the State, beginning July 1, 2024, at a redemption price equal to 100% of the principal amount thereof, plus accrued interest as set forth more fully herein.
The Bonds will be issued in book-entry form as fully registered bonds in denominations of $1,000 and integral multiples thereof. The investor will not receive physical delivery of Bond certificates. Principal and interest payments on the Bonds will be paid to The Depository Trust Company or its nominee as record owner of the Bonds and investors should look for payment to the institution from which their Bonds were purchased.
The Bonds are offered when, as and if issued and received by the Underwriters (as defined hereafter) subject to prior sale, to withdrawal or modification of the offer without notice, and subject to the approving legal opinion of Saul Ewing LLP, Bond Counsel, Wilmington, Delaware, and certain other conditions. Certain legal matters will be passed upon for the Underwriters of the Bonds by their counsel Cozen O’Connor, Wilmington, Delaware and Philadelphia, Pennsylvania. It is expected that the Bonds will be available through the facilities of The Depository Trust Company for delivery in New York, New York, on or about November 6, 2014.
J.P. Morgan
BofA Merrill Lynch
Citigroup M&T Securities, Inc.
Morgan Stanley
PNC Capital Markets LLC
Raymond James
RBC Capital Markets
The date of this Official Statement is October 22, 2014.

MATURITIES, AMOUNTS, RATES, YIELDS AND PRICES
2014B Bonds
Maturity (July 1)
Principal Amount ($)
Interest Rate (%)
Yield (%)
Price ($)
CUSIP Number(1) (246381)
2015 11,845,000 3.00 0.11 101.885 DY0 2016 1,025,000 2.00 0.32 102.766 DZ7 2016 10,820,000 4.00 0.32 106.060 EQ6 2017 11,845,000 4.00 0.54 109.100 ER4 2018 710,000 3.00 0.80 107.903 EA1 2018 1,150,000 4.00 0.80 111.496 ES2 2018 23,670,000 5.00 0.80 115.088 FA0 2019 3,030,000 2.00 1.06 104.255 EB9 2019 13,700,000 5.00 1.06 117.839 ET0 2020 305,000 3.00 1.32 109.121 EC7 2020 16,455,000 5.00 1.32 119.979 EU7 2021 255,000 4.00 1.57 115.292 ED5 2021 16,560,000 5.00 1.57 121.585 EV5 2022 825,000 3.00 1.78 108.690 EE3 2022 16,040,000 5.00 1.78 122.939 EW3 2023 26,605,000 5.00 1.92 124.444 FB8 2024 3,260,000 4.00 2.03 117.187 EX1 2024 23,460,000 5.00 2.03 125.913 FC6 2025 16,930,000 5.00 2.12* 125.017* EF0 2026 16,360,000 5.00 2.21* 124.130* EG8 2027 16,395,000 5.00 2.28* 123.444* EH6 2028 3,380,000 4.00 2.60* 111.880* EJ2 2028 13,045,000 5.00 2.35* 122.764* EY9 2029 - - - - - 2030 11,840,000 5.00 2.46* 121.703* EK9 2031 11,840,000 4.50 2.71* 115.110* EL7 2032 11,840,000 3.50 2.99* 104.246* EM5 2033 11,840,000 3.50 3.04* 103.820* EN3 2034 1,740,000 3.00 3.14 97.955 EP8 2034 10,100,000 3.50 3.09* 103.396* EZ6
_______________ * Price and yield are to first call date of July 1, 2024. (1) Copyright 2006, American Bankers Association. CUSIP data herein is provided by Standard & Poor’s, CUSIP Service
Bureau, a division of the McGraw-Hill Companies, Inc. This data is not intended to create a database and does not serve in any way as a substitute for the CUSIP Service. CUSIP numbers are provided for convenience of reference only. Neither the State nor the Underwriters take any responsibility for the accuracy of such CUSIP numbers. The CUSIP number for a specific maturity is subject to being changed after the issuance of the Bonds as a result of various subsequent actions including, but not limited to, a refunding in whole or in part of such maturity.

No dealer, broker, salesperson or other person has been authorized by the State or by the Underwriters to give any information or to make any representation in connection with the Bonds or the matters described herein, other than those contained in this Official Statement, and, if given or made, such other information or representation must not be relied on as having been authorized by the State or by the Underwriters. This Official Statement does not constitute an offer to sell or the solicitation of an offer to buy, nor shall there be any sale of the Bonds by any person in any jurisdiction in which it is unlawful for such person to make such offer, solicitation or sale. The information and expressions of opinion contained herein are subject to change without notice, and neither the delivery of this Official Statement, nor any sale made hereunder, shall, under any circumstances, create any implication that there has been no change in the matters described herein since the date thereof. Only the statements and information contained herein should be considered in making an investment decision with respect to the Bonds. This Official Statement is distributed in connection with the sale of the Bonds and may not be reproduced or used, in whole or in part, for any other purpose. All estimates and assumptions herein have been made on the best information available at the time of issuance and are believed to be reliable, but no representations whatsoever are made that such estimates or assumptions are correct or will be realized. So far as any statements herein involve matters of opinion, whether or not expressly so stated, they are intended merely as such and not as representations of fact. Neither the Official Statement nor any statement which may have been made orally or in writing is to be construed as a contract with the holders of the Bonds. IN CONNECTION WITH THIS OFFERING, THE UNDERWRITERS MAY OVER-ALLOT OR EFFECT TRANSACTIONS WHICH STABILIZE OR MAINTAIN THE MARKET PRICE OF THE BONDS ABOVE THAT WHICH MIGHT OTHERWISE PREVAIL IN THE OPEN MARKET. SUCH STABILIZING, IF COMMENCED, MAY BE DISCONTINUED AT ANY TIME. THE ORDER AND PLACEMENT OF MATERIALS IN THIS OFFICIAL STATEMENT, INCLUDING THE APPENDICES, ARE NOT TO BE DEEMED TO BE A DETERMINATION OF RELEVANCE, MATERIALITY OR IMPORTANCE, AND THIS OFFICIAL STATEMENT, INCLUDING THE APPENDICES, MUST BE CONSIDERED IN ITS ENTIRETY. THE OFFERING OF THE BONDS IS MADE ONLY BY MEANS OF THIS ENTIRE OFFICIAL STATEMENT. The Underwriters of the Bonds have provided the following sentence for inclusion in this Official Statement: The Underwriters of the Bonds have reviewed the information in this Official Statement in accordance with and as part of their responsibilities to investors under the federal securities laws as applied to the facts and circumstances of this transaction, but the Underwriters of the Bonds do not guarantee the accuracy, completeness or fairness of such information.
If and when included in this Official Statement, the words “expects,” “forecasts,” “projects,” “intends,” “anticipates,” “estimates,” “assumes” and analogous expressions are intended to identify forward-looking statements, and any such statements are subject inherently to a variety of risks and uncertainties that could cause actual results to differ materially from those that have been projected. Such forward-looking statements speak only as of the date of this Official Statement. The State disclaims any obligation or undertaking to release publicly any updates or revisions to any forward-looking statement contained herein to reflect any changes in the State’s expectations with regard thereto or any change in events, conditions or circumstances on which any such statement is based. All quotations from and summaries and explanations of provisions of laws and documents described herein do not purport to be complete and reference is made to said laws and documents for full and complete statements of their provisions. Upon issuance, the Bonds will not be registered under the Securities Act of 1933, as amended (the “Act”), or under any state securities laws in reliance upon exemptions contained in such Act or under such state securities laws. The Bonds will not be listed on any stock or other securities exchange. Any registration or qualification of the Bonds in accordance with applicable provisions of securities laws of the states in which the Bonds may be registered or qualified and the exemption from registration or qualification in other states cannot be regarded as a recommendation thereof. Neither the Securities and Exchange Commission nor any other federal, state or other governmental entity or agency, except the State, will have passed upon the accuracy, completeness or adequacy of this Official Statement or approved the Bonds for sale. Any representation to the contrary may be a criminal offense.

[THIS PAGE INTENTIONALLY LEFT BLANK]

-i-
TABLE OF CONTENTS
Page
INTRODUCTION ................................................................................................................................... 1
DESCRIPTION OF THE BONDS ......................................................................................................... 1 General Information ............................................................................................................................................................. 1 Redemption .......................................................................................................................................................................... 1 Authorization and Purpose .................................................................................................................................................. 2
SOURCES AND USES OF FUNDS ...................................................................................................... 4
SECURITY FOR BONDS ...................................................................................................................... 4
DEBT SERVICE REQUIREMENTS .................................................................................................... 5
BONDED INDEBTEDNESS OF THE STATE .................................................................................... 6 Authorization of General Obligation Debt ......................................................................................................................... 6 Debt Limits ........................................................................................................................................................................... 6 General Obligation Debt ...................................................................................................................................................... 8 Authorized but Unissued General Obligation Debt ............................................................................................................ 9 General Obligation Note Debt ............................................................................................................................................. 9 Debt Burden Comparisons ................................................................................................................................................ 10 Build America Bonds and Qualified School Construction Bonds ................................................................................... 13 Sustainable Energy Utility, Inc. Energy Efficiency Revenue Bonds .............................................................................. 13 Qualified Zone Academy Bonds ....................................................................................................................................... 14 State Revenue Debt ............................................................................................................................................................ 14 Lease Obligations ............................................................................................................................................................... 14
INDEBTEDNESS OF AUTHORITIES, UNIVERSITIES AND POLITICAL SUBDIVISIONS ....................................................................................................................... 14
Authorities .......................................................................................................................................................................... 15 Universities ......................................................................................................................................................................... 16 Political Subdivisions ......................................................................................................................................................... 17
ECONOMIC BASE ............................................................................................................................... 17 Recent History .................................................................................................................................................................... 18 Population ........................................................................................................................................................................... 19 Major Political Subdivisions ............................................................................................................................................. 19 Personal Income ................................................................................................................................................................. 20 Unemployment Rates ......................................................................................................................................................... 20 Employment ....................................................................................................................................................................... 21 Chemical and Advanced Materials Industry ..................................................................................................................... 23 Life Sciences ...................................................................................................................................................................... 25 Research and Development ............................................................................................................................................... 27 Biotechnology .................................................................................................................................................................... 28 Financial Services Industry ................................................................................................................................................ 30 Construction ....................................................................................................................................................................... 31 Incorporations ..................................................................................................................................................................... 31 Agriculture .......................................................................................................................................................................... 32 The Port of Wilmington ..................................................................................................................................................... 33 Dover Air Force Base ........................................................................................................................................................ 34
STATE FINANCIAL OPERATIONS .................................................................................................. 34

-ii-
Revenue and Expenditure Forecasting .............................................................................................................................. 34 Economic Projections ........................................................................................................................................................ 35 Revenue Summary - Fiscal Year 2015E - Fiscal Year 2017E ......................................................................................... 36 Expenditure Summary - Fiscal Year 2012 - Fiscal Year 2015E ...................................................................................... 38 Sources and Uses of State Funds ....................................................................................................................................... 39
CUMULATIVE CASH BALANCES .................................................................................................. 41
FISCAL YEAR ENDED JUNE 30, 2013 ............................................................................................ 42 Revenue ............................................................................................................................................................................. 42 Expenditures ....................................................................................................................................................................... 42 Balances ............................................................................................................................................................................. 43
FISCAL YEAR ENDED JUNE 30, 2014 ............................................................................................ 44 Revenue ............................................................................................................................................................................. 44 Expenditures ....................................................................................................................................................................... 44 Balances ............................................................................................................................................................................. 45
FISCAL YEAR ENDING JUNE 30, 2015 ........................................................................................... 46 Revenue ............................................................................................................................................................................. 46 Appropriations .................................................................................................................................................................... 46 Balances ............................................................................................................................................................................. 47
TOBACCO SETTLEMENT ................................................................................................................. 48
FINANCIAL STRUCTURE ................................................................................................................. 48 General ............................................................................................................................................................................. 48 Budget Process ................................................................................................................................................................... 49 Appropriation Limit ........................................................................................................................................................... 49 Budget Reserve Account ................................................................................................................................................... 50 Tax Limitations .................................................................................................................................................................. 50 Internal Control Structure .................................................................................................................................................. 50 Tax Collection Procedures ................................................................................................................................................. 51 Risk Management .............................................................................................................................................................. 52 Cash Management .............................................................................................................................................................. 52
BUDGETARY GENERAL FUND SUMMARIES............................................................................. 52 Principal Receipts by Category ......................................................................................................................................... 52 Additional Sources of Revenue ......................................................................................................................................... 55 Budgetary General Fund Disbursements by Category of Expense ................................................................................. 56 Budgetary General Fund Disbursements by Purpose ....................................................................................................... 56 Public Education ................................................................................................................................................................ 56 Higher Education ............................................................................................................................................................... 57 Social Services ................................................................................................................................................................... 57 Children's Services ............................................................................................................................................................. 60 Corrections ......................................................................................................................................................................... 60
BUDGETARY SPECIAL FUNDS SUMMARIES ............................................................................. 60 Local School Property Taxes and Assessed Valuation .................................................................................................... 60 Unemployment Compensation .......................................................................................................................................... 61 Federal Grants, Benefits and Reimbursements ................................................................................................................. 61 Pension Fund Receipts ....................................................................................................................................................... 62 Social Security Fund Receipts ........................................................................................................................................... 62 Bond and Note Sales .......................................................................................................................................................... 62

-iii-
DEFERRED COMPENSATION PROGRAM .................................................................................... 62
STATE PENSION PLAN ..................................................................................................................... 63 Summary of Pension Contribution Funding Policy ......................................................................................................... 66 General Funding Practices ................................................................................................................................................. 67 Pension Plan Investment Policy and Practices ................................................................................................................. 68 Litigation, Investigations and Labor Relations ................................................................................................................. 68 Transfers of Investment Earnings ...................................................................................................................................... 68 Pension Plan Reserves ....................................................................................................................................................... 68 Pension Obligation Bonds ................................................................................................................................................. 69 Other Relevant Reports ...................................................................................................................................................... 69
OTHER POST EMPLOYMENT BENEFITS ..................................................................................... 69
EMPLOYEE RELATIONS ................................................................................................................... 70
GOVERNANCE .................................................................................................................................... 71
LITIGATION ......................................................................................................................................... 72
THE BOOK-ENTRY ONLY SYSTEM ............................................................................................... 72
APPROVAL OF LEGAL MATTERS ................................................................................................. 74
TAX MATTERS .................................................................................................................................... 74
CHANGES IN FEDERAL TAX LAW ................................................................................................ 76
OPINIONS AND CERTIFICATES AVAILABLE ON DELIVERY OF THE BONDS ................. 77
INDEPENDENT AUDITORS .............................................................................................................. 77
FINANCIAL ADVISOR ....................................................................................................................... 77
RATINGS ............................................................................................................................................... 78
UNDERWRITING................................................................................................................................. 78
VERIFICATION OF MATHEMATICAL COMPUTATIONS ......................................................... 79
CONTINUING DISCLOSURE UNDERTAKING ............................................................................. 79
CERTAIN RELATIONSHIPS .............................................................................................................. 81
APPENDIX A: SUMMARY OF CASH BASIS FINANCIAL STATEMENTS For Fiscal Years 2010 through 2014 ........................................................................ A-1 APPENDIX B: BASIC FINANCIAL STATEMENTS For The Year Ended June 30, 2013 .......................................................................... B-1 APPENDIX C: CONTINUING DISCLOSURE AGREEMENT ...................................................... C-1 APPENDIX D: FORM OF OPINION OF BOND COUNSEL ......................................................... D-1

[THIS PAGE INTENTIONALLY LEFT BLANK]
OFFICIAL STATEMENT of
THE STATE OF DELAWARE
$306,870,000 THE STATE OF DELAWARE
General Obligation Bonds – Series 2014B
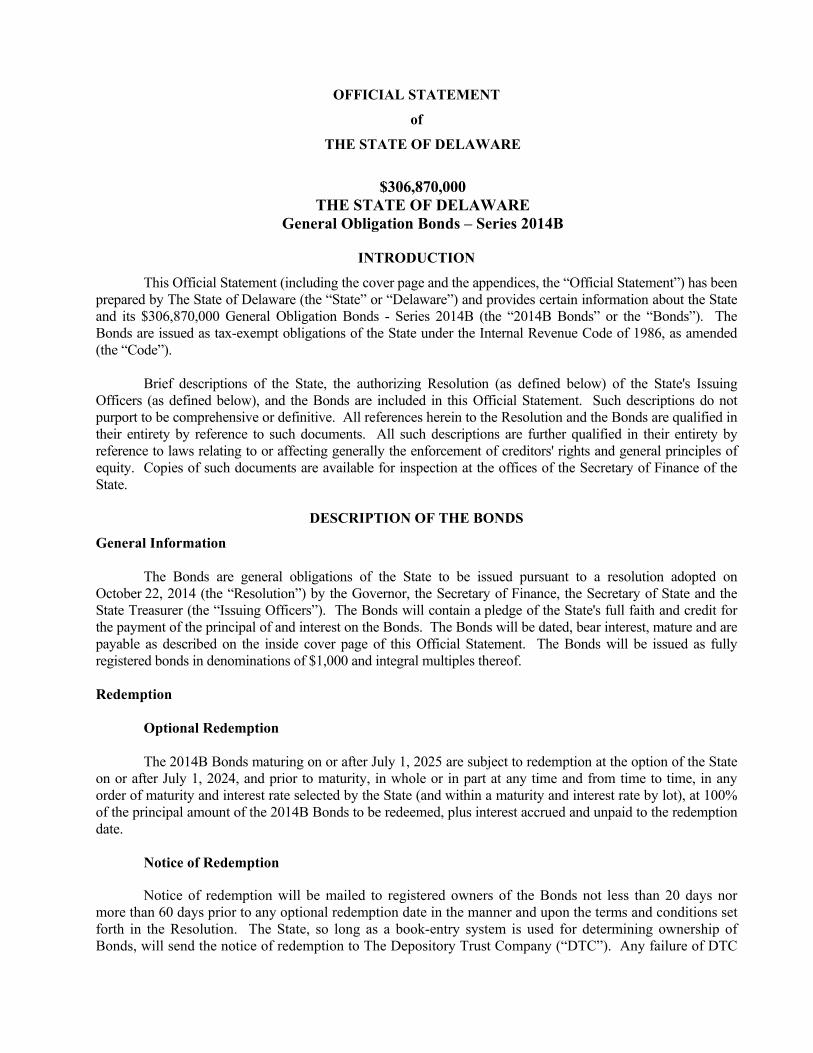
INTRODUCTION This Official Statement (including the cover page and the appendices, the “Official Statement”) has been prepared by The State of Delaware (the “State” or “Delaware”) and provides certain information about the State and its $306,870,000 General Obligation Bonds - Series 2014B (the “2014B Bonds” or the “Bonds”). The Bonds are issued as tax-exempt obligations of the State under the Internal Revenue Code of 1986, as amended (the “Code”). Brief descriptions of the State, the authorizing Resolution (as defined below) of the State's Issuing Officers (as defined below), and the Bonds are included in this Official Statement. Such descriptions do not purport to be comprehensive or definitive. All references herein to the Resolution and the Bonds are qualified in their entirety by reference to such documents. All such descriptions are further qualified in their entirety by reference to laws relating to or affecting generally the enforcement of creditors' rights and general principles of equity. Copies of such documents are available for inspection at the offices of the Secretary of Finance of the State.
DESCRIPTION OF THE BONDS General Information The Bonds are general obligations of the State to be issued pursuant to a resolution adopted on October 22, 2014 (the “Resolution”) by the Governor, the Secretary of Finance, the Secretary of State and the State Treasurer (the “Issuing Officers”). The Bonds will contain a pledge of the State's full faith and credit for the payment of the principal of and interest on the Bonds. The Bonds will be dated, bear interest, mature and are payable as described on the inside cover page of this Official Statement. The Bonds will be issued as fully registered bonds in denominations of $1,000 and integral multiples thereof. Redemption
Optional Redemption
The 2014B Bonds maturing on or after July 1, 2025 are subject to redemption at the option of the State on or after July 1, 2024, and prior to maturity, in whole or in part at any time and from time to time, in any order of maturity and interest rate selected by the State (and within a maturity and interest rate by lot), at 100% of the principal amount of the 2014B Bonds to be redeemed, plus interest accrued and unpaid to the redemption date.
Notice of Redemption
Notice of redemption will be mailed to registered owners of the Bonds not less than 20 days nor more than 60 days prior to any optional redemption date in the manner and upon the terms and conditions set forth in the Resolution. The State, so long as a book-entry system is used for determining ownership of Bonds, will send the notice of redemption to The Depository Trust Company (“DTC”). Any failure of DTC

-2-
to mail such notice to any DTC participant will not affect the validity of the redemption of the Bonds. If at the time of mailing of a notice of redemption, the State shall not have deposited with the bank or depositary acting as refunding escrow agent money sufficient to redeem all Bonds called for redemption, the notice of redemption may state that it is conditional, i.e., that it is subject to the deposit of sufficient redemption money with a refunding escrow agent not later than the redemption date, and such notice shall be of no effect unless such money is so deposited. Authorization and Purpose The Bonds are issued pursuant to the State Constitution, statutes of the State, including acts of the General Assembly (the “General Assembly”) authorizing the issuance of the Bonds (the “Authorization Acts”) and the Resolution. A portion of the proceeds of the Bonds will be applied to pay for various capital facilities of the State and to provide financing for other capital projects, as authorized by the Authorization Acts. The remaining portion of the proceeds of the Bonds will be applied to advance refund to maturity or the optional call date the State’s general obligation bonds identified below (the “Refunded Bonds”).
Schedule of Refunded Bonds
Series Maturities Principal Amount
Date of Optional Call
Redemption Price
2009A January 1, 2016* at 2.50%; 2016* at 4.00%; 2017*; 2019 at 3.00%; 2020-2029, inclusive $39,570,000 01/01/2017 100%
2009B January 1, 2019-2026, inclusive 29,350,000 01/01/2017 100%
2011 July 1, 2015* at 2.00%; 2017* at 2.25%; 2023 and 2024 20,352,000 07/01/2020 100%
* All bonds with an asterisk were partially funded to maturity with the exception of the Series 2009A bond maturing January 1, 2016 at 2.5% that was fully funded to maturity. In order to provide for the funding to maturity or refunding of the Refunded Bonds, the State will use a portion of the proceeds of the Bonds, together with certain other available moneys, to purchase United States Treasury Obligations, State and Local Government Series, or other direct obligations of, or obligations the principal of and the interest on which are unconditionally guaranteed by, the United States Government (the “Government Securities”), the principal of which together with interest payable thereon will be sufficient to pay when due the interest on the Refunded Bonds on or prior to the maturity date or call date, as the case may be, and principal, to redeem on such call date Refunded Bonds which become due after such date. Neither the maturing principal of the Government Securities nor the interest thereon will secure or be available for the payment of principal of, interest or redemption premium, if any, on any obligations of the State other than the Refunded Bonds. The Government Securities are to be held in a trust fund (the “Escrow Fund”) by U.S. Bank National Association, as escrow agent (the “Escrow Agent”) pursuant to an Escrow Agreement to be dated November 6, 2014 (the “Escrow Agreement”) between the State and the Escrow Agent for the benefit of the holders of the Refunded Bonds. National School Lunch Program
Approximately $106,000,000 of the principal amount of the Bonds will be used to finance the construction of (including any related demolition), renovations to and acquisition of land for certain local public school facilities. Approximately $26,000,000 will finance projects in New Castle County, $24,000,000 in Kent County, and $56,000,000 in Sussex County. The entire principal amount of Bonds with CUSIP No. 246381 EQ6, 246381 ER4, 246381 EJ2, 246381 EL7, 246381 EM5, 246381 EN3 and 246381 EZ6 and a portion of each of the remaining maturities are allocated to and deemed to finance a portion of the costs of the capital facilities described in the table below, which sets forth for certain local public schools,

-3-
each such school’s name by school district, each school’s address and county of location and the percentage of students within each school that is eligible for free and reduced price meals (the “National School Lunch Program”). A majority of students attending the schools listed below are expected to be eligible to participate in the National School Lunch Program. Each school district maintains data pertaining to students who are eligible for such free and reduced price meals.
School District/Name Street Address Zip Code County
Percent of Students Eligible for the National School
Lunch Program* Cape Henlopen School District
Mariner Middle School 16391 Harbeson Road, Milton, DE 19968 Sussex 61.0% Beacon Middle School 19483 John Williams Hwy, Lewes, DE. 19958 Sussex 56.9%
Capital School District Booker T. Washington Elementary School 901 Forest Street, Dover DE 19904 Kent 69.5% Central Middle School 211 Delaware Avenue, Dover, DE 19901 Kent 67.8% Main Building 65-1 Carve Road, Dover, DE 19904 Kent 64.0% New 1,800 Student High School One Dover High Drive, Dover, DE 19901 Kent 66.9%
Indian River School District East Millsboro Elem. School 29346 Iron Branch Road, Millsboro, DE 19966 Sussex 64.7% Georgetown Elem. & Mid. School 301 West Market Street, Georgetown, DE 19947 Sussex 74.3% Phillip Showell Elem. School 41 Bethany Road, Selbyville, DE 19975 Sussex 73.4% Selbyville Middle School 80 Bethany Road, Selbyville, DE 19975 Sussex 58.9% Long Neck Elementary School 26064 School Lane, Millsboro, DE 19966 Sussex 75.2% North Georgetown Elementary School 664 North Bedford Street, Georgetown, DE 19947 Sussex 82.5%
Lake Forest School District Central Elementary School 5424 Killens Pond Road, Felton, DE 19943 Kent 56.1% East Elementary School 124 West Front Street, Frederica, DE 19946 Kent 58.6% Lake Forest High School 5407 Killens Pond Road, Felton, DE 19943 Kent 51.1% North Elementary School 319 East Main Street, Felton, DE 19943 Kent 57.1% South Elementary School 301 Dorman Street, Harrington, DE 19952 Kent 68.2% W.T. Chipman Middle School 101 West Center Street, Harrington, DE 19952 Kent 55.9%
Laurel School District North Laurel Elementary School 300 S Wilson Street, Laurel, DE 19956 Sussex 71.6% New Combined Middle & High Schools Adjacent to 1133 S Central Avenue, Laurel, DE 19956 Sussex 71.6% Laurel Intermediate Middle School 801 S. Central Avenue, Laurel, DE 19956 Sussex 71.6%
NCC Vocational Technical School District Delcastle Technical High School 1417 Newport Road, Wilmington, DE 19804 New Castle 55.6%
Red Clay School District New 600 Student Elementary School Graves Road & Newport Gap Pike, Hockessin, DE 19707 New Castle 52.4% A.I. DuPont Middle School 3130 Kennett Pike, Wilmington, DE 19807 New Castle 86.4% Dickinson High School 1801 Milltown Road, Wilmington, DE 19808 New Castle 62.4% Forest Oak High School 55 Meadowood Drive, Newark, DE 19711 New Castle 53.2% Marbrook Elementary School 2101 Centerville Road, Wilmington DE 19808 New Castle 84.5% Mote Elementary School 2112 Edwards Avenue, Wilmington, DE 19808 New Castle 86.0% Richardson Park Elementary School 16 Idella Avenue, Wilmington, DE 19804 New Castle 86.3% Richey Elementary School 105 Highland Avenue, Wilmington, DE 19804 New Castle 61.2% Shortlidge Elementary School 100 West 18th Street, Wilmington, DE 19802 New Castle 89.0% Stanton Middle School 1800 Limestone Road, Wilmington, DE 19804 New Castle 82.6% Warner Elementary School 820 West 19th Street, Wilmington, DE 19802 New Castle 92.4%
Smyrna School District John Bassett Moore Intermediate School 20 West Frazier Street, Smyrna, DE 19977 Kent 54.1% North Smyrna Elementary School 365 North Main Street, Smyrna, DE 19977 Kent 68.6% Smyrna Elementary School 121 South School Lane, Smyrna, DE 19977 Kent 51.6%
Seaford School District Senior High School 399 N. Market Street, Seaford, DE 19973 Sussex 72.0%
Woodbridge School District Woodbridge High School 14712 Woodbridge Road, Greenwood, DE 19950 Sussex 70.2%
* Reflects eligibility for the 2012-2013 academic year.

-4-
The State Constitution provides that any money borrowed by the State shall be used exclusively for the purpose for which it is borrowed, but that if any borrowed money remains after a project has been completed or abandoned, such money may be expended according to law. The Delaware Code provides that any funds borrowed pursuant to an Authorization Act and not expended for the purposes set forth therein shall be deposited in a special fund and applied with the approval of the Issuing Officers to the remaining costs of any project authorized by any prior Authorization Act.
SOURCES AND USES OF FUNDS The sources and uses of funds to accomplish the purposes of the Bonds are expected to be as follows:
Sources: Total Par Amount: $ 306,870,000.00 Net Original Issue Premium 53,159,369.85
Total Sources: $ 360,029,369.85
Uses: Deposit to Escrow Fund $ 98,709,801.64 Capital Projects 260,811,107.19 Underwriters’ Discount 303,514.54 Other Financing Expenses 204,946.48
Total Uses: $ 360,029,369.85
SECURITY FOR BONDS The Bonds are direct obligations of the State to which the full faith and credit of the State will be pledged. The payment of principal of and interest on debt obligations of the State is made pursuant to appropriations by the General Assembly of the State. Historically, the State has appropriated funds for and paid the principal of and interest on its debt obligations as they have come due. If the State fails to make sufficient provision to pay the principal of and interest on the Bonds, or, at the time such amount is payable, sufficient funds are unavailable for such payment, a sufficient sum to pay such principal and interest is required by State law to be set apart by the State Treasurer from the first revenues thereafter received by the State. The State Treasurer may be required to set apart and apply such revenue to the payment of such principal and interest at the suit of any holder of the Bonds. In the event the State fails to make timely payment of the principal of or interest on the Bonds, the owner of the Bond on which default in payment has occurred may also sue the State for breach of contract. In the opinion of the Attorney General of the State, the State may not successfully invoke the defense of sovereign immunity in an action alleging breach of contract by the State, and in the further opinion of the Attorney General, the Bonds pertaining thereto are such contracts. Any judgment against the State obtained in such an action, however, must be paid solely from funds appropriated by the General Assembly for the purpose of such payment.

-5-
DEBT SERVICE REQUIREMENTS The following table sets forth the debt service requirements of general obligation bonds of the State, prior to and after giving effect to the issuance of the Bonds.
General Obligation Bond Debt Service(1)(2)
(expressed in millions) Prior to Issuance of the Bonds After Issuance of the Bonds
Fiscal Year
Ending June 30
Principal
Interest
Total Debt
Service
Principal Outstanding
Principal
Interest
Total Debt
Service
Principal Outstanding
2015 167.5 78.8 246.4 1,657.8 167.5 77.1 244.6 1,875.4 2016 161.5 71.3 232.8 1,496.3 168.3 83.8 252.1 1,707.1 2017 156.4 63.7 220.0 1,339.9 167.7 73.8 241.4 1,539.4 2018 144.1 56.2 200.3 1,195.8 155.4 65.8 221.2 1,384.0 2019 126.6 50.3 176.8 1,069.2 138.0 59.1 197.1 1,246.0 2020 109.2 45.0 154.1 960.1 120.7 53.2 173.9 1,125.2 2021 107.0 40.0 147.0 853.0 118.6 47.6 166.2 1,006.6 2022 106.8 35.2 142.0 746.2 118.5 42.1 160.6 888.1 2023 104.9 30.4 135.2 641.3 116.6 36.6 153.3 771.5 2024 98.1 25.4 123.6 543.2 109.8 31.1 140.9 661.7 2025 84.9 21.4 106.4 458.3 96.7 26.5 123.2 565.0 2026 81.4 18.0 99.4 376.9 93.2 22.4 115.6 471.7 2027 76.2 14.7 90.9 300.7 88.0 18.5 106.5 383.7 2028 66.5 11.7 78.3 234.2 78.4 14.9 93.3 305.3 2029 59.4 9.0 68.4 174.8 71.3 11.6 82.9 234.0 2030 71.9 5.6 77.6 102.9 71.9 8.0 79.9 162.1 2031 42.5 3.4 45.9 60.4 54.3 5.5 59.8 107.8 2032 32.0 1.9 33.9 28.4 43.8 3.4 47.2 64.0 2033 20.1 0.9 21.1 8.3 32.0 2.0 33.9 32.0 2034 8.3 0.3 8.6 - 20.1 0.9 21.0 11.8 2035 11.8 0.2 12.0 -
TOTAL $1,825.3 $583.2 $2,408.6 $2,042.9 $683.8 $2,726.8
(1) Totals may not add due to rounding. (2) Outstanding gross debt service gross (excludes Federal Interest Subsidy on Build America Bonds and Qualified School Construction Bonds).

-6-
BONDED INDEBTEDNESS OF THE STATE Authorization of General Obligation Debt General obligation bonds and bond anticipation notes of the State are issued and the proceeds thereof appropriated to various purposes pursuant to the Authorization Acts. Under the State Constitution, Authorization Acts become law upon the approval of three-quarters of all the elected members of each house of the General Assembly and the concurrence of the Governor. The Governor may veto a bill by returning the bill to the house of the General Assembly in which the bill originated within ten days of receipt, Sunday excepted. The General Assembly may override the Governor's veto by a three-fifths vote of all members in each house. No bill becomes law after final adjournment of the General Assembly unless previously approved by the General Assembly and approved by the Governor within 30 days after such adjournment. The Governor has veto power over line item appropriations. Once an Authorization Act is enacted, the Issuing Officers are authorized by State law to issue bonds and bond anticipation notes thereunder. Bond anticipation notes may be issued for a term of one year and may be renewed, but all such renewal notes must mature not later than four years after the date of original issuance of such notes. No bond anticipation notes have been outstanding since fiscal 1978. All bonds are required to mature within 20 years from their date of issuance. Other than bonds issued in fiscal years 2010 through 2015, bonds may not provide for principal payments higher in later years than earlier years (except for refunding bonds, capital appreciation bonds, qualified zone academy bonds and retail bonds) and may have such other terms as the Issuing Officers may determine, subject to the limitations of the Authorization Acts and other provisions of law. The Qualified School Construction Bonds issued in fiscal year 2011 provided for a single maturity of $59.6 million in fiscal year 2030, exceeding principal due in earlier years. The Issuing Officers are authorized to issue bonds to refund bonds in advance of maturity provided that the refunding results in a present value savings to the State. The Issuing Officers may also issue revenue anticipation notes, in an amount they determine necessary, to meet a casual deficiency of revenue in the budgetary General Fund to pay budgetary General Fund obligations or to pay existing debts. Revenue anticipation notes may be issued at any time and from time to time prior to June 25 in any State fiscal year. There has not been a State issue of revenue anticipation notes since fiscal 1977. If at any time during the fiscal year prior to June 15 there is a casual deficiency of revenue in the budgetary General Fund to pay budgetary General Fund obligations or to pay existing debts, the State may draw upon available balances in the State's budgetary Special Funds to pay such obligations or debts. Such draws are required to be reimbursed to the appropriate budgetary Special Funds as soon as sufficient budgetary General Fund monies become available, and in any case, the budgetary General Fund cannot evidence a negative balance after June 15 of such fiscal year. Debt Limits
There is no State Constitutional debt limit; however, the State has statutory debt limits as discussed herein.
In 1991, the State enacted legislation to replace the previous statutory debt limits with a three-part debt limit, effective July 1, 1991, as follows:
First, the aggregate principal amount of new “tax-supported obligations of the State” (hereinafter defined) which may be authorized in any one fiscal year (excluding refunding bonds) may not exceed 5% of estimated net budgetary General Fund revenue for that fiscal year, as determined by a Joint Resolution approved by a majority of the members elected to each house of the General Assembly and signed by the

-7-
Governor in conjunction with the adoption of the annual Budget Appropriation Bill for that fiscal year (the “5% Rule”). The June 2014 estimate of net general fund revenues for fiscal year 2015 was $3,949.0 million, thus a total of $197.5 million of new tax-supported general obligation debt was permitted under the 5% rule and was authorized.
The level of tax-supported debt permitted under the 5% Rule for the current and next four (4) fiscal years is set out in the following table. The fiscal year 2015 figures are based on Senate Joint Resolution No. 14 which provides fiscal year 2015 official revenue, refund and unencumbered fund estimates. The revenue estimates for fiscal years 2016 through 2019 are estimated from the September 15, 2014 meeting of the Delaware Economic and Financial Advisory Council (“DEFAC”), See “STATE FINANCIAL OPERATIONS — Revenue Summary-Fiscal Year 2015E-Fiscal Year 2017E” herein. DEFAC projections are dependent on a variety of economic factors affecting the State’s projected revenues. See “STATE FINANCIAL OPERATIONS - Revenue and Expenditure Forecasting”.
The 5% Rule (in millions)
Estimated Net Budgetary
Fiscal 2015
Fiscal 2016
Fiscal 2017
Fiscal 2018
Fiscal 2019
General Fund Revenue $ 3,949.0 $ 3,883.2 $ 4,007.5 $ 4,113.2 $ 4,237.1
Projected New Tax- Supported Debt Authorizations $ 197.5 $ 194.0 $ 200.4 $ 205.7 $ 211.9
Second, no “tax-supported obligations of the State” and no “Transportation Trust Fund (“Trust
Fund” or “TTF”) debt obligations” (each as hereinafter defined) of the Delaware Transportation Authority may be incurred if the aggregate maximum annual payments on all such outstanding obligations (plus certain lease obligations) exceed 15% of the estimated aggregate budgetary General Fund revenue, plus Trust Fund revenue for the fiscal year following the fiscal year in which such obligation is incurred (the “15% Test”). Any such debt incurred would have to comply with this test, as illustrated in the following table:
The 15% Test (in millions)
Fiscal 2016(1)
General Obligation Debt Service ................................................................ $ 252.1 Less: Excluded Debt Service (2) ................................................................. (65.5) Other Tax-Supported Debt Service (3) ......................................................... 26.9 Total Tax-Supported Debt Service ....................................................... $ 213.5Delaware Transportation Authority (TTF) Debt Service ............................ $ 101.4 Total Debt Service ................................................................................ $ 314.9Estimated Aggregate Budgetary General Fund and TTF Revenue (4) ......... $ 4,502.5Total Debt Service as Percent of Total Revenue ........................................ 7.0%
____________________ (1) Year of maximum annual debt service. Totals in column may not add due to rounding. (2) Portion of general obligation debt service to be reimbursed by local school districts and the Trust Fund. (3) Includes projected payments on lease obligations of the State. (4) Based upon September 15, 2014 revenue projections of DEFAC for fiscal year 2017. See “STATE
FINANCIAL OPERATIONS - Revenue and Expenditure Forecasting.”

-8-
“Tax-supported obligations of the State” include a) all obligations of the State or any agency or authority thereof to which the State's full faith and credit is pledged; and b) all obligations of the State or any agency or authority thereof extending beyond one year with respect to the lease, occupancy or acquisition of property which are incurred in connection with debt financing transactions (for example, certificates of participation), and which are payable from taxes, fees, permits, licenses and fines imposed or approved by the General Assembly. Tax-supported obligations do not include a) obligations incurred to acquire a like principal amount of full faith and credit obligations issued by a local school district to the extent such local school district obligations are not in default; b) any obligations of the Delaware Transportation Authority; c) any tax or other revenue anticipation notes or bonds of the State; or d) obligations to the extent that the debt service with respect thereto is reasonably expected to be offset (as determined by the Secretary of Finance) by lease payments, user fees, federal grants or other payments from a non-budgetary General Fund source. “Transportation Trust Fund debt obligations” include all debt obligations of the Delaware Transportation Authority, including all obligations extending beyond one year with respect to the lease, occupancy or acquisition of property which are incurred in connection with debt financing transactions (for example, certificates of participation), and which in any case are payable from the Trust Fund. Trust Fund debt obligations do not include any obligations to the extent that the debt service with respect thereto is reasonably expected to be offset (as determined by the Secretary of Finance) by lease payments, user fees, federal grants or other payments from a non-State source.
Third, no general obligation debt (with certain exclusions) may be incurred if the maximum annual debt service payable in any fiscal year on all such outstanding obligations will exceed the estimated cumulative cash balances (including all reserves) for the fiscal year following the fiscal year in which such obligation is incurred (the “Cash Balances Test”), as estimated by the Secretary of Finance. The Bonds also comply with the Cash Balances Test, as illustrated below:
The Cash Balances Test (in millions)
Fiscal 2016 (1)
General Obligation Debt Service ................................................................... $ 252.1 Less: Excluded Debt Service (2) .................................................................... (65.5) Net General Obligation Debt Service ..................................................... $ 186.6 Projected Cumulative Cash Balances (3) ........................................................ $ 607.7 ____________________ (1) Year of maximum annual debt service. Totals in column may not add due to rounding. (2) Portion of general obligation debt service to be reimbursed by local school districts and the Trust Fund. (3) As estimated by the Secretary of Finance based upon September 15, 2014 budgetary General Fund revenue
projections by DEFAC for fiscal year 2017. General Obligation Debt On June 30, 2014, the outstanding general obligation debt of the State, a portion of which was supported by budgetary General Fund revenue and a portion of which was supported by budgetary Special Funds, was as follows:

-9-
Outstanding General Obligation Debt (in millions)
General Obligation Debt Supported by Budgetary General Fund Revenue
State Facilities .................................................................. $ 620.1 School Facilities (State Share) .......................................... 666.8 Subtotal ....................................................................... $ 1,286.9
General Obligation Debt Supported by Budgetary Special Funds
Highways and Other Transportation Improvements ........ $ 0.1 School Facilities (Local Share) ......................................... 538.4 Subtotal ....................................................................... $538.4(1) Total General Obligation Debt Outstanding ..................... $ 1,825.3(1)
__________ (1) Totals may not add due to rounding.
The Trust Fund reimburses the budgetary General Fund for the payment of debt service on previously issued transportation-related general obligation debt and debt issued on behalf of the Division of Motor Vehicle. As of June 30, 2014, $0.1 million of such debt was outstanding. The State pays between 60% and 80% of the cost of capital improvements for public school districts upon approval of such cost by the State Board of Education. The public school districts pay the remaining percentage. In conjunction with aggregate construction spending of capital improvement projects, the State issues bonds for 100% of the cost of approved school district projects pursuant to Authorization Acts. Simultaneously, the school districts issue their own bonds (the “School District Bonds”) to the State for their 20% to 40% share of capital costs at an interest rate not exceeding 1/4 of 1% above the interest rate on the corresponding State bonds. As debt service payments on the State's bonds become due, school districts are required to pay debt service on the School District Bonds from their tax receipts into the State's budgetary Special Fund, and the State pays the total debt service from both the budgetary General Fund and Special Fund appropriations. This policy allows the local school districts to borrow capital funds at very competitive rates and to lessen the associated costs of issuance and market access. No public school district has ever defaulted on any such obligation to the State. Authorized but Unissued General Obligation Debt Prior to the issuance of the Bonds, statutory authorization exists for the issuance of additional general obligation debt of the State in the principal amount of $398.6 million. General Obligation Note Debt There are no outstanding State general obligation notes or any notes of any authority or agency for whose debt the State has a contingent liability as of the date of this Official Statement.

-10-
Debt Burden Comparisons The State's general obligation debt outstanding was $1,825.3 million on June 30, 2014 with approximately 70.2% scheduled to mature within ten years. The following chart further demonstrates the State’s commitment to the rapid retirement of its general obligation debt.
General Obligation Debt Amortization as of June 30, 2014
0%
20%
40%
60%
80%
100%
2015 2016 2017 2018 2019 2020 2021 2022 2023 2024 2025 2026 2027 2028 2029 2030 2031 2032 2033 2034
% o
f Prin
cipa
l Out
stan
ding
Delaware's debt burden reflects the centralized role of the State government in financing capital projects
that are typically funded by local governments in other states, such as schools and correctional facilities. In the U.S. Census Bureau’s Public Education Finances survey of 2012 issued in May 2014, Delaware ranked 10th in state spending per pupil in elementary – secondary public schools. Of the $1,825.3 million of debt outstanding as of June 30, 2014, $538.3 million or 29.5% was issued on behalf of local school districts. This debt is fully supported by the property tax revenues of those districts. The State has instituted a number of measures designed to manage and reduce its indebtedness, as outlined below. • Aggressive Retirement of General Obligation Debt: The State voluntarily retires its general obligation debt rapidly. Approximately 70.2% of current general obligation debt is scheduled to mature within ten years, as noted above. • Strict Debt Limitations: In 1991, the State instituted new debt limits, one of which restricts new debt authorizations to 5% of budgetary General Fund revenue as projected for the next fiscal year. The debt limit also effectively eliminates the use of any “off balance sheet” financing instruments, such as certificates of participation. See “Bonded Indebtedness of the State - Debt Limits” for further information concerning the State's debt limits. • Significant “Pay-As-You-Go” Financing: Over the years, the State has appropriated surplus cash for “pay-as-you-go” financing. Revenue surpluses between fiscal years 1993 to 2001 allowed the State to appropriate cash on average at a rate of 52.6% of capital expenditures. With more modest revenue growth, cash contributions in fiscal years 2002 and 2003 were reduced. However, between fiscal years 2004 and 2015, the cash funding exceeded $1.6 billion or 24.9% of capital expenditures.

-11-
• Numerous Bond Refundings: The State has undertaken a series of bond refundings which have lowered the overall debt service on outstanding State general obligation debt. The savings identified in the following sentences reflect net present value savings. In fiscal year 2003, the State refunded over $167 million of its general obligation bonds for a combined savings of $8.7 million. In fiscal year 2004, savings of $2.9 million were realized after the State refunded $74.6 million of its general obligation bonds; in fiscal year 2005, savings of $1.9 million were realized after the State refunded $48.3 million of its general obligation bonds; in fiscal year 2008, savings of $0.7 million were realized after the State refunded $16.4 million of its general obligation bonds; in fiscal year 2010, savings of $26.4 million were realized after the State refunded $460.6 million of its general obligation bonds; in fiscal year 2011, savings of $3.4 million were realized after the State refunded $54.6 million of its general obligation bonds; and in fiscal year 2013, savings of $14.4 million were realized after the State refunded $123.3 million of its general obligation bonds. With the issuance of the 2014B Bonds, the State will realize net present value savings of approximately $5.4 million after refunding $89.3 million of its general obligation bonds. The State continues to monitor opportunities to refund its outstanding bonds to lower future debt service requirements. The result of these initiatives has been to reduce the rate of growth in Delaware’s debt burden, as depicted on a fiscal year basis in the following three charts.
Debt Per Capita at June 30
749946 973 1,067 1,090 1,186 1,255 1,307 1,378 1,431
468
557 584580 573
590 595 590 577 566
0
500
1,000
1,500
2,000
2,500
2006 2007 2008 2009 2010 2011 2012 2013 2014 2015E
General Fund Special Fund
Notes: The bottom portion of each column represents the portion of general obligation debt funded by the budgetary General
Fund. The remainder is funded by budgetary Special Funds. 2015 data assumes a population growth rate of 1.2%.

-12-
Debt as a Percentage of Personal Income at June 30
1.6%2.0% 2.1% 2.3% 2.4% 2.5% 2.6% 2.7% 2.8% 2.9%
1.0%
1.2% 1.2%1.3% 1.3% 1.3% 1.2% 1.2% 1.2% 1.1%
0.0%
0.5%
1.0%
1.5%
2.0%
2.5%
3.0%
3.5%
4.0%
4.5%
2006 2007 2008 2009 2010 2011 2012 2013 2014 2015E
General Fund Special Fund
Notes: The bottom portion of each column represents the portion of general obligation debt funded by the budgetary
General Fund. The remainder is funded by budgetary Special Funds. Personal Income estimates provided by Global Insight and Delaware Department of Finance.
Debt Service as a Percent of
Net Budgetary General Fund Revenue at June 30
3.9% 3.7% 4.2% 4.7% 5.1%4.2% 4.4% 4.5% 4.6% 4.7%
1.2% 1.4%1.5%
1.8%1.8%
1.7%1.9% 1.7% 1.8% 1.7%
0.0%
1.0%
2.0%
3.0%
4.0%
5.0%
6.0%
7.0%
8.0%
2006 2007 2008 2009 2010 2011 2012 2013 2014 2015E
General Fund Special Fund
Notes: The bottom portion of each column represents the portion of general obligation debt funded by the budgetary
General Fund. The remainder is funded by budgetary Special Funds.

-13-
Build America Bonds and Qualified School Construction Bonds “Build America Bonds” are taxable general obligation bonds backed by the full faith and credit of the State and could only be issued in calendar years 2009 and 2010 to finance capital expenditures for which the State could issue tax-exempt bonds. In calendar years 2009 and 2010, the State issued $295,090,000 in aggregate principal amount of Build America Bonds and elected to receive periodic payments from the United States Treasury on each interest payment date equal to 35% of the corresponding interest payable on such Build America Bonds (the “BAB Subsidy Payments”). “Qualified School Construction Bonds” are taxable general obligation bonds backed by the full faith and credit of the State and could be issued to finance the construction, rehabilitation, or repair of a public school facility or for the acquisition of land on which such a facility is to be constructed. For calendar years 2009 and 2010, the State received Qualified School Construction Bond allocations of $29,784,000 and $29,797,000, respectively. The State carried forward the entire $29,784,000 from 2009 and issued $59,580,000 in aggregate principal amount of Qualified School Construction Bonds in 2010 and elected to receive periodic payments from the United States Treasury on each interest payment date equal to the lesser of: (i) the amount of interest payable on the such Bonds on such date; or (ii) the amount of interest that would have been payable on the such Bonds if the interest were determined at the applicable tax credit rate pursuant to Section 54A(b)(3) of the Code published by the United States Treasury on the sale date of such Bonds (the “QSCB Subsidy Payments”). Subsequent acts of Congress have reduced direct-pay bond subsidy payments by 7.3% in federal fiscal year 2015 and by rates that will be set from time to time through federal fiscal year 2024. Neither the BAB Subsidy Payments nor the QSCB Subsidy Payments were pledged to the payment of the Build America Bonds or the Qualified School Construction Bonds, respectively. Such subsidy payments are paid directly to the State and the holders of such Build America Bonds and Qualified School Construction Bonds are not entitled to a tax credit related thereto, and interest paid to holders of such bonds is subject to federal income tax. Sustainable Energy Utility, Inc. Energy Efficiency Revenue Bonds
In August, 2011, pursuant to the Delaware Energy Act, 29 Del. C. §8059, Energy Utility, Inc. (the “SEU”), a Delaware nonprofit corporation created by and for the benefit of the State issued $67,435,000 of its Sustainable Energy Utility, Inc. Energy Efficiency Revenue Bonds, Series 2011 (the “SEU Bonds”).
The SEU has developed a program (the “SEU Program”) to issue bonds and utilize the proceeds
to pay the costs of designing and implementing energy conservation measures (“ECMs”) at the facilities of agencies (defined to include the State, municipalities and state and local governmental agencies and institutions of higher learning). The SEU Bonds were issued to finance the initial ECMs for several State agencies and departments participating in the SEU Program (the “Agencies” and each an “Agency”). Each Agency is obligated to make or cause to be made payments (the “Installment Payments”) to the SEU for the ECMs under an Installment Payment Agreement in accordance with the Energy Performance Contracting Act, 29 Del. C. §6971. Each Installment Payment Agreement is the several obligation only of the applicable Agency under which Installment Payments are payable by such Agency out of funds appropriated to such Agency by the State and available for such purpose.
The SEU Bonds are limited obligations of the SEU payable primarily from the Installment Payments to be made by, or on behalf of, the Agencies. The Agencies’ obligations to make Installment Payments are subject to appropriation by the State, and the State is not obligated to make any appropriation to an Agency. Neither the State nor any political subdivision thereof shall be obligated to

-14-
make payments on the SEU Bonds. Neither the faith and credit nor the taxing power of the State or of any political subdivision thereof is pledged to the payment of the principal of or the interest on the SEU Bonds. The issuance of the SEU Bonds does not directly or indirectly or contingently obligate the State or any political subdivision thereof to levy or to pledge any form of taxation whatever therefor, or to make any appropriation for their payment. Qualified Zone Academy Bonds
Qualified Zone Academy Bonds (“QZAB”) are general obligation bonds backed by the full faith and credit of the State for the repayment of principal, primarily through the use of a sinking fund with a bullet maturity. QZABs are taxable bonds the proceeds of which are limited to improving eligible public schools, such capital projects having been approved by the General Assembly. In lieu of receiving periodic interest payments from the State, an eligible QZAB holder is generally allowed annual federal income tax credits while the QZAB is outstanding.
On December 8, 2006, the State issued $1,433,000 QZABs for the purpose of financing renovations
of the following facilities in the Cape Henlopen School District, Sussex County, Delaware: the Lewes School, Milton Elementary School, Rehoboth Elementary School and H.O. Brittingham Elementary School. In conjunction with such QZAB, the State executed a forward delivery contract requiring that the State establish an escrow account to be funded with annual sinking fund deposits and which will be guaranteed interest at a rate of 2.72% per annum. In 2004, the State issued $908,000 QZABs and, in fiscal year 2005, issued $224,177 QZABs to finance the renovations of the Charlton School in the Caesar Rodney School District, Kent County, Delaware. In fiscal year 2003, the State issued $760,000 QZABs and, in fiscal year 2002, issued $649,000 QZABs. The fiscal year 2003 QZAB proceeds funded the renovation of the Charlton School in the Caesar Rodney School District, Kent County, Delaware. The fiscal year 2002 QZAB proceeds assisted in the renovation of Georgetown and Showell elementary schools in the Indian River School District, Sussex County, Delaware. State Revenue Debt There is currently no State revenue debt outstanding, nor any plans to authorize any State debt other than State general obligation debt. Lease Obligations The State has entered into long-term leases with terms in excess of one year. At June 30, 2014, aggregate remaining lease payments total approximately $169.8 million with $122.8 million payable through fiscal year 2019. Real estate rentals account for 85.3% of the aggregate payments and equipment rentals account for the remainder. All payments are subject to annual appropriation. The State may not be held contractually liable for the payments in the event that such appropriations are not made. See “APPENDIX B - Notes to the Financial Statements - #8, Lease Commitments”. Lease obligations are subject to one of the State's debt limits, the 15% Test. See “BONDED INDEBTEDNESS OF THE STATE - Debt Limits” for a further explanation.
INDEBTEDNESS OF AUTHORITIES, UNIVERSITIES AND POLITICAL SUBDIVISIONS
Oversight responsibility for the issuance of debt by the State and authorities deemed to be part of the State's financial reporting entity is centralized under the Secretary of Finance. The following section sets forth certain indebtedness of State authorities, Delaware State University, the University of Delaware and political

-15-
subdivisions of the State. The State is not directly or contingently liable for debt service for any of the following indebtedness: Authorities Delaware Transportation Authority The Delaware Transportation Authority (the “Authority”) is a body corporate and politic constituting an instrumentality of the State. The Authority acts by resolution of the Secretary of the Department of Transportation (the “Department”), the Director of Finance of the Department and the Transportation Trust Fund Administrator. The Department has overall responsibility for coordinating and developing comprehensive, multi-modal transportation planning and policy for the State. The Authority assists in the implementation of this policy and has the power to develop a unified system of air, water, vehicular, public and specialized transportation in the State, subject to oversight by the Department and the State as hereinafter described. To assist the Authority in financing a unified transportation system, the State created the Transportation Trust Fund (the “Trust Fund” or “TTF”) within the Authority in 1987 to receive revenue and receipts of the Authority. The primary sources of funding of the Trust Fund are motor fuel taxes, motor vehicle document fees, motor vehicle registration fees, and other transportation-related fees, all of which are imposed and collected by the State and transferred to the Trust Fund. The State has irrevocably pledged, assigned and continuously appropriated these taxes and fees to the Trust Fund. The other major source of funding for the Trust Fund is toll and concession revenue of the Delaware Turnpike and the Route 1 Toll Road. The Authority may apply Trust Fund revenue for transportation projects, subject to the approval of the State, and may pledge any or all of this revenue to secure financings for these projects. As of June 30, 2014, the Delaware Transportation Authority had outstanding $845.0 million in Transportation System Revenue Bonds and $94.1 million in Grant Anticipation Revenue Vehicle Bonds, or “GARVEEs”, which were issued to finance a portion of the costs of completing the final design and right-of-way acquisition activities for a new U.S. 301. The Authority may issue bonds to refund prior Authority obligations. Additional bonds secured on parity with the TTF’s senior bonds may be issued subject to the satisfaction of debt service coverage tests and certain other requirements. Under certain circumstances, additional revenue may be pledged by the Authority to secure its bonds, in which case such revenue may be taken into account in determining satisfaction of these debt service coverage tests. The Authority may also incur additional debt, which has a lien on revenue subordinate to the lien of other bonds. See “APPENDIX B - Notes to the Financial Statements - #6, Revenue Bonds”.
In addition to debt service coverage tests and certain other requirements, future debt issues of the Authority are subject to one of the debt limits of the State. The debt limit mandates that the aggregate maximum annual payments on the State’s tax-supported obligations and the TTF debt obligations of the Authority (plus certain lease obligations) may not exceed 15% of total budgetary General Fund revenue, plus Trust Fund revenue for the fiscal year following the fiscal year in which such debt is issued. See “BONDED INDEBTEDNESS OF THE STATE - Debt Limits” for a further explanation. The bonds of the Authority do not constitute a debt of the State or a pledge of the general taxing power or the faith and credit of the State or any political subdivision, agency or instrumentality thereof other than the Authority. The State's pledge and assignment to the Authority of motor fuel tax revenue, motor vehicle document fees, motor vehicle registration fees and other revenue pursuant to State law creates an obligation of the State, until there are no longer any Authority bonds remaining outstanding, to continue to impose and collect these taxes and fees at least at the rates in effect on the date of issuance of the Authority bonds and to transfer

-16-
this revenue to the Authority. The State, however, has no obligation to increase these taxes or fees to provide sufficient revenue to meet payments of debt service on the Authority’s bonds. Delaware State Housing Authority The Delaware State Housing Authority (“DSHA”), created in 1968, had outstanding on June 30, 2014, $430.6 million of tax-exempt revenue bonds and $53.1 million of taxable revenue bonds. The total $483.7 million of the outstanding bonds were issued to finance the purchase of single-family homes. The security for these bonds is mortgage loan repayments, reserve funds, bond proceeds and other revenue. The taxable bonds have been issued primarily to finance second mortgages, providing down payment and closing cost assistance to eligible homebuyers. See “APPENDIX B - Notes to the Financial Statements - #6, Revenue Bonds”. Bonds issued by DSHA (“DSHA Bonds”) do not constitute a debt or liability of the State. The enabling legislation, however, provides that the General Assembly may, but is not obligated to, make appropriations to restore the DSHA’s capital reserve fund if such fund is drawn upon to meet debt service payments on certain of the DSHA’s Bonds. As of June 30, 2014, there were no DSHA Bonds outstanding which are entitled to the benefit of the capital reserve fund. To date, the General Assembly has not been requested to make any such “moral obligation” appropriations. The statutory debt limit of the DSHA is $350.0 million in bonds carrying the moral obligation of the State. The Delaware Economic Development Authority The Delaware Economic Development Authority and its predecessors had outstanding approximately $672.2 million in economic development revenue bonds on June 30, 2014, none of which are backed by the full faith and credit of the State. The following two Authorities are not part of the State's financial reporting entity. The State, however, exercises oversight regarding their debt activities. Delaware Solid Waste Authority The Delaware Solid Waste Authority (the “DSWA”) was created in 1975 and is the sole entity in the State responsible for the planning and administration of a comprehensive statewide program for the management, storage, collection, transportation, utilization, processing (including resource recovery), and disposal of solid waste and sewage sludge. On June 30, 2014, DSWA had $100.5 million outstanding solid waste revenue bonds. Delaware Health Facilities Authority The Delaware Health Facilities Authority (the “Health Facilities Authority”), established in 1973, is authorized to issue revenue bonds and notes to finance projects for health care facilities located in the State. As of June 30, 2014, there were outstanding $639.5 million of revenue bonds issued for the benefit of these facilities. The Health Facilities Authority has no taxing power and no source of funds other than from the contractual obligations of participating health care facilities. Universities
Delaware State University There were outstanding on June 30, 2014, $91.3 million of revenue bonds issued by Delaware State University. These bonds are secured by the Delaware State University's pledge of certain of its net operating

-17-
revenue and net non-operating revenue, exclusive of gifts, grants, bequests, contributions and donations to the extent specifically restricted to a particular purpose inconsistent with their use for the making of debt service payments and any funds appropriated by the State.
University of Delaware There were outstanding on June 30, 2014, $445.7 million of revenue bonds issued by the University of Delaware for housing, dining and other auxiliary facilities. These bonds are secured by revenue generated by the facilities. Political Subdivisions The approximate aggregate principal amount of general obligation bond indebtedness of the three counties, the City of Wilmington, the other cities and towns and the school districts of the State, as of June 30, 2014, is outlined in the following table:
General Obligation Debt of Political Subdivisions (in millions)
New Castle County .......................................... $ 380.8 Sussex County .................................................. 159.5 Kent County ..................................................... 47.5 Wilmington ...................................................... 301.9(1) Other Cities and Towns ................................... 195.3(2) School Districts ................................................ 538.3(3) Total .................................................... $1,623.3
____________________ (1) Of this total, $5.0 million in principal is supported by payments from the Diamond State Port
Corporation, an instrumentality of the State. Excludes $18.8 million of Wilmington Parking Authority bonds guaranteed by the City of Wilmington.
(2) Excludes revenue bonds and anticipation notes. (3) Represents local shares sold by the State on behalf of the school districts (as reported in the earlier
chart entitled “Outstanding General Obligation Debt”). Source: Chief fiscal officers of respective governmental entities.
Indebtedness of counties, towns, and cities, other than the City of Wilmington, has been incurred primarily for water and sewer projects and general municipal purposes, subject to various debt limits. The State is not liable for any of this indebtedness. Unlike most other states, the State, rather than the local governments, is principally responsible for capital expenditures for schools and correctional facilities. School districts may not issue bonds (excluding bonds sold to the State by school districts to fund the 20% to 40% share of capital costs), except to refund outstanding bonds, in an aggregate amount causing bonded debt of the district, less sinking funds on hand for payment of such bonded debt, to exceed 10% of the assessed value of the real property in the district.
ECONOMIC BASE The State is located on the eastern seaboard of the United States and is bordered by the Atlantic Ocean and the Delaware Bay, as well as by the states of New Jersey, Pennsylvania and Maryland. It has a land area of 1,955 square miles, ranking 49th in area in the United States. The State is 96 miles long and varies from 9 to 35

-18-
miles wide, with elevations ranging from sea level to 442 feet. As the first state to ratify the United States Constitution on December 7, 1787, Delaware is known as “The First State.” Recent History
During the most recent two business cycles, Delaware’s economic performance has largely mirrored national trends in terms of employment and income growth. In this period, Delaware has consistently posted lower unemployment rates than the United States. More recently, however, Delaware has experienced an unemployment rate aligning more closely to the national average.
The State’s recent performance is due, in part, to the changing composition of its economic base. With a
heavy concentration in financial services, the State’s economy could not avoid the effects of recent industry turmoil. Despite this uncertainty, the State’s major employers, Bank of America, N.A., JPMorgan Chase & Co., Barclays Bank Delaware and Capital One, continue to maintain a major presence in the State and demonstrate the State’s importance as a financial center. In addition to purchasing a former MBNA America Bank facility, JP Morgan Chase purchased two of its previously leased facilities in downtown Wilmington as well as 58 acres of the AstraZeneca campus in Fairfax, Delaware further demonstrating its commitment to Delaware. The State’s long-established manufacturing sectors, oil-refining and fibers, have also suffered as a result of the worst economic downturn since World War II. In response to these setbacks, however, the State has made important strides to reinvigorate and modernize its manufacturing base. The site of the former Chrysler plant was purchased by the University of Delaware to pursue science, technology and advanced research. The “STAR” campus now houses a health sciences complex dedicated to advanced healthcare research, education and delivery. Bloom Energy now produces solid oxide fuel cells, “Bloom Boxes”, in a new, on-site manufacturing facility, and through a project with NRG Energy Inc., all-electric vehicles give and take power from an electric power grid using technology invented at the University of Delaware.
Diversifying the State’s economy has consistently ranked among State policymakers’ highest priorities since the adoption of the Financial Center Development Act in 1981. The State’s economic development efforts have followed a two-pronged approach. Broadly speaking, the State has continually improved its business climate using a combination of (i) prudent fiscal management, including judicious tax policy, and (ii) strategic investments in public education and infrastructure. When faced with specific challenges, alert and supportive policymakers have teamed with the business community to develop effective policy responses to a changing economic landscape.
To enhance its position in an increasingly competitive gaming market and to increase employment
across the State, Delaware diversified its gaming portfolio to include sports betting and Keno at multiple retail venues, and in November 2013, introduced i-gaming to in-state consumers via the internet. In February 2014, Governor Jack Markell of Delaware and Governor Brian Sandoval of Nevada signed a multi-state internet agreement that will allow poker players from both states to participate in a combined player pool creating a larger marketplace. Delaware continues to explore additional gaming offerings and multistate compacts for online gaming.
The State continues to pursue high technology industries, including life sciences research and development, pharmaceuticals, agricultural biotechnology, human biotechnology, information technology and, more recently, alternative energy and other green industries. The State has made a significant investment to establish the Delaware Biotechnology Institute, a partnership involving State government, the State’s higher education institutions and the private sector. The Institute is designed to expand the State’s scientific base and create opportunities for the development of new technologies in the emerging life sciences field.

-19-
The State’s business-friendly legal system continues to attract new incorporations. Even though initial public offering (“IPO”) activity has suffered from economic and other factors, the State has continued to register a record number of business formations in the form of limited liability companies and limited partnerships. In 2013, more than 152,000 new business entities were formed in Delaware bringing the total number of business entities registered in the State to more than 1,051,000.
Population
Between 2012 and 2013, Delaware’s population was estimated to have increased by 0.9 percent, to 925,749 inhabitants. In comparison, there was 0.4 percent growth in the Mid-Atlantic region and 0.7 percent growth in the nation over the same period.
The following table presents population trends for Delaware, the mid-Atlantic region and the United States for 2007 through 2013.
Population (in thousands)
Delaware
Mid-Atlantic Region (1)
United States
Population Change Population Change Population Change 2007 ............. 872 1.5% 46,899 0.3% 301,231 1.0%2008 ............. 884 1.4 47,105 0.4 304,094 1.02009 ............. 892 0.9 47,352 0.5 306,772 0.92010 ............. 900 0.9 47,598 0.5 309,326 0.82011 ............. 908 0.9 47,829 0.5 311,583 0.72012 ............. 917 1.0 48,010 0.4 313,874 0.72013 ............. 926 0.9 48,179 0.4 316,129 0.7(1) Mid-Atlantic region consists of Maryland, New Jersey, Pennsylvania, New York and Delaware. Source: U.S. Census Bureau. Major Political Subdivisions
The State has three counties: Kent, New Castle, and Sussex. All of the cities and towns in the State are independent, incorporated municipalities. The U.S. Census Bureau has population data for cities up to 2013. There are three major cities: Wilmington, the largest city, with a 2013 estimated population count of 71,525; Dover, the State capital and the site of a major U.S. Air Force base, with a 2013 estimated population count of 37,366 residents; and Newark, the site of the University of Delaware, with a 2013 estimated population count of 32,549.
The following table shows the population of the State’s three counties for the years 2008 through 2013. Nearly 60 percent of the State’s population lives in New Castle County, the northernmost county. Sussex County, the southernmost county, and Kent County continue to show stronger growth, with Sussex more than twice New Castle County’s growth rate and Kent more than one and a half times New Castle County’s growth rate.

-20-
Population by County
New Castle Change Kent Change Sussex Change 2008 ............... 533,958 0.64% 157,925 2.57% 191,991 2.55%2009 ............... 536,898 0.55 160,081 1.37 194,751 1.442010 ............... 538,951 0.38 162,973 1.81 197,900 1.622011 ............... 542,444 0.65 165,319 1.44 200,374 1.252012 ............... 546,076 0.67 167,626 1.40 203,390 1.512013 ............... 549,684 0.67 169,416 1.07 206,649 1.60Source: Delaware Population Consortium. Personal Income
Personal income is the income received by all persons from all sources. The State’s total personal income rose by 2.9 percent from calendar 2012 to 2013, compared with increases of 2.0 percent for the Mid-Atlantic region and 2.6 percent for the nation. Total State personal income in calendar 2013 was $41.7 billion.
The following table provides per capita personal income comparisons for calendar 2008 through 2013. (Per capita personal income is the annual total personal income of State residents divided by the population.) Per capita personal income of Delaware residents rose by 2.0 percent from calendar 2012 to 2013 compared with 1.6 percent in the Mid-Atlantic region and 1.8 percent in the U.S. over the same period. In comparison, State per capita personal income was approximately equal to 101 percent of U.S. per capita personal income in calendar 2013.
Per Capita Personal Income
Delaware
Change
Mid-Atlantic Region(1)
Change
United States
Change
Delaware as Percent of the United States
2008 ............. $41,490 1.1% $47,471 2.4% $40,873 2.7% 1022009 ………. 40,841 -1.6 46,421 -2.2 39,357 -3.7 1042010 ............. 41,072 0.6 47,610 2.6 40,163 2.0 1022011 ............. 42,805 4.2 49,904 4.8 42,298 5.3 1012012 ............. 44,224 3.3 51,292 2.8 43,735 3.4 1012013 ............. 45,092 2.0 52,114 1.6 44,543 1.8 101 Source: U.S. Department of Commerce. (1) Mid-Atlantic region includes Delaware, Maryland, New York, New Jersey and Pennsylvania. Unemployment Rates Delaware’s average unemployment rate for 2013 fell to 6.7 percent from 7.1 percent in 2012. The region had an overall average unemployment rate of 7.5 percent in 2013, down from 8.3 percent in 2012. The following table presents the average annual unemployment rates for Delaware, the region, and the U.S. from 2005 through 2013.

-21-
Unemployment Rates (%)
Delaware Mid-Atlantic
Region(1) United States
2005 .............................. 4.0 4.8 5.1 2006 .............................. 3.5 4.5 4.6 2007 .............................. 3.5 4.3 4.6 2008 .............................. 4.9 5.2 5.8 2009 .............................. 7.9 8.2 9.3 2010 .............................. 8.0 8.7 9.6 2011 .............................. 7.4 8.2 8.9 2012 .............................. 7.1 8.3 8.1 2013 .............................. 6.7 7.5 7.4
Sources: U.S. Department of Labor and Delaware Department of Labor. (1) Mid-Atlantic Region consists of Delaware, Maryland, New York, New Jersey and Pennsylvania. In 2013, Delaware’s annual unemployment rate of 6.7 percent was tied for 23rd lowest in the nation. In the surrounding states, Maryland’s unemployment rate was ranked 22nd lowest at 6.6 percent, Pennsylvania was tied for 31st at 7.4 percent, New York was 36th at 7.7 percent, and New Jersey was 41st at 8.2 percent. Employment The rate of non-agricultural job growth in Delaware increased 1.9 percent in 2013. There were also job gains in the region and the nation of 0.9 percent and 1.7 percent, respectively.
Non-Agricultural Employment Growth Rates (%)
Delaware
Mid-Atlantic Region
United States
2005 ............................. 1.8 1.0 1.7 2006 ............................. 1.2 1.0 1.8 2007 ............................. 0.2 0.9 1.1 2008 ............................. (0.5) 0.1 (0.6) 2009 ............................. (4.6) (3.1) (4.3) 2010 ............................. (0.7) (0.2) (0.7) 2011 ............................. 0.8 1.0 1.2 2012 ............................. 0.6 1.1 1.7 2013 ............................. 1.9 0.9 1.7
Sources: U.S. Department of Labor and Delaware Department of Labor.

-22-
Total Employment Growth (2004 = 100)
96.0%
98.0%
100.0%
102.0%
104.0%
106.0%
2004 2005 2006 2007 2008 2009 2010 2011 2012 2013
Mid-Atlantic United States Delaware
Source: Delaware Department of Labor
In terms of employment, Government remained the single largest industry sector in Delaware in 2013. Total employment across all federal, state and local government entities averaged 63,900 over the year, an increase of 300 jobs over 2012. Among private industry sectors, Health Care and Social Assistance remained as the state’s largest industry sector with 62,100 jobs; Retail Trade was again the second-largest with 51,200.
Ten private industry sectors added jobs in 2013: Finance and Insurance (+1,500), Administrative and Support and Waste Management and Remediation Services (+1,400), Health Care and Social Assistance (+1,400), Professional, Scientific, and Technical Services (+1,300), Construction (+1,200), Transportation, Warehousing and Utilities (+1,100), Accommodation and Food Services (+900), Retail Trade (+500), Other Services (+100) and Real Estate and Rental and Leasing (+100).

-23-
Employment by Industry Sector
(in thousands)
2008 2009 2010 2011 2012 2013 Construction .................................................... 25.1 20.0 19.3 19.3 18.5 19.7Manufacturing ................................................. 31.7 27.9 25.9 25.7 25.7 25.3Wholesale Trade .............................................. 14.6 13.2 12.5 12.5 12.4 12.2Retail Trade ..................................................... 53.0 49.7 49.8 50.6 50.7 51.2Transportation, Warehousing and Utilities1 .... 13.6 12.4 12.1 12.3 12.8 13.9Information ...................................................... 7.0 6.5 6.0 5.7 5.5 5.3Finance and Insurance ..................................... 39.0 38.0 37.1 36.8 37.0 38.5Real Estate and Rental and Leasing ................ 6.5 5.9 5.6 5.5 5.4 5.5Professional, Scientific and Tech. Services ..... 25.7 24.2 24.5 26.0 27.5 28.8Management of Companies ............................. 10.8 10.1 9.1 7.8 6.8 6.0Administrative and Support and Waste Management and Remediation Services .......... 23.1 21.3 21.2 21.8 21.9 23.3
Educational Services ....................................... 7.4 7.3 7.5 7.7 7.8 7.6Health Care and Social Assistance .................. 55.2 56.4 57.3 58.9 60.7 62.1Arts, Entertainment and Recreation ................. 8.1 7.8 8.5 8.8 8.5 8.3Accommodation and Food Services ................ 33.0 32.9 33.7 34.4 35.1 36.0Other Services ................................................. 20.3 19.8 19.6 19.6 19.7 19.8Government ..................................................... 62.8 63.3 63.8 63.7 63.6 63.9 Total Nonfarm Employment ................................ 436.8 416.6 413.8 417.1 419.5 427.4_______________ 1 Combines the industry sector Transportation and Warehousing with the sector Utilities. Source: Delaware Department of Labor.
Chemical and Advanced Materials Industry
In Delaware, the business of chemistry is a vital part of the economy. Chemicals represent the leading export category for the State accounting for about 50% of Delaware’s total manufactured exports. The chemical manufacturing industry is a sector cluster in Delaware with more than a 200 year local history. The requirement for rapid chemical and material innovations has diversified and today thousands are employed in this vital industry.
The chemical industry in the State is diverse, going beyond the manufacturing of chemicals and includes advanced materials, instrumentation, research and development, marketing, distribution, intellectual property, and other capabilities that distinguish industry segments. Companies in Delaware continue to innovate for growth.
The global chemical and advanced materials industry is going through some of the most turbulent times in its history. The economic situation remains volatile, but many businesses are seeing a more stable environment for a continued recovery. Against this background, Delaware companies are making sure they are continually improving their processes and developing innovative solutions that meet the specific requirements of markets and consumers.
The importance of the chemical industry to Delaware’s economy historically stems from the establishment of E.I. du Pont de Nemours & Co., Inc. (DuPont) in 1802. DuPont (NYSE: DD) is a market-driven, science company and one of the State’s largest private employers. Operating globally with over

-24-
$35.5 billion in annual sales in 2013, DuPont offers a wide range of innovative products and services for markets including agriculture, nutrition, electronics, communications, safety and protection, home and construction, transportation and apparel. DuPont Pioneer, a subsidiary of DuPont, is the world's leading developer and supplier of advanced plant genetics, providing high-quality seeds to farmers in more than 90 countries. DuPont Pioneer provides agronomic support and services to help increase farmer productivity and profitability and strives to develop sustainable agricultural systems for people everywhere. On August 14, 2014, the company announced a multi-million dollar soybean research project to build significant new installations at the Stine Haskell Laboratory and renovate existing space at the DuPont Experimental Station in Delaware. Ashland Inc. (“Ashland”) (NYSE: ASH) created a leading specialty chemicals company with the acquisition of Hercules in 2008. Ashland products are sold in over 100 countries worldwide and are used in architectural coatings, automotive, construction, energy, food and beverages, personal care, pharmaceuticals, tissues and towels. Its operations in Delaware are part of one of four main operating groups, Ashland Specialty Ingredients. Ashland employs over 15,000 worldwide and approximately 420 in Delaware primarily at its research and technology center. In July 2014, Ashland’s water technology division was acquired by a fund managed by the private investment firm Clayton, Dubilier & Rice (CD&R) and included the Industrial Water and the Pulp and Paper business units. The resulting company is now named Solenis and has committed to remain in Delaware.
BASF Corporation (“BASF”) is the world’s leading chemical company (BASF shares are traded on the stock exchanges in Frankfurt (BAS), London (BFA) and Zurich (AN)) and operates a synthesis plant, a finishing plant and a metalized film plant in Newport, Delaware. This site is a global supply point for Quinacridone pigments and for Diketo Pyrrolo Pyrrol pigments. Both are a red-shade family of high-performance pigments used in the automotive industry, inks, paints and plastics. The company has won numerous environmental awards for its advanced system of handling waste and storm water at the site, which is also home to BASF’s Northeast Regional Service Center. Since the site was first acquired from DuPont in 1984, more than $250 million has been invested in site improvements and BASF continues to value the site as a key supply point for customers around the world. In 2013, BASF employed more than 112,000 worldwide and posted global sales of about $94.2 billion. Approximately 160 employees are employed in Newport, Delaware.
The Dow Chemical Company (“Dow”) (NYSE: DOW), is an industry-leading company with a portfolio of specialty chemical, advanced materials, agrosciences and plastics businesses and delivers a broad range of technology-based products and solutions to customers in approximately 160 countries and in high growth sectors such as electronics, water, energy, coatings and agriculture. In 2013, Dow had annual sales of $57.5 billion and employed approximately 53,000 people worldwide. Dow Electronic Materials, a global supplier of materials and technologies to the electronics industry has a significant presence in Delaware with over 500 employees. Chemical mechanical polishing products are developed and manufactured in Delaware for the fabrication of almost every type of electronic chip made today. It is expected that Dow’s Delaware site will continue to be responsible for products and develop R&D applications and customer support primarily in North America and Europe.
L’Air Liquide (OTC: AIQUY) is a worldwide leader in industrial and medical gases and related services. Founded in 1902, L’Air Liquide operates in more than 65 countries through 125 subsidiaries. L’Air Liquide has a state-of-the-art R&D facility in Delaware where it consolidated U.S. research and development operations along with some of its manufacturing engineering business. The total capital expenditures budget for this consolidated operation was nearly $30 million. In addition, the company has two industrial manufacturing sites in Delaware.

-25-
Agilent Technologies Inc. (“Agilent”) (NYSE: A) is a world leading provider of instrumentation, supplies, software and services to life science and chemical analysis markets. The Delaware site in Little Falls is the major location for the company’s chemical analysis measurement R&D, marketing and manufacturing operations. In 2007, Agilent opened its East Coast Center of Excellence at the company’s Delaware facility which employs almost 750 people.
Croda International Plc (“Croda”) (OTC: COIHF) is a world leader in natural based specialty chemicals which are sold to virtually every type of industry. The company has approximately 3,400 employees, working in 34 countries. The research and development center is located in New Castle, Delaware and is adjacent to its North American manufacturing plant. The facility helps to support Croda’s global activities in the personal care, lubricants, polymers, oilfield, specialty cleaning, fibers and crop protection industries. Research activities are closely coordinated with the company’s worldwide research program. Since 2006, Croda has invested $100 million in upgrades to its Delaware facility. Over the next three years, Croda plans to invest an additional $50 million in upgrades to enhance and expand the site. FMC Corporation (NYSE: FMC) is one of the world’s leading specialty chemical companies that employs approximately 5,600 people world-wide, and had annual sales of about $3.9 billion in 2013. FMC Health and Nutrition has a manufacturing plant located in Delaware which was originally opened for business in 1962. This site manufactures microcrystalline cellulose and has remained competitive on the world stage through a relentless focus on innovation, productivity and efficiency. The Delaware site has recently been selected to move forward with the company’s new North American BioColors Division, which will involve making colorants from natural sources (primarily plant extracts).
TA Instruments (“TAI”), a division of Waters Corporation, is the world-wide market leader in the field of thermal analysis and rheology. It provides thermal analysis, rheometry, and microcalorimetry instruments throughout the world which are used primarily in predicting the suitability of polymers, fine chemicals, and viscous liquids for various industrial, consumer goods and health care products. TAI is also a developer and supplier of software-based products that interface with the company’s instruments as well as other instruments manufactured by other companies. TAI’s division headquarters are located in Delaware where they recently completed a $40 million expansion project.
Other companies in this industry have been investing in their Delaware facilities. Kuehne Chemical has seen its volumes grow and continues to spend capital at its site. ILC Dover, known for making spacesuits for NASA, the airbag system for the Mars Rover and personal protection equipment for military, homeland security and industrial users is growing. In 2012, ILC Dover purchased Grayling Industries to complement its flexible containment products for the pharmaceutical industry. Life Sciences
Delaware is uniquely positioned in the center of one of our nation’s life science corridors, as recognized by Pharmaceutical Research and Manufacturers of America. Most of the world’s top pharmaceutical companies have major operations within a 50-mile radius of the State capital. Delaware is also home to Christiana Care Health Systems and Nemours A.I. duPont Hospital for Children. These health providers actively participate in research and clinical trials and have co-founded the launch of a nationally recognized consortium known as the Delaware Health Science Alliance.
Delaware Health Science Alliance combines the priorities and assets of the member institutions, which are Christiana Care Health System, Nemours A.I. duPont Hospital for Children, Thomas Jefferson University and the University of Delaware. This new coalition of leading education, healthcare and medical research institutions has been formed to nurture research and the development of advanced technology with the State. In January 2014, Delaware Health Science Alliance moved into 300,000 square feet of newly

-26-
designed space at the University of Delaware’s Science, Technology & Advanced Research (“STAR”) campus.
Other private industry investments help drive Delaware’s leadership in life sciences, such as AstraZeneca, Plc, DuPont, Agilent, Hologic, Inc. (“Hologic”), Siemens AG, Dentsply Caulk and Merck Animal Health. Examples include DuPont’s Center for Collaborative Research & Education at its Wilmington-based Experimental Station. The Experimental Station has been the home to the discovery and development of virtually every major DuPont product since 1903.
Dentsply Caulk recently upgraded their equipment and facility and provided customized training to its employees resulting in improved productivity. Located in Milford, Delaware, Dentsply Caulk performs research, development and manufacturing of dental health composites and complementary instruments and works closely with researchers at the University of Delaware and Delaware State University.
Merck Animal Health, located in Millsboro, Delaware continues its legacy of research, development and manufacturing of vaccines, primarily focused on poultry. It also continues to provide similar services and production for small and large animals with a special concentration on poultry vaccines. Although some of the backroom, office support functions were relocated soon after Merck acquired the Delaware facilities from Intervet/Schering Plough, it continues to create new, highly-skilled research and manufacturing jobs and to make significant capital investments in its Delaware facilities.
Hologic’s 3D Mammography is growing in Delaware. In 2012, Hologic acquired a German-based coatings company, AEG Electrofotgraphie GmbH, and is in the process of relocating that business to its Newark, Delaware site. In 2013, the company completed a building expansion which will house the new equipment and new highly-skilled workers. Hologic is a company that has been at the forefront of the industry’s transformation from analog to digital mammography. Delaware is proud to be home to the research, development and manufacturing of the 3D panels.
In April 2007, the State and Siemens Healthcare announced the company’s new Customer Solutions Center in Newark, Delaware. As a global powerhouse in electronics and electrical engineering, Siemens has always been synonymous with technological excellence, innovation, quality, reliability and internationality. By focusing its business on the industry, energy and healthcare segments, Siemens Healthcare is poised to respond to demographic change, urbanization, climate change and globalization - the megatrends of today and tomorrow.
Agilent, the world’s largest maker of scientific equipment, operates its Center of Excellence, an 8,000 square foot state-of-the-art demonstration laboratory in Delaware. The Center of Excellence is the eighth in the world and will revamp the way the company markets its products on the East Coast.
New innovations continue to thrive in Delaware. One notable example is Incyte, Inc. Since basing
its headquarters in Delaware more than 10 years ago, Incyte has discovered, developed and commercialized Jakafi® (ruxolitinib), a medicine that was the first drug approved by the U.S. Food and Drug Administration for the treatment of a rare blood cancer and the first one in its class approved for any indication. Incyte is also developing Jakafi® as a potential treatment for additional cancers and has a broad product pipeline that includes multiple compounds that address a number of unmet patient needs. Incyte is working towards the completion of and relocation to its newly renovated 190,800 square foot campus on 16.7 acres in North Wilmington.
In addition, Delaware’s colleges and universities continue to develop and update curriculum in direct
support of the life sciences.

-27-
Delaware State University offers a Health Professions track in the BS degree in Biological Sciences that offers complete preparation for medical, dental, pharmacy, and veterinary schools, as well as other careers in health care.
Within the University of Delaware’s College of Health Sciences (the “College”), research provides
an evidence-based foundation for the education of the next generation of thought leaders and healthcare professionals. The College is also a place where partnerships play a key role in promoting health research and education. High-quality undergraduate and graduate programs, research seed grant programs, and clinical research projects provide the students with rich classroom, laboratory, and clinical experiences. The programs encompass a broad and dynamic collection of specialties, including medical laboratory science, kinesiology, applied physiology, nursing, physical therapy, behavioral health and wellness, and nutrition. In each program, the College creates an experience that shapes changes in practice based on scientific evidence. The College’s approach is to translate strong platforms in interdisciplinary science into health practices, therapies, and interventions that result in immediate improvements in people’s lives.
Delaware Technical Community College (“DTCC”) is Delaware’s accredited and nationally recognized community college system. DTCC provides instruction through four campuses throughout the State, as well as through online instruction, offering associate degree and certificate programs designed to meet industry demand. In addition to traditional life sciences related to medical, dental, pharmacy and veterinary programs, DTCC offers degree programs related to basic biologics. DTCC graduates, along with those of other Delaware-based colleges and universities, provide a strong pipeline of highly-skilled workers for medical service providers, industrial, research and public health laboratories, as well as basic biotechnicians for a wide variety of laboratory settings. DTCC provides dual-enrollment through articulation agreements with Delaware’s institutes of higher education as well as with local high schools. This provides unique advanced education opportunities for students at all levels. Research and Development
Delaware’s economy has long been a source of innovation and technological growth. Some of the State’s most prominent firms, such as Agilent, AstraZeneca, DuPont and W.L. Gore and Associates, are world renowned for their technical breakthroughs and resulting commercial success. The presence of these firms and others like them, as well as its highly capable research universities, have positioned Delaware as one of the leading states in the nation for industry investment and research and development as well as high wage service jobs. The Kauffman Foundation and the Information Technology & Innovation Foundation ranked Delaware 2nd overall in the 2014 State New Economy Index, which measures the ability of states to transform from an industrial economic model to one that creates and retains high value-added, high- wage jobs. Delaware has consistently ranked in the top 10 and currently ranks: 1st in the nation for high-wage traded services, industry investment in R&D and foreign direct investment; 3rd in the nation for information technology and patents; and 7th in the nation for scientists and engineers.
Delaware’s high quality workforce and innovative research and development environment provide excellent opportunities for technology-based business growth and entrepreneurial ventures. The State provides a variety of technology resource programs and innovative business development support to enhance commercialization opportunities. This support includes Delaware’s status as a Kauffman FastTrac Affiliate and its Kauffman FastTrac New Venture and Growth Venture Entrepreneurial Training Initiatives. In August 2012, Start It Up Delaware, Inc. (“Start It Up Delaware”) was incorporated as a for-profit company operating through its wholly-owned subsidiary, coIN Loft Inc. Start It Up Delaware is a public-private partnership serving as a hub for entrepreneurship and job creation. The partnership brings together Delaware’s financial, accounting, legal and real estate communities, as well as the University of Delaware, Delaware State University, Delaware Technical and Community College and other institutions of higher education.

-28-
The University of Delaware’s outstanding reputation for research in cooperation with industry is well recognized in many areas. Its innovative research efforts are illustrated through its partnerships with industry in composite materials, information science, biotechnology, alternative energy, virology and development of genetically engineered vaccines, and agrigenetics, including plant tissue culture research. Through its seven colleges, institutes and various centers, including the Center for Composite Materials, Center for Catalytic Science and Technology, and Center for Climatic Research, the University of Delaware has fostered growth and development in the chemical, computer, energy, food, agricultural and marine sciences industries.
The University of Delaware’s Institute of Energy Conversion, one of the world’s largest thin-film solar cell laboratories performing research and process development for industry, has been designated by the U.S. Department of Energy as a national center of excellence in photovoltaic research and education. The University of Delaware’s Center for Composite Materials is one of three partners in an Army Research Laboratory Materials Center of Excellence.
Nemours Biomedical Research, the nation’s largest group medical practice devoted to pediatric care, education, and research and headquartered at the Nemours Alfred I. DuPont Hospital in Wilmington, Delaware, has more than 40 different research programs and laboratories to support the medical and surgical staff in restoring and improving the health of acutely and chronically ill children. Based on dollars received from the National Institutes of Health, Nemours Biomedical Research would rank 16th in overall awards to freestanding children’s hospitals. According to the American Hospital Association Guide, there are about 250 such children’s hospitals.
The Delaware Technology Park (“DTP”) is part of Delaware’s commitment to attracting both established businesses and promising high-tech companies. With a combination of government, academic and industry partners, it is now home to 54 high-tech companies, including the Delaware Biotechnology Institute. The mission behind DTP is to promote economic development and innovation and, to that end, has developed an integrated system of technology focused facilities and services. Since its inception, DTP has housed more than 75 companies, including 25 companies that have matured and graduated from DTP. There has been $300 million invested in DTP and an additional $300 million given to DTP organizations through research grants. Biotechnology
Delaware is one of a few states with a specialization in all four bioscience subsections: (1) agriculture, feedstock and chemicals; (2) drugs and pharmaceuticals; (3) medical devices and equipment; and (4) research and testing. With its roots in the research and development standards set by the DuPont Company more than 200 years ago, Delaware is currently home to life science firms ranging from incubator start-ups to multinational giants with a supportive environment for creativity and innovation. Delaware is uniquely positioned geographically and scientifically to maximize the biotechnology industry across all spectrums. Delaware’s location at the center of the East Coast of the United States provides excellent access to world markets. Delaware lies in the eastern megalopolis where approximately one-third of the United States’ population resides. A 350-mile radius circle, drawn around the City of Wilmington, Delaware, encompasses every major population center from Boston, Massachusetts to Raleigh, North Carolina, and as far west as Cleveland, Ohio. Modern highways, railroads, airports, ports, and public transit systems facilitate the movement of products and people.
The Delaware Biotechnology Institute (“DBI”), located in DTP, is an academic unit of the University of Delaware and a partnership among government, academia and industry to help establish Delaware as a center of excellence in biotechnology and the life sciences. DBI’s mission is to build a biotechnology network of people and facilities to enhance academic and private sector research, catalyze

-29-
unique cross-disciplinary research and education initiatives and to foster the entrepreneurship that creates high quality jobs. DBI’s 72,000 square foot research facility is designed to house 140 faculty and student researchers and features 25 dedicated research laboratories, 10 common research laboratories, six state-of-the-art research instrumentation centers, and several large and small conference areas. Some of the companies launched at DBI are: the Fraunhofer Center for Molecular Biotechnology, LLuminari, Neurologix, InfoQuest Systems, iBio, Occam BioLabs and Quantum Leap Innovations. DBI contributes at all levels to Delaware’s innovation in Science, Technology, Engineering and Math (STEM) by leading the State’s annual BioGENEius Challenge, by collaborating with the national Biotechnology Industry Organization (BIO) and by augmenting k-12 biotechnology education with programs for teachers as well as students throughout the school year.
DBI led Delaware’s effort towards gaining Experimental Program to Stimulate Competitive
Research (“EPSCoR”) status with the National Science Foundation’s Experimental Program Status Competitive Research. EPSCoR status provides Delaware and 22 other qualifying states and U.S. Territories with a better chance for federal funding dollars. Eight federal agencies, including the National Institutes of Health (“NIH”) and the National Science Foundation (“NSF”), participate in this program.
Over the past five years, DBI has successfully built a capability in plant molecular biology to better
understand the basic processes that control plant development on the genetic level. Combined with the highly regarded genomics-based poultry disease research located at DBI, this newly developed capability has direct applications to serve Delaware’s agricultural industry.
Leading-edge interdisciplinary research is at the core of DBI’s work. Successful partnerships are
already underway involving biology, biochemistry, engineering, marine, materials science and computational biology. Encompassing 12 academic departments at the University of Delaware alone, collaborations are also state-wide, national and international, with the participation of scientists from Delaware State University, DTCC, and Wesley College. DBI-affiliated researchers are principal investigators in a growing portfolio of federal research grants from NSF, NIH, the U.S. Department of Agriculture (“USDA”) and numerous other government agencies and private foundations.
In 2012, with support from the State, DBI launched The Bioscience Center for Advanced
Technology (“The Bioscience CAT”), which synergizes efforts among the academic and industrial community to address the technology innovation gap and promote economic development in Delaware. The Bioscience CAT links researchers in Delaware institutions with Delaware bioscience companies with the goal of investing in the bioscience community to ensure Delaware competes on the world stage in biotechnology innovation. The Bioscience CAT has three key components: a grant program funded by the State, a technology access program, and an annual symposium. The Technology Access Program (“TAP”) provides Delaware bioscience businesses with access - at a reduced fee - to high-end technology platforms available as part of the DBI network. Many businesses routinely send samples to these facilities for analysis and pay a certain rate for this service. Under TAP, businesses will be able to continue to do their work, but receive a discounted rate that is subsidized by Bioscience CAT.
Delaware’s investments serve as seed funding for private investments, as found in the example of
Fraunhofer Center for Molecular Biotechnology (“CMB”). Established in July 2001 as a partnership between the Fraunhofer Society in Germany and the State, CMB conducts research in the area of plant biotechnology, developing cutting edge technologies to assist the diagnosis, prevention and treatment of human and animal diseases. With the addition of CMB manufacturing capability and the successful completion of two successful Phase I clinical trials, CMB’s plant-based, protein production technology achieved several important developmental milestones. The advancement of FhCMB’s work, as measured by the U.S. Department of Defense, has evolved from Level 1- Basic technology research, through proof of feasibility, technology development and demonstration to level 8 – System and subsystem development,

-30-
which has made CMB eligible for new funding from various government departments including the NIH. This is a major accomplishment which both externally validates CMB’s innovative technology and enables the organization to move closer to the goal of improving sustainability.
After several rounds of funding from the Bill and Melinda Gates Foundation to support the
development of transmission-blocking vaccines against malaria, CMB recently received funding from the National Institute of Allergy and Infectious Diseases to advance development of candidate vaccine components and technologies that accelerate the immune response for use following intentional release of Bacillus anthracis or in response to naturally occurring outbreaks.
Another new project, funded by the U.S. Defense Threat Reduction Agency, will develop a cost-
effective, high throughput, ex-vivo, lung tissue- based system for evaluating vaccine safety and immunogenicity directly in human tissue. This three year contract will address one of the largest obstacles in the current system of evaluating vaccine safety and immunogenicity - the lengthy testing in animal models that preceded clinical drug development.
To ensure Delaware’s continued voice in regional biotechnology industry opportunities, the
Delaware BioScience Association (“DBA”) was formed in 2006. DBA is a non-profit trade association dedicated to promoting and expanding Delaware’s bioscience industry by establishing a unified voice in order to accelerate the growth of human, animal, plant, and industrial bioscience, advocating on behalf of the industry in support of public policies that advance bioscience in the State, supporting initiatives that help attract bioscience talent and enterprises to the State, as well as support their retention and growth, while developing and implementing programs that build local, regional, national, and international recognition of and support for Delaware’s bioscience industry. The membership has grown to include over 120 members including several global companies such as AstraZeneca, Endo Pharmaceuticals, QPS LLC, previously known as Quest Pharmaceutical Services and Siemens Healthcare.
Delaware State University (“DSU”) is another proud contributor to Delaware’s biotechnology
research and technology transfer. In 2009, DSU launched the Center for Integrated Biological and Environmental Research designed as a regional faculty network hub that includes DSU, Wesley College, DTCC and the University of Delaware. Major functions of the center include: (1) identifying funding opportunities and assisting in bringing together groups of researchers in order to secure grants; (2) communicating the availability of and training on the use of research instrumentation and equipment across the network; (3) coordinating the use and maintenance of key common research facilities at DSU; and (4) integrating research and outreach activities for partner institutions. All students on the Biotechnology track at DSU complete an independent research project for their Senior Capstone course.
Delaware is also home to a number of healthcare-related, biotechnology facilities such as: (i) Christiana Care’s Health System’s Helen F. Graham Cancer Center (one of only 34 National Cancer Institute’s Community Oncology Research Program Community sites and one of only 12 Minority/Underserved Community sites that will implement the latest, most scientifically-advanced clinical research designed and led by NCORP under a 5-year, $8.2 million grant); (ii) The Charles C. Carson Center for Mortuary Affairs (the U.S. Department of Defense’s largest joint-service mortuary facility and the only one located in the continental United States); (iii) the 436th Medical Group at Dover Air Force Base; (iv) A.I. DuPont Hospital for Children; (v) Astra Zeneca Pharmaceuticals; (vi) Incyte Pharmaceuticals; (vii) Merck Animal Health; (viii) Hologic; (ix) Agilent Technologies; (x) Siemens Healthcare; (xi) UPS Healthcare Logistics; (xii) Dentsply Caulk; and (xiii) CD Diagnostics.
Financial Services Industry Banks and other financial institutions have been a major focus of Delaware’s economic development
activity since 1981. In that year, landmark legislation was passed that opened Delaware to interstate

-31-
banking, modernized the State’s banking laws, and permitted the creation of new types of special purpose intermediaries. The 1981 Financial Center Development Act created strong economic incentives for the banking industry in Delaware, including a favorable state tax structure and a market based approach to lending that eliminated restrictive usury caps. These laws continue to create a favorable economic environment for banking. The State subsequently enacted additional legislation in order to sustain the State’s competitive advantage in banking. In 1989, the Bank and Trust Company Insurance Powers Act was signed into law which allowed State-chartered banks and trust companies to underwrite and sell various types of insurance. In response to the Riegle-Neal Interstate Banking and Branching Efficiency Act of 1994, the State enacted legislation in 1995 to keep Delaware’s banking community competitive and to maintain Delaware’s role as a financial services center. In 1995, the State Bank Commissioner issued the “Incidental Powers Regulation”, which is designed to keep Delaware competitive by allowing State-chartered banks and trust companies to exercise additional powers incident to a banking corporation. The State tax structure was modernized in 2006 by allowing banks to elect an alternative system based on a three-factor income apportionment for multi-state operations, plus a location benefit tax reflecting the value of utilizing Delaware’s banking laws and bank system.
There are currently about 80 banks and trust companies in Delaware, including full-service commercial banks, credit card banks, non-deposit and limited purpose trust companies, wholesale banks, and federal and state savings banks. Banking is one of the State’s largest private industry sector employers, with over 26,000 employees as of December 2013, according to the Delaware Department of Labor. Credit cards are a major industry. Prominent credit card issuers in Delaware include Bank of America, N.A., JPMorgan Chase & Co., Discover Bank and Barclays Bank Delaware. Other major bank employers include M&T Bank Corporation, PNC Financial Services Group, Inc., Capital One, N.A., Citigroup and BNY Mellon. During the fiscal year ending June 30, 2014, the bank franchise tax contributed $102.9 million, about 2.9% of the State’s total revenues. Construction
During 2013, Delaware’s housing production totaled 4,693 units. The following table outlines total housing production in the State by county for 2009 through 2013. Housing production includes single-family and multifamily housing, public and private. In 2013, single-family housing (including condominiums) represented 83.0% of total production, and multifamily units represented 17.0%.
Production of Housing Units
2009 2010 2011 2012 2013 New Castle County ....................... 796 608 711 990 1,282 Kent County .................................. 800 793 737 907 937 Sussex County ............................... 1,555 1,554 1,702 2,004 2,474 Total ................................. 3,151 2,955 3,150 3,901 4,693
________________________ Source: Delaware State Housing Authority. Incorporations
As of December 2013 the total number of business entities registered with the Delaware Division of Corporations exceeded 1,051,000. More than 152,000 new business entities were formed in Delaware in 2013. The State continues to be the corporate home of over half of all publicly-traded firms in the United States. Delaware is the legal domicile of more than 65% of the companies listed in the “Fortune 500”. Delaware leads the nation in per capita business entity filings and has ranked among the top five states in the nation for new business entity formations since 1989. The principal driver of this growth over the long term has been the popularity of alternative business entities, such as Delaware limited liability companies.

-32-
The Delaware General Corporation Law is widely regarded as the most modern and flexible corporate statute in the nation. In addition to the option of forming a Delaware corporation, the Delaware Code enables businesses to form as general partnerships, limited partnerships, limited liability companies and statutory trusts. Businesses may also qualify as limited liability partnerships or limited liability limited partnerships. Delaware’s legal entity statutes, combined with a well-developed body of case law in important areas of corporate governance such as director liability and takeovers; prompt resolution of commercial and corporate disputes by Delaware’s Court of Chancery; and efficient service from the Delaware Division of Corporations have resulted in significant business formation activity.
In order to sustain its competitive edge over other states and countries, Delaware continues to adopt statutes that respond to changing business conditions. Recent laws extend the corporate jurisdiction of the Court of Chancery to include jurisdiction over commercial technology disputes and allows the Court to mediate many types of complex business disputes, providing a more cost-effective, confidential, and consensual method for resolving litigable disputes. Another recent law permits corporations to form as public benefit corporations, a new kind of socially-conscious, for-profit corporation whose affairs are to be conducted for the benefit of stockholders as well as certain specific public benefits and those affected by the corporation’s activities. Delaware law provides incentives for businesses to locate headquarter services and captive insurance operations in Delaware. The State’s legal entity laws provide a simple method for domesticating an entity in Delaware and converting from one type of business entity to another type of entity. The Division of Corporations continues to enhance its services by offering 1-hour processing service and expanding Internet services to allow businesses to reserve corporate names, access general corporate information and file annual tax returns. All of these enhancements provide further incentives for entrepreneurs, businesses and investors to make Delaware their legal home.
Revised Article IX of the Uniform Commercial Code (“UCC”) took effect in most U.S. states in 2001 and provided that many UCC documents should be filed in the debtor’s state of incorporation. In July 2001, Delaware became one of the first states to allow for the filing of UCC information via the Internet. General Fund revenue from UCC transactions totaled $17.1 million in fiscal year 2014.
Agriculture Agriculture is a very significant industry in Delaware. In 2013, there were 2,450 farms, and land in farms at 500,000 acres, accounted for 40% of Delaware's total land area. Farm size averaged 204 acres.
In 2013, the total market value of agricultural land and buildings was $4.09 billion, and the average value per farm was $1,667,000. The average market value per acre of farmland and buildings in Delaware was $8,170, nearly three times the national average of $2,730. Only four states had a higher value per acre of farm real estate. The average value per acre was virtually unchanged from 2012.
In 2012, the value of agricultural sector production was $1.38 billion and the Delaware agricultural cash receipts total was $1.18 billion for all commodities. Cash receipts in 2012 were up 11% from the 2011 level of $1.08 billion.
Delaware's 2012 net farm income increased 17% from the 2011 level of $232 million to $272 million. Increased crop production, higher crop prices and a record high broiler price were primarily responsible for the increase in net farm income.
In 2012, agricultural production value per farm was $550,717 and the value per acre was $2,810.
Cash receipts per acre was at $2,409 and net farm income per acre was at $556.

-33-
The cash receipts from Delaware farms as compared to the U.S. total in 2008-2012 are outlined in the table below.
FARM CASH RECEIPTS
DELAWARE (in millions)
UNITED STATES (in billions)
Year
Livestock &
Livestock Products
Crops
Total Cash
Receipts
% Change from
Previous Year
Total Cash
Receipts
%Change from
Previous Year
2008 $ 781 $ 261 $ 1,042 6.6 $ 316.4 9.7 2009 772 242 1,014 (2.7) 289.1 (8.6) 2010 828 230 1,058 4.2 321.1 11.1 2011 749 316 1,065 0.7 368.0 14.6 2012 804 377 1,181 10.9 395.1 7.3 Sources: Delaware Department of Agriculture and National Agricultural Statistics Service/USDA. The Port of Wilmington
The Port of Wilmington (the “Port”) is one of the two largest importers of containerized bananas and other fruit in the world and is a significant east coast importer of: break bulk fruit, juice and produce, particularly winter Chilean fruit, citrus products from Morocco, juice concentrate and fruit from Argentina, liquid bulk juice concentrate from Brazil, and liquid petroleum products. Other notable break bulk items moving over the Port’s piers include: steel, paper liner board, dry bulk, and scrap metal. The Port has also established a niche in handling specialized cargo such as large wind turbines, dismantled distillation and chemical plants, generators, rocket booster cores, concrete railroad ties, and livestock export. The Port continues to be a major point of consolidation and export of vehicles to the Middle East, Africa, and Central and South America.
The Port has a central location on the east coast and excellent access to rail and highway transportation systems. Warehouse facilities include 250,000 square feet of dry and 750,000 square feet of modern temperature controlled refrigerated space. The combination of relatively new facilities, operational experience, proximity to transportation networks and a skilled labor force has made the Port among the most successful ports in the very competitive mid-Atlantic and Northeast region.
Founded in 1923, the Port is owned and operated by the Diamond State Port Corporation (“DSPC”). In June 1995, the General Assembly authorized the creation of the DSPC, a membership corporation with the Department of State as the sole member, for the purpose of acquiring and operating the Port. On September 1, 1995, DSPC acquired substantially all of the Port’s assets from the City of Wilmington. Under the terms of that agreement, DSPC agreed to make payments to the City of Wilmington equal to $39.9 million over a 30-year period and to pay amounts equal to total debt service on approximately $51.0 million of indebtedness previously incurred by the City of Wilmington for Port related assets. The Delaware Transportation Authority’s Transportation Trust Fund has loaned funds to the DSPC to enable it to restructure certain of the DSPC’s debt and to fund certain capital projects. The Delaware River and Bay Authority has participated with DSPC to fund a refrigerated warehouse in 2006. The total long-term debt of the DSPC outstanding as of June 30, 2013 was $26.7 million. DSPC does not have the power to pledge the credit of the State.
In fiscal year 2013, a total of 5.2 million tons of cargo passed through the Port’s facilities, an increase of 2% compared to fiscal year 2012. The combination of growth in cargo tonnage and changes to

-34-
the mix of cargo increased operating revenue by 8% from $34.0 million to $36.7 million. Petroleum liquid bulk imports decreased by 0.2 million tons in fiscal year 2013 to 1.3 million tons. Compared to fiscal year 2012, dry-bulk cargo tons increased by 8%, vehicle tons by 7%. Over $187 million has been provided by the State through fiscal year 2013 for Port infrastructure improvements and debt restructuring. The Port is not required to repay these funds.
The Port is part of the State’s financial reporting entity and is considered an enterprise fund for the State’s GAAP (hereinafter defined) financial reporting purposes. See “Appendix C - Notes to the Financial Statements-#6, Revenue Bonds”. Dover Air Force Base The federal government maintains a major U.S. Air Force Base (the “Base”) in Dover, Delaware. The 3,900 acre Base, established in 1941, is the nation's busiest military cargo terminal and a key airlift center. It is home to the 436th Airlift Wing, known as the “Eagle Wing” and the 512th Airlift Wing, referred to as the “Liberty Wing”. The 436th Airlift Wing provides command and support functions for assigned airlift operations, permitting worldwide movement of outsized cargo (including the military's largest tanks and heaviest weapons and equipment) and personnel. The unit flies Lockheed C-5 Galaxy transport planes, known as “the free world's largest airlifter” and C-17 Globemaster. Together with the 512th Airlift Wing, aircrews from Dover fly an air fleet that comprises 25% of the nation’s strategic airlift capacity. In addition, the Base hosts the Charles C. Carson Center for Mortuary Affairs, the defense department’s largest joint-service mortuary facility and the only one located in the continental U.S. There are approximately 6,400 military personnel – 3,900 active duty, 1,500 reservists, and 1,000 civilians – who work at the Base. It is estimated that the economic impact of the Base on the local economy is $466 million annually.
STATE FINANCIAL OPERATIONS The State controls and records its financial transactions on a cash basis of accounting for its day-to-day operations in accordance with the various budgets and statutes passed by the General Assembly and approved by the Governor. See “FINANCIAL STRUCTURE Budgetary Control and Financial Management Systems”. The State’s audited June 30, 2013, Basic Financial Statements as set forth in Appendix B, were prepared in accordance with accounting principles generally accepted in the United States of America (“GAAP”) using both the modified accrual basis and full accrual basis of accounting. The following discussion of State finances relates to the budgetary General and budgetary Special Funds of the State, as more fully set out in the financial statements included under Appendix A hereto. Revenue and Expenditure Forecasting
The Delaware Economic and Financial Advisory Council (“DEFAC”), created in 1977, is comprised currently of 33 members appointed by the Governor. Current members of DEFAC include five cabinet-level officials, the State Treasurer, the Controller General, one other governmental official, six legislators, and 19 private citizens from the business, financial and academic communities.
DEFAC is mandated by executive order to submit to the Governor and the General Assembly budgetary General Fund and Transportation Trust Fund revenue forecasts six times each fiscal year in September, December, March, April, May and June for the current fiscal year and the succeeding two fiscal years. A forecast for the current fiscal year and the succeeding four fiscal years is generated once each year, no later than October 1. Budgetary General Fund and Transportation Trust Fund expenditure forecasts are generated for the current fiscal year in December, March, April, May and June. The various DEFAC forecasts contained in this Official Statement were provided as of September 15, 2014.

-35-
These revenue and expenditure forecasts are used in the State budget process to ensure compliance with the State’s constitutional limits on spending and statutory debt limitations. See “FINANCIAL STRUCTURE - Appropriation Limit” and “Debt Limits”. The subcommittees of DEFAC are the Expenditure and Revenue subcommittees, which meet prior to the DEFAC meetings. The full DEFAC meetings are open to the public and provide a general forum for members of the private and public sectors to exchange views on matters of economic and fiscal concern for the State.
DEFAC relies on projections of national economic trends by IHS Global Insight, Inc. (formerly DRI-WEFA), the Department of Finance’s econometric model, projections generated by the Department of Transportation, its members’ knowledge of the State’s particular economic strengths, and its members’ understanding of the structure of the State’s revenue system. A comparison of DEFAC’s forecasts of budgetary General Fund revenue with actual year-end revenue is reviewed in the following table. These forecasts were generated 18 months and 9 months prior to the end of each fiscal year. DEFAC does not project the revenue impact of legislation until after its enactment.
DEFAC Budgetary General Fund Revenue Projections (in millions)
2010 2011 2012 2013 2014 18 Months Before Fiscal Year-End ..... $2,937.7 $3,176.3 $3,444.9 $3,566.1 $3,663.3 9 Months Before Fiscal Year-End ....... 3,143.1 3,363.0 3,379.5 3,699.0 3,732.4 Actual Fiscal Year-End Revenue ......... 3,235.1 3,531.4 3,359.3 3,729.8 3,572.7 Economic Projections Based upon national forecasts by IHS Global Insight, Inc. in September 2014, the State’s economy is expected to be in line with the broader U.S. economy, which has been in modest recovery since the recession ended in June 2009. The following chart compares forecasted population, employment and personal income growth rates for fiscal years 2015 through 2017 for Delaware and the United States, considered by DEFAC in making its revenue forecasts as presented herein.
Projected Economic Growth Rates Delaware United States Fiscal Fiscal Fiscal Fiscal Fiscal Fiscal 2015 2016 2017 2015 2016 2017 Population Growth ........................... 1.2% 1.2% 1.2% 0.8% 0.8% 0.8%Employment Growth ........................ 2.2 1.5 1.4 1.9 1.7 1.7Personal Income Growth .................. 3.2 3.9 4.8 4.5 4.8 5.9Sources: Delaware Department of Finance and IHS Global Insight, Inc.

-36-
Revenue Summary - Fiscal Year 2015E - Fiscal Year 2017E
The following table and chart include DEFAC’s forecast of budgetary General Fund revenue from all sources as of September 15, 2014, for fiscal year 2015, fiscal year 2016 and fiscal year 2017. DEFAC forecasts General Fund revenue growth of 10.4%, -1.6% and 3.2% for fiscal years 2015, 2016 and 2017, respectively. See “Fiscal Year Ending June 30, 2015”.
Budgetary General Fund Revenue (in millions)
DEFAC Forecasts as of September 15, 2014 Fiscal Year 2015 Fiscal Year 2016 Fiscal Year 2017 Forecast Change Forecast Change Forecast Change Personal Income Tax ......................... $1,436.1 3.7% $1,504.7 4.8% $1,580.1 5.0% Less: Refunds ................................... -209.8 6.3 -223.4 6.5 -234.6 5.0 PIT Less Refunds ............................... 1,226.3 3.2 1,281.3 4.5 1,345.5 5.0 Franchise Tax .................................... 653.6 4.3 655.8 0.5 655.8 0.0 Limited Partnerships & LLC's ........... 239.2 22.2 251.1 5.0 263.7 5.0 Subtotal Franchise Tax and Limited Partnerships & LLCs 891.8 8.6 906.9 1.7 919.5 1.4
Less: Refunds ................................... -10.0 46.9 -10.0 0.0 -10.0 0.0 Net Franchise Tax and Limited Partnerships & LLCs ......................... 881.8 8.2 896.9 1.7 909.5 1.4 Business Entity Fees .......................... 99.8 4.0 103.8 4.0 108.0 4.0 Uniform Commercial Code ................ 17.5 2.0 17.7 1.1 18.0 1.7 Corporation Income Tax .................... 260.0 48.1 195.0 -25.0 200.9 3.0 Less: Refunds (1) ................................ -42.6 -42.0 -42.6 0.0 -42.6 0.0 CIT Less Refunds .............................. 217.4 113.1 152.4 -29.9 158.3 3.9 Bank Franchise Tax ........................... 102.1 -0.6 100.2 -1.9 102.2 2.0 Gross Receipts Tax ............................ 231.9 2.4 243.0 4.8 255.2 5.0 Lottery ............................................... 206.2 -3.9 207.3 0.5 213.8 3.1 Abandoned Property .......................... 554.0 16.7 495.0 -10.6 495.0 0.0 Hospital Board and Treatment ........... 46.7 -4.6 46.5 -0.4 46.8 0.6 Dividends and Interest ....................... 5.0 75.7 8.0 60.0 11.0 37.5 Realty Transfer Tax ........................... 77.2 27.9 65.8 -14.8 69.1 5.0 Estate Tax .......................................... 5.0 292.9 5.0 0.0 5.0 0.0 Insurance Taxes ................................. 54.5 2.9 53.5 -1.8 54.6 2.1 Public Utility Tax .............................. 51.6 8.8 49.4 -4.3 51.2 3.6 Cigarette Taxes .................................. 108.7 -5.2 106.5 -2.0 104.4 -2.0 Other Revenues. ................................. 109.7 24.1 95.8 -12.7 104.8 9.4 Less: Other Refunds .......................... -50.6 37.0 -44.9 -11.3 -44.9 0.0
Total(2) .................................. $3,944.8 10.4% $3,883.2 -1.6% $4,007.5 3.2% (1) The State’s Division of Revenue has received corporate income tax refund claims that total $136.8 million, the validity of
which are in various stages of evaluation, but nonetheless represents an amount well in excess of typical refund claims. Some amounts have been recognized. Please See Note 19 of the Basic Financial Statements for the fiscal year ending June 30, 2013 attached hereto as Appendix B.
(2) May not equal the sum of its components due to the rounding of actual amount.

-37-
The following chart shows both the growth in and source of budgetary General Fund revenues since 2006.
Budgetary General Fund Revenue at June 30 (in millions)
$0
$500
$1,000
$1,500
$2,000
$2,500
$3,000
$3,500
$4,000
2006 2007 2008 2009 2010 2011 2012 2013 2014 2015E
Lottery
Corp. Income
Franchise
Other
Personal Income
Bank Franchise
Gross Receipts

-38-
Expenditure Summary - Fiscal Year 2012 - Fiscal Year 2015E The following table compares total budgetary General Fund expenditures by major departments for the past three fiscal years ending with fiscal year 2014 and estimated expenditures for fiscal year 2015. These figures include supplemental appropriations for capital projects. See also “BUDGETARY GENERAL FUND SUMMARIES - Budgetary General Fund Disbursements by Category of Expense.”
Budgetary General Fund Expenditures (in millions)
Fiscal
Year 2012 Change
Fiscal Year 2013 Change
Fiscal Year 2014 Change
Fiscal Year
2015E(1) Change Correction ............................. $262.3 6.9% $265.0 1.0% $273.5 3.2% $ 277.5 1.5% Health and Social Services ................................ 1,055.1 26.4 1,061.9 0.6 1,087.2 2.4
1,118.9
2.9
Higher Education .................. 222.7 1.2 226.7 1.8 234.6 3.5 226.6 (3.4) Public Education ................... 1,155.8 5.9 1,194.0 3.3 1,242.6 4.1 1,267.6 2.0 Safety & Homeland Security ............................... 137.5 8.6 144.3 4.9 145.6 0.9
125.6
(13.7)
Services to Children, Youth & Their Families ........ 134.5 11.4 141.9 5.5 149.5 5.4 154.6 3.4
Other Expenditures ............... 624.5 (1.1) 624.7 0.0 661.1 5.8 639.0 (3.3) Total ...................................... $3,592.4 9.8% $3,658.5 1.8% $3,794.1 3.7% $3,809.5 0.4%
(1) Based on fiscal year 2015 budget.
The table below depicts trends in State expenditures by the three major components; i.e., budgetary General Fund base budget for operations, supplemental appropriations for one-time capital projects and debt reduction, and the effect of the carryover of these unspent capital funds on the overall spending levels. The nature of capital projects tends to delay the actual expenditure of capital funds to fiscal years subsequent to the fiscal year in which they were appropriated.
Adjusted Budgetary General Fund Expenditures (in millions)
Fiscal Year 2012
Change
Fiscal Year 2013
Change
Fiscal Year 2014
Change
Fiscal Year
2015E
Change Base Budget $3,293.8 7.5% $3,403.8 3.3% $3,534.2 3.8% $3,809.5 7.8%
Supplemental Appropriations 114.2 10.7 86.8 (24.0) 86.0 (0.9) 69.2 (19.5)
Prior Year Carryover 184.4 75.8 168.0 (8.9) 173.9 3.7 (47.8) (127.5)
Total $3,592.4 9.8% $3,658.5 1.8% $3,794.1 3.7% $3,830.9(1) 1.0%
______________________________
(1) Per September 15, 2014 DEFAC revenue and expenditures projections. Note: Totals may not add due to rounding.

-39-
Sources and Uses of State Funds The distribution of budgetary General Fund revenues and appropriations is shown in the following bar charts, which compare fiscal year 2014 with ten years earlier.
SOURCES
29% 33%
18%17%
6%6%5% 3%3% 3%
31% 31%
8% 6%
0%
10%
20%
30%
40%
50%
60%
70%
80%
90%
100%
2004 2014
Lottery
Other
Corp. Income
Bank Franchise
Gross Receipts
Net Franchise
Personal Income
(1) Other sources include interest, public utility, cigarette, abandoned property, alcoholic beverage, and insurance
taxes.

-40-
USES
34% 33%
8% 6%
18%17%
4%4%
7%7%
4%4%
26% 29%
0%
10%
20%
30%
40%
50%
60%
70%
80%
90%
100%
2004 2014
Health & SocialServices
Children, Youth &Family
Corrections
Public Safety &Homeland Security
Other Expenditures
Higher Education
Public Education
(1) Other uses include administrative services, fire prevention, National Guard, natural resources and environmental control, other elective offices, legislative and executive branches, and agriculture.

-41-
CUMULATIVE CASH BALANCES The following graph reflects growth in the Budget Reserve Account and the changes in continuing and encumbered appropriations and the cumulative cash balances from fiscal year 2005 to fiscal year 2015E.
Budgetary General Fund Cumulative Cash Balances at June 30
(in millions)
$0
$100
$200
$300
$400
$500
$600
$700
$800
2005 2006 2007 2008 2009 2010 2011 2012 2013 2014 2015E
Budget Reserve Continuing & Encumbered Unencumbered Cash

-42-
FISCAL YEAR ENDED JUNE 30, 2013
The State ended fiscal year 2013 with a cumulative cash balance of $635.9 million. This balance represented 17.4% of the State’s expenditures for the year. The Budget Reserve Account remained fully funded for the fiscal year, totaling $198.9 million. An additional $276.5 million was set aside for continuing and encumbered appropriations resulting in an unencumbered cash balance on June 30, 2013 of $160.5. million. Revenue
Net budgetary General Fund revenue for fiscal year 2013 totaled $3,729.8 million, an 11.0% increase over fiscal year 2012.
Personal income taxes, after refunds were $1,139.8 million, a 9.4% increase over 2012.
Franchise and Limited Partnership/LLC taxes, after refunds, were $776.7 million, a 1.4% increase from fiscal year 2012.
Business entity fees were $89.8 million, a 6.3% increase over the previous fiscal year.
Corporate income taxes, after refunds, were $187.9 million, a 57.8% increase over fiscal year 2012.
Bank franchise taxes were $103.5 million, a 8.0% decrease from fiscal year 2012.
Business and occupational gross receipts taxes were $226.3 million, a 3.1% decrease from fiscal year 2012.
Lottery revenue was $235.3 million, a 12.5% decrease from fiscal year 2012.
Abandoned property revenue was $566.5 million, an 77.3% increase over fiscal year 2012.
Expenditures
Budgetary General Fund expenditures for fiscal year 2013 totaled $3,658.5 million, an increase of 1.8% over fiscal year 2012. The fiscal year 2013 budgetary General Fund operating budget totaled $3,586.8 million, a 2.2% increase over the fiscal year 2012 operating budget. Cash appropriations of $53.4 million included in the capital budget and grants-in-aid appropriations of $44.2 million brought total fiscal year 2013 appropriations to $3,684.4 million. The appropriation package was within the constitutionally-prescribed limit of 98% of estimated revenues.

-43-
Balances
The following table outlines revenue, expenditures and remaining cash balances for fiscal year 2013.
Budgetary General Fund Balances - Fiscal Year 2013 (in millions)
Revenue ........................................................................................................................ $3,729.8
Expenditures Budget ............................... $3,586.8 Grants ...................................... 44.2 Supplemental ............................ 53.4
Total appropriations ............................... $3,684.4 Continued and encumbered (prior years) ............. 301.1
Total spending authorizations ........................................ $3,985.5 Less: Continued and encumbered (present year) .............. (276.5) Less: Reversions ................................................................ (50.5)
Total expenditures ........................................................................ $ 3,658.5 Operating balance ................................................................................. 71.2 Prior year cash balance ......................................................................... 564.7
Cumulative cash balance .............................................................. $ 635.9
Less: Continued and encumbered (present year) ................................. (276.5) Less: Budget Reserve Account ............................................................ (198.9)
Unencumbered cash balance ................................................................................... $ 160.5(1) _____________________
(1) Totals may not add due to rounding.

-44-
FISCAL YEAR ENDED JUNE 30, 2014 The State ended fiscal year 2014 with a cumulative cash balance of $414.4 million. This balance represented 10.9% of the State’s total expenditures for the year. The Budget Reserve Account remained fully funded for the fiscal year, totaling $201.7 million. An additional $194.8 million was set aside for continuing and encumbered appropriations resulting in an unencumbered cash balance on June 30, 2014 of $18.0 million. Revenue
Net budgetary General Fund revenue for fiscal year 2014 totaled $3,572.7 million, a decrease of 4.2% from fiscal year 2013.
Personal income taxes, after refunds were $1,187.7 million, a 4.2% increase over fiscal year 2013.
Franchise and Limited Partnership/LLC taxes, after refunds, were $814.6 million, a 4.9% increase over fiscal year 2013.
Business entity fees were $96.0 million, a 6.9% increase over fiscal year 2013
Corporate income taxes, after refunds, were $102.0 million, a 45.7% decrease from fiscal 2013 primarily due to a significant increase in refund disbursements. Before refunds, the decrease in corporate income taxes was 14.7%.
Bank franchise taxes were $102.7 million, a 0.8% decrease from fiscal year 2013.
Business and occupational gross receipts taxes were $226.5 million, a 0.1% increase over fiscal year 2013.
Lottery revenue was $214.6 million, an 8.8% decrease from fiscal year 2013.
Abandoned property revenue was $474.9 million, a 16.2% decrease from fiscal year 2013.
Expenditures
Budgetary General Fund expenditures for fiscal year 2014 totaled $3,794.1 million, an increase of 3.7% over fiscal year 2013. The fiscal year 2014 budgetary General Fund operating budget totaled $3,718.2 million, a 3.7% increase over the fiscal year 2013 operating budget. Cash appropriations of $60.9 million included in the capital budget and grants-in-aid appropriations of $44.8 million brought total fiscal year 2014 appropriations to $3,823.8 million. The appropriation package was within the constitutionally-prescribed limit of 98% of estimated revenues.

-45-
Balances
The following table outlines revenue, expenditures and remaining cash balances for fiscal year 2014.
Budgetary General Fund Balances - Fiscal Year 2014 (in millions)
Revenue ........................................................................................................................ $3,572.7
Expenditures Budget ............................... $3,718.2 Grants ...................................... 44.8 Supplemental ............................ 60.9
Total appropriations ............................... $3,823.8 Continued and encumbered (prior years) ............. 276.5
Total spending authorizations ........................................ $4,100.2 Less: Continued and encumbered (present year) .............. (194.8) Less: Reversions .............................................................. (111.3)
Total expenditures ........................................................................ $ 3,794.1 Operating balance ................................................................................. (221.5) Prior year cash balance ......................................................................... 635.9
Cumulative cash balance .............................................................. $ 414.4
Less: Continued and encumbered (present year) ................................. (194.8) Less: Budget Reserve Account ............................................................ (201.7)
Unencumbered cash balance ................................................................................... $ 18.0(1) _____________________ (1) Totals may not add due to rounding.

-46-
FISCAL YEAR ENDING JUNE 30, 2015 Based upon the September 15, 2014 DEFAC revenue forecasts, net budgetary General Fund revenue for fiscal year 2015 is projected to total $3,944.8 million, a 10.4% increase over fiscal year 2014 revenue. Revenue
Personal income taxes, after refunds, are projected to total $1,226.3 million, a 3.2% increase over fiscal year 2014.
Franchise and Limited Partnership/LLC taxes, after refunds, are expected to be $881.8 million, an 8.2% increase over fiscal year 2014.
Business entity fees are projected to be $99.8 million, a 4.0% increase over the previous fiscal year.
Corporate income taxes, after refunds, are expected to be $217.4 million, a 113.1% increase over fiscal year 2014.
Bank franchise taxes are projected to be $102.1 million, a 0.6% decrease from fiscal year 2014.
Business and occupational gross receipts taxes are projected to be $231.9 million, a 2.4% increase over fiscal year 2014.
Lottery revenue is expected to be $206.2 million, a 3.9% decrease from fiscal year 2014.
Abandoned property revenue is projected to total $554.0 million, a 16.7% increase from fiscal year 2014. Effective in fiscal year 2014, any abandoned property revenue received over $514.0 million will be considered special funds and will be used for (1) a K-12 Construction Fund; (2) a Debt Reduction Fund; and (3) Other Post-Employment Benefits Fund as established by 29 Del. C. §5281.
Appropriations
The fiscal year 2015 budgetary General Fund operating budget totaled $3,809.5 million, an increase of 2.5% over the fiscal year 2014 operating budget. Cash appropriations in the capital budget of $23.8 million and grant-in-aid appropriations of $45.4 million bring total fiscal year 2014 appropriations to $3,878.7 million. This appropriation package is within the constitutionally-prescribed limit of 98% of revenues.
The fiscal year 2015 capital budget totals $421.0 million. Of that amount, $242.2 million is allocated for general obligation capital projects, $155.0 million is allocated for the capital program of the Department of Transportation funded through the Transportation Trust Fund and general fund cash of $23.8 million has been allocated for “pay as you go” projects.

-47-
Balances
The following table outlines estimated revenue, expenditures and remaining cash balances for fiscal year 2015.
Budgetary General Fund Balances - Fiscal Year 2015 (in millions)
Revenue ..................................................................................................................... $3,944.8(1)
Expenditures Budget ............................... $3,809.5 Grants ...................................... 45.4 Supplemental ............................ 23.8
Total appropriations ............................... $3,878.7 Continued and encumbered (prior years) ........... 194.8
Total spending authorizations ........................................ $4,073.5 Less: Continued and encumbered (present year) .............. (232.6) Less: Reversions .................................................................. (10.0)
Total expenditures ........................................................................ $ 3,830.9 Operating balance ................................................................................. 113.9 Prior year cash balance ......................................................................... 414.4
Cumulative cash balance .............................................................. $528.3 Less: Continued and encumbered (present year) ................................. (232.6) Less: Budget Reserve Account ............................................................ (212.5)
Unencumbered cash balance ................................................................................... $83.2 (2) _____________________ (1) Revenue estimates per DEFAC’s September 15, 2014 forecast. (2) Totals may not add due to rounding.

-48-
TOBACCO SETTLEMENT
A coalition of State Attorneys General negotiated an agreement to settle various states’ lawsuits against tobacco manufacturers, in order to recover state funds expended on health care for smokers, consumer fraud and other claims. The Master Settlement Agreement (the “Agreement”) entered into by the State and participating tobacco manufacturers in late 1998 has resulted in significant payments to the State. The size of payments to Delaware is subject to a number of possible offsets and adjustments outlined in the Agreement. Such offsets include, but are not limited to, the reduction in sales of products from participating manufacturers.
The State created a special fund called the “Delaware Health Fund” into which proceeds received as a result of the Agreement are deposited. The General Assembly and the Governor may authorize expenditure of these monies to expand access to health care and health insurance, make long-term investments in State-owned health care infrastructure, promote healthy lifestyles including tobacco, alcohol, and drug prevention, and promote preventive health care for Delawareans. The fund requires an annual appropriation by the General Assembly and is administered by the Secretary of Finance. As of June 30, 2014, approximately $413.4 million has been received by the State from participating manufacturers. At June 30, 2014, the balance in the Delaware Health Fund was $5.9 million, a portion of which was appropriated through the fiscal year 2015 budget process to various health related programs.
FINANCIAL STRUCTURE General The State budgets and controls its financial activities on the cash basis of accounting for its fiscal year (July 1 to June 30). In compliance with State law, the State records its financial transactions in either of two major categories, the budgetary General Fund or budgetary Special Funds. References to these two funds in this document include the terms “budgetary” or “budgetary basis” to differentiate them from the GAAP funds of the same name which encompass different funding categories. The budgetary General Fund provides for the cost of the State's general operations and is credited with all tax and other revenue of the State not dedicated to budgetary Special Funds. All disbursements from the budgetary General Fund must be authorized by appropriations of the General Assembly. Budgetary Special Funds are designated for specific purposes. The appropriate budgetary Special Fund is credited with the tax or other revenue allocated to such fund and is charged with the related disbursements. Specific uses of the budgetary Special Funds include State parks operations and fees charged by the Public Service Commission and The Division of Professional Regulation. Federal payments and unemployment compensation are examples of non-appropriated budgetary Special Funds. Some budgetary Special Funds, such as the Delaware State Housing Authority and the State Pension Office, contain both appropriated funds for operations and non-appropriated funds for specific programs, such as public housing and pension benefits. The Basic Financial Statements in APPENDIX B hereof have been prepared to conform to the standards of financial reporting set forth by the Governmental Accounting Standards Board (“GASB”) in its various statements and interpretations. GAAP reporting standards allow the accurate assessment of financial condition and enable the State to present its total fiscal operation in conformity with accounting principles generally accepted in the United States of America. In GAAP reporting, operations of the primary government and component units are recorded under three main fund types - Governmental, Proprietary and Fiduciary, as defined by GASB. The fund types and account groups are described in Note 1 of the accompanying GAAP Basic Financial Statements in APPENDIX B. A reconciliation of budgetary General and Special Funds to GAAP is found in the Required Supplementary Information Section of the financial statements in APPENDIX B.

-49-
Capital assets are defined by the State as assets which have a cost of $15,000 or more at the date of acquisition and have an expected useful life of one or more years. All land and buildings are capitalized regardless of cost. Purchased and constructed capital assets are valued at historical cost or estimated historical cost. Donated fixed assets are recorded at their fair market value at the date of donation. The State has elected to use the “modified approach” to account for certain infrastructure assets, as provided by GASB Statement No. 34. Under this process, the State does not record depreciation expense nor are amounts capitalized in connection with improvements to these assets, unless the improvements expand the capacity or efficiency of an asset. Roads and bridges maintained by the Department of Transportation are accounted for using the modified approach. Budget Process As noted earlier, all disbursements from the budgetary General Fund and certain budgetary Special Funds must be authorized by appropriation of the General Assembly. In the fall of the fiscal year, each State agency submits to the Budget Office under the Office of Management and Budget (“OMB”) a request for operating and capital funds for the ensuing fiscal year. Public hearings on the requests are subsequently conducted. The Governor's proposed operating and capital budgets for the budgetary General Fund and budgetary Special Funds, including the Transportation Trust Fund, are then drafted and presented by the Governor to the General Assembly in January. The General Assembly's Joint Finance and Bond Bill Committees hold hearings and mark up the Governor's proposed operating and capital budgets, respectively. As amended, the budgets are expected to be passed prior to July 1 and signed by the Governor shortly thereafter. State agencies currently participate in a uniform budgeting process whereby each agency submits with its budget request a department mission, key objectives, background and accomplishments, and activities and performance measures. This fully integrated budget submission provides much information to the public as well as to State decision-makers. Federal funds are not appropriated but are subject to the review and approval of OMB and the Delaware State Clearinghouse Committee for Federal Aid Coordination. The Committee is comprised of 10 members, including the Secretary of Finance, Director of OMB, Director of the Delaware Economic Development Office, the Controller General, and six legislators. Appropriation Limit
The State Constitution limits annual appropriations by majority vote of both houses of the General Assembly to 98% of estimated budgetary General Fund revenue, plus the unencumbered budgetary General Fund balance from the previous year. An appropriation exceeding this limit may be made in the event of a declared emergency, with the approval of a three-fifths vote of the members of each house of the General Assembly, but no appropriation may be made exceeding 100% of estimated budgetary General Fund revenue plus the unencumbered budgetary General Fund balance from the previous fiscal year. In June 2014, the General Assembly authorized appropriations of $3,878.7 million for fiscal year 2015, within the projected 98% appropriation limit.

-50-
Budget Reserve Account The Budget Reserve Account (commonly referred to as the “Rainy Day Fund”) is designed to provide a cushion against unanticipated revenue shortfalls. The State Constitution provides that the excess of any unencumbered budgetary General Funds at the end of a fiscal year must be placed in a reserve account (the “Budget Reserve Account”) within 45 days following the end of the fiscal year, provided that the amount of funds in the Budget Reserve Account does not exceed 5% of the estimated budgetary General Fund revenue used to determine the appropriation limit for that fiscal year. Transfers are made in August based on June revenue projections, with consideration given to year-end operating results of the previous fiscal year. Transfers of $212.5 million have been made which fully funded the Budget Reserve Account for fiscal year 2015. Money from the Budget Reserve Account may be appropriated only with the approval of a three-fifths vote of the members of each house of the General Assembly and only to fund an unanticipated budgetary General Fund deficit or to provide funds required as a result of the enactment of legislation reducing revenue. No funds have been withdrawn from the Budget Reserve Account since its inception in 1980. Tax Limitations The State Constitution was amended in May 1980 to limit tax and license fee increases or the imposition of any new taxes or fees. Any tax or license fee increase or the imposition of any new tax or license fee must be passed by a three-fifths vote of each house of the General Assembly, rather than by a simple majority vote, except for tax increases to meet debt service on outstanding obligations of the State for which insufficient revenue is available when such debt service is due. The amendment requires the State to appropriate, prior to each fiscal year of the State, sums sufficient to meet debt service in the following fiscal year, a practice the State has always followed. Internal Control Structure
The State has established and maintains an internal control structure designed to ensure that the assets of the State are protected from loss, theft, or misuse, and to ensure that adequate accounting data are compiled to allow for the preparation of financial statements in conformity with GAAP. The internal control structure is designed to provide reasonable, but not absolute, assurance that these objectives are met. The concept of reasonable assurance recognizes that the cost of a control should not exceed the benefits likely to be derived and that evaluation of costs and benefits requires estimates and judgments by State officials. Determination as to the adequacy of the internal control structure is made within the above framework. State officials believe the State’s internal control structure adequately safeguards assets and provides reasonable assurance of proper recording of financial transactions. In the beginning of fiscal year 2011, the State fully implemented and upgraded its financial systems to continue to safeguard its assets and properly record its financial transactions.
Disbursements from State funds are controlled by an encumbrance accounting system that is designed to provide information on the actual extent of the State’s obligations (as determined by purchase orders issued) and to guard against over-committing available funds. Disbursements are controlled through the encumbrance system in such a way that purchase orders issued for goods and services cause a reduction in available appropriations. As a result, the amount of budgetary General Fund cash disbursements plus unliquidated encumbrances cannot exceed the amount appropriated by the General Assembly for any budget line.
At fiscal year-end, cash is reserved to pay outstanding encumbrances (orders for goods and services not yet received or for which payment has not been made). Budgetary General Fund encumbrances are carried over as encumbered appropriations and paid out and recorded as disbursements in the succeeding fiscal year. All obligations created by purchase orders (encumbered amounts) are liquidated upon

-51-
satisfactory receipt of goods and services. Budgetary General Fund appropriations, which have not been disbursed, continued or encumbered at fiscal year-end, lapse. Such lapsed appropriations are referred to as reversions in the State’s financial reports.
The State restricts commitments for budgetary General Fund expenditures by State agencies. Commitments to incur expenditures in excess of an appropriation (to be funded from unused funds appropriated to other agencies) must be approved by the Director of the OMB and the Controller General.
Although the majority of the State’s financial transactions are processed through the accounting system, certain budgetary Special Funds have financial activity, such as investments, outside the system. For example, the Transportation Trust Fund, the Delaware State Housing Authority, the deferred compensation programs and Delaware State University all maintain certain financial activity outside the system. This activity is governed in adherence to legislative regulations as well as guidelines established by their respective boards. In addition, these entities are audited annually and produce published financial reports.
The Auditor of Accounts is required to make audits of all agencies collecting State revenue or expending State funds in excess of $500,000 each year, and, to the extent possible, to make annual audits of the financial transactions of all other State agencies. The Auditor of Accounts also reviews certain records of the Secretary of Finance and State Treasurer on a quarterly basis to reconcile the State’s bank accounts to such records. Tax Collection Procedures Most of the State's taxes are collected under a self-assessing system. Taxpayers prepare the tax forms and pay the amounts they determine are due. When the State determines that a payment is less than the amount due, assessments may be made which can include applicable penalties and interest as allowed by law. The State has continually instituted procedures to identify non-filers and increase compliance with its tax statutes. The procedures include comparing federal income tax records with State income tax records, comparing State records for various years, and cross-referencing the license tax files to licensee lists from the State's various regulatory boards. Through the Attorney General's Office, the State employs legal procedures to effect payment of past due balances. These procedures include filing actions in the Justice of the Peace, Common Pleas and Superior Courts on bad checks received. Procedures have been instituted for the garnishment of wages and bank accounts and the sale of personal property through the County Sheriffs. By statute, the State's accounts receivable may be removed from current active accounts only if the account is more than six years old and is determined to be uncollectible or if the potential recovery or administrative costs of collection would not warrant further collection efforts. Recently enacted legislation allows the Division of Revenue to write off the accounts of those who are deceased or bankrupt. Recently enacted legislation requires the Secretary of Finance to prepare, maintain and publish on the Division of Revenue’s Internet Website two separate lists of the top 100 business and personal taxpayers owing outstanding tax liabilities in excess of $1,000 in which a judgment has been filed and who are not currently in bankruptcy or have not entered into and complied with the terms of an installment plan.

-52-
Risk Management The State is exposed to various risks and losses related to employee health and accident, worker's compensation, environmental and a portion of property and casualty claims. It is the policy of the State to self-insure its exposures when cost effective and commercially insure on the exposures that are specialized. Cash Management Created by State law, the Cash Management Policy Board (the “Board”) establishes policies for the investment of all money belonging to the State or put on deposit with the State by its political subdivisions, except money in any State pension fund and money held for individuals under the State deferred compensation program. The investment of such money belonging to the State is executed by the State Treasurer in accordance with and pursuant to the Board’s investment policies. The Board is comprised of nine members, including the Secretary of Finance, the Secretary of State, the State Treasurer, the Controller General (all serving ex officio), and five members from the private sector appointed by the Governor and confirmed by the State Senate. Currently, there is one vacancy on the Board. The current members of the Board are:
John V. Flynn, Jr. (Chairman) . Managing Director, Healthcare Resource Solutions Thomas J. Cook Secretary of Finance Jeffrey W. Bullock Secretary of State Warren C. Engle Formerly Senior Vice President, PNC Bank, retired Michael L. Morton Controller General David F. Marvin Partner, Marvin & Palmer Associates, Inc. Chipman Flowers, Jr. State Treasurer Mike Karia Chief Executive Officer, MK Consulting I Inc.
The State has instituted a number of measures to augment its dividend and interest earnings. Among these are the implementation of a commercial bank lockbox for collection of corporate franchise taxes, bank franchise taxes and insurance premium taxes. In addition, the State is also receiving tax payments electronically for the following taxes on a voluntary basis: employer withholding taxes, corporate franchise taxes and bank franchise taxes. The State's motor fuel/special fuels tax is collected electronically on a mandatory basis.
BUDGETARY GENERAL FUND SUMMARIES Principal Receipts by Category All revenue derived by the State, unless otherwise provided by law, is credited to the budgetary General Fund. The principal receipts not credited to the budgetary General Fund are unemployment insurance taxes, transportation-related taxes for the Transportation Trust Fund, certain taxes on insurance companies and property taxes levied by local school districts. Such taxes are deposited in budgetary Special Funds of the State. The State does not levy ad valorem taxes on real or personal property and does not impose a general sales or use tax. The taxes summarized below produce most of the budgetary General Fund revenue.
Personal Income Tax: Effective January 1, 2014, Delaware’s rates on taxable income range from zero on the first $2,000 of net taxable income, to 6.60% on taxable income in excess of $60,000. Taxable income consists of federal adjusted gross income, with certain modifications, less itemized deductions (or a standard deduction in lieu thereof). After the application of the rates to taxable income, a

-53-
$110 non-refundable personal tax credit is subtracted for each taxpayer and dependent claimed, providing a direct dollar-for-dollar reduction in final tax liability.
Since 1992, non-resident taxes have been computed as if the taxpayer were a State resident, multiplied by the ratio of Delaware income to total income. Tax returns and payments are due April 30.
Employers maintaining an office or transacting business within the State and making payment of any wages or other remuneration subject to withholding under the United States Internal Revenue Code are required to withhold State income tax on such wages or remuneration at prescribed rates. Filing frequency is determined based on the amount of an employer’s withholdings between July 1 and June 30, immediately preceding the calendar year: under $3,600 file quarterly; from $3,600 to $20,000 file monthly; and over $20,000 file up to eight times per month.
Corporation Franchise Tax: An annual franchise tax is levied on business corporations organized under State laws, excepting banks and building and loan associations. The tax levy is based on either the corporation's total number of authorized shares of capital stock or on its gross assets. The basis yielding the lesser tax revenue is applied. Effective January 1, 2009, the maximum tax was increased from $165,000 to $180,000. Applying the authorized share basis, the tax is levied according to the following rate schedule:
• 5,000 shares or less (minimum tax): $175.00 • 5,001 – 10,000 shares: $250.00 • $75.00 for each additional 10,000 shares or portion thereof • Maximum annual tax is $180,000.00
Applying the gross assets basis, the tax is levied at a rate of $350 for each $1.0 million or fractional part thereof of the corporation's gross assets per authorized share. The maximum annual franchise tax is $180,000.00 and the minimum tax is $175.00. Tax payments for any corporation whose annual franchise taxes exceed $5,000.00 are required to be made quarterly. Other companies pay once each year, on March 1. Corporation Income Tax: This tax is levied at the rate of 8.7% on net taxable income of both foreign and domestic corporations derived from sources within the State. Investment and holding companies, insurance companies and domestic international sales corporations, among others, are exempt. Fifty percent of the estimated tax for the taxpayer's current tax year and the balance due from the prior year is payable on the first day of the fourth month of the taxpayer's tax year, 20% of such estimated tax is payable on the 15th day of the sixth month, 20% on the 15th day of the ninth month and 10% on the 15th day of the twelfth month. Corporations with taxable income of $200,000 or more in any of the last three years must pay 80% of their current year's estimated tax on a current basis. Business and Occupational Gross Receipts Tax: The State imposes license requirements and related taxes on most occupations and businesses. License fees and taxes consist of a basic annual fee of $75 (in some cases an additional $25 per establishment is levied) plus a tax on gross receipts. Effective for tax periods ending after December 31, 2013, tax rates include 0.6472% for contractors (with a monthly deduction from gross receipts of $100,000); 0.3983% for wholesalers (with a monthly deduction of $100,000); 0.1260% for manufacturers (with a monthly deduction of $1,250,000); 0.1991% for food processors (with a monthly deduction of $100,000); 0.0996% for commercial feed dealers and farm machinery retailers (with a monthly deduction of $100,000); 0.7468% for general retailers (with a monthly deduction of $100,000); 0.6472% for restaurants (with a monthly deduction of $100,000); and 0.3983% of aggregate gross receipts on most occupational licenses (with a monthly deduction of $100,000). A use tax on leases of tangible personal property is levied on the lessee at the rate of 1.9914% of lease rentals and on the lessor at the rate of 0.2987% of rental payments received. Lessors are allowed a quarterly deduction of $300,000. Automobile manufacturers pay a 0.0945% tax (with a monthly deduction of $1,250,000).

-54-
Public Utility Tax: Gross receipts from the sale of telephone, telegraph, gas, electricity, and cable television services are subject to tax. Receipts from services sold to residential users are excluded, except for receipts from residential cable television services. Generally, public utilities are subject to a tax rate of 4.25%. Several exemptions/reductions apply. Receipts from sales of electricity to manufacturers and agribusiness/food processors are taxed at 2.00%. Certain electrochemical processors and receipts from sales of electricity and gas to automobile manufacturers are exempt from the tax. Cable television and direct-to-home satellite services are taxed at 2.125%. Cigarette Tax: Effective August 1, 2009, the cigarette tax was increased from $1.15 to $1.60 per 20 cigarette pack. Moist snuff is taxed at a rate of 54 cents per ounce. Other tobacco products are taxed at 15% of the wholesale price. Inheritance and Estate Tax: Effective January 1, 1999, the inheritance tax was eliminated. Since the inheritance tax was eliminated, the State has continued to levy its estate tax. Delaware’s estate tax, sometimes referred to as a “pick up” tax, applies only to those estates required to pay the federal estate tax. Changes in federal law effectively phased-out Delaware’s estate tax in 2005. Effective July 1, 2009, however, the State chose to “decouple” from federal law effectively reinstating the tax essentially as it existed in 2001. Realty Transfer Tax: Generally, the State levies a realty transfer tax at a rate of 1.5% of the consideration paid for any real property transferred. (Local governments are permitted to levy an additional 1.5%.) A 1% tax is levied on the value of construction in excess of $10,000 where the underlying property was acquired by the owner less than 12 months prior to the commencement of construction. Alcoholic Beverage Tax: The State imposes an excise tax on the distribution of alcoholic beverages. Beer is taxed at the rate of $4.85 per barrel; wine at 97 cents per gallon; liquor containing 25% or less alcohol by volume at $2.50 per gallon; and liquor containing more than 25% at $3.75 per gallon. Insurance Tax: The State levies a tax of 1.70%, plus an additional 0.30% for the benefit of fire and police, on gross premiums, less dividends and returned premiums on cancelled policies, for most types of insurance. An annual privilege tax is levied on domestic insurers based upon annual gross receipts and subject to credits for payroll compensation for employee services performed in the State. Bank Franchise Tax: The State levies a tax on banks at 8.7% on the first $20 million of taxable income, 6.7% on such income between $20 and $25 million, 4.7% on such income between $25 million and $30 million, 2.7% on such income between $30 million and $650 million, and 1.7% on taxable income in excess of $650 million. Effective for tax years beginning after December 31, 2006, banks have the option of using an “Alternative Franchise Tax”. The Alternative Franchise Tax has two parts: 1. A traditional income tax employing three-factor apportionment with a double-weighted receipts
factor. The tax’s regressive rates range from 7.0% on taxable income not in excess of $50 million to 0.5% on taxable income in excess of $1.3 billion.
2. A “Location Benefits Tax” based on assets. The location benefit tax liability shall be $1.6
million, plus 0.012% of the value of the assets not in excess of $5 billion; 0.008% of the value of the assets in excess of $5 billion but not in excess of $20 billion; 0.004% of the value of the assets in excess of $20 billion but not in excess of $90 billion. The maximum Location Benefits Tax is $6.2 million.

-55-
Additional Sources of Revenue Lottery
Delaware’s lottery actually includes multiple gaming options, which consumers may access via various platforms.
• Traditional Lottery: The traditional lottery consists of daily drawings, lotto, instant tickets, Keno, and multi-state games such as Powerball and Megamillions. Traditional lottery products are sold via a State-operated network of linked lottery terminals located in approximately 600 retail locations throughout the State.
• Casino Operations: Casino operations consist of a video lottery, sportsbooks, table games and i-gaming.
o Video Lottery – The video lottery is a State-operated network of linked video lottery or slot machines restricted to three locations authorized by State law. In addition, Delaware participates in a multi-jurisdictional, progressive video lottery game (MegaHits) via a network operated under the auspices of the Multi-State Lottery Association (MUSL). This wide-area network currently consists of Delaware, Rhode Island, West Virginia and Ohio.
o Sportsbooks – The State, in conjunction with the State’s three casinos and approximately 70 retail establishments, operates a sports lottery, which consists of parlay-style betting on National Football League (“NFL”) games.
o Table Games – Delaware’s three casinos operate table games, such as blackjack, craps, roulette and poker. Table games were operational at the end of fiscal year 2010 and have enhanced the State’s position in an increasingly competitive gaming market, increased employment and added revenue to the State’s coffers.
o I-gaming – Beginning in November 2013, Delaware’s i-gaming was made available to in-state consumers. Among other offerings, consumers may access peer-to-peer poker, and virtual blackjack, video lottery and roulette via the internet sites of the State’s three casinos. In order to maximize i-gaming’s revenue potential, Delaware is exploring adding additional gaming offerings and multistate compacts for online poker.
DEFAC closely monitors an evolving regional gaming market and updates the State’s revenue forecasts as conditions have evolved. By law, the lottery undertakes to provide an aggregate of at least 30.0% of the net revenue generated from traditional lottery products to the budgetary General Fund. The State retains 43.5% of video lottery profits (net of certain equipment costs), 29.4% of the net proceeds from table games, whether wagered by traditional means or via the internet. The State retains 50% of the net proceeds from sports lottery. Abandoned Property Abandoned property represents any debt or obligation, including securities, which have gone unclaimed or undelivered for three or more years. Such unclaimed property is reported to the state of the lost owner’s last known address. If the owner’s address is unknown or is in a foreign country, the unclaimed property is reported to the state of incorporation of the holder of the unclaimed property. In addition, for those lost owners with a last known address that is in a state which does not have an applicable statute for the type of property being reported, the unclaimed property is reported to the state of incorporation of the holder.

-56-
Budgetary General Fund Disbursements by Category of Expense The following table summarizes the budgetary General Fund disbursements of the State for fiscal years ended June 30, 2010 through 2014. See “STATE FINANCIAL OPERATIONS – Expenditure Summary – Fiscal Year 2012–Fiscal Year 2015E” for a detailed explanation of the expenditure figures.
Budgetary General Fund Disbursements (in millions)
Fiscal2010
Fiscal2011
Fiscal 2012
Fiscal 2013
Fiscal 2014
Salaries .......................................... $1,154.7 $1,200.1 $1,277.4 $1,285.6 $1,306.8 Debt Service .................................. 174.3 169.5 144.3 144.8 158.0 Contractual Services ..................... 435.7 434.5 455.1 484.0 517.3 Fringe Benefits, except Pensions .. 330.9 365.4 379.5 379.0 396.1 Pensions ........................................ 196.7 222.2 252.9 271.9 285.8 Welfare and Assistance Grants ..... 428.6 466.2 637.3 637.1 661.8 Other Grants .................................. 276.6 327.3 364.1 372.8 379.6 Other ............................................. 79.0 85.5 81.8 83.3 88.7 Total Disbursements ..................... $3,076.5 $3,270.7 $3,592.4 $3,658.5 $3,794.1 Budgetary General Fund Disbursements by Purpose The State assumes substantial financial responsibility for a number of programs often funded by local units of government in other states, including public and higher education, social service programs and the correctional system. In addition, the State builds and maintains all roads and highways within the State except certain local streets within a municipality's corporate boundaries and certain private streets. See “INDEBTEDNESS OF AUTHORITIES, UNIVERSITY OF DELAWARE AND POLITICAL SUBDIVISIONS - Authorities - Delaware Transportation Authority” for additional information. The major State programs are described in more detail below. Public Education
Delaware is one of only four states in the country which has not undergone a constitutional challenge to its public education funding. The State finances its public school operations from a combination of State, federal and local funds. In fiscal year 2013, the State provided 58.6%, the federal government 10.5% and localities 30.9% of the cost for current operations and debt service. For fiscal year 2011, the U.S. Department of Education, National Center for Educational Statistics, Institute for Education Sciences reported that Delaware was exceeded by five other states and Puerto Rico in terms of the percentage of public school revenues financed by the State. Public education base salary scales are set by State law, but the base salary may be supplemented by local funds. The local supplements vary in each school district in the State, depending on each district’s contractual obligations with its employees and the district’s ability and willingness to tax its constituents. For the 2013-2014 school year, the average State-local funded classroom teacher’s salary was $60,286, of which $39,702 was paid from State funds and the balance paid from federal or local funds. The State share of public education costs is allocated to the school districts, subject to a number of formulae based primarily on enrollment. The State funds between 60% and 80% of school construction costs, based on an index of an individual district’s ability to generate local share funding. The State also funds fringe benefits for school personnel in approximate proportion to the budgetary General Fund contribution to salaries, with the exception of health insurance which is 100% State funded for the basic plan. School districts reimburse the State for fringe benefit costs for personnel hired and paid under federally-funded programs and for the proportion of salary paid from local funds.

-57-
Budgetary General Fund expenditures for public education in fiscal year 2014 totaled $1,217.8 million. Appropriations of $1,267.6 million have been made for fiscal year 2015.
The following table sets forth public school enrollment (elementary and secondary), in September of the years indicated.
Public School Enrollment(1)
(1) Excludes children of military personnel living on Dover Air Force Base who attend Base schools and whose education is federally-funded.
Higher Education
The State’s higher education system consists of eight institutions, which enrolled 59,237 students in the 2013-2014 academic school year based upon Fall 2013 student headcount (45,275 on a full-time equivalent (“FTE”) basis). The three State-supported institutions are Delaware Technical and Community College which enrolled 14,490 students (8,876 FTE); Delaware State University, a land grant college located in the City of Dover which enrolled approximately 4,336 students (4,087 FTE); and the University of Delaware, a land grant college located in the City of Newark, which enrolled 22,166 students (20,651 FTE). The five privately supported institutions of higher education in the State enrolled an additional 18,245 students in 2013-2014 (11,661 FTE).
Budgetary General Fund expenditures for higher education in fiscal year 2014 were $227.3 million. The State provides approximately 13.0% of the operating budget of the University of Delaware, 38.5% of the budget of Delaware Technical and Community College, and 31.8% of the budget of Delaware State University. Appropriations of $226.3 million have been made for fiscal year 2015, including $115.6 million for the University of Delaware (this includes $1.8 million in funding for Delaware Geological Survey), $76.1 million for Delaware Technical and Community College and $34.6 million for Delaware State University. Social Services
The principal social service programs administered by the State are: (1) Temporary Assistance for Needy Families (“TANF”); (2) General Assistance (“GA”) to low-income single individuals who do not qualify for Supplemental Security Income (“SSI”) or TANF payments; (3) service programs for qualified individuals including child care, employment & training services; (4) food benefits through the federal Supplemental Nutritional Assistance Program (“SNAP”); and (5) direct medical assistance to qualifying individuals (“Medicaid” & “CHIP”).
Since January 1974, the SSI Program has been administered and funded by the federal government. Beginning with fiscal 1975, the State elected to supplement federal SSI payments for individuals who received the State equivalent of SSI payments prior to January 1974.
Enrollment Change (%) 2004 ............................... 118,413 1.22005 ............................... 120,482 1.72006 ............................... 121,856 1.72007 ............................... 123,615 1.42008 ............................... 124,903 1.02009 ............................... 126,271 1.12010 ............................... 127,944 1.32011 ............................... 130,102 1.72012 ............................... 131,029 0.72013 ............................... 132,841 1.4

-58-
Delaware’s Medicaid program traditionally has been funded at the minimum Federal financial
participation (“FFP”) rate of 50%. Each state’s FFP is determined annually by a statutory formula designed to account for income variation across states. Delaware’s rate has varied from a high of 64.38% (due to a provision of ARRA) to a low of 50% (the lowest rate) during the past five years. The current FFP for Delaware (beginning October 1, 2014) is 53.63%. The FFP rate expected to become effective on October 1, 2015 is 53.93%.
Delaware’s TANF program is funded by a federal capped block grant and State budgetary General Funds. The State is required under federal law to maintain a prescribed level of historic State expenditures for benefits and services to individuals eligible for TANF. GA program grants are entirely funded by the State. This program has experienced consistent growth since 2003. As of October 2013, the payment standard for the GA program is $90 a month per single-person family.
The portion of the expenditures for the foregoing programs paid by the federal government is accounted for by the State through the non-appropriated budgetary Special Funds. The portion paid by the State is accounted for through the budgetary General Fund.
After a period of gradual decline, the TANF caseload increased 29% between 2009 and 2011. Since 2012, the TANF caseload is again gradually declining. The State provides health care, child care assistance and help finding work for participants in the State’s TANF program and provides health care and subsidized childcare to income eligible individuals or those who have left the welfare rolls and continue to be eligible for that coverage. In 2014, an average of 11,120 people per month received TANF cash assistance and 4,953 people per month received GA for 16,073 combined average monthly recipients.
Since fiscal year 2008, welfare caseloads and income maintenance expenditures increased, driven by a dramatic increase in applications for SNAP and medical assistance. While the TANF caseload declined slightly beginning in 2012, the GA caseload continues to increase as well as SNAP and Medicaid. The following table indicates the trends of selected State social services expenditures for fiscal year 2009 through fiscal year 2014.

-59-
Social Services Expenditures
(dollars in millions)
Fiscal2009
Fiscal2010
Fiscal2011
Fiscal2012
Fiscal 2013
Fiscal 2014
TANF
Number of Recipients/month .... 11,312 13,027 14,537 13,969 11,895 11,120 Total Expenditures/year ............ $16.7 $21.8 $22.4 $20.8 $19.6 $18.6 State Share ................................. $16.5 $16.3 $13.9 $19.9 $18.7 $15.1 GENERAL ASSISTANCE Number of Recipients/month .... 3,352 3,739 3,964 4,369 4,458 4,953 Total Expenditures/year ............ $4.7 $5.2 $4.4 $4.4 $4.8 $5.2 State Share ................................. $4.7 $5.2 $4.4 $4.4 $4.8 $5.2 SSI Number of State Subsidized Recipients/month ..................... 845 830 815 820 609 608 State Share ................................. $1.2 $1.1 $1.0 $0.9 $0.9 $0.9 FOSTER CARE (DSCYF) Number of Children/month ....... 740 640 627 661 638 562 Total Expenditures/year ............ $18.2 $16.5 $16.9 $17.3 $17.6 $17.8 State Share ................................. $15.9 $13.5 $13.6 $14.7 $14.9 $15.5 DAY CARE Number of Children/month ....... 13,496 13,668 14,459 14,609 14,765 14,063 Total Expenditures/year ............ $44.6 $38.5 $53.2 $61.4 $65.3 $63.3 State Share ................................. $10.5 $10.9 $10.9 $24.0 $31.4 $30.4 MEDICAID Number of Eligibles/month ....... 160,018 173,771 193,633 207,067 212,693 217,658 Total Expenditures/year ............ $1,201.6 $1,315.5 $1,424.0 $1,552.2 $1,618.4 $1,620.1 State Share ................................. $499.4 $505.3 $550.9 $700.6 $713.7 $750.1 COMMUNITY HEALTH State Expenditures/year ............. $41.0 $33.5 $33.8 $33.8 $34.8 $33.1

-60-
Children's Services
The Department of Services for Children, Youth and Their Families provides integrated service delivery for children and their families in its efforts to promote family stability through a child-centered, family-focused continuum of care. The Department served 21,591 clients in fiscal year 2014, some of these clients were shared by each of the three divisions. The Family Services division spent $46.4 million in fiscal year 2013, $46.4 million in fiscal year 2014 and has budgeted $51.0 million in fiscal year 2015. The Division of Youth Rehabilitative Services (“YRS”) handles delinquent youth in both pre- and post-adjudication through an array of alternative placements and State-owned secure facilities. The YRS division spent $37.3 million in fiscal year 2013, $39.6 million in fiscal year 2014, and has budgeted $42.1 million for fiscal year 2015. The Division of Prevention and Behavioral Health Services (“DPBHS”) provides mental health services for children and youth. The DPBHS spent $38.4 million in fiscal year 2013, $41.4 million in fiscal year 2014, and has budgeted $40.5 million for fiscal year 2015.
Corrections
The Department of Corrections (“DOC”) is the only government operated correction agency in the State. Delaware operates under a unified corrections system. Delaware has no regional, county or municipal correction or jail system and no separate probation system. Offenders immediately become the responsibility of the State, including: pre-trial and sentencing, misdemeanor and felony, jail and prison and all community based sanctions. Sentencing in the State has evolved with the passage of Sentencing Accountability (“SENTAC”) legislation whereby all offenders are sentenced to one of five levels ranging from Level 1 (administrative supervision) to Level V (incarceration). This structure allows the State flexibility to match offenders with the most appropriate sentence. Total budgetary General Fund expenditures for DOC in fiscal year 2014 were $273.5 million. The budget for fiscal year 2015 is $277.5 million. As of September 2014, the incarcerated population in the custody of the Department was approximately 5,961, of which about 3,927 are prisoners.
BUDGETARY SPECIAL FUNDS SUMMARIES
Each budgetary Special Fund is created by statute or administrative action for a specific purpose. The appropriate Fund is credited with the specific revenue or receipts allocated to such Fund. Disbursements from certain budgetary Special Funds require specific appropriation by the General Assembly. In general, money in budgetary Special Funds is not available for disbursement or encumbrance until funds are deposited therein with the result that disbursements plus outstanding encumbrances cannot exceed the available funds (except for federal funds and the Transportation Trust Fund). In the case of bond funds, total disbursements plus encumbrances cannot exceed authorizations. At fiscal year end, the available fund balance plus outstanding encumbrances are carried over into the succeeding fiscal year. Local School Property Taxes and Assessed Valuation These taxes are levied by local school districts upon the assessed value of real estate in the district, as determined for county taxation purposes, for the local share of school operating costs and debt service on capital improvements. All tax receipts of a district are credited to the appropriate budgetary Special Fund and operating expenses are disbursed from such Fund upon the presentation of warrants or drafts to the State Treasurer by the school board of the district. The State's share of operating and debt service costs are appropriated and disbursed from the budgetary General Fund.

-61-
The following table outlines the assessed and estimated full valuation of all taxable real property in the State as of July 1, 2014.
Real Property Valuations (in millions)
Assessed Estimated Full County Valuation(1) Valuation New Castle .......................... $ 18,818.1(2) $58,752.0 Kent ..................................... 3,661.6(3) 26,510.5 Sussex ................................. 3,007.8(4) 33,654.1 Total $25,487.5 $118,916.6
____________________ (1) Net of all legal exemptions.
(2) Based on 100% of 1983 appraised value, as of the date of the most recent assessment which occurred in 1985.
(3) Based on 60% of appraised value, as of the date of the most recent assessment which occurred in 1987. (4) Based on 50% of appraised value, as of the date of the most recent assessment which occurred in 1974. Source: Delaware Department of Education. Unemployment Compensation Money deposited in the Unemployment Compensation Fund consists of employers' contributions and has at certain times in the past included advances from the federal government necessary to meet the excess of unemployment compensation benefits paid over the employers' contributions. As of August 31, 2014, the Unemployment Compensation Fund reflected a cumulative advance of $10,679,876.75. Federal Grants, Benefits and Reimbursements All grants and reimbursements of money received from the federal government by the State are credited to budgetary Special Funds. The money is disbursed to the appropriate agency to be used for the purpose stated in the grant application without any further authority from the General Assembly. The Delaware State Clearinghouse Committee is the committee representing the legislative and executive branches of government. It is charged with reviewing all State agency applications for federal funds and no agency may expend federal funds without approval of this committee. The following chart indicates the distribution of federal funds expended by the State by Department in the fiscal years indicated below.

-62-
Ratio of Federal Funds Expended by Department
Fiscal Fiscal Fiscal Fiscal Fiscal Fiscal 2009 2010 2011 2012 2013 2014 Health & Social Services 61.0% 57.2% 60.1% 59.6% 63.4% 66.1% Transportation 13.9% 13.0% 10.9% 12.0% 12.1% 10.6% Public Education 10.3% 13.1% 13.2% 13.8% 11.9% 10.9% Housing Authority 3.2% 3.9% 1.0% 0.6% 0.1% 0.1% Labor 2.6% 2.3% 2.4% 2.5% 2.4% 2.1% Higher Education 2.5% 3.1% 4.3% 4.1% 3.6% 3.4% Natural Resources 2.3% 2.3% 3.0% 2.6% 2.2% 2.8% Other 4.2% 5.1% 5.1% 4.8% 4.3% 4.0%
Total 100.0% 100.0% 100.0% 100.0% 100.0% 100.0% Pension Fund Receipts State pension contributions are appropriated by the General Assembly in the annual budget to cover the liability on budgetary General Fund salaries and are disbursed each month from the budgetary General Fund. Each monthly disbursement is recorded as a receipt of the appropriate budgetary Special Fund and is disbursed from such budgetary Special Fund to meet pension benefits and operating costs. The balance is disbursed from the budgetary Special Fund and invested as part of the State pension plan. See “STATE PENSION PLAN” for additional information. Employee pension contributions are also recorded as budgetary Special Fund receipts and are disbursed together with the State's share of pension costs. Pension costs paid by the federal government for employees paid under federal programs are also recorded as budgetary Special Fund receipts and disbursements. Social Security Fund Receipts All Social Security contributions by State departments and agencies and political subdivisions are recorded as a receipt to the Social Security Fund and are remitted on a semi-monthly basis. Contributions are submitted to the U.S. Department of the Treasury semi-monthly, at which time a disbursement is recorded. Bond and Note Sales All proceeds received from the sale of bonds or bond anticipation notes are recorded as a receipt in a special account designated as the State Treasurer's Bond Account. The withdrawal of proceeds is recorded as a budgetary Special Fund disbursement. The principal and interest on the State's general obligation bonds are paid as a budgetary General Fund disbursement.
DEFERRED COMPENSATION PROGRAM All pension-eligible State employees may elect to participate in a deferred compensation plan. The plan is an eligible plan under Section 457(b) of the Internal Revenue Code (the “Code”).
In accordance with the Code, the annual limit on a participant's pre-tax contributions remained at $17,500 for calendar year 2014. Additional catch-up contributions are permitted for participants age 50 and older, who may contribute an additional $5,500 in calendar year 2014. An alternative to the age 50 catch-up

-63-
provision is available for certain participants within three years of retirement, which serves to double the annual contribution limit to $35,000.
Employees make self-directed investment elections from a broad menu of investment options made
available through the plan vendor, which range from ultra conservative to very aggressive. The total market value of plan assets as of September 1, 2014 was $565.8 million (unaudited). The State also provides a $10 per-pay employer match to contributions by 457(b) deferred compensation plan participants, which began on January 1, 2001. The match plan is approved under Section 401(a) of the Code. However, the match plan was suspended by the General Assembly for fiscal years 2009 through 2014, and remained suspended for fiscal year 2015. Certain State employees working in the Department of Education, or for any school district or state-funded college or university, are eligible to participate in the State of Delaware 403(b) retirement plan, which is a tax-sheltered annuity (the “TSA Plan”). The TSA Plan is a qualified plan under Section 403(b) of the Code. The TSA Plan accepts both before tax and after tax Roth contributions. In accordance with the Code, the annual limit on a participant’s pre-tax contributions remained at $17,500 for calendar year 2014. Additional catch-up contributions are permitted for participants age 50 and older, who may contribute an additional $5,500 in calendar year 2014. The 403(b) limits apply only to TSA Plan contributions; pension-eligible 403(b) participants are also eligible to participate in the 457(b) Plan. No alternative catch-up provision applies to the TSA Plan. No employer match program is established for the TSA Plan. Employees make self-directed investment elections from a broad menu of investment options, including annuities and fund investments ranging from ultra conservative to very aggressive, made available through 13 plan vendors. The total market value of plan assets as of September 1, 2014 was $273.9 million (unaudited).
STATE PENSION PLAN
The State of Delaware Employees’ Pension Plan (the “State Employees’ Plan”) is a cost-sharing single employer defined benefit plan that covers State employees and all local school district and other affiliated employees who qualify as full-time and regular part-time employees. As of June 30, 2013, participation in the State Employees’ Plan, as well as the following state funded plans (collectively the “Plans”) are as follows:
The Plans and the other plans managed by the State’s Board of Pension Trustees (the “Pension
Board”), but not funded by the State, are referred to herein as the “Fund”.
Plan
Retirees beneficiaries
currently receiving benefits
Terminated Employees entitled to benefits but not receiving them yet
Active Participants
Total Membership
State Employees’ Plan 23,579 3,094 35,571 62,244 New State Police Plan 173 11 689 873 Judiciary Plan 45 -- 56 101 Closed State Police Plan 528 -- -- 528 Special Plan 9 -- -- 9
Total Membership: 24,334 3,105 36,316 63,755

-64-
The Pension Board is composed of five members from the private sector appointed by the Governor and confirmed by the Senate, and the Secretary of Finance and the Director of OMB serving as ex-officio members. The current members of the Pension Board are: Suzanne B. Grant, Chair ......... Former Senior Vice President, Salomon Smith Barney, Consulting Group Arturo F. Agra ......................... Vice President of Strategic Planning, Pepco Holdings Inc. Thomas S. Shaw ...................... Former Executive Vice President and Chief Operating Officer, PHINancy J. Shevock .................... Former Director, Delaware Transit Corp.Helen R. Foster, J.D. ............... President, CTW Consulting AssociatesThomas J. Cook ...................... Secretary of FinanceAnn S. Visalli .......................... Director, Office of Management & Budget
Legislative authority for the Fund is contained in 29 Del. Code §5541 which establishes a State Employees’ Retirement Fund, mandates that state appropriations and other employer contributions, and employee contributions be deposited and benefits paid. The statute dictates that the assets of the Fund are to be held in trust and not be used for or diverted to any purpose other than for the exclusive benefit of the employees and their beneficiaries. Section 5541 allows the accumulated assets of the Fund to be commingled with the assets of local and other government entities.
The custodian of the Fund’s assets is Northern Trust Company, Chicago, Illinois. The Fund’s assets
are managed by professional investment management firms. The total return on the fund in fiscal year 2013 was 11.1% on a market value basis compared to 20.6% for the Standard & Poor’s 500. However, due to the Fund’s asset-smoothing technique which recognizes only a portion of the gains and losses, the return on the actuarial asset value was 7.1%. Below is a table depicting one-year and five-year returns from fiscal year 1993 through fiscal year 2014, inclusive.
Fiscal One Year Five Year Year RETURN RETURN 1993 16.3% 11.2% 1994 3.3% 9.3% 1995 19.1% 11.1% 1996 20.0% 14.1% 1997 17.8% 15.1% 1998 18.0% 15.4% 1999 11.1% 17.1% 2000 16.8% 16.7% 2001 -5.1% 11.3% 2002 -6.3% 6.4% 2003 3.1% 3.5% 2004 15.9% 4.4% 2005 9.6% 3.1% 2006 12.4% 6.9% 2007 15.9% 11.5% 2008 -1.3% 10.5% 2009 -15.8% 3.6% 2010 14.1% 4.3% 2011 24.3% 6.6% 2012 2.0% 3.9% 2013 11.1% 6.4% 2014 17.5% 13.6%

-65-
The Fund provides retirement, disability and survivor benefits as detailed in Note 15 of the Basic Financial Statements attached as Appendix B. In May 2011, the Delaware Code was amended in order to reduce benefits for and increase the contribution of all State employees hired on and after January 1, 2012 (“Post 2011 Employees”). In general, recipients, other than Post 2011 Employees, in the State Employees’ Plan are entitled to receive a service pension at various times during their years of credited service, i.e.: (1) age 62 with 5 years of credit service; (2) age 60 with 15 years of credit service; (3) a reduced service pension at age 55 with 15 years of credited service; (4) a reduced service pension at any age with 25 years of credited service; or (5) at any age with 30 years of credited service. Employees hired before January 1, 2012 are “fully vested” in benefits after 5 years of service, and Post 2011 Employees are “fully vested” in benefits after 10 years of service. Post 2011 Employees are entitled to receive a service pension if: (1) the employee has 10 years of credited service, and has attained age 65; (2) the employee has 20 years of credited service, and has attained age 60; or (3) the employee has 30 years of credited service. A Post 2011 Employee can receive a reduced service pension if: (1) the employee has 15 years of credited service, and has attained age 55, or (2) the employee has 25 years credited service regardless of age. All Plan participants also participate in the Old Age Disability Security Income component of the Federal Social Security System.
For members of the State Employees Plan, benefit payments are computed using the average monthly compensation for the 36 months of highest monthly compensation. Such compensation excludes overtime in the case of Post 2011 Employees. The average is then multiplied by 1.85% for each year of credited service after January 1, 1997 to determine the actual monthly benefit. Retirees with credited service before December 31, 1996 get a multiplier of 2.00 for service prior to January 1, 1997.
Post 2011 Employees contribute 5% of annual compensation above $6,000. All other State employees contribute 3% of annual compensation above $6,000.
Except for the Closed State Police Plan, the State’s annual contribution to the Plans are equal to the sum of the normal cost of each year and the annual payment required to amortize the unfunded accrued liability using an amortization period of 20 years. The State’s contribution must also include an amount to fund post retirement pension increases in accordance with a formula contained in the Delaware Code. The Closed State Police Plan is funded on a pay-as you-go basis; all other Plans are funded on an actuarially sound basis, as determined by the Pension Board, on the basis of actuarial analyses undertaken by Cheiron, Inc. (“Cheiron”) annually. The most recent valuation, as of June 30, 2013, determined the State Employees’ Plan to have a funded ratio of 91.1% based on the actuarial value of the assets and 89.6% based on the market value of the assets. Each year the Pension Board certifies the required State contribution rate as a percentage of covered payroll, based on the results of the actuarial valuations of the Plans. The State Employees’ Plan has an unfunded accrued liability of $737.5 million as of June 30, 2013. A Schedule of Funding Progress for the State Employees’ Plans is shown below. See Schedule 1 – Schedule of Funding Progress in the Financial Section of the Delaware Public Employees’ Retirement System Comprehensive Annual Financial Report for fiscal year 2013 for the funding progress of the New State Police Plan, the Judiciary Plan, the Closed State Police Plan and the Special Plan.

-66-
HISTORICAL FUNDING PROGRESS
ACTUARIAL VALUE STATE EMPLOYEES’ PLAN
(in thousands)
Fiscal Year
Ended June 30
(1) Actuarial Value of Assets
(2) Actuarial Accrued Liability (AAL)
(3) Unfunded
AAL (UAAL) (2) – (1)
(4) Funded Ratios (1)/(2)
(5) Annualized
Covered Payroll
(6) UAAL as a %
of Covered Payroll (3)/(5)
2013 $ 7,519,770 $ 8,257,270 $ 737,500 91.1% $ 1,877,105 39.3%2012 7,270,430 7,949,855 679,425 91.5% 1,881,097 36.1%2011 7,091,821 7,547,951 456,130 94.0% 1,783,603 25.6%2010 6,808,957 7,096,326 287,369 96.0% 1,740,622 16.5%2009 6,744,050 6,827,006 82,956 98.8% 1,753,129 4.7%2008 6.751,949 6,549,856 (202,093) 103.1% 1,711,473 (11.8%)2007 6,437,916 6,208,025 (229,891) 103.7% 1,654,609 (13.9%)2006 5,998,746 5,901,072 (97,674) 101.7% 1,589,185 (6.1%)2005 5,660,057 5,572,719 (87,338) 101.6% 1,471,931 (5.9%)2004 5,387,560 5,229,927 (157,633) 103.0% 1,399,279 (11.3%)
Summary of Pension Contribution Funding Policy
Payment of each annual contribution is subject to appropriation by the General Assembly. In each
year since fiscal 1971, the General Assembly has appropriated the contribution amounts recommended by the Pension Board. The State has appropriated the amount based on the percentage of covered payroll which is determined by the Pension Board based on the actuarial report. The following table sets forth the annual required contribution of the State Employees’ Plan as well as the percentage contributed.
Fiscal Year Ended
Annual Required
Contribution (000)(1)
Percentage Contributed
General Fund
Expenditures (000,000)
% of Total Gen. Fund
Expenditures
% of
Covered Payroll
2013 $160,651 100.0% $3,658.5 4.4% 8.6% 2012 147,464 100.0% 3,592.4 4.1% 7.8%2011 128,019 100.0% 3,270.8 3.6% 7.2%2010 101,457 100.0% 3,076.5 3.3% 5.8%2009 96,576 100.0% 3,295.5 2.9% 5.5%2008 101,660 100.0% 3,421.6 3.0% 6.1%2007 97,000 100.0% 3,389.5 2.9% 5.9%
(1) Does not include contributions to the Post-Retirement Increase Fund
The following table sets forth the actual cash inflows, including investment earnings, and cash outflows for the State Employees’ Plan for the last five years. For detailed cash flows for the New State Police Plan, the Judiciary Plan, the Closed State Police Plan and the Special Plan, see the Schedule of Additions by Source and the Schedule of Deductions by Type in the Statistical Section of the Delaware Public Employees’ Retirement System Comprehensive Annual Financial Report for fiscal year 2013.

-67-
State Employees’ Pension Plan (in millions)
Fiscal
2009Fiscal2010
Fiscal2011
Fiscal 2012
Fiscal 2013
Income Employee Contributions ............... $ 45.9 $ 44.9 $ 46.4 $ 47.9 $ 50.6 State Contributions(1) (budgetary General Fund and budgetary Special Funds) ...........
135.4
127.6
141.6
155.6
186.5 Investment Income ........................ (1,048.3) 756.6 1,391.2 112.7 736.1 Total Income ................................. $(867.0) $929.1 $1,579.2 $316.2 $973.2
Disbursements
Pension Benefits Paid ................... $369.2 $399.2 $418.5 $443.9 $478.0 Refunds ......................................... 3.1 3.1 3.0 4.0 3.6 Other Disbursements ..................... 11.1 10.2 9.9 10.4 10.9 Total Disbursements ..................... $383.4 $412.5 $431.4 $458.3 $492.5 Excess of Income over Disbursements ............................
($1,250.4)
$516.6
$1,147.8
($142.1)
$480.7
Total Plan Assets ........................... $5,392.7 $5,909.1 $7,056.9 $6,914.8 $7,395.5 ________________ (1) Includes contributions to a Post-Retirement Increase Fund. General Funding Practices Since 1993, the Pension Board has commissioned actuarial studies annually. Cheiron of McLean, Virginia (“Cheiron”) has served as the independent actuary since 2006 and uses the assumptions described in the following table for the State Employees Plan: Actuarial Cost Method Entry Age NormalAmortization method Level Percent Closed for Plan Bases and Open for
Aggregate Gain/Loss Amortization period 20 years Asset Valuation Method 5-Year Smoothed MarketActuarial Assumption: Investment Rate of Return Salary Increases attributable to inflation Salary Increases attributable to merit and productivity
7.5%* 3.25%† 3.8% to 11.8%
________________________ *Prior to fiscal year 2011, the assumed Investment Rate of Return was 8% and will be decreased to 7.2% in fiscal 2015. † For fiscal 2015, the assumed inflation rate was reduced to 3.0%. The actuarial assumptions used have been recommended by Cheiron and adopted by the Pension Board based on the Fund’s recent experience.

-68-
For the State Employees’ Plan, the information in the following table provides a comparison of the actuarial value of assets to the market values, the ratio of the AVA to market value, and the funded ratio based on AVA compared to funded ratio based on the market value of assets.
Fiscal Year Ended
June 30
Actuarial Value of Assets (000)
Market Value of Assets
(000)% of AVA to market value
Funded Ratio (actuarial
value) Funded Ratio (market value)
2013 $ 7,519,770 $ 7,395,577 98.3% 91.1% 89.6% 2012 7,270,430 6,914,826 95.1% 91.5% 87.0%2011 7,091,821 7,056,916 99.5% 94.0% 93.5%2010 6,808,957 5,909,160 86.8% 96.0% 83.3%2009 6,744,050 5,392,660 80.0% 98.8% 79.0%2008 6,751,949 6,643,042 98.4% 103.1% 101.4%2007 6,437,916 6,920,607 107.5% 103.7% 111.5%
Pension Plan Investment Policy and Practices
The Investment Committee of the Pension Board seeks the following investment objectives established by the Pension Board:
• Achieve a real return of 3% per year over long periods, • Manage portfolio risk that limits downside price fluctuation, • Maximize total investment returns, consistent with Pension Board objectives.
While not governed by a mandated target asset allocation, investment decisions are shaped by the
Pension Board’s internal investment guidelines which provide that a minimum of 20% of the total assets of the Fund be invested in fixed income investments, such as bonds, cash equivalents and certain real estate investments. This guideline is monitored with the assistance of an independent investment advisor. The committee strives for appropriate investment diversification by allocating funds across a variety of asset classes and by selecting managers whose demonstrated performance reflects different management styles and asset class expertise. The performance of all investment managers is closely monitored, not only in relation to specific absolute objectives, but also in relation to other fund managers following the same or similar investment objectives. Litigation, Investigations and Labor Relations
There has been no material litigation brought or any investigation initiated in connection with the pension plan or members of its governing body. Audits of the pension plan’s financial statements have been conducted annually by an independent auditor and that auditor has expressed an unqualified opinion. Transfers of Investment Earnings
Earnings generated over and above the investment rate of return are retained as part of the plan assets. Pension Plan Reserves
The State passed legislation which established a mechanism for funding ad hoc post-retirement increases granted by the General Assembly to members retired under the State Employees’ Plan, the New

-69-
State Police Plan and the Judiciary Plan beginning in fiscal 1994. The mechanism allows the State to appropriate actuarially determined employer contributions to a separate Post-Retirement Increase Fund (“PRI”) managed by the Pension Board. The actuary uses the current actuarial assumptions, methods and population data to calculate the estimated additional liability resulting from the potential benefit increases. When the Legislature grants an ad hoc post-retirement adjustment, funds are transferred from this PRI fund on a monthly basis based on a five-year actuarial funding schedule to the appropriate pension plan from which the additional benefits are disbursed. For the fiscal year ended June 30, 2013, $26.6 million was transferred to the appropriate plan.
During the last five years there have been three post-retirement increases granted by the General Assembly in fiscal years 2012, 2013 and 2015. As of June 30, 2014, these post-retirement increases have outstanding liabilities totaling $132.5 million, which will be funded by the State and transferred to the appropriate plans over the remaining amortization periods.
The Pension Board adopts actuarially determined funding for the Post-Retirement Increase Fund. Funding for fiscal year 2013 was 1.49% of covered payroll. Funding for fiscal year 2014 was 1.51%. Funding for fiscal year 2015 is 1.66%. Pension Obligation Bonds
No pension obligation bonds have been issued and the State does not anticipate issuing any pension obligation bonds in the future. Other Relevant Reports
The Delaware Public Employees’ Retirement System, a component unit of the State, annually issues a comprehensive annual financial report. This report, along with the Cheiron’s actuarial valuation, can be found on the state’s website at http://www.delawarepensions.com/financials.shtml. The information included in this section relies on information produced by the State together with Cheiron, its independent actuary. Actuarial assessments are “forward-looking” and reflect the judgment of the fiduciaries of the Plans. Such assessments are based upon a variety of assumptions, one or more of which may provide to be inaccurate or be changed in the future, and will change with the future experience of the Plans.
OTHER POST EMPLOYMENT BENEFITS
The State provides post-employment health care to its employees and, in fiscal year 2008, began accounting for these benefits according to GASB Statement No. 45, Accounting and Financial Reporting by Employers for Postemployment Benefits Other Than Pensions (“GASB 45”). The State’s actuarially accrued liability, based on a study conducted by Cheiron using actual data as of July 1, 2013, has been determined to be about $5.99 billion using a discount rate of 4.25%.
The State began pre-funding the obligation in 2002 and 2003 with lump sum payments and contributions based on a percentage of payroll. In fiscal year 2007, the amount contributed as a percentage of payroll was approximately $5 million and increased to approximately $10 million in fiscal years 2008 and 2009. In both fiscal years 2010 and 2011, the State contributed $10 million from abandoned property revenue and, in 2011, an additional $9.7 million was contributed by the State primarily from Medicare Part D subsidies received. Fiscal year 2012 and 2013 contributions, based on a 0.9% of payroll, were about $16.8 million each and the fiscal 2013 Medicare Part D subsidy was $11.2 million. In addition, $3.6 million was received from fiscal 2013 Abandoned Property revenues. Fiscal 2014 payroll contributions totaled $16 million plus an additional $6.2 million in Medicare Part D subsidies brought total fiscal 2014 contributions to $22.2 million. Payroll contributions for fiscal 2015 are expected to be about $17 million.

-70-
The State has established an irrevocable trust and, at December 31, 2013, has accumulated $222 million in assets resulting in a funding ratio of 3.7%. At a 4.25% discount rate, the State’s fiscal year 2014 annual required contribution (“ARC”) is $406.7 million, which is expected to be only partially met with cash contributions and paid benefits. Paid benefits are estimated to be in the amount of $177.6 million.
In 2011, the Governor signed legislation, which made significant modifications to employee’s health care insurance and pension plan programs. The legislation establishes a fixed cost share in the State’s health insurance programs for both active employees and retirees and increases the time to vest for retiree health care benefits. Further reducing this liability was the State’s participation, effective January 1, 2013, in an Employee Group Waiver Plan, or EGWP, which shifts the cost of retiree pharmacy benefits to the Centers for Medicare and Medicaid Services.
EMPLOYEE RELATIONS The State currently has 31,789.6 full-time equivalent (“FTE”) positions budgeted for fiscal year 2015, an increase of 247.2 FTEs from fiscal year 2014. This includes 14,205.7 FTEs in the public schools, 1,130.0 FTEs in institutions of higher learning (excluding employees of the University of Delaware, which is not considered part of the State’s financing reporting entity) and 16,444.9 FTE positions in all other departments. Since July 1966, virtually all State employees have had the right to organize for the purpose of collective bargaining. Classification of bargaining units is determined by the Public Employee Relations Board (“PERB”). Collective bargaining is conducted by OMB on behalf of departments and agencies. With respect to non-merit system employees, such bargaining may include all terms and conditions of employment, including wages, hours and benefits. With respect to the merit system employees, individual bargaining units may not bargain wages, most benefits, classification plans or hiring practices. Effective on August 2, 2007, Senate Bill 36 permits merit system employees to negotiate compensation, defined as payment of salaries and cash allowances, through the collective bargaining process. Position classification, health care and other benefit programs, workers compensation, disability programs and pension programs are not negotiable. These agreements are subject to approval by the Governor and binding to the extent sufficient appropriations are made by the General Assembly. At present, approximately 8,000 of the State's merit system employees are organized and covered by collective bargaining agreements. Employees of institutions of higher education, certified professional employees of the State public school system (teachers) and certain public school support personnel have the right to organize for the purpose of collective bargaining. Bargaining units representing such employees negotiate with their respective school districts regarding all matters relating to salaries, employee benefits and certain working conditions. Virtually all of these school employees are covered by collective bargaining agreements. State employees in Delaware do not have the legal right to strike. Few work stoppages have occurred. Currently only two-thirds of employees eligible for union representation are covered by collective bargaining agreements. All payment contracts reached under such agreements are subject to appropriation by the General Assembly, except for the locally funded portion of school district employees' salaries and benefits. In 1982, a State law was enacted establishing the PERB to oversee the conduct of labor negotiations between public school teachers and their boards of education. There are provisions for mediation and binding arbitration of collective bargaining disputes. Strikes, slow-downs and walkouts are prohibited; but, if they occur, school boards are required to seek injunctive relief. In 1986, legislation was enacted which extended the PERB's jurisdiction to police officers and firefighters. The PERB's jurisdiction was further expanded in 1994 to include all public employees in the State. In the same year, a State law was enacted

-71-
establishing the Merit Employee Relations Board to address grievances and related issues of merit system employees.
GOVERNANCE The chief executive officer of the State is the Governor, who is elected for a term of four years. The State Constitution limits any Governor to two terms, whether or not consecutive. The Governor appoints all members of the State judiciary, the cabinet, and the boards and councils. The Governor reports to the General Assembly at the start of each annual session in January on the “State of the State,” recommends changes in legislation, and follows this report with an annual budget message and financial accounting of the State. In addition to the Executive Office of the Governor (which includes the Offices of Management and Budget, Economic Development, and Technology and Information), there are thirteen cabinet departments, as reflected in the table which follows. They include the following: the Department of State, which administers the Division of Corporations and the Division of Cultural and Historical Affairs; the Department of Finance, which performs financing, accounting, bond finance, revenue collection, fiscal policy functions and administers the State lottery; the Department of Health and Social Services; the Department of Services for Children, Youth and Their Families; the Department of Natural Resources and Environmental Control; the Department of Labor; the Department of Transportation, which oversees the Division of Motor Vehicles; the Department of Safety and Homeland Security, which oversees the state police; the Department of Correction; the Department of Agriculture; the Department of Education; Delaware State Housing Authority; and the Delaware National Guard. Delaware is unusual in that the State government (as opposed to county or municipal governments) funds and administers substantially all correctional, public health, welfare, and transportation services for its residents. Other elected officers include the Lieutenant Governor who presides over the Senate and the Board of Pardons; the State Treasurer, who is one of four Issuing Officers, signs all state checks and oversees the management of the State's bank accounts; the Auditor of Accounts who audits all State agencies' financial transactions; the Insurance Commissioner; and the Attorney General who is the chief legal officer of the State. All of the elected officers serve terms of four years. The State's General Assembly is bicameral and consists of a 21-member Senate and a 41-member House of Representatives. The entire House stands for re-election every two years, while Senators are elected to four year staggered terms. Regular sessions of the General Assembly convene in January and adjourn by June 30th. Between regular sessions, the Governor or the presiding officers of either house may call special sessions. Proposed legislation is usually assigned to a standing committee for review. It may then receive consideration on the floor of both houses. The judicial branch of the government includes a Supreme Court, which acts primarily as an appeals court, and the Court of Chancery, an equity court which has jurisdiction over corporate matters, trusts, estates, and other matters involving equitable jurisdiction. The Superior Court has jurisdiction over criminal and civil cases, except equity cases. The Family Court administers justice in cases involving domestic relations or dependent juveniles. The Court of Common Pleas is a court of limited jurisdiction over civil and criminal matters which the Superior Court would otherwise handle. The Justice of the Peace Courts handle criminal matters and civil cases where the amount in controversy is less than $5,000. The following is a list of certain elected officials, cabinet positions and other appointed officials.

-72-
Statewide Elected Officials Governor ................................................................................. Jack A. Markell Lieutenant Governor .............................................................. Matthew Denn Attorney General .................................................................... Joseph R. Biden III State Treasurer ........................................................................ Chipman Flowers, Jr. State Auditor ........................................................................... R. Thomas Wagner, Jr. Insurance Commissioner ....................................................... Karen Weldin Stewart Cabinet Positions and Other Appointed Officials Agriculture .............................................................................. Edwin Kee Correction ............................................................................... Robert Coupe Delaware Economic Development Office ............................ Alan Levin Education ................................................................................ Mark T. Murphy Finance .................................................................................... Thomas J. Cook Health and Social Services .................................................... Rita Landgraf Housing ................................................................................... Anas Ben-Addi Labor ....................................................................................... John McMahon Management and Budget ....................................................... Ann Visalli National Guard ....................................................................... Francis D. Vavala Natural Resources and Environmental Control .................... Collin O’Mara Safety and Homeland Security .............................................. Lewis Schiliro Services for Children, Youth and Their Families ................. Jennifer Ranji State ........................................................................................ Jeffrey W. Bullock Technology and Information ................................................. James Collins Transportation ........................................................................ Shailen Bhatt
LITIGATION
The State recognized $1.8 million in governmental activities as probable litigation expenses as of June 30, 2014. Additionally, the State is a defendant in various suits involving contract/construction claims, tax refunds claims, allegations of wrongful discharge and/or other employment-related claims, use of excessive force, civil rights violations, and automobile accident claims. Although the State believes it has valid defenses to these actions, the State has identified a potential aggregate exposure which could exceed $6.3 million, as of October 1, 2014.
THE BOOK-ENTRY ONLY SYSTEM
The Depository Trust Company (“DTC”), New York, NY, will act as securities depository for the Bonds. The Bonds will be issued as fully-registered securities registered in the name of Cede & Co. (DTC’s partnership nominee) or such other name as may be requested by an authorized representative of DTC. One fully-registered Bond certificate will be issued for each maturity and interest rate of the Bonds, each in the aggregate principal amount of such maturity and interest rate, and will be deposited with DTC. DTC, the world’s largest securities depository, is a limited-purpose trust company organized under the New York Banking Law, a “banking organization” within the meaning of the New York Banking Law, a member of the Federal Reserve System, a “clearing corporation” within the meaning of the New York Uniform Commercial Code, and a “clearing agency” registered pursuant to the provisions of Section 17A of the Securities Exchange Act of 1934. DTC holds and provides asset servicing for over 3.5 million issues of U.S. and non-U.S. equity issues, corporate and municipal debt issues, and money market instruments from

-73-
over 100 countries that DTC’s participants (“Direct Participants”) deposit with DTC. DTC also facilitates the post-trade settlement among Direct Participants of sales and other securities transactions in deposited securities, through electronic computerized book-entry transfers and pledges between Direct Participants’ accounts. This eliminates the need for physical movement of securities certificates. Direct Participants include both U.S. and non-U.S. securities brokers and dealers, banks, trust companies, clearing corporations, and certain other organizations. DTC is a wholly-owned subsidiary of The Depository Trust & Clearing Corporation (“DTCC”). DTCC is the holding company for DTC, National Securities Clearing Corporation, and Fixed Income Clearing Corporation, all of which are registered clearing agencies. DTCC is owned by the users of its regulated subsidiaries. Access to the DTC system is also available to others such as both U.S. and non-U.S. securities brokers and dealers, banks, trust companies, and clearing corporations that clear through or maintain a custodial relationship with a Direct Participant, either directly or indirectly (“Indirect Participants”). DTC has Standard & Poor’s rating of: AA+. The DTC Rules applicable to its Participants are on file with the Securities and Exchange Commission. More information about DTC can be found at www.dtcc.com. Purchases of Bonds under the DTC system must be made by or through Direct Participants, which will receive a credit for the Bonds on DTC’s records. The ownership interest of each actual purchaser of each Bond (“Beneficial Owner”) is in turn to be recorded on the Direct and Indirect Participants’ records. Beneficial Owners will not receive written confirmation from DTC of their purchase. Beneficial Owners are, however, expected to receive written confirmations providing details of the transaction, as well as periodic statements of their holdings, from the Direct or Indirect Participant through which the Beneficial Owner entered into the transaction. Transfers of ownership interests in the Bonds are to be accomplished by entries made on the books of Direct and Indirect Participants acting on behalf of Beneficial Owners. Beneficial Owners will not receive certificates representing their ownership interests in Bonds, except in the event that use of the book-entry system for the Bonds is discontinued. To facilitate subsequent transfers, all Bonds deposited by Direct Participants with DTC are registered in the name of DTC’s partnership nominee, Cede & Co., or such other name as may be requested by an authorized representative of DTC. The deposit of Bonds with DTC and their registration in the name of Cede & Co. or such other DTC nominee do not effect any change in beneficial ownership. DTC has no knowledge of the actual Beneficial Owners of the Bonds; DTC’s records reflect only the identity of the Direct Participants to whose accounts such Bonds are credited, which may or may not be the Beneficial Owners. The Direct and Indirect Participants will remain responsible for keeping account of their holdings on behalf of their customers. Conveyance of notices and other communications by DTC to Direct Participants, by Direct Participants to Indirect Participants, and by Direct Participants and Indirect Participants to Beneficial Owners will be governed by arrangements among them, subject to any statutory or regulatory requirements as may be in effect from time to time. Beneficial Owners of Bonds may wish to take certain steps to augment the transmission to them of notices of significant events with respect to the Bonds, such as redemptions and defaults. For example, Beneficial Owners of Bonds may wish to ascertain that the nominee holding the Bonds for their benefit has agreed to obtain and transmit notices to Beneficial Owners. Redemption notices shall be sent to DTC. If less than all of the Bonds within a maturity and interest rate are being redeemed, DTC’s practice is to determine by lot the amount of the interest of each Direct Participant in such maturity to be redeemed. Neither DTC nor Cede & Co. (nor any other DTC nominee) will consent or vote with respect to Bonds unless authorized by a Direct Participant in accordance with DTC’s MMI Procedures. Under its usual procedures, DTC mails an Omnibus Proxy to the State as soon as possible after the record date. The

-74-
Omnibus Proxy assigns Cede & Co.’s consenting or voting rights to those Direct Participants to whose accounts Bonds are credited on the record date (identified in a listing attached to the Omnibus Proxy). Redemption proceeds on the Bonds will be made to Cede & Co., or such other nominee as may be requested by an authorized representative of DTC. DTC’s practice is to credit Direct Participants’ accounts upon DTC’s receipt of funds and corresponding detail information from the State, on the payable date in accordance with their respective holdings shown on DTC’s records. Payments by Participants to Beneficial Owners will be governed by standing instructions and customary practices, as is the case with securities held for the accounts of customers in bearer form or registered in “street name”, and will be the responsibility of such Participant and not of DTC nor its nominee or the State, subject to any statutory or regulatory requirements as may be in effect from time to time. Payment of redemption proceeds to Cede & Co. (or such other nominee as may be requested by an authorized representative of DTC) is the responsibility of the State, disbursement of such payments to Direct Participants will be the responsibility of DTC, and disbursement of such payments to the Beneficial Owners will be the responsibility of Direct and Indirect Participants. DTC may discontinue providing its services as depository with respect to the Bonds at any time by giving reasonable notice to the State. Under such circumstances, in the event that a successor depository is not obtained, Bond certificates are required to be printed and delivered. The State may decide to discontinue use of the system of book-entry transfers through DTC (or a successor securities depository). In that event, Bond certificates will be printed and delivered. The information in this section concerning DTC and DTC’s book-entry system has been obtained from sources that the State believes to be reliable, but the State and the Underwriters take no responsibility for the accuracy thereof.
APPROVAL OF LEGAL MATTERS Certain legal matters incident to the authorization and issuance of the Bonds are subject to the approval of Saul Ewing LLP, Wilmington, Delaware, Bond Counsel, whose approving legal opinion, substantially in the form set forth in APPENDIX D, will be available at the time of the delivery of the Bonds. Bond Counsel has not verified the accuracy, completeness or fairness of the statements contained in the Official Statement nor will it express an opinion as to the accuracy, completeness, or fairness of the statements contained in the Official Statement.
TAX MATTERS Tax Exemption-Opinion of Bond Counsel The Internal Revenue Code of 1986, as amended (the “Code”) contains provisions relating to the tax-exempt status of interest on obligations issued by governmental entities which apply to the Bonds. These provisions include, but are not limited to, requirements relating to the use and investment of the proceeds of the Bonds and the rebate of certain investment earnings derived from such proceeds to the United States Treasury Department on a periodic basis. These and other requirements of the Code must be met by the State subsequent to the issuance and delivery of the Bonds in order for interest thereon to be and remain excludable from gross income for purposes of federal income taxation. The State has made covenants to comply with such requirements. In the opinion of Bond Counsel, interest (including accrued original issue discount) on the Bonds is not includable in gross income for purposes of federal income taxation under existing statutes, regulations, rulings and court decisions. The opinion of Bond Counsel is subject to the condition that the State comply with all

-75-
applicable federal income tax law requirements that must be satisfied subsequent to the issuance of the Bonds in order that interest thereon continues to be excluded from gross income. Failure to comply with certain of such requirements could cause the interest on the Bonds to be so includable in gross income retroactive to the date of issuance of the Bonds. The State has covenanted to comply with all such requirements. Interest on the Bonds is not treated as an item of tax preference under Section 57 of the Code for purposes of the individual and corporate alternative minimum taxes; however, under the Code, to the extent that interest on the Bonds is a component of a corporate holder's “adjusted current earnings,” a portion of that interest may be subject to the corporate alternative minimum tax. Bond Counsel expresses no opinion regarding other federal tax consequences relating to the Bonds or the receipt of interest thereon. See discussion of “Alternative Minimum Tax”, “Branch Profits Tax”, “S Corporations with Passive Investment Income”, “Social Security and Railroad Retirement Benefits”, “Deduction for Interest Paid by Financial Institutions to Purchase or Carry Tax-Exempt Obligations”, “Property or Casualty Insurance Company” and “Accounting Treatment of Original Issue Discount and Amortizable Bond Premium” below. Alternative Minimum Tax The Code includes, for purposes of the corporate alternative minimum tax, a preference item consisting of, generally, seventy-five percent of the excess of a corporation's “adjusted current earnings” over its “alternative minimum taxable income” (computed without regard to this particular preference item and the alternative tax net operating loss deduction). Thus, to the extent that tax-exempt interest (including interest on the Bonds) is a component of a corporate holder's “adjusted current earnings,” a portion of that interest may be subject to the alternative minimum tax. Branch Profits Tax Under the Code, foreign corporations engaged in a trade or business in the United States will be subject to a “branch profits tax” equal to thirty percent (30%) of the corporation's “dividend equivalent amount” for the taxable year. The term “dividend equivalent amount” includes interest on tax-exempt obligations. S Corporations with Passive Investment Income Section 1375 of the Code imposes a tax on the income of certain small business corporations for which an S Corporation election is in effect, and that have “passive investment income”. For purposes of Section 1375 of the Code, the term “passive investment income” includes interest on the Bonds. This tax applies to an S Corporation for a taxable year if the S Corporation has Subchapter C earnings and profits at the close of the taxable year and has gross receipts, more than twenty-five percent (25%) of which are “passive investment income”. Thus, interest on the Bonds may be subject to federal income taxation under Section 1375 of the Code if the requirements of that provision are met. Social Security and Railroad Retirement Benefits Under Section 86 of the Code, certain Social Security and Railroad Retirement benefits (the “benefits”) may be includable in gross income. The Code provides that interest on tax-exempt obligations (including interest on the Bonds) is included in the calculation of “modified adjusted gross income” in determining whether a portion of the benefits received are to be includable in gross income of individuals. Deduction for Interest Paid by Financial Institutions to Purchase or Carry Tax-Exempt Obligations The Code, subject to limited exceptions not applicable to the Bonds, denies the interest deduction for indebtedness incurred or continued to purchase or carry tax-exempt obligations, such as the Bonds. With respect to banks, thrift institutions and other financial institutions, the denial to such institutions is one hundred percent

-76-
(100%) for interest paid on funds allocable to the Bonds and any other tax-exempt obligations acquired after August 7, 1986. Property or Casualty Insurance Company The Code also provides that a property or casualty insurance company may also incur a reduction, by a specified portion of its tax-exempt interest income, of its deduction for losses incurred. Accounting Treatment of Original Issue Discount and Amortizable Bond Premium The 2014B Bonds maturing on July 1, 2034 bearing interest at 3.000% are herein referred to as the “Discount Bonds.” In the opinion of Bond Counsel, the difference between the initial public offering price of the Discount Bonds set forth on the cover page and the stated redemption price at maturity of each such Bonds constitutes “original issue discount,” all or a portion of which will, on the disposition or payment of such Bonds, be treated as tax-exempt interest for federal income tax purposes. Original issue discount will be apportioned to an owner of the Discount Bonds under a “constant interest method,” which utilizes a periodic compounding of accrued interest. If an owner of a Discount Bond who purchases it in the original offering at the initial public offering price owns that Discount Bond to maturity, that Bondholder will not realize taxable gain for federal income tax purposes upon payment of the Discount Bond at maturity. An owner of a Discount Bond who purchases it in the original offering at the initial public offering price and who later disposes of the Discount Bond prior to maturity will be deemed to have accrued tax-exempt income in a manner described above; amounts realized in excess of the sum of the original offering price of such Discount Bond and the amount of accrued original issue discount will be taxable gain. Purchasers of Discount Bonds should consider possible state and local income, excise or franchise tax consequences arising from original issue discount on the Discount Bonds. Prospective purchasers of the Discount Bonds should consult their tax advisors regarding the Delaware tax treatment of original issue discount. All of the 2014B Bonds, except for the 2014B Bonds maturing on July 1, 2034 bearing interest at 3.000%, are herein referred to, collectively, as the “Premium Bonds”. An amount equal to the excess of the initial public offering price of a Premium Bond set forth on the inside cover page over its stated redemption price at maturity constitutes premium on such Premium Bond. A purchaser of a Premium Bond must amortize any premium over such Premium Bond’s term using constant yield principles, based on the purchaser’s yield to maturity. As premium is amortized, the purchaser’s basis in such Premium Bond is reduced by a corresponding amount, resulting in an increase in the gain (or decrease in the loss) to be recognized for federal income tax purposes upon a sale or disposition of such Premium Bond prior to its maturity. Even though the purchaser’s basis is reduced, no federal income tax deduction is allowed. Purchasers of Premium Bonds, whether at the time of initial issuance or subsequent thereto, should consult their own tax advisors with respect to the determination and treatment of premium for federal income tax purposes and with respect to state and local tax consequences of owning such Premium Bonds. Delaware State Tax Opinion In the opinion of Bond Counsel under existing statutes interest on the Bonds is exempt from personal and corporate income tax imposed by the State.
CHANGES IN FEDERAL TAX LAW
From time to time, there are presidential proposals, proposals by various federal committees and legislative proposals in Congress that, if enacted, could alter or amend the tax matters referred to herein or

-77-
adversely affect the marketability or market value of the Bonds or otherwise prevent holders of the Bonds from realizing the full benefit of the tax exemption of interest on the Bonds. Further, such proposals may impact the marketability or market value of the Bonds simply by being proposed. It cannot be predicted whether or in what form any such proposals may be enacted or whether if enacted such proposals would apply to bonds issued prior to enactment. In addition, regulatory actions are from time to time announced or proposed and litigation is threatened or commenced which, if implemented or concluded in a particular manner, could adversely affect the market value, marketability or tax status of the Bonds. It cannot be predicted whether any such regulatory action will be implemented, how any particular litigation or judicial action will be resolved, or whether the Bonds would be impacted thereby.
Purchasers of the Bonds should consult their tax advisors regarding any pending or proposed legislation, regulatory initiatives or litigation. The opinions expressed by Bond Counsel are based upon existing legislation and regulations as interpreted by relevant judicial and regulatory authorities as of the date of issuance and delivery of the Bonds, and Bond Counsel has expressed no opinion as of any date subsequent thereto or with respect to any proposed or pending legislation, regulatory initiatives or litigation.
OPINIONS AND CERTIFICATES AVAILABLE ON DELIVERY OF THE BONDS Upon delivery of the Bonds, the State will make available the following opinions and certificates dated the date of delivery of the Bonds: (1) the opinion of Saul Ewing LLP, Bond Counsel, Wilmington, Delaware, substantially in the form set forth in APPENDIX D, to the effect that the Bonds are legal and valid general obligations of the State to which the State has pledged its full faith and credit; (2) the opinion of the Attorney General or a Deputy Attorney General to the effect that no litigation is pending or known to be threatened to restrain or enjoin the issuance of the Bonds, or in any manner questioning the validity of any proceedings authorizing the issuance of the Bonds, or the levy or collection of any material portion of taxes or other revenues of the State, or contesting the completeness, accuracy or fairness of the Official Statement; and that neither the corporate existence of the State nor the titles of the officials of the State signatories hereto to their respective offices is being contested; (3) a certificate of the Issuing Officers certifying as genuine the signatures of the Issuing Officers signing the Bonds; (4) a certificate of the State Treasurer acknowledging receipt of payment for the Bonds; (5) a certificate executed by the State Treasurer relating to federal tax matters under the Internal Revenue Code of 1986, and regulations promulgated thereunder; and (6) a certificate of the Issuing Officers stating: (a) that the Official Statement, as of the date of the Official Statement, did not contain any untrue statement of a material fact or omit to state a material fact necessary to make the statements therein, in the light of the circumstances under which they were made, not misleading; and (b) as of the date of delivery of and payment for the Bonds there has been no material adverse change in the condition, financial or otherwise of the State, from the date of the sale of the Bonds to the date of delivery of the Bonds and from that set forth in the Official Statement.
INDEPENDENT AUDITORS The State’s audited June 30, 2013, Basic Financial Statements included as APPENDIX B to this Official Statement have been examined by KPMG LLP, independent auditors, whose report thereon appears therein. KPMG LLP, the State’s independent auditor, has not been engaged to perform and has not performed, since the date of its report included herein, any procedures on the financial statements addressed in that report. KPMG LLP has not performed any procedures relating to this Official Statement.
FINANCIAL ADVISOR Public Financial Management, Inc. has been appointed financial advisor to the State and is acting in that capacity in connection with the sale of the Bonds.

-78-
RATINGS Fitch Ratings, Moody's Investors Service and Standard & Poor's rate the general obligation bonds of the State. The current rating of all outstanding general obligation bonds of the State assigned by Fitch Ratings is AAA, the rating assigned by Moody's Investors Service is Aaa and the rating assigned by Standard & Poor's is AAA. Fitch Ratings, Moody's Investors Service and Standard & Poor's have assigned the Bonds the ratings which appear on the cover hereof. Such ratings reflect only the respective views of such organizations. An explanation of the significance of such ratings may be obtained from the respective organizations. There is no assurance that such ratings will continue for any period of time or that they will not be revised or withdrawn. A downward revision or withdrawal of the ratings may have an adverse effect on the market price of the Bonds. No rating assures the market value of the Bonds.
UNDERWRITING The Bonds are being purchased by J.P. Morgan Securities LLC, as representative of a group of underwriters (the “Underwriters”). The Underwriters have agreed to purchase said Bonds at a purchase price of $359,725,855.31 (which is equal to the aggregate principal amount of $306,870,000 plus net original issue premium of $53,159,369.85 less underwriters’ discount of $303,514.54). The Underwriters’ obligation to make such purchase is subject to certain terms and conditions set forth in the related purchase contract, the approval of certain legal matters by Bond Counsel and certain other conditions. J.P. Morgan Securities LLC (“JPMS”), one of the Underwriters of the Bonds, has entered into a negotiated dealer agreement (the "Dealer Agreement") with Charles Schwab & Co., Inc. ("CS&Co.") for the retail distribution of certain securities offerings, including the Bonds, at the original issue prices. Pursuant to the Dealer Agreement, CS&Co. will purchase Bonds from JPMS at the original issue price less a negotiated portion of the selling concession applicable to any Bonds that CS&Co. sells. Citigroup Global Markets Inc., an underwriter of the Bonds, has entered into a retail distribution agreement with each of TMC Bonds L.L.C. (“TMC”) and UBS Financial Services Inc. (“UBSFS”). Under these distribution agreements, Citigroup Global Markets Inc. may distribute municipal securities to retail investors through the financial advisor network of UBSFS and the electronic primary offering platform of TMC. As part of this arrangement, Citigroup Global Markets Inc. may compensate TMC (and TMC may compensate its electronic platform member firms) and UBSFS for their selling efforts with respect to the Bonds. Morgan Stanley, parent company of Morgan Stanley & Co. LLC., an underwriter of the Bonds, has entered into a retail distribution arrangement with its affiliate Morgan Stanley Smith Barney LLC. As part of the distribution arrangement, Morgan Stanley & Co. LLC may distribute municipal securities to retail investors through the financial advisor network of Morgan Stanley Smith Barney LLC. As part of this arrangement, Morgan Stanley & Co. LLC may compensate Morgan Stanley Smith Barney LLC for its selling efforts with respect to the Bonds.
The Underwriters reserve the right to change the initial prices of the Bonds in connection with the marketing of the Bonds and may offer and sell the Bonds to certain dealers (including dealers depositing the Bonds into investment trusts) and others at prices lower than the initial public offering price or prices set forth in the Official Statement.
The Underwriters and their respective affiliates are full service financial institutions engaged in
various activities, which may include securities trading, commercial and investment banking, financial

-79-
advisory, investment management, principal investment, hedging, financing and brokerage activities. The Underwriters and their respective affiliates may have, from time to time, performed and may in the future perform, various investment banking services for the State, for which they may have received or will receive customary fees and expenses. In the ordinary course of their various business activities, the Underwriters and their respective affiliates may make or hold a broad array of investments and actively trade debt and equity securities (or related derivative securities) and financial instruments (which may include bank loans and/or credit default swaps) for their own account and for the accounts of their customers and may at any time hold long and short positions in such securities and instruments. Such investment and securities activities may involve securities and instruments of the State. The Underwriters and their respective affiliates may also communicate independent investment recommendations, market color or trading ideas and/or publish or express independent research views in respect of such assets, securities or instruments and may at any time hold, or recommend to clients that they should acquire, long and/or short positions in such assets, securities and instruments.
VERIFICATION OF MATHEMATICAL COMPUTATIONS The accuracy of the mathematical computations of (i) the adequacy of the maturing principal of and interest earned on the escrow securities together with other available funds held in the escrow account, to provide for the payment of the Refunded Bonds; and (ii) the “yield” on the escrow securities and on the Bonds, will be examined by PFM Asset Management LLC. The computations will be based upon information and assumptions supplied by the financial advisor on behalf of the State. PFM Asset Management LLC has restricted its procedures to examining the arithmetical accuracy of the computations and has not evaluated or audited the assumptions or information used in the computations. PFM Asset Management LLC is an affiliate of the Financial Advisor and part of The PFM Group.
CONTINUING DISCLOSURE UNDERTAKING General. The State has covenanted for the benefit of the Holders of the Bonds in a Continuing Disclosure Agreement dated November 15, 2011, which is being supplemented and amended to make it applicable to the Bonds (as so supplemented and amended, the “Disclosure Agreement”) to (a) provide notices of the occurrence of certain enumerated events; and (b) provide certain financial information and operating data relating to the State not later than the first day of the eleventh calendar month immediately following the end of the State’s fiscal year (the “Annual Report”). The Annual Report and the notices of significant events, both summarized below, will be filed by the State with the Electronic Municipal Market Access System (“EMMA”) maintained by the Municipal Securities Rulemaking Board. The specific nature of the information to be contained in the Annual Report or the notices of significant events is summarized below. These covenants have been made in order to assist the Underwriters in complying with S.E.C. Rule 15c2-12, as amended (the “Rule”). Annual Reports. The State’s Annual Report filed with EMMA shall contain or incorporate by reference the information with respect to the relevant fiscal year as set forth in Exhibit “A” to the Continuing Disclosure Agreement and in the Supplement to the Continuing Disclosure Agreement, both of which are attached hereto as Appendix C. Notices of Significant Events. Upon the occurrence of any of the following notice events, the State shall in a timely manner not in excess of ten (10) business days after the occurrence of any of the following events, file with EMMA notice of such occurrence: (1) principal and interest payment delinquencies; (2) non payment-related defaults, if material; (3) unscheduled draws on debt service reserves reflecting financial difficulties; (4) unscheduled draws on credit enhancements reflecting financial difficulties; (5) substitution of

-80-
credit or liquidity providers, or their failure to perform; (6) adverse tax opinions or events affecting the tax status of the Bonds; (7) modifications to rights of Holder, if material; (8) bond calls (other than mandatory sinking fund redemptions), if material, and tender offers; (9) defeasances of Bonds; (10) release, substitution, or sale of property securing repayment of any Bonds, if material; (11) rating changes; (12) bankruptcy, insolvency, receivership or similar event of the State; (13) the consummation of a merger, consolidation, or acquisition involving the State or the sale of all or substantially all of the assets of the State, other than in the ordinary course of business, the entry into a definitive agreement to undertake such an action or the termination of a definitive agreement, if material; (14) appointment of a successor or additional trustee or the change of name of a trustee, if material; or (15) failure to provide annual financial information as required. Accounting Standards. The financial statements described above shall be audited in accordance with generally accepted accounting principles applicable in the preparation of financial statements of the State as such principles are from time to time promulgated by the Financial Accounting Standards Board, the Governmental Accounting Standards Board, or such other body recognized as authoritative by the American Institute of Certified Public Accountants or any successor body (“GAAP”), and shall also comply with applicable federal and state auditing statutes, regulations, standards and/or guidelines. The State may from time to time modify its accounting principles to the extent necessary or desirable to comply with changes in either GAAP or applicable federal and state statutes, regulations, standards and/or guidelines. Audited financial statements of the State not submitted as part of the Annual Report shall be provided to EMMA if and when available to the State, and in any event not more than thirty (30) days after receipt thereof from the State’s auditors. In the event that audited financial statements are not submitted as part of the Annual Report, the State shall provide in lieu thereof unaudited financial statements meeting the description set forth above. Termination of Reporting Obligation. The State’s obligations under the Disclosure Agreement shall terminate upon (a) the legal defeasance, prior redemption or payment in full of all of the Bonds or (b) the assumption by a successor Obligated Person of all of the obligations of the prior Obligated Person both under the Disclosure Agreement and under the Bonds. Amendments. Notwithstanding any other provision of the Disclosure Agreement, the State may modify or amend the Disclosure Agreement. Under the current SEC interpretation of the Rule, the following preconditions must be satisfied: (a) the amendment is being made in connection with a change of circumstances that arises from a change in legal requirements, change in law, change in the identity, nature or status of the State, or change in the type of business conducted by the State; (b) the Disclosure Agreement, as amended, would have complied with the requirements of the Rule as of the date of issuance of the relevant Bonds, after taking into account any amendment or interpretations of the Rule, as well as any change in circumstances; and (c) the amendment does not materially adversely effect the interests of Holder as determined either by a party unaffiliated with the State (such as the Paying Agent or nationally recognized bond counsel) or by an approving vote of a majority of Holders. To the extent required by the Rule, the State shall disclose in the next Annual Report the amendment and its impact on the information being provided. Defaults. In the event of a failure of the State to comply with any provision of the Disclosure Agreement, the Paying Agent, any Participating Underwriter or any Holder may take such actions as may be necessary and appropriate, including seeking a writ of mandamus or specific performance by court order to cause the State to comply with its obligations under the Disclosure Agreement. A default under the Disclosure Agreement shall not be deemed an Event of Default under the Resolution or the Bonds, and the sole remedy under the Disclosure Agreement in the event of any failure of the State to comply with the Disclosure Agreement shall be an action to compel performance, provided, however, that nothing in the Disclosure Agreement shall limit any Holder’s rights under applicable federal securities law.

-81-
Due to an oversight, the State was not in compliance with its obligations under its continuing disclosure
agreements to which it is a party. While the State filed its Annual Report for the fiscal year ended June 30, 2011 by the due date, it later discovered that the filing was not complete. The State supplied the corrected information to EMMA on February 5, 2013 and is now in compliance, in all material respects, with the disclosure agreements. Otherwise, the State has complied, in all material respects, with all of its obligations under its continuing disclosure agreements in each of the past five years.
CERTAIN RELATIONSHIPS Cozen O’Connor, counsel to the Underwriters, provides legal services to the State from time to time. PFM Asset Management LLC, verification agent, is an affiliate of Public Financial Management, Inc., Financial Advisor to the State, and is part of The PFM Group.

-82-
The execution and distribution of the Official Statement in connection with the sale of the Bonds has been duly authorized by the State. THE STATE OF DELAWARE JACK A. MARKELL, Governor THOMAS J. COOK, Secretary of Finance JEFFREY W. BULLOCK, Secretary of State CHIPMAN FLOWERS, JR., State Treasurer

APPENDIX A
SUMMARY OF CASH BASIS FINANCIAL STATEMENTS for Fiscal Years 2010 through 2014

[THIS PAGE INTENTIONALLY LEFT BLANK]

A-1
THE STATE OF DELAWARE BUDGETARY GENERAL FUND
RECEIPTS, DISBURSEMENTS AND CASH BALANCES (in thousands)
Fiscal Years Ended June 30 2010(1) 2011(1) 2012(1) 2013(1) 2014(1) Receipts Tax Revenue Personal Income ............................................. $1,061,486 $1,175,933 $1,231,722 $1,318,915 $1,384,985 Franchise ........................................................ 633,108 614,486 611,812 605,594 625,643 Corporation Income ....................................... 125,575 221,181 149,012 205,696 175,514 Gross Receipts ............................................... 194,594 201,104 233,358 226,254 226,524 Public Utility .................................................. 56,694 57,174 45,351 44,481 47,445 Cigarette ......................................................... 132,278 129,105 120,848 115,190 114,657 Pari-Mutual .................................................... 116 110 96 80 80 Inheritance and Estate .................................... 293 16,165 12,001 5,298 1,272 Realty Transfer .............................................. 46,875 44,054 31,598 42,255 60,348 Alcoholic Beverage ....................................... 16,446 16,883 17,654 18,412 19,617 Insurance Taxes ............................................. 51,838 62,881 63,398 53,942 52,962 Bank Franchise .............................................. 54,005 119,739 112,541 103,531 102,695 All Other ........................................................ 648,803 595,046 495,753 758,394 682,874 Total Taxes ....................................... 3,022,111 3,253,861 3,125,144 3,498,042 3,494,616 Revenue Refunds .......................... 296,348 291,815 264,557 235,400 357,952 Net Taxes ......................................... 2,725,763 2,962,046 2,860,587 3,262,642 3,136,664 Other Revenue Fees .......................................................... 114,091 124,567 126,699 132,807 140,702 Interest Earnings ............................................ 10,900 8,867 10,648 6,295 2,866 Sales(2) 350,483 357,561 334,320 295,075 263,750 Grants, Donations & Special Income 0 91 - - 283 Licenses ......................................................... 11,775 17,447 12,272 19,508 13,572 Other Revenue ............................................... 8,916 4,186 5,832 5,404 4,687 Non-revenue and Transfers ........................... 13,214 56,652 8,937 8,020 10,131 Total Other Revenue ........................ 509,379 569,371 498,708 467,109 435,991 Total Receipts ................................................... $3,235,142 $3,531,417 $3,359,295 $3,729,751 $3,572,655 Disbursements Legislative ...................................................... $ 11,768 $ 12,047 $ 13,149 $ 13,286 $ 14,351 Judicial 86,357 90,445 95,256 91,403 93,783 Executive ........................................................ 89,887 124,161 144,678 134,492 133,490 Technology and Information.......................... 32,258 36,292 35,462 41,300 38,479 Other Elective Offices .................................... 54,173 190,261 168,666 170,891 185,240 Legal .......................................................... 41,289 44,051 49,638 52,629 56,014 Dept. of State .................................................. 27,396 26,653 28,037 23,889 24,994 Dept. of Finance ............................................. 24,332 21,092 18,939 20,358 34,081 Dept. of Administrative Services ................... - - - - - Dept. of Health & Social Services ................. 821,414 834,901 1,055,134 1,061,885 1,087,203 Dept. of Children, Youth & Their Families ... 118,206 120,678 134,493 141,895 149,517 Dept. of Correction ........................................ 237,987 245,402 262,307 264,989 273,474 Dept. of Natural Resources & Env. Control .. 44,137 42,585 41,766 44,602 49,598 Dept. of Safety & Homeland Security ........... 117,906 126,594 137,524 144,288 145,584 Dept. of Transportation .................................. - 14,000 - - - Dept. of Labor ............................................... 6,178 6,522 7,239 7,886 8,965 Other .......................................................... 18,951 23,370 21,629 24,058 22,150 Total Departments ............................ 1,732,239 1,959,054 2,213,917 2,237,851 2,316,923 Higher Education ........................................... 227,323 220,023 222,656 226,714 234,645 Public Education ............................................ 1,116,947 1,091,673 1,155,825 1,193,976 1,242,567 Total Education ................................ 1,344,270 1,311,696 1,378,481 1,420,690 1,477,212 Total Disbursements ........................................ $3,076,509 $3,270,750 $3,592,398 $3,658,541 $3,794,135
Receipts Over (Under) Disbursements 158,633 260,667 (233,103) 71,210 (221,480) Cash Balance-Beginning of Period 378,471 537,104 797,771 564,668 635,878 General Fund Advances to Other Funds - - - - - Cash Balance ..................................................... $ 537,104 $ 797,771 $ 564,668 $ 635,878 $ 414,398
_______________ (1) Unaudited. The State has audited GAAP financial statements for the fiscal years ending June 30, 2010 through June 30, 2013. (2) Consists primarily of payments for board and treatment at State institutions and lottery receipts. NOTE: Numbers are rounded, and thus, the sum of the detail may not equal the total. Source: Department of Finance.

A-2
THE STATE OF DELAWARE
BUDGETARY SPECIAL FUND RECEIPTS, DISBURSEMENTS AND CASH BALANCES
(in thousands) Fiscal Years Ended June 30 2010(1) 2011(1) 2012(1) 2013(1) 2014(1) Receipts Taxes Insurance ................................................... $ 24,321 $ 31,223 $ 21,857 $ 27,088 $ 30,152 Local School Property ............................... 435,961 402,552 474,829 506,850 536,160 All Other .................................................... 356,336 341,242 382,675 281,771 247,251 Total Taxes ........................................... 816,618 775,017 879,361 815,709 813,563 Other Revenue Federal Grants and Reimbursements ........ 1,884,666 1,478,960 1,836,862 1,836,012 1,940,496 Pension Fund Receipts .............................. 180,576 209,888 238,767 249,552 267,072 Interest Earnings ........................................ 16,661 11,178 21,104 10,720 9,866 All Other .................................................... 983,269 857,267 390,504 452,853 505,633 Total Other Revenue ............................. 3,065,172 2,557,293 2,487,237 2,549,137 2,723,067 Non-Revenue and Transfer Sale of Bonds ............................................ 211,693 269,862 257,391 247,669 248,626 Receipts from Pension Fund...................... 575,419 497,978 477,541 522,921 563,365 All Other .................................................... 873,255 329,243 1,046,607 1,078,799 1,112,122 Total Non-Revenue and Transfer .... 1,660,367 1,097,083 1,781,539 1,849,389 1,924,113 Total Receipts ..................................................... 5,542,157 4,429,393 5,148,137 5,214,235 5,460,743 Total Disbursements ........................................... 5,643,645 4,347,718 5,085,043 5,267,578 5,455,581 Receipts Over (Under) Disbursements .............. (101,488) 81,675 63,094 (53,343) 5,162 Operating Cash Balance-Beginning of Period ... 1,379,132 1,277,667 1,398,763 1,526,992 1,430,695
Operating Cash Balance-End of Period ......... $1,277,644 $1,359,342 $1,461,857 $1,473,649 $1,435,857 Other Cash Payables(2) .................................................. 23 39,421 65,135 (42,954) (80,460)
Cash Balance ..................................................... $1,277,667 $1,398,763 $ 1,526,992 $ 1,430,695
$ 1,355,397
_______________ (1) Unaudited. The State has audited GAAP financial statements for the fiscal years ending June 30, 2010 through June 30, 2013. (2) Payroll withholdings are no longer considered a State budgetary Special Fund. They are a General Ledger liability entry
starting in fiscal 1987. NOTE: Numbers are rounded and thus the sum of the detail may not equal the total. Source: Department of Finance.

A-3
THE STATE OF DELAWARE
COMBINED BUDGETARY GENERAL AND SPECIAL FUNDS RECEIPTS, DISBURSEMENTS AND CASH BALANCES
(in thousands) Fiscal Years Ended June 30 2010(1) 2011(1) 2012(1) 2013(1) 2014(1) Receipts Net Taxes ................................................... $ 3,546,383 $ 3,737,064 $ 4,004,507 $ 4,078,352 $ 3,950,227 Interest Earnings ........................................ 27,561 20,053 31,752 17,015 12,732 Grants, Donations and Special Income ..... 1,800,487 1,433,101 1,791,868 1,788,677 1,918,380 Licenses ..................................................... 18,268 29,987 18,933 28,143 20,877 Fees .......................................................... 274,355 537,145 606,463 606,418 639,710 Sales .......................................................... 448,708 449,671 430,130 415,471 391,092 Other Revenue ........................................... 1,166,632 563,521 599,758 640,289 688,658
Total Revenue ....................................... 7,282,394 6,806,542 7,483,411 7,574,365 7,621,676 Non-Revenue and Transfers ................. 1,494,905 1,154,269 1,288,578 1,369,621 1,411,722
Total Receipts 8,777,299 7,960,811 8,771,989 8,943,986 9,033,398 Total Disbursements ........................................... 8,720,154 7,618,468 8,941,998 8,926,119 9,249,716 Receipts Over (Under) Disbursements .............. 57,145 342,343 (170,009) 17,867 (216,318) Cash Balance-Beginning of Period .................... 1,757,603 1,814,771 2,196,534 2,091,660 2,066,573 General Fund Advances to Other Funds ............ - - - - -
Operating Cash Balance-End of Period ......... $1,814,748 $2,157,114 $2,026,525 $2,109,527
$1,850,255
Other Cash Payables(2) .................................................. 23 39,421 65,135 (42,954) (80,460)
Cash Balance ..................................................... $1,814,771 $2,196,535 $2,091,660 $2,066,573
$1,769,795
_______________ (1) Unaudited. The State has audited GAAP financial statements for the fiscal years ending June 30, 2010 through June 30, 2013. (2) Payroll withholdings are no longer considered a State budgetary Special Fund. They are a General Ledger liability entry
starting in fiscal 1987. NOTE: Numbers are rounded and thus the sum of the detail may not equal the total. Source: Department of Finance.

[THIS PAGE INTENTIONALLY LEFT BLANK]

APPENDIX B
BASIC FINANCIAL STATEMENTS For The Year Ended June 30, 2013

[THIS PAGE INTENTIONALLY LEFT BLANK]

STATE OF DELAWARE Basic Financial Statements
June 30, 2013 (With Independent Auditors’ Report Thereon)

STATE OF DELAWARE
Table of Contents Page
Independent Auditors’ Report 1
Management Discussion and Analysis 4
Basic Financial Statements
Government-Wide Financial Statements 19
Governmental Fund Financial Statements 21
Proprietary Fund Financial Statements 25
Fiduciary Fund Financial Statements 28
Discretely Presented Component Unit Financial Statements 30
Notes to the Financial Statements 32
Required Supplementary Information
Notes to Required Supplementary Information 115 Budgetary Comparison Schedule – General Fund 117 Budgetary Comparison Schedule – Special Fund 117 Statutory/Budgetary Reconciliations 118 Information About Infrastructure Assets Reported Using the Modified Approach 122 Delaware Public Employees’ Retirement System (DPERS) Schedule of Funding Status and Progress 122
DelDOT – Delaware Transit Corporation – Pension Data Schedule of Funding Status and Progress 123 OPEB Trust Schedule of Funding Status and Progress 124 Schedule of Employer Contributions 124
Delaware Transit Corporation - OPEB Trust Schedule of Funding Status and Progress 125

Independent Auditors’ Report The Honorable Governor and Honorable Members of the State Legislature State of Delaware
Report on the Financial Statements
We have audited the accompanying financial statements of the governmental activities, the business-type activities, the aggregate discretely presented component units, each major fund, and the aggregate remaining fund information of the State of Delaware (the State), as of and for the year ended June 30, 2013, and the related notes to the financial statements, which collectively comprise the State’s basic financial statements as listed in the table of contents.
Management’s Responsibility for the Financial Statements
Management is responsible for the preparation and fair presentation of these financial statements in accordance with U.S. generally accepted accounting principles; this includes the design, implementation, and maintenance of internal control relevant to the preparation and fair presentation of financial statements that are free from material misstatement, whether due to fraud or error.
Auditors’ Responsibility
Our responsibility is to express opinions on these financial statements based on our audit. We did not audit the financial statements of the Delaware State Housing Authority (DSHA), Delaware State University (DSU), Delaware Charter Schools, Riverfront Development Corporation (RDC), and Diamond State Port Corporation (DSPC) within the aggregate discretely presented component units. The financial statements of DSHA, DSU, RDC, DSPC and the Delaware Charter Schools were audited by other auditors whose reports thereon have been furnished to us and which represent 89% of total assets, 80% of total net position and 93% of total revenues within the aggregate discretely presented component units. Our opinions, insofar as it relates to the amounts included for those entities, are based solely on the reports of the other auditors. We conducted our audit in accordance with auditing standards generally accepted in the United States of America. Those standards require that we plan and perform the audit to obtain reasonable assurance about whether the financial statements are free from material misstatement.
KPMG LLP 1601 Market Street Philadelphia, PA 19103-2499
KPMG LLP is a Delaware limited liability partnership, the U.S. member firm of KPMG International Cooperative (“KPMG International”), a Swiss entity.

The Honorable Governor and Honorable Members of the State Legislature
2
An audit involves performing procedures to obtain audit evidence about the amounts and disclosures in the financial statements. The procedures selected depend on the auditors’ judgment, including the assessment of the risks of material misstatement of the financial statements, whether due to fraud or error. In making those risk assessments, the auditor considers internal control relevant to the entity’s preparation and fair presentation of the financial statements in order to design audit procedures that are appropriate in the circumstances, but not for the purpose of expressing an opinion on the effectiveness of the entity’s internal control. Accordingly, we express no such opinion. An audit also includes evaluating the appropriateness of accounting policies used and the reasonableness of significant accounting estimates made by management, as well as evaluating the overall presentation of the financial statements. We believe that the audit evidence we have obtained is sufficient and appropriate to provide a basis for our audit opinions.
Opinions In our opinion, based on our audit and the reports of other auditors, the financial statements referred to above present fairly, in all material respects, the respective financial position of the governmental activities, the business-type activities, the aggregate discretely presented component units, each major fund, and the aggregate remaining fund information of the State of Delaware, as of June 30, 2013, and the respective changes in financial position, and where applicable, cash flows thereof for the year then ended in accordance with U.S. generally accepted accounting principles.
Emphasis of Matter
Change in Accounting Principle Resulting from the Adoption of a New Accounting Pronouncement
As discussed in Note 1 to the financial statements, effective July 1, 2012, the State adopted the provisions of Governmental Accounting Standards Board (GASB) Statement No. 61, The Financial Reporting Entity: Omnibus, an amendment of GASB Statements No. 14 and No. 34. Our opinion is not modified with respect to this matter.
Delaware State Housing Authority
As discussed in Notes 1 and 21 to the financial statements, the Delaware State Housing Authority, a discretely presented component unit, restated its net position as of July 1, 2012 to correct a material misstatement in the amount previously reported. Our opinion is not modified with respect to this matter.
Other Matters
Required Supplementary Information
U.S. generally accepted accounting principles require that the management’s discussion and analysis and required supplementary information as listed in the accompanying table of contents (collectively referred to as RSI) be presented to supplement the basic financial statements. Such information, although not a part of the basic financial statements, is required by the GASB who considers it to be an essential part of financial reporting for placing the basic financial statements in an appropriate operational, economic, or historical context. We have applied certain limited procedures to the RSI in accordance with auditing standards generally accepted in the United States of America, which consisted of inquiries of management about the methods of preparing the information and comparing the information for consistency with management’s responses to our inquiries, the basic financial statements, and other knowledge we obtained during our

The Honorable Governor and Honorable Members of the State Legislature
3
audit of the basic financial statements. We do not express an opinion or provide any assurance on the information because the limited procedures do not provide us with sufficient evidence to express an opinion or provide any assurance.
Philadelphia, Pennsylvania February 6, 2014

STATE OF DELAWARE Management’s Discussion and Analysis
The following is a discussion and analysis of the State of Delaware’s (the State’s) financial activities as of and for the fiscal year ended June 30, 2013. Readers are encouraged to consider the information presented here in conjunction with additional information that is furnished in the letter of transmittal, which can be found on pages i-vi of this report, and the State’s financial statements, which follow this section. These financial statements have been prepared using the financial accounting model adopted by the Governmental Accounting Standards Board (GASB). Financial Highlights
� The assets of the State exceeded its liabilities at the close of the most recent fiscal year by $4,877.2 million (net position). Component units reported a net position of $1,109.3 million, an increase of $27.4 million from the previous year as restated.
� As a result of its operations, the primary government’s total net position increased by $68.9 million (1.4%) in fiscal year 2013 when compared to the previous year’s ending net position as restated. Net position of governmental activities decreased by $74.1 million (4.2%) from the previous year, while net position of the business-type activities increased $143.1 million (4.7%) from the previous year.
� The State’s governmental funds reported combined ending fund balances of $1,902.9 million, an increase of $74.1 million (4.1%) in comparison with the restated prior year balance.
� The general fund reported unassigned fund balance of $1,025.3 million which was 23.6% of total general fund expenditures.
� The State’s total general obligation debt increased $58.4 million (3.5%) during fiscal year 2013 to $1,755.2 million. Of the State’s outstanding general obligation debt, $545.7 million (31.1%) has been issued on behalf of local school districts, which is supported by the property tax revenues of those districts. In addition, the State has $1,063.3 million in outstanding revenue bonds with $56.2 million for energy conservation projects and $1,007.1 million for transportation projects.
Overview of the Financial Statements This discussion and analysis is intended to serve as an introduction to the State’s basic financial statements. The State’s basic financial statements are comprised of three components: 1) government-wide financial statements, 2) fund financial statements, and 3) notes to the financial statements. This report also contains additional required supplementary information and other supplementary information, in addition to the basic financial statements.
4

State of Delaware Management’s Discussion and Analysis, June 30, 2013
Government-Wide Financial Statements The government-wide financial statements are designed to provide readers with a broad overview of the State’s operations, in a manner similar to a private sector business. The statement of net position reports the difference between the State’s assets, deferred outflows, liabilities, and deferred inflows as net position. Over time, increases or decreases in net position may serve as a useful indicator of whether the financial position of the State is improving or deteriorating. The statement of activities presents information showing how the State’s net position changed during the most recent fiscal year. All changes in net position are reported as soon as the underlying event that created the change occurs, regardless of the timing of related cash flows. As a result, revenues and expenses are reported in this statement for some items that will only result in cash flows in future fiscal periods (e.g., uncollected taxes and earned but unused vacation leave). Both of the government-wide financial statements distinguish functions of the State that are principally supported by taxes and intergovernmental revenues (governmental activities) from other functions that are intended to recover all or a significant portion of their costs through user fees and charges (business-type activities). The governmental activities of the State include general government, health and children’s services, judicial and public safety, natural resources and environmental control, labor and education. The business-type activities of the State include transportation, lottery and unemployment services. The government-wide financial statements include not only the State (known as the primary government), but also legally separate entities for which the State is financially accountable. These entities include the Delaware State Housing Authority, the Diamond State Port Corporation, the Riverfront Development Corporation, the Delaware State University, the Delaware Agricultural Lands Preservation Foundation and 22 charter schools. Financial information for these component units is reported separately from the financial information presented for the primary government. The government-wide financial statements can be found on pages 19 - 20 of this report. Fund Financial Statements A fund is a grouping of related accounts that is used to maintain control over resources that have been segregated for specific activities or objectives. The State, like other state and local governments, uses fund accounting to ensure and demonstrate compliance with finance-related legal requirements. The State’s funds can be divided into three categories: governmental funds, proprietary funds, and fiduciary funds. - Governmental Funds Governmental Funds are used to account for essentially the same
functions reported as governmental activities in the government-wide financial statements. However, the governmental fund financial statements focus on near-term inflows and
5

State of Delaware Management’s Discussion and Analysis, June 30, 2013
outflows of available resources, as well as on balances of available resources on hand at the end of the fiscal year. Such information may be useful in evaluating a government’s near-term financing requirements. Because the focus of governmental funds is narrower than that of the government-wide financial statements, it is useful to compare the information presented for government funds with similar information presented for governmental activities in the government-wide financial statements. By doing so, readers may better understand the long-term impact of the government’s near-term financial decisions. Both the governmental funds balance sheet and the governmental funds statement of revenues, expenditures, and changes in fund balance provide a reconciliation to facilitate this comparison between governmental funds and governmental activities.
The State’s governmental funds include the general, federal, local school district, and capital projects funds. Information is presented separately in the governmental funds balance sheet and in the governmental funds statement of revenues, expenditures, and changes in fund balance (deficit) for these funds.
The basic governmental funds financial statements can be found on pages 21 - 24 of this report.
The State budgets and controls its financial activities on the cash basis of accounting. In compliance with State law, the State records its financial transactions in either of two major categories – the General Fund or the Special Fund. References to these funds in this report include the terms “budgetary” or “budgetary basis” to differentiate them from the GAAP funds of the same name which encompass different funding categories. The State adopts an annual appropriated budget for its budgetary general fund. A budgetary comparison schedule has been provided for the budgetary general fund to demonstrate compliance with the budget. The schedule can be found on page 117 of this report.
- Proprietary Funds Proprietary Funds charge customers for the services they provide –
whether they are provided to outside customers (enterprise funds) or other State agencies and other governments (internal service funds). Proprietary Funds provide the same type of information as the government-wide financial statements, but in more detail. The proprietary fund financial statements provide separate information for the Lottery, Unemployment Insurance Trust Fund and the Delaware Department of Transportation (DelDOT), all of which are considered to be major funds of the State.
The basic proprietary fund financial statements can be found on pages 25 - 27 of this report.
- Fiduciary Funds The State acts as a fiduciary to account for resources held for the benefit
of parties outside the government. Fiduciary Funds are not reflected in the government-wide financial statements because the resources of those funds are not available to support the State of Delaware’s own programs. The accounting used for fiduciary funds is much like that used for proprietary funds. These funds are used where the State holds assets in trust or as an agent for others, including the pension trust funds and agency funds.
6

State of Delaware Management’s Discussion and Analysis, June 30, 2013
The basic fiduciary fund financial statements can be found beginning on pages 28 – 29 of this report. The combining fiduciary and agency fund statements can be found on pages 127 - 131.
Notes to the Financial Statements The notes provide additional information that is essential to a full understanding of the data provided in the government-wide and fund financial statements. The notes to the financial statements can be found on pages 32 - 113 of this report. Required Supplementary Information In addition to the basic financial statements and accompanying notes, this report presents certain Required Supplementary Information (RSI) concerning the status of the State’s legally adopted budget, the maintenance of the State’s infrastructure and additional schedules related to funding status and progress, annual pension costs and actuarial methods and assumptions for the State’s pension and OPEB trusts. The RSI can be found on pages 115 - 125 of this report. Statewide Financial Analysis As noted earlier, net position may serve over time as a useful indicator of a government’s financial position. The State’s assets exceeded its liabilities by $4,877.2 million at the close of the most recent fiscal year. The largest portion of the State’s net position of 99.3% reflects its investment in capital assets (e.g., land, buildings, vehicles, and equipment) less any related outstanding debt used to acquire those assets. The State uses these capital assets to provide services to citizens; consequently, these assets are not available for future spending. Although the State’s investment in capital assets is reported net of related debt, it should be noted that the resources needed to repay this debt must be provided from other sources, since the capital assets themselves cannot be used to liquidate these liabilities. Restricted net position, comprising 11.7% of total net position, represents resources that are subject to external restrictions, constitutional provisions, or enabling legislation on how they can be used. The remaining portion of the State’s net position represents the unrestricted deficit net position (11.0%).
7

State of Delaware Management’s Discussion and Analysis, June 30, 2013
Assets:
Non-capital Assets $ 3,091,193 $ 2,930,951 $ 492,035 $ 542,418 $ 3,583,228 $ 3,473,369
Capital Assets 3,548,331 3,630,903 4,155,114 4,034,852 7,703,445 7,665,755
Total Assets 6,639,524 6,561,854 4,647,149 4,577,270 11,286,673 11,139,124
Liabilities:
Long-Term Liabilities
Outstanding 4,039,786 3,734,563 1,171,349 1,232,755 5,211,135 4,967,318
Other Liabilities 906,117 845,643 292,250 304,045 1,198,367 1,149,688
Total Liabilities 4,945,903 4,580,206 1,463,599 1,536,800 6,409,502 6,117,006
Net Position:
Net Investment in
Capital Assets 1,701,366 1,851,218 3,142,841 2,956,316 4,844,207 4,807,534
Restricted 408,694 519,836 163,539 169,954 572,233 689,790
Unrestricted deficit (416,439) (389,406) (122,830) (85,800) (539,269) (475,206)
Total Net Position * $ 1,693,621 $ 1,981,648 $ 3,183,550 $ 3,040,470 $ 4,877,171 $ 5,022,118
Condensed Financial Information - Primary Government
20132013 2013
Governmental Activities Business-type Activities Total
(Expressed in Thousands)
*The State implemented GASB Statement No. 61 during fiscal 2013. The provisions of GASB Statement No. 61 required the State to reevaluate its component units. The Delaware Agricultural Lands Preservation Foundation which was previously a blended component unit is now considered a discretely presented component unit. Therefore, the State's governmental activities net position as of July 1, 2012 has been restated. Fiscal 2012 amounts for governmental activities reported above have not been restated to reflect this change.
As of June 30, 2013
2012 2012 2012
The capital assets of the governmental activities decreased by $82.6 million (2.3%) since June 30, 2012. The decrease is the result of decreased land easements in the amount of $213.4 million due to a restatement of net position with the implementation of Governmental Accounting Standards Board (GASB) Statement No. 61. The land easements are now recorded by a discretely presented component unit, the Delaware Agricultural Lands Preservation Foundation on page 30. These decreases are offset by increases in construction in progress and other depreciable assets as a result of significant renovations to, and expansions of, existing school buildings across all counties to accommodate the rise in student population.
The increase in governmental activities non-capital assets is due to an increase in cash and investments due to an increase in business and real estate tax revenues along with increases in charges for services. The increase in governmental activities long-term liabilities outstanding of $305.2 million (8.2%) is primarily due to an increase in the other post employment benefits liability and bonds payable. At June 30, 2013, the long-term obligation for OPEB was $1,682.0 million, an increase of $185.5 million (12.4%) from fiscal year 2012. The OPEB obligation will increase each year as the State continues to defer full funding of its annual required contribution. Additional information for the OPEB obligation can be found in Note 14 of the financial statements. In addition, the general obligation long term debt increased by $58.6 million (3.5%) from fiscal year 2012. The State’s debt as a percentage of the State’s personal income was 7.8% in fiscal
8

State of Delaware Management’s Discussion and Analysis, June 30, 2013
year 2012 and 7.3% in fiscal year 2013. The State’s debt burden reflects its centralized role in financing facilities, such as schools and prisons. The following condensed financial information is derived from the government-wide Statement of Activities and reflects the changes in net position during the fiscal year:
2013 2012 2013 2012 2013 2012Revenues: Program Revenues: Charges for Services 559,213$ 421,594$ 1,205,519$ 1,285,907$ 1,764,732$ 1,707,501$ Operating Grants and Contributions 1,551,954 1,541,931 72,517 109,037 1,624,471 1,650,968 Capital Grants and Contributions - - 211,245 199,214 211,245 199,214 General Revenues: Taxes: Personal Income Taxes 1,130,501 1,126,014 - - 1,130,501 1,126,014 Business Taxes 2,051,071 1,834,684 - - 2,051,071 1,834,684 Real Estate Taxes 504,620 473,351 - - 504,620 473,351 Other Taxes 217,880 241,525 - - 217,880 241,525 Investment Income (Loss) 11,636 32,849 (608) 4,029 11,028 36,878 Gain on Sale of Assets - - 1,018 308 1,018 308 Miscellaneous 25,244 24,103 - - 25,244 24,103 Total Revenues 6,052,119 5,696,051 1,489,691 1,598,495 7,541,810 7,294,546
Expenses: General Government 543,931 654,311 - - 543,931 654,311 Health and Children's Services 2,428,629 2,386,475 - - 2,428,629 2,386,475 Judicial and Public Safety 711,361 660,053 - - 711,361 660,053 Natural Resources and Environmental Control 147,733 161,354 - - 147,733 161,354 Labor 69,226 79,706 - - 69,226 79,706 Education 2,408,647 2,372,080 - - 2,408,647 2,372,080 Interest Expense 54,969 61,111 - - 54,969 61,111 Lottery - - 358,467 386,241 358,467 386,241 Transportation/DelDOT - - 580,392 641,850 580,392 641,850 Unemployment - - 169,508 247,932 169,508 247,932 Total Expenses 6,364,496 6,375,090 1,108,367 1,276,023 7,472,863 7,651,113 Increase (Decrease) in Net Position Before Transfers (312,377) (679,039) 381,324 322,472 68,947 (356,567) Transfers 238,244 287,903 (238,244) (287,903) - - Increase (Decrease) in Net Position (74,133) (391,136) 143,080 34,569 68,947 (356,567) Net Position - Beginning of
Year As Restated * 1,767,754 2,372,784 3,040,470 3,005,901 4,808,224 5,378,685
Net Position - End of Year 1,693,621$ 1,981,648$ 3,183,550$ 3,040,470$ 4,877,171$ 5,022,118$
*The State implemented GASB Statement No. 61 during fiscal 2013. The provisions of GASB Statement No. 61 required the State to reevaluate its component units. The Delaware Agricultural Lands Preservation Foundation which was previously a blended component unit is now considered a discretely presented component unit. Therefore, the State's governmental activities net position as of July 1, 2012 has been restated. Fiscal 2012 amounts for governmental activities reported above have not been restated to reflect this change.
Changes in Net Position - Primary GovernmentFor Year End June 30, 2013
Governmental Activities Business-type Activities Total Primary Government
(Expressed in Thousands)
9

State of Delaware Management’s Discussion and Analysis, June 30, 2013
Governmental Activities Since fiscal year 2012, the net position for governmental activities has decreased by $74.1 million. A comparison of the cost of services by function for the State’s governmental activities is shown in the following chart, along with the revenues used to cover the net expenses of the governmental activities. Key elements of the decrease in the State’s net position from governmental activities are as follows: Total general revenues of governmental activities increased overall by $208.4 million (5.6%) relating to increases in business taxes of $216.4 million and real estate taxes of $31.3 million. There was a decrease in investment income of $21.2 million (6.5%). The increases in tax revenues were primarily attributable to overall improvements in the economy and successful tax audits resulting in increased business tax revenue. The decrease in investment income is due to decreased market gains in the current year. Program revenues increased by $147.6 million (7.5%) from the prior year due to an increase in charges for services of $137.6 million (32.6%) resulting from increases in licenses, fees, permits and fines and rentals and sales from the Department of Natural Resources and Environmental Control and the Department of Agriculture. Also, operating grants increased by $10.0 million (0.6%) compared to the prior fiscal year, since Health and Social Services received additional funding of $103.8 million (9.9%) due largely to increased Medicaid funds and Education received $65.5 million (20.5%) less in operating grants due mainly to the end of ARRA funding.
Revenues by Source – Governmental Activities
Expenses for governmental activities decreased during fiscal year 2013 by $10.6 million (0.2%). The decrease in governmental activities is due in part to the decreased spending of $110.4 million (16.9%) for the general government due to organizations identifying alternative funding sources for expenditures. This is offset by increased spending of $42.1 million (1.8%) at Health and Children’s Services as a result of a general increase in the
Charges for Services9.3% Operating and Capital Grants
and Contributions25.7%
Personal Income Taxes18.4%
Business Taxes33.3%
Other Taxes4.7%
Real Estate Taxes8.4%
Investment Earnings.2%
10

State of Delaware Management’s Discussion and Analysis, June 30, 2013
population served and rising health care costs and in educational expenses of $36.5 million (1.5%) due to the continued increase in student population resulting in additional personnel and other operating costs.
Expenses and Program Revenues- Governmental Activities
Business-type Activities The net position for business-type activities increased by $143.1 million (413.6%) in fiscal year 2013. This increase is comprised of a $130.3 million (273.2%) increase in net position for DelDOT plus a $12.8 (197.7%) million increase in the Unemployment Insurance Trust Fund. The increase of $12.8 million in Delaware Unemployment Insurance Trust Fund net position is due to a decreased demand in benefits paid by the Trust Fund. The operating revenues (charges for services and operating grants) and operating expenses decreased by $51.3 million (22.2%) and $78.3 million (31.9%), respectively due to decreases in the benefits paid with improvements in the economy and less individuals unemployed and collecting benefits. Change in net position increased from a decrease of $13.1 million in 2012 to the increase of $12.8 million in 2013. DelDOT’s net position at June 30, 2013 was $130.3 million higher than at June 30, 2012. Change in net position increased from $47.7 million in 2012 to $130.3 million in 2013. DelDOT’s total operating revenues increased by $13.3 million (2.9%) while operating expenses decreased by $58.6 million (9.8%). The change is primarily attributable to an increase in toll revenues and an increase in motor vehicle and related revenues as a result of increased auto sales. The decrease in operating expenditures is primarily due to decreased capital preservation. In addition, capital contributions increased by $12.0 million (6.0%) due to increased federal capital grants. There was no change in the Lottery’s net assets. By law, the Lottery’s net assets cannot exceed $1.0 million. Revenue for the Lottery decreased by $79.0 million (11.1%) over last year mainly due to increased competition from casinos operating in Maryland and
$0
$500,000
$1,000,000
$1,500,000
$2,000,000
$2,500,000
$3,000,000
General Government Health and Children's Services
Judicial and Public Safety
Natural Resources and Environmental Control
Labor Education Interest on Long-Term Debt
(Expressed in Thousands)
Expenses 2013
Expenses 2012
Program Revenues 2013
Program Revenues 2012
11

State of Delaware Management’s Discussion and Analysis, June 30, 2013
Pennsylvania. The Lottery transferred $276.8 million in gaming revenues to the State, a decrease from fiscal year 2012 of $51.3 million (15.6%). The total costs of games and prizes decreased by $27.8 million (7.4%) over the previous year due to the decrease in video lottery activity.
Revenues by Source – Business-type Activities
Financial Analysis of the State’s Funds
As noted earlier, the State uses fund accounting to ensure and demonstrate compliance with finance-related legal requirements. Governmental Funds The focus of the State’s governmental funds is to provide information on near-term inflows, outflows, and balances of available resources. Such information is useful in assessing the State’s financing requirements. Unassigned fund balances may serve as a useful measure of a government’s net resources at the end of the fiscal year.
Charges for Services81.6%
Operating and Capital Grants and Contributions
18.4%
Expenses and Program Revenues – Business-type Activities
$0
$100,000
$200,000
$300,000
$400,000
$500,000
$600,000
$700,000
$800,000
DelDOT Unemployment Lottery
Expenses 2013
Expenses 2012
Program Revenues 2013
Program Revenues 2012
12

State of Delaware Management’s Discussion and Analysis, June 30, 2013
Fund balance classifications comprise a hierarchy based primarily on the extent to which a government is bound to observe constraints imposed upon the use of the resources reported in the governmental funds. This is further described in note 1 and note 16 of the basic financial statements. As of the end of the current fiscal year, the State’s governmental funds reported combined ending fund balances of $1,902.9 million, an increase of $74.1 million over the prior year fund balance as restated. Of this amount, $7.7 million is nonspendable (.4%), either due to its form or legal constraints, $569.7 million (29.9%) is restricted for specific programs by external constraints and $209.5 million (11.0%) is committed for specific purposes pursuant to constraints imposed by a formal action of the Delaware Legislature. An additional $91.6 million (4.8%) has been assigned to specific purposes by management. The remaining $1,024.4 million (53.9%) of fund balance is unassigned. General Fund The General Fund accounts for the operation and administration of the State. Total general fund balance increased by $52.1 million for the fiscal year. Total General Fund revenues increased by $258.4 million (6.7%) due to several factors. The main increases were in personal taxes, which increased by $35.0 million and business taxes, which increased by $239.6 million. This was partially due to increased effort with enforcement efforts and an increase in business profits. These increases were offset by a decrease in investment income of $20.6 million due to decreased market gains. Total General Fund expenditures increased by $96.0 million (2.3%). This was primarily due to increases in Health and Children’s Services of $12.3 million, Department of Natural Resources and Environmental Control of $27.6 million, Public Safety of $58.1 million, Education of $125.3 million and debt services costs of $21.2 million offset by a decrease of expenditures in the General Government of $150.9 million due to organizations identifying alternative funding sources for expenditures. The increase in expenditures for Health and Children’s Services, Public Safety, Education, and Natural Resources and Environmental Control, were attributable to an increase in services and for Health and Children’s Services a decrease in federal coverage for the Medicaid program. At the end of the current fiscal year, unassigned fund balance of the general fund was $1,025.3 million, while total fund balance reached $1,448.5 million. Federal Funds Federal Funds represent pass through grants used for designated purposes. These funds report federal grant revenues and the related expenditures to support the State’s grant programs. Total federal fund expenditures increased by $19.3 million. Expenditures increased for Health and Children’s Service by $82.2 million due largely to increased Medicaid expenditures and
13

State of Delaware Management’s Discussion and Analysis, June 30, 2013
decreased for General Government and Education by $14.3 million and $40.3 million, respectively. The General Government decrease is due to decreased funding for agricultural and energy related programs and the Education decrease is due to decreased funding for Title I and Special Education programs. Local School District Funds These funds are used to account for activities relating to the State’s local school districts, which are funded by locally raised real estate taxes and other revenues. The fund balance decreased by $12.1 million to $294.3 million due to an increase of expenditures to serve the increasing population. Capital Project Funds Capital Project Funds are used to account for the construction and acquisition of capital assets of the primary government. Capital outlay expenditures totaled $226.1 million in fiscal year 2013, an increase of $38.4 million. Proprietary Funds The State’s Proprietary Funds provide the same type of information found in the government-wide financial statements, but in more detail. The Proprietary Fund financial statements provide separate information for the Lottery, Unemployment Insurance Trust Fund and the DelDOT Fund, all of which are considered to be part of the primary government and major funds of the State. Total Proprietary Fund net position increased in fiscal year 2013 by $143.1 million as a result of operations. Page 11 discusses the changes in net position of the business-type activities.
General Fund Budgetary Highlights
The Budgetary General Fund is the chief operating fund of the State. At the end of the fiscal year, total fund balance increased by $71.2 million.
Revenues were $370.5 million (11.0%) more than the previous fiscal year. This was primarily due to increases in the corporate income tax of $68.8 million (57.7%), abandoned property of $252.7 million (84.1%), corporate and partnership fees of $20.3 million (8.1%) and realty transfer tax of $10.7 million (33.7%). The $252.7 million increase in abandoned property was the result of increased enforcement efforts and an audit of transfer agents to ensure inactive accounts are timely reported to the State. Offsetting these revenue increases were decreases in gross receipts tax of $10.8 million (4.7%) bank franchise tax of $8.4 million (7.7%), and insurance tax of $8.0 million (14.2%).
Expenditures were $66.3 million (1.8%) more than the previous fiscal year. Salaries and wages increased by $8.2 million (0.6%) and pension costs increased by $19.1 million (7.5%). Grants-in-Aid increased by $8.7 million (2.4%), contractual services increased by $28.9 million (6.3%) and capital outlays increased by $3.3 million (20.0%).
14

State of Delaware Management’s Discussion and Analysis, June 30, 2013
The original budget authorizes current fiscal year operating and administrative expenditures. Included in the final budget are the original budget, prior year encumbrances, multi-year project budgetary carry-forwards from the prior fiscal years, and all modifications to the original budget. The most significant components are the original budget and carry-forwards of prior fiscal year. The unused appropriations from a prior year will carry forward to the final budget for authorized capital projects and grants until the funds are spent. Where actual expenditures were within the final budget in departments, the significant budget variance was $25.4 million in the Executive Department for funds budgeted, but not spent on ongoing capital improvement projects, technology projects, and contingency items. Business taxes were $35.9 million less than budgeted due in large part to refunds that were in excess of budgeted amounts. Other revenues, which are mainly licenses and fees, were $34.6 million more than budgeted as the budgeted refunds for these revenues were less than expected. Funded projects, which are not completed by year-end, may carry over unspent funds into fiscal year 2014. Unspent funds are reflected in the final budget which may cause variances from original budget.
Capital Assets and Debt Administration
Capital Assets The State’s investment in capital assets for its governmental and business-type activities, as of June 30, 2013, amounted to $7,703.4 million (net of accumulated depreciation). This investment in capital assets includes land, land improvements, buildings, vehicles and equipment, easements, roads, highways, and bridges. The total decrease in capital assets for governmental activities was $82.6 million (2.3%) and the increase for business-type activities was $120.3 million (3.0%). Major capital asset changes during the current fiscal year included the following:
� The decrease in governmental activities is due to the implementation of GASB 61 which decreased easements reported by a newly identified discretely presented component unit that was previously blended, offset by increases for the continued completion of school renovations,
� The increase in business-type activities is due to increased spending at DelDOT for the Turnpike/SR-1 interchange and the US 301 projects.
As allowed by GASB, the State has adopted an alternative process for recording expense related to selected infrastructure assets. Under this alternative method, referred to as the modified approach, the State expenses certain maintenance and preservation costs and does not report depreciation expense. Assets accounted for under the modified approach include 4,378 center line miles of roads and 1,601 bridges that the State is responsible to maintain. DelDOT performs condition assessments of eligible infrastructure assets at least every three years. Currently, road condition assessments are conducted every two years. Historically, road condition assessments were conducted every year. The Department’s assessment plan will
15

State of Delaware Management’s Discussion and Analysis, June 30, 2013
ensure that all infrastructure assets are assessed and evaluated within the three-year period, as required. Due to timing of these conditions assessments, information for the fiscal year ended June 30, 2013 is not available for all assessments. It is the State’s policy to maintain at least 85% of its highways at a fair or better condition level and 75% of its bridge systems at a good or better condition level. No more than 10% of bridges and 15% of roads should be in substandard condition. Of the State’s 1,601 bridges that were rated in fiscal year 2013, 71.9% received a good or better Bridge Condition Rating (BCR) rating, 20.9% were rated fair, and 7.2% received a substandard rating. Of the 7,614,980 square feet of bridge deck that was rated, 91.4% or 6,956,457 square feet received an Overall Pavement Condition (OPC) condition rating of good or better, 8.5% received a fair rating, and 0.1% received a substandard deck rating. In 2011, 4,378 center line miles were rated; 95.8% received a fair or better OPC rating and 4.2% received a poor rating. The fiscal year 2013 estimate to maintain and preserve DelDOT’s infrastructure was $185.4 million, but the actual expenditures were $233.8 million, which is $48.4 million over the estimate. The estimated expenditures represent annual budget or bond bill authorizations and the actual expenditures represent the current year spending, which includes cumulative authorizations. Additional information on the State’s capital assets can be found in Note 1 on pages 46 - 47, Note 12 on pages 86 - 88 and starting on page 120 in the Required Supplementary Information. A summary of the State’s primary government’s capital assets, net of depreciation is provided below:
Land $ 459,587 $ 447,812 $ 283,876 $ 276,761 $ 743,463 $ 724,573
Land Improvements 153,346 155,604 - - 153,346 155,604
Buildings 2,422,593 2,416,856 75,271 73,724 2,497,864 2,490,580
Easements 79,750 291,105 - - 79,750 291,105
Equipment, Vehicles
and Computer Software 73,869 74,743 122,577 117,533 196,446 192,276
Infrastructure - - 3,670,250 3,564,347 3,670,250 3,564,347
Construction-In-Progress 359,186 244,783 3,140 2,487 362,326 247,270
Total $ 3,548,331 $ 3,630,903 $ 4,155,114 $ 4,034,852 $ 7,703,445 $ 7,665,755
State of Delaware Capital Assets as of June 30, 2013Net of Depreciation
(Expressed in Thousands)
20122013
Governmental Activities Business-type Activities
2013 2012
Total
2013 2012
Long-Term Debt The State uses general obligation debt to finance capital projects. At the end of the current fiscal year, the State had total general obligation bond debt outstanding of $1,755.2 million backed by the full faith and credit of the State. The State’s debt burden reflects its centralized role in
16

State of Delaware Management’s Discussion and Analysis, June 30, 2013
financing school construction projects. As of June 30, 2013, $545.7 million, or 31.1%, of the State’s outstanding debt was issued on behalf of local school districts. Local school districts transferred $64.3 million of property tax revenue to the State to cover related debt service during fiscal year 2013. The State has no constitutional debt limits. However, in 1991, the State enacted legislation that limits debt issuance with a three-part test as follows:
� A 5% test restricts new debt authorization to 5% of budgetary general fund revenue as projected by DEFAC in June for the next fiscal year. Should actual revenue collections increase during the year, no additional authorizations are made. For fiscal year 2013, debt issuance was limited to $187.0 million.
� A 15% test restricts debt issuance if the annual payments on all outstanding debt exceed 15% of estimated budgetary general fund and Transportation Trust Fund Revenue for the next fiscal year. Currently, these annual payments represent approximately 8% of estimated general fund and Transportation Trust Fund revenues.
� Finally, a cash balance test restricts debt issuance if the debt service payment in any year exceeds the estimated cumulative cash balance for the following fiscal year. For fiscal year 2013, the projected cash balance exceeded debt service.
Due to the State’s statutory debt limits and its fiscal management, three principal rating agencies, Moody’s Investor’s Service, Fitch Ratings and Standard & Poor’s, reaffirmed their triple-A ratings on the State’s general obligation bonds during fiscal year 2013. On February 28, 2013, the State issued $336.3 million of its general obligation bonds maturing between February 1, 2014 and February 1, 2033. Of the $336.3 million issued as Series 2013, $111.3 million was issued to refund higher priced bonds resulting in a net present value savings of $14.4 million, or 11.7% of the principal refunded. In addition, the Sustainable Energy Utility, Inc. had $56.2 million of Revenue Bonds, Series 2011 outstanding as of June 30, 2013. These bonds were used to support general government initiatives and have been used to finance construction on energy efficient upgrades to facilities in the State. As such, that debt is reflected in the primary government statements as governmental activities. The bonds are secured by appropriations of the state agencies that are participating in the SEU program. Debt issued by the Delaware Transportation Authority does not constitute a debt of the State or a pledge of its general taxing power or of its full faith and credit. Rather, the outstanding revenue bonds are obligations of the Authority payable solely from and secured by a pledge and assignment of certain tolls and revenues such as motor fuel tax revenues, motor vehicle document fees and motor vehicle registrations. The Delaware Transportation Authority has revenue bonds outstanding of $923.8 million to support its ongoing capital transportation program and $99.7 million in Grant Anticipation Vehicle Bonds (GARVEEs), to finance a portion of the costs of completing the final design and right-of-way acquisition for a new U.S. 301.
17

State of Delaware Management’s Discussion and Analysis, June 30, 2013
Additional information on the State of Delaware’s long-term debt can be found in Notes 5, 6 and 7 on pages 69 - 83 of this report.
Financial Management
The State’s financial management continues to be recognized by a premier credit rating from all three principal rating agencies: Aaa from Moody’s Investor’s Service, AAA from Fitch Ratings and AAA from Standard & Poor’s. The ratings reflect Delaware’s financial management practices that have become institutionalized within the State:
� expenditure budgeting of 98% of available budgetary general fund revenue;
� budgetary general fund revenue forecasts that are frequent, objective and often conservative;
� three-part debt affordability test that limits debt authorization to 5% of budgetary general fund; revenue and debt service to 15% of tax supported revenue; and cash balance test;
� consistent satisfaction of the State’s budget reserve requirement – the State’s rainy day fund has never fallen below its mandated 5% of general fund revenue; and
� full funding of its pension plan.
Economic Factors and Next Year’s Budgets and Rates
DEFAC met on June 17, 2013 to prepare the final revenue and expenditure estimates upon which the fiscal year 2014 operating and capital budgets would be based. The most recent employment data for the State of Delaware has indicated improvement in the labor market; therefore, the FY 2014 forecast anticipates small growth. There is an assumption in the forecast that the scheduled expiration of tax cuts in 2014 will occur. The fiscal year 2014 operating and capital budgets meet budgetary spending limitations imposed by law. The fiscal year 2014 operating budget is $3,718.2 million, 5.0% more than fiscal year 2013. The fiscal year 2014 operating budget included $60.9 million in supplemental appropriations (historically in the form of cash allocated to the capital budget), a decrease of 53.7% over the fiscal year 2013 budget.
Requests for Information This financial report is designed to provide a general overview of the State’s finances for all those with an interest in the government’s finances. Questions concerning any of the information provided in this report or requests for additional financial information should be directed to the Department of Finance, Division of Accounting, 820 Silver Lake Boulevard, Suite 200, Silver Lake Plaza, Dover, Delaware 19904 or visit our website at http://accounting.delaware.gov. The State’s component units publish their own separately issued audited financial statements. These statements may be obtained from their respective administrative offices.
18

STATE OF DELAWARESTATEMENT OF NET POSITION
JUNE 30, 2013(Expressed in Thousands)
DiscretelyPresented
Governmental
ASSETSCash and Cash Equivalents (Note 2) 42,200$ 101,122$ 143,322$ 52,741$
Cash and Pooled Investments (Note 2) 1,798,727 6,353 1,805,080 71,115
Receivables, Net (Note 3) 642,990 98,408 741,398 333,448
Interfund Balances (Note 4) (2,201) 2,201 - -
Deferred Bond Issuance Costs 5,796 2,381 8,177 9,544
Inventories 7,681 18,425 26,106 867
Prepaid Items - 4,356 4,356 5,067
Escrow Insurance Deposits - 182 182 -
Investments 158,909 78,455 237,364 724,065
Other Assets - 2,447 2,447 1,019
Restricted Assets:
Cash and Pooled Investments (Note 2) 408,694 - 408,694 51,130
Deposit on Hold with Trustee (Note 6) 28,397 - 28,397 -
Restricted Investments - 177,705 177,705 -
Other Restricted Assets - - - 6,465
Capital Assets: (Note 12)
Non-Depreciable Assets 898,523 3,957,266 4,855,789 286,225
Depreciable Capital Assets, Net 2,649,808 197,848 2,847,656 526,930
Total Capital Assets, Net 3,548,331 4,155,114 7,703,445 813,155
Total Assets 6,639,524 4,647,149 11,286,673 2,068,616
-
DEFERRED OUTFLOWS OF RESOURCESDerivative Instrument - Interest Rate Swap - - - 1,206
Total Deferred Outflow of Resources - - - 1,206
LIABILITIESAccounts Payable 519,586 54,276 573,862 12,243
Accrued Liabilities 81,912 41,280 123,192 21,702
Accrued Interest Payable 30,299 25,220 55,519 -
Unearned Revenues 1,024 - 1,024 3,458
Escrow Deposits - 6,122 6,122 -
Advances From Federal Government 20,062 72,132 92,194 -
Due Within One Year (Note 10) 253,234 93,220 346,454 23,932
Due In More Than One Year (Note 10) 4,039,786 1,171,349 5,211,135 897,404
Total Liabilities 4,945,903 1,463,599 6,409,502 958,739
DEFERRED INFLOWS OF RESOURCESDerivative Instrument - Interest Rate Swap - - - 1,823
Total Deferred Inflow of Resources - - - 1,823
NET POSITIONNet Investment in Capital Assets 1,701,366 3,142,841 4,844,207 592,612
Restricted For:
Debt Service - 163,539 163,539 -
Federal and State Regulations 408,694 - 408,694 313,237
Bond Covenants - - - 53,788
Other Purposes - - - 14,131
Unrestricted (Deficit) (416,439) (122,830) (539,269) 135,492
Total Net Position 1,693,621$ 3,183,550$ 4,877,171$ 1,109,260$
Primary Government
Total UnitsBusiness-type Component
Activities Activities
19
See Accompanying Notes to Basic Financial Statments

STATE OF DELAWARESTATEMENT OF ACTIVITIES
FOR THE FISCAL YEAR ENDED JUNE 30, 2013(Expressed in Thousands)
Net (Expense) Revenues andProgram Revenues Changes in Net Position
Grants and Contributions Primary Government DiscretelyPresented
Charges for Governmental Business-type ComponentFunctions/Programs Expenses Services Operating Capital Activities Activities Total Units
Primary Government:Governmental Activities: General Governmental Services 543,931$ 287,709$ 25,141$ -$ (231,081)$ -$ (231,081)$ -$
Health and Children Services 2,428,629 73,522 1,150,434 - (1,204,673) - (1,204,673) -
Judicial and Public Safety 711,361 126,052 42,198 - (543,111) - (543,111) -
Natural Resources and Environmental Control 147,733 59,262 36,994 - (51,477) - (51,477) -
Labor 69,226 7,103 43,247 - (18,876) - (18,876) -
Education 2,408,647 5,565 253,940 - (2,149,142) - (2,149,142) -
Interest on Long-term Debt 54,969 - - - (54,969) - (54,969) -
Total Governmental Activities 6,364,496 559,213 1,551,954 - (4,253,329) - (4,253,329) -
Business-type Activities:Lottery 358,467 635,264 - - - 276,797 276,797 -
DelDot 580,392 462,609 - 211,245 - 93,462 93,462 -
Unemployment 169,508 107,646 72,517 - - 10,655 10,655 -
Total Business-type Activities 1,108,367 1,205,519 72,517 211,245 - 380,914 380,914 -
Total Primary Government 7,472,863$ 1,764,732$ 1,624,471$ 211,245$ (4,253,329)$ 380,914$ (3,872,415)$ -$
Component Units:Delaware State Housing Authority 105,677$ 49,745$ 79,963$ 878$ - - - 24,909
Diamond State Port Corporation 37,764 36,750 - 12,089 - - - 11,075
Riverfront Development Corporation 10,046 1,668 200 6,124 - - - (2,054)
Delaware State University 123,295 55,802 31,445 7,340 - - - (28,708)
Delaware Charter Schools 117,904 13,216 4,712 3,086 - - - (96,890)
966 - 5,075 3,264 - - - 7,373
Total Component Units 395,652$ 157,181$ 121,395$ 32,781$ - - - (84,295)
General Revenues: Taxes:
Personal Income 1,130,501 - 1,130,501 -
Business 2,051,071 - 2,051,071 -
Real Estate 504,620 - 504,620 -
Other 217,880 - 217,880 -
Unrestricted Payments from Primary Government - - - 141,700
Investment Income (Loss) 11,636 (608) 11,028 (33,750)
Gain on Disposal of Assets - 1,018 1,018 (1,060)
Miscellaneous 25,244 - 25,244 4,750
Transfers In (Out) 238,244 (238,244) - -
Total General Revenues 4,179,196 (237,834) 3,941,362 111,640
Changes in Net Position (74,133) 143,080 68,947 27,345
Net Position - Beginning As Restated (Note 1) 1,767,754 3,040,470 4,808,224 1,081,915
Net Position - Ending 1,693,621$ 3,183,550$ 4,877,171$ 1,109,260$
Delaware Agricultural Lands Preservation Foundation
20
See Accompanying Notes to Basic Financial Statments

STATE OF DELAWAREBALANCE SHEET
GOVERNMENTAL FUNDSJUNE 30, 2013
(Expressed in Thousands)
TotalLocal School Capital Governmental
General Federal Districts Projects Funds
ASSETSCash and Cash Equivalents 27,089$ 2,745$ 12,366$ -$ 42,200$
Cash and Pooled Investments 1,729,807 6,621 297,924 173,069 2,207,421
Deposit on Hold with Trustee 28,397 - - - 28,397
Investments 158,340 - 569 - 158,909
Accounts Receivable, Net 73,891 11,655 171 - 85,717
Taxes Receivable, Net 91,211 - 34,859 - 126,070
Intergovernmental
Receivables, Net - 120,628 - - 120,628
Loans and Notes Receivable, Net 49,004 261,571 - - 310,575
Due from Other Funds 20,922 16,833 - - 37,755
Inventories 7,681 - - - 7,681
Total Assets 2,186,342 420,053 345,889 173,069 3,125,353
LIABILITIES AND FUND BALANCES
LiabilitiesAccounts Payable 380,929 108,344 18,226 12,087 519,586
Accrued Liabilities 81,912 - - - 81,912
Claims and Judgments 1,304 - - - 1,304
Escheat Liability 95,000 - - - 95,000
Due to Other Funds 19,034 20,922 - - 39,956
Unearned Revenues 159,626 291,701 33,387 - 484,714
Total Liabilities 737,805 420,967 51,613 12,087 1,222,472
Fund Balances Nonspendable 7,681 - - - 7,681 Restricted 114,418 - 294,276 160,982 569,676 Committed 209,557 - - - 209,557 Assigned 91,597 - - - 91,597 Unassigned (Deficit) 1,025,284 (914) - - 1,024,370
Total Fund Balances 1,448,537 (914) 294,276 160,982 1,902,881
Total Liabilities and Fund Balances 2,186,342$ 420,053$ 345,889$ 173,069$ 3,125,353$
21
See Accompanying Notes to Basic Financial Statments

STATE OF DELAWARERECONCILIATION OF THE GOVERNMENTAL FUNDS BALANCE SHEET
TO THE STATEMENT OF NET POSITIONJune 30, 2013
(Expressed in Thousands)
Total Fund Balances - Governmental Funds $ 1,902,881
Amounts reported for governmental activities in the statement ofnet position are different because:
Net capital assets used in governmental activities are not financial resources and therefore are not reported in the funds. These assets consist of:
Land 459,587Land Improvements 153,346Buildings 2,422,593Easements 79,750Equipment, Vehicles and Software 73,869Construction-In Progress 359,186
3,548,331
463,628
Interest Payable (30,299) Claims and Judgments (Current and Long-term) (167,214) Compensated Absences (Current and Long-term) (172,747) Other Post Employment Benefits (1,682,008) Pollution Remediation Obligations (Current and Long-term) (27,558) Notes Payable (28,550) Net Pension Obligation (119,088) General Obligation Long-term Debt and Related Accounts (1,991,484) Other Long-term Obligations (2,271)
(4,221,219)
Total Net Position of Governmental Activities $ 1,693,621
Certain revenues are earned, but are not available to pay for the
current period's expenditures and are reported as unearned in the
funds balance sheet.
Certain liabilities net of related assets are not due and payable in the
current period and are not reported in the fund balance sheet. These
liabilities consist of:
22
See Accompanying Notes to Basic Financial Statments

STATE OF DELAWARESTATEMENT OF REVENUES, EXPENDITURES AND CHANGES
IN FUND BALANCES (DEFICITS)GOVERNMENTAL FUNDS
FOR THE FISCAL YEAR ENDED JUNE 30, 2013����������� ��������
TotalLocal School Capital Governmental
General Federal District Fund Projects Funds
Revenues�������� ���� ���������� �� �� �� ������������������ ���� ��������� � � � ���������� ��� ��!�"���� ����##� � ��$�%�� � �������&�'������(�������)� ���(���� �����%% � ��� � ��%��%#!�� �����*���� ������� ��� ����+� � �������,��� � �%�##� ��$+��#+� ���$# � ����+�+��-� ���� ��� ���-�"�� )�� -�'�)� +�$�� �� ���+� � ���%��� ��� �#%�#�� ����� �����+ � ��#���%
Total Revenues $��+����� ��$+%�### �$���#� � %�����$�$
Expenditures.����� /
,������,�"���)�� $$����+ �����% � � $�+�$%�0��� ���.������1�*��"�'�� �������%# �������+# � � ��$����%%2��'�������3��'*�4� 5 %���%$$ $����� � � %%��#%�6� ����!�����'����
��"����)�� ��.�� ��� ������� ����++ � � �������&�3�� �+�+## �#��%% � � %#���$��'� ��� ��$������ ����##% $���+�% � ����+��$�7���� ��' ���5)�� � �
.�)����� 7�� ���'� ��� ��+���� � ���%+� � �$�����
.��� ���� ��5 � � � ��%���� ��%����8�3 ���"�'�/
����'���� �����+% � � � �����+%-� ���� ��� ���.���9�� �����% � � � �����%.�� ��4-�����'��48�3 ����# � � � ����#
Total Expenditures $���$���� ��$+���+� ��%�%�� ��%���� %�����$#�
Excess (Deficiency) of of Revenues Over (Under) Expenditures ��%��+��� %��+% �#�%$# ���%����� �$$���#��
Other Sources (Uses) ofFinancial Resources
����4���-� ����##� �%�#�� ������ � �#+��%+ ����4����� ������$� ��+�%��� ��������� ������+%� ���������-�����'��4,������
�3��9� ������� � � � ��%���� ��%����
!�4����9� �������#� � � � �������#����)��)������*���� � � � $$�%�� $$�%��� ���(����'��9*���'�� � � � �+���$ �+���$
Total Other Sources (Uses) of Financial Resources ����+�� ����#$�� �����%+� ��%�#�� ��%��%�
Net Change in Fund Balances ����%+ ��%��$$� �������� ���%#� �$��#$
���+%�$%# ���%�� ��%��+� ������� ��#�#��+�
Fund Balances (Deficits) - Ending ��$$#����� �+�$�� �+$���%� �%��+#�� ��+���##��
-�����'��4:"��'�
Fund Balances - Beginning as Restated (Note 1)
23
See Accompanying Notes to Basic Financial Statments

STATE OF DELAWARERECONCILIATION OF THE NET CHANGES IN FUND BALANCES -
TOTAL GOVERNMENT FUNDS TO CHANGE IN NET POSITIONOF GOVERNMENTAL ACTIVITIES
FOR THE FISCAL YEAR ENDED JUNE 30, 2013(Expressed in Thousands)
Net Changes in Fund Balances $ 74,084
Amounts reported for governmental activities in the statement of activities are different because:
Governmental funds report capital outlays as expenditures. However, in the statement of activities, the cost of those assets is allocated over their estimated useful lives as depreciation expense. In the current period, these amounts are:
Capital Outlays 242,499 Depreciation Expense (111,701)
130,798
Revenues in the statement of activities that do not provide current financial resources are not reported as revenues in the funds. 26,301
Bond proceeds provide current financial resourcesto governmental funds, but issuing debt increases long-term liabilities in the statement of net position.Repayment of bond principal is an expenditure in the governmental funds, but the repayment reduces long-term liabilities in the statement of net position.Components of the debt related adjustments consist of:
Debt Service Principal Repayments 155,096 Advanced Refunding Payments 132,178 New Debt Issued (Face Value) (336,330) Premium Received (44,635) Issuance costs 1,118 Amortization of Premium/Issuance Costs 15,383
(77,190)
Some expenses reported in the statement of activities do not require the use of current financial resources and therefore, the changes in these liabilities are not reported as expenditures in the governmental funds:
Accrued Interest Expense 2,943 Claims and Judgments (8,795) Compensated Absences (5,868) Other Post Employment Benefits (185,495) Pollution Remediation Obligation 2,228 Pension Obligation (1,091) Notes Payable (29,134) Other Liabilities (2,914)
Change in Net Position in the Statement of Activities $ (74,133)
24
See Accompanying Notes to Basic Financial Statments

STATE OF DELAWARESTATEMENT OF NET POSITION
PROPRIETARY FUNDSJUNE 30, 2013
(Expressed in Thousands)
Unemployment Lottery DelDOT Total
ASSETSCash and Cash Equivalents 22,877$ 1,743$ 76,502$ 101,122$
Cash and Pooled Investments - 1,756 4,597 6,353
Accounts Receivable, Net 17,810 11,070 17,449 46,329
Taxes Receivable, Net 24,484 - - 24,484
Intergovernmental Receivables, Net 1 - 27,058 27,059
Interest Receivable - - 536 536
Inventories - - 18,425 18,425
Prepaid Items - - 4,356 4,356
Escrow Insurance Deposits - - 182 182
Due from Other Funds 1,524 677 - 2,201
Bond Issuance Costs - - 2,381 2,381
Investments:
Unrestricted - - 78,455 78,455
Restricted - 209 177,496 177,705
Other Assets - 2,447 - 2,447
Capital Assets:
Capital Assets, Non-depreciable - - 3,957,266 3,957,266
Capital Assets, Depreciable, Net - - 197,848 197,848
Total Capital Assets, Net - - 4,155,114 4,155,114
Total Assets 66,696 17,902 4,562,551 4,647,149
LIABILITIESAccounts Payable - 7,042 47,234 54,276
Accrued Liabilities 30,564 4,714 6,002 41,280
Escrow Deposits - - 6,122 6,122
Interest Payable 1,524 - 23,696 25,220
Advances from Federal Government 71,539 - 593 72,132
Due Within One Year (Note 10) - - 93,220 93,220
Due in More Than Within One Year (Note 10) - 5,146 1,166,203 1,171,349
Total Liabilities 103,627 16,902 1,343,070 1,463,599
NET POSITION
Net Investment in Capital Assets - - 3,142,841 3,142,841
Restricted for:
Debt Service - - 163,539 163,539
Unrestricted (deficit) (36,931) 1,000 (86,899) (122,830)
Total Net Position (36,931)$ 1,000$ 3,219,481$ 3,183,550$
25
See Accompanying Notes to Basic Financial Statments

STATE OF DELAWARESTATEMENT OF REVENUES, EXPENSES AND CHANGES IN FUND NET POSITION
PROPRIETARY FUNDSFOR THE FISCAL YEAR ENDED JUNE 30, 2013
����������� ��������
Unemployment Lottery DelDOT Total
Operating Revenues:7��)���5)�� �����* � �(��� ����%$%� �� �� ����%$%�,�)��9!�"���� � %����%$ � %����%$���9�!�"�����/
�����;�!�"���� � � �����#+ �����#+<� ��=���'����!��� �!�"���� � � �%��%�+ �%��%�+
�����;�!�"���� � � $%���$ $%���$ ������9��(���� � � �$��#+ �$��#+ <��'��������� � � �%��+# �%��+#
� ������� ��9!�"����� ����%$% %����%$ $%��%�+ ��������+
Operating Expenses:7��)���5)�� ����4� ��* � �(��� ��%���� � � ��%����7��)���5)�� ����4� ��(�����(��� %���+$ � � %���+$ .�� �4*���� � �$%�#$� � �$%�#$����>�� � ++��%$ � ++��%$ ������� � ��� � � $++��#% $++��#%8����'�� ��� � � ������ ������ ,��������:)���� �� �"� � ����%� �%�$�� ���#��
� ������� ��9�������� �%��$�� ����$%� �$���%# ���%%��$�
����� ��9-�'�)��&���� ��+��%�� �����+� ��#���+� ��+�$��
Nonoperating Revenues (Expenses):-�"�� )�� &��� � � �%�#� �%�#� -� ���� ������� ������� � ��+���$� �$������7��)���5)�� �����(�����(��� %���+$ � � %���+$ � ���!�"���� ����� � � ����� .�� ��3� ���� � �����9�3�����9��) � ������� � ������� ,�����8��������4:��� � � � ����# ����#
� ��6������� ��9!�"��������������� ���$�% ������� ��#�#�$� ���%��
-�'�)��&������4��� ����4�����.��� ��.�� ��3� ���� ���%�� ��%��+� ��������� ������+
.��� ��.�� ��3� ���� � � �����$� �����$�
����4���-� ���#+ � $����� $���$%
����4����� � ���%��+�� �%��+�� ��#���+��
-�'�������6� ���� ��� ����$$ � ������% �$���#�
Net Position - Beginning of Year �$+�%��� ����� ���#+��$� ���$��$��
Net Position - End of Year ��%�+���� ������ ����+�$#�� ���#������
26
See Accompanying Notes to Basic Financial Statments

STATE OF DELAWARESTATEMENT OF CASH FLOWS
PROPRIETARY FUNDSFOR THE FISCAL YEAR ENDED JUNE 30, 2013
����������� ��������
Cash Flows from Operating Activities:!�'��� �4��)�)���5��� ����#�#� �� �� ����#�#���5)�� �4��-������'�.���)� ��%+����� � ���#$#� �����##��!�'��� �4��).�� �)�����7���� � %�$���� $�+��## ���+��#+�� �������� ��9!�'��� � � � ��$�� ��$����5)�� � �*��������4��,�����*��"�'�� � �����+#� �������%� �$�����$���5)�� � ��)���5���4��*��"�'�� � ������� ���+���$� �����$$����5)�� �4�����>�� � �++����� � �++�������5)�� 4��.�))������� � �����$+�� � �����$+��
�%������ ��#�%%% �����%�� ��$��$$
Cash Flows from Noncapital Financing Activities::"��'��4��)(�����,�"���)�� ��$$+ � � ��$$+!�'��� �4��)(�����,�"���)�� %����� � � %�����-� ���� �����:"��'�� ����%%� � � ����%%� ����4���-� ����� � $����� $����� ����4����� � ��#���#+� �%��+�� ��#+��#��
%���$� ��#���#+� �%�$%$ ���#��#$�
Cash Flows from Capital and Related Financing Activities:.��� ��,��� � � � �+$�#�� �+$�#�����'������4.��� ��:��� � � � ��$%�%��� ��$%�%�������'���������.��� ��8�3 � � �#��$��� �#��$���-� ���� �����.��� ��8�3 � � �$#����� �$#��������'���4��)*����4&�����?���)�� � � ����% ����%���������'�.�� � � � �#� �#�
� � ���##� ���##�
� � �����#+� �����#+�
Cash Flows from Investing Activities:-� ���� ��-�"�� )�� !�"����� � � ���+� ���+�!���5)�� ��&���!�'��"�3�� � � #�� #����'��@8����� �!�'��"� � � ��� ������'�����4-�"�� )�� � � � ��%+��%�� ��%+��%�����'���4��)*������<� ��� ����4-�"�� )�� � � ��� $%����� $%��#$�
6� .������"��35-�"�� ��9:' �"� ��� � ��� ++�%#� ++�+�%
6� -�'������8�'��������.����.����?��"���� ��������-�"�� )�� � �#$ ���$��� �#��+� ������
Cash, Cash Equivalents and Pooled Investments- Beginning of Year ���$+� %�+�� �����$ #��+$#
Cash, Cash Equivalents and Pooled Investments - End of Year ���#�� ��$++ #���++ ����$��
Reconciliation of Operating Income (Loss) to Net CashProvided (Used) by Operating Activities:
����� ��9-�'�)��&���� ��+��%�� �����+� ��#���+� ��+�$��:A�� )�� � �!�'��'�������� ��9-�'�)��&���� �6� .���
���"���7���35����� ��9:' �"� ���/8����'�� ���������� � � ������ ������8�'������-�'��������:��� �/!�'��"�3����6� ������� ��%�� �+��� ����%��-�"�� ����� � � ��� ���������- �)� � � ����� �����-�'������8�'��������&��3��� ���/:''��� ���� �����5�3��� � � $�� $��:''���&��3��� ��� ���%�#� �+� ����+�� �������:''����������� � �$� ��$�# �����:''�����5������!��� ��������� � ���+� ����%�� ���+%$���� ��)���5)�� ����4� � � � �$�%�� �$�%��8�� �B(��),�"���)�� � � �$���%� �$���$�
�%������� ��#�%%%� �����%��� ��$��$$�
Schedule of Noncash Noncapital Financing Activities (��9�"������4:"��'��4��)(�����,�"���)�� ������ �� �� ������
6� .���7��35.��� ����!��� �(����'��9:' �"� ���
6� .������"���7���356��'��� ��(����'��9:' �"� ���
6� .������"���7���35����� ��9:' �"� ���
6� .������"���7���35����� ��9:' �"� ���
(�����!��)3����)�� �48�3 *��"�'�
DelDOT TotalUnemployment Lottery
27
See Accompanying Notes to Basic Financial Statments

STATE OF DELAWARESTATEMENT OF FIDUCIARY NET POSITION
FIDUCIARY FUNDSJUNE 30, 2013
(Expressed in Thousands)
OPEB Trust Trust AgencyAssets:
Cash and Cash Equivalents 432,315$ 3,899$ 2,521$ 28,694$
Cash and Pooled Investments 687 35,095 - 25,002
Receivables:
Accrued Interest 15,090 - 74 -
Investment Sales Pending 17,193 - 91 -
Employer Contributions 9,438 6,576 - -
Member Contributions 2,655 74 - -
Other Receivables - - - 46,172
Investments, at Fair Value:
Domestic Fixed Income 266,599 76,172 6,065 -
Domestic Equities 1,871,050 75,610 14,543 -
Pooled Equity and Fixed Income 2,860,837 - 15,101 -
Alternative Investments 1,520,018 - 8,065 -
Short Term Investments - - - 2,772
Foreign Fixed Income 145,425 - 770 -
Foreign Equities 953,246 35,831 7,246 -
Total Assets 8,094,553 233,257 54,476 102,640
Liabilities:Accounts Payable - - - 102,640
Investment Purchase Payable 27,908 - 148 -
Benefits/Claims Payable 1,429 11,556 - -
Accrued Investment Expense 4,921 6 26 -
Accrued Administrative Expenses 497 5 - -
Total Liabilities 34,755 11,567 174 102,640
Net Position:Assets Held in Trust for
Benefits and Pool Participants 8,059,798$ 221,690$ 54,302$ -$
Pension TrustInvestment
28
See Accompanying Notes to Basic Financial Statments

STATE OF DELAWARESTATEMENT OF CHANGES IN FIDUCIARY NET POSITION
FIDUCIARY FUNDSFOR THE FISCAL YEAR ENDED JUNE 30, 2013
(Expressed in Thousands)
Additions:Contributions:
Employer Contributions 236,140$ 193,089$ -$
Transfer of Contributions from Post-Retirement Increase Fund 26,585 - -
Transfer of Assets from Outside the System 3,018 14,897 661
Member Contributions 59,798 7,390 -
Other 9 - -
Total Contributions 325,550 215,376 661
Investments:
Investment Earnings 140,245 4,647 1,035
Net Increase in Fair Value of Investments 680,885 11,760 4,339
Total Investment Earnings 821,130 16,407 5,374
Less Investment Manager/Advisor/Custody Fees (21,008) (74) (116)
Less Investment Administrative Expenses (697) - -
Net Investment Earnings 799,425 16,333 5,258
Total Additions 1,124,975 231,709 5,919
Deductions:
Transfer of Assets from Post-Retirement Increase Fund 26,585 - -
Transfer of Assets from Outside the System 1,954 - 630
Pension/Claim Payments 519,075 173,034 -
Refunds of Contributions to Members 4,028 - -
Group Life Payments 5,361 - -
Administrative Expenses 5,930 72 1
Total Deductions 562,933 173,106 631
Change in Net Position 562,042 58,603 5,288
Net Position - Beginning of Year 7,497,756 163,087 49,014
Net Position - End of Year 8,059,798$ 221,690$ 54,302$
InvestmentPension Trust OPEB Trust Trust
29
See Accompanying Notes to Basic Financial Statments

STATE OF DELAWARECOMBINING STATEMENT OF NET POSITION
DISCRETELY PRESENTED COMPONENT UNITSJUNE 30, 2013
(Expressed in Thousands)
Delaware State
Housing Authority
Diamond State Port
Corporation
Riverfront Development Corporation
Delaware State
University
Delaware Charter Schools
Delaware Agricultural
Land Preservation Foundation Total
ASSETSCash and Cash Equivalents 43,870$ 5,582$ 1,191$ 2,098$ -$ -$ 52,741$ Cash and Pooled Investments 10,736 - 28 16,526 35,868 7,957 71,115 Accounts and Other Receivables, Net 51,217 2,923 64 15,338 2,828 - 72,370 Loans and Notes Receivable, Net 258,048 - 2,978 - - 52 261,078 Inventories - 867 - - - - 867 Prepaid Items 3,530 1,237 138 - 162 - 5,067 Deferred Bond Issuance Costs 7,081 - - 1,726 737 - 9,544 Investments 700,970 - - 23,095 - - 724,065 Other Assets 3 - 879 47 90 - 1,019 Restricted Assets: Cash and Cash Equivalents 965 19,890 2,000 22,404 5,871 - 51,130 Other Restricted Assets - - - 6,445 20 - 6,465 Capital Assets: Capital Assets - Non-Depreciable 4,346 26,733 13,664 4,532 23,581 213,369 286,225 Capital Assets - Depreciable, Net 14,139 140,205 99,118 210,733 62,735 - 526,930
Total Capital Assets, Net 18,485 166,938 112,782 215,265 86,316 213,369 813,155
Total Assets 1,094,905 197,437 120,060 302,944 131,892 221,378 2,068,616
-
DEFERRED OUTFLOWS OF RESOURCESDerivative Instrument - Interest Rate Swap - - - - 1,206 - 1,206
Total Deferred Outflow of Resources - - - - 1,206 - 1,206
LIABILITIESAccounts Payable 1,057 149 892 6,047 4,072 26 12,243 Accrued Liabilities 18 7,617 100 4,876 9,085 6 21,702
Unearned Revenue - 39 58 3,280 81 - 3,458 Due Within One Year (Note 10) 14,540 1,324 1,320 4,186 2,555 7 23,932 Due in More Than Within One Year (Note 10) 660,621 25,383 13,214 114,395 83,791 - 897,404
Total Liabilities 676,236 34,512 15,584 132,784 99,584 39 958,739
DEFERRED INFLOWS OF RESOURCESDerivative Instrument - Interest Rate Swap - - - - 1,823 - 1,823
Total Deferred Inflow of Resources - - - - 1,823 - 1,823
Net PositionNet Investment in Capital Assets 18,484 140,231 100,248 114,776 5,504 213,369 592,612 Restricted for:
Federal and State Regulations 304,832 - - 435 - 7,970 313,237 Bond Covenants 53,788 - - - - - 53,788 Other Purposes - - - 14,131 - - 14,131
Unrestricted 41,565 22,694 4,228 40,818 26,187 - 135,492
Total Net Position 418,669$ 162,925$ 104,476$ 170,160$ 31,691$ 221,339$ 1,109,260$
30
See Accompanying Notes to Basic Financial Statments

STATE OF DELAWARECOMBINING STATEMENT OF ACTIVITIES
DISCRETELY PRESENTED COMPONENT UNITSFOR THE FISCAL YEAR ENDED JUNE 30, 2013
(Expressed in Thousands)
Delaware Diamond Delaware State State Riverfront Delaware Delaware Agricultural
Charges for Housing Port Development State Charter Lands Preservation Expenses Services Operating Capital Authority Corporation Corporation University Schools Foundation Total
Components UnitsDelaware State Housing Authority 105,677$ 49,745$ 79,963$ 878$ 24,909$ -$ -$ -$ -$ -$ 24,909$
Diamond State Port Corporation 37,764 36,750 - 12,089 - 11,075 - - - - 11,075
Riverfront Business
Improvement District 10,046 1,668 200 6,124 - - (2,054) - - - (2,054)
Delaware State University 123,295 55,802 31,445 7,340 - - - (28,708) - - (28,708)
Delaware Charter Schools 117,904 13,216 4,712 3,086 - - - - (96,890) - (96,890)
Delaware Agricultural Lands Preservation Foundation 966 - 5,075 3,264 - - - - - 7,373 7,373
395,652$ 157,181$ 121,395$ 32,781$ 24,909 11,075 (2,054) (28,708) (96,890) 7,373 (84,295)
General RevenuesUnrestricted Payments from Primary Government - - - 33,943 107,757 - 141,700
Investment Income (Loss) (31,161) (1,132) 147 (1,762) 157 1 (33,750)
Gain on Disposal of Assets - - (1,060) - - - (1,060)
Miscellaneous - - - 185 4,494 71 4,750
Total General Revenues (31,161) (1,132) (913) 32,366 112,408 72 111,640
Net (Expenses) Revenues andChanges in Net Position
Program IncomeGrants and Contributions
Change in Net Position (6,252) 9,943 (2,967) 3,658 15,518 7,445 27,345
Net Position - Beginning of Year as Restated (Note 1) 424,921 152,982 107,443 166,502 16,173 213,894 1,081,915
Net Position - Ending of Year 418,669$ 162,925$ 104,476$ 170,160$ 31,691$ 221,339$ 1,109,260$
31
See Accompanying Notes to Basic Financial Statments

State of Delaware Notes to the Financial Statements, June 30, 2013
NOTE 1 SUMMARY OF SIGNIFICANT ACCOUNTING POLICIES
The accompanying financial statements of the State of Delaware (the State) have been prepared in conformity with accounting principles generally accepted in the United States (GAAP) as prescribed by the Governmental Accounting Standards Board (GASB). (a) Reporting Entity
The accompanying financial statements present the State’s primary government and include all funds, elected officials, departments and organizations, bureaus, boards, commissions, and authorities that comprise the State’s legal entity. Also included in the State’s primary government are the State’s 16 local school districts and 3 vo-tech schools (collectively referred to as the local school districts). The local school districts have separately elected boards, but they have not been specifically granted power by legislation to be legally separate. Based on the powers and authority granted in Title 14 of the State of Delaware code, the primary government holds sufficient power and responsibility that the local school districts have been accounted for as not being legally separate and as a result have been reported in the primary government. The financial activity of the local school districts is reported in the General Fund, Local School District Fund (for real estate taxes levied by the Schools), Federal Fund, and the Capital Projects Fund.
The DelDOT enterprise fund is also included in the reporting entity of the primary government. DelDOT has the overall responsibility for coordinating and developing transportation polices for the state along with the maintenance and operation of roadways and bridges that fall under its jurisdiction. To assist DelDOT in their mission, the State and DelDOT created the Delaware Transportation Authority (the Authority), which includes the activities of the Transportation Trust Fund (the Trust Fund) and the Delaware Transit Corporation (DTC). The Authority is a body politic and corporate whose actions are overseen by the Secretary of Transportation, the Director of the Office of Financial Management and Budget, and the Administrator of the Trust Fund. The Authority’s principal role is to provide financing to DelDOT and as a result is a blended component unit of DelDOT. Fiduciary funds, although legally separate entities, are in substance part of the State’s operations. The State’s reporting entity also comprises its component units, entities for which the State is considered either financially accountable or the nature and the significance of their relationship with the State is such that exclusion would cause the State’s financial statements to be misleading. Blended component units are reported within the primary government. Discretely presented component units are reported in a separate column in the government-wide financial statements (see note below for description) to emphasize that such are legally separate from the State. The decision to include and how to report a component unit in the State’s reporting entity is based on several criteria, including legal standing, debt responsibility, fiscal dependency, and financial accountability. The State is financially accountable for legally separate organizations if it appoints a voting majority of the organization’s board and (1) it is able to impose its will on that organization or (2) there is a potential for the organization to provide
32

State of Delaware Notes to the Financial Statements, June 30, 2013
specific financial benefits to, or impose specific financial burdens on, the State. The State may also be financially accountable if an organization is fiscally dependent on the State and there is a potential for the organization to provide specific benefits to or impose specific financial burdens on the State, regardless of whether the organization has a separately elected governing board, a governing board appointed by a higher level of government, or a jointly appointed board.
Blended Component Units The Delaware Public Employees’ Retirement System (DPERS) is a public employee retirement system, which covers substantially all State employees. The DPERS is a legally separate entity, which includes its blended component unit, the First State Independence Fund I, LLC, a hedge fund-of-funds which DPERS is considered to be financially accountable. DPERS’ Board is comprised of five members appointed by the Governor and confirmed by the State Senate, plus two ex-officio members. It provides services and benefits almost exclusively to the primary government, and it is considered a blended fiduciary funds component unit and is shown in the financial statements as part of the primary government as a pension trust fund. The financial report of DPERS for the fiscal year ended June 30, 2013 may be obtained in writing to the State Board of Pension Trustees and Office of Pensions, McArdle Building, Suite 1, 860 Silver Lake Boulevard, Dover, Delaware 19904-2402. The Delaware Other Post Employment Benefit Fund Trust (OPEB Trust) is a trust, which provides retirement medical coverage to pensioners and their eligible dependents in the State’s Employees’, Judiciary, New State Police, and Closed State Police Pension Plans. The OPEB Trust is a legally separate entity and by legislative code the Board of DPERS serves as the Board of the OPEB Trust. It provides services and benefits almost exclusively to the primary government. The OPEB Trust is considered a blended fiduciary funds component unit and is shown in the financial statements as part of the primary government as the OPEB Trust Fund. The Delaware Economic Development Authority (DEDA) was established by 29 Del. C. 50, Subchapter IV as a legally separate entity to assist the State in the financing of citizens and activities of exempt persons in order to contribute to the prosperity, health, and general welfare of the citizens of the State by acting as the financing vehicle. DEDA is considered to be a blended component unit due to the board being the same as the primary government and is reported as part of the General Government in the General Fund of the primary government.
The Sustainable Energy Utility, Inc. (SEU) is a legally separate 501(c)(3) nonprofit organization, which was established to reduce energy waste and foster a sustainable energy future for the State. The Governor appoints seven of the eleven members. It provides benefits almost exclusively to the primary government by developing and coordinating programs for the purpose of promoting sustainable use of energy by State departments and agencies. The SEU is considered a blended component unit and is shown as part of the Natural Resources and Environmental Control function in the General Fund of the primary
33

State of Delaware Notes to the Financial Statements, June 30, 2013
government. Discretely Presented Component Units The following component units are entities that are legally separate from the State, but are financially accountable to the State for reporting purposes or whose relationship with the State is such that exclusion would cause the State’s financial statements to be misleading. The component units’ column of the basic financial statements includes the financial data of these entities. Each discretely presented component unit has a June 30, 2013 fiscal year-end. Complete financial statements for each of the discretely presented component units may be obtained from their respective administrative offices.
Delaware State Housing Authority (DSHA) The Delaware State Housing Authority is a public corporation whose Director is appointed by the Governor with the consent of the State Senate and serves at the Governor’s pleasure. The DSHA is governed by the Council on Housing whose eleven members are appointed by the Governor. The DSHA administers the role of providing affordable housing as a key aspect of State policy. The State provides both General Fund appropriations and capital funding to assist DSHA in its mission. Certain transactions of the DSHA require the approval of the primary government. The DSHA is authorized, among other things, to (1) make mortgage, construction and other loans to not-for-profit and limited for-profit housing sponsors; (2) make loans to mortgage lenders, requiring the proceeds thereof to be used for making newly qualified residential mortgage loans; (3) purchase qualified mortgage loans from mortgage lenders; and (4) apply for and receive assistance and subsidies under programs from the federal government and others. Diamond State Port Corporation (DSPC) The Diamond State Port Corporation was organized as a body corporate and politic constituting a public instrumentality of the State. The DSPC is empowered to operate, improve and maintain the Port of Wilmington and related facilities. The Governor appoints eight of the fifteen members of the board of directors, with the advice and consent of the Senate. Certain transactions of the DSPC require the approval of the primary government. Riverfront Development Corporation (RDC) The Riverfront Development Corporation was formed to plan, develop and manage programs and projects intended to foster economic development along the Brandywine and Christina Rivers. The Governor appoints seven of the eighteen board members; however, seven of the remaining eleven directors consist of the Governor and six State officials. Authorization by the State’s Budget Director and Controller General is required before funds of the RDC may be expended, which indicates imposition of will.
34

State of Delaware Notes to the Financial Statements, June 30, 2013
Delaware State University (DSU or the University) Delaware State University is a public institution of higher education. Funding is primarily through State appropriations. State appropriations, without restrictions as to use by the University, are reported in general revenue. Additional funding is derived from tuition, federal grants, private donations and grants. The Board of Trustees is comprised of fifteen members, eight appointed by the Governor of Delaware and seven elected by the Trustees. The President of the University and the Governor of the State of Delaware serve as ex-officio members of the Board. Delaware State University financial data includes its two component units, the Delaware State University Student Housing Foundation and the Delaware State University Foundation, Inc. The State annually appropriates funding for the University, which totaled more than $33 million in fiscal year ending June 30, 2013, which is twenty eight percent of the University’s total revenues.
Delaware Charter Schools The State’s 22 Charter Schools are public schools funded primarily through State appropriations. Additional funding is derived from federal grants passed through from the primary government, private donations and funds received from local school districts on a tax portion per child basis. State funding for the Charter Schools totaled $107.8 million for fiscal year ending June 30, 2013 which represents over eighty percent of the Charter Schools’ total revenues. Each Charter School is a separate legal entity managed by their own separate board of directors and operate independently under a charter granted by the State Department of Education with the approval of the State Board of Education. Charters are granted for an initial period of three years and renewable every five years thereafter. Charter Schools issue their own debt but are dependent on the State for their primary funding. Financial information for Delaware Charter Schools is presented in the aggregate as they are individually immaterial to the State’s basic financial statements. Delaware Agricultural Lands Preservation Foundation (DALPF) The Delaware Agricultural Lands Preservation Foundation was established to provide comprehensive agricultural lands preservation programs to serve the long-term needs of the agriculture community and the citizens of Delaware. State appropriations fund DALPF for their specific programs. DALPF is comprised of twelve trustees and the Governor of the State of Delaware appoints ten of them. DALPF shall continue until its existence is terminated by law, whereby all of its rights, properties and liabilities shall pass to and be assumed by the State.
Related Organizations Organizations in which the State appoints the voting majority of the board but the State is not financially accountable for the organizations are considered related organizations. The Delaware Solid Waste Authority (DSWA) is a legally separate entity and the primary government appoints all seven members of its governing board. The primary government’s accountability for DSWA does not extend beyond making the appointments. The DSWA is
35

State of Delaware Notes to the Financial Statements, June 30, 2013
responsible for implementing solid waste disposal, recycling, and resource recovery systems, facilities and services for the State of Delaware. The financial activities of DSWA are not included in the State’s financial statements.
The Delaware Health Facilities Authority (DHFA) was established by 16 Del. C.92 for the benefit of the people of the State, the increase of their commerce, welfare and prosperity and the improvement of their health and living conditions and provides a measure of assistance and an alternative method to enable facilities to provides structures needed to accomplish this purpose. All of the seven members of the board are appointed by the Governor. The primary government’s accountability for DHFA does not extend beyond making the appointments. The financial activities of DHFA are not included in the State’s financial statements.
Complete financial statements for each of the related organizations may be obtained from their respective administrative offices. Jointly Governed Organization The Delaware River and Bay Authority (DRBA), a body politic, was created with the intention of advancing the economic growth and development of those areas in the State of Delaware and the State of New Jersey, which border the Delaware River and Delaware Bay. DRBA is governed by twelve commissioners: six appointed by the State of Delaware and six appointed by the State of New Jersey. DRBA is autonomous from a day-to-day operations perspective and neither State is obligated for the DRBA’s debt. DRBA is not included in the basic financial statements as the State of Delaware has no ongoing financial interest or financial responsibility. Complete financial statements for the DRBA may be obtained from its administrative office. Other Organization The Governor appoints eight members of the governing board of the University of Delaware (the University). The remaining twenty members are elected separately. Since the primary government’s accountability does not extend beyond State grants to the University and there is a lack of fiscal dependency, the financial activities of the University are not included in the State’s basic financial statements.
Government-Wide and Fund Financial Statements The government-wide financial statements (i.e., the statement of net position and the statement of activities) report information on all of the non-fiduciary activities of the primary government and its component units. For the most part, the effect of interfund activity has been removed from these statements. Governmental activities, which normally are supported by taxes and intergovernmental revenues, are reported separately from business-type activities, which rely to a significant extent on fees and charges for support. Likewise, the primary government is separately presented from certain legally separate component units for which the State is financially accountable.
36

State of Delaware Notes to the Financial Statements, June 30, 2013
The statement of net position measures not just current assets and liabilities, but also long-term assets and liabilities such as capital assets (including infrastructure assets) and general long-term debt. The difference between the State’s assets and its liabilities is its net position. Net position is displayed in three components – net investment in capital assets (capital assets, net of accumulated depreciation and related debt); restricted; and unrestricted. Net position is restricted when constraints are placed that are either externally imposed or are imposed by constitutional provisions or enabling legislation. When both restricted and unrestricted resources are available for use, generally it is the State’s policy to use restricted resources first, then unrestricted resources as they are needed.
The statement of activities demonstrates the degree to which the direct expenses of a given function or segments are offset by program revenues. Direct expenses are those that are clearly identifiable with a specific function or segment. Program revenues include 1) charges to customers or applicants who purchase, use, or directly benefit from goods, services, or privileges provided by a given function or segment and 2) grants and contributions that are restricted to meeting the operational or capital requirements of a particular function or segment. Taxes and other items properly excluded among program revenues are reported as general revenues.
Separate fund financial statements are provided for governmental funds, proprietary funds, and fiduciary funds, even though the latter are excluded from the government-wide financial statements. Major individual governmental funds and major individual proprietary funds are reported in separate columns in the fund financial statements.
(b) Measurement Focus, Basis of Accounting, and Financial Statement Presentation The government-wide financial statements are reported using the economic resources measurement focus and the accrual basis of accounting, as are the proprietary fund and fiduciary fund financial statements. Agency funds reported as part of the fiduciary fund financial statements are custodial in nature and do not present results of operations and, therefore, do not have a measurement focus. Revenues are recorded when earned and expenses are recorded when a liability is incurred, regardless of the timing of related cash flows. Property taxes are recognized as revenues in the year for which they are levied and other taxes are recognized when the transaction occurs. Grants and similar items are recognized as revenue as soon as all eligibility requirements have been met. As a general rule, the effect of interfund activity has been eliminated from the government-wide financial statements. Exceptions to this general rule are charges between the State’s enterprise operations and various other functions of the government. Elimination of these charges would distort the direct costs and program revenues reported for the various functions concerned. Intrafund non-exchange transactions between the primary government and component units are reported as operating or capital grants as appropriate for restricted amounts. Unrestricted amounts are reported as general revenue.
37

State of Delaware Notes to the Financial Statements, June 30, 2013
Governmental fund financial statements are reported using the current financial resources measurement focus and the modified accrual basis of accounting. Revenues are recognized as soon as they are both measurable and available. Revenues are considered to be available when they are collectible within the current period or soon enough thereafter to pay liabilities of the current period. For this purpose, the State considers all revenues to be available if they are collected within 60 days of the end of the current fiscal period. Expenditures generally are recorded when a liability is incurred, as under accrual accounting. However, debt service expenditures, as well as expenditures related to other long term liabilities including compensated absences and claims and judgments, are recorded only when payment is due. Taxes, grants, fees, sales, rents, and interest income associated with the current fiscal period are all considered to be susceptible to accrual and have been recognized as revenues of the current fiscal period to the extent earned and available. All other revenue items are considered to be measurable and available only when cash is received by the State. Revenue related to expenditure driven grants is recognized when the qualifying expenditures have been incurred and all other requirements for recognition have been met.
Governmental Funds The State reports the following major governmental funds: General Fund – The General Fund is the State’s primary operating fund. It accounts for all financial resources obtained and used for those services traditionally provided by a state government, which are not required to be accounted for in other funds. These services include, among others, education, and health and social services. Federal Fund – The Federal Fund accounts for all activities relating to the State’s federal grant programs. Local School District Fund – The Local School District Fund is used to account for aggregate financial activity of the State’s local school districts that is funded by locally-raised real estate taxes, interest, and minor miscellaneous revenue. All other financial activity that is funded from sources, such as federal grant programs, major and minor capital project programs, and subsidized government programs are accounted for in the General Fund, Federal Fund, and Capital Projects Fund. Capital Projects Fund – Transactions related to resources obtained and used for the acquisition or construction of major capital facilities (other than those financed by Proprietary and Fiduciary Funds), are accounted for in the Capital Projects Fund. Such resources are derived principally from proceeds of general obligation bond issues, federal grants, and transfers from the General Fund. Proprietary Funds Proprietary funds are used to account for those activities which are financed and operated in a manner similar to private business enterprises. The costs of providing services to the public
38

State of Delaware Notes to the Financial Statements, June 30, 2013
on a continuing basis are financed by or recovered primarily through user charges. Proprietary funds distinguish operating revenues and expenses from non-operating items. Operating revenues and expenses generally result from providing services and producing and delivering goods in connection with a proprietary fund’s principal ongoing operations. The principal operating revenues of the unemployment fund are charges to employers for taxes against wages. The principal operating revenues of the lottery fund and DelDOT fund are charges to customers for sales and services.
The Lottery fund recognizes revenue from online games on the day of the drawing. Revenue from the sale of instant tickets is recognized when the book has been activated and 85% of the related prizes of an activated book are paid, 90 days from the date of activation, or when the next pack of the same game is activated. Revenue from the video lottery and table games is recognized, net of prizes paid, at the time the public plays the game. Revenue from the sports lottery is also recognized at the time the public plays the game. Operating expenses for proprietary funds include the cost of sales and services, administrative expenses, and depreciation on capital assets. For the unemployment fund, expenses are payments of benefits to recipients. All expenses not meeting this definition are reported as non-operating expenses. The State reports the following major proprietary funds: DelDOT Fund – The DelDOT Fund accounts for the activities relating to the operation of the State’s Department of Transportation, including the Delaware Transportation Trust (Authority), which is comprised of the Transportation Trust Fund and Delaware Transit Corporation. Unemployment Fund – The Unemployment Fund accounts for the activities relating to the State’s Unemployment Insurance Trust Fund. Lottery Fund – The Lottery Fund accounts for the activities relating to the State’s Lottery program. Fiduciary Funds The fiduciary funds account for assets held by the State in a trustee capacity or as an agency for other individuals or organizations. The fiduciary fund statements are reported using the economic resources measurement focus and the accrual basis of accounting. The State reports the following fiduciary funds: Agency Funds – Agency funds are custodial in nature and do not involve measurement of the results of operations. They account for the receipt of various taxes, deposits, deductions, and certain property collected by the State, acting in the capacity of an agent, and for the distribution to other governmental units or designated beneficiaries.
39

State of Delaware Notes to the Financial Statements, June 30, 2013
Pension Trust Funds – The Delaware Public Employees' Retirement System (DPERS) is a public employee retirement system, which covers substantially all State employees. It provides services and benefits almost exclusively to the primary government and it is considered a fiduciary fund and is shown in the financial statements as part of the primary government as a pension trust fund. Pension trust funds account for transactions, assets, liabilities and net position available for plan benefits (Note 15). For pension trust funds, employee contributions are recognized as revenue in the period in which the employee services are performed. Employer contributions are recognized when due and the employer has made a formal commitment to provide the contributions. Benefits and refunds are recognized when due and payable in accordance with the terms of each plan.
Investment Trust Funds – Investment Trust Funds are used to account for external investment pools where a government commingles the monies of more than one legally separate entity and invests, on the participants’ behalf, in an investment portfolio; one or more of the participants is not part of the sponsor’s reporting entity. The Investment Trust Fund accounts for the transactions, assets, liabilities and fund equity for the DPERS’s external investment pool and for the OPEB Fund Investment Trust Fund.
OPEB Trust Fund – The OPEB Trust Fund is a trust administered by DPERS. In addition to
providing pension benefits, the State is statutorily required to provide health insurance
coverage and survivor benefits for retired employees and their survivors. Substantially all of
the State’s employees may become eligible for these benefits if they reach normal retirement
age while working for the State. Health care benefits are provided through plans whose
premiums are based on the benefits paid during the year. The cost of providing post-
retirement benefits is shared between the State and the retired employee.
New Accounting Pronouncements
During fiscal year ending June 30, 2013, the state adopted GASB Statement No. 61, The Financial Reporting Entity: Omnibus and amendment GASB Statements No. 14 and No. 34. The objective of this Statement is to improve financial reporting for a governmental financial reporting entity and to better meet user needs and to address reporting entity issues that have arisen since the issuance of Statements No. 14 and No. 34.
This Statement modifies certain requirements for inclusion of component units in the financial reporting entity. For organizations that previously were required to be included as component units by meeting the fiscal dependency criterion, a financial benefit or burden relationship also would need to be present between the primary government and that organization for it to be included in the reporting entity as a component unit. Further, for organizations that do not meet the financial accountability criteria for inclusion as component units but that, nevertheless, should be included because the primary government's management determines that it would be misleading to exclude them, this Statement clarifies the manner in which that determination should be made and the types of relationships that generally should be considered in making the determination. This Statement also amends the criteria for reporting component units as if they were part of the primary government (that is, blending) in certain circumstances. This Statement also clarifies the reporting of equity
40

State of Delaware Notes to the Financial Statements, June 30, 2013
interests in legally separate organizations and amends certain note disclosure requirements. The adoption of Statement No. 61 in 2013 resulted in the State decreasing net position of the governmental activities as of June 30, 2012 in the amount of $213.9 million for the change of DAPLF from blended with the governmental activities to a discretely presented component unit and a related $525 thousand decrease in the General Fund balance as of June 30, 2012 on the Governmental Funds Balance Sheet as follows:
During fiscal year ending June 30, 2013 the State adopted GASB Statement No. 63 Financial Reporting of Deferred Outflows of Resources, Deferred Inflows of Resources, and Net Position. This Statement provides financial reporting guidance for deferred outflows of resources and deferred inflows of resources. GASB Concepts Statement No. 4, Elements of Financial Statements, introduced and defined those elements as a consumption of net assets by the government that is applicable to a future reporting period, and an acquisition of net assets by the government that is applicable to a future reporting period, respectively. GASB Concepts Statement No. 4 also identifies net position as the residual of all other elements presented in a statement of financial position. Statement No. 63 amends the net asset reporting requirements in Statement No. 34, Basic Financial Statements—and Management's Discussion and Analysis—for State and Local Governments, and other pronouncements by incorporating deferred outflows of resources and deferred inflows of resources into the definitions of the required components of the residual measure and by renaming that measure
Local School CapitalGeneral Federal District Projects Total
Net Position as previously reported at June 30, 2012 1,396,993$ 15,630$ 306,397$ 110,302$ 1,829,322$
Restatement for GASB 61 Adjustment (525) - - - (525)
Net Position as restated at July 1, 2012 1,396,468$ 15,630$ 306,397$ 110,302$ 1,828,797$
Governmental Funds Balance Sheet(Expressed in Thousands)
Discretely Presented
Governmental Business-Type Component Activities Activities Total Units
Net Position as previously reported at June 30, 2012 1,981,648$ 3,040,470$ 5,022,118$ 828,792$
Apply GASB 61:
DAPLF (213,894) - (213,894) 213,894
1,767,754 3,040,470 4,808,224 1,042,686
Other:
DSHA (Note 21) - - - 58,931
Other - - - (19,702)
Net Position as restated at July 1, 2012 1,767,754$ 3,040,470$ 4,808,224$ 1,081,915$
Government Wide Statement of Net Position(Expressed in Thousands)
41

State of Delaware Notes to the Financial Statements, June 30, 2013
as net position, rather than net assets. The adoption of Statement No. 63 resulted only in the State renaming net assets to net position. Impact of Future Accounting Pronouncements In 2012, the GASB issued No. 65 Items Previously Reported as Assets and Liabilities. This Statement establishes accounting and financial reporting standards that reclassify, as deferred outflows of resources or deferred inflows of resources, certain items that were previously reported as assets and liabilities and recognizes, as outflows of resources or inflows of resources, certain items that were previously reported as assets and liabilities. GASB Concepts Statement No. 4, Elements of Financial Statements, introduced and defined the elements included in financial statements, including deferred outflows of resources and deferred inflows of resources. Statement No. 65 amends the financial statement element classification of certain items previously reported as assets and liabilities to be consistent with the definitions in GASB Concepts Statement No. 4. This Statement also provides other financial reporting guidance related to the impact of the financial statement elements deferred outflows of resources and deferred inflows of resources, such as changes in the determination of the major fund calculations and limiting the use of the term deferred in financial statement presentations. The provisions of this Statement are effective for financial statements for periods beginning after December 15, 2012. Earlier application is encouraged. The State is currently evaluating the future impact of this statement. In 2012, the GASB issued No. 66 Technical Corrections—2012— an amendment of GASB Statements No. 10 and No. 62. The objective of this Statement is to improve accounting and financial reporting for a governmental financial reporting entity by resolving conflicting guidance that resulted from the issuance of two pronouncements, Statements No. 54 Fund Balance Reporting and Governmental Fund Type Definitions, and No. 62 Codification of Accounting and Financial Reporting Guidance Contained in Pre-November 30, 1989 FASB and AICPA Pronouncements. This Statement amends Statement No. 10 Accounting and Financial Reporting for Risk Financing and Related Insurance Issues, by removing the provision that limits fund-based reporting of an entity's risk financing activities to the general fund and the internal service fund type. This Statement also amends Statement No. 62 by modifying the specific guidance on accounting for (1) operating lease payments that vary from a straight-line basis, (2) the difference between the initial investment (purchase price) and the principal amount of a purchased loan or group of loans, and (3) servicing fees related to mortgage loans that are sold when the stated service fee rate differs significantly from a current (normal) servicing fee rate. The provisions of this Statement are effective for periods beginning after December 15, 2012. The State is currently evaluating the future impact of this statement. In June of 2012, the GASB issued No. 67 Financial Reporting for Pension Plans—an amendment of GASB Statement No. 25. The objective of this Statement is to improve financial reporting by state and local governmental pension plans. This Statement results from a comprehensive review of the effectiveness of existing standards of accounting and financial reporting for pensions with regard to providing decision-useful information, supporting assessments of accountability and inter-period equity, and creating additional
42

State of Delaware Notes to the Financial Statements, June 30, 2013
transparency. This Statement will replace the requirements of Statements No. 25 Financial Reporting for Defined Benefit Pension Plans and Note Disclosures for Defined Contribution Plans, and No. 50 Pension Disclosures, as they relate to pension plans that are administered through trusts or equivalent arrangements (hereafter jointly referred to as trusts) that meet certain criteria. The requirements of Statements No. 25 and 50 remain applicable to pension plans that are not administered through trusts covered by the scope of this Statement and to defined contribution plans that provide postemployment benefits other than pensions. This Statement and Statement No. 68 establish a definition of a pension plan that reflects the primary activities associated with the pension arrangement—determining pensions, accumulating and managing assets dedicated for pensions, and paying benefits to plan members as they come due. The provisions of this Statement are effective for fiscal years beginning after June 15, 2013. The State is currently evaluating the future impact of this statement. In June of 2012, the GASB issued No. 68 Accounting and Financial Reporting for Pensions – An Amendment to GASB Statement No. 27. The primary objective of this Statement is to improve accounting and financial reporting by state and local governments for pensions. It also improves information provided by state and local governmental employers about financial support for pensions that is provided by other entities. This Statement results from a comprehensive review of the effectiveness of existing standards of accounting and financial reporting for pensions with regard to providing decision-useful information, supporting assessments of accountability and inter-period equity, and creating additional transparency. This Statement and Statement No. 67 establish a definition of a pension plan that reflects the primary activities associated with the pension arrangement — determining pensions, accumulating and managing assets dedicated for pensions, and paying benefits to plan members as they come due. In addition, this Statement details the recognition and disclosure requirements for employers with liabilities (payables) to a defined benefit pension plan and for employers whose employees are provided with defined contribution pensions. This Statement also addresses circumstances in which a non-employer entity has a legal requirement to make contributions directly to a pension plan. This Statement is effective for fiscal years beginning after June 15, 2014. This will result in the liability being included on the statement of net position. In 2013, the GASB issued No. 69 Government Combinations and Disposals of Government Operations. This Statement establishes accounting and financial reporting standards related to government combinations and disposals of government operations. As used in this Statement, the term government combinations includes a variety of transactions referred to as mergers, acquisitions, and transfers of operations. The requirements of this Statement are effective for government combinations and disposals of government operations occurring in financial reporting periods beginning after December 15, 2013, and should be applied on a prospective basis. Earlier application is encouraged. The State is currently evaluating the future impact of this statement. In 2013, the GASB issued No. 70 Accounting and Reporting for Non-exchange Financial Guarantees. Some governments extend financial guarantees for the obligations of another government, a not-for-profit organization, a private entity, or individual without directly
43

State of Delaware Notes to the Financial Statements, June 30, 2013
receiving equal or approximately equal value in exchange (a non-exchange transaction). As a part of this non-exchange financial guarantee, a government commits to indemnify the holder of the obligation if the entity or individual that issued the obligation does not fulfill its payment requirements. Also, some governments issue obligations that are guaranteed by other entities in a non-exchange transaction. The objective of this Statement is to improve accounting and financial reporting by state and local governments that extend and receive non-exchange financial guarantees. The provisions of this Statement are effective for reporting periods beginning after June 15, 2013. Earlier application is encouraged. Except for disclosures related to cumulative amounts paid or received in relation to a non-exchange financial guarantee, the provisions of this Statement are required to be applied retroactively. Disclosures related to cumulative amounts paid or received in relation to a non-exchange financial guarantee may be applied prospectively. The State is currently evaluating the future impact of this statement.
(c) Assets, Liabilities, and Net Assets or Equity
Cash Equivalents, Cash and Pooled Investments, and Investments Cash equivalents consists of demand deposits, short-term money market securities, and other deposits held by financial institutions, generally with original maturities of three months or less.
Cash and Pooled Investments consist of cash equivalents, commercial paper, certificates of deposit, short-term (12 to 18 months) and long-term investments, which comprise corporate, municipal and U.S. government obligations, held and managed by the State Treasurer.
Investment securities are stated at quoted market prices, except that investment securities with a remaining maturity at time of purchase of one year or less are stated at cost or amortized cost. All of the investment assets of the Pension and Investment Trust Funds, with the exception of the Closed State Police Pension Plan (which is a pay-as-you-go plan) and the Delaware Volunteer Fireman’s Fund (which is a length of service award plan), are pooled and invested in a common Master Trust. Investments are presented at fair value. Fair values for fixed income and equity securities are determined by quoted market prices based on national exchanges when available. Pooled investments are funds wherein the System owns units or shares of commingled equity, bond, and cash funds. Pooled investments are redeemable with the underlying funds at net asset values under the original terms of the partnership agreements and/or subscription agreements. Alternative investments include nontraditional investments, some of which may be illiquid, such as limited partnerships, venture capital funds, or private LLCs. DPERS or management generally uses net asset value as reported by investment managers as a practical expedient to fair value for its investments in pooled and alternative investment funds. Net asset values provided by pooled and alternative investment managers are based on quoted prices for the funds’ underlying securities (most of which are marketable), as well as estimates, appraisals, assumptions, and methods that are established by valuation
44

State of Delaware Notes to the Financial Statements, June 30, 2013
committees and reviewed by DPERS or management. Net asset value may differ from fair value, and under some circumstances, DPERS or management may determine, based on other information available, that an underlying investment’s reported valuation does not represent fair value. These net asset values are review by DPERS or management and its investment advisor; both management and the custodian receive periodic and audited annual financial reports from the alternative fund managers. Receivables and Payables Activities between funds that are representative of lending/borrowing arrangements outstanding at the end of the fiscal year are referred to as “due to/from other funds” (i.e., the current portion of interfund loans). All trade and property tax receivables, including those for the component units, are shown net of an allowance for uncollectibles and refunds. Inventories and Prepaid Items All inventories are valued at cost using the first-in/first-out (FIFO) method. Inventories of governmental funds are recorded as expenditures when consumed, rather than when purchased. Certain payments to vendors reflect costs applicable to future accounting periods and are recorded as prepaid items in both government-wide and fund financial statements. Restricted Assets When both restricted and unrestricted resources are available for use, it is the State’s policy to use restricted resources first, and then unrestricted resources as needed. In the government-wide financial statements, restricted net assets represent balances that are subject to external restrictions or were created by enabling legislation. The State has the following restricted assets:
� The Delaware Transportation Authority restricts revenue bond proceeds that are accounted for in the Transportation Fund.
� The governmental activities have funds that are required to be restricted as disclosed in Note 16.
The discretely presented component units have the following restricted assets:
� Diamond State Port Corporation has restricted investments for capital project outlays.
� Delaware State University has restricted assets for capital project outlays, grants, and college endowment funds.
� Charter schools have restricted assets to cover debt service payments, capital improvements and donor imposed restrictions.
� Delaware State Housing Authority has restricted assets used for the specific purpose of housing development fund activities per enabling legislation.
45

State of Delaware Notes to the Financial Statements, June 30, 2013
Capital Assets Capital assets, which include property, plant, equipment, and infrastructure assets (which are normally immovable and of value only to the State, such as roads, bridges, sidewalks, and similar items), are reported in the applicable governmental or business-type activities columns in the government-wide financial statements, the proprietary funds and discretely presented component units. Capital assets are defined by the State as assets with estimated useful lives in excess of one year at the date of acquisition. Such assets are recorded at historical cost if purchased or constructed, or estimated historical cost if the original cost is not determinable. Donated capital assets are recorded at estimated fair market value at the date of donation. All land and buildings are capitalized, regardless of cost. Equipment and vehicles are capitalized when the cost of individual items exceeds $25,000. Building and land improvements are capitalized when the cost of the project exceeds $100,000. Infrastructure and software are capitalized when the costs of individual items or projects exceed $1.0 million. The costs of normal maintenance and repairs that do not add to the value of the asset or materially extend assets lives are not capitalized, but rather expenses as incurred. The State possesses certain capital assets that have not been capitalized and depreciated, because the assets cannot be reasonably valued and/or the assets have inexhaustible useful lives. These assets include works of art and historical treasures, such as statues, monuments, historical documents, paintings, forts, miscellaneous State capitol-related artifacts and furnishings. These assets are held for public exhibition, education or research in the furtherance of public service rather than for financial gain; they are protected, kept unencumbered, cared for and preserved; and they are subject to an organizational policy that requires the proceeds from sales of collection items to be used to acquire other items for collections. Major outlays for capital assets and improvements are capitalized as projects are constructed. Interest incurred during the construction phase of capital assets of business-type activities is included as part of the capitalized value of the assets constructed. Property, plant, equipment, and software of the primary government and component units is depreciated using the straight line method over the following estimated useful lives:
Primary ComponentGovernment Unit
Asset Years Years
Buildings and Building Improvements 10 - 40 15 - 75
Land Improvements 20 N/A
Furniture and Equipment 3 - 12 3 - 40
Vehicles 7 N/A
Software 5 N/A
46

State of Delaware Notes to the Financial Statements, June 30, 2013
The State has elected to use the modified approach to account for certain infrastructure assets. Under this process, the State does not record depreciation expense nor are amounts capitalized in connection with improvements to these assets, unless the improvements expand the capacity or efficiency of an asset. Utilization of this approach requires the State to: 1) commit to maintaining and preserving affected assets at or above a condition level established by the State, 2) maintain an inventory of the assets and perform periodic condition assessments to ensure that the condition level is being maintained, and 3) make annual estimates of the amounts that must be expended to maintain and preserve assets at the predetermined condition levels. Roads and bridges maintained by the Department of Transportation are accounted for using the modified approach.
Advances from Federal Government During the fiscal year ended June 30, 2013, the amount of unemployment insurance taxes collected by the Division of Unemployment Insurance from Delaware employers was not sufficient to cover the amount of benefits paid to Delaware residents. As a result, the unemployment fund received advances from the federal government to be used for benefit payments. Pursuant to Subchapter XII – Advances to State Unemployment Funds, 42 U.S.C. §1321, advances are made to the unemployment fund once all funds in the trust have been extinguished, and amounts borrowed must be no more than the aggregate amount necessary to provide benefit payments in any three-month period, as certified by the Federal Secretary of Labor. These advances must be repaid when funds become available in the Unemployment Fund. Interest accrues daily, and the interest rate varies, based upon the outstanding balance of the loan. Interest is due annually on September 30 and is to be paid using appropriations from the State General Fund. Total accrued interest was $1.5 million as of June 30, 2013 and a corresponding receivable due from the State General Fund has been accrued accordingly. The outstanding advance balance totaled $71.5 million as of June 30, 2013. For the year ended June 30, 2013, $20.1 million was received in advance largely for Health and Human Services and Education programs and is recorded in the Federal Fund. Compensated Absences It is the State’s policy to permit employees to accumulate earned, but unused vacation and sick pay benefits. In the governmental fund financial statements, liabilities for compensated absences are accrued when they are considered “due and payable” and recorded in the fund only for separations or transfers that occur before year-end. In the government-wide and proprietary fund financial statements, the State has accrued a liability for compensated absences, recognizing the obligation to make future payments.
Long-Term Obligations In the government-wide financial statements and proprietary fund financial statements, long-term debt and other long-term obligations are reported as liabilities in the applicable governmental activities, business-type activities, or proprietary fund statement of net assets.
47

State of Delaware Notes to the Financial Statements, June 30, 2013
Bond premiums and discounts, as well as issuance costs, are deferred and amortized over the life of the bonds using the effective interest method. Bond issuance costs are reported as deferred charges and amortized over the term of the related debt. In the fund financial statements, governmental funds recognize bond premiums and discounts, as well as bond issuance costs, during the current period. The face amount of debt issued is reported as other financing sources. Premiums received on debt issuances are reported as other financing sources while discounts on debt issuances are reported as other financing uses. Issuance costs, whether or not withheld from the actual debt proceeds received, are reported as expenditures. Fund Equity In governmental fund types, fund equity is called “fund balance.” Fund balances are reported as nonspendable, restricted, committed, assigned, or unassigned as described in note 16. The State Constitution provides that certain excess unencumbered budgetary general funds at the end of a fiscal year must be placed in a reserve account (the Budgetary Reserve Account). This account, designed to mitigate the operational impact of any future unanticipated deficits may not exceed 5% of the estimated general fund revenue for the ensuing fiscal year. Total funding of the budgetary reserve account was $198.9 million at June 30, 2013. When resources meeting more than one of the classifications (excluding nonspendable) are commingled in an account, assuming that expenditure meets the constraints of the classification, the assumed order of spending is restricted first, committed second, assigned third and finally unassigned. In proprietary funds, fund equity is called net position. Net position is comprised of three components: net investment in capital assets; restricted; and unrestricted.
(d) Grants Federal grants and assistance awards made on the basis of entitlement periods are recorded as intergovernmental receivables when entitlement occurs. All other federal reimbursement type grants are recorded as accounts receivable when the related expenditures or expenses are recognized. Related revenue is recorded subject to availability in the governmental funds. Amounts not collected within 60 days of fiscal year-end are recorded as deferred revenue in the governmental funds.
(e) Litigation Revenue
In 1997, several states began litigation against defendant tobacco product manufacturers to recover certain amounts the states expended to provide health care to the users of tobacco products. In 1998, a settlement was reached which provided that the states cease litigation against the manufacturers. As part of the Master Settlement Agreement, certain manufacturers agreed to remit periodic payments to the states until 2025. The State’s share of the estimated $200 billion settlement amounted to $774.5 million. Amounts to be remitted
48

State of Delaware Notes to the Financial Statements, June 30, 2013
are calculated based on a variety of specific settlement provisions. Future tobacco product sales are one key factor used in determining periodic payment amounts. A receivable of $13.5 million has been recorded pursuant to the settlement. The Master Settlement agreement receipts of $26.3 million are recorded in the general fund as part of other revenue and as miscellaneous general revenue on the government-wide statement of activities. Expenditures of monies received under the Master Settlement Agreement are authorized by legislation and are dedicated to health care and related programs.
(f) Management Estimates The preparation of the basic financial statements in conformity with accounting principles generally accepted in the United States of America requires management to make estimates and assumptions that affect the reported amounts of assets and liabilities and disclosure of contingent assets and liabilities at the date of the basic financial statements. Estimates also affect the reported amounts of revenues and expenditures during the reporting period. Actual results could differ from those estimates.
NOTE 2 CASH, INVESTMENTS AND RESTRICTED ASSETS Cash Management Policy and Investment Guidelines The State Treasurer maintains the majority of the deposits and investments of the primary government and uses professional money managers to invest the State's deposits according to guidelines set in the Statement of Objectives and Guidelines for the Investment of State of Delaware Funds (the Policy) by the State’s Cash Management Policy Board (the Board). The Board, created by State law, establishes policies for, and the terms, conditions, and other matters relating to, the investment of all money belonging to the State except money in DPERS, the OPEB Trust and money held under the State deferred compensation program. By law, all deposits and investments belonging to the State are under the control of the State Treasurer in various pooled investment funds (State Investment Pool) except for those that, by specific authority, are under the control of other agencies or component units, as determined by the Board. The deposit and investment policies of those entities may differ from those of the State Treasurer. Typically, these agencies follow the deposit and investment policies of the State Treasurer in an effort to minimize deposit and investment risks. As mandated by State statutes, the State’s funds shall be invested pursuant to the prudent person standard as defined in the Policy. The prudent person standard allows the Board to establish investment policies based on investment criteria that it defines, and it allows the Board to delegate investment authority to investment professionals. This standard of care not only permits, but also encourages diversifying investments across various asset classes. The objectives and guidelines, as outlined in the Policy, apply to all cash and special purpose funds for which the State is financially accountable. These funds are categorized as outlined below:
� Cash Accounts. Cash accounts divide the State's available cash into three parts:
49

State of Delaware Notes to the Financial Statements, June 30, 2013
� Collection and Disbursement Accounts: The State maintains an amount of cash in its general collection and disbursement accounts sufficient to meet its outstanding obligations.
� Cash and Liquidity Accounts: The majority of the State's cash balance available for investment is maintained in the cash and liquidity accounts. These accounts are managed and invested by investment managers, selected by the Board through competitive bid, in order to maximize the return to the State while, at the same time, providing for safety of principal and sufficient liquidity for the State to meet its cash needs. The State manages its short-term investments to ensure sufficient liquidity and prevent their premature sale for the purpose of covering expenditures. Short-term investments should mature at face value in sufficient amounts to meet any needs.
� Reserve Cash (Intermediate) Account: To the extent cash is not expected to be needed on short notice, the Board directs the funding of a third part. This account is managed and invested by an investment manager or managers, selected by the Board after a competitive bid, in order to maximize the return on said money to the State while providing for the safety of principal. The State manages its intermediate investments to ensure such investments are made under circumstances and in amounts in which the State would not be forced to liquidate them at a loss.
� Special Purpose Accounts. There are two primary types of special purpose accounts:
� Endowment Accounts: Endowment accounts consist of funds set-aside for specified purposes.
� Authority Accounts: The State's Authorities (state agencies, local school districts and component units) maintain a variety of fund types, including various operating funds, bond funds and debt service reserve funds.
The Policy specifies the types of investments these managers can make; the maximum percentage of assets that may be invested in particular instruments; the minimum credit quality of these investments; and the maximum length of time the assets can be invested. The Policy provides, among other things, that no more than 10% of the entire portfolio may be invested in obligations of any one issuer other than the U.S. Government. The following investments are permissible for all funds under the review of the Board, subject to percentage limitations of the account:
� U.S. government securities
� Government agency securities
� Certificates of deposit, time deposits, and bankers acceptances
� Corporate debt instruments
� Repurchase agreements
� Reverse repurchase agreements
� Money market funds
� Canadian treasury bills
� Canadian agency securities
50

State of Delaware Notes to the Financial Statements, June 30, 2013
� Mortgage-backed and asset-backed securities
� Municipal obligations Additional permissible investments for special-purpose accounts only:
� Guaranteed investment contracts
� Asset-backed securities and trust certificates
The primary government’s accounts are categorized as “authority accounts”. At June 30, 2013, investments of the primary government were primarily in commercial paper, corporate obligations, government agency bonds and notes, and municipal obligations. All of these meet the objectives defined by the Policy. The State’s Cash Management Policy Board Statement of Objectives and Guidelines for the Investment of State of Delaware Funds is available by request through the Office of the State Treasurer. Risks The following deposits and investments disclosure of the primary government excludes the OPEB Trust and DPERS, including the Investment Trust, which are described on pages 57 - 61. Custodial Credit Risk Deposits For deposits, custodial credit risk is the risk that, in the event of the failure of a depository financial institution, the deposits or collateral securities may not be recovered from an outside party. All State deposits are required by law to be collateralized by direct obligations of, or obligations, which are guaranteed by, the United States of America, or other suitable obligations as determined by the Board, unless the Board shall find such collateralization not in the best interest of the State. The Board has determined that certificates of deposit and time deposits must be collateralized, unless the bank issuing the certificate has assets of not less than $5 billion and is rated not lower than "B" by Fitch, Inc. Bank Watch. The Board has also determined that State demand deposits need not be collateralized, provided that any bank that holds these funds has had for the last two years a return on average assets of 0.5% or greater and an average equity-capital ratio of at least 1:20. If the bank does not meet the above criteria, collateral must consist of one or more of the following:
� U.S. Government securities;
� U.S. Government agency securities;
� Federal Home Loan Board letters of credit;
� State of Delaware securities; or
� Securities of a political subdivision of the State with a Moody's Investors Service rating of "A" or better.
At June 30, 2013, the carrying amount of the primary government’s deposits was $517.5 million
51
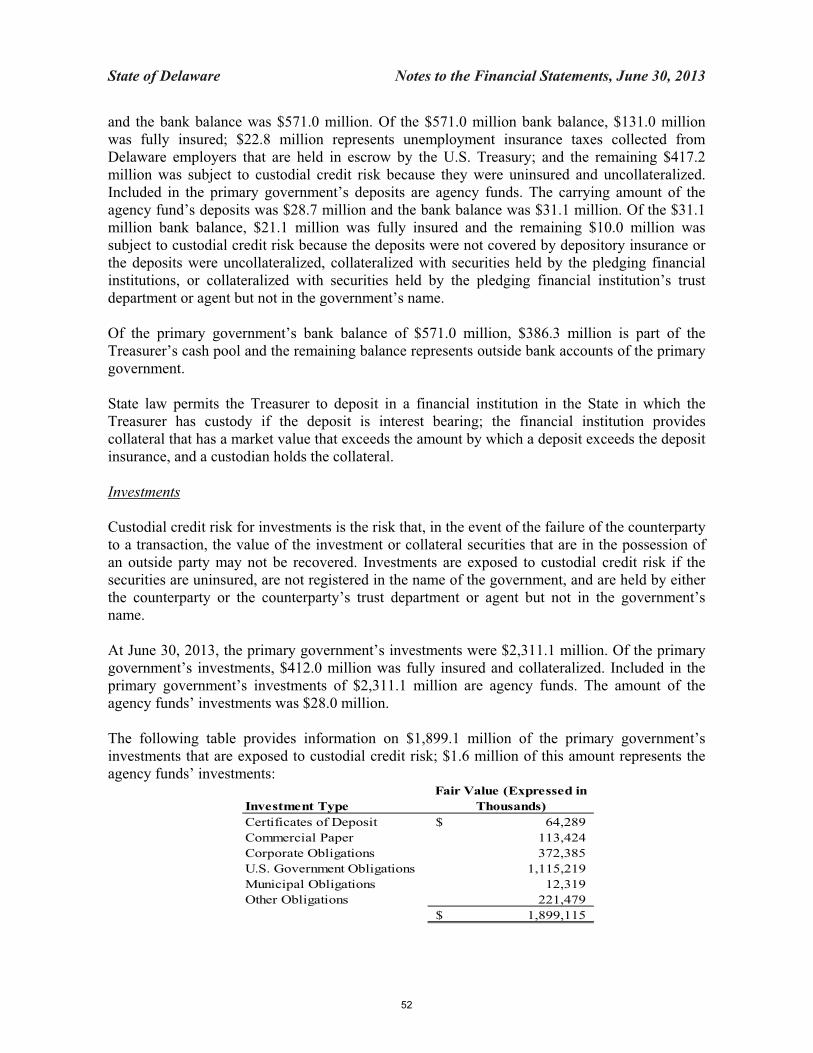
State of Delaware Notes to the Financial Statements, June 30, 2013
and the bank balance was $571.0 million. Of the $571.0 million bank balance, $131.0 million was fully insured; $22.8 million represents unemployment insurance taxes collected from Delaware employers that are held in escrow by the U.S. Treasury; and the remaining $417.2 million was subject to custodial credit risk because they were uninsured and uncollateralized. Included in the primary government’s deposits are agency funds. The carrying amount of the agency fund’s deposits was $28.7 million and the bank balance was $31.1 million. Of the $31.1 million bank balance, $21.1 million was fully insured and the remaining $10.0 million was subject to custodial credit risk because the deposits were not covered by depository insurance or the deposits were uncollateralized, collateralized with securities held by the pledging financial institutions, or collateralized with securities held by the pledging financial institution’s trust department or agent but not in the government’s name. Of the primary government’s bank balance of $571.0 million, $386.3 million is part of the Treasurer’s cash pool and the remaining balance represents outside bank accounts of the primary government. State law permits the Treasurer to deposit in a financial institution in the State in which the Treasurer has custody if the deposit is interest bearing; the financial institution provides collateral that has a market value that exceeds the amount by which a deposit exceeds the deposit insurance, and a custodian holds the collateral. Investments Custodial credit risk for investments is the risk that, in the event of the failure of the counterparty to a transaction, the value of the investment or collateral securities that are in the possession of an outside party may not be recovered. Investments are exposed to custodial credit risk if the securities are uninsured, are not registered in the name of the government, and are held by either the counterparty or the counterparty’s trust department or agent but not in the government’s name. At June 30, 2013, the primary government’s investments were $2,311.1 million. Of the primary government’s investments, $412.0 million was fully insured and collateralized. Included in the primary government’s investments of $2,311.1 million are agency funds. The amount of the agency funds’ investments was $28.0 million. The following table provides information on $1,899.1 million of the primary government’s investments that are exposed to custodial credit risk; $1.6 million of this amount represents the agency funds’ investments:
Investment TypeFair Value (Expressed in
Thousands)Certificates of Deposit 64,289$
Commercial Paper 113,424
Corporate Obligations 372,385
U.S. Government Obligations 1,115,219
Municipal Obligations 12,319
Other Obligations 221,479
1,899,115$
52

State of Delaware Notes to the Financial Statements, June 30, 2013
Interest Rate Risk
Interest rate risk is the risk that changes in interest rates will adversely affect the fair value of an investment. Also, the terms of a debt investment may cause its fair value to be highly sensitive to interest rate changes. The State manages interest rates using the segmented time distribution and effective duration methods. The State approves and contracts with different investment managers of fixed income securities in order to manage the exposure to interest rate risk with each different manager focusing on different goals of yield periods or duration of maturities of their particular portion of the investment pool. The Policy provides either maturity or duration limitations for the various investment pools. The interest rate risk inherent in the portfolio is monitored by measuring the weighted average maturity and/or duration. Effective duration measures the expected change in value of a fixed income security for a given change in interest rate. This method takes into account the likely timing and amounts of variable cash flows for bonds with call options and prepayment provisions. The following table presents the fair value and effective duration of the primary government and agency fund investments by investment type at June 30, 2013:
Investment Type Treasurer's Pool
Outside Treasurer's
Pool
Total Investments (Expressed in
Thousands)
Effective Duration (In
Years) Corporate Obligations 372,385$ -$ 372,385$ 1.61
Municipal Obligations 12,319 - 12,319 5.58
U.S. Government Obligations 1,114,561 172,945 1,287,506 1.96
Other Obligations 216,385 159,723 376,108 2.07
Commercial Paper 113,324 83,791 197,115 0.32
Certificates of Deposit 64,288 1,382 65,670 0.44
1,893,262$ 417,841$ 2,311,103$
Although the Policy does not limit total portfolio maturities, it provides maximum maturity restrictions for each of the investment account types as described below:
� Cash Account Investment. The maximum maturity for any investment at the time of purchase for the cash account is one year.
� Liquidity Accounts. The maximum maturity for any investment at the time of purchase for the liquidity accounts is two years.
� Reserve Cash (Intermediate) Account. The maximum maturity for any investment at the time of purchase is 10 years. The maximum average maturity of the portfolio is seven years.
� Endowment Accounts. The maximum maturity for any investment at the time of purchase is 10 years. The maximum average maturity of the portfolio is seven years. The Board shall consider tailoring maturity restrictions to meet specific purposes for endowment accounts to be established in the future.
� Authority Operating, Bond and Debt Service Reserve Fund Accounts. Maturity
53

State of Delaware Notes to the Financial Statements, June 30, 2013
Restrictions: The maximum maturity for any investment at the time of purchase is 10 years, except when prudent to match a specific investment instrument with a known specific future liability, in which case the maturity limitation shall match the maturity of the corresponding liability.
As of June 30, 2013, the primary government and agency funds had the following debt investments and maturities:
Fair Value Less Than 1 1 to 5 6 to 10 More than 10Long Term InvestmentsCorporate Obligations
Corporate Bonds 332,389$ 150,327$ 177,460$ 4,602$ -$
Asset-Backed Securities 39,996 3,881 36,115 - -
Municipal Obligations 12,319 401 11,303 - 615
U.S. Government Obligations
U.S. Treasury Bonds, Notes 499,630 658 488,559 10,413 -
U.S. Agency Bonds, Notes 253,901 - 185,944 44,249 23,708
Non US Gov't Obligations 25,651 2,752 20,085 2,814 -
Other Obligations
Private Placements 215,340 81,771 133,415 154 -
Pooled Investments 160,768 160,768 - - - Short Term InvestmentsCommercial Paper 197,115 196,621 494 - -
Certificate of Deposit 65,670 65,670 - - -
U.S. Government Obligations
U.S. Treasury Bonds, Notes 325,072 290,281 9,932 24,859 -
U.S. Agency Bonds, Notes 183,252 135,415 22,029 23,950 1,858
Total Investments 2,311,103$ 1,088,545$ 1,085,336$ 111,041$ 26,181$
Investment Maturities
Investment Maturity(Expressed in Thousands)
Credit Risk Credit risk of investments is the risk that an issuer or other counterparty to an investment will not fulfill its obligations. The Policy requires that the State’s investments in asset-backed securities be rated AAA by a major rating agency. Corporate debt instruments must be rated by Standard and Poor’s Ratings Services (S & P) and/or Moody’s Investor Service (Moody’s) and/or Fitch Ratings (Fitch) as follows:
Investment S & P Moody's FitchCommercial Paper A-1 P-1 F1
Senior Long-Term Debt A A A
Corporate Bonds AA Aa AA
Additionally, the State has multiple non-rated/pooled accounts which represent immaterial amounts when treated individually. The Board permits the types of investments which are held in these accounts.
54

State of Delaware Notes to the Financial Statements, June 30, 2013
The following table presents the State’s investments which were rated by S & P as of June 30, 2013 the ratings are presented using S & P’s rating scale:
Investment Type TOTAL AAA AA A A-1 NRLong Term InvestmentsCorporate Obligations
Corporate Bonds 332,389$ 24,033$ 215,623$ 92,733$ -$ -$ Asset-Backed Securities 39,996 23,357 - - - 16,639
Municipal Obligations 12,319 - 11,392 753 - 174 U.S. Government Obligations
U.S. Treasury Bonds, Notes 499,630 - 499,630 - - - U.S. Agency Bonds, Notes 253,901 - 253,901 - - -
Other Obligations 25,651 2,752 15,788 5,746 - 1,365 Private Placements 215,340 29,470 112,477 4,514 - 68,879 Pooled Investments 160,768 - - - - 160,768
Short Term InvestmentsCertificate of Deposit 65,670 - 4,339 30,277 - 31,054 Commercial Paper 197,115 - - - 185,157 11,958 U.S. Government Obligations
U.S. Treasury Bonds, Notes 325,072 - 325,072 - - - U.S. Agency Bonds, Notes 183,252 - 183,252 - - -
Total Investments 2,311,103$ 79,612$ 1,621,474$ 134,023$ 185,157$ 290,837$
NR = Non-Rated Pooled accounts
Credit Risk - Quality Ratings(Expressed in Thousands)
Concentration of Credit Risk Concentration of credit risk is the risk of loss attributed to the magnitude of the State’s investments in a single issuer (5% or more of total investments). When investments are concentrated in one issuer, this concentration represents heightened risk of potential loss. No specific percentage identifies when concentration risk is present. The investments in obligations explicitly guaranteed by the U.S. government, mutual funds, and other pooled investments are exempt from disclosure. The Policy provides the following percentage of account limitations, valued at market. Investments due to mature in one business day may be excluded from the computation of said limitations.
A. U.S. Government - no restrictions. B. Government agency - 50% total; 20% in any one agency.
C. Certificates of deposits, time deposits and bankers acceptances - 50% total; 5% in any one issuer. 1. Domestic - No additional restrictions. 2. Non-domestic - 25%, 5% in any one issuer.
55

State of Delaware Notes to the Financial Statements, June 30, 2013
3. Delaware domiciled – Not more than the lesser of $10 million or 25% of an issuer’s total equity capital may be invested in any one issuer. (Investments due to mature in one business day may be excluded from the computation of this percentage.)
D. Corporate debt - 50% total; 25% in any one industry; 5% in any one issuer, 5% of any issuer's total outstanding securities.
1. Domestic - No additional restrictions. 2. Non-Domestic - 25%; 5% in any one issuer.
E. Repurchase agreements - 50% total. F. Reverse repurchase agreements - 25% total.
G. Money market funds - 25% total; 10% in any one fund except for the Cash Account,
which may invest 100% of the Account in the Delaware Local Government Investment Pool (DELGIP) Fund. The Investment Guidelines for the DELGIP Fund are defined in Appendix B of the Policy.
H. Canadian treasuries - 25% total; 10% in any one agency.
I. Canadian agency securities - 25% total; 10% in any one agency. J. Mortgage-backed and asset-backed securities – 10% total (when combined with asset-
backed securities and trust certificates if applicable). K. Municipal obligations - 5% in any one issuer.
L. Guaranteed investment contracts - Permitted where it is prudent to match a specific
investment instrument with a known specific future liability, subject to credit quality guidelines for commercial paper and corporate bonds and debentures and with adequate exit provisions in the event of the future downgrade of the issuer.
M. Asset-backed securities and trust certificates – 10% total (when combined with
mortgage-backed and asset-backed securities if applicable). At June 30, 2013, the State’s investments have met the requirement of all the State’s laws and policies, when applicable. There were no obligations that represented 5% or more of the primary government’s investments, except for U.S. government securities, pooled and mutual funds. Foreign Currency Risk Foreign currency risk is the risk that changes in the foreign exchange rate will adversely impact the fair value of an investment or deposit. The Policy only permits investments denominated in U.S. dollars; therefore, the State’s
56

State of Delaware Notes to the Financial Statements, June 30, 2013
investments are not exposed to foreign currency risk. Commitments At June 30, 2013, the State did not enter into any commitment agreements with any investment managers for future funding of various asset classes. OPEB Trust Fund (OPEB Trust) Investment Policy The State Board of Pension Trustees is responsible for the management and investment of the funds in the OPEB Trust. The Board authorized its Investment Committee to select the investment managers of the OPEB Trust following the established investment guidelines for the Delaware Public Employees’ Retirement System (DPERS) until a separate investment policy is adopted for the OPEB Trust. The System follows the prudent person standard, which requires fiduciaries to discharge their duties solely in the interests of participants and their beneficiaries with such care, skill, prudence, and diligence as a person acting in like circumstances would exercise in the conduct of an enterprise with similar character and with similar aims. The OPEB Trust investment objectives and policies currently include indexed exposure to approximate the System’s policy benchmark. The Investment Committee regularly reviews the OPEB investment performance, and considers investment vehicles which strike a balance between risk and return while being mindful of the government’s time horizon for the OPEB investments. Of the OPEB Trust’s investment balance of $187.6 million, all is invested in three mutual funds and are not in individual investments registered in the Trust’s name. For the fixed income type of mutual fund, the investments in maturities is in government agencies and hold a maturity of six to ten years at a fair market value of $76.2 million with a AA credit rating. The foreign equities type of mutual fund represents $35.8 million of balance of the trust. These are denominated in US Dollars and are invested in no individual country but an international region. The other $75.6 million is in an equity index fund.
Delaware Public Employees’ Retirement System (DPERS or System) Investment Policy There are no State statutes limiting allowable investments for the System. The investment decisions are dictated by the prudent person rule and the internal investment guidelines established by the Board as outlined below:
� Allocate a minimum of 20% of assets to fixed income investments such as bonds, cash equivalents, and certain real estate investments
� Maintain a widely diversified portfolio, to minimize the risk of overexposure in any one market segment or investment style
� Monitor the performance of all investment managers using specific benchmarks
� Control exposure in illiquid asset classes
� Review, re-examine, and reconfirm the operation of results of the investment process regularly
57

State of Delaware Notes to the Financial Statements, June 30, 2013
� Identify new long-term opportunities for risk reduction and improved investment returns
� Review actuarial assumptions to ensure consistency with capital market expectations
For the fiscal year ended June 30, 2013, management of the System has operated in accordance with these policies, in all material respects. Securities Lending The System entered into a contract with its custodian to allow participation in its securities lending program. The objective of securities lending is to earn income through a conservatively operated and well-controlled program. The System elected not to participate in the program during fiscal years 2013 and 2012, but may elect to participate at some time in the future. Investments The following is a listing of fixed income investments and cash equivalents and related maturity schedule which shows the System’s exposure to interest rate risk as of June 30, 2013. It is the System’s policy to classify corporate convertible bonds as equity securities because those securities generally convert to preferred equity interests upon maturity. Corporate convertible bonds in the amount of $671.6 million have been included in the chart below because they have maturity dates and are exposed to interest rate risk.
Fair LessInvestment Type/Sector Value than 1 1 - 6 6 - 10 10 +
Asset Backed Securities $ 375 $ - $ 26 $ 349 $ - Cash Equivalents 340,320 340,320 - - - Commercial Mortgage-Backed 1,466 - - - 1,466 Corporate Bonds 306,795 10,764 100,413 65,292 130,326 Corporate Convertible Bonds 671,596 22,814 485,465 66,226 97,091 Government Agencies 21,535 5,438 16,097 - - Government Bonds 68,104 - 41,453 3,111 23,540 Municipal/Provincial Bonds 15,935 - 11,481 - 4,454 Pooled Investments 1,338,938 - 369,015 969,923 -
Total $ 2,765,064 $ 379,336 $ 1,023,950 $ 1,104,901 $ 256,877
Investment Maturities (in Years)Delaware Public Employees' Retirement System (DPERS or System)
(Expressed in Thousands)
Interest Rate Risk The State has delegated an investment policy for the System to the Board and its Committees. The Investment Committee sets its own guidelines in conjunction with the Board to manage and review the System’s exposure to fluctuating interest rates. Interest rate risk is a consideration when establishing and reviewing investment manager guidelines and asset allocation. Both topics are included in the Statement of Investment Policies and Objectives which is published on the System’s website.
58

State of Delaware Notes to the Financial Statements, June 30, 2013
Credit Risk The System’s general investment policy is to apply the prudent-person rule to all risks incurred by the fund: Investments are made as a prudent person would be expected to act, with discretion and intelligence, to seek reasonable income, preserve capital and, in general, avoid speculative investments. The System has no investment policy that would further limit its investment choices related to credit risk. As of June 30, 2013, the System’s fixed income investments and cash equivalents had the following credit risk characteristics as indicated in the following schedule (expressed in thousands):
Moody’s Ratings Percent of Market or Comparable Total Fund Value
AAA to A 17.9% $ 1,450,682 BBB to B 10.5% 850,709 CCC to C 0.5% 37,726 Agency of the Federal Government 0.1% 6,014 Not Rated 5.2% 419,933
Total 34.2% $ 2,765,064
Custodial Credit Risk
For deposits, custodial credit risk is the risk that, in the event of the failure of a depository financial institution, the deposits or collateral securities may not be recovered from an outside party. At June 30, 2013, the $435.3 million carrying amount of the System’s cash and cash equivalents was comprised of $417.1 million of short-term investments and $18.2 million in deposits. Of the $18.2 million in deposits, $17.5 million was subject to custodial credit risk because it was uninsured and uncollaterized. The remaining $687 thousand was held as pooled deposits by the State Treasurer’s Office. Investment Concentration Risk As of June 30, 2013, the System held no concentration of investments in an individual issuer in excess of 5% of the fair value of the System’s net assets. Management Fees The System paid $27.4 million in management fees to the venture alternative investment funds and partnerships for the fiscal year ended June 30, 2013. These fees are netted against investment income. Management fees charged at the underlying fund level for the investments held by the First State Independence Fund I, LLC ranged from 1% to 2% of net assets, plus a performance fee of 20% on positive investment earnings, which were netted against earnings. Investment Commitments The System has commitments to invest up to an additional $779.2 million in venture capital limited partnerships in varying amounts as of June 30, 2013, to be drawn down, as called upon at any time during the term of each partnership, which is usually a ten-year period. Generally, these
59

State of Delaware Notes to the Financial Statements, June 30, 2013
commitments are self-funding, in that the capital calls are met using cash flows generated by the existing venture capital/limited partnerships as managers in this asset class realize the proceeds of their investments. Foreign Investments Foreign investments include equity securities, bonds, cash, and cash equivalents. The following is a listing of the System’s foreign assets as of June 30, 2013. The listing includes $6.5 million of investments of domestic issuers which have been classified as domestic, but are denominated in a foreign currency.
Fair Value in Fixed Cash and CashCurrency U.S. Dollars Equities Income Equivalents
Australian Dollar $ 35,151 $ 21,626 $ 13,373 $ 152
Brazilian Real 16,408 9,870 6,538 -
British Pound Sterling 75,748 74,198 886 664
Canadian Dollar 41,854 20,510 21,066 278
Danish Krone 9,975 9,975 - -
Euro 273,543 235,207 22,247 16,089
Hong Kong Dollar 71,867 71,816 - 51
Indonesian Rupiah 19,421 11,936 7,485 -
Japanese Yen 99,730 99,516 - 214
Mexican Peso 3,746 - 3,746 -
New Zealand Dollar 18,118 - 18,118 -
Norwegian Krone 15,111 1,365 13,746 -
Philippine Peso 17,839 17,839 - -
Singapore Dollar 21,070 17,105 3,964 1
South African Rand 3,479 3,479 - -
South Korean Won 5,891 5,891 - -
Swedish Krona 23,504 23,504 - -
Swiss Franc 39,762 39,717 - 45
Thai Baht 10,248 10,248 - -
Turkish Lira 10,963 10,951 - 12
Malaysian Ringgit 7,710 7,710 - -
Nigerian Naira 2,419 2,419 - -
United Arab Emirates Dirham 1,751 1,751 - -
Total Foreign Currencies $ 825,308 $ 696,633 $ 111,169 $ 17,506
Foreign Issued InvestmentsDenominated in U.S. Dollars 303,220 261,672 41,548 - Pooled International InvestmentsDenominated in U.S. Dollars 251,426 251,426 - -
Total $ 1,379,954 $ 1,209,731 $ 152,717 $ 17,506
Investment Types(Expressed in Thousands)
Derivatives Derivatives are instruments (securities or contracts) whose value is dependent on such things as stock or bond prices, interest rate levels, or currency exchange rates. In June 1994, the Board adopted a formal written policy on the use of derivatives which is reviewed periodically and policy, as amended, was incorporated in the formalized investment policy adopted by the Board. This was during fiscal year 2007 and reviewed during fiscal year 2008. Some selected managers are permitted to use derivatives. In every case, the types of derivatives used and limits on their use are stated in the manager’s contract and are monitored on an ongoing basis. Derivatives serve a variety of useful purposes for the System, including the reduction of foreign exchange risk, the minimization of transaction costs and as a means of implementing value added strategies to enhance returns. If the use of derivatives in a portfolio strategy results in some leverage, that leverage is never permitted to expose the Fund to a loss greater than the amount committed to that strategy.
60

State of Delaware Notes to the Financial Statements, June 30, 2013
The following lists principal categories of derivatives and their uses during the year:
Category Purpose
Foreign exchange forward contracts Hedge currency risk of investments denominated
in foreign currencies; enhance return
Exchange traded futures contracts Reduce transaction costs; hedge equity market
risk; control fixed income; counterbalance
portfolio duration; enhance return
Exchange traded options contracts Enhance return; reduce transaction costs
Total return equity swaps Hedge equity market risk exposure
Generally, derivatives are subject both to market risk and counterparty risk. The derivatives utilized by the System typically have no greater risk than their physical counterparts, and in many cases are offset by exposures elsewhere in the portfolio (for example, a short S&P 500 futures contract partially hedging a long position in S&P 500 securities). Counterparty risk, the risk that the “other party” to a contract will default, is managed by utilization of exchange traded futures and options where practical (in which case the futures exchange is the counterparty and guarantees performance) and by careful screening of counterparties where use of exchange traded products is impractical or uneconomical. Derivative securities are priced and accounted for at their fair value. For exchange traded securities such as futures and options, closing prices from the securities exchanges are used. Foreign exchange contracts are valued at the price at which the transaction could be settled by offset in the forward markets. The Investment Committee monitors the System’s derivative holdings on a regular basis to ensure that the derivatives used by managers of the System will not have a material adverse impact on its financial condition. Total derivative instruments at June 30, 2013 were not material to the system. Risk and Uncertainty The System invests in various investment securities. Investment securities are exposed to various risks such as interest rate, market, and credit risks. Due to the level of risk inherent in investment securities, it is possible that changes in the values of investment securities will occur in the near term and that such change could affect the amounts reported. Discretely Presented Component Units Diamond State Port Corporation (DSPC) At June 30, 2013, the carrying value and the bank balances of the DSPC’s deposits were $5.6 million and $5.7 million, respectively. Of the bank balances, $250 thousand is insured by the Federal Deposit Insurance Corporation (FDIC). The remaining amount is not collateralized by the banks as the banks meet the criteria set by the State under the collateralization requirements.
61

State of Delaware Notes to the Financial Statements, June 30, 2013
DSPC’s assets restricted for capital improvements were $19.9 million at June 30, 2013. These assets are invested in a mutual funds account with a Moody’s rating of Aaa. Delaware State University (DSU) At June 30, 2013, the carrying value and bank balances of DSU’s deposits were $18.6 million and $20.6 million, respectively. An additional $16.5 million of cash and cash equivalents related to unexpended State appropriations are held by the Office of the State Treasurer. There was no portion of the University’s investment portfolio, excluding U. S. Government guaranteed obligations, which exceed 5% of the portfolio and there was no portion of the University portfolio that was invested in below investment grade securities. The University’s $8.0 million in fixed income investments was not rated as of June 30, 2013 using the Standard and Poor’s rating scale. DSU’s investments at quoted market value were $16.9 million at June 30, 2013. In addition, DSU’s two discretely presented component units’ investments at quoted market value were $18.5 million at June 30, 2013. Delaware State Housing Authority (DSHA) As of June 30, 2013, the carrying value and the bank balances of DSHA’s deposits were $44.8 million and $46.1 million, respectively, all of which are insured by the FDIC. Investment Policies DSHA has an investment policy that encompasses all moneys related to the issuance of bonds, as well as all funds otherwise held by DSHA. DSHA seeks first and foremost to ensure safety of principal, and secondly, to attain the highest possible return available given the risk constraints. DSHA is allowed to invest in certain qualified investments as defined by amended Subchapter II, Section 4013, Chapter 40, Title 31, of the Delaware Code and DSHA’s formal investment policy. Subject to certain limitations, such as the credit ratings on bonds and the capitalization level of depositories, “qualified investments” include:
a. Obligations of or explicitly guaranteed by the U.S. or Delaware state governments. b. Obligations of U.S. government-sponsored enterprises and U.S. government agencies
and instrumentalities. c. Obligations of depositories and other financial institutions. d. Bankers’ acceptances. e. Commercial paper. f. Money market mutual funds. g. Corporate debt obligations. h. The State of Delaware investment pool with the State Treasurer’s Office. i. Other investment arrangements made pursuant to an investment agreement authorized
by a resolution of DSHA. Certain federal funds administered by DSHA are subject to additional limitations within the
62

State of Delaware Notes to the Financial Statements, June 30, 2013
qualified investments listed above. For those investments in the State of Delaware Investment Pool, the fair value of the pool shares is the same as the carrying value of the pool shares. The State of Delaware Cash Management Policy Board provides oversight for this pool. Securitized mortgage loans consist of Federal National Mortgage Association (FNMA), Government National Mortgage Association (GNMA), and Federal Home Loan Mortgage Corporation (FHLMC) mortgage backed securities, which were pooled and securitized by a contract servicer utilizing Single Family Mortgage Program loans purchased by DSHA. Investments Investments are presented at fair value. Fair values are determined by quoted market prices based on national exchange prices for all investments, except for the State of Delaware Investment Pool. The State pool is valued based on the pool’s share price. The table below lists the investments and the related maturities:
Interest Rate Risk As a means of limiting its exposure to fair value losses arising from rising interest rates, the DSHA’s investment policy places limits on maturities for the various funds as follows:
a. Single Family Program Funds: Investment contracts for bond program funds should have a maturity that matches the final bond maturity to minimize reinvestment risk. Individual investments of bond program funds should match anticipated cash requirements or
Investment LessType Fair Value than 1 1 - 5 5 - 10 10 - 20 20 - 30
U.S. Treasury Notes $ 11,627 $ 3,350 $ 8,125 $ - $ 208 $ - US Treasury Strips 548 360 8 - 259 - U.S. Treasury Bonds 26 - - - 19 - U.S. Agencies 20,278 6,510 13,275 - - 378 Commercial Paper 5,398 5,410 - - - - Corporate Notes 14,776 1,000 13,750 - - - Investment Agreements 630 - - - 266 364 Money Market Savings Accounts 15,564 15,564 - - - - Bank Money Market Accounts 25,168 25,168 - - - - State of Delaware Investment Pool 10,736 10,736 - - - -
Total Investments: 104,751 68,098 35,158 - 752 742
Securitized Mortgage Loans 606,955 - - - - 578,910
Total Investments &
Securitized Mortgage Loans $ 711,706 $ 68,098 $ 35,158 $ - $ 752 $ 579,652
Investment Maturities (in Years)(Expressed in Thousands)
Book Value
63

State of Delaware Notes to the Financial Statements, June 30, 2013
provide sufficient liquidity to allow funds to be accessed to meet bond resolution requirements without incurring material principal losses.
b. Federal Program Funds: HUD funds held by DSHA should have a maximum maturity of
one year. HUD-related funds held by DSHA (escrows, replacement reserves, residual receipts) shall have a maximum maturity of three years.
c. General Fund: The Operating Reserve Account, which is managed externally, should
have a maximum maturity at the time of purchase of ten years. However, specific investments may be transferred into the account from time to time that may have a longer maturity. DSHA may further reduce the maximum maturity of the operating reserve investments from time to time.
d. Other DSHA funds should be invested with a maturity that matches, or is prior to, the
anticipated time at which the funds will be needed.
e. DSHA investments (other than deposit accounts, money market fund shares, or deposits with the State Treasurer’s Office) should have a fixed maturity date by which principal and accrued interest will be fully repaid. DSHA is not permitted to enter into investments that have an expected maturity date that can be extended, depending upon market conditions.
Credit Risk DSHA’s general investment policy is to make investments with judgment and care, under circumstances then prevailing, which persons of prudence, discretion and intelligence exercise in the management of their own affairs, not for speculation, but for investment, considering the probable safety of their capital, as well as the probable income to be derived. DSHA’s investment policy limits its investment choices as mentioned above under Investments. For DSHA’s Single and Multi-Family Programs, the investment rating must be equal or exceed the bond rating. DSHA’s Operating Reserve Account has a specific credit quality requirement. Corporate debt obligations and shares of money market mutual funds shall have a long-term rating of AA and/or AA, respectively by Standard & Poor’s (S&P) and Moody’s at the time of purchase. As of June 30, 2013, DSHA’s investments were rated as follows:
64

State of Delaware Notes to the Financial Statements, June 30, 2013
U.S. Government
AAA AA+ AA AA- A1+ A1 A2 Guaranteed
Investment Type
U.S. Treasury Notes -$ -$ -$ -$ -$ -$ -$ 11,627$
U.S. Treasury Strips - - - - - - - 548
U.S. Treasury Bonds - - - - - - - 26
U.S. Agencies - 20,303 - - - - - -
Corporate Notes 764 965 6,159 6,888 - - - -
Commercial Paper 1,748 1,745 1,905 -
Securitized Mortgage Loans - - - - - - - 606,955
Total 764$ 21,268$ 6,159$ 6,888$ 1,748$ 1,745$ 1,905$ 619,156$
Ratings ( S & P)
(Expressed in Thousands)
Custodial Credit Risk For an investment, custodial credit risk is the risk that, in the event of the failure of the counterparty, DSHA will not be able to recover the value of its investments or collateral securities that are in the possession of an outside party. Of DSHA’s $104.8 million investment balance, $600 thousand represents deposits held by various Guaranteed Investment Contract (GIC) providers under investment agreements. These accounts are uninsured and uncollateralized. The funds are specifically identified for DSHA, but the custodial credit risk cannot be categorized for these funds. Credit risk for such investments depends on the financial stability of the GIC provider whose rating must equal or exceed that of the bond rating. The bank and savings money markets must be collateralized at 102% or greater by securities pledged and identified as held in DSHA’s name. Although the State Investment Pool is not collateralized, the State’s Cash Management Policy Board requires that investments in the pool meet certain ratings, investment types and maturity criteria. DSHA’s investment policy does not limit the amount of securities that can be held by the counterparties. NOTE 3 RECEIVABLES All trade, loan and tax account receivables are recorded net of an allowance for uncollectible accounts. In the governmental fund financial statements, receivables that will not be available within 60 days of year-end are recorded as unearned revenue. Taxes receivable represent the amount of personal, business, and other taxes determined to be measurable at June 30, 2013. Uncollectibility for taxes receivable primarily results from identified assessment problems, inability to locate taxpayers, and accounts of decedents. The State levies taxes on real property through its school districts. Each of the three counties of the State establishes the assessed values of real estate and bills and collects its own property taxes. Local school property taxes are levied by local school districts based on the assessed value of real estate, as determined by county taxation formulas. Taxes are levied on July 1 and are
65

State of Delaware Notes to the Financial Statements, June 30, 2013
payable on or before September 30. Taxes paid after the payable date are assessed a 6% penalty for nonpayment and 1% interest per month thereafter. Taxes are billed and collected by the counties with funds remitted to the local school district to be used for the local share of school operating costs and debt service on general obligation bonds issued for capital improvements. Receivables as of year-end for the State’s individual funds, including the applicable allowances for uncollectible accounts, are as follows:
General Federal Local School TotalFund Funds District Funds Receivables
Receivables: Taxes $ 213,726 $ - $ 34,859 $ 248,585 Accounts 350,796 106,228 345 457,369 Loans and Notes 50,423 261,836 - 312,259 Intergovernmental - Federal Grants - 120,628 - 120,628
Total Receivables 614,945 488,692 35,204 1,138,841
Allowance for Doubtful Accounts (400,839) (94,838) (174) (495,851)
Total Receivables, Net $ 214,106 $ 393,854 $ 35,030 $ 642,990
for Collection During
the Subsequent Year $ 103,810 $ 246,571 $ 22,471 $ 372,852
Receivables - Primary Government
(Expressed in Thousands)
Amounts not Scheduled
Governmental Activities/Governmental Funds
TotalUnemployment Lottery DelDOT Receivables
Receivables: Taxes $ 49,444 $ - $ - $ 49,444 Interest - - 536 536 Accounts 32,684 11,804 17,449 61,937 Intergovernmental 1 - 27,058 27,059
Total Receivables 82,129 11,804 45,043 138,976
Allowance for Doubtful Accounts (39,834) (734) - (40,568)
Total Receivables, Net $ 42,295 $ 11,070 $ 45,043 $ 98,408
for Collection During
the Subsequent Year $ - $ - $ - $ -
Receivables - Primary Government
(Expressed in Thousands)
Amounts not Scheduled
Business-Type Activities/Proprietary Funds
66

State of Delaware Notes to the Financial Statements, June 30, 2013
Unearned Revenues Governmental funds report unearned revenue in connection with receivables for revenues that are not considered to be available to liquidate liabilities of the current period. Governmental funds also defer revenue recognition in connection with resources that have been received, but not yet earned. Amounts considered unearned federal grant drawdowns are reported as unearned revenue. The various components of unearned revenue and advances reported at year-end in the governmental funds are as follows:
UnavailableTaxes Receivable $ 84,409
Loans and Notes Receivables 308,793
Intergovernmental 24,711
Accounts Receivables 45,715
Subtotal Unavailable 463,628
Advances Advance Park Reservation Fees 1,024
Federal Grant Advance Drawdowns 20,062
Subtotal Advances 21,086Total Unearned Revenue $ 484,714
Unearned Revenues (Expressed in Thousands)
Discretely Presented Component Units Delaware State Housing Authority (DSHA) Total receivables as of June 30, 2013 are as follows:
Receivables:
Mortgage Loans $ 258,946
Accrued Interest 50,391
Other Receivables 726
Grants Receivable 281
Total Receivables 310,344
Allowance for Doubtful Accounts (1,077)
Total Receivables, Net $ 309,267
for Collection During
the Subsequent Year $ 265,107
(Expressed in Thousands)
Amounts not Scheduled
67

State of Delaware Notes to the Financial Statements, June 30, 2013
Mortgage loans receivable which total $258.9 million consist of single family and multi-family loans and are collateralized by first, second or third mortgages on the properties and in limited instances are guaranteed by corporate sponsors. Interest rates on the loans vary from 2.99% to 12.43% and loan maturities are between one and forty years depending on the type of mortgage loan issued.
NOTE 4 INTERFUND BALANCES AND TRANSFERS (a) Due To/From to Other Funds
Receivables reported as “due from other funds” and the related payables reported as “due to other funds” represent amounts owed to State organizations by other organizations within the State primary government. Amounts receivable from or payable to other levels of government are reported as intergovernmental receivables or payables and are expected to be repaid within one year from the date of these financial statements. The composition of due from/due to balances at June 30, 2013, expressed in thousands, is as follows:
The amounts due from the Federal Fund are recorded for borrowings to eliminate negative balances in the State Investment Pool. The amount for the Federal Fund is created by expenditures relating to reimbursement type federal grant revenues. These costs result in a negative balance in the State Investment Pool. The amounts due to the Federal Fund are for reimbursements for grant expenses for over expending federal government grants. The amount due to the Lottery Fund (reported as an internal balance on the statement of net position), represents overpayments of profits required by law to be transferred to the General Fund.
The amount due to the Unemployment Fund is from interest that the General Fund owes the Unemployment Fund due to an overpayment of a temporary borrowing.
(b) Transfers In From/Out to Other Funds Transfers in and transfers out from/to other funds in the statement of revenues, expenditures and changes in fund balance and the statement of revenues, expenses and changes in fund net position, proprietary funds represent transfers between funds. Transfers are used to 1) move revenues from the fund that statute requires to collect them to the fund that statute requires to expend them, 2) use restricted revenues collected in the General Fund to finance various programs accounted for in other funds in accordance with budgetary authorizations, 3) move profits from the Lottery Fund, as required by State law, and 4) move bond proceeds from
Amount
$ 20,922
Federal 16,833
Primary Government
1,524 677
Receivable Fund Payable Fund
General Federal
General
Lottery General
Unemployment General
Governmental Funds
68

State of Delaware Notes to the Financial Statements, June 30, 2013
Capital Projects to the General Fund to cover expenses paid by the General Fund. A schedule of transfers in and transfers out for the year ended June 30, 2013 is presented below (expressed in thousands):
NOTE 5 GENERAL OBLIGATION BONDS General obligation bonds have been authorized and issued primarily to provide funds for acquisition and construction of capital facilities for State administrative operations, public and higher education, public and mental health, corrections and conservation purposes and for maintenance and construction of highway facilities. The State Constitution provides that the State may issue general obligation bonds for specific purposes in amounts approved by the General Assembly. The enabling acts pursuant to which the bonds are issued provide that all bonds issued shall be direct obligations of the State; that is, the bonds are secured by the pledge of the full faith and credit of the State. General obligation bonds are redeemed over a period not to exceed 20 years, generally from available resources in the general fund. Accordingly, the State has generally issued 20-year serial bonds with equal amounts of principal maturing each year. Bonds outstanding have call provisions providing for early redemption at the option of the State, generally beginning 8 or 10 years following the date of issue in the inverse order of maturity, in whole or in part, at redemption prices not to exceed 100% of par value.
On February 28, 2013, the State issued $336.3 million of its general obligation bonds maturing between February 1, 2024 and February 1, 2033. Of the $336.3 million issued, Series A Bonds, at $111.3 million, were issued to refund higher priced bonds resulting in a net present value savings of $14.4 million, or 11.7% of the principal refunded. Series B Bonds, at $225.0 million, were issued as new money. The bonds of both series bore coupons of 2% and 5% and yield between .16% and 2.93%. The refunding Series 2013 resulted in an economic gain of $13.3 million and a debt service cash savings over the next nine years of $14.4 million. Bonds issued and outstanding totaled $1,755.0 million at June 30, 2013. Of this amount, $545.7 million is supported by property taxes collected by the local school districts. During fiscal year 2013, the local school district funds transferred $64.3 million of property tax revenue to the State to meet the required debt service on their share of the debt.
Transfers InLocal
School Capital General Federal District Projects Unemployment Lottery DelDOT Total
Transfers Out General $ - $16,833 $13,555 $ - $ 2,089 $ - $43,257 $ 75,734
Federal 1,675 - 37,998 - - - - 39,673
Local School 102,322 - - - - - - 102,322
Capital Projects 133,296 - - - - - - 133,296
Unemployment - - - - - - - -
Lottery 276,797 - - - - - - 276,797
DelDOT 6,793 - - - - - - 6,793
Total $ 520,883 $16,833 $51,553 $ - $ 2,089 $ - $43,257 $ 634,615
69

State of Delaware Notes to the Financial Statements, June 30, 2013
The State is authorized to issue an additional $162.5 million of general obligation bonds at June 30, 2013. Interest rates and maturities of the outstanding general obligation bonds are detailed as follows:
Maturity BalanceInterest Date Outstanding at
Sale # Description Rates (Fiscal Year) June 30, 2013
220 GO 2013B 2.000% - 5.000% 2033 225,000$ 219 GO 2013A3 2.000% - 5.000% 2025 35,940 218 GO 2013A2 4.000% - 5.000% 2024 40,210 217 GO 2013A1 2.000% - 5.000% 2026 35,180 216 GO 2011A2 2.000%-5.000% 2031 162,675 215 GO 2011A1 2.000%-5.000% 2031 85,380 214 GO 2010D 4.550% 2029 59,580 213 GO 2010C 3.100%-4.600% 2030 115,775 212 GO 2010B2 5.00% 2023 89,250 211 GO 2010B1 2.000%-4.000% 2024 25,000 210 GO 2010A2 2.000%-3.000% 2018 22,315 209 GO 2010A1 1.500%-5.000% 2024 102,340 208 GO 2009D 3.700%-5.300% 2029 179,315 207 GO 2009C2 2.000%-3.000% 2024 37,205 206 GO 2009C1 3.000%-5.000% 2027 247,710 205 GO 2009B 4.750%-5.000% 2026 73,750 204 GO 2009A2 4.750%-5.000% 2017 5,275 203 GO 2009A1 4.750%-5.000% 2029 59,125 202 GO 2008B 4.750%-5.000% 2016 38,145 201 GO 2008A 3.000%-5.000% 2016 3,510 200 GO 2007A 4.000%-5.000% 2027 27,850 199 GO 2006C 0% 2022 1,433 198 GO 2006B 4.000%-5.500% 2026 22,395 197 GO 2006A 3.75%-4.500% 2026 4,845 196 GO 2005D 3.50%-5.0% 2025 8,600 195 GO 2005C 5% 2016 45,335 192 QZAB 2004B 0% 2020 224 190 QZAB 2003D 0% 2018 908 186 QZAB 2002B 0% 2016 760
Total, Gross 1,755,030
Plus: Unamortized Bond Premium 186,080
Total General Obligation Bonds 1,941,110$
General Obligation Bonds(Expressed in Thousands)
70

State of Delaware Notes to the Financial Statements, June 30, 2013
The following table sets forth the future debt service requirements on outstanding general obligation bonds at June 30, 2013:
Fiscal Year Principal Interest Total
2014 $ 154,695 $ 74,945 $ 229,6402015 152,540 69,110 221,6502016 146,530 62,145 208,6752017 141,355 55,320 196,6752018 129,135 48,565 177,700
2019-2023 479,475 173,972 653,4472024-2028 358,630 79,674 438,3042029-2033 192,670 15,429 208,099
Total $ 1,755,030 $ 579,160 $ 2,334,190
Total General Obligation Bonds(Expressed in Thousands)
Changes in general obligation bonded debt during the year ended June 30, 2013 are summarized in Note 10. In prior years, the State has defeased certain general obligation bonds by creating separate irrevocable trust funds. New debt has been issued or cash appropriated and the proceeds have been used to purchase U.S. government securities that were placed in the trust funds. The investments and fixed earnings from the investments are sufficient to fully service the defeased debt. Accordingly, the debt has been considered defeased and has been removed as a liability from the government-wide financial statements. At June 30, 2013, a total of $355.6 million of defeased bonds were outstanding. NOTE 6 REVENUE BONDS Revenue Bonds The State Constitution empowers certain State agencies and authorities to issue bonds that are not supported by the full faith and credit of the State. These bonds pledge income derived from acquired or constructed assets or some other stream of revenues to retire the debt and pay related interest. Primary Government In August, 2011, pursuant to the Delaware Energy Act, 29 Del. C. §8059, the Sustainable Energy Utility, Inc. (the “SEU”), a Delaware nonprofit corporation created by and for the benefit of the State issued $67.4 million of its Sustainable Energy Utility, Inc. Energy Efficiency Revenue Bonds, Series 2011 (the “SEU Bonds”). Interest rates on bonds outstanding range from 2.0% to 5.0%. Of the total amount, $56.2 million of the SEU Bonds were issued to finance energy conservation measures for multiple State agencies and the remaining amount of $11.2 million was issued on behalf of Delaware State University. Under separate Installment Payment
71

State of Delaware Notes to the Financial Statements, June 30, 2013
Agreements, each agency and Delaware State University, is obligated to make installment payments to the SEU in accordance with the Energy Performance Contracting Act, 29 Del. C. §6971. Further, each agency and Delaware State University separately entered into Guaranteed Energy Savings Agreements with various energy services companies, which guaranteed that the savings achieved will be sufficient to cover the financing costs associated with the SEU bonds upon completion of the energy conservation measures. In the event that savings are not realized, the energy services companies will be held responsible for the deficiency. The SEU Bonds are limited obligations of the SEU, secured by the trust estate and payable only from amounts appropriated by the State that are eligible for payment under the Installment Payment Agreements. No funds appropriated to any agency for any purpose are available to pay the Installment Payments of any other agency or Delaware State University.
The final maturity of the SEU bonds is September 15, 2034. As of June 30, 2013, $28.4 million of the SEU Bonds issued to finance projects at State agencies was unspent and held by Citibank, the bond underwriter.
(Expressed in Thousands)
Fiscal Year Principal Interest Total2014 1,635$ 2,549$ 4,184$
2015 1,610 2,509 4,119
2016 3,045 2,439 5,484
2017 2,915 2,324 5,239
2018 3,055 2,179 5,234
2019-2023 10,155 9,401 19,556
2024-2028 12,730 6,705 19,435
2029-2033 15,870 3,310 19,180
2034-2035 5,155 255 5,410
Total 56,170$ 31,671$ 87,841$
Sustainable Energy Utility Revenue Bonds
DelDOT Fund Delaware Transportation Authority (Authority) The Authority is subject to oversight by the DelDOT and is included in the DelDOT Fund. The Authority assists in the implementation of the State’s plans and policies regarding the coordination and development of a comprehensive, balanced transportation system for the State. It has the power to develop a unified system of air, water, vehicular and specialized transportation in the State. The Authority includes the Transportation Trust Fund and the Delaware Transit Corporation. The Secretary of the Department of Transportation, with consent of the Governor, appoints the Authority’s Director. To assist the Authority in financing a unified transportation system, the State created a
72

State of Delaware Notes to the Financial Statements, June 30, 2013
Transportation Trust Fund (the Trust Fund) within the Authority which receives all receipts of the Authority. The primary sources of funding of the Trust Fund are motor fuel taxes and motor vehicles fees imposed and collected by the State and deposited in the Trust Fund, and revenue from the Delaware Turnpike, which the Authority owns and operates. The Authority also has the power to issue bonds, with legislative authorization, to finance improvements to the State's transportation system. Debt issued by the Authority does not constitute a debt of the State or a pledge of its general taxing power or of its full faith and credit. Rather, the outstanding revenue bonds are obligations of the Authority payable solely from and secured by a pledge and assignment of certain tolls and revenues such as motor fuel tax revenue, motor vehicle document fees, and motor vehicle registrations. The Authority may apply Trust Fund revenue in excess of debt service requirements for transportation projects, subject to legislative authorization, and may pledge any or all of this revenue to secure financing for these projects. The Authority has defeased various bond issues by creating separate irrevocable trust funds. New debt has been issued and the proceeds have been used to purchase U.S. government securities that were placed in the trust funds. The investments and fixed earnings from the investments are sufficient to fully service the defeased debt until the debt is called or matures. For financial reporting purposes, the debt has been considered defeased and is therefore not reported as a liability. At June 30, 2013, the amount of defeased debt outstanding amounted to $195.2 million. The Authority has a total of $235.6 million in authorized but unissued revenue bonds at June 30, 2013. Bonds outstanding at June 30, 2013 amounted to $1,007.1 million and are presented as follows:
(Expressed in Thousands)
Maturity BalanceInterest Date Outstanding At
Description Rates (Fiscal Year) June 30, 2013Transportation System Senior
Revenue Bonds - Series
2003 5.00% 2023 $ 35,315
2004 4.0% - 5.0% 2024 58,385
2005 4.25% - 5.0% 2025 58,480
2006 3.5% - 5.0% 2026 101,610
2007 4.0% - 5.0% 2021 61,805
2008 4.0% - 5.0% 2028 66,135
2008 4.0% - 5.0% 2029 106,200
2009 5.00% 2029 100,125
2010 4.0% - 5.0% 2019 40,745
2010 3.95% - 5.80% 2030 72,120
2012 3.0% - 5.0% 2024 222,870
Transportation System
Grant Anticipation Bonds
2010 Series 3.00% - 5.00% 2025 99,715
Total, Gross 1,023,505
(16,374)
Total, Net 1,007,131
Less: Current Portion of Debt
Outstanding (72,544)
$ 934,587
Delaware Transportation Authority Revenue Bonds
Less: Deferred Amount on Refunding
Long-term Portion of Debt Outstanding
73

State of Delaware Notes to the Financial Statements, June 30, 2013
Future debt service requirements for the Authority’s outstanding bonds are shown in the table below:
Fiscal Year Principal Interest Total
2014 $ 75,205 $ 47,162 $ 122,367 2015 77,655 43,465 121,1202016 75,350 39,754 115,1042017 72,840 36,243 109,0832018 72,105 32,799 104,904
2019-2023 363,055 110,948 474,0032024-2028 228,925 37,588 266,5132029-2033 58,370 3,647 62,017
Total $ 1,023,505 $ 351,606 $ 1,375,111
Delaware Transportation Authority Revenue Bonds(Expressed in Thousands)
The transportation system revenue bonds have fixed interest rates and are limited obligations of the Authority secured only by the pledged revenues of the trust funds. Summary financial information as of and for the year ended June 30, 2013 for the trust funds, which is the segment of DelDOT that supports the revenue bonds, is presented below and on the following page:
Assets:
Current Assets $ 232,884
Capital Assets 1,327,286
Other Assets 85,195
Total Assets $ 1,645,365
Liabilities:
Current Liabilities 139,277
Noncurrent Liabilities 978,804
Total Liabilities 1,118,081
Net Position:
Net Investment in Capital Assets 315,013
Unrestricted 52,109
Restricted 160,162
Total Net Position 527,284
Total Liabilities and Net Position $ 1,645,365
Condensed Statement of Net Position(Expressed in Thousands)
74

State of Delaware Notes to the Financial Statements, June 30, 2013
Operating Revenues (Pledged Against Bonds) 385,698$
Other Operating Revenues 55,366
Depreciation Expense (192)
Other Operating Expenses (343,981)
Operating Income 96,891
Nonoperating Revenues (Expenses):
Investment Income (Pledging Against Bonds) 2,220
Other Investment Income (Loss) 8,841
Interest Expense (39,224)
Transfer from State General Fund 43,257
Change in Net Position 111,985
Beginning Net Position 415,299
Ending Net Position 527,284$
Condensed Statement of Revenues, Expense and Changes in Net Position
(Expressed in Thousands)
Net Cash Provided by (Used In):
Operating Activities 95,211$
Noncapital Financing Activities 43,257
Capital and Related Financing Activities (213,445)
Investing Activities 99,600
Net Increase 24,623
Beginning Cash and Cash Equivalents 24,530
Ending Cash and Cash Equivalents 49,153$
(Expressed in Thousands)
Condensed Statement of Cash Flows
The State has pledged turnpike, motor fuel tax, and motor vehicle fee revenues to the Trust Fund in order to provide additional means to finance the maintenance and development of the State’s highway transportation system, as well as security for the repayment of the outstanding revenue bonds of the Authority. Proceeds from the revenue bonds were used to finance infrastructure maintenance, preservation, and construction related projects. The revenue bonds are payable solely from these pledged revenue streams and are not backed by the faith and credit of the State or any such political subdivision. Annual principal and interest payments on the revenue bonds are expected to require less than 35% of pledged revenues. The total principal and interest remaining to be paid on the revenue bonds as of June 30, 2013 was $1.4 million. Principal and interest paid on the revenue bonds for the year ended June 30, 2013 was $131.3 million. Total pledged revenues for the year ended June 30, 2013 was $387.9 million. Discretely Presented Component Units Debt issued by the following component units is not secured by the full faith, credit and taxing power of the State.
75

State of Delaware Notes to the Financial Statements, June 30, 2013
Delaware State Housing Authority (DSHA) DSHA is authorized to issue bonds and notes, with the approval of the State, in order to exercise its powers. These bonds and notes are secured solely by the revenues, loans, and other pledged assets under the related Bond Indenture of DSHA. DSHA has issued revenue bonds to provide financing for mortgage, construction, and other loans to not-for-profit and limited for profit housing sponsors; to make loans to mortgage lenders, requiring the proceeds thereof to be used for making new qualified residential mortgage loans; and to purchase qualified mortgage loans from mortgage lenders. The bonds are direct obligations of DSHA and are secured by the mortgage loans made or purchased under the applicable resolutions; the revenues, prepayments and foreclosure proceeds received are related to the mortgage loans, and certain funds and accounts established pursuant to the applicable bond resolutions. All bonds are callable subject to certain restrictions. Interest rates on bonds outstanding range from 0.95% to 7.75% with maturities of such bonds up through January 1, 2049. On February 28, 2013, the Authority issued $58.2 million of Single Family Revenue Bonds (SFMRB) 2013-1 pursuant to the New Issue Bond Program (NIBP) established jointly by Fannie Mae, Freddie Mac, the Federal Housing Finance Agency, and the U. S. Department of Treasury (US Treasury) under which the US Treasury provided funding for bond issuance. The proceeds from the sale were used to refund bonds held within the SFMRB 2011-1(NIBP) bond issue. Also, the remaining SFMRB 2011-1 (NIBP) bonds were transferred into the SFMRB 2013-1 (NIBP) bond issue along with the associated Mortgage Backed Securities of that issue. On June 26, 2013, the Authority issued $49.9 million of Single Family Mortgage Revenue Bonds 2013 Series A. The proceeds from the sale were used to provide low rate mortgages to first-time homebuyers. Outstanding bonds at June 30, 2013 amounted to $639.3 million. Future debt service requirements for DSHA’s bonds are shown on the following table:
Fiscal Year Principal Interest Total2014 $ 14,142 $ 25,473 $ 39,6152015 13,220 24,966 38,1862016 13,610 24,452 38,0622017 14,045 23,912 37,9572018 14,520 23,319 37,839
2019-2023 80,205 106,015 186,2202024-2028 97,692 84,884 182,5762029-2033 92,186 62,751 154,9372034-2038 118,734 40,337 159,0712039-2043 156,935 18,974 175,9092044-2048 14,830 2,331 17,161
2049 9,163 23 9,186
Total $ 639,282 $ 437,437 $ 1,076,719
Delaware State Housing Authority Revenue Bonds(Expressed in Thousands)
76

State of Delaware Notes to the Financial Statements, June 30, 2013
Delaware State University (DSU or the University) Revenue bonds payable at June 30, 2013 are as follows:
Revenue Bonds 3,126$
Revenue Refunding Bonds 47,844
Energy Efficiency Revenue Bonds 12,089
Revenue Refunding Bonds Series 2012 32,739
Student Housing Foundation Bonds 15,281
Total Revenue Bonds Outstanding as of June 30, 2013 111,079$
(Expressed in Thousands)
Revenue Bonds Payable
On May 6, 1999, the University issued revenue refunding bonds in the amount of $15.9 million (par value) through the DEDA. The bonds are due on October 1, 2017 and are secured by un-appropriated gross revenues of the University.
The Bond Trust Indenture requires the University to maintain a debt service reserve fund equal to the maximum annual debt service on all bonds outstanding under the Indenture. The University meets this requirement by providing for the deposit through a surety bond in the Debt Reserve Fund. This bond was obtained from MBIA Insurance Corporation in the amount of $1.5 million and expires on October 1, 2017. The University has pledged all operating and non-operating revenues, except State appropriations and restricted gifts, grants and bequests, for each academic year during which any of the bonds remain outstanding. On March 1, 2012 the University issued revenue refunding bonds in the amount of $32.1 million (par value) through the DEDA which were in part used to refund certain maturities of Series 1999 bonds. The issuance of Series 2012 bonds and refunding resulted in a $2.7 million reduction in Series 1999 bond obligations. As of June 30, 2012, $3.1 million including less than a million of unamortized bond discount remained outstanding on the 1999 Revenue Bonds. The refunding of the callable portion of the Series 1999 Bonds resulted in a net present value savings of $.1 million. On December 20, 2007 the University issued revenue refunding bonds in the amount of $47.6 million (par value) through the DEDA. The bonds are interest only through October 1, 2018; due on October 1, 2036; and are secured by un-appropriated gross revenues of the University. The 2007 bonds were being issued as “Additional Bonds” under the Indenture, secured equally and ratable with all other Bonds issued and outstanding under the Indenture and any Alternative Indebtedness as provided in the Indenture and in the Loan Agreement. The 2007 Bonds are insured by MBIA Insurance Corporation. The University has pledged all operating and non-operating revenues, except State appropriations and restricted gifts, grants and bequests, for each academic year during which any of the bonds remain outstanding. The bonds were secured for the construction of a new student union, a swimming pool and a student wellness/recreation center. As of June 30, 2013, $47.8 million including $265 thousand of unamortized bond premium remained outstanding on the 2007 revenue bonds.
77

State of Delaware Notes to the Financial Statements, June 30, 2013
The University entered into a Guaranteed Energy Savings Agreement with Johnson Controls, Inc. in the amount of $11.3 million. In connection with this agreement and to fund energy efficiency projects, energy efficiency revenue bonds were issued through the SEU on August 1, 2011. The bonds are due September 15, 2032 and are limited obligations of the University, payable only from amounts appropriated by the State that are eligible for payment of the Installment Payments pursuant to the Energy Performance Contracting Act. The 2011 bonds are equally and ratably secured by the trust estate, and failure of the State to appropriate each year sufficient available funds will cause insufficient funds to be deposited into the bond fund to pay all principal and interest on the bonds when due. Johnson Controls, Inc. guaranteed that the savings achieved will be sufficient to cover the financing cost associated with the bond, upon completion of the energy upgrades to various buildings and systems throughout the University. In the event that the savings are not realized, Johnson Controls, Inc. will be responsible for the amount of that deficiency. As of June 30, 2013, $12.1 million including $823 thousand of unamortized bond premium remained outstanding on the 2011 energy efficiency bonds. On March 1, 2012 the University issued revenue refunding bonds in the amount of $32.1 million (par value) through the DEDA. The bonds are due October 1, 2036 and are secured by a pledge of certain un-appropriated revenues of the University. The 2012 bonds were issued as “Additional Bonds” under the Indenture, secured equally and ratable with all other Bonds issued and outstanding under the Indenture and any Alternative Indebtedness as provided in the Indenture and in the Loan Agreement. The University has pledged all operating and non-operating revenues, except State appropriations and restricted gifts, grants and bequests, for each academic year during which any of the bonds remain outstanding. The proceeds of the 2012 bonds were used to finance: (1) the refunding of certain maturities of The Delaware Economic Development Authority Revenue Refunding Bonds (Delaware State University Project) Series 1999; (2) the purchase of the University Village, a four building, 628 bed student housing facility and dining hall located on the campus of the University, the construction of which was financed by the Kent County, Delaware Variable Rate Demand Student Housing Revenue Bonds (Delaware State University Student Housing Foundation Project) Series 2004B; (3) the funding of any required reserve funds relating to the 2012 Bonds; and (4) the costs of issuance and any credit enhancement of the 2012 Bonds. As of June 30, 2013, $32.7 million including $1.8 million of unamortized bond premium remained outstanding on the 2012 revenue bonds. Remaining maturities and interest due relating to the university's revenue bonds at June 30, 2013, follows:
Delaware State University Revenue Bonds
Fiscal Year Principal Interest Total2014 $ 1,640 $ 4,101 $ 5,741 2015 2,030 4,054 6,084 2016 2,100 3,981 6,081 2017 2,230 3,886 6,116 2018 2,370 3,778 6,148
2019 - 2023 14,505 17,361 31,866 2024 - 2028 17,955 13,925 31,880 2029 - 2033 22,480 9,528 32,008 2034 - 2038 20,980 4,184 25,164 2039 - 2042 6,650 452 7,102
Total 92,940$ $ 65,250 $ 158,190
Plus Unamortized Bond Premiums and Discount 2,858
Total Revenue Bonds Payable 95,798$
(Expressed in Thousands)
78

State of Delaware Notes to the Financial Statements, June 30, 2013
The Delaware State University Housing Foundation (Housing Foundation), a component unit of DSU refinanced its Series 2000A and 2002A Bonds (the Prior Bonds) with a loan payable in an aggregate amount of $18.4 million funded with proceeds from the issuance of student housing revenue bonds, Series 2004A (Delaware State University Student Housing Foundation Project). Pursuant to the trust indenture dated January 1, 2004, the proceeds from the sale of the Series 2004A Bonds are restricted to refunding the Prior Bonds, to fund a debt service reserve fund for the Series 2004A Bonds, to fund an operating reserve fund for the Series 2004A Bonds, and to pay a portion of the costs of issuance of the Series 2004A Bonds. In February 2004, the Housing Foundation defeased the tax-exempt series 2000A and the tax exempt series 2002A term bonds at face value. The liability of the Housing Foundation under the loan agreements is limited to the value of the building and improvements, pledged revenues and amounts deposited with the trustee. The first monthly interest payment on the Series 2004A Bonds began on July 1, 2004. Total accrued interest as of June 30, 2013 was $381 thousand. Maturities of long-term debt at June 30, 2013 are as follows:
(Expressed in Thousands)
BalanceInterest Principal Interest Outstanding At
Fiscal Year Rates Amount Amount June 30, 20132014 3.70% $ 420 $ 753 $ 1,173 2015 4.00% 435 736 1,171 2016 4.00% 455 717 1,172 2017 4.20% 475 698 1,173 2018 4.30% 495 676 1,171
2019 - 2023 4.40-5.0% 2,840 2,999 5,839 2024 - 2028 5.00% 3,615 2,197 5,812 2029 - 2033 5.0-5.125% 4,610 1,171 5,781 2034 - 2042 5.125% 2,195 114 2,309
Total, Gross 15,540 $ 10,061 $ 25,601
Less: Unamortized Bond Discount (259)
$ 15,281
Delaware State University Housing Foundation Revenue Bonds
Total Bonds Payable
NOTE 7 LOANS AND NOTES PAYABLE Primary Government Banc of America Master Lease/Purchase In May, 2011 the State entered into a Master Lease/Purchase Agreement with Banc of America Public Capital Corporation (BOA) for a two year period on behalf of all its State Agencies to acquire equipment including all installation costs with a maximum aggregate amount of principal components for this equipment not to exceed $50 million. Each individual equipment lease will establish the duration of the lease agreement with the interest rate determined using a percentage of a like term U.S. Treasury as quoted by the Federal Reserve.
79

State of Delaware Notes to the Financial Statements, June 30, 2013
On April 15, 2013, the State executed an agreement under the BOA Master Agreement in the amount of $18.5 million for the purchase and installation of equipment for the Red Clay Consolidated School District. Beginning October 15, 2014, principal and interest payments are due each April 15 and October 15. The interest rate for the term of the agreement is 2.91% and the loan matures April 15, 2035. The future maturities of principal and interest payments on the agreement are as follows:
Fiscal Year Principal Interest Total
2014 $ (542) $ 542 $ - 2015 (144) 555 4112016 329 556 8852017 406 546 9522018 454 534 988
2019-2023 3,070 2,434 5,5042024-2028 4,697 1,886 6,5832029-2033 6,797 1,071 7,8682034-2035 3,433 127 3,560
Total $ 18,500 $ 8,251 $ 26,751
Red Clay Consolidated School District Agreement(Expressed in Thousands)
On April 15, 2013, the State executed an agreement under the BOA Master Agreement in the amount of $10.6 million for the purchase of helicopters for the Delaware State Police. Beginning April 15, 2013, principal and interest payments are due each April 15 and October 15. The interest rate for the term of the agreement is 2.03% and the loan matures October 15, 2022. The future maturities of principal and interest payments on the agreement are as follows:
Fiscal Year Principal Interest Total
2014 $ 970 $ 199 $ 1,169 2015 989 179 1,1682016 1009 159 1,1682017 1030 138 1,1682018 1051 117 1,168
2019-2023 5,001 257 5,258
Total $ 10,050 $ 1,049 $ 11,099
Delaware State Police Agreement(Expressed in Thousands)
80

State of Delaware Notes to the Financial Statements, June 30, 2013
Discretely Presented Component Units Diamond State Port Corporation (DSPC) Loan and notes payable of the DSPC at June 30, 2013 are shown below:
Transportation Trust Fund Loan 18,579$ City of Wilmington Port Debt Service Notes 5,348
Delaware River and Bay Authority 2,780
Total 26,707$
(Expressed in Thousands)
Diamond State Port CorporationLoans and Notes Payable
Transportation Trust Fund Loan In November 2001, DSPC entered into a loan agreement with DelDOT. DSPC borrowed $27.5 million. The funds were used to repay the balances in full of the original Delaware River and Bay Authority Note and the Wilmington Trust Company Note, and, at a discount, the City of Wilmington Deferred Payment Note. The interest rate was 3.99% during 2013. The loan matures March 2029. Interest expense charged to operations in 2013 was $800 thousand. The future maturities of principal and interest payments on the Transportation Trust Fund Loan are as follows:
Fiscal Year Principal Interest Total
2014 $ 888 $ 740 $ 1,628 2015 923 704 1,6272016 960 667 1,6272017 999 629 1,6282018 1039 589 1,628
2019-2023 5,855 2,284 8,1392024-2028 7,127 1,012 8,139
2029 788 26 814
Total $ 18,579 $ 6,651 $ 25,230
Transportation Trust Fund Loan(Expressed in Thousands)
81

State of Delaware Notes to the Financial Statements, June 30, 2013
City of Wilmington Note In 1995, in consideration of the acquisition of the Port of Wilmington assets from the City of Wilmington (the City), Delaware, DSPC issued to the City two separate notes consisting of a Port Deferred Payment Note in the amount of $39.9 million and Port Debt Service Notes with an original face amount of $51.1 million. These notes are secured by a first lien on substantially all of the DSPC’s assets. These notes obligate DSPC to pay the City amounts that generally represent the outstanding principal balance of certain DSPC-related City general obligation bonds. The interest rates on the City bonds range from 3.2% to 6.4%. Principal and interest payments made on the note during 2013 were $600 thousand and $300 thousand, respectively. The future maturities of principal and interest payments on the Port Debt Service Notes are as follows:
Fiscal Year Principal Interest Total2014 $ 256 $ 200 $ 456 2015 701 233 9342016 742 195 9372017 683 157 8402018 253 136 389
2019-2023 2,592 353 2,945
Subtotal 5,227 1,274 6,501
Deferred Gain on Refunding 121 - 121
Total $ 5,348 $ 1,274 $ 6,622
Port Debt Service Note(Expressed in Thousands)
Delaware River and Bay Authority (DRBA) Obligation On March 1, 2005, DSPC entered into an agreement with the DRBA whereby the DSPC agreed to lease to the DRBA land and a warehouse, located at the Port, for twenty years. The rent for the entire twenty-year term of the lease was $4.0 million, to be paid in advance. Simultaneously, DSPC and the DRBA entered into an operating agreement in which DSPC agreed to make guaranteed payments to the DRBA, at the beginning of each month, starting with the date upon which substantial completion has occurred, for a period of twenty years, totaling $4.0 million plus interest, which ranges from 1.5% to 5.32%. This transaction is accounted for as a loan from DRBA secured by revenue from warehouse operations. DSPC began making guaranteed payments on July 1, 2007. Interest expense incurred on this obligation was less than a million during 2013.
82

State of Delaware Notes to the Financial Statements, June 30, 2013
The future maturities of principal and interest payments on the DRBA obligation are as follows:
Fiscal Year Principal Interest Total2014 $ 181 $ 81 $ 262 2015 186 75 2612016 192 70 2622017 197 64 2612018 158 104 262
2019-2023 926 381 1,3072024-2027 940 105 1,045
Total $ 2,780 $ 880 $ 3,660
Delaware River and Bay Authority Obligation(Expressed in Thousands)
NOTE 8 LEASE COMMITMENTS The State has entered into various property and equipment operating leases (terms in excess of one year) with aggregate future rentals approximating $172.6 million, of which $147.3 million relates to property leases and $25.3 million relates to equipment leases. Operating leases contain various renewal options. Any escalation clauses, sublease rentals and contingent rents are considered immaterial to the future minimum lease payments and current rental expenditures. Operating lease payments are recorded as expenditures of the related fund when paid. Lease payments for fiscal year 2013 were approximately $33.1 million, of which $24.3 million was for office space and $8.8 million, was for equipment. The equipment leases held by the State consists mainly of computers, data processing equipment and fleet vehicles. Significant annual equipment rentals include $4.0 million for fleet vehicles and data processing equipment for the Office of Management and Budget, $2.7 million for helicopters and computer hardware for Safety and Homeland Security, and $1.7 million for data processing equipment for the Department of Education. Significant annual real estate rentals include $6.1 million for leases for Health and Social Services facilities, $2.2 million for the Department of Services for Children, Youth and Their Families, $2.9 million for office space for the Department of Correction, and $3.1 million for the Department of Labor. Future minimum lease commitments for operating leases as of June 30, 2013 are shown in the following table:
83

State of Delaware Notes to the Financial Statements, June 30, 2013
Fiscal Year
2014 $ 28,659
2015 27,027
2016 23,297
2017 21,399
2018 19,227
2019-2023 44,171
2024-2028 7,747
2029-2033 1,067Total $ 172,594
Leases
Lease Commitments(Expressed in Thousands)
Operating
NOTE 9 OTHER LONG-TERM OBLIGATIONS Compensated absences payable are reported in the government-wide financial statements and in the proprietary fund financial statements. They represent benefits accrued to State employees for vacation earned as of year-end and sick leave estimated to be paid out at retirement for services rendered as of June 30, 2013. Employees earn from 1.25 to 1.75 days of vacation leave per month depending on years of service. Employees or their estates are paid for unused vacation upon termination of employment. Employees earn 1.25 days of sick leave per month. The State’s obligation for sick leave credit is a maximum of 45 workdays. $172.7 million has been accrued for the Governmental Activities and $14.2 million in the Business-type Activities for the total compensated absences liability. The current portion of the long-term obligation for compensated absences is $13.6 million in the Governmental Activities and $ 5.0 Million in the Business-type Activities. Approximately $147.4 million (85.4%) of the long-term obligation for compensated absences will be liquidated by the General Fund. Of the remainder, approximately $10 million (5.8%) and $15.3 million (8.8%) will be paid with Federal Funds and Local School District Funds, respectively. The State has recorded $95.0 million relating to the accrual of the obligation for escheated (abandoned) property of which $19.0 million was recorded as the current portion. The State has incurred obligations relating to scholarship and physician loan repayment programs, resulting in an additional long-term obligation of $3.6 million, of which $1.3 million was recorded as the current portion.
84

State of Delaware Notes to the Financial Statements, June 30, 2013
NOTE 10 CHANGES IN LONG-TERM OBLIGATIONS The following table provides a summary of changes in long-term obligations of the primary government for the year ended June 30, 2013:
Beginning Ending Due WithinBalance Additions Reductions Balance One Year
Governmental Activities:Net Pension Obligation
(Note 15) 118.0$ 11.5$ (10.4)$ 119.1$ -$ Other Postemployment Benefits (Note 14) 1,496.5 440.4 (254.9) 1,682.0 - Compensated Absences 166.9 18.6 (12.8) 172.7 13.6 Claims and Judgments
(Notes 13 and 19) 158.4 46.1 (37.3) 167.2 37.4 Escheat Payable 95.0 13.2 (13.2) 95.0 19.0 Notes Payable (Note 7) - 29.1 (0.6) 28.5 1.0 Pollution Remediation Obligations (Note 19) 29.8 1.6 (3.8) 27.6 9.2 Bonds Payable:
General Obligation Bonds (Note 5) 1,696.4 336.3 (277.7) 1,755.0 154.7 Bond Issue Premium, Net of
Accumulated Amortization 156.8 44.6 (15.4) 186.0 15.4 Revenue Bonds (Note 6) 56.2 - - 56.2 1.6
Physician and ScholarshipPrograms 5.2 1.4 (3.0) 3.6 1.3
Governmental Activities
Long-term Liabilities 3,979.2$ 942.8$ (629.1)$ 4,292.9$ 253.2$
Business-type Activities:Other Postemployment Benefits (Note 14) 145.9$ 40.1$ (15.1)$ 170.9$ -$ Compensated Absences 16.8 0.2 (2.8) 14.2 5.0 Claims and Judgments
(Notes 13 and 19) 3.0 - (3.0) - - Pollution Remediation Obligations (Note 19) 5.4 - (1.4) 4.0 1.3 Liabilities Payable from
Restricted Assets 11.7 4.6 (3.9) 12.4 2.5 Bonds Payable:
General Obligation Bonds 0.4 - (0.2) 0.2 0.1 Revenue Bonds 1,087.7 - (80.6) 1,007.1 72.5 Bond Issue Premium, Net of
Accumulated Amortization 68.5 - (12.8) 55.7 11.8
Business-type ActivitiesLong-term Liabilities 1,339.4$ 44.9$ (119.8)$ 1,264.5$ 93.2$
Changes in Long-Term ObligationsPrimary Government(Expressed in Millions)
NOTE 11 NO COMMITMENT DEBT (NOT INCLUDED IN FINANCIAL STATEMENTS) The State, by action of the General Assembly, created various authorities for the express purpose of providing private entities with an available low cost source of capital financing for construction of facilities deemed to be in the public interest. The bonds of the authorities represent limited obligations payable solely from payments made by the borrowing entities. The majority of the bonds are secured by the property financed. Upon repayment of a bond, ownership of acquired property transfers to the entity served by the bond issuance. The State has no obligation for this debt. Accordingly, these bonds are not reflected in the accompanying
85

State of Delaware Notes to the Financial Statements, June 30, 2013
financial statements. These bonds are issued through the Delaware Economic Development Authority and the Delaware Health Facilities Authority. The principal amount of bonds outstanding at June 30, 2013 for these entities amounted to $687.2 million and $670.2 million, respectively.
NOTE 12 CAPITAL ASSETS Capital asset activities for the fiscal year ended June 30, 2013 were as follows:
Beginning Ending Governmental Activities Balance Increases Decreases BalanceCapital Assets, Not Being Depreciated Land $ 447,812 $ 11,927 $ (152) $ 459,587 Easements 77,736 2,014 - 79,750 Construction-In-Progress 244,783 203,284 (88,881) 359,186
Total Capital Assets, Not Being
Depreciated 770,331 217,225 (89,033) 898,523
Capital Assets, Being Depreciated Vehicles 79,703 6,811 (4,788) 81,726 Buildings 3,514,526 85,140 (834) 3,598,832 Equipment 96,245 6,758 (3,505) 99,498 Land Improvements 217,523 8,948 (141) 226,330 Computer Software 58,171 7,547 - 65,718
Total Capital Assets Being Depreciated 3,966,168 115,204 (9,268) 4,072,104
Less Accumulated Depreciation For: Vehicles (62,899) (5,108) 4,788 (63,219) Buildings (1,097,670) (78,849) 280 (1,176,239) Equipment (71,777) (4,362) 3,199 (72,940) Land Improvements (61,919) (11,169) 104 (72,984) Computer Software (24,701) (12,213) - (36,914)
Total Accumulated Depreciation (1,318,966) (111,701) 8,371 (1,422,296)
Total Capital Assets, Being Depreciated, Net 2,647,202 3,503 (897) 2,649,808
Governmental Activities Capital Assets, Net $ 3,417,533 $ 220,728 $ (89,930) $ 3,548,331
Capital Assets(Expressed in Thousands)
86

State of Delaware Notes to the Financial Statements, June 30, 2013
Business-type Activities Beginning Ending Lottery Balance Increases Decreases Balance
Capital Assets, Being Depreciated
Computer Equipment & Software $ 1,395 $ - $ - $ 1,395
Total Capital Assets Being Depreciated 1,395 - - 1,395
Less Accumulated Depreciation (1,395) - - (1,395)
Total Capital Assets, Being
Depreciated, Net $ - $ - $ - $ -
Capital Assets(Expressed in Thousands)
Business-type Activities Beginning Ending DelDOT Balance Increases Decreases Balance
Capital Assets, Not Being Depreciated
Land $ 276,761 $ 7,115 $ - $ 283,876
Infrastructure 3,564,347 105,903 - 3,670,250
Construction In Progress 2,487 653 - 3,139
Total Capital Assets, Not Being
Depreciated 3,843,595 113,671 - 3,957,266
Capital Assets, Being Depreciated
Buildings & Improvements 104,837 4,801 - 109,638
Furniture & Equipment 254,506 28,137 (13,743) 268,900
Total Capital Assets, Being Depreciated 359,343 32,938 (13,743) 378,538
Less Accumulated Depreciation For:
Buildings & Improvements (31,112) (3,255) - (34,367)
Furniture & Equipment (136,973) (22,077) 12,727 (146,323)
Total Accumulated Depreciation (168,085) (25,332) 12,727 (180,690)
Total Capital Assets, Being
Depreciated, Net 191,258 7,606 (1,016) 197,848
Total Capital Assets $ 4,034,853 $ 121,277 $ (1,016) $ 4,155,114
Business-type Activities Capital
Assets, Net $ 4,034,853 $ 121,277 $ (1,016) $ 4,155,114
Capital Assets(Expressed in Thousands)
87

State of Delaware Notes to the Financial Statements, June 30, 2013
Depreciation expense was charged to the following primary government functions as follows:
NOTE 13 RISK MANAGEMENT The State is exposed to various risks of losses related to workers’ compensation, employee health-care and accident, automobile accident, police professional malpractice and property and casualty claims. It is the policy of the State not to purchase commercial insurance to cover these risks. Instead, State management believes it is more economical to manage its risk internally and thus, covers all claim settlements and judgments out of its general fund. The State continues to carry commercial insurance for all other risks of loss, including general liability and the remainder of the property and casualty liability. There have been no significant reductions in insurance coverage from prior years. In the past three years of insured coverage, settled claims have not exceeded commercial coverage. Claim liabilities are reported when it is probable that a loss has occurred and the amount of that loss can be reasonably estimated. Liabilities include an amount for claims that have been incurred but not reported. Because actual claim liabilities depend on such complex factors as inflation, changes in legal doctrines and damage awards, the process does not result in an exact amount. Claim liabilities are reevaluated annually to take into consideration recently settled claims, the frequency of claims and other economic and social factors. The management of the State estimates that the amount of actual or potential claims against the State at June 30, 2013, for workers’ compensation, automobile accident and health-care claim liabilities is $207.8 million. The claim liabilities relating to health-care totaling $41.9 million have been recorded as accrued liabilities in governmental activities. The liability for workers’ compensation and automobile accident liabilities totaling $165.9 million has been recorded in governmental activities as claims and judgments. The current portion of these claims totals $37.4 million. Other claim liabilities relating to police professional malpractice and property and casualty were not recorded at June 30, 2013 as the total of these liabilities were not material to the financial statements. Changes in the balances of claim liabilities during fiscal years 2013 and 2012 were as follows:
Governmental Activities:General Government 25,527$ Health and Children's Services 6,239 Judicial and Public Safety 14,630 Natural Resources and Environmental Control 4,352 Labor 99 Education 60,854
Total Depreciation Expense - Governmental Activities 111,701$
Business-type Activities:
DelDOT 25,332$
Total Depreciation Expense - Business-type Activities 25,332$
(Expressed in Thousands)Depreciation Expense
88

State of Delaware Notes to the Financial Statements, June 30, 2013
Current YearBeginning Claims and Ending
Fiscal Balance Changes in Actual Claim BalanceYear July 1 Estimates Payments June 302012 $ 176,929 $ 639,514 $ (617,548) $ 198,895 2013 $ 198,895 $ 640,376 $ (631,434) $ 207,837
Changes in Claim Liabilities(Expressed in Thousands)
DelDOT The Delaware Transit Corporation (DTC) maintains coverage on auto insurance through both the retention of risk and the purchase of commercial insurance. The DTC has recorded $9.8 million of claim liabilities as Insurance Loss Reserve. Of this amount, $2.5 million has been recorded as current. NOTE 14 OTHER POST-EMPLOYMENT BENEFITS (OPEB) Plan Description On July 1, 2007, the Delaware OPEB Trust Fund (OPEB Trust) was established pursuant to Section 115 of the Internal Revenue Code and separate from the DPERS. The OPEB Trust is administered by the DPERS Board of Directors. Policy for and management of the OPEB benefits provided to retirees are the responsibility of the State. No stand-alone financial report is issued for the OPEB Trust. The OPEB Trust is a single-employer defined benefit plan. The OPEB Trust provides retirement medical coverage to pensioners and their eligible dependents in the State Employees’, Judiciary, New State Police, and Closed State Police pension plans. The State of Delaware has elected to assume the OPEB liability on behalf of employees who participate in the State’s pension plan but are employed at outside agencies including Delaware State University, University of Delaware, Delaware State Housing Authority, Delaware Charter Schools and Delaware Solid Waste Authority. Due to this assumption, the State is a single employer defined benefit plan. Membership of the plan consisted of the following at June 30, 2013:
Retirees and Beneficiaries Receiving Benefits 19,863
Terminated Plan Members Entitled to But Not Yet Receiving the Benefits 2,575
Active Eligible Plan Members 36,316
Total 58,754
Substantially all State employees become eligible for post retirement benefits if they reach retirement age while working for the State. The costs of providing these benefits are shared between the State and the retired employee. The plan provisions are as follows:
89

State of Delaware Notes to the Financial Statements, June 30, 2013
Eligibility:
State Employees: Early Retirement:
Age 55 with 15 years of service or any age with 25 years of service Normal Retirement:
Age 62 with 5 years of service or age 60 with 15 years of service or any age with 30 years of service
Benefits: During the fiscal year ended June 30, 2013, the State provided health insurance options through several providers. Spouse and Survivor Coverage: Both are available under any of the plan options with similar retiree contributions. Employee Contributions: If hired prior to July 1, 1991, no contributions are required. If hired on or after July 1, 1991 (except disability pension), contributions depend on years of service.
Retiree Contributions (hired on or after July 1, 1991):
Years of Service Percent of Premium Paid by StateLess than 10 0%
10 - 14 50%
15 - 19 75%
20 or more 100% Funding Policy The State of Delaware funds the OPEB Trust for current retirees on a pay-as-you-go basis along with funding for future benefits at a rate that is approved in the annual budget, but not actuarially determined. Additional funding has also been provided on an ad hoc basis. By State Statute Chapter 52, Title 29 of the Delaware Code, contribution requirements of plan members and the government are established and may be amended by the State Legislature. Funds are recorded in the OPEB Trust for the payment of retiree health care claims and administrative and investment expenses. Administrative costs are financed through investment earnings. State appropriations, other employer contributions, and retiree contributions for health care are recorded in the OPEB Trust. The funds available are invested under the management of the DPERS Board of Pension Trustees, which acts as the Board of Trustees for the OPEB Trust and is responsible for the financial management of the OPEB Trust.
90

State of Delaware Notes to the Financial Statements, June 30, 2013
Contributions The contribution rates for the employer and retiree are established annually by the budgeting process of the State. Those rates include an employer contribution based on projected pay-as-you-go financing requirements as a percent of covered payroll, with an additional amount to prefund benefits, which is not actuarially determined. For fiscal year 2013, the State contribution in relation to the annual required contribution (ARC) totaled $193.1 million. Retiree contribution rates are affected by the retiree date of hire, with eligible retirees hired after June 30, 1991 paying a proportionately higher rate if their years of service total less than 20. Retiree contributions for health coverage totaled $7.4 million. Annual OPEB Cost and Net OPEB Obligation The State’s annual OPEB cost is calculated based on the annual required contribution (ARC) of the employer, an amount which is actuarially determined. The ARC represents a level of funding that, if paid on an ongoing basis, is projected to cover normal cost each year and amortize any unfunded actuarial liabilities over a period of thirty years. Amounts “required” but not actually set aside to pay for these benefits are accumulated as part of the net OPEB obligations. The following table shows the components of the State’s annual OPEB obligation for fiscal year 2013 and 2012, the amount actually contributed to the plan, and the State’s net OPEB obligation (dollar amounts in millions):
Governmental Business-TypeTotal Activities Activities *
Net OPEB Obligation at June 30, 2011 1,317.1$ 1,204.1$ 113.0$
Annual Required Contribution 563.8 515.0 48.8
Adjustment to Annual Required Contribution (51.2) (46.7) (4.5)
Subtotal 1,829.7 1,672.4 157.3
Employer Contributions (187.3) (175.9) (11.4)
Net OPEB Obligation at June 30, 2012 1,642.4$ 1,496.5$ 145.9$
Governmental Business-TypeTotal Activities Activities *
Net OPEB Obligation at June 30, 2012 1,642.4$ 1,496.5$ 145.9$
Annual Required Contribution 483.8 440.4 43.4
Adjustment to Annual Required Contribution (64.1) (58.0) (6.1)
Subtotal 2,062.1 1,878.9 183.2
Employer Contributions (209.2) (196.9) (12.3)
Net OPEB Obligation at June 30, 2013 1,852.9$ 1,682.0$ 170.9$
* This column includes DTC's OPEB activity.
The State’s annual OPEB cost, the percentage of annual OPEB cost contributed to the plan, and the net OPEB obligation for the fiscal years 2013, 2012, and 2011 are as follows (dollar amounts in millions):
91

State of Delaware Notes to the Financial Statements, June 30, 2013
Fiscal Year Annual Percentage of NetEnded OPEB Annual OPEB Cost OPEB
June 30 Cost Contributed Obligation2013 397.8$ 52% 1,777.5$
2012 490.5 38% 1,581.5
2011 488.1 37% 1,272.0
Funded Status and Funding Progress As of June 30, 2013, the plan was 3.7% funded. The actuarial accrued liability for benefits was $5,988.0 million, and the actuarial value of assets was $222.0 million, resulting in an unfunded actuarial accrued liability (UAAL) of $5,766.0 million for the primary government. The covered payroll (annual payroll of active employees covered by the plan) was $1,944.0 million, and the ratio of the UAAL to the covered payroll was 297%. Actuarial valuations of an ongoing plan involve estimates of the value of reported amounts and assumptions about the probability of occurrence of events far into the future. Examples include assumptions about future employment, mortality, and the healthcare cost trend. Amounts determined regarding the funded status of the plan and the annual required contributions of the employer are subject to continual revision as actual results are compared with past expectations and new estimates are made about the future. The schedule of funding progress, presented as required supplementary information following the notes to the basic financial statements, will present information about whether the actuarial value of plan assets is increasing or decreasing over time relative to the actuarial accrued liabilities for benefits.
Actuarial Methods and Assumptions Projections of benefits for financial reporting purposes are based on the substantive plan (the plan as understood by the employer and the OPEB plan members) and include the types of benefits provided at the time of each valuation and the historical pattern of sharing of benefit costs between the employer and plan members to that point. The actuarial methods and assumptions used include techniques that are designed to reduce the effects of short-term volatility in actuarial accrued liabilities and the actuarial value of assets, consistent with the long-term perspective of the calculations.
In the June 30, 2013, actuarial valuation, the entry age normal actuarial cost method was used. Investments are valued at market fair value. The actuarial assumptions included a 4.25% investment rate of return, which is a blended rate of the expected long-term investment returns on plan assets and on the State’s own investments calculated based on the funded level of the plan at the valuation date, and an initial medical inflation rate of 4.25% with an ultimate rate of 4.25%. The UAAL is being amortized as a level percentage of projected payroll on a level percent open basis over 30 years using a 3.25% rate of salary increase. Delaware Transit Corporation (DTC) In June 2010, the Delaware Transit Corporation OPEB Trust Fund (the DTC OPEB Trust) was established pursuant to Section 115 of the Internal Revenue Code. The DTC OPEB Trust is
92

State of Delaware Notes to the Financial Statements, June 30, 2013
administered by DTC. Policy for and management of the OPEB benefits provided to retirees are the responsibility of DTC. No stand-alone financial report is issued for the DTC OPEB Trust. Plan Description DTC provides continuation of medical insurance coverage to employees that retire. Based on collective bargaining agreements, any full-time employee is eligible to participate in the plan if the employee retires after meeting the eligibility requirements, which are: 1) age 65 with 5 years of service or after working for 25 years for contract employees or 2) age 55 with 10 years of service or age 62 with five years of service for noncontract employees. Disabled employees must reach eligibility. Surviving spouses of participants are allowed access to the plan and receive the same subsidy as retirees. DTC subsidizes the medical premium. The subsidized percentage is 90% of published rates for retirees less than age 65 and 100% for retiree’s age 65 or greater. DTC subsidizes 100% of the dental and vision coverage for noncontract employees. Contract employees are allowed to access to dental and vision coverage, but must pay the full premium. Life insurance is provided to retirees. Retirees under age 70 receive $6,000 in coverage. Once the participant reaches age 70, the coverage drops to $5,000. DTC must contribute $0.23 per month per $1,000 of coverage for each employee. The numbers of participants are 799 active employees and 158 retirees as of June 30, 2013, the effective date of the other post-employment benefit (OPEB) actuarial valuation report. Funding Policy DTC funds the DTC OPEB Trust on a pay-as-you-go basis with additional funding on an ad hoc basis. Funds are recorded in the DTC OPEB Trust for the payment of retiree healthcare claims and administrative and investment expenses. Administrative costs are financed through investment earnings. Employer contributions and retiree contributions for healthcare are recorded in the DTC OPEB Trust. The funds available are invested under DTC’s management, which acts as the Trustee and is responsible for the financial management of the DTC OPEB Trust. The cash basis costs associated with these benefits was $1.2 million for the fiscal year ended June 30, 2013. Annual OPEB Cost and Net Obligation DTC’s annual OPEB cost (expense) is calculated based upon the annual required contribution (ARC) of the employer, an amount which is actuarially determined. The ARC represents a level of funding that, if paid on an ongoing basis, is projected to cover the normal cost each year and amortize any unfunded actuarial liabilities (or funding excess) over a period not to exceed 30 years. The following table shows the components of DTC’s OPEB cost for the year, the amount actually contributed to the plan, and changes to DTC’s net OPEB obligation (expressed in thousands):
93

State of Delaware Notes to the Financial Statements, June 30, 2013
Annual Required Contribution 16,072$
Interest on Net OPEB Obligation 2,434
Adjustment to Annual Required Contribution (2,835)
Annual OPEB Cost (Expense) 15,671
Contributions Made (1,194)
Increase in Net OPEB Obligation 14,477
Net OPEB Obligation - Beginning of Year 61,021
Net OPEB Obligation - End of Year 75,498$
DTC’s annual OPEB cost, the percentage of annual OPEB cost contributed to the plan, and the net OPEB obligation is as follows (expressed in thousands):
Fiscal Year Annual Percentage of NetEnded OPEB Annual OPEB Cost OPEB
June 30 Cost Contributed Obligation2013 15,671$ 7.62% 75,498$
2012 17,074 6.84% 61,021
2011 15,772 6.61% 45,115
Funded Status and Funding Progress As of July 1, 2012, the most recent actuarial valuation date, the Plan was 1.4% funded. The actuarial accrued liability was $121.6 million and the actuarial value of the assets was $1.7 million, resulting in an unfunded actuarial accrued liability of $119.9 million. The covered payroll (annual payroll of active employees covered by the plan) was $34.5 million and the ratio of the UAAL to the covered payroll was 347.1%. Actuarial valuations of an ongoing plan involve estimates of the value of reported amounts and assumptions about the probability of occurrence of events far into the future. Examples include assumptions about future employment, mortality, and the healthcare cost trend. Amounts determined regarding the funded status of the plan and the annual required contributions of the employer are subject to continual revision as actual results are compared with past expectations and new estimates are made about the future. Actuarial Methods and Assumptions Projections of benefits for financial reporting purposes are based on the substantive plan (the plan as understood by the employer and plan members) and include the types of benefits provided at the time of each valuation and the historical pattern of sharing of benefit costs between the employer and plan members to that point. The actuarial methods and assumptions used include techniques that are designed to reduce short-term volatility in actuarial accrued liabilities and the actuarial value of assets, consistent with the long-term perspective of the calculations. In the July 1, 2012 actuarial valuation, the projected unit credit method was used with linear pro-ration to assumed benefit commencement. The actuarial assumptions included a 4.0% investment rate of return, 3.0% payroll growth rate, a 2.5% inflation rate, and a healthcare cost trend rate of 8.0% initially, incrementally down to 5.9% after 10 years. The ultimate healthcare cost trend rate
94

State of Delaware Notes to the Financial Statements, June 30, 2013
will remain constant at 4.2% after 2098. The unfunded liability is being amortized as a level percentage of payrolls over a 30-year closed amortization period. NOTE 15 PENSIONS Pension Plans The State Board of Pension Trustees (Board) administers the following plans/funds (the Plans) of the Delaware Public Employees’ Retirement System (DPERS) as described below:
� State Employees’ Pension Plan;
� Special Fund;
� New State Police Pension Plan;
� Judiciary Pension Plans (Closed and Revised);
� County & Municipal Police and Firefighters’ Pension Plans;
� County & Municipal Other Employees’ Pension Plan;
� Delaware Volunteer Firemen’s Fund;
� Diamond State Port Corporation Pension Plan; and
� Closed State Police Pension Plan. With the exception of the Diamond State Port Corporation Pension Plan, the State’s General Assembly is responsible for setting benefits and contributions and amending plan provisions; administrative rules and regulations are adopted and maintained by the Board. The Board of Directors for the Diamond State Port Corporation is responsible for setting benefits and contributions and amending their plan provisions. The Plans of DPERS are considered part of the State’s financial reporting entity and are included in the accompanying financial statements as pension trust funds in the fiduciary funds. All of the investment assets of the plans and funds, with the exception of the Closed State Police Pension Plan and the Delaware Volunteer Firemen’s Fund, are pooled and invested in a common DPERS Master Trust (Master Trust). Each of the plans or funds share in the Master Trust based on funds contributed and earnings or losses allocated. Individual investments in the Master Trust are not specifically identified to the various plans or funds. Additionally, the following non-DPERS retirements funds/plans, described below, have been established under the custody of the Board for investment purposes only:
� County & Municipal Police and Firefighters’ COLA Fund;
� Post-Retirement Increase Fund;
� Delaware Local Government Retirement Investment Pool.
The Delaware Local Government Retirement Investment Pool (DELRIP) is presented separately as investment trust funds in the fiduciary funds statement of net position and statement of changes in net position. The remaining non-DPERS retirement funds/plans are included in the pension trust fund.
95

State of Delaware Notes to the Financial Statements, June 30, 2013
Non-DPERS Fund Descriptions and Contributions County & Municipal Police and Firefighters’ COLA Fund During 1990, the State passed legislation which established a mechanism for funding post-retirement increases granted by employers who participate in the County & Municipal Police and Firefighters’ Pension Plans. This mechanism allows the State to appropriate funds separate to a cost of living adjustment fund (COLA Fund) managed by the Board. The funds are generated by a 0.25% tax on the value of insurance premiums written within the State. The proceeds of the tax are transferred to the State and local governments on a per member basis. In 1994, the New State Police Plan began receiving funding for post-retirement increases from the Post-Retirement Increase Fund. Since that time, funds calculated for the State Police membership were re-directed into the COLA Fund. In accordance with Section 708 (c), Title 18 of the Delaware Code, when a participating employer grants a post-retirement increase for a plan outside of the DPERS County & Municipal Plans, funds are transferred from the COLA Fund to the employer. The participating employer must provide funds to match the State’s contribution. Allocated funds that are unused will be reverted to the State General Fund. Post-Retirement Increase Fund (PRI) The State passed legislation which established a mechanism for funding ad hoc post-retirement increases granted by the General Assembly to members retired under the State Employees’ Plan, the New State Police Plan, and the Judiciary Plans (Closed and Revised) beginning in fiscal year 1994. The mechanism allows the State to appropriate actuarially determined employer contributions to a separate PRI fund managed by the Board. The actuary uses the current actuarial assumptions, methods, and population data to calculate the estimated additional liability resulting from the potential benefit increases. When the Legislature grants an ad hoc post-retirement adjustment, funds are transferred from this PRI fund on a monthly basis based on a five-year actuarial funding schedule to the appropriate pension plan from which the additional benefits are disbursed. For the fiscal year ended June 30, 2013, $26.6 million was transferred to the appropriate plans in DPERS. As of June 30, 2013 recently granted post-retirement increases have outstanding liabilities totaling $106.1 million, which will be funded by the State and transferred to the appropriate plans over the next four fiscal years as follows:
Expressed inFiscal Year Thousands
2014 $ 27,536 2015 28,521 2016 29,542 2017 20,536
Total $ 106,135
The Board adopts actuarially determined funding for the Post-Retirement Increase Fund. Funding for fiscal year 2013 was 1.49% of covered payroll. Funding for fiscal year 2014 will be 1.51%.
96

State of Delaware Notes to the Financial Statements, June 30, 2013
Local Government Retirement Investment Pool (DELRIP) In June 1996, the State established DELRIP in the custody of the Board to allow local governments the option to pool their pension assets with the System for investment purposes. The DELRIP is an external investment pool that allows local governments within the State to potentially maximize their rate of return and reduce administrative expenses related to the investment of funds. Participation in the pool is voluntary. There were three participating entities in DELRIP as of June 30, 2013, which comprise the pool in its entirety: Sussex County and the Towns of Elsmere and Newport. DELRIP is subject to the oversight of the System's Investment Committee and not subject to the regulatory oversight of the Securities and Exchange Commission (SEC). The System has not provided or obtained any legally binding guarantees during the year to support the value of shares. The fair value of the shares in the pool is determined in the same manner as the value of the Master Trust shares. Since this pool is a portion of the total System, the same accounting and investment policies apply. Plan Membership, Benefit and Contribution Provisions A description of the individual plans including eligibility provisions, types of benefits and contribution requirements are set forth in general terms below and on the following pages. Detailed information regarding these plans is available in the Delaware Code and in the Rules and Regulations of the Board. State Employees’ Pension Plan Plan Description and Eligibility: The State Employees’ Pension Plan is a cost-sharing single employer defined benefit plan that covers virtually all full-time or regular part-time employees of the State, including employees of other affiliated entities. There are two tiers within this plan:
1) Employees hired prior to January 1, 2012 2) Employees hired on or after January 1, 2012
Service Benefits: Final average monthly compensation multiplied by 2.0% and multiplied
by years of credited service prior to January 1, 1997, plus final average compensation multiplied by 1.85% and multiplied by years of credited service after December 31, 1996, subject to minimum limitations. For this plan, final average monthly compensation is the monthly average of the highest three years of compensation.
Vesting: Pre-2012 date of hire: 5 years of credited service. Post-2011 date of hire: 10 years of credited service.
97

State of Delaware Notes to the Financial Statements, June 30, 2013
Retirement: Pre-2012 date of hire: Age 62 with 5 years of credited service; age 60 with
15 years of credited service; or after 30 years of credited service at any age.
Post-2011 date of hire: age 65 with at least 10 years of credited service; Age 60 with 20 years of credited service; 30 years of credited service at any age.
Disability Benefits: Pre-2012 date of hire: Same as Service Benefits. Employee must have 5
years of credited service. In lieu of disability pension benefits, over 90% of the members of this plan opted into a disability insurance program offered by the State effective January 1, 2006.
Post-2011 date of hire- in the Disability Insurance Program. Survivor Benefits: If employee is receiving a pension, the eligible survivor receives 50% of
pension (or 75% with 3% reduction of benefit); if employee is active with at least 5 years of credited service, eligible survivor receives 75% of the benefit the employee would have received at age 62.
Contributions:
� Employer - Determined by Board of Pension Trustees.
� Pre -2012 date of hire Member - 3% of earnings in excess of $6,000.
� Post-2011 date of hire Member- 5% of earnings in excess of $6,000.
Burial Benefit: $7,000 per member. Special Fund Plan Description and Eligibility: The Special Fund provides certain benefits granted to individuals through legislation passed by the General Assembly. Service Benefits: Defined by special legislation. Vesting: Defined by special legislation. Retirement: Defined by special legislation. Disability Benefits: Defined by special legislation. Survivor Benefits: Same as State Employees' Plan. Contributions: Employer contributions are actuarially determined and fully funded in
advance by the General Assembly.
98

State of Delaware Notes to the Financial Statements, June 30, 2013
Burial Benefit: $7,000 per member. New State Police Pension Plan Plan Description and Eligibility: The New State Police Pension Plan is a single-employer defined benefit plan that covers all State police officers appointed on or after July 1, 1980. Service Benefits: 2.5% of final average monthly compensation multiplied by years of
credited service up to 20 years, plus 3.5% of final average monthly compensation multiplied by years of service in excess of 20 years. For this plan, final average monthly compensation is the monthly average of the highest three consecutive years of compensation.
Vesting: 10 years of credited service at age 62. Retirement: Age 62 with 10 years of credited service; age plus credited service (but not
less than 10 years) equals 75; or 20 years of credited service. Disability Benefits: Duty – Total Disability - 75% of final average compensation plus 10% for
each dependent not to exceed 25% for all dependents. Partial Disability - calculated the same as Service Benefits, subject to minimum 50% of final average compensation.
Non-Duty – same as Service Benefits. Survivor Benefits: If employee is receiving a pension, the eligible survivor receives 50% of
pension; if employee is active, eligible survivor receives 75% of compensation.
Contributions:
� Employer - Determined by Board of Pension Trustees.
� Member - 7% of compensation.
Burial Benefit: $7,000 per member. Judiciary Pension Plans (Closed and Revised) Plan Description and Eligibility: The Closed Judiciary Pension Plan is a single-employer defined benefit plan that covers members of State Judiciary appointed before July 1, 1980.
99

State of Delaware Notes to the Financial Statements, June 30, 2013
The Revised Judiciary Pension Plan is a single-employer defined benefit plan that covers members of State Judiciary appointed on or after July 1, 1980 or members appointed before July 1, 1980 who accept the provisions of this Plan. Assets of one plan can be used to satisfy the liabilities of the other plan. Service Benefits:
Revised - 1/24th of final average monthly compensation multiplied by years of service up to 12 years, plus 1/48th of final average monthly compensation, multiplied by years of service from 13 to 24 years, subject to maximum limitations. For this plan, final average monthly compensation is the monthly average of the highest three consecutive years of compensation.
Vesting: 12 years of credited service. Retirement:
Revised - Age 62 with 12 years of credited service, or any age with 24 years of credited service.
Disability Benefits: Same as Service Benefits. Survivor Benefits:
Closed - If employee is receiving a pension, the eligible survivor receives 2/3 of pension; if employee is active with 12 years of credited service, then eligible survivor receives 2/3 of pension the employee would have been eligible to receive.
Revised - If employee is receiving a pension, the eligible survivor receives 50% of pension (or 2/3 with 2% reduction of benefit); if employee is active with at least 5 years of credited service, eligible survivor receives 2/3 of the benefit the employee would have received at age 62.
Contributions:
� Employer - Determined by Board of Pension Trustees.
� Member:
Closed - $500 per year for the first 25 years of service. Revised - 3% of earnings that exceed $6,000 per year, plus 2% of earnings that exceed
the Social Security Wage Base for the first 24 years of service. Burial Benefit: Not applicable.
100

State of Delaware Notes to the Financial Statements, June 30, 2013
County & Municipal Police and Firefighters’ Pension Plans Plan Description and Eligibility: County & Municipal Police and Firefighters’ Pension Plans, both FICA and Non-FICA, are cost-sharing multiple-employer defined benefit plans that cover police officers and firefighters employed by a county or municipality of the State which has become part of the Plan. Service Benefits: 2.5% of final average monthly compensation multiplied by years of
credited service up to 20 years, plus 3.5% of final average monthly compensation multiplied by years of service in excess of 20 years. For this plan, final average monthly compensation is the monthly average of the highest three consecutive years of compensation.
Vesting: 5 years of credited service. Retirement: Age 62 with 5 years of service; age plus credited service (but not less than
10 years) equals 75; or 20 years of credited service. Disability Benefits: Duty - Total Disability - 75% of final average compensation plus 10% for each
dependent not to exceed 25% for all dependents; Partial Disability - calculated the same as Service Benefits, subject to
minimum 50% of final average compensation. Non-Duty - Same as Service Benefits. Survivor Benefits: If employee is receiving a pension, then eligible survivor receives 50% of
pension; if employee is active, eligible survivor receives 50% of pension the employee would have received at age 62.
Contributions:
� Employer - Determined by Board of Pension Trustees.
� Member - 7% of compensation.
Burial Benefit: Not applicable. County and Municipal Other Employees' Pension Plan Plan Description and Eligibility: County and Municipal Other Employees' Pension Plan is a cost-sharing multiple employer defined benefit plan that covers employees of counties or municipalities which have become part of the Plan.
101

State of Delaware Notes to the Financial Statements, June 30, 2013
Service Benefits: 1/60th of final average monthly compensation multiplied by years of credited service, subject to maximum limitations. For this plan, final average monthly compensation is the monthly average of the highest five years of compensation.
Vesting: 5 years of credited service.
Retirement: Age 62 with 5 years of credited service, age 60 with 15 years of credited
service; or after 30 years of credited service. Disability Benefits: Same as Service Benefits. Employee must have 5 years of credited service. Survivor Benefits: If employee is receiving a pension, then eligible survivor receives 50% of
pension; if the employee is active, eligible survivor receives 50% of pension the employee would have received at age 62.
Contributions:
� Employer - Determined by Board of Pension Trustees.
� Member - 3% of earnings in excess of $6,000. Burial Benefit: Not applicable. Delaware Volunteer Firemen’s Fund Plan Description and Eligibility: The Delaware Volunteer Firemen’s Fund is a cost-sharing length of service award plan that covers all actively participating volunteers of fire departments, ladies auxiliaries, or ambulance organizations within the State. Service Benefits: $5 multiplied by years of credited service (not to exceed 25 years) per
month. Vesting: 10 years of credited service. Retirement: Age 60 with 10 years credited service. Disability Benefits: Not applicable. Survivor Benefits: Not applicable. Contributions:
� Employer - Determined by Board of Pension Trustees.
102

State of Delaware Notes to the Financial Statements, June 30, 2013
� Member - $60 per member per calendar year.
Burial Benefit: Not applicable. Diamond State Port Corporation Pension Plan Plan Description and Eligibility: The Diamond State Port Corporation Pension Plan is a single-employer defined benefit plan which covers all employees of the Diamond State Port Corporation. Service Benefits: 1.75% of final average monthly compensation multiplied by the years of
credited service (not to exceed 30 years). For this plan, final average monthly compensation is the monthly average of the highest consecutive five years of compensation within the last ten years of employment.
Vesting: 5 years of credited service. Retirement: Age 65 with 5 years of credited service, or age (not less than 55 years)
plus credited service equals 90. Disability Benefits: Same as Service Benefits. Employee must have 15 years of credited
service. Survivor Benefits: If employee is receiving a pension, the eligible survivor receives 50% of
pension; if employee is active with at least 15 years of credited service, then eligible survivor receives 50% of pension the employee would have received at age 65.
Contributions:
� Employer - Determined by Board of Pension Trustees.
� Member - 2% of compensation. Burial Benefit: Not applicable. Closed State Police Pension Plan Plan Description and Eligibility: The Closed State Police Pension Plan is a single-employer defined benefit plan that covers all State police officers appointed before July 1, 1980. Survivor Benefits: If employee is active or is receiving a service or service-related disability
pension, the eligible survivor receives 75% of pension; if employee is receiving a non-service related disability pension; eligible survivor
103

State of Delaware Notes to the Financial Statements, June 30, 2013
receives 50% of pension. Contributions:
� Employer - Funded on a pay-as-you-go basis.
Burial Benefit: $7,000 per member. Historical Trend Information Historical trend information for the current year and the preceding five years is designed to provide information about progress made by the individual plans in accumulating sufficient assets to pay benefits when due is presented in the separately issued financial report of the DPERS. The DPERS issues a publicly available financial report that includes financial statements and required supplementary information for each of the individual plans and funds identified above. The financial report may be obtained by writing to the State Board of Pension Trustees and Office of Pensions, McArdle Building, Suite 1, 860 Silver Lake Boulevard, Dover, Delaware 19904-2402.
104

State of Delaware Notes to the Financial Statements, June 30, 2013
Schedule of Annual Pension Cost, Actuarial Methods and Assumptions(Expressed in Thousands)
Closed NewState State State
Plan Employees' Special Police Police Judiciary
Annual Pension Cost 160,651 N/A 25,696 9,292 2,762
Actuarial Valuation Date 6/30/2013 6/30/2013 6/30/2013 6/30/2013 6/30/2013
Actuarial Cost Method Entry Age Entry Age Entry Age Entry Age Entry Age
Normal Normal Normal Normal Normal
Level Percent
Amortization Method Closed for Plan Level Dollar Level Dollar Level Percent Level Percent
Bases & Open for Open Closed Closed Closed
Aggregate
Gain/Loss
Remaining Amortization
Period 20 years (1) 10 years 24 years 20 years (1) 8.26 years (1)
Asset Valuation Method 5-year 5-year 5-year 5-year 5-year
Smoothed Smoothed Smoothed Smoothed Smoothed
Market Market Market Market Market
Actuarial Assumptions:
Investment Rate of Return 7.5% 7.5% 7.5% 7.5% 7.5%
Projected Salary Increases 1 3.8% to 11.8% N/A 4.2% to 4.8% 4.3% to 11.8% 3.8% to 12.5%
Cost-of-Living Adjustments Ad hoc Ad hoc Based on CPI Ad hoc Ad hoc
County & County &Diamond Municipal Municipal DelawareState Port Police and Other Volunteer
Corporation Firefighters' Employees Firemen's
854 8,671 1,604 2,002
6/30/2013 6/30/2013 6/30/2013 6/30/2013
Entry Age Entry Age Entry Age Entry Age
Normal Normal Normal Normal
Level Percent Level Percent Level Percent Level Dollar
Open Open Open Open
15 years 10 years 10 years 15 years
5-year 5-year 5-year 5-year
Smoothed Smoothed Smoothed Smoothed
Market Market Market Market
7.5% 7.5% 7.5% 7.5%
4.3% 4.3% to 11.8% 3.8% to 9.6% N/A
Ad Hoc Ad Hoc Ad Hoc Ad Hoc
1
Plan
Excludes liability and amortization payments due to cost-of-living adjustments. This
liability is funded from the Post-Retirement Increase Fund. Each Post-Retirement
Increase is funded over 5 years. N/A: Not applicable.
Annual Pension Cost
Actuarial Valuation Date
Actuarial Cost Method
Amortization Method
Remaining Amortization
Period
Asset Valuation Method
Actuarial Assumptions:
Investment Rate of Return
Projected Salary Increases 1 Cost-of-Living Adjustments
105

State of Delaware Notes to the Financial Statements, June 30, 2013
NET PENSION OBLIGATION (NPO) The Annual Pension Cost (APC) and Net Pension Obligation (NPO) for the Closed State Police Pension Plan for the fiscal years ended June 30, 2013, 2012, and 2011 are as follows:
Fiscal Year Fiscal Year Fiscal YearEnded Ended Ended
June 30, June 30, June 30,2013 2012 2011
Annual Required Contribution $ 25,696 $ 24,678 $ 26,638 Interest on Net Pension Obligation 8,850 8,833 9,246 Adjustment to Annual Required Contribution (10,391) (10,218) (10,318)
Annual Pension Cost 24,155 23,293 25,566
Less Contributions Made (23,064) (23,064) (23,367)
Increase in Net Pension Obligation 1,091 229 2,199
Net Pension Obligation, Beginning of Year 117,997 117,768 115,569
Net Pension Obligation, End of Year $ 119,088 $ 117,997 $ 117,768
Net Pension Obligation (NPO)(Expressed in Thousands)
Annual Percent NetPlan Year Contribution Pension Of APC Pension
Ended Made Cost (APC) Contributed Obligation
State Employees' 6/30/2013 $ 160,651 $ 160,651 100.00% $ -
6/30/2012 147,464 147,464 100.00% -
6/30/2011 128,019 128,019 100.00% -
County & Municipal 6/30/2013 $ 8,671 $ 8,671 100.00% $ -
Police and Firefighters' 6/30/2012 9,265 9,265 100.00% -
6/30/2011 7,569 7,569 100.00% -
County & Municipal 6/30/2013 $ 1,604 $ 1,604 100.00% $ -
Other Employees' 6/30/2012 1,362 1,362 100.00% -
6/30/2011 1,186 1,186 100.00% -
6/30/2013 $ 1,456 $ 2,002 72.73% $ 4,246
6/30/2012 1,311 1,896 69.15% 3,833
6/30/2011 1,220 1,762 69.24% 3,352
6/30/2013 $ 2,762 $ 2,762 100.00% $ -
6/30/2012 2,674 2,674 100.00% -
6/30/2011 2,557 2,557 100.00% -
6/30/2013 $ 9,292 $ 9,292 100.00% $ -
6/30/2012 8,309 8,309 100.00% -
6/30/2011 7,810 7,810 100.00% - 1
6/30/2013 $ 23,064 $ 25,696 89.76% $ 119,088
6/30/2012 23,064 24,678 93.46% 117,997
6/30/2011 23,367 26,638 87.72% 117,768
6/30/2013 $ 854 $ 854 100.00% $ -
6/30/2012 814 814 100.00% -
6/30/2011 704 704 100.00% -
Judiciary
Closed State Police
Diamond State Port
Corporation
Three-Year Trend Information(Expressed in Thousands)
New State Police
Delaware Volunteer
Firemen's
106

State of Delaware Notes to the Financial Statements, June 30, 2013
Delaware Transportation Authority Generally, employees of the Expressways Operations/Toll Administration are covered under DPERS. The Delaware Transit Corporation (DTC), a subsidiary public corporation of the Delaware Transportation Authority, contributes to two single-employer defined benefit plans consisting of the Contributory Pension Plan and the Delaware Transit Corporation (DTC) Pension Plan. Each plan provides retirement, disability and death benefits to plan members and beneficiaries. Each plan issues a publicly available financial report that includes financial statements and required supplementary information. Financial data for these plans has not been included in the fiduciary statements due to immateriality. The trustees of each plan establish and may amend the contribution requirements of plan members and DTC. The most recent information available for DTC’s annual pension cost and related information for each Plan is as follows:
Schedule of Annual Pension Cost, Actuarial Methods and Assumptions (Expressed in Dollars)
DTC ContributoryPension Pension
Plan Plan Plan
Contribution Rates:
Employer 8.70%* 5.00%
Participants 3.00% 5.00%
Annual Pension Cost $ 962,682 $ 788,421
Contributions Made $ 963,253 $ 1,080,068
Actuarial Valuation Date 07/01/12 01/01/13
Actuarial Cost Method Frozen Initial Entry Age
Liability Normal
Remaining Amortization
Period 30 15
Asset Valuation Method Market Five-Year
Smoothed Market
Actuarial Assumptions:
Investment Rate of Return 7.50% 7.00%
Projected Salary Increases 2.50% 4.00%
* Actuarially determined
Note: Effective July 1, 2012 , an amendment was made to the DTC
Pension Plan which states that any eligible employee who participates in
the Plan shall make after-tax contributions in the amount equal to 3% of
their eligible compensation in excess of $6,000.
107

State of Delaware Notes to the Financial Statements, June 30, 2013
DTC’s annual pension cost and net pension obligation to the DTC Pension and Contributory Pension Plan were as follows:
Schedule of Annual Pension Cost, Actuarial Methods and Assumptions (Expressed in Dollars)
DTC ContributoryPension Pension
Plan PlanFor the Year Ended 6/30/2013 12/31/2012Annual Required Contribution (ARC) 962,682$ 714,521$
Interest on Net Pension Obligation (NPO) 8,163 292,950
Actuarial Adjustment (8,163) (219,050)
Annual Pension Cost (APC) 962,682 788,421
Less: Actual Contributions (963,253) (1,080,068)
Increase (Decrease) in NPO (571) (291,647)
Net Pension Obligation (Asset), Beginning of the Year 109,418 (3,129,291)
Net Pension Obligation (Asset), End of the Year 108,847$ (3,420,938)$
Deferred Compensation Plan The State offers its permanent employees a deferred compensation plan created in accordance with Internal Revenue Code Section 457. The Plan, available to all State of Delaware employees, permits them to defer a portion of their salary to future years. Participation in the Plan is optional. The deferred compensation is not available to employees until termination, retirement, death or unforeseeable emergency.
Annual Percent NetPlan Year Contribution Pension Of APC Pension
Ended Made Cost Contributed Asset
DTC Pension Plan 6/30/2013 $ 963,253 $ 962,682 100.06% $ (108,847)6/30/2012 996,777 996,827 99.99% (109,418)6/30/2011 1,111,468 1,111,548 99.99% (109,368)
Contributory Pension 12/31/2012 $ 1,080,068 $ 788,421 136.99% $ 3,420,938 12/31/2011 1,073,948 658,363 163.12% 3,129,291 12/31/2010 1,081,793 535,681 201.95% 2,713,706
Three-Year Trend InformationNet Pension Obligation (NPO)
(Expressed in Dollars)
108

State of Delaware Notes to the Financial Statements, June 30, 2013
NOTE 16 GOVERNMENTAL FUND BALANCES The State’s governmental fund balances are classified according to the relative constraints that control how amounts can be spent. Classifications include:
� Nonspendable. Balances include items that cannot be spent. This includes activity that is not in a spendable form (inventories, prepaid amounts, long-term portion of loans/notes receivable, or property held for resale unless the proceeds are restricted, committed or assigned) and activity that is legally or contractually required to remain intact.
� Restricted. Balances have constraints placed upon the use of the resources either by constitutional provisions, enabling legislation, external resource providers such as creditors, grantors, or imposed by law or regulations of other governments.
� Committed. Balances can be used only for specific purposes pursuant to constraints imposed by a formal action of the Delaware Legislature, the State’s highest level of decision-making authority. This formal action is the passage of law by the legislature, or other parties named by the State’s legislature, creating, modifying, or rescinding an appropriation.
� Assigned. Balances include amounts that are constrained by the State’s intent to be used for a specific purpose, but are neither restricted nor committed. For the General Fund, amounts constrained for the intent to be used for specific purpose by a governing board or a body or official that has been delegated authority to assign amounts that varies by organization within the state. For governmental funds, other than the General Fund, this is the residual amount within the fund that is not restricted or committed.
� Unassigned. Balance is the residual amount of the General Fund not included in the four categories described above. Also, any deficit fund balances within the other governmental fund types are reported as unassigned.
109

State of Delaware Notes to the Financial Statements, June 30, 2013
A summary of governmental fund balances at June 30, 2013, is as follows (expressed in thousands):
Local TotalSchool Capital Governmental
General Federal District Projects Funds Nonspendable
Inventories 7,681$ -$ -$ -$ 7,681$
Total Nonspendable 7,681 - - - 7,681
Restricted:
Health and Children's Services 6,939 - - - 6,939
Judicial and Public Safety 9,251 - - - 9,251
Natural Resources
and Environmental Control 81,044 - - - 81,044
Agriculture 225 - - - 225
Labor 8,719 - - - 8,719
Education 3,886 - 294,276 160,982 459,144
Economic Development 536 - - - 536
Other 3,818 - - - 3,818
Total Restricted 114,418 - 294,276 160,982 569,676
Committed -
Health and Children's Services 44,756 - - - 44,756
Judicial and Public Safety 6,212 - - - 6,212
Natural Resources
and Environmental Control 31,643 - - - 31,643
Agriculture 15,053 - - - 15,053
Labor 4,009 - - - 4,009
Education 8,680 - - - 8,680
Economic Development 82,521 - - - 82,521
Other 16,683 - - - 16,683
Total Committed 209,557 - - - 209,557
Assigned
Health and Children's Services 2,768 - - - 2,768
Judicial and Public Safety 3,818 - - - 3,818
Natural Resources
and Environmental Control 5,385 - - - 5,385
Agriculture 11,171 - - - 11,171
Education 51,851 - - - 51,851
Economic Development 122 - - - 122
Other 16,482 - - - 16,482
Total Assigned 91,597 - - - 91,597
Unassigned (Deficit) 1,025,284 (914) - - 1,024,370
Total Fund Balance 1,448,537$ (914)$ 294,276$ 160,982$ 1,902,881$
Fund Balance Restricted by Enabling Legislation The restricted Fund Balance for the Local School Districts Fund are funds that are used to account for activities relating to Delaware’s 19 local school districts, which are funded by locally raised real estate taxes and other revenues. The total amount in the fund was $294.3 million at June 30, 2013.
110

State of Delaware Notes to the Financial Statements, June 30, 2013
NOTE 17 AFFILIATED ORGANIZATIONS
The State Lottery is a member of the Multi-State Lottery Association (MUSL), which operates online games on behalf of participating state lotteries. Each MUSL member sells game tickets through its agents and makes weekly wire transfers to the MUSL in an amount equivalent to the member’s share of the estimated grand prize liability. Each MUSL member pays lesser prizes directly to the winners. The MUSL operates the Powerball games, as well as the Powerplay feature associated with Powerball, and also operates the Hot Lotto game. Participating lotteries are required to maintain deposits with MUSL for contingency reserves to protect MUSL from unforeseen prize liabilities. The money in this reserve fund is refundable to MUSL members if the MUSL disbands or if a member leaves the MUSL Board. The amount the Lottery had on deposit with the MUSL, as of June 30, 2013 was $2.4 million. This amount is also reported as a liability on the Lottery’s balance sheet because it represents the amount to be paid to the State upon separation from the MUSL if the MUSL is not required to use a portion of the Lottery’s reserves held by the MUSL. Complete separate financial statements for the MUSL may be obtained at the Multi-State Lottery Association, Suite 210, and 1701 48th Street, West Des Moines, IA 50266-6723. NOTE 18 COMMITMENTS Primary Government The State has entered into various contractual commitments that control for services and for construction of various highway, capital and lottery projects. Commitment of the proprietary fund includes $253.2 million for DelDOT.
Encumbrances which represent commitment related to unperformed contracts for goods or services are included in restricted, committed, or assigned fund balance, as appropriate. Encumbrances lapse at the end of the applicable appropriation, unless re-appropriated by the Legislature. Encumbrances outstanding against continuing appropriations at the end of fiscal year 2013 are as follows: general fund $148.9 million, federal funds are $17.9 million, local school district funds are $5.7 million and capital project funds are $30.0 million. Discretely Presented Component Units Diamond State Port Corporation (DSPC) DSPC has various contracts for construction and renovation of significant facilities in accordance with the Capital Budget approved by its Board of Directors. As of June 30, 2013, DSPC had $19.9 million in cash and cash equivalents committed to capital projects.
111

State of Delaware Notes to the Financial Statements, June 30, 2013
NOTE 19 CONTINGENCIES Various parties have made claims against the State. For those cases in which it is reasonably possible that a loss will be incurred and in which the amount of the potential judgment can be reasonably estimated, the State estimates the liability to be $4.8 million. The State recognized $1.3 million in governmental activities as claims and judgments liabilities for pending litigation settlements estimated to be probable as of June 30, 2013. In the opinion of the Attorney General of the State, however, the remaining cases are either subject to a valid defense or are not expected to result in an impairment of the State’s financial position. Management believes the settlement in aggregate of claims outstanding will not result in amounts material to the financial statements of the State. The State receives significant financial assistance from the federal government in the form of grants and entitlements. The right to these resources is generally conditioned upon compliance with terms and conditions of the grant agreements and applicable federal regulations, including the expenditure of the resources for eligible purposes. Substantially all grants are subject to financial and compliance audits by the grantors. Any disallowances as a result of these audits become a liability of the State. The State does not believe that the liabilities that may result from such audits for periods through June 30, 2013 would have a material effect on its financial position or the results of operations. Site investigation, planning and design, cleanup and site monitoring are typical pollution remediation activities underway across the State. Several State organizations have dedicated programs, rules and regulations that routinely deal with remediation related issues; others become aware of pollution conditions in the fulfillment of their missions. The State has the knowledge and expertise to estimate the remediation obligations presented herein based upon prior experience in identifying and funding similar remediation activities. The State calculates pollution remediation liabilities using the expected cash flow technique. Where the State cannot reasonably estimate a pollution remediation obligation, it does not report a liability; however, the State has not identified any of these situations. The pollution remediation obligation estimates that appear in this report are subject to change over time. Cost may vary due to price fluctuations, changes in technology, changes in potential responsible parties, results of environmental studies, changes to statutes or regulations and other factors that could result in revisions to these estimates. Prospective recoveries from responsible parties may reduce the State’s obligation. Capital assets may be created when pollution remediation outlays are made under specific circumstances. At June 30, 2013, the State had a total pollution remediation liability of $31.6 million, with an estimated potential recovery of $4.5 million from the U.S. Environmental Protection Agency. The State Lottery has discharged its primary responsibility for payment of annual installments (generally 14 to 20 years) to winners of jackpots greater than $150,000 by purchasing annuities from private insurance companies. The Lottery remains liable for future periodic payments of deferred prize obligations (approximately $200 thousand at June 30, 2013) in the event that the annuity issuers default on their obligations.
112

State of Delaware Notes to the Financial Statements, June 30, 2013
In fiscal year 2014 the State of Delaware has processed and paid $11.1 million of corporate income tax refunds as of November 30, 2013. Currently, there are corporate income tax refunds pending that total $136.8 million, an amount that is well in excess of the typical balance of refunds pending. The preponderance of the $136.8 million balance is attributable to fewer than five refund claims. These pending refund claims have been filed by taxpayers, but the validity of each of the claims has not been evaluated or determined as of the date hereof. Historically, the amount of refund claims for corporate income tax the State receives varies significantly from year to year. From fiscal year 2005 through fiscal year 2013, the corporate income tax refunds actually paid have ranged from a low of $17.8 million to a high of $52.9 million. The current budget projects total corporate income tax refunds of $45.6 million for fiscal year 2014 of which $40.0 million has been accrued for in the fiscal year. However, based on the current figures for this fiscal year, the potential continues to exist that the total corporate income tax refund claims may exceed the amount initially projected for the year. Based upon the claims received to date, the potential corporate income tax refund payments for fiscal year 2014 may now range from approximately $35.0 million to approximately $100 million. NOTE 20 SUBSEQUENT EVENTS Discretely Presented Component Units Delaware State University (DSU or the University) The University entered into a $12 million, 15-year lease agreement with the owners of a local hotel with an option to buy any time after the second year. The lease on the 153 room facility, located a quarter-mile north of the campus, began on July 28, 2013 and will provide additional residential space for students as existing residential halls on campus are renovated and upgraded. NOTE 21 RESTATEMENT Discretely Presented Component Units Delaware State Housing Authority (DSHA) In prior years, securitized mortgage loans were carried at current principal amounts, which did not constitute fair value in accordance with GASB standards. The beginning net position as July 1, 2012 has been restated in the amount of $58.9 million due to recording these loans at fair value, as follows:
Net Position as previously reported at June 30, 2012 365,990$
Adjustment to record loans at fair market value 66,827
Adjustment to record premiums and discounts on loans (7,896)
Net Position as restated at July 1, 2012 424,921$
DSHA(Expressed in Thousands)
113

State of Delaware
Comprehensive Annual Financial Report
Required Supplementary
Information
114

NOTES TO REQUIRED SUPPLEMENTARY INFORMATION
BUDGETARY REPORTING
BUDGETARY BASIS VS. GAAP
While GAAP requires the use of the fund structure described in Note 1(b), the State’s budget system uses only a general fund and a special fund, each of which uses the basis of accounting described below. Additionally, the activities of the Delaware State Housing Authority and Delaware State University, both component units of the State, which are not substantially supported by tax revenues, are not included in the budget data. Reconciliation of the accrual adjustments necessary to convert budgetary basis information to GAAP basis is presented as Required Supplementary Information.
The State Constitution requires the Governor to prepare and submit to the General Assembly a State budget for the ensuing year. The State budgets and controls its financial activities on the cash basis of accounting. In compliance with State law, the State records its financial transactions in either of two major categories – the general fund or the special fund. References to these two funds in this document include the terms “budgetary” or “budgetary basis” to differentiate them from the GAAP funds of the same name which encompass different funding categories. The General Assembly enacts the budget through the passage of specific line-item appropriations by department, the legal level of budgetary control, the sum of which must not exceed 98 percent of the estimated revenues and available unencumbered cash balance from the prior year pursuant to the State Constitution. The Governor has the power to approve or veto each appropriation passed by the General Assembly. The General Assembly may also enact supplemental appropriation or special appropriation bills after it completes action on the State’s budget.
The budgetary general fund provides for the cost of the State’s general operations and is credited with all tax and other revenue of the State not dedicated to budgetary special funds. Certain special funds are subject to appropriation, referred to herein as budgetary or appropriated special funds. Unexpended appropriations at year-end are available for subsequent expenditure to the extent that they have been encumbered at that date or legislatively extended for another year. Budget data represents original appropriations modified by interdepartmental transfers, supplemental, continuing, and carried-over encumbered appropriations. Subsequent modifications to the budget require the approval of the Controller General and the Budget Director. Additional detailed information regarding compliance with the legal level on control can be obtained by contacting the Office of Management and Budget at (302) 739-4206. Summary information regarding individual department budgets and the compliance with the legal level of budgetary control is presented on the following pages.
Encumbrance accounting is employed in budgetary funds. Encumbrances (e.g., purchase orders) outstanding at year-end do not constitute expenditures or liabilities and are reported as reservations of fund balances because the commitments will be honored during the subsequent year.
The budget schedules in Required Supplemental Information a) reflect the adjustments made to increase the special fund’s excess of revenues over expenditures for certain revenue sources not previously recognized; b) eliminates the net activity of certain operations that are accounted for within both the special fund and also in the separate accounts of certain component units or
115

agency funds that are not principally accounted for within the special fund; and c) presents the accrual adjustments necessary to convert budgetary basis information to GAAP basis.
Statutory/Budgetary Presentation
The Budgetary Comparison Schedule – Budget to Actual (Non-GAAP Budgetary Basis) presented on the following pages provides a comparison of the original and final legally adopted budget with actual data on a budgetary basis.
The original budget and related estimated revenues represent the spending authority enacted into law by the appropriations bill as of June 30, 2013, and do not include encumbrances and multi-year projects budgetary carry-forwards from the prior fiscal year. GAAP requires that the final legal budget be reflected in the “final budget” column; therefore, updated revenue estimates available for appropriations as of the last Delaware Economic and Financial Advisory Council (DEFAC) meeting in June 2013, as well as the amounts shown in the original budget, are reported. The final legal budget also reflects encumbrances and multi-year projects budgetary carry-forwards from the prior fiscal year.
The tables on the following page represent the Budgetary Statements of Revenues, Expenditures and Changes in Fund Balance – General and Special Funds. Also included is a schedule showing the budgetary fund balance designations for the General Fund. Of the $637.4 million budgetary general fund balance at June 30, 2013, $198.9 million is reserved for the budgetary reserve account and $276.4 million is designated as continuing and encumbered appropriations. The $162.1 million of undesignated fund balance, for the most part, is not available for new spending as these funds have been committed based on State statutes which are subject to review and change by the Legislature.
116

(Expressed in Millions)
Actual Variance with Actual Variance with Original Final Amounts Final Budget Original Final Amounts Final Budget
Revenues Personal Income Taxes 1,086.2$ 1,137.2$ 1,139.0$ 1.8$ -$ -$ -$ -$ Business Taxes 1,787.6 1,787.1 1,751.2 (35.9) - - - - Other Taxes 173.8 167.6 162.1 (5.5) - - - - License, Permits, Fines and Fees 342.7 341.2 346.3 5.1 - - - - Rentals and Sales - - - - - - - - Interest Earnings 8.5 6.3 6.3 - - - - - Lottery Sales 248.1 236.8 235.3 (1.5) Grants - - - - - - - - Other Non-tax Revenue 50.2 54.9 89.5 34.6 1,030.4 1,030.4 1,075.5 45.1
Total Revenues 3,697.1 3,731.1 3,729.7 (1.4) 1,030.4 1,030.4 1,075.5 45.1
ExpendituresLegislative 15.1 14.1 13.3 0.8 - - - - Judicial 90.3 91.6 91.4 0.2 9.8 9.8 9.1 0.7 Executive 128.2 159.9 134.5 25.4 112.4 112.4 50.0 62.4 Department of Technology & Information 37.3 38.8 41.3 (2.5) 29.6 29.6 29.1 0.5 Other Elective Offices 150.8 172.5 170.9 1.6 100.5 100.5 103.2 (2.7) Legal 50.4 51.9 52.6 (0.7) 9.8 9.8 6.4 3.4 Department of State 24.2 24.0 23.8 0.2 47.8 47.8 48.7 (0.9) Department of Finance 17.7 18.5 20.4 (1.9) 99.7 99.7 108.4 (8.7) Department of Health & Social Services 1,049.0 1,062.4 1,061.9 0.5 106.3 106.3 112.6 (6.3) Department of Services to Children, Youth and Their Families 133.9 139.4 141.9 (2.5) 19.7 19.7 20.6 (0.9) Department of Corrections 257.8 264.8 265.0 (0.2) 4.2 4.2 2.9 1.3 Department of Natural Resources and Environmental Control 35.2 44.3 44.6 (0.3) 96.4 96.4 48.8 47.6 Department of Safety & Homeland Security 136.2 144.0 144.3 (0.3) 18.3 18.3 15.1 3.2 Department of Transportation - - - - 346.4 346.4 349.9 (3.5) Department of Labor 7.8 7.9 7.9 - 13.7 13.7 12.3 1.4 Department of Agriculture 7.9 7.7 7.6 0.1 8.1 8.1 5.0 3.1 Department of Elections 4.0 3.9 6.5 (2.6) - - - - Fire Prevention Commission 5.0 5.3 5.0 0.3 2.6 2.6 1.9 0.7 Delaware National Guard 4.4 4.8 4.8 - - - - - Higher Education 215.9 224.6 226.7 (2.1) - - 1.0 (1.0) Department of Education 1,172.5 1,197.8 1,194.1 3.7 5.1 5.1 3.5 1.6
Total Expenditures 3,543.6$ 3,678.2$ 3,658.5$ 19.7$ 1,030.4$ 1,030.4$ 928.5$ 101.9$
Excess of Revenues over Expenditures 153.5 52.9 71.2 18.3 - - 147.0 147.0
Budgetary Fund Balance, Beginning of Year 566.2 566.2 566.2 - 630.7 630.7 630.7 -
Budgetary Fund Balance, End of Year 719.7$ 619.1$ 637.4$ 18.3$ 630.7$ 630.7$ 777.7$ 147.0$
Budgetary Fund Balance Designated: Budget Reserve Account $ 198.9 Continuing and Encumbered Appropriations 276.4Undesignated 162.1Total $ 637.4
(See Budgetary Basis vs. GAAP in Notes to Required Supplementary Information)
Budgeted AmountsGeneral Fund Special Fund
Budgeted Amounts
117

Statutory/Budgetary Reconciliations
Since accounting principles applied for purposes of developing data on a budgetary basis differ significantly from those used to present financial statements in conformity with GAAP, a reconciliation is required of resulting basis, perspective and entity differences in the revenues in excess of (less than) expenditures and other financing sources (uses) between budgetary and GAAP presentations.
The following two schedules represent the accrual adjustments necessary to convert budgetary basis information to GAAP basis.
Budget vs GAAP Revenue ReconciliationFor the Fiscal Year Ended June 30, 2013
(Expressed in Millions)
Total Budget Basis General and Special Fund
Revenue for Fiscal Year 2013 4,805.2$
Adjustments:
The financial reporting revenues do not include
revenues that are part of the general budgetary
revenues (613.5)
Non-budgetary General Revenues Reclassified
to General Fund Revenue 637.1
To Adjust Revenues, Other Financing Sources
and Related Receivables and Deferred Revenue (735.6)
Total General Fund Revenues for Fiscal Year
2013 4,093.2$
Federal Fund Revenue 1,496.9
Local School District Fund Revenue 545.3 Capital Projects Fund Revenue -
2,042.2
Total GAAP Basis Governmental Funds
Revenue for Fiscal Year 2013 6,135.4$
118

Budget vs GAAP Expenditures ReconciliationFor the Fiscal Year Ended June 30, 2013
(Expressed in Millions)
Total Budget Basis General and Special Fund
Expenditures for Fiscal Year 2013 4,587.0$
Adjustments:
The financial reporting expenditures do not include
expenditures that are part of the general budgetary
revenues (530.0)
Non-budgetary General Expenditures Reclassified to
General Fund Expenditures 656.5
To Adjust Expenditures, Other Financing Uses and
Related Accounts Payable, Accrued Liabilities (359.4)
Total General Fund Expenditures for Fiscal Year 2013 4,354.1$
Federal Fund Expenditures 1,490.6
Local School District Fund Expenditures 506.6 Capital Projects Fund Expenditures 226.1
2,223.3
Total GAAP Basis Governmental Funds Expenditures
for Fiscal Year 2013 6,577.4$
119

Required Supplementary Information
Information About Infrastructure Assets Reported Using the Modified Approach
As allowed by GASB Statement No. 34, Basic Financial Statements – and Management’s Discussion and Analysis – for State and Local Governments, the State has adopted an alternative process for recording depreciation expense on selected infrastructure assets. Under this alternative method, referred to as the modified approach, the State expenses certain maintenance and preservation costs and does not report depreciation expense. Assets accounted for under the modified approach include 4,378 centerline miles and 1,601 bridges that the State is responsible to maintain.
The condition of the State’s road pavement is measured using the Overall Pavement Condition (OPC) system, which is based on the extent and severity of various pavement distresses that are visually observed. The OPC system uses a measurement scale that is based on a condition index ranging from 0.0 for poor pavement to 5.0 for pavement in good condition.
The condition of bridges is measured using the “Bridge Condition Rating” (BCR) which is based on the Federal Highway Administration (FHWA) Coding Guide, “Recording and Coding Guide for the Structure Inventory and Appraisal of the Nation’s Bridges.” The BCR uses a measurement scale that is based on a condition index ranging from 0 to 9, 0 to 4 for substandard bridges and 9 for bridges in good condition. For reporting purposes, substandard bridges are classified as those with a rating of 4 or less. The good or better condition bridges were taken as those with ratings of between 6 and 9. A rating of 5 is considered fair. This information is taken from past “Bridge Inventory Status” reports.
It is the State’s policy to maintain at least 85% of its highways at a fair or better condition level and 75% of its bridge systems at a good or better condition level. No more than 10% of bridges and 15% of roads should be in substandard condition. Condition assessments are determined every year for roads and every two years for bridges. Due to the timing of these condition assessments, information for the fiscal year ended June 30, 2013 is not available.
120

BCR ConditionRating Number Percent Number Percent Number Percent
Good 6-9 1,151 71.9 1,149 72.3 1,137 72.8Fair 5 334 20.9 322 20.2 313 20Poor 0-4 116 7.2 120 7.5 112 7.2
Totals 1,601 100 1,591 100 1,562 100
OPC Condition Square Square SquareRating Feet Percent Feet Percent Feet Percent
Good 6-9 6,956,457 91.4 6,476,158 90.3 6,685,282 91.1Fair 5 649,176 8.5 687,461 9.6 651,712 8.8Poor 0-4 9,347 0.1 10,720 0.1 4,994 0.1
Totals 7,614,980 100 7,174,339 100 7,341,988 100
Center- Center- Center-OPC Condition Line Line Line
Rating Mile Percent Mile Percent Mile PercentGood 3.0-5.0 3,796 86.7 3,423 78.5 3,007 67.6Fair 2.5-3.0 400 9.1 575 13.2 1000 22.5Poor Below 2.5 182 4.2 362 8.3 440 9.9
Totals 4,378 100 4,360 100 4,447 100
2013 2012 2011
Estimated 185,399$ 243,600$ 259,351$
Actual 233,810$ 285,923$ 248,973$
* The estimated expenditures represent annual Bond Bill authorization. The actual expenditures represent the current year spending, which includes cumulative authorization.
Structural Rating Numbers and Percentages for Bridges
Deck Rating Numbers and Percentages for Bridges
Calendar Year Ended December 31
Fiscal Year ended June 30
Center-Line Mile Numbers and Percentages for Road Pavement
(Expressed In Thousands)Comparison of Estimated-to-Actual Maintenance/Preservation*
Calendar Year Ended December 31
State of DelawareDepartment of Transportation
Supplementary Information For Governments That Use theModified Approach for Infrastructure Assets
2013
2010
20082011 2009
Calendar Year Ended December 312012 2010
2013 2012
121

Required Supplementary Information – Pension
The following tables present additional information related to funding status and progress. It is intended to help readers assess the individual plans’ funding status on a going-concern basis and assess progress made in accumulating sufficient assets to pay benefits when due.
Delaware Public Employees’ Retirement System (DPERS)
The amount shown below as actuarial accrued liability is a measure of the difference between the actuarial present value of future plan benefits, and the actuarial present value of future normal cost.
Schedule of Funding Status and Progress(Expressed in Thousands)
PlanActuarial
Valuation Date(1) Actuarial
Value of Assets
(2) Actuarial Accrued
Liability (AAL)
(3) Unfunded AAL AAL
AAL (UAAL) Excess of
Assets over Liabilities (2) -
(1)(4) Funded
Ratio (1) / (2)(5) Annual Covered
Payroll
(6) UAAL/ (Excess) as % of Covered payroll (3) / (5)
6/30/2013 7,519,770$ 8,257,270$ 737,500$ 91.1% 1,877,105$ 39.3%
6/30/2012 7,270,430 7,949,855 679,425 91.5% 1,881,097 36.1%
6/30/2011 7,091,821 7,547,951 456,130 94.0% 1,783,603 25.6%
6/30/2013 329$ 224$ (105)$ 146.9% N/A N/A
6/30/2012 366 264 (102) 138.6% N/A N/A
6/30/2011 406 287 (119) 141.5% N/A N/A
6/30/2013 2,668$ 294,533$ 291,865$ 0.9% -$ N/A
6/30/2012 2,748 293,808 291,060 0.9% 124 234725.8%
6/30/2011 2,414 286,010 283,596 0.8% 114 248768.4%
New State Police 6/30/2013 317,814$ 350,885$ 33,071$ 90.6% 56,289$ 58.8%
6/30/2012 292,262 324,898 32,636 90.0% 54,412$ 60.0%
6/30/2011 270,625 286,890 16,265 94.3% 50,556 32.2%
6/30/2013 63,512$ 66,567$ 3,055$ 95.4% 10,416$ 29.3%
6/30/2012 59,279 65,946 6,667 89.9% 10,387 64.2%
6/30/2011 55,784 63,090 7,306 88.4% 9,624 75.9%
6/30/2013 20,964$ 25,136$ 4,172$ 83.4% 11,381$ 36.7%
6/30/2012 18,930 23,039 4,109 82.2% 12,229 33.6%
6/30/2011 17,198 20,632 3,434 83.4% 11,150 30.8%
6/30/2013 203,832$ 207,740$ 3,908$ 98.1% 68,122 5.7%
6/30/2012 179,816 186,901 7,085 96.2% 67,091 10.6%
6/30/2011 157,394 160,150 2,756 98.3% 59,418 4.6%
6/30/2013 27,492$ 29,312$ 1,820$ 93.8% 26,332$ 6.9%
6/30/2012 23,851 25,189 1,338 94.7% 22,435$ 6.0%
6/30/2011 20,664 22,859 2,195 90.4% 20,580 10.7%
Retirement Increase Fund and is funded over five years
+ The Closed State Police Pension Plan is a pay-as-you-go pension plan.
N/A - Not Applicable
County and Municipal
Other Employees
* Excludes liability and amortization payments due to cost-of-living adjustments. This liability is funded from the Post-
State Employees*
Special
Closed State Police +
Judiciary
Diamond State Port
Corporation
County and Municipal
Police and Firefighters
122

DelDOT - Delaware Transit Corporation – Pension Data
The most recent information available for Delaware Transit Corporation’s annual pension cost and related information for each plan is as follows (note – the current year information is not available for each plan):
Schedule of Funding Status and Progress (Expressed in Dollars)
(c) (f) (Unfunded (UAAL) (b) AAL (UAAL)) Excess (a) Actuarial Excess of (d) (e) as % of Actuarial Actuarial Accrued Assets over Funded Annual Covered Valuation Value of Liability AAL Ratio Covered PayrollPlan Date Assets (AAL) (a-b) (a / b) Payroll (c / e)
DTC Pension Plan 07/01/2012 $ 15,941,868 $ 16,990,051 $ (1,048,183) 93.83% $ 11,041,527 (9.49)%
07/01/2011 15,121,491 16,236,313 (1,114,822) 93.13% 11,253,210 (9.91%)
07/01/2010 12,329,167 12,841,594 (512,427) 96.01% 11,464,713 (4.47)%
Contributory Plan 01/1/2013 $ 32,243,870 $ 34,423,975 $ (2,180,105) 93.67% $ 24,788,597 (8.79)%
01/1/2012 30,863,722 32,171,013 (1,307,291) 95.94% 22,985,063 (5.69)%
01/1/2011 29,920,228 29,601,647 318,581 101.08% 22,847,401 1.39%
123

Required Supplementary Information – OPEB Trust The following table presents additional information related to funding status and progress. It is intended to help readers assess the individual plans’ funding status on a going-concern basis and assess progress made in accumulating sufficient assets to pay benefits when due.
OPEB Trust
The amount shown below as “actuarial accrued liability” is a measure of the difference between the actuarial present value of future plan benefits and the actuarial present value of future normal cost.
Schedule of Funding Status and Progress(Expressed in Millions)
Actuarial Valuation Date
(1) Actuarial Value
of Assets
(2) Actuarial Accrued Liability
(AAL)
(3) Unfunded Actuarial Accrued
Liabilities (UAAL)
(4) Funded Ratios (1) (2)
(5) Covered Payroll
(6) UAAL as
a % of Covered Payroll (3) / (5)
7/1/2013 $ 222 $ 5,988 $ 5,766 3.70% $ 1,944 297%
7/1/2012 163 5,805 5,642 2.80% 1,885 299%
7/1/2011 144 6,769 6,625 2.10% 1,787 371%
Valuation Date
Actuarial Cost Method
Amortization Method
4.25%
4.25%
July 1, 2013
Entry Age Normal
Level Percent Open
30 years
Market Value
Ultimate Rate of Medical Inflation
3.25% (Plus Merit Scale)
Remaining Amortization Period
Asset Valuation Method
Actuarial Assumptions:
Investment Rate of Return
Rate of Salary Increases
The State’s annual OPEB cost, the percentage of annual OPEB cost contributed to the plan, and the OPEB obligations for the fiscal years as follows:
Schedule of Employer Contributions
(Expressed in Millions)
Annual Percentage of Annual Required Annual OPEB Fiscal Year Contribution Costs Contributed__________ 2013 $397.8 52% 2012 490.5 38% 2011 488.1 37%
124

Required Supplementary Information – DTC OPEB Trust
The following table presents additional information related to funding status and progress. It is intended to help readers assess the individual plans’ funding status on a going-concern basis and assess progress made in accumulating sufficient assets to pay benefits when due:
Schedule of Funding Status and Progress (Expressed in Dollars)
(4)
UAAL (2) Excess (deficit)
(1) Actuarial Excess (deficit) Excess (deficit)Actuarial Actuarial Accrued Of assets Funded (3) as a percentageValuation Value of Liability Over AAL Ratio Covered of covered
Date Assets (AAL) (1-2) (1/2) Payroll payroll ((1-2)/3
07/1/2012 $ 1,755,283 $ 121,627,000 $ (119,871,717) 1.44% $ 34,537,878 (347.07%)07/1/2011 1,605,000 125,866,000 (124,261,000) 1.28% 31,883,191 (389.74%)07/1/2010 1,500,000 111,122,000 (109,622,000) 1.35% 31,293,725 (350.30%)
125

[THIS PAGE INTENTIONALLY LEFT BLANK]

APPENDIX C
CONTINUING DISCLOSURE AGREEMENT AND SUPPLEMENT TO CONTINUING DISCLOSURE AGREEMENT

[THIS PAGE INTENTIONALLY LEFT BLANK]

C-1
THE STATE OF DELAWARE $275,425,000
General Obligation Bonds, Series 2011
CONTINUING DISCLOSURE AGREEMENT This Continuing Disclosure Agreement dated November 15, 2011 (including any amendments or supplements hereto, the “Disclosure Agreement”) is executed and delivered by The State of Delaware (as more fully defined below, the “Issuer”) in connection with the issuance of the above-captioned bonds (the “2011 Bonds”). The Issuer, intending to be legally bound, hereby covenants and agrees as follows:
Section 1. Purpose of the Disclosure Agreement. This Disclosure Agreement is being executed and delivered by the Issuer for the benefit of the Holder from time-to-time of the Bonds (as defined below) and in order to assist the Participating Underwriters in complying with S.E.C. Rule 15c2-12(b)(5).
Section 2. Definitions. Unless the context clearly requires otherwise, the following capitalized terms shall have the meanings set forth below: “Additional Bonds” shall mean any indebtedness of the Issuer issued subsequent to the 2011 Bonds which the Issuer has declared in writing to be covered by this Disclosure Agreement. No such written declaration shall be considered an amendment to this Disclosure Agreement for purposes of Section 9 hereof. “Annual Filing Date” shall mean not later than the first day of the eleventh calendar month immediately following the end of the Issuer’s fiscal year. “Annual Financial Information” shall mean any Annual Report provided by the State pursuant to, and as described in, Sections 3 and 4 of this Disclosure Agreement. “Annual Report” shall mean any Annual Report provided by the Issuer pursuant to, and as described in, Sections 3 and 4 of this Disclosure Agreement. “Bonds” shall mean the 2011 Bonds and Additional Bonds, if any. “Dissemination Agent” shall mean any agent of the Issuer designated in writing by the Issuer which has filed with the Issuer a written acceptance of such designation. “EMMA” shall mean the Electronic Municipal Market Access System maintained by the MSRB at http://emma.msrb.org/, which serves as the sole nationally recognized municipal securities information repository under the Rule. “Holder” means any person (a) having the power, directly or indirectly, to vote or consent with respect to, or to dispose of ownership of, any Bonds (including persons holding

C-2
Bonds through nominees, depositories or other intermediaries) or (b) treated as the owner of any Bonds for federal income tax purposes. “Issuer” shall mean The State of Delaware, or any successor Obligated Person that assumes either by operation by law or by contract both (i) the obligation to pay debt service on the Bonds and (ii) the obligations of the Issuer under this Disclosure Agreement. “MSRB” shall mean the Municipal Securities Rulemaking Board, or any successor organization. “Notice Event” shall mean any of the events listed in Section 5(a) of this Disclosure Agreement. “Obligated Person” shall have the meaning set forth in the Rule, provided that the sole objective criteria used to select the Obligated Person shall be the entity obligated to repay all debt service with respect to the relevant Bonds. “Official Statement” shall mean the final Official Statement relating to the 2011 Bonds or a Series of Additional Bonds, as applicable. “Participating Underwriter” shall mean any of the original underwriters of any Series of Bonds required to comply with the Rule in connection with offering of such Bonds. “Repository” shall mean each nationally recognized municipal securities information repository under the Rule. As of the date hereof, the Securities and Exchange Commission has appointed the MSRB through EMMA to act as the sole Repository. Any information filed in connection with this Disclosure Agreement shall be filed with EMMA at http://emma.msrb.org/, any State Repository and any future Repository as may be required under the Rule. “Rule” shall mean Rule 15c2-12 promulgated by the Securities and Exchange Commission under the Securities Exchange Act of 1934, as heretofore amended, and as such Rule may be hereafter amended from time-to-time. “State Repository” shall mean any public or private repository or entity designated by the State of Delaware as a state information repository for the purpose of the Rule and with which the Issuer is legally required to file the Annual Report. Currently, there is no State Repository in Delaware. The list of state information repositories maintained by the United States Securities and Exchange Commission shall be conclusive as to the existence of a State Repository. “2011 Bonds” shall mean the Issuer’s $275,425,000 aggregate principal amount General Obligation Bonds, Series 2011 dated November 15, 2011 Section 3. Provision of Annual Reports.
(a) The Issuer shall, or shall cause the Dissemination Agent to, not later than the Annual Filing Date, provide to the MSRB via EMMA an Annual Report which is consistent with

C-3
the requirements of Section 4 of this Disclosure Agreement. Not later than fifteen (15) business days prior to said date, the Issuer shall provide the Annual Report to the Dissemination Agent, if any. The Annual Report may be submitted as a single document or as separate documents comprising a package, and may cross-reference other information as provided in Section 4 of this Disclosure Agreement; provided however that the audited financial statements of the Issuer may be submitted separately from the balance of the Annual Report.
(b) If the Issuer is unable to provide the Annual Report to the Repository by the date
required in subsection (a), a Notice Event pursuant to Section 5(a)(15) shall be deemed to have occurred and the Issuer shall report to the Repository electronically in accordance with the provisions of Section 5(b) hereof.
(c) The Dissemination Agent, if any, shall: (i) determine each year prior to the
Annual Filing Date the name and address of each Repository; and (ii) file a report with the Issuer certifying that the Annual Report has been provided pursuant to this Disclosure Agreement, stating the date it was provided and listing each Repository to which it was provided.
(d) Audited financial statements of the Issuer not submitted as part of the Annual
Report shall be provided to the Repository, if and when available to the Issuer, and in any event not more than thirty (30) days after receipt thereof from the Issuer’s auditors. In the event that audited financial statements are not submitted as part of the Annual Report, the Issuer shall provide in lieu thereof, when available, unaudited financial statements for the relevant fiscal year.
(e) The Issuer shall promptly provide written notice of any change in its fiscal year to the MSRB and to each Repository.
Section 4. Content of Annual Reports.
(a) The Issuer’s Annual Report shall contain or incorporate by reference the
information listed in Exhibit A with respect to the relevant fiscal year.
(b) Any or all of the items listed as Annual Financial Information may be incorporated by reference from other documents, including official statements of debt issues of the Issuer or related public entities, which have been submitted to any Repository or the Securities and Exchange Commission. If the document incorporated by reference is a final official statement, it must be available from the MSRB. The Issuer shall clearly identify each such other document so incorporated by reference.
(c) If any Annual Financial Information can no longer be generated because the
operations to which such information relates have been materially changed or discontinued, a statement to that effect shall satisfy the obligations of the Issuer under this Section 4, provided however that the Issuer shall, to the greatest extent feasible, provide in lieu thereof similar information with respect to any substitute or replacement operations.

C-4
Section 5. Reporting of Notice Events. (a) This Section 5 shall govern the giving of notices of the occurrence of any of the
following events with respect to the Bonds: 1. Principal and interest payment delinquencies; 2. Non payment-related defaults, if material; 3. Unscheduled draws on debt service reserves reflecting financial difficulties; 4. Unscheduled draws on credit enhancements reflecting financial difficulties; 5. Substitution of credit or liquidity providers, or their failure to perform; 6. Adverse tax opinions, the issuance by the Internal Revenue Service of
proposed or final determinations of taxability, Notices of Proposed Issue (IRS Form 5701-TEB) or other material notices or determinations with respect to the tax status of the security, or other material events affecting the tax status of the security;
7. Modifications to rights of Holder, if material; 8. Bond calls (other than mandatory sinking fund redemptions), if material, and
tender offers; 9. Defeasances; 10. Release, substitution, or sale of property securing repayment of any Bonds, if
material; 11. Rating changes; 12. Bankruptcy, insolvency, receivership or similar event of the Issuer (for the
purposes of the event identified in subsection 5(a)(12), the event is considered to occur when any of the following occur: the appointment of a receiver, fiscal agent or similar officer for the Issuer in a proceeding under the U.S. Bankruptcy Code or in any other proceeding under state or federal law in which a court or governmental authority has assumed jurisdiction over substantially all of the assets or business of the Issuer, or if such jurisdiction has been assumed by leaving the existing governing body and officials or officers in possession but subject to the supervision and orders of a court or governmental authority, or the entry of an order confirming a plan of reorganization, arrangement or liquidation by a court or governmental authority having supervision or jurisdiction over substantially all of the assets or business of the Issuer);
13. The consummation of a merger, consolidation, or acquisition involving the Issuer or the sale of all or substantially all of the assets of the Issuer, other than in the ordinary course of business, the entry into a definitive agreement to undertake such an action or the termination of a definitive agreement relating to any such actions, other than pursuant to its terms, if material;
14. Appointment of a successor or additional trustee or the change of name of a trustee, if material; and
15. Failure to provide annual financial information as required.

C-5
(b) Upon the occurrence of a Notice Event, the Issuer shall file, or cause the
Dissemination Agent to file, a notice of such occurrence with the MSRB via EMMA in a timely manner not in excess of ten (10) Business Days after the occurrence of the Notice Event.
Section 6. Accounting Standards. The financial statements described in Section 4(a)(i) above shall be audited in accordance with generally accepted accounting principles applicable in the preparation of financial statements of the Issuer as promulgated by the Financial Accounting Standards Board, the Governmental Accounting Standards Board, or such other body recognized as authoritative by the American Institute of Certified Public Accountants or any successor body, as applicable (“GAAP”), and shall also comply with applicable federal and state auditing statutes, regulations, standards and/or guidelines. The Issuer may from time-to-time modify its accounting principles to the extent necessary or desirable to comply with changes in either GAAP or applicable federal and state statutes, regulations, standards and/or guidelines. Any such modification of accounting standards or principles to conform to changes in either GAAP or applicable federal or state auditing statutes, regulations, standards or guidelines shall not constitute an amendment to this Disclosure Agreement within the meaning of Section 9 hereof, but such modifications shall be disclosed in the first Annual Report to be provided subsequent to such modifications.
Section 7. Termination of Reporting Obligation. The Issuer’s obligations under this
Disclosure Agreement shall terminate upon (a) the legal defeasance, prior redemption or payment in full of all of the Bonds, or (b) the assumption by a successor Obligated Person of all of the obligations of the prior Obligated Person both hereunder and under the Bonds. The prior Issuer shall provide timely written notice to each Repository of any termination of its obligations hereunder.
Section 8. Dissemination Agent. The Issuer may, from time-to-time, appoint or
engage a Dissemination Agent to assist it in carrying out its obligations under this Disclosure Agreement, and may discharge any such agent, with or without appointing a successor Dissemination Agent.
Section 9. Amendments. (a) Notwithstanding any other provision of this Disclosure
Agreement, the Issuer may modify or amend this Disclosure Agreement. The Issuer acknowledges and agrees that the current SEC interpretation of the Rule requires satisfaction of the following preconditions for any amendment:
(i) the modification or amendment is being made in connection with a
change of circumstances that arises from a change in legal requirements, change in law, change in the identity, nature or status of the Issuer, or change in the type of business conducted by the Issuer;
(ii) this Disclosure Agreement, as amended, would have complied with
the requirements of the Rule as of the date of issuance of the relevant Bonds, after taking into account any amendment or interpretations of the Rule, as well as any change in circumstances; and

C-6
(iii) the modification or amendment does not materially adversely affect the interests of Holders, as determined either by a party unaffiliated with the Issuer (such as the Paying Agent or nationally recognized bond counsel) or by an approving vote of a majority of Holders.
(b) The Issuer shall report any modification or amendment of this Disclosure
Agreement as required by the Rule. To the extent required by the Rule, the Issuer shall include as a component of the first Annual Report to be provided subsequent to the relevant amendment, a copy of the amendment, together with a notice explaining in narrative form both (i) the reasons for the amendment and (ii) the impact of the change in the type of operating data or financial information being provided. To the extent required by the Rule, if the amendment relates to changes in accounting principles to be followed in preparing financial statements, the first Annual Report to be provided subsequent to the relevant amendment shall also include a comparison between the financial statements or information prepared on the basis of the new accounting principles and those prepared on the basis of the former accounting principles and a qualitative (and to the extent reasonably feasible, quantitative) discussion of the differences in the accounting principles and the impact of the change in the accounting principles upon the presentation of the financial information. Written notice of any such change in accounting principles shall be provided in a timely fashion to each Repository.
(c) Neither a supplement to this Disclosure Agreement to declare that it is applicable
to Additional Bonds or a modification of accounting principles or standards pursuant to Section 6 shall be considered an amendment for purposes of this Section 9.
Section 10. Additional Information. Nothing in this Disclosure Agreement shall be deemed to prevent the Issuer from disseminating any other information, using the means of dissemination set forth in this Disclosure Agreement or any other means of communication, or including disclaimers or any other information in any Annual Report or notice of occurrence of a Notice Event, in addition to that which is required by this Disclosure Agreement. If the Issuer chooses to include any information in any Annual Report or notice of occurrence of a Notice Event in addition to that which is specifically required by this Disclosure Agreement, the Issuer shall have no obligation under this Agreement to update such information or include it in any future Annual Report or notice of occurrence of a Notice Event.
Section 11. Submission of Information to the MSRB. The information required to be
disclosed pursuant to this Disclosure Agreement shall be submitted to the MSRB through EMMA. Subject to future changes in submission rules and regulations, such submissions shall be provided to the MSRB, through EMMA, in portable document format (“PDF”) files configured to permit documents to be saved, viewed, printed and retransmitted by electronic means. Such PDF files shall be word-searchable (allowing the user to search for specific terms used within the document through a search or find function available in a software package).
Subject to future changes in submission rules and regulations, at the time that such information is submitted through EMMA, the Issuer, or any Dissemination Agent engaged by the Issuer, shall also provide to the MSRB information necessary to accurately identify the category of information being provided and other identifying descriptions required by MSRB rules and regulations.

C-7
Section 12. Default. In the event of a failure of the Issuer to comply with any
provision of this Disclosure Agreement, the Paying Agent, any Participating Underwriter or any Holder may take such actions as may be necessary and appropriate, including seeking a writ of mandamus or specific performance by court order to cause the Issuer to comply with its obligations under this Disclosure Agreement. A default under this Disclosure Agreement shall not be deemed an Event of Default under the Bonds or any document relating to the Bonds, and the sole remedy under this Disclosure Agreement in the event of any failure of the Issuer to comply with this Disclosure Agreement shall be an action to compel performance; provided however that nothing herein shall limit any Holder’s rights under applicable federal securities law.
Section 13. Severability. In case any section or provision of this Disclosure
Agreement or any covenant, stipulation, obligation, agreement, or action, or any part thereof, made, assumed, entered into or taken under this Disclosure Agreement, or any application thereof, is for any reason held to be illegal or invalid or is at any time inoperable, such illegality, invalidity or inoperability shall not affect the remainder thereof or any other section or provision or the Disclosure Agreement, or any other covenant, stipulation, obligation, agreement, act or action, or part thereof, made, assumed, entered into or taken under this Disclosure Agreement, which shall at the time by construed and enforced as if such illegal or invalid or inoperable portion were not contained therein.
Section 14. Entire Agreement. This Disclosure Agreement contains the entire
agreement of the Issuer with respect to the subject matter hereof and supersedes all prior arrangements and understandings with respect thereto, provided however that this Disclosure Agreement shall be interpreted and construed with reference to and in pari materia with the Rule.
Section 15. Captions. The captions or headings herein shall be solely for convenience
of reference and shall in no way define, limit or describe the scope or intent of any provisions or sections hereof.
Section 16. Beneficiaries. This Disclosure Agreement is being entered into solely for the benefit of the Participating Underwriters and Holders from time-to-time of the Bonds, and nothing in this Disclosure Agreement expressed or implied is intended to or shall be construed to give to any other person or entity any legal or equitable right, remedy or claim under or in respect of this Disclosure Agreement or any covenants, conditions or provisions contained herein.
Section 17. Governing Law. This Disclosure Agreement shall be deemed to be a
contract made under the laws of the State of Delaware, and all provisions hereof shall be governed and construed in accordance with the laws of the State of Delaware, without reference to the choice of law principles thereof.

C-8
IN WITNESS WHEREOF, THE STATE OF DELAWARE, has caused this Disclosure Agreement to be executed by the Secretary of Finance as of the day and year first above written.
THE STATE OF DELAWARE By: Thomas J. Cook Secretary of Finance

C-9
EXHIBIT A
CONTENTS OF ANNUAL REPORT The Annual Report shall contain the following: 1. Audited financial statements for the prior fiscal year in form and content substantially the same as those appended to the State's Official Statement with respect to the 2011 Bonds. 2. A Summary of the Cash Basis Financial Statements for the prior fiscal year in form and content substantially the same as those appended to the State's Official Statement with respect to the 2011 Bonds. 3. An update of the type of information included in the below-listed tables and sections in the Official Statement to the extent not included in Item Nos. 1 or 2 above:
(a) Debt Service Requirements (p. 4) - updated for the issuance of general obligation debt through the prior fiscal year.
(b) The 5% Rule (p. 6) - updated for the current fiscal year. (c) The 15% Test (p. 6) and the Cash Balances Test (p. 7) - updated for the
current fiscal year. (d) DEFAC Budgetary General Fund Revenue Projections (p. 32) - updated
for the prior fiscal year. (e) Budgetary General Fund Revenue (p. 33) - updated for the prior fiscal
year. (f) Budgetary General Fund Expenditures and Adjusted Budgetary General
Fund Expenditures (p. 35) - updated for the prior fiscal year. (g) Sources and Uses of State Funds (pp. 36 and 37) - updated to compare the
prior fiscal year to the fiscal year ten years prior. (h) Budgetary General Fund Disbursements (p. 53) - updated for the prior
fiscal year. (i) Public School Enrollment (p. 54) - updated for the prior year. (j) Social Services Expenditures (p. 56) - updated for the prior fiscal year. (k) Ratio of Federal Funds Expended by Department (p. 59) - updated for the
prior fiscal year.

C-10
4. An update of the type of information included in the text and tables under the heading “Bonded Indebtedness of the State” beginning with the subsection “General Obligation Debt” through “State Revenue Debt” (p. 5) for the prior fiscal year. The information under the heading “Lease Obligations” shall be updated to cover the five fiscal year period beginning with the prior fiscal year. 5. An update of the type of information included in the text under the heading “Indebtedness of Authorities, Universities and Political Subdivisions - Authorities - Delaware Transportation Authority” (p. 14) for the prior fiscal year; and “- Delaware State Housing Authority” (p. 15) updated for the prior fiscal year. 6. An update of the type of information included in the text and tables under the heading “Fiscal Year Ended June 30, 2011” (p. 41) for the prior fiscal year. 7. An update of the type of information included in the text and tables under the heading “State Pension Plan” (p. 60) for the prior fiscal year. 8. An update of the text appearing in the first paragraph under the heading “Employee Relations” (p. 63) for the prior fiscal year.

C-11
THE STATE OF DELAWARE $306,870,000 General Obligation Bonds - Series 2014B
SUPPLEMENT TO CONTINUING DISCLOSURE AGREEMENT This Supplement to Continuing Disclosure Agreement dated November 6, 2014 (the “2014 Supplement”) is executed and delivered by the State of Delaware (the “Issuer”) in connection with the issuance of the above-captioned bonds dated November 6, 2014 (collectively, the “Bonds”). Capitalized terns used herein and not defined shall have the meanings ascribed to such terms as set forth in the Original Disclosure Agreement (as defined herein). WHEREAS, the Issuer has previously issued bonds and entered into a Continuing Disclosure Agreement dated November 15, 2011 (the “Original Disclosure Agreement”) in which the Issuer agreed to take certain actions in order to assist the Participating Underwriters (as defined in the Original Disclosure Agreement) in complying with S.E.C. Rule 15c2-12(b)(5); and WHEREAS, pursuant to Section 2 of the Original Disclosure Agreement, the Issuer has the ability to supplement the Original Disclosure Agreement to include additional bonds or notes with the same force and effect as if all terms and provisions of such Original Disclosure Agreement had originally provided for the inclusion of such bonds or notes; and WHEREAS, a change in format of the Issuer’s official statement resulted in the subsection “Other Post Employment Benefits” no longer being part of the section titled “STATE PENSION PLAN,” which is part of the contents of the Issuer’s Annual Report. The Issuer hereby desires to clarify that the new section “OTHER POST EMPLOYMENT BENEFITS” will continue to be reported as part of the Issuer’s Annual Report. NOW, THEREFORE, the Issuer, intending to be legally bound, hereby covenants and agrees as follows:
SECTION 1. Written Declaration of Issuer. The Issuer has determined that the Bonds shall constitute “Additional Bonds” under the Original Disclosure Agreement.
SECTION 2. Original Disclosure Agreement Applicable to Bonds. This
2014 Supplement shall be construed as a supplement to the Original Disclosure Agreement and shall be governed by the provisions thereof. Except as hereby supplemented, all the terms, covenants and conditions of the Original Disclosure Agreement are hereby confirmed, ratified and approved in all respects, shall continue in full force and effect, and shall apply to the Bonds with the same force and effect as if all terms and provisions of the Original Disclosure Agreement had originally provided for the inclusion of the Bonds. Capitalized terms used but not defined herein shall have the same meanings as ascribed to them in the Original Disclosure Agreement.

C-12
SECTION 3. Content of Annual Report. The Issuer hereby agrees that item 7 in Exhibit A to the Original Disclosure Agreement shall continue to include updates to the text and tables under “OTHER POST EMPLOYMENT BENEFITS” in the Issuer’s official statements.
SECTION 4. Governing Law. This 2014 Supplement shall be deemed to be a
contract made under the laws of the State of Delaware, and all provisions hereof shall be governed and construed in accordance with the laws of the State of Delaware, without reference to the choice of law principles thereof.

C-13
IN WITNESS WHEREOF, the State of Delaware has caused this 2014 Supplement to be duly executed as of the day and year first above written. THE STATE OF DELAWARE By: ___________________________________ Secretary of Finance

[THIS PAGE INTENTIONALLY LEFT BLANK]

APPENDIX D
FORM OF OPINION OF BOND COUNSEL

[THIS PAGE INTENTIONALLY LEFT BLANK]

D-1
[FORM OF OPINION OF BOND COUNSEL] November __, 2014
OPINION OF BOND COUNSEL RE: The State of Delaware $306,870,000 General Obligation Bonds, Series 2014B TO THE PURCHASERS OF THE ABOVE-CAPTIONED BONDS: We have acted as bond counsel in connection with the issuance of $306,870,000 General Obligation Bonds, Series 2014B (the “Bonds”) by The State of Delaware (the “State”) on the date hereof. The Bonds are issued as fully registered Bonds as provided in the Bonds and in a resolution of the Issuing Officers of the State adopted on October 22, 2014 (the “Resolution”). The Bonds are issued pursuant to the Constitution and laws of the State including Chapter 74, Title 29, Delaware Code, as amended, and the Resolution. As Bond Counsel, we have examined a certified copy of the Resolution and the form of the Bonds. We have examined originals (or copies certified or otherwise identified to our satisfaction) of such other instruments, certificates and documents as we have deemed necessary or appropriate for the purposes of the opinion rendered below. In such examination, we have assumed the genuineness of all signatures, the authenticity of all documents submitted to us as originals and the conformity to the original documents of all documents submitted to us as copies. We have relied on a certificate of the State as to the due execution and delivery of, and payment for, the Bonds. As to any facts material to our opinion we have, when such facts were not independently established, relied upon the aforesaid instruments, certificates and documents including the State's Federal Tax Certificate dated the date of issuance of the Bonds, and the statement of reasonable expectations of future events set forth in such certificate. We have not verified the accuracy, completeness or fairness of the information set forth in any offering statement or other similar documents of the State delivered to the purchasers or prospective purchasers of the Bonds, and we take no responsibility therefor. Based on the foregoing, we are of the opinion as of the date hereof and under existing law that:
1. The Bonds have been duly authorized, executed and delivered and constitute legal and valid general obligations of the State.
2. The State has pledged its faith and credit for the payment of the principal of and interest on the Bonds. The Constitution of the State does not contain any limitation upon the rate or amount of taxes which may be levied by the State for the payment of principal of and interest on the Bonds with the exception that any law which shall have the effect of increasing the rates of taxation on

D-2
personal income for any year or part thereof prior to the date of the enactment thereof, or for any year or years prior to the year in which the law is enacted, would be void.
3. Interest (including accrued original issue discount) on the Bonds is not includable in gross income for purposes of federal income taxation under existing statutes, regulations, rulings and court decisions. The opinion set forth in the preceding sentence is subject to the condition that the State complies with all applicable federal income tax law requirements that must be satisfied subsequent to the issuance of the Bonds in order that interest thereon continues to be excluded from gross income for purposes of federal income taxation. Failure to comply with certain of such requirements could cause the interest on the Bonds to be includable in gross income retroactive to the date of issuance of the Bonds. The State has covenanted to comply with all such requirements. Interest on the Bonds is not treated as an item of tax preference under Section 57 of the Internal Revenue Code of 1986, as amended (the “Code”) for purposes of the individual and corporate alternative minimum taxes; however, we call to your attention that under the Code, to the extent that interest on the Bonds is a component of a corporate holder's “adjusted current earnings,” a portion of that interest may be subject to the corporate alternative minimum tax. We express no opinion regarding other federal tax consequences relating to the Bonds or the receipt of interest thereon.
4. Under existing statutes, interest on the Bonds is exempt from personal and corporate income taxes imposed by the State of Delaware.
It is to be understood that the rights of the holders of the Bonds and the enforceability thereof may be subject to bankruptcy, insolvency, reorganization, moratorium and other similar laws affecting creditors' rights heretofore or hereafter enacted to the extent constitutionally applicable and that their enforcement may also be subject to the exercise of judicial discretion in appropriate cases. This opinion is given as of the date hereof, and we assume no obligation to revise or supplement this opinion to reflect any facts or circumstances that may hereafter come to our attention, or any changes in law that may hereafter occur.


TH
E S
TA
TE
OF
DE
LA
WA
RE
• GE
nE
RA
L Ob
LiG
AT
iOn b
On
DS – S
ER
iES 2014b