SEPTEMBER, 1971 Vol. 34 P. 423-466 No. 9
52
SEPTEMBER, 1971 Vol. 34 P. 423-466 No. 9
-
Upload
khangminh22 -
Category
Documents
-
view
4 -
download
0
Transcript of SEPTEMBER, 1971 Vol. 34 P. 423-466 No. 9

SEPTEMBER, 1971
Vol. 34 P. 423-466 No. 9

We surprised a food processor in California by removing stubborn stains from aluminum food tubs like those shown here.
Our man out there cleaned them in a flash with one of the special cleaners from our 8-K® line of cleaners and sanitizers. A quick soak and rinse did the job.
Your local Pennwalt representative can show you how to make even the most stubborn stains vanish from your plant equipment and utensils. If you've got an especially tough cleaning problem that baffles him (possible, but not likely), our scientists at Pennwalt's Technological Center will find the answer. Without charge.
Contact us now. You have nothing to lose but your stains. Dairy and Food Department, Pennwalt Corporation, Three Parkway, Philadelphia, Pa. 19102.
~ lilEI\N\MLT CLEANERS & SANITIZERS

' •• )
;
To Our Contributors The success of this 58th annual meeting could not have been achieved without your gen
erous assistance.
Alta DenG Dairy Alpha Beta Acme Markets Associated Dairymen Avoset Food Corporation Babson Bros. Co. (Surge) Beaver Mfg. Co. Borden's Bou-Matic Milkers Brinderson DeLaval Sales California Milk Producers Advisory Board Challenge Cream 0. Butter Ass'n. Chace C. Hoffman (Neilson Creamery) Chino Valley Cattle Co. Clay Equipment Co. Coast Grain Co. Consolidated Dairy Prod. Co. Continental Dairy Supply Creamery Package Division St. Regis Dairy Council of California Dairymen's Coop. Creamery Ass'n. Dairy Research Prod., Inc. Danish Creamery Ass'n. Dean Milk Co. DeLaval Separator Co. Diversey Chemical Co. Ex Cello Corp. Food Filters Corp. Fults ChemicaL Inc. Globe Veterinary Supply Golden Arrow Dairy Hites Dairy International Paper Co. Jerseymaid Milk Products
California Cheese Assn. California Cheese Co. Standard Cheese Co.
Vella Cheese Co. Kendall-Fiber Products Div. Kings Country Creamery Ass'n. Kings Country Truck Lines Klenzade Kennel K 999 (L.A. Yellow Dogs) Kruse, 0. H. Grain 0. Milling) Knudsen Corp. League of Calif. Milk Producers Ass'n. Lily-Tulip Div. Los Angeles Mutual Dairymen's Ass'n. Lucky Stores, Inc. Los Banos Dairymen's Ass'n. Meyenberg Milk Products Mulligan Sales Penny-Newman Grain Co. Protected Milk Prod. Ass'n. Real Fresh Milk. Inc. Ralph's Grocery Co. Rehrig Pacific Co. Ross-Holm Safeway Stores Milk Dept. San Francisco Milk Industry Schweitzers Metal Fabricators Sep-Ko ChemicaL Inc. Sunshine Dairy Sales Yard Superior Milk Products, Ass'n. The Dairyman Thrifty Drug Stores, Inc. Top-Line Corp. Transflow Tubing 0. Inflations United Dairymen's Ass'n. West-Argo ChemicaL Inc. Western Dairy Journal Weyerhaeuser Co. Wilsey Bennett Foods. Inc. Zan Mfg. Co.
DAIRY INSTITUTE OF CALIFORNIA
Adohr Milk Farms Arden Farms Co. Berkeley Farms Brookside Dairy Carnation Company, Los Angeles Carnation Comp<;my, Oakland Crystal Cream 0. Butter Co. Driftwood Dairy Edgemar Farms Favorite Foods, Inc. Foremost Dairies, Inc.
• Foster Farms All-Jersey Dairy Green Glen Meadow Gold Dairies ·
I
t-11cColl's Dairy Products Co. Pellissier Dairy Farms Peninsula Creamery Petaluma Cooperative Creamery Producers Dairy Delivery Co. Quaker Maid Dairy Scott Brothers Shady Grove Dairy Spreckels Dairies, Inc. Sunshine Farms Sun Valley Dairy Wayne's Dairy Western Holstein Farms, Inc.

OFFICERS AND EXECUTIVE BOARD President, 0RLOWE !vL OsTEN, Minn .
Dept. of Agric., 517 State Office Bldg., St. Paul, !vlinn. 55101.
President-Elect, \VALTER F. ·wiLsoN, County Los Angeles Health D ept. , 313 N. Figueroa St ., Los Angeles, Calif. 90012.
First V-ice-President, EAnL 0. \\TmGHT, 116 Dairy Industry Bldg., Iowa State U ., Ames, l a. 50010.
Second Vice-PI'esident, P. J . SKULBOnSTAD, 2100 South York Rd., Oakbrook, Ill. 60521.
Secretary-Treasu.rer, RICHARD P. [AHCH, 118 Stocking Hall, Cornell Univ., Ithaca, N. Y. 14850.
Junior Past-P-resident, DICK B. vVHITEHEAD, Miss., State Board of H ealth, P. 0 . Box 1700, Jackson, Miss. 39205.
Senior Past-President, !viiLTON E. H ELD, 910 Lupin Way, San Carlos, Calif. 94070.
Editors Dn. ELMEH H . MARTH, Editor, Dept.
of Food Science, University of '"' isconsin, Madison, \Vis. 53706.
H. L. THOMASSON, Execut·ive Secretary and Managing Editor, Box 437, Shelbyville, Indiana 46176.
Editorial Board C. A. ABELE ____________ Evamton, lll. H. S. ADAi'\1S ___ ___ Indianapolis, Ind. J. A. ALFORD __________ Beltsville, Mel. E. F. BAEH - -----Washington, D. C. F. W. BAimEH ________ Glenview, Ill. F. L. BnYAN __ __________ Atlanta, Ga. W. J . DYEH __________ Halifax, N. S. J. C. FLAKE ____ __ \;.,lashington, D. C. H. H. GnoNmGEH ______ Seattle, Wash. L. G. HAHMON ___ _ East Lansing, _M:ich. N. F. INSALATA ___ _ Battle Creek, Mich. C. K. JoHNS ___ _________ Ottawa, Ont. H . KonEN ______ ____ Terre Haute, Ind. R. T . MAHSHALL ______ Columbia, i'vfo . S. A. MATZ ----------Villa Park, Ill. E. M. MIKOLAJCIX ____ Columbus, Ohio J. C. OLSON, Jn. ____ Washington, D. C. R. L. OLSON __________ Albany, Calif. Z. J . 0HDAL ______________ Urbana, Ill. J . W . PENcE ___ _______ Albany, Calif. H. J . PEPPLEH ___ __ _ Milwaukee, '"' is. D. S. PosTLE ___ _________ Ithaca, 1. Y. \V. D. PowniE ------Vancouver, B. C. R. B. READ, JR. -----Washington, D.C. G. W. REINBOLD -- ~-----Ames, Iowa G. H . RICHAHDSON ______ Logan, Utah R. L. SAFFLE ____________ Ath.,ns, Ga. \ V. • E. SAND!NE ____ Corvallis, Oregon F. l'vf. SAWYEH ________ Amherst, Mass . D. F. SPLITTSTOESSER __ Geneva, N . Y. C. E . SwiFT ________ Philadelphia, Pa . B. A. TwiGG ______ College Park, Mel. C. VANDERZA!'.'T _College Station, Texas vV. G. \VALTEH ______ Bozeman, Mont. H . B. vVARREN ________ Omal1a, Nebr. K. G. WECKEL ________ Madison, Wis. J . C. WHITE ____________ Ithaca, N. Y. H. \VrsTHEICH __________ Chicago, Ill E. R. WoLFOHD ____ Puyallup, vVash. E . A. ZoTTOLA ______ St. Paul, Minn.
The .Tournai of Milk and Food Technology is issued monthly begtnnng with the Janua.ry number. Each rolume comprises 12 numbers. Published by the International Association of Milk, Food and Env ironmenta l Sanitarians, In c. with executive offices of the Association,
]ou·mal of
MILK and FOOD TECHNOLOGY
INCLUDING J\IIILK AND FOOD SANITATION Off·icial Publication
Internation al Association of Milk, Food and Environmental Sanitarians, Inc.
Reg. U. S. Pat. Off.
VoL 34 September, 1971 No. 9
Isolation of Salmonellae from Naturally Contaminated Dried Milk Products ll. Influences of Storage Time on th e Isolation of Salmonellae
13-ibek Hay, ]. ] . ]ezeski, and F . F. Busta _______________________ _423
Sanitation and \Vater Usage in the Processing of Sour Cherries Y . D. Han g, D . L. Downing and D. F . Splitt;toesser ___ __________ _428·
Temperature Profiles in Holding Tubes of Milk and Egg Pasteurizers R. ,V, Dickerson, ]r., and R . B. Read, ]r. --------------- · _____ _43 1
Immunoglobulins in Skimmi lk and Model Systems and their Effect on Bacillus Cereus ,
E. M. Mikolajcik and A K. Cho11clh ery ---------------- ______ _ _435
Testing Milk for Cleanliness of Production A1~hael Roman -------------- -------- -------------- - --------- -438
Microwave Ovens and their Public Health Significance Hobett L . Elder and Walter E. C unclake1· ____________ ____ ________ 444
Vibrio Parahaemolyticus - A Review R. Nickelso n and C. Vamlersant -------------------- - ---------_4·!7
\ Amendment to 3-A Sanitary Standards for :Multiple-Use Plastic Materials Used as Product Contact Surfaces for Dairy Equipment ______________ 452
Performance in Microscopic Counting of Somatic Cells in Milk. I. Effects of Procedural Variations on Accuracy and Precision
\V. D . Schultze, ]. W. Sm·ith , D. E. jasper, 0 . Klastrup , F. H. S. Newbould, D . S. Postle and W. W. Ullmann ____ _______ _453
Amendment to the 3-A Accepted Practices for th e Sanitary Construction, Installation, Testing and Operation of High-Temperature Short-Time Pasteurizers, Revised __ - --- - --------------- - - --- _______ ____ _457
Holders of 3-A Symbol Council Authorizations on August 20, 1971 _________ _458 The National Conference on Interstate Milk Shipments: Twenty
Years in Retrospect ] . C. McCaffrey - ------ __ --- --- ----- -- ----------- - ---------- _ _461
Association Affairs _____ ---- ____ -- - ------------------------ --- ------- A65 News and Events ___ ------------ - --------------------------------- ____ 466 Index to Advertisers ___ ----- ----- -------- - ------ -------- - ---------- _____ Ill Classified Ads ________ -------- - ------------------------ _______________ Ill
Blue Ridge Rd., P. 0 . Box 43 i, Sllelbyr ille, Ind.
2nd Class postage pa id at Shelbyr ille, ln dian <L •16176.
EDITOlllAL OFFICES: Dr. Elmer H. Marth , Dept. of l!.,ood Science, U niY ersity of ' Viscous iu , Aladison, " 7is. 53i OG. H . L. Thoma sson , 3lanaging Editor, P. 0. Box 43i Shelbyrille, Indi·ana 46liG.
Manu scripts: Correspondence rega rd ing man uscripts and other rea ding materi al should be addressed to Dr. E lmer H. Marth , Dept. of l~'ood Science, Uni vers ity of " 'isconsin , 1\Iadison. Wis. 53 i06.
ulnstruction to Contributors" can be obta ined from the editor for the use of co~>tributors of papers.
Page Ch arge: Effectlre January 1, 1969 a charge of $25.00 JlCr print ed page will be made for all resea rch papers whi ch are published. See Volume 31, issues 10, 11, or 12 for details.
Bu siness Matters : Corres]londeuce regarding business matters, advertis ing1 subscriptions, orders for s ingle copies, etc., should be addressed to II. J,. 'l'homasson (address above).
Su bscription Rates: One volu me per year . l ndir ldua l non-members. Gol•ernmcnt nl and Comm ercial Organization subscr iptiou.
I )T,
1'ubli c and Education Institution J.. ibraries, 1 yr.
. ..... . $14.00
. .. $12.00
Sing-le Copies ...... . ........... ... ... ........ ........ $ 1.50 Orders for Rep rints: All orders for reprints
should be sent to the ex ecutlv~ office of the Association, P. 0 . Box 43i, Shelbyville, Ind.
Membership Ou es : Members in the In terna tional Association of 1\Iill<, Food and En,· ironmental Sanitarians, In c., is $14.00 per year, ancl Special Certified Student membership is $4. 00 per yea r, which includes annual subscription to the Journal of Milk a nd Food Technology. All Correspondence, r ega.rdlng membership, remittances for du es, failure to receil·e COllies of the Journ a l, cha nges In adclress and other such matters should be addressed to the Executive Setretary of the Association, H . L. Thomasson, Box 437, Shelbyv llc, Indiana 46176.
CoPYRIGHT 1971 INTERNATIONAL AssoCIATION OF MILK, Foon M m ENVIRONMENTAL SANITARIANS, INc.
II
,
' .. I

'
]. Milk Food T echnol., Vol. 34, No. 9 (1971) 423
ISOLATION OF SALMONELLAE FRO~M NATURALLY CONTAMINATED DRIED MILK PRODUCTS
II. INFLUENCE OF STORAGE TIME ON THE ISOLATION OF SALMONELLAE'
BIBEK RAY', J. J. JEzEsKI\ AND F. F. BusTA Department of Food Science and Indttstries
University of Minnesota St. Paul 55101
( Received fo r publication 'larch 29, 1971 )
ABSTRACT
Qualitative tests for the presence of sa lmonellae in naturally contaminated dried milk products and tailings obtained from five plants indicated rapid decreases in numbers of positive samples. After storage of up to 10 months, <23% of the 49 product samples and <36% of the 93 tailings samples exhibited viable salmonellae. In product fractions of daily production, storage survival was greatest in the first product through the system ( 48.9%) when compared to an average of 23% sur~val in the food grade fraction s. Quantitative detenninations of salmonellae in nine samples indicated a significant reduction from 2.2 to 0.9 Most Probable ltm1ber per 100 g sample. These data indicated that samples which contained viable salmonellae inunediately after manufacture might test negative after extended storage. However, extended storage did not free all samples of contrunination . Therefore, storage cannot be based as a method of freeing contaminated dried milk products of salmonellae.
Detection of salmonellae in contaminated dried milk products may depend upon the interval between production and testing, i. e., storage time. In artificially contaminated dry milk, the survival of salmonellae, as determined by the reduction in number, was affected by storage (4, 5). In general, salmonellae were desh·oyed initially at a rapid rate followed by a relatively reduced rate (4). A rapid initial reduction in number of salmonellae in meat meal during storage also was reported (8). Bacterial death rates in dry milk, as measured by total number, were high during the first 2 months of storage (1 , 6). This reduction in total number during storage of dry milk was exh·emely high at 22 C. Also, reduction in total bacterial number in dry milk stored in air was greater than that stored under nitrogen (6).
MATERIAL AND METHODS
Samples Detection of salmonellae from naturally contaminated dried
milk products was done by isolation procedures (2) and by
'Scientific Journal Series Paper 'o . 7577, Minnesota Agricultural Experiment Station, St. Paul. ' Present address: Department of Food Science, North Carolina State University, Raleigh, N . C. 27607 . "Present address: Department of Botany and Microbiology, Montana State University, Bozeman, Montana 59715.
1nost probable number ( MPN) procedures. For isolation studies, different product fractions an~l tailings samples from daily production wns from several dry milk plants were tested for the presence of salmonellae within 7 days after manufacture. All these plants had a history of producing powder contaminated with salmonellae. The different product fractions used were the first product (animal feed), and portions from the first, middle, and last bags of food grade products. All the samples from which salmonellae were isolated initially were stored in polyethylene bags at room temperature and were tested again during 2 to 12 months of storage. Limited quantities of each srunple did not pennit more frequent and long term testing of all the samples from these plants.
For MPN determinations, "bulk samples" in 50 and 100 lb. bags and drums were procured about 2 months after manufacture and t ested for the presence of salmonellae. Sru11ples that showed the presence of salmonellae were used. Numbers of salmonellae were determined by the MPN technique, initially and again 4 months later. Products were stored in the same manner as described previously. A total of 9 bulk samples from three different plants were used. The products tested were : two roll er dried nonfat dry milk ( DM) , three spray dried Dl\1[, one spray dried whole milk, one spray dried buttermilk, and one spray dried caseinate mix.
M ethocls of test-ing
Both in the isolation studies ru1d MPN determination, enrichment, plating on selective agar medium , biochemical identification, and serological confirmation were done according to the recomm ended procedure (2) and also by the procedure described in a previous paper (7) .
For the isolation of salmonellae from different product fractions and tailings, samples in 100-g quantities were preenriched in lactose broth pre-enrichment ( 1000 ml in a 2-quart fruit jar.) After 20 to 24 hr incubation at 35 C, a 10-ml portion from the thoroughly mixed pre-enriched sample was used for enrichment.
For MPN determinations, lactose broth was used as the pre-emichment mediwn. The method used for reconstitution and rehydration (first hour after reconstitution) prior to pre-enriclm1ent incubation is presented in Table l. Two temperatures ( 25 and 45 C.) and two solid to liquid ratios ( 1:10 and '1:2.5) were used during reconstitution and the first hour of rehydration . In general, for any particular test condition, a total of 333 g of sru11ple was reconstituted in the required an1ount of lactose broth and mLxed vigorously for 2 to 3 min with a stainless steel whip ( 18-inch piano wire balloon type). The reconstitution and mixing were done in a stainless steel beaker of 4 to Sliter capacity. After the rehydration period of 1 hr, each 333-g portion of sample

424 RAY ET AL.
TABLE 1. R ECONSTITUTION PROCEDURES FOR liWST PROBABLE UMBER ( MP 1 )
DETEHMlNATION OF SALMONELLAE FHOM DRIED MILK PRODUCTS
1336 gl
333 gl
(A) Reconstituted in 3,330 ml of medium, rehydrated for 1 hr, mixed ·and divided
333 gl
(B) Reconstituted in 835 ml of meditml , rehydrated for 1 hr, mixed and divided
333 gl 333 gl
( A') ( B' )
into 3 X 1000 ml, 3 X 100 ml, and 3 X 10 ml and incubated at 35 C.
into 3 X 250 ml, 3 X 25 ml, and 3 X 2.5 mi. Enough medium was added to make the volumes 1000, 100,
1 : 10 solid to liquid ratio
and 10 ml , respecti vely, and incubated at 35 C.
1: 2.5 solid to liquid ratio
Reconstituted :mel rehydrated for first hour at 25 C
'Samples were dry blended in a bag by shaking 100 times.
1 :10 solid to liquid 1:2.5 solid to liquid
Reconstituted and rehydrated for first hour at 45 C
Lactose broth was used in all phases of reconstitution and pre-enrichm ent. A' and B' were the same as A and B, respectively, except for reconstitution and rehydration temperature.
At the end of the rehydration period and before pre-enrichment incubation at 35 C all th e subsamples were adjusted to ,
a 1 : 10 solid to liquid ratio.
TABLE 2. EFFECT OF STORAGE ON CONTAMINATED SAMPLES ON THE ISOLATION OF SALMONELLAE
Number of sa mples positire for sa lmonell ae f l\umber of sa mpl es tested
Produ ct samples ' l 'a ilin ~ sam ples (Storage tim e, months)
0 2 4 6 8 10 0 2 4 6 8 10 12
Plant 1 10/10 5110 10/ 25" 5116 2/13 27/ 27 5/ 27 4/ 27 4/ 27
Plant 7 13/ 13 1/13 - 9/ 9 3/ 9
Plant 8 33/ 33 13/ 33 11/ 33 12/ 33 8/ 33 10/ 33
Plant 3 11/ 11 7111 - 4/10 9/ 9 4/ 9 6/ 9 4/ 9 5/ 9
Plant 11 15115 4/15 - 15/ 15 11/15 -
1- not tested.
All the samples used in the storage study were positive for salmonell ae in the first test. Serotypes isolated from different plants : Plant 1 - S. typhimurium, S. ia.va, and S. blockley
Plant 3 - S. montevideo; Plant 7 - S. omnien.btt?"g; Plant 8 - S. m innesota, S. kentucky, and S. tennessee; Plant 11 - S.
a.natum. "25 samples included eight from the two months test ( including all five positive) and 17 new samples.
Product samples tested at 6, 8, and 10 months from Plant 1 and at 8 months from Plant .3 included all the positive samples
from th e preceding tests.
was divided into nine subsamples containing three 100-g, three 10-g, and three 1-g portions. The containers used for pre-enrichment incubation were 2-quart fruit jars for the 100-g samples, wide mouth screw cap dilution bottles for 10-g samples, and screw cap test tubes ( 150 X 25 mm) for 1-g san1ples. The subsamples were incubated for 20 to 24 hr at 35 C and then enriched by the procedure de
scribed above. E ach of the nin e subsamples was considered as a separate unit and was tested separately according to the recommended procedure for th e presence of salmonellae (2). The total number of subsamples out of the total number t es ted in each of the 100, 10, and 1 g levels that showed the presence of salmonellae were added together. Sa lmonella. population levels were then calculated by MPN techniques accordin g to the method suggested by Halvorson (3).
R ESULTS
Sun;ival of salmonellae
Salmonellae in naturally contamin ated dried milk
products may die off during storage, possibly at a nile equal to or much faster than that in artificially contaminated products. To es tablish the effect of storage, a series of different fractions of products samples and tailings, which showed the presence of salmonellae when first tested within 7 days after manufacture, were retes ted at later dates. ·A reduction in number of samples from which salmonellae could be isolated after storage was considered to result from death of these organisms during storage. The results of these tests are presented in Table 2 and Fig. 1.
Product samples consisting of animal feed and first, middle, and las t bags of food-grade products from four different plants were retested during 2 to 10 months of storage (Table 2). Within 2 months of- storage, salmonellae were isolated from only 8
, , •· I
f)
l I
.-I

,
' ·' l
;
IsoLATIOK OF S ALMONELLAE 425
100
80
60
40
"" > 20 ,.... II)
0 0 ll..
,.... 100 z w u 80 Dl:: w ll..
60
40
20
a. PRODUCTS : PLANT 1 o-\ 3~
\ 7 k - -
11 ._
\\~ \\ ----~~ \~ 0~ I
I I 0 ...
\'\ 3 ~ 7 k -- -
\ \ 11~ ,, ~ ~ 8 D- ·-I t.. I' 1\
~~ t..
I \
\o"-.., I --a- - _c_~ ~- _ _JJ A
~ o_o
2 4 6 8 10 AGE AT TESTING (MONTHS)
Figure l. Effect of storage on the isolation of salmonellae from contamin ated dried milk samp les.
to 50% of the samples from plants 1, 7, and 11 (Fig. 1 ) . After the initial rapid decline in incidence of isolation, Salmonella isolation percentages in samples from plant 1 remained essentially constant up to 10 months. However, more than 70% of the product samples from plant 3 were found to contain salmonellae after 4 months of storage. This was reduced to about 40% after 8 months. The high incidence of Salmonella isolation from stored plant 3 product samples contaminated wi th S. montevideo could result from one or more of the following factors : difference in serotype, difference in initial level of contamination, mechanisms of contamination, or differences in the processing conditions .
Tailings samples from five different plants were tested during a storage period up to 12 months (Table 2 ). A rapid reduction in the incidence -of Salmonella isolation in tailings from plants 7 and 8 was observed wi thin 2 months of storage (Fig. 1 ). Only 15% of the samples from plant 1 were positive after 8 months, the time when the samples from this plant were first retested. From these results it is impossible to detennine the time during storage
where most of the reduction might have actually occurred. A relatively high percentage of tailings samples from plant 3 showed the presence of salmonellae ( 45 to .55%) during 6 to 12 months of storage. The product samples from this plant also showed high isolation frequencies during storage. Tailings from plant 11, which were actually powder from a central vacuum fines collection system, were positive for salmonell ae in about 70% of the samples after 2 months. Products from the same plant, however, showed the presence of salmonellae in only 30% of the samples on re tes t after the same period ·of storage. This could be caused by differences in the original populations or any of the reasons mentioned before. In some of the tailings 'from plants 3 and 8, salmonellae were not isolated in one test but were isolated in later tes ts.
Swvival in different product fractions Data on Salmonella test results observed during
storage were related to different product fractions from two plants (Table 3 ) . The first product (animal feed ) provided more isolations of salmonellae than did the other samples taken later during the production of a lot. Furthermore, contamination persisted longer in the animal feed. About 49% of the total animal feed samples tested during 2 to 10 months of storage were found to contain salmonellae. This high isolation rate could b e direct evidence
TABLE 3 . EFFECT OF STORAGE ON TI-IE SURVIVAL OF
SALi\'IONELLAE IN DIFFEH.E ' T PROOUCT FRACTIONS FROM
TWO DHY l>d!LK PLANTS1
T ype of sa mples
F irst product (animal feed)
Food grade products First bag Middle bag Last bag Total food grade
\'un;ber posilh·e j ?\ um ber tested
P lnnt 1
21/ 59
6/ 27 0/ 6 4/14
10/ 47
P l ant. 3
22/ 29
3/ 8 0/ 0 0/ 2 3/10
Tota l %
43/ 88 48.9
9/ 35 25.7 0/ 6 0.0 4/16 25.0
13/ 57 23.0
1 All samples tested during storage were positive initiall y. The samples were retested during storage up to 10 months.
TABLE 4 . EFFECT OF STOHAGE ON SUHVI\'AL OF Salmonella SEHOTYPES IN CONTAl\IINATED DIUED l>.IILK PRODUCTS
FHOM PLANT 11
"\'umben: of samples positive
S. typhimu-rium S. ja va.
S. blockleu
l" res h samples
43
143 (67%) 69 (33% )
0 (0%)
Sto red samples up to 6 months
18
95 (55% ) 74 (42% )
6 (3% )
'All 43 samp les were tested during storage. FI"Om each positive sample, four or more colonies were isolated on the b asis of difference in colony morphology and serologically typed.

426 RAy ET AL.
TABLE 5. MOST PHOBABLE NUMJ3EH ( MPN ) OF SALMONELLAE IN CONTAMINATED DHIED MILK PRODUCTS1
25 c 45 c;
1 :10 1 :2.fi 1 :10 1 :2.;i Total
100 I 0 100 10 I 00 10 I 00 10 100 10 MP!\ I C. I. (9~% (A) (B) (A') (]3') 100 g
Number of samples tested
in each test 27 27 27 27 27 27 27 27 27 27 27 27 108 108 108
Number positive in:
First test 19 9 3 21 12 0 19 11 3 24 11 4 83 43 lO 2.2 1.67-3.09
Retest 12 0 0 16 5 1 11 4 0 12 8 2 51 ' 23 3 0.9 0.68-1.26
'A total of nine ~amp l es from three different sources were tested by the method shown in Table l. Two of these samples were contaminated - with S. breclenu, one with S. anatwn, and two with S. minnesota, and four with S. minnesota, S. kentucku,
and S. tennessee. At the time of the first test, th e samples were at least two months old. Hetesting was done four months after the first test . MPN's for th e total positive sampl es were determ ined by the method of Halvorson ( 3).
of eleva ted survival rate or could be caused by a high level of initial population of salmonellae. The incidence of Salmonella isolation was higher in animal fef'd from plant 3 than from plant 1. This could result from a difference in serotypes or other factors mentioned earlier. Incidence of Salmonella isolation from the different fractions of food grade products was relatively low, the lowest being in the sample from the middle bag.
St.trviual of vario·us serotypes
To study the effect of storage on individual Salmonella serotypes, dried milk products contaminated with multiple serotypes were tested (Table 4). These product samples from plant 1 were contaminated with Salmonella typhimt.tritt.1n, Salmonella java, and Salmonella blockley. Four to 16 colonies w ere randomly selected from each plate containing typical Salmonella colonies (after 20 to 24 hr incubation at 35 C) and these isolates were serologically typed. Of the 21.2 colonies typed from 43 positive samples on the first test, about 67% were S. typhimuri.wn and 33% were S. java. These samples were retested after 2 to 6 months of storage and salmonellae could b e isolated from only 18 samples. Of the 175 colonies, about 55% were S. typhimuT'ium, 42% S. java, and 3% S. blockley. Though S. blockley was isolated only in the stored samples, no gross differences in percentages of isolation between S. typhimurium and S. java were observed. Probably the initial levels of contamination for S. blocldey were low in comparison to S. typhimuriu:m and S. java and thus were not detected in mixed populations. However, S. blockley might have been more tolerant of storage and thus was isolated . Also, the other serotypE)s seemed to differ very little in their survival rates during stor
age.
Effect of storage on apparent populations
Salmonellae in . naturally contaminated dried milk
products apparently die off during storage. The rate of this death may be fairly rapid during the early stage of storage. An estimation of the rate ' of reduction in population over a period of 4 months was done by MPN determination.
A total of nine bulk samples was tested at two initial rehydration temperatures and two initial rehydration solid to liquid ratios in lactose broth preenrichm ent medium. The total number of subsamples that showed the presence of salmonellae out of the total number of subsamples tested in each of the 100, 10, and 1-g levels were used to determine !vlPN values (Table 5). Although n;vo rehydration temperatures and two rehydration solid to liquid ratios were used, the results did not show any major differences between these variables. Values in the first test and retes t were calculated only on the compiled data. The MPN of salmonellae in 100 g of product was 2.~ in the first test and 0.9 in the retest. Even though the samples were at least 2 months old during the first test, about 60% reduction in population occurred within the next 4 months of storage. Reduction in percentage of population might have been much higher during the early period of storage.
DISCUSSION
Salmon ella populations in naturally contaminated dried milk products appeared to die off rapidly during storage. In general, the presence of salmonellae was not demonstrable in about 60 to 70% of the contaminated samples after storage. Initial rapid reduction may have occurred early in storage and possibly within the first few days after manufacture, particularly when the samples are stored at room temperature and without any humidity control. Similar rapid reduction in total count as well as in Salmonella . population in dried milk products has been observed by other workers. Crossley and John-
,
;~ I
'J
.I
'

I
·' l
'
IsoLATION OF S ALMONELLAE 427
son (1) reported a 70% reduction in original total counts within 4 w<:eks of storage of dry milk powder at room temperature. In artificially contaminated dry milk, McDonough and Hargrove (5) observed about 50% survival of original Salmon ella population after 1 week and 2% after 4 weeks of storage at 26.6 C. Riemann (8) also observed about a 100-fold reduction of salmonellae in meat meal during the first few days of storage.
Death of salmonellae in naturally contaminated dried milk products during storage appeared rapid initially and slowed in later phases of storage. Even in samples that were 2 months old, there "vas about a 60% reduction in population over a period of 4 months storage. The redu ction rate during the initial stage of storage is probably much higher. Supplee and Ashbaugh (9) observed that bacterial death rate in dry milk powder determined by total count was high during the first 2 months of storage and reduced later in storage. LiCari and Potter ( 4) reported that initially Salm onella destruction occmTed rapidly, and after about 2 weeks of storage, destruction occurred at a reduced rate. Similarities exist in the death pattern of salmonellae during storage in the naturally or artificall y contaminated dried milk product.
Survival of salmonellae in dried milk products during storage may be dependent upon several factors such as the numbers of organisms present initially, serotype involved, type of processing, kind of product, conditions, and duration of storage, etc. With the samples stored at room temperature and without humidity control , the initial number of salmonellae was a major factor in determining whether or not a sample exhibited the presence of salmonel-
; lae on retest during storage. Initial high populations , therefore, may have been the reason for the first product processed during a day's operation demonstrating higher percentages of positive tests during storage.
Different serotypes of salmonellae may have different survival rates during storage of the contaminated products. Salmo11 ella montevideo isolated from the samples from one plant appeared to be somewhat more resistant to storage conditions than several serotypes isolat-ed from other plants. This also could result from a difference in initial population. In a multiserotype contaminated product, the frequency of isolation of a particular serotype may depend on the relative proportion of these serotypes in the population . The isolation of S. blockley only upon retest may have been due to its initial number in comparison to S. typhimu1·ium and S. java and relatively better resistance to storage. Existence of
different survival rates during storage among Salmonella serotypes also was reported by LiCari and Potter (4).
Though salmonellae in naturally contaminated products appeared to die off during storage, this method cannot be adopted to free all samples from contamination . In a majority of samples, the presence of salmonellae could not be detected within t\:vo months. However, in some samples the presence of salmonellae was detected after 1 year of storage. A similar suggestion has also been made by LiCari and Potter ( 4).
ACK NO W LEDGM ENT
Tllis investigation was supported in part by Food and Drug Administration Contract 67-61 and Contract 68-46 and by a grant from the American Dry Milk Institute. V•le thank the Consumer and Marketing Service, USDA, for their cooperation in obtaining samples, the Minn esota Department of H ealth for assistance in serologically typing and identifying isolates, and local food industries laboratories who assisted in suppl ying certain samples . \~Te also thank Miss Gretchen Saecker for technical assistance and H. Orin Halvorson and F. B. Martin for consultations on statistical evaluations. \•Ve are grateful to a group of people associated with the plants involved, who must remain anonymous, but without whose cooperation and active assistance, these data could not have been collected.
R EFEHENCES
l. Crossley, E . L. , and W . A. Johnson . 1942. Bacteriological aspects of the manufacture of spray-dried milk and whey powders, including some observa tions concerning moisture content and solubility. }. Dairy Res. 13 :5-44.
2. Galton, 1\'1. M., G. K. Morris, and W. T . Martin, 1968. Salmonellae in foods and feeds. Review of isolation methods and recommended procedures. U . S. Dept. of H ealth, E ducation , and \Velfare, Public H ealth Service, C.D.C., Atlanta, Georgia. p. 17-25.
3. Halvorson, H . 0. 1958. Some elements of statistics for microbiologists. Dept. of Biochemistry, The T echnical University of orway, Trondheim . p. 19-22.
4. LiCari, J. } ., and N. N. Potter. 1970. Salmonella smvival during spray drying and subsequent handling of skimmilk powder. III. Effects of storage temperature on Salmonella and dried milk p roperties. }. Dairy Sci . 53: 877-882.
5. McDonough, F. E ., and R. E . Hargrove. 1968. Heat resistance of Salmonella in dried milk. J. Dairy Sci. 51:1587-1591.
6. Nichols, A. A. 1939. Bacteriological studies of spraydried milk powder. J. Dairy Res . 10:202-249.
7. Ray, B. , J . J. Jezeski, and F. F . Busta . 1971. Isolation of salmonellae from na t~,~rally contaminated dried milk products. I. Influence of sampling procedures on the isolation of salmonellae. J. 1ilk F ood Teclmol. ( In. press)
8. Riemann, H. 1968. Effect of water activity on the heat resistance of Salmonella in "dry" materials. Appl. Microbia l. 16:1621-1622.
9. Supplee G. C., and V. J. Ashbaugh. 1922. Bacterial content of milk powder. J. Dairy Sci. 5:216-228.

428 ]. Milk Food Teclmol., Vol. 34, No . 9 (1971)
SANITATION AND WATER USAGE IN THE PROCESSING OF SOUR CHERRIES' Y. D. H ANG, D. L. DowNING, AND D. F. SPLITISTOESSER
New York State Agricultural Experiment Station , Cornell University, Geneva, New York 14456
( Received for publication March 22, 1971 )
ABSTHA Cl'
Surveys were made of four red sour cherry processing plants to obtain information regarding microbial contamination and water usage. \ 'Vith the exception of some long conveyor belts, no single sites were found to be major sources of contamination and the mean count at most stages was under 50,000 per gram .
The primary sources of waste water were the soak tanks, sprays, and flum es. From 600 to over 800 gal of water were discharged per ton of fruit processed ; the BOD per ton ranged from 6 to over 10 lb. The study pointed to the soak tanks and pit flum es as possible areas where waste water generation could be reduced.
Pure waters programs are forcing many members of the food indush·y to improve their h·eatment of aqueous wastes that are to be discharged into classified waters. Treahnent costs usually are sizeable for fruit and vegetable processors because of the high volume and strength of their wastes. One of the more promising approaches for reduction of these costs is to minimize water consumption and consequently effluent production (6) . Although a prerequisite for this is an understanding of the effect of different variables on waste water generation; only a limited number of reports describe in~plant studies dealing with this aspect of fruit and vegetable processing (2, 4, 7, 10).
The purpose of this research was to study water usage and sanitation in the processing of red sour pitted ( RSP) cherries. It was felt that the h 'IO
should be considered together to avoid alterations for reducing waste water that might sacrifice sanitation and thus product quality.
MATERIALS AN D M ETHODS
V\Taste water flow rates were measured by two methods. Discharges from various equipment and pipes were estimated by the calibrated container-stop watch procedure in which the time required to fill a container was clete1mined (3). The flow through open channels was calculated on the basis of cross section dimensions and strean1 velocity. The latter, measured with a cork float and stop watch, was corrected to establish the mean velocity (5).
Samples of was te water and fruit were sealed in one
'Approved by the Director of the ' ew York State Agricultural E xperiment Station for publication as Journal Paper No. 1877.
pint polyethylene bags and transported to the laboratory in an insulated ice chest over ice. Bacteriological analyses were performed as soon as the sampl es reached the laboratory, the sam e clay they were collected. The samples to be analyzed for BOD, total solids, and volatile solids were frozen immediately and stored at -23 C until the tests could be made.
The microbial populations on fruit were determined by blending 22 g in 198 ml of sterile water for 2 min in a vVa.ring blenclor. Appropriate decimal dilutions were platec' on potat~ dextr.ose agar, pH 5.6. Colonies were counte1., after an mcubatwn of 4 days at 20 C. \-\Tater sampl es wer handled similarly except that mechanical blending was omit ted.
Standard methods (1 ) were used for determinin g the BOD , total and volatile solids.
RESULTS Al\TJ) DISCUSSION
During the 1970 processing season 22 surveys were made of the lines of four cherry processors. Three of the plants prepared the fruit for freezing while the fourth was a cannery; all were quite similar with respect to the processing steps that were followed. The general procedure was that the fruit was h·ansported to the factory in water contained in halfton pallet tanks . After weighing it was h·ansferred to soak tanks where it was held 8 or more hr in 10 C water to effect firming. The soak tanks were part of a closed recirculated-water system in which the water also was pumped through a reservoir containing ice for cooling and through different flumes used for conveying the fruit. Following the soak tanks the cherries were conveyed via flume and belt through the stemmer, size and color graders , an inspection table, and the pitter. They then were ready for canning or fr eezing.
Microbiology Niicrobial counts were made on 120 samples of
fruit collected at the different processing stages. The data are presented as geometric means (Table 1 ) because of the considerable variation .in counts from survey-to-survey. In 8 studies of Plant. B,~ for example, the counts on cherries taken from the·· inspection belt ranged from . 6 to 240 X 10" per gram.
In general, no specific sites were found to ·be the primary sources of contamination. This was uneJ~.'Pected since it had been anticipated that ce1· t~dn
•
( .. I

iJr
t
·' l
;
SAXITATION AND VVATER USAGE 429
E 106 .... 0
E 0> .... <11 a. V> 105 E
- ~ c 0 0> .... 0 0 .... u
::E 104 c:n
0 .....
---- Recirculated Cooled Water
o---o Fruit From Soak Tonk
SURVEYS 1-6 7-14
Plant A Plant B Plant C
19-22
Plant D
Figure l. Individual survey results comparing microbial counts of recirculated water with that of fruit from the soak tanks.
T.-\BLE l. ivlrCROBIAL CONTA1>flNAT10~ OF CHEHR!ES DUBIN(;
THEIH PHEPAHATION FOH F HEEZl NG .
i\ficroorganisms/g - geometric mean X 10-3
J>rocesslng Samplin~: site plant A B c ])
Receiving station 43 17 20 45 Pol lowing soak tank 40 17 44 87 After stem mer 12 35 8.9 Hl f-o llowing grader 10 19 Inspection belt 16 20 47 After pitter 15 14 78 2.'5 Filler 8.9 12 35 160
equipment such as the pitters would be areas of significant microbial build-up. These results, which differ from our obseryations of vegetable lines (8, 9) are thought to be due to the low pH of cherries, under 4.0, which selects for yeas ts as the predominant contaminant. The periodic line clean-ups, usually limited to shutdown periods , appear to have b(jen sufficiently frequent to control the relatively slow growing yeasts .
Plant D used a number of long belts to convey the fruit from pitters to fillers. This is believed to explain the significantly heavier contamination of cherries at this latter stage. Cherries at Plant D were
g iven a thermal process and, therefore, this viable count would not be found in the preserved product.
The microbial populations of the reci~culated 10 C wat · r that is pumped through the soak tanks and flumes vvas compared with the level of contamination on fruit taken from the soak tanks (Fig. 1 ) . There was considerabl e variation in counts; the soak water at Plant B, for example, yielded 5 x 10³ to 1.8 x 10' organisms per milliliter. These differences undoubtedly refl ected the time that had lapsed since the sys tem had been completely drained and refilledit was not uncommon for this to b e done weekly or at even longer intervals.
Tt can be seen (Fig. 1 ) that the concentration of organisms on the fruit paralleled that in the water to only a limited ex tent and that the number per milliliter of watn was almost always higher than the number pPr gram of fruit. The latter would be expected since most of the organisms on the cherry would be restricted to its surface. The rather poor correlation between microbial densities on the fruit and in the water suggest that other factors have a marked effect on the microbiology of the cherry. It is likely that an important variable was the incidence of surface fractures on the fruit that was cultured.
IV aste water Soak tanks , sprays, and flumes were the main
sources of waste water in the four plants (Table 2). The gallons of water and pounds of BOD per ton of cherries shown here probably underestimated the tru e values because of additional water used for clean-ups, and because the soak tank-flume-cooled water systems wc- re completely drained and ·tefilled periodically. Surprisingly, the different processors could not provide figures as to the volumes of water in these systems .
Total cherry production an d water consumption data for the entire processing season, available for Plants A and B, permitted an evaluation of these per-ton figures. Based on seasonal totals, Plant A used 1800 gal of water per ton, a value considerably higher than the 790 gal estimat~d from in-plant flow measurements . However, this factory completely emptied the water from its soak tanks daily which could account for the difference. The seasonal calculations for Plant B, which emptied its recirculated water weekly, indicated a consumption · rate of 780 gal per ton , a figure comparable to . the 869 gal in Table 2.
It would appear that the amount of waste water aenerated in the soak tank-flume operation varied ~onsiderably from factory-to-factory. In addition to the frequency that different plants emptied and refill ed these systems, considerable variation in wa-
' /
430 HANG Kr AL.
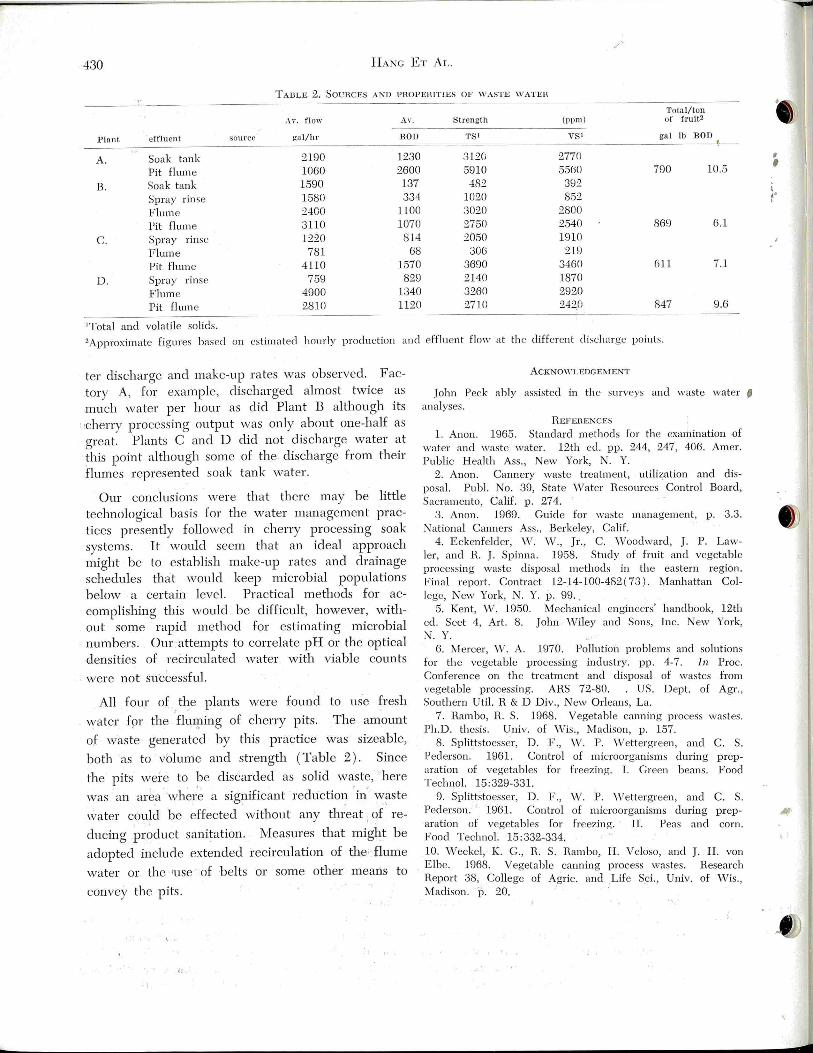
TABLE 2. SOUHCES AKD PHOP EHITJES OF WASTE WATER
Total/ton A \·. fl ow Av. Strength (ppm ) of fruit2
Plant efflu ent SOU I'CC ga l/hr BOD 'l'S' VS' gal lb BOD
A. Soak tank 2190 1230 3120 2770
Pit flum e 1060 2600 5910 5560 790 10.5
B. Soak tank 1590 137 482 39:2
Spray rinse 1580 334 1020 85:2
Flume :2400 llOO 3020 2800
Pit flum e 3110 1070 2750 2540 869 6.1
c. Spray rinse 12:20 814 2050 1910
F ILml e 781 68 306 219
Pit flum e 4110 1570 3690 3460 611 7.1
D. Spray rinse 759 829 2140 1870
Flume 4900 1340 3260 2920
Pit flum e 2810 1120 2710 242.0 847 9.6
'Total and volatile solids. 2Approximate fi gures based on es timated hourly production and efflu ent flow at th e different cl iseharge points.
ter discharge and make-up rates was observed. Factory A, for example, discharged almost tvvice as much water per hour as did Plant B although its ·cherry processing output was only about one-half as great. Plants C and D did not discharge water at this point although some of the discharge from their flumes represented soak tank water.
Our conclusions were that there may be little technological basis for the water management practices presently followed in cherry processing soak systems. It would seem that an ideal approach might b e to establish make-up rates and drainage schedules that would keep microbial populations below a certain level. Practical methods for accomplishing this would b e difficult, however, without some rapid method for estimating microbial numbers. Our attempts to correlate pH or the optical densities of recirculated water with viable counts
were not successful.
All four of . the plants were found to use fresh
water fs)l' the flmp ing of cherry pits. The amount
of waste generated by this practice was sizeable,
both as to volume and strength (Table 2 ) . Since
the pits wei'e to b e discarded as solid waste, here
was an area \ vher'e a signific~nt reduction in' w~ste water could be effected without any threat I of re
ducing product sani~ation . :Measures that might be
adopted include extended recirculation of the ·· flume
water or the tuse · of b elts or some other means to
convey the pits.
ACKNO\\'LEDGEMENT
John Peck ably ass isted in th e surveys and waste water 1 analyses.
REFEHEKCES l. Anon. 1965. Standard methods for the examination of
water and waste water. 12th ed. pp. 244, 247, 406. Amer. Public Health Ass., New York, N. Y.
2. Anon . Cannery waste treatment, utilization and disposal. Pub!. No. 39, State \Vater Resources . Con trol Board, Sacramento, Calif. p . 274.
3. Anon . 1969. Guide for waste management, p. 3 .3. i\'ationa l Canners Ass., Berkeley, Calif.
4. E ckenfelder, \V. W. , Jr., C. Woodward, J. P. Lawler, and R. J. Spinna. 1958. Study of fruit and vegetabl e processing waste disposal methods in the eastern region . Final report. Contract 12-14-100-482(73 ). Manl1attan College, New York, N. Y. p . 99 . .
5. Kent, \V. 1950. .l'viechanical engineers' handbook, 12th eel. Sect 4, Art. 8. John vViley and Sons, 1nc. New York, N. Y.
6. Mercer, \V. A. 1970. Pollution problems and solutions fo r th e vegetable processing industry. pp. 4-7. In Proc. Conference on the treatment and disposal of wastes from vegetable processing. ARS 72-80. . US. Dept. of Agr. , Southern Uti!. R & D Div., New Orleans, La.
7. Rambo, R. S. 1968. Vegetabl e cmmin g process was tes. Ph .D. thesis. Univ. of Wis., !viadison, p . 157.
8. Splittstoesser, D. F ., \V . P. \Vettergreen, and C. S. Pederson. 1961. Control of microorganisms during preparation of vegetables for freezing. I. Green beans. Food Techno!. 15:329-331.
9. Splittstoesser, D . F., \V. P. \Vettergreen, and C. S. Pederson. · 1961. Control of microorganisms during preparation of vegetables for freezing. II. Peas and corn. Food Techno!. 15:332-334. 10. Weckel, K. C., R. S. Rambo, H . Veloso, and J. H. von Elbe. 1968. Vegetable canning process wastes . Hesearch Report 38, College of Agric. and Life Sci., Univ. of Wis. , Madison. p. 20.
, '
\ .. I
,,
I
·~
] . Milk Food T echnol. , Vol . 34, No. 9 (1971 ) 431
TEMPERATURE PROFILES OF MILK AND EGG
IN HOLDING TUBES PASTEURIZERS
R. w. DICKERSON, JR. AND R. B. READ, JR.
U. S. D epartment of H ealth, Education, and W elfare
Puhlic H ealth Service, Food and Drug Administration
Bureau of Foods, Office of Foocl San·itation
Dit;ision of M icroh iologu, Food P-rocess Evaluation B-ranch
Cincinnati, Ohio 45226
( Received for publication March 5, 1971 )
ABSTRACT
Product temperatures in a cross-section of the holding tube
of milk and egg pasteurizers are required to be within 1 F ,
and this condition is assumed to be met when tube diam eter
is < 7 inches and product velocity is at least 1 ft / sec . Be
t:ause of the viscous nature of some milk products and most
egg products, the 1 F requirement might not be met, and
therefore product temperatures were measured at the en
trance and exit cross-sections of both milk and egg holding
tubes.
Product temperatures were measured with 0.010-inch-diam
cter thermocouples and a 2<1-point record er. \Vith the
pasteurizer operating with product in forward flow, holdin g
tube temperatures were monitored for about 0.5 hr. Except
for condensed skimmilk, milk product temperatures in a
cross-section did not vary by more than 0.8 F. Although
the temperature variation of condensed skimmilk exceeded
the 1 F requirement, it was within 2 F. For plain yolk and
for salted yolk ( 10% salt by weight) the variation within a
cross-section was 1.2 and 4.8 F respecti vely. The variation
for the other egg products was < 1 F.
Holding tubes are required on milk and egg pas
teurizers to ensure that every particle of product is
held for a minimum time at some minimum tempera-
; ture. If there were large differences in product
. temperature in the holding tube, pathogens might
survive in the cooler portions of product, reducing
the ~ffectiveness of pasteurization. To prevent this,
there is a requirement that product temperatures in
a cross-section of the holding tube cannot differ by
more than 1.0 F (8, 9 ). It has been generally as
sumed that this condition is met when the tube size
is less than 7 inches in diameter and product velocity
is 1 ft/sec or more (8). For milk and vvater, the flow
is turbulent (1 , 2) and no temperature differences are
expected. ·
. For viscous products, however, the flow is not
turbulent (1, 3, 4, 6). Furthermore, the requirement
of a minimum product velocity of 1 ft/sec cannot be
q1et with a product such as salted yolk ( 10% salt by
weight ) . ' iVith a normal plating arrangement of the
pasteurizer, .Scalzo et al. (7) have shown that a pres
sure of 64 psig was required to pump salted yolk
through the pasteurizer at a capaci ty yielding an
·average velocity of- 0.4 ft/sec ·in · the holding tube.
An attempt to operate the pasteurizer a t a velocity
of 1 ft/sec in the holding tube resulted in significant
leakage from the heater section: Consequently, we
questioned whether the 1.0 F requirement could be
met with viscous products such as egg and ice cream
mix. Finally, some milk particles have been observed
moving as much as 3.8 times faster than average
through the heater section of a pasteurizer (10 ), and
we wondered if uneven heating would cause signifi
cant temperature variations in product at the inlet
to the holding tube.
The objective of this work was to measure product
temperature differences at the inlet and exit cross
sections of holding tubes used on pasteurizers for
both egg and milk products .
MATElUALS AND !I I ETHOOS
Products and eqtt:i:pm ent
The pasteurizers, holding tubes, and products used in this
study were those described by Dickerson et al. (1) for milk
products and Scalzo et a l. (6) for egg products. The holding
tube used for milk was size 1.5 inches O.D. stainless-steel
tubing, 20 ft long, consisting of 3 unequal straight sections,
one 180-degree bend, and one 90-degree bend. For the other
milk products , the holding tube was the same diameter and
30 ft long, consistin g of 5 unequal straight sections, three
180-degree bends, an d one 90-degree bend . Neither milk
product holding tube was insulated. The holding tube used
for salted yolk ( 10% salt by " eight ) was size 1.5 inches O.D.
stainless-steel tubing, 84 ft long. The holding tube used
with the other egg products "·as the same diameter and 210
ft. long. Piping arrangements were as described previously
(6). Both egg holding tubes were insulated with ARMAFLEX'
( trade name of the Armstrong Cork Co.) moisture-proof pipe
insulation. The insulation was 0.5 inch thick. The inside di
am eter of all ho lding tubes was 1.40 inches.
T e.>t procedure The pasteurizer was operated as described previotlsly ( 1, '6).
F low rate was 300 gal/hr for all products except salted yolk,
( 1G% sa lt by weight ) , and this yielded an average holding
tube velocity of 1 ft /sec. F low rate for salted yolk was 114
gal!hr with an average velocity of 0.4 ft/sec.
The small thennocouples were susceptible to breakage and
we tested them for continuity prior to each temperature de-
'Mention of a c~mmercia l product implies neither end01·sement
nor criticisrt!' by the U. S. Department of Health, Education ,
and \ .V elfare.

432 DICKERSON Kr AL.
/ No. 30 A.W.G. Thermocouoles
....------Holding tube wall~
· Va inch
BEGINNING Of HOLDING TUBE END Of HOLDING TUBE
Figure l. Position of th ermocouples in the holding tube.
termination. This was clone by pushing the indicating h ead of the recorder off th e ba lance point and observing a restoring force. To achieve steady-state conditions, the pasteurizer was operated with product in forward flow for about 20 min before harves ting of data . \Vith th e e~;ception of one tria l on ice cream mix, in diverted fl ow (8), all tes ts were performed in the forward flow condition.
Instrum entation Thermocoup les with insulation but without a metallic sheath
were fabricated from 0.010-inch-diameter copper-constantan duplex wire and insta lled as shown in F ig. 1. The thermocouple junctions were located diametrically 1/ 8 inch from the tube wall . TI1ese locations were selected as the ones believed to yield the larges t temperature variation. At the beginning of the holding tubes, temperature variations were expected to be the result of uneven h eating in the h eater section, and because of a 90-degree sharp turn at the h eater exit, individual streamlines of flow should have been selectively segregated between the inside and outside radii of the turn . Thermocouples at the beginning of the holding tube were located in a cross-section 7 inches dowmtream from th e exit port of the heater. At th e end of the holding tube there were no changes in flow d irection, and temperature differences were expected to be th e result of differences in fluid density with the coldest product flowing along the bottom of the tube; therefore, we measured temperatures at the top and bottom of the tube. The thermocouples were shifted slightly from the true vertical position to ensure that they would always be immersed in product. Preliminary investigations with a glass holding tube indicated a continuous flow of air bubbles (about 3/ 8 in ch in diameter and 1/ 8 inch thick ) along the top of tb ~ holding tube. Thermocouples at th e end of the holding tube were located in a cross-section 14 inches upstream from the flow diversion valve for milk products and 20 inches upstream for egg products. T emperatures were recorded with a 24-poin t recorder ( Bristol Co. Model M P12G591 ). The smallest chart division was 2 F , and readings were interpolated to 0.2 F.
The thermocouples were ca librated with an NBS t hermometer at 180 F for milk products and 145 F for egg products . All bare wire thennocouples were immersed in a water batl1, and all rea,din gs were within 0.2 F at both temperatures cited above.
REsULTS AL'-'D D iscussiON
Holding tube temperatures were recorded automatically and a . complete set of temperatures were obtained abo1,.1t '2 ~imes ,,per m inute dming each test (about 80 min ). Temperature differences within
a cross-section did not vary significantly with time and the data reported here are those occurring approximately 40 min after th e changeover from water to product operation.
Male products Except for condensed skimmilk, product tempera
tures in a cross-section did not vary by more than 0.8 F , and the exis ting reqvirement of 1.0 F was met. Conversely, condensed skimmilk exhibited tempera ture variations that exceeded 1.0 F but were within 2.0 F (Table 1 ) . Th e variation was greatest a t the beginning of the holding tube; it differed by less than 0.8 F at the end of the holding tube for all products.
As expected, product temperatures at the end of the holding tube were higher at the top of the tube. Despite the absence of insulation, temperature drop along the holding tube was < 2.4 F for all products.
' Vith the exception of ice cream mix, all tests were ' performed in the forward flow condition. For ice cream mix, tes ts were performed in both forward and diverted flow, and no significant differences were detected. During diverted flow, data were taken after multi-pass heating had raised heater inlet temperature from the forward flow condition of 136 F to 173 F .
To determine if the temperature differences would be more severe under non-steady-state conditions, a tes t on ice cream mix ( 16% milk fat ) was conducted wherein the steam and hot water recirculating pump were shut off and holding tube temperatmes were recorded during the transient. The flow-diversion valve was held in forward flow to prevent the flow disturbances that would otherwise occur. D espite the sharp drop in temperatures, the temperature differences within the cross-section at the beginning of the holding tube were about the same as those observed during steady-state operation (Fig. 2).
For all milk products, temperature differences across and along the holding h1be were small, even at the beginning of the holding tube. This suggests that the holding tube can begin immediately at the heater exit port. Furthermore, it is acceptable to locate the temperature sensing element of the recorder-controller at the beginning of the holding tube as recommended by Read et al. (5) for Ulh·aHigh-Temperature (UHT ) processes. Our data shovv even temperature distributions in a cross-section for products at about 180 F, and product temperatures at 190 to 212 F ( the UHT processes) are expected to b e even more uniform because of the lower fluid viscosities at the higher temperatures.
Egg products
With the exception of salted yolk ( 10% salt by
f
( •• I

...
'1
I
·~
TmviPERATUHE PHOFILES 433
T AIJLE l. VAH JATJ 0:--1 OF TElVIPE11ATUHE OF llllLK PHODUCTS A:-<D \VATEH I N THE HOLDI NG TUIJE OF A MILK PASTEURIZEH
Holding tube Inlet Holding tube exit Productn Top Side Bottom Side Top Bottom
------( Temperature, F ) ------------------\Vater
Raw milk
l ee cream mix ( 16% milk fat)
Diverted flow
Condensed ski.mmilk
( 40% total solids)
"In forward flow except as ot herwise noted.
176.2
163.2
177.0
176.8
175.2
weight ) , temperatures of egg products in holding tubes were uniform (Table 2) , despite the long holding htbe ( 210 ft ). The temperature drop along the holding tube was small ( 0.016 F / ft ), but the insulation was required to maintain these temperah1re distributions. A tes t with an uninsulated holding tube vvas not conducted on the egg pasteurizer; however. the temperature drop of 0.053 F / ft for ice cream mix suggests a temperature drop of 11.1 F for an uninsulated 210-ft holding tube. Consequently, holding tubes of egg pasteurizers must be insul ated .
For salted yolk ( 1m~ sa lt by weight ), the difference in product temperature in a cross-section was significant at both the beginnin g ( 3.6 F ) and end ( 4.8 F ) of the holding tube. For the entire holding htbe, the lowes t product temperature occurred at the end of
1the tube, near the bottom. Rather than attempt to meet the 1.0 F requiremen t within a. cross-section for salted yolk, it appeared more reasonable to locate the temperature-sensing clement at the zone of lowest temperature. An off-set mounting ferrule is commercially available (Taylor Instrument Companies ) and may be used to position the temperahtresensing element at the bottom of the tube. At the end of the holding tube, the zone of highes t temperature occurred at the top of the htbe and this is the worst location for the temperahue-sensing element.
For the other egg products, and milk products as well, the specific location of the temperature-sensing element within a cross-section is not significant.
Although the lowest temperature occurred at the end of the holding tube, the temperature-sensing element 1may be located upstream from the flow-diversion valve within the limits recommended by the Public Health Service (9). For the holding tube and flow rate we used with salted yolk, tllis location is between 8 and 16 ft upstream from the flow diversion
176.4
163.0
177.6
177.4
176.2
177.0
162.6
177.4
177.2
177.2
176.8
163.2
177.4
177.2
176.8
176.2 176.0
163.2 163.2
176.4 176.()
176.6 176.0
175.4 174.8
valve. Since the temperature drop along the bottom of the tube was approximately 0.03 F / ft for salted yolk, the maximum upstream position would have yielded a process control error no greater than 0.5 F , provided the temperature-sensing element was located at the bottom of the htbe cross-section. The longitudinal temperarure drop of 0.03 F / ft is not precise; it does not include the effect of residence time in the holding tube. The process controller exhibited a slight drift ( ± 0.1 F / min ) and because of the 3.5-mi.n average residence time in the holding tube, a longitudinal temperature change of -+- 0.35 F can be directly ath·ibuted to the process conb:oller.
• .. •
.. -
.<). •
Posi t ion of t hermocouples at the beginning of the holding tube
.. Figwre 2. Temperatures of ice cream mix in a holding;
tube during h eat supply failure.

434 DICKEHSON E-r AL.
TABLE 2. \ ' AHIATIO:-.: OF TEI\IPEHATURE OF EGG PRODUCTS A ~D \VA TEll IN THE HOLDING TUBE OF AN EGG PASTEURIZER
Holding tube inlet Holding tube exit
Top Side Bottom Side Top Bottom t
( Temperature, F)
\Vater 145.8
Liquid whole egg 144.2
Stabilized egg white ( pH 7) 144.4
Plain yolk 144.6
Sal ted yolk
( 10% salt by weight) 147.6
"In forward flow.
In comparison with the longitudinal temperature drop
of salted yolk ( 2.6 F ), however, the effect is not
significant.
HEFZ I\ E N CES
1. Dickerson , R. \\ ·., Jr. , A. }-1. Scalzo, R. B. Read, Jr., and 1~. \IV. Parker. 1968. Residence tim e of milk products
in holding tubes of high- tcmperatme, short-time pasteurizers.
J. Dairy Sci. 51:1731.
2. Jordan , W. K. , R. F. Holland, and J. C. White. 1952.
The effici ency of holding tubes used in high-temperature
short-time pasteurizers. T. 11ilk Food Techno!. 15:155.
~ . 3. Kaufman, V. F ., K. ljichi , and G. \V. Putnam. 1968.
Flow characteristics in holding tubes of commercial egg
pasteurizers. J . •!ilk Fcod Techno!. · 31:269.
4. Kaufman, V. F. , G. \V. Putnam , and K. ljichi. 1968.
Test methods for measuring minimum holding time in con
tinuous egg pasteurizers. J. Milk Food T echnol. 31:310.
5. Read, R. B. , Jr. , R. \V. Dickerson , Jr. , and H. E. Thomp-
146.2 146.2 146.2 145.2 144.8
144.4 144.4 143.4 143.0
145.6 145.0 145.2 143.8 143.2
145.8 145.1 144.6 143.2 142.4
144.0 144.0 147.0 146.2 141.4
son, Jr. 1968. Time-temperature standards for the ultra
high temperature pasteurization of Grade A milk and milk
products by plate heat e.\change. J . Milk Food Technol. 31:72.
6. Scalzo, A. !vi., R. W. Dickerson, Jr. , R. B. Read, Jr., and
R. W. Parker. 1969. Residence tim es of egg products in holding '
tubes of egg pasteurizers. Food Technol. 23:678.
7. Sca lzo, A. i'vl., R. \\'. Dickerson, Jr., and R. B. Read, Jr.
1970. Pressure relationships in th e regenerator of an egg
pasteurizer. J . Food Sci. 35:411 .
8 . U. S. Public Health Service. 1965. Grade "A" pas
teurized milk ordinance - 1965 recommendations of the U. S.
Public Health Service. Public Health Service Publication
No. 229 . U. S. Government Printing Office, \•Vashington, D.C.
9. U. S. Public Health Service. 1970. Ordinance and
code regulating th e processing of eggs and egg products -
1970 recomm endations of the U. S. Public Health Service.
Public Health Service Publication No . 1943. U. S. Govern
ment Printing Office, \·Vashington, D. C.
10. Windau, T . D ., R. W. Dickerson, Jr. , and R. B. Read ,
Jr. 1969. Residence tim es of milk in a flow passage of a
plate-type pasteurizer. J. Dairy Sci . 52:898. ( Abstr.)
,
4• I
'
-- -- ------------------------------------------------------------
' ·' l
' '
]. M ilk Food Technol ., Vo l. 34, 'o . 9 (1971 ) 435
IMMUNOGLOBULINS IN SKIMMILK AND MODEL SYSTEMS AND THEIR EFFECT ON BACILLUS CEREUS'
E. ~vi. MIKOLAJCIK AND A. K. CHOUDHERY2
Departm ent of Da·iru Technologu, The Ohio Agricultnurl Research and Development Center and · ·
Th e Ohio State University Columbus 43210
( Received for publication April 2, 1971 )
ADSTHACT
Immunoglobulins isolated from ;lli'lk by ammonitml sulfate fractionation were added to skimmilk . and the rate of Bacillus cereus spore germination and subsequent vegetative cell growth was determined. At 1 hr .. ii~ctibation at 35 C, 96.6, 96.8, 91.4, and 74.3% of th e spores had germinated in pasteurized ( 62.8 C - 30 min ) skimmilk without added immunoglobulins, skimmilk pasteurized with immunoglobulins added, pasteurized skimmilk supplemented with unh eated immunoglobulins, and nonheated unsupplemented skimmilk, respectively. 'With respect to vegetative cell growth , the number of generations at 4 hr in these systems was 5.9, 5.6, 4.4, and 2.3. TQ'nheated skimmilk without added immunoglobulins depressed B. cereus spore germination· and vegetative cell growth to a greater extent than did pasteurized skimmilk supplemented· with unheated immunoglobulins. In model systems . composed of protein-free skimmilk dialysate and h eated or unheated immunoglobulins, the system with unh eated immunoglobulins lowered spore germination by 20% and subsequent cell growth by one-half in comparison 'vith the heated system indicatin g that vegetative cells of B. cere-us 7 are more susceptible to the immunoglobulins than :spores.
We (5) have observed th ;{t unheated sterile skimmilk was a less satisfactory germination and growth medium for Bacillus cereus 7 than the same skimmilk heated at 62.8 for 30 min . This study was undertaken to determine if the effect \<Vas related to bovine lacteal immunoglobulins.
ExP£1Ulv!ENTAL PnocEomm
Our previous paper (5) describes the procedures fo llowed for preparation of unheated B. cereus 7 spores and for determination by th e agar plate n(ethod of spore germination and vegeta tive cell growth . Spores of 13. cereus 7 were h eatshocked at 80 C for 12 min in sterile distilled wa ter prior to inoculation of the skimmilk or model systems.
Sterile unheated skimmilk was p repared by Seitz fi ltration (7) . The protein-free skimmilk dia lysa te used for model systems was obtained by dialyzing sterile water against unheated sterile skimmilk (2). Pasteuriza tion of skimmilk and model systems was at 62.8 C for 30 min.
The immunoglobulins were prepared from mixed herd raw milk by ammonium sulfate fractionation procedure of Smith (8). The D fraction was used. The protein content was determined by the method of Lowry et al. ( 4). Analysis of th e D fraction by polyacrylamide rre l elise electrophoresis (1) at pH 8.9 and gel strength of 7.5% revealed the presence of
'Approved as }our1tal Seri s Article l\o. 29-7 1 of' The Ohio Agricultural l).esearch and .. Development Cen t.er, \Vooster. This investigation was· support e<;l iq . p (l rt by ,J?~,~b li c H ealth Services Grant EF - 00161 from . the Office of Research and Training Grants, Food and Drug Administration . 2Present address: Amul Dairy, Anand, India.
a single major band- jush below the spacer gel. Upon immunoelectrophoresis (3) of the D fraction against anti-bovine serum (rabbit ), precipitin arcs corresponding to IgGI , IgC2, and l g:tvf were evident. lgA was not C!etected.
RESULTS
To study the effect of immunoglobulins on B. cereus spore germination and vegetative cell growth in skimmilk, the rate of . germination .and vegetative cell growth was determiped in four sys tems : unheated skimmilk, pasteurized skimmilk, pasteurized skimmilk fortifi ed with unheated immunoglobulins, and skimmilk pasteurized after fortification with immunoglo,~}llin s. The imrriunoglobulins' were added to a final'' concen tration of 200 11-g protein / mi. Each system was inoculated with approximately 50,000 . heatshocked B. cereus spores/ ml and incubated at 35 C.
Spore counts of the sys tems are shown in Fig. 1 with the percent germination indicated at l and 8 hr. Upon incubation, spore counts decreased in all skimmilks with the decrease b eing more pronounced in the heated than nonheated sys tems. At l hr, germination was 74.3% in the unheated skimmilk, 91.4% in the p as teurized skimmilk fortified with unheated immunoglobulins , and over 96% in the fully heated systems. \iVhereas at 8 hr > 99% of the spores had germinated in the heated systems, the unheated system continued to suppress germination and only 90.5% of the spores had germinated. Initially, the unheated immunoglobulins depressed sp ore germination, but, the effect was dissipated upon contjnued . incubation or upon heat treatment of the immimoglobulins. In unheated skimmilk, agents other than the immunoglobulins had a more pronounced and sustained effect oiJ spore germination.
The rate of multiplica tion · of B. cereus following incubation in the various systems is shown in Fig. 2. The number of generations at 4 hr was determined from the total count. In all skimmilks, the number of vegetative cells increased as incubation progressed. H owever, rates of increase \-Vere more rapid and the number of cells was higher in the completely heated systems than in the unheated skimmilk o~· the heated skimmilk fortified with unh~a~ed immunoglobulins. At 4 hr, the number of generations .was 2.25, 4.35, 5.62, and 5.89 in unheated skimmilk, pasteurized skimmilk with unheated immunoglobulins, and pas-

-!36 i'vl rKOLAJCIK A NTI CHOUDHEIW
5
~4 ' (/)
1-z ::::> 0 0
w3 a:: 0 a.. (/)
o<- (91.4"/o)
~6. 6°/o) o ~PAST a UNHEAT lg
(968%) ;~o-- ' 0) 9 (99.2 roi
PASTe I~ ~;=====----• PAST (99.4%Y
1 o~--~--~--~~--~--~--~--~--~a~ 2 4 6
INCUBATION- HOURS
Figure l. Spore counts of Bacillus ce-reus 7 in unheated ( nonheat ) and pasteurized ( past ) skimmilk, and in pasteurized skim milk with added unheated immunoglobulins (past & unh cat l g), and in skimmi lk pasteurized fol lowing addition of immunoglobulins ( past c l g ) . Pasteurization was at 62.8 C - 30 min and immunoglobulins added at 200 ""g portein / ml. l'C'rcent g::rmination at 1 and 8 hr is shown in parenth eses .
_J
~
8
;n 7 _J _J
w 0
w > i= <t6 1-w (!)
w > I
<.?5 0 _J
~ PASTe lgl7?~~. (5621-. ~ PAST~ ~ (5 .89) A
0 - (4.35)
t PAST a UNHEAT lg
- NONHEAT .f/ / "-(2 .25)
.~~v ~~-JJ.
.'• I~
1
<~----~--~----~--~~---L----~--_. ____ ._ 0 2 4 6 8
INCUBATION- HOURS
Figure 2. Vegetative cell counts of l3acillus cereus 7 in th e systems described in Fig. 1. The number of generations at 4 hr is shown in parenthesis.
teurized skimmilk. The data present a similar trend to those for germination rates, in that, unheated immunoglobulins had an intermediate depressing effect on cell multiplication. However, unheated skimmilk without ,added immunoglobulins was the most' inhibitory to growth.
In an attempt to ascertain the effect of immunoglobulins pe1· se on B. cereus 7 spore germination
and cell multiplication , a model system was developeel. This consisted of 4 ml of protein-free skimmilk dialysate (pH 6.5 ) , 8 ml of sterile distilled water, 1 ml of an aqueous suspension of heat-shocked ! B. cereus 7 spores, and a weighed amount of lypophil ized D Fraction immunoglobulins to yield 1500 11-g protein/ mi. Six systems were prepared : heated ( 62.8 C - :30 min ) and unheated dialysate conh·ols, unhea ted dialysate fortifi ed with unheated immunoglobulins, dialysate and immunoglobulins heated together, dialysate and immunoglobulins combined after separate heat treatment, and unheated dialysate combined with heated immunoglobulins.
The log of spore counts in the systems with the percent germination at 6 hr is shown in Fig. 3. For the dialysate con trols, spore counts were relatively unchanged during the first ' 6 hr of incubation. In the systems with immunoglobulins, spore counts decreased with incubation and · at 6 hr, percentage of germinated spores ranged from 62 in the unheated ' system to 82 in the totally. heated system. Thus, unheated immunoglobuliris ' depressed spore germination when compared with heated samples. Heat treatment of the dialysate per se did not influence spore germination: 799~ of the spores germinated in
4 .
__J
2 4.6-
' (f) t-z -UN HEAT DIAL S. UN HEAT lg
:::> 0 (.)
4.4 w a: 0 Cl.. (f)
• ~(62 'Yo) ---· --- HEAT DIALS. HEAT lg • I
(.!)
0 4.2 _J ~-======--~(78%) 8
-----~==--(79'Yo).J' ' UN HEAT DIALS. o HEATlg
D~j, ..... HEATDIAL c lg 0
INCUBATION- HOURS
Figure 3. Spore counts of Bacillus cereus 7 in model systems composed of unheated or h eated protein-free skimmilk dialysate ( unheat dia l or heat dial ), unheated dialysate with unheated immunoglobulins ( unheat dial & un.heat l g ), heated dialysate combined with separately heated immtmoglobulins ( heat dial & h eat Ig) , unheated dialysate combined with separately heated immunoglobulins l)eated together (h eat dial c Ig) . Heat treatments were at 62 .8 C - 30 min and immunoglobulins were add ed at th e rate of 1500 f.'.g protein / mi. The percent germination at 6 hr is shown in ' parentheses.
•· I
'

iv
I
·~
bri\IUNOGLOBULli s I N SKrM:-.nLK 437
7 .d6 .5) B UNHEAT DIAL a HEAT lg, f
(6,9)
_j HEAT DIALaHEAT lg
~ ....... 1-z 6 :::> HEAT DIALc lg 0 (.)
_J UNHEAT DIAL a <{ UNHEATig CONTROLS 1-0 1-I
5 (!)
0 _J
4~-------L------~--------~ 0 3 6 9
INCUBATION- HOURS Figure 4. i'vl ultiplica tion of Bacillus cereus 7 in the var ious
lltodel systems described in F ig. 3. T he number of getH' rations at 6 hr is shown in parenthesis.
the unheated dialysate with hea ted immunoglobulin system as compared with 82% in the heated dialysate with immunoglobulins and 78% in the separately heated system. In all instances, model systems were less effective germinating media than the native skimmilk.
Rate of multiplication and number of generations of B. cere'US in model systems is shown in Fig. 4 . In systems supplemented with immunoglobulins, the total B. cereus counts increased rapidly after an initial 3-hr lag p eriod, whereas in the dialysate control lots , the lag period was long :r. The number of generations at 6 hr ranged from l.l for the unheated dialysate control to 6.9 for the separately heated dialysate and immunoglobulin system. The number of generations in the unheated dialysate and unheated immunoglobulin sys tem was approximately onehalf that observed in the separately heated system, indicating that unheated immunoglobulins depressed the growth of B. cereus . Heat treatment of the dialysate did not alter stgnificantly its properties as a growth medium for the organisms.
DrscussroK
Immunoglobulins in normal, mixed raw skimmilk play only a minor role as inhibitors of B. cereus s~ore germination and subsequent prolifera tion. The limited bacterial inhibitory properties of the immunoglobulins are further negated upon pasteuriza tion. For B. cereus, at least, one must look to other heatlabile agents or factors in skimmilk which will depress
germination and growth of sporeform~rs. Reiter and Oram (6) have sugges ted that lactotransferrin is one such agent, being an effective inhibitor of Bac-illus subtilis and Bacillus stearothennophilus. However, lactotransferrin is highly heat stable ( 90 C - 60 min ) and would thus be exp ::cted to manifest its activity in pasteurized milk; an effect we have not observed. Smith (9) has shown tha t lac toferrin is present in dry mammary gland secretions of dairy cows and in some analytical procedures it may be confused with IgG2. It is doubtful that lactoferrin would b e present in concentrations necessary to manifes t its inhibitory activities in mixed herd milk.
In model systems, where unheated immunoglobulins were the only protein sourGe, spore germination and subs equent growth of the organisms were reduced . However, upon heat treatment of the immunoglobulins per se, the inhibitory property of the systems diminished . It is possible that the increased germination and· more rapid growth of the organisms resulting from heat treatment of immunoglobulins may relate to a denaturation of these proteins making them more accessible to enzymatic breakdown by the organisms. In some unpublished work, we have observed that h eat treatment of blood serum albumin alters its electrophoretic patterns : one major band plus a multiplicity of minor bands appear in the gels. The proteins represented by the minor bands were selectively degraded by B. cereus 7 with the major band remaining essentially unchanged. Regardless of effect, unhe~ted immunoglobulins appear to influence multiplication of B. cereus to a greater extent than spore germination.
R EFERENCES
l. C_houdhery, A. K., and E. M. Mikolajcik. 1970. Activity of Bacillus cereus proteinases in milk. J. Dairy Sci. 53: 363-366.
2. Koka, M. , and E. ~vi. Mikolajcik. 1967. A microbialfree milk dialysate. J. Dairy Sci. 50 :762.
3. Kumar, S., and E . l'vl. Mikolajcik. 1971. Potency of comm ercial an tibovine sera. J. Dairy Sci. 54:913-915.
4 . Lowry, 0. H ., N. J. Rosenbrough, A. L. Farr, and R J. Randall. 1951. Protein measurement with the Folin phenol reagent. J. Bioi. Chem. 1~3: 265-275.
5. Mikolajcik, E. M., :mel 1\1. Kok::t. 1968. Bacilli in milk . I. Spore germina tion and growth. J. Dairy Sci. 51: 1579-1582.
G. Reiter, B. , and J. D . Oram . 1967. Bacterial inhibitors in milk and other biological fluids. Nature 216:328-330.
7. Singh , V. K. , and E. ~1. Mikolajcik. 1971. Influence of heat treatmen t of skimmilk U]JOn growth of enteropathogenic and lactic bacteria. J. Milk Food Techno!. 34:204-208.
8. Smith, E. L. 1940. Isolation and properties of immun e lactoglobulins from bovine whey. J. Bioi. Chem. 165:655-676.
9. Smith, K. L. 1970. The l gG inummoglobulin of bovine lacteal secretion and _ a possible role of estrogen on IgG I concentration . Ph.D. dissertation . Ohio State University, Columbus.

.r'
438 ]. Milk Food Tec/111ol. , Vol. 34, No . 9 (1971 )
TESTING MILK FOR CLEANLINESS OF PRODUCTION! MrcHAEL H. RoMA r
?l'ew Y ork State Department of Agriculture and Markets
B·u.ilcli11g 8, State Cam7Jus Albany, New York 12226
AnsTnAcr
Clean milk production is an important requisite for high
quality. The mh·ed sample sediment test of producer's milk
is indicative of production practices and should be renamed
"Cleanliness of Production Test." Cleanliness of milk in th e
fium · tank should relate to dairy farm inspection ratings.
s ·tandards of · < 1.5 mg/ gal are practical to meet. Milk can
be kept clean if milking preparation and procedures as out
lined in regulatory codes are followed . Unclean milk can be
only partially "cleaned" by filtration because of fragm enta
tion and solubility of some filth s. The test disk is likely to
be fouled and may show yellow color wh en testing highly
abnormal milk and thus t es ting serves a dual pmpose. Before
straining testi:ngs indicate degree of sediment contamination.
Thorough washing and drying of teats with single service
material with no reuse of solution cannot be overemphasized.
A universal milk sample taken from each milk collection
simplifies monitoring for cleanliness using 4 oz sample and
0.2 inch diameter t est. Milk cleanlin ess should be regulated
since voluntary prograri1s are subject to many variables. Pro
ducers should assume responsibility for clean milk production
by conducting their own mixed sample t es t usin g sedim ent
test disk.
Numerous articles have been written on the subject of clean milk production and the importance of sedi
ment tes ting of milk by well versed men from all parts of the country. To quote a few:
Ben Luce, V/ashington State Dep arh11ent of Agricultme : "I
believe sediment in milk is one of the two major problems of
the dairy industi·y today. Ignoring it as we have done for
the most part since the advent of the bulk tank does not cor
rect it or make it go away" (8). Harold J. Bamum, D enver D epartment of H ealth and
Hospitals : "I consider routine sedin1ent testing a must in any
quality and sa~1ita tion ' program. Dilt is an adulterant and
is not relished by anyone" (2) .
Dr. Jam es C. \ ,Yhite, Cornell University: "There is a segmen,t
of the dairy industry that .does not feel that sediment in milk
is a problem. They have come as close to achievil1g that
impossibility, hoping that if they shut theil· eyes and 1·efu se
to recognize it, the problem will disappear" (12).
Dr. John Flake, Evaporated 1ilk Association: "It is puz
zling how such a simple t est ca..'1 cause so much controversy
as to its interpretation and m erits" (5). Earl \¥ right, Iowa State University: "The sedin1ent test is
an excellent indication on how well the dairyman cleaned the
cows' udders before milking" (13). Professor B. J. Liska, Purdue University: "There should
'Presented at the · 57th · Annual Meeting of the International
Association of Milk, Food, and Environmental Sanitarians,
Cedar Rapids, Iowa, August 17-20, 1970.
be a good practical sediment testing program on the fann
before milk is pumped into the tank truck in order to main
tain high quality milk supply" (6).
Elmer Kihlstrum, Chicopee Mills : "Sedim ent tests offer visi
ble evidence that a quality problem exists" (.9).
I shall discuss sediment testing of milk and more
especially the testing of bulk supplies such as milk in farm tanks, tank trucks, storage tanks and shall include the tes ting of milk at milking time before straining.
It should not be necessary to discuss why we should strive towards production of sediment-free milk since
sanitation is a part and parcel of the American way of life, as evidencec! by our many pure food laws .
HISTORY OF SEDIC\IENT TESTING
Sediment testing of milk is not new. A brief review of history would show that even in the days of "dip" milk, consumers were watchful of the cleanliness of
milk dipped out for them by the driver of a horse drawn milk wagon on which were one or more large
40 or 50 gal cans uncovered and exposed to the ele
ments during the dipping operation. The invention of the glass milk bottle made sediment visible on the
bottom of the bottle and was perhaps the greatest step forward in milk sediment control. TI1e glass
bottle was first accepted with reservation by those selling milk since it made every consumer a potential
milk inspector. Cream lines and milk cleanliness could now be observed. The glass milk bottle must
have led to the earlies t sediment testing of milk. One
of the early tes ting devices consisted of a metal funnel into which was fitted a loosely formed cotton wad
through which the test sample of milk was filtered. As more effiqien t and commercially made test disks
became flVa ilable, the funnel shaped tes ter was provided with a cover and a hand operated pressure bulb to create air pressure and force milk through
the test disk. ext a milk thief-type sample procurer follo·wed. This was equipped with a spring operated foot valve so that the h1be would fill with milk from
the bottom of the can. The milk in the tube was
then poured into a funnel cup for gravity filtration.
The milk theif method was improved by develop
ment of a suction type pump. This provided for suction removal of the sample and pressure filtration for off-bottom testing of milk in cans. To meet
today's need for testing mixed samples of bulk milk,
,
' •• I

' '
TEsTmc MILK FoH CLEANLmESs 439
various types of pressure and vacuum operated devices have been prefected .
As an aid in classifying milk as to its cleanliness, official photographed tes t standards (1) have been made available for this purpose so that milk cleanliness may be referred to in terms of milligrams per gallon, such as 0.2 mg, 1.5 mg, or 6.0 mg, etc. These standards are comparative means which can be used
for more uniform grading of sediment tes ts. An electronic densitometer is presently under trial and if it proves satisfactory, it will remove the variable of the human element in estimating from photos the sediment levels of tests . This, in brief, is a history of tes ting milk for cleanliness and the tools that were used.
A NEW NAME?
Consideration should be given to using the name "Cleanliness of Production" test to designate the common sediment test. This is a more complete description of what a mixed milk sample tes t of a producer's milk reveals. In milking cows with healthy udders and using clean production methods, the test area of the disk for such a milk sample is almost indiscernible since it is free of sediment or stain. Milk is clean and sediment-free as it leaves the cow's teats, however from this point it is subject to contamination with extraneous matter unless proper milking procedures and care are exercised. Thus if milk is clean in the udder but not clean in the bulk tank or milk can then contamination with extraneous matter occurred during the milking or handling process .
The degree of cleanliness of production can be measured. Contaminants such as manure, barnyard soil, and silt may be fragmented into tiny particles
; and may have high moisture contents, the liquid portion going into solution in the milk. This liquid along with the fragmented particles cannot be effec tively strained out b y farm filtration. An unclean test result is a good indication that proper milking and milk handling practices vvere not followed. One cannot observe actual milking and handling practices during inspections when milking is not in progress, thus the sediment test can serve as an indicator or guide as to compliance by the dairyman with required procedures for clean milk production.
A STAt'\'DAI\D METHOD
It is obvious that cleanly produced milk is not only obligatory to consumers but is also a requisite for high ' quality. Standard Methods (1) recognizes the sediment test as one of the quality tests for milk. Chapter 15 of the 12th edition is devoted to tlus subject and spells out (a) methods and procedures to be used for sediment testing by the mixed sample and
off-bottom methods, (b) the required features of sediment tes ting devices to assure that no by-pass occurs while tes ting the sample, (c) specifications relative to sediment retention for test disks and (d) directions for preparation of grading standards.
It is interesting to note that Standard Methods (1 ) lists the presence of abnormal milk as one of the factors which will influence the rate of flow through a tes t disk. Our many mixed sample testings have shown this to be a fact. The mixed sample sediment t'C st does serve the dual purpose of not only determining cleanliness but also revealing highly abnormal milk supplies . A milk quality problem likely exists if a properly warmed mixed milk sample cannot b e passed through a test disk with va uum, milk which fouls the disks may be exceedingly unclean or have a high abnormal milk reaction. The sediment level must be very high in the test sample before it fouls the disk and resists passage.
ExPEHIENCES IN NEw YoHK
I would like to share with you my experiences in New York State during the past 35 years in tes ting milk for cleanliness. In the late 1930's we started to check on milk cleanliness by actual resh·aining of a full can of morning's milk as delivered by producers to the plant. A 20 quart strainer with a flannel square clamped to its bottom was used. The flannel squares would then be displayed on a clothes line for producer observation. This method, although very cumbersome, was quite effective in attaining some improvement in milk cleanliness.
Restraining of a whole can was discontinued when the plunger type off-bottom tes ter was invented. This tester made it possible to tes t many more cans of milk and thus milk cleanliness programs were given more attention. Food and Drug Adminish·ation participation in testing of supplies added further stimulus to the program. The off-bottom testing was practiced for many years and did much to further improve on milk cleanliness. Rejections, exclusions, and penalties had to be resorted to in some instances to effect an improvement. Sediment testing of milk was and continues to be distmbing to some producers and this group needs the sanitarian's assistance in clean milk production.
Studies were conducted in the late 1940's on effectiveness of straining materials and on consh·uction of strainers; thus it is significan t the concenh·ation at the time was on cleaning of milk rather then on clean milk production.
During the early days of bulk milk handling, m~y studies were conducted as to how to tes t such milk for cleanliness. Experiments were conducted by drawing 5 gal of milk off the bottom of tanks, ob-

440 RoMAN
TABLE 1. VOLUME-Al~EA FOR ML'I:ED SAi\•IPLE SEDI-"'IENT TESTING
Volume Filter area
( Diameter in inches)
1 gal 1.125
3 quarts 1.0
2 quarts 0.80
1 quart 0.56
1 pint 0.40
4 oz 0.20
TABLE 2. MILK HESISTANCE TO FILTRATION THilOUGH SEDIMENT
TEST DISC AND M. '~T . T. RESULTS1
1\o . sampl es resisting filtz·ation
64 Neg. Trace 1 2 3
:\f .\\". T.
2 5 9
24 24
1299 individual cow's bucket samples (mixed test sample-
1 pint-0.4 inch disc) , vacuum usecl- 15 inches.
taining unstirred samples from outlet valves of tanks ,
and using the off-bottom double length tester. It was
about this time that Watson (11 ) and Calbert and
Liska (7) established that the amount of sediment ob
tained from testing of 1 gal of mixed milk through
an 1 1/ 8th inch diameter test area of a disk approxi
mated that obtained by the 1-pint unstirred method
in the off-botton testing of the same milk when col
lected in 10 gal cans and allowed to remain quiescent
for several hours. This was a most important ob
servation and it established the basis for mixed sample
testing. Liska and Calbert also suggested use of
smaller milk samples for the mixed sample method
and compensated for this by ad justing the size of the
test area. Thus if 1-pint of mixed milk is to be test
ed, the filter area should be 1/ 8th of that used for
a 1 gal sample or qn area 0.4 inch in diameter, or if a
4 oz universal milk sample is to be tes ted, the filter
area should be 0.2 inch in order to maintain a con
stant volume-area relationship (Table 1 ).
NEW YORK STUDIES
As a result of establishing a method for testing any
bulk milk supply for cleanliness, much work has been
done by various sanitarian committees and others in
evJ York State to obtain further data on the prob
lem. I would now like to describe the design and
results of a fevv of these studies:
(a) Studies to ascertain adequacy of mixing milk in
bulk tanks by mechanical ·agitators for repre
sentative sampling. It h as been concluded that
if milk is sufficiently mixed for a representative
butterfat sample then mixing is adequate for a
(b)
sediment sample.
Determining the effect of the temperature of
milk sample at testing on the resulting sediment
test. It was found that bulk farm milk must
be warmed to 95 to 100 F in order to effect its
passage through the t~s t disk and eliminate the
minute fat flakes which may foul or mask the
disk. However, if a sample has been properly
warmed and still resists passage it should be
suspected of being abnormal unless it has a
very high sediment level. Fouling of disks when
applied to clean, freshly produced milk of in
dividual cows relates highly to abnormal milk.
Studies have shown that in many instances it
is possible to pass several quarts of an individ
ual cow's freshly produced milk through a
0.4 inch diameter sediment test disk, whereas
in other instances only a small fraction of 1-pin t
of clean milk will pass before fouling the disk
Producers have long known that a cow's milk
is likely to be abnormal when it fouls the strain-
er pad . The sediment test disk, being much
denser, makes for a much more senstive test
(Table 2).
(c) Recent studies have been made regarding use
of a 4 oz universal milk sample and a 0.2 inch
diameter test area to screen milk for cleanliness.
It has been found that such a test is very prac
tical for quickly determining the cleanliness of
supplies and for rechecks when needed, in that
the hauler brings in a sample with each milk
collection. This procedure holds much promise
for milk quality improvement and for pinpoint
ing sources where improvement is needed . It
should place much inspection work on a selec
tive and productive rather than random basis.
(cl) Studies have been made on the behavior of
sediment in milk. Contrary to common think
ing, sediment does not necessarily settle to the
bottom, but depending upon its nature and
density, much of it may remain in suspension
for hours . In some instances sediment con
centration has been found to be greater in the
cream portion than in the bottom of the tank
or can.
(e) Since much can milk still exists and the off
bottom test is still an official test in Standard
Methods and in some codes, comparisons have
been made and it has been found that the mixed
sample test reveals more instances of unclean
milk than does the off-bottom method. Ma
loney and Armsh·ong (10) have made a similar
observation. This is caused by suspended fine
sediment and tl1e fact tl1at most off-bottom tes-ts
are conducted on milk which has been agitated
,
; ( .. I
'i
'I
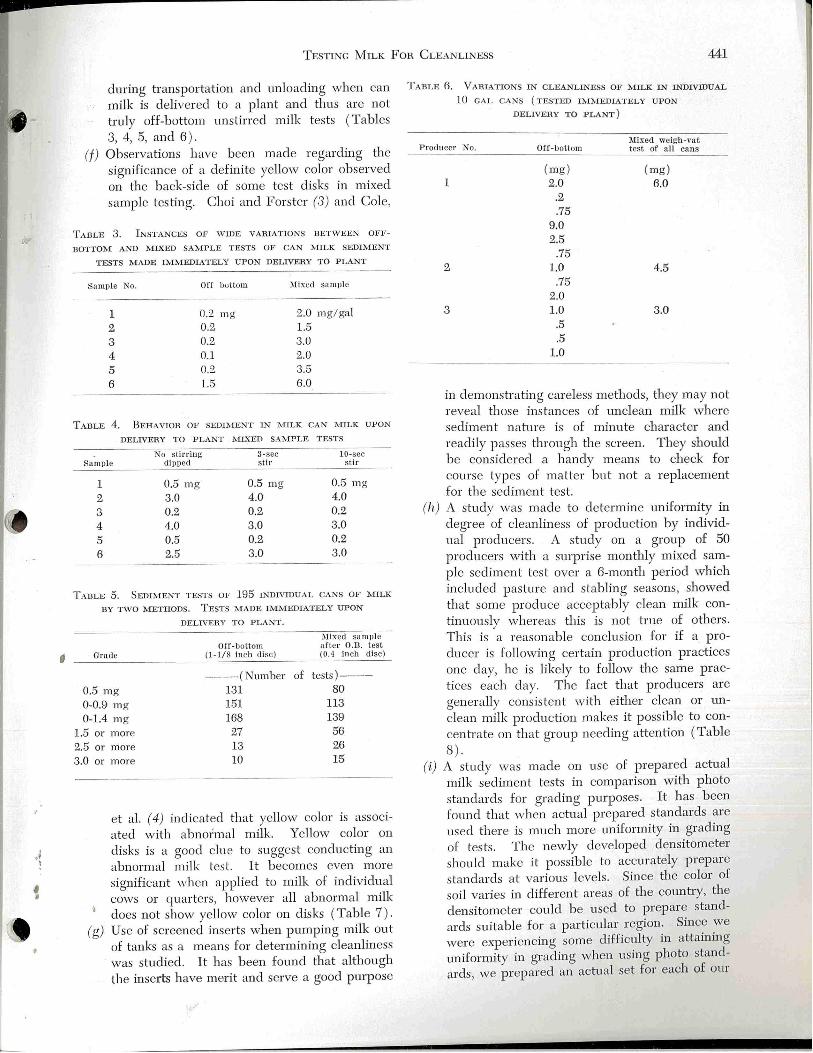
I
·' )
'
TESTING Mu.K FoR CLEA ILlNESS 441
during transportation and unloading when can milk is delivered to a plant and thus are not truly off-bottom unstirred milk tests (Tables 3, 4, 5, and 6 ) .
(f) Observations have been made regarding the significance of a definite yellow color observed on the back-side of some test disks in mixed sample testing. Choi and Forster (3) and Cole,
TABLE 3. I NSTANCES OF WIDE VARIATIOKS BETWEEN OFF
BOTTOM A.,"'D :MIXED SAMPLE TESTS OF CAN MILK SEDIMENT
TESTS MADE LviMEDIATELY UPON DELIVERY TO PLANT
Sample No. Off bottom )!ixed sa mpl e
1 0.2 n1 g 2.0 mg/ gal
2 0.2 1.5 3 0.2 3.0 4 0.1 2.0 5 0.2 3.5 6 1.5 6.0
TABLE 4. BEHAVIOH OF SEDJlVrENT IN M ILK CAN wllLK UPON
DELIVERY TO PLANT ML\:ED SAMPLE TESTS
~0 sti rring 3-sec 10-sec Sample dipped stir sti r
1 0.5 mg 0.5 mg 0.5 mg
2 3.0 4.0 4.0
3 0.2 0.2 0.2
4 4.0 3.0 3.0
5 0.5 0.2 0.2
6 2.5 3.0 3.0
TABLE 5. SEDIMENT TESTS OF 195 IN DIVIDUAL CANS OF MILK
BY TWO METHODS. TESTS MADE Ii\•IMEDIATELY UPON
DELTVEHY TO PLANT.
Mixed sample Off-bottom after O.B. test
Grade (1-l/8 inch disc) (0.4 in ch disc)
----(Number of tests)----
0.5 m g 131 80
0-0.9 mg 151 113
0-1.4 mg 168 139
1.5 or more 27 56
2.5 or more 13 26
3.0 or more 10 15
et al. ( 4) indicated that yellow color is associated with abn01:mal milk. Yellow color on disks is a good clue to suggest conducting an abnormal milk tes t. It becomes even more significant when applied to milk of individual cows or quarters, however all abnormal milk does not show yellow color on disks (Table 7 ).
(g) Use of screened inserts when pumping milk out of tanks as a means for determining cleanliness was studied. It has been found that although the inserts have merit and serve a good purpose
TABLE 6. VARIATIONS IN CLEANLINESS OF MILK IN INDIVIDUAL
10 GAL CANS (TESTED IMlVIEDIATELY UPON
Producer No.
1
2
3
DELIVERY TO PLANT)
Off-bottom
(mg) 2.0
.2 .75
9.0 2.5
.75 1.0
.75 2.0 1.0
.5
.5 1.0
Mixed weigh-vat test of all can s
(mg) 6.0
4.5
3.0
in demonstrating careless methods, they may not reveal those instances of unclean milk where sediment nature is of minute character and readily passes through the screen. They should be considered a handy means to check for course types of matter but not a replacement for the sediment test.
(h) A study was made to determine uniformity in degree of cleanliness of production by individual producers. A study on a group of 50 producers with a surprise monthly mixed sample sediment tes t over a 6-month period which included pasture and stabling seasons, showed that some produce acceptably clean milk continuously whereas this is not h·ue of others. This is a reasonable conclusion for if a producer is following certain production practices one day, he is likely to follow the same practices each day. The fact that producers are generally consistent with either clean or unclean milk production makes it possible to concenh·ate on that group needing attention (Table 8).
(i) A study was made on use of prepared actual milk sediment tests in comparison with photo standards for grading purposes. It has been found that when actual prepared standards are used there is much more uniformity in grading of tests . The newly developed densitometer should make it possible to accurately prepare standards at various levels . Since the color of soil varies in different areas of the counh'y, the densitometer could b e used to prepare standards suitable for a particular region. Since we were e).:p eriencing some difficulty in attaining uniformity in grading when using photo standards, we prepared an actual set for each of om

442 RoMAN
TABLE 7. SIGNIFICANCE OF YELLOW COLOR ON SEDIMENT TEST
DISCS TO ADNOR~IAL l'viJLK ( lNDIVlUUAL CO\v's ~!JILK) 1' 2
• 3
i\I. W. T .
1+ 2 + 3+
Samples
4 4
17
' 1 umber of cow's milk tested-160. 2Discs with yellow color-25 "Average somatic cell count of above 25-2,758,000.
TABLE 8. 6-MONTH STUDY OF 50 PHODUCEHS. ~V[IXED SAJ\•1PLE
TEST METHOD USED
.Number 1\umber of th e of 6 monthly tests
producers at 1.5 mg/gal or more
Same 24 0
Same 1 1
Same 4 2
Same 5 3
Same 5 4
Same 2 5
Same 2 6
TABLE 9. MILKING TIME INSPECTION-INDIVIDUAL COWS MJLK
MIXED SAMPLE BEFOHE- STHAINING TESTS
4 selected cl ean 4 selected un clean Grade milk producers mil k produ.cers
- - - - (Number of samples)----
< 1.0 mg 1.0-2.9 mg 3.0-6.0 mg
67 26
6 6
6 11
4 67 6.0 mg or more
TABLE 10. SEDil\1ENT-BEFOHE AND AFTEH STHAL'IING PHODUCEHS,
SELECTED ON BASIS OF CLEAN AND U ' CLEAN TESTS
I N EACH GHOUP
Ax cra~e sediment f;ractet
}~ arms Before-straining .After-straining
4 Fam1s
( mg) 1.0
(mg) 0.2
( 105 COWS)
4 Far:ms (88 cows)
'lV!ixed sample tests.
7.0 2.2
inspectors using a blend of milk from several sources. The standards were prepared at estimated 1.5 and 3.0 mg levels which are the two critical points in ew Y ark State milk cleanliness regulations. \ iVhen checked with the densitometer, these two disks showed a 1.5 and 3.2 mg level. Accurate grading problems arise only in those instances where the tests are at the cut-off point b etween acceptable and unacceptable. Disks which are clean or considerable beyond the acceptable grade present no grading problem .
(j) Before-straining tes ting of milk at milking time has been one of our most important studies.
This was a real breakthrough in clean milk production for we found that some producers were able to produce practically sediment-free milk by good milking practices, whereas this w~1s not true where practices did not follow codes . Many milking time before-straining tests have been conducted and it is obvious that milk must be produced clean if a clean test of the milk after sh·aining js to result. Incomplete an inadequate washing and drying of teats with reuse of the solution for many cows were found to be the greatest conh·ibuting sources of sediment. After a number of cows had been prepared for milking with the reuse of the washing solution it became so soiled that a number of test disks would be required to test 1-pint of it for cleanliness. The single use of the cleaning solution preferably using white single service tovvels soaked in the tepid germicidal solution should be encouraged. If a cow's teatJI are badly soiled and the white shows soil on drying the cow's teats, washing should b e reP"ated. Keeping udders clipped will facilitate cleaning. The more modern practices for dairy farm operation such as use of loose housing, especially where inadequate b edding exists and the use of drylots for feeding which become muddy from rains and other conditions allowing cows to become badly soiled places greater emphasis on the importance of proper preparation of the cow for clean milk production. \ iVork with before-straining testing has shown that the visible sediment test of sh·ained milk is equivalent to abou t one-fourth of the original visible sediment contamination plus the moisture content of the contaminants which may be very high. Thus a 2 mg test would mean that the milk originally had about 8 mg of visible sediment plus the contaminants' moisture before straining. There have b een instances at our milking time inspections when producers would start milking with high levels of sediment, would show interest in the tes ting and would soon be producing milk at practically a 0 mg level. If cow's teats are as clean b efore milking as they are after milking, milk cleanliness problems would be greatly reduced . Tables 9 and
10 ). Although the major source for contamination
of milk is from improper cleaning and drying of teats and udders, there are other sources
which could contribute contamination, such as
improper or careless use of the milking ma
chine allowing it to draw in dust and dirt off
the floor , dusty stables, unclean farm water,
, , ;. I

' ·' ~
TESTING MJLK FoR CLEAl\'LL.'\TEss 443
and dust and dirt settling into cans and farm tanks.
(k) Another study that was conducted was a pipeline filter survey. Cleanliness tests were made of bulk milk and water supplies at 237 farms with such installations. Information was tabulated as to make of filter holders, type of material used, and milk and water cleanliness results. It was concluded that cleanliness of milk was directly related to cleanliness of production and care a t cowside.
(1 ) Monitoring cleanliness of milk in farm tank truck loads was another one of the studies. It vvas found that the universal milk sample makes it possible to quickly monitor the supply contained in the tanker and pinpoint the sources contributing to sediment.
Cleanliness of milk in New York State is regulated. Prior to adoption of regulations in 1961 and amending them in 1968, cleanliness tes ting was voluntary but suitable progress was not being made either in effecting improvement or bringing about uniform programs in industry. Briefly, the regulations relating to adulteration and cleanliness of milk are as follows: (a) Producer acceptable milk cleanliness level is set at less than 1.5 mg/gallevel by the mixed sample test. (b) Monthly testing is required except if a producer has acceptable tests for three consecutive months, his milk may be tes ted quarterly. (c) Plants must institute additional sediment testing as soon as blended supply is at the 1.0 mg level and continue it until reduced to less than 1.0 mg. ( cl) The regulations spell out mixed sample volumes and tes t area diameters : 4 guarts-1.125 inches, 3 guarts-1.0 inch, 2 guarts-0.8 inch, 1 guart-0.56 inch , and
f 1 pint-0.40 inch . (e) The mixed sample test is the official test for both can and bulk milk. Can milk may be tested by sampling out of weigh vat. (f) Off-bottom tests may be made on can milk and unclean milk rejected on the basis on this tes t, but mixed sample test must b e made as the official test. A clean off-bottom test on can milk is not accepted as an official test. (g) If milk is at 1.5 mg but less than 3.0 mg level, producers must be notified , the milk resampled at next collection and if still at 1.5 mg level or above, no further milk accepted until less than 1.5 mg. If tes t is at 3.0 mg or above, no further milk is
accep ted until less than 1.5 mg. ·w ith bulk farm milk, this necessitates testing the milk at the farm before recheck acceptance. (h) Tests must be held for 1 month and records for 1 year.
H.egulations also have been promulgated which require sediment testing of cream including gathered cream shipped for manufacture. Cleanliness level is established at less than 2.0 mg/ gal. The procedure calls for filtering of a mixed 2 oz cream sample through a 0.4 inch diameter area . The cream is liquifi ed and made filterable by mixing tl1e test sample with 2 oz of a 10% sodium citrate solution and warming to 120 F before testing. A rapid improvement in gathered cream cleanliness was noted after just a few tes ts and producer notification of unsatisfactory results.
REFERENCES
1. American Public Health Ass·ociation Inc.' 1967. Standard m ethods for the examination of dairy products, 12 eel. American Public H ealth Associa tion, New York.
2. Barmun, H. J. 1961. Sediment testing-then and now. Colorado Dairy Fieldmen's Annual Conference. F eb. 27.
3. Choi, S. S., and T. L. Forster. 1966. The relationship of yellow color on milk sediment pads to mastitis. J . Milk Food Techno!. 29:53-56. .
4. Cole, E. J ., G. MacKay, and H. J . Barnum. 1965. Observations on the yellow color that appears on milk sediment pads. J. Milk Food T echno!. 28 :372-374.
5. Flake, J. C. 1964. Universi ty of Wisconsin conference for dairy fieldmen, plant managers and laboratory technicians. Jan . 30-31. ·
6. Liska, B. J . 1962. Sediment testing of- bulk tank milk. J. 1\lfilk Food T echnology 25:48-50.
7. Liska, B. J., and H. E. Calbert . 1954. A study of mixed sample methods of sedim ent testing using off-the-bottom standards and equipment for possible use with farm bulk holding tanks. J. Milk Food Techno!. 17:83.
8. Luce, B. 1966. The problem of sediment in milk. J . !vfilk Food Technology. 29:29.
9. Kil1lstrwn, E . E . 1963. Sediment testing for quality. A.mer . Milk Rev. June.
10. Maloney, P. , and J. G. Armstrong. ~969. Mixed sample test s for extraneous matter in milk. J. Milk Food Techno!. 32:455-457.
11. Watson, N. E. 1952. A sediment pump for fru·m tanks . J. Milk, Food Techno!. 15:43.
12. \ il/hite, J. C. 1964. Sedim ent in milk gets a closer scrutiny. Am er. Milk Rev. July.
13. Wright, E. 1968. "Fin gerprinting" quality milk. Hoard's Dairymru1 . Feb. 10.
./
444 ]. M ilk Food Techno!. , Vo l. 34, No. 9 (1971 )
MICROWAVE OVENS AND THEIR PUBLIC HEALTH SIGNIFICANCE RoBERT L. ELDER Al\'D VVALTER E. G ul\'DAKER
Public Health Serv ice Bureau of Radiological Health
Rock ville, lvlaruland 208.52
( Received for publication March 29, 1971 ))
AusTRACT
T he number of microwave ovens sold in the United States is expected to increase greatly in the next 2 to 3 years. Recent field surveys have indicated that p roper main tenance on the part of the owner or operator and improved servicing play an importan t role in controlling microwave oven leakage. T he Department of Health , Educa tion, and \ Velfare perfo rmance standard for microwave ovens, which will apply to ovens manufactured after October 6, 1971, cannot he tru ly effective un less th e ovens are conscien tiously mainta ined after purchase. The sanita rian has an extreme ly importan t role in p romoting microwave oven safety, and State and local health workers are urged to take an active part in convincing owners to implement proper maintenance procedures and to pr:1ct ice good s:~n itat i on.
A microwave oven is an electronic product which produ ces energy in the nonionizing microwave region of the electromagnetic spech·um for the purpose of hea ting or cooking food. The exact number of microwave ovens in use in homes and restaurants around the United States is difficult to pinpoint exactly, but we estimate that there are currently 40 to 50 thousand units in homes and 50 to 80 thousand units in commercial food establishments. It is expected that the number of microwave ovens sold in the United States will increase greatly in the next 2 to 3 years, particularly if the cos t to the owner becomes less.
Because microwave radiation does not carry suffi cient energy per photon to break chemical b onds, the principal end result of microwave exposure is hea ting. The deterimental biological effects are associated with both · thermal and non thermal ( field ) effects. Some researchers b elieve that microwave absorption in humans raises the temperature and produces an observable effect when the body's thermal compensating mechanism is unable to remove the increased thermal load. Cataracts, temporary sterility, and subcutaneous burns are commonly referred to as thermal effects (2). Nonthermal effects, those which cannot be accounted for by thermal rise in the tissue, are mainly rep orted in the Russian literature on the subject and are associated with psychological, physiological, and psychoneural responses. Fatigue, h eadaches, and overall slowness of reaction are typical symptoms reported (2).
The D epartment of H ealth, E ducation, and Welfare has published a performance standard for mi-
crowave ovEns which becomes effective on October 6, 1971., for ovens manufachued after that date. The standard limits leakage to 1 mW /em• prior to acqu isition by a purchaser and allows leakage to increase to no grea ter than 5 m\iV / em• throughout the life of the ove n. The allowable increase in leab~Se
acknowledges that some degradation in the quality of the oven with wear and tear seems to be technologically unavoidable. The leakage is to be measured at 5 em by means of a microwavP. measuremt nt instrument with specific characteristics. The ' standard also requires t\vo interlocks, one of which mus t be concealed , and specifies that no object may be inserted into the oven while the oven is "on," when this would allow microwave levels outside the oven to exceed the applicable limits. This particular section of the standard is directed primarily to door screens through which an object, such as a pipe cleaner, can be inserted. An insulated metallic object could act as a receiving antenna on the inside and a transmitting antenna on the outside, thus producing externally high levels of microwave rediation .
FIELD SunvEYs oF NllcROWAVE 0 VEKS
An early Bureau of Radiological H ealth rep ort (7) summarized results of a munber of surveys in which radia tion leakage from microwave ovens was measured with food loads or watei: loads placed in the ovens to simula te actual operating conditions. The tes ts were made under a variety of conditions. Leakage apparently occurred through the oven door seal and also as a result of conditions which permitted the oven to operate when the door was no t completely closed. The data in this report were collected by different organizations, and 109 of the 494 units surveyed, or approximately 22%, were reported to emit microwave leakage in excess of 10 mW / cm'.
In the fall of 1969, with the availability of a microwave measurement insh·ument much more suited to surveying microwave ovens, the Narda 8100, the Bureau of Radiological Health conducted a sm vey of microwave ovens in cooperation with th e Sta te Health D epartmen ts of Mississippi and Massachusetts and with the 1 assau County H ealth Depart-
•· '

I
·' )
' '
MICROWAVE O VENS 445
ment in New York. Approximately 72 facilities were visited, and 155 ovens made by six manufacturers were surveyed under closely controlled test conditions. Fifty-one of the 155 ovens surveyed, or about 33%, were found to emit radiation in excess of 10 m vV I em' which was stated to be the maximum design leakage .standard recognized by the indush·y. Of the 51 ovens which emitted more than 10 m\V / em' , 36 exceeded this amount with the oven door closed and 15 exceeded it only during the ac t of opening the door. The surveyors noted that 19 ovens had observable defects , such as loose hinges, broken hinges, fail ed interlocks, and defective doors, which probably contributed to excessive radiation leakage.
In 1970, a 1 combined Federal-State-industry survey was conducted on 4,033 ovens produced by 17 manufacturers . The results confirmed the fall 1969 study, with approximately 20% of the ovens emitting leakage radiation in excess of 10 m \1\1 I em•. In those instances in which a specific feature of the oven's design , construction , or adjusbnent capability was identified as the cause of microwave radiation leakage in excess ;of the voluntary indush-y standard of 10 m vV /em• fneasmed at 5 em, the manufacturer was requested to arrange for corrective servicing or modificatiob of the ovens. In every instance in which a manl1facturer was reques ted to submit a
I corrective action plan to the Bureau, the manufac-turer complied with the request and implemented the plan.
A review of the data from the 1970 survey indi-ca tes that : 1
l. Excessive radiation leakage from microwave ovens seems to be a function of oven design or cortstruction, int e r I o c k maladjustment, user maintenance, and frequency of service.
2. The most frequently observed cause of excess leakage was interlock maladjustment or lack of ability to adjust the interlock satisfactorily. In ·almost all of the oven models surveyed, this condition was readily detected by sin1ple tes t procedures and could be corrected by manufacturer's or owner's representatives.
.3. Oven design or construction appears to contribute more to ·excessive leakage from ovens manufactured prior to 1970.
4. Proper maintenance on the part of the ovvner and improved servicing, including a microwave emission measurement, seem to be significant factors in maintaining control over excessive microwave oven leakage.
There is a need for continued surveillance of microwave ovens to monitor the thoroughness of the manufacturers ' design, consh·uction, and corrective
action programs and their efforts to improve their fi eld service capability in the area of microwave emission control.
hiPOHTAKCE OF OVEN SANITATION AND MAINTENANCE
A microwave oven is designed to contain microwave energy and prevent its escape from the oven cavity. Three types of door seals are commonly used by the industry for this purpose. One type, the choke seal, consists of a fractional wavelength trap at the frequency of the oven which absorbs energy leaking from the oven. A second type is the metalto-metal seal which causes reflection of the energy back into the oven. A third type contains materials commonly called "lossy." Thes~ nonreflective absorb ~rs are used to coat surfaces and generally serve as a backup for one of the other types of door seals. There are combinations of these, and each has advantages, according to the overall design of the individual oven.
Any object which accumulates on the seal, such as dirt, grease, or metal, can defeat the purpose of the seal and allow microwave leakage to increase. H ence, basic sanitation is vital to microwave oven safety. The microwave manufacturer is responsible for designing an oven that does not leak, whose seals are easily and safely cleaned, and which will not leak excessively from dirt buildup . Seaming should not be necessary, since any abrasive item used to scrub a seal could reduce the effi ciency of the seal to absorb and/ or refl ect the energy into the cavity. :\1Ietal scouring pads in par ticular should not be used, unless recommended by the manufacture, b ecause residual metal particles can cause arcing and pitting of th e seals. Manufacturers are continuing to design improved seals which effectively h·ap the energy and can be easily cleaned.
A local health official visiting a restaurant does not need an instrument to tell a proprietor that his microwave oven is dirty. If an official observes that ail
oven has dirty seals, he can assume that the potential for leakage has b een increased. Therefore, owners should be encouraged to keep microwave oven seals clean. Costs of instruments to measure microwave leakage at present vary from inexpensive for unreliable devices, such as those with fluorescent bulb detectors, to expensive for highly sophisticated instruments costing nearly $1000. Insh'ument cos ts , however, are e!l.>p ected to drop b elow $200 in 1971. A
DEP report has b een published which describes the
design of a simple and inexpensive instrument that
can be used by technicians to detect radiation leak
age from microwave ovens (3). Several other DEP
reports describe a compm·ison of microwave detec-

446 ELDER A:Nn Gu.NDAKER
tion instruments (5) and related work on microwave measurements (1, 6, 8, 9).
The Bureau of Radiological H ealth has published a pamphlet entitled Facts About Microwave Oven Radiation ( 4) which lists safety tips for the microwave oven owner and operator. The following list summarizes ~ome of these tips as they apply to the sanitarian.
l. Head the instruction manual for th e manufacturer's recommendations for safe operation of the oven.
2. Examine the oven for evidence of shipping damage. 3. Instruct the owner to arrange th e installation , if possi
bl e, to allow the user to stay at least a full am1's length away from the front of an operating oven.
4. Train the user to switch th e oven off before opening th e door.
5. Instruct th e user never to insert objects ( for exampl e, a fork prong, aluminum foil, wire) through the door grill ( if th ere is one) or around the door seal.
G. Instruct all users and maintenance personnel never to tamper with or inacti va te the oven safety interlocks.
7 . Instruct the owner or user to clean the oven cavity, door, and seals frequently with water and mild detergent, and to refrain from usin g pads, steel wool, or other abrasives unl ess recomm ended by the manufactur er.
8. Instruct the owner to h ave each oven examined at regul ar intervals by a qualified serviceman for signs of wear, damage, or tamperin g, and to have it adjusted, repaired, and measured for excessive leakage.
During the joint industry/Bureau survey of microwave ovens, vve discovered that many cases of excessive leakage could be caused by poor sanitation. One hospital, for example, reported that 26 ovens which leaked more than 10 mW / em• b efore proper cleaning, emitted no measurable radiation after cleaning; tbis situation is typical of the metal-to-metal seal. In addition to sanitation , there are other readily observable problems which will indicate the potential for unnecessary leakage. If an oven door appears to be loose, indica ting excessive hinge wear, the door may not be giving a tight seal. If the door interlock or cooking indication light appears to b e malfunctioning, there may b e an interlock failme. In all instances only specially h·ained repairmen should make tests or adjustments or repair ovens . The Division of Electronic Products is encouraging manufacturers to increase their repair capabilities for safety and encourages the support of every sanitarian in helping these same manufacturers transmit information to the repairman and oven owner concerning basic sanitation.
Dming the recent industry / Bmeau survey of microwave ovens, about 23% of one manufachuer's ovens were found to be leaking microwave radiation in excess of 10 mVV / cm2
• However, when 100 of the
same models were surveyed in a single city, only 6% were found to leak in excess of 10 m\iV / cm2
• Fmther inves tigation showed that these were owned and operated by a vendor who had a well-run maintenan ce program . Most of the ovens surveyed h cfd been serviced about 2 or three months before the survey as part of a routine program.
!vficrowave ovens can b e designed, constructed, and used safely and are practically a necessity in the rapid vending of food. Food vendors are making a major effort to purchase good, durable ovens and reliable microwave measurement instruments to make certain that the microwave ovens they use in their food delivery service are safe for public use. These efforts should continue to increase in order that continued, safe use of microwave ovens can be realized. Sanitation, maintenance, and continual safety monitori11g can and will accomplish this for ovens which are designed and constructed to operate safely.
HEFEHENCES
l. Bendix Corporation Hesearch Laboratories. 1970. D evelopment of liqujd crystal microwave power density meter. BRH/ DEP 70-8. USDHE\V, PHS, BHH, Rockville, Mel . (Accession No. PB 191 39G)."
2. Cleary, S. F. 1970. Biological effects of microwave and radiofrequency radiation . Critical Heviews in Environmental Control , The Chemical Hubber Company, Vol. 1, Is>uc 2.
3 . Cloke, H. L. 1970. Inexpensive readout for a commercia l thermocouple microwave power density probe. USDHE\V, PHS, BHH, Hockville, Mel. BlH-I/ DEP 70-31. (Accession No. PB 19G 440 ) . 0
4. Facts About Microwave Oven H.adiation. Pamphl et BlH-1/P-4. USDHEW, PHS, BHH, Hockville, Mel. 20852.
5. :tvfoore, H. L. , and S. \V. Smith. 1970. A compari>on of microwave detection instrum ents. BHH/ DEP 70-7. USDHEW, PHS, BHH, Hockvill e, i\!d. ( Accession No. PB 191 395) .•
G. H.adiation Measurements and Calibration Branch. 1970. The effect of instrument averagi ng time on microwave power density m easurements. BHH/ DEP 70-12. USDHEW, PHS, BHH, H.ockvill e, Mel. (Accession No. PB 192 322). 0
7. Hosenstein, M. , \V. A. Brill, and C. K. Showalter. 1969. H.adiation exposure overview-microwave ovens and the public. OCS 69-1 , USDHEW, PHS, BRH, Hockville, Mel. (Accession No. PB 188 G90 ) . •
8 . Hudge, A. W. , and R. i\1. Knox. 1970. Near fi eld instrum entation . BRH/ DEP 70-1G. US DHEv,r, PHS, BHH, Hockville, Mel . ( Accession No. PB 192 748). 0
9. Swicord, M. L. 1971. Microwave measurements and new types of detectors for evaluation of health hazards. BHH/ DEP 71-l. USDHEW, PHS, BHH, Hockville, Mel. ( Accession No. PB 197 715) ." 0 Available from Nationa l Technica l Inform ation Service Springfi eld, Va. 22151. $3 .00 for paper copy, $0.95 for micro~ fi che. The accession number should be cited when ordering.
, ,

I
•' )
' '
'
]. \!ilk Food T echnol., Vol. 34, No. 9 (1971) 447
VIBRIO PARAHAEMOLYTICUS-A REVIEW'
R. NICKELSON Ar D C. V Ai'.'DERZANT
Animal Science Department
Texas A&M Uniuersity, College Station 77843
( Heceived for publication February 26, 1971 )
ABSTHACT
This review presents current information on th e taxonomic
position , biochemical characteristics, distribution , isolation and
identification procedures, pathogenicity, and serology of Vibrio
paralwemolyticus. In th e past, V. paralwemolyticus was asso
ciated primarily with ou tbreaks of gas troenteriti s in Japan
caused by consumption d seafoods and other salted foods.
In recent yea rs, this organism has been isolated from marine
environments and seafoods in man y coun tries, includin g the
United States . In addition to gastroenteriti s, some strains
may cause localized tissue infections in humans and cause
death of crab and shrimp. In the . United States, V. para
lwemoluticus has been incriminated in unconfirm ed outbreaks
of foodborne illn ess associated with consumption of shellfish.
Isolation procedures based on direct p lating of food homog
enates on selective media wi th or without prior enrichm ent
in broth media are availabl e. Suspect colonies are confirmed
by biochemical tests and fl uo rescen t antibody technique. Al
though antisera ( 7 polyvalent and 47 monovalent ) for sero
logical groupin g of strains of V. paralwemolutic·us are avail
able, their usefuln ess in di agnostic procedures is at the present
uncertain .
V·ibrio parahaemolyt-icus is the causative agent of
an infectious food poisoning syndrome associated
with warm summer months and consumption of ra"v
seafood, particularly in Japan (31). Recent isolations
of this organism from marine environments and sea
foods in th e United States and other countries have
prompted many studies on the -isolation, identifica
tion , and public health significance of this organism.
The purpose of this review is to present current in
formation on various aspects of V. paralwemolyt·icus.
TAXO NOJVIICAL HISTORY
Vibrio paralwemolyticus as it is now known was
first isolated by Fujino et al . (11) in 1950 and desig
nated PasteuTella. parahemolytica. The organism
caused gastroenteritis in 272 persons resulting in 20
deaths. "Shirasu" ( the fry of sardine boiled in salt
water and sold and eaten in the half-dried state) was
the contaminated food produ ct eaten by all who had
acute gastroenteritis. The major symptoms observed
were abdominal pains, vomiting, diarrhea, chills,
headache, and dyspnea. The organism was placed
'Published with th e approval of the T exas Agri cultural Ex
periment Station, College Station. This work was funded in
part by the NSF Sea Cnmt Program Institutiona l C rant GH-
101 made to T exas A&l'v! University.
in the genus Pasteurella because of its bipolar stain
ing and fastidious nature on ordinary culture media.
In 1955, "Asazuke" (salted chopped cucumber) was
incriminated in an outbreak of gastroenteritis invol
ving 120 persons with no deaths. Takikawa (28)
classified the causative agent as Pseudomonas en
teritis. He noted that the chm·acteristics of his iso
late were similar to the culttii·e isolated by Fujino
et al. (11 ), but changed the genus designation to
Pseudomonas based on biochemical properties and
growth on media containing salt. This was the first
indication of the halophilic nature of this organism.
Because of serological differences between this or
ganism and Pseudomonas, 1vJiyamoto et al. (18) pro
posed the generic name Oceanomonas. They made
a detailed study of the characteristics of their cul
tures isolated from mackerel incriminated in food
borne illness and those isolated by Fujino e t al. (11)
and Takikawa (28). All cultures were able to utilize
glucose fermentatively with or without production
of gas. This suggested that they should be placed
in the genus VibTio or Ae-romonas. VibTio was not
considered since pathogens such as VibTio choleTae
grow on 3% NaCl and on ordinary culture media . A
survey indicated that the natural habitat of this or
ganism was a marine environment. Three species
were recognized based on the ability to utilize chitin
and alginate, resistance to desoxycholate, citrate utili
za tion , and sucrose fermentation . Oceano-monas para
hemolyt-ica (Pasteurella pamh emolytica Fujino) was
negative for all the above tests. Oceanomo1ws en
teritidis (Pseudomonas enteritis Takikawa) was posi
tive for chitin, desoxycholate, and cih·ate. Ocean
omonas a.lginolytica ( Pseudomonas enteTitis Takika
wa's serotype XII ) was positive for all tests .
Sakazaki et al. (24) discarded the generic designa
tion PasteuTella on the basis of halophilism, Pseu
domonas on the basis of fermentative glucose utili
zation, and Oceanomonas because it would incorpor
ate many heterogenous organisms possessing different
properties. In an attempt to clarify the taxonomical
position of these organisms, they made an extensive
study of many of the halophilic organisms in ques
tion. Among those studied were the sh·ains of Fujino
et al. (11) and of Takikawa (28). They reported
(24) that these orgm1isms were closely related to the
genus Vib?'io. They recognized tlu-ee subgroups
.r 448 1 ICKELSO A l\TD V A NDERZANT
based on differences of growth in peptone water containing 7 and 10% NaCl; Voges-Proskauer reaction; and fermentation of sucrose, arabinose, and cellobiose. Subgroup 3 resembled Vibrio anguillarum, which did not grow in 7 or 10% aCI. Subgroups 1 and 2 were designated as V. paralw emolytictts. Cultures of subgroup 2 grew in 7 and 10% NaCl, whereas those of subgroup 1 grew in 7% 1 aCl only. Almost all culhues of subgroup 1 were isolated from feces of human patients affected with gastroenteritis, those of subgroup 2 primarily from sea fish and seawater.
The differences between subgroups 1 and 2 were confirmed by Zen-Yoji et al. (43). They reported differences in pathogenicity b etween tl1e two groups .
Subgroup 1 was isolated frequently from patients with unidentifiable enteritis. The occurrence of subgroup 2 in patients with gash·oenteritis was not significantly higher than in persons without this illness. They concluded that subgroup 2 \-vas not pathogenic to man.
Prompted by the investigation of Zen-Yoji et al. (43), Sakazaki (23 ) re-examined 100 cultures of each subgroup. H e confirmed the results reported by ZenYoji et al. (43). Cultures of subgroup 2 grew in 10% TaCl, fermented sucrose and produced acetoin , where
as those of subgroup 1 did not. Because of these differences, he proposed the specific name Vibrio a!ginolyticus for biotype 2 ( subgroup 2 ) . The organisms of biotype 1 (subgroup 1) continued to be classified as V. paralwemolyticus.
\ tfrCROBIOLOGICAL AKD BIOCHEl\ifiCAL PROPERTIES
Sakazaki et al. (24) were the first to present a detailed description of V. paraha.emolytictts. Many reports contain scattered information concerning the properties of this organism (3, 4, 5, 6, 9, 11, 24, 28, 36, 38, 40). The most recent and comprehensive investigation of Japanese strains and related cultures isolated in the United S,tates was made by Twedt et al. (36). The following list of characteristics is compiled from reports of many investigators. l\tlorphologically the organism is a short, gram-negative rod exhibiting pleomorphism. Slightly curved, straight, coccoid, and swollen forms can be observed. All strains of V. pa.mha.emolyt'ictts are motile by means of a single polar flagellum. On agar plates most cultmes appear as smooth, moist, circular, opaque colonies with entire edges . Some rough variants have b een reported in pme cultures (36). A swarming phenomenon oc
curs in some instances when low concenb:ations of
agar are used. This diminishes with increased con
cenh·a tions of agar.
Vibrio parahaemolyticus grows readily at . temperatures from 22 to 42 C, but fails to grow at 2 C.
Growth has been observed at pH values from 5 to 11 and at NaCl concenh·ations from 1 to 7%. Ternmyo (30) noted that V. para.lwemolyticus was killed by heating at 55 ( 10 min ) and 60 C ( 5 min ) in a liquid medium.
1
The following biochemical characteristics have been reported for V. paT(thaemolyticus.
Starch hydrolysis - · (4, 5, 6, 9, 11 , 28, 36) Acetoin production - (5, ~. 28, 36; 38, 40); variabl e (2-1 ) Hemolysis (4, 5, 9, 11 , 36, 38, 40); slight (28) Tripl e Sugar Iron Agar alk/ acid, gas- , H,S- (9, 38, 40) Growth in 0% 1 aCl - (4, 5, ~. 36, 38)
3% NaCl + (4, 5, 9, 36, 38) 7% NaCl + (4, 5, 9, 24, 36, 38, 40) 10% NaCl - ( 4, 5, 9, 24, 38); variable (36)
Indole + (6, 9, 11 , 24, 28, 36, 38, 40) Methyl Red + (5, 6, 9, 24, 38, 40); - (28) Citrate utilization + (6, 9, 28, 36, 38, 40); - (24) Phenylalanine deaminase - (9, 38) Nitrate reduction + (4, 5, 6, 9, 11 , 24, 28, 36, 38, 40) Urease - (6, 9, 24, 36, 38, 40) Gelatin liquefaction + (3, 4, 5, 6, 9, 11 , 24, 28, 36, 38, 40) Catalase + (9, 24, 28, 36, 38, 40) ~1al onate - (6, 9, 24, 36, 38, 40) Oxidase + (4, 5, 9, 24, 36, 38, 40) Cholera-Red - ( 9, 24 ); + (36); variable (38) F ermentation of glucose ( Hugh-Leifson ) + Gas- (3, 4, 9,
11 , 24, 28, 36, 38, 40) Alginate - (24) Luminescence - (24, 40) Pigment - (24) Decarboxylase lysine + (3, 36)
Arginine - (36) Ornithine - (40)
Sensitivity to pteridine 0/129 + (3, 5, 24, 40) Chitin hydrolysis + (4, 5, 24) Sensitivity to penicillin - ( 4, 5, 24) N H" from arginine - (3, 40)
Ferm entation of: ( Acid no gas) Cellobiose - (4, 5, 9, 24, 38); variable (36) Sucrose - (4, 5, 6, 9, 11 , 28, 36, 38, 40); variabl e (24) Arabinose -! · (11 , 36, 40); variable (24, 28, 38) Maltose + (4, 9, 11 , 24, 28, 36, 38) Mannitol + (4, 6, 9, 24, 28, 36, 38, 40) Trehalose + (9, 24, 28, 36, 38) Lactose - (4, 6, 9, 11 , 24, 28, 36, 38, 40) Rhamnose - (9, 11 , 24, 28, 38) Xylose - (6, 9, 11 , 24, 36, 38) Adonitol - (6, 9, 11 , 24, 36, 38) Inositol - (3, 6, 9, 11, 24, 28, 36, 38) Sorbitol - (9, 11 , 24, 36, 38) Salicin - (6, 9, 24, 28, 36, 38); + (11 ) Galactose + (11 , 28, 36) Mannose + (6, 11 , 28, 36) Haffinose - (11 , 28, 36) F ructose - (11 , 28); + (36) Dulcitol - (11 , 24, 28, 36, 40) Inulin - (28) Melibiose (36)
Ut-ilization as sole source of carbon : Glucose + (36) F ructose + (36) Sorbitol variable (36)
ifannitol + (36) Sorbose - (36)
,
, '·
( .. I

'
Vmmo PAHAHAEMOLYncus 449
Mannose + (36) Galactose + (36) Dulcitol - (6, 36) a - Meth yl-D-glucosicle - (36) Potassium gluconale + (36) Arabinose variable (36) Adonitol - (36) Xylose - (36) Rhamnose - (36) E rythritol - (36) Glycerol + (36) Maltose + (36) Lactose - (36) Sucrose - (36) Cellobiose - (36) Melibiose - (36) Haffinose - (36) Salicin - (36) Inositol - (36) Trehalose + (36) Melezitose - (36) Lactate + (24, 36) C luconate + (36) Pyruvate + (24); - (36) Acetate + (24); variabl e (36) Formate - (24, 36) Citrate + (36) Succinate + (24, 36) Malonate - (24, 36) Malate + (24, 36) Oxalate - (24, 36) DL-Phenylalanine - (24, 36) L-Tryptophan e - (24, 36) Benzoate - (36) Phenol - (24, 36)
Utilization in complex medium: Alginate - (36) Malonate variable (36) Tartrate variable (36) Citrate variable (36) Mucate variabl e (36)
More sophisticated procedures also have been used to characterize V . parahaemolyticus. Colwell (8) subjected various marine Vibr io species, V. cholerae, V. pamhaemolyticus, and other related organisms to 200 different morphological , physiological, and biochemical tes ts . Using numerical taxonomy she was able to separate V . para.haem.olyticus from the other organisms. Vibrio pamhaemolyticus species clustered at S ~ 80%. D A base composition for all Vib1'io species was 40 to 48% guanine plus cytosine. Little relation existed between V. cholem e and V. paralwemolyticus. The lack of relationship between these two human pathogens was confirmed by Citarella and Colwell (7) with D r A reassociation reactions.
DrsTRIBUTIOK OF V . pa:rahaemolyticus
'For many years isolations of V. parahaemolyticus seemed to be limited to Japan where it is responsible for 70% of the gash·oenteritis (22). iiyamoto et al. (19) investigated the seasonal distribution of this organism in Sagami and Tokyo Bays. They observed
a "winter-summer type" distribution. The avirulent stenohaline type was predominant in the winter and the virulent euryhaline type in the summer season. Euryhaline types withstood wider ranges of salinity and therefore were more predominant in coastal waters.
In addition, the organism has b een isolated in Germany, the Far East, Hawaii, Hong Kong, Taiwan, Singapore, the Phillipines, and in the 1 etherlands (9, 12, 36). V ·ibrio pamha.emolyt-iws has been studied more extensively in the United States in recent years. Organisms resembling V . para.ha.enwlyticus were isolated from Gulf and South Atlantic Coast water and sediment samples (41). Baross and Liston (4) isolated V. pa'!'a.haemolt;ticus from seaw.ater sediments and shellfish of Pt~get Sound in the N~rthwest P~cific . They reported a seasonal dish·ibution sin1ilar -to that reported in Japan by Miyamoto et al. (19). Large numbers were isolated in the summer, but counts vvere very low in early spring and early fall. It also has been isolated from moribund and lethargic blue crab in Chesapeake Bay (14), shrimp from the Gulf of Mexico ( 40 ), Pacific oys ters (5), processed meat of Chesapeake Bay blue crab (9 ), Gulf Coast oysters, and cooked crab meat sold in the Dallas area (15). In the United States in 1969, V. paraha.emolyticus was incrimin·ated in two unconfirmed outbreaks of foodborne illness associated with the consumption of. shellfish . (37). Seventy-one persons were involved in these outbreaks. Twedt et al. (36) also studied human isolates ( CDC cultures) from wound infections associated with marine b athing. The distribution of V. paraha.em olyt-icus appears ubiquitous in marine environments.
IsoLATIOK PROCEDURES FOR V. pamhaemolyticus
Isolatfon protocols for V. parahaenwlyticus are almost as numerous as reports of its isolation . Earlier isolations were on media such as Salmonella-Shigella or nutrient agar containing 4% aCl (11, 28). IN 1965 Zen-Yoji et al. ( 43) used a brom thymol blue teepol agar for the isolation of V. parahaemolyticus. The Food and Drug Administration now uses a combination of Japanese methods and methods proposed by Liston and Bm·oss (38) . The Japanese phase employs two enrichment broths, Glucose Salt Teepol Broth ( GSTB ) and Salt Colistin Broth ( SCB ) which are then streaked on Thiosulfate Citrate Bile Salts Sucrose agar ( TCBS ) . The Liston-Baross method is more quantitative in that it is a direct plating medium. In addition to common nuh·ients, this medium contains salt water and stm·ch and is incubated anaerobically. In the identification protocol, the J ap anese method emphasizes differential tests such as reactions in Triple Sugar Iron Agar, Voges-Pros-
450 NICKELSON AND VAt-..T])EHZANT
kauer reaction, nitrate reduction, e tc. The Liston
Baross method stresses type of hemolysis and pleo
morphism. Kampelmacher et al. (12) studied five
different enrichment broths and tlu-ee different iso
lation media . The best enrichment was a meat broth
with 5% NaCI. This medium then was streaked on
Teepol Brom Thymol Blue agar ( BTB ) and TCBS agar. Twedt et a!. (35) developed a selective plating
medium consisting of 2% peptone, 0.2% yeast extract,
O.S.% corn starch, 3% NaCl, 1.5% agar, and Penicillin G
( 5 {Lg/ ml ) . The medium was adjusted to pH 8.0. Average recovery of V. parahaemolyticus from buf
fered suspensions was 82%. Recently, Vanderzant
and ~ Tickelson (39) reported a direct plating pro
cedure with or \-vithout preliminary enrichment. En
richment was in Trypticase Soy Broth with 7% TaCl
with incubation at 42 C for 18 hr. The plating me
clium consisted of 0.2% peptone, 0.2% yeast extract,
1i6 corn starch, 7% NaCl, and 1.5% agar. The pH was adjusted to 8.0. Plates were incubated aerobically
at 42 C for 48 hr. Smooth, white-creamy, circular,
amylase-positive colonies were picked as suspect V.
pnrahaem olyt'icus. Confirmation of gram-negative,
fermentative, oxidase-positive, pleomorphic rods was
made by fluorescent antibody technique.
P ATHOGEJ'\ICITY OF V . paralwenwlytiCtiS
Vihrio pamhaemolyt-ictts is the causative agent of
a food poisoning syndrome, related primarily to the
consumption of seafood. Several case histories are
described (1, 11 , 26, 28, 42). The usual symptoms
in order of frequency are: diarrhea, abdominal pain,
nausea, pyrexia, vomiting, and chills. Incubation
period before onse t of symptoms is reported from 9
to 25 hr (28, 42). In an exp erimental case, onset of
illness was observed in 3.5 hr (28) and in an accident
al laboratory infection, the time was 6 hr (26). The
speed with which symptoms occur suggests the presence of an exo toxin, however, only live cells have
produced the disea~e syndrome making it an infectious disease (28, 42). Hemolytic activity ("Kan
agawa phenomenon'') has been closely correlated with human pathogenicity (17, 26). Tllis h emolytic
activity results from a direct thermolabile h emolysin
(10). Pathogmlicity for mice has been demonstrated in
several instances (1, 11, 24, 28, 40). D eath in . mice seems to b e caused by a septicemia. The "D e-T est,"
using ligated rabbit gut inoculated with V. pa.m
haemolyticus produced enteritis at the loop of the
gut (2, 24). In experimental infections, V. pa.m
haernolyticus is also reported as pathogenic for dogs
and cats (1, 28). Marine Vibr·io species are known
causes of marine animal diseases (2, 13, 21, 27, 34).
Vibrio paralw emolyticus has caused deaths in the blue
crab (Call-in ectes sap·iclus) (14) and Gulf of Mexico
shrimp (Penaeus aztecus) ( 40 ). Organisms similar to
V. paralwem olyticus also have b een isolated from
human skin infections . These patients had a history
of marine bathing (36). ·
SEROLOGY OF V. paralwemolytictls
Fujino Et a!. (11 ) and Takikawa (28) observed no
reaction be t\.veen their isolates ai1d sera from recover
ing patients. Sakazaki et a!. (24) noted that H anti
gens might be a better indication of phylogenie re
lationships . 0-Antigen relationsllips we r e noted
among the genera Escherichia, Salmonella, Pmte11s,
Citrobacter, and Enteroba.cter. It had been noted that living cultures were not
agglutinated by homologous 0 antiserum, but if the
cultures were heated at 100 C for 1 to 2 hr strong
agglutination was observed (1 , 24). This was inter
preted by Omori et a!. (20j, to b e caused by a K
antigen that interfered with the 0-antigen reaction .
Immunochemical and biological properties of this
K-antigen were studied by these investigators. The first extensive study of all antigens was made
by Sakazaki et al. (2.5) . vVith 2,720 cultures of V. paralwemolyticus they es tablished 11 0 and 41 K
antisera . Production of H -antigen and antiserum was
difficult. A close H-antigen relationship b etween vibrios was noted . ·with the cultures studied, no one
K antiserum occurred in t\vo or more 0 groups. The determination of 0 antigen was time-consuming. For
these reasons , it was recommended that only K anti
gen determinations be made in routine diagnostic
work. No significant antigenic relationships b etween
V. parahaem olyticus and V. cholerae including the
so called NAG vibrios was found. Preparation, specificity, and chemical nature of
V. paralwemolyticus 0-antigen were reported by
Torii et al. (32 , 33). This antigen was a lipopoly
saccharide. The envelope fraction of V. paralwemoly
ticus is reported to contain an unusual a-1,4-o-glucan
(29 ). This glucan ( V -glucan ) differs from glycogen in that it is not sensitive to a- or {3- amylase.
Twedt et a!. (36) made a serological comparison of
Japanese sh·ains, isolates from human sources, and some non-pathogenic marine vibrios. The serological
comparisons and biochemical tests strongly sugges ted that the wow1d isolates (human sources) were V. pa:rahaenwlyticus species.
A common antige11ic substance of V. paraha.emoly
ticu.s was isolated and purified by Miwatani et al.
(16). This antigen was designated as A-substance
and was common to sh·ains of V . pa.rahaemolyt'ictls
but not to V. cholera.e or V. algina.lyticus. The sub
stance was found to be different from 0 , K, or H
antigens of V. pamlwem olyticus. A serological kit
,

Vmruo P ARAHAEMOLYTicus 451
with 7 polyvalent and 47 monovalent K antisera is comm ercially available (N ichimen Company, 1 ew York, manufactured a t Toshiba Inst. of Biological Science, Japan ) . The usefulness of antisera in diagnostic procedures is at the present questionable.
This revievv of literature indicates that much recent information is available related to the morphological and biochemical characteristics of V. pa.rahaemolyticus. Although several isolations have been reported from marine environments and seafoods in the United States, little is known about its presence in other salted foods and about its significance in foodborne illnesses in this country. Additional information in these areas is needed.
TIEF E I1E:"CES
l. Aiso, K. , and M. Matsuno. 1961. The outbreaks of enteritis-type food poisoning clue to fish in Japan and its ca usative agent. Jap. J. Mi crobial. 5:337-346.
2. Akazawa, H. 1968. Bacterial disease of marine fishes . In Symposium on bacterial fi sh diseases. Bull. Jap . Soc. Sci. F ish . 34:271-272.
3. Bain, N ., and J. M. Shewan. 1968. Identifi cation of Aeromonas, V ·ibrio, and rela ted organisms. pp. 79-84. I n B. M. Gibbs and D. A. Shapton (eel. ) Identification m ethods for microbiologists. Part B. Academic Press. New York.
4. Bm·oss, J. , and J. Liston . 1968. Isolation of Vibrio jJa.rahaemolyticus from th e Northwest Pacifi c. Nature ( London) 217: 1263-1264.
5. Baross, J. , and J. Liston. 1970. Occurrence of Vib rio parahaemol!Jticus and related hemolytic vibrios in marine environments of Vlashington State. Appl. Microbial. 20: 179-186.
6 . Carpenter, K. P ., J . M. Hart, J . Hatfield, and G. Wicks. 1968. Identification of hum an vibrios and allied organisms. pp. 9-18. In B. B. Cibbs and D. A. Shapton (eel. ) Identi fication methods for microbiologist. Part B. Acad emic Press. New York.
7. CitarelJa, H. V. , and R. R. Colwell. 1970. Polyphasic taxonomy of the genus Vibrio: Polynucleotide sequence r·elationships among selected V ibrio species. J. Bacterial. 104: 434-442.
8 . Colwell , R. R. 1970. Polyphasic taxonomy of the genus Vi.brio: Numerica l taxonomy of Vibrio cholerae, V ibrio paralwemolytiws and related Vibrio species . J . Bacterial. 104 : 410-433 .
9. Fishbein, !vi. , I. J. Mehlman , and J. Pitcher. 1970. Isolation of V ibrio pal'(lhaemoluticus from the processed meat of Chesapeake Bay blue crabs. Appl. Microbial. 20:176-178.
10. Fujino, T. , T. Miwatani, Y. Takeda, and A. Tomaru . 1969. A th ermolabile cli1:ect hemolys in of V ·ibrio ·paralwemoluticus. Biken J. 12: 145-148.
11. Fujino, T., Y. Okuno, D. Nakada, A. Aoyama, K. F ukai , T. !v!ukai, and T. Ueho. 1953. On the bacteriological examination of Shirasu-foocl poisoning. Med . J . Osaka Univ. 4: 2~9-304.
112. Kampelmacher, E . H., D . A. A. Mossel, L. J\11. van
Noorle Jansen, and H . Vincentie. 1970. A survey on th e occurrence of Vibrio parahaemoluticus on fi sh and shellfish , marketed in th e Netherlan ds. J . Hygiene 68 :189-196.
13. Kiehn , E. D. , and R. E. Pacha. 1969. Characteriza tion and relatedn ess of marin e vibrios pa thogenic to fish:
deoxyribonucleic acid homology and base composition. J . Bacterial. 100:1248-1255.
14. Krantz, G. E., R. H. Colwell, and E. Lovelace. 1969. V ibrio paralwemolyticus from the blue crab CaWnectes sap'iclus in Chesapeake Bay. Science 164 :1286-1287 .
15. Landry, \>\i. L. , B. vVentz, and M. Fishbein . 1970. Hecovery of Vib rio pcrmlwem.olytic us during a market survey of Gulf Coast seafoods in th e Dallas area. Paper presented at the Fall ]\l[eeting of the Texas Branch, ASM . Da!Jas.
16. Miwatani , T. , S. Shinocla, H. Nishimune, 1. Okada, Y. Takeda, and T. F ujino. 1969. A common an tigenic substance of Vib rio parahaemolyticus. I. Isolation and purification. Biken J. 12:97-106.
17. Miyamoto, Y. , T . Kato, Y. Obara, S. Akiyama, K. Takizawa, and S. Yamai. 1969. In vitro hemolytic characteristic of Vibrio paralwemolyticus : Its close correlation with hwnan pathogenicity. J. Bacteria l. 100 :1147-1149.
18. Miyamoto, Y. , K. Nakamuma, .and K. Takizawa. 1961. Pathogenic halophiles. Proposals of a new genus "Oceanomonas" and of th e amended species names . Jap . J . Microbioi. 5:477-486.
19. lvliyamoto, Y. , K. Nakamura, and K. Takizawa. 1962. Seasonal distribution of Oceanomonas spp. , halophiHc bacteria , in th e coastal sea. Its signi ficance in epidemiology and marine industry. Jap. J. ivlicrobiol. 6:141-158.
20. Omori, C., M. Iwao, S. Iicla, and K. Kuroda. 1966. Studies on K antigen of V ibrio parahaemolyticus I. Isolation and purification of K antigen from Vi.b rio paralwemolyticus A55 and some of its biological properties . Biken J . 9:33-43.
21. Pacha, H. E. , and E. D. Kiehn. 1969. Characteriza tion and relatedness of marine vibrios pathogenic to fish: physiology, serology, and epidemiology. J. Bacterial. 100: 1242-1247.
22. Sakazaki, H. 1965. V ihrio parahemolyticus. A noncholerogenic enteropathogenic vibrio. In Proceedings of the Cholera Hesearch Symposium, 1965, ( U. S. Dept. H ealth , Education and \ Velfare, \ Vashin gton , D. C. ).
23. Sakazaki, H. 1968. Proposal of Vibrio alginol!fticus for the biotype 2 of V ibrio paralwemolyticus. Jap. J. Med. Sci. Biol. 21:359-362.
24. Sakazaki . H. , S. Iwanami , and H . Fukumi. 1963. Studies on tJ1e enteropathogenic, facultatively halophilic bacteria, Vib'l'io para.haemolyticu.s. I. Morphological, cultural, and biochemical properties and its taxonomical position. Jap. J . 1ecl. Sci. Biol. 16:161-188.
25. Sakazaki, H., S. Iwanami , and K. Tamura . 1968. Studies on tJ1e enteropathogenic, facultat ively halophiHc bacteria , Vib rio paralwemolyticus. II. Serological characteristics. Jap. J. 1[ecl. Sci. Bioi. 21:313-324.
26. Sakazaki, H. , K. Tamura, T. Kato, Y. Obara, S. Yamai, and K. Hobo . 1968. Studies on th e enteropathogenic, facultatively halophilic bacteria , ' ' ibrio paralwemoluticus. III. Enteropathogenicity. Jap. J. ~ f ed. Sci. Biol. 21:325-331.
27 . Smith , I. \V. 1961. A disease of finnock clue to V ·ibrio angu.illarw11 . J. Gen Microbial. 24:247-252.
28. Takikawa, I. 1958. Stud ies on pathogenic halophilic bacteria . Yokohama Mecl . Bull. 9:313-322.
29. Tamura, T. , T. Fujino, H. Miyaj i, A. Misaki, and S. Kotani. 1969. A highly branched a-D-ghican of V ibrio para.lwemolyticus A 55. I. Its isolation and structure. Biken J. 12:231-244.
30. Temmyo, H. 1966. Studies on tJ1 e prevention of outbreaks of food poisoning caused by Vibrio parahaemoluticus. Bull. Tokyo Mecl. D ent. Univ. 13:489-510.
31. Thatcher, F. S., and D . S. Clarke. 1968. Micro-orga nisms in foods : Their signif icance and methods of enum eration, p. 14, 15. University of Toro to Press, Canada.
452 N ICKELSON A m \1 ANDERZANT
31. Torii, ~'1., T. An, K. Igarashi , T. Sakai, and K. Kuroda. 1969. Immunological studies on 0 -antigen of V ibrio paralwemolyticus. Preparation, specificity, and chemical nature of the antigens. Biken J. 12:24-39.
33. Torii, M., and K. Igarashi. 1969. lmmunochemical studies on 0-antigens of Vibrio parahaem olyticus. Effect of alkali and acid on specifi city. Biken J. 12 :149-159.
34. Tubiasb, H. S. , R. R. Colwell, and R. Sakazaki. Ul70. i\'larine vibrios associated with bacillary necrosis, a disease of larval and juvenile bivalve mollusks. J. Bacteria l. 103:272-273.
35. Twedt, R. M., B. E. Ivins, H. . :-.1. E . :\ovelli , H. G. Thompson, and H . E . H all. 1970. Selective and diffe rential medium for V . parahaemolyt icus. Bacterial. Prcc. p. 6.
36. Twedt, R. M. , P. L. Spaulding, and H. E. Hall. 1969. Morphological, cultural, biochemical and serological comparison of Japanese strains of V ibrio parah emolyticus with related cultures isolated .in th e United States. J . Bac teri al. D8:5ll-518 .
37. U . S. Deparbn ent H ea lth , E ducation, and \Velfare. 1969. F oodborne outbreaks. Annual Summary. Center for Disease Control. Atlanta, Ga .
38. . S. Dept. H ealth , Education, and W elfare. 1969. Bacteriological analytical manual. Food and Drug Administration, \•Vashington, D . C.
39. Vanderzant, C., and R. Nickelson. 1971. Isolation and emm1eration procedure for Vibrio parahaem olyticus. :ijac-teriol. Proc. p . 20 . '
40. Vanderzant, C., R. Nickelson, and J. C. Parker. 1970. Isolation of Vibrio JJaralwemolut icus from Gulf Coast shrimp . J. Milk Food Techno!. 33 :11-162.
41. \ Vard, B. Q. 1968. Isolations of organisms related to V ibrio paralwemolyticus fr :Jm Amarican estuarine sediments. Appl. Microbial. 16: 543-546.
42. Zen-Yoji, H. , S. Sakai, T . Terama, Y. Kudo, and H . Hitogoto. 1963. Studies on the enteropathogenic halophilic bacteria. I. On the epidemiology of the food poisoning due to halophilic bacteria in Tokyo district durin g 1961 and its bacteriological examination ( English summary) . Jap. J. Infec. Dis. 39:195-204.
43. Zen-Yoji , H. , S. Sakai, T. Terayama, Y. Kudo, T. Ito, :-.11. Benoki, and M. Nagasaki . 1965. Epidemiology, enteropathogenicity, and classification of Vibrio parahaemolyticus. J. Infec . Dis. 115:436-444.
AMENDMENT TO 3-A SANITARY STANDARDS FOR MULTIPLE
USE PLASTIC MATERIALS USED AS PRODUCT CONTACT SURFACES
FOR DAIRY EQUIPMENT
j ntema.tional
Serial #2005
Formulated by Associat·ion of Mille, Food and Envimnmental
United States Public Health Service The Dairy Industry Committee
S anitm·ians
The "3-A Sanitary Standards for Multiple-Use Plastic Materials Used as Product Contact Surfaces for Dairy Equipment, Serial #2000", are hereby further amended as indicated in the following:
Section I. Standards for Acceptability, Sub-paragraph ( 2 ) : Add the followin g material to the list of Generic Classes of Plastics:
Polysulfone Resin .05 0.1 0.1
This Amendment is effec tive Oct. 23, 1971.
,

' •' )
]. Milk Food T ec/111ol. , Vo l. 34, No . 9 (1971) 453
PERFORMANCE IN MICROSCOPIC COUNTING OF SOMATIC CELLS IN MILK
I. EFFECTS OF P,ROCEDURAL VARIATIONS ON ACCURACY AND PRECISION '
'vV. D . SCHULTZE2
, J. 'vV. SMITH2
, D. E. JASPER3
,
0. KLASTRuP·', F. H. S. NEwBouLn5, D. S. PosTLE6
,
Ai'\'D vv. vv. ULLMANN7
( Received for publication March 8, 1971 )
ABSTHA CT
The effects of three changes in th e optical equipm ent used for Direct lvlicroscopic Somati c Cell Count in mi lk ( National Mastitis Council method) on performance of the method have been measured and subjected to statistical analys is of probable signifi cance. Replicate slides of six milk samples were counted by eight technicians among the authors' laboratories. Three levels of cell concentration were represented among the samples. No consistent differences in es timated cell concentration were demonstrated in th e comparisons of nanow versus wide reticle band, wide field versus Huygh enian eyepieces, or low ( h igh dry ) versus high (oil imm ersion ) magnification . In a few instances within each comparison , individual counters produced marked ly different results when the optical equipment was modified. These individual biases wer~ large and consistent with regard to change in objective magnifi ca tion. To evidence was found to preclude use of wide fi eld eyepieces in performin g the DMSCC.
In developing the Direc t iVlicroscopic Somatic Cell Count in milk (DMSCC ) (1), the need to specify appropriate optical equipment forced us to make certain restrictive decisions. If, for example, reticles of the same band width were to be used with both Huyghenian and uncorrected wide field eyepieces,
I counts made with the latter equipment would be derived from a considerably small er area of milk film and thus in theory would be expected to exhibit a greater variance. We decided to specify only Huyghenian eyepieces rather than introduce the confusion
'A contribution from the Subcommittee on Screening T es ts, Nat ional Mastitis Council , Inc. 'United States Department of Agricu lture, ARS , An imal Science Hesearch Division, Beltsvil le, Maryland 20705. "D eparhnent of Clinica l Pathology, School of Veterinary ivlecUcine, Un iversity of Californ ia, Da vis, California 95616. "Statens Veterinaere Serumlahoratoriu m, 4, Oclinsvcj, DK 4100 Hingsted , Denmark. ' Deparhnent of Veterinary \licrobiology and Immunology, Ont.ario Veterinary Coll ege, Uni versity of Guelph , Ontario, Canada. 6D eparb11ent of Large Animal Medicine, Obstetrics and Surgery, New York State Veterinary College, Cornell University, Ithaca" ew York 14850 ' Laboratory Division, State D epartment of H ealth, P. 0 . Box 1689, Hartford, Coru1ecticut 06101.
of a multiplicity of reticles (2) in describing a procedure with defined precision.
Since cells are difficult to recognize, there was no question that the high magnification achieved with oil immersion objectives should be required for general use in the DMSCC. Several participating researchers subsequently had occasion to make counts in parallel at lower magnifications and found a marked discrepancy in estimated cell concentration which seemd to be a function of objective magnification. Similarly, counts made using both wide and narrow bands of the two-band reticle seemed for some operators to show a consistent discrepancy. Optical physics offered no theoretical explanation. The la tter difference vvas of immediate concern, for it would constih1te a bias in our recommended procedure to minimize differences in expected coefficient of variation by varying the number and width of strips to be counted (3). Consequently, a collaborative study was designed to test the effects of these three procedural varia tions through counting replicate sets of milk films .
.\IATE III ALS A :-;- 1) lvJ ETHODS
Milks containing approximately 0.5, 0.75, and 1.0 million somatic cells/ ml were prepared by admixing bucket milks from individual cows. Each sampl e was subdivided into two portions. These were labeled I and IV, II and Vl, and III and V to correspond in dupli ca te with the three desired levels of cell concentration . Sets of D iviSCC slides containing two milk films of each of th e six samples were prepared by a single technician. The order of fi lm preparation among sets was randomized. Fi lm preparation and staining were p erform ed as specified for the DMSCC (1 ).
One set of slides was mail ed to each of th e participating research laborato ries with instructions for counting according to eight procedural var iations, as shown in Table 1. Th e two-band reticle origina ll y designed by th e Subcommittee on Screening Tests, Na tional Mastitis Council, and described by Schu ltze (2) was used throughout. Counts were recorded sep arately for each of the four strips examined for each cell <:aunt as specified in th e DMSCC.
Because there was good reason not to assume nonnality of distribution among the cell count data in this study we used nonparametric methods of statistical analysis, in which distri butions rather than m eans are coniparccl. To compare counts produced on a given milk sample by any two procedure· ' c

454 SCHULTZE ET AL.
TAULI': l. VA IHA:-.IT COUNTING PHOCEDVHES U SED 1N
COLLADOHATI VE STUDY.
Co un t Reticle t~· p c code Obie,::tive J~.vcpicces band
1 Oil-immersion Huyghenian Wide
'(; 0 il -immersion Huyghenian Narrow
3 High-dry Huyghenian Wide 4 High-dry Hu yghenian NarrO\V
5 Oil-immersion Wide fi eld Wiele 6 Oil-immersion \Vide field Narrow 7 High-dry \Viele field \Vide
8 High-dry Wide fi eld Narrow
computed count differences as percentage, as follows : Difference (count b from count a) = b / a - 1
This corrects for inequality of cell concentration and permits pooling of results across samples.
W ilcoxon's Signed Rank Test for Paired Replicates (4, 5) is a nonparametric method which considers medians rath er than means of distributions and makes some use of the magnitudes of difference. N rank numbers are assigned to the differences between pairs and each rank number is given a sign according to the sign of th e difference. The positive and negative ranks are summed separately, and th e smaller sum in absolute value is designated "T" . The expected total
of one sign, ·T, is equal to N [ ( N + 1 ) / 4] and the variance
of the total is equal to 2 NT/ 6. The totals corresponding to the 0 .05% and 0.01% levels of significance are computed as follows: T. 05 = T- 1.96 (21 T/6 ) Y2 T.o, = T- 2.576 (2NT/6) •;. In each comparison, th e null hypothesis to be tested is that the difference has a median value of zero.
Three variations were included in the experimen tal design, each a function of th e other two. Thus, analysis of any one procedural variation required th e comparison of four pairs of counts, .selected from among th e count types shown in Table l. For the comparison of narrow versus wide reticle band we used pairs 2:1, 4:3, 6: 5, and 8 :7; for wide field versus Huygbenian eyepieces we used 5:1 , 6:2, 7 :3, and 8: 4; for high dry versus oi l immersion magnifica tion we used 3: 1, 4:2, 7:5, and 8:6.
RESULTS AND DISCUSSION
All estimated cell concentrations (factored counts ) obtained in the study' are shown in Table 2. Counts were not made vvith wide field eyepieces by Counter 2 of Laboratory C nor by Counter 1 of Laboratory E. Because preliminary work led us to suspect that individual counters might not respond similarly to changes in the DMSCC procedure and equipment all such comparisons were made in parallel within counter.
As an example of the computations involved in the Signed Rank Test, all desired differences which were determined for Counter 1 of Laboratory A are shown in Table 3. Table 4 illush·a tes the assignment of signed rank numbers to the computed signed differences, using the comparis.on of narrow versus wide reticle band for counts made with oil-immersion objectives and Huyghenian eyepieces. Only the cumulative
ranking used to quantitate the comparison across all counters is shown. Ranking was also done within each counter's data. The computed values of "T" obtained for all three procedural comparisons a~e
tabulated in Table 5. ' The overall analysis indica ted high probability
that counts made using a narrow reticle band were higher than counts made on the same milk film using a wide reticle band (984 - and 1010 -, as shown in Table 5a ) . It is instructive, however, to examine individual counter performance. Only three of eight counters produced deviations from count equivalence significant at even the 5% level, and in several in-stances the direction of trend was reversed . These observations sugges t that we are dealing with a problem of psychological bias rather than of physical optics. The magnitude of mean differences in factor-ed cell count was not great, averaging 5.9%.
No evidence was found that counts made using wide fi eld eyepieces might be expected to differ consistently either above or below counts on the same material using Huyghenian eyepieces (Table 5b). Some counter individuality was apparent in the r esults, however. In both Laboratories A and B, two technicians train ed by the same researcher tend-ed toward opposite biases. Subject to investigation of the respective count variances, which will be dealt with in a companion publication, we see no reason to discourage the use of wide field eyepieces for the DMSCC.
The overall analysis of pooled cell counts made with high dry and oil-immersion objectives appeared to es tablish their nonequivalence ( 1333 + and 671 +, as shown in Table 5c ) . Counts made with the high-dry objective might be expected to be lower with greater than 99% probability. But again it was necessary to consider the counters as individuals. The overall bias was contributed largely by two technicians, C-1 and E-1. Since for N = 12, the expected total for one sign ( T ) is 39 and the critical point for P = 0.05 is 14, it is apparent that among the other technicians only B-1 shared this sh·ong counting bias.
Originally, only one technician from Laboratory C took part in the investigation. At a meeting of the Subcommittee on Screening Tests held at Laboratory C a preliminary analysis of these data was offered for comment. It was suggested that the uniqueness of count relationships produced by C-1 might relate to the microscope used, an unusually fine instrument of European manufac ture. To tes t this, two of the authors recounted sample I by procedures 1 and 3 at this same microscope. The factored cell counts in thousands were, respectively, 1,146 versus 1,310 and 1,156 versus 1,263. Thus, these two checks produced
•· I
,

~ .
PERFORMANCE I N MICROSCOPIC COUNTIL"<G 455
TABLE 2. FACTORED CELL COUNTS (X 10·3 PEH lVIL ) OBTAINED BY ALL PARTICIPATING COUNTEHS .
Milk Count sa mple type
II
III
IV
v
VI
1 2 3 4 5 6 7 8
1 2 3 4 5 6 7 8 1 2 3 4 5 6 7 8
1 2 3 4 5 6 7 8 1 2 -~ 0
4 5 6 7 8 1 2 3 4 5 6 7 8
Lab A Ctr 1 Ctr 2
1,128 1,243 1,174 1,160 1,203 1,156 1,141 1,299
432 484 472 481 474 457 450 438 724 759 733 741 696 732 708 714
1,089 1,236 1,189 1,242 1,232 1,304 1,093 1,201
730 719 723 706 712 780 719 692 391 430 434 440 483 578 446 490
1,022 1.089 1,125 1,162 1,123 1,062 1,100 1,184
480 470 455 440 440 423 469 462 700 847 694 654 625 517 670 673
1,280 1,290 1,155 1,149 1,154 1,277 1,179 1,151
704 941 722 730 631 726 667 640 442 585 483 459 385 376 424 416
Lao B Ctr 1 Ctr 2
1,312 1,463 1,270 1,248 1,264 1,568 1,161 1,270
506 516 470 525 457 511 443 432 802 923 818 852 739 818 743 691
1,299 1,324 1,369 1,369 1,270 1,227 1,248 1,360
858 880 750 781 779 716 716 744 482 540 469 454 469 520 465 500
1,247 1,257 1,423 1,266 1,364 1,245 1,232 1,375
488 449 461 493 429 486 396 473 729 710 838 863 784 733 730 684
1,218 1,245 1,425 1,309 1,395 1,287 1,248 1,352
783 704 887 937 796 852 835 849 443 492 511 451 480 486 516 500
somewhat higher coi.mts a t high dry magnification.
Following this, a second technician at Laboratory C
was assigned to the study · and also fail ed to confirm
th e strong bias of Counter C-1. \ iV e conclude that
t)1ere i s no evidence of a necessary difference in cell
counts referable to the level of objective magnifica
tion . Other difl~culties , -in : particular~the prob-lem of
cell fecognitiori", - are stronger arguments aga ins't de
parture from oil-immersion objectives for the
DMSCC. Idiosyncracies among individual techni-
;Lab C Ctr 1 Ctr 2
1,398 1,470 1,137 1,291 1,430 1,693 1,181 1,210
590 706 412 470 483 656 413 490
953 1,009
712 752
1,002 1,410
694 738
1,384 1,820 1,005 1,267 1,457 1,640 1,056 1,068
991 1,056
652 788 938
1,197 730 807 677 589 426 494 668 798 432 545
1,304 1,262 1,162 1,038
475 386 385 390
731 909 772 908
1,209 1,347 1,177 1,101
760 619 740 777
427 421 437 438
Lab D Ctr 1
1,308 1,199 1,263 1,196 1,335 1,372 1,247 1,452
491 490 449 515 510 494 447 432 793 752 759 840
1,065 1,202
855 879
1,209 1,374 1,292 1,268 1,254 1,355 1,304 1,357
796 821 753 727 842 869 819 757 479 443 425 466 429 443 478 439
Lab E Ctr 1
1,511 1,390 1,025 1,326
592 635 296 493
1,042 839 584 831
1,334 1,563
834 1,169
987 922 860 352
588 581 326 507
l\Iean
1,279 1,297 1,197 1,211 1,287 1,349 1,177 1,298
507 517 425 476 466 505 436 455 809 844 739 805 819 902 733 730
1,253 1,400 1,181 1,234 1,294 1,348 1,188 1,248
826 833 761 72.5 783 857 748 748 491 510 439 464 486 534 460 482
cians can produce such strong biases in cell counting,
however, that we are cautioned against accepting
radical innovations as free options in counting pro
cedure. Procedural variations should be minimized,
and first evaluated in a collaborative study b efon>
their ar.ceptance. Through this study it became apparent that in
dividual counter biases can be an important source of
error in quantitative microscopic procedures. Even
though minor changes in the optical equipment or

456 ScHULTZE E-r AL.
TABLE 3 . COl\!P UTEU SIGNED DIFFERENCES FOH COUNTEH 1, LABORATOHY A
Cou nt pa ir (b :a)
2:1 4 :3 6.5 8:7
5:1 6: 2 7:3 8:4
3 :1 4:2 7:5 8 :6
)lil l< sa mple
II Ill I\'
+ 10.20 + 12.04 + 4.83 + 13.50 - 1.19 + 1.91 + 1.09 + 4.46 - 3.91 3.59 + 5.17 + 5.84 + 13.85 2.67 + 0.85 + 9.88
1.51 + 9.97 2.35 + 1.38
+ 9.55 + 19.67 3.76 + 9.87
+ 6.65 + 7.00 2.81
+ ll .98
9.72 - 3.87 + 13.13 5.58 - 2.56 + 5.50 +
2.47 --1- 23.53 8.48 + 34.42 0.55 + 2.76 1.98 + 11.36
+ 4.08 + 6.68 5.15
+ 12.37
4.66 - 3.41 8.07 8.94 - 3.64 3.30
9.26 + 1.24 + 9.18 0.62 - 2.37 + 0.49 5.06 + 1.72 - 11.28 4. 16 - 2.46 - 7.90
0.96 1.81
+ 0.98 - ll .28
+ ll.OO + 2.33 - 7.66 - 15.22
apparent magnification can in theory be compensated for by calculation of a revised microscope factor, they can have a large and unpredictable effect on the counting performance of individual technicians. This observation argues strongly for the precise definition of detail of any quantitative microscopic procedure, and also for the selection of only a single referenct- method. The DMSCC (National Mastitis
TABLE 5. VAL UES OF "T'' COMPUTED FOH THE SIGNED RANK
TEST FOH PAIDED DIFFEHENCES 1
a. Comparison of NA RROW vs. W IDE RETICLE BAND
Countel'
A-1 A-2 B-1 B-2 C-1 C-2 D-1 E -1 All
Counte r
A -1 A-2 B-1 B-2 C-1 D-1 All
Used in combination with: Oil Immersion High dry
N "T" N " T"
12 12 12 12 12
6 12 G
84
6 23 9
35 +
0 0
5 - oo
9 + 30 -8 +
984 - oo
12 12 ll 12 12
6 12
6 83
b. Compa-rison of WIDE FIELD vs. I-IUYGHENIAN EYEPIECES
Used in combina tion wit h:
24 -23 + 13 -35 -0 - ••
9 29-
5 -1010 - • •
Oil immers iou High dry
12 12 12 12 12 ll 71
" 'l" '
18 5 + 6 +
13 - 0
29 -10 -
1229 -
12 12 12 12 12 12 72
26 + 25 + 13 + 0
15 + 29 21
1029 +
TABLE 4. AsSIGNl\!ENT OF HA :'IK N Ul\!BEHS TO COMPUTED SIGNED DIFFEHENCES : COMPAH ISON OF NAIU10W VERSUS WIDE RETICLE
BANDS USED WITH OIL-IMMERSION OBJECTIVES
Counter
A-1
A-1
A-2
A-2
B-1
B-1
B-2
B-2
C-1
C-1
C-2
D-1
D-1
E-1
Count palr
2:1
6 :5
2: l
6:5
2:1
6:5
2:1
6:5
2:1
6:5
2:1
2 :1
6:5
2:1
'Computed signed difference ' Hank am.ong counts frpm all counters
CSD'
Rank' CSD
Rank CSD
Rank CSD
Rank CSD
Rank CSD
Hank CSD
Rank CSD
Rank CSD
Hank CSD
Rank CSD
Hank CSD
Hank CSD
Hank CSD
Rank
- 3.91 - 24
+ 6.56 + 33
- 5.43 - 29
+ ll .51 --I- 55
+ 24.05 + 77
+ 0.80 + 3
- 8.72 - 45
' 5. 15 + 26 18.39
+ 69 - 3.22
- 19 - 8.33
- 44 + 2.77
+ 15 - 8.01
- 41
II
12.04 + 58
- 3.59 - 22
- 2.08 - 10
- 3.86 - 23
+ 1.98 + 9
+ 11.82 + 56
- 7.99 - 40
+ 13.29 + 62
+ 19.66 + 74
+ 35.82 + 82
- 18.74 - 71
- 0 .20 - I
- 3.14 - 16.5
. _,_ 7.26
+ 37
l\lilk snmple
III IV
+ 4.83 + 25
+ 5.17 + 27.5
+ 21.00 + 76
- 17.28 - 68
+ 15.09 + 66
+ 10.69 + 51
- 2.61 - 14
- 6.51 - 32
+ 5.88 + 31
+ 40.72 + 84
+ 24.35 + 78
- 5.17 - 27.5 + 12.86
+ 60 - 19.48
- 73
+ 13.50 + 63
+ 5.84 + 30
+ 0.78 + 2
+ 10.66 + 50
+ 1.92 + 8
- 3.39 - 21
+ 2.22 + ll
- 7.74 - 39
+ 31.50 + 80
+ 12.56 + 59
+ ll.41 + 54
+ 13.65 + 64
+ 8.05 + 42
.. + 17.17 + 67
v
1.51 - 7
+ 9.55 + 46
+ 33.66 + 82
+ 15.06 + 65
+ 2.56 + 13
- 8.09 - 43
- 10.09 - 48
+ 7.04 + 36
+ 6.56 + 34
+ 27.61 + 79
- 18.55 - 70
+ 3.14 + 16.5 + 3.21
+ 18 - 6.59
- 35
VI
+ 9.97 + 47
+ 19'.67 + 75
+ 32.35 + 81
- 2.34 - 12
+ 12.03 + 57
+ 10.87 + 52
+ 11.06 + 53
+ 1.25 + 5
- 13.00 - 61
+ 19.46 + 72
- 1.41 - 6
- 7.52 - 38
+ 3.26 + 20
- 1.19 - 4
,
,:

Counter
A-1 A-2 B-1 B-2 C-1 C-2 D-1 E-1 All
PERFORMAL'ICE I N :tvlrc RoscoPIC CouNTING 457
c. Comparison of I-IIGH DRY vs. OIL IMME RSION OBJECTIVES
Used in combination with: Huygbeu ian Wide fi eld
1'\ "T" N "T"
12 12 12 12 12 12 12 12 96
26 21 + 15 +
7 0 +
30 + 28 + 0 +
1333 + 00
12 14 + 12 19 -12 16 + 12 31 + 12 0 +
12 . 17 +
72 671 +
0
0 0
00
be identified and corrected through reh·aining.
REFEREl':CES
l. National Mastitis Council, Subcommittee on Screening Tests. 1968. Direct Mi croscopic Somatic Cell Count in milk. J. Milk Food Techno!. 31 :350.
2. Schultze, \ ".1. D. 1968. Design of eyepiece reticl e~ for use in the Direct Microscopic Somatic Cell Count methad. J. Milk Food T echno!. 31 :344.
3. Schultze, \V. D., and J. \V. Smith. 1969. A procedure to minimize differences in expected coefficient of variation in th e Direct Microscopic Somatic Cell Count. J. lvlilk Food Techno!. 32:477.
' Significance at P Significance at P =
.05 designated •
.01 designated 60
4. \¥ ilcoxon , F. 1945. lnclividual comparisons by ranking methods. Biometrics 1:80.
.5. \•Vilcoxon , F. , and Roberta A. \Vilcox. 1964. Some rapid approximate statistical procedbres . Leclerle Laboratories Division , Am et:ican Cyanamid Company, Pearl River, New York.
Council method ) is uniquely susceptible to detailed performance analysis , and counter idiosyncracies can
AMENDMENT TO THE 3-A ACCEPTED PRACTICES FOR THE
SANITARY CONSTRUCTION, INSTALLATION, TESTING AND OPERATION OF
.~ HIGH-TEMPERATURE SHORT-TIME PASTEURIZERS, REVISED
Serial #60304
F ormu.lated by International Assoc-iation of Milk, Food and Environm.errtal San-itarians
United States Publ-ic Health Service The Dairy Industry Comm-ittee
The "3-A Accepted Practices for the Sanitary Construction, Installation, Testing and Operation of High-Temperature Short-Time Pasteurizers, Revised, (Effective January 22, 1967 )", as amended, Serial #60303, are hereby further amended by substituting the following for definition B.1 :
B.l
HTST Pasteurization : Heating every particle of ( 1 ) milk or milk product to a temperature of at leas t 161° F, and holding it continuously at or above this temperature f.or at least 15 seconds in a holding tube, provided that milk products which have a higher milkfat content than milk and/ or contain added s\veeteners, and concentrated milk products
to be repasteurized before drying, shall be heated to at least 166° F , and held continuously at or above this temperature for at least 15 seconds in a holding tube, or ( 2) frozen dessert mix to at least 175° F, and holding at or above this temperature continuously for at leas t 25 seconds in a holding tube.
This Amendment is effective October ·23, 1971.

-l5S
HOLDERS OF 3-A SYMBOL COUNCIL AUTHORIZATIONS ON AUGUST ~0, 1971
"Questions or statements concerning any of the holders of authorizations listed below, or the equipment fabricat· ed, should be addressed to Earl 0. Wright, Asst. Sec'y. Treas., Dept. of Food Technology, 116 Dairy Industry Bldg., Iowa s·tate University, Ames, Iowa 50010."
0102 Storage Tanks for Milk and Milk Products
u<:
28
102.
2
117
76
115
207
109
21
1U
127
197
2.13
:31
As Amended
Jacob Brenner Company, Inc. ( 101 8159) 450 Arlington, Fond du Lac, Wisconsin 54935 Cherry-Burrell Corporation ( 101 3156) 575 E . Mill St. , Little Falls, N. Y. 13365 Chester-J ensen Company, In c. ( 61 6158) 5th & Tilgham Streets, Chester, Pennsylvania 19013 Chicago Stainless Equipment Corp. ( .51 1/56) 5001 No. Elston Avenue, Chicago, Illinois 60~30 CP :Jivision, St. Regis ( 51 1156) 100 C. P. Ave. , Lake Mills, Wisconsin 53551 Dairy Craft, Inc. ( 10128159) St. Cloud Industrial Park St. Cloud, Minn. 56301 Damrow Company ( 10131/57 ) 196 \i\Testern Avenue, Fond de Lac, \Visconsin 54935 DeLaval Company, Ltd. ( 9128159) 113 Park Street, So ., Peterborough, Ont., Canada The DeLaval Separatm Co. ( 7123169) Duchess Turnpike, Poughkeepsie, N. Y. 12602 Girton Manufacturing Company ( 9130158) Millville, Pennsylvania 17846 The J . A. Gosselin Co., Ltd. 9120156) P. 0 . Box 280, Drummondvi lle, Quebec, Canada C. E. Howard Corporation ( 9121/59) 9001 Rayo Avenue, South Gate, California 90280 Paul lvlueller Company ( 6129160 ) P. 0 . Box 828, Springfield , Missouri 65801 Paul Mueller (Canada ), Ltd. ( 91 9167) 84 Wellington St. , South, St. Marys, Ont., Ganada Sanitary Processing Equipment Corp. F 3/ 25/70) Butternut Drive E. Syracuse, N. Y. 13057 •. Walker Stainless Equipment Co. ( 101 4156) E lroy, Wisconsin 53929
0204 Pumps for Milk and Milk Products Rev1sed, as Amended
2.14H Ben H. Anderson ll! anufacturers Morrisonville, vVis. 53571
5120170)
2121\. Babson Bros. Co. 2120170) 2100 S. York Rd. , 0:1k Brook, Ill. 60621
29H Cherry-Burrell Corporation ( 101 3156 ) 2400 Sixth St., S. W. Cedar Hapids, Iowa 52406
63H. CP Division , St. Regis ( 4129157) 100 C. P. Ave., Lake Mi lls, Wisconsin 53551 '
2051\ Dairy Equipment Co. ( 5122169 ) 1919 So. Stoughton Hoad , Madison, \Vis. 53716
180H The DeLaval Separator Co. ( 51 5166 ) Duchess Tmnkpike, Poughkeepsie, N. Y. 12602
G5R G & H Products Corporation ( 5122157 ) 5718 52nd Street, Kenosha , W isconsin 53140
1451\ ITT Jabco, Incorporated ( 11120163 ) 1485 Dale Way, Costa Mesa, Calif. 92626
2GR La dish Co., Tri-Clover Di vision ( 9/ 29156) 2809 60th Street, Kenosha, Wisconsin 53140
1481\ Hobbins & Myers, lnc. ( 4122164) \ Moyno Pump Division
1345 L1gonda Ave., Springfield, Ohio 45501 163H. Sta-Rite Products, Inc. ( 51 5165)
P. 0. Box 622, Delavan, Wisconsin 53115 72H L. C. Thomsen & Sons, In c. 8115157 )
1303 53rd Street, Kenosha, Wisconsin 53140 2I9 Tri-Canada Limited ( 2/15/71)
21 Newbridge Road , Toronto 18, Ont. , Canada 175H. Universa l ~11 ilkin v ll•lach ine Div. ( 10126165)
52R
Nationa l Cooperat ives, Inc. First Avenue at College, Albert Viking Pump Div.-Houdaill e Industries, Inc.
Lea, Minn . 56007
406 State Street, Cedar Falls, 5R \Vaukesha Foundry Company
Waukesha, Wisconsin 53186
( 12131156) Iowa 50613
( 71 6156)
0402 Homogenizers and High Pressure Pumps of the Plunger Type, As Amended
87 Cherry-Burrell Corporation ( 12120157) 2400 Sixth Street, S. W. , Cedar Rapids, Iowa 52404
37 CP Division , St. Regis ( 10/19156) Fort Atkinson , Wis . 53538
75 Manton, Inc. ( 9126157) 44 Garden Street, Everett , Massachusetts 02I49
0506 Stainless Steel Automotive Milk Transportation Tanks for Bulk De livery and/ or Farm Pick-up Service,
As Amended
131H. Almont Welding Works, Inc. ( 9/ 3/60) 4091 Van Dyke Road , Almont, Michigan 48003
98R Beseler Steel Products, Inc. ( 3124158) 417 East 29th , Marshfi eld, Wisconsin 54449
70H. Jacob Brenner Company ( 81 5157) 450 Arlington, Fond clu Lac, Wisconsin 54935
40 Butler Manufacturing Co. ( 10/20156) 600 Sixth Ave., S. E ., Minneapolis, Minn. 55114
118 Dairy Craft , Inc. . (10128159) St. Cloud Industrial Park St. Cloud, Minn. 56301
GG Dairy Equipment Company 5129/ 57) 1818 So. Stoughton H.oacl , ll!adison, Wisconsin 53716
123 DeLaval Compan y, Ltd . ( 12/ 31/59) 113 Park Street, South Peterborough, Ont., Canada
45 The Heil Company ( 10/26156 ) 3000 \i\1. Montana Street, Milwaukee, Wisconsin 53235
201 Paul Krohnert Mfg., Ltd . ( 41 1168) \Vest Hill , Ontario, Canada
80 Paul Mueller (Canada ), Ltd . ( 11/ 24/ 57) 84 Wellingtpn Street, So., St. Marys, Ont. , Canada
85 Polar Manufacturing Company ( 12/ 20157 ) Holclingforcl, Minn. 56340
144 Portersvill e Equipment Company 5116163 ) Portersville, Pennsylvania 16051
71 Progress Industries, Inc. 8/ 8/57) 400 E . Progress Street, Arthur, Illinois 61911
47 Trailmobile, Div. of Pullman, Inc. ( 11/ 2/ 56 ) 701 East 16th Ave., North Kansas City, Mo. 64116
189 A. & L. Tougas, Ltee ( 10/ 3/66 ) 1 Tougas St. , Iberville, Quebec, Canada
,
" , ~ .. I
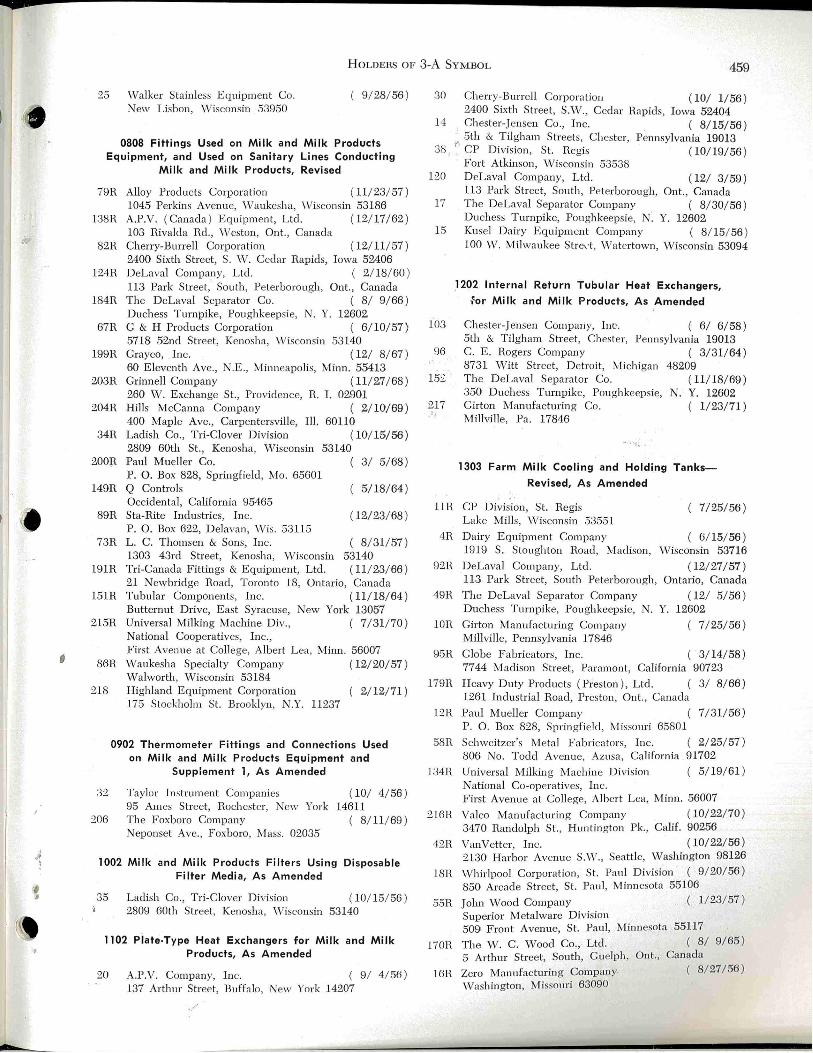
' ·' )
;
HOLDEHS OF 3-A SYMBOL 459
2.5 Walker Stainless Equipment Co. ( 9/28/ 56 ) New Lisbon , \ 'Visconsin 53950
0808 Fittings Used on Milk and Mi lk Products Equipment, and Used on Sanitary Lines Conducting
Mi lk and Milk Products, Revised
79R Alloy Products Corporation ( 11/ 23/ 57) 1045 Perkins Avenue, Waukesha, Wisconsin 53186
138R A.P.V. ( Canada ) Equipment, Ltd. ( 12117/ 62 ) 103 Hivalda Hd. , Weston, Ont., Canada
82R Cherry-Burrell Corporation ( 12/ 11/ 57 ) 2400 Sixth Street, S. \V. Cedar Rapids, Iowa 52406
l24H DeLaval Company, Ltd. ( 2/18/ 60 ) 113 Park Street, South, Peterborough, Ont. , Canada
184H The DeLaval Separator Co. ( 8/ 9/66) Duchess Turnpike, Poughkeepsie, N. Y. 12602
67H G & H Products Corporation ( 6/10/ 57) 5718 52nd Street, Kenosha, Wisconsin 53140
199R Grayco, Inc. ( 12/ 8/ 67 ) 60 E leventh Ave., N.E., Minneapolis, Minn. 55413
203R Grinnell Company ( 11/ 27/ 68 ) 260 W. Exchange St., Providence, H. I. 02901
204R Hills McCanna Company ( 2/ 10/69 ) 400 Maple Ave. , Carpentersville, Ill. 60110
34H Ladish Co. , Tri-Clover Division ( 10115/56) 2809 60th St., Kenosha, Wisconsin 53140
200~ Paul Mueller Co. ( 3/ 5168) P. 0 . Box 828, Springfi eld, Mo. 65601
149R Q Controls 5118/ 64) Occidental, California 95465
89H Sta-Hite Industries, Inc. ( 12/23/ 68 ) P. 0. Box 622, D elavan, \Vis. 53115
73R L. C. Thomsen & Sons, Inc. ( 8/ 31/ 57) 1303 43rd Street, Kenosha, vVisconsin 53140
191R Tri-Canada Fittings & Equipment, Ltd. ( 11/23/ 66 ) 21 Newbridge Hoad, Toronto 18, Ontario, Canada
151H Tubular Components, Inc. ( 11/ 18/ 64 ) Butternut Drive, East Syracuse, New York 13057
215R Universal Milking Machine Div., ( 7/ 31170) National Cooperatives, Inc., First Avenue at College, Albert Lea, Minn. 56007
86H Waukesha Specialty Company ( 12/ 20/57) Walworth , Wisconsin 53184
218 Highland Equipment Corporation ( 2/ 12171) 175 Stockholm St. Brooklyn, N.Y. 11237
0902 Thermometer Fittings and Connections Used on Milk and Milk Products Equipment and
Supplement 1, As Amended
3'J
206
Taylor Instrument Companies 95 Ames Street, Hochester, New York The Foxboro Company Neponset Ave. , Foxboro, :tvlass. 02035
( 10/ 4/ 56 ) 14611
( 8/11 / 69 )
1002 Milk and Milk Products Filters Us ing Disposable Filter Media, As Amended
35 Ladish Co., Tri-Clover Division ( 10/15/ 56 ) 2809 60th Street, Kenosha, Wisconsin 53140
1102 Piate-Type Heat Exchangers for Milk and Milk Products, As Amended
20 A.P.V. Company, Inc. ( 9/ 4/ 56) 137 Arth ur Street, Buffalo, New York 14207
30 Cherry-Burrell Corporation (10/ 1/ 56 ) Iowa 52404 2400 Sixth Street, S.v,r., Cedar Hapids,
14 Chester-Jensen Co., Inc. ( 8/ 15/56) Pennsylvania 19013 5th & Tilgham Streets, Chester,
38 1~ CP D. . . S H. · , , 1 VlS!On , t. eg1s ( 10/19/56 ) Fort Atkinson, \•Viscomin 53538
120 DeLaval Company, Ltd. ( 12/ 3/ 59) 113 Park Street, South, Peterborough, Ont., Canada
17 The DeLaval Separator Company ( 8/ 30/56 ) Duchess Turnpike, Poughkeepsie, N. Y. 12602
15 Kusel Dairy Equipment Company ( 8/15/ 56 ) 100 \•V. i\•Ii lwaukee Stred, \Vatertown, vVisconsin 53094
103
96
15:2
217 ·''
.1202 Internal Return Tubular Heat Exchangers, ,•or Mi lk and Milk Products, As Amended
Chester-Jensen Company, In t:: . ( 6/ 6/ 58) 5th & Tilgham Street, Chester, Pennsylvania 19013 C. E. Rogers Company ( 3/31/ 64) 8731 Witt Street, Detroit , Michigan 48209 The DeLaval Separator Co. ( 11/18/ 69) 350 Duchess Turnpike, Poughkeepsie, N. Y. 12602 Girton Manufacturing Co. ( 1/23/ 71 ) Mill ville, Pa. 17846
1303 Farm Milk Coo ling and Holding TanksRevised, As Amended
llR CP Division , St. Regis 7/25/ 56 ) Lake Mills, Wisconsin 53551
4R Dairy Equipment Company 6/15/ 56) 1919 S. Stoughton Road, Madison, Wisconsin 53716
92H DeLaval Company, Ltd. ( 12/ 27/57) 113 Park Street, South Peterborough, Ontario, Canada
49H The DeLaval Separator Company ( 12/ 5/56) Duchess Turnpike, Poughkeepsie, N. Y. 12602
lOR Girton Manufacturing Company ( 7/ 25/ 56) Millville, Pennsylvania 17846
95R Globe Fabricators, Inc. 3/14/58) 7744 Madison Street, Paramont, California 90723
179H H eavy Duty Products ( Preston) , Ltd . 3/ 8/ 66) 1261 Indush·ial Road, Pres ton, Ont., Canada
12.R Paul Mueller Company 7/ 31/56) P. 0 . Box 828, Springfield , 1\ lissouri 65801
58H Schweitzer's Metal Fabricators, Inc. ( 2/ 25/ 57 ) 806 1 o. Todd Avenue, Azusa, California 91702
134R Universal Milking Machin e Division ( 5/19/ 61 ) National Co-operatives, Inc. First Avenue at College, Albert Lea, Minn. 56007
216H. Valco Manufacturing Company ( 10/22/70 ) 3470 Handolph St. , Huntin gton Pk. , Calif. 90256
42R VanVetter, Inc. (10/22/56) 2130 H arbor Avenue S.\V. , Seattle, Washington 98126
18H Whirlpool Corporation, St. Paul Division ( 9/ 20/56) 850 Arcade Street, St. Paul, Minnesota 55106
55H. Jolm Wood Company ( 1/23/ 57 ) Superior Metalware Division 509 Front Avenue, St. Paul, Minnesota 55117
l70R The W . C. Wood Co., Ltd. ( 8/ 9/65) 5 Arthur Street, South, Guelph, Ont., Canada
16H Zero Manufacturing Company \ Vashington, Missouri 63090
( 8/ 27/ 56 )

-!60 HoLDEHS OF 3-A SYMBOL
1400 Inlet and Outlet Leak Protector Plug Valves for Batch Pasteurizers, As Amended
1:22H Cherry-Burrell Corporation ( 12/11/ 59 ) 2400 Sixth St. , S.W. Cedar Rapids, Iowa 52406
()<.) C & H Products Corporation ( 6/10/ 57 ) 5718 52nd Street, Kenosha, Wisconsin 53140
27 Ladish Co. - Tri-C iover Division ( 9/ 29/ 56 ) 2809 60th Street, Kenosha, Wisconsin 53140
78 L. C. Thomsen & Sons, Inc. ( 11/ 20/ 57 ) 1303 43rd Street, Kenosha, \ Visconsin 53140
1603 Evaporators and Vacuum Pans for Milk and Milk Products, Revised
132R A.P.V. Company, Inc. ( 10/ 26/ 60 ) New York 14207 137 Arthur Street, Buffa lo,
1LH Blaw-Knox Food & Chemical P. 0 . Box 1401
Equip. , Inc. ( 2/12/ 59 )
Buffalo, N. Y. 14210 llOH Arthur Harris & Company ( 11/10/ 58)
210-218 North Aberdeen Street, Chicago, Illinois 60607 164H Mora Industries, Inc. ( 4/ 25/ 65 )
999 E. !vlaple Street, r-.•lora, Minnesota 55051 1 07R C. E. Rogers Company ( 8/ 1/ 58 )
8731 vVitt Street, Detroit, Michigan 48209 l 86R Marriott Walker Corporation ( 9/ 6/ 66 )
925 East Maple Road , Birmingham, Mich . 48010
1702 Fillers and Sealers of Single Service Containers, For Milk and Milk Products, As Amended
221 Bertopack Limited 5/ 25/71 ) 75 Ardelt Place, Kitch ener, Ontario, Canada
192 Cherry-Burrell Corporation ( 1/ 3/ 67) 2400 Sixth St., S. \V. , Cedar Rapids, Iowa 52404
139 Exact Weight Scale Company ( 4/15/ 68 ) 944 \•V. 5th Ave., Columbus, 0. 43212
137 Ex-Cell-O Corporation ( 10/17/ 62 ) P. 0 . Box 386, Detroit, Michigan 48232
220 Haskon, Inc., Package Equipment Division ( 4/ 27/71) 2285 University Ave., St. Paul , Minn esota 55114
142 Polygal Company ( 4/15/ 63 ) Div. of Inland Container Corp . 1'. 0. Box 68074, Indianapolis, Indiana 46268
211 Twinpak, Inc. ( 2/ 4170 ) 1133 Avenue of the Am ericas, New York, N. Y. 10036
1901 Batch and Continuous Freezers, For Ice Cream, Ices and Similarly Frozen Dairy Foods, As Amended
1-11 CP Division , St. Hegis ( 4/15/ 63 ) 100 C. P. Avenu e, Lake Mi ll s, Wisconsin 53551
146 - Cherry-Burrell Corporation ( 12/ 10/ 63)
168
154
160
2400 Sixth Street, S. W. , Cedar Hapids, Iowa 52404
2201 Silo-Type Storage Tanks for Milk and Milk Products
Cberry-Burre!J Corporation 575 E. Mill St., Li ttle Falls CP Division, St. Regis 100 C. P. Ave., Lake Mi lls, Dail'y Craft, Inc. St. Cloud Industrial Park St. Cloud, Minn . 56301
6/16/ 65 ) N. Y. 13365
( 2/10/ 65 ) Wisconsin 53551
( 4/ 5/ 65 )
181 Damrow Company ( 5/18/ 66 ) 196 \\' estern Ave., Fond du Lac, Wisconsin 54935
156 C. E . Howard Corporation ( 3/ 9/ 65) 9001 Rayo Avenue, South Gate, California 90280
155 Paul Muell er Co. ( 2/ 10'/ 65 ) P. 0. Box 820, Springfield, Missouri 65801
195 Paul Mueller (Canada) , Ltd. ( 7 I 6! 61) 84 \\' ellington St. , So. , St. r-. lary's, Ont ., Canada
165 Walker Stainless Equipment Co. ( 4/ 26/ 65) E lmy, Wisconsin 53929
2300 Equipment for Packaging Frozen Desserts, Cottage Cheese and Mill< Products Similar to Cottage
Cheese in Single Service Containers
174 Anderson Bros . Mfg. Co. ( 9/ 28/ 65 ) 1303 Samuebon Hoad, Hockford, Illinois 61109
209 Doughboy Industries, Inc. ( 7/ 23/ 69 ) Machin e Division 869 S. Main Ave., New Hichmond, \ Vis. 54017
193 Triangle Package Machinery Co. ( 1/31/ 67) 6655 West Diversey Ave., Chicago, Illinois 60635
2400 Non-Coil Type Batch Pasteurizers
161 Cherry-Burrell Corporation 4/ 5/ 65) 575 E. Mill St., Little Falls, N. Y. 13365
158 CP Division, St. Hegis ( 3/ 24/ 65) 100 C. P. Avenue, Lake Mills, Wisconsin 53551
187 Dairy Craft, Inc. ( 9/26/66) St. Cloud Industrial Park St. Cloud, Minn. 56301
208 The De Laval Separator Co., ( 7/ 23/ 69) Duchess Turnpike, Poughkeepsie, N. Y. 12602
177 Girton Manufacturing Co. ( 2/18/ 66) Millvi!Je, Pennsylvania 17846
2500 Non-Coi I Type Batch Processors for Milk and Milk Products
162 Cherry-Burrell Corporation ( 4/ 5/65) 575 E. Mi ll St., Little Falls, N. Y. 13365
159 CP Division, St. Hegis ( 3/ 24/ 65) 100 C. P. Avenue, Lake Mills, Wisconsin 53551
188 Dairy Craft, Inc. ( 9/ 26/ 66) St. Cloud Industrial Park St. Cloud, r-. linn . 56301
196 Paul M~eller ( Canada ), Ltd. ( 7/ 6/ 67) 84 \\!ellington St., So., St. Marys, Ont., Canada
202 Walker Stainless Equipment Co. ( 9/ 24/ 68) New Lisbon, W is. 53950
2600 Sifters for Dry Milk and Dry Milk Products 171 Entoleter, In c. ( 9/ 1/ 65 )
Subsidiary of American Mfg. Co. 1187 Dixwell Avenue, Hamden, Connecticut 06514
173 B. F. Gump Di vision ( 9/ 20/ 65 ) Blaw-Knox Food & Chem. Equip. Inc., 750 E . Ferry St. , P. 0 . Box 1041 Buffalo, New York 14240
185 The Orville-Simpson Co. 8/ 10/ 66)
176
172
1230 Knowlton St., Cincinnati, Ohio 45223 Sprout, Waldron & Co., Inc. ( 1/ 4/ 66 ) Munsy, Pennsylvania 17756 SWECO, Inc. ~ ... 9/ 1/65) 6111 E. Bandini Blvd. , Los An geles; California 90022
~ .. I
'

I
' ·~
]. Milk Food T echnol., Vol. 34, No. 9 (1971 ) 461
THE NATIONAL CONFERENCE ON INTERSTATE MILK SHIPMENTS: TWENTY YEARS IN RETROSPECT
J. C. McCAFFREY
National Conference on Interstate M-ilk Shipments 1800 W est Fillmore Street
Chicago, Illinois 60612
(Received for publication March 10, 1971)
ABSTRACT
The National Conference on Interstate Milk Shipments has developed, during the past 20 years, from a shaky beginning, into a solid organization that has benefited all phases of the dairy industry. The gradual increase in and diversification of attendance, by disciplines as well as by geographical entities, has proven that a voluntary organization can work. The gradual changes in th e format of the program have resulted from the changing demands of th e industry.
Since discussion of the "generation gap" seems to occupy the minds of both the "older" and "younger" generations today, this might be an appropriate time to summarize the progress that has been made by the National Conference on Interstate Milk Shipments. The writer has been familiar with many "starts and stops" that have taken place during the past two decades. Many of the individuals who were active participants dming the early years of the Conference have either retired or departed tlus earth. Many of the new participants in Conference deliberations were still in high school and/ or college during the formative years of tl1e organization. It is hoped, therefore, that this article will help to bridge the so-called "generation gap".
EARLY HISTORY
The sanitary quality of milk shipped both interstate and intra-state has been a matter of concern to receiving areas for many year . Lack of uniform standards of inspection, differences in interpretation of regulations, and simple econonucs of h·ade barriers were prime causes for the great concern over the low quality of some milk supplies. The situation was brought to a head by the events of World War II. The outbreak of hostilities brought about extensive shifts in population and a tremendous increase in military personnel. This resulted in procurement officers scouring the counh·y for satisfactory milk supplies. Both military and health officers soon found that there was an insufficient supply of clean, safe milk to meet the demands.
In 1946 the Conference of State and Territorial Health Officers requested the United States Public Health Service to develop a workable plan for certification of milk supplies tl1at might be shipped interstate. On December 31, 1946 (1), tl1e Surgeon General sent a letter to all state nllik conh·ol autl1orities outlining the proposed plan. The response
Figure l. Opening session of the 1963 Conference which met in Memphis.

462 )V!cCAFFREY
Figure 2. Park Livingston, Chairman , addressed the opening session of the 1965 Con ference .in Louisville.
from state authorities was very spotty. This apparent lack of interest, plus a lack of funds and personnel in the Public Health Service, prevented the plan from being implemented at that time. In 1949, therefore, the Association of State and Territorial Health Officers again requested the Public Health Service to assist the states in implementing the program. At this time, similar requests were made by state departments of agriculture, local health offi cials, and representatives of the milk indush-y.
In December, 1949, representatives of nine midwestern states met at the Indiana State Board of Health, Indianapolis, Indiana, to sh1dy the problem and to determine whether a workable plan could be developed whereby the interstate shipment of milk might be facilita ted. In February, 1950, a second meeting was held in Chicago in which representatives of ll michves tern states participated. At this time, a committee composed of representatives from ' 'Visconsii1, Illinois, Indiana, Missouri and Ohio, was appointed to arrange the details for a
ational Conference.
After considerable deliberation, this committee requested the Surgeon General to call a National Conference to be held at St. Louis, Missouri, June 1-3, 1950. The Surgeon General wrote an invitational letter to all states reques ting them to have representatives at this meeting. H.epresentatives of 22 states and the Dish·ict of Columbia, numbering 70 individuals, participated in the first meeting. As a result of group discussions and joint planning, certain basic ;:;onclusions were es tablished, to be used in developing and administering state milk conh·ol programs that would bring about reciprocity. Several states immediately began to implement the interstate
program, using the report of the 1950 Conference as guidance.
SuBSEQUEl\'T CoNFERE •cEs
By the time the second Conference was held in St. Louis, June 4-6, 1951, 21 states were participating in the program (1). The pmpose of the second meeting was to evaluate the fl edgling interstate plan and to make constructive improvements where needeel . Seven task forces were set up as study groups to handle problems submitted by the delegates. Hisstorically, the names of these task forces were : (a) Certification, (b) Supervision, (c) Laboratory, (d) Education, (e) Promotion of Interstate Programs, (f) Manufactured Milk Products, and (g) Channels and Forms for H.eporting.
Chairman J. L. Rowland announced the following rules to govern the operations of the task forces and the general assembly. '
l. Task Force Rules a. Task forces will be appointed by the Conference
chairman. b. Each task force will select its own chairman. c. Each task force will select a subcommittee of three to
prepare the report of th e task force. cl . The chairman of the task forc e will present the report
to th e general assembl y. 2. General Assembly Rules
a. In general assembl y, each state will be entitled to one vote.
h. Representatives of municipalities, industry, Public Health Service, and other federal agencies will not be entitled to a vote in the general assembly.
The third ational Conference was held in St. Louis , !v!issouri, June 10-12, 1952. During this Conference Chairman Rowland appointed a parliamentary procedures committee, under the chairmanship of C . K. Luchterhand of Wisconsin. The committee was directed to study the organizational problems and outlined a procedure for selection of responsible officials to direct the activities of the Conference in the fuh1re. The committee recommended selection of an Executive Board to be composed of 12 members including the preceding chairman exofficio (1 ). The remaining 11 members were to be selected as follows: from shipping states as a group and from receiving states as a group, each group having one member from a state department of health, one from a state department of agriculture, one from a municipal health agency, and one from indush·y; one from the U. S. Public Health Service; one from the U. S. D epartment of Agriculture; one from an educa tional institution . The Executive Board was to elect a chairman from among its own membership.
In 1955 the constitution was revised and membership of the Executive Board was increased from 12 to 17 (2). States were divided geographically,
, , ( .. I
I!

'I
'
' •' l
i
State
Alabama Arizona Arkansas Califomia Colorado Connecticut Delaware Dist. of Col. Florida Georgia Idaho Illinois Indiana Iowa Kansas Kentucky Louisiana Maine Maryland Massachusetts Michigan Minnesota Mississippi Missouri Montana Nebraska Nevada New Hampshire New Jersey New Mexico New York No. Carolina No. Dakota Ohio Oklahoma Oregon Pennsylvania Puerto Rico Rhode Island So. Carolina So. Dakota Tennessee Texas Utah Venr.ont Virginia Washington W. Virginia Wisconsin Wyoming
Total
>:tnte
Health Agriculture P.H.S. Industry U.f;.D.A. University Comm. labs. Suppliers News media Miscellaneous
Total
1950
l
l
l l
3 2 4 l
10
2 4
l
4
17
2
2 l 2 2
3 1
1
1 4
2
70
1950
30 13 13 13
l
70
NATIONAL CONFERENCE
TABLl> 1. ANNUAL ArrENDANCE BY STATE
1951
3
l l l
lO l 8 l
ll l 2 2 l l
l
12 l
18
2
l l 4
4 l
4
4
1 6
104
1951
33 22 13 25
2
5
4
104
195S
l
2
l 2
6 l l l
17 4 l
l l
l
6 1
17
2
1 4 2
2 1
5
3
2 1 l 1
1 . 11
101
1955
7
5
2 3
ll l 5
19 5 4 4 3 l 1 l 1 2
12 3 9
1
1
6 2 l 5 6
7
2 2 1
22 8
1 2
. l 19
186
1917
7
2
3 1 4 l 4
16 4 6 4 4 2
l
2 6 3
11
1
1 4 1 l 4 2
6
14 5
5
1 18
144
1959
l 1 2 4 3 6
2
20 5
10 2 1 2 1 l 1
6 4
21
l
1
2 l 3 6 l
5
4 5
l 4
1 14
142
TABLE 2. REGISTRANTS BY FIELD
1953
41 12 7
26 l 4
2 3 5
101
1955
76 24 9
58 3 5 2 5
4
186
1957
65 17 9
39 l 4 1 5 2 1
144
1959
51 26
9 44
l 5 2 3
l
142
1961
3 l 3 3
ll
7 1
22 6
13 3 9 1 1 2 1 4 4 3
22
l
1 5 1 2 8
5
5 5 l l 6
1 If
173
1961
1963
1 2
12 2 4 3 1
14 4 8
28 7 9 3
14
l 2 2 6 6 6
17
l
2
11 2 2
16 2 l 9
l
28 6 2 l 7 l 2
14
260
1963
63 98 20 27 19 27 49 88
2 7 5 4 2 9 3
2 2 6
173 " 260
1965
3 3 7 6 5 2 1
18 3 ll
l 33 17 14
6 . 41
4 1 3 3
12 9 6
17
l
2 1
19 5 4
38 3 1
18
2
13 7
1 10
2 2
15
371
1965
133 30 36
130 6
11 5
15 2 3
371
1967
5 2 6 5 5 3
15 12 12
1 29
7 8 5 9 5 1
13 4 7
10 5
17 1 3
l
l 22
8
24 2 l
13
3 l 7
10 1 2 ll
2 4
19
322
1967
93 29 33
111 3
12 3
12 3
23 322
463
1969
2 4 3
10 32
3 1
14 8 3 6
32 8 9 8
10 1
4 3
10 7 4
17 5 4 l
l
16 9 2
26 4 l
10 l
l 3
12 15
1 2
10 4 1
15 3
346
1969
87 44 26
123 2
19 2
15 3
25 346

464 McCAFFREY
from north to south, into 3 groups: Group I consisting of the eastern states, Group II the midwestern states, and Group III the western states. Each group was to have one member from a state health department, one from industry, one from a state department of. agriculture, and one from a municipal health department. T11e representatives from the U. S. Public Health Service, U. S. Department of Agriculture, and an educational institution were to be elected "at large," meaning that the individual could be selected from any part of the country. At this time, a representative of laboratory was added to the Board, also to be elected "at large." The Public Health Service representative was assigned to Group I, representatives of an educational institution and laboratory were assigned to Group II, and representatives from the U. S. Department of Agriculture were assigned to Group III . The makeup of the Executive Board has not changed since 1955. The format of task forces remained essentially the same through all Conferences up to 1969, but the titles varied somewhat from year to year depending upon the problems involved.
ORGANIZATIONAL CHANGES
The Executive Board, during an interim meeting held at the O'Hare Ramada Inn, Chicago, on March 8, 1966, authorized the Secretary to publish a Newsletter to keep all registrants advised of future Conference plans. The first issue was published on May 16, 1966. At the same meeting the Board voted to select future meeting places 4 years in advance, as well as to extend the Conference through a fourth day so that individuals participating would have more time to study task force reports.
In 1965 the Executive Board voted to establish a standing Credentials Committee to arbitrate disputes concerning the voting rights of official delegates. The committee was to be composed of three members, one from each of the Regions, with the Secretary-Treasurer as a non-voting ex-officio member. The members of the original committee were: Roger Holkesvik, North Dakota; Roy Perkins, Tennessee; and Earle Borman, Connecticut as Chairman. At the same time the Board voted to make the Task Force reports available to registrants at the Conference on the evening before the final business session, so that interested persons and/or delegates would have the opportunity to study the reports.
The task force alignment for the 1969 ( 4) Conference was completely re~rganized in an attempt to d·e.velop better working qonditions . Each task force consisted · of 5 members who were appointed in advance by the Program Committee, with the approval of the Executive Board. The individuals selected
represented the five different disciplines involved in the Conference : state department of health, state department of agriculture, local health department, indush·y, and educational institutions. Registei'ed participants were allowed to participate in any task force that they wished. After the conclusion of deliberations, the five members of the task force prepared a short statement regarding the problems and the actions taken . Any individual (or group ) who disagreed with the task force statement was authorized to make a 3-min presentation of a minority report at the business session. \Vhile some individuals complained about task force reorganization, the procedure operated much more smoothly than at some times in the past. The former practice of "packing" task forces was largely eliminated.
LocATION
The first four Conferences ( 1950, 1951, 1952, and 1953) were held at the Statler Hotel, St. Louis , Missouri, with attendance averaging slightly over 100. The Executive Board shifted the 1955 and 1957 meetings to the Hotel Peabody in Memphis, with a tremendous increase in attendance. St. Louis hosted the meeting in 1959 and 1961. The 1963 meeting returned to Memphis and an all-time high regish·ation of 260 was reached. The Board voted to meet in Louisville, Kentucky in 1965 and attendance skyrocketed to 371. The famous Deanville Hotel in Miami Beach, Florida, was the scene of the 1967 Conference and the New Albany Hotel, Denver, Colorado, was the headquarters for the 1969 meeting. The 1971 Conference was held at the ChasePark Plaza Hotel , St. Louis, Missouri.
ATTEl\'DANCE BY STATES
As was mentioned previously, only 22 states and the District of Columbia were represented at tl1e first Conference in 1950. The attendance figures , both by state and by individuals, for all conferences are listed in Table 1. The Secretary's files are, with the exception of 1952 regish·ation, complete from 1950 through 1969. The author has been unable to obtain a regis tration list for the 1952 Conference. Only 12 states and the Dish·ict of Columbia have been represented at every one of the Conferences. Illinois has the largest average representations of the above mentioned group with 21.5. Missouri is second with an average of 17, followed by Ohio with an average of 13.5, and Wisconsin with an average of 13.
TYPE OF R EGiSTRANTS
The type of regish·an ts by profession is shown in
,

I •• )
ATIONAL CoNFERENCE 465
Year Chairman Secretary Treasu rer
1950-3 1955 1957-9 1961 1963 1965 1967 1969
J. L. Rowland 1 one None
Dr. K. C . Weckel H. L. Hortman
C. K. Luchterhand Harvey vVeavers
H. J. Barnum H . J. Barnum M. P. Baker M. P. Baker
H. J. Barnum Park Li vingston Park Livingston
J. C. McCaffrey J. C. McCaffrey
Dr. Howard K. Johnston Shelby Johnson
J. C. McCaffrey-Secretary-Treasurer J. C. McCaffrey J. C. McCaffrey
Table 2. It is interesting to note that health, agri
culture, inclush-y, and educational institutions have
been well represented at every Conference. While
registration from health and agriculture has remain
ed relatively constant throughout the years, dairy
indush·y representation has markedly increased. Ed
ucational institutions likewise are showing a greater
interest in the deliberations of the Conference, as
are representatives of the dairy industry supply or
ganizations.
OFFICERS
From 1950 through 1953, the only elected Con
ference officer was the Chairman, J. L. Rowland,
Associate Professor of Preventive Medicine and Pub
lic Health, Kansas City College of Osteopathy and
Surgery, Kansas City, Missouri. From 1955 through
1963, the elected officers consisted of (a) Chairman,
(b) Secretary~ , and (c) Treasurer. In 1963 the con
sti~tion was;·. changed to combine the. officers of Secretary ana Treasurer. The officers who have
guided the Cqnference through its first 20 years are listed below:
REFERENCES
l. 1952 Conference report. 1953. J. Milk Food Technol.
16 :232-237.
2. 1957 Conference report. 1958. J. Milk Food Techno!.
21:164-171.
3. 1967 Conference report. 1967. J. Milk Food Techno!.
30: 2.08-212.
4. 1969 Conference report. 1969. J. Milk Food Techno!.
32:290-294.
ASSOCIATION AFFAIRS NOTICE TO MEMBERS IAMFES, INC.
At the Annual Meeting of the Executive Board
San Diego, Calif. August 15, 1971-the Executive
' Board in accordance with the By-Laws, Article I,
Section 2 raised the Annual clues to $12.00 affiliate,
and $14.00 Direct, beginning Jan. 1, 1972. It was
determined by the Board that the raise was absolute
ly necessary for the following reasons:
1. The last clues raise was Jan. 1, 1966 and we all
know costs have been consistently rising, making it
increasingly difficult each year to meet expenses.
2. An increase in May 1971 of over 20% in postal
costs.
3. An increase of over 20% in printing costs as of
August 1971 .
4. A greatly expanded Journal over the past ~vb years which has provided considerably more for the
money.
5. The need to build sufficient margin to hire a
competent replacement for "Red" when he retires,
with pension plan for the new Executive Secretary. 6. The need to meet our obligation to "Red" for
his pension-we have two more payments of $6120.00 each.
7. It is estimated that our expenses will increase
by $8500 this fiscal year July 1971-Jun~ ,3P, 1972. Allowing for a net income of $6000.00 \¥e 'will need to
increase our income by $11,500. We average about
$3000.00 net income now. We would still be short
on our pension_' obligation. However the Board felt
that a $4.90 raise in clues plus increases in subscrip
tion rates, reprints, advertising etc. would increase
our income over $12,000.00. We will be able to
meet the $6120.00 payment this year from the re
serve and only one more payment will then be due
next year so we will be in a position to handle the
situation at the end of this period.
The Executive Board earnestly solicts your sup
port and understanding of the situation, and h·uly
hopes that each and every ~ember appreciates the
conh·ibution IAMFES makes to them and to the
field of milk and food sanit~tion. To anyone worthy of the name "Professional S~nitarian" the Journal
alone is worth the membership dues. Sincerely, Orlowe M. Osten, President
466
NEWS & EVENTS 15TH ANNUAL EDUCATIONAL
SEMINAR OF NSPS
The 15th Annual Educational Seminar and Convention of the National Society of Professional Sanitarians will be held at the Sands Motel, Tucson, Arizona, November 3, 4, and 5, 1971.
The theme of the seminar is "Food: From Seed to Man." Instructors from the College of Agriculture, University of Arizona, will be instructing the seminar.
All sanitarians and other persons interested in the seminar are invited to attend. Please make advanced reservations and mail to: Bailey E. Battiste, R.P.S. , President, N.S.P.S., 151 West Congress Street, Pima County Health Department, Tucson, Arizona 85701.
NATIONAL RESTAURAN!T ASSOCIATION IN RECENT MESSAGE URGES
MEMBERS TO IMPROVE BY VOLUNTARY SELF-INSPECTION
The image of your foodservice establishment that greets your cus tomer determines, to a considerable extent, his patronage of your establishment.
Very important to you is what the cus tomer sees during his visit . . . hopefully, a bright, clean and attractive place in which to dine.
More importan t to you is what your customer, for the most part, does not see. The personal hygiene practices of your employees; the manner in which food is handled during storage preparation and serving; and the manner in which equipment and utensils are cleaned and sanitized.
The ex tent to which your employees practice good personal hygiene,, prepare and serve food in a safe manner and maintain equipment and utensils in a clean and sanitary condition, measures the extent to which you protect your customers from contaminated food and possible foodborne illness.
You cannot rely on the visi ts and counsel of your health department's sanitarian to greatly aid you in presenting a safe eating place for your customers. Although your customers visit your restaurant every day, the sanitarian sees it infrequently . . . once a month; once every 2 or 3 months; once or twice a year or perhaps not at all .
As in many other situations, a businessman has to do it himself . . . in other words, the effective protection of your customer can be achieved by requiring that your managers and supervisors do a continual job of self-inspection of both facilities and
! practices . . . by checking department by depart-ment and function by function for unsafe procedures and unsanitary conditions which can lead to contamination of food and growth of hannful bacteria.
Your health officer can a~sist you in setting-up an effective self-inspection program for your establishment. The National Restaurant Association can supply you with reference charts and guidance material to supplement the assistance given you by the health department.
PLANS UNDERWAY FOtR NATIONAL DAIRY HOUSING CONFERENCE
Providing practical information to dairymen and others interested in dairy facilities will be the goa] of the National Dairy Housing Conference that will be held February 6-8, 1973, at Michigan State University. 1 oted authorities from all areas of dairy housing will be on hand to discuss new ideas and relate their field experiences. Topics will include housing, feeding, milking, and construction sys tems; building materials, environmental control, manure and was te management, regulations, economics, sanitation, and herd health.
The meeting will combine the efforts of the American Society of Agricultural Engineers, American Dairy Science Association, Canadian Society of Agricultural Engineering, Farmstead Equipment Association, Milking Machine Manufacturers Council, International Association of :tvlilk, Food and Environmental Sanitarians, Agricultural Research Service, and the Agricultural Extension Service. Conference organizers are looking for program material from anyone interested in dairy cattle housing and facilities. Either 200-word abstracts or completed papers should be sent to NDHC Program Chairman T. J. Brevik, Agricultural Engineering Department, University of Wisconsin, Madison, Wisconsin 53706, by November 30, 1971.
PROFESSOR F. E. NELSON HONORED
F. Eugene Nelson, Professor of Dairy and Food Sciences and Professor of Microbiology and Medical Technology at the University of Arizona, was the recipient of the American Dairy Science Association Award of Honor during the Annual Meeting of ADSA at Michigan State University, June 20-23. He has served as President of the Association, a member of the Board of Directors and member and chairman of numerous committees. He was editor of the
~ ,. I
':

I
•' )
;
EWS A ND EvE TS
Journal of Dairy Science from 1947 to 1952 and 1953 recipient of the Borden Avvard of ADSA in recognition of his research on dairy products. Many of his former graduate students hold responsible positions in commercial and academic phases of the clairy and food industries.
LABORATORY EXAMINATION OF DAIRY PRODUCTS - I
This course is desig:: .:d for technicians who are ·· ·spt':1sible for the microbiological examination of J a \\· or pasteurized milk and other dairy products. l.nrL•llment is limited to 24 to enable instructors to cl-.a l with individual needs of the less experienced technician and to provide consultation with the more experiwced worker.
Laboratory procedures described in the current "Standard Methods for the Examination of Dairy Products" and AOAC as they support the 1965 Grade A Pas teurized Milk Ordinance and the National Conference on Interstate :Milk Shipments are emphasized .
Considerable time is spent in the laboratory. E ach technique is accompanied by a lecture to present the test in detail; manipulations or factors which are
NEW! LIQUID
SUD'N Is Now
Available
• Phosphate
Free
• Biodegradable
• Non Polluting
TODAY it's Free rinsing SUD'N for brush and ultra-sonic washing of all laboratory glassware, missle and other space t:omponents . .. used wherever t he ultimate· in cleaning is essential ... where anything less wo uld be too expensive.
CLEANS COMPLETELY . . .
® RINSES freely without film or residue even in COLD WATER. TRY SUD'N. Contact your Sep-Ko dealer or write
SEP-KO CHEMICALS, INC. 3!100 J acl\son St. , 1\" .E . )fl n neapoli s , 1\ Un n . 55421
likely to cause variations in the results are pointed out to enable the technician to achieve a greater degree of standardization.
The course is scheduled for ovember 15-19, 1971 in Cincinnati, Ohio.
Applications should be sent to: Cincinnati Training Facility, F ood and Drug Administration, 1090 Tusculum A venue, Cincinnati, Ohio 4522().
Ta naco Plastic Plug Sanitary Va lves given Honors in Putm an F OOD A wards
N 0
----
G A L L
# 316 St ainless Body and parts w ith t he Indust ry Approved TANACO PLASTIC PLUG.
Guaranteed Leakproof!
TANACO PRODUCTS 2825 Benedict St ., Los Angeles, Cal. 90039
INDEX TO ADVERTISERS
N 0 s T I c K
Babson Bros. , Co. ___ _____ _____ __ ____ _ Back Cover IAMFE S, Inc. ____________ ____ ___ ___ ___ _____ I , IV
Pennwalt Corporation ___ __ _____ Inside Front Cover Sep-Ko Chemicals, Inc. _____ ____ ___ ___ ___ ____ _466 Tanaco Products __ __ ___ __ _____ _____ ________ _ _466
The Haynes :tvifg. Co. __ ___ _____ Inside Back Cover
CLAS-SIFIED ADS FOR SAL E
Single Service milk sample tub;s. F~r further in-formation and a catalogue please wnte, Da1ry Technology Inc ., P. 0 . Box 101, Eugene, Oregon 97401.
III

+·-··-··-··-·M-II-II-·ft-·l-ll-~1-ll-ll-11-ll-ll-ll-ll-11-ll-ll-ll-ll-ll-ll-ll-ll-11-ll-11- l-ll-ll-ll-ll-ll-ll-ll-ll-ll-lt-
l + j A pplication for M embersltip i l INTERNATIONAL ASSOCIATION OF MILK, FOOD & ENVIRONMENTAL l
SANITARIANS, INC. ! Box 437, Shelbyville, Indiana 46176 !!
Name -------- - ----------- -- - --- - ----- - - -------- ------- -------- ----------- -- --- -Date Please Print
Address _____ - - -------- - ---- ------ - ----- ____ __ __ - - -- --- --------- __ - --------- - - 0 Renewal
------------- - --------------------------------- --- Zip Code ----------- ------ 0 New
Business Affiliation - - -------------------- --------------- ----------------- - ---- 0 Re-instatement
Direct Member Annual Dues $14.00 0 Check 0 Cash Membership Through An Affiliate-$12.00 Plus Affiliate Dues
Student Mem bership $4.00 (Membership Includes Subscription to Journal of Milk & Food Technology.)
Recommended by
Shelbyville, Ind. Box 437
Please Print
Subscription Order JOURNAL OF MILK & FOOD TECHNOLOGY
(Monthly Publication)
Name __ _ ----------- --- - - -- ___ ____ ______ _________ __ __ - - --------- - --------- ----- - Date Please Print
Address ----- -- --- - - - -- -- --------- - -- - ---- --- ---- - -------------- - ------------- 0 New
0 Renewal
Educational Institution & Public Libraries (Annually) $12.00 0 Check 0 Cash
Individual Non-Member Subscription (Annually) $14.00 Government Agencies, Commercial Organizations
I.A.M.F.E.S. & J.M.F.T. Box 437, Shelbyvi lie, Ind. Change of Address
FROM Name _________ __________________ _____ _____________ - ----- - ----------- --------··- - Date
Please Print
Address -- --- --------------------- - ----- ---------- - ------- ----- - ---- - -- - ------- -
TO Name
Please Print
Address ---- - ---- -- ----- - ----------- - ----------- - -- -- -------------- ------ -- - - ---I.A.M.F.E.S. & J.M.F.T.
Box 437, Shelbyville, Ind. Order for 3A Standards Name _____ ____________ ___ _______ ____________ ------ - ------- ___________________ __ Date
Please Print
Address
( ) Complete Set @ <!=5 .50 = ________ ( ) Complete set ~o 11 nd (durable cover) @ $7.00 = _______ _ ( ) Revised HTST Std.- without cover = $1.50 F.O.B. Shelbyville, Ind. ( ) Revised HTST Std.-25 or more = $1.00 each F.O.B. Shelbyville, Ind. ( ) E-3-A Sanitary Standa rds- Set Unbound @ $1.25 = _______ _
3-A Accepted Practices For Milking Machines 1-100 = 25c ea.; 100-1000 = 20c ea.; 1000 or more = 15c ea. 5 Year Service on Standards as Published = $6.00 additional
Orde1· for Reprints of Articles
Amt. ___ - - --------- ____ Title ___ ____ ___ ___________ ___ ______ ______ -------- - --- -- -
Schedule of letterpress prices for reprints within 30 days after pub lication, F.O.B. Shelbyville, Indiana
100 or less Add'l 100's
1 Page 2 Pages 3 & 4 Pages 6 & 8 Pages 12 Pages $19.50 $23.40 $32.80 $46.80 $78.00
2.40 3.00 5.00 6.60 10.80 After 30 Days Offset Reprint prices add $2.00 per page
Cover $33.60
5.50
-s"•- ••-••- ••- ••- ••-••-••- ••-••- •--••-••-••-••-••-••- ••-wa- ••- ••- ••- w• - ••- ••- ••- ••- ••- ••- ••- ••- ••- ••- ••- •11- ••- ••-••-••-••-•'ft
IV
,
,
•• t

I
·' )
.· .. ·.. ~nl\ / ;/'/
( >Hd!J'~~·fll) ;. : .. / .// S Pflj-' U.S. P. LIQUID PETROLATUM SPRAY
U.S.P. UNITED STATES PHARMACIUTICil STIHOAROS CONTAINS NO ANIMAL OR VEGETABLE FATS. ABSOLUTELY NEUTRAL. WILL NOT TURN RANCID- CONTAMINATE OR TAINT WHEN IN CONTACT WITH FOOD PRODUCTS.
~ SANITARY-PURE
.e _ODORLESS-TASTELESS
of NON -TOXIC
Tim fi!te U<i6t-Mle HAYNES-SPRAY 3~fteMe4~~: SANITARY VALVES HOMOGENIZER PISTONS - RINGS SANITARY SEALS & PARTS CAPPER SLIDES & PARTS POSITIVE PUMP PARIS GLASS & PAPER FILLING MACHINE PARTS and for All OTHER SANITARY MACHINE PARTS whkh are cleaned doily.
Tlce lf(ederm HAYNES -SPRAY lf(eflcd ~ .£~ c~~ Mlifk t~~e milk o~ aH4 CDde R~ luj tile U. S. Pill& He«ftk Sewiee
The Haynes -Spray eliminates the danger af cantaminat ion which is poss ible by old fashioned lubricating methods. Spreading lubricants by the use of the finger method may entirely destroy previous bactericidal treatment of equipment.
PACK ED-6-1 2 oz. CANS PER CARTON SHIPPING WEIGHT - ? lBS.
' THE HAYNES MANUFACTURING COMPANY t 4180 LORAIN AVENUE • CLEVELAND, OHIO 44113
Gasket Color ••• slightly off-while
*MADE FROM
TEFLON® " Tke Sopki6tiooled G~ket II THE IDEAL UNif'N SEAL FOR
BOTH VACUUM AND PRESSURE LINES
SNAP-TITE self-centering gaskets of TEFLON are designed for all standard bevel seal sanitary fillings. They SNAP inlo place provid· ing self-alignment and ease of assembly and disassembly. HAYNES SNAP-TITES of TEFLON are unaffected by cleaning solu· t ions, steam and solvents, They will not embrittle at temperatures as l~w as minus 200° F. and are impervious to heal up to 500 ° F.
FOR A FITTING GASKET THAT WILL OUT-PERFORM All OTHERS.N
S~~y ... HAYNES SNAP-liTES of TEFLON e Tf110N ACCE,TED SAFE FOR USE ON FOOD & PROCESSING
EOU,MENT 8Y U. S. FOOD AND DRUG ADMINISTRATION
• Gaskets made of DuPont TEFLON <!> TFE-FLUOROCARBON RESINS
THE HAYNES MANU FACTURING COMPANY 4180 LORAIN AVENUE • CLEVELAND, OHIO 44113
DESIGNED TO SNAP INTO
FITTINGS LEAK-PREVENTING
NEOPRENE GASKET lo~ Sanitary Fittings
~ tk4e $NA1'!ti~E rl~~ Tight joints, no leaks, no shrinkage
Sanitary, unaffected by heat or fats
Non .. porous, no seams or crevices
Odorless, polished surfaces, easily cleaned
Withstand sterilization
Time-saving, easy to assemble Self-centering No sticking to fittings
Eliminate line blocks Help overcome line vibrations
long life, use over and over
Aroiloble lor J", JY.t", 2•, 2Y.tn and 3" fitting1.
Packed 100 Ia the box. Order through your dairy supply house.
THE HAYNES MANUFACTURING CO. 418 0 Lorain Avenue • ClevelanCI 13, Ohio
Available in bolh SPRAY AND TUBE
All lubri- Film ingredients are
approved additives and can be
safely utilized as a lubricant for
food processing equipment when
used in compliance with existing
food additive regulations.
ESPECIALLY DEVELOPED FOR LUBRICATION OF FOOD
PROCESSING AND PACKAGING EQUIPMENT
For Use in Dairies- Ice Cream Plants- Breweries
Beverage Plants- Bakeries- Canneries- Packing Plants
SANITARY • NON TOXIC • ODORLESS • . TASTELESS SPRAY- PACKED 6- 16 OZ. CANS PER CARTON TUBES- PACKED 12-4 OZ. TUBES PER CARTON
THE HAYNES MANU'f A.CTURING co. CLEVELAND OHIO 44113

No leaks - easily cleaned - maintenance free permanent - welded by Surg~
Welded milk lines are available from your Surge Dealer, wherever you may dairy in the United States or Canada. A concept proven in milk processing plants and on the dairy in localized areas for more than 15 years is now offered by Surge Dealers everywhere.
Expansion and contraction of the milk line along with gasket aging in conventional couplings can cause cracks and leaks. Cracks rep-
t
resent contamination sources and leaks are detrimental to milk quality and efficient milking. Welded lines can eliminate these problems.
All welded lines installations are subject to the approval of local regulatory authorities.
Thorough, efficient cleaning, which results in a higher quality milk product, is of interest to everyone- dairymen, sanitation specialists, dairy plant fieldmen, and consumers.
SURGE ... the accent is on YOU
BABSON BROS. CO., OAK BROOK, ILLINOIS BABSON BROS. CO., {Canada) LTD., PORT CREDIT, ONTARIO
,
;. I
,


![[1971: T.N.Act 8] THE TAMIL NADU AGRICULTURAL ...](https://static.fdokumen.com/doc/165x107/63171366c72bc2f2dd055383/1971-tnact-8-the-tamil-nadu-agricultural-.jpg)