Sensory functionality of extra-virgin olive oil in vegetable foods ...
10
Sensory functionality of extra-virgin olive oil in vegetable foods assessed by Temporal Dominance of Sensations and Descriptive Analysis Caterina Dinnella a , Camilla Masi a , Gianpaolo Zoboli b , Erminio Monteleone a,⇑ a Department of Agricultural Biotechnology, University of Florence, Italy b ADACTA International, Corso Vittorio Emanuele 122, 80121 Napoli, Italy article info Article history: Received 24 October 2011 Received in revised form 23 February 2012 Accepted 21 April 2012 Available online 30 April 2012 Keywords: Liking Freshness Consumer test Tomato Bean abstract Current methods used to classify extra-virgin olive oils into sensory quality categories involve evaluation of oils on their own and thus do not take into account the actual conditions that consumers often expe- rience them, that is, mixed with other foods. Descriptive Analysis (DA) and Temporal Dominance of Sen- sations (TDS) methods were used to assess the impact of two Italian extra-virgin olive oils with different sensory properties (oil A from Tuscany and oil B from Garda lake region) on the perceived sensory profiles of pureed beans and tomatoes. Both descriptive data and TDS curves showed that the addition of olive oils strongly influenced the sensory properties of tomato and bean samples by modifying the intensity and the dominance rate of their characteristic attributes (suppression of sourness and watery character of tomato and suppression of metallic flavour and creaminess in bean samples) and/or by contributing new sensations, peculiar for each oil (bitterness and grassy flavour for oil A and unripe fruit flavour for oil B). Modifications of the sensory properties of tomatoes induced by oils also affected consumers’ hedo- nic responses in terms of liking and perceived freshness. Furthermore, no relationships have been found between liking and freshness ratings for oil and those reported for the combination of oil with tomato or bean purees. Ó 2012 Elsevier Ltd. All rights reserved. 1. Introduction The perceived sensory profile of a food depends on complex interactions between several different factors. Omitting those re- lated to extrinsic food properties, such as expectation, context and individual physiological variation of perceptual abilities, and only considering the intrinsic factors related to its chemical com- position, the network of interactions taking place in the context of food perception still remains extremely complex (Delwiche, 2003). When a single sensory modality, such as taste, is considered, at least three levels of interaction can be defined for a multiple stimuli mixture (Keast & Breslin, 2002). There are chemical interac- tions, leading to structural, composition or physical modifications of molecules; oral physiological interactions, related to the poten- tial for one compound to interfere with taste receptor cells or taste transduction mechanisms associated with another compound and there are cognitive interactions, related to the central processing of signals induced by different sapid compounds. Also, how these var- ious interactions affect the perceived intensity of tastes does not follow a general rule. In fact, enhancement, suppression and asymmetrical intensity shifts can take place as a function of sapid compound concentrations and of their taste quality. Different sensory modalities can interact with each other thus resulting in synesthetic experiences, whereby the stimulation of one sensory modality gives rise to a perceptual experience in an- other sensory modality (Robertson & Sagiv, 2005). In the context of food perception, flavour represents one of the most well known examples of multisensory integration (Awray & Spence, 2008). The ability of odours to modify tastes depends on the sensory quality of the stimuli and on their relevant concentration/intensity. Mixing congruous odour and taste stimuli can induce enhancement while mixing incongruous stimuli can result in suppression of taste intensity (Caporale, Policastro, & Monteleone, 2004; Pfeiffer, Hort, Hollowood, & Taylor, 2006; Stevenson, Prescott, & Boakes, 1999). The modification of taste quality by odour seems to be a conse- quence of learning from previous instances of co-exposure such as might naturally occur during eating (Prescott, Johnstone, & Fran- cis, 2004). Moreover, the intensity of flavour perception can be dri- ven by the concentration/intensity of only one of the flavour components (Davidson, Linforth, Hollowood, & Taylor, 1999). As well as taste and smell, stimulation of the trigeminal and somato- sensory systems by chemical irritation, temperature, texture and consistency of foods are able to influence the overall perception of flavour. For example, a decrease in both taste and flavour inten- sity ratings has been found when solution viscosity is increased 0950-3293/$ - see front matter Ó 2012 Elsevier Ltd. All rights reserved. http://dx.doi.org/10.1016/j.foodqual.2012.04.013 ⇑ Corresponding author. Address: Dipartimento di Biotecnologie Agrarie, Via Donizetti, 6, 51144 Firenze, Italy. Tel.: +39 055 3288470; fax: +39 055 3288488. E-mail address: erminio.monteleone@unifi.it (E. Monteleone). Food Quality and Preference 26 (2012) 141–150 Contents lists available at SciVerse ScienceDirect Food Quality and Preference journal homepage: www.elsevier.com/locate/foodqual
-
Upload
khangminh22 -
Category
Documents
-
view
4 -
download
0
Transcript of Sensory functionality of extra-virgin olive oil in vegetable foods ...

Food Quality and Preference 26 (2012) 141–150
Contents lists available at SciVerse ScienceDirect
Food Quality and Preference
journal homepage: www.elsevier .com/locate / foodqual
Sensory functionality of extra-virgin olive oil in vegetable foods assessedby Temporal Dominance of Sensations and Descriptive Analysis
Caterina Dinnella a, Camilla Masi a, Gianpaolo Zoboli b, Erminio Monteleone a,⇑a Department of Agricultural Biotechnology, University of Florence, Italyb ADACTA International, Corso Vittorio Emanuele 122, 80121 Napoli, Italy
a r t i c l e i n f o a b s t r a c t
Article history:Received 24 October 2011Received in revised form 23 February 2012Accepted 21 April 2012Available online 30 April 2012
Keywords:LikingFreshnessConsumer testTomatoBean
0950-3293/$ - see front matter � 2012 Elsevier Ltd. Ahttp://dx.doi.org/10.1016/j.foodqual.2012.04.013
⇑ Corresponding author. Address: Dipartimento dDonizetti, 6, 51144 Firenze, Italy. Tel.: +39 055 32884
E-mail address: [email protected] (E. M
Current methods used to classify extra-virgin olive oils into sensory quality categories involve evaluationof oils on their own and thus do not take into account the actual conditions that consumers often expe-rience them, that is, mixed with other foods. Descriptive Analysis (DA) and Temporal Dominance of Sen-sations (TDS) methods were used to assess the impact of two Italian extra-virgin olive oils with differentsensory properties (oil A from Tuscany and oil B from Garda lake region) on the perceived sensory profilesof pureed beans and tomatoes. Both descriptive data and TDS curves showed that the addition of olive oilsstrongly influenced the sensory properties of tomato and bean samples by modifying the intensity andthe dominance rate of their characteristic attributes (suppression of sourness and watery character oftomato and suppression of metallic flavour and creaminess in bean samples) and/or by contributingnew sensations, peculiar for each oil (bitterness and grassy flavour for oil A and unripe fruit flavour foroil B). Modifications of the sensory properties of tomatoes induced by oils also affected consumers’ hedo-nic responses in terms of liking and perceived freshness. Furthermore, no relationships have been foundbetween liking and freshness ratings for oil and those reported for the combination of oil with tomato orbean purees.
� 2012 Elsevier Ltd. All rights reserved.
1. Introduction
The perceived sensory profile of a food depends on complexinteractions between several different factors. Omitting those re-lated to extrinsic food properties, such as expectation, contextand individual physiological variation of perceptual abilities, andonly considering the intrinsic factors related to its chemical com-position, the network of interactions taking place in the contextof food perception still remains extremely complex (Delwiche,2003). When a single sensory modality, such as taste, is considered,at least three levels of interaction can be defined for a multiplestimuli mixture (Keast & Breslin, 2002). There are chemical interac-tions, leading to structural, composition or physical modificationsof molecules; oral physiological interactions, related to the poten-tial for one compound to interfere with taste receptor cells or tastetransduction mechanisms associated with another compound andthere are cognitive interactions, related to the central processing ofsignals induced by different sapid compounds. Also, how these var-ious interactions affect the perceived intensity of tastes does notfollow a general rule. In fact, enhancement, suppression and
ll rights reserved.
i Biotecnologie Agrarie, Via70; fax: +39 055 3288488.onteleone).
asymmetrical intensity shifts can take place as a function of sapidcompound concentrations and of their taste quality.
Different sensory modalities can interact with each other thusresulting in synesthetic experiences, whereby the stimulation ofone sensory modality gives rise to a perceptual experience in an-other sensory modality (Robertson & Sagiv, 2005). In the contextof food perception, flavour represents one of the most well knownexamples of multisensory integration (Awray & Spence, 2008). Theability of odours to modify tastes depends on the sensory quality ofthe stimuli and on their relevant concentration/intensity. Mixingcongruous odour and taste stimuli can induce enhancement whilemixing incongruous stimuli can result in suppression of tasteintensity (Caporale, Policastro, & Monteleone, 2004; Pfeiffer, Hort,Hollowood, & Taylor, 2006; Stevenson, Prescott, & Boakes, 1999).The modification of taste quality by odour seems to be a conse-quence of learning from previous instances of co-exposure suchas might naturally occur during eating (Prescott, Johnstone, & Fran-cis, 2004). Moreover, the intensity of flavour perception can be dri-ven by the concentration/intensity of only one of the flavourcomponents (Davidson, Linforth, Hollowood, & Taylor, 1999). Aswell as taste and smell, stimulation of the trigeminal and somato-sensory systems by chemical irritation, temperature, texture andconsistency of foods are able to influence the overall perceptionof flavour. For example, a decrease in both taste and flavour inten-sity ratings has been found when solution viscosity is increased
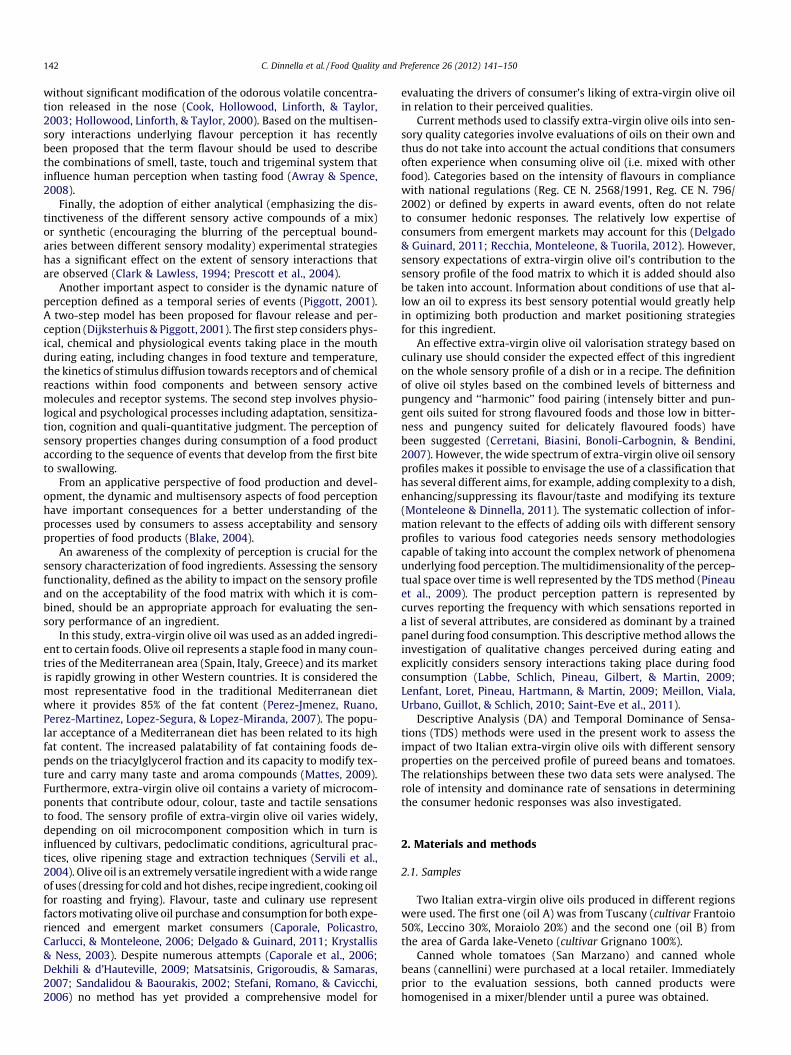
142 C. Dinnella et al. / Food Quality and Preference 26 (2012) 141–150
without significant modification of the odorous volatile concentra-tion released in the nose (Cook, Hollowood, Linforth, & Taylor,2003; Hollowood, Linforth, & Taylor, 2000). Based on the multisen-sory interactions underlying flavour perception it has recentlybeen proposed that the term flavour should be used to describethe combinations of smell, taste, touch and trigeminal system thatinfluence human perception when tasting food (Awray & Spence,2008).
Finally, the adoption of either analytical (emphasizing the dis-tinctiveness of the different sensory active compounds of a mix)or synthetic (encouraging the blurring of the perceptual bound-aries between different sensory modality) experimental strategieshas a significant effect on the extent of sensory interactions thatare observed (Clark & Lawless, 1994; Prescott et al., 2004).
Another important aspect to consider is the dynamic nature ofperception defined as a temporal series of events (Piggott, 2001).A two-step model has been proposed for flavour release and per-ception (Dijksterhuis & Piggott, 2001). The first step considers phys-ical, chemical and physiological events taking place in the mouthduring eating, including changes in food texture and temperature,the kinetics of stimulus diffusion towards receptors and of chemicalreactions within food components and between sensory activemolecules and receptor systems. The second step involves physio-logical and psychological processes including adaptation, sensitiza-tion, cognition and quali-quantitative judgment. The perception ofsensory properties changes during consumption of a food productaccording to the sequence of events that develop from the first biteto swallowing.
From an applicative perspective of food production and devel-opment, the dynamic and multisensory aspects of food perceptionhave important consequences for a better understanding of theprocesses used by consumers to assess acceptability and sensoryproperties of food products (Blake, 2004).
An awareness of the complexity of perception is crucial for thesensory characterization of food ingredients. Assessing the sensoryfunctionality, defined as the ability to impact on the sensory profileand on the acceptability of the food matrix with which it is com-bined, should be an appropriate approach for evaluating the sen-sory performance of an ingredient.
In this study, extra-virgin olive oil was used as an added ingredi-ent to certain foods. Olive oil represents a staple food in many coun-tries of the Mediterranean area (Spain, Italy, Greece) and its marketis rapidly growing in other Western countries. It is considered themost representative food in the traditional Mediterranean dietwhere it provides 85% of the fat content (Perez-Jmenez, Ruano,Perez-Martinez, Lopez-Segura, & Lopez-Miranda, 2007). The popu-lar acceptance of a Mediterranean diet has been related to its highfat content. The increased palatability of fat containing foods de-pends on the triacylglycerol fraction and its capacity to modify tex-ture and carry many taste and aroma compounds (Mattes, 2009).Furthermore, extra-virgin olive oil contains a variety of microcom-ponents that contribute odour, colour, taste and tactile sensationsto food. The sensory profile of extra-virgin olive oil varies widely,depending on oil microcomponent composition which in turn isinfluenced by cultivars, pedoclimatic conditions, agricultural prac-tices, olive ripening stage and extraction techniques (Servili et al.,2004). Olive oil is an extremely versatile ingredient with a wide rangeof uses (dressing for cold and hot dishes, recipe ingredient, cooking oilfor roasting and frying). Flavour, taste and culinary use representfactors motivating olive oil purchase and consumption for both expe-rienced and emergent market consumers (Caporale, Policastro,Carlucci, & Monteleone, 2006; Delgado & Guinard, 2011; Krystallis& Ness, 2003). Despite numerous attempts (Caporale et al., 2006;Dekhili & d’Hauteville, 2009; Matsatsinis, Grigoroudis, & Samaras,2007; Sandalidou & Baourakis, 2002; Stefani, Romano, & Cavicchi,2006) no method has yet provided a comprehensive model for
evaluating the drivers of consumer’s liking of extra-virgin olive oilin relation to their perceived qualities.
Current methods used to classify extra-virgin olive oils into sen-sory quality categories involve evaluations of oils on their own andthus do not take into account the actual conditions that consumersoften experience when consuming olive oil (i.e. mixed with otherfood). Categories based on the intensity of flavours in compliancewith national regulations (Reg. CE N. 2568/1991, Reg. CE N. 796/2002) or defined by experts in award events, often do not relateto consumer hedonic responses. The relatively low expertise ofconsumers from emergent markets may account for this (Delgado& Guinard, 2011; Recchia, Monteleone, & Tuorila, 2012). However,sensory expectations of extra-virgin olive oil’s contribution to thesensory profile of the food matrix to which it is added should alsobe taken into account. Information about conditions of use that al-low an oil to express its best sensory potential would greatly helpin optimizing both production and market positioning strategiesfor this ingredient.
An effective extra-virgin olive oil valorisation strategy based onculinary use should consider the expected effect of this ingredienton the whole sensory profile of a dish or in a recipe. The definitionof olive oil styles based on the combined levels of bitterness andpungency and ‘‘harmonic’’ food pairing (intensely bitter and pun-gent oils suited for strong flavoured foods and those low in bitter-ness and pungency suited for delicately flavoured foods) havebeen suggested (Cerretani, Biasini, Bonoli-Carbognin, & Bendini,2007). However, the wide spectrum of extra-virgin olive oil sensoryprofiles makes it possible to envisage the use of a classification thathas several different aims, for example, adding complexity to a dish,enhancing/suppressing its flavour/taste and modifying its texture(Monteleone & Dinnella, 2011). The systematic collection of infor-mation relevant to the effects of adding oils with different sensoryprofiles to various food categories needs sensory methodologiescapable of taking into account the complex network of phenomenaunderlying food perception. The multidimensionality of the percep-tual space over time is well represented by the TDS method (Pineauet al., 2009). The product perception pattern is represented bycurves reporting the frequency with which sensations reported ina list of several attributes, are considered as dominant by a trainedpanel during food consumption. This descriptive method allows theinvestigation of qualitative changes perceived during eating andexplicitly considers sensory interactions taking place during foodconsumption (Labbe, Schlich, Pineau, Gilbert, & Martin, 2009;Lenfant, Loret, Pineau, Hartmann, & Martin, 2009; Meillon, Viala,Urbano, Guillot, & Schlich, 2010; Saint-Eve et al., 2011).
Descriptive Analysis (DA) and Temporal Dominance of Sensa-tions (TDS) methods were used in the present work to assess theimpact of two Italian extra-virgin olive oils with different sensoryproperties on the perceived profile of pureed beans and tomatoes.The relationships between these two data sets were analysed. Therole of intensity and dominance rate of sensations in determiningthe consumer hedonic responses was also investigated.
2. Materials and methods
2.1. Samples
Two Italian extra-virgin olive oils produced in different regionswere used. The first one (oil A) was from Tuscany (cultivar Frantoio50%, Leccino 30%, Moraiolo 20%) and the second one (oil B) fromthe area of Garda lake-Veneto (cultivar Grignano 100%).
Canned whole tomatoes (San Marzano) and canned wholebeans (cannellini) were purchased at a local retailer. Immediatelyprior to the evaluation sessions, both canned products werehomogenised in a mixer/blender until a puree was obtained.
C. Dinnella et al. / Food Quality and Preference 26 (2012) 141–150 143
All products were evaluated alone (without oil) and in combina-tion with oil, by adding 3 g of oil to 30 g of tomato or bean pureei.e. 10% oil in the mixtures. Immediately prior to sample serving,combinations were mixed using a tea-spoon for around 15 s, untilthe oil was homogeneously dispersed as small drops in the puree.In total eight samples were considered: oil A, oil B, tomato, tomatowith oil A, tomato with oil B, bean, bean with oil A and bean withoil B.
2.2. Trained panel
Thirteen subjects, seven males and six females, aged from 21 to33 years were recruited from the students and staff of the Univer-sity of Florence. The subjects had no history of disorders in oralperception. They were paid for their participation in the study.All subjects were very familiar with extra-virgin olive oil. Writteninformed consent was obtained from each subject after thedescription of the experiment.
The subjects developed a vocabulary describing differences be-tween samples according to the Generic Descriptive Analysismethod (Lawless & Heymann, 1998). Panellists participated inthree training sessions of about 60 min each. A main list of attri-butes was developed (Table 1) which described the mouthfeel,taste and flavour of oils, tomato and bean samples, evaluated bothwith and without the two oils In order to train the panellists toevaluate the descriptors, some standards were prepared as re-ported in Table 1. All standards were prepared to induce a moder-ate intensity, corresponding to the central point of the nine pointscale. A nine point category scale labelled at the extremes with‘‘extremely weak’’ and ‘‘extremely strong’’ was used for evaluation.
2.3. Temporal Dominance of Sensations
The most relevant attributes for describing the temporal evolu-tion of sensations induced by each product were selected from themain lists by panellists. Three different lists consisting of five ornine attributes were used for TDS evaluation of oils or tomatoand bean samples, respectively (Table 1).
The panel participated to five sessions. Two sessions were per-formed for training subjects with the use of the computer systemfor TDS data acquisition. Three evaluation sessions were per-formed, each sample was replicated four times. In the first session
Table 1Sensory attributes of oils and pureed tomato and bean samples, definitions and standards
Attributes Definition Standard
FlavourBean Odour of canned white beansBitterness Bitter taste Quinine dichlorideGrassy Odour of freshly mown grass Cis-3-hexenol in sGreen olive Odour of fresh green olive pulp Fresh green olive p
crushed in seed oiMetallic Metallic taste typical of canned food FeSO4 (1.5 g/l)Peppery Leaving a burning sensation in the
oral cavity and on the tonguePungency Leaving a burning sensation in the
back of the throatSourness Sour taste Citric acid (0.25 g/Sweetness Sweet taste Sucrose (5.0 g/l)Tomato Odour canned tomatoesUnripe fruit Odour of unripe, ‘‘green’’ fruit
Mouth feelCreamy Soft and smooth textureWatery Thin, weak texture, opposite of viscous
two sample sets were evaluated in duplicate: one consisting of thetwo oil samples and the other one of the three tomato samples (to-mato without oil, tomato with oil A, tomato with oil B). Two sam-ple sets were evaluated in duplicate in the second session: oneconsisting of the oil samples and the other one of bean samples(bean without oil, bean with oil A, bean with oil B). In the third ses-sion a set consisting of tomato samples and one consisting of beansamples were evaluated in duplicate. In each session the presenta-tion order of sets was counterbalanced so that half subjects evalu-ated set 1 as first and set 2 as second whereas the other half did theopposite.
Oils (3 g) were presented in a test tube identified by a three di-git code, subjects were instructed to pour the whole test tube con-tent in a spoon for evaluation. Tomato and bean samples werepresented in plastic cups identified by a three digit code. Subjectswere instructed to thoroughly mix each sample immediately be-fore taking a spoon for the evaluation. After 8 s, subjects were ad-vised to swallow the sample. The total evaluation time was 90 s.The order of the subset presentation was randomized across sub-jects within and between subsets. The order of attributes was ran-domized between subjects and was always the same for a givenpanellist. After each sample, subjects rinsed their mouths with dis-tilled water for 30 s, had some plain crackers for 30 s and finallyrinsed their mouths with water for a further 30 s. Subjects took a10 min break between subset evaluations. All evaluations wereperformed in individual booths under red lights.
Data were recorded using the FIZZ Software Version 2.40G(Biosystemes, Couternon, France) and automatically plotted asTDS curves (Dominance Rate – DR vs evaluation time).
2.4. Descriptive analysis
A trained panel participated in three evaluation sessions. Eachsample was replicated three times. In each session the followingfive sets were evaluated: set 1 – oil samples, set 2 – tomato withoil A and B; set 3 – bean with oil A and B; set 4 – tomato withoutoil; set 5 – bean without oil. Set and sample presentations wererandomized across subjects. Evaluations were performed in thesame conditions previously described. The order of attribute eval-uation was balanced to minimize a possible ‘‘proximity’’ effect.Subjects had a five minute break between set evaluations.
(moderate intensity on a 9-point category scale).
Products Combinations
Oils Pureedtomatoes
Pureedbeans
Pureedtomatoes
Pureedbeans
– – DA/TDS – DA/TDS(0.025 g/l) DA/TDS TDS TDS DA/TDS DA/TDS
eed oil (140 ll/l) DA/TDS TDS TDS DA/TDS DA/TDSulp
l (1 g/ml)DA – – DA DA
– – DA/TDS – DA/TDSDA – – DA DA
DA/TDS TDS TDS DA/TDS DA/TDS
l) – DA/TDS – DA/TDS –– DA/TDS DA/TDS DA/TDS DA/TDS– DA/TDS – DA/TDS –DA/TDS TDS TDS DA/TDS DA/TDS
– – DA/TDS – DA/TDS– DA/TDS – DA/TDS
144 C. Dinnella et al. / Food Quality and Preference 26 (2012) 141–150
The perceived intensity of each sensation was rated on a ninepoint category scale labelled at the extremes with ‘‘extremelyweak’’ and ‘‘extremely strong’’.
2.5. Consumer test
2.5.1. SubjectsSixty-four subjects (24 males and 40 females, aged from 23 to
60) recruited in the Florence area took part in this experiment.All subjects were familiar with extra-virgin olive oils includingPDO (Protected Denomination of Origin) products. They were alsoregular consumers of extra-virgin olive oil, with a self reported fre-quency of consumption greater than once a day.
2.5.2. EvaluationsSamples were presented monadically. The order of the sample
presentation was randomized across subjects. Subjects were askedto hold the sample in their mouth for 8 s, swallow it and rate theoverall liking and freshness. Liking was rated on a 9-point hedonicscale (Peryam and Pilgrim, 1957). This fully anchored 9-point cat-egory scale ranges from 1 (‘‘dislike extremely’’– estremamente sgra-devole) to 9 (‘‘like extremely’’– estremamente gradevole), with aneutral point at 5 (‘‘neither like nor dislike’’– ne gradevole/nè sgra-devole). A 9-point category scale ranging from 1 (‘‘not at all’’) to 9(‘‘extremely’’) with a neutral point at 5 (‘‘moderately’’) was usedfor freshness ratings. After each sample, subjects rinsed theirmouths with distilled water for 30 s, had some plain crackers for30 s and finally rinsed their mouths with water for a further 30 s.Evaluations were performed in the same conditions previously de-scribed in individual booths under white lights.
2.6. Data analysis
2.6.1. TDS dataPanel performance was assessed on the frequency values with
which each attribute was selected as dominant by each subject,computed from raw software coding (1 selected; 0 not selected)(Pineau, Neville, & Lepage, 2011); for this purpose, the first 30 sof evaluation were considered. The obtained frequency values wereanalysed by multi-block PCA (Tucker-1) and by p⁄MSE plot (PanelCheck software, ver. 1.4.0, Nofima, Norway) to assess panel calibra-tion and assessor performance, respectively (Naes, Brockhoff, & To-mic, 2010). ANOVA mixed models (assessors as random effect)were used to evaluate sample effect on the frequency of attribute
Table 2Three-way-ANOVA mixed model: sample effect (F values) and mean frequency values wdynamic profile.
Bitterness Pungency Astringency Grassy Unripe fruit Sweetnes
OilOil A 0.29a 0.40 0.02 0.22a 0.07b –Oil B 0.18b 0.40 0.04 0.10b 0.28a –F1;33 4.92 – – 4.09 22.03 –
Tomatow/o Oil 0.01b 0.00b 0.02 0.00b 0.04b 0.11+oil A 0.19a 0.07a 0.01 0.08a 0.06b 0.03+oil B 0.13a 0.03b 0.02 0.06a 0.12a 0.06F2;72 6.03 7.41 – 12.07 8.05 –
Beanw/o Oil 0.00b 0.00b 0.01 0.00b 0.00b 0.08+oil A 0.11a 0.05a 0.01 0.08a 0.04b 0.07+oil B 0.05b 0.02b 0.01 0.04b 0.20a 0.06F2;72 6.52 8.08 / 8.66 41.35 /
Values followed by different letters are significantly different (p 6 0.05) F value are only
selection. The critical value of DR for a significance level of 95%in TDS curves was computed with the binomial distribution.
2.6.2. Descriptive dataA Three-way ANOVA model (assessors, sample and replicates as
fixed factors), with Fisher LDS post hoc test considered significantfor p 6 0.05, was used to validate descriptive data.
2.6.3. Consumer dataA Two-way mixed ANOVA model with subjects taken as a ran-
dom effect was used to evaluate the effect of the combination witholive oil on the sensory profile of tomato and bean samples.
Liking and freshness ratings expressed for oil A and B, toma-to + oil A and tomato + oil B, bean + oil A and bean + oil B werecompared by paired t-tests. A two-way ANOVA model was usedto estimate the effect of the combination with olive oil on likingand freshness ratings expressed for tomato and bean samples.
3. Results
3.1. Temporal Dominance of Sensations
Visual inspection of TDS curves showed that, for all products,several sensations were perceived as dominant during the first30 s of evaluation, whereas after that only one clearly dominatedeach perceived profile. The maximum value of DominanceRate (DRmax) of sensations perceived over the significance levelare reported: pungency for oils, DRmax P 62; tomato flavour,DRmax P 58 for tomato samples; bean flavour DRmax P 55 for beansamples.
The Tuker-1 test performed on these frequency values, com-puted only for tomato and bean samples, showed that their corre-lation loadings are strongly related on the first consensusdimension for eight out of nine of the considered attributes, thusindicating the panel calibration. A p⁄MSE plot of frequency valuesshowed that, with the exception of one subject who was taken outfrom further data analysis on oil samples, assessors were able todiscriminate between products using most of the attributes andto reproduce their own results amongst replicates.
The frequency with which attributes were selected as dominantduring the first 30 s of evaluation of oil, tomato and bean sampleswere independently submitted to a three-way ANOVA mixed mod-el (Table 2). No significant effect of replicates was found.
ith which attributes were selected as dominant during the first 30 evaluation sec of
s Sourness Watery Tomato Flavour Metallic Creamy Bean flavour
– – – – – –– – – – – –– – – – – –
0.32 0.17a 0.33 – – –0.23 0.1b 0.23 – – –0.23 0.1b 0.23 – – –– 4.85 – – – –
– – – 0.16a 0.15a 0.21a– – – 0.01b 0.09b 0.13b
– – – 0.01b 0.11ab 0.10b
– – – 18.41 3.79 9.12
reported for significantly different attributes (p 6 0.05).
C. Dinnella et al. / Food Quality and Preference 26 (2012) 141–150 145
Bitterness and grassy flavour frequency values were signifi-cantly higher in oil A than in oil B, while unripe fruit was selectedas a dominant flavour more frequently in oil B than in oil A.
The combination of tomatoes with either oil caused a significantincrease in the frequency with which bitter taste and grassyflavour were selected as dominant sensations, while inducing a de-crease in watery frequency values. Furthermore, in tomato sam-ples, oil A induced a significant increase in pungency frequencyvalues and oil B a significant increase in unripe fruit flavour.
The combination of beans with either oil induced a significantdecrease in frequency values for creamy, metallic and bean flavour.Moreover, frequency values in bean puree + oil A induced a signif-icant increase in bitterness, pungency and grassy flavour and withoil B an increase in unripe fruit flavour.
The panel’s performance was considered reliable in view of thegeneral results from the frequency value analysis.
Examples of dynamic sensory profiles, represented by TDScurves, are shown in Figs. 1–3. Based on the binomial distribution,the critical values of DR for a significance level of 95% resulted in17% when thirteen subjects performed the evaluation using nineattributes, such as in the case of tomato and bean samples; and29% when twelve subjects and five attributes were considered,such as in the case of oil samples.
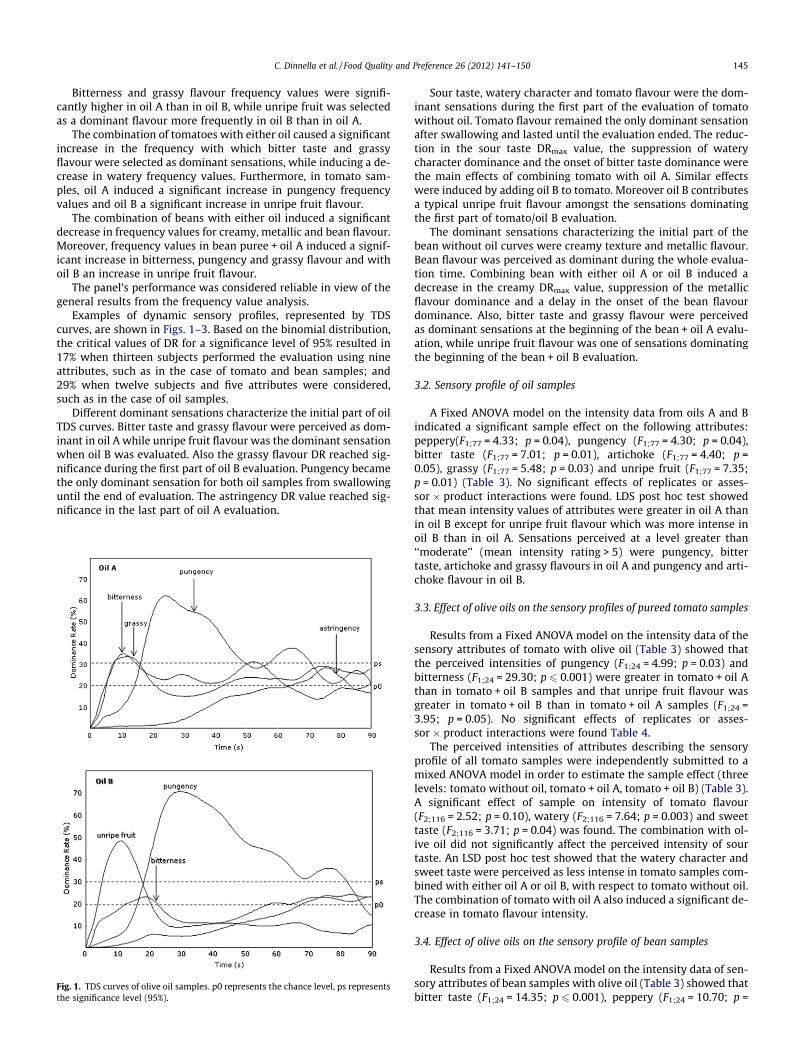
Different dominant sensations characterize the initial part of oilTDS curves. Bitter taste and grassy flavour were perceived as dom-inant in oil A while unripe fruit flavour was the dominant sensationwhen oil B was evaluated. Also the grassy flavour DR reached sig-nificance during the first part of oil B evaluation. Pungency becamethe only dominant sensation for both oil samples from swallowinguntil the end of evaluation. The astringency DR value reached sig-nificance in the last part of oil A evaluation.
Fig. 1. TDS curves of olive oil samples. p0 represents the chance level, ps representsthe significance level (95%).
Sour taste, watery character and tomato flavour were the dom-inant sensations during the first part of the evaluation of tomatowithout oil. Tomato flavour remained the only dominant sensationafter swallowing and lasted until the evaluation ended. The reduc-tion in the sour taste DRmax value, the suppression of waterycharacter dominance and the onset of bitter taste dominance werethe main effects of combining tomato with oil A. Similar effectswere induced by adding oil B to tomato. Moreover oil B contributesa typical unripe fruit flavour amongst the sensations dominatingthe first part of tomato/oil B evaluation.
The dominant sensations characterizing the initial part of thebean without oil curves were creamy texture and metallic flavour.Bean flavour was perceived as dominant during the whole evalua-tion time. Combining bean with either oil A or oil B induced adecrease in the creamy DRmax value, suppression of the metallicflavour dominance and a delay in the onset of the bean flavourdominance. Also, bitter taste and grassy flavour were perceivedas dominant sensations at the beginning of the bean + oil A evalu-ation, while unripe fruit flavour was one of sensations dominatingthe beginning of the bean + oil B evaluation.
3.2. Sensory profile of oil samples
A Fixed ANOVA model on the intensity data from oils A and Bindicated a significant sample effect on the following attributes:peppery(F1;77 = 4.33; p = 0.04), pungency (F1;77 = 4.30; p = 0.04),bitter taste (F1;77 = 7.01; p = 0.01), artichoke (F1;77 = 4.40; p =0.05), grassy (F1;77 = 5.48; p = 0.03) and unripe fruit (F1;77 = 7.35;p = 0.01) (Table 3). No significant effects of replicates or asses-sor � product interactions were found. LDS post hoc test showedthat mean intensity values of attributes were greater in oil A thanin oil B except for unripe fruit flavour which was more intense inoil B than in oil A. Sensations perceived at a level greater than‘‘moderate’’ (mean intensity rating > 5) were pungency, bittertaste, artichoke and grassy flavours in oil A and pungency and arti-choke flavour in oil B.
3.3. Effect of olive oils on the sensory profiles of pureed tomato samples
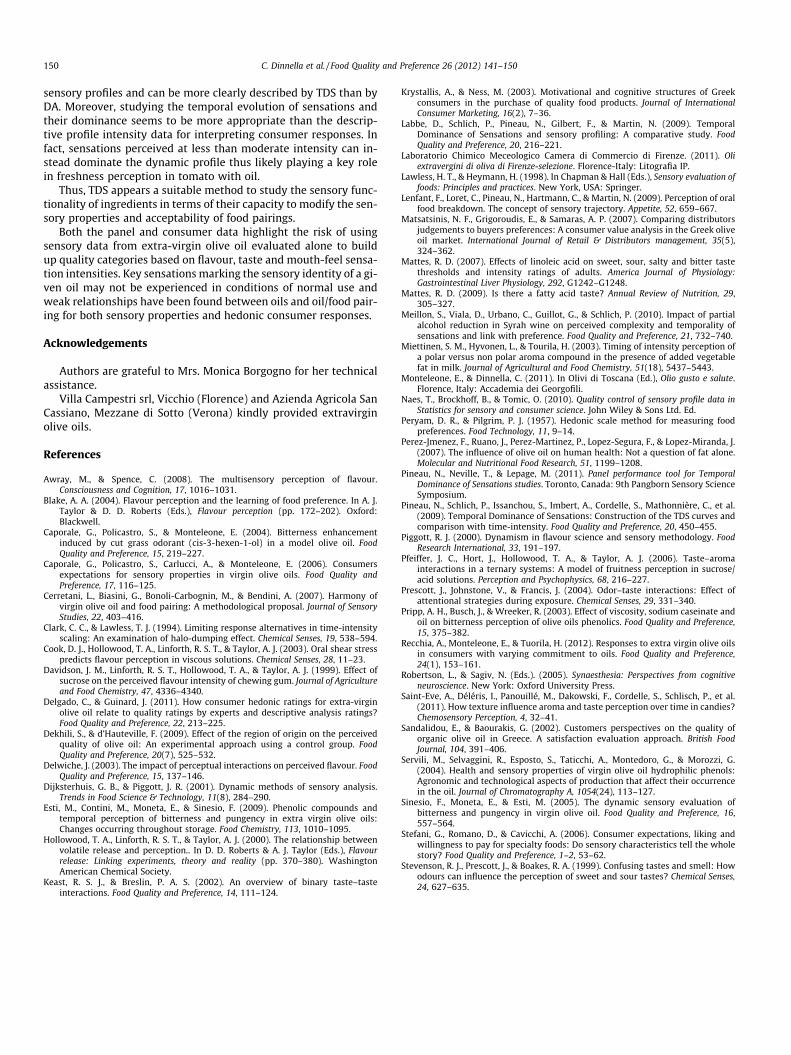
Results from a Fixed ANOVA model on the intensity data of thesensory attributes of tomato with olive oil (Table 3) showed thatthe perceived intensities of pungency (F1;24 = 4.99; p = 0.03) andbitterness (F1;24 = 29.30; p 6 0.001) were greater in tomato + oil Athan in tomato + oil B samples and that unripe fruit flavour wasgreater in tomato + oil B than in tomato + oil A samples (F1;24 =3.95; p = 0.05). No significant effects of replicates or asses-sor � product interactions were found Table 4.
The perceived intensities of attributes describing the sensoryprofile of all tomato samples were independently submitted to amixed ANOVA model in order to estimate the sample effect (threelevels: tomato without oil, tomato + oil A, tomato + oil B) (Table 3).A significant effect of sample on intensity of tomato flavour(F2;116 = 2.52; p = 0.10), watery (F2;116 = 7.64; p = 0.003) and sweettaste (F2;116 = 3.71; p = 0.04) was found. The combination with ol-ive oil did not significantly affect the perceived intensity of sourtaste. An LSD post hoc test showed that the watery character andsweet taste were perceived as less intense in tomato samples com-bined with either oil A or oil B, with respect to tomato without oil.The combination of tomato with oil A also induced a significant de-crease in tomato flavour intensity.
3.4. Effect of olive oils on the sensory profile of bean samples
Results from a Fixed ANOVA model on the intensity data of sen-sory attributes of bean samples with olive oil (Table 3) showed thatbitter taste (F1;24 = 14.35; p 6 0.001), peppery (F1;24 = 10.70; p =
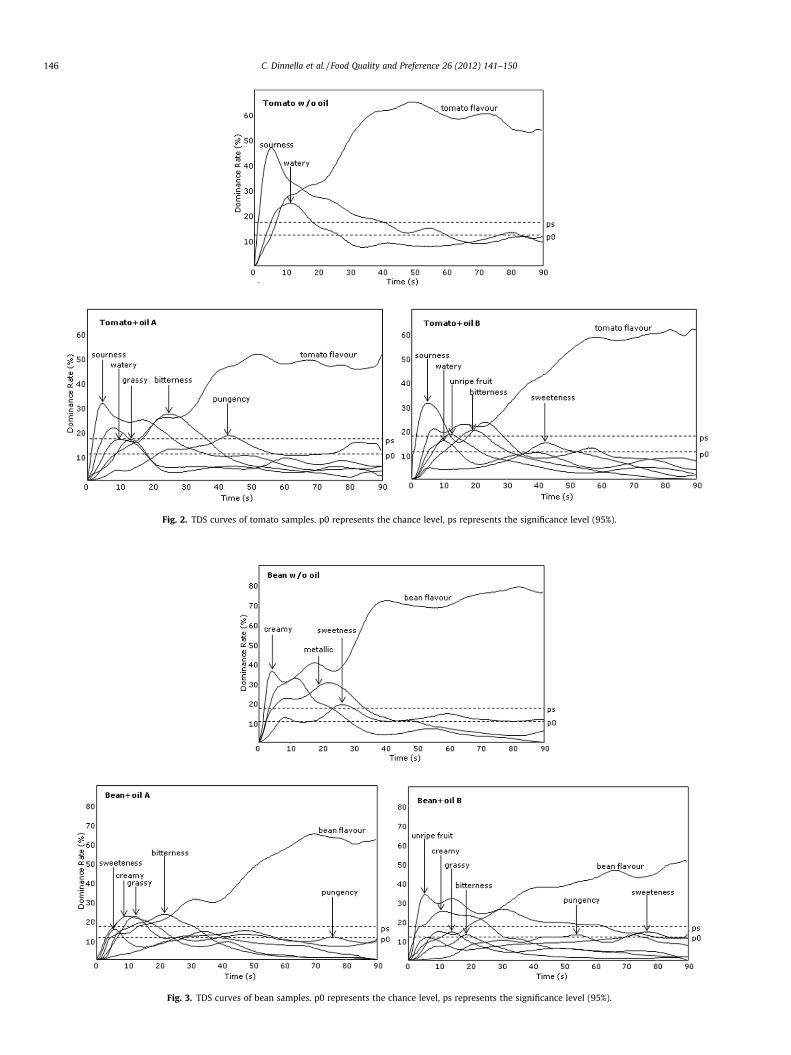
Fig. 2. TDS curves of tomato samples. p0 represents the chance level, ps represents the significance level (95%).
Fig. 3. TDS curves of bean samples. p0 represents the chance level, ps represents the significance level (95%).
146 C. Dinnella et al. / Food Quality and Preference 26 (2012) 141–150

Table 3Three-way-ANOVA fixed model: Sensory profile of extra virgin olive oil A and B: mean intensity scores and F values.
Oil Bitterness Peppery Pungency Astringency Grassy Unripe fruit Artichoke Green Olive
Oil A 5.37a 6.97a 4.43a 3.69 6.17a 3.09b 6.45a 4.72Oil B 4.27b 6.07b 3.48b 3.92 4.73b 4.13a 5.19b 4.85F1;24 7.24 4.33 4.30 – 5.48 7.35 4.40 –
Different letters indicate significantly different values (p 6 0.050). F value are only reported for significantly different attributes (p 6 0.05).
C. Dinnella et al. / Food Quality and Preference 26 (2012) 141–150 147
0.003), artichoke (F1;247 = 11.34; p = 0.003) and grassy (F1;24 =26.13; p 6 0.001) flavours were perceived as more intense in bea-n + oil A than in bean + oil B samples, whereas the intensity of un-ripe fruit flavour was greater in bean + oil B than in bean + oil A(F1;24 = 27.85; p 6 0.001). No significant effects of replicates orassessor � product interactions were found.
The perceived intensities of attributes describing the sensoryprofile of all bean samples were independently submitted to amixed ANOVA model in order to estimate the sample effects (threelevels: bean without oil, bean + oil A, bean + oil B) (Table 3). Signif-icant effects of sample on intensity of bean (F2;116 = 4.26; p = 0.03)and metallic (F2;116 = 12.12; p < 0.001) flavour and on sweet taste(F2;116 = 5.03; p = 0.01) were found. The combination with olive oildid not significantly affect perceived intensity of the creamy attri-bute. A LSD post hoc test showed that bean and metallic flavoursand sweet taste were perceived as less intense in bean samples com-bined with either oil A or oil B, compared to beans without oil.
3.5. Effect of olive oils on liking and freshness ratings of pureed tomatoand bean samples
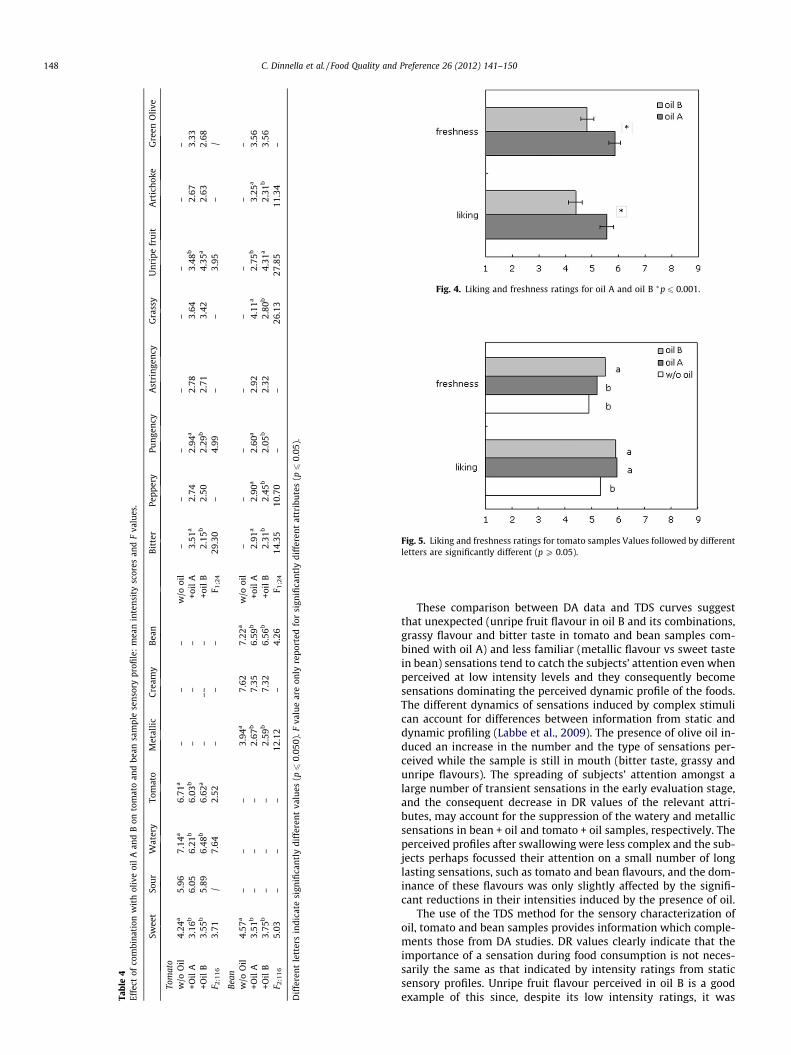
Consumers’ liking and freshness ratings for olive oils A and Bwere compared (Fig. 4). A paired t-test indicated that oil A is moreliked (t63;1.99 = 3.53; p 6 0.001) and perceived as fresher(t63;1.99 = 3.90; p 6 0.001) than oil B.
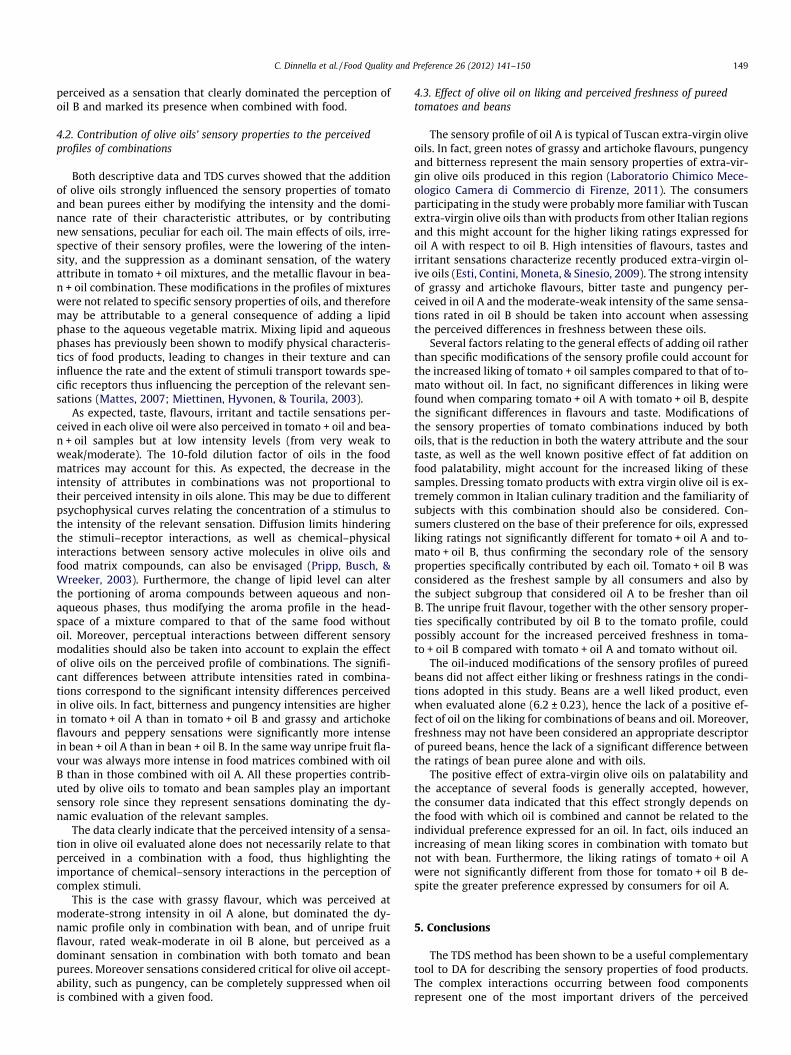
A two-way ANOVA model was used to estimate the sample ef-fect (three levels: without oil, +oil A, +oil B) on liking and freshnessratings of tomato and bean samples (Fig. 5). A significant effect wasfound for tomato liking (F2;126 = 6.45; p = 0.002). An LSD post hoctest indicated a significant increase in liking for tomato combinedwith either oil A or oil B compared to tomato without oil. The AN-OVA indicated that tomato combined with oil B was perceived asfresher than both tomato without oil and tomato + oil A (F2;126 =5.17; p = 0.007). No significant sample effects were found for thebean samples.
The effect of liking and freshness expressed for oils alone, on lik-ing and freshness expressed for tomato combinations, was furtherinvestigated. The arithmetic difference between liking for oil A andfor oil B was computed for each subject, two groups of subjectswere selected, one consisting of subjects preferring oil A (clusterAlik:liking oil A – liking oil B P 1; n = 36) and the other consistingof subjects preferring oil B (cluster Blik liking oil A – liking oilB 6 �1; n = 19). Similarly, two clusters of consumers were selectedon the basis of their freshness ratings. One cluster considered oil Afresher than oil B (cluster Afrs: freshness oil A – freshness oil B P 1;n = 42) and the other cluster considered oil B fresher than oil A(cluster Bfrs:freshness oil A – freshness oil B 6 �1; n = 14).
The B clusters were not submitted to further analysis given thesmall number of subjects.
Liking and freshness ratings expressed by the A clusters for to-mato + oil samples were independently compared by paired t-test.No significant difference was found between liking expressed fortomato + oil A and tomato + oil B samples, whereas freshness rat-ings of tomato + oil B were significantly greater than those ex-pressed for tomato + oil A (t41;2.02 = �2.61; p = 0.013). The resultsindicate that consumers’ liking and freshness ratings for oils do
not influence their liking for and perceived freshness of tomatoin combination with olive oil.
4. Discussion
4.1. Descriptive Analysis vs TDS curves
Available tools, such as TDS difference curves, are not alwayssuitable for panel validation in dynamic sensory profile evalua-tions. Computing the frequency values proved to be a useful ap-proach for assessing panel calibration and assessor performanceespecially when several sensations are perceived as dominant dur-ing the same time interval (Pineau et al., 2011). In this study, theresults from data analysis of frequency values computed on thefirst 30 s of evaluation, showed significant differences amongstthe selection of dominant attributes in the oil, tomato and beansamples.
Previous studies have demonstrated a good agreement be-tween DA data and TDS curves in model food products (Labbeet al., 2009; Saint-Eve et al., 2011) and this was confirmed in oliveoil samples where attributes with mean intensity ratings greaterthan 5, moderate, (pungency, bitter taste and grassy flavour) werealso the dominant sensations in the oils. The only exception wasunripe fruit flavour, which was the most dominant flavour in oilB; in fact the mean intensity rating of this attribute in oil Bwas less than 5 (4.13 ± 0.41) and was not significantly differentfrom those expressed for grassy flavour (4.73 ± 0.40) and bittertaste (4.27 ± 0.37). Unripe fruit is an uncommon flavour of Tuscanextra-virgin olive oils (Laboratorio Chimico Meceologico Cameradi Commercio di Firenze, 2011) consequently, it may have caughtmore of the subjects’ attention than the very well known grassyand bitter notes. Moreover, TDS curves clearly showed the differ-ent dynamics of the perception of stimuli, with taste and flavourperceived as dominant when the sample is in the mouth and theirritant sensations dominating after swallowing (Sinesio, Moneta,& Esti, 2005).
The consistent relationship between TDS curves and DA datawas confirmed in this study for tomato and bean samples, wheremost of the sensations dominating the dynamic sample profilewere also the attributes rated with an intensity P 5. However,the watery attribute and the metallic taste in tomato and beansamples, respectively, do not show such a relationship. The wateryattribute did not reach a significant DR value in tomato samplescombined with either oil even though it was perceived at astrong-moderate intensity (6.22 ± 0.23 in tomato + oil A;6.49 ± 0.23 in tomato + oil B) whereas the metallic flavour wasone of the perceived sensations dominating the bean without oilsample, despite being rated lower than moderate intensity(3.94 ± 0.36) and less intense than sweet taste (4.92 ± 0.28). Somespecific flavours and tastes contributed by olive oils to the descrip-tive profile of tomato and bean combinations with oil were per-ceived as dominant sensations despite their weak–weak/moderate perceived intensity; this was also the case with bittertaste (tomato + oil A: 3.40 ± 0.38; bean + oil A: 2.9 ± 0.32), grassy(tomato + oil A: 3.64 ± 0.35; bean + oil A: 4.10 ± 0.4) and unripefruit (tomato + oil B: 4.35 ± 0.3; bean + oil B: 4.30 ± 0.36) flavours.
Tabl
e4
Effe
ctof
com
bina
tion
wit
hol
ive
oil
Aan
dB
onto
mat
oan
dbe
ansa
mpl
ese
nsor
ypr
ofile
:m
ean
inte
nsit
ysc
ores
and
Fva
lues
.
Swee
tSo
ur
Wat
ery
Tom
ato
Met
alli
cC
ream
yB
ean
Bit
ter
Pepp
ery
Pun
gen
cyA
stri
nge
ncy
Gra
ssy
Un
ripe
fru
itA
rtic
hok
eG
reen
Oli
ve
Tom
ato
w/o
Oil
4.24
a5.
967.
14a
6.71
a–
––
w/o
oil
––
––
––
––
+Oil
A3.
16b
6.05
6.21
b6.
03b
––
–+o
ilA
3.51
a2.
742.
94a
2.78
3.64
3.48
b2.
673.
33+O
ilB
3.55
b5.
896.
48b
6.62
a–
–––
+oil
B2.
15b
2.50
2.29
b2.
713.
424.
35a
2.63
2.68
F 2;1
16
3.71
/7.
642.
52–
––
F 1;2
429
.30
–4.
99–
–3.
95–
/
Bean
w/o
Oil
4.57
a–
––
3.94
a7.
627.
22a
w/o
oil
––
––
––
––
+Oil
A3.
51b
––
–2.
67b
7.35
6.59
b+o
ilA
2.91
a2.
90a
2.60
a2.
924.
11a
2.75
b3.
25a
3.56
+Oil
B3.
75b
––
–2.
59b
7.32
6.56
b+o
ilB
2.31
b2.
45b
2.05
b2.
322.
80b
4.31
a2.
31b
3.56
F 2;1
16
5.03
––
–12
.12
–4.
26F 1
;24
14.3
510
.70
––
26.1
327
.85
11.3
4–
Dif
fere
nt
lett
ers
indi
cate
sign
ifica
ntl
ydi
ffer
ent
valu
es(p6
0.05
0).F
valu
ear
eon
lyre
port
edfo
rsi
gnifi
can
tly
diff
eren
tat
trib
ute
s(p6
0.05
).Fig. 4. Liking and freshness ratings for oil A and oil B ⁄p 6 0.001.
Fig. 5. Liking and freshness ratings for tomato samples Values followed by differentletters are significantly different (p P 0.05).
148 C. Dinnella et al. / Food Quality and Preference 26 (2012) 141–150
These comparison between DA data and TDS curves suggestthat unexpected (unripe fruit flavour in oil B and its combinations,grassy flavour and bitter taste in tomato and bean samples com-bined with oil A) and less familiar (metallic flavour vs sweet tastein bean) sensations tend to catch the subjects’ attention even whenperceived at low intensity levels and they consequently becomesensations dominating the perceived dynamic profile of the foods.The different dynamics of sensations induced by complex stimulican account for differences between information from static anddynamic profiling (Labbe et al., 2009). The presence of olive oil in-duced an increase in the number and the type of sensations per-ceived while the sample is still in mouth (bitter taste, grassy andunripe flavours). The spreading of subjects’ attention amongst alarge number of transient sensations in the early evaluation stage,and the consequent decrease in DR values of the relevant attri-butes, may account for the suppression of the watery and metallicsensations in bean + oil and tomato + oil samples, respectively. Theperceived profiles after swallowing were less complex and the sub-jects perhaps focussed their attention on a small number of longlasting sensations, such as tomato and bean flavours, and the dom-inance of these flavours was only slightly affected by the signifi-cant reductions in their intensities induced by the presence of oil.
The use of the TDS method for the sensory characterization ofoil, tomato and bean samples provides information which comple-ments those from DA studies. DR values clearly indicate that theimportance of a sensation during food consumption is not neces-sarily the same as that indicated by intensity ratings from staticsensory profiles. Unripe fruit flavour perceived in oil B is a goodexample of this since, despite its low intensity ratings, it was
C. Dinnella et al. / Food Quality and Preference 26 (2012) 141–150 149
perceived as a sensation that clearly dominated the perception ofoil B and marked its presence when combined with food.
4.2. Contribution of olive oils’ sensory properties to the perceivedprofiles of combinations
Both descriptive data and TDS curves showed that the additionof olive oils strongly influenced the sensory properties of tomatoand bean purees either by modifying the intensity and the domi-nance rate of their characteristic attributes, or by contributingnew sensations, peculiar for each oil. The main effects of oils, irre-spective of their sensory profiles, were the lowering of the inten-sity, and the suppression as a dominant sensation, of the wateryattribute in tomato + oil mixtures, and the metallic flavour in bea-n + oil combination. These modifications in the profiles of mixtureswere not related to specific sensory properties of oils, and thereforemay be attributable to a general consequence of adding a lipidphase to the aqueous vegetable matrix. Mixing lipid and aqueousphases has previously been shown to modify physical characteris-tics of food products, leading to changes in their texture and caninfluence the rate and the extent of stimuli transport towards spe-cific receptors thus influencing the perception of the relevant sen-sations (Mattes, 2007; Miettinen, Hyvonen, & Tourila, 2003).
As expected, taste, flavours, irritant and tactile sensations per-ceived in each olive oil were also perceived in tomato + oil and bea-n + oil samples but at low intensity levels (from very weak toweak/moderate). The 10-fold dilution factor of oils in the foodmatrices may account for this. As expected, the decrease in theintensity of attributes in combinations was not proportional totheir perceived intensity in oils alone. This may be due to differentpsychophysical curves relating the concentration of a stimulus tothe intensity of the relevant sensation. Diffusion limits hinderingthe stimuli–receptor interactions, as well as chemical–physicalinteractions between sensory active molecules in olive oils andfood matrix compounds, can also be envisaged (Pripp, Busch, &Wreeker, 2003). Furthermore, the change of lipid level can alterthe portioning of aroma compounds between aqueous and non-aqueous phases, thus modifying the aroma profile in the head-space of a mixture compared to that of the same food withoutoil. Moreover, perceptual interactions between different sensorymodalities should also be taken into account to explain the effectof olive oils on the perceived profile of combinations. The signifi-cant differences between attribute intensities rated in combina-tions correspond to the significant intensity differences perceivedin olive oils. In fact, bitterness and pungency intensities are higherin tomato + oil A than in tomato + oil B and grassy and artichokeflavours and peppery sensations were significantly more intensein bean + oil A than in bean + oil B. In the same way unripe fruit fla-vour was always more intense in food matrices combined with oilB than in those combined with oil A. All these properties contrib-uted by olive oils to tomato and bean samples play an importantsensory role since they represent sensations dominating the dy-namic evaluation of the relevant samples.
The data clearly indicate that the perceived intensity of a sensa-tion in olive oil evaluated alone does not necessarily relate to thatperceived in a combination with a food, thus highlighting theimportance of chemical–sensory interactions in the perception ofcomplex stimuli.
This is the case with grassy flavour, which was perceived atmoderate-strong intensity in oil A alone, but dominated the dy-namic profile only in combination with bean, and of unripe fruitflavour, rated weak-moderate in oil B alone, but perceived as adominant sensation in combination with both tomato and beanpurees. Moreover sensations considered critical for olive oil accept-ability, such as pungency, can be completely suppressed when oilis combined with a given food.
4.3. Effect of olive oil on liking and perceived freshness of pureedtomatoes and beans
The sensory profile of oil A is typical of Tuscan extra-virgin oliveoils. In fact, green notes of grassy and artichoke flavours, pungencyand bitterness represent the main sensory properties of extra-vir-gin olive oils produced in this region (Laboratorio Chimico Mece-ologico Camera di Commercio di Firenze, 2011). The consumersparticipating in the study were probably more familiar with Tuscanextra-virgin olive oils than with products from other Italian regionsand this might account for the higher liking ratings expressed foroil A with respect to oil B. High intensities of flavours, tastes andirritant sensations characterize recently produced extra-virgin ol-ive oils (Esti, Contini, Moneta, & Sinesio, 2009). The strong intensityof grassy and artichoke flavours, bitter taste and pungency per-ceived in oil A and the moderate-weak intensity of the same sensa-tions rated in oil B should be taken into account when assessingthe perceived differences in freshness between these oils.
Several factors relating to the general effects of adding oil ratherthan specific modifications of the sensory profile could account forthe increased liking of tomato + oil samples compared to that of to-mato without oil. In fact, no significant differences in liking werefound when comparing tomato + oil A with tomato + oil B, despitethe significant differences in flavours and taste. Modifications ofthe sensory properties of tomato combinations induced by bothoils, that is the reduction in both the watery attribute and the sourtaste, as well as the well known positive effect of fat addition onfood palatability, might account for the increased liking of thesesamples. Dressing tomato products with extra virgin olive oil is ex-tremely common in Italian culinary tradition and the familiarity ofsubjects with this combination should also be considered. Con-sumers clustered on the base of their preference for oils, expressedliking ratings not significantly different for tomato + oil A and to-mato + oil B, thus confirming the secondary role of the sensoryproperties specifically contributed by each oil. Tomato + oil B wasconsidered as the freshest sample by all consumers and also bythe subject subgroup that considered oil A to be fresher than oilB. The unripe fruit flavour, together with the other sensory proper-ties specifically contributed by oil B to the tomato profile, couldpossibly account for the increased perceived freshness in toma-to + oil B compared with tomato + oil A and tomato without oil.
The oil-induced modifications of the sensory profiles of pureedbeans did not affect either liking or freshness ratings in the condi-tions adopted in this study. Beans are a well liked product, evenwhen evaluated alone (6.2 ± 0.23), hence the lack of a positive ef-fect of oil on the liking for combinations of beans and oil. Moreover,freshness may not have been considered an appropriate descriptorof pureed beans, hence the lack of a significant difference betweenthe ratings of bean puree alone and with oils.
The positive effect of extra-virgin olive oils on palatability andthe acceptance of several foods is generally accepted, however,the consumer data indicated that this effect strongly depends onthe food with which oil is combined and cannot be related to theindividual preference expressed for an oil. In fact, oils induced anincreasing of mean liking scores in combination with tomato butnot with bean. Furthermore, the liking ratings of tomato + oil Awere not significantly different from those for tomato + oil B de-spite the greater preference expressed by consumers for oil A.
5. Conclusions
The TDS method has been shown to be a useful complementarytool to DA for describing the sensory properties of food products.The complex interactions occurring between food componentsrepresent one of the most important drivers of the perceived
150 C. Dinnella et al. / Food Quality and Preference 26 (2012) 141–150
sensory profiles and can be more clearly described by TDS than byDA. Moreover, studying the temporal evolution of sensations andtheir dominance seems to be more appropriate than the descrip-tive profile intensity data for interpreting consumer responses. Infact, sensations perceived at less than moderate intensity can in-stead dominate the dynamic profile thus likely playing a key rolein freshness perception in tomato with oil.
Thus, TDS appears a suitable method to study the sensory func-tionality of ingredients in terms of their capacity to modify the sen-sory properties and acceptability of food pairings.
Both the panel and consumer data highlight the risk of usingsensory data from extra-virgin olive oil evaluated alone to buildup quality categories based on flavour, taste and mouth-feel sensa-tion intensities. Key sensations marking the sensory identity of a gi-ven oil may not be experienced in conditions of normal use andweak relationships have been found between oils and oil/food pair-ing for both sensory properties and hedonic consumer responses.
Acknowledgements
Authors are grateful to Mrs. Monica Borgogno for her technicalassistance.
Villa Campestri srl, Vicchio (Florence) and Azienda Agricola SanCassiano, Mezzane di Sotto (Verona) kindly provided extravirginolive oils.
References
Awray, M., & Spence, C. (2008). The multisensory perception of flavour.Consciousness and Cognition, 17, 1016–1031.
Blake, A. A. (2004). Flavour perception and the learning of food preference. In A. J.Taylor & D. D. Roberts (Eds.), Flavour perception (pp. 172–202). Oxford:Blackwell.
Caporale, G., Policastro, S., & Monteleone, E. (2004). Bitterness enhancementinduced by cut grass odorant (cis-3-hexen-1-ol) in a model olive oil. FoodQuality and Preference, 15, 219–227.
Caporale, G., Policastro, S., Carlucci, A., & Monteleone, E. (2006). Consumersexpectations for sensory properties in virgin olive oils. Food Quality andPreference, 17, 116–125.
Cerretani, L., Biasini, G., Bonoli-Carbognin, M., & Bendini, A. (2007). Harmony ofvirgin olive oil and food pairing: A methodological proposal. Journal of SensoryStudies, 22, 403–416.
Clark, C. C., & Lawless, T. J. (1994). Limiting response alternatives in time-intensityscaling: An examination of halo-dumping effect. Chemical Senses, 19, 538–594.
Cook, D. J., Hollowood, T. A., Linforth, R. S. T., & Taylor, A. J. (2003). Oral shear stresspredicts flavour perception in viscous solutions. Chemical Senses, 28, 11–23.
Davidson, J. M., Linforth, R. S. T., Hollowood, T. A., & Taylor, A. J. (1999). Effect ofsucrose on the perceived flavour intensity of chewing gum. Journal of Agricultureand Food Chemistry, 47, 4336–4340.
Delgado, C., & Guinard, J. (2011). How consumer hedonic ratings for extra-virginolive oil relate to quality ratings by experts and descriptive analysis ratings?Food Quality and Preference, 22, 213–225.
Dekhili, S., & d’Hauteville, F. (2009). Effect of the region of origin on the perceivedquality of olive oil: An experimental approach using a control group. FoodQuality and Preference, 20(7), 525–532.
Delwiche, J. (2003). The impact of perceptual interactions on perceived flavour. FoodQuality and Preference, 15, 137–146.
Dijksterhuis, G. B., & Piggott, J. R. (2001). Dynamic methods of sensory analysis.Trends in Food Science & Technology, 11(8), 284–290.
Esti, M., Contini, M., Moneta, E., & Sinesio, F. (2009). Phenolic compounds andtemporal perception of bitterness and pungency in extra virgin olive oils:Changes occurring throughout storage. Food Chemistry, 113, 1010–1095.
Hollowood, T. A., Linforth, R. S. T., & Taylor, A. J. (2000). The relationship betweenvolatile release and perception.. In D. D. Roberts & A. J. Taylor (Eds.), Flavourrelease: Linking experiments, theory and reality (pp. 370–380). WashingtonAmerican Chemical Society.
Keast, R. S. J., & Breslin, P. A. S. (2002). An overview of binary taste–tasteinteractions. Food Quality and Preference, 14, 111–124.
Krystallis, A., & Ness, M. (2003). Motivational and cognitive structures of Greekconsumers in the purchase of quality food products. Journal of InternationalConsumer Marketing, 16(2), 7–36.
Labbe, D., Schlich, P., Pineau, N., Gilbert, F., & Martin, N. (2009). TemporalDominance of Sensations and sensory profiling: A comparative study. FoodQuality and Preference, 20, 216–221.
Laboratorio Chimico Meceologico Camera di Commercio di Firenze. (2011). Oliextravergini di oliva di Firenze-selezione. Florence-Italy: Litografia IP.
Lawless, H. T., & Heymann, H. (1998). In Chapman & Hall (Eds.), Sensory evaluation offoods: Principles and practices. New York, USA: Springer.
Lenfant, F., Loret, C., Pineau, N., Hartmann, C., & Martin, N. (2009). Perception of oralfood breakdown. The concept of sensory trajectory. Appetite, 52, 659–667.
Matsatsinis, N. F., Grigoroudis, E., & Samaras, A. P. (2007). Comparing distributorsjudgements to buyers preferences: A consumer value analysis in the Greek oliveoil market. International Journal of Retail & Distributors management, 35(5),324–362.
Mattes, R. D. (2007). Effects of linoleic acid on sweet, sour, salty and bitter tastethresholds and intensity ratings of adults. America Journal of Physiology:Gastrointestinal Liver Physiology, 292, G1242–G1248.
Mattes, R. D. (2009). Is there a fatty acid taste? Annual Review of Nutrition, 29,305–327.
Meillon, S., Viala, D., Urbano, C., Guillot, G., & Schlich, P. (2010). Impact of partialalcohol reduction in Syrah wine on perceived complexity and temporality ofsensations and link with preference. Food Quality and Preference, 21, 732–740.
Miettinen, S. M., Hyvonen, L., & Tourila, H. (2003). Timing of intensity perception ofa polar versus non polar aroma compound in the presence of added vegetablefat in milk. Journal of Agricultural and Food Chemistry, 51(18), 5437–5443.
Monteleone, E., & Dinnella, C. (2011). In Olivi di Toscana (Ed.), Olio gusto e salute.Florence, Italy: Accademia dei Georgofili.
Naes, T., Brockhoff, B., & Tomic, O. (2010). Quality control of sensory profile data inStatistics for sensory and consumer science. John Wiley & Sons Ltd. Ed.
Peryam, D. R., & Pilgrim, P. J. (1957). Hedonic scale method for measuring foodpreferences. Food Technology, 11, 9–14.
Perez-Jmenez, F., Ruano, J., Perez-Martinez, P., Lopez-Segura, F., & Lopez-Miranda, J.(2007). The influence of olive oil on human health: Not a question of fat alone.Molecular and Nutritional Food Research, 51, 1199–1208.
Pineau, N., Neville, T., & Lepage, M. (2011). Panel performance tool for TemporalDominance of Sensations studies. Toronto, Canada: 9th Pangborn Sensory ScienceSymposium.
Pineau, N., Schlich, P., Issanchou, S., Imbert, A., Cordelle, S., Mathonnière, C., et al.(2009). Temporal Dominance of Sensations: Construction of the TDS curves andcomparison with time-intensity. Food Quality and Preference, 20, 450–455.
Piggott, R. J. (2000). Dynamism in flavour science and sensory methodology. FoodResearch International, 33, 191–197.
Pfeiffer, J. C., Hort, J., Hollowood, T. A., & Taylor, A. J. (2006). Taste–aromainteractions in a ternary systems: A model of fruitness perception in sucrose/acid solutions. Perception and Psychophysics, 68, 216–227.
Prescott, J., Johnstone, V., & Francis, J. (2004). Odor–taste interactions: Effect ofattentional strategies during exposure. Chemical Senses, 29, 331–340.
Pripp, A. H., Busch, J., & Wreeker, R. (2003). Effect of viscosity, sodium caseinate andoil on bitterness perception of olive oils phenolics. Food Quality and Preference,15, 375–382.
Recchia, A., Monteleone, E., & Tuorila, H. (2012). Responses to extra virgin olive oilsin consumers with varying commitment to oils. Food Quality and Preference,24(1), 153–161.
Robertson, L., & Sagiv, N. (Eds.). (2005). Synaesthesia: Perspectives from cognitiveneuroscience. New York: Oxford University Press.
Saint-Eve, A., Déléris, I., Panouillé, M., Dakowski, F., Cordelle, S., Schlisch, P., et al.(2011). How texture influence aroma and taste perception over time in candies?Chemosensory Perception, 4, 32–41.
Sandalidou, E., & Baourakis, G. (2002). Customers perspectives on the quality oforganic olive oil in Greece. A satisfaction evaluation approach. British FoodJournal, 104, 391–406.
Servili, M., Selvaggini, R., Esposto, S., Taticchi, A., Montedoro, G., & Morozzi, G.(2004). Health and sensory properties of virgin olive oil hydrophilic phenols:Agronomic and technological aspects of production that affect their occurrencein the oil. Journal of Chromatography A, 1054(24), 113–127.
Sinesio, F., Moneta, E., & Esti, M. (2005). The dynamic sensory evaluation ofbitterness and pungency in virgin olive oil. Food Quality and Preference, 16,557–564.
Stefani, G., Romano, D., & Cavicchi, A. (2006). Consumer expectations, liking andwillingness to pay for specialty foods: Do sensory characteristics tell the wholestory? Food Quality and Preference, 1–2, 53–62.
Stevenson, R. J., Prescott, J., & Boakes, R. A. (1999). Confusing tastes and smell: Howodours can influence the perception of sweet and sour tastes? Chemical Senses,24, 627–635.