Sensitive and Robust Methods for Simultaneous Determination of Beclomethasone Dipropionate and...
12
Sensitive and Robust Methods for Simultaneous Determination of Beclomethasone Dipropionate and Formoterol Fumarate Dihydrate in Rotacaps Vijaykumar K. Parmar*, Hetvi N. Patel and Bhavin K. Patel Ramanbhai Patel College of Pharmacy, Charotar University of Science and Technology, CHARUSAT Campus, Ta. Petlad, Dist. Anand, Changa 388421, Gujarat, India *Author to whom correspondence should be addressed. E-mail: [email protected]; [email protected] Received 31 May 2013; revised 8 December 2013 Fixed dose combination containing beclomethasone dipropionate (BDP) and formoterol fumarate dihydrate (FFD) is used in the treat- ment of asthma in form of dry powder inhaler. Two methods are described for the simultaneous determination of BDP and FFD in commercial rotacap formulation. The first method was based on HPTLC separation of the two drugs followed by densitometric mea- surements of their spots at 220 nm. The separation was carried out on Merck HPTLC aluminum sheets precoated with silica gel 60F254 using hexane:ethyl acetate:methanol:formic acid (2.0:2.5:2.0:0.2, v/v/v/v) as mobile phase. The linearity was found to be in the range of 2.4–8.4 mg/spot and 80–280 ng/spot for BDP and FFD, respect- ively. The second method was based on HPLC separation of the two drugs on the reversed phase Enable HPLC Analytical C 18 G 120A ˚ (250 3 4.6 mm, 5 mm) column at ambient temperature using a mobile phase consisting of methanol:acetonitrile:phosphate buffer adjusted to pH 3.6 using orthophosphoric acid (65:25:10, v/v/v). Quantitation was achieved with UV detection at 220 nm based on peak area with linear calibration curves at concentration ranges of 10–200 and 0.3–6.0 mg/mL for BDP and FFD, respectively. Both methods were validated in terms of precision, robustness, recovery and limits of detection and quantitation. The robustness of both methods was assessed using experimental design and results were analyzed by statistical and graphical approaches. Rotacaps formula- tion containing BDP (200/400 mg) and FFD (6 mg) were successfully quantified using the proposed methods. The proposed methods can be used as sensitive, precise, accurate and robust methods for quan- tification of BDP and FFD in Rotacaps. Introduction Asthma is the commonest chronic disease in children in eco- nomically developed countries and is also common in adults (1). It is increasing in prevalence and severity. Asthma is associated with airway inflammation, airway hyperreactivity and acute bron- chial constriction (2). The drugs used most commonly in the treatment of asthma, b2 adrenergic receptor agonists and gluco- corticoids, have potentially serious side effects when delivered systemically (3). The aerosol delivery of these drugs produces a high local concentration in the lungs with a low systemic delivery, thereby significantly minimizing systemic side effects. Aerosol delivery in the forms of nasal sprays, metered-dose inhalers (MDI), dry powder inhalers (DPI) and nebulizers, are commonly used for treatment of asthma and chronic obstructive pulmonary disease (COPD) (4). The most of the aerosol products for asthma have been launched in combination like b 2 -adrenoreceptor with corticosteroids for prolonged duration of action, more effectiveness and quick relief. A significant synergistic therapeutic effect can be obtained in the treatment of asthma by using a fixed dose combinations containing formoterol fumarate dihydrate (FFD) (6 mg) and beclomethasone dipropio- nate (BDP) (200/400 mg) in form of dry powder inhaler (5). BDP, 9a-chloro-11b-hydroxy-16b-methyl-3,20-dioxopregna- 1,4-diene-17,21-diyldipropionate (Figure 1a), is a glucocorticoid steroid (6). The anti-inflammatory effects of BDP in asthma include modulation of cytokine and chemokine production; inhibition of eicosanoid synthesis; marked inhibition of accumu- lation of basophils, eosinophils and other leukocytes in lung tissue; and decreased vascular permeability (2). The HPLC methods are reported for assay of BDP in bulk in Indian Pharmacopoeia (7), British Pharmacopoeia (8) and European Pharmacopoeia (9). BDP inhaler formulation is official in Indian Pharmacopoeia mentioning HPLC method for the assay of BDP. Dhudashia et al. reported stability indicating HPLC method for estimation of BDP from cream (10). The UPLC (11), HPLC (12) and spectrophotometric (13) methods were reported for simul- taneous estimation of BDP and Salbutamol in bulk and Rotacaps. Also determination of BDP in biological fluids by liquid chroma- tography–mass spectrometry (14) and HPLC (15) methods has been reported. FFD, (RS)-2 0 -hydroxy-5 0 -[(RS)-1-hydroxy-2 [[(RS)p-methoxy- a-methylphenethyl]amino]ethyl] formanilide (Figure 1B), is a long-acting b 2 -agonist (6). It is used in the management of asthma and/or COPD (4). Inhaled formoterol works like other b 2 -agonists, causing bronchodilatation by relaxing the smooth muscle in the airway so as to treat the exacerbation of asthma (2). Potentiometric (7 – 9), spectrophotometric (16, 17) and HPLC (18, 19) methods are reported in the literature for deter- mination of FFD in bulk and pharmaceutical formulation. Several methods are reported for simultaneous determination of compo- nents of fixed dose combination product containing FFD and glucocorticoids such as fluticasone, budenoside and ciclesonide in the form of pulmonary product (20 – 23). Determination of formoterol in urine by liquid chromatography –tandem mass spectrometry is also reported (24). From the literature survey, it was found that there is no known method available for the simultaneous determination of these two drugs in the commercially available formulation. Therefore, it was thought of interest to develop analytical methods for the simultaneous determination of BDP and FFD in Rotacaps. Two methods, HPTLC and HPLC, were developed and validated for determination of both drugs from marketed formulation. # The Author [2014]. Published by Oxford University Press. All rights reserved. For Permissions, please email: [email protected] Journal of Chromatographic Science 2014;1– 12 doi:10.1093/chromsci/bmt208 Article Journal of Chromatographic Science Advance Access published February 9, 2014
Transcript of Sensitive and Robust Methods for Simultaneous Determination of Beclomethasone Dipropionate and...

Sensitive and Robust Methods for Simultaneous Determination of BeclomethasoneDipropionate and Formoterol Fumarate Dihydrate in Rotacaps
Vijaykumar K. Parmar*, Hetvi N. Patel and Bhavin K. Patel
Ramanbhai Patel College of Pharmacy, Charotar University of Science and Technology, CHARUSAT Campus, Ta. Petlad, Dist. Anand,
Changa 388421, Gujarat, India
*Author to whom correspondence should be addressed. E-mail: [email protected]; [email protected]
Received 31 May 2013; revised 8 December 2013
Fixed dose combination containing beclomethasone dipropionate(BDP) and formoterol fumarate dihydrate (FFD) is used in the treat-ment of asthma in form of dry powder inhaler. Two methods aredescribed for the simultaneous determination of BDP and FFD incommercial rotacap formulation. The first method was based onHPTLC separation of the two drugs followed by densitometric mea-surements of their spots at 220 nm. The separation was carried outon Merck HPTLC aluminum sheets precoated with silica gel 60F254using hexane:ethyl acetate:methanol:formic acid (2.0:2.5:2.0:0.2,v/v/v/v) as mobile phase. The linearity was found to be in the rangeof 2.4–8.4 mg/spot and 80–280 ng/spot for BDP and FFD, respect-ively. The second method was based on HPLC separation of the twodrugs on the reversed phase Enable HPLC Analytical C18 G 120A(250 3 4.6 mm, 5 mm) column at ambient temperature using amobile phase consisting of methanol:acetonitrile:phosphate bufferadjusted to pH 3.6 using orthophosphoric acid (65:25:10, v/v/v).Quantitation was achieved with UV detection at 220 nm based onpeak area with linear calibration curves at concentration ranges of10–200 and 0.3–6.0 mg/mL for BDP and FFD, respectively. Bothmethods were validated in terms of precision, robustness, recoveryand limits of detection and quantitation. The robustness of bothmethods was assessed using experimental design and results wereanalyzed by statistical and graphical approaches. Rotacaps formula-tion containing BDP (200/400 mg) and FFD (6 mg) were successfullyquantified using the proposed methods. The proposed methods canbe used as sensitive, precise, accurate and robust methods for quan-tification of BDP and FFD in Rotacaps.
Introduction
Asthma is the commonest chronic disease in children in eco-
nomically developed countries and is also common in adults (1).
It is increasing in prevalence and severity. Asthma is associated
with airway inflammation, airway hyperreactivity and acute bron-
chial constriction (2). The drugs used most commonly in the
treatment of asthma, b2 adrenergic receptor agonists and gluco-
corticoids, have potentially serious side effects when delivered
systemically (3). The aerosol delivery of these drugs produces
a high local concentration in the lungs with a low systemic
delivery, thereby significantly minimizing systemic side effects.
Aerosol delivery in the forms of nasal sprays, metered-dose
inhalers (MDI), dry powder inhalers (DPI) and nebulizers, are
commonly used for treatment of asthma and chronic obstructive
pulmonary disease (COPD) (4). The most of the aerosol
products for asthma have been launched in combination like
b2-adrenoreceptor with corticosteroids for prolonged duration
of action, more effectiveness and quick relief. A significant
synergistic therapeutic effect can be obtained in the treatment of
asthma by using a fixed dose combinations containing formoterol
fumarate dihydrate (FFD) (6 mg) and beclomethasone dipropio-
nate (BDP) (200/400 mg) in form of dry powder inhaler (5).
BDP, 9a-chloro-11b-hydroxy-16b-methyl-3,20-dioxopregna-
1,4-diene-17,21-diyldipropionate (Figure 1a), is a glucocorticoid
steroid (6). The anti-inflammatory effects of BDP in asthma
include modulation of cytokine and chemokine production;
inhibition of eicosanoid synthesis; marked inhibition of accumu-
lation of basophils, eosinophils and other leukocytes in lung
tissue; and decreased vascular permeability (2). The HPLC
methods are reported for assay of BDP in bulk in Indian
Pharmacopoeia (7), British Pharmacopoeia (8) and European
Pharmacopoeia (9). BDP inhaler formulation is official in Indian
Pharmacopoeia mentioning HPLC method for the assay of BDP.
Dhudashia et al. reported stability indicating HPLC method for
estimation of BDP from cream (10). The UPLC (11), HPLC (12)
and spectrophotometric (13) methods were reported for simul-
taneous estimation of BDP and Salbutamol in bulk and Rotacaps.
Also determination of BDP in biological fluids by liquid chroma-
tography–mass spectrometry (14) and HPLC (15) methods has
been reported.
FFD, (RS)-20-hydroxy-50-[(RS)-1-hydroxy-2 [[(RS)p-methoxy-
a-methylphenethyl]amino]ethyl] formanilide (Figure 1B), is a
long-acting b2-agonist (6). It is used in the management of
asthma and/or COPD (4). Inhaled formoterol works like other
b2-agonists, causing bronchodilatation by relaxing the smooth
muscle in the airway so as to treat the exacerbation of asthma
(2). Potentiometric (7–9), spectrophotometric (16, 17) and
HPLC (18, 19) methods are reported in the literature for deter-
mination of FFD in bulk and pharmaceutical formulation. Several
methods are reported for simultaneous determination of compo-
nents of fixed dose combination product containing FFD and
glucocorticoids such as fluticasone, budenoside and ciclesonide
in the form of pulmonary product (20–23). Determination of
formoterol in urine by liquid chromatography–tandem mass
spectrometry is also reported (24).
From the literature survey, it was found that there is no known
method available for the simultaneous determination of these
two drugs in the commercially available formulation. Therefore,
it was thought of interest to develop analytical methods for
the simultaneous determination of BDP and FFD in Rotacaps.
Two methods, HPTLC and HPLC, were developed and validated
for determination of both drugs from marketed formulation.
# The Author [2014]. Published by Oxford University Press. All rights reserved. For Permissions, please email: [email protected]
Journal of Chromatographic Science 2014;1–12
doi:10.1093/chromsci/bmt208 Article
Journal of Chromatographic Science Advance Access published February 9, 2014

An experimental design approach was used for determination of
robustness of the proposed methods as a part of an overall
method validation strategy. The robustness testing is generally
performed by evaluating the effects of individual factors by
varying one variable at a time. The use of experimental design
helps to predict the possible interactions between the factors
with limited number of experiments. The design of experiment
(DOE) approach supports ICH guidelines of applying quality by
design (QbD) to predict the parameters negatively affecting the
quality of product (25). The proposed methods are found to be
sensitive and suitable for routine quality control of formulation
containing BDP and FFD.
Experimental
Instrumentation
The HPTLC system (Camag Sonnenmattstr, Mutenz, Switzerland)
consisting of a Linomat V semi-automatic spotting device, a glass
twin-trough TLC chamber (20 � 10 cm), a TLC scanner-IV, a
data station with winCATS (V 1.4.7) software and an HPTLC
syringe (100 mL capacity; Hamilton Company, NV, USA) was
used for thin layer chromatographic studies.
The HPLC system (Shimadzu Corporation, Analytical Instruments
Division, Kyoto, Japan) consisting of a Rheodyne syringe loading
sample injector (20 mL), an LC-AT20 solvent delivery module,
SPD M20A PDA detector, CTO-10AS column oven, LC solution
work station was used for LC separation. The chromatographic
separation was accomplished on an Enable HPLC Analytical C18
G 120 A (250 � 4.6 mm, 5 mm) column protected with a guard
column of the same stationary phase.
Chemicals
BDP (Batch no. BMD 0160811) was procured as gift sample from
Tripda Biotech Private Limited, Ahmedabad, India. FFD (Batch
no. FF-0020610) was supplied as gratis sample from Cadila
Healthcare Ltd., Ahmedabad, India. Drug substances were used
without further purification and certified to contain 99.89%
(w/w) purity for BDP and 99.20% (w/w) purity for FFD on dried
basis. Acetonitrile, ethyl acetate, formic acid, hexane, methanol,
orthophosphoric acid and potassium dihydrogen orthophosphate
were procured from Loba Chemicals, Mumbai, India. The HPLC
grade chemicals and reagents were used for HPLC method. Glass
distillation assembly from Durga scientific, Vadodara was used to
prepare triple distilled water. Marketed formulation containing
BDP and FFD were procured from local market.
Chromatographic conditions
HPTLC method
Separation was performed on precoated silica gel aluminium
plate 60 F-254 (20 � 10 cm) with 250 mm thickness; E. Merck,
Darmstadt, Germany, supplied by Anchrom Technologists
(Mumbai). The TLC plate was prewashed with methanol and
dried in an oven at 1108C for 5 min. Samples were spotted on
the TLC plate in the form of band leaving 10 mm from the
bottom edge using Linomat V semi-automatic spotter and ana-
lyzed using following parameters: bandwidth, 6 mm; track dis-
tance, 10 mm; spraying rate, 150 nL/s; volume of mobile phase,
6.5 mL; temperature, 27+18C; chamber saturation time, 10 min;
migration distance, 70 mm; slit dimension, 4.00 � 0.30 mm;
scanning speed, 20 mm/s; detection wavelength, 220 nm.
Mobile phase consisted of hexane:ethyl acetate:methanol:formic
acid (2.0:2.5:2.0:0.2, v/v/v/v).
HPLC method
The mobile phase consisted of methanol:acetonitrile:phosphate
buffer adjusted to pH 3.6 with orthophosphoric acid (65:25:10,
v/v/v). Samples were analyzed using the following parameters:
flow rate, 1.0 mL/min; injection volume, 20 mL; run time, 6 min;
temperature, 27+28C; detection wavelength, 220 nm.
Preparation of stock solutions
Accurately weighed 100 mg of BDP was transferred to 100 mL
volumetric flask, dissolved and diluted up to the mark with
methanol to get BDP stock solution containing 1 mg/mL of BDP.
Accurately weighed 100 mg of FFD was transferred to 100 mL
volumetric flask, dissolved and diluted up to the mark with
methanol to get FFD stock solution containing 1 mg/mL of FFD.
Preparation of calibration curve
For HPTLC method
The combined working standard solution of BDP and FFD was
prepared by diluting the stock solutions with methanol to
prepare mixture of 300 mg/mL of BDP and 10 mg/mL of FFD.
Aliquots of 8, 12, 16, 20, 24 and 28 mL of working standard solu-
tion (corresponding to 2.4, 3.6, 4.8, 6, 7.2, 8.4 mg/spot and 80,
120, 160, 200, 240, 280 ng/spot for BDP and FFD, respectively)
were spotted on a TLC plate and analyzed. Calibration curve was
Figure 1. Structure of (A) BDP and (B) FFD.
2 Parmar et al.

prepared by plotting peak area of BDP and FFD against their re-
spective concentration.
For HPLC method
The working standard solutions of BDP and FFD were prepared
by diluting stock solutions with mobile phase to prepare
400 mg/mL of BDP and 20 mg/mL of FFD solutions. Aliquots
(0.25, 0.50, 1.0, 2.0, 4.0 and 5.0 mL) from working standard solu-
tion of BDP (400 mg/mL) and aliquots (0.15, 0.3, 0.6, 1.2, 2.4 and
3.6 mL) from working standard solution of FFD (20 mg/mL)
were diluted up to 10 mL with mobile phase to prepare mixture
of calibration standard solutions corresponding to 10, 20, 40, 80,
160 and 200 mg/mL of BDP and 0.3, 0.6, 1.2, 2.4, 4.8, 6.0 mg/mL
of FFD. The calibration standard solutions were analyzed by the
proposed procedure. Calibration curve was prepared by plotting
peak area of BDP and FFD against their respective concentration.
Sample preparation
For assay
To determine the content of BDP and FFD simultaneously in
marketed formulations (formulation A: labeled claim: 200 mg
BDP and 6 mg FFD in each capsule; Formulation B: labeled claim:
400 mg BDP and 6 mg FFD in each capsule), the 20 capsules
were weighed and emptied. The capsule powder was transferred
to 25 mL volumetric flask. Five milliliters of methanol was added.
The capsule shells were rinsed twice with methanol (5 mL),
dried and weighed. The methanolic extract was transferred to
volumetric flask containing capsule powder. The solution was
sonicated for 25 min, diluted up to the mark with methanol and
filtered using 0.45 mm filters (Millipore, Milford, MA, USA) to
get the sample solution containing 160 mg/mL of BDP and
4.8 mg/mL of FFD for formulation A and 320 mg/mL of BDP and
4.8 mg/mL of FFD for formulation B.
For content uniformity
Ten capsules were taken for content uniformity test. Each capsule
was weighed and emptied. The content of each capsule was trans-
ferred to a series of 10 mL volumetric flasks. The capsule shells
were rinsed with methanol and the rinsing solution was trans-
ferred to volumetric flask. The volume was made up to the mark
with methanol. The mixtures were sonicated for 25 min. The
resulting solution was filtered using 0.45mm filters (Millipore,
Milford, MA, USA) to get the sample solution containing 20
and 0.6 mg/mL of BDP and FFD (for formulation A) and 40 and
0.6 mg/mL of BDP and FFD (for formulation B), respectively.
Validation of the proposed methods
Both the methods were validated in compliance with ICH guide-
lines (26, 27). The following parameters were validated.
Specificity
The specificity of the methods was ascertained by analyzing
standard drug and sample solutions.
HPTLC method
The spot for BDP and FFD in sample solution prepared from
marketed formulation was confirmed by comparing the Rf and
absorbance/reflectance spectrum with that of standard BDP and
FFD. The peak purity of BDP and FFD was assessed by correlating
the spectra at three different levels, i.e., peak start (S), peak apex
(M) and peak end (E) positions of the spot.
HPLC method
The chromatograms of standard and sample solutions containing
BDP and FFD were compared to determine the specificity of the
HPLC method. The retention time of BDP and FFD was found to
check selectivity of the method. The PDA (photo diode array)
spectrum of drug peaks obtained from sample and standard solu-
tions were compared. Peak purity analysis was performed using
LC solution software. The specificity was further determined by
the complete separation of BDP and FFD along with other para-
meters like retention time (Rt), capacity factor (k), tailing or
asymmetrical factor (T), etc.
Linearity
Standard stock solution of the drug was diluted to prepare lin-
earity standard solutions containing BDP and FFD in the concen-
tration range of 2.4–8.4 mg/spot, 80–280 ng/spot and 10–
200 mg/mL, 0.3–6.0 mg/mL for HPTLC and HPLC method, re-
spectively. Six sets of such solutions were prepared. Each set
was analyzed to plot a calibration curve. Standard deviation (SD),
slope, intercept and coefficient of determination (r2) of the cali-
bration curves were calculated to ascertain linearity of the
method.
Precision
The precision is measure of either the degree of reproducibility
or repeatability of analytical method. It is indication of random
error. The precision of analytical method is expressed as a SD,
relative standard error or coefficient of variance of series of
measurement.
HPTLC method
Repeatability of measurement of peak area was carried out by
repeated scan of the same spot (4.8 mg/spot of BDP and 160 ng/spot of FFD) seven times without changing the plate position.
The % RSD for peak area was calculated. Repeatability of sample
application is based on seven-time application of combined
standard solution. The % RSD for peak area was computed.
Variations of results within same day (intraday precision) and
among days (interday precision) are called as reproducibility.
The intraday precision (% RSD) was determined by analyzing
standard solution of BDP and FFD for three times on the same
day. The interday precision (% RSD) was determined by analyz-
ing standard solution of BDP and FFD for 5 days. The intra- and
interday variation for determination of BDP and FFD was carried
out at three different concentration levels 3.6, 4.8, 6.0 mg/spotof BDP and 120, 160, 200 ng/spot of FFD.
HPLC method
System suitability tests are used to verify that resolution and re-
producibility of chromatography. It was performed by injecting
20 mL of standard solution, containing 200 mg/mL of BDP and
6 mg/mL of FFD, six times. Resolution (R), column efficiency
(N), tailing factor (T) and precision of injection repeatability
were analyzed.
Sensitive and Robust Methods for BDP and FFD 3

The intraday precision (% RSD) was determined by analyzing
standard solution of BDP and FFD for three times on the same
day. The interday precision (% RSD) was determined by analyz-
ing standard solution of BDP and FFD for 5 days. The intra- and
interday variation for determination of BDP and FFD was carried
out at three different concentration levels 40, 80, 160 mg/mL of
BDP and 1.2, 2.4, 4.8 mg/mL of FFD.
Recovery studies
The accuracy was determined by the standard addition method.
To a fixed amount of pre-analyzed sample of BDP and FFD, in-
creasing amount of standard BDP and FFD solution was added.
HPTLC method
Accuracy of an analysis is determined by calculating systemic
error involved. The recovery studies were carried out by apply-
ing the method to drug sample to which known amount of BDP
and FFD corresponding to 80, 100 and 120% of label claim had
been added. At each level of the amount, three determinations
were performed and the results obtained were compared with
expected results.
HPLC method
Recovery study was performed by addition of known amounts of
standard drugs to pre-analyzed commercial pharmaceutical product
sample at three different concentration levels of drug (50, 100 and
150%). Along with sample solution of BDP (40 mg/mL) and FFD
(1.2 mg/mL) working standard solution of BDP and FFD at each
level were added to prepare mixtures of BDP (6080, 100 mg/mL)
and FFD (1.8, 2.4, 3.0 mg/mL). The experiment was repeated three
times.
Robustness
Robustness testing was performed by experimental design ap-
proach (28–31). Plackett–Burman (PB) designs for testing of
seven factors are the most commonly used designs for robust-
ness testing of chromatographic methods. The proposed HPTLC
method was tested for robustness using PB design with eight
experiments. Seven HPTLC conditions were screened: (A)
change in amount of hexane in mobile phase composition, (B)
change in amount of ethyl acetate in mobile phase composition,
(C) change in amount of methanol in mobile phase composition,
(D) change in saturation time, (E) change in detection wave-
length, (F) change in bandwidth and (G) change in solvent run
distance (Table Ia). Robustness of HPLC method was determined
using two-level 24–1 fractional factorial design. The generator
for this design, that has resolution IV, was D ¼ ABC. The
procedure-related factors examined were: (P) change in mobile
phase composition, (Q) change in pH of mobile phase, (R)
change in flow rate and (S) change in detection wavelength
(Table Ib).
The DOEþþ (Reliasoft Corporation, AZ, USA; ver 1.0.7) and
Design of Experiment (Stat Ease, MN, USA; ver 8.0.1) software
were used to set up the experimental designs for HPTLC and
HPLC methods, respectively. The % recoveries and Rf values for
BDP and FFD were observed at each experiment designed for
the HPTLC method, whereas % recoveries and resolution
between FFD and BDP were observed for the HPLC method. The
experiment was repeated three times. The experiments were
executed in random order. The significance of the factor effects
was determined statistically, using error estimates in the calcula-
tion of critical effects, and graphically, by means of half-normal
plots and Pareto charts.
Limit of detection and limit of quantitation
The detection limit of an individual analytical procedure is the
lowest amount of analyte in a sample that can be detected but
not necessarily quantitated as an exact value. The quantitation
limit of an individual analytical procedure is the lowest amount
of analyte in a sample that can be quantitatively determined
with suitable precision and accuracy. The quantitation limit is a
parameter of quantitative assays for low levels of compounds in
sample matrices and is used particularly for the determination
of impurities and/or degradation products. The limit of detec-
tion (LOD) and limit of quantitation (LOQ) were separately
determined at a signal-to-noise (S/N) ratio of 3 and 10. LOD
and LOQ were experimentally verified by diluting known
concentrations of BDP and FFD until the average responses
were �3 or 10 times the SD of the responses for six replicate
determinations.
Table IFactors and Their Levels for Robustness Testing of HPTLC and HPLC Methods
Factors Levels
(2) Nominal (0) (þ)
(a) HPTLC method(A) Change in amount of hexane in mobile phase composition (mL) 1.8 2.0 2.2(B) Change in amount of ethyl acetate in mobile phase composition (mL) 2.25 2.50 2.75(C) Change in amount of methanol in mobile phase composition (mL) 1.8 2.0 2.2(D) Change in saturation time (min) 9 10 11(E) Change in detection wavelength (nm) 219 220 221(F) Change in bend width (mm) 4 6 8(G) Change in solvent run distance (cm) 6.5 7.0 7.5
(b) HPLC method(P) Change in amount of methanol in mobile phase composition (mL) 62 65 68(Q) Change in pH of mobile phase 3.5 3.6 3.7(R) Change in detection wavelength (nm) 219 220 221(S) Change in Flow rate (mL/min) 0.95 1.00 1.05
4 Parmar et al.

Analysis of marketed formulations
Assay
HPTLC method. Sample solution (25 mL) was spotted on
TLC plate in triplicate. The plate was developed and analyzed. The
peak area of the spots were measured for BDP and FFD and their
concentrations in the samples were determined using multilevel
calibration curves developed on the same plate under the same
conditions using linear regression equation.
HPLC method. From formulation A sample solution, a 20-mL
volume of solution (4.8 and 160 mg/mL of FFD and BDP,
respectively) was chromatographed in HPLC system, three times.
The peak area of the BDP and FFD was measured at 220 nm, and
their concentrations in the samples were determined using linear
regression equation.
From formulation B sample solution, 2 mL was pipette out
to 10 mL volumetric flask and dilute up to the mark with
mobile phase to get concentration 32 and 0.96 mg/mL of BDP and
FFD, respectively. A 20-mL volume of the resulting solution was
injected in HPLC system, three times. The peak area of the BDP
and FFD was measured at 220 nm and their concentrations in the
samples were determined using linear regression equation.
Content uniformity
A 20 mL volume of the sample solution for content uniformity
was injected in HPLC system, three times, and analyzed. The
peak area of the BDP and FFD was measured at 220 nm and their
concentrations in the samples were determined using linear
regression equation. The content uniformity for the marketed
formulations was tested as per USP guidelines (32).
Results
Chromatographic separation
HPTLC method
Various solvent systems composed of toluene, methanol, ethyl
acetate, hexane or mixture thereof were tried for optimization
of mobile phase for HPTLC separation of BDP and FFD. But
the best resolution and symmetrical peak shapes were achieved
using mobile phase system consisting of hexane:ethyl acetate:
methanol:formic acid (2.0:2.5:2.0:0.2 v/v/v/v). The Rf values
were found to be 0.36 and 0.68 for FFD and BDP, respectively.
The comparison of densitograms of standard drug solution and
sample solution from formulation showed identical Rf values, i.e.,
0.68 for BDP and 0.36 for FFD (Figure 2). Comparison of the
spectra scanned at peak start (S), peak apex (M) and peak end (E)
positions of individual spots of BDP and FFD obtained from
sample solution showed a high degree of correlation (.0.99),
confirmed the purity of the corresponding spots (Supplementary
Figure 1). The spectrum of individual drug was also correlated
with spectrum of standard BDP and FFD. The correlation obtained
was 0.9998 and 0.9991 for BDP and FFD, respectively, confirmed
the identity of the spots.
HPLC method
The mobile phase system consisting of methanol:acetonitrile:
water (65:25:10, v/v/v) adjusted to pH 3.6 showed good
separation, good peak shape and repeatable result. The elution
of both drugs from HPLC column was achieved at 1.69 min for
FFD and 4.78 min for BDP (Figure 3). The results of the system
suitability test (Table II) shows that the optimized chromato-
graphic conditions are adequate for simultaneous determin-
ation. The resolution between BDP and FFD peaks was found to
be 17.45. Chromatograms of standard drug solution and sample
solution were compared and it showed identical retention
times for both drugs (Figure 3). The peak purity indices for
both drugs from standard and sample solution were found to
be .0.999.
Method validation
HPTLC method
Representative calibration curve of BDP and FFD was obtained
by plotting the peak area of BDP and FFD against concentration
over the range of 2.4–8.4 mg/spot and 80–280 ng/spot, respect-ively. They were found to be linear over above-mentioned range
with correlation coefficients of 0.9979+0.001 for BDP and
0.9978+0.0006 for FFD. The linear regression equations were
y ¼ 1907.8x þ 2822.2 and y ¼ 13.21x 2 73.794 for BDP and
FFD, respectively. The repeatability of measurement of peak area
and sample application were expressed in terms of % RSD and
were found to be 0.88, 0.82 and 1.47, 1.33 for BDP and FFD,
respectively. The % RSD for intraday precision (Table III) was
found to be 0.17–0.85 and 0.17–0.48 for BDP and FFD, respect-
ively. The % RSD for interday precision (Table III) was found
to be 0.32–1.62 and 0.72–1.19 for BDP and FFD, respectively.
The proposed HPTLC method when used for recovery studies
for BDP and FFD from pharmaceutical formulation after spiking
with additional standard drug afforded recovery between
98–102% and mean recoveries for BDP and FFD from the
marketed formulation are listed in Table IV. The LOQs and LODs
were found to be 0.44 mg/spot, 0.14 ng/spot for BDP and
10.94 ng/spot, 3.61 ng/spot for FFD, respectively. The total
eight experimental plans of PB design for robustness testing and
the corresponding responses are summarized in Table V. The
margin of errors (ME) or the critical effects were calculated for
each response using algorithm of Dong (30). The values for ME
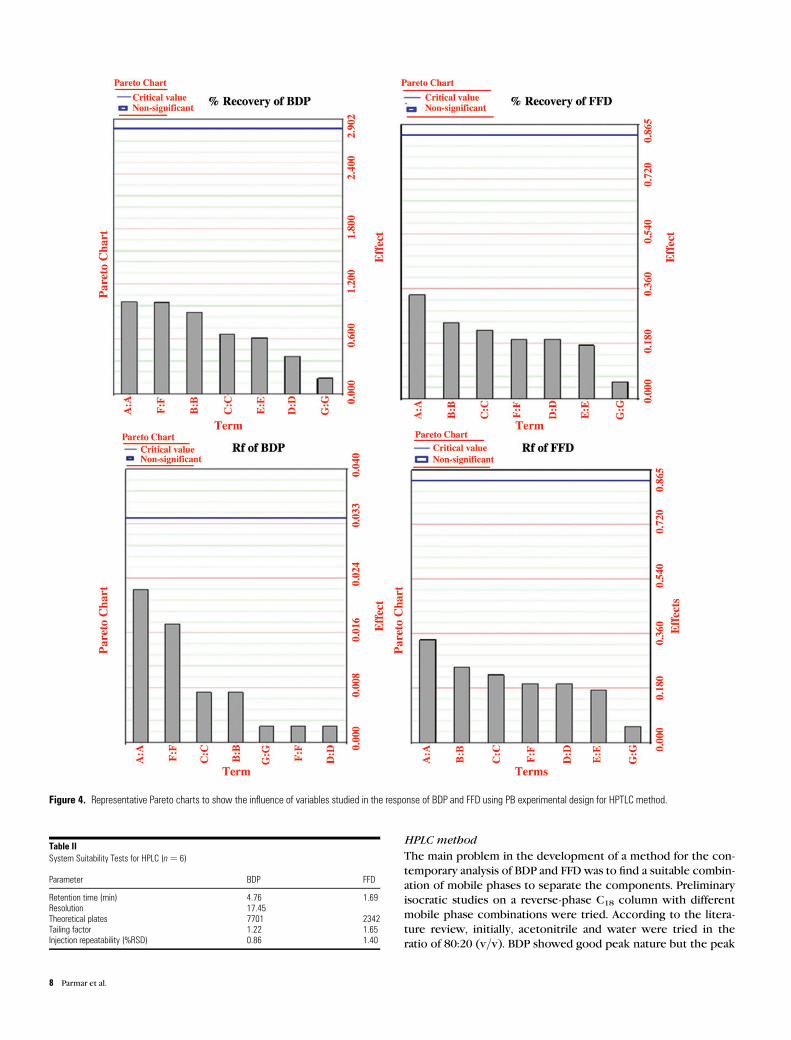
are shown in Table V. Pareto charts evaluation of robustness data
are depicted in Figure 4.
The solution stability and spot stability studies were per-
formed for the HPTLC method. Solutions of BDP (160 ng/mL)and FFD (4.8 ng/mL) were prepared from sample solution and
stored at room temperature for 0.5, 1.0, 2.0, 4.0, 8.0 and 24 h,
respectively. They were then applied on the TLC plate, after
development of the densitogram was evaluated for additional
spots if any. There was no indication of compound instability in
the sample solution. The time the sample is left to stand on the
solvent prior to chromatographic development can influence
the stability of separated spots and are required to be investi-
gated for validation. Two-dimensional chromatography using
same solvent system was used to find out any decomposition
occurring during spotting and development. In case, if decom-
position occurs during development, peak(s) of decomposition
product(s) shall be obtained for the analyte both in the first and
second direction of the run. No decomposition was observed
during spotting and development.
Sensitive and Robust Methods for BDP and FFD 5

HPLC method
BDP and FFD showed good correlation coefficient in the con-
centration range of 10–200 mg/mL (r ¼ 0.9980+0.001) and
0.3–6.0 mg/mL (r ¼ 0.9976+0.0005) for the HPLC method, re-
spectively. The linear regression equations were y ¼ 13,329x þ
48,850 and y ¼ 54,558x þ 7,030 for BDP and FFD, respectively.
The SD for slope and intercept calculated was 132.07 and
3742.65 for BDP and 397.94 and 806.68 for FFD, respectively.
Intraday precision (%RSD, n ¼ 3) was found to be 0.21–0.88 and
0.16–0.95 for BDP and FFD, respectively. Interday precision
Figure 2. Densitogram of (A) standard BDP (3.6 mg/spot, Rf: 0.68+ 0.02) and FFD (120 ng/spot, Rf: 0.36+ 0.02), (B) sample BDP (3.6 mg/spot, Rf: 0.68+ 0.02) and FFD(120 ng/spot, Rf: 0.36+ 0.02) measured at 220 nm, mobile phase hexane–ethyl acetate–methanol–formic acid (2.0:2.5:2.0:0.2, v/v/v/v).
6 Parmar et al.

(%RSD, n ¼ 3) was found to be 1.10–1.24 and 0.84–1.25 for
BDP and FFD, respectively. The intra- and interday precision
result is depicted in Table III. The accuracy of the method was
evaluated by recoveries of the added sample. The results of re-
covery studies for the HPLC method are presented in Table IVb.
The LOQs were found to be 5.06 and 0.14 mg/mL for BDP and
FFD, respectively, and the LODs were estimated to be 1.67 and
0.05 mg/mL for BDP and FFD, respectively. Standard solution of
BDP (80 mg/mL) and FFD (2.4 mg/mL) were prepared from
sample solution and stored at room temperature for 3 days. They
were then injected into the HPLC system and no additional peak
was found in the chromatogram indicating the stability of BDP
and FFD in the sample solution.
The statistical analysis of the robustness testing data was done
by Design Expert software. The significance of the effects was
evaluated by the statistical interpretation method (Algorithm of
Dong) and graphical methods, namely a half-normal probability
plot of the residuals and Pareto chart of the standardized
effects. The half-normal plots showing effect of factor change on
responses are depicted in Figure 5. The factor effects were
calculated for each response and presented in Table VI.
Analysis of the marketed formulation
The proposed methods were applied for assay of BDP and FFD
from marketed formulations. The spots at Rf 0.68 (for BDP) and
Rf 0.36 (for FFD) were observed in the densitogram of the drug
samples extracted from capsules (Figure 2B). There was no
interference from the excipients commonly present in the cap-
sules. The HPLC chromatogram of the drug samples extracted
from capsule showed peaks at retention time of 4.78 min (for
BDP) and 1.68 min (for FFD) (Figure 3B). The HPLC method was
further applied for content uniformity testing of marketed
formulation. The steps of the test were adopted according to the
USP procedure (32). The acceptance value (AV) was calculated
for each of the Rotacaps and was found to be smaller than the
maximum allowed acceptance value (LI).
Comparison between HPLC and HPTLC methods
Sample solutions were analyzed simultaneously by HPTLC and
HPLC methods. Each sample was analyzed in triplicate. The results
of both methods were compared by paired t-test. The data were
treated as paired data. The statistical data are shown in Table VII.
Discussion
By reviewing the literature in hand, it was found that no chroma-
tographic methods were published for the simultaneous deter-
mination of binary mixture of BDP and FFD. Therefore, the aim
of this work was to develop and validate chromatographic
methods for simultaneous determination of the cited drugs.
Optimization of procedure
HPTLC method
Initially, toluene and methanol in the ratio of 5:5 (v/v) were tried
for separation of both drugs simultaneously. The spots were not
developed properly and dragging was observed. Then toluene and
methanol in the ratio of 3:7 (v/v) was tried. The developed spots
were diffused and Rf was near to solvent front. Then the reverse
ratio of the same mobile phase was tried. The distance travelled by
developed spots was less and dragging was observed. To the
above mobile phase, ethyl acetate was added with different ratios
but the spot of BDP was diffused to solvent run, then ethyl acetate
was replaced with ethanol but the developed spots lack compact-
ness and were observed to be less persistent. Also the Rf values of
FFD and BDP were not satisfactory because of less resolution
between them. Then toluene was replaced by hexane and ethanol
was again replaced by ethyl acetate. Different ratios of hexane,
ethyl acetate and methanol were tried and finally 2.0:2.5:2.0 (v/v/v) ratio of hexane, ethyl acetate and methanol was optimized. For
improvement in peak shape of both the drugs, 0.2 mL of formic
acid was added to hexane, ethyl acetate and methanol in the ratio
of 2:2.5:2:0.2 (v/v/v/v).The densitometric scanning at 220 nm, the iso-absorptive point
determined from overlain absorbance/reflectance spectra of FFD
and BDP, resulted in increased sensitivity of the method.
Well-defined spots were obtained when plate was activated at
1108C for 15 min and the chamber was saturated with the mobile
phase for 10 min at room temperature. It was observed that drying
of TLC plate after spotting and pre-saturation of TLC chamber
with the mobile phase for 10 min ensured good reproducibility of
Rf value. The proposed HPTLCmethod has the advantage of allow-
ing determination of several samples at the same time.
Figure 3. HPLC chromatograms of (A) sample solution of BDP (160 mg/mL, Rt:4.656 min) and FFD (4.8 mg/mL, Rt: 1.664 min), (B) working standard solution of BDP(160 mg/mL, Rt: 4.655 min) and FFD (4.8 mg/mL, Rt: 1.663 min) at 220 nm; mobilephase:methanol:acetonitrile: 25 mM phosphate buffer, pH 3.6, adjusted withorthophosphoric acid in ratio of 65:25:10 (v/v/v).
Sensitive and Robust Methods for BDP and FFD 7
HPLC method
The main problem in the development of a method for the con-
temporary analysis of BDP and FFD was to find a suitable combin-
ation of mobile phases to separate the components. Preliminary
isocratic studies on a reverse-phase C18 column with different
mobile phase combinations were tried. According to the litera-
ture review, initially, acetonitrile and water were tried in the
ratio of 80:20 (v/v). BDP showed good peak nature but the peak
Figure 4. Representative Pareto charts to show the influence of variables studied in the response of BDP and FFD using PB experimental design for HPTLC method.
Table IISystem Suitability Tests for HPLC (n ¼ 6)
Parameter BDP FFD
Retention time (min) 4.76 1.69Resolution 17.45Theoretical plates 7701 2342Tailing factor 1.22 1.65Injection repeatability (%RSD) 0.86 1.40
8 Parmar et al.

of FFD was not separated. Then acetonitrile was replaced by
methanol in the same ratio. Splitting was observed for both
peaks. Then acetonitrile, methanol and water were tried in dif-
ferent ratios but there were problem in peak shape of both drugs
and retention time of FFD was too long. Then the above mobile
phase in different ratios were tried along with change in pH
from 3.0 to 5.0 with the help of orthophosphoric acid. With 3.6
pH in 65:25:10 (v/v/v) ratio of methanol:acetonitrile:water, both
the drugs were separated within 5 min and have good peak
shapes. For stabilizing the pH, water was replaced by 25 mM
phosphate buffer (pH 3.6). Both the drugs showed typical peak
nature and peaks were symmetrical at 220 nm (Figure 3).
The proposed HPLC method utilizes an isocratic elution tech-
nique at room temperature with PDA detection for the simultan-
eous determination of both the drugs from rotacap formulation.
The mobile phase with pH 3.6 gives greater stability to the ana-
lytical column. The real advantage of the HPLC method is low re-
tention times: 1.69 and 4.78 min for FFD and BDP, respectively.
It reduces total run time, leads to low solvent consumption and
makes the method more economical.
Method validation
The goal of this study was to develop sensitive and robust chroma-
tographic methods for the simultaneous determination of BDP
and FFD from their combined marketed formulation. The pro-
posed methods were validated according to the ICH guidelines.
HPTLC method
The linearity of calibration graphs and adherence of the system
to Beer’s law was validated by high value of correlation coeffi-
cient and the SD for intercept value was ,2%. The repeatability
studies ensured precision of densitometric scanner and spotting
device. The % RSD for replicate sample solutions for intra- and
interday study are ,2.0% for FFD and BDP which met the ac-
ceptance criteria established for the RP-HPLC method. This con-
firms that the method is precise. The % RSD values show that the
proposed method provides acceptable intra- and interday vari-
ation of BDP and FFD. The signal-to-noise ratios of 3:1 and 10:1
were considered as LODs and LOQs, respectively.
In this paper, PB design has been chosen to test the robustness
of the HPTLC method. If the PB design is saturated, n trials enable
to determine n 2 1 factor effects. In the current study, seven
factors were tested with only eight experiments. The selection of
factors was based on observations during method development
and own experience. Each factor was studied at two levels. The
different levels for each factor were selected symmetrically
around the nominal value of the corresponding factor in the
Table IIIIntra- and Interday Precisions of BDP and FFD (n ¼ 3)
Drug HPTLC HPLC
Intraday precision Interday precision Intraday precision Interday precision
SD ofarea
%RSD
SD ofarea
%RSD
SD ofarea
%RSD
SD ofarea
%RSD
BDPa 64.40 0.51 109.36 0.87 6560.27 0.64 15083.29 1.17FFDb 7.60 0.34 19.59 1.00 666.88 0.47 1607.64 1.01
aAverage of three concentrations 120, 160, 200 ng/spot and 1.2, 2.4, 4.8 mg/mL for HPTLC and
HPLC, respectively.bAverage of three concentrations 3.6, 4.8, 6 mg/spot and 40, 80, 160 mg/mL for HPTLC and HPLC,
respectively.
Table IVRecovery Study of (a) HPTLC Method and (b) HPLC Method (n ¼ 3)
Excess drug added to the analyte (%) Theoretical content % Recovery % RSD
BDP(mg/spot)
FFD(ng/spot)
BDP FFD BDP FFD
(a) HPTLC method0 2.0 60 99.87 99.53 0.35 0.2460 3.2 96 99.74 99.81 0.24 0.40100 4.0 120 99.88 99.87 0.63 0.50140 4.8 144 99.91 99.82 0.61 0.36
(b) HPLC method0 40 1.2 99.98 99.78 0.27 0.3250 60 1.8 98.53 99.79 1.15 0.25100 80 2.4 99.99 99.66 0.28 0.47150 100 3.0 99.39 99.98 0.42 0.31
Table VEight Experiment PB Design to Examine the Seven Factors (A–G) Selected for Robustness Testing of HPTLC Method
Experiments Factors Responses
A B C D E F G % Recovery Rf values
BDP FFD BDP FFD
1 21 þ1 þ1 þ1 21 þ1 21 100.46 99.25 0.67 0.352 21 21 þ1 þ1 þ1 21 þ1 99.77 99.54 0.67 0.363 21 21 21 21 21 21 21 101.65 99.73 0.64 0.344 þ1 21 þ1 21 21 þ1 þ1 98.79 100.10 0.64 0.335 þ1 þ1 21 þ1 21 21 þ1 100.94 99.68 0.64 0.346 21 þ1 21 21 þ1 þ1 þ1 100.74 99.91 0.68 0.337 þ1 21 21 þ1 þ1 þ1 21 98.59 100.25 0.66 0.388 þ1 þ1 þ1 21 þ1 21 21 100.25 99.77 0.65 0.36
Responses Effects of factors Critical effect
A B C D E F G ME (a ¼ 0.05)
% Recovery (BDP) 21.01 0.90 20.66 20.42 20.62 21.01 20.18 1.729% Recovery (FFD) 0.34 20.25 20.22 20.20 0.18 0.20 0.06 0.525Rf values (BDP) 20.018 0.007 0.002 0.008 0.018 0.013 0.003 0.028Rf values (FFD) 0.0075 20.0075 0.0025 0.0175 0.0175 20.0025 20.0175 0.029
Sensitive and Robust Methods for BDP and FFD 9

original method. The limits of the factors studied were selected
according to error ranges which would be typically encountered
in an analytical laboratory. All absolute factor effects on the quan-
titative responses, i.e., percentage recoveries of BDP and FFD,
were found to be smaller than the corresponding critical effects,
i.e., ME (a ¼ 0.05) ¼ 1.729 for BDP and 0.525 for FFD. All absolute
effects on the response Rf values for both compounds were
smaller than their respective critical effects, i.e., ME (a ¼ 0.05)¼
0.028 for BDP and 0.029 for FFD. Concomitantly, graphical evalu-
ation employing Pareto charts was done. It may be more comfort-
able viewing the Pareto Chart that has the significant effects
selected. The Pareto graph (Figure 4) consists of bars with a
length proportional to the absolute value of the estimated effect,
divided by the pseudo standard error defined by Lenth (Lenth’s
Table VIEight Experiment 2421 Fractional Factorial Design to Examine the Four Factors (P–S) Selected for Robustness Testing of HPLC Method
Experiments Factors Responses Resolution
P Q R S % Recovery
BDP FFD
1 21 21 21 21 99.91 100.89 15.3782 þ1 21 21 þ1 99.84 99.59 15.3423 21 þ1 21 þ1 100.55 100.55 15.3844 þ1 þ1 21 21 99.70 99.38 15.2415 21 21 þ1 þ1 99.91 101.63 15.3156 þ1 21 þ1 21 99.92 101.60 15.1897 21 þ1 þ1 21 99.85 100.76 15.1498 þ1 þ1 þ1 þ1 99.91 99.20 15.343
Responses Effects of factors Critical effects
P Q R S PQ PR PS ME (a ¼ 0.05)
% Recovery of BDP 20.21 20.11 20.10 0.21 20.18 0.25 20.14 0.42% Recovery of FFD 21.02 20.95 0.70 20.41 20.35 0.22 20.68 1.66Resolution 20.03 20.03 20.09 0.11 0.05 0.06 0.02 0.15
Figure 5. Representative graphs to show the influence of variables studied in the response of BDP and FFD using 2421 experimental design for HPLC method.
10 Parmar et al.

PSE). All main effects and interaction terms are found to be statis-
tically insignificant as absolute values of main effects are below
the critical t-value (a ¼ 0.05). Thus, in all situations, the % recoveries
and Rf values for both the drugs are not significantly affected by
factor changes. The method was found to be robust.
HPLC method
The results of system suitability test (Table II) shows that the
optimized chromatographic conditions are adequate for simul-
taneous determination. The resolution of BDP and FFD peaks is
.1.5. Theoretical plates of BDP and FFD are .2,000, tailing
factor of BDP and FFD is ,2.0, % RSD of injection repeatability is
,2.0%. The recovery studies for BDP and FFD from pharmaceut-
ical formulation after spiking with additional standard drug
afforded recovery between 98 and 102%.
Robustness was assessed using experimental design approach.
The results of robustness trials were evaluated by half-normal
plots and statistical parameters. In half-normal plots, insignificant
effects that tend to have a normal distribution centered near
zero are normally distributed around the straight line, while sig-
nificant effects deviate from it. Ideally, when the selection of
statistically significant terms is complete, the Shapiro–Wilk
P-value must be .0.10, indicating that the remaining (unse-
lected) terms are normally distributed. In the current study,
Shapiro–Wilk P-value of all the response parameters are .0.10
indicates that all unselected terms are normally distributed on
straight line. It can be concluded from the half-normal plot that
no effects are statistically significant as they all are normally
distributed around the straight line. Although, we recommend
using the half-normal plot of effects to choose the statistically
significant effects, in some cases, a Pareto chart can also be very
valuable. The Pareto chart is a useful tool for showing others
the relative size of effects. There is standard t limits plotted on
the graph to identify significant effects. After the initial
selection of effects in half-normal plot, effects above the t-value
limit (t(a ¼ 0.05) ¼ 2.445) are possibly significant and should be
added if they are not already selected, effects below the t-value
limit are not likely to be significant. So, in present state, all main
effects and interaction terms are statistically in-significant. At the
studied ranges, the effects of the factors were not statistically sig-
nificant (a ¼ 0.05) for the response studied, recoveries of BDP
and FFD and resolution between BDP and FFD. All absolute
factor effects on the quantitative responses, i.e., percentage re-
coveries of BDP and FFD, and qualitative response, i.e., resolution
between BDP and FFD, were found to be smaller than the corre-
sponding critical effects. The % recoveries and resolution are
not significantly affected by factor changes.
Analysis of the marketed formulation
Both the drugs have good solubility in methanol; therefore,
methanol was selected for the extraction from rotacap formula-
tion. The formulation powder was sonicated with methanol for
25 min to ensure complete dissolution of both drugs. No inter-
fering peaks were found in the chromatogram, indicating that
formulation excipients did not interfere in the estimation of BDP
and FFD by the proposed chromatographic methods. The low %
RSD value indicated the suitability of this method for routine
analysis of FFD and BDP in pharmaceutical dosage form.
Content uniformity testing by HPLC
Due to the high precision of the proposed method and its ability
to rapidly estimate the concentration of the drugs in a single cap-
sules extract with sufficient accuracy, the method is ideally
suited for content uniformity testing which is a time-consuming
process when using conventional assay techniques. The steps of
the test were adopted according to the USP procedure (32). The
AV was calculated for each of the rotacaps and was found to be
smaller than the maximum LI.
Comparison between HPLC and HPTLC method
For four pairs of analysis, the Tcal was lower than the Ttab value
obtained from Student’s distribution table for a risk factor of 5%,
which showed that there was no statistically significant difference
between HPLC and HPTLC analytical methods. HPTLC has devel-
oped to an extent that separation and quantitation can provide
results that are comparable with another analytical method such as
HPLC. Today, HPTLC has firm place among various analytical techni-
ques as a reliable method for quantification at micro-, nano- and
even at picogram level, even when present in complex formulations.
Conclusion
The proposed HPTLC and HPLC methods provide precise, accur-
ate and reproducible quantitative analysis for the simultaneous
determination of BDP and FFD in rotacaps. Both the methods
were validated as per the ICH guidelines. The robustness of the
proposed methods was studied using DOEs and found to be
robust at deliberate changes made in experimental conditions.
Statistical tests indicate that the proposed HPTLC and HPLC
methods reduce the duration of analysis and appear to be
equally suitable for routine determination of BDP and FFD simul-
taneously in pharmaceutical formulation. The HPLC method is
also applicable for the content uniformity test of rotacaps. Both
the methods are suitable for routine analysis of BDP and FFD in
their commercial dosage forms. The methods are also suitable
and valid for application in quality control laboratories.
Supplementary material
Supplementary data are available at Journal of Chromatographic
Science online.
Table VIIStatistical Comparison of the Results Obtained by the Proposed HPLC and HPTLC Methods for the
Analysis of Formulation A and B
Parameters Formulation A Formulation B
BDP FFD BDP FFD
HPTLC HPLC HPTLC HPLC HPTLC HPLC HPTLC HPLC
Mean 100.07 99.97 99.54 99.96 99.85 100.06 99.68 100.01Variance 0.12 0.07 0.06 0.09 0.02 0.16 0.12 0.01d.f. 2 2 2 2t calculated 0.31 22.21 20.68 22.24t tabulated 2.92 2.92 2.92 2.92P-value* 0.39 0.08 0.28 0.08
*P-value ¼ 0.05.
Sensitive and Robust Methods for BDP and FFD 11

Acknowledgments
The authors thank Tripda Biotech Private Limited, Ahmedabad
for gift sample of beclomethasone dipropionate and Cadila
Healthcare Ltd., Ahmedabad for gift sample of formoterol fumar-
ate dihydrate. Authors also thank to Charotar University of
Science and Technology for providing the facilities for comple-
tion of the project.
References
1. Van den Berge, M., ten Hacken, N.H., Cohen, J., Douma, W.R., Postma,
D.S.; Small airway disease in asthma and COPD: clinical implications;
Chest, (2011); 139: 412–420.
2. Goodman, G.; Bronchial asthma. In Manuals of Pharmacology
and Therapeutics, 11th ed. Mc-Graw Hill, New York, (2006), pp.
1031–1061.
3. Tripathi, K.D. (ed); Essential of Medical Pharmacology, 4th ed.
Jaypee Brothers, New Delhi, (2001), 201 pp.
4. Hickey, A.J.; Back to the future: inhaled drug products; Journal of
Pharmaceutical Sciences, (2013); 102: 1165–1170.
5. Tzani, P., Crisafulli, E., Nicoline, G., Aiello, M., Chetta, A., Clini, E.M.,
et al.; Effects of beclomethasone/formoterol fixed combination on
lung hyperinflation and dyspnea in COPD patients; International
Journal of Chronic Obstructive Pulmonary Disease, (2011); 6:
503–509.
6. O’Neil, M.J.; Merck Index: An Encyclopedia of Chemicals, Drugs,
and Biologicals, 12th ed. Merck & Co., Inc., Rathway, New Jersey,
(2006), pp. 1419, 1941.
7. Indian Pharmacopoeia Commission. Indian Pharmacopoeia, vol. 2,
6th ed. Ministry of Health and Family Welfare, Government of India,
Ghaziabad, India, (2010), pp. 873, 1386.
8. British Pharmacopoeia Commission. British Pharmacopoeia,
Secretariat of the Medicines and Healthcare Products Regulatory
Agency, London, UK, (2011), pp. 219, 963.
9. Council of Europe’s European Directorate for the Quality of Medicines
and Healthcare (EDQM) and European Medicines Agency joint
meeting on raw materials used for the production of cell-based and
gene-therapy products, Council of Europe: European Directorate for
the Quality of Medicines (EDQM). European Pharmacopoeia, vol. 2,Strasbourg, France, (2011), pp. 1449, 2067.
10. Dhudashia, K.R., Patel, A.V., Patel, C.N.; Development and
validation of stability indicating RP- HPLC method for estimation of
beclomethasone dipropionate in cream dosage form; Inventi Rapid:
Pharm Analysis & Quality Assurance, (2012); 2013: 567–576.
11. Venkata, N.T., Gopinath, B., Bhaskar, V.V.; Development and valid-
ation of UHPLC method for simultaneous estimation of salbutamol
sulphate and beclomethasone dipropionate; International Journal
of Pharmacy and Biological Sciences, (2012); 2: 254–268.
12. Martis, E.A., Gangrade, D.M.; Reverse phase isocratic HPLC method
for simultaneous estimation of salbutamol sulphate and beclo-
methasone dipropionate in Rotacaps formulation dosage forms;
International Journal of Pharmacy and Pharmaceutical Sciences,
(2011); 3: 64–67.
13. Lakshmi, P.B., Shetty, S.A., Priyatam, N.T., Gopinath, B., Manzoor, A.;
Development of new spectrophotometric methods for the simultan-
eous estimation of levosalbutamol sulphate and beclomethasone
dipropionate in bulk drug and pharmaceutical formulations
(ROTACAP); International Journal of PharmTech Research,
(2012); 4: 791–798.
14. Guan, F., Uboh, C., Soma, L., Hess, A., Luo, Y., Tsang, D.S.; Sensitive
liquid chromatographic/tandem mass spectrometric method for the
determination of beclomethasone dipropionate and its metabolites
in equine plasma and urine; Journal of Mass Spectrometry, (2003);
38: 823–832.
15. Foe, K., Brown, K.F., Seale, J.P.; Decomposition of beclomethasone
propionate esters in human plasma; Biopharmaceutics and Drug
Disposition, (1998); 19: 1–8.
16. Gousuddin, M., Raju, S.A., Sultan, U., Manjunath, S.; Development and
validation of spectrophotometric methods for estimation of formoterol
bulk drug and its pharmaceutical dosage forms; International Journal
of Pharmacy and Pharmaceutical Sciences, (2011); 3: 300–309.
17. Gousuddin, M., Raju, S.A., Sultan, U., Manjunath, S.; Optimization and
validation of quantitative spectrophotometric methods for determin-
ation of formoterol bulk drug and its pharmaceutical dosage forms;
Journal of Analytical Chemistry, (2011); 1: 1–5.
18. Ahmed, S., Jayakar, B., Aleem, M.A.; Development of reverse phase high
performance liquid chromatography method and its validation for esti-
mation of formoterol fumarate Rotacaps; International Journal of
Pharmaceutical Science and Research, (2011); 2: 319–324.
19. Akapo, S.O., Asif, M.; Validation of a RP-HPLC method for the assay of
formoterol and its related substances in formoterol fumarate dihy-
drate drug substance; Journal of Pharmaceutical and Biomedical
Analysis, (2003); 33: 935–945.
20. Trivedi, R.K., Chendake, D.S., Patel, M.C.; A rapid stability-indicating
RP-HPLC method for the simultaneous determination of formoterol
fumarate, tiotropium bromide, and ciclesonide in a pulmonary drug
product; Scientia Pharmaceutica, (2012); 80: 1–13.
21. Shah, B.D., Kumar, S., Yadav, Y.C., Seth, A.K., Ghelani, T.K., Deshmukh,
G.J.; Analytical method development and method validation of tiotro-
pium bromide and formoterol fumarate metered dose Inhaler (MDI)
by using RP-HPLC method; Asian Journal of Biochemical and
Pharmaceutical Research, (2011); 1: 145–158.
22. Patil, A.T., Patil, S.D., Shaikh, K.A.; Sensitive LC method for simultan-
eous determination of ciclesonide and formoterol fumarate in dry
powder inhaler; Journal of Liquid Chromatography and Related
Technology, (2011); 34: 1568–1577.
23. Malik, K., Kumar, D., Tomar, V., Kaskhedikar, S., Soni, L.; Simultaneous
quantitative determination of formoterol fumarate and fluticasone
propionate by validated reversed-phase HPLC method in metered
dose inhaler; Pelagia Research Library, (2011); 2: 77–84.
24. Sardelaa, V.F., Deventerb, K., Pereiraa, H.M.G., de Aquino Netoa, F.R.,
Van Eenoob, P.; Development and validation of an ultra-high perform-
ance liquid chromatography–tandem mass spectrometric method for
the direct detection of formoterol in human urine; Journal of
Pharmaceutical and Biomedical Analysis, (2012); 70: 471–479.
25. ICH, Q8 (R2); Harmonised tripartite guideline, Pharmaceutical de-
velopment, IFPMA. In Proceedings of the International Conference
on Harmonization, Geneva, (2009), pp. 1–28.
26. ICH, Q2A; Harmonised tripartite guideline, text on validation of ana-
lytical procedures, IFPMA. In Proceedings of the International
Conference on Harmonization, Geneva, (1994), pp. 1–5.
27. ICH, Q2B; Harmonised tripartite guideline, validation of analytical
procedure: methodology, IFPMA In Proceedings of the International
Conference on Harmonization, Geneva, (1996), pp. 1–8.
28. Inglot, T., Gumieniczek, A., Maczka, P., Rutkowska, E.; New HPLC
method with experimental design and fluorescence detection for
analytical study of antihypertensive mixture, amlodipine and valsar-
tan; American Journal of Analytical Chemistry, (2013); 4: 17–23.
29. Enrique, M., Garcıa-Montoya, E., Minarro, M., Orriols, A., Tico, J.R.,
Sune-Negre, J.M., et al.; Application of an experimental design for
the optimization and validation of a new HPLC method for the deter-
mination of vancomycin in an extemporaneous ophthalmic solution;
Journal of Chromatographic Science, (2008); 46: 828–834.
30. Barth, A.B., de Oliveira, G.B., Malesuik, M.D., Paim, C.S., Volpato, N.M.;
Stability-indicating LC assay for butenafine hydrochloride in creams
using an experimental design for robustness evaluation and photo-
degradation kinetics study; Journal of Chromatographic Science,
(2011); 49: 512–518.
31. Gohel, N.R., Patel, B.K., Parmar, V.K.; Chemometrics-assisted UV
spectrophotometric and RP-HPLC methods for the simultaneous
determination of tolperisone hydrochloride and diclofenac sodium in
their combined pharmaceutical formulation; Scientia Pharmaceutica,
(2013); 81: 983–1001.
32. USP 30/NF 25; The United States Pharmacopoeia, 30th Rev, and
The National Formulary, 25th ed., United States Pharmacopoeial
Convention, Inc., Rockville, (2007).
12 Parmar et al.