Selling Practices in Online Fixed-Price Marketplaces
7
Selling Practices in Online Fixed-price Marketplaces Adriano Pereira Diego Duarte Wagner Meira Jr. Federal University of Minas Gerais Department of Computer Science Av. Antˆ onio Carlos 6627 - ICEx - 31270-010 Belo Horizonte – Minas Gerais – Brazil {adrianoc, diegomd, meira}@dcc.ufmg.br Paulo G´ oes The University of Arizona Management Information Systems Dept. McClelland Hall 430, 1130 East Helen Street Tucson, AZ, USA [email protected] Abstract—In the last decade, there has been an explosion of online commercial activity enabled by the World Wide Web (WWW). In Brazil, probably by cultural influence, online auctions are not so popular, since users prefer fixed-price for online negotiation. This work presents a characterization and analysis of fixed-price online negotiations. Using actual data from a Brazilian marketplace, we analyze selling practices, considering seller profiles and selling strategies. We study and confirm several important hypotheses about selling practices in online marketplaces, which allow us to state interesting conclusions, such as: the product category impacts the seller profile and the selling strategies; and the best selling practices vary for different products. Keywords-e-marketplaces; selling practices; seller profile; I. I NTRODUCTION Electronic markets (e-markets) provide an online method to facilitate transactions between buyers and sellers that potentially provides support for all steps in the order fulfill- ment process. One of the biggest challenges in e-markets is the understanding of the complex procedure that guides the results of the negotiation. In order to address this challenge, it is essential to assess how the negotiation (offer) inputs are correlated to its outcomes. In the context of e-markets, there are important factors that can be considered to analyze selling practices, such as the seller’s reputation and experience, offer’s price, and duration, among others. Understanding how these factors affect the auction results is useful for buyers, sellers and e- market’s provider. The buyers may choose to negotiate with more trustable sellers and save money. On the other hand, the sellers can make decisions that increase the chances of achieving success in the negotiation or to sell faster. Finally, the marketplace can provide specific services that will help buyers and sellers, increasing its popularity and revenues. In this paper we characterize a fixed-price marketplace to investigate selling practices. Negotiation inputs are divided into: (1) seller characteristics and (2) offer configuration, which contains product characteristics. By characterizing seller’s attributes we may identify seller profiles and by analyzing how seller configures the offer, we can determine selling strategies. Together, they establish the selling prac- tice. Besides identifying and analyzing selling practices, Ta- ble I presents some hypotheses that motivate this research on selling practices. Id Hypothesis Description A There are different seller profiles for different product categories. B There are different seller strategies for different product categories. C Seller profiles choose different strategies to configure their offers. D The impact of the selling strategy on negotiation results depends on the seller profile. E For different product categories there are different selling practices. F The best and worst selling practices vary for different product categories. G The impact of the selling practices depends on the product category. Table I: Research Hypotheses These hypotheses address important questions about sell- ers and their practices in online marketplaces and previous works have not already provided enough information to study them. We are going to evaluate these hypotheses by performing an analysis of a real case study. Our results can be applied to provide support decision strategies for sellers. II. RELATED WORK E-markets are becoming more popular each day. One of the most popular e-market applications is online auctions, which have been studied extensively lately. For example, Bajari and Hortacsu [1] address how the starting bid, set by the seller, affects the winner’s course. Gilkeson and Reynolds [2] show the importance of a proper starting bid price to attract more bidders and make an auction successful. Studies about sellers have focused on reputation systems and trust in e-commerce. Some of them have analyzed the importance of reputation in auction outputs, mainly on final prices. In [3], the authors investigate the effectiveness of reputation systems and how reputation correlates to auction results. They conclude that reputation plays an important role in trust and leads to higher ending prices. In [4], it is analyzed the effect of trust and reputation on the profits obtained by intermediaries in electronic commercial connections. Different trust and distrust propagation schemes in e-commerce negotiations are studied and evaluated in [5]. Resnick et al. [6] show that sellers with high reputation may sell their products easier, but the gains in final prices are reduced. Using a controlled experiment, Resnick et al. [7] study more accurately the reputation’s impact on the auction outputs. The results show that, in general, bidders pay higher prices to sellers with higher reputation. Becherer and Halstead [8] sent e-mail questionnaires to some sellers of eBay. Using factor analysis they study seller profiles and selling strategies, showing the diversity of sellers and business practices on eBay. 2009 Ninth Annual International Symposium on Applications and the Internet 978-0-7695-3700-9/09 $25.00 © 2009 IEEE DOI 10.1109/SAINT.2009.20 71 2009 Ninth Annual International Symposium on Applications and the Internet 978-0-7695-3700-9/09 $25.00 © 2009 IEEE DOI 10.1109/SAINT.2009.20 71 2009 Ninth Annual International Symposium on Applications and the Internet 978-0-7695-3700-9/09 $25.00 © 2009 IEEE DOI 10.1109/SAINT.2009.20 71
-
Upload
independent -
Category
Documents
-
view
5 -
download
0
Transcript of Selling Practices in Online Fixed-Price Marketplaces

Selling Practices in Online Fixed-price Marketplaces
Adriano Pereira Diego Duarte Wagner Meira Jr.Federal University of Minas GeraisDepartment of Computer Science
Av. Antonio Carlos 6627 - ICEx - 31270-010Belo Horizonte – Minas Gerais – Brazil{adrianoc, diegomd, meira}@dcc.ufmg.br
Paulo GoesThe University of Arizona
Management Information Systems Dept.McClelland Hall 430, 1130 East Helen Street
Tucson, AZ, [email protected]
Abstract—In the last decade, there has been an explosionof online commercial activity enabled by the World WideWeb (WWW). In Brazil, probably by cultural influence, onlineauctions are not so popular, since users prefer fixed-price foronline negotiation. This work presents a characterization andanalysis of fixed-price online negotiations. Using actual datafrom a Brazilian marketplace, we analyze selling practices,considering seller profiles and selling strategies. We study andconfirm several important hypotheses about selling practicesin online marketplaces, which allow us to state interestingconclusions, such as: the product category impacts the sellerprofile and the selling strategies; and the best selling practicesvary for different products.
Keywords-e-marketplaces; selling practices; seller profile;
I. INTRODUCTIONElectronic markets (e-markets) provide an online method
to facilitate transactions between buyers and sellers thatpotentially provides support for all steps in the order fulfill-ment process. One of the biggest challenges in e-markets isthe understanding of the complex procedure that guides theresults of the negotiation. In order to address this challenge,it is essential to assess how the negotiation (offer) inputs arecorrelated to its outcomes.In the context of e-markets, there are important factors
that can be considered to analyze selling practices, suchas the seller’s reputation and experience, offer’s price, andduration, among others. Understanding how these factorsaffect the auction results is useful for buyers, sellers and e-market’s provider. The buyers may choose to negotiate withmore trustable sellers and save money. On the other hand,the sellers can make decisions that increase the chances ofachieving success in the negotiation or to sell faster. Finally,the marketplace can provide specific services that will helpbuyers and sellers, increasing its popularity and revenues.In this paper we characterize a fixed-price marketplace to
investigate selling practices. Negotiation inputs are dividedinto: (1) seller characteristics and (2) offer configuration,which contains product characteristics. By characterizingseller’s attributes we may identify seller profiles and byanalyzing how seller configures the offer, we can determineselling strategies. Together, they establish the selling prac-tice.Besides identifying and analyzing selling practices, Ta-
ble I presents some hypotheses that motivate this researchon selling practices.
Id Hypothesis DescriptionA There are different seller profiles for different product categories.B There are different seller strategies for different product categories.C Seller profiles choose different strategies to configure their offers.D The impact of the selling strategy on negotiation results depends on the
seller profile.E For different product categories there are different selling practices.F The best and worst selling practices vary for different product categories.G The impact of the selling practices depends on the product category.
Table I: Research Hypotheses
These hypotheses address important questions about sell-ers and their practices in online marketplaces and previousworks have not already provided enough information tostudy them. We are going to evaluate these hypotheses byperforming an analysis of a real case study. Our results canbe applied to provide support decision strategies for sellers.
II. RELATED WORK
E-markets are becoming more popular each day. One ofthe most popular e-market applications is online auctions,which have been studied extensively lately. For example,Bajari and Hortacsu [1] address how the starting bid, setby the seller, affects the winner’s course. Gilkeson andReynolds [2] show the importance of a proper starting bidprice to attract more bidders and make an auction successful.Studies about sellers have focused on reputation systems
and trust in e-commerce. Some of them have analyzed theimportance of reputation in auction outputs, mainly on finalprices. In [3], the authors investigate the effectiveness ofreputation systems and how reputation correlates to auctionresults. They conclude that reputation plays an importantrole in trust and leads to higher ending prices. In [4],it is analyzed the effect of trust and reputation on theprofits obtained by intermediaries in electronic commercialconnections. Different trust and distrust propagation schemesin e-commerce negotiations are studied and evaluated in [5].Resnick et al. [6] show that sellers with high reputation
may sell their products easier, but the gains in final pricesare reduced. Using a controlled experiment, Resnick etal. [7] study more accurately the reputation’s impact on theauction outputs. The results show that, in general, bidderspay higher prices to sellers with higher reputation. Bechererand Halstead [8] sent e-mail questionnaires to some sellersof eBay. Using factor analysis they study seller profilesand selling strategies, showing the diversity of sellers andbusiness practices on eBay.
2009 Ninth Annual International Symposium on Applications and the Internet
978-0-7695-3700-9/09 $25.00 © 2009 IEEE
DOI 10.1109/SAINT.2009.20
71
2009 Ninth Annual International Symposium on Applications and the Internet
978-0-7695-3700-9/09 $25.00 © 2009 IEEE
DOI 10.1109/SAINT.2009.20
71
2009 Ninth Annual International Symposium on Applications and the Internet
978-0-7695-3700-9/09 $25.00 © 2009 IEEE
DOI 10.1109/SAINT.2009.20
71

There are works that focus on selling strategies. However,in general these works evaluate online auctions. In [9] theauthors analyze the correlation between different variablesof the auction for sales on eBay. They categorize sellers bytheir negotiation frequency during data collection. Sellerswho sell large volumes are defined as retailers. The resultsshow that retailers who set low starting bids attract more bidsthan any other seller category. Moreover, they found out thatsellers with high reputation are able to better describe theirproducts.Buy-it-now prices (BIN) have become increasingly popu-
lar among buyers and sellers. Several empirical papers havestudied the Buy-it-now option in eBay. For example, in [10]and [11], it has been found that experienced sellers use theBIN price more frequently and that BIN price offers fromsellers with a high reputation are accepted more frequently.In [12], they focus on the consequences of bidder riskaversion on seller revenue. They find that the buy-it-nowauction raises seller revenue even if the buy price is notaccepted at the auction open by any bidder type.To the best of our knowledge, there is no work that
analyzes selling practices for a fixed-price e-market, as wedo in this work.
III. MARKETPLACE DESCRIPTIONThis section presents a short description of TodaOferta
(www.todaoferta.com.br), which is a marketplace from thelargest Latin America’s Internet service provider, namedUniverso OnLine Inc. (UOL).Table II shows a short summary of the TodaOferta dataset.
It embeds a significant sample of users, offers, and negotia-tions. Due to a confidentiality agreement, other quantitativeinformation about this dataset is not presented.
Coverage (time) Jun/2007 to Jul/2008#categories (top-level) 32#sub-categories 2,189
Average offers per user 10.1Negotiation options Fixed Price and Auction
Table II: TodaOferta Dataset - Summary
There are 32 top-level categories, which include 2,189sub-categories, in TodaOferta, providing a variety of distinctproducts, from collectibles to electronics and vehicles.The current top sales subcategories are Cell Phones, MP3
Players and Pen Drives. From the TodaOferta dataset, wechoose some dozens of thousands of offer negotiations toanalyze these top3 subcategories.These top3 sales subcategories together correspond to
almost 25% of all trading negotiations from the marketplace.Cell phones correspond to 14.51%, MP3 players to 7.29%,and Pen Drives to 2.69%.
IV. CHARACTERIZATIONThis section presents our characterization of TodaOferta,
using the dataset described in Section III. We are going todistinguish the sellers from their selling strategies and verifythe first two hypotheses, previously posed in Section I.
A. Identifying Negotiation InputsFirst we have to identify the inputs that will be part
of the characterization process. The set of variables thataffects the negotiation results vary. Thus, understanding howthese variables are correlated to the negotiation results is acomplex task. To deal with this complexity, we distinguishthe negotiation inputs according to their characteristics andfunctionalities, dividing them into seller’s characteristics andoffer configuration.The Seller’s characteristics provide information about
the person who is offering the product. An e-market mayprovide a variety of information about the seller, such as itsenrollment date on the system and a reputation measure.Offer configuration is the set of variables directly related
to a given product being negotiated, such as its price and itsstate (new or used).The set of seller’s characteristics supports the identifi-
cation of seller profiles(Section IV-D). In addition, offerconfiguration analysis allows the identification of sellingstrategies (Section IV-E).1) Seller’s characteristics: We employ a set of meaning-
ful information about sellers provided by TodaOferta:• Retailer: indicates whether the user is considered ahigh-volume seller.
• Certified: denotes the seller who has a quality certifi-cation which is provided by a third party organization.
• Qualification: is the seller reputation rating. Feed-back ratings (positive, negative or neutral) are cumula-tive, adding points to the seller’s score.
• Time (registration time): how long the seller has beenregistered in the e-market.
• Items: the amount of items the seller has already sold.2) Offer Configuration: We choose the following at-
tributes to characterize the offer configuration in TodaOferta:• Highlight: indicates when the offer is set to be adver-tised with highlight.
• Price: offer price of the product.• Duration: negotiation duration (in days).• Images: number of product pictures used in offer.• Quantity: the number of items in the offer.
B. Identifying Negotiation OutcomesAfter identifying the inputs of interest, it is necessary
to define the negotiation outcomes that will be evaluated.Different outcomes may be selected according to the goalsof the characterization. Examples of outcomes are the sale’sprice and the transaction’s qualification.These negotiation outcomes can be seen as success indi-
cators. We choose five indicators, as follows:• Price: the value of the closing price transaction.• Volume: the percentage of offer’s items that has beensold.
• Views: the number of offer’s visualizations (visits).• Qualification: is the transaction rating given by thebuyer to the seller.
• Duration: the amount of time spent since the offer wascreated until the transaction is complete.
727272

C. Data EngineeringWe pre-process the data to make the characterization more
robust. A small number of offers with inconsistent data andoutliers were removed from the dataset. It is also importantto say that we consider in this analysis only offers that havenegotiations. We consider the attributes of each category toperform the clustering. Moreover, we set the same weightto all attributes, normalizing them in the interval (0,1).
D. Identifying Seller ProfilesThe identification of seller profiles is based on the seller’s
characteristics. In order to identify seller profiles and sell-ing strategies, we employ a data mining technique calledclustering [13], which can be used to identify groups withsimilar characteristics in terms of their attributes.Many clustering algorithms have been proposed by lit-
erature [14]. We employ X-means[15], which is an effi-cient algorithm that extends the popular K-means [16] byestimating the best number of clusters k inherent to thedata. We use statistical metrics, such as average, medianand dispersion metrics (standard deviation, co-variance) toanalyze the characteristics of each profile.Table III shows the notation we defined to present the
values for each attribute. In order to simplify the analysis,we classify each of them according to the mean value (andconsidering standard deviation) to a scale. For the booleanvalues (Retailer and Certified), we adopt the labels Y (yes)or N (no). This notation will be also used in the analysis ofthe selling strategies.
Scale Notation (symbol) Meaning�� very low value� low value• average value� high value
�� very high value
Table III: Attribute values - Notation
In order to identify seller profiles we executed the X-means algorithm for different values of k on the sellerattributes, for each top3 product category. The best valuefound for k (number of clusters) for each top3 category is9 clusters, from which 23 are different (P0-P22).Tables IV, VI and VIII show all seller profiles (i.e,
clusters) for products cell phone, MP3 player and pen drive,respectively. Each one presents the cluster’s frequency (thenumber in parenthesis) and the characterization in termsof the seller characteristics, previously explained: Retailer,Certified, Qualification, Time, Items. Tables V, VII, and IXshow the success indicators for the same products.
Seller ProfileCluster Retailer Certif Qualif Time ItensP0 (5.5%) N N • �� �
P1 (10.3%) N N �� � ��
P2 (2.3%) N N �� �� �
P3 (16.9%) N Y �� � ��
P4 (50.7%) N N �� �� ��
P5 (2.0%) Y N �� �� ��
P6 (3.3%) Y N � � �
P7 (4.3%) Y Y � �� ��
P8 (4.7%) Y N � �� �
Table IV: Seller Profile - Cell Phones
Cell Phones - In general, these sellers are non-retailersand non-certified. 80.2% have very low qualification, from
Success IndicatorsCluster Price Volume Views Qualif DurP0 �� �� �� � ��
P1 � � �� � �
P2 �� � �� �� ��
P3 � � � � •
P4 • � �� � �
P5 � �� • �� •
P6 � � � �� •
P7 �� • • � •
P8 • �� �� �� ��
Table V: Seller Profile Outcomes - Cell Phones
which 87.2% are newcomers. Therefore, they are also sellerswith a very low amount of sold items. It is important toemphasize that all analyses are performed in comparison tothe average values of the attributes for each category.The most frequent profiles for cell phone are P4, P3 and
P1 that account for 77.9%. They follow the general charac-teristics explained (non-retailer, very low qualification, andsmall amount of sold items). They present variable time ofregistration, where almost 87% are new sellers.Analyzing the success indicators (Table V), we can see
that P7 represents retailers and certified sellers, whichachieve very high prices and high qualifications. Contradict-ing our expectation, this group presents low qualification andvery low quantity of sold items, compared to average valuesof this product category. P1 and P4 are only different w.r.t.experience (Time), which can explain why P1 gets betterprice and qualification than P4. P0 and P8 are newcomers,however their offers have many visits, which is probablyexplained by the strategies they adopt.It is interesting to note that the retailers who have sold
many items have a good qualification. The retailers achievevery high or high qualification.
Seller ProfileCluster Retailer Certif Qualif Time ItensP1 (9.6%) N N �� � ��
P4 (32.0%) N N �� �� ��
P6 (8.9%) Y N � � �
P9 (3.0%) N N � �� �
P10 (7.2%) N N � �� �
P11 (12.3%) N N �� � ��
P12 (5.1%) Y N �� � ��
P13 (2.9%) Y Y �� �� ��
P14 (19.1%) Y N � • ��
Table VI: Seller Profile - MP3 player
Success IndicatorsCluster Price Volume Views Qualif DurP1 • • • � ��
P4 � • �� • ��
P6 �� �� � �� �
P9 �� • �� �� ��
P10 � � � �� �
P11 �� �� � � ��
P12 �� �� �� �� ��
P13 �� • • �� �
P14 • • • �� �
Table VII: Seller Profile Outcomes - MP3 player
MP3 Player - It is the second top category in terms ofsales. In general, sellers who negotiate MP3 players are non-retailers (36% are retailer) and non-certified. 86% have verylow or low qualification, the largest portion of them (63.9%)are newcomers. 17% have sold many items, from which82.3% received good qualification and are retailers. It isinteresting to note that experient sellers (longest registrationtime) are not necessarily qualified.
737373

The most frequent profiles are P4, P14 and P11, whichcorrespond to 63.4% of all seller of this category. Theyare typically non-retailer (69.9%). P4 and P11 are similar,presenting very low qualification and amount of sold items.However, they have different experience in terms of registra-tion time. P14 has an average experience, is a retailer andpresents low qualification, although higher than P4 and P11.They have different time of registration, but almost 70% ofthem can be considered new sellers.The success indicators show that P13 is the unique retailer
and certified seller, achieving a fast selling and very highqualification. Despite this, its price is very low comparedto market average. The retailers are the unique sellers whoget very high qualification, but almost half of them sell byvery low prices. Analyzing P4 and P11, we can see that,despite their low experience, very low reputation and solditems, they get good results in terms of selling prices (high),views (low), and duration (very low), which can be laterinvestigated by analyzing their selling strategies.
Seller ProfileCluster Retailer Certif Qualif Time Itens
P4 (40.0%) N N �� �� ��
P15 (2.5%) N N �� �� �
P16 (11.9%) N N • �� •
P17 (9.6%) N N �� �� ��
P18 (4.2%) Y Y � �� ��
P19 (4.7%) Y Y � � �
P20 (7.5%) Y N � • ��
P21 (9.4%) Y N �� �� �
P22 (10.3%) Y N �� �� ��
Table VIII: Seller Profile - Pen drive
Success IndicatorsCluster Price Volume Views Qualif DurP4 � �� � � ��
P15 � �� �� �� ��
P16 �� • � �� ��
P17 • �� �� • ��
P18 �� �� • • �
P19 • • • � �
P20 • � �� • �
P21 • �� • • �
P22 �� � � �� ��
Table IX: Seller Profile Outcomes - Pen drive
Pen Drive - In general, sellers from Pen drive are non-retailers (36.1% are retailers, from which the most part haveexperience -71.5%). Almost all of them are non-certified andthe certified sellers (8.9%) are also retailers. 69.3% havevery low qualification. From retailers, the ones who havesold many itens also present good reputation. The other onespresent bad reputation (low and very low qualification). Allsellers who have reputation above average also have alreadysold more items than average amount of sold items of thisproduct category. From the set of sellers who are retailerand certified, almost half (47.1%) have good reputationand sold many items. The other half presents the oppositecharacteristics.The most frequent groups are P4, P16 and P22, which
together represent 62.2% of total. All of them are newcom-ers. Moreover, P16, which is non-retailer, is the one with thebest characteristics in this set. 80.8% of these sellers havevery low reputation and amount of sold items. Surprisingly,P22 is a group of retailers and has these characteristics,which we believe can be explained by the fact that theseretailers are also newcomers.
Analyzing Table IX, we can see that the two clustersthat have retailers and certification get some different re-sults in terms of success indicators. Surprisingly, the bestsuccessful sellers in terms of qualification and sale’s priceare newcomers (P15 and P22). P15 can be explained bythe fact that, besides this, they have good reputation andhigh amount of sold items. But P22 are sellers who havepresented bad reputation and very low amount of sales. Onlythe analysis of their selling strategies can help to clarify thisfact, one hypothesis is that the use of a very good strategyovercomes their limitations. Moreover, all non-retailers sellfast, probably because they would adopt strategies thathighlight offers. P4, which is the most popular profile, sellsfast and cheap, despite receiving low qualification.
E. Identifying Selling StrategiesSelling strategies are found by the set of offer configura-
tion inputs. We also run X-means and the best values foundare 11 (cell phone), 10 (MP3 player) and 7 (pen drive), fromwhich only one strategy appears for more than one group.Tables X, XII and XIV show each selling strategy for cell
phone, MP3 player and pen drive, respectively. Each onepresents the cluster’s frequency and their characterizationin terms of the offer attributes previously explained: High-light, Price, Duration, Images and Quantity. Tables XI, XIIIand XV show the success indicators for these categories.
Seller StrategiesCluster Used HL Price Dur Img QuantS0 (6.7%) N N • �� �� ��
S1 (17.3%) N Y • • � �
S2 (3.6%) N N • � • ��
S3 (8.8%) N Y • • �� �
S4 (5.1%) N N �� �� � ��
S5 (13.4%) N N � �� • ��
S6 (9.0%) N N � �� �� ��
S7 (5.6%) N N • �� �� ��
S8 (15.6%) N N �� �� �� ��
S9 (5.9%) Y N �� �� � ��
S10 (9.2%) N Y � � • ��
Table X: Selling Strategy - Cell Phones
Analysis Seller StrategiesStrategy Price Volume Views Qualif DurS0 • � �� � ��
S1 • • � �� �
S2 • �� �� • ��
S3 • • � �� �
S4 �� • �� � ��
S5 � • �� � ��
S6 � • �� �� •
S7 • � �� �� ��
S8 �� � �� • ��
S9 �� �� �� � �
S10 � �� �� �� ��
Table XI: Selling Strategy Outcomes - Cell Phones
Cell Phones - Table X shows the selling strategies forcell phones. In general, these strategies have new products(94.1%), 35.3% use highlight, present average market pricesor below, and very low quantity of items.The most frequent strategies are S1, S8, and S5, which
account for to 46.3%. They sell new items and set offerswith values of price, duration, images and quantity of itemson average or below market values.By evaluating the success indicators (Table XI), we can
see that the best volume of sales is achieved by S9, whichoffers used cell phones. The best qualifications are receivedby strategies that uses highlight. The lowest volume of sales
747474

are obtained by S2 and S10, what can be explained by thefact that these offers comprise several items.
Seller StrategiesCluster Used HL Price Dur Img Qty
S11 (10.2%) N Y � � • ��
S12 (11.4%) N Y �� � �� ��
S13 (14.5%) N Y �� � �� ��
S14 (8.3%) N Y � • � ��
S15 (11.0%) N N • � �� ��
S16 (8.3%) N Y �� �� • ��
S17 (14.6%) N Y �� � �� ��
S18 (1.2%) N Y � �� �� ��
S19 (3.6%) N N � � • ��
S20 (17.0%) N N �� � �� ��
Table XII: Selling Strategy - MP3 player
Analysis Seller StrategiesStrategy Price Volume Views Qualif DurS11 � � • • •
S12 �� �� • • •
S13 � �� • � •
S14 � �� � � •
S15 • �� � � �
S16 �� � � �� •
S17 �� �� �� �� ��
S18 �� �� �� �� ��
S19 �� �� �� • �
S20 �� � �� �� �
Table XIII: Selling Strategy Outcomes - MP3 player
MP3 Player - The selling strategies adopted for MP3players (Table XII) are only for new products, 68.5% usehighlight (2 times more than cell phone) and 70% presentaverage market prices or above (different from cell phone).Moreover, they have short duration and very low quantity.It is interesting to note that no strategy is equal to the onesof cell phones.The most frequent strategies are S20, S17, and S13,
which correspond to 46.1% together. These strategies presentsome similarities between them, but no attribute assumes thesame value for these three strategies.In terms of success indicators, we can see in Table XIII
that the best qualifications are received by strategies thathighlight offers. S17 has very large number of views,however S18 does not. Both sell at very low prices. S18
sells faster with very high qualification and cheap price,explaining the low number of views. The lowest volumesof sales are obtained by S14, S17, S18, and S19, what canbe explained by the fact that these offers announce manyitems. All strategies that sell at prices above market pricedid not receive a percentage of qualification above average.
Seller StrategiesCluster Used HL Price Dur Img QuantS0 (9.2%) N N • �� �� ��
S21 (17.1%) N Y • �� �� ��
S22 (7.4%) N Y �� � • ��
S23 (6.9%) N N �� �� �� ��
S24 (20.6%) N Y � �� �� ��
S25 (9.1%) N Y �� �� �� �
S26 (29.7%) N N �� �� �� ��
Table XIV: Selling Strategy - Pen drive
Analysis Seller StrategiesStrategy Price Volume Views Qualif DurS0 • �� �� • �
S21 • �� �� �� �
S22 �� �� � � �
S23 �� �� • • �
S24 � � �� � �
S25 �� � �� • ��
S26 �� �� �� �� ��
Table XV: Selling Strategy Outcomes - Pen drive
Pen Drives - Their selling strategies consist of newproducts, typically have average market prices or below,and 54.2% use highlight. They have very short duration andnumber of items. The only strategy that is also employed bycell phone sellers is S0.The most frequent strategies are S26, S24, and S21,
which account for 67.4%. They are similar in terms ofduration (very low) and offered quantity of items (very low).Analyzing success indicators (Table XV), we can see
that the best qualifications are received by strategies thathighlight offers (S21, S22). Moreover, the most visitedoffers are highlighted.
F. RemarksWe can present some conclusions about seller profiles
from the performed analysis: (i) most of the sellers havequalification below average; (ii) the retailers receive highor average qualifications, which can explain the first con-clusion; (iii) apparently, the seller’s experience (time ofregistration) is not enough to explain the success indicators;(iv) the top3 profiles represent a significant part of total ofsellers (from 62.2% to 77.9%), from which the profile P4
is very popular, occuring in all of them.We can state some conclusions about our analysis of
selling strategies: (i) almost all traded products are new; (ii)the frequency of highlighted offers varies for the categories,from 35.3% (cell phones) to 68.5% (MP3 players); (iii) thebest qualifications are received by strategies with highlight;(iv) in general, the strategies offer few items and have shortand very short duration; (v) the top3 strategies correspond toa significant part (from 46.1% to 67.4%), from which onlythe strategy S0 appears in both cell phone and pen drive.The hypothesis A is verified in this section, confirming
that “There are different seller profiles for different productcategories”. Moreover, the hypothesis B is also confirmed,since we show that “there are different seller strategies fordifferent product categories.”
V. SELLING PRACTICESIn this section we characterize the selling practices in
TodaOferta. A selling practice is defined as the sellingstrategy adopted by a seller profile. The number of potentialselling practices is the Cartesian product of seller profile andselling strategies.First, we have to evaluate the hypothesis C, which states
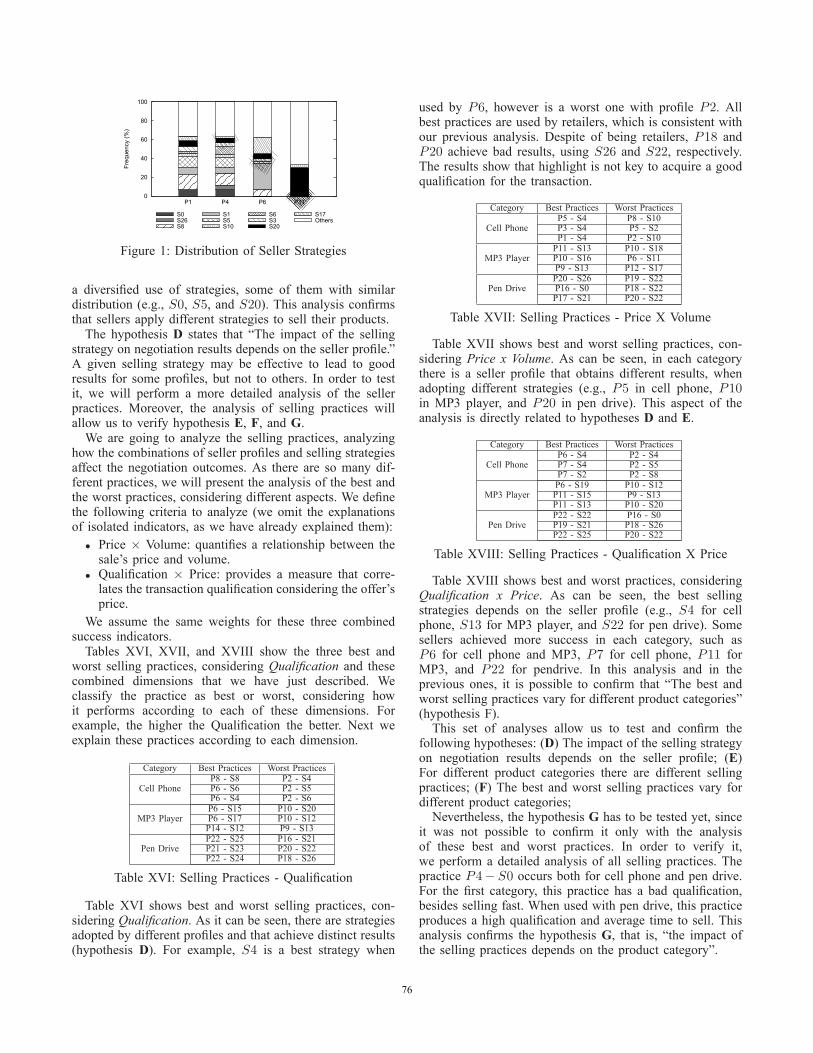
that “Seller profiles choose different strategies to configuretheir offers.” We are going to identify which selling strate-gies (S0 − S26) are adopted by the most common sellerprofiles. It is important to evaluate whether the same sellerprofile adopts or not the same selling strategies.Figure 1 shows a histogram of the selling strategies used
by the most common seller profiles: P1, P4, P6, and P11.Analyzing the results, it is possible to see that differentselling strategies (with different proportions) are adopted bydifferent seller profiles.There are strategies adopted by all of them (S20 and
S17), but in different proportions. P11 typically uses S20,while P6 prefers S1 and S17. Profiles P1 and P4 present
757575
0
20
40
60
80
100
P1 P4 P6 P11
Freq
uenc
y (%
)
S0S26S8
S1S5S10
S6S3S20
S17Others
Figure 1: Distribution of Seller Strategies
a diversified use of strategies, some of them with similardistribution (e.g., S0, S5, and S20). This analysis confirmsthat sellers apply different strategies to sell their products.The hypothesis D states that “The impact of the selling
strategy on negotiation results depends on the seller profile.”A given selling strategy may be effective to lead to goodresults for some profiles, but not to others. In order to testit, we will perform a more detailed analysis of the sellerpractices. Moreover, the analysis of selling practices willallow us to verify hypothesis E, F, and G.We are going to analyze the selling practices, analyzing
how the combinations of seller profiles and selling strategiesaffect the negotiation outcomes. As there are so many dif-ferent practices, we will present the analysis of the best andthe worst practices, considering different aspects. We definethe following criteria to analyze (we omit the explanationsof isolated indicators, as we have already explained them):
• Price × Volume: quantifies a relationship between thesale’s price and volume.
• Qualification × Price: provides a measure that corre-lates the transaction qualification considering the offer’sprice.
We assume the same weights for these three combinedsuccess indicators.Tables XVI, XVII, and XVIII show the three best and
worst selling practices, considering Qualification and thesecombined dimensions that we have just described. Weclassify the practice as best or worst, considering howit performs according to each of these dimensions. Forexample, the higher the Qualification the better. Next weexplain these practices according to each dimension.
Category Best Practices Worst PracticesP8 - S8 P2 - S4
Cell Phone P6 - S6 P2 - S5P6 - S4 P2 - S6P6 - S15 P10 - S20
MP3 Player P6 - S17 P10 - S12P14 - S12 P9 - S13P22 - S25 P16 - S21
Pen Drive P21 - S23 P20 - S22P22 - S24 P18 - S26
Table XVI: Selling Practices - Qualification
Table XVI shows best and worst selling practices, con-sidering Qualification. As it can be seen, there are strategiesadopted by different profiles and that achieve distinct results(hypothesis D). For example, S4 is a best strategy when
used by P6, however is a worst one with profile P2. Allbest practices are used by retailers, which is consistent withour previous analysis. Despite of being retailers, P18 andP20 achieve bad results, using S26 and S22, respectively.The results show that highlight is not key to acquire a goodqualification for the transaction.
Category Best Practices Worst PracticesP5 - S4 P8 - S10
Cell Phone P3 - S4 P5 - S2P1 - S4 P2 - S10P11 - S13 P10 - S18
MP3 Player P10 - S16 P6 - S11P9 - S13 P12 - S17P20 - S26 P19 - S22
Pen Drive P16 - S0 P18 - S22P17 - S21 P20 - S22
Table XVII: Selling Practices - Price X Volume
Table XVII shows best and worst selling practices, con-sidering Price x Volume. As can be seen, in each categorythere is a seller profile that obtains different results, whenadopting different strategies (e.g., P5 in cell phone, P10
in MP3 player, and P20 in pen drive). This aspect of theanalysis is directly related to hypotheses D and E.
Category Best Practices Worst PracticesP6 - S4 P2 - S4
Cell Phone P7 - S4 P2 - S5P7 - S2 P2 - S8P6 - S19 P10 - S12
MP3 Player P11 - S15 P9 - S13P11 - S13 P10 - S20P22 - S22 P16 - S0
Pen Drive P19 - S21 P18 - S26P22 - S25 P20 - S22
Table XVIII: Selling Practices - Qualification X Price
Table XVIII shows best and worst practices, consideringQualification x Price. As can be seen, the best sellingstrategies depends on the seller profile (e.g., S4 for cellphone, S13 for MP3 player, and S22 for pen drive). Somesellers achieved more success in each category, such asP6 for cell phone and MP3, P7 for cell phone, P11 forMP3, and P22 for pendrive. In this analysis and in theprevious ones, it is possible to confirm that “The best andworst selling practices vary for different product categories”(hypothesis F).This set of analyses allow us to test and confirm the
following hypotheses: (D) The impact of the selling strategyon negotiation results depends on the seller profile; (E)For different product categories there are different sellingpractices; (F) The best and worst selling practices vary fordifferent product categories;Nevertheless, the hypothesis G has to be tested yet, since
it was not possible to confirm it only with the analysisof these best and worst practices. In order to verify it,we perform a detailed analysis of all selling practices. Thepractice P4− S0 occurs both for cell phone and pen drive.For the first category, this practice has a bad qualification,besides selling fast. When used with pen drive, this practiceproduces a high qualification and average time to sell. Thisanalysis confirms the hypothesis G, that is, “the impact ofthe selling practices depends on the product category”.
767676

VI. CONCLUSIONThis paper presents a characterization of fixed-price online
negotiations, using actual data from TodaOferta marketplace.We analyze the seller practices, considering seller profilesand selling strategies. More than identifying and analyzingseller practices, we investigate some hypotheses.We characterize the set of offers that have negotiations.
From this group, we selected the top3 categories (cellphones, MP3 players, and pen drive) in terms of amountof sales to perform a detailed characterization.First, our analyses confirm that “There are different seller
profiles for different product categories” (hypothesis A) and“There are different seller strategies for different categories.”(hypothesis B).We also study hypotheses C and D, confirming they are
also true. The validation of C shows that the seller behavioris not random, that is, different sellers adopt their strategiesaccording to their interests, capacities, and experience. Thehypothesis D suggests that choosing a selling strategy isnot simple, since it is important to consider the seller’scharacteristics to evaluate the efficacy of a selling strategy.Finally, the analysis of the best and worst selling practices
enables us to study and confirm the three last hypotheses:(E) for different product categories there are different sellingpractices; (F) the best and worst selling practices vary fordifferent product categories; and (G) the impact of theselling practices depends on the product category.We extract some interesting conclusions from this re-
search, such as: (i) There are a small number of retailersin TodaOferta and also a small percentage of negotiationsperformed by them (25.2%); (ii) The newcomers correspondto 47.02% of all transactions of top3 categories; (iii) Usinghighlight is an efficient mechanism to attract visits, as canbe observed by the success indicator Views. These conclu-sions illustrate how complex are this e-market interactions,showing the relevance of this kind of research.The current results may be applied to develop mechanisms
to provide decision support tools to recommend negotiationpractices to sellers and buyers. Moreover, the results canbe adopted to implement personalized marketing strategies,considering the selling practices.As future work we will perform a similar characterization
of offers that do not result in sale, comparing the results withthe ones obtained in this work. Also, we want to characterizethe buyer profiles, investigating the buying practices.
VII. ACKNOWLEDGMENTSThis work was partially sponsored by Universo OnLine
S. A. - UOL (www.uol.com.br) and partially supported bythe Brazilian National Institute of Science and Technologyfor the Web (CNPq grant no. 573871/2008-6), INFOWEB(CNPQ no. 55.0874/2007-0), CAPES, Finep, and Fapemig.
REFERENCES[1] P. Bajari and A. Hortacsu, “The winner’s curse, reserve
prices, and endogenous entry: Empirical insights from ebayauctions,” RAND Journal of Economics, vol. 34, no. 2, pp.329–55, 2003.
[2] J. Gilkeson and K. Reynolds, “Determinants of internetauction success and closing price: An exploratory study,”Psychology & Marketing, vol. 20, no. 6, pp. 537–566, 2003.
[3] S. Ba and P. A. Pavlou, “Evidence of the effect of trustbuilding technology in electronic markets: price premiumsand buyer behavior,” MIS Quarterly, vol. 26, no. 3, pp. 243–268, 2002.
[4] T. B. Klos and F. Alkemade, “Trusted intermediating agentsin electronic trade networks,” in AAMAS ’05: Proc. of the4th Int’l Conference on Autonomous Agents and MultiagentSystems. NY, USA: ACM, 2005, pp. 1249–1250.
[5] R. Guha, R. Kumar, P. Raghavan, and A. Tomkins, “Propa-gation of trust and distrust,” in WWW ’04: Proc. of the 13thInt’l Conference on World Wide Web. New York, NY, USA:ACM, 2004, pp. 403–412.
[6] P. Resnick and R. Zeckhauser, “Trust among strangers ininternet transactions: Empirical analysis of ebay’s reputationsystem,” The Economics of the Internet and E-Commerce, vol.edited by M.R. Baye. Amsterdam: Elsevier Science B.V., pp.127–157, 2002.
[7] P. Resnick, R. Zeckhauser, J. Swanson, and K. Lockwood,“The value of reputation on ebay: A controlled experiment,”School of Information, University of Michigan, vol. AnnArbor, Michigan, USA, p. 34, 2003.
[8] R. C. Becherer and D. Halstead, “Characteristics and internetmarketing strategies of online auction sellers,” Int’l Journal ofInternet Marketing and Advertising, vol. 1, no. 1, pp. 24–36,2004.
[9] S. Anderson, D. Friedman, G. Milam, and N. Singh,“Seller strategies on ebay,” EconWPA, Industrial Organization0412004, Dec. 2004.
[10] M. R. Durham, Y. and S. Standifird, “ebay’s buy-it-nowfunction: Who, when and how,” Topics in Economic Analysis& Policy, vol. 4, no. 1, p. 28, 2004.
[11] S. Anderson, D. Friedman, G. Milam, and N. Singh, “Buyit now: A hybrid internet market institution,” EconWPA,Industrial Organization 0412003, Dec. 2004. [Online].Available: http://ideas.repec.org/p/wpa/wuwpio/0412003.html
[12] J. Wooders and S. S. Reynolds, “Auctions with a buy price,”Econometric Society, Econometric Society 2004 NorthAmerican Summer Meetings 130, Aug. 2004. [Online].Available: http://ideas.repec.org/p/ecm/nasm04/130.html
[13] H.-H. Bock, “Data mining tasks and methods: Classification:the goal of classification,” pp. 254–258, 2002.
[14] S. Chelcea, A. D. Silva, Y. Lechevallier, D. Tanasa, andB. Trousse, “Pre-processing and clustering complex data in e-commerce domain,” in 1st Int’l Workshop on Mining ComplexData MCD’05. Houston, Texas: IEEE, November 2005.
[15] D. Pelleg and A. W. Moore, “X-means: Extending k-meanswith efficient estimation of the number of clusters,” in Proc.of the 17th Int’l Conf. on Machine Learning. San Francisco,CA, USA: Morgan Kaufmann Publ., 2000, pp. 727–734.
[16] J. Hartigan, Clustering Algorithms. New York, NY: JohnWiley and Sons, Inc., April 1975.
777777