
SELLING OUR RANGATAHI SHORT (final)
14
1 | Selling our Rangatahi Short (10 Oct) | Social Policy & Parliamentary Unit | www.salvationarmy.org.nz/socialpolicy SELLING OUR RANGATAHI SHORT By Alan Johnson, Social Policy Analyst, The Salvation Army Social Policy & Parliamentary Unit A PAPER PRESENTED TO THE SOCIETY OF YOUTH HEALTH PROFESSIONALS AOTEAROA NEW ZEALAND CONFERENCE, AUCKLAND, 10 OCTOBER 2014 The word ‘rangatahi’ is widely used in New Zealand to refer to youth or adolescents, teenagers and young adults. The word comes from a well-known Maori proverb or whakatauki: ‘ka pu te ruha, ka hao te rangatahi — as an old net withers, another is remade.’ This proverb does not just talk about old things being replaced by newer things, but of the potential embodied in these newer things. The reference to our youth as rangatahi is a reference to this potential. Such a reference might be seen as somewhat ironic given the comparative lack of priority given to youth needs and youth issues within public policy. This lack of priority is apparent in policy areas such as employment, vocational training, health, and income support. This lack of priority is probably not intentional but rather incidental – youth needs and issues are simply ignored as a policy or budget priority because ‘other things’ are more urgent or more compelling. These ‘other things’ are decided by politics and in particular by what gets noticed, or what is attractive, or what suits the interests of those with power. It is suggested in this paper that it is the needs of an aging population, and not the needs of children and youth, which dominate the political agenda and hence the policy agenda and budgets. Such an observation or claim is not made in order to pit the interests of old and aging against those of the young in some sort of blame game or political contest. This observation is made to bring attention to the current biases and preferences at play in New Zealand’s politics and policy making. If we are able to recognise these biases and preferences, we may be more able to build a broad consensus around how the needs of the young and the old may be fairly served by public policy and programmes. A political framing In 2008, when John Key promised that ‘National will retain all the superannuation entitlements and eligibility rules that our senior citizens currently enjoy. We will keep this pledge and I will resign as Prime Minister, and as a member of our Parliament, rather than break it’ i , he set the framework for inter-generational politics for his leadership term – however long this may be. This was an astute political move because every politician knows the huge electoral weight which is behind doing little or nothing about New Zealand Superannuation. In 2008, when Mr Key made this promise, the population aged over 55-years-old, and so most affected by retirement income policies, made up 31% of the voting-age population. At the end of his second term as Prime Minister, this proportion had risen to 34% and by 2021, it may exceed 38% ii . Moreover, older people are more likely to vote than younger people so the electoral weight of this growing over 55 age-group will be amplified. Political scientist, Professor Jack Vowles, suggests that at the 2011 Election, just over 50% of 18-year-olds who were enrolled actually voted, while about 82% of
-
Upload
independent -
Category
Documents
-
view
1 -
download
0
Transcript of SELLING OUR RANGATAHI SHORT (final)

1 | Selling our Rangatahi Short (10 Oct) | Social Policy & Parliamentary Unit | www.salvationarmy.org.nz/socialpolicy
SELLING OUR RANGATAHI SHORT
By Alan Johnson, Social Policy Analyst, The Salvation Army Social Policy & Parliamentary Unit
A PAPER PRESENTED TO THE SOCIETY OF YOUTH HEALTH PROFESSIONALS AOTEAROA NEW ZEALAND
CONFERENCE, AUCKLAND, 10 OCTOBER 2014
The word ‘rangatahi’ is widely used in New Zealand to refer to youth or adolescents, teenagers and
young adults. The word comes from a well-known Maori proverb or whakatauki: ‘ka pu te ruha, ka
hao te rangatahi — as an old net withers, another is remade.’ This proverb does not just talk about old
things being replaced by newer things, but of the potential embodied in these newer things. The
reference to our youth as rangatahi is a reference to this potential.
Such a reference might be seen as somewhat ironic given the comparative lack of priority given to
youth needs and youth issues within public policy. This lack of priority is apparent in policy areas
such as employment, vocational training, health, and income support.
This lack of priority is probably not intentional but rather incidental – youth needs and issues are
simply ignored as a policy or budget priority because ‘other things’ are more urgent or more
compelling. These ‘other things’ are decided by politics and in particular by what gets noticed, or
what is attractive, or what suits the interests of those with power.
It is suggested in this paper that it is the needs of an aging population, and not the needs of children
and youth, which dominate the political agenda and hence the policy agenda and budgets. Such an
observation or claim is not made in order to pit the interests of old and aging against those of the
young in some sort of blame game or political contest. This observation is made to bring attention to
the current biases and preferences at play in New Zealand’s politics and policy making. If we are able
to recognise these biases and preferences, we may be more able to build a broad consensus around
how the needs of the young and the old may be fairly served by public policy and programmes.
A political framing
In 2008, when John Key promised that ‘National will retain all the superannuation entitlements and
eligibility rules that our senior citizens currently enjoy. We will keep this pledge and I will resign as
Prime Minister, and as a member of our Parliament, rather than break it’ i, he set the framework for
inter-generational politics for his leadership term – however long this may be.
This was an astute political move because every politician knows the huge electoral weight which is
behind doing little or nothing about New Zealand Superannuation. In 2008, when Mr Key made this
promise, the population aged over 55-years-old, and so most affected by retirement income policies,
made up 31% of the voting-age population. At the end of his second term as Prime Minister, this
proportion had risen to 34% and by 2021, it may exceed 38%ii.
Moreover, older people are more likely to vote than younger people so the electoral weight of this
growing over 55 age-group will be amplified. Political scientist, Professor Jack Vowles, suggests that at the
2011 Election, just over 50% of 18-year-olds who were enrolled actually voted, while about 82% of

2 | Selling our Rangatahi Short (10 Oct) | Social Policy & Parliamentary Unit | www.salvationarmy.org.nz/socialpolicy
enrolled 60-year-olds did soiii. The Electoral Commission reported just prior to the 2014 Election that
76.5% of 18 to 24-year-olds had enrolled to vote while 98.6% of 55 to 70-year-olds had. iv All this means
that almost half of the 2.4 million votes cast in the 2014 Election were probably made by voters aged
over 55.
We can never know whether Mr Key’s electoral promise was based on deeply held principles of
fairness to older people or to an astute political calculation, but as a gesture it does not make a lot of
sense fiscally. In 2008, when he made his commitment not to mess with Superannuation, the
programme cost $7.3 billion or 12.6% of core Crown expenditure. In 2014, this cost had risen to $10.9
billion or 15.1% of expenditure, and by 2017 New Zealand Superannuation will cost an expected $12.7
billion or 16.5% of core Crown expenditure.v
This cost blowout was entirely predictable but has been managed by a fiscally conservative
Government, which openly celebrates its efforts at reducing the size of Government in the
economyvi. This means, of course, that rising expenditures in one area must be offset by declining
expenditure somewhere else, unless of course the economy grows rapidly and the Government
becomes munificent. We are seeing such declines across a number of areas including health, tertiary
education and income support for families. Within these declines, we are seeing a deliberate
political and fiscal trade-off between the interests of younger citizens and the interests of older
citizens.
At the time of the 2014 Election, there were more than 650,000 people receiving New Zealand
Superannuation — a staggering 25% increase on the numbers doing so in 2008 when Mr Key made his
pledge. Forty per cent of these 650,000 people rely almost entirely on superannuation as their sole
source of income. For a further 20%, superannuation makes up 80% or more of their income. While a
clear majority of people receiving superannuation rely almost entirely on it to survive , around one in
three older New Zealanders, who receive it, have at least as much income again from other sources
such as savings, investments and employmentvii. The likely cost of the support given to this wealthier
one third of over 65-year-olds is around $3.2 billion per annum.
This $3.2 billion should be seen in the context of the $4.6 billion being spent on working age benefits
and the $2.5 billion on Working for Families’ supports. While it is not suggested here that $3.2 billion
could be saved by changing entitlement to superannuation, it is important to recognise the scale of the
commitments and trade-offs which are implicit in any government’s unwillingness to address the
impact of an aging population and the growing cost of our main retirement income programme.
The employment fortunes of the young and the old
The employment picture of over-65s receiving New Zealand Superannuation is perhaps the most
startling. Presently there are around 120,000 to 130,000 people over 65 still working in the labour
force. This figure is nearly double that of the over-65s workforce prior to the GFC in 2007. In fact, the
growth of employment of workers of who have passed retirement age has largely been unaffected
by the slump in job numbers immediately following the GFC in 2008 and 2009. This trend is shown
on Figure 1.

3 | Selling our Rangatahi Short (10 Oct) | Social Policy & Parliamentary Unit | www.salvationarmy.org.nz/socialpolicy
Figure 1 also compares the employment fortunes of the over-65s to those of 15 to 19-year-olds.
Essentially, the recession following the GFC took 30,000 to 40,000 15 to 19-year-olds out of the
workforce and the subsequent economic recovery has not seen these jobs return.
This slump in the employment fortunes of teenagers has been disguised by definitions. The official
unemployment rate quoted in the media, and sourced from Statistics New Zealand’s Household
Labour Force Survey (HLFS), requires an out-of-work person to be immediately available for work
and to be actively seeking a job. People who have become discouraged in their job search, or who
have decided, because of poor job prospects, to undertake full-time training or education are not
considered to be unemployed.
Figure 1: Employment of 15 to 19 year olds and over-65s 2004-2014viii
This definition means that the official rate of youth unemployment has been reduced by lower rates
of participation of 15 to 19-year-olds in the labour market. This trend is shown in Figure 2. During
2007 and immediately prior to the GFC, labour market participation of 15 to 19-year-olds averaged
more than 56%, while over the past 12 months (to 30 June 2014), this rate has averaged 45%.
Against a population of 15 to 19 years of around 310,000 people, this lower participation rate
translates into 35,000 people out of work, who in better times would be employed.
Figure 2 also reports the official unemployment rate for 15 to 19-year-olds over the last seven years.
This data shows an increase in this rate from around 15% prior to the GFC to around 25% in 2014.

4 | Selling our Rangatahi Short (10 Oct) | Social Policy & Parliamentary Unit | www.salvationarmy.org.nz/socialpolicy
Figure 2: Participation & unemployment rates for 15 – 19-year-olds 2007-2014
If in 2007, more than 56% of 15 to 19-year-olds wanted to be working, what has changed now that
has brought this rate down to 45% - except lack of opportunity. If this higher participation rate of
56% more accurately demonstrates young people’s preferences to be in work rather than training,
what would youth unemployment look like if we applied this higher rate to the job figures for 15 to
19-year-olds today?
Figure 3 offers such a picture for the last seven years, and compares the official unemployment rate
(as reported by the HLFS) with the unemployment rate based on the much higher participation rate
of 56%. Essentially, this measure of unemployment has it rising from around 15% pre-GFC to around
35% today. Such a rate is comparable to those emerging from Western Europe.
Figure 3: Official & disguised unemployment rates for 15- 19-year-olds 2007-2014
There does not appear to have been a great deal of attention paid to such high and persistent rates of
youth unemployment – either from the political left or the right. Youth unemployment did not feature
5 | Selling our Rangatahi Short (10 Oct) | Social Policy & Parliamentary Unit | www.salvationarmy.org.nz/socialpolicy
prominently in the 2014 General Election campaign. The National Party appears to have run a ‘look
how good things are going’ type of campaign, while opposition parties raised issues around child
poverty, the need for smaller classroom sizes and the prospect that the Government is about to
conduct mass surveillance of citizens. The health and wellbeing of our youth appears to have gained
scant attention and, for those of us interested in such issues, this has to be seen as discouraging.
This lack of political interest in the status and future of our youth has translated more or less into a
fairly indifferent response through public policy and tax funded programmes. There is however some
recent evidence that more attention is being given to the truly disadvantaged groups of youth
although such attention is coming at the expense of others — both young and not-so-young, who
probably cannot afford to have fewer opportunities and resourcesix.
Government’s overall budget priorities
There is a trick played by Ministers around Budget time to make a great deal out over very little, and
to forget to mention the big picture around overall budget settings and priorities. In the fortnight
prior to Budget day, the public is bombarded by press statements which announce the
commencement of a new programme or the roll out of a new policy. Most often these
announcements involve tens rather than hundreds of millions of dollars which will be spent over
three or four years. Often, the money has been taken from another budget or is so-called ‘new’
money, which is really the allowance built into any budget for inflation.
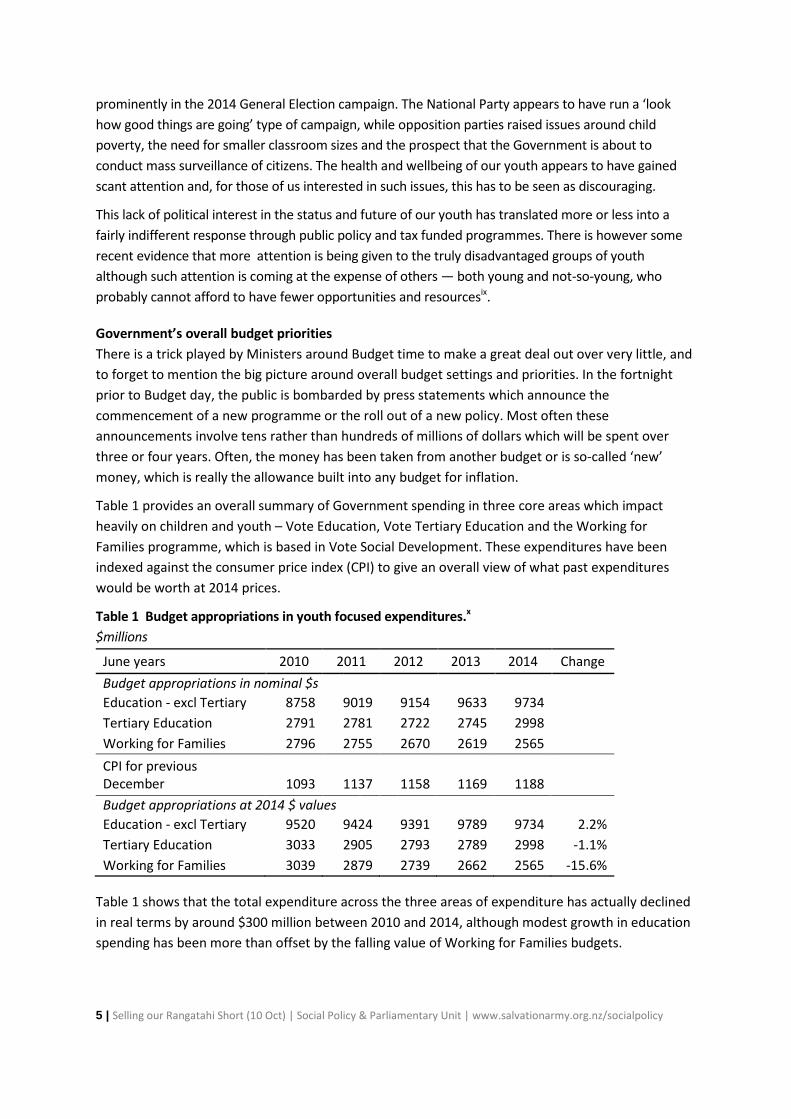
Table 1 provides an overall summary of Government spending in three core areas which impact
heavily on children and youth – Vote Education, Vote Tertiary Education and the Working for
Families programme, which is based in Vote Social Development. These expenditures have been
indexed against the consumer price index (CPI) to give an overall view of what past expenditures
would be worth at 2014 prices.
Table 1 Budget appropriations in youth focused expenditures.x
$millions
June years 2010 2011 2012 2013 2014 Change
Budget appropriations in nominal $s
Education - excl Tertiary 8758 9019 9154 9633 9734
Tertiary Education 2791 2781 2722 2745 2998
Working for Families 2796 2755 2670 2619 2565
CPI for previous
December 1093 1137 1158 1169 1188
Budget appropriations at 2014 $ values
Education - excl Tertiary 9520 9424 9391 9789 9734 2.2%
Tertiary Education 3033 2905 2793 2789 2998 -1.1%
Working for Families 3039 2879 2739 2662 2565 -15.6%
Table 1 shows that the total expenditure across the three areas of expenditure has actually declined
in real terms by around $300 million between 2010 and 2014, although modest growth in education
spending has been more than offset by the falling value of Working for Families budgets.

6 | Selling our Rangatahi Short (10 Oct) | Social Policy & Parliamentary Unit | www.salvationarmy.org.nz/socialpolicy
For comparison and reiteration, spending on New Zealand Superannuation has risen from $8.29
billion in the 2009/10 year to an expected $10.89 billion in 2013/14 – a 21% increase in inflation-
adjusted terms.
Table 2 reports Budget allocations within Vote Tertiary Education, and indexes these against inflation
as well. The ‘Student Achievement Component (SAC) is the core of the tertiary education funding
mechanism. It essentially funds teaching and course delivery at universities, polytechs, waanaga and
private training establishments (PTEs). Between 2010 and 2014, this budget grew a credible 15% in real
terms while the overall budget tertiary education budget has shrunk marginally. This growth appears
to be mainly due a change in the funding model around 2011. With this change, tertiary education
institutions received less non-SAC funding at about the same levels as the increase in SAC funding. As
discussed below, it is doubtful that these changes have either increased the quantum of learning
actually delivered by tertiary education providers or made tertiary education any cheaper for students.
The second main youth-related component of Vote – Tertiary Education is the ‘Training for Designated
Groups’ budget which is worth around $300 million annually, or about 10% of the over overall
appropriation. This budget is mainly used to fund the delivery of entry level courses (Levels 1 and 2) for
learners who have not succeeded within the compulsory education system, and is most often
delivered by PTEs and waanaga. The value of this budget has changed very little since 2007/08 xi.
In other words, the budget, which we would expect would fund training and second chance learning
for unemployed and at-risk youth, was cut during the recession and subsequent recovery and during
a time when youth unemployment rose from around 15% to more than 35%. While recent increases
in this budget are likely to be highlighted by Government, these increases merely reinstate the level
of spending (in inflation adjusted terms) which existed in 2007/08.
Table 2: Budget appropriations for tertiary educationxii
$millions
June years ending 2010 2011 2012 2013 2014 Change 2010-14
Budget appropriations in nominal $s
Student achievement component 1618 1835 2005 2022 2028
Training for designated groups 295 269 244 253 313
Total appropriation 2791 2781 2722 2745 2998
CPI for previous December 1093 1137 1158 1169 1188
Budget appropriations at 2014 $ values
Student achievement component 1759 1917 2057 2055 2028 15.3%
Training for designated groups 320 281 250 257 313 -2.4%
Total appropriation 3033 2905 2793 2789 2998 -1.1%
Counting at-risk youth
Most people working with youth would be familiar with the term NEET – ‘Not in Employment,
Education or Training’. NEET youth are seen to be most at risk of anti-social behaviour and perhaps
of self-destructive behaviour, and it seems to be for these reasons that they are of interest to policy

7 | Selling our Rangatahi Short (10 Oct) | Social Policy & Parliamentary Unit | www.salvationarmy.org.nz/socialpolicy
makers. NEET youth are of such interest to these people that Statistics New Zealand makes an effort
to estimate how many of them there are and where they live.
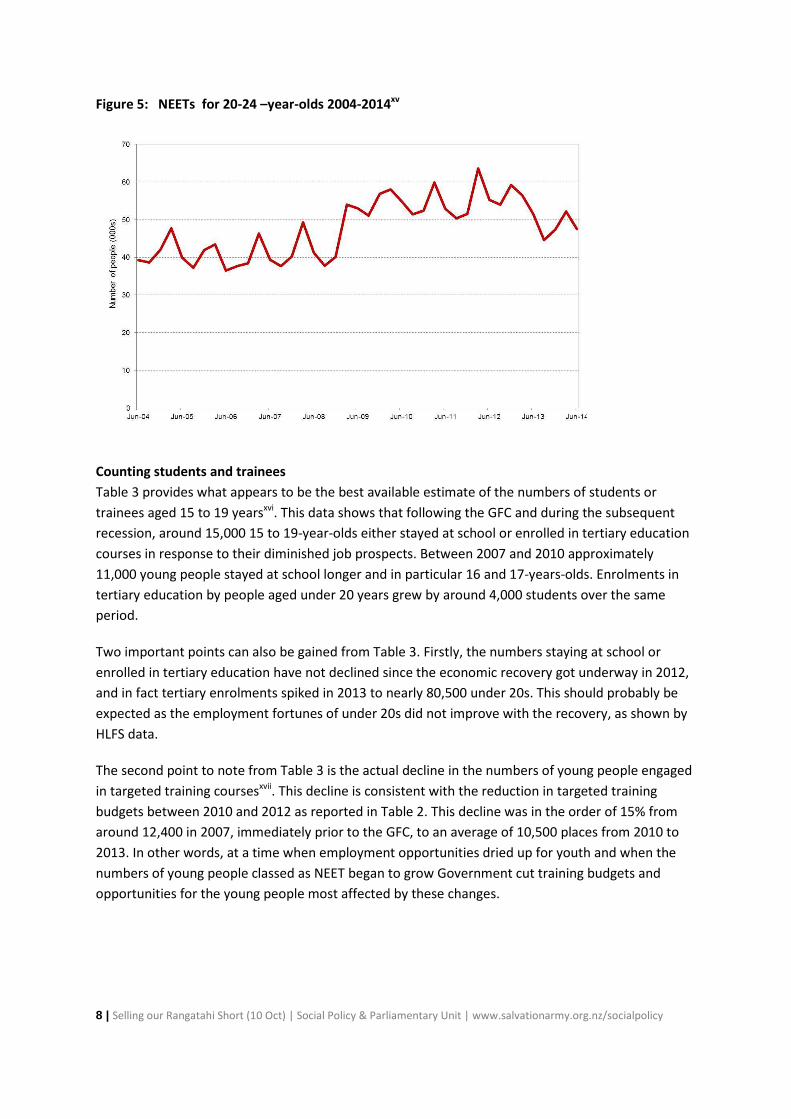
These estimates are reported in Figure 4 for 15 to 19-year-olds and Figure 5 for 20 to 24-year-olds.
Because these estimates are based on a sample survey ( the HLFS), they are prone to some moderate
errorsxiii and because of the seasonal nature of younger peoples’ work patterns, we should expect the
significant fluctuations shown in Figures 4 and 5. These fluctuations notwithstanding, several
noteworthy trends emerge from this data.
1. The number of NEET youth aged 15 to 19 years grew slightly on account of the recession post-
GFC. This increase was from 25,000 people to around 30,000 people.
2. The number of NEET 15 to 19 years has fallen back to pre-GFC days from 2012 onwards
3. The number of NEET people aged 20 to 24 is about 1.5 times larger than the number aged 15 to
19, but we should expect this given that most 15 and 16-year-olds are likely to be in school.
4. The number of 20 to 24-year-old NEETs rose from around 40,000 to around 55,000 as a
consequence of the GFC, and has only fallen very gradually since 2012.
The estimates for 15 to 19 NEET youth should be compared with other estimates from the HLFS,
which are reported in Figure 1 above. These other estimates suggest that 35,000 to 40,000 fewer 15
to 19-year-olds have jobs today than prior to the GFC. So, where have the missing 30,000 or so 15 to
19-year-olds gone? Into further education and training?
Figure 4: NEETs for 15- 19-year-olds 2004-2014xiv
8 | Selling our Rangatahi Short (10 Oct) | Social Policy & Parliamentary Unit | www.salvationarmy.org.nz/socialpolicy
Figure 5: NEETs for 20-24 –year-olds 2004-2014xv
Counting students and trainees
Table 3 provides what appears to be the best available estimate of the numbers of students or
trainees aged 15 to 19 yearsxvi. This data shows that following the GFC and during the subsequent
recession, around 15,000 15 to 19-year-olds either stayed at school or enrolled in tertiary education
courses in response to their diminished job prospects. Between 2007 and 2010 approximately
11,000 young people stayed at school longer and in particular 16 and 17-years-olds. Enrolments in
tertiary education by people aged under 20 years grew by around 4,000 students over the same
period.
Two important points can also be gained from Table 3. Firstly, the numbers staying at school or
enrolled in tertiary education have not declined since the economic recovery got underway in 2012,
and in fact tertiary enrolments spiked in 2013 to nearly 80,500 under 20s. This should probably be
expected as the employment fortunes of under 20s did not improve with the recovery, as shown by
HLFS data.
The second point to note from Table 3 is the actual decline in the numbers of young people engaged
in targeted training coursesxvii. This decline is consistent with the reduction in targeted training
budgets between 2010 and 2012 as reported in Table 2. This decline was in the order of 15% from
around 12,400 in 2007, immediately prior to the GFC, to an average of 10,500 places from 2010 to
2013. In other words, at a time when employment opportunities dried up for youth and when the
numbers of young people classed as NEET began to grow Government cut training budgets and
opportunities for the young people most affected by these changes.

9 | Selling our Rangatahi Short (10 Oct) | Social Policy & Parliamentary Unit | www.salvationarmy.org.nz/socialpolicy
Table 3: Participation in education and training by 15 to 19-year-oldsxviii
Numbers of students/trainees
2007 2008 2009 2010 2011 2012 2013
Secondary schools 164,289 166,228 170,503 175,114 175,170 174,185 174,299
Tertiary institutions 75,223 75,444 78,716 78,992 75,719 76,134 80,449
Training courses 12,395 12,208 12,054 11,219 11,990 9,251 10,109
Totals 251,906 253,880 261,273 265,325 262,879 259,570 264,857
Adding it all up
Table 4 provides a summary of some of the key statistics around youth employment and
engagement in education and training. These statistics are based on data presented earlier, as well
as Statistics New Zealand’s population estimatesxix. The figures don’t, of course, add up because
there is an overlap as some young people will be in two categories.
Table 4: Summary of employment & engagement of 15 to 19-year-olds
Numbers of people
2007 2010 2013
Employed 152,500 115,300 100,400
NEET 25,300 30,100 25,200
Engaged in education or
training 251,900 265,300 264,900
Total population 315,500 317,400 312,700
Overlap 114,200 93,300 77,800
Most likely, this overlap is between young people both being in employment and education or
training, as they take up after school jobs or work part-time while also attending university or
polytech. What is noticeable about this overlap is that it has shrunk not just during the post GFC
recession but even during the subsequent recovery. Granted this overlap is just a statistical artefact,
but it probably provides us with a useful indication of what has happened to the employment and
economic prospects of young people since the GFC. Young people appeared not only have been the
worst affected by the post GFC recession, but have not shared much of the subsequent recovery.
Making do and getting by
This increased participation by young people has been funded in part by debt through the student
loan scheme and in part by Government transfers through student allowance programme. Evidence
of this is provided in Table 5. This evidence points to an expansion of take up and entitlements
between 2007 and 2010 and a slowdown or decline since then.
Between 2007 and 2010, the student loan scheme expanded 22% from 174,000 borrowers to
212,000, while the proportion of full-time students borrowing to undertake tertiary study grew from
74% to 81%. New lending through the scheme also grew rapidly from $1.2 billion in 2007 to $1.5
billion by 2010. The real value of average borrowings stayed much the same at the equivalent $7300
per borrower per year at 2014 values.

10 | Selling our Rangatahi Short (10 Oct) | Social Policy & Parliamentary Unit | www.salvationarmy.org.nz/socialpolicy
Over the same period, the student allowance programme expanded even faster. Between 2007 and
2010, the total Government spend on student allowances grew by more than 50% (in nominal
terms), from $385 million to $590 million and on to $650 million by 2012. Those receiving the
allowance also grew by more than 50% or 32,000 people overall, and by more than 7000 under 20-
year-olds.
Table 5: Summary of student loan and allowance programmesxx
2007 2008 2009 2010 2011 2012 2013
Student loans
Number of borrowers 173,791 178,533 198,738 212,485 207,330 201,187 NA
% of full-time students
borrowing 73.5 74.9 77.5 81.1 82.4 81.9 NA
% of part-time students
borrowing 44.9 47.5 47.9 49.5 50.1 42.7 NA
Value of new lending ($millions) 1176 1201 1350 1525 1564 1586 1470
Value of repayments ($millions) 555 629 710 754 802 877 1054
Student allowances
Total appropriation 384.9 384.1 429.2 589.3 625.8 649.3 601.6
Numbers receiving 62,479 65,702 82,633 95,945 99,277 96,908 NA
Numbers under 20 receiving 13,020 14,016 18,414 20,333 20,714 20,142 NA
Fortunes have however changed since 2010. The numbers of student loan borrowers and the value
of loans have fallen slightly since 2010, and look set to fall further when more recent data is released
in December 2014. The fall-off in availability of student allowances looks like to be more severe with
the overall budget falling from $650 million in 2011/12 to a budgeted $531 million in the current
financial year.
This budget reduction is coming on the back of declines in tertiary student numbers and especially of
part-time and older students. Overall student numbers declined 12% between 2010 and 2013, with
almost all of this decline being in numbers of part-time students. Over the same period, it was older
students whose enrolment numbers fell, while the numbers of students aged under 25 increased
slightly. How these younger students are managing financially in an environment with less funding
for student allowances is not yet known, although it appears likely that these reductions will impact
most on part-time and mature students.
Summary and conclusions
As should be expected, the response of youth to the worsening job market following the GFC in late
2007 was to stay at school longer and to spend more effort in tertiary education. Rates of
participation in education – either at secondary or tertiary level – did not however increase by as
much as might be expected, given the sharp reduction in youth employment during the post-GFC
recession. The only modest increase in the numbers and rates of NEETs suggests that this decline in
youth employment impacted most on young people who were both studying and working. Their loss
of employment would most likely have reduced their ability to offer financial support into their

11 | Selling our Rangatahi Short (10 Oct) | Social Policy & Parliamentary Unit | www.salvationarmy.org.nz/socialpolicy
households and to financially support their studies. This loss appears to have been offset, in part, by
greater take-up of student loans, although the rapid expansion of the student allowance programme
would also have plugged this gap for perhaps only 7000 students aged under 20.
Missing from this equation are the experiences of the most marginalised young people who have left
school with no or few qualifications and, as a consequence, are most likely to struggle to find work in a
tight labour market. This group of young people swelled the NEET ranks by around 5000 between 2007
and 2010. In response, the Government reduced funding to training programmes which were targeted
for this group and, as a consequence, training numbers fell by more than 2000 places. Recent
increases in the numbers in these programmes should be seen in the context of the funding and
programme cuts, which occurred between 2006 and 2012, and not just against more recent figures.
While it appears that the benefits of the economic recovery are finally trickling down to our youngest
workers, NEET rates in June 2014 remain higher than they were in June 2007 for most North Island
regions outside of Aucklandxxi. In other words, the employment outlook and the engagement
opportunities for most young people out of Auckland and the South Island are no better, and even
worse, than they were for their older brothers and sisters seven years ago.
The failure of the Government to address this poverty of opportunity for our most vulnerable youth
was both unfortunate and unnecessary. The funding and additional effort required to do better are not
huge and are certainly not beyond the capacity of a society such as ours. It may not be a lack of care or
compassion which has prevented us from doing better, but simply a lack of awareness on the part of a
middle New Zealand, which is getting older by the day and more distant from the experiences of many
of our youth.
Although recent budget and programme initiatives through the Youth Guarantee and Modern
Apprenticeship programmes appear to have increased the opportunities available young people for
training and skills acquisition, the numbers involved really just reinstate the cuts in such opportunities
between 2007 and 2012xxii. That there remain around 25,000 young people under 20 and a further
50,000 people between 20 and 25 not in work or any meaningful education or training, it should be
seen as a national disgrace and not simply accepted as the status quo – as seems to be case. The
talents and energy of these people is too important to waste when we have the retirement age
population growing by 400 to 450 people per weekxxiii. As a priority, funding and programmes should
be available to ensure that at least half these 75,000 people are offered on-going opportunities for
training and second-chance education. In addition greater attention should be given to the systemic
failures within our primary and secondary education sector which lead to the very poor educational
outcomes for the 10 to 15% of students who leave without a formal qualificationxxiv.
Health professionals, and especially public health professionals, know that the physical, social and
economic environments, which are wrapped around a person, have a huge impact – perhaps the
greatest impact – on their health and well-being. If as a country, we are to improve youth health,
and especially youth mental health, we need to ensure that all our rangatahi grow up in an
environment which offers them almost open-ended opportunities to succeed, and a strong sense
that they are loved and belong.
12 | Selling our Rangatahi Short (10 Oct) | Social Policy & Parliamentary Unit | www.salvationarmy.org.nz/socialpolicy
I expect that there will be a number of key messages or learnings to come out of this conference and
can I suggest one for you to consider.
As health professionals, you have a unique and privileged role in this society. Your experiences of
the lives of others are unique and you are privileged in that you are valued and listened to. Please
use these advantages to tell stories to others – not necessarily stories about sick people but perhaps
stories of the context in which things happen and the background to these events. In other words,
actively bear witness to the real maladies within our society – those of inequality and the lack of
opportunity.
Endnotes
i http://www.johnkey.co.nz/index.php?url=archives/498-NEWS-Economic-plan-Superannuitants-get-a-
boost.html&serendipity%5Bcview%5D=linear
ii Based on Statistics New Zealand’s median scenario population projection of 1.416 million population aged
over 55 years against an over 18’s population of 3.706 million
iii Vowles, J. (2012) Down, Down, Down: Turnout in New Zealand from 1946 to the 2011 Election; Paper for
presentation at the Annual conference of the New Zealand Political Studies Association, Wellington, November
25-27 2012 . p14.
iv http://www.elections.org.nz/research-statistics/enrolment-statistics-electorate
v These figures are taken from Government’s Budget papers
vi For example see Mr English’s comments in his 2014 Budget Speech ‘But the biggest contribution to
the fiscal turnaround has been considered expenditure restraint that rigorously tests
spending for value and results. Core Crown expenses have fallen from 34.4 per cent of GDP in 2008/09 to a
forecast 30.3 per cent in 2014/15 and are soon expected to fall below 30 per cent of GDP.
In the next four years, the Government will continue to focus on achieving better results as
the main way of restraining future government expenditure.’ (p.5)
vii Perry, B. (2014) Household incomes in New Zealand: Trends in indicators of inequality and hardship 1982 to
2013; Ministry of Social Development Wellington. p.170
viii Source: Statistics New Zealand Household Labour Force Survey
ix Government’s focus around training now appears to be targeting opportunities to younger people and
assisting older long-term unemployed people to find work without further training. In addition the age
distribution of people engaged in tertiary education has become younger. In 2007 17% of tertiary students
were aged under 20% while 33% were aged over 40. By 2013 these shares had shifted to 22% and 24%
respectively – Source Education Counts database

13 | Selling our Rangatahi Short (10 Oct) | Social Policy & Parliamentary Unit | www.salvationarmy.org.nz/socialpolicy
x Source New Zealand Government Budget’s Estimates of Appropriations – available at
http://www.treasury.govt.nz/budget
xi Budgets for Training for designated groups in $million is as follows: Source NZ Government Budget
Estimates of Appropriations – Vote Education & Vote Tertiary Education
June years ending 2008 2009 2010 2011 2012 2013 2014
Training for designated groups - nominal 309 334 320 281 250 257 313
Training for designated groups - 2014 $s 270 301 295 269 244 253 313
xii NZ Government’s Budgets – Estimates of Appropriation papers
xiii The Household Labour Force Survey is a quarterly survey which samples around 15,000 households and
about 30,000 people. Sample sizes in small sub-categories can be quite small meaning that margins of errors
around some estimates are quite high. For example estimates of unemployment in smaller regions m ight
have margin of error of 25%
xiv Source: NZ Statistics Household Labour Force Survey
xv ibid
xvi Customised data on budgets and enrolment numbers have been gained from the Tertiary Education
Commission (TEC) for this paper. This data is a variance to equivalent data provided on the Education Counts
website which is also apparently sourced from TEC. The data sourced from TEC was for the years 2011. 2012
and 2013 while the Education Counts data goes back to 2006 or 2007. Because of this longer time series the
Education Counts data has been used in this analysis
xvii Until 2011 these courses were the Training Opportunities programme and the Youth Training programme
and after 2011 these morphed into the Youth Guarantee programme. The Youth Guarantee programme
includes the Gateway programme which is a secondary school based programme so enrolments in this
programme have not been included in the figures provided on Table 3 as these students are already counted
as being enrolled in secondary school.
xviii All this data is sourced from Education Counts data files – available at
http://www.educationcounts.govt.nz/statistics/tertiary_education
xix Employment and NEET data is taken from the HLFS and is averaged over the respective calendar year,
education and training data is taken from Table 3 while the population data is from Statistics New Zealand’s
population estimates and is the mean for the June years.
xx Source: Education Counts website
xxi Household Labour Force Survey estimates of NEET rates for 15-19 years by region
June year ending 2007 2008 2009 2010 2011 2012 2013 2014 Northland 12.7 15.2 14.8 16.3 15.3 12.2 14.6 12.9 Auckland 7.8 7.1 7.8 10.2 9.8 7.8 7.3 6.8 Waikato 8.9 9.3 9.9 8.9 11.3 10.2 10.1 11.6 Bay of Plenty 9.5 11.5 8.1 14.1 11.9 12.9 11.3 7.4 Hawkes Bay/Gisborne 10.2 10.6 14.3 14.3 10.5 9.4 11.9 11.7 Taranaki 13.0 NA NA NA NA NA NA 6.2
14 | Selling our Rangatahi Short (10 Oct) | Social Policy & Parliamentary Unit | www.salvationarmy.org.nz/socialpolicy
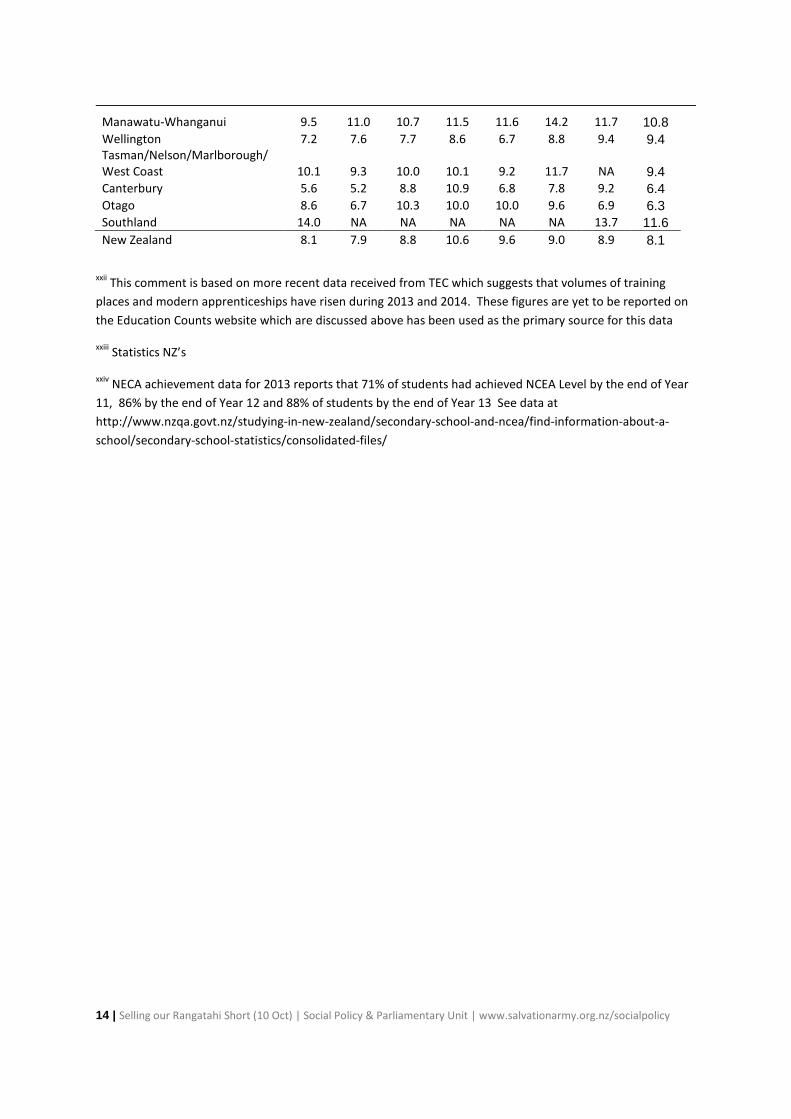
Manawatu-Whanganui 9.5 11.0 10.7 11.5 11.6 14.2 11.7 10.8 Wellington 7.2 7.6 7.7 8.6 6.7 8.8 9.4 9.4 Tasman/Nelson/Marlborough/
West Coast 10.1 9.3 10.0 10.1 9.2 11.7 NA 9.4 Canterbury 5.6 5.2 8.8 10.9 6.8 7.8 9.2 6.4 Otago 8.6 6.7 10.3 10.0 10.0 9.6 6.9 6.3 Southland 14.0 NA NA NA NA NA 13.7 11.6 New Zealand 8.1 7.9 8.8 10.6 9.6 9.0 8.9 8.1
xxii This comment is based on more recent data received from TEC which suggests that volumes of training
places and modern apprenticeships have risen during 2013 and 2014. These figures are yet to be reported on
the Education Counts website which are discussed above has been used as the primary source for this data
xxiii Statistics NZ’s
xxiv NECA achievement data for 2013 reports that 71% of students had achieved NCEA Level by the end of Year
11, 86% by the end of Year 12 and 88% of students by the end of Year 13 See data at
http://www.nzqa.govt.nz/studying-in-new-zealand/secondary-school-and-ncea/find-information-about-a-
school/secondary-school-statistics/consolidated-files/