SECTION 2: THE MALAYSIAN CIVIL AVIATION SECTOR
28
MASTERPLAN MALAYSIAN AVIATION COMMISSION ● PROPOSAL TO THE MINISTRY OF TRANSPORT 39 SECTION 2: THE MALAYSIAN CIVIL AVIATION SECTOR – CURRENT LANDSCAPE The framework and proposed recommendations for the Master Plan are based on MAVCOM’s findings with regards to the regional and global positioning of the Malaysian civil aviation sector by 2030. This positioning took into consideration the following factors: • The role of the civil aviation sector in Malaysia’s economy. According to MAVCOM’s estimates based on data provided by the Department of Statistics (DOS), the aviation sector contributed 0.6% to Malaysia’s total gross domestic product (GDP) in 2015 (2010: 0.5%). 11 This estimate, however, belies the role that the industry plays as an enabler for the other economic activities, given that the sector produces an output multiplier of 2.1, meaning that every RM1 of output produced by the aviation sector leads to a 2.1 times increase in the output for the whole economy 12 . • Malaysia’s current and forecasted air passenger traffic. The transportation of air passengers, through both scheduled and unscheduled flights, comprises 60.2% of the total GDP contribution from the sector in 2015. 13 Hence, the performance of passenger traffic has a significant impact on the growth of the civil aviation sector. • Passenger traffic growth is in turn connected to the central importance of connectivity to economic growth and competitiveness through tourism and trade links. In this regard, MAVCOM had conducted a study to benchmark Malaysia’s air passenger and cargo connectivity against other ASEAN Member States. • The role of airports in ensuring that Malaysia maximizes its potential for air connectivity. This entails determining the following: o Whether Malaysia’s airports should focus on developing a strong hub-and-spoke network, implying that all international traffic would be mainly channelled through KUL, with regional airports such as the Kota Kinabalu International Airport (BKI) and PEN feeding traffic into KUL as a hub; or o Whether Malaysia’s airports industry structure and network should be determined by market forces, particularly the dynamic conditions of the airlines sector • The human capital landscape for the sector, which provides integral support for the development of the industry. • The institutional framework within which the sector operates, encompassing: o The legal and regulatory landscape for the sector o The role of the government o The commercial environment, exemplified by the following: ▪ The liberalization regime, of both public and domestic ownership requirements ▪ Safeguarding consumer welfare ▪ The administration of PSOs 11 MAVCOM’s estimates based on latest available data provided by DOS. 12 Refer to MAVCOM Technical Paper on the Aviation Sector Multiplier (August 2017) and Appendix 4 for a list of output multipliers for Malaysian industries. 13 Latest available data, DOS.
-
Upload
khangminh22 -
Category
Documents
-
view
1 -
download
0
Transcript of SECTION 2: THE MALAYSIAN CIVIL AVIATION SECTOR

MASTERPLAN
MALAYSIAN AVIATION COMMISSION ● PROPOSAL TO THE MINISTRY OF TRANSPORT 39
SECTION 2: THE MALAYSIAN CIVIL AVIATION SECTOR –
CURRENT LANDSCAPE
The framework and proposed recommendations for the Master Plan are based on MAVCOM’s
findings with regards to the regional and global positioning of the Malaysian civil aviation sector
by 2030. This positioning took into consideration the following factors:
• The role of the civil aviation sector in Malaysia’s economy. According to MAVCOM’s
estimates based on data provided by the Department of Statistics (DOS), the aviation sector
contributed 0.6% to Malaysia’s total gross domestic product (GDP) in 2015 (2010: 0.5%).11
This estimate, however, belies the role that the industry plays as an enabler for the other
economic activities, given that the sector produces an output multiplier of 2.1, meaning that
every RM1 of output produced by the aviation sector leads to a 2.1 times increase in the output
for the whole economy12.
• Malaysia’s current and forecasted air passenger traffic. The transportation of air
passengers, through both scheduled and unscheduled flights, comprises 60.2% of the total GDP
contribution from the sector in 2015.13 Hence, the performance of passenger traffic has a
significant impact on the growth of the civil aviation sector.
• Passenger traffic growth is in turn connected to the central importance of connectivity
to economic growth and competitiveness through tourism and trade links. In this regard,
MAVCOM had conducted a study to benchmark Malaysia’s air passenger and cargo
connectivity against other ASEAN Member States.
• The role of airports in ensuring that Malaysia maximizes its potential for air
connectivity. This entails determining the following:
o Whether Malaysia’s airports should focus on developing a strong hub-and-spoke
network, implying that all international traffic would be mainly channelled through
KUL, with regional airports such as the Kota Kinabalu International Airport (BKI) and
PEN feeding traffic into KUL as a hub; or
o Whether Malaysia’s airports industry structure and network should be determined by
market forces, particularly the dynamic conditions of the airlines sector
• The human capital landscape for the sector, which provides integral support for the
development of the industry.
• The institutional framework within which the sector operates, encompassing:
o The legal and regulatory landscape for the sector
o The role of the government o The commercial environment, exemplified by the following:
▪ The liberalization regime, of both public and domestic ownership requirements
▪ Safeguarding consumer welfare
▪ The administration of PSOs
11 MAVCOM’s estimates based on latest available data provided by DOS. 12 Refer to MAVCOM Technical Paper on the Aviation Sector Multiplier (August 2017) and Appendix 4 for a list of output
multipliers for Malaysian industries. 13 Latest available data, DOS.

MASTERPLAN
MALAYSIAN AVIATION COMMISSION ● PROPOSAL TO THE MINISTRY OF TRANSPORT 40
In addition, given its long-term nature, recommendations developed as part of the Master Plan will
also need to be cognizant of future trends that are potentially either headwinds or tailwinds for the
economic development of civil aviation not only in Malaysia, but regionally and globally (see Box 1).
It is proposed that given trends in Malaysia’s passenger traffic growth and the country’s potential
to grow both hub and direct passenger traffic, as well as, the dynamism of the airlines sector, that a
strategy of allowing market forces to determine the role of airports is considered. This should be
supported by a strong human capital base for the sector and a regulatory infrastructure that
maintains a fair and competitive commercial environment.
The factors listed above and the positioning of the Malaysian civil aviation sector in 2030 are
discussed in the following sub-sections.
Box 1: Future Trends Impacting the Malaysian Civil Aviation Sector in 2030 and Beyond
14 TFP, which is typically interpreted as an economy’s use of technological development, measures the efficiency of capital
and labour used to produce goods and services.
While it is not possible to “future-proof” completely, developing a long-term Master Plan
requires foreseeing and recognizing trends that may impact implementation of the Plan’s
recommendations. This is to ensure that these measures are sufficiently flexible to address
potential “game-changers” that may arise, whether within Malaysia or from external forces.
Domestically, Malaysia’s long-term growth prospects are dampened by productivity concerns,
as Malaysia’s total factor and labour productivity growth have not kept pace with those of
comparator countries such as South Korea and Singapore, which have experienced similar rates
of labour and capital accumulation over the past 25 years.
Globally, one of the more immediate threats to long-term economic growth that may come to
fruition over the next decade is that of increasing economic insularity and trade protectionism,
symptomized by Brexit in Europe and the United States’ (US) shift towards protectionism.
Exacerbating this closing of economic borders is rising geopolitical tensions, both of which
threaten to negatively impact the demand for air travel. Meanwhile, demographic shifts in Asia
and the rest of the world will also affect the way that aviation business models evolve in the
future, along with technological advancements and environmental precepts. This Box provides a
survey of the future economic, political, technological, and demographic trends that are foreseen
to affect the development of the civil aviation sector in 2030.
Economics
Structural headwinds threaten Malaysia’s long-term growth prospects
According to the World Bank (2016), Malaysia experienced similar rates of accumulation of
labour and capital in the last 25 years as South Korea and Singapore, but total factor productivity
(TFP)14 growth in Malaysia only averaged 1.8% compared to 2.2% in the other two countries.
Malaysia’s labour productivity growth has similarly failed to keep pace with that of these
comparator countries. While Malaysia’s economic growth has been relatively resilient thus far,
structural constraints mean that the country can no longer rely on increasing utilization of
factors of production (labour, land, capital) to continue to drive growth. Capital accumulation
faces headwinds as the output from oil and gas—Malaysia’s primary commodities—decline,
while labour force growth is expected to slow down in line with demographic transition.

MASTERPLAN
MALAYSIAN AVIATION COMMISSION ● PROPOSAL TO THE MINISTRY OF TRANSPORT 41
Regarding the latter, while Malaysia’s demographic transition is at a more nascent stage
compared to some other ASEAN countries, by 2030, Malaysia’s population would have already
begun to age, with the share of the population over the age of 65 expected to be close to 10%.
Trade wars
Trade protectionism will pose multiple threats to the aviation industry in the long run, in several
ways:
• Increasing costs for airlines: The recent imposition of tariffs by the US targeting steel
and aluminium from Canada, the European Union (EU), and Mexico could result in
businesses dismantling GVCs into more localized models that could increase the costs of
manufacturing aircraft by raising prices of raw materials, which is likely to raise airfares
in the long run
• Reduction in cargo volumes as trade barriers—both at- and behind-the-border—
are fortified, potentially reducing total trade by 2030, which is currently forecasted to
be USD73tn (2018: USD48tn)
Competing modes of transportation
Research and development (R&D) activities have enhanced both the technical and commercial
viability of new modes of transport. These include hyperloops and more advanced high-speed
rail, which in the very long-run could act as substitutes for short-haul air travel. As such, airlines
could shift to operating long-haul flights only. However, this new scenario also offers airlines an
opportunity to embark on a partnership with these new modes of transport to develop an
integrated transportation solution to promote efficient growth in connectivity.
Politics
Global flashpoints
Parochial and protectionist sentiments are expected to prevail into the 2020s, where multiple
flashpoints pose significant risks to the aviation sector. Rising geopolitical tensions in several
regions around the world, particularly in the Middle East and Asia Pacific, could inhibit the
movement of people and goods. In recent years, unilateral actions such as China’s enforcement
of an Air Defence Identification Zone over the South China Sea, Saudi Arabia closing its airspace
to Qatar, and Russia’s threat to close Siberian airspace for airlines flying to Asia, are the by-
products of geopolitical squabbles. If mismanaged, militarization of the skies could have adverse
effects on the safety of both the airlines and passengers, as well as, increasing the cost of flying
for passengers. Such effects could revise global GDP growth downwards, currently forecasted at
2.9% in 2030.
Supranational bodies undermined
Nationalist sentiments are also beginning to threaten the integrity of existing international
institutions. In appealing to voter bases, several world leaders have upended international
bodies such as the World Trade Organization (WTO) and the Asian Development Bank. They
have also undermined long-established arrangements such as the North American Free Trade
Agreement (now known as the United States-Mexico-Canada Agreement). In the future, global
leaders may resort to establishing alternative regional and global institutions that could rival
long-established ones. Global aviation bodies, such as the International Civil Aviation
Organization (ICAO), could face challenges to harmonize aviation regulations if alternative
bodies are set up.

MASTERPLAN
MALAYSIAN AVIATION COMMISSION ● PROPOSAL TO THE MINISTRY OF TRANSPORT 42
In ASEAN, the implementation of ASAM to connect primary and secondary cities in ASEAN with
each other could also be undermined by nationalist sentiments. This could affect connectivity for
an additional 90mn people who are expected to live in ASEAN cities by 2030. In mitigating these
risks, airlines and international bodies should engage in more effective stakeholder
management, especially with developing countries, and ensure balanced representation in
global discussions to avoid having two sets of rules, which will only increase compliance costs
for airlines.
Demographics
The middle-class continues to rise in Asia …
Given a rising middle class and a relatively young population, Asia is poised to play a leading role
in driving the global economy in decades to come. Middle-income population in both the Asia
Pacific and Southeast Asian region is forecasted to be 76% and 51% respectively in 2030, up
from 33% and 24% in 2015. The increase in population is likely to be coupled with growing
spending power, some of which could be channelled to air travel. As such, airlines should start
assessing the Asian market to search for new growth opportunities and identify risks that could
impede operations.
… amidst an aging global population
Along with a rising young population, the proportion of people aged 64 and above worldwide
are expected to increase to 11.7% by 2030 from 8.7% in 2017. Although an aging population may
not change the demand for air travel, preferences will shift. Airlines would need to be equipped
to cater to the needs of older passengers or passengers with reduced mobility—not just in the
air, but at every stage of their journey, in addition to making flights more comfortable. Airlines
could consider placing healthcare workers such as doctors and nurses on all flights, along with
medical supplies and basic healthcare facilities. As such, airplane design could also be changed
to accommodate such preferences, although this could result in higher costs.
Technology
Airports of the future
As global demand for flying is to nearly double to 7.2bn by 2030, challenges at the airport level
will become more apparent in handling the increase in the number of passengers. As airports
cannot expand indefinitely, pressure will build on airport assets to ensure a smooth journey for
passengers. Therefore, airports of the future would have to rely more on technology to mitigate
the risk of a capacity crunch. Future airports could also automate the experience to reduce the
possibilities of human errors. By using big data to generate predictive analyses, airports and
airlines can use artificial intelligence to predict and mitigate the impact of any disruptions. This
would change the nature of work in airports of the future as robots are increasingly used to work
alongside humans, taking on physical and repetitive tasks, with humans in positions where
robots have not yet become dominant. Improved facilities could include enhanced checkpoints
for known travellers, more effective bag-tracking, and flexible infrastructure. In ensuring a
smooth journey for all passengers, airports must play a leading role in educating passengers
about the enhanced journeys to avoid any mishaps as the success rate of utilising the technology
at airports would hinge on well-informed and engaged passengers.
MASTERPLAN
MALAYSIAN AVIATION COMMISSION ● PROPOSAL TO THE MINISTRY OF TRANSPORT 43
Advances in aircraft technology
Several new long-haul routes introduced in the world today (e.g. Houston-Sydney, Singapore-
New York, London-Perth) have all been made possible due to advances in aircraft technology
(particularly in materials engineering) and efficiency in fuel usage. These flights are likely to
appeal more to business/premium travellers who prefer the convenience of direct flights
without going through long overlays. This would lead to a worldwide requirement for close to
40,000 new jet airplanes by 2030, valued at USD5.9tn. In the future, with advances in
technology—self-flying planes, more efficient jet fuel, and lighter steel/aluminium—could all
encourage more long-haul flights as other advances in technology promote novel modes of
transport (e.g. high-speed rail, hyperloop) for point-to-point, short-haul flights. As this happens,
establishing relationships with other transport providers become more important in providing
a seamless end-to-end journey for passengers. In addition, advances in aircraft technology could
also broaden the possibilities for hub bypass, increasing the likelihood that future airport
structures will be determined by market forces.
Environment
Carbon reduction
Environmental activism against industries such as aviation are expected to rise as large-capacity
clean energy comes to the market. With increasing R&D work, clean energy could displace fossil
fuels and power other modes of transport such as high-speed rail, displacing airlines over short-
haul flights. The ICAO has agreed on a global emissions-reduction scheme that will apply to
passenger and cargo flights that generate more than 10,000 tonnes of annual greenhouse gases
beginning 2020. This new system is voluntary until 2027 but has so far involved pledges from
airlines operating in China and the US. The emissions will be offset by airlines funding forests
and other carbon-reducing activities, which will cost up to 2% of revenues annually. Research is
also being undertaken in Europe on the viability of using biofuels to displace jet fuel in airplanes,
with a target of using 2.0mn tonnes of sustainable biofuels annually in the European civil aviation
market by 2020. In meeting emission targets, airlines must increase efforts to lower their carbon
footprints by engaging in better logistical planning and relying on clean energy where possible.
Conclusion
The trends mentioned above were drawn out from the anticipated key risks and opportunities
facing the civil aviation sector between now until 2030. Whilst some of these such as trade wars
and rising global flashpoints are more immediate in nature up to 2030, other trends such as
advances in aircraft technology and reducing carbon emissions are expected to affect
developments in the industry until 2030 and beyond. In either case, these trends provide an idea
of how both the civil aviation sector and the world will change in the future.

MASTERPLAN
MALAYSIAN AVIATION COMMISSION ● PROPOSAL TO THE MINISTRY OF TRANSPORT 44
Malaysia’s Passenger Traffic Growth
Overall, the demand for air travel looks set to expand until 2030—globally, regionally, and for
Malaysia. The International Air Transport Association (IATA) expects 7.2bn passengers to travel in
2030, compared to 4.1bn in 2017, at a compound annual growth rate (CAGR) of 3.7%.
Comparatively, MAVCOM’s provisional and unconstrained forecasts find that Malaysian passenger
traffic will grow by a CAGR of 4.1% between 2019 and 2030, from 104.9mn to 165.0mn15 (see Figure
5).
Available forecasts by the IATA indicate that countries within the Asia Pacific region such as China,
India, Indonesia, and Thailand are expected to grow by 5.3%, 7.0%, 6.3%, and 4.2%, respectively in
CAGR terms within the same period.
Figure 5: Air Passenger Traffic, Malaysia, 2000 – 2030F
Source: MAVCOM Analysis, MAHB, SATSSB
The forecasted passenger traffic growth (in CAGR terms) for Malaysia between 2019 and 2030 is
slower than the CAGR growth reported between 2006 and 2019 of 7.2%. This forecast has both
upside and downside risks. On the upside, an additional 1.0ppt in Malaysia GDP growth would
increase our 2030 passenger traffic forecast by 2.6mn, while the forecasted traffic would decline
by 2.6mn, if the growth in GDP was 1.0ppt less than expected, for 2030. This results in a passenger
traffic forecast growth between 3.9% and 4.2% in CAGR terms.
Apart from the growing economy, passenger traffic will also be supported by population growth of
0.9% and 0.6% in ASEAN and the Asia Pacific countries (in CAGR terms), respectively. Malaysia’s
population will grow by 1.2% between 2018 and 2030, the fourth in ASEAN behind the Philippines,
Cambodia, and Laos.
15 See Appendix 5 for details of the long-term passenger traffic forecast.
104.9
165.0
0.0
20.0
40.0
60.0
80.0
100.0
120.0
140.0
160.0
180.0
20
00
20
01
20
02
20
03
20
04
20
05
20
06
20
07
20
08
20
09
20
10
20
11
20
12
20
13
20
14
20
15
20
16
20
17
20
18
20
19
20
20
20
21
20
22
20
23
20
24
20
25
20
26
20
27
20
28
20
29
20
30
Pas
sen
ger
Tra
ffic
(m
n)
MASTERPLAN
MALAYSIAN AVIATION COMMISSION ● PROPOSAL TO THE MINISTRY OF TRANSPORT 45
Therefore, while the aviation sector contributes towards economic growth directly, its
performance is also driven by the economic and demographic factors.
Air Connectivity
The link between civil aviation and tourism and trade is provided by air connectivity. Globally, an
estimated 40% of tourists travel by air16, while the World Bank (2013) has found, for instance, that
stronger air connectivity is highly correlated with trade in GVCs. This is particularly relevant for
value chains involving high-value components, such as that for the electrical and electronics (E&E)
sector, in which travel times are a key production factor. Higher air connectivity reduces the costs
of air transport and therefore enables a location to be more strongly connected to GVCs (see Box
2). Hence, while air cargo constitutes only 1% of global trade by volume, it consists of 35% of global
trade values. For Malaysia, between 27% and 29% of its exports and imports are carried by air.
Box 2: Air Connectivity and Trade
16 IATA (2017). 17 Shepherd, Shinghal, and Raj (2016).
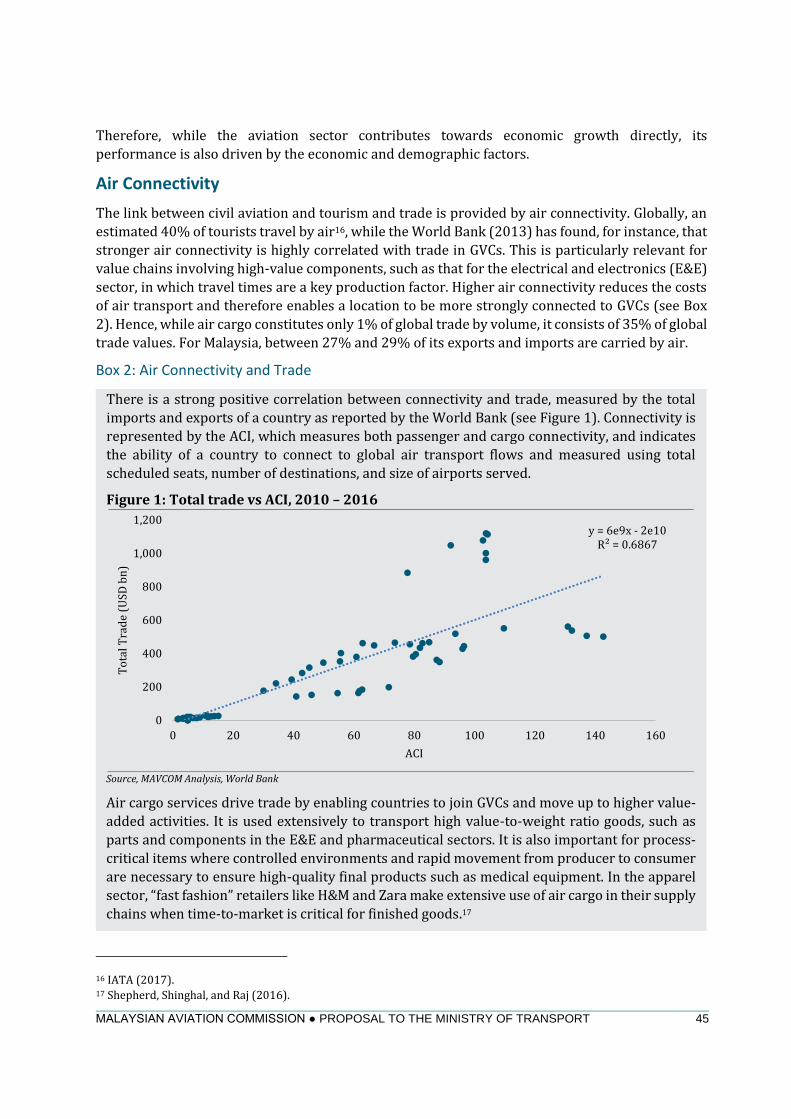
There is a strong positive correlation between connectivity and trade, measured by the total
imports and exports of a country as reported by the World Bank (see Figure 1). Connectivity is
represented by the ACI, which measures both passenger and cargo connectivity, and indicates
the ability of a country to connect to global air transport flows and measured using total
scheduled seats, number of destinations, and size of airports served.
Figure 1: Total trade vs ACI, 2010 – 2016
Source, MAVCOM Analysis, World Bank
Air cargo services drive trade by enabling countries to join GVCs and move up to higher value-
added activities. It is used extensively to transport high value-to-weight ratio goods, such as
parts and components in the E&E and pharmaceutical sectors. It is also important for process-
critical items where controlled environments and rapid movement from producer to consumer
are necessary to ensure high-quality final products such as medical equipment. In the apparel
sector, “fast fashion” retailers like H&M and Zara make extensive use of air cargo in their supply
chains when time-to-market is critical for finished goods.17
y = 6e9x - 2e10R² = 0.6867
0
200
400
600
800
1,000
1,200
0 20 40 60 80 100 120 140 160
To
tal T
rad
e (U
SD b
n)
ACI

MASTERPLAN
MALAYSIAN AVIATION COMMISSION ● PROPOSAL TO THE MINISTRY OF TRANSPORT 46
Maximizing Malaysia’s potential passenger traffic growth, and therefore, increasing the sector’s
contribution towards economic development, requires an analysis of the factors supporting such
growth. Primarily, the growth of air traffic is dependent on the economic rationale for air travel,
namely tourism and trade. Hence, the current and future development of Malaysia’s civil aviation
sector must be closely interlinked with Malaysia’s trade and tourism initiatives, i.e. the
strengthening of the civil aviation-related economic base.
18 Leinbach and Bowen (2004).
From the supply chain perspective, air cargo services help firms maintain low inventory levels
which consequently reduce warehouse costs by moving goods quickly, reliably, and at a
reasonable cost. Moreover, it supports the GVC’s just-in-time approach to combining and
assembling inputs via express shipment. The speed, reliability, and security of air cargo services
are also beneficial in cases when surface transport is disrupted, for example due to natural or
social factors. In terms of integrating and moving up the GVC, the availability of air cargo
services is a significant factor for firms in deciding the viability of a new node in a global
production network18.

MASTERPLAN
MALAYSIAN AVIATION COMMISSION ● PROPOSAL TO THE MINISTRY OF TRANSPORT 47
Air Passenger Connectivity
MAVCOM’s rankings of air passenger connectivity19 at the country- and airport-levels indicate the
following:
• Malaysia trails behind Thailand, Singapore, and Indonesia in terms of country-level connectivity, which highlights the positive relationship between air connectivity and passenger size, as both Thailand and Indonesia have higher passenger traffic than Malaysia as at 2017 at 129.2mn and 111.0mn, respectively.
However, when only the countries’ main airports are considered, KUL leads over Soekarno-
Hatta International Airport, Jakarta (CGK) in terms of connectivity at the airport-level and is
only second to Changi Airport (SIN) in terms of being connected as an international hub (see
Table 2). One of the main reasons for this juxtaposition is that while Malaysia’s connectivity is
concentrated at KUL (which serves more than three times the number of destinations as the
second-largest airport, BKI), Indonesia’s connectivity is spread across two airports, i.e. CGK and
Ngurah Rai International Airport, Denpasar (DPS).
These findings imply that at the country-level, air passenger connectivity is improved when more than one airport can act as international gateways into a country.
Table 2: Summary of Air Connectivity at the Country, Airport, and International Hub
Level for ASEAN Countries, 2018
Rank Country-level Airport-level International hub
1. Thailand SIN SIN
2. Singapore BKK KUL
3. Indonesia KUL BKK
4. Malaysia MNL MNL
5. Philippines CGK SGN
6. Vietnam SGN BWN
7. Cambodia PNH CGK
8. Myanmar RGN PNH
9. Laos BWN RGN
10. Brunei VTE VTE
Source: MAVCOM Analysis, AirportIS
• On the other hand, it was also found that while all of SIN’s hub traffic as at 2018 comprised
passengers traveling to international destinations, 50% of KUL’s hub traffic were domestic
passengers travelling from other domestic airports such as PEN, LGK, and BKI, who were
connecting to flights at KUL
19 See MAVCOM Technical Paper on Defining and Measuring Air Connectivity (2018).

MASTERPLAN
MALAYSIAN AVIATION COMMISSION ● PROPOSAL TO THE MINISTRY OF TRANSPORT 48
• Apart from population size, which directly affects passenger traffic size, air connectivity is also
significantly influenced by the number of airlines flying into a country. This relationship
between the number of carriers and connectivity is highlighted by the split in market share
between local and foreign carriers in ASEAN Member States (see Figure 6)
Figure 6: Market Share Between Local and Foreign Carriers, 2017
Source: MAVCOM Analysis, AirportIS
Figure 6 highlights that countries with higher market shares for foreign carriers than Malaysia
also led in terms of connectivity.20 Furthermore, while Singapore, like Malaysia, had a market
dominated by local carriers (53.7%, compared to 62.6%), the key difference is that Singapore’s
local carrier market was dominated by a full-service carrier (FSC, i.e. Singapore Airlines). On
the other hand, Malaysia’s market was dominated by a low-cost carrier (LCC), AirAsia Berhad
(AirAsia), which had a domestic and international passenger share of 56.3% and 27.6%,
respectively, in 2017.
In general, LCCs like AirAsia largely adopt a point-to-point model, in contrast to FSCs, which
operate within a network of routes, either on their own, within an alliance or other types of
joint ventures (JVs). This implies that a new service and/or higher frequency by an FSC
increases connectivity more than such a development by an LCC.
20 Cambodia is the exception, as it has a relatively small number of local carriers, and a liberalized domestic scheduled
services market.
77.0 16.2 39.0 29.2 62.6 13.6 51.4 53.7 43.0 39.0
23.0 83.8 61.0 70.8 37.4 86.4 48.6 46.3 57.0 61.0
0.010.020.030.040.050.060.070.080.090.0
100.0
Bru
nei
Cam
bo
dia
Ind
on
esia
Lao
s
Mal
aysi
a
My
anm
ar
Ph
ilip
pin
es
Sin
gap
ore
Th
aila
nd
Vie
tnam
Mar
ket
Sh
are
(%)
Local Carriers Foreign Carriers

MASTERPLAN
MALAYSIAN AVIATION COMMISSION ● PROPOSAL TO THE MINISTRY OF TRANSPORT 49
Cargo Air Connectivity
MAVCOM’s analysis of cargo connectivity found the following:21
• In 2017, within ASEAN, cargo from Malaysia was connected to 15 countries via scheduled
flights, lower than Singapore and Vietnam, with each connected to 24 different countries.
However, when measured by connectivity units22 (CNUs), Malaysia’s cargo connectivity was
found to be second in ASEAN after Indonesia (see Figure 7). As Figure 7 also indicates,
Malaysia’s cargo connectivity was primarily driven by domestic cargo services. Moreover,
around 55% of air cargo measured by CNUs comprised road feeder services (RFS), or flight
trucks.
Figure 7: Domestic and International CNUs for ASEAN Member States, 2010 & 2017
Source: MAVCOM Analysis, AirportIS
21 See Appendix 6 for more details of the study. 22 A measure that factors in the total transportation time (flight plus transfers), a hypothetical maximum transportation
time offered by airlines, and non-stop flight time, as well as, the weekly frequencies of scheduled cargo flights.
0
50
100
150
200
250
300
350
400
Mal
aysi
a
Sin
gap
ore
Ind
on
esia
Th
aila
nd
Vie
tnam
Ph
ilip
pin
es
Bru
nei
Cam
bo
dia
My
anm
ar
Ind
on
esia
Mal
aysi
a
Sin
gap
ore
Vie
tnam
Th
aila
nd
Cam
bo
dia
Ph
ilip
pin
es
My
anm
ar
Bru
nei
2010 2017
CN
Us
Domestic International
MASTERPLAN
MALAYSIAN AVIATION COMMISSION ● PROPOSAL TO THE MINISTRY OF TRANSPORT 50
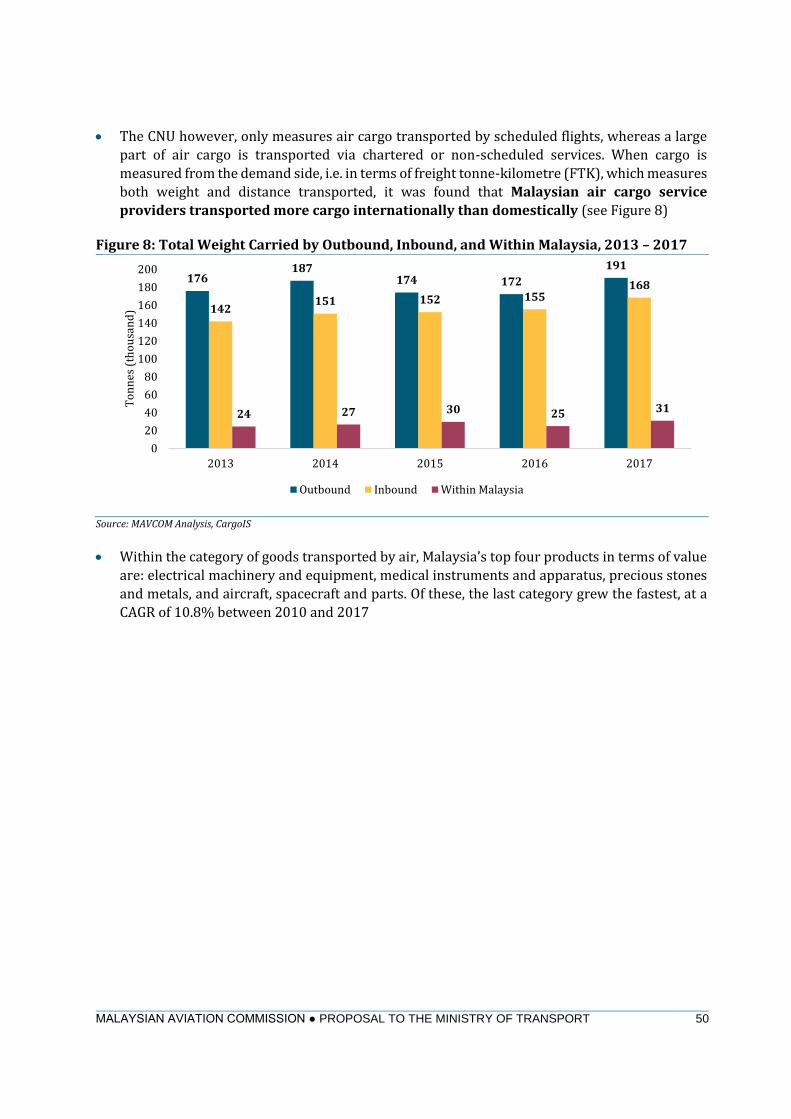
• The CNU however, only measures air cargo transported by scheduled flights, whereas a large
part of air cargo is transported via chartered or non-scheduled services. When cargo is
measured from the demand side, i.e. in terms of freight tonne-kilometre (FTK), which measures
both weight and distance transported, it was found that Malaysian air cargo service
providers transported more cargo internationally than domestically (see Figure 8)
Figure 8: Total Weight Carried by Outbound, Inbound, and Within Malaysia, 2013 – 2017
Source: MAVCOM Analysis, CargoIS
• Within the category of goods transported by air, Malaysia’s top four products in terms of value
are: electrical machinery and equipment, medical instruments and apparatus, precious stones
and metals, and aircraft, spacecraft and parts. Of these, the last category grew the fastest, at a
CAGR of 10.8% between 2010 and 2017
176187
174 172
191
142151 152 155
168
24 27 30 25 31
0
20
40
60
80
100
120
140
160
180
200
2013 2014 2015 2016 2017
To
nn
es (
tho
usa
nd
)
Outbound Inbound Within Malaysia

MASTERPLAN
MALAYSIAN AVIATION COMMISSION ● PROPOSAL TO THE MINISTRY OF TRANSPORT 51
• Malaysia’s top two cargo processing airports are KUL and PEN, which handled 61.4% and 36.5%
of Malaysia’s total cargo by weight, respectively. However, in terms of value, cargo flown in and
out of PEN was around 1.8x of KUL (RM316bn and RM179bn, respectively, in 2017, Figure 9).
This could be explained by PEN’s location within the Bayan Lepas Free Trade Zone, which
houses the E&E-based multinational corporations, such as Intel, AMD, and Altera, all of whom
export high-value parts, components, and finished products
Figure 9: Total Air Cargo by FTK (Left) and Value (Right) for KUL and PEN, 2014 – 2017
Source: MAVCOM Analysis, CargoIS, DOS
• Nonetheless, while air cargo services are strongly correlated with the performance of
international trade, the cargo sub-sector plays a minor role compared to the contribution of the
passenger sub-sector. When passenger traffic is measured by passenger tonne kilometres
(PTKs), cargo tonnage constituted approximately 13% of the 20.6bn international tonne
kilometres transported to and from Malaysian airports in 2017 (see Figure 10). Growth
in the cargo sub-segment between 2013 and 2017 was slower than that of the passenger
sub-segment, at 2.8% compared to 6.1% in CAGR terms
Figure 10: International PTKs and FTKs Handled by Malaysian Airports, 2013 – 2017
Source: AirportIS, CargoIS
1,706 1,675 1,649
1,825
819 810 811 810
41 41 32 32
0
200
400
600
800
1,000
1,200
1,400
1,600
1,800
2,000
2014 2015 2016 2017
FT
K (
mn
)
KUL PEN Others
137 133 139
179
237250 261
316
15 15
7693
0
50
100
150
200
250
300
350
2014 2015 2016 2017
RM
(b
n)
KUL PEN Others
14,065 15,490 15,238 15,483
17,803 2,392 2,566 2,526 2,491
2,666
0
5,000
10,000
15,000
20,000
25,000
2013 2014 2015 2016 2017
ton
ne-
kil
om
etre
s (m
n)
Passenger Tonne-Kilometres Freight Tonne-Kilometres

MASTERPLAN
MALAYSIAN AVIATION COMMISSION ● PROPOSAL TO THE MINISTRY OF TRANSPORT 52
• Leveraging on the strong correlation between air connectivity and trade goes beyond
developing air cargo. Notwithstanding the strong correlation between air connectivity—
both passenger and cargo—and international trade, there does not seem to be a
significant relationship between the percentage of goods transported as air cargo and a
country’s contribution of trade to GDP (see Figure 11)
Figure 11: Trade Transported by Air vs. Total Trade over GDP, 2018
Source: Eurostat, National Statistical Offices of Brunei, Indonesia, Malaysia and the Philippines, World Bank
The weak correlation between goods transported as air cargo and the size of trade relative
to a country’s GDP, combined with the importance of connectivity to trade, indicates that
air cargo performance and air connectivity are necessary but insufficient conditions for a
country’s international trade performance and economic growth. Structural and
macroeconomic factors, such as the efficiency of regulatory processes and strong
investment flows, possibly play a more significant role. The World Bank for instance, has
found that providing 24/7 automated customs processing could lead to a country’s trade
growing by 4.4% year-on-year (YoY), over time.23
23 Frontier Economics (2015).
IE
UKLU
MT
BEFR
NLDE ATDK
HUIT
SEFI EEPT
CY PLES
CZLVHR SKRO
BGSILTEL
MY
BRID
PH
y = -0.0351x + 21.484R² = 0.015
0
10
20
30
40
50
60
0 20 40 60 80 100 120 140 160 180 200
Mer
chan
dis
e T
rad
e T
ran
spo
rted
by
Air
(%
)
Total Trade over GDP (%)
MASTERPLAN
MALAYSIAN AVIATION COMMISSION ● PROPOSAL TO THE MINISTRY OF TRANSPORT 53
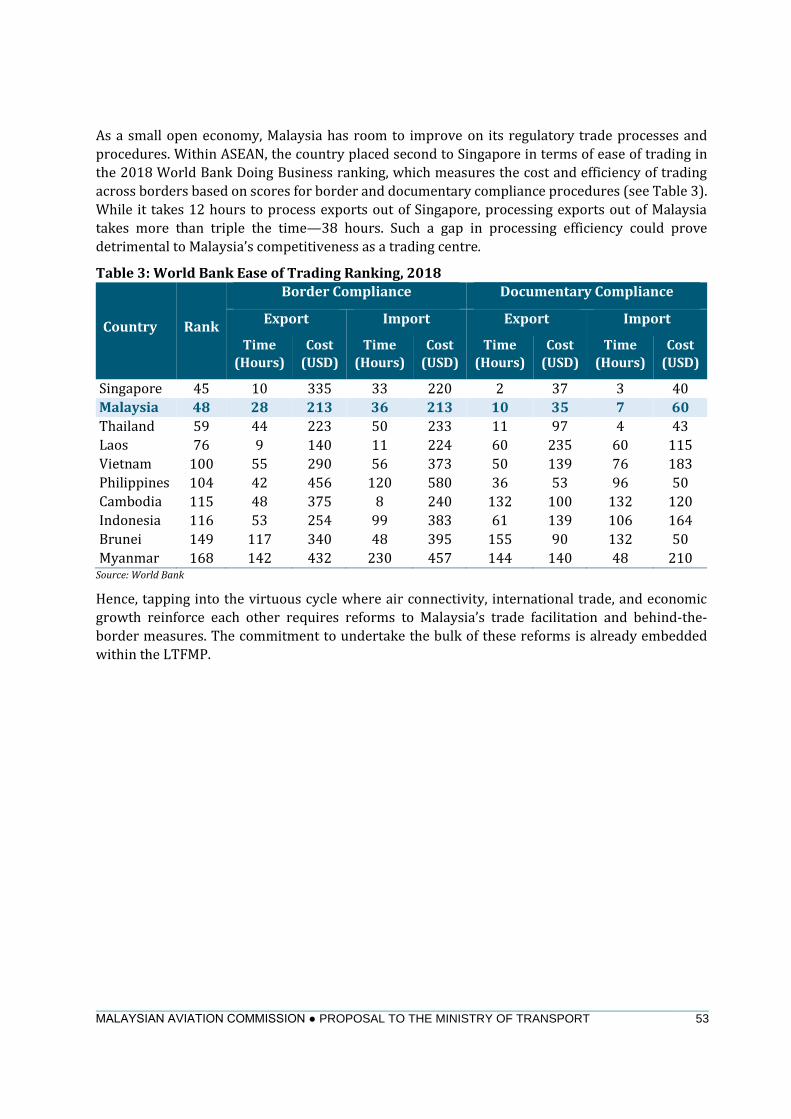
As a small open economy, Malaysia has room to improve on its regulatory trade processes and
procedures. Within ASEAN, the country placed second to Singapore in terms of ease of trading in
the 2018 World Bank Doing Business ranking, which measures the cost and efficiency of trading
across borders based on scores for border and documentary compliance procedures (see Table 3).
While it takes 12 hours to process exports out of Singapore, processing exports out of Malaysia
takes more than triple the time—38 hours. Such a gap in processing efficiency could prove
detrimental to Malaysia’s competitiveness as a trading centre.
Table 3: World Bank Ease of Trading Ranking, 2018
Country Rank
Border Compliance Documentary Compliance
Export Import Export Import
Time
(Hours)
Cost
(USD)
Time
(Hours)
Cost
(USD)
Time
(Hours)
Cost
(USD)
Time
(Hours)
Cost
(USD)
Singapore 45 10 335 33 220 2 37 3 40
Malaysia 48 28 213 36 213 10 35 7 60
Thailand 59 44 223 50 233 11 97 4 43
Laos 76 9 140 11 224 60 235 60 115
Vietnam 100 55 290 56 373 50 139 76 183
Philippines 104 42 456 120 580 36 53 96 50
Cambodia 115 48 375 8 240 132 100 132 120
Indonesia 116 53 254 99 383 61 139 106 164
Brunei 149 117 340 48 395 155 90 132 50
Myanmar 168 142 432 230 457 144 140 48 210 Source: World Bank
Hence, tapping into the virtuous cycle where air connectivity, international trade, and economic
growth reinforce each other requires reforms to Malaysia’s trade facilitation and behind-the-
border measures. The commitment to undertake the bulk of these reforms is already embedded
within the LTFMP.

MASTERPLAN
MALAYSIAN AVIATION COMMISSION ● PROPOSAL TO THE MINISTRY OF TRANSPORT 54
Airports
As mentioned, determining the position of Malaysia’s civil aviation sector entails reviewing the role
of airports as enablers towards maximizing air connectivity. While this involves determining the
airport industry’s commercial positioning, at a more fundamental level, it also requires a review of
the industry’s structure.
Therefore, MAVCOM’s review of the Malaysian airports industry structure24 found the following
issues:
• The service levels for Malaysia’s airports have deteriorated. KUL for instance, had dropped
10 spots in the Skytrax World Airport Rankings between 2017 and 2018Airport
developments face funding constraints. The deterioration in airport service levels is partly
driven by constraints to fund investments in airports infrastructure. While MAHB’s capacity to
raise funding for development capex is restricted by the terms of its Operating Agreement (OA)
with the GoM, the private operator of Senai International Airport (JHB), SATSSB, is in the process of requesting funding from the GoM for the further implementation of its Master Plan
• A near-monopoly airports industry structure has not resulted in relatively high returns.
MAHB lags behind other airports network operators in terms of revenue per passenger
• Malaysia’s airports network is haphazard. The absence of a comprehensive NASP has meant
that the development of Malaysia’s airports network is uncoordinated not only within air transport, but also with other modes of transport as well. In addition, the development and
maintenance of PSO-related airports and infrastructure have not been determined
Meanwhile, the following are lessons learnt from case studies of other airport systems:25
• Individual airports and airport networks structures can be financially sustainable and
maintain satisfactory performance levels
• Corporate governance and commercialization are critical success factors, particularly in
the absence of competition. These include:
o Airport operators holding total responsibility for capital and operational expenditure
o Freedom from political interference at the decision-making or operational level,
especially for airports with full or partial government ownership
o Service level requirements are built into the airport charges framework, where
applicable
• Most airports do not have dedicated terminals for LCCs, opting for multi-use facilities.
This is mainly due to the dynamic nature of the airlines industry, whereby airports do not want
to commit permanent infrastructure should airlines’ business models change
• Airport networks operators (e.g. Aena in Spain) may be relatively less responsive to
airlines’ and passengers’ needs due to a lack of competition
24 Refer to MAVCOM Position Paper on Malaysia’s Airports Industry Structure (December 2019).
25 Refer to MAVCOM Position Paper on Malaysia’s Airports Industry Structure (December 2019).

MASTERPLAN
MALAYSIAN AVIATION COMMISSION ● PROPOSAL TO THE MINISTRY OF TRANSPORT 55
Finally, a recent audit on GHL holders in Malaysia by MAVCOM found the following weaknesses:
• Firms operating without licence or not complying with licence conditions. The operations
of 11 ground-handling service providers (GHSPs) are not in compliance with their respective
GHL or conditional approval (CAs) approved by the Commission. In addition, at least one
unauthorized GHSP has been providing services since 1998 without an approval from the MOT
(before March 2016, when MAVCOM was established) or MAVCOM (after March 2016)
• Low productivity due to low levels of investment in equipment and high operational staff
turnover
• Lack of monitoring and supervision of GHSPs by MAHB
Lack of competition, especially in the catering sub-sector, where the market is dominated by
Brahim’s SATS Food Services Sdn. Bhd (Brahim’s SATS), which controls 79.3% of market share
(as of 2018) Conversations between MAVCOM and foreign airlines have indicated that apart from
incentives and services offered by airports, the service quality of support services such as ground-
handling is also a key driver for the route decisions of these airlines. Hence, improvements in the
service quality of ground-handling services are imperative—especially at Malaysia’s gateway hub
and secondary hub airports.
Therefore, a long-term National Aviation Master Plan26 needs to address these structural issues in
order to allow for the commercial and competitive operations of airports.
26 A National Aviation Master Plan would comprise the Economic Master Plan for the Malaysian Civil Aviation Sector,
Technical and Safety Master Plan for the Malaysian Civil Aviation Sector, and the National Airports Master Plan.

MASTERPLAN
MALAYSIAN AVIATION COMMISSION ● PROPOSAL TO THE MINISTRY OF TRANSPORT 56
Human Capital
The development of the Malaysian civil aviation sector into one that can ably support the country’s
economic growth into a developed nation requires a strong human capital base. In 2014, the
aviation sector was estimated to have employed 43,902 full-time workers, equivalent to 0.3% of
total employed persons for the year.27 Of these, scheduled passenger air transport—Air Service
Licence holders (ASL holders)—are the largest employers, followed by services incidental to air
transportation, which include the operation of terminals (airports) (see Figure 12). In addition,
while total employee compensation comprised 34.3% of total GDP in 2014 (2015: 36.4%), total
compensation in the air transport sector comprised 59.2% of the total GDP produced in that sector
(2015: 62.0%).
Figure 12: The Malaysian Civil Aviation Sector Workforce, 2014
Source: DOS
However, in terms of the human capital development in the aviation sector, there are several
foundational challenges which need to be addressed in order to establish a human capital base that
is sufficiently strong to support the future development of the sector:
• Data-driven action plans (talent analytics) cannot be undertaken due to a lack of
comprehensive and accurate data on the current workforce as the highest granularity of data
is necessary for any useful insights to be shared within the sector
• A lack of coordination and standardization in industry qualifications and certifications
has led to a mismatch of talent supply and demand, especially for high-skilled roles where
specialized skills are not transferrable between different roles
• Globally-accepted standards of quality assurances on training and certifications—which
are readily available—are not uniformly applied across service providers, which causes
delay in the execution of the training modules and incurs high sunk cost
27 Latest available figures, DOS.
Freight, non-scheduled, 0.2%
Freight, renting, 1.6%
Freight, scheduled, 2.3%
Incidental services, 26.4%
Passenger, non-scheduled,
0.3%
Passenger, renting, 3.8%
Passenger, scheduled, 65.2%

MASTERPLAN
MALAYSIAN AVIATION COMMISSION ● PROPOSAL TO THE MINISTRY OF TRANSPORT 57
• Career-branding in the aviation sector is only targeted to the front-end roles such as
pilots and flight attendants, with less emphasis given to other professional and/or
technical roles such as route planners, revenue management executives, airline flight
instructors, and avionics technicians. There are also many individuals performing specific tasks
in ensuring that flights are safe, including those with operational roles such as baggage-
handlers and ticketing agents
• Lack of funds and common facilities which negatively affect training for smaller firms.
This can be alleviated by the establishment of permanent financial facilities i.e. a pool fund for
them to reinvest in training their succession pool
Technological advancements such as automation, machine learning, and artificial
intelligence present significant challenges to sub-sectors that are relatively labour-
intensive. While technological advancements can improve aviation sector processes and efficiency
significantly, developments such as automation and artificial intelligence also threaten to displace
a human workforce in an extremely disruptive way. Despite this very real possibility, the impact of
these possible disruptions has not been well-defined and needs to be studied in more detail.
Institutional Framework
Much like the rest of the economy, the development of Malaysia’s civil aviation sector is
underpinned by the strength of its institutional framework. The framework can be defined as the
system of formal organizational structures, policies, and laws and regulations which govern the
way in which the sector’s stakeholders—policymakers, regulators, legislators, industry players,
and consumers—operate and interact with each other.
Regulatory and Legal Framework of the Malaysian Civil Aviation Sector
At present, the aviation services sector in Malaysia is mainly governed by the MOT, CAAM, and
MAVCOM. The MOT is the principal policy maker for the aviation industry and represents Malaysia
for any inter-governmental relations regarding the civil aviation industry, such as in negotiations
for ASAs.
CAAM is an aviation agency under the MOT with regulatory functions over technical aviation
matters, particularly enforcement of safety, maintenance, and security standards.
MAVCOM, established on 1 March 2016 under Act 771, is an independent economic regulator for
the civil aviation industry in Malaysia and advisor to the MOT on economic matters pertaining to
civil aviation. As an economic regulator, MAVCOM has powers over commercial licensing and
permits, consumer protection, competition, slot allocation, ATRs, and dispute settlement in the civil
aviation industry.

MASTERPLAN
MALAYSIAN AVIATION COMMISSION ● PROPOSAL TO THE MINISTRY OF TRANSPORT 58
Figure 13 illustrates the roles of the three organizations.
Figure 13: Roles and Functions of the MOT, CAAM, and MAVCOM
Source: MAVCOM
MAVCOM MOT CAAM
• Economic regulator,
overseeing commercial and
economic matters
• Independent adviser to MOT
on economic matters
pertaining civil aviation
• Principal policy maker for the Malaysian aviation industry
• G2G negotiations for bilateral rights
• Technical regulator,
overseeing safety,
maintenance, and security
Civil Aviation
Industry Economic Issues Technical Issues

MASTERPLAN
MALAYSIAN AVIATION COMMISSION ● PROPOSAL TO THE MINISTRY OF TRANSPORT 59
Civil aviation in Malaysia is governed by legislation covering different aspects of the industry,
including economic regulation, technical regulation, implementation of international conventions,
and the GoM’s role in the civil aviation industry. Table 4 summarizes the principal legislations
governing civil aviation in Malaysia:
Table 4: Principal Legislation Governing Civil Aviation in Malaysia
Legislation Authority Scope
Technical Regulation
Civil Aviation Act
1969
CAAM Technical regulation including:
• Safety and security regulation of the civil aviation
• Aerodrome operation regulation
• Air navigation services and facilities
• Search and rescue services
• Investigation of aircraft accidents
Civil Aviation
Authority of
Malaysia Act
2017
CAAM Establishment of CAAM
Economic Regulation
Malaysian
Aviation
Commission Act
2015
MAVCOM Economic regulation of aviation services, including:
• Service licenses and permits
• Aviation services charges
• Sectoral competition law authority
• ATRs
• Slot allocation
• PSOs
• Consumer protection
• Aviation disputes
Implementation of International Conventions
Aviation
Offences Act
1984
Attorney
General’s
Chambers and the
MOT
To give effect to:
• The Convention on Offences and Certain Other
Acts Committed on Board Aircraft
• The Convention for the Suppression of Unlawful
Seizure of Aircraft
• The Convention for the Suppression of Unlawful
Acts Against the Safety of Civil Aviation
• The Protocol for the Suppression of Unlawful Acts
of Violence at Airports Serving International Civil
Aviation
MASTERPLAN
MALAYSIAN AVIATION COMMISSION ● PROPOSAL TO THE MINISTRY OF TRANSPORT 60
Legislation Authority Scope
Carriage by Air
Act 1974
The MOT and
MAVCOM
To give effect to:
• The Warsaw Convention 1955 and its
Supplementary Convention 1961
• The Montreal Protocol No. 4 of 1975 to amend the
Warsaw Convention
• The Montreal Convention 1999
International
Interests in
Mobile
Equipment
(Aircraft) Act
2006
The MOT and
CAAM
To give effect to the Convention on International
Interests in Mobile Equipment and the Protocol to the
Convention on International Interests in Mobile
Equipment on Matters Specific to Aircraft Equipment.
Source: MAVCOM
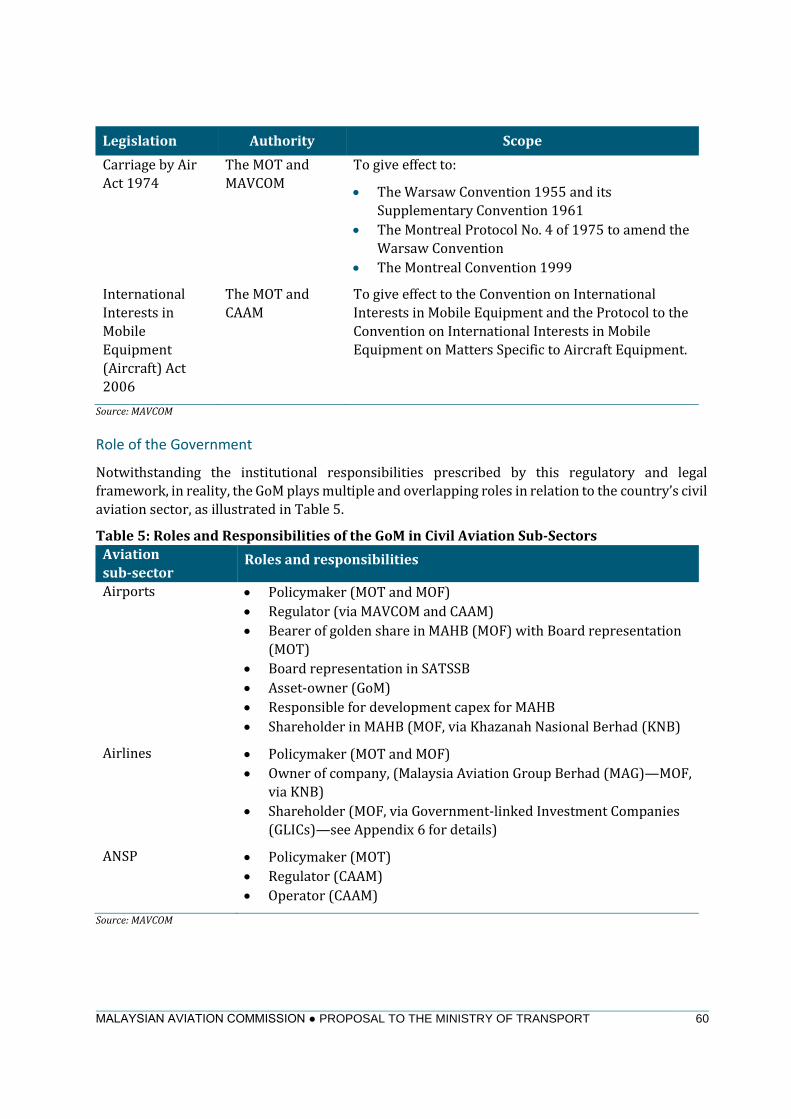
Role of the Government
Notwithstanding the institutional responsibilities prescribed by this regulatory and legal framework, in reality, the GoM plays multiple and overlapping roles in relation to the country’s civil
aviation sector, as illustrated in Table 5.
Table 5: Roles and Responsibilities of the GoM in Civil Aviation Sub-Sectors
Aviation
sub-sector Roles and responsibilities
Airports
• Policymaker (MOT and MOF)
• Regulator (via MAVCOM and CAAM)
• Bearer of golden share in MAHB (MOF) with Board representation
(MOT)
• Board representation in SATSSB
• Asset-owner (GoM)
• Responsible for development capex for MAHB
• Shareholder in MAHB (MOF, via Khazanah Nasional Berhad (KNB)
Airlines • Policymaker (MOT and MOF)
• Owner of company, (Malaysia Aviation Group Berhad (MAG)—MOF,
via KNB)
• Shareholder (MOF, via Government-linked Investment Companies
(GLICs)—see Appendix 6 for details)
ANSP • Policymaker (MOT)
• Regulator (CAAM)
• Operator (CAAM)
Source: MAVCOM

MASTERPLAN
MALAYSIAN AVIATION COMMISSION ● PROPOSAL TO THE MINISTRY OF TRANSPORT 61
These overlaps may then give rise to ad-hoc, contradictory, and inconsistent policy directions and
regulations. For instance, in its 2019 Budget, the MOF announced two measures relating to the
aviation sector—the development of an Airport Real Estate Investment Trust (REIT) and the
imposition of a Departure Levy, which would have adverse implications on the performance of the
aviation sector. The REIT may hinder efforts to grant MAHB with more responsibility over its capex
and therefore, to operate on a more commercial basis. On the other hand, the Departure Levy is
misaligned with ICAO’s Policy on Charges for Airports and Air Navigation Services, which
recommends that States should permit the imposition of charges only for services and functions
which are provided for, directly and indirectly related to the civil aviation operations.28
In addition, while the MOT’s representation on the Board of Directors of MAHB may have been a
legacy of the airport operator’s origins as a government agency, and reflective of the GoM’s
perception of airports as a strategic asset, it may also give rise to conflicts of interest.
Commercial Environment
The lynchpin for the development of the Malaysian civil aviation sector over the next decade is the
continuous maintenance of a commercial environment where competitive processes and
commercial activities are safeguarded by facilitative regulations without sacrificing consumer
welfare. There are three illustrative areas where the upholding of a fair and competitive
commercial environment manifests itself in the Malaysian civil aviation sector:
• Liberalization in terms of market and ownership structures
• Safeguarding consumer welfare
• The administration of PSOs
E. Liberalization
As with many other sectors in the Malaysian economy and the aviation services sector in many
other countries, the Malaysian civil aviation sector too has undergone significant liberalization.29
This was achieved via the following:
• Negotiating and agreeing for greater ATRs and other liberalization measures: Malaysia
has entered into 106 bilateral ASAs with other countries as of 2018. These ASAs promote and
increase air access into and from Malaysia as Parties commit to more liberal ATRs and removal
of constraints and barriers for routes, capacity, and pricing, among others
• Introducing and developing competition process in the market: Malaysia has allowed and
encouraged more players to enter and operate in the various segments of the aviation services
value chain. For example, current carriers operating in the domestic market include Malaysia
Airlines Berhad (MAB), FlyfireFly Sdn. Bhd. (Firefly), MASwings Sdn. Bhd. (MASwings), AirAsia,
and Malindo Airways Sdn. Bhd. (Malindo), while in the past, there were Pelangi Airways Sdn.
Bhd. and Berjaya Air Sdn. Bhd. In the airport management market, airport operators include
MAHB, SATSSB, and Tanjung Manis Development Sdn. Bhd. Finally, in the ground handling
markets, players include POS Aviation Sdn. Bhd. (formerly known as KL Aviation Services Sdn.
Bhd.), AeroHandlers Sdn. Bhd., and Brahim’s SATS
28 Refer to MAVCOM’s commentary on aviation-related measures in the 2019 Budget. 29 Refer to MAVCOM Position Paper on Sequencing Liberalization for the Aviation Services Sector (July 2019).
MASTERPLAN
MALAYSIAN AVIATION COMMISSION ● PROPOSAL TO THE MINISTRY OF TRANSPORT 62
• Promoting both private and foreign ownership in industry players operating in the
various parts of the aviation services value chain: For example, both AirAsia and Malindo
are privately-owned airlines. They, along with MAHB, also have foreign ownership in the form
of institutional investors. Additionally, MAHB and AirAsia are listed on Bursa Malaysia
Market liberalization has benefited consumers who now enjoy more choices through increased
connectivity and lower airfares:
• Passenger traffic has increased from 65.3mn in 2011 to 102.5mn in 2018
• As of 2018, Malaysia was connected to 128 international destinations, ranking fourth in ASEAN
after Thailand, Singapore, and Indonesia
• The average airfares for Malaysian carriers had been on the downward trend for both domestic
and international airfares from 2011 to 2018. The average domestic airfares decreased from
RM245 in 1Q11 to RM215 in 4Q18 while the average international airfares decreased from
RM570 to RM467 for the same period.
Despite these achievements, more can and needs to be done to ensure that the benefits of market
liberalization continue and are sustainable for the long term. The issues and challenges that have
been identified with regards to the liberalization of the sector include:
• Issues with mixed ownership structures—tensions may arise due to:
o Perceived preferential treatment by the GoM for State-Owned Enterprises (SOEs): in
the context of competition law, any preferential treatment by the GoM creates an
uneven playing field which disadvantages other companies in the market
o Managing the balance between commercial and non-commercial objectives: unlike for
non-SOEs, SOEs may have the additional burden of having to fulfil non-commercial
objectives despite having to ensure their profitability, and therefore, having to bear the
high costs for aviation services to achieve the social benefits expected by the GoM and
the public
o Managing tensions between the need to meet international obligations in ASAs and to
subsidize: the currently negotiated ASEAN-EU Comprehensive Air Transport
Agreement (ASEAN-EU CATA) has incorporated comprehensive and deep obligations
on competition, including rules on state aid or subsidies. Would any of the existing
subsidies in the aviation services sector be inconsistent with these obligations?
o Funding of aviation-related activities and infrastructure by the GoM and taxpayers
versus by private investors: the GoM may have difficulties in financing aviation-related
activities and infrastructure when it also needs to reduce its fiscal deficit and debt.
Should the current model of privatization be revised? Would it be appropriate to move
from the current public-private partnership (PPP) model for asset
ownership/operation to purely private participation in asset ownership/operation in
the future?

MASTERPLAN
MALAYSIAN AVIATION COMMISSION ● PROPOSAL TO THE MINISTRY OF TRANSPORT 63
o Keeping pace with the latest development of liberalization in the international aviation
sector: historically, flag carriers were owned by their governments, but this has
gradually changed with more private investment into airlines. As a consequence, the
concept of a ‘flag carrier’ is becoming increasingly diluted and indeed, the US has no flag
carriers. In Malaysia, AirAsia flies more domestic and international routes, and carries
more passengers than any other Malaysian carrier. Is the concept of a ‘flag carrier’,
owned by the GoM, still relevant in the Malaysian context? Issues with common
ownership—while common ownership has its benefits in terms of allowing for cross-
subsidization and leveraging on economies of scale, it could also lead to negative
implications should inefficient companies within a group/network be subsidized, and
if companies are incentivized to undertake anti-competitive conduct
• Outdated regulatory instruments still in force to regulate the sector—despite the slew of
regulatory instruments available for the GoM to ensure that the civil aviation sector acts in
accordance with national objectives, several outdated practises have been retained, with the
most intrusive being the State ownership of assets and companies in the sector. This still
prevails despite the GoM undertaking the privatization programme in the 1980s and the
existence of a complete suite of regulations in governing all aspects of the civil aviation sector—
technical, safety, and security regulations implemented by CAAM and economic regulations
implemented by MAVCOM
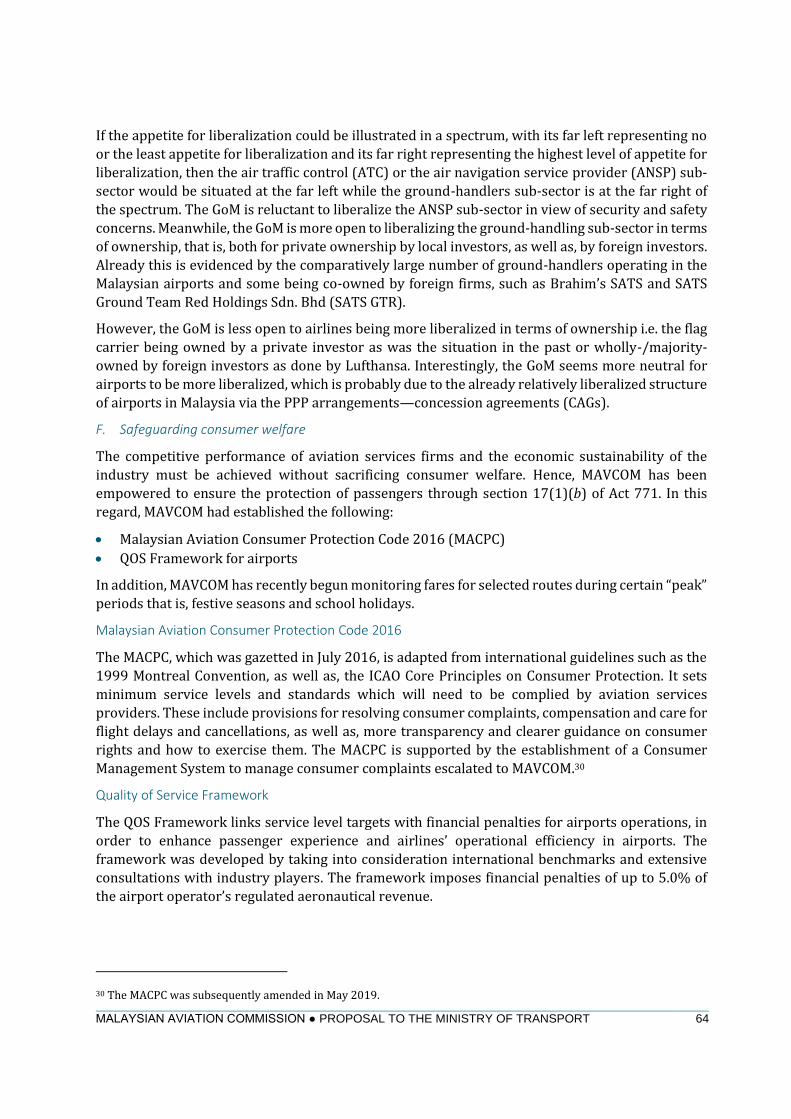
• Different levels of appetite for liberalization of the key sub-sectors in the aviation services
market—despite the sector liberalization having been in progress since the 1980s, the GoM still
has different levels of appetite for liberalization of the key sub-sectors in the aviation services
markets, as illustrated in Figure 14
Figure 14: Differing Appetite for Liberalization in the Aviation Industry
Source: MAVCOM
More Appetite
Airlines Ground Handlers Airports ATC
• National pride, designation requirements in ASA
• Strategic government asset, but operator may not necessarily be local
• No issue of sovereignty involved
• Provision in ASA that allows ground handling for airlines
• Security concerns
Why?
Less Appetite
MASTERPLAN
MALAYSIAN AVIATION COMMISSION ● PROPOSAL TO THE MINISTRY OF TRANSPORT 64
If the appetite for liberalization could be illustrated in a spectrum, with its far left representing no
or the least appetite for liberalization and its far right representing the highest level of appetite for
liberalization, then the air traffic control (ATC) or the air navigation service provider (ANSP) sub-
sector would be situated at the far left while the ground-handlers sub-sector is at the far right of
the spectrum. The GoM is reluctant to liberalize the ANSP sub-sector in view of security and safety
concerns. Meanwhile, the GoM is more open to liberalizing the ground-handling sub-sector in terms
of ownership, that is, both for private ownership by local investors, as well as, by foreign investors.
Already this is evidenced by the comparatively large number of ground-handlers operating in the
Malaysian airports and some being co-owned by foreign firms, such as Brahim’s SATS and SATS
Ground Team Red Holdings Sdn. Bhd (SATS GTR).
However, the GoM is less open to airlines being more liberalized in terms of ownership i.e. the flag
carrier being owned by a private investor as was the situation in the past or wholly-/majority-
owned by foreign investors as done by Lufthansa. Interestingly, the GoM seems more neutral for
airports to be more liberalized, which is probably due to the already relatively liberalized structure
of airports in Malaysia via the PPP arrangements—concession agreements (CAGs).
F. Safeguarding consumer welfare
The competitive performance of aviation services firms and the economic sustainability of the
industry must be achieved without sacrificing consumer welfare. Hence, MAVCOM has been
empowered to ensure the protection of passengers through section 17(1)(b) of Act 771. In this
regard, MAVCOM had established the following:
• Malaysian Aviation Consumer Protection Code 2016 (MACPC)
• QOS Framework for airports
In addition, MAVCOM has recently begun monitoring fares for selected routes during certain “peak”
periods that is, festive seasons and school holidays.
Malaysian Aviation Consumer Protection Code 2016
The MACPC, which was gazetted in July 2016, is adapted from international guidelines such as the
1999 Montreal Convention, as well as, the ICAO Core Principles on Consumer Protection. It sets
minimum service levels and standards which will need to be complied by aviation services
providers. These include provisions for resolving consumer complaints, compensation and care for
flight delays and cancellations, as well as, more transparency and clearer guidance on consumer
rights and how to exercise them. The MACPC is supported by the establishment of a Consumer
Management System to manage consumer complaints escalated to MAVCOM.30
Quality of Service Framework
The QOS Framework links service level targets with financial penalties for airports operations, in
order to enhance passenger experience and airlines’ operational efficiency in airports. The
framework was developed by taking into consideration international benchmarks and extensive
consultations with industry players. The framework imposes financial penalties of up to 5.0% of
the airport operator’s regulated aeronautical revenue.
30 The MACPC was subsequently amended in May 2019.

MASTERPLAN
MALAYSIAN AVIATION COMMISSION ● PROPOSAL TO THE MINISTRY OF TRANSPORT 65
The QOS Framework comprises service quality categories with multiple service elements which
will be measured by MAVCOM to determine the performance of service at a particular airport.
These categories are:
• Passenger comfort and facilities
• Operator and staff facilities
• Queuing times
• Passenger and baggage flows
See Appendix 7 for details on the QOS Framework.
Monitoring of air fares
MAVCOM’s current price monitoring efforts provide an example of how the regulator can balance
the commercial and competitive interests of aviation services providers—in this case, airlines—
with consumer welfare. Arising from public complaints on the high domestic airfares during the
festive seasons and school holidays, MAVCOM had undertaken a study on the pricing patterns of
airfares for domestic flights during these peak seasons. The results of the study had been published
in the MAVCOM Technical Paper on Airfares for Domestic Flights During Peak Seasons in August
2018.
The study found evidence of airfare increases during some of the peak seasons, regardless of the
market concentration in those routes. However, the study also found that heavy-handed price
regulation could have detrimental unintended consequences, such as price ceilings leading to an
increase in average airfares and decreasing competition.
MAVCOM is implementing the following ‘soft-touch’ regulatory measures to preserve the
commercial and competitive nature of the domestic scheduled services market, while
simultaneously ensuring that consumers overall are not unduly disadvantaged:
• Compulsory filing of airfares for selected routes during the peak seasons for monitoring
purposes
• Encouraging more airlines to operate on monopoly routes, or routes with high demand or no
alternative modes of transport
• Continuous monitoring of domestic airfares for peak seasons
G. Public Service Obligations
Currently, the sole example of PSO within the sector is the RAS programme which provides
subsidized air connectivity (for passengers and freight) in Sabah and Sarawak. Prior to the
establishment of MAVCOM, the RAS programme was governed through a contract between the GoM
and the current RAS operator, MASwings.
The RAS routes are defined as follows:
• Routes serving regions which are remote and/or sparsely populated
• Routes serving regions faced with significant accessibility issues arising from geographical
peripherality or lack of adequate surface transport alternatives
• Routes which airlines would not serve if only commercial interests were considered

MASTERPLAN
MALAYSIAN AVIATION COMMISSION ● PROPOSAL TO THE MINISTRY OF TRANSPORT 66
MAVCOM performed a review of the existing RAS regime as part of its advisory role to the MOT.
The review resulted in rationalized routes, as well as, reformulation of the subsidy which was
linked to agreed key performance indicators (KPIs). The proposed regime also allows the GoM to
embed an element of risk and reward into the payment of subsidies to MASwings. Hence, the
proposed PSO mechanism introduces commercial and quantitative considerations and
performance-based measurements which were absent in the previous system.
The key challenge for the implementation of the RAS programme is that the definition of PSO only
covers the carriage of passengers and freight by air but excludes provisions for aerodromes, that is,
airports and short take-off and landing airports (STOLports). Therefore, funding for RAS-related
infrastructure, including those for runways and ATCs, is not subsidized by the GoM, despite not
being commercially viable. This is a gap which the Master Plan will address as part of the reform of
the airports industry structure.
See Appendix 8 for additional details of MAVCOM’s review of the RAS programme.