Seasonal Variation in Schools’ Indoor Air Environments and Health Symptoms among Students in an...
23
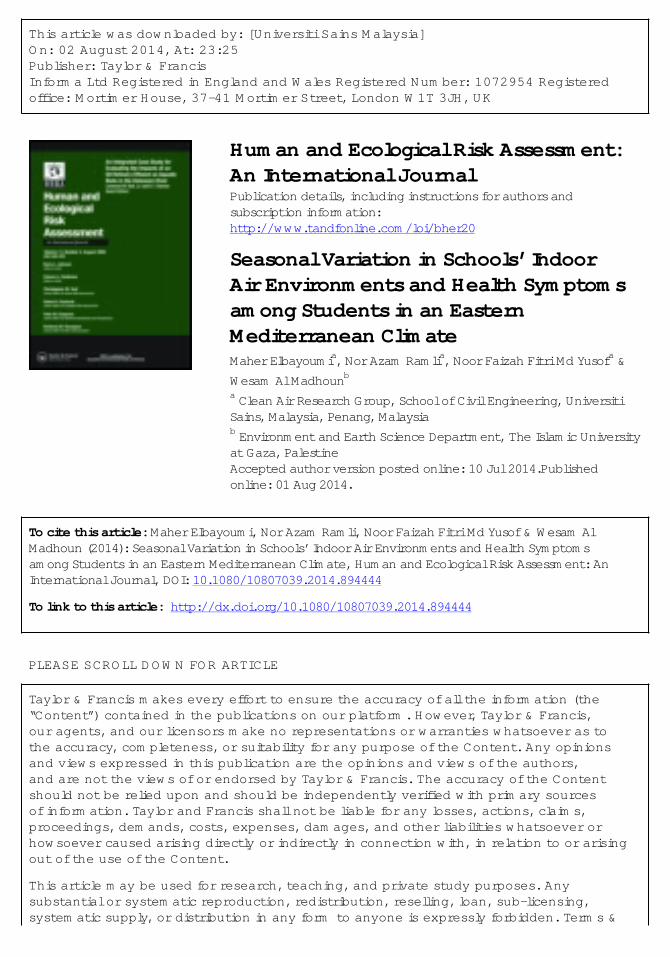
This article was downloaded by: [Universiti Sains Malaysia] On: 02 August 2014, At: 23:25 Publisher: Taylor & Francis Informa Ltd Registered in England and Wales Registered Number: 1072954 Registered office: Mortimer House, 37-41 Mortimer Street, London W1T 3JH, UK Human and Ecological Risk Assessment: An International Journal Publication details, including instructions for authors and subscription information: http://www.tandfonline.com/loi/bher20 Seasonal Variation in Schools’ Indoor Air Environments and Health Symptoms among Students in an Eastern Mediterranean Climate Maher Elbayoumi a , Nor Azam Ramli a , Noor Faizah Fitri Md Yusof a & Wesam Al Madhoun b a Clean Air Research Group, School of Civil Engineering, Universiti Sains, Malaysia, Penang, Malaysia b Environment and Earth Science Department, The Islamic University at Gaza, Palestine Accepted author version posted online: 10 Jul 2014.Published online: 01 Aug 2014. To cite this article: Maher Elbayoumi, Nor Azam Ramli, Noor Faizah Fitri Md Yusof & Wesam Al Madhoun (2014): Seasonal Variation in Schools’ Indoor Air Environments and Health Symptoms among Students in an Eastern Mediterranean Climate, Human and Ecological Risk Assessment: An International Journal, DOI: 10.1080/10807039.2014.894444 To link to this article: http://dx.doi.org/10.1080/10807039.2014.894444 PLEASE SCROLL DOWN FOR ARTICLE Taylor & Francis makes every effort to ensure the accuracy of all the information (the “Content”) contained in the publications on our platform. However, Taylor & Francis, our agents, and our licensors make no representations or warranties whatsoever as to the accuracy, completeness, or suitability for any purpose of the Content. Any opinions and views expressed in this publication are the opinions and views of the authors, and are not the views of or endorsed by Taylor & Francis. The accuracy of the Content should not be relied upon and should be independently verified with primary sources of information. Taylor and Francis shall not be liable for any losses, actions, claims, proceedings, demands, costs, expenses, damages, and other liabilities whatsoever or howsoever caused arising directly or indirectly in connection with, in relation to or arising out of the use of the Content. This article may be used for research, teaching, and private study purposes. Any substantial or systematic reproduction, redistribution, reselling, loan, sub-licensing, systematic supply, or distribution in any form to anyone is expressly forbidden. Terms &
Transcript of Seasonal Variation in Schools’ Indoor Air Environments and Health Symptoms among Students in an...
This article was downloaded by: [Universiti Sains Malaysia]On: 02 August 2014, At: 23:25Publisher: Taylor & FrancisInforma Ltd Registered in England and Wales Registered Number: 1072954 Registeredoffice: Mortimer House, 37-41 Mortimer Street, London W1T 3JH, UK
Human and Ecological Risk Assessment:An International JournalPublication details, including instructions for authors andsubscription information:http://www.tandfonline.com/loi/bher20
Seasonal Variation in Schools’ IndoorAir Environments and Health Symptomsamong Students in an EasternMediterranean ClimateMaher Elbayoumia, Nor Azam Ramlia, Noor Faizah Fitri Md Yusofa &Wesam Al Madhounb
a Clean Air Research Group, School of Civil Engineering, UniversitiSains, Malaysia, Penang, Malaysiab Environment and Earth Science Department, The Islamic Universityat Gaza, PalestineAccepted author version posted online: 10 Jul 2014.Publishedonline: 01 Aug 2014.
To cite this article: Maher Elbayoumi, Nor Azam Ramli, Noor Faizah Fitri Md Yusof & Wesam AlMadhoun (2014): Seasonal Variation in Schools’ Indoor Air Environments and Health Symptomsamong Students in an Eastern Mediterranean Climate, Human and Ecological Risk Assessment: AnInternational Journal, DOI: 10.1080/10807039.2014.894444
To link to this article: http://dx.doi.org/10.1080/10807039.2014.894444
PLEASE SCROLL DOWN FOR ARTICLE
Taylor & Francis makes every effort to ensure the accuracy of all the information (the“Content”) contained in the publications on our platform. However, Taylor & Francis,our agents, and our licensors make no representations or warranties whatsoever as tothe accuracy, completeness, or suitability for any purpose of the Content. Any opinionsand views expressed in this publication are the opinions and views of the authors,and are not the views of or endorsed by Taylor & Francis. The accuracy of the Contentshould not be relied upon and should be independently verified with primary sourcesof information. Taylor and Francis shall not be liable for any losses, actions, claims,proceedings, demands, costs, expenses, damages, and other liabilities whatsoever orhowsoever caused arising directly or indirectly in connection with, in relation to or arisingout of the use of the Content.
This article may be used for research, teaching, and private study purposes. Anysubstantial or systematic reproduction, redistribution, reselling, loan, sub-licensing,systematic supply, or distribution in any form to anyone is expressly forbidden. Terms &

Conditions of access and use can be found at http://www.tandfonline.com/page/terms-and-conditions
Dow
nloa
ded
by [
Uni
vers
iti S
ains
Mal
aysi
a] a
t 23:
25 0
2 A
ugus
t 201
4
Human and Ecological Risk Assessment, 00: 1–21, 2015Copyright C© Taylor & Francis Group, LLCISSN: 1080-7039 print / 1549-7860 onlineDOI: 10.1080/10807039.2014.894444
Seasonal Variation in Schools’ Indoor AirEnvironments and Health Symptoms among Studentsin an Eastern Mediterranean Climate
Maher Elbayoumi,1 Nor Azam Ramli,1 Noor Faizah Fitri Md Yusof,1
and Wesam Al Madhoun2
1Clean Air Research Group, School of Civil Engineering, Universiti Sains, Malaysia,Penang, Malaysia; 2Environment and Earth Science Department, The IslamicUniversity at Gaza, Palestine
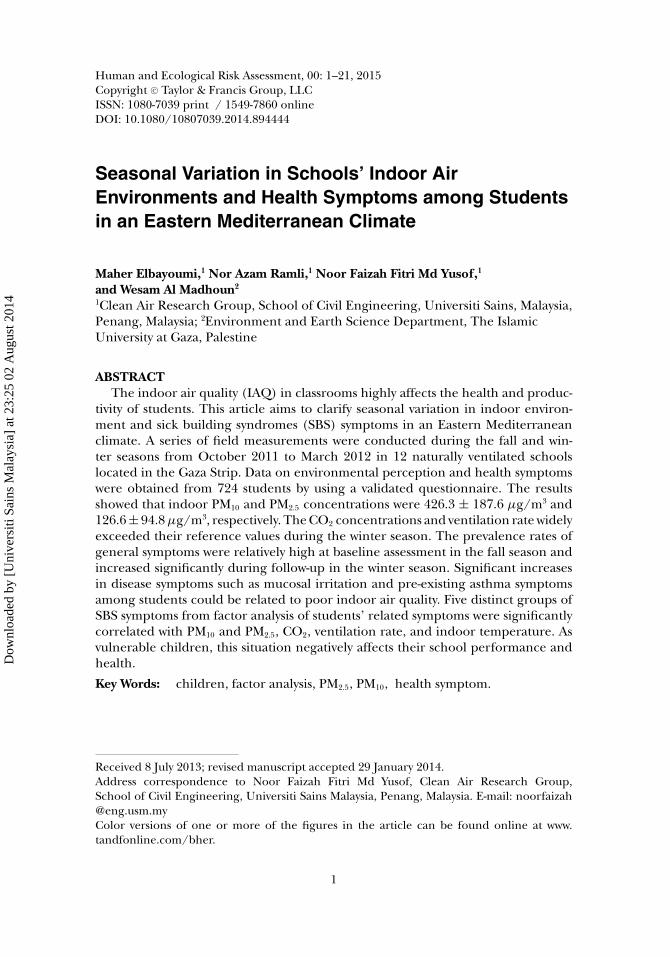
ABSTRACTThe indoor air quality (IAQ) in classrooms highly affects the health and produc-
tivity of students. This article aims to clarify seasonal variation in indoor environ-ment and sick building syndromes (SBS) symptoms in an Eastern Mediterraneanclimate. A series of field measurements were conducted during the fall and win-ter seasons from October 2011 to March 2012 in 12 naturally ventilated schoolslocated in the Gaza Strip. Data on environmental perception and health symptomswere obtained from 724 students by using a validated questionnaire. The resultsshowed that indoor PM10 and PM2.5 concentrations were 426.3 ± 187.6 µg/m3 and126.6 ± 94.8 µg/m3, respectively. The CO2 concentrations and ventilation rate widelyexceeded their reference values during the winter season. The prevalence rates ofgeneral symptoms were relatively high at baseline assessment in the fall season andincreased significantly during follow-up in the winter season. Significant increasesin disease symptoms such as mucosal irritation and pre-existing asthma symptomsamong students could be related to poor indoor air quality. Five distinct groups ofSBS symptoms from factor analysis of students’ related symptoms were significantlycorrelated with PM10 and PM2.5, CO2, ventilation rate, and indoor temperature. Asvulnerable children, this situation negatively affects their school performance andhealth.
Key Words: children, factor analysis, PM2.5, PM10, health symptom.
Received 8 July 2013; revised manuscript accepted 29 January 2014.Address correspondence to Noor Faizah Fitri Md Yusof, Clean Air Research Group,School of Civil Engineering, Universiti Sains Malaysia, Penang, Malaysia. E-mail: [email protected] versions of one or more of the figures in the article can be found online at www.tandfonline.com/bher.
1
Dow
nloa
ded
by [
Uni
vers
iti S
ains
Mal
aysi
a] a
t 23:
25 0
2 A
ugus
t 201
4
M. Elbayoumi et al.
INTRODUCTION
Growing scientific evidence during the last decade indicates that the air insidehomes and other buildings can be more polluted than the outdoor air (USEPA2012). The concentration of certain indoor air pollutants may be 2–5 times andoccasionally more than 100 times higher than outdoor air (Zock et al. 2002). Thus,problems of indoor air quality are recognized as important risk factors for humanhealth in both low-income and middle- to high-income countries (WHO 2009).Moreover, indoor air quality (IAQ) causes adverse effects mainly when buildingsare naturally ventilated, providing a way for outdoor pollutants to infiltrate or enterindoors where the closing and opening of inlets (doors and windows) are regulatedaccording to occupants’ thermal comfort and seasonal variation (Kwok and Chun2003; Habil and Taneja 2011).
Indoor environmental quality in schools is a key element as it can affect studentsand teachers in a variety of ways such as health, performance, and comfort (Kwokand Chun 2003). However, a growing body of evidence has demonstrated thatthere are serious inadequate operation and maintenance of facilities inside schoolbuildings as a result of chronic shortages in funding (Mendell and Heath 2004). Asa result the effects of air pollution on children have been growing and one of theconsequences is an increase worldwide in the prevalence of allergic rhinitis, asthma,and sick building syndromes (SBS) (Khan et al. 2007).
Children worldwide spend about one-third of their time inside school buildings,which represents a substantial portion of the day, that is, wakening hours (Almeidaet al. 2011; Habil et al. 2013). Moreover, children have greater susceptibility to someenvironmental pollutants than adults. Children’s tissues and organs are activelygrowing (Mendell and Heath 2004) and they are more active than adults, whichresults in a higher intake of air into their lungs as compared to adults (Salvi 2007).Furthermore, children have narrower airways than do adults. Thus, irritation causedby air pollution can result in potentially significant obstruction in the airways of ayoung child (Kulkarni and Grigg 2008).
Air quality is in deterioration in the Middle East and characterized by dust storms,high levels of desert particulate matter (PM), transportation- and industry-relatedemissions, and meteorology-linked smog formation (Saliba et al. 2010). The sea-sonal variation in the Middle East area is considered one of the main reasons thatinfluence the rising concentration of several pollutants such as PM2.5 and PM10 (El-bayoumi et al. 2013b). Seasonal dust storms that mainly form in the winter andspring seasons come from northern Africa and the Arabian Peninsula Desert, in-ducing the transport of mineral dust into the region (Dayan and Levy 2005). It hasbeen estimated that 70 million tons of the Saharan dust is transported every yearand 20–30 million tons of this amount are deposited in the lower free troposphereof the eastern Mediterranean area (Zereini and Wiseman 2010). Further, the sea-sonal fluctuation of air pollutant, ambient temperature, and relative humidity thatinfluenced ventilation rate can cause typical symptom of sick building syndrome(SBS).
As per reports from the Middle East, the length of the education expectancy forchildren has increased in the last decade from 8.2 years to 10 years (UNESCO 2010).Therefore, attaining education is a vital indication of development in this region
2 Hum. Ecol. Risk Assess. Vol. 00, No. 0, 2015
Dow
nloa
ded
by [
Uni
vers
iti S
ains
Mal
aysi
a] a
t 23:
25 0
2 A
ugus
t 201
4
Students’ Environment and Health Symptoms in an Eastern Mediterranean Climate
and education has become a crucial component of a child’s social development.Nevertheless, the schools’ environment has not received much attention in mostArab countries due to bad economic situations. Consequently, data for IAQ in Arabcountries schools in general and in Gaza Strip schools in particular are still veryscarce. Furthermore, according to the published literature, no representative studyon IAQ and related health symptoms for children in schools has been done beforein the Middle Eastern region (Yeatts et al. 2012).
The purposes of this study were (i) to examine the seasonal variation of self-reported prevalence of disease symptoms among Palestinian students and (ii) toevaluate the impact of the indoor air quality of schools on the prevalence of diseasesymptoms among students. Therefore, this study is considered as the first effort thatattempts to characterize the dimensions of the current situation in relation to IAQand health symptoms in selected schools in the study area. The results obtained area useful contribution for implementing public health prevention programs and toformulate recommendations aimed at providing healthier school environments.
METHODS AND MATERIALS
Study Area
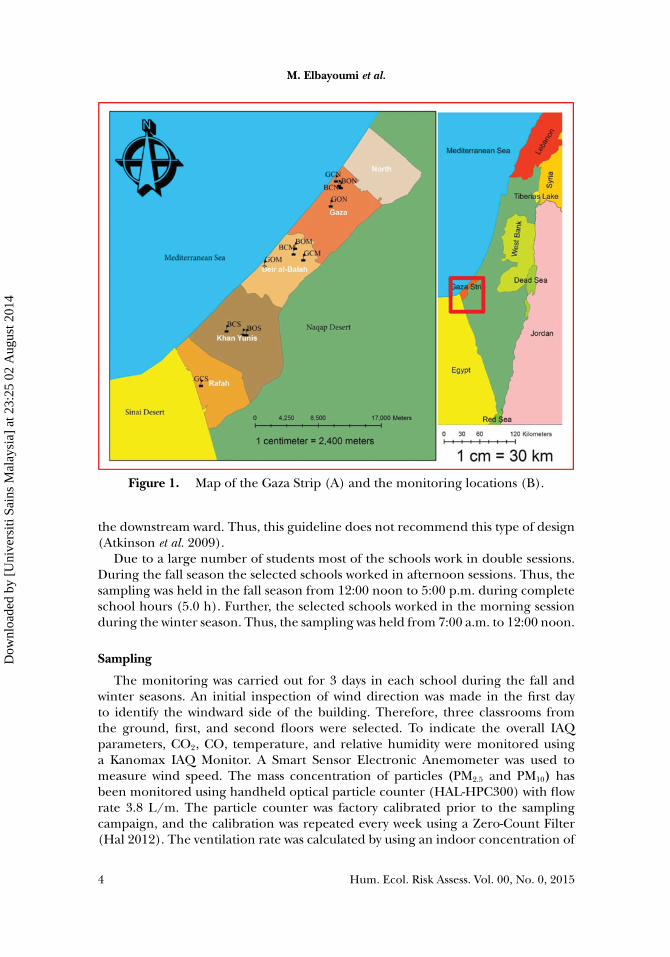
This study was conducted in schools situated in the Gaza Strip of Palestinianterritories. The Gaza Strip is a semi-arid coastal land of roughly 360.0 km2 of arableland along the eastern Mediterranean Sea (Figure 1A). The climate is characterizedby mild and humid winter (December to March), which is dominated by rainfall.The spring season (March to June) is characterized by unsettled winter type weatherfor the first month, associated with North African cyclones, while the rest of thisperiod is very similar to that in summer. The summer months (June to September)are characterized by high humidity and lack of wet precipitation. The fall season(September to December) is typically characterized by abrupt summer type weatherin the first month. The rest of this period is characterized by the unsettled winterweather (PMD 2012).
Selection of Schools
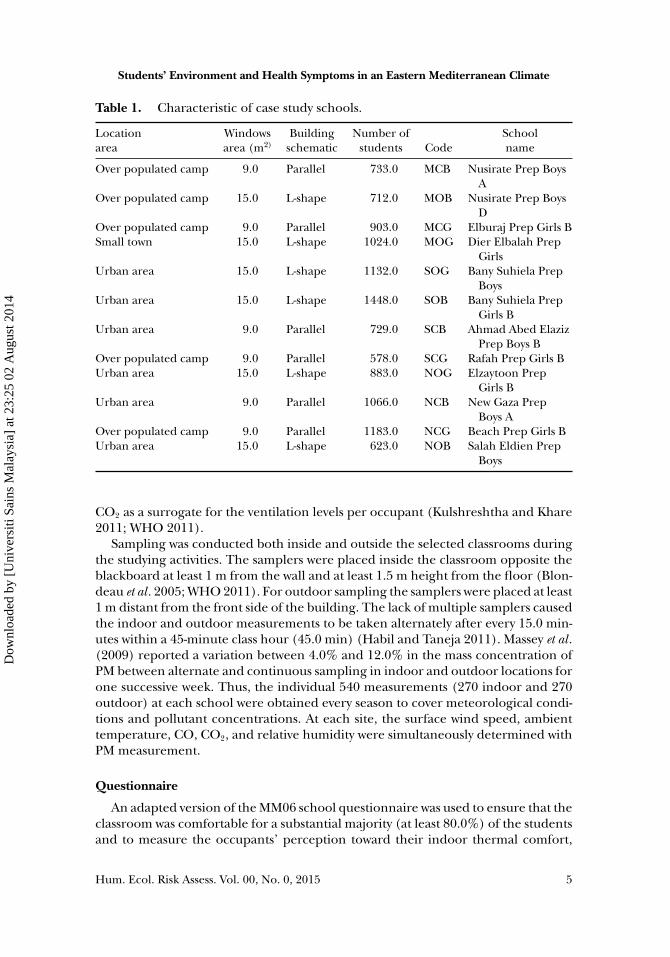
Sampling was performed in 12 overcrowded school buildings. The selection ofschools was based on the geographical distribution of the refugee people (camps,cities), building prototype, and male or female students in the schools. Presentedin Table 1 and Figure 1B are each school’s details. All schools in the Gaza Strip arenatural-ventilated schools with three-story building construction and total height of10.0 m. There are two common design models for school buildings. The first modelis an L-shape model, which is naturally cross-ventilated with a single-side corridortype. The corridor is usually on one side of the ward of classrooms. The secondmodel is a parallel shape model, which is cross-ventilated with double banked andconsists of two symmetric rows of classrooms embracing corridors. The possibleairflow path would be from one ward to the corridor, and then to the ward onthe other side. According to WHO ventilation guidelines (2009) the parallel shapemodel would result in possibly contaminated air moving from the upstream ward to
Hum. Ecol. Risk Assess. Vol. 00, No. 0, 2015 3
Dow
nloa
ded
by [
Uni
vers
iti S
ains
Mal
aysi
a] a
t 23:
25 0
2 A
ugus
t 201
4
M. Elbayoumi et al.
Figure 1. Map of the Gaza Strip (A) and the monitoring locations (B).
the downstream ward. Thus, this guideline does not recommend this type of design(Atkinson et al. 2009).
Due to a large number of students most of the schools work in double sessions.During the fall season the selected schools worked in afternoon sessions. Thus, thesampling was held in the fall season from 12:00 noon to 5:00 p.m. during completeschool hours (5.0 h). Further, the selected schools worked in the morning sessionduring the winter season. Thus, the sampling was held from 7:00 a.m. to 12:00 noon.
Sampling
The monitoring was carried out for 3 days in each school during the fall andwinter seasons. An initial inspection of wind direction was made in the first dayto identify the windward side of the building. Therefore, three classrooms fromthe ground, first, and second floors were selected. To indicate the overall IAQparameters, CO2, CO, temperature, and relative humidity were monitored usinga Kanomax IAQ Monitor. A Smart Sensor Electronic Anemometer was used tomeasure wind speed. The mass concentration of particles (PM2.5 and PM10) hasbeen monitored using handheld optical particle counter (HAL-HPC300) with flowrate 3.8 L/m. The particle counter was factory calibrated prior to the samplingcampaign, and the calibration was repeated every week using a Zero-Count Filter(Hal 2012). The ventilation rate was calculated by using an indoor concentration of
4 Hum. Ecol. Risk Assess. Vol. 00, No. 0, 2015
Dow
nloa
ded
by [
Uni
vers
iti S
ains
Mal
aysi
a] a
t 23:
25 0
2 A
ugus
t 201
4
Students’ Environment and Health Symptoms in an Eastern Mediterranean Climate
Table 1. Characteristic of case study schools.
Location Windows Building Number of Schoolarea area (m2) schematic students Code name
Over populated camp 9.0 Parallel 733.0 MCB Nusirate Prep BoysA
Over populated camp 15.0 L-shape 712.0 MOB Nusirate Prep BoysD
Over populated camp 9.0 Parallel 903.0 MCG Elburaj Prep Girls BSmall town 15.0 L-shape 1024.0 MOG Dier Elbalah Prep
GirlsUrban area 15.0 L-shape 1132.0 SOG Bany Suhiela Prep
BoysUrban area 15.0 L-shape 1448.0 SOB Bany Suhiela Prep
Girls BUrban area 9.0 Parallel 729.0 SCB Ahmad Abed Elaziz
Prep Boys BOver populated camp 9.0 Parallel 578.0 SCG Rafah Prep Girls BUrban area 15.0 L-shape 883.0 NOG Elzaytoon Prep
Girls BUrban area 9.0 Parallel 1066.0 NCB New Gaza Prep
Boys AOver populated camp 9.0 Parallel 1183.0 NCG Beach Prep Girls BUrban area 15.0 L-shape 623.0 NOB Salah Eldien Prep
Boys
CO2 as a surrogate for the ventilation levels per occupant (Kulshreshtha and Khare2011; WHO 2011).
Sampling was conducted both inside and outside the selected classrooms duringthe studying activities. The samplers were placed inside the classroom opposite theblackboard at least 1 m from the wall and at least 1.5 m height from the floor (Blon-deau et al . 2005; WHO 2011). For outdoor sampling the samplers were placed at least1 m distant from the front side of the building. The lack of multiple samplers causedthe indoor and outdoor measurements to be taken alternately after every 15.0 min-utes within a 45-minute class hour (45.0 min) (Habil and Taneja 2011). Massey et al .(2009) reported a variation between 4.0% and 12.0% in the mass concentration ofPM between alternate and continuous sampling in indoor and outdoor locations forone successive week. Thus, the individual 540 measurements (270 indoor and 270outdoor) at each school were obtained every season to cover meteorological condi-tions and pollutant concentrations. At each site, the surface wind speed, ambienttemperature, CO, CO2, and relative humidity were simultaneously determined withPM measurement.
Questionnaire
An adapted version of the MM06 school questionnaire was used to ensure that theclassroom was comfortable for a substantial majority (at least 80.0%) of the studentsand to measure the occupants’ perception toward their indoor thermal comfort,
Hum. Ecol. Risk Assess. Vol. 00, No. 0, 2015 5
Dow
nloa
ded
by [
Uni
vers
iti S
ains
Mal
aysi
a] a
t 23:
25 0
2 A
ugus
t 201
4
M. Elbayoumi et al.
air movements, and health symptoms (Andersson 1998). The questionnaire is avalidated self-administered questionnaire designed for the epidemiological assess-ment of IAQ and SBS symptoms, and has been widely used in different studies(Nordstrom et al. 1994; Mizoue et al. 2001). The first part of the questionnaire wasdevoted to demographic data. The rest of the questionnaire addressed comfort andhealth-related complaints. The following groups of symptoms were considered: (1)mucosal irritation or upper respiratory problems (dry, itching, irritated, or wateryeyes; nasal problems, sore throat, cough); (2) lower respiratory problems (tightchest, breathing difficulties such as breath shortness, wheeze); (3) central nervoussystem (CNS) (fatigue, headache, heavy head, dizziness, concentration difficulties)symptoms; and (4) dermal symptoms (dry skin, namely in hands) (Madureira et al.2009; Massey et al. 2009).
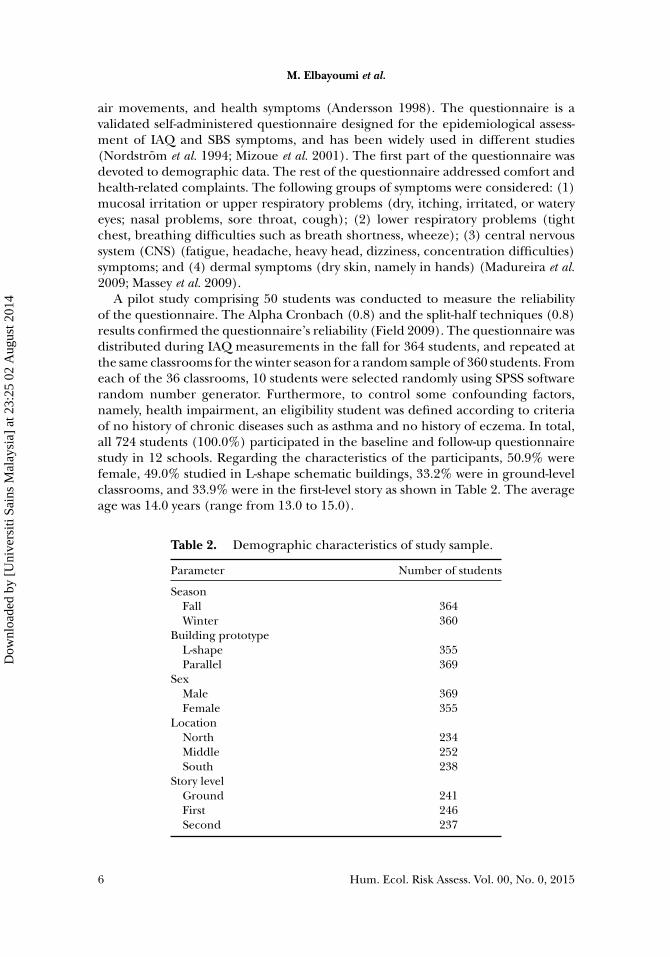
A pilot study comprising 50 students was conducted to measure the reliabilityof the questionnaire. The Alpha Cronbach (0.8) and the split-half techniques (0.8)results confirmed the questionnaire’s reliability (Field 2009). The questionnaire wasdistributed during IAQ measurements in the fall for 364 students, and repeated atthe same classrooms for the winter season for a random sample of 360 students. Fromeach of the 36 classrooms, 10 students were selected randomly using SPSS softwarerandom number generator. Furthermore, to control some confounding factors,namely, health impairment, an eligibility student was defined according to criteriaof no history of chronic diseases such as asthma and no history of eczema. In total,all 724 students (100.0%) participated in the baseline and follow-up questionnairestudy in 12 schools. Regarding the characteristics of the participants, 50.9% werefemale, 49.0% studied in L-shape schematic buildings, 33.2% were in ground-levelclassrooms, and 33.9% were in the first-level story as shown in Table 2. The averageage was 14.0 years (range from 13.0 to 15.0).
Table 2. Demographic characteristics of study sample.
Parameter Number of students
SeasonFall 364Winter 360
Building prototypeL-shape 355Parallel 369
SexMale 369Female 355
LocationNorth 234Middle 252South 238
Story levelGround 241First 246Second 237
6 Hum. Ecol. Risk Assess. Vol. 00, No. 0, 2015
Dow
nloa
ded
by [
Uni
vers
iti S
ains
Mal
aysi
a] a
t 23:
25 0
2 A
ugus
t 201
4
Students’ Environment and Health Symptoms in an Eastern Mediterranean Climate
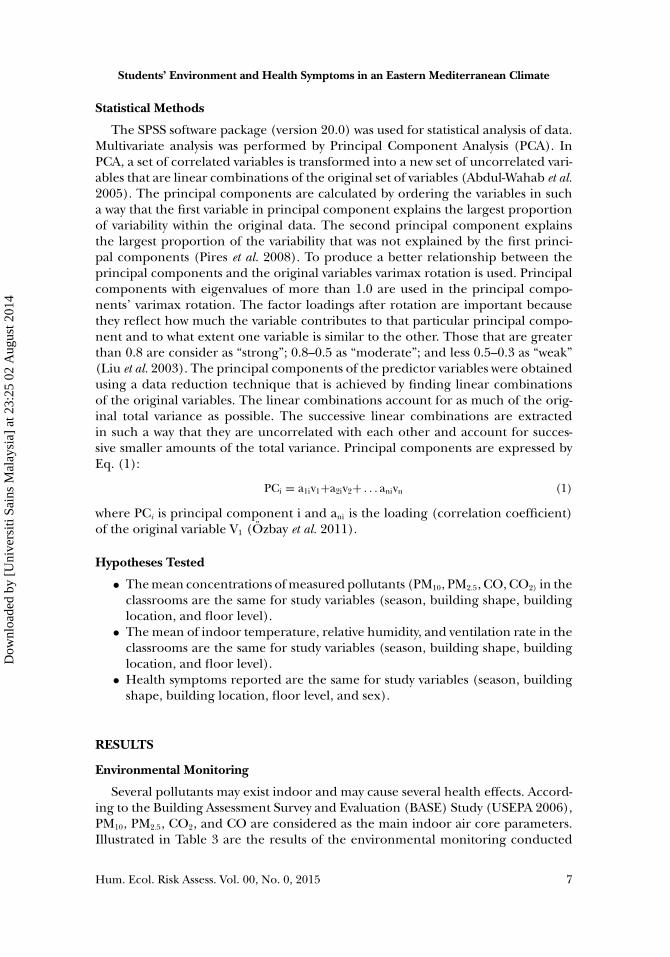
Statistical Methods
The SPSS software package (version 20.0) was used for statistical analysis of data.Multivariate analysis was performed by Principal Component Analysis (PCA). InPCA, a set of correlated variables is transformed into a new set of uncorrelated vari-ables that are linear combinations of the original set of variables (Abdul-Wahab et al.2005). The principal components are calculated by ordering the variables in sucha way that the first variable in principal component explains the largest proportionof variability within the original data. The second principal component explainsthe largest proportion of the variability that was not explained by the first princi-pal components (Pires et al. 2008). To produce a better relationship between theprincipal components and the original variables varimax rotation is used. Principalcomponents with eigenvalues of more than 1.0 are used in the principal compo-nents’ varimax rotation. The factor loadings after rotation are important becausethey reflect how much the variable contributes to that particular principal compo-nent and to what extent one variable is similar to the other. Those that are greaterthan 0.8 are consider as “strong”; 0.8–0.5 as “moderate”; and less 0.5–0.3 as “weak”(Liu et al. 2003). The principal components of the predictor variables were obtainedusing a data reduction technique that is achieved by finding linear combinationsof the original variables. The linear combinations account for as much of the orig-inal total variance as possible. The successive linear combinations are extractedin such a way that they are uncorrelated with each other and account for succes-sive smaller amounts of the total variance. Principal components are expressed byEq. (1):
PCi = a1iv1+a2iv2+ . . . anivn (1)
where PCi is principal component i and ani is the loading (correlation coefficient)of the original variable V1 (Ozbay et al. 2011).
Hypotheses Tested
• The mean concentrations of measured pollutants (PM10, PM2.5, CO, CO2) in theclassrooms are the same for study variables (season, building shape, buildinglocation, and floor level).
• The mean of indoor temperature, relative humidity, and ventilation rate in theclassrooms are the same for study variables (season, building shape, buildinglocation, and floor level).
• Health symptoms reported are the same for study variables (season, buildingshape, building location, floor level, and sex).
RESULTS
Environmental Monitoring
Several pollutants may exist indoor and may cause several health effects. Accord-ing to the Building Assessment Survey and Evaluation (BASE) Study (USEPA 2006),PM10, PM2.5, CO2, and CO are considered as the main indoor air core parameters.Illustrated in Table 3 are the results of the environmental monitoring conducted
Hum. Ecol. Risk Assess. Vol. 00, No. 0, 2015 7
Dow
nloa
ded
by [
Uni
vers
iti S
ains
Mal
aysi
a] a
t 23:
25 0
2 A
ugus
t 201
4
M. Elbayoumi et al.
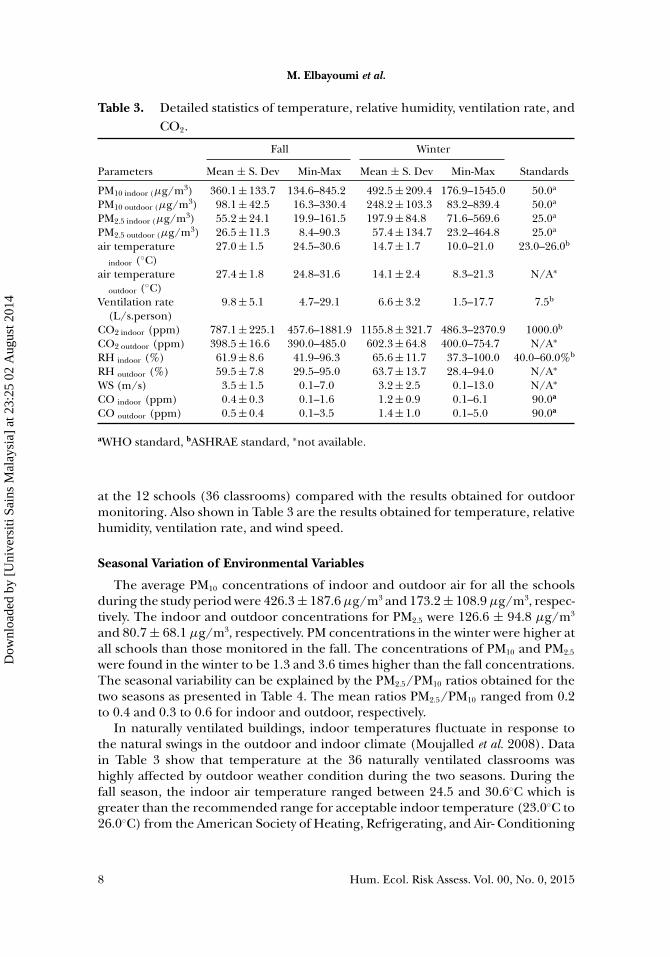
Table 3. Detailed statistics of temperature, relative humidity, ventilation rate, andCO2.
Fall Winter
Parameters Mean ± S. Dev Min-Max Mean ± S. Dev Min-Max Standards
PM10 indoor (µg/m3) 360.1 ± 133.7 134.6–845.2 492.5 ± 209.4 176.9–1545.0 50.0a
PM10 outdoor (µg/m3) 98.1 ± 42.5 16.3–330.4 248.2 ± 103.3 83.2–839.4 50.0a
PM2.5 indoor (µg/m3) 55.2 ± 24.1 19.9–161.5 197.9 ± 84.8 71.6–569.6 25.0a
PM2.5 outdoor (µg/m3) 26.5 ± 11.3 8.4–90.3 57.4 ± 134.7 23.2–464.8 25.0a
air temperatureindoor (◦C)
27.0 ± 1.5 24.5–30.6 14.7 ± 1.7 10.0–21.0 23.0–26.0b
air temperatureoutdoor (◦C)
27.4 ± 1.8 24.8–31.6 14.1 ± 2.4 8.3–21.3 N/A∗
Ventilation rate(L/s.person)
9.8 ± 5.1 4.7–29.1 6.6 ± 3.2 1.5–17.7 7.5b
CO2 indoor (ppm) 787.1 ± 225.1 457.6–1881.9 1155.8 ± 321.7 486.3–2370.9 1000.0b
CO2 outdoor (ppm) 398.5 ± 16.6 390.0–485.0 602.3 ± 64.8 400.0–754.7 N/A∗
RH indoor (%) 61.9 ± 8.6 41.9–96.3 65.6 ± 11.7 37.3–100.0 40.0–60.0%b
RH outdoor (%) 59.5 ± 7.8 29.5–95.0 63.7 ± 13.7 28.4–94.0 N/A∗
WS (m/s) 3.5 ± 1.5 0.1–7.0 3.2 ± 2.5 0.1–13.0 N/A∗
CO indoor (ppm) 0.4 ± 0.3 0.1–1.6 1.2 ± 0.9 0.1–6.1 90.0a
CO outdoor (ppm) 0.5 ± 0.4 0.1–3.5 1.4 ± 1.0 0.1–5.0 90.0a
aWHO standard, bASHRAE standard, ∗not available.
at the 12 schools (36 classrooms) compared with the results obtained for outdoormonitoring. Also shown in Table 3 are the results obtained for temperature, relativehumidity, ventilation rate, and wind speed.
Seasonal Variation of Environmental Variables
The average PM10 concentrations of indoor and outdoor air for all the schoolsduring the study period were 426.3 ± 187.6 µg/m3 and 173.2 ± 108.9 µg/m3, respec-tively. The indoor and outdoor concentrations for PM2.5 were 126.6 ± 94.8 µg/m3
and 80.7 ± 68.1 µg/m3, respectively. PM concentrations in the winter were higher atall schools than those monitored in the fall. The concentrations of PM10 and PM2.5
were found in the winter to be 1.3 and 3.6 times higher than the fall concentrations.The seasonal variability can be explained by the PM2.5/PM10 ratios obtained for thetwo seasons as presented in Table 4. The mean ratios PM2.5/PM10 ranged from 0.2to 0.4 and 0.3 to 0.6 for indoor and outdoor, respectively.
In naturally ventilated buildings, indoor temperatures fluctuate in response tothe natural swings in the outdoor and indoor climate (Moujalled et al. 2008). Datain Table 3 show that temperature at the 36 naturally ventilated classrooms washighly affected by outdoor weather condition during the two seasons. During thefall season, the indoor air temperature ranged between 24.5 and 30.6◦C which isgreater than the recommended range for acceptable indoor temperature (23.0◦C to26.0◦C) from the American Society of Heating, Refrigerating, and Air- Conditioning
8 Hum. Ecol. Risk Assess. Vol. 00, No. 0, 2015
Dow
nloa
ded
by [
Uni
vers
iti S
ains
Mal
aysi
a] a
t 23:
25 0
2 A
ugus
t 201
4
Students’ Environment and Health Symptoms in an Eastern Mediterranean Climate
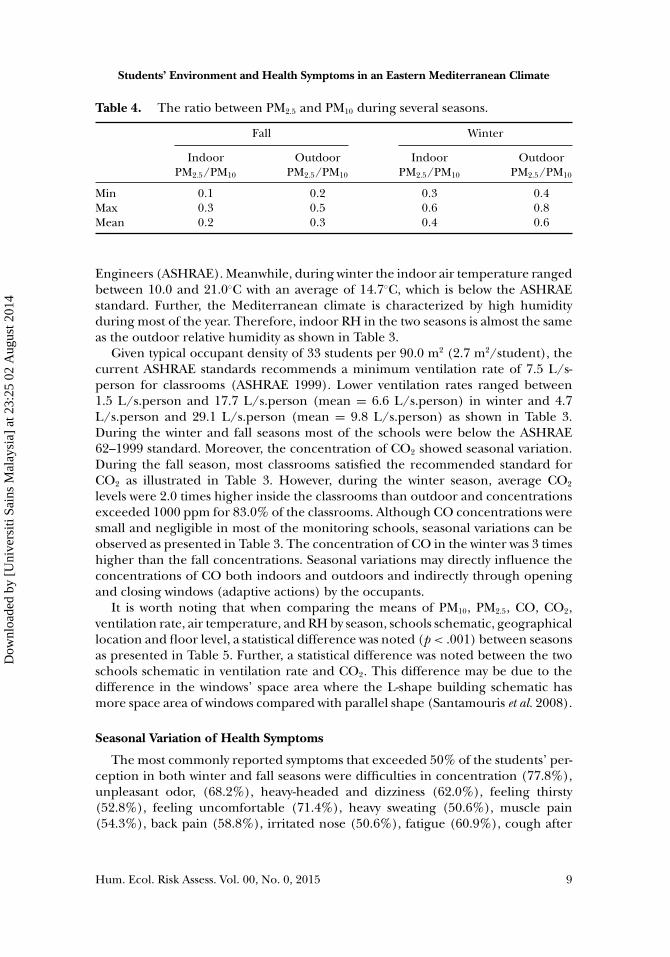
Table 4. The ratio between PM2.5 and PM10 during several seasons.
Fall Winter
Indoor Outdoor Indoor OutdoorPM2.5/PM10 PM2.5/PM10 PM2.5/PM10 PM2.5/PM10
Min 0.1 0.2 0.3 0.4Max 0.3 0.5 0.6 0.8Mean 0.2 0.3 0.4 0.6
Engineers (ASHRAE). Meanwhile, during winter the indoor air temperature rangedbetween 10.0 and 21.0◦C with an average of 14.7◦C, which is below the ASHRAEstandard. Further, the Mediterranean climate is characterized by high humidityduring most of the year. Therefore, indoor RH in the two seasons is almost the sameas the outdoor relative humidity as shown in Table 3.
Given typical occupant density of 33 students per 90.0 m2 (2.7 m2/student), thecurrent ASHRAE standards recommends a minimum ventilation rate of 7.5 L/s-person for classrooms (ASHRAE 1999). Lower ventilation rates ranged between1.5 L/s.person and 17.7 L/s.person (mean = 6.6 L/s.person) in winter and 4.7L/s.person and 29.1 L/s.person (mean = 9.8 L/s.person) as shown in Table 3.During the winter and fall seasons most of the schools were below the ASHRAE62–1999 standard. Moreover, the concentration of CO2 showed seasonal variation.During the fall season, most classrooms satisfied the recommended standard forCO2 as illustrated in Table 3. However, during the winter season, average CO2
levels were 2.0 times higher inside the classrooms than outdoor and concentrationsexceeded 1000 ppm for 83.0% of the classrooms. Although CO concentrations weresmall and negligible in most of the monitoring schools, seasonal variations can beobserved as presented in Table 3. The concentration of CO in the winter was 3 timeshigher than the fall concentrations. Seasonal variations may directly influence theconcentrations of CO both indoors and outdoors and indirectly through openingand closing windows (adaptive actions) by the occupants.
It is worth noting that when comparing the means of PM10, PM2.5, CO, CO2,ventilation rate, air temperature, and RH by season, schools schematic, geographicallocation and floor level, a statistical difference was noted (p < .001) between seasonsas presented in Table 5. Further, a statistical difference was noted between the twoschools schematic in ventilation rate and CO2. This difference may be due to thedifference in the windows’ space area where the L-shape building schematic hasmore space area of windows compared with parallel shape (Santamouris et al. 2008).
Seasonal Variation of Health Symptoms
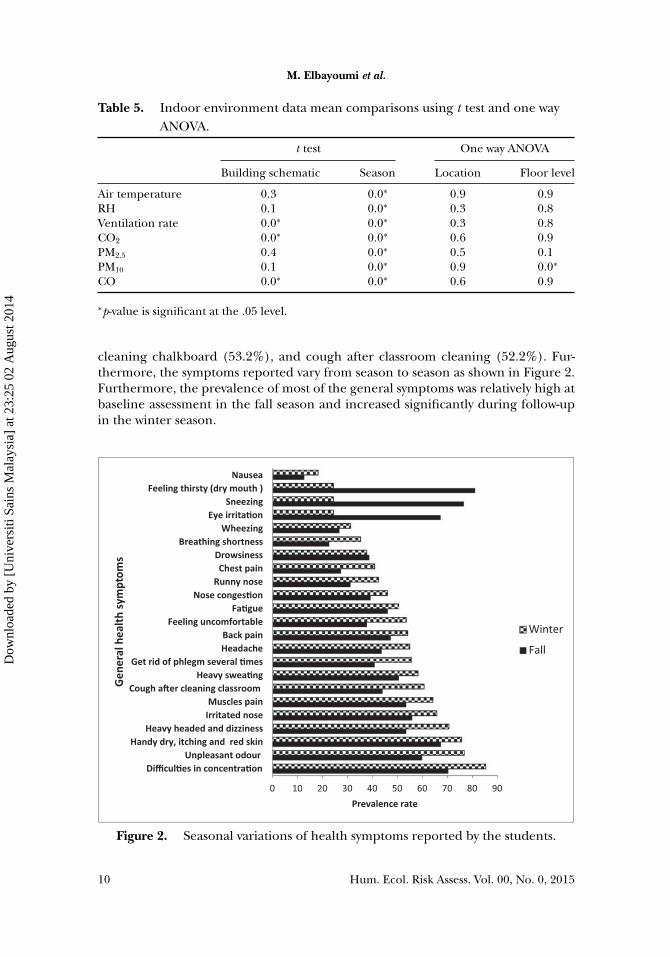
The most commonly reported symptoms that exceeded 50% of the students’ per-ception in both winter and fall seasons were difficulties in concentration (77.8%),unpleasant odor, (68.2%), heavy-headed and dizziness (62.0%), feeling thirsty(52.8%), feeling uncomfortable (71.4%), heavy sweating (50.6%), muscle pain(54.3%), back pain (58.8%), irritated nose (50.6%), fatigue (60.9%), cough after
Hum. Ecol. Risk Assess. Vol. 00, No. 0, 2015 9
Dow
nloa
ded
by [
Uni
vers
iti S
ains
Mal
aysi
a] a
t 23:
25 0
2 A
ugus
t 201
4
M. Elbayoumi et al.
Table 5. Indoor environment data mean comparisons using t test and one wayANOVA.
t test One way ANOVA
Building schematic Season Location Floor level
Air temperature 0.3 0.0∗ 0.9 0.9RH 0.1 0.0∗ 0.3 0.8Ventilation rate 0.0∗ 0.0∗ 0.3 0.8CO2 0.0∗ 0.0∗ 0.6 0.9PM2.5 0.4 0.0∗ 0.5 0.1PM10 0.1 0.0∗ 0.9 0.0∗
CO 0.0∗ 0.0∗ 0.6 0.9
∗p-value is significant at the .05 level.
cleaning chalkboard (53.2%), and cough after classroom cleaning (52.2%). Fur-thermore, the symptoms reported vary from season to season as shown in Figure 2.Furthermore, the prevalence of most of the general symptoms was relatively high atbaseline assessment in the fall season and increased significantly during follow-upin the winter season.
0 10 20 30 40 50 60 70 80 90
Difficul�es in concentra�onUnpleasant odour
Handy dry, itching and red skinHeavy headed and dizziness
Irritated noseMuscles pain
Cough a�er cleaning classroomHeavy swea�ng
Get rid of phlegm several �mesHeadacheBack pain
Feeling uncomfortableFa�gue
Nose conges�onRunny nose
Chest painDrowsiness
Breathing shortnessWheezing
Eye irrita�onSneezing
Feeling thirsty (dry mouth )Nausea
Prevalence rate
Gen
eral
heal
th sy
mpt
oms
Winter
Fall
Figure 2. Seasonal variations of health symptoms reported by the students.
10 Hum. Ecol. Risk Assess. Vol. 00, No. 0, 2015
Dow
nloa
ded
by [
Uni
vers
iti S
ains
Mal
aysi
a] a
t 23:
25 0
2 A
ugus
t 201
4
Students’ Environment and Health Symptoms in an Eastern Mediterranean Climate
Factor Analysis
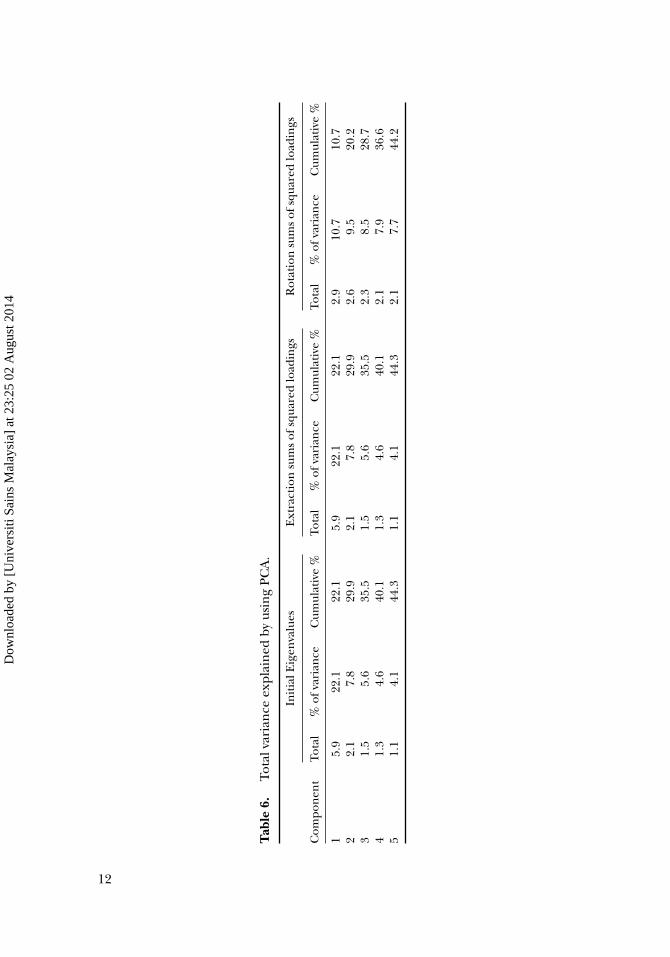
PCA was used to examine the relationships among health symptoms, comfort,odor, and psychosocial questions. The aim of PCA was to reduce different variablesto a smaller number of factors that would account for most of the observed variance.Different numbers of criteria were used during the extraction to determine the ap-propriate number of factors to retain, including Measuring the Sampling Adequacy(MSA), and Kaiser-Guttmann criterion. To enhance interpretability, orthogonal ro-tations were performed using the varimax procedure because they greatly simplifiedinterpretation of results. A result obtained by the Kaiser-Meyer-Olkin (KMO) test is0.9 and is highly significant (p < .001) and therefore factor analysis is appropriatefor these data. Presented in Table 6 are the loaded eigenvalues with the eigenvalues> 1.0. Five factors that explained 44.2% of the total variance were used to explainthe correlations among the symptoms. A factor-loading threshold of 0.4 was usedbecause it optimized factor interpretability (Kelton et al. 2010).
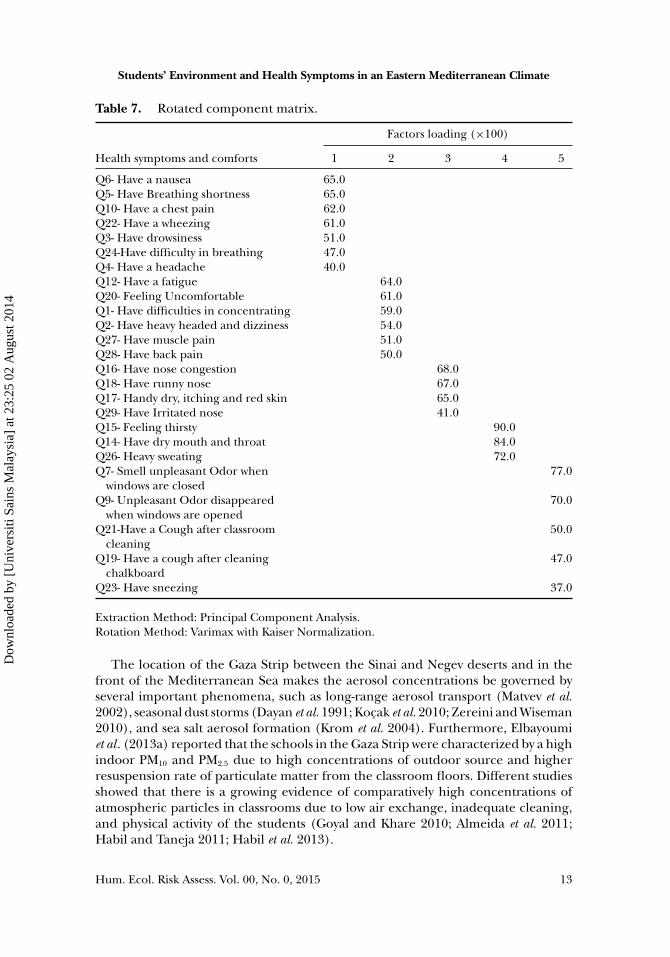
Summarized in Table 7 is the rotated component matrix for the five factors.The first factor contributed 22.1% of the total variance, which contains nausea,chest pain, wheezing, breathing shortness, and headache and drowsiness symptoms.Therefore, we called the first factor as pre-existing asthma factor or lower respi-ratory factor. The second factor contributes to 7.8% of the total variance, whichcontains fatigue, feeling uncomfortable, difficulties in concentrating, and heavy-headed, dizziness, and muscle pain symptoms. Mendell and Smith (1990) called thesecond factor as injuries in central nervous system (CNS) factor. The third factorcontributes 5.6% of the total variance, which contains irritated nose, runny nose,dry itching, and red skin and nose congestion. Mendell and Smith (1990) called thethird factor mucosal irritation or upper respiratory problems factor. The fourth sig-nificant factor contributes 4.6% of the total variance, which contains feeling thirsty,dry mouth and throat, and sweating. We called the fourth factor comfortable fac-tor. The last factor contributes 4.1% of the total variance, which contains sneezing,cough, unpleasant odor. We called the fifth factor the ventilation factor.
DISCUSSION
The measurements revealed considerable seasonal variation between indoor andoutdoor PM10, PM2.5, CO, CO2, ventilation rate, temperature, and relative humidity.This variation may have its impact on children health. The data analysed show thatthe indoor and outdoor averages of PM10 and PM2.5 concentrations for most ofthe schools were higher than the recommended WHO 24-h limits (50 µg/mg3 and25 µg/mg3 for PM10 and PM2.5, respectively) in the two seasons. The contributions ofPM2.5 to PM10 were not similar in the two seasons and the coarse particles (>2.5 µm)were the dominating fraction in particle species. Thus, the seasonal changes seemto be predominant due to different contributions of dust emission sources, bothindoors and outdoors. Furthermore, the higher outdoor PM2.5/PM10 ratio in winterwas presumably a consequence of higher particulate emission from combustionsources than in the fall. Similar results have been reported from studies that wereconducted in the Middle East (Saliba et al. 2010; Elbayoumi et al. 2013a).
Hum. Ecol. Risk Assess. Vol. 00, No. 0, 2015 11
Dow
nloa
ded
by [
Uni
vers
iti S
ains
Mal
aysi
a] a
t 23:
25 0
2 A
ugus
t 201
4
Tab
le6.
Tota
lvar
ian
ceex
plai
ned
byus
ing
PCA
.
Init
ialE
igen
valu
esE
xtra
ctio
nsu
ms
ofsq
uare
dlo
adin
gsR
otat
ion
sum
sof
squa
red
load
ings
Com
pon
ent
Tota
l%
ofva
rian
ceC
umul
ativ
e%
Tota
l%
ofva
rian
ceC
umul
ativ
e%
Tota
l%
ofva
rian
ceC
umul
ativ
e%
15.
922
.122
.15.
922
.122
.12.
910
.710
.72
2.1
7.8
29.9
2.1
7.8
29.9
2.6
9.5
20.2
31.
55.
635
.51.
55.
635
.52.
38.
528
.74
1.3
4.6
40.1
1.3
4.6
40.1
2.1
7.9
36.6
51.
14.
144
.31.
14.
144
.32.
17.
744
.2
12
Dow
nloa
ded
by [
Uni
vers
iti S
ains
Mal
aysi
a] a
t 23:
25 0
2 A
ugus
t 201
4
Students’ Environment and Health Symptoms in an Eastern Mediterranean Climate
Table 7. Rotated component matrix.
Factors loading (×100)
Health symptoms and comforts 1 2 3 4 5
Q6- Have a nausea 65.0Q5- Have Breathing shortness 65.0Q10- Have a chest pain 62.0Q22- Have a wheezing 61.0Q3- Have drowsiness 51.0Q24-Have difficulty in breathing 47.0Q4- Have a headache 40.0Q12- Have a fatigue 64.0Q20- Feeling Uncomfortable 61.0Q1- Have difficulties in concentrating 59.0Q2- Have heavy headed and dizziness 54.0Q27- Have muscle pain 51.0Q28- Have back pain 50.0Q16- Have nose congestion 68.0Q18- Have runny nose 67.0Q17- Handy dry, itching and red skin 65.0Q29- Have Irritated nose 41.0Q15- Feeling thirsty 90.0Q14- Have dry mouth and throat 84.0Q26- Heavy sweating 72.0Q7- Smell unpleasant Odor when
windows are closed77.0
Q9- Unpleasant Odor disappearedwhen windows are opened
70.0
Q21-Have a Cough after classroomcleaning
50.0
Q19- Have a cough after cleaningchalkboard
47.0
Q23- Have sneezing 37.0
Extraction Method: Principal Component Analysis.Rotation Method: Varimax with Kaiser Normalization.
The location of the Gaza Strip between the Sinai and Negev deserts and in thefront of the Mediterranean Sea makes the aerosol concentrations be governed byseveral important phenomena, such as long-range aerosol transport (Matvev et al.2002), seasonal dust storms (Dayan et al. 1991; Kocak et al. 2010; Zereini and Wiseman2010), and sea salt aerosol formation (Krom et al. 2004). Furthermore, Elbayoumiet al . (2013a) reported that the schools in the Gaza Strip were characterized by a highindoor PM10 and PM2.5 due to high concentrations of outdoor source and higherresuspension rate of particulate matter from the classroom floors. Different studiesshowed that there is a growing evidence of comparatively high concentrations ofatmospheric particles in classrooms due to low air exchange, inadequate cleaning,and physical activity of the students (Goyal and Khare 2010; Almeida et al. 2011;Habil and Taneja 2011; Habil et al. 2013).
Hum. Ecol. Risk Assess. Vol. 00, No. 0, 2015 13
Dow
nloa
ded
by [
Uni
vers
iti S
ains
Mal
aysi
a] a
t 23:
25 0
2 A
ugus
t 201
4
M. Elbayoumi et al.
From the inspection of the classrooms’ thermal comfort, it is observed that dur-ing the fall both indoor and outdoor temperatures were high and during the winterboth indoor and outdoor temperatures were low. Thus, the students opened andclosed classrooms windows to maintain their thermal comfort during hot and coldseasons. This adaptive action by students contributes significantly to the poor levelof ventilation rate. Several classrooms had windows that were shut by students dur-ing the cold season in order to maintain thermal comfort or obstructed by postersand furniture to prevent sun rays in the fall season. On other hand, the ventilationrate in natural-ventilated buildings depends on two forces, the wind-driven forceand the buoyancy-driven force. While wind is the main mechanism of wind-drivenventilation, buoyancy-driven ventilation occurs as a result of the directional buoy-ancy force, which results from temperature differences between the indoor andoutdoor. During the fall season much less or even non-existent differences existbetween indoor and outdoor temperature, which makes the wind-driven ventila-tion predominant and depend on school orientation and location (Milner et al.2004).
Furthermore, varying climatic parameters may also indirectly influence the con-tribution of outdoor pollutants to indoor levels. The average concentration of COwas the highest during the the winter season, reflecting the high emission sources(vehicular emission exhaust) around these sites. Moreover, winter, the season withthe lowest ventilation capability, compared to the remaining seasons, is character-ized by lower temperatures, high relative humidity, available organics emitted fromvehicles, and decreased atmospheric mixing height (Arkouli et al. 2010; Somuri2011). This can increase the outdoor concentration and as a consequence increasethe indoor level of CO.
Factor analysis has been used in different studies as a tool for detecting andevaluating sick building syndrome (Sega and Kalinic 1994; Wallace et al. 2004). Theresults from this study showed logical grouping of the health complaints and/orsymptoms, suggesting credibility of the answers. Moreover, the loaded five factorssupport the theory that sick building syndrome is a combination of a mixture ofsub-clinical conditions. However, these school-related symptom factors are partiallydifferent from the symptom groups previously identified from factor analysis instudies of mechanical ventilation places (Sega and Kalinic 1994; Spengler et al.2000; Brightman et al. 2008). The causes of sick building syndrome symptoms areoften hard to pin down and several factors may contribute to the situation (Pommeret al. 2004). Many of the symptoms can be attributed either to the known toxic effectsof high levels of certain pollutants or could be triggered by various allergens in abuilding.
As shown in Table 8, the pre-existing asthma factor has a significant correlationwith PM10, PM2.5, CO, CO2, and negative correlation with ventilation rate and indoortemperature. The negative relationship between temperatures, ventilation rate, andhealth symptoms in factor 1 are due to an inverse relationship between PM2.5 andPM10 concentration and ventilation rate and temperature. This inverse relationshipis supported by fact as temperature is decreasing this will result in stable conditionsthat will increase outdoor and indoor concentrations of such pollutants. Moreover,increasing the ventilation rate will increase the infiltration and the exfiltration ofparticulate matter, which will affect the concentrations of particulate matter and
14 Hum. Ecol. Risk Assess. Vol. 00, No. 0, 2015
Dow
nloa
ded
by [
Uni
vers
iti S
ains
Mal
aysi
a] a
t 23:
25 0
2 A
ugus
t 201
4

Students’ Environment and Health Symptoms in an Eastern Mediterranean Climate
Table 8. Pearson correlation coefficient between health symptoms (by factors)and indoor environmental parameters.
Factor 1 Factor 2 Factor 3 Factor 4 Factor 5
Indoor PM2.5 0.2∗∗ 0.2∗∗ 0.2∗∗ −0.6∗∗ 0.3∗∗
Indoor RH 0.1 0.1 0.1∗ −0.2∗∗ 0.0Indoor Temperature −0.2∗∗ −0.2∗∗ −0.1∗∗ 0.7∗∗ −0.3∗∗
Ventilation rate −0.1∗∗ −0.1∗∗ −0.1 −0.2∗∗ −0.1∗∗
Indoor CO 0.2∗∗ 0.1∗ 0.1∗∗ −0.5∗∗ 0.2∗∗
Indoor PM10 0.2∗∗ 0.1∗∗ 0.1∗∗ −0.3∗∗ 0.2∗∗
Indoor CO2 0.2∗∗ 0.2∗∗ 0.1∗∗ 0.5∗∗ 0.2∗∗
∗Correlation is significant at the .05 level.∗∗Correlation is significant at the .01 level.
CO. Several studies found a statistically significant correlation between symptoms ofheadaches, dizziness, heavy headed, tiredness, difficulties concentrating, unpleasantodor, and high CO2 concentrations (1500–4000 ppm compared with concentrationsbelow 1500 ppm) (Myhrvold et al. 1996; Seppanen et al. 1999).
Kinshella et al . (2001) indicated that the prevalence of complaints regardingnasal congestion, sore throat, dustiness, and headache were higher in elementaryschools using natural ventilation systems and these higher prevalence rates may havebeen due to increased numbers of large aerodynamic diameter particles in the air. Asimilar relationship between particulate matter and nasal conditions was suggestedby Walinder et al . (1991), who reported that high settled dust levels in buildings wererelated to nasal obstruction and nasal cavity dimensions. Different studies show thatthe prevalence of some types of communicable respiratory diseases is higher underconditions with lower ventilation rates (Seppanen et al. 1999; Fisk 2000; Wargockiet al. 2002).
Factor 2, CNS factor, and factor 3, mucosal irritation or upper respiratory prob-lems, have a significant correlation with PM2.5, PM10, CO2, and CO and negativecorrelation with indoor temperature. Several studies reported that occupants innatural ventilation microenvironments complain from nasal symptoms than frommechanical ventilation systems (Kinshella et al. 2001; Rudblad et al. 2002). More-over, Gravesen et al . (1990) reported an association between mucous membraneirritations, general SBS symptoms and surface dust, described as macromolecularorganic dust (MOD), which had been extracted from floor and other horizontalsurfaces.
Factor 4, comfort factor, has a significant negative correlation with PM2.5, PM10,CO and ventilation rate and positive correlation with indoor temperature and CO2.The high correlation (Pearson coefficient 70%) between indoor air temperatureand factor 4 explained sweating, dry mouth and feeling thirsty symptoms. Manystudies have reported a linkage between high temperatures and higher prevalenceor higher intensity of SBS symptoms (Mendell et al. 2002; Seppanen and Fisk 2006).Furthermore, Seppanen and Fisk (2003) showed a decrease in performance by 2%per 1◦C increase in the temperature in the range of 25–32◦C, and no effect onperformance in temperature range of 21–25◦C.
Hum. Ecol. Risk Assess. Vol. 00, No. 0, 2015 15
Dow
nloa
ded
by [
Uni
vers
iti S
ains
Mal
aysi
a] a
t 23:
25 0
2 A
ugus
t 201
4
M. Elbayoumi et al.
Factor 5, ventilation factor, had a significant positive correlation with PM2.5, PM10,CO2, and CO and negative correlation with indoor temperature and ventilationrate. The primary indoor source of CO2 in school buildings is the respiration pro-cess from the building’s occupants. As ventilation rate decreased. the concentrationsof CO2 and bioeffluents increased, causing unpleasant odor. Moreover, symptomslike sneezing and cough were correlated with the increasing in PM2.5 and PM10
concentrations. The cleaning process of the chalk on chalkboard or classroomfloor was found to be one of the indoor sources of particulate matter inside theclassrooms. Kemp et al . (2004) showed that by using higher performance carpetcleaning practices in buildings with poor ventilation and elevated Respirable Sus-pended Particles (RSP) levels can reduce RSP to acceptable levels and can reduceSBS symptoms. The most significant reductions in the referenced study were insymptoms of eye irritation, throat irritation, dry unproductive cough, and noseirritation.
As mentioned previously, several factors may contribute to the causes of sick build-ing syndrome symptoms. From Table 9 different pollutant correlates significantlywith all symptoms. Sieber et al . (1996) found that the high degree of correlationamong environmental variables makes it difficult to disentangle the most importantpredictors of work-related health conditions.
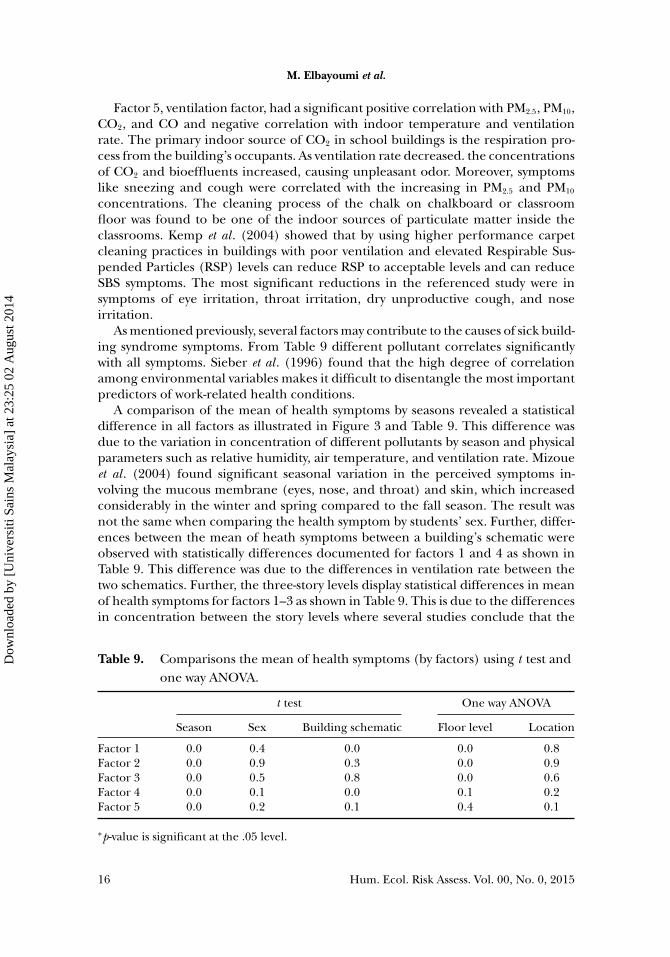
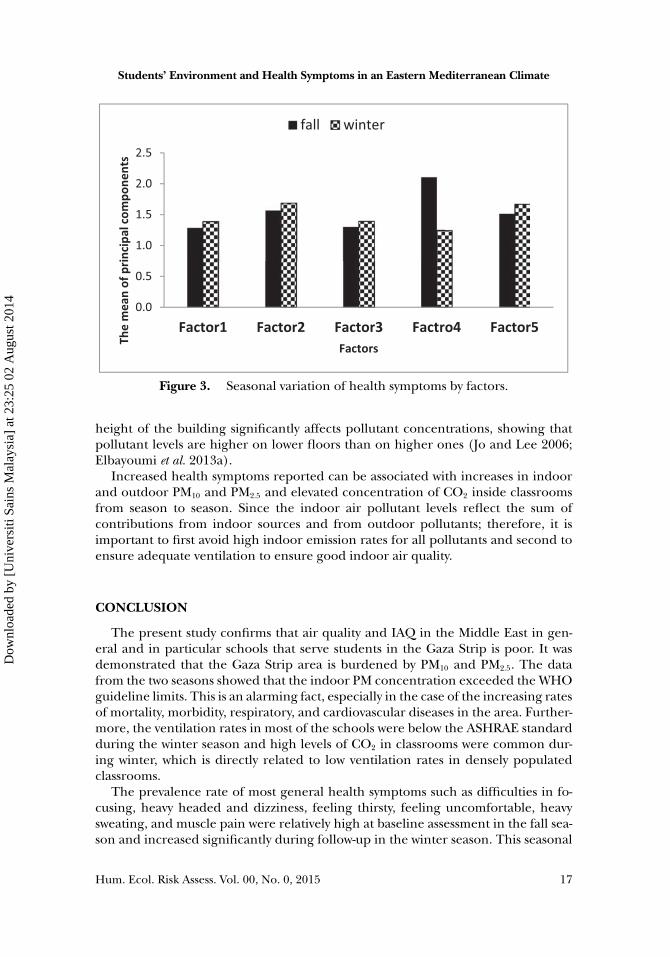
A comparison of the mean of health symptoms by seasons revealed a statisticaldifference in all factors as illustrated in Figure 3 and Table 9. This difference wasdue to the variation in concentration of different pollutants by season and physicalparameters such as relative humidity, air temperature, and ventilation rate. Mizoueet al . (2004) found significant seasonal variation in the perceived symptoms in-volving the mucous membrane (eyes, nose, and throat) and skin, which increasedconsiderably in the winter and spring compared to the fall season. The result wasnot the same when comparing the health symptom by students’ sex. Further, differ-ences between the mean of heath symptoms between a building’s schematic wereobserved with statistically differences documented for factors 1 and 4 as shown inTable 9. This difference was due to the differences in ventilation rate between thetwo schematics. Further, the three-story levels display statistical differences in meanof health symptoms for factors 1–3 as shown in Table 9. This is due to the differencesin concentration between the story levels where several studies conclude that the
Table 9. Comparisons the mean of health symptoms (by factors) using t test andone way ANOVA.
t test One way ANOVA
Season Sex Building schematic Floor level Location
Factor 1 0.0 0.4 0.0 0.0 0.8Factor 2 0.0 0.9 0.3 0.0 0.9Factor 3 0.0 0.5 0.8 0.0 0.6Factor 4 0.0 0.1 0.0 0.1 0.2Factor 5 0.0 0.2 0.1 0.4 0.1
∗p-value is significant at the .05 level.
16 Hum. Ecol. Risk Assess. Vol. 00, No. 0, 2015
Dow
nloa
ded
by [
Uni
vers
iti S
ains
Mal
aysi
a] a
t 23:
25 0
2 A
ugus
t 201
4
Students’ Environment and Health Symptoms in an Eastern Mediterranean Climate
0.0
0.5
1.0
1.5
2.0
2.5
Factor1 Factor2 Factor3 Factro4 Factor5
The
mea
n of
prin
cipa
l com
pone
nts
Factors
fall winter
Figure 3. Seasonal variation of health symptoms by factors.
height of the building significantly affects pollutant concentrations, showing thatpollutant levels are higher on lower floors than on higher ones (Jo and Lee 2006;Elbayoumi et al. 2013a).
Increased health symptoms reported can be associated with increases in indoorand outdoor PM10 and PM2.5 and elevated concentration of CO2 inside classroomsfrom season to season. Since the indoor air pollutant levels reflect the sum ofcontributions from indoor sources and from outdoor pollutants; therefore, it isimportant to first avoid high indoor emission rates for all pollutants and second toensure adequate ventilation to ensure good indoor air quality.
CONCLUSION
The present study confirms that air quality and IAQ in the Middle East in gen-eral and in particular schools that serve students in the Gaza Strip is poor. It wasdemonstrated that the Gaza Strip area is burdened by PM10 and PM2.5. The datafrom the two seasons showed that the indoor PM concentration exceeded the WHOguideline limits. This is an alarming fact, especially in the case of the increasing ratesof mortality, morbidity, respiratory, and cardiovascular diseases in the area. Further-more, the ventilation rates in most of the schools were below the ASHRAE standardduring the winter season and high levels of CO2 in classrooms were common dur-ing winter, which is directly related to low ventilation rates in densely populatedclassrooms.
The prevalence rate of most general health symptoms such as difficulties in fo-cusing, heavy headed and dizziness, feeling thirsty, feeling uncomfortable, heavysweating, and muscle pain were relatively high at baseline assessment in the fall sea-son and increased significantly during follow-up in the winter season. This seasonal
Hum. Ecol. Risk Assess. Vol. 00, No. 0, 2015 17
Dow
nloa
ded
by [
Uni
vers
iti S
ains
Mal
aysi
a] a
t 23:
25 0
2 A
ugus
t 201
4
M. Elbayoumi et al.
difference may be due to the seasonal differences in PM2.5, PM10, CO2, RH, and airtemperature and ventilation rate between the two seasons.
Results of the PCA showed that health symptoms among students could be re-duced to five factors that account for most of the observed variance. The five factorsare pre-existing asthma factor; central nervous system (CNS) factor; upper res-piratory problems factor; comfortable factor, and ventilation factor. A statisticallysignificant correlation was found between the five factors and PM2.5, PM10, CO2, RH,air temperature, and ventilation rate. Evidence suggests that poor IAQ and thermalcomfort in schools is common and adversely influences the performance and at-tendance of students, primarily through health effects from indoor pollutants thatrequire urgent actions for assessment and improvement of indoor environmentalquality in schools. Therefore, there is a possible decline in the learning ability ofchildren because of the negative effects on their health, which increase after stu-dents come to school. As a result, improving air quality in schools can be achieved byreducing the number of students in a classroom, installing an appropriate numberof ceiling and exhaust fans, increasing the length of breaks between classes, andby looking for better building shapes and orientation to increase the ventilationflow.
FUNDING
The authors acknowledge the Universiti Sains Malaysia (USM) for partly financingthe study under RUI 814183 and RUI 811206.
REFERENCES
Abdul-Wahab S, Bakheit C, and Al-Alawi S. 2005. Principal component and multiple regres-sion analysis in modelling of ground-level ozone and factors affecting its concentrations.Environ Modell Softw 20:1263–71.
Almeida S, Canha N, Silva A, et al. 2011. Children exposure to atmospheric particles in indoorof Lisbon primary schools. Atmos Environ 45:7594–9.
Andersson K. 1998. Epidemiological approach to indoor air problems. Indoor Air 8:32–9Arkouli M, Ulke A, EndlicheR W, et al. 2010. Distribution and temporal behavior of particulate
matter over the urban area of Buenos Aires. Atmos Poll Res 1:1–8.ASHRAE (American Society of Heating, Refrigerating, and Air-Conditioning Engineers).
1999. Standard 62–1999: Ventilation for Acceptable Indoor Air Quality. Atlanta, GA,USA.
Atkinson J, Chartier Y, Pessoa-Silva C, et al. 2009. Natural Ventilation for Infection Con-trol in Health-Care Settings. 1st edit, WHO Press, World Health Organization, Geneva,Switzerland
Blondeau P, Iordache V, Poupard O, et al. 2005. Relationship between outdoor and indoorair quality in eight French schools. Indoor Air 15:2–12.
Brightman H, Milton D, Wypij D, et al. 2008. Evaluating building-related symptoms using theUS EPA BASE study results. Indoor Air 18:335–345
Dayan U and Levy I. 2005. The influence of meteorological conditions and atmosphericcirculation types on PM10 and visibility in Tel Aviv. J Appl Meteorol 44:606–19
Dayan U, Heffter J, Miller J, et al. 1991. Dust intrusion events into the Mediterranean basin. JAppl Meteorol 30:1185–99
18 Hum. Ecol. Risk Assess. Vol. 00, No. 0, 2015
Dow
nloa
ded
by [
Uni
vers
iti S
ains
Mal
aysi
a] a
t 23:
25 0
2 A
ugus
t 201
4

Students’ Environment and Health Symptoms in an Eastern Mediterranean Climate
Elbayoumi M, Ramli N, Md Yusof N, et al. 2013a. Spatial and seasonal variation of particulatematter (PM10 and PM2.5) in Middle Eastern classrooms. Atmos Environ 80:389–97
Elbayoumi M, Ramli N, and Md Yusof N. 2013b. Effects of seasonal differences on particulatematter in Mediterranean area. Internat J Sci Eng Res 4:37–43
Field A. 2009. Discovering Statistics Using SPSS. 3rd edit, pp 673–81. Sage Publications, LosAngeles, CA, USA
Fisk W. 2000. Health and productivity gains from better indoor environments and theirrelationship with building energy efficiency. Annu Rev Energy Environ 25:537–66
Goyal R and Khare M. 2010. Indoor Air Qaulity in Naturally Ventilated Schools, 1st edit.Germany, VDM Verlag Dr.Muller Aktiengesellschaft & Co.KG, Saarbrubcken, Germany
Gravesen S, Skov P, Valbjorn O, et al. 1990. The role of potential immunogenic componentsof dust (MOD) in the sick building syndrome. Proceedings of the Fifth InternationalConference on Indoor Air Quality and Climate, Toronto, ON, Canada
Habil M and Taneja A. 2011. Children’s exposure to indoor particulate matter in naturallyventilated schools in India. Indoor Built Environ 20:430–48
Habil M, Massey D, and Taneja A. 2013. Exposure of children studying in schools of Indiato PM levels and metal contamination: Sources and their identification. Air Qual AtmosHealth 3:1–13
Hal (Hal Technologies). 2012. HAL-HPC300 User Manual. Available at http,//www.haltechnologies.com/Docs/HAL-HPC300%20User%20Manual.pdf (accessed December12, 2013)
Jo W and Lee J. 2006. Indoor and outdoor levels of respirable particulates (PM 10) and carbonmonoxide (CO) in high-rise apartment buildings. Atmos Environ 40:6067–76
Kelton M, LeardMann C, Smith B, et al. 2010. Exploratory factor analysis of self-reportedsymptoms in a large, population-based military cohort. BMC Med Res Methodol 10:94–102
Khan I, Freitas M, Dionısio I, et al. 2007. Indoor habits of children aged 5 to 10 years learningat the public basic schools of Lisbon-city, Portugal. Proceedings of Clima 2007 WellBeingIndoors. Helsinki. Finland
Kinshella M, Van Dyke M, Douglas K, et al. 2001. Perceptions of indoor air quality associatedwith ventilation system types in elementary schools. Appl Occup Environ Hyg 16:952–60
Kocak M, Kubilay N, Tugrul S, et al. 2010. Atmospheric nutrient inputs to the northernlevantine basin from a long-term observation, sources and comparison with riverine inputs.Biogeosciences 7:4037–50
Krom M, Herut B, and Mantoura R. 2004. Nutrient budget for the Eastern Mediterranean,implications for phosphorus limitation. Limnol Oceanogr 49:1582–92.
Kulkarni N and Grigg J. 2008. Effect of air pollution on children. J Paediatr Child Health18:238–43
Kulshreshtha P and Khare M. 2011. Indoor exploratory analysis of gaseous pollutants andrespirable particulate matter at residential homes of Delhi, India. Atmos Poll Res 2:337–50
Kwok A and Chun C. 2003. Thermal comfort in Japanese schools. Solar Energy 74:245–52Liu R, Kuang J, Gong Q, et al. 2003. Principal component regression analysis with SPSS.
Comput Meth Prog Biomed 71:141–7Madureira J, Alvim-Ferraz M, Rodrigues S, et al. 2009. Indoor air quality in schools and health
symptoms among Portuguese teachers. Hum Ecol Risk Assess 15:159–69Massey D, Masih J, Kulshrestha A, et al. 2009. Indoor/outdoor relationship of fine particles
less than 2.5 µm (PM 2.5) in residential homes locations in central Indian region. BuildEnviron 44:2037–45
Matvev V, Dayan U, Tass I, et al. 2002. Atmospheric sulfur flux rates to and from Israel. SciTotal Environ 291:143–54
Mendell M and Heath G. 2004. Do indoor pollutants and thermal conditions in schoolsinfluence student performance? A critical review of the literature. Indoor Air 15:27–52
Hum. Ecol. Risk Assess. Vol. 00, No. 0, 2015 19
Dow
nloa
ded
by [
Uni
vers
iti S
ains
Mal
aysi
a] a
t 23:
25 0
2 A
ugus
t 201
4
M. Elbayoumi et al.
Mendell M and Smith A. 1990. Consistent pattern of elevated symptoms in air-conditionedoffice buildings, a reanalysis of epidemiologic studies. Am J Public Health 80:1193–9
Mendell M, Fisk W, Petersen M, et al. 2002. Indoor particles and symptoms among officeworkers, results from a double-blind cross-over study. Epidemiology 13:296–304
Milner J, Dimitroulopoulou C, and ApSimon H. 2004. Indoor Concentrations in Buildingsfrom Sources Outdoors. UK Atmospheric Dispersion Modeling Liaison Committee. Avail-able at http,//www.admlc.org.uk/documents/ADMLC20042.pdf (accessed November 15,2013)
Mizoue T, Reijula K, and Andersson K. 2001. Environmental tobacco smoke exposure andovertime work as risk factors for sick building syndrome in Japan. AM J EpidemioL154:803–8
Mizoue T, Andersson K, Reijula K, et al. 2004. Seasonal variation in perceived indoor envi-ronment and nonspecific symptoms in a Temperate climate. J Occup Health 46:303–9
Moujalled B, Cantin R, and Guarracino G. 2008. Comparison of thermal comfort algorithmsin naturally ventilated office buildings. Energy Build 40:2215–23
Myhrvold A, Olsen E, and Lauridsen O. 1996. Indoor environment in schools–pupils healthand performance in regard to CO2 concentrations. Indoor Air 96:369–71
Nordstrom K, Norback D, and Akselsson R. 1994. Effect of air humidification on the sickbuilding syndrome and perceived indoor air quality in hospitals, a four month longitudinalstudy. J Occup Env Med 51:683–8
Ozbay B, Keskin G, Dogruparmak S, et al. 2011. Multivariate methods for ground-level ozonemodeling. Atmo Res 102:57–65
Pires J, Martins F, Sousa S, et al. 2008. Selection and validation of parameters in multiplelinear and principal component regressions. Environ Modell Softw 23:50–5
PMD (The Palestinian Meteorological Department). 2012. Climate Bulletine. Available athttp,//www.pmd.ps/ar/mna5palestine.php (accessed November 23, 2013)
Pommer L, Fick J, Sundell J, et al. 2004. Class separation of buildings with high and lowprevalence of SBS by principal component analysis. Indoor Air 14:16–23
Rudblad S, Andersson K, Stridh G, et al. 2002. Slowly decreasing mucosal hyperreactivity yearsafter working in a school with moisture problems. Indoor Air 12:138–44
Saliba N, El Jam F, El Tayar G, et al. 2010. Origin and variability of particulate matter (PM10
and PM2.5) mass concentrations over an Eastern Mediterranean city. Atmos Res 97:106–14Salvi S. 2007. Health effects of ambient air pollution in children. Paediatr Respir Rev 8:275–80Santamouris M, Synnefa A, Asssimakopoulos M, et al. 2008. Experimental investigation of the
air flow and indoor carbon dioxide concentration in classrooms with intermittent naturalventilation. Energy and Build 40:1833–43
Sega K and Kalinic N. 1994. Sick building syndrome-a case study in Zagreb. Arh Hig RadaToksikol 45:1–10
Seppanen O and Fisk W. 2003. A conceptual Model to Estimate Cost Effectivenessof the Indoor Environment Improvements. Available at http,//escholarship.org/uc/item/3nv9t304 (accessed November 5, 2013)
Seppanen O and Fisk W. 2006. Some quantitative relations between indoor environmentalquality and work performance or health. HVAC&R Res 12:957–73
Seppanen O, Fisk W, and Mendell M. 1999. Association of ventilation rates and CO2 con-centrations with health and other responses in commercial and institutional buildings.Indoor Air 9:226–52
Sieber W, Stayner L, Malkin R, et al. 1996. Associations between environmental factors andself-reported health conditions. Appl Occup Environ Hyg 11(12):1387–92
Somuri D. 2011. Study of Particulate Number Concentrations in Buses Running with Bio-Diesel and Ultra-Low Sulfur Diesel. Master’s Thesis. University of Toledo, Toledo, OH,USA
20 Hum. Ecol. Risk Assess. Vol. 00, No. 0, 2015
Dow
nloa
ded
by [
Uni
vers
iti S
ains
Mal
aysi
a] a
t 23:
25 0
2 A
ugus
t 201
4
Students’ Environment and Health Symptoms in an Eastern Mediterranean Climate
Spengler J, McCarthy J, and Samet J. 2000. Indoor Air Quality Handbook, McGraw-HillProfessional, New York, NY, USA
UNESCO (United Nations Educational, Scientific and Cultural Organization). 2010. GlobalEducation Digest - Comparing Education Statistics Across the World. Montreal, Quebec,Canada
USEPA (US Environmental Protection Agency). 2006. Standardized EPA protocol for char-acterization indoor air quality in large office buildings- The Building Assessment Surveyand Evaluation (BASE). Washington, DC, USA
USEPA. 2012. Indoor Air Quality: Tools For Schools. Available at http,//www.epa.gov/iaq/schools/ (accessed December 25, 2013)
Wallace L, Nelson C, Highsmith R, et al. 2004. Association of personal and workplace charac-teristics with health, comfort and odor, a survey of 3948 office workers in three buildings.Indoor Air 3:193–205
Wargocki P, Sundell J, Bischof W, et al. 2002. Ventilation and health in non-industrial indoorenvironments. Indoor Air 12:113–28
WHO (World Health Organzation). 2009. WHO Guidelines for Indoor Air Quality: Dampnessand Mould. Copenhagen, Denmark
WHO. 2011. Methods for Monitoring Indoor Air Quality in Schools Bonn. Germany. Availableat http,//www.euro.who.int/ data/assets/pdf file/0011/147998/e95417.pdf (accessedDecember 6, 2013)
Yeatts K, El-Sadig M, Leith D, et al. 2012. Indoor air pollutants and health in the United ArabEmirates. Environ Health Persp 120:687–96
Zereini F and Wiseman C. 2010. Urban Airborne Particulate Matter, Origin, Chemistry, Fateand Health Impacts, 1st edit. Springer, Heidelberg, Germany
Zock J, Jarvis D, Luczynska C, et al. 2002. Housing characteristics, reported mold exposure,and asthma in the European community respiratory health survey. J Allergy Clin Immunol110:285–92
Hum. Ecol. Risk Assess. Vol. 00, No. 0, 2015 21
Dow
nloa
ded
by [
Uni
vers
iti S
ains
Mal
aysi
a] a
t 23:
25 0
2 A
ugus
t 201
4