Seasonal dynamics of biomarkers in infaunal clam Macoma balthica from the Gulf of Riga (Baltic Sea)
7
Seasonal dynamics of biomarkers in infaunal clam Macoma balthica from the Gulf of Riga (Baltic Sea) Ieva Barda a, ⁎, Ingrida Purina b , Elina Rimsa a , Maija Balode b a University of Latvia, Faculty of Biology, Kronvalda Blvd. 4, LV-1586 Riga, Latvia b Latvian Institute of Aquatic Ecology, Daugavgrivas 6, LV-1048 Riga, Latvia abstract article info Article history: Received 30 November 2011 Received in revised form 13 May 2013 Accepted 15 May 2013 Available online 25 May 2013 Keywords: Baltic Sea Gulf of Riga Biomarkers Seasonality Macoma balthica Biomarkers are often regarded as “early warning” signals of environmental pollution; however seasonal changes are mentioned as one of the most important factor that influences the activity of biomarkers. The aim of our study was to assess the importance of seasonal variation of selected contaminant biomarkers in Macoma balthica to provide background information for further environmental surveys in the Gulf of Riga. Seasonal variation of biomarkers (acetylcholinesterase (AChE), catalase (CAT), glutathione reductase (GR) and glutathione-S-transferase (GST)) was measured in infaunal clam M. balthica from the southern part of the Gulf of Riga. The majority of biomarkers (GST, CAT and GR) showed strong seasonal variability; however only CAT and GR were found to be significantly related to environmental factors (near-bottom oxygen, salinity and temperature). Integrated biomarker response (IBR) index indicated that the most stressed condition of M. balthica is during August and May. The highest values of IBR were found near the mouth of the River Daugava, suggesting the impact of environmental pollution on the benthic animals. © 2013 Elsevier B.V. All rights reserved. 1. Introduction The increasing anthropogenic activities are the main factor leading to the increasing levels of contaminants in the aquatic environments. In order to assess water quality, combination of physical, chemical and biological analyses are being traditionally used. Many recent laboratory and field studies in marine and freshwater environments suggest that measurements of enzymatic activity biomarkers are in- dicative of exposure to chemical pollution (Bocquene and Galgani, 1998; Robillard et al., 2003; Vidal et al., 2002). Biomarkers com- plement to and enhance reliability on the data of chemical analysis, offering more integral and biologically relevant information on the potential impact of toxic pollutants on the health of organisms (Cazenave et al., 2009; van der Oost et al., 2003). Moreover, effects at the biochemical level are generally used as “early warning” signals to assess the effects of contaminants on organisms, due to the sensi- tivity, ease of application and specificity to pollution stress of many biomarkers (Livingstone et al., 1992). Therefore, the use of biomarkers can offer an integrated evaluation of the effects of pollutants in organ- isms and show the “health status” of a system under investigation (Ferreira et al., 2005; Hansen, 2003). The enzymatic activity responses can also be influenced by seasonal changes of both environmental factors and metabolic activities, i.e. those related to food availability, reproductive cycle and gonadic development; in this respect, the understanding of natural changes of biomarkers can be useful for interpretation of field results and to discriminate the onset of biologi- cal disturbance from the natural variability (Boccheti and Regoli, 2006). Infaunal clams Macoma balthica are sessile, deposit/suspension feeding organisms, widely distributed in low diversity in the Northern Baltic Sea and abundant in coastal and estuarine areas. M. balthica is recognized as an important sentinel organism in the Baltic Sea able to accumulate several classes of pollutants, thus providing a time-integrated picture of their bioavailability (Bocchetti and Regoli, 2006; Lehtonen et al., 2006). The Gulf of Riga is situated in the Northeastern part of the Baltic Sea with an extensive catchment area. During early 1990s, the Gulf of Riga was described as one of the most polluted parts of the Baltic Sea (Yurkovskis et al., 1993) due to the industrial and agricultural activities in the drainage basin of the Gulf. High concentration of heavy metals, hydrocarbons and other pollutants was observed in the river mouth areas. Afterwards, a considerable decrease has been observed, which is explained both by decline of the agriculture and industry in the Baltic states (Kotta et al., 2008; Ojaveer, 1995). Howev- er recent assessments of hazardous substances revealed an alarming increase of DDT, PCB, lead, cadmium and zinc in the molluscs and fish of the Gulf of Riga (HELCOM, 2010), particularly in the southern part of the Gulf, as well as in the vicinity of harbors and shipping routes. The aim of our study was to assess the importance of seasonal variation of selected biomarkers in M. balthica to provide background information for further environmental surveys in the Gulf of Riga. A set of biomarkers was used to represent different types of biological Journal of Marine Systems 129 (2014) 150–156 ⁎ Corresponding author. Tel.: +371 29351779; fax: +371 67601995. E-mail address: [email protected] (I. Barda). 0924-7963/$ – see front matter © 2013 Elsevier B.V. All rights reserved. http://dx.doi.org/10.1016/j.jmarsys.2013.05.006 Contents lists available at ScienceDirect Journal of Marine Systems journal homepage: www.elsevier.com/locate/jmarsys
-
Upload
independent -
Category
Documents
-
view
0 -
download
0
Transcript of Seasonal dynamics of biomarkers in infaunal clam Macoma balthica from the Gulf of Riga (Baltic Sea)

Journal of Marine Systems 129 (2014) 150–156
Contents lists available at ScienceDirect
Journal of Marine Systems
j ourna l homepage: www.e lsev ie r .com/ locate / jmarsys
Seasonal dynamics of biomarkers in infaunal clam Macoma balthicafrom the Gulf of Riga (Baltic Sea)
Ieva Barda a,⁎, Ingrida Purina b, Elina Rimsa a, Maija Balode b
a University of Latvia, Faculty of Biology, Kronvalda Blvd. 4, LV-1586 Riga, Latviab Latvian Institute of Aquatic Ecology, Daugavgrivas 6, LV-1048 Riga, Latvia
⁎ Corresponding author. Tel.: +371 29351779; fax: +E-mail address: [email protected] (I. Barda).
0924-7963/$ – see front matter © 2013 Elsevier B.V. Alhttp://dx.doi.org/10.1016/j.jmarsys.2013.05.006
a b s t r a c t
a r t i c l e i n f oArticle history:Received 30 November 2011Received in revised form 13 May 2013Accepted 15 May 2013Available online 25 May 2013
Keywords:Baltic SeaGulf of RigaBiomarkersSeasonalityMacoma balthica
Biomarkers are often regarded as “early warning” signals of environmental pollution; however seasonalchanges are mentioned as one of the most important factor that influences the activity of biomarkers. Theaim of our study was to assess the importance of seasonal variation of selected contaminant biomarkers inMacoma balthica to provide background information for further environmental surveys in the Gulf of Riga.Seasonal variation of biomarkers (acetylcholinesterase (AChE), catalase (CAT), glutathione reductase (GR)and glutathione-S-transferase (GST)) was measured in infaunal clam M. balthica from the southern part ofthe Gulf of Riga. The majority of biomarkers (GST, CAT and GR) showed strong seasonal variability; howeveronly CAT and GRwere found to be significantly related to environmental factors (near-bottom oxygen, salinityand temperature). Integrated biomarker response (IBR) index indicated that the most stressed condition ofM. balthica is during August and May. The highest values of IBR were found near the mouth of the RiverDaugava, suggesting the impact of environmental pollution on the benthic animals.
© 2013 Elsevier B.V. All rights reserved.
1. Introduction
The increasing anthropogenic activities are the main factor leadingto the increasing levels of contaminants in the aquatic environments.In order to assess water quality, combination of physical, chemicaland biological analyses are being traditionally used. Many recentlaboratory and field studies in marine and freshwater environmentssuggest that measurements of enzymatic activity biomarkers are in-dicative of exposure to chemical pollution (Bocquene and Galgani,1998; Robillard et al., 2003; Vidal et al., 2002). Biomarkers com-plement to and enhance reliability on the data of chemical analysis,offering more integral and biologically relevant information on thepotential impact of toxic pollutants on the health of organisms(Cazenave et al., 2009; van der Oost et al., 2003). Moreover, effectsat the biochemical level are generally used as “early warning” signalsto assess the effects of contaminants on organisms, due to the sensi-tivity, ease of application and specificity to pollution stress of manybiomarkers (Livingstone et al., 1992). Therefore, the use of biomarkerscan offer an integrated evaluation of the effects of pollutants in organ-isms and show the “health status” of a system under investigation(Ferreira et al., 2005; Hansen, 2003). The enzymatic activity responsescan also be influenced by seasonal changes of both environmentalfactors and metabolic activities, i.e. those related to food availability,reproductive cycle and gonadic development; in this respect, theunderstanding of natural changes of biomarkers can be useful for
371 67601995.
l rights reserved.
interpretation of field results and to discriminate the onset of biologi-cal disturbance from the natural variability (Boccheti and Regoli,2006).
Infaunal clams Macoma balthica are sessile, deposit/suspensionfeeding organisms, widely distributed in low diversity in the NorthernBaltic Sea and abundant in coastal and estuarine areas. M. balthicais recognized as an important sentinel organism in the Baltic Seaable to accumulate several classes of pollutants, thus providing atime-integrated picture of their bioavailability (Bocchetti and Regoli,2006; Lehtonen et al., 2006).
The Gulf of Riga is situated in the Northeastern part of the BalticSea with an extensive catchment area. During early 1990s, the Gulfof Riga was described as one of the most polluted parts of the BalticSea (Yurkovskis et al., 1993) due to the industrial and agriculturalactivities in the drainage basin of the Gulf. High concentration ofheavy metals, hydrocarbons and other pollutants was observed inthe river mouth areas. Afterwards, a considerable decrease has beenobserved, which is explained both by decline of the agriculture andindustry in the Baltic states (Kotta et al., 2008; Ojaveer, 1995). Howev-er recent assessments of hazardous substances revealed an alarmingincrease of DDT, PCB, lead, cadmium and zinc in the molluscs andfish of the Gulf of Riga (HELCOM, 2010), particularly in the southernpart of the Gulf, as well as in the vicinity of harbors and shippingroutes.
The aim of our study was to assess the importance of seasonalvariation of selected biomarkers in M. balthica to provide backgroundinformation for further environmental surveys in the Gulf of Riga. Aset of biomarkers was used to represent different types of biological

151I. Barda et al. / Journal of Marine Systems 129 (2014) 150–156
responses reacting to different stressors. Acetylcholinesterase (AChE)is an enzyme involved in the synaptic transmission of nerve impulsesand is primarily inhibited by neurotoxic compounds, such as organo-phosphates and carbamate pesticides (Bocquene and Galgani, 1998),but also by other pollutants — heavy metals, detergents, cyanobac-terial toxins (Guilhermino et al., 1998; Kankaanpää et al., 2007;Lehtonen et al., 2003). Glutathione-S-transferase (GST) is involvedin the phase II of metabolism where it contributes to cell survivalby detoxification of xenobiotics (Habig et al., 1974; Sherrat andHayes, 2002). GST can detoxify a number of commonly used pesticideslike DDT, atrazine, lindane and methyl parathion either by catalyzingformation of GSH-conjugates or by dehalogenation activity (Sherratand Hayes, 2002). Glutathione reductase (GR) plays an importantrole in cellular antioxidant protection and adjustment process of met-abolic pathway maintaining adequate levels of reduced cellular GSHby reduction of GSSG to GSH in the NADPH-dependent reaction(Carlberg and Mannervik, 1985; Massy and Williams, 1965). Anotherantioxidant enzyme — catalase (CAT) is responsible for transforma-tion of reactive oxygen species, i.e. hydrogen peroxide to water andoxygen (Claiborne, 1985; Di Giulio et al., 1989).
2. Materials and methods
2.1. Study area
The Gulf of Riga is situated at the Northeastern part of the BalticSea and is quite an enclosed basin, as the water exchange with thesea occurs through two shallow straits. Its surface area is 16.330 km2
and the volume 424 km3, while the maximum depth is 62 m and theaverage depth −26 m (Berzinsh, 1995; Olesen et al., 1999). TheSouthern and Eastern part of the Gulf receives a large input of fresh-water from the main rivers Daugava, Lielupe, Gauja and Salaca,where they supply the dominant part of water runoff (30.2 km3 or86% of the total runoff) (Kļaviņš et al., 2002). The salinity of the Gulfis low (5–7 psu) as a result of the weak water exchange and largefreshwater impact (Berzinsh, 1995).
The Gulf of Riga is mostly well mixed to the bottom during thewinter due to wind-induced mixing of the seasonal cycle. FromApril to mid-October seasonal stratification restricts vertical waterexchange, thus promoting oxygen depletion and storage of nutrientsin the bottom water until the water column is remixed in the autumn(Yurkovskis, 2004). The only exceptions are straits and river mouths,where variable salinity stratification can be encountered in all sea-sons (Stipa et al., 1999). Estuaries of rivers Lielupe and Gauja usuallyfreeze up at the middle of December, and ice cover period lasts95 days on average. On the River Daugava ice cover formation startsat the beginning of January but is destroyed artificially.
The highest population density is in the Southern part of the Gulfof Riga, where the capital of Latvia, Riga with more than 0.8 millioninhabitants, is located. The Western and Eastern coasts of Riga arewidely used for recreational purposes.
The Gulf of Riga receives the largest part of nutrients from therivers Daugava and Lielupe. The majority of nutrients come fromagricultural lands in the catchment area and from Riga City municipalwastewaters (e.g. Andrushaitis et al., 1995). Anthropogenic nutrientinputs from land increased until the 1990s when a decline followed.About half of the load of dissolved substances and metals from theterritory of Latvia enters via the River Daugava. The highest loadsare observed for Zn and Mn and the lowest for Cd (Kļaviņš et al.,2002). The port of Riga is situated on the mouth of the River Daugava,where general cargo, containers and oil products are transhipped.
Stations 167B, 101A and 163B are located opposite the mouth ofrivers (167B — estuary of River Lielupe, 101A — River Daugava and163B — River Gauja) with the depth of 22 m (Fig. 1). The choice ofstations was based on the availability of long-term background
information— plankton, benthic community, nutrients, heavy metals,recently also few results on hazardous substances.
2.2. Sampling
Molluscs were collected monthly in the Southern part of the Gulfof Riga from May till October 2010 opposite estuaries of the threerivers (Fig. 1). These are transition areas in terms of salinity, sinceriver's waters mix with brackish water from the Gulf of Riga, resultingin a horizontal salinity gradient and a pronounced halocline. Duringthe sampling 30 specimens of M. balthica were collected with theVan Veen grab (in May, August with r/v “Varonis” and Septemberwith r/v “Aranda”) and with bottom dredge (June, July, October) atthe depth of 22 m. After sampling M. balthica was dissected and footand digestive gland were removed. The tissues were directly trans-ferred into the vials and stored in liquid nitrogen, but later placedin −80 °C freezer. The shell length of each mollusc was measured.The physicochemical parameters such as salinity, temperature anddissolved oxygen were measured in all stations from May to October2010 using YSI 6600V2 multiparameter water quality sonde.
2.3. Biomarker analyses
For the analysis of AChE, foot tissues of M. balthica were used.Five individuals were pooled per replicate (6 replicates per station).Determination of AChE activity was conducted according toBocquené and Galgani (1998). The foot tissues (≈0.12 g wet weight)were homogenized in cold 0.02 M phosphate buffer (0.1 % TritonX-100, pH 7.0) in ratio 1:3 (w/v) using pellet pestle (Kontes) for30 s. During homogenization vials were kept on ice. The homogenatewas centrifuged at 10,000 × g at 4 °C for 20 min and supernatant (S9fraction) was taken for measuring AChE activity at 412 nm usingmicroplate reader (TECAN Infinite 200) (Ellman et.al., 1961).
For GR, CAT and GST analysis, digestive gland tissue fromM. balthicawas used. Five individuals were pooled, with six replicates per station.Approximately 0.3 g (wet weight) of digestive gland tissues werehomogenized in cold 100 mM potassium phosphate buffer (pH 7.4) inratio 1:4 (w/v). The homogenate was centrifuged at 10,000 × g at 4 °Cfor 20 min.
GST measurements were performed using modification of themethod based on Habig et al. (1974). S9 fraction was diluted withhomogenization buffer in ratio 1:30 and the standard reaction mix-ture contained 20 mM CDNB and 20 mM GSH. Enzyme activity wasmeasured with microplate reader (TECAN Infinite 200) at 340 nm.
CAT activity was determined according to Claiborne (1985) and S9fraction was diluted in ratio 1:10 (w/v). CAT activity was measuredwith microplate reader (TECAN Infinite 200) observing decrease of30 mM H2O2 at 240 nm.
For GR determination, S9 dilution of 1:3 (w/v) was made and theactivity of GR was assayed following the rate of NADPH (1 mM)oxidation in the presence of GSSG (5 mM). The GR activity was mea-sured with microplate reader (TECAN Infinite 200) at 340 nm.
The quantity of proteins present in homogenate was determinedusing the method of Bradford (1976) with bovine serum albumin(BSA) as standard for all biomarkers. All measurements of enzymaticactivity and protein content were performed in quadruplicate foreach replicate.
2.4. Statistical analyses
All data are expressed as the means ± SD and were first tested fornormality using Shapiro–Wilk test. As all biomarker data were notnormally distributed, Kruskal–Wallis test was used to compare vari-ables between the site and season.Whenever a significant (p b 0.05) ef-fect was established on a parameter response, a post-hoc Bonferronitest for multiple comparison between paired means was applied to
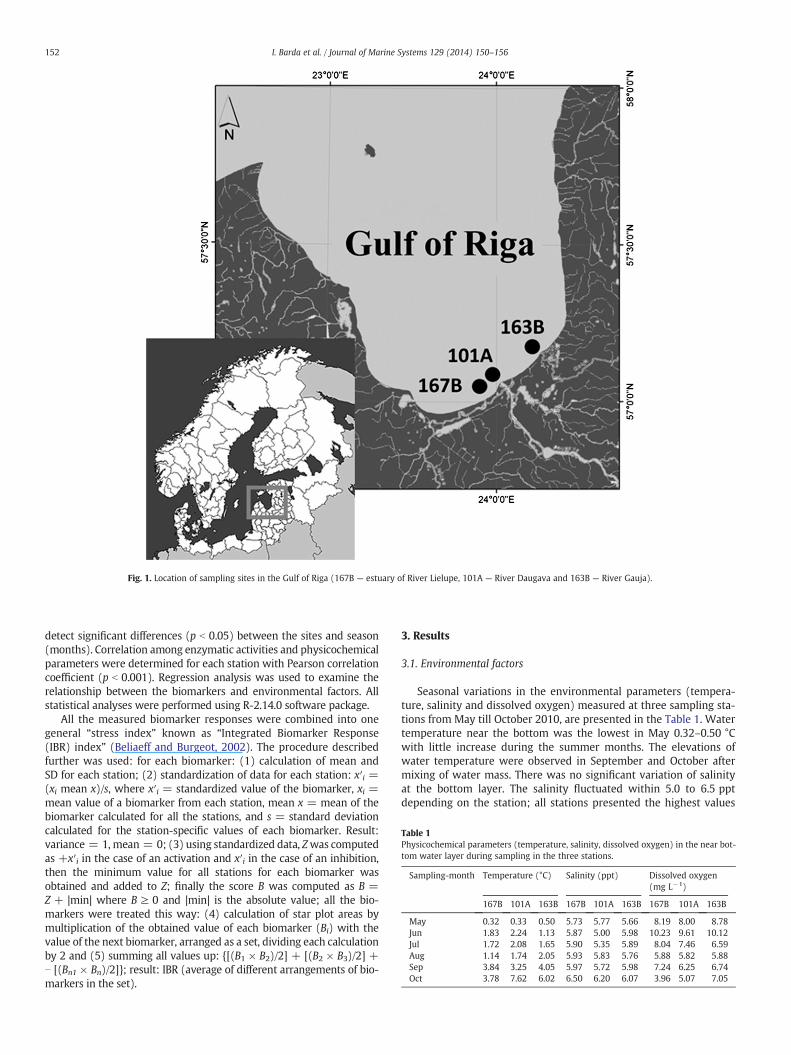
Table 1Physicochemical parameters (temperature, salinity, dissolved oxygen) in the near bot-tom water layer during sampling in the three stations.
Sampling-month Temperature (°C) Salinity (ppt) Dissolved oxygen(mg L−1)
167B 101A 163B 167B 101A 163B 167B 101A 163B
May 0.32 0.33 0.50 5.73 5.77 5.66 8.19 8.00 8.78Jun 1.83 2.24 1.13 5.87 5.00 5.98 10.23 9.61 10.12Jul 1.72 2.08 1.65 5.90 5.35 5.89 8.04 7.46 6.59Aug 1.14 1.74 2.05 5.93 5.83 5.76 5.88 5.82 5.88Sep 3.84 3.25 4.05 5.97 5.72 5.98 7.24 6.25 6.74Oct 3.78 7.62 6.02 6.50 6.20 6.07 3.96 5.07 7.05
Fig. 1. Location of sampling sites in the Gulf of Riga (167B — estuary of River Lielupe, 101A — River Daugava and 163B — River Gauja).
152 I. Barda et al. / Journal of Marine Systems 129 (2014) 150–156
detect significant differences (p b 0.05) between the sites and season(months). Correlation among enzymatic activities and physicochemicalparameters were determined for each station with Pearson correlationcoefficient (p b 0.001). Regression analysis was used to examine therelationship between the biomarkers and environmental factors. Allstatistical analyses were performed using R-2.14.0 software package.
All the measured biomarker responses were combined into onegeneral “stress index” known as “Integrated Biomarker Response(IBR) index” (Beliaeff and Burgeot, 2002). The procedure describedfurther was used: for each biomarker: (1) calculation of mean andSD for each station; (2) standardization of data for each station: x′i =(xi mean x)/s, where x′i = standardized value of the biomarker, xi =mean value of a biomarker from each station, mean x = mean of thebiomarker calculated for all the stations, and s = standard deviationcalculated for the station-specific values of each biomarker. Result:variance = 1, mean = 0; (3) using standardized data, Zwas computedas +x′i in the case of an activation and x′i in the case of an inhibition,then the minimum value for all stations for each biomarker wasobtained and added to Z; finally the score B was computed as B =Z + |min| where B ≥ 0 and |min| is the absolute value; all the bio-markers were treated this way: (4) calculation of star plot areas bymultiplication of the obtained value of each biomarker (Bi) with thevalue of the next biomarker, arranged as a set, dividing each calculationby 2 and (5) summing all values up: {[(B1 × B2)/2] + [(B2 × B3)/2] +⋯ [(Bn1 × Bn)/2]}; result: IBR (average of different arrangements of bio-markers in the set).
3. Results
3.1. Environmental factors
Seasonal variations in the environmental parameters (tempera-ture, salinity and dissolved oxygen) measured at three sampling sta-tions from May till October 2010, are presented in the Table 1. Watertemperature near the bottom was the lowest in May 0.32–0.50 °Cwith little increase during the summer months. The elevations ofwater temperature were observed in September and October aftermixing of water mass. There was no significant variation of salinityat the bottom layer. The salinity fluctuated within 5.0 to 6.5 pptdepending on the station; all stations presented the highest values

153I. Barda et al. / Journal of Marine Systems 129 (2014) 150–156
in October. The dissolved oxygen composes more than 8 mg L−1 afterthe spring mixing and increases in June. Oxygen decrease at thebottom layer was observed during the summer stratification withsmall oscillation at the end of the sampling.
3.2. Biomarker activity
3.2.1. Acetylcholinesterase activityThe results of AChE activity showed no significant difference
between the stations. AChE activity in the foot tissues of M. balthicawas 26.8 ± 10.1, 20.3 ± 4.0 and 33.3 ± 11.0 nmol/min/mg protein(167B, 101A, 163B, respectively) in May and was gradually decreas-ing till August, when the lowest concentrations were detected in allstations — 18.8 ± 5.4 (167B), 14.4 ± 4.0 (101A) and 16.9 ± 6.1(163B) nmol/min/mg protein (p b 0.05, Bonferroni test). DuringSeptember–October the activity of AChE was increasing evenly inStation 163B, while in 101A and 167B decrease was observed inOctober (Fig. 2). No correlation between AChE activity in M. balthicaand environmental factors in the stations could be observed, but sea-sonality was detected only in station 101A (p b 0.001).
3.2.2. Glutathione-S-transferase activityDuring the seasonal study period GST activity of M. balthica
showed quite similar pattern for stations 101A and 167B (Fig. 2),while it was significantly different (p b 0.001) for station 163B.The lowest values were recorded in May (272 ± 32 and 307 ±22 nmol/min/mg protein; 167B and 101A, respectively) with aminor fluctuation till July. The GST increased in August, when thehighest values (606 ± 132 nmol/min/mg protein) were detected inStation 101A. Comparatively, enzyme activity in Station 163B wasincreasing until June (522 ± 110 nmol/min/mg protein) and remainedquite stable till August. The GST activity decreased at the end of thestudy period in all stations. Although a significant seasonal impacton GST activity was established (ANOVA: p b 0.05), changes in temper-ature, dissolved oxygen and salinity were not related to the enzymeactivity in any station.
Fig. 2. Seasonal variations in CAT, GR and GST activity (mean ± SD) in the d
3.2.3. Catalase activityAlike AChE, also CAT activity showed no significant difference
between the stations. The highest CAT activity was recorded in May(77.6 ± 11.3 μmol/min/mg protein, station 163B) and June (63.2 ±11.2 μmol/min/mg protein, station 167B) with decrease till July(Fig. 2). Expressed peak was detected in August, when the highestvalues were determined in Station 101A (70.2 ± 9 μmol/min/mgprotein, respectively). A decline of CAT activity in M. balthica wasdetected from August till October. At the end of the season CAT activ-ity was the lowest (32.5 ± 7.3; 27.2 ± 4.1; 32.9 ± 8.9 μmol/min/mgproteins; Station 167B, 101A and 163B, respectively) and signifi-cantly different from that at the beginning of the sampling season(p b 0.001, Bonferroni test).
The relationships between all three physicochemical parametersand CAT activity were found to be statistically significant. Negativecorrelation was detected with temperature (r = −0.65; p b 0.001)and salinity (r = −0.29; p b 0.001), while positive with dissolvedoxygen (r = 0.36; p b 0.001). In addition, the seasonal variability ofCAT activity was established (p b 0.001).
3.2.4. Glutathione reductase activityThe trend of GR activity was dissimilar between the stations, pre-
senting more equal results for station 101A and 167B; however thedifferences were not statistically significant. The highest activity forstation 163B was recorded in May (22.8 ± 5 nmol/min/mg protein)with equable decrease till October (Fig. 2). Comparatively, in theother stations a small variation was observed from May till Julywhen enzyme activity fluctuated from 5.2 to 13.2 nmol/min/mg pro-tein (Station 167B) and 9.6 to 10.8 nmol/min/mg protein (Station101A). A strongly pronounced peak was detected in August (p b 0.01,Bonferroni test) when values were the highest in station 101A and167B (20.2 ± 9 and 25.3 ± 8 nmol/min/mg protein; respectively). Atthe end of the sampling period GR activity had reduced and was stablein all stations. The statistical analyses showed that GR activity was sig-nificant and correlated negatively with the temperature (r = −0.39;p b 0.001) and that enzyme activity depends on the seasonal influence(p b 0.001).
igestive gland tissue and AChE activity in the foot tissue of M. balthica.

154 I. Barda et al. / Journal of Marine Systems 129 (2014) 150–156
3.3. Integrated biomarker response
The integrated biomarker responses were based on all measuredbiomarkers and are shown in Fig. 3. The area in black integrates theIBR for each site and is represented as a star plot. In station 167Bthe IBR values were the highest between June and August. A similartrend was observed also in station 101A, however in this station IBRshows more expressed integrated stress response of M. balthica inAugust. Different results were calculated for station 163B, where thehighest values were obtained in May with decrease till October. Rela-tively lowest IBR values were determined at the end of the samplingseason — September, October in all stations.
4. Discussion
Apart from the pollution, seasonal changes are mentioned as animportant factor influencing the biomarker activity (Bocchetti andRegoli, 2006; Dellali et al., 2001; Fitzpatrick et al., 1997; Manduzio et al.,2004; Pfeifer et al., 2005). In our study a strong connectionwith seasonalvariability was established for GST, CAT and GR in all stations. Only AChEdid not show seasonal variation. However, relationship between physio-chemical parameters and biomarker activitywas identified only for someof them.
Impact of the environmental factors on the enzyme activity inmolluscs has been reported in many studies. Temperature has beenclaimed to be the most significant natural factor affecting bivalveAChE (Leiniö and Lehtonen, 2005; Pfeifer et al., 2005; Robillard et al.,2003), CAT, GST (Robillard et al., 2003) as well as GR activity (Verlecaret al., 2008). Also salinity (Pfeifer et al., 2005), oxygen saturation atthe bottom level (Leiniö and Lehtonen, 2005) and pH (Robillard et al.,2003) have been mentioned.
As to our study the activity of AChE was the less sensitive to theabiotic factors. The seasonality of AChE activity was established onlyin one station (101A). Besides, the results did not show statisticallysignificant influence of temperature, salinity or oxygen concentrationon the enzyme activity inM. balthica in any station of the Gulf of Riga.Similarly to AChE, GST was also not related to physiochemical param-eters. Strong thermal stratification, as well as pronounced salinitygradient was established in the estuaries zone during the study peri-od, preventing the mixing and warming of water masses during thesummer. Significant warming of near-bottom water was recordedonly in October after the breakdown of summer stratification. Thiscould influence the seasonal dynamics of all enzyme activity in thesampling stations. Leiniö and Lehtonen (2005) in their study reportedof higher AChE activity during the summer period, probably due tohigher water temperatures during the summer months, while in ourstudy such pronounced trend was not established. Comparably, inour study the AChE activity was higher in May and was decreasing
Fig. 3. Seasonal variations in the integrated biomarker response index (IBR)
steadily until August. An elevated activity of GST, GR and CAT werealso recorded in August, especially in the station 101A, suggestingthat enzyme activity could be affected by phytoplankton composition,namely, blooms of potentially toxic cyanobacteria. The accumulationof cyanobacteria toxins into biota (Kankaanpää et al., 2002; Sipiäet al., 2001a, 2001b), as well as toxin impact on the enzyme activityhas been reported in many studies concerning the Baltic Sea. Signifi-cant changes of AChE and CAT activity were found in bivalves afterexposure to nodularin or nodularin-containing cyanobacterial extract(Lehtonen et al., 2003; Pflugmacher et al., 2007). The influence ofnodularin on the GST activity was also recognized in the organismsof different trophic levels (Davies et al., 2005; Kankaanpää et al.,2007; Pflugmacher et al., 2007). The long-term data from the studiesof phytoplankton in the Gulf of Riga shows that usually the highestproportion of cyanobacteria in biomass occurs during July–August(Jurgensone et al., 2011), when mass development of potentiallytoxic cyanobacteria blooms can be found (Seppälä and Balode,1999). The high concentrations of nodularin (270–540 ng/g dw)detected in digestive glands of M. balthica from the Gulf of Riga(unpublished data) confirms the influence of cyanobacterial toxinson enzymatic activity of molluscs.
CAT and GR are antioxidant enzymes, involved in the enzymesystem preventing the cellular damage caused by reactive oxygenspecies (ROS). Our studies showed that these enzymes are stronglyaffected by the environmental parameters. Temperature and salinityhad a negative impact on CAT activity in M. balthica while dissolvedoxygen — positive. On the contrary, GR activity negatively correlatedonly with the temperature. In addition to that the seasonal variabilityof both enzyme activities was established. The antioxidant enzymeGR in M. balthica showed similar seasonal trend as GST activity, how-ever there was no significant correlation between them.
The seasonal influence on GR activity in mussels has been reportedby Manduzio et al. (2004), Bocchetti and Regoli (2006). Verlecar et al.(2008) observed significant connection between the temperature andGR activity in green-lipped mussel Perna viridis from the Arabian Sea.As to our study, negative correlation between the temperatureand seasonal variability of enzyme activity has also been detected. Inthe M. balthica higher CAT and GR activity was detected in spring(May, June) when the bottom temperature was the lowest. High CATactivity in bivalves of the Baltic Sea has been reported at the endof the spring (Kopecka et al., 2006; Leiniö and Lehtonen, 2005) andalso for Mediterranean mussel Mytilus galloprovincialis (Bocchettiand Regoli, 2006). Phytoplankton blooms of diatoms are typical inspring, thus increasing the food availability for molluscs. This affectsalso their metabolism, as oxidative changes are reported to be typicalresponses in bivalve molluscs during the periods of more intensefeeding activities (Regoli et al., 2002). In the Gulf of Riga the highestphytoplankton biomass has been recorded in May (Jurgensone et al.,
calculated for all stations using 4 measured biomarkers in M. balthica.

Fig. 4. Relationship between seasonal integrated biomarker response index (IBR) and amount of bivalve larvae in plankton.
155I. Barda et al. / Journal of Marine Systems 129 (2014) 150–156
2011), but higher sedimentation rates of suspended matter in June(data from Latvian Institute of Aquatic Ecology). This could explainhigher enzyme activity in M. balthica at the end of the spring.
The integrated biomarker response index (IBR) has been used inmany studies to assess toxically-induced stress level of populations(Broeg and Lehtonen, 2006; Damiens et al., 2007; Lehtonen et al.,2006) or generally describe the “stress period” of the population(Leiniö and Lehtonen, 2005). As to our study, two stations (167Band 101A) presented higher IBR during the summer period reachingthe highest peak in August, but also May showed higher IBR response(163B), indicating that these months could be stressful forM. balthicain the Southern part of the Gulf of Riga. As discussed previously, foodavailability (phytoplankton blooms in spring and summer) has strongconnection to oxidative stress in bivalves. Many studies have shownimpact of cyanobacterial toxins on the biomarker activity in molluscs,also for M. balthica. In the Gulf of Riga, the mass development ofcyanobacteria varies from year to year, but still the most intensiveblooms are observed from July till September (Jurgensone et al.,2011). This shows that toxin production of cyanobacteria and alsodiatom abundance has to be taken into account when assessing IBRof the study area.
There is close functional relationship between the reproductioncycle and oxidative stress in bivalves (Filho et al., 2001). In theNorthern Baltic Sea M. balthica spawns once a year: April–May, whilefrom March to early May it spawns in the South of the Baltic Sea(Bonsdorff andWenne, 1989). In contrast,M. balthica from the Southernlimit of its distribution (Gironde Estuary, France) is known to spawntwice a year: in late spring/early summer and again from Septemberto November (Bachelet, 1986). Günther et al. (1998) has reportedabout mass occurrence of M. balthica larvae in midsummer fromWadden Sea. Our results show that increased IBR could also haveconnection with the spawning period. The average IBR from all sta-tions increased in August significantly, while large amounts of bivalvelarvae were also detected in the summer months (Latvian Institute ofAquatic Ecology) (Fig. 4). As the M. balthica has a planktonic life stageof 2–5 weeks, spawning in July or August could affect the biomarkeractivity.
The lowest values of IBR were calculated at the end of the sam-pling period (September–October), indicating that this could be thebest sampling period for biomarker activity during the vegetationseason.
In the estuary of the River Gauja (163B) IBR was less pronouncedthan in the estuaries of the River Daugava (101A) and Lielupe (167B).The highest values of IBR were found near the mouth of the RiverDaugava, suggesting the impact of the environmental pollution onthe benthic animals.
5. Conclusions
The results of this study allow to set the “baseline” level of select-ed biomarker responses inM. balthica in the Gulf of Riga in order to beable to identify the pollution related events in the future. It maybe assumed that the seasonal variability of biomarkers integratesthe characteristic variation of reproductive status, food availabilityand environmental conditions in the study area, therefore seasonalvariability should be taken into account when the environmentalquality is assessed. The results showed that neurotoxic biomarkerAChE exhibited the lowest seasonal variability. AChE and detoxifica-tion enzyme GST were not affected by abiotic environmental factors,opposite to oxidative stress biomarkers GR and CAT. However furtherresearch is required to estimate the year-to-year variability.
Integrated biomarker response is useful when the seasonal estima-tion of biomarkers is performed. According to our results September–October is the best period for sampling ofM. balthica for the assessmentof hazardous substances and their effects, because the IBR indicates themost stable biomarker levels at this period.
Acknowledgements
This study was partly supported by ESF project HYDROTOXcontract no. 2009/0226/1DP/.1.1.1.2.0/09/APIA/VIAA/080 and partlyby BONUS+ project BEAST (Biological Effects of AnthropogenicChemical Stress: Tools for the Assessment of Ecosystem Health). Wewould like to thankBONUS+project BEAST coordinator Karri Lehtonen.Many thanks to Vadims Jermakovs and Mintauts Jansons from LatvianInstitute of Aquatic Ecology for invaluable help in the field work andAstra Labuce for zooplankton data used for this study.
References
Andrushaitis, A., Seisuma, Z., Legzdina, M., Lenshs, E., 1995. River load of eutrophyingsubstances and heavy metals into the Gulf of Riga. In: Ojaveer, E. (Ed.), Ecosystemof the Gulf of Riga between 1920 and 1990. Estonian Academy Publishers, Tallinn,pp. 32–42.
Bachelet, G., 1986. Recruitment and year-to-year variability in a population of Macomabalthica (L.). Hydrobiologia 142, 233–248.
Beliaeff, B., Burgeot, T., 2002. Integrated biomarker response (IBR): a useful graphicaltool for ecological risk assessment. Environ. Toxicol. Chem. 21, 1316–1322.
Berzinsh, V., 1995. Hydrology. In: Ojaveer, E. (Ed.), Ecosystem of the Gulf of Rigabetween 1920 and 1990. Estonian Academy Publishers, Tallinn, pp. 7–31.
Bocchetti, R., Regoli, F., 2006. Seasonal variability of oxidative biomarkers, lysosomalparameters, metallothioneins and peroxisomal enzymes in the Mediterraneanmussel Mytilus galloprovincialis from Adriatic Sea. Chemosphere 65, 913–921.
Bocquene, G., Galgani, F., 1998. Biological effects of contaminants: cholinesterase inhi-bition by organophosphate and carbamate compounds. ICES Tech. Mar. Environ.Sci. 22, 1–12.

156 I. Barda et al. / Journal of Marine Systems 129 (2014) 150–156
Bonsdorff, E., Wenne, R., 1989. A comparison of condition indices of Macoma balthica(L.) from the northern and southern Baltic Sea. Neth. J. Sea Res. 23 (1), 45–55.
Bradford, M.M., 1976. A rapid and sensitive method for quantitation of microgramquantities of protein utilizing the principle of protein dye binding. Anal. Biochem.72, 248–254.
Broeg, K., Lehtonen, K.K., 2006. Indices for the assessment of environmental pollutionof the Baltic Sea coasts: integrated assessment of a multi-biomarker approach.Mar. Pollut. Bull. 53, 508–522.
Carlberg, I., Mannervik, B., 1985. Glutathione reductase. Methods Enzymol. 113, 485–490.Cazenave, J., Bacchetta, C., Parma, M.J., Scarabotti, P.A., Wunderlin, D.A., 2009. Multiple
biomarkers responses in Prochilodus lineatus allowed assessing changes in thewater quality of Salado River basin (Santa Fe, Argentina). Environ. Pollut. 157,3025–3033.
Claiborne, A., 1985. Catalase activity. In: Greenwald, R.A. (Ed.), Handbook of Methodsfor Oxygen Radical Research. CRC Press, Boca Raton, Florida, pp. 283–284.
Damiens, G., Gnassia-Barelli, M., Loquès, F., Romèo, M., Salbert, V., 2007. Integrated bio-marker response index as a useful tool for environmental assessment evaluatedusing transplanted mussels. Chemosphere 66, 574–583.
Davies, W.R., Siu, W.H.L., Jack, R.W., Wu, R.S.S., Lam, P.K.S., Nugegoda, D., 2005. Com-parative effects of the blue green algae Nodularia spumigena and a lysed extracton detoxification and antioxidant enzymes in the green lipped mussel (Pernaviridis). Mar. Pollut. Bull. 51, 1026–1033.
Dellali, M., Gnassia Barelli, M., Rome´o, M., Aissa, P., 2001. The use of acetylcholinesteraseactivity in Ruditapes decussatus and Mytilus galloprovincialis in the biomonitoring ofBizerta lagoon. Comp. Biochem. Physiol. C 130, 227–235.
Di Giulio, R.T., Wasburn, P.C., Wenning, R.J., Winston, G.W., Jewell, C.S., 1989. Biochem-ical responses in aquatic animals: a review of determinants of oxidative stress.Environ. Toxicol. Chem. 8, 1103–1123.
Ellman, G.L., Courtney, K.O., Andrres, V., Featherstone, R.M., 1961. A new and rapidcolorimetric determination of acetylcholinesterase activity. Biochem. Pharmacol.7, 88–95.
Ferreira, M., Moradas-Ferreira, P., Reis-Henriques, M.A., 2005. Oxidative stress biomarkersin two resident species,mullet (Mugil cephalus) and flounder (Platichthys flesus), froma polluted site in River Douro EstuaryPortugal. Aquat. Toxicol. 71, 39–48.
Filho, D.W., Tribess, T., Gaspari, C., Claudio, F.D., Torres, M.A., Magalhaes, A.R.M., 2001.Seasonal changes in antioxidant defenses of the digestive gland of the brownmussel Perna perna. Aquaculture 203, 149–158.
Fitzpatrick, P.J., O'Halloran, J., Sheehan, D., Walsh, A.R., 1997. Assessment of a glutathi-one S-transferase and related proteins in the gill and digestive gland of Mytilusedulis (L.), as potential organic pollution biomarkers. Biomarkers 2, 51–56.
Guilhermino, L., Barros, B., Silva, M.C., Soares, A.M.V.M., 1998. Should the use of inhibi-tion of cholinesterases as a specific biomarker for organophosphate and carbamatepesticides be questioned? Biomarkers 3, 157–163.
Günthera, C.-P., Boysen-Ennen, E., Niesel, V., Hasemann, C., Heuers, J., Bittkau, A., Fetzer, I.,Nacken,M., Schlüter,M., Jaklin, S., 1998. Observations of amass occurrence ofMacomabalthica larvae in midsummer. J. Sea Res. 40, 347–351.
Habig, W.H., Pabst, M.J., Jakoby, W.B., 1974. Glutathione S-transferases — the firstenzymatic step in mercapturic acid formation. J. Biol. Chem. 249, 7130–7139.
Hansen, P.-D., 2003. Biomarkers. In: Markert, B.A., Breure, A.M., Zechmeister, H.G.(Eds.), Bioindicators and Biomonitors. Elsevier Science Ltd., Oxford, pp. 203–220.
HELCOM, 2010. Hazardous substances in the Baltic Sea — an integrated thematic as-sessment of hazardous substances in the Baltic Sea. Balt. Sea Environ. Proc. 120B.
Jurgensone, I., Carstensen, J., Ikauniece, A., Kalveka, B., 2011. Long-term changes andcontrolling factors of phytoplankton community in the Gulf of Riga (Baltic Sea).Estuar. Coasts 34 (6), 1205–1219.
Kankaanpää, H., Vuorinen, P., Sipiä, V., Keinänen, M., 2002. Acute effects of Nodulariaspumigena and bioaccumulation of nodularin to brown trout (Salmo trutta L.)under laboratory conditions. Aquat. Toxicol. 61, 155–168.
Kankaanpää, H., Leiniö, S., Olin, M., Sjövall, O., Meriluoto, J., Lehtonen, K.K., 2007. Accu-mulation and depuration of cyanobacterial toxin nodularin and biomarkerresponses in the mussel Mytilus edulis. Chemosphere 68, 1210–1217.
Kļaviņš, M., Rodinovs, V., Kokorīte, I., 2002. Chemistry of surface waters in Latvia. 286[Rīga, LU].
Kopecka, J., Lehtonen, K.K., Baršiene, J., Broeg, K., Vuorinen, P.J., Gercken, J., Pempkowiak, J.,2006. Measurements of biomarker levels in flounder (Platichthys flesus) and bluemussel (Mytilus trossulus) from the Gulf of Gdansk (Southern Baltic). Mar. Pollut.Bull. 53, 406–421.
Kotta, J., Lauringson, V., Martin, G., Simm, M., Kotta, I., Herkül, K., Ojaveer, H., 2008. Gulfof Riga and Pärnu Bay. In: Schiewer, U. (Ed.), Ecology of Baltic Coastal Waters.Ecological Studies, 197. Springer, pp. 217–243.
Lehtonen, K.K., Kankaanpää, H., Leinio, S., Sipia, V.O., Pflugmacher, S., Sandberg-Kilpi, E.,2003. Accumulation of nodularin-like compounds from the cyanobacteria Nodulariaspumigena and changes in acetylcholinesterase activity in the clam Macoma balthicaduring short-term laboratory exposure. Aquat. Toxicol. 64, 461–476.
Lehtonen, K.K., Leinio, S., Schneider, R., Leivuori, M., 2006. Biomarkers of pollutioneffects in the bivalvesMytilus edulis andMacoma balthica collected from the south-ern coast of Finland (Baltic Sea). Mar. Ecol. Prog. Ser. 322, 155–168.
Leiniö, S., Lehtonen, K.K., 2005. Seasonal variability in biomarkers in the bivalvesMacoma balthica and Mytilus edulis from the northern Baltic Sea. Comp. Biochem.Physiol. C 40, 408–421.
Livingstone, D.R., Lips, F., Garcia Martinez, P., Pipe, R.K., 1992. Antioxidant enzymes indigestive gland of the common mussel, Mytilus edulis L. Mar. Biol. 112, 265–276.
Manduzio, H., Monsinjon, T., Galap, C., Leboulenger, F., Rocher, B., 2004. Seasonalvariations in antioxidant defences in bluemusselsMytilus edulis collected from a pol-luted area: major contributions in gills of an inducible isoform of Cu/Zn-superoxidedismutase and of glutathione S-transferase. Aquat. Ecol. 70, 83–93.
Massy, V., Williams, C.H., 1965. On the reaction mechanism of yeast glutathione reduc-tase. J. Biol. Chem. 240, 4470–4481.
Ojaveer, E., 1995. Large-scale processes in the ecosystem of the Gulf of Riga. In: Ojaveer,E. (Ed.), Ecosystem of the Gulf of Riga between 1920 and 1990. Estonian AcademyPublishers, Tallinn, pp. 268–277.
Olesen, M., Lundsgaard, C., Andrushaitis, A., 1999. Influence of nutrients and mixing onthe primary production and community respiration in the Gulf of Riga. J. Mar. Syst.23, 127–144.
Pfeifer, S., Schiedek, D., Dippner, J., 2005. Effect of temperature and salinity on acetyl-cholinesterase activity, a common pollution biomarker, in Mytilus sp. from thesouth-western Baltic Sea. J. Exp. Mar. Biol. Ecol. 320, 93–103.
Pflugmacher, S., Olin, M., Kankaanpää, H., 2007. Nodularin induces oxidative stressin the Baltic Sea brown alga Fucus vesiculosus (Phaeophyceae). Mar. Environ. Res.64, 149–159.
Regoli, F., Nigro, M., Chiantore, M., Winston, G.W., 2002. Seasonal variations of suscep-tibility to oxidative stress in Adamussium colbecki, a key bioindicator species for theAntarctic marine environment. Sci. Total. Environ. 289, 205–211.
Robillard, S., Beauchamp, G., Laulier, M., 2003. The role of abiotic factors and pesticidelevels on enzymatic activity in the freshwater mussel Anadonta cygnea at threedifferent exposure sites. Comp. Biochem. Physiol. C 135, 49–59.
Seppälä, J., Balode, M., 1999. Spatial distribution of phytoplankton in the Gulf of Rigaduring spring and summer stages. J. Mar. Syst. 23, 51–68.
Sherrat, P.J., Hayes, J.D., 2002. Glutathione-S-transferases. In: Ioanides, C. (Ed.), En-zyme Systems that Metabolize Drugs and Other Xenobiotics. John Wiley & Sons,LTD, pp. 319–352.
Sipiä, V.O., Kankaanpää, H.T., Flinkman, J., Lahti, K., Meriluoto, J.A.O., 2001a. Time-dependent accumulation of cyanobacterial hepatotoxins in flounders (Platichthysflesus) and mussels (Mytilus edulis) from the northern Baltic Sea. Environ. Toxicol.16, 330–336.
Sipiä, V., Kankaanpää, H., Lahti, K., Carmichael, W.W., Meriluoto, J., 2001b. Detection ofnodularin in flounders and cod from the Baltic Sea. Environ. Toxicol. 16, 121–126.
Stipa, T., Tamminen, T., Seppälä, J., 1999. On the creation and maintenance of stratifica-tion in the Gulf of Riga. J. Mar. Syst. 23, 27–50.
Van der Oost, R., Beyer, J., Vermeulen, N.P.E., 2003. Fish bioaccumulation and bio-markers in environmental risk assessment: a review. Environ. Toxicol. Pharmacol.13, 57–149.
Verlecar, X.N., Jena, K.B., Chainy, G.B.N., 2008. Seasonal variation of oxidative bio-markers in gills and digestive gland of green-lipped mussel Perna viridis fromArabian Sea. Estuarine Coastal Shelf Sci. 76, 745–752.
Vidal, M.-L., Basseres, A., Narbonne, J.-F., 2002. Seasonal variations of pollution biomarkersin two populations of Corbicula fluminea (Müller). Comp. Biochem. Physiol. C 131,133–151.
Yurkovskis, A., 2004. Long-term land-based and internal forcing of the nutrient state ofthe Gulf of Riga (Baltic Sea). J. Mar. Syst. 50, 181–197.
Yurkovskis, A., Wulff, F., Rahm, L., Andruzaitis, A., Rodiguez-Medina, M., 1993. A nutri-ent budget of the Gulf of Riga, Baltic Sea. Estuar. Coast. Shelf Sci. 37, 113–127.