
SCSI Journal April-June 2013 12(2).pdf - Soil Conservation ...
92
-
Upload
khangminh22 -
Category
Documents
-
view
2 -
download
0
Transcript of SCSI Journal April-June 2013 12(2).pdf - Soil Conservation ...


Volume 12 No. 2 ISSN 0022–457X April-June 2013
Contents
All disputes are subject to the exclusive jurisdiction of competent courts and forums in Delhi/New Delhi only • The Society does not assumeany responsibility for opinions offered by the authors in the articles and no material in any form can be reproduced without permission of theSociety • The Society is not responsible for any delay, whatsoever, in publication/delivery of the periodicals to the subscribers due to unforeseencircumstances or postal delay • Readers are recommended to make appropriate enquiries before sending money, incurring expenses orentering into commitments in relation to any advertisement appearing in this publication. The Society does not vouch for any claims made bythe advertisers of products and services. The publisher and the editors of the publication shall not be held liable for any consequences in theevent of such claims not being honoured by the advertisers.
INMS: A tool to retrieve soil health 93– A.K. Jha and K.K. Singh
Effect of rates, methods, and schedules of N application on growth, and yield in upland rice under 101unfavourable environments– R.K. Tomar and R.N. Garg
Efficient use of geotextiles as soil conditioner to increase potato productivity on inceptisol of West Bengal 104– Debabrata pain, Susanta Kumar De, P. K. Tarafda, Arunabha Pal, Angira Prasad Mahata, Rahul Adhikari and Sanjib Kumar Bauri
Irrigation water use and availability in India: changing growth trends and implications 108– I. Sekar
Spatial and temporal variations in rainfall and rainwater harvesting potential for Kutch district, Gujarat 117– M. K. Khandelwal, Sanjay Arora and K.C.B. Raju
Moisture distribution and fertilizer mobility under drip fertigation in Mulberry 123– K. Arun Devi and P.K. Selvaraj
Determination of drainage coefficient for surface drainage design in rainfed low land rice areas of 130Mahanadi Delta– P. K. Pataniak, J. C. Paul and B. Panigrahi
Wind drift and evaporation losses under various operating conditions of sprinkler irrigation system 136– Jitander Kumar, Dheeraj Kumar, Dharmendera Kumar and H.K. Mittal
Innovative design and layout of Staggered Contour Trenches (SCTs) leads to higher survival of 141plantation and reclamation of wastelands– R.R. Babu and Purnima Mishra
Study of the shifting cultivation scenario in Aizwal district, Mizoram using remote sensing techniques 149– S. N. Das and S. Saha
Challenges in managing agricultural knowledge 153– V.K. Bharti, Hans Raj, Suraj Bhan and Meetali Bharti
Development of Computer Aided Design Procedure for bench terraces 159– Akhilesh Kumar, P V Singh, Varun Tiwari and R K Tewari
NREGA: Science based perspective plan preparation and ex-ante impact assessment – 168A case study for Sitapur district of Uttar Pradesh– R.C. Sachan, K. Srinivas, P. Pathak, A.V.R. Kesava Rao and S.P. Wani

Pledge
J.S. Bali
I pledge to conserve Soil,
that sustains me.
I pledge to conserve Water,
that is vital for life.
I care for Plants and Animals and the Wildlife,
which sustain me.
I pledge to work for adaptation to,
and mitigation of Global Warming.
I pledge to remain devoted,
to the management of all Natural Resources,
With harmony between Ecology and Economics.

April-June 2013] INMS: A TOOL TO RETRIEVE SOIL HEALTH 93
Journal of Soil and Water Conservation 12(2): 93-100, April-June 2013ISSN: 022-457X
INMS: A tool to retrieve soil health
A.K. JHA1 and K.K. SINGH2
Received: 29 February 2012; Accepted: 30 May 2013
ABSTRACT
Over exploitation and degradation of soil resources in the quest of food security has made the soildeficient in macro as well as micro nutrients. On an all India basis 41% soil samples have been founddeficient in S, 47% in Zn, 35% in B, 13% in Fe, 7% in Mo and less than 5% in Cu and Mn. Percentageof nutrient deficient samples in India is increasing tremendously. It is due to avoidance of organicmatter incorporation in our soil during the post green revolution era. Organic sources of plantnutrients are important as they improve physical, chemical and biological health of soils. However,the chemical fertilizers are also an important input to obtain the high output from less fertile soilsbecause sudden replacement of chemical fertilizer by manures/ composts/ bio-fertilizers may causenoticeable yield decrease. Thus, an integrated nutrient management system (INMS) may prove auseful tool to achieve food security on sustainable soil health consideration.
Key words: INMS, food security, sustainable soil health, chemical fertilizers, organic sources ofplant nutrients
1Dept. of Soil Science & Agricultural Chemistry, B.A.C., Sabour-813210, Bhagalpur, Bihar2Directorate of seed, B.A.U., Sabour-813210, Bhagalpur, Bihar
INTRODUCTIONIndia has the onerous task of feeding almost 17
percent of the global human and 11 percent of thelivestock population on only 2.3 percent of theworld’s land. It is estimated that by 2025, Indiawould require 338 million tons of food grains tofeed it’s teeming millions population (Parama andBiswas 2009). This target has to be met under theconstraint of decreasing net cultivated area due toutilization of cultivated area for residential,transport and industrialization purposes andimpairing soil fertility. It has been estimated thatthe area of cultivated land in India will decrease to100 million hectare and human population willbecome 1.4 billion by 2025. To feed the everincreasing population from shrinking cultivatedland, it will be necessary to use 30-35 Mt of NPKfrom various sources. In addition, the experts onhorticulture, vegetable, plantation crops, sugarcane,cotton, oilseeds and potato have projected that bythe year 2025, the demand for fertilizers for thesehigh value crops, will rise to 3.0, 2.0, 0.9, 3.1, 1.5,and 1.0 million tonnes, respectively (Tiwari,
2008).This adds to the total nutrient needs byanother 14-15 million tonnes NPK. Thus, from bothinorganic and organic sources, the country willrequire to arrange for the supply of about 40-45million tonnes of nutrients by the year 2025.However, present consumption of NPK andproduction of N+P2O5+K20 in our country are only22.57 million tonnes Bhumbla (2010) and 16.42million tonnes FAI (2008) respectively.
As a result of over exploitation of the soilresource in post green revolution era, most of oursoils have become deficient in some secondary andmicro nutrient elements. The number of deficientnutrients in Indian soils continue to increase sharply(fig. 1). Not only this, but the physical, chemicaland biological properties of soils have also beenfound deteriorated (Rattan et al, 2009). Thus, thereis an urgent need of organic matter incorporationin soil to restore it’s health. Though, organic matterincorporation improves physical, chemical andbiological properties of soils, but it can’t be usedfor sudden replacement of chemical fertilizers.Thus, it should be integrated with chemical
3

94 JHA & SINGH et al. [Journal of Soil & Water Conservation 12(2)
fertilizers to assure food security without impairingour soil fertility.
Organic carbon vs. soil health
The quality and health of soils not onlydetermines agricultural sustainability but also theenvironmental quality and plant, animal and humanhealth (Sharma and Mandal, 2009). Organic carbonstatus of the soil is an important biological indicatorof soil health and its contribution on physical,chemical and biological properties in sustaining theproductivity is being appreciated since the dawn ofhuman civilization. It has been estimated that landuse change resulted in the transfer of 1 X 10⁸ - 2 X10⁸ Mt C/yr from terrestrial ecosystem to theatmosphere of which 15-17 percent carbon iscontributed by decomposition of soil organic carbon(Houghton and Hackler, 1994). Organic carbon inIndian soils was estimated at 23.4 X 10⁸ - 27.1 X 10⁸
Mt (Dhadhwal and Nayak, 1993). The amount ofsoil organic carbon in Indian soils under intensivecropping systems is relatively low, ranging from 0.1to 1% and typically less than 0.5% which influencesthe soil fertility and physical condition (Swarup andSingh, 2009). The organic carbon content of Indiansoils is decreeing very sharply and as a resultphysical, chemical and biological properties of soilsare deteriorating gradually due to unfavorable shiftof mineralization and immobilization. So, there is aneed to improve organic carbon status of the soil toassure the nutrient requirement of crops throughorganic or inorganic sources.
In general, four important chemical andbiochemical processes, often working simultaneously,
are involved in influencing the dynamics of nutrientsin soil system. These are: dissolution-precipitation,sorption-desorption, mineralization-immobilizationand oxidation-reduction and most of the dynamicbehavior of soil nutrients can be explained by one orcombination of these processes. These all processesare governed by organic carbon status of the soil.Thus, there is a need to apply organic matter incombination with inorganic fertilizers to sustainfertility and productivity of the soils.
Nutritional status of Indian soils
There is a definite gap between nutrient removaland supply leading to nutrient depletion from soils.There exists a gap of about 10 Mt between additionsof nutrients through fertilizers and their removalby crops in India (Tandon, 1997). As a result, thegrowth rates of production and productivity ofprincipal crops started showing stagnation or adeclining trend in the post green revolution era.Poor nutritional status of Indian soils due toimbalanced use of nutrient elements is one of theimportant factors responsible for this decliningtrend in crop yield. On an all India basis, out of36,50,004 soil samples, 63, 42 and 13 % samples werefound to be deficient in nitrogen, phosphorus andpotassium respectively (Table 1). However, it hasbeen reported by Subba Rao et. al.(2009) and Vasuki(2010) that out of 2,50,000 soil samples 40-41% soilsamples were deficient in S, 47% in Zn, 35% in B,13% in Fe, 7% in Mo and less than 5% for Cu andMn (Table 2). Zinc deficiency in soil is expected toincrease from 49% to 63% by the year 2025.Thissituation can possibly be restored by fullexploitation of the potential of alternative sourcesof plant nutrients (Tiwari, 2008). Complementaryuse of available renewable sources of organic andbiological sources of plant nutrients along withmineral fertilizers is of great importance for themaintenance of soil productivity, preferably in a
Fig. 1: Progressive increase in deficient nutrient elements inIndia (source; Rattan et.al, 2009)
Table 1. Extent of macronutrient deficiencies in India
Nutrient Number of Status of nutrient (%)
samples analyzed Low Medium High
N 36,50,004 63 26 11
P 36,50,004 42 38 20
K 36,50,004 13 37 50
S 27,000 40 35 25
Source: Singh, 2010
4
April-June 2013] INMS: A TOOL TO RETRIEVE SOIL HEALTH 95
balanced way (Singh, 2008). This integrated nutrientmanagement system (INMS) is the need of the dayand for future in agriculture for sustainable soilhealth and food security (Singh, 2001).
Integrated Nutrient Management System Concept
The basic concept underlying with INMS is themaintenance and adjustment of soil fertility to supplyan optimum level of plant nutrient through allpossible sources in an integrated manner. Theappropriate combination of mineral fertilizers,organic manures, crop residues, vermicompost orbio-fertilizers according to the system of land useand ecological/social and economic conditions isthe basic aim of INMS. The INMS involves a low tomedium external chemical inputs approach.
Although, INMS is an age old concept but itsimportance was not realized earlier. It has nowassumed a great importance because of the presentnegative nutrient balance (nutrient mining). The
INMS helps not only to restore and sustain the soilfertility and crop productivity, but also enables theemerging deficiency of nutrients other than N, P,and K. INMS favorably affects the physical, chemicaland biological environment of soils and increasesthe efficiencies of fertilizers.
Components of INMS
Different components of INMS are discussedbelow:
Fertilizers: Fertilizers are one of the most importantcomponents of INMS. The response of the major cropsto the applied fertilizers has been decreasing for thecountry as a whole and as a result fertilizerconsumption in India is increasing very sharply(Table 3). Fertilizer use efficiency is required to beimproved. The causes of low efficiency are as under:
Sub optimal and imbalanced use of fertilizers (NPK)Excessive use of fertilizer in some commercialand horticultural cropsInappropriate methods and time of fertilizerapplicationDeficiency of secondary and micronutrientsDeteriorating soil health.Poor water management systemFaulty plant protection and weed controlmeasures.Faulty agronomic practicesPoor organic carbon status of majority of the soils
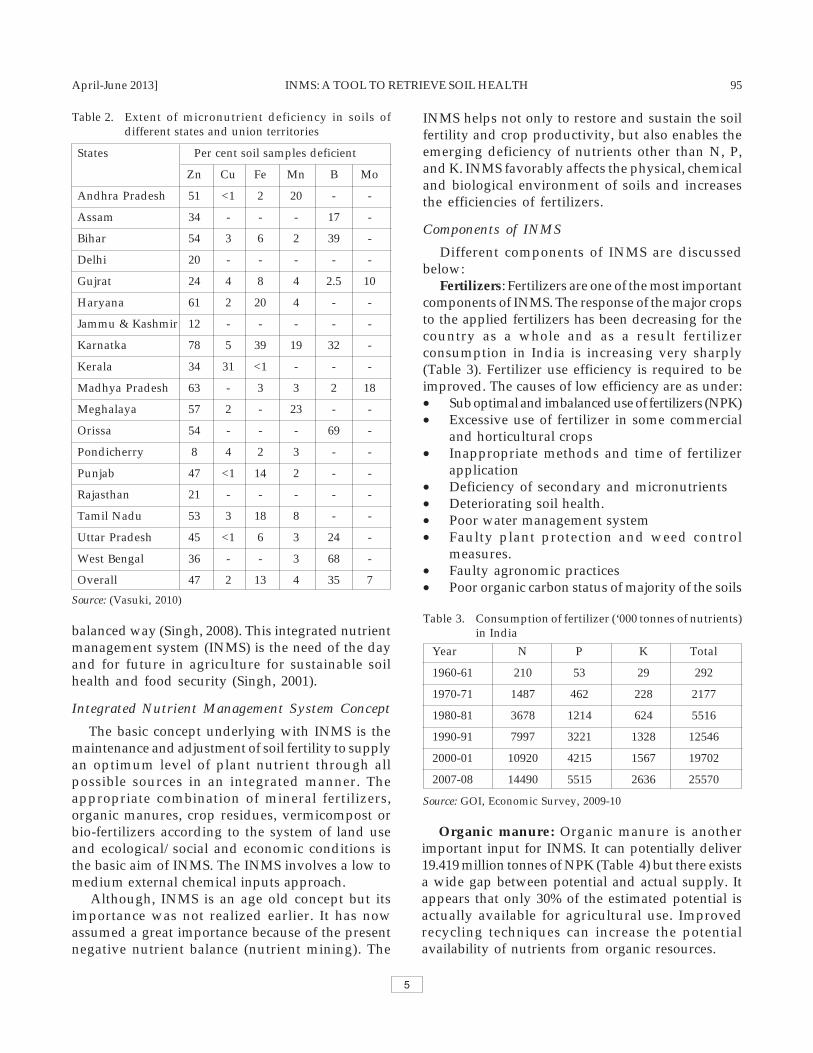
Table 2. Extent of micronutrient deficiency in soils ofdifferent states and union territories
States Per cent soil samples deficient
Zn Cu Fe Mn B Mo
Andhra Pradesh 51 <1 2 20 - -
Assam 34 - - - 17 -
Bihar 54 3 6 2 39 -
Delhi 20 - - - - -
Gujrat 24 4 8 4 2.5 10
Haryana 61 2 20 4 - -
Jammu & Kashmir 12 - - - - -
Karnatka 78 5 39 19 32 -
Kerala 34 31 <1 - - -
Madhya Pradesh 63 - 3 3 2 18
Meghalaya 57 2 - 23 - -
Orissa 54 - - - 69 -
Pondicherry 8 4 2 3 - -
Punjab 47 <1 14 2 - -
Rajasthan 21 - - - - -
Tamil Nadu 53 3 18 8 - -
Uttar Pradesh 45 <1 6 3 24 -
West Bengal 36 - - 3 68 -
Overall 47 2 13 4 35 7
Source: (Vasuki, 2010)
Organic manure: Organic manure is anotherimportant input for INMS. It can potentially deliver19.419 million tonnes of NPK (Table 4) but there existsa wide gap between potential and actual supply. Itappears that only 30% of the estimated potential isactually available for agricultural use. Improvedrecycling techniques can increase the potentialavailability of nutrients from organic resources.
Table 3. Consumption of fertilizer (‘000 tonnes of nutrients)in India
Year N P K Total
1960-61 210 53 29 292
1970-71 1487 462 228 2177
1980-81 3678 1214 624 5516
1990-91 7997 3221 1328 12546
2000-01 10920 4215 1567 19702
2007-08 14490 5515 2636 25570
Source: GOI, Economic Survey, 2009-10
5

96 JHA & SINGH et al. [Journal of Soil & Water Conservation 12(2)
The long term fertilizer experiments conductedat different locations in the country indicated thatthe plots receiving organic manure (FYM) along withNPK sustained the soil fertility and productivity. Incontrast, in the absence of FYM, application of even50 percent higher dose of recommended NPK couldnot hold on the initial rise in productivity (Nambiarand Ghosh, 1984). Additional response to organicmanures over NPK is attributed to correction of someother nutrient deficiencies and improvement of soilphysical properties. Even in short term studiesinvolving rice-wheat rotation, FYM (12t ha-1)
produced a residual effect equivalent to 30 kg eachof N and P2O5 ha-1 (Tiwari, 2008). The organicmanures used with fertilizers, besides improvingsoil physico- chemical properties also improved theuse efficiencies. Physical, chemical and biologicalproperties of soil also improved in long term fertilityexperiments due to application of INM in differentcropping systems (Table 5).
The crop residues with high C: N and C: P ratioscan not be directly applied to soil as a source ofnutrient. They have to be composted in order toconvert the nutrient contained there in to becomeplant usable forms. Technologies to upgrade thenutrient content of compost and also to hasten theprocess of composting by use of efficient cellulolyticand lignolytic cultures have been developed (Tiwariet al., 1989). The technologies for preparation ofenriched compost, vermicompost, enrichedvermicompost and biodynamic fertilizers in Indiahave been standardized. The main limitation in theway of composting is the consumption of 75% oftotal dung for domestic fuel purposes and wastageof livestock urine. However, wider adoptability ofINMS requires proper utilization of cattle dung andurine for composting.
Green manures/ Brown manures: Green manurehas long been known to be beneficial for sustainablecrop production. The studies in India indicate that
Table 4. Nutrient potentiality of various organic resources
Types of organic Availa- Total Nutrient(Mt/Year)
resources bility N P2O5 K2O Total
Crop residues 273 1.28 1.97 3.91 7.16
Cattle manure 280 2.81 2.00 2.07 6.88
Rural compost 285 1.43 0.86 1.42 3.71
Forest litter 19 0.10 0.04 0.10 0.24
City garbage 15 0.23 0.15 0.23 0.61
Press mud 03 0.03 0.079 0.055 0.164
Sewage 6351 0.32 0.14 0.19 0.65
Industrial waste 66 0.003 0.001 0.001 0.005
Total 6.203 5.20 7.976 19.419
Source: Bhardwaj, 1995; Tandon, 1997
Table 5. Effect of INMS on physical, chemical and biological properties of soils in long term fertility experiments
Location Treatment Soil Av.N Av. P Av. K Bulk Hydraulic Bacteria Fungi Actino-organic (Kg ha-1) (Kg ha-1) (Kg ha-1) Density conductivity (X 106g-1 (X 103 g-1 mycetes carbon (Mg m-3) (cm hr-1) soil) soil) (X 104 g-1
(g Kg-1) soil)
Ludhiana NPK 3.6 126 86 99 1.53 - - - -
NPK + FYM 5.2 132 99 114 1.49 - - - -
New Delhi NPK 4.4 - 35 287 1.48 0.69 - - -
NPK + FYM 5.5 - 41 316 1.41 0.76 - - -
Palampur NPK 9.7 317 103 156 1.17 - 11.5 7.8 20.3
NPK + FYM 13.0 335 194 215 1.13 - 28.0 2.8 7.3
Bangalore NPK 4.9 308 113 173 1.52 0.96 16.7 9.0 3.0
NPK + FYM 5.7 316 195 206 1.45 0.59 24.0 15.0 4.3
Jabalpur NPK 7.4 263 29 266 1.28 0.50 - - -
NPK + FYM 9.6 315 39 313 1.25 1.40 - - -
Pantnagar NPK 8.7 242 19 140 1.35 0.74 - - -
NPK + FYM 16.0 328 35 154 1.20 0.80 - - - -
Source: Singh, 2010
6

April-June 2013] INMS: A TOOL TO RETRIEVE SOIL HEALTH 97
the green manure is able to replace 60 KgN/ha(Tiwari et al., 2008). A fertilized green manure cropwould substitute more mineral fertilizer N than anunfertilized green manure crop. With the increasingcost of fertilizer and growing awareness of ecologicalimpact of using agro- chemicals, green manuring hasa special place in view of the limited availability ofother organic manures. Incorporation of summergreen gram into the soil after first picking also saved60 kg N ha-1 (Tiwari, 1980). Being deep rooted andleguminous, green manuring crops improve theavailability of other plant nutrients beside nitrogen.Physical properties of soil also improve due topractice of green manuring of Sesbania before ricecrop (Table 6).
Bio-fertilizer: Biological organism used as afertilizer is known as bio-fertilizer. Bio-fertilizers canbe grouped into nitrogen fixer, phosphate solubilizer,mycorrhiza and nutrient transformer but last one isneither produced nor utilized in India. However, allkind of nitrogen fixers (symbiotic, associative andfree living) are being utilized to fix substantialamount of nitrogen biologically (Table 7).
Rhizobium: Rhizobia, a soil bacteriam has anability to fix atmospheric nitrogen in symbioticassociation with legumes and certain non-legumeslike parasponia. Organic matter, temperature,sunlight, moisture and nutritional factors affect thenitrogen fixation abilities of rhizobial species andstrains. Rhizobium is host specific. The new systemof classification of root nodule bacteria and hostspecificity has been presented in Table 8. As nativerhizobial population is not sufficient in Indian soilsfor maximum N2- fixation, so legume seeds areinoculated with synthetic cultures adopting theprinciple of F.I.R. (Fungicide-Insecticide-Rhizobium).
Azospirillum/Azotobacter: Multilocational trialswith pearl millet, sorghum, finger millet, barley andvegetables have shown significantly increased yielddue to inoculation with Azospirillum and Azotobacter,the effects of inoculation being more conspicuous
under low levels of added nitrogen (SubbaRaoet al., 1982). Apart from nitrogen fixing ability,Azospirillum is known to produce auxins, cytokininsand gibberellins. Azospirillum and Azotobacter arealso applied through seed inoculation, seedlingtreatment, tuber treatment or soil application.
Blue green algae: Extensive field trialsconducted in many parts of India on the use of theblue green algae in rice fields indicated that onethird of the recommended N fertilizer could beconserved without affecting crop productivitythrough inoculation (Goyal, 1993). These algae areknown to provide the crop plant with many otheruseful organic substances like growth factors,vitamins etc. Normally, continuous inoculation for3-4 consecutive cropping seasons results in anappreciable population build up without any furtherinoculation unless some unfavorable ecologicalconditions supervene.
Azolla: Azolla is a tiny floating fresh water fernand is omnipresent in nature. The dorsal lobe ofAzolla has blue green algal symbiont (Anabalnaazollae) within a central cavity. The heterocyst of themicrosymbiont is the site of nitrogen fixation. Theincrease in yield of rice due to Azolla applicationhas been reported to be varying from 18-47 percentdepending on the cultivar of rice used (Singh, 1977).Further, field experiments have shown thatconsistent increase in yield of rice could be obtainedby the use of Azolla as a green manure in conjunctionwith fertilizer N (Tilak , 1998 ) . It has been estimatedthat a saving of at least 30Kg N/ha for rice could beobtained by the use of Azolla biofertilizer besideresidual effect for the succeeding crops.
Phosphate Solubilizers: Phosphate solubilizersinclude various bacterial, fungal and actinomycetes.They help to convert insoluble inorganic phosphateinto simple and soluble forms. Field experimentsconducted with phosphate solubilizers significantlyincreased the yield of various crops like wheat, rice,cowpea etc. In the presence of rock phosphate,
Table 6. Effect of green manuring of Sesbania on physical properties of soils
Reference Study duration Treatment Water stable aggregates (%) Bulk density
(Years) 0.25-0.1mm 0.5-0.25mm 0.5-1mm (Mg m-3)
Kumar et al. (1992) 6 - GM 6.3 7.5 8.0 1.54
+ GM 11.1 10.7 7.8 1.45
Boparai et al. (1992) 2 - GM 10.5 9.4 3.9 1.56
+ GM 17.3 12.8 4.6 1.50
7

98 JHA & SINGH et al. [Journal of Soil & Water Conservation 12(2)
inoculation of phosphate solubilizers saved 30kgP2O5 ha-1 (Gaur, 1985).
VAM Fungi: Vesicular arbuscular mycorrhiza(VAM) is the mutually beneficial association betweencertain fungi and the roots of higher plants.Mycorrhiza greatly enhance the ability of plants to
Table 7. Typical level of fixed-N in different systems
Crop/ plant Associated organism Fixed-N(kg N/ha/yr)
(A) Symbiotic Legumes
Medicago sativa (Alfalafa) Rhizobium 90-386
Trifolium pratense (Clover) Rhizobium 69-373
Pisum sativum (Pea) Rhizobium 17-244
Lupinus sp. (Lupin) Rhizobium 32-288
Lens esculenta (Lentil) Rhizobium 10-192
Vicia vilbosa (Vetch) Rhizobium 53-330
Vicia faba (Faba bean)) Rhizobium 53-330
Lupinus agustifolius(Lupin) Rhizobium 32-228
Cicer aritenum (Gram) Rhizobium 3-141
Phaseolus vulgaris (Bean) Rhizobium 0-125
Leucena leucocepnala Rhizobium 98-230
Vigna unguiculata (Cowpea) Bradyrhizobium 9-201
Vigna radiata (Green Gram) Bradyrhizobium 9-112
Vigna mungo (Black Gram) Bradyrhizobium 21-140
Arachis hypogea (Peanut) Bradyrhizobium 37-206
Glycin max (Soybean) Bradyrhizobium 0-450
Cajunus cajan (Pigeon pea) Bradyrhizobium 7-235
Pueraria (Kudzu) Bradyrhizobium 100-140
(B) Symbiotic non legumes
Alnus Frankia 50-150
Gunnera Not well defined 10-20
Casurina equisetfolia Frankia 9-440
Giricidia sepium Not well defined 86-309
Calopogonium/Peuraria spp Not well defined 150
(C) Non legumes (Non nodulated)
Pangola grass(Degetaria decumbans) Azospirillum 5-30
Bahai grass(Pasalum notatum) Azotobacter 5-30
Azolla BGA 150-300
(D) Free living
Hetrotrophic Microbes 0.1-0.5
Autotrophic Microbes 25.0
Source: Peoples et al., 1995; Marschner, 1986; Singh, 1989
take up phosphorus and other nutrients thatare relatively immobile and present in lowerconcentrations in the soil solution. Water uptakemay also be improved by mycorrhiza makingplants more resistant to drought, pests anddiseases.
8

April-June 2013] INMS: A TOOL TO RETRIEVE SOIL HEALTH 99
CONCLUSIONFertilizer is the most costly input used for crop
production. Demand of chemical fertilizers has beenincreasing tremendously over the years due to theintroduction of high nutrient responsive crops anddeclining fertility of the soil. Still, the gap betweenremoval and addition of nutrients through fertilizersis constant i.e. 10 million tones of nutrients perannum. The plant nutrient imbalance in quest ofincreasing food grain production target wouldfurther aggravate through over exploitation.
Balanced use of nutrient will not only improvecrop productivity but it reduce large scale depletionof soil nutrients .The entire nutrient needs of thecrops to take care of nutrient removal by crops cannot be met either through chemical fertilizers aloneor through organics alone. Integrated nutrientsupply and management based on soil test wouldbe the most practically viable technique which holdsthe key to sustain crop yield and quality of soilwithout adversely affecting the environment.Addition of organic sources can again increase theyield by increasing the soil productivity andfertilizer use efficiency. Thus sustainable agriculturein years to come should ideally be based onintegrated plant nutrient supply system. Locallyadopted INMS should be technically sound,environmentally friendly, economically reliable,socially acceptable and practically feasible and theseare yet to be developed on priority basis.
REFERENCESBaparai, B.S., Singh, Y. and Sharma, B.D. 1992. Effect of
green manuring with Sesbania acculeata onphysical properties of soil and growth of wheat in
Table 8. New system of classification of root nodule bacteria
Species Biovar Host
Rhizobium a. viciae Vicia
leguminosarm b. trifolii Trifolium
c. phaseoli Phaseolus
R . meliloti - Medicago
R . loti - Lotus
R . friedii - Glycine
Bradyrhizobium - GlycineJaponicum
Bradyrhizobium sp. - Cicer, Cajanus,Vigna
rice-wheat and maize- wheat cropping system insemiarid region of India. Arid Soil Res. Rehabil., 6:135-143.
Bharadwaj , K. K. R. 1995. Recycling crop residues, oilcakes and other plant products in agriculture. Pages9-30 in Tandan, HLS ed.Recycling of Crop, AnimalHuman and Industrial Wastes in Agriculture. Fertilizerdevelopment and consultation organization, NewDelhi.
Bhumbla, D.R. (2010) Role of fertilizers in food grainproduction. Journal of the Indian society of soilscience, 58 (supplement): 589-597.
Dhadhwal ,V. K. and Nayak , S. R. 1993. A preliminaryestimate of bio chemical cycle of carbon for India .Science and culture, 59: 9-13.
FAI (2008) Fertilizer statistics 2007-08: I45-I51.Gaur, A. C. 1985. Phosphate solubilizing micro
organisms and their role in plant growth and cropyield. Pages 125-138 in Proc. of Soil Biol. Symp.Hissar.
Goyal, S. K. 1993. Algal bio-fertilizer for vital soil andfree nitrogen. Pages 135-141 in Abrol, YP: Tilak, KVBR;Kumar, S and Katyal,JC ed. Nitrogen 59 (B) (3-4). IndianNatl. sci. Acad.,New Delhi.
Houghton , R .A . and Hackler 1994. The net flux of carbonfrom deforestation and degradation in south and southeast Asia . Pages 304-327 in Dale, V ed. Effects of LandUse Change on Atmospheric CO2 Concentration: South andSouth East Asia as a Case Study, Springer Verlag, NewYork.
Kumar, K. Meelu, O.P., Singh, Y. and Singh, B.1992. Effectof continuous application of organic manure on thephysical properties of soil in rice-wheat croppingsystem. Int. Rice Res. News I ,17 (4): 16-17.
Marschner, H. 1986. Nitrogen fixation. Pages 173-193 inMineral Nutrition of Higher Plants. Academic Press,London.
Nambiar, K. K. M. and Ghosh , A. B. 1984. Highlights ofresearch on long term fertilizerexperiments in India . Page-100 in Tech. Bull. Long –term Fertilizer project. IARI, New Delhi.
Parama, V.R.R.and Biswas, D.R 2009. Assesment , saferdisposal and utilization of Agricultural and industrialwastes. Journal of Indian Society of Soil Science,57(4):.502-512.
Peoples, M.B., Herridge, D.F. and Ladha, J.K. 1995.Biological nitrogen fixation: An efficient source ofnitrogen for sustainable agriculture production. Plantand Soil, 174: 3-28.
Rattan , R.K. , Patel , K.P. , Manjaiah , K.M and Datta , S.P.2009. Micronutrient in soil , plant, animal and humanhealth. Journal of Indian Society of Soil Science, 57(4): 546-558.
Roy, R.N. (1992) Integrated nutrient supply system.In Fertilizers, Organic Manures, Recyclable Waste andBiofertilize. FNCO, New Delhi.
9

100 JHA & SINGH et al. [Journal of Soil & Water Conservation 12(2)
Sharma, K.L. and Mandal, B. 2009. Soil quality and itsrelevance for sustainable agriculture. Journal of IndianSociety of Soil Science, 57(4): 572-586.
Singh, M.2010. Soil management in relation tosustainable food production. Journal of the IndianSociety of Soil Science, 58: S65-S72
Singh, A . K . 2008. Soil resource management –Key tofood and health security. Journal of the Indian Societyof Soil Science, 56(4): 348- 357.
Singh, M. V. 2001. Evaluation of current micronutrientstocks in different agro-ecological Zones of India forsustainable crop production. Fertilizer News, 46 (2): 25-42.
Singh, P.K. 1989. Use of Azolla in Asian agriculture. Appl.Agric Res., 4: 149-161.
Singh, P.K.1977. Effect of Azolla on the yield of paddy with andwithout application of fertilizer. Curr. Sci. 46: 642-644.
Subba Rao , A. , Muralidharudu , Y. , Lakaria , B.L. andsingh ,K.N. 2009. Soil testing and nutrientrecommendations. Journal of the Indian Society ofSoil Science, 57(4): 559-571.
Subba Rao, N.S., Tilak K.V.B.R. ,Singh, C.S. and Gautam,R.C.1982. Crop yield and nitrogen content of pearlmillet (Pennisetum americanum L.) in response toAzospirillum brasilense. Page 144 in Proc. Nationalsymp. Biol. Nitrogen fixation, IARI, New Delhi.
Swarup , A. and singh, M. 2009. Soil carbon dynamicsunder intensive cropping systems. Journal of the IndianSociety of Soil Science, 57(4): 469-476.
Tondon, H. L. S. 1997. Potential of organic resources asplant nutrients in India. Pages 101-107 in Mahajan, Aand Gupta, RD ed. Integrated Nutrient Management(INM) in Sustainable Rice – Wheat Cropping System.DCO, New Delhi.
Tilak, K.V.B.R. 1998. Azolla- Anabaena symbiosis. Pages53-55 in Bacterial Fertilizers, ICAR, New Delhi.
Tiwari, K.N. 2008.. Future plant nutrition research in India.Journal of the Indian Society of Soil Science, 56(4):327-336.
Tiwari, K. N., Pathak , A. N. and Ram, H. 1980. Greenmanuring in combination with fertilizer nitrogen onrice under double cropping system in an alluvial soil.Journal of the Indian Society of Soil Science, 38(2):162-169.
Tiwari, V.N., Pathak, A.N. and Lehri, K.K. 1989. Effect ofcattle dung and rock phosphate on composting of woolwaste. Biological Wastes, 27: 237-241.
Vasuki, N. 2010. Micronutrient management for enrichingcrop production-future strategy and requirement.Journal of the Indian Society of Soil Science, 58(1):32-36.
10

April-June 2013] EFFECTS OF RATES 101
Journal of Soil and Water Conservation 12(2): 101-103, April-June 2013ISSN: 022-457X
Effect of rates, methods, and schedules ofN application on growth, and yield in upland rice
under unfavourable environments
R.K. Tomar and R.N. Garg
Received: 24 October 2012; Accepted: 11 January 2013
ABSTRACT
A field study was conducted to find out the optimum time and application rates, methods andschedules of N fertilizers and characterize their effects on the growth, dry matter accumulation, yieldand its components and for improving its response in upland rice under rain fed ecosystem. Resultsrevealed that for achieving the highest grain productivity in rain fed upland environment, applicationof 40 kg N ha-1 applied in two equal splits at 20 and 40 DAS and 2% urea spray at 2 weeks afterflowering while for highest productivity of straw ,60 kg N ha-1 applied in two equal splits at 20 and40 DAS and 4% urea spray at 1 week after flowering is essential.
Key words: fertilizers, productivity, flowering and DAS
1 Division of Agricultural Physics, Indian Agricultural Research Institute, New Delhi-110012 .
INTRODUCTIONTypical upland soils of Eastern India is generally
deficient in nitrogen & phosphorus and there istoxicity of Al and Mn. Traditional rice cultivars werenon-responsive to chemical fertilizers but with thedevelopment of fertilizer responsive cultivars, it isessential to determine the rates, methods andschedules of N fertilization for achieving higher useefficiency or response (Newton et al., 2001) due toleaching, denitrification, volatilization and run offlosses. For upland rice, the recommended rates ofN varies from 40-60 kg ha-1 (Kumar et al., 2002)which should be applied in 2-3 equal splits atsowing, flowering and panicle initiation forachieving higher use efficiency (Singh and Modgal,1979). But in the event of severe water deficit whensoil becomes too dry then it becomes impossibleto apply nitrogenous fertilizer by top dressingdueto higher dentrification/ voltalization losses. Undersuch situations, nitrogenous fertilizers solution canbe sprayed (Singh and Modgal, 1979) whichresulted in higher yield due to direct absorption ofN by the leaves. In view of the above, a fieldstudy was conducted to find out the optimum timeand application rates, methods and schedules of N
fertilizers and characterize their effects on thegrowth, dry matter accumulation, yield and itscomponents and for improving its response inupland rice under rain fed ecosystem.
Field study was conducted at Central Rain fedUpland Rice Research Station, Hazaribag,Jharkhand during kharif season with promisingupland rice (cv. Kalinga III) as test crop with twolevels of nitrogen viz., 40 and 60 kg ha-1, twoconcentrations of urea spray (2 and 4 %) and twotimings of spray (1 and 2 week after flowering-WAF). Eleven treatment combinations viz., T1- N0(control), T2- 40 kg N ha-1, T3-60 kg N ha-1, T4: T2+2 % urea spray 1 WAF, T5 : T2+ 2 % urea spray 2WAF, T6 : T2+ 4 % urea spray 1 WAF, T7 : T2+ 4 %urea spray 2 WAF , T8 : T3+ 2 % urea spray 1 WAF,T9 : T3+ 2 % urea spray 2 WAF , T10: T3+ 4 % ureaspray 1 WAF and T11: T3+ 4 % urea spray 2 WAFwere tested in RBD replicated thrice. The soilbelongs to Alfisol order having the characteristics:sand-32.1%, silt-46.6% and clay-21.3%, pH-5.8, OC-0.36%, CEC-14 meq/100g, total N-0.04%, availableP-5.5 ppm, and K-129 ppm, rolling topography andvery sloppy. Total long-term average rain fall ofthe study area is 1298.5 mm. However, during the
11

102 TOMAR et al. [Journal of Soil & Water Conservation 12(2)
crop growing season, a total 926.6 mm rain fallwas received. Crop was sown @ 100 kg ha-1 (directseeding) in 20 cm row spacing. Recommended doseof fertilizers P2O5:K2O-30:20 kg ha-1 was appliedas basal . Half of N was applied at 20 DAS (afterfirst hand weeding) and ½ at 40 DAS. Periodicdata on plant height was recorded during thegrowing season for studying the growth profile ofthe crop. Representative plant samples usingdestructive method were collected from 50 cm rowlength during crop growing seasons to compute drymatter accumulation. Nitrogen response expressedas agronomic nitrogen use efficiency (ANUE) wascomputed by dividing the increase in grain yieldover control by the amount of nitrogen applied inthe crop. Yield and its components were recordedand analyzed statistically .
Crop growth expressed as plant height and totaldry matter accumulation was appreciably affectedby rates, methods as well as application scheduleof N (Table 1) in upland condition. Among varioustreatments, the differential rates of increase in plantheight was recorded during the growing season(22 to 81 DAS). At any stage, tallest plants werefound in T10 ( 30.0 cm on 22 DAS and 101.4 cm on81 DAS) and shortest in T1 (25.1 cm on 22 DASand 86.0 cm on 81 DAS). Maximum percent increasein plant height in most of the treatments, except inT2 ,T3 and T6, was found on 39 DAS (24.4% in T7to 34.5% in T10) but in T2 ,T3 and T6 it was foundon 53 DAS (T2-14.5% and T6-18.2%) compared tocontrol. A gradual decline in percent increase inheight was observed between 53 to 81 DAS, which
reflects the growth profile of each treatment.Similarly, highest dry matter accumulation wasfound in T10 during the growing season (5.6 g on22 DAS and 53.4 g on 81 DAS ) and the lowest incontrol T1 (3.3 g on 22 DAS and 26.8 g on 81 DAS).In all the treatments, except in T3 and T6, maximumincrease in dry matter accumulation (45.5% in T7and 119.7% in T10 ) was observed on 39 DAS whilein T2,T3 and T6, it was observed on 22 DAS. On 53DAS, it declined gradually in all the treatments.But, a differential rate of increase and decrease indry matter accumulation was observed on 67 and81 DAS indicating the variable impacts oftreatments on dry matter accumulation. This reflectsthat 39 DAS is the most active stage of growth inupland rice expressed in terms of plant height anddry matter accumulation which might be due tomaximum physiological and biochemical activitieslike cell division and elongation in the plants.
Yield components viz., panicle length, grains/panicle, total and effective tillers, 1000-grainand panicle weight, of rice under rain fedenvironment were considerably affected by Nfertilization (Table 2). Maximum panicle length wasfound in T1 (19.7 cm) which was 5.9% higher thanthe control - T1(18.6 cm). Highest number of grains/panicle was obtained in T11 (74) which were 21.3%higher than the control (T1)(61). The percentincrease was 9.8 and 16.4%, in T2 and T3,respectively . Maximum total tillers were found inT11 (467) which were 26.2% higher than the control(370). The percent increases in T2 and T3 was 16.5and 22.7 % , respectively. Similarly effective tillers
Table 1. Effect of N fertilization on plant height and dry matter accumulation in rain fed upland rice
Treat- Plant height (cm) Total dry matter (g)ments 22 39 53 67 81 22 39 53 67 81T1 25.1 40.6 61.4 83.5 86.0 3.3 6.6 13.6 20.8 26.8
T2 25.7 43.1 70.3 86.0 86.5 3.9 7.4 15.7 21.5 30.3
T3 26.0 45.2 70.3 87.9 91.2 4.4 7.9 16.2 22.1 33.0
T4 26.5 52.0 74.3 93.4 98.1 4.7 10.2 17.3 26.5 35.2
T5 26.6 52.1 75.2 94.4 98.1 4.8 10.8 17.6 32.2 38.6
T6 26.1 46.9 72.6 91.9 94.4 4.5 8.4 17.0 22.4 33.7
T7 26.4 50.5 73.0 93.1 96.6 4.6 9.6 17.1 23.7 34.4
T8 27.0 52.8 75.4 94.8 98.4 5.4 12.0 18.3 34.3 44.5
T9 28.9 54.3 75.8 95.4 99.4 5.5 13.6 18.4 34.4 50.3
T10 30.0 54.6 78.0 98.3 101.4 5.6 14.5 22.8 38.5 53.4
T11 27.0 52.6 75.4 94.6 98.4 5.2 10.9 18.0 34.3 38.7
12

April-June 2013] EFFECTS OF RATES 103
Table 2. Effect of N fertilization on ANUE, yield and yield components of rain fed upland rice
Treatments Grain Straw ANUEkg Panicle Grains Total Effective 1000-grain Panicleyield yield grain/kg length /panicle tillers tillers weight weight
(t ha-1) (t ha-1) N applied (cm) (m-2) (m-2) (g) (g)T1 1.74 1.89 - 18.6 61 370 346 21.8 1.35
T2 2.20 2.41 11.5 19.2 67 431 413 23.1 1.56
T3 2.25 2.54 8.5 19.5 71 454 436 23.4 1.60
T4 2.39 2.79 14.3 19.3 68 437 416 23.2 1.45
T5 2.41 2.86 14.7 19.3 69 439 418 23.3 1.46
T6 2.31 2.71 11.2 19.4 69 440 421 23.6 1.42
T7 2.31 2.76 11.2 19.4 70 442 426 23.9 1.43
T8 2.46 2.96 11.0 19.5 73 460 441 23.5 1.43
T9 2.58 2.97 12.8 19.5 73 462 445 23.7 1.44
T10 2.09 2.98 4.9 19.6 74 465 449 23.8 1.41
T11 2.34 2.95 8.6 19.7 74 467 451 24.0 1.42
SEM± 0.16 0.17C.D.(5%) 0.33 0.37
were also highest in T11 (451) which were 30.3%higher than control (T1)(346). Minimum percentincrease was found in T2 (19.4%). Highest 1000-grainweight was found in T11 (24.0 g) which was 10.1%higher than the control (T1)(21.8 g) and minimumpercent increase was 6.0% in T2. Highest panicleweight was recorded in T3 (1.6 g) which was 18.5% more than the control (T1) (1.35 g) and minimumincrease in panicle weight was found in T10 (4.4%).
Agronomic nitrogen use efficiency wassubstantially affected by N fertilization (Table 2).Highest ANUE was obtained in T5 ( 14.7 kg grain/kg N applied) which was 200% higher than T10.Almost, similar ANUE was found in T11 (8.6 kggrain /kg N applied) and T3 (8.5 kg grain /kg Napplied) which was 75.5 and 73.5% higher in T11and T3, respectively than T10. Same ANUE wasrecorded in T6 and T7 (11.2 kg grain /kg N applied)which was 128.6% higher than T10. The values forother treatments falls in between.
Nitrogen management in upland rice hassignificantly influenced the rice productivity (Table2). Highest grain yield was recorded in T9 ( 2.58 tha-1) which was at par with T8, T5, T4, T11, T7, T6and T3 but significantly higher than othertreatments (T2 and T10) including the control T1(1.74 t ha-1). Maximum percent increase in grainyield was found in T9 (48.3%) and the minimum inT10 (20.1%) over control (T1). On the other hand,maximum straw yield was recorded in T10 (2.98 tha-1) which was at par with T9, T8, T11, T5, T4, T7
and T6 but significantly higher than T3, T2 andcontrol (T1). The percent increase in straw yield ofother treatments was 57.1% in T9, 56.6% in T8,56.1% in T11, 51.3% in T5, 47.6% in T4, 46.0 % inT7, 43.4% in T6, and 34.4% in T3. This indicatesthat there was more diversion of photosynthatestowards dry matter accumulation in T10 while inT9 there was more diversion of photosynthates forgrain formation.
It can be concluded that for achieving the highestgrain productivity in rain fed upland environment,application of 40 kg N ha-1 applied in two equalsplits at 20 and 40 DAS and 2% urea spray at 2weeks after flowering while for highestproductivity of straw ,60 kg N ha-1 applied in twoequal splits at 20 and 40 DAS and 4% urea sprayat 1 week after flowering is essential.
REFERENCESSingh, B.K. and Modgal, S.C. 1979. Pattern of dry-matter
accumulation and nitrogen concentration anduptake as influenced by levels and methods ofnitrogen applications in rain fed upland rice. Plantand Soil 52, 9-17.
Kumar, A., Prasad, N.K. and Kumar, A. 2002. Nutrientharvest and soil fertility as influenced by nutrientmanagement in rice (Oryza sativa)-forage cropsequences. Indian J. Agron., 47(2): 158-162.
Newton, P.J. 2001. Effect of long-term stubblemanagement on yield and nitrogen-uptake efficiencyof wheat top dressed with urea in north-easternVictoria. Australian J. Expt. Agric., 41(8) : 1167-1178.
13

104 PAIN et al. [Journal of Soil & Water Conservation 12(2)
Journal of Soil and Water Conservation 12(2):104-107, April-June 2013ISSN: 022-457X
Efficient use of geotextiles as soil conditioner to increasepotato productivity on inceptisol of West Bengal
DEBABRATA PAIN, SUSANTA KUMAR DE, P. K. TARAFDA, ARUNABHA PAL,ANGIRA PRASAD MAHATA, RAHUL ADHIKARI and SANJIB KUMAR BAURI
Received: 24 November 2012; Accepted: 20 April 2013
ABSTRACT
A field experiment was conducted at the University farm of Regional Research Station, New Alluvialzone of Bidhan Chandra Krishi Viswavidyalaya, Gayespur under Nadia district of West Bengal toinvestigate the effect of various geotextile on change of soil properties including yield and size of thetubers. Four treatment combinations viz. T1 – farmers practices (control), T2 – non oven jute geotextile,T3- non oven coco coir geotextile, T4 – vetiver root geotextile ware applied @ 5 ton/ ha for each of thegeotextile along with the levels of N-P-K at 100- 75- 75 kg/ ha and replicated thrice. Yield of potatotuber responded by jute, coco coir and vetiver were 68, 86, and 89.5% respectively. Application ofgeotextile reduce the number of small size tuber by an average 40% and increased sharply themedium and large sized tubers 26 and 34% respectively favoring better yield of tubers in treatedplots. These also improved moisture use efficiency, in general, by 81.5% over control. Decreasingbulk density with simultaneous increasing of porosity under each treatment also improved themoisture retention capacity in soil. Better aggregation and their stabilization occurred with appliedtreatments. Results under vetiver root geotextiles were found most effective in all the above respectsfollowed by jute and coco coir geotextiles.Key words: Geotextile, Bulk Density, Porosity and Moisture use efficiency.
Department of Soil and Water Conservation, Bidhan Chandra Krishi Viswavidyalaya, Mohanpur-741252, Nadia, West Bengal,E-mail –[email protected]
INTRODUCTIONPotato (Solanum tuberossum L.) is the world’s
fourth important food crop after wheat, rice andmaize because of its great yield potential and highnutritive value which constitutes nearly half of theworld annual output of all root and tuber crops.With an annual global production of about 328.87million tons over an area of about 19.13 mha,potatoes are grown in about 150 countries and morethan a billion of people worldwide consume potatoas staple food. Although India ranks 3rd , coveringan area of 1.75 mha of potato cultivation andbecomes the 3rd largest country in the world withits production of 34 million tones, but it have thelowest per capita consumption (14.8 kg/head/year)in the world hardly where 1% of the potatoes areprocessed (Anonymous 2010). The region of Indo-Gangetic plains in the country covers 90% potato
cultivation of which the state of West Bengaloccupies 3rd rank in terms of area and production.However, the productivity of the crop graduallydecreases due to declining soil fertility status andinadequate availabilities of water and non-availability of good quality of seeds. Naturallyoccurring geotextile are ecofriendly andbiodegradable products which act as surface covermaterials and useful ameliorative to eliminate soilrelated constraints to crop production (Yong et al.2000). It also helps to protect the most vital naturalresources against various degradation processesand promotes vegetation cover through acceleratedseed germination and seedling emergence(Bhattacharya et al. 2010). Adequate information onthe efficiencies of geotextiles as soil conditionerstowards improving crop productivity are lacking.Viewed the above consideration, the present study
14

April-June 2013] EFFICIENT USE OF GEOTEXTILES 105
was undertaken to compare the efficiencies ofgeotextiles of different nature on soil qualitychanges and improvement of tuber yield of potatocrops.
MATERIALS AND METHODSThe present investigation has been carried out
at the university farm of Regional Research Station,New Alluvial Zone, Bidhan Chandra KrishiViswavidyalaya, Gayeshpur, Nadia District, WestBengal represented by sub-tropical climatic region.The area lies between 21051/N latitude and 86022/
E longitude with an altitude of 10 m above MSLhaving average rainfall of 1500 to 1600 mm/yearwith variation of temperature between 100 to 380 C.The soils of the area are characterized as acidic innature, low in organic carbon and medium fertilitystatus. The experiment was conducted withfollowing treatments:
T1 : farmer’s practice (control), NPK @ 200-150-150 kg/ha
T2 : nonwoven jute fiber geotextiles, 5 tons+NPK @ 100-75-75 kg/ha
T3 : nonwoven coco coir fiber geotextiles, 5 tons+NPK @ 100-75-75 kg/ha
T4 : nonwoven vetiver root geotextiles, 5 tons+NPK @ 100-75-75 kg/ha
The above treatments were replicated thrice inRBD design with growing potato (var-KufriChandra Mukhi) as test crop were grown on 1st
week of November consecutively for 2005-06 to2008-09. The area of each plots were maintained by20 sq.m with spacing of 50 cm between row to rowand 20 cm between plants to plants. Therecommended packages of practices were adoptedfor growing of the crop. Each year crops wereharvested in 1st week of February, tubers of thecrop were graded into different sizes and the yieldsof tuber from each plot were recorded. Surface soilsamples from each plot were collected for theanalysis of relevant physical and chemical propertiesin soil. Bulk density and porosity in soil weredetermined by the normal procedure as describedby Black (1965). Soil moisture contents of surfacelayer at 7 days interval from each plot duringseedling emergence to harvesting were determinedby Theta Probe Moisture Meter. The sizedistribution of aggregates in soil like mean weightdiameter, geometric mean diameter representingstructural indices, structural coefficients and
aggregate stability percentage were evaluated bythe methods as proposed by Piper (1966). The pH,organic carbon, availabilities of phosphorous andpotassium were determined by the standardprocedure of Jackson (1965). Cost benefit ratios wascalculated by the ratio of total economic return (Rs)and total cost (Rs). Moisture use efficiency wascalculated by the relationship as: MUE (Kg/mm/ha) = Total tuber yield (kg/ha)/Consumptive useof water (mm). Necessary stastical analysis wasworked out to interpret the effects of treatmentsas suggested by Gomez and Gomez (1984).
RESULTS AND DISCUSSION
Size and yields of potato tubers
The results of effects of various kinds ofgeotextiles on yields of potato tubers presented inTable 1 showed that irrespective of the nature ofgeotextiles the yields of potato tubers increasedover control. The response of tuber yield in eachtreatment were increased by 97.5, 122.5 127.5 q/harespectively for jute, coco-coir and vetiver root withcorresponding values of 68%, 86%and 89.5%. Theyield and its response over control were maximumin the treatments of vetiver root geotextiles thanall other treatments. The results of size distributionof potato tubers also showed that in control plotsthe tubers yields were mostly constituted withsmall sized grades having 60% distribution withthese whereas the medium and large sized tuberswere constituted with remaining 40% with equaldistribution of each of around 20%. Highestdistribution of small sized tubers in control plotsreflected the lowest tuber yield. Application ofgeotextiles dropped the distribution of small sizedtubers by an average of 40% and increased sharplythe medium and large sized tubers 26 and 34%respectively and an average of 20% due to appliedtreatments over control which directed toquantitative increase in yields of potato tubers inthese treatments. The results thus revealed that theincrease of tuber yield were associated withenlargement of tuber size and better utilization ofsoil moisture favored by the geotextiles treatments.The benefit cost ratio of potato crop under thetreatments also showed similar results themaximum of which found under vetiver roottreatments. The above results find supported byPaza (2007).
15

106 PAIN et al. [Journal of Soil & Water Conservation 12(2)
Physical and chemical properties of soil
The results of the effects of various geotextileson the changes of physical and chemical propertiesof soil are presented in Table 2. Bulk density of soilwere decreased by 4.5%, 3.7% and 6.0% withsimultaneous increased of porosity by 13.6%, 11.7%and 19.1% respectively by jute, coco-coir and vetiverroot geotextiles over control. The vetiver rootgeotextiles were found more effective in thisrespect. The results further indicated thatsignificantly increased availability of phosphorousand potassium. The results also reveal that increasedof organic carbon by 100%, 95.9% and 124.5%,respectively by jute fiber, coco-coir and vetivergeotextiles over control. Similar to the effects ofyields vetiver root geotextiles also showedprominence towards increasing fertility in soil. The
above results also supported by Dutta andChaktaborty (1995).
Soil moisture use efficiencies
Soil moisture changes at 7 days interval for theenter growing period of potato under variousgeotextiles have been depictured in figure 1. Soilmoisture content at every stage was higher undereach of the treatment over control. It was foundmaximum under vetiver root geotextiles than othertreatments. Results followed the following orderof soil moisture contents: vetiver geotextile > jutegeotextile > coco coir geotextile > control. Thechanges of soil moisture content due to thetreatment might be attributed by bulk density andporosity in soil towards increasing moistureretention capacity in soil. The data further showedthat the moisture use efficiencies of the crop,generally, increased by 81.5% due to the treatmentsof geotextiles over control, the highest 89.6% ofwhich occurred under vetiver root geotextiles (table1). The above results supported by Nag et al. (2008).
Soil aggregation
Results of the effect of various geotextile on thechanges of various indices of soil structure and theirstabilization were presented in table 3. Resultsclearly revealed much variation of all the indices ofsoil structure and their stability due to applicationvarious treatment. The values of mean weightdiameter (MWD), geometric mean diameter (GMD),structural coefficient (SC) and water stableaggregates (WSP) were found highest under vetiverroot followed by coco coir and jute geotextiles.These indicated that vetiver root geotextile couldbe effective ameliorative towards improvingstability soil structure. The above results alsosupported by Smets and Poesen (2009).
Fig. 1. Changes of soil moisture at 7 days interval asinfluenced by various geo textiles
Table 1. Effect of different geotextile management practices on potato tuber yield, MUE and BC ratio.
Treatments Percentage of tuber Yield Moisture use Costbenefit (kg/ha) efficiency ratio (B:C)
A (>100gm) B (50-100 gm) C (<50 gm) (kg/ha/mm)
( T1) Control (farmers practices) 19 21 60 142.5 35.6 1.2:1
(T2 ) Non woven jute fibre geo textile 35 24 41 240.0 60.0 2:1
(T3) Non woven coco coir geo textile 35 25 40 265.0 66.3 2.2:1
(T4) Non woven vetiver root geo textile 32 29 39 270.0 67.5 2.3:1
SE(m)+ 0.799 0.645 0.764 1.236 3.232
CD(0.05) 2.766 2.234 2.643 4.277 11.183
16

April-June 2013] EFFICIENT USE OF GEOTEXTILES 107
CONCLUSIONGeotextiles of various natures due to its effects
as surface cover materials have potentials formaintaining soil quality and protecting the soilagainst any form of degradation. Efficiencies ofdifferent kinds of geotextiles on the improvementsof soil properties attributing yield and quality ofpotato tubers have been investigated in the presentstudy. Each of the geotextiles increased the size ofpotato tubers leading to its higher yield associatedwith much increase of organic carbon andavailability of phosphorous and potassium. Sharpimprovements of bulk density, porosity, moistureuse efficiency as well as better aggregation and wellstabilization of soil aggregates occurred due toapplication of each geotextiles, of which vetiver rootshowed most prominent effect in all such respect.The result thus lead to suggest that vetiver rootgeotextiles could be effectively utilized for makingfavorable soil structure along with other soilproperties towards development of larger sizetubers and better utilization soil moisturefacilitating in yield and quality of potato tubers.
REFERENCESAnonymous. 2010. Directorate of Economics and
Statistics, Krishibhavan, New Delhi - HorticultureDivision, Ministry of Agriculture, Govt. of India.
Treatments Bulk Porosity pH Organic Total Available AvailableDensity (%) (1:2) Carbon Nitrogen P(kg/ha) K(kg/ha)
(mg/m3) (%) (%)
( T1) Control (farmers practices) 1.34 41.8 6.3 0.49 0.06 16.9 152
(T2 ) Non woven jute fibre geo textile 1.28 47.5 6.7 o.98 0.19 26.6 219
(T3) Non woven coco coir geo textile 1.29 46.7 6.7 0.96 0.14 24.9 306
(T4) Non woven vetiver root geo textile 1.26 49.8 6.8 1.10 0.16 29.7 230
SE(m)+ 0.005 0.389 o.082 0.032 0.006 0.497 2.646
CD(0.05) 0.017 1.346 0.283 0.111 0.020 1.721 9.156
Table 2. Effect of different geotextile management practices on soil physical and chemical properties
Black C A. 1965. Method of soil analysis. A M. SOC.Agron., Inc., publisher, Madison, Wisconsin, USA
Bhattacharyya R, Davies K, Fullen M A, Booth C A. 2010.Soil conservation using palm- mat geotextiles onloamy sand soils in the United Kingdom.
Gomez K A and Gomez A A. 1984. Statistical Proceduresfor Agricultural Research, 2 nd ed. Wiley, New York.
Dutta T and Chakraborty T. 1995. Effect of organicmanures and subabul leaf mulching under varyinglevels of fertility on growth and yield of potato andweed biomass. Indian J of Agron. 40 (1): 140-142
Jackson M L. 1967. Soil chemical analysis. PrenticeHall of India Pvt.Ltd. New Delhi, India.
Nag D, Choudhury T K, Debnath S, Ganguli P K andGhosh S K. 2008. Efficient management of soilmoisture with jute non-woven as mulch forcultivation of sweet lime and turmeric in red lateriticzone. J of Agr Eng, New Delhi. 45 (3): 59-62
Paza A. 2007. The fertilization of potato with cash cropsand straw. Framenta Agronomical 24 (40): 100-105.
Piper C S. 1966. Soil plant analysis. Asian Report, Hans,Puplisher, Bombay, India.
Smets T and poesen J. 2009. Impacts of soil tilth on theeffectiveness of biological geotextile in reducingrunoff and interrril erosion. Soil and Tillage Res.103(2); 356-363.
Yong L H, ZaiQin W, DingXing P and GuoSheng L.2000. Study on the effect of jute geotextile on rimegrowth. J of Scientia Agricultura Sinica 33 (3): 103-105.
Treatments Mean Weight Structure Geometric Mean WSA WSADiameter (mm) Coefficient Diameter (mm) >0.25 (%) <0.25 (%)
( T1) Control (farmers practices) 0.706 0.514 0.426 58.47 41.53(T2 ) Non woven jute fibre geo textile 1.568 0.769 0.698 78.56 21.44
(T3) Non woven coco coir geo textile 1.872 0.861 0.705 81.99 18.01
(T4) Non woven vetiver root geo textile 2.979 0.912 0.868 82.38 17.62
SE(m)+ 0.03 0.01 0.03 0.99 0.99
CD(0.05) 0.10 0.03 0.12 3.43 3.43
Table 3. Effect of different geotextile management practices on soil structure and their stabilization.
17

108 SEKAR et al. [Journal of Soil & Water Conservation 12(2)
Journal of Soil and Water Conservation 12(2): 108-116, April-June 2013ISSN: 022-457X
Irrigation water use and availability in India:changing growth trends and implications
I. SEKAR*
Received: 28 February 2013; Accepted: 16 June 2013
ABSTRACT
Per capita availability of water resources in India more particularly irrigation water availability is onthe decline vis-à-vis an increase in the annual irrigation water requirement, which may have anadverse impact on the food security. Importance given to irrigation sector during five year plans andefforts made for irrigation development as well as favourable policy with respect to irrigationinvestment has helped a great deal in making stupendous achievements in agricultural production.Minor irrigation system, the tubewell technology has been given so much importance that it has ledto mushrooming of tubewells in the country. However, excessive extraction of groundwater raisessustainability issues in various regions across the country and many blocks in the north west belt ofthe Indo-Gangetic Plains are already designated as over exploited zones and hence may have a denton agriculture production, more specifically, on the production of food grain crops on which foodsecurity largely depends. Strenuous efforts are therefore required to reverse the trend, while thecurrent trend being decline in area under surface water sources and increase in area irrigated bygroundwater sources. It is important to encourage conjunctive use of water, which can be practicedwith the help of further water augmentation and potential creation from surface water sources.Revival of age old tank irrigation system and proper maintenance and monitoring of canal irrigationsystem can promote conjunctive use of water. Increase in groundwater recharge through rain waterharvesting and adoption of water-saving irrigation technologies will be useful for matching supplyand demand of irrigation water and helpful in achieving the sustainable food production in thecountry. In the face of achieving the 4 per cent growth in agriculture, irrigation sector needs to beaccorded higher emphasis in the context of declining water table conditions and changing climatescenario. While aiming at achieving inclusive growth in agriculture, it is important to reorient theirrigation policy in favour of marginal farmers because of their lion’s share in cultivation.
Key words: Water availability, growth trends, irrigated agriculture, groundwater development,source of irrigation, implications
*Principal Scientist, Division of Agricultural Economics, IARI, Pusa, New Delhi- 110012, India.; E-mail: [email protected]
INTRODUCTIONIrrigation water is one of the critical inputs for
agricultural production. In the beginning of fiveyear plan periods, priority has been in favor ofsurface irrigation development. However of late,due to the inherent weaknesses in surface waterirrigation system and conflicts on distribution anduse of surface water both at micro and macro level,groundwater development has taken a rapid pace.As a result, over a period of three decades surfacewater irrigated area particularly tank irrigation hasdeclined while ground water use registered
prominence in agriculture. Favorable policies onenergy and credit facilitated farmers’ access to thetechnology for enhancing crop productivity.
Groundwater plays a supplementing andstabilizing role when surface water suppliesfluctuate both within and between years. Thoughit facilitates increasing farm production,mushrooming of tubewells with excessiveextraction of ground water threatens sustainabilityof fresh water resources. Command and controlapproach to regulate groundwater would not workin a democratic set up as in India, where market-
18

April-June 2013] IRRIGATION WATER USE 109
based economic instruments can play a pivotal rolein managing this precious water resource moreefficiently and equitably. Small farmers may be thebeneficiaries because they are unable to makeinvestments in tube-well installation. Generally,the possession of tube-wells is highly skewed infavour of large farmers. Though ground watermarket is functioning informally in many places,emergence of formal groundwater market is stillat nascent stage in India. Such a market can benefitboth the buyers and sellers of water and the smalland marginal farmers can have access to irrigationwater without making huge initial investment. It isan informal institutional arrangement in whichprivate tube-well owners sell surplus irrigationwater to the neighbors who don’t own wells.However, the flip side is that sellers can exercisemonopoly in charging and supplying water to non-owners of tube wells. In such cases, buyers can beexploited and become the losers. While discussingthe ground water transaction and development inIndia, overall trends in irrigation development,availability and future demand for water is alsodiscussed in this paper.
Water availability and demand
Water is becoming scarce and per capitaavailability of water resources is declining due torapid population growth, economic developmentand urbanization. According to the irrigation census2001, per capita availability of water resources wasaround 1900 cu.m in 2001 while it was 2300 cu.m adecade ago (Figure 1). It is going to further declinewhen the estimates are made on the basis ofpopulation projections assuming the availability ofwater shall not change in future. Based on theseprojections, per capita availability of surface water
would be around 1400 cu.m and 1200 cu.m by 2025and 2050, respectively.
The utilizable surface water availability will bestill less than the total and it would also follow thesame declining trend. While the per capitaavailability of water is declining, water requirementhas been increasing over the years and it is predictedthat water requirement will further soar up in future(Figure 2). Irrigation sector is by far the largestconsumer of water among various sectors includingindustry and energy sectors. Domestic sector’srequirement is very less when compared toirrigation sector, however, the requirement fordomestic sector will also increase because ofpopulation growth unless there is a check inpopulation.
Source: Based on data from Ministry of Statistics and ProgrammeImplementation, GOI(2010)
Favourable policy prevailed in India with respectto irrigation investment on development hasprovided a solid platform for Indian agriculture toflourish. It acts like a complementary input foradoption of modern varieties and large scaleapplication of fertilizer. The efforts and importanceaccorded to irrigation sector in the past, has nodoubt brought in more area under irrigation andthe yields also increased quite significantly onexisting cropland. It has allowed multiple croppingand therefore gross area irrigated also increasedwith supplemental irrigation. This provided morestability to the production system in comparison torain-fed agriculture. Rains are more uncertain atthe time of sowing and drought occur frequentlyeven during rainy season (Biwalkar et al., 2007). Itis evident that to achieve the food grain production
Figure 1. Per capita availability of water in India
Figure 2. Sector-wise Water Requirement in India
Source: Based on data from Ministry of Statistics and ProgrammeImplementation, GOI (2010)
19

110 SEKAR et al. [Journal of Soil & Water Conservation 12(2)
demand of 281 MT by 2020, more food needs to beproduced with less amount of water. Irrigationassumes greater significance while aiming atachieving 4 per cent growth in agriculture insustainable and inclusive manner. It is a matter ofconcern that water use in agriculture is not efficientbecause of several reasons including distributionand conveyance losses. The losses occur at basinscale as well as field scale at micro level. These lossesneed to be minimized by more investment indistribution networks and channels and the overallirrigation efficiency should be improved.
Each stakeholder in an irrigation systemconfronts with different kinds of problems spanningfrom scarcity to plenty with different consequences.Water logging and salinity problems are often inthe head region of a system and water dearth inthe tail region. Water conflicts, both intra and interbasins, trans-boundary issues are common andlongstanding and these conflicts need to beresolved in an amiable manner in order to achievethe inclusive growth. At basin scale, activities inthe upstream decide the fate of the communitydownstream. These issues need to be sorted out atbasin scale and more importantly collective actionfor water distribution and use will benefit thecommunity at large.
To achieve the sustainable and inclusive growth,it is important to pay more emphasis on both supplyand demand fronts. Efforts on water augmentationand creation of awareness on optimal use of waterwill be the key to bring in water supply and demandmatch and also to achieve the set target ofagricultural production. But the annual increase ofirrigation water requirement and the deficit in itsavailability (supply) will have an impact onagricultural production. The overall cost for wateraugmentation and minimizing water losses maysoar up in future in addition to the present costs.There is a need for completing the incompleteirrigation projects which can be done through theexisting Accelerated Irrigation Benefits Program(AIBP). There are substantial costs for constructionof water projects in the form of capital and forreduction of environmental degradation. Thegrowth in irrigated lands also emanates externalitieseither directly or indirectly. When the irrigationpotential is increased, there are a few associatedproblems such as population displacement, soilerosion, deterioration in water quality, increase in
waterborne diseases and adverse impact onbiodiversity.
Trends in irrigation development, investments andcoverage
Starting from I FYP, major and medium irrigationprogrammes contributed around two-third of theadditional irrigation potential created (Table 1).Minor irrigation programmes contributed theremaining one-third. This emphasis was graduallychanging from III FYP and completely reversedfrom IV FYP onwards extending up to IX FYP. Thiscould have been due to a shift in the funding sourcefor minor irrigation development, which might haveprovided the fillip for increased share of minorirrigation in the additional irrigation potentialcreated from IV FYP onwards.
Table 1. Plan wise Irrigation Potential Created and Utilizedin India (‘000 ha)
V Year Major & Medium Minor TotalPlan Irrigation Irrigation
IPC IPU IPC IPU IPC IPU
I 2486 1280 1159 1159 3645 2439
II 2143 2067 671 671 2814 2738
III 2231 2123 2269 2269 4500 4392
IV 2608 1937 4380 4380 6988 6317
V 4014 2475 3900 3900 7914 6375
VI 1083 929 7521 5249 8604 6178
VII 2225 1893 9086 7871 11311 9764
VIII 2216 2126 7545 6252 9761 8378
IX 4097 3079 12935 4544 17032 7623
X 5296 3410 5572 3871 10867 7281
XI* 9000 - 7000 16000 -
Source: CWC, GOI (2010)IPC and IPU denote Irrigation Potential Createdand Utilized respectively.*Target
In the IX Plan, the share of minor irrigationincreased noticeably around 3/4th of the total whilethe remaining by the major and medium irrigationprojects. However, in the X plan, the gap reducedin terms of potential created between major andminor irrigation systems. As a result of this, bothsurface and ground water resources were harnessedat varying levels across space and time. Overall,
20

April-June 2013] IRRIGATION WATER USE 111
the gap between irrigation potential created andutilized continues to remain wide although in themiddle of the FYP, the gap gets abridged to a certainextent. In the X Plan, the total investment made inirrigation infrastructure was Rs. 1,06,743 crore.Government investment in irrigation has been risingover the years and has received a further boost inthe recent years (Ramanayya, et al., 2008).Investment in irrigation infrastructure is a criticalpart of rural infrastructure. It remains a publicsector activity only because the sector is nowherenear being commercially viable since water chargesaccount for only about 20 per cent of operatingcosts.
Source-wise area irrigated and its trends areshown in Figure 3. Expansion of minor irrigationespecially tubewell irrigation has witnessedexponential growth, which obviously contributedsignificantly towards agriculture production growthin India. As seen from the Figure, canal irrigatedarea in India showed declining trend after 90’s butarea irrigated by minor irrigation source(groundwater) has shown an upward trend. Tubewell irrigation particularly, has shown phenomenalrise over the years. Irrigation from tank sourceshas been declining since the inception of greenrevolution. Before nineteen seventies the share oftank irrigation was greater than that of tubewells.During the early 1980s, central and stategovernments initiated programs for subsidizing theexpansion of groundwater irrigation, which led toa spurt in growth of tube well irrigation in thecountry. Rehabilitation of tanks, revival of irrigationinfrastructure, and resuscitation of water harvestingsystems with local indigenous knowledge wouldbe the key for augmenting irrigation water. Rainwater harvesting can be promoted as a corestrategy for achieving sustainability of water
resources and security (Rajput and Patel, 2012). Itis important to harvest water from any watersources in ponds and reservoirs for variouspurposes including agriculture to stretch its usageto the maximum (Baipheti et al., 2009). If conjunctiveuse of water is to be encouraged, then far moreattention needs to be given for rehabilitation oftanks and enhance the irrigation potential createdby the tanks.
On the whole, tubewell irrigation emerged asan important source of irrigation not only at allIndia level, but also in the IGP which is the heartbelt of Green Revolution. Over the last 40 years inIGP, the trend has been with surface water irrigationdecline and ground water irrigation increase.Besides investment efforts and favorable policyatmosphere towards groundwater development,existence of an active groundwater market has alsobeen an important characteristic of groundwaterutilization in the IGP and more particularly in ricegrown areas. Ground water market has helpedsmall, marginal and resource poor farmers who areunable to make investments in pumps. Thegroundwater market flourished in a great dealthough the kind of transaction is informal. Thesubsidized energy policy put forth by the stategovernments also helped the farmers in a way togo in for energized tube wells. As a result, numberof energized tube wells swelled up across states inIndia. The relative reduction in risk due to thebuffer provision of supplemental irrigation waterhas then encouraged intensification of othercomplementary inputs like fertilizer and othermodern inputs. However, large scale applicationof chemical inputs may lead to environmentalproblems and health hazards.
Status of Groundwater Development in IrrigatedAgriculture
Groundwater irrigation has been a preferredsource of irrigation for the farmers as compared tosurface systems by virtue of fairly assured supplyof water. Groundwater is also generally moreproductive compared to surface irrigation. Someevidence in India suggests that crop yield/cubicmeter on groundwater irrigated farms tends to be1.2-3 times higher than on surface water irrigatedfarms (Dhawan, 1989). A study conducted by IWMIindicates that farmers with wells obtain 50 to100 %higher value of output per unit area compared toFigure 3. Trends in Sources of Irrigation in India
21

112 SEKAR et al. [Journal of Soil & Water Conservation 12(2)
canal irrigators (Shah et al. 2003). As a result, therapid expansion and increasingly greater relianceon the use of groundwater for irrigation hascontributed significantly to agricultural and overalleconomic development of India. It was estimatedthat about two-fifths of India’s agricultural outputcomes from areas irrigated with groundwater(World Bank 1998). Farmers have becomeincreasingly dependent on groundwater because oflimitations in surface water sources. This movetowards groundwater sources has been furtherfacilitated by the government policies on credit,subsidy policy on energy etc. Since agriculture is astate subject, making electricity available at highlysubsidized rates with liberal tariff charging policiescomes within the purview of state governments.This is one of the reasons for proliferation oftubewells across the country. Growth of tubewellshas been tremendous both in Peninsular India andthe Indo Gangetic Plain of India. Ground waterexploitation is more in north western region whereground water development is designated as overexploited and critical zones.
Increase in well density, well failure, deepeningof wells, rapidly falling water table, negativeexternalities emanating from deep groundwaterextraction in many parts of India are raising seriousconcerns and posing major challenges, whichrequire to be addressed both to sustain the benefitsof groundwater irrigation and to ensure thesustainability of gains in agricultural production.
The electricity consumption for irrigation pumpingover the years has been increasing as a consequenceof increase in the number of tubewells as well asincrease in electricity consumption per tubewell. Thelatter has partly been on account of the largeramount of electricity required to pump groundwaterfrom greater water depths due to decline in thewater table. Ground water status presented in thetable 2 reveals that over exploitation ofgroundwater is more in states like Punjab, Haryana,Rajasthan, Delhi, Tamil Nadu and Karnataka. Inthese states, many blocks/talukas are designatedas critical. Therefore, priority needs to be accordedto these states for investment for groundwaterrecharge as well as efforts on demand managementof ground water including adequate regulatorymechanism.
An analysis of growth of tube well irrigation inthe Indo Gangetic Plain of India revealed that therehas been higher growth of wells during 1970-80and the growth in net area irrigated by tubewellswas around 8.76 per cent and it declined to 5 percent afterwards until it came down to 1.27 per centrecently in the past decade. Increase in number oftubewells and declining growth in area irrigatedby tubewells implies the need for sustainable useof water. Declining growth in area irrigated bytubewells could be due to reduced supply of wateras well as increasing awareness of farmers onjudicious use of irrigation water. While the latter isgood from sustainability point of view, over
Table 2. Ground water status in India
State Total No. of Safe Semi-Critical Critical Over-blocks/talukas exploited
No. % No. % No. % No. %
Andhra Pradesh 1231 760 62 175 14 77 6 219 18
Delhi 9 2 22 0 0 0 0 7 78
Gujarat 223 97 43 69 31 12 5 31 14
Haryana 113 42 37 5 4 11 10 55 49
Karnataka 175 93 53 14 8 3 2 65 37
Punjab 137 25 18 4 3 5 4 103 75
Rajasthan 237 32 14 14 6 50 21 140 59
Tamil Nadu 385 145 38 57 15 33 9 142 37
Uttar Pradesh 803 665 83 88 11 13 2 37 5
India 5723 4078 71 550 10 226 4 839 15
Source: Ministry of Water Resources, GOI (2010)
22

April-June 2013] IRRIGATION WATER USE 113
exploitation of water needs to be curtailed, whichcould be partly done by encouraging conjunctiveuse of water. With increasing need of water forcompeting sectors, groundwater use has becomeindispensable over the years. An excessiveextraction and mining of groundwater leads todepletion and degradation in quality of this preciousresource in many parts of India, which deprivesthe future generation accessible to fresh waterresources.
Apart from availability of water under threat,degradation of water is reported in eastern partsof India particularly in West Bengal, where arsenicand nitrate contamination is observed to beexceeding the limit. It is reported in the trans-Gangetic Plain, more so in Haryana, where waterquality is poor, which may have profound impactson health and environment in years to come. Lackof comprehensive policies to guide ground waterdevelopment and regulate ground water useresulted in over exploitation of this preciousresource to a greater extent. In the trans-GangeticPlain, irrigation intensity increased from 148 to 180per cent over the last four decades. Similarly in thelower Gangetic Plain, irrigation intensity hasincreased from nearly 100 per cent in 1960 to 178per cent in 2008. Increasing irrigation intensity is afactor which shifts production frontier up howeverincreasing level of environmental degradation andhealth hazards cannot be neglected too long. Suchincrease in irrigation intensity could be possiblewith the use of ground water which is apparentlyevident from the increase of number of tube wellsinstallation in last three decades. For example, inPunjab state, the percentage share of tube wellirrigation in net irrigated area is 72 per cent, whichshowed the skewed proportion of irrigation sourcetowards tubewells. Nearly 75 per cent of the blocksare already designated as over-exploited.
Tubewell irrigation and energy demand
Tubewell irrigation has emerged as the backboneof Indian agriculture and accounts for 70–80% ofthe value of irrigated farm output (Sharma andMehta, 2002). Despite its significance, sustainableuse of groundwater resources is a concern as thegroundwater extraction rate is more than that ofrecharge rate in several places. Such water extractionis primarily driven by irrigation demand and policysupport of government in energy front. This is
happening in spite of dismal energy situation in thecountry; therefore it is important to relook at thesubsidy support of electricity to the farmers. Therising demand of energy and the soaring prices ofdiesel and inflated tariff rates for electricity prompta reorientation of energy policy in agriculturesector.
Electricity is a major input to the agriculturalactivity in India and the agricultural sector accountsfor 22% of all final electricity consumed in India in2004 (CEA, 2006). In rural areas, electric operatedpump sets are on the rise to provide irrigationfacilities and as per the CEA (2008) estimates, nearly15.4 million pump set had been installed. In anotherstudy, Purohit and and Michaelowa (2006) reportedthat more than 15 million electric and 6 million dieselirrigation pump sets are in operation. Pumpsoperated with electricity are generally preferred,due to convenience of use and the low subsidizedprice of electricity. Power pricing and subsidy toagriculture continues to hold differing views. Instates like Tamil Nadu, power supply to farmers isfree; and many other states, the flat electricity tariff– based on horsepower rating of the pump ratherthan actual metered consumption – charged tofarmers is heavily subsidised. Annual losses toelectricity boards on account of power subsidies toagriculture are estimated at Rs 260 billion in India;and these are growing at a compound annualgrowth rate of 26% (Gulati, 2002).
Badiani and Jessoe (2011) found that a 10 percentdecrease in subsidies would reduce groundwaterextraction by 4.3 percent, costing farmers 13 percentin agricultural revenues. It will not be a profitableproposition for the farmers to undertake farmingactivity any more unless farmers are offered withsubsidized energy. But at the same time, ifgovernment decides to continue with status quo,then the entire cost should be borne by thegovernment. It will be huge particularly in thecontext of exorbitant price rise of energy and willerode the government exchequer. This amount hasto be met largely from the capital account and hencethere is a likelihood of downgrading of capital assetcreation in agriculture. This should be dealt in aholistic approach of considering both supply anddemand of energy and water for irrigation. Allpossible efforts should be taken on demand sidefor judicious use of irrigation water and thereofenergy and at the same time efforts are required
23

114 SEKAR et al. [Journal of Soil & Water Conservation 12(2)
on supply side to augment water and increase thesupply of energy. These are to be viewed in a properpolicy perspective without harming small andmarginal farmers of the country and at the sametime solving energy-irrigation crisis in future.
Farm Size and Use of Irrigation by Source
Farm size-wise and irrigation source-wiseanalysis revealed that area irrigated by tubewellshas been predominant irrespective of farm sizecategory (Table 3). On the whole, nearly 33 millionhectare is irrigated by groundwater source and 17million hectare is irrigated by canal. Moreparticularly, tubewell is the major source ofirrigation for marginal farmers followed by canals.Tanks contribution in net irrigated area is very lessand the share can be increased while efforts aremade on rehabilitation of tanks. While doing so,conjunctive use of water could be indirectlyimproved; this will pave the way for sustainableuse of water. The last two irrigation census datapertaining to 2001 and 2006 revealed that canal andtank irrigation declined in all categories of farmersexcept marginal and small farmers. But, tubewellirrigation increased irrespective farm size categoryover these time periods. Overall, total irrigated areaincreased from 51.6 million hectare to 54.2 millionhectare and the percentage share of irrigated area
over the net area sown also increased from 38.9per cent to 46.8 per cent. While aiming at sustainableuse of water, policy benefiting marginal and smallfarmers to reduce the gap between area irrigatedby tubewells and canals will help in encouragingconjunctive use of water. Therefore thedisadvantaged sections of the farming communityie marginal and small farmers are to be given farmore attention for achieving the inclusive growthin agriculture. It is important to see if thosecategories of farmers are benefited more fromsurface sources than groundwater. As discussedearlier, proliferation of tubewells, exceedingly fasterrate of ground water exploitation, and decline inground water table would result in more externalcosts, which may be irreversible. Therefore, policieson improving surface water sources throughdevelopment, rehabilitation and efficientmanagement, which benefits marginal and smallfarmers at large should be the future thrust.
Impact of irrigation on foodgrain production in India
In this section, the relationship betweenproduction of foodgrains and major factors likeirrigation, fertilizer, seed, and pesticides wasestablished using regression analysis. Thehypothesis tested in the model was the marginaleffect of irrigation on foodgrain production is higherthan that of other factors. A regression model was
Table 3. Source-wise Distribution of Irrigated Area by Farm Size wise in India (‘000 ha)
Size Class Year Canals Tanks Wells Tubewells Others Total Net Sown % of IrrigatedIrrigated Area (NSA) Area to NSA
Marginal 2000-1 3405 855 1296 5419 1409 12384 24266 51.03
2005-6 3741 881 1266 6298 1365 13552 23557 57.53
Small 2000-1 2929 587 1971 4335 1069 10891 27854 39.10
2005-6 2984 518 1909 4955 1036 11403 24314 46.90
Semi-medium 2000-1 3219 463 2500 4740 1010 11932 32608 36.59
2005-6 3181 394 2485 5345 991 12396 27682 44.78
Medium 2000-1 3447 276 2511 4502 811 11547 32019 36.06
2005-6 3384 228 2550 5013 807 11982 26838 44.65
Large 2000-1 1578 77 952 1715 550 4872 15929 30.59
2005-6 1552 76 929 2031 349 4937 13464 36.67
All Classes 2000-1 14578 2258 9231 20711 4849 51627 132677 38.91
2005-6 14842 2097 9139 23643 4548 54270 115855 46.84
Source: Based on data from Department of Agriculture and Cooperation (2000-1) and Agriculture Census (2005-6
24

April-June 2013] IRRIGATION WATER USE 115
fitted with irrigation, seeds, fertilizer and pesticidesas explanatory variables and foodgrain productionas dependent variable and the model is of the form:PRODGrain = β0 + β1(Irr ) + β2(Fert ) + β3(Pes )+β4(Seed)
Whereas PRODGrain = production of foodgrain;Irr = net irrigated area; Fert = usage of fertilizer ;
Pes= pesticide usage; Seed= usage of seeds.Marginal impact of each predictor was derived fromthe estimated results. The explanatory variablesexplained the variations in the dependent variable,foodgrain production are reflected in high R square(0.89). The results suggest that irrigation variableis highly significant in explaining the variations inproduction of foodgrains. Marginal effect ofirrigation variable was quite high in relation to othervariables considered in the analysis. One unitincrease in irrigated area will raise 1.87 unit ofproduction of foodgrain, which evidently suggeststhe importance of irrigation in foodgrain productionin India. Keeping in view the food security of thecountry in the face of soaring population and food
effect relationship further bolsters the fact thatirrigation has a critical role in the production offoodgrains in India.
CONCLUSIONSThe influence of irrigation on production growth
of foodgrains in the country has been noteworthy,which was partly due to the conscious efforts ofCentral and State governments in irrigation sector.Irrigation potential created and utilized hasincreased over a period of time although there is agap in potential created and utilized. Of late, withthe increase in population, per capita wateravailability is less and annual irrigation waterdemand is increasing. The trends in differentsources of irrigation both surface and groundwatersources have shown diametrically oppositedirections. High growth of tubewells, increase inshare of tubewell irrigation over other surfacesources, subsidized tariff for electricity foragriculture purposes thereby injudicious use ofwater, decline in water table, over exploitation ofgroundwater are some of the grey areas which needattention in future. It is important to promoteconjunctive use of water, which could be madepossible only through enhancing the irrigationpotential of surface water sources. More wateraugmentation could be done through installationof farm ponds, revitalization of defunct tanks, andresuscitation of community based watermanagement in canal and tank command areas.Marginal and small farmers form the central foci offarming community and irrigation policiesbenefiting small and marginal farmers will pave theway for achieving inclusive agricultural growth. Insum, to achieve the sustainable and inclusivegrowth, it is important to pay more emphasis onboth supply and demand fronts in irrigation sector.Efforts on water augmentation, distribution, andcreation of awareness on optimal use of water willbe the key to bring in water supply and demandmatch and also to achieve the set target ofagricultural production.
REFERENCES
Badiani, R., Jessoe, K.K., 2011. Electricity subsidies foragriculture: Evaluating the impact and persistenceof these subsidies in India, Report, World Bank, Dept.of Agricultural and Resource Economics, UC Davis,USA.
demand, irrigation sector and investment in thesector needs to be given top priority in order toexpand the irrigation frontier in the total net sownarea of the country. The contribution of each of theexplanatory variables and its extent of influence onfoodgrain production and the significance level arepresented in table 4.
Computation of the elasticity with respect toproduction of foodgrains reveals the marginalimpact of irrigation and its importance onproduction with an elasticity value of 0.48, whichis higher than that of fertilizer with an elasticityvalue of 0.12. The marginal effect of contributionof other factors on production of foodgrains is stillless than irrigation and fertilizer. This cause and
Table 4. Regression estimation results
Variable Coefficients (β) Elasticity t statistic Sig.(1) (2) (3) (4) (5)
Irrigation 1.869 0.48 4.877 .000
Fertilizer -1.446 0.12 -2.427 .030
Pesticides .028 7.07E-06 .179 .860
Seeds .551 0.003 1.664 .120
Constant 147.527 - -2.154 .051
Note: R2= 0.89* significant at 1 per cent level.
25

116 SEKAR et al. [Journal of Soil & Water Conservation 12(2)
Baiphethi, M., Vilijeen, M.F., Kundhlande, G., Botha, J.J.,Anderson, J.J., 2009. Reducing poverty and foodinsecurity by applying infield rainwater harvesting:How rural institution made a difference. AfricanJournal of Agricultural Research. 4(12): 1358-1363.
Biwalkar, N., Sharma, S.C., Rana, D.S., Bawa, S.S., 2007.Rainwater harwesting for enhancement of socioeconomic condition of Kandi. Paper presented in the‘Environmental and livelihood security throughresource management in northern India’ organizedby Indian Association of Soil and WaterConservationists, Dehradun held at Punjab KalaaKendra, Sector 16, Chandigarh, p.24.
Dhawan, B.D., 1989. Studies in Irrigation and WaterManagement. New Delhi, India: CommonwealthPublishers.
Gulati, A.S., 2002. Energy Implications of GroundwaterIrrigation in Punjab., paper for the IWMI-ICAR-Colombo Plan sponsored Policy Dialogue on‘Forward-Thinking Policies for GroundwaterManagement: Energy, Water Resources, andEconomic Approaches’ organized at IndiaInternational Centre, New Delhi, India, September2–6.
Purohit, P., and Michaelowa, A., 2006, “CDM potentialof SPV pumps in India”, Renewable and SustainableEnergy Reviews, May 2006.
Rajput, T.B.S., and Patel, N., 2012. Traditional waterharvesting in India. Journal of Soil and WaterConservation 11 (1): 38-48.
Ramanayya, T.V., Nagadevara, V., Roy, S., 2008. StudyRelated to Gap between the Irrigation PotentialCreated and Utilized, Project Report, Indian Instituteof Management, Bangalore.
Shah, T., Scott, C., Kishore, A., Sharma, A., 2003. Energy–Irrigation nexus in south Asia:
Approaches to agrarian prosperity with viable powerindustry, Research Report No. 70. Colombo, SriLanka: International Water Management Institute.
Sharma, S.K. and Mehta, M., 2002. GroundwaterDevelopment Scenario: Management Issues andOptions in India. Paper for the IWMI-ICARColomboPlan Sponsored Policy Dialogue on ‘Forward-Thinking Policies for Groundwater Management:Energy, Water Resources, and EconomicApproaches’ organized at India International Centre,New Delhi, India.
Stephane, C., McNeil, M., and Sathaye, J., 2009. IndiaEnergy Outlook: End Use Demand in India to 2020,Berkeley National Laboratory, USA.
World Bank. 1998. India Water Resources ManagementSector Review: Groundwater Regulations andManagement Report. World Bank and Governmentof India, New Delhi. The World Bank.
26

April-June 2013] SPATIAL AND TEMPORAL VARIATIONS IN RAINFALL & RAINWATER 117
Journal of Soil and Water Conservation 12(2): 117-122, April-June 2013ISSN: 022-457X
Spatial and temporal variations in rainfall andrainwater harvesting potential for Kutch district, Gujarat
M. K. KHANDELWAL1, SANJAY ARORA2 and K.C.B. RAJU3
Received: 26 November 2012; Accepted: 9 May 2013
ABSTRACT
The Kutch district of Gujarat receives highly variable and erratic rainfall leading to protracteddroughts. The daily rainfall data of 1975-2011 for nine talukas of Kutch district have been statisticallyanalyzed to study their spatial and temporal variation. The mean date of onset of effective monsoonin the district varied from July 12 (Mandvi) to July 25 (Rapar) with earliest onset of effective monsoon(p=0.68) during June 20 (Mundra) to June 27 (Bhuj). In general, for the entire district, the averageonset of effective monsoon may occur from June 16 to July 10 with standard deviation of 24 days andit may cease around August 29. Mean date of withdrawal of monsoon ranged from August 20(Lakhpat) to Sept 8 (Anjar). On an average each taluka experiences at least two critical dry spellsfrom the monsoon period. The entire district may experience critical dry spells of 77 days durationcomprising 29, 28 and 20 days starting on Jul 13, Aug 5 and Aug 20, respectively. It indicates acutenecessity of storing runoff water for the region to tackle the imminent water shortage problems forcrop production. On an average rainfall during the three to four wet spells ranged in the district from418 mm at Bhuj to 550 mm at Mundra. The first wet spell of the order of 209 mm at Bharuch to 314 mmat Mundra may be harvested and stored in rainwater harvesting structures. In general, for the entiredistrict, about 548 mm of rainwater can be harnessed and stored in water harvesting structures.
Key words: rainwater, harvesting, dry spells, wet spells, effective monsoon, Gujarat
1Principal Scientist (Agril. Engg.), 2Senior Scientist (Soil Science), CSSRI, Regional Research Station, Bharuch (Gujarat); 3Former Director, Swami Vivekanand Research and Technology Institute (SVRTI), Mandvi (Kutch) (Gujarat)
INTRODUCTIONThe Kutch district (45,652 km2) is located between
22o41’11" to 24o 41’ 47" north latitude and 68o09’46"to 71o54’47" east longitude in north-western regionof the Gujarat state. This district shares its north andnorth-west border with Sind (Pakistan) whereas theArabian sea lies in the west and south-west.Administratively the district is divided into ninetalukas: Naliya, Anjar, Bhachau, Bhuj, Lakhpat,Mandvi, Mundra, Nakhtrana and Rapar (Fig 1).Kutch falls in the arid tracts and has a tropicalmonsoon climate. It receives much of its rainfallfrom the south-west monsoon. The average annualrainfall (1961-2011) is 395 mm, which varies from330 mm (Lakhpat) to 469 mm (Mundra) and so isclassified as an arid district. The distribution of themeager rainfall 395 is highly skewed and erratic,
leading to protracted droughts. Six severe, threemoderate and five mild meteorological droughtswere recorded within a span of 23 years (1972-94).The Indian arid zone accounts for approximately12% of the country’s geographical area and Gujaratoccupies second largest arid and semi-arid area inthe country. Drought and long dry spells arecommon features and a large number of villages inthe Kutch district are affected by the water scarcityproblem. The surface and groundwater resourceshave been receding all over the state due to overexploitation and increasingly deficient recharge.About 4,77,200 ha of cultivated area is affected bysoil salinity. Maximum salt affected cultivated arealies in Anjar taluka (86%), followed by Bhachau(59%), Lakhpat (48%), Mandvi (40%), Naliya (23%),Mundra (23%), Bhuj (12%), and Rapar (11%). There
27

118 KHANDELWAL et al. [Journal of Soil & Water Conservation 12(2)
are 20 medium irrigation schemes with a total livestorage capacity of about 281 MCM and 162 minorirrigation schemes with a total live storage of about252 MCM. However, only 28% of the potentialcreated (533 MCM) was utilized annually by theseschemes (1984-85 to 1994-95) to irrigate 14,068 ha (minor7857 ha and medium 6211 ha) (Anonymous, 1996).
Fig. 1. Location of various talukas in Kutch district, Gujarat
Human and Livestock Population: The districthas population of about 12.625 lakhs (1991 census)with an average density of 65 persons km-2 asagainst 4 persons km-2 in most arid regions of theworld. The population increase for the periodbetween 1901 and 1991 was only 159 per cent ascompared to 354 per cent for the Gujarat 252 percent for the whole of India. In the first five decadesof 20th century the population growth was ameager 16.3 per cent. However a rapid increase(122 per cent) has occurred during the last fourdecades, the rural and urban population hasincreased by 56 per cent and 187 per centrespectively with a decadal growth rate of 16 percent and 43 per cent, respectively. Livestockpopulation also increased from 9.40 lakhs (48animals km-2) in 1962 to 14.13 lakhs (73 animals km-2)in 1992 showing an increase of 50 per cent within aspan of 30 years.
Soils: Main geological formations contributingto the soil formation in the Kutch district includesedimentary rocks of marine and non-marine origin,basaltic trap, laterites, limestone and alluviumformed under different geological situations. Soilsof Kutch can be broadly classified into sandy soilswhich cover a vast area of the district, coastal alluvialsoils that are located along the coast of Mundraand Mandvi talukas, black soils in the central partof district, shallow and skeletal soils developed on
the slopes of the hilly areas in Anjar, Rapar, Mandvi,Mundra, Bhuj and Nakhtrana talukas and the mudsoils located in the coastal belt formed under theinfluence of sea water. The soils in the Kutch districtare generally low Nitrogen and medium inphosphorus and potassium 96 per cent of the soilshave low iron and high lime contents.
Surface Waters: In Kutch district, the availabilityof surface water depends on the intensity, durationand amount of rainfall. The reservoirs are not filledup to the capacity for several years at a stretchbecause of arid climate and low rainfall. It isdifficult to establish rainfall runoff relationship dueto non-availability of proper stream gauging data.The runoff coefficients worked out on the basis ofthe designed inflow data of medium dams indifferent talukas are Anjar-0.2082, Bhachau-0.2164,Bhuj-0.2299, Lakhpat-0.2092, Mandvi-0.2370,Mundra-0.2294, Nakhtrana-0.2193, Naliya -0.1854and Rapar-0.1952 (Singh and Kar, 1996). Out of thetotal 1482.71 MCM of runoff, an estimated 847.38MCM water is being stored in different storagereservoirs and village tanks. Thus, nearly 57.15% ofrunoff is surplus which goes into the sea and the Ranns.
Groundwater: Fresh groundwater resources arelimited in Kutch district, mainly due to scanty rainfalland also because the district has nearly 60 per centsaline area. Among the 166 wells examined, about9 per cent wells tapped water at less than 30 mdepth, 43.4 per cent tapped water at 10-20 m depthand 27.1 per cent had it at less than 10 m depth(Singh and Kar, 1996). Excessive withdrawal ofgroundwater has led GWRDC to categorise Anjarand Bhachau under over–exploited talukas, Mandviunder dark category and Naliya, Nakhtrana,Mundra and Rapar under gray category (GWRDC,1991). Only two talukas viz. Bhuj and Lakhpat wereconsidered as safe areas with regard to groundwater availability. Rate of depletion of 1.2 m peryear in Bhuj and Nakhtrana and 0.8m per year inMandvi and Mundra talukas resulted inconsiderable decline (10-15 m) in water table during1980-91 (GWRDC, 1995).
Agriculture: The total cultivated area in Kutchdistrict increased by 15 per cent from during1961-62 to 1992-93. At taluka level, the increase wasrecorded in all except Naliya and Anjar, where thecultivated land decreased by 17 per cent and 29per cent, respectively. Major crops like jowar, bajra,pulses, groundnut and cotton accounted for 78
28

April-June 2013] SPATIAL AND TEMPORAL VARIATIONS IN RAINFALL & RAINWATER 119
per cent of the total cultivated area during 1961-62which decreased to 72 per cent during 1992-93.Groundnut, a salinity sensitive crop was cultivatedmainly in Nakhtrana and Mandvi (56 per cent and20 per cent of total groundnut cultivationrespectively) during 1961-62. Groundnut cultivationshowed a significant decrease of 33 per cent inNakhtrana taluka during 1992-93. Cotton wasmainly cultivated in saline tracts of Anjar, Bhachau,Rapar, Mandvi and Mundra talukas in 1,06,684 hain 1961-62 which decreased to 55,288 ha in 1992-93.
MATERIALS AND METHODSDaily rainfall data of 1975-2011 for all nine taluka
were collected from Kutch district panchayat pffice,Bhuj (Gujarat). Details on agricultural statistics werecollected from the office of the Joint Director(Agriculture), Ahmedabad (Gujarat). Information onother aspects was collected from publishedliteratures. Computer programme by Ashokraj(1977) has been used to study various aspectsrelated to onset of effective monsoon, critical dryspells and rainfall during wet spells. Theharnessable runoff based on USDA-SCS CurveNumber method for the region was also estimated.
RESULTS AND DISCUSSION
Rainfall depth duration relationship
Average rainfall during different storm periods(Table 1) shows that average 1-day annual maximum
Table 1.Average of 1-7 days continuous moving maximumrainfall for various talukas in Kutch district (1975-2011)
Code and Name Average rainfall (mm) duringof Raingauge different storm periods (day)station
Taluka 1 2 3 4 5 6 7
ANJ (Anjar) 106 148 161 168 174 178 185
BHA (Bhachau) 103 135 148 161 169 171 181
BHU (Bhuj) 105 141 159 169 174 184 188
LAK (Lakhpat) 111 151 173 189 192 195 197
MAN (Mandvi) 120 158 177 179 189 197 203
MUN (Mundra) 129 172 190 202 212 219 228
NAK (Nakhtrana) 123 158 176 187 194 197 203
NAL (Naliya) 142 183 201 204 214 217 226
RAP (Rapar) 110 150 166 170 174 181 194
Whole district 84 123 144 156 166 172 178
rainfall ranged from 103 mm (Bhachau) to 142 mm(Naliya) with district average of 84 mm (Fig 2). Onthe other hand maximum one-day annual rainfallranged from 375 mm (Bhachau, Mandvi) to 683 mm(Naliya). Maximum one day annual rainfall in orderof 265.2 mm (Nakhtrana) to 467.9 mm (Bhuj) wasreported by Singh and Kar (1996) that falls withinthe above limit. Analysis of longest possible durationrainfall data will help in establishing statisticalparameters. Analysis of 1-7 day continuous movingmaximum annual rainfall showed that average1-day annual maximum rainfall ranged from 176mm to 243 mm for the same talukas with districtaverage at 183 mm.
Fig. 2. Average annual rainfall pattern (1975-2011) in varioustalukas of Kutch district
Distribution of Monsoon Rains
Annual rainfall of 1975-2011 (except 1987,extremely dry year) showed that on an average thedistrict experienced drought and below normalrains in 11 out of 51 years (43%) (Table 2). It receivednormal rain only in 12 out of 51 years (23.5%).Likewise, above normal and surplus rains wereexperienced in 7 years (13.7%) and 10 years (19.6%)respectively out of 51 years (Fig 3). Pooled data of1901-99 from different sources (Singh et al., 1990;Khandelwal et al., 2002) showed that the districtexperienced drought, below normal, normal, abovenormal and surplus rains in 17, 24, 28, 14 and 15out of 98 years, respectively. These two separateinferences establish that the district experienceddrought and below normal rainfall to the extent of41-42 per cent. Hence, there is need to studycritically on onset of effective monsoon and relatedaspects for better agricultural water management
29
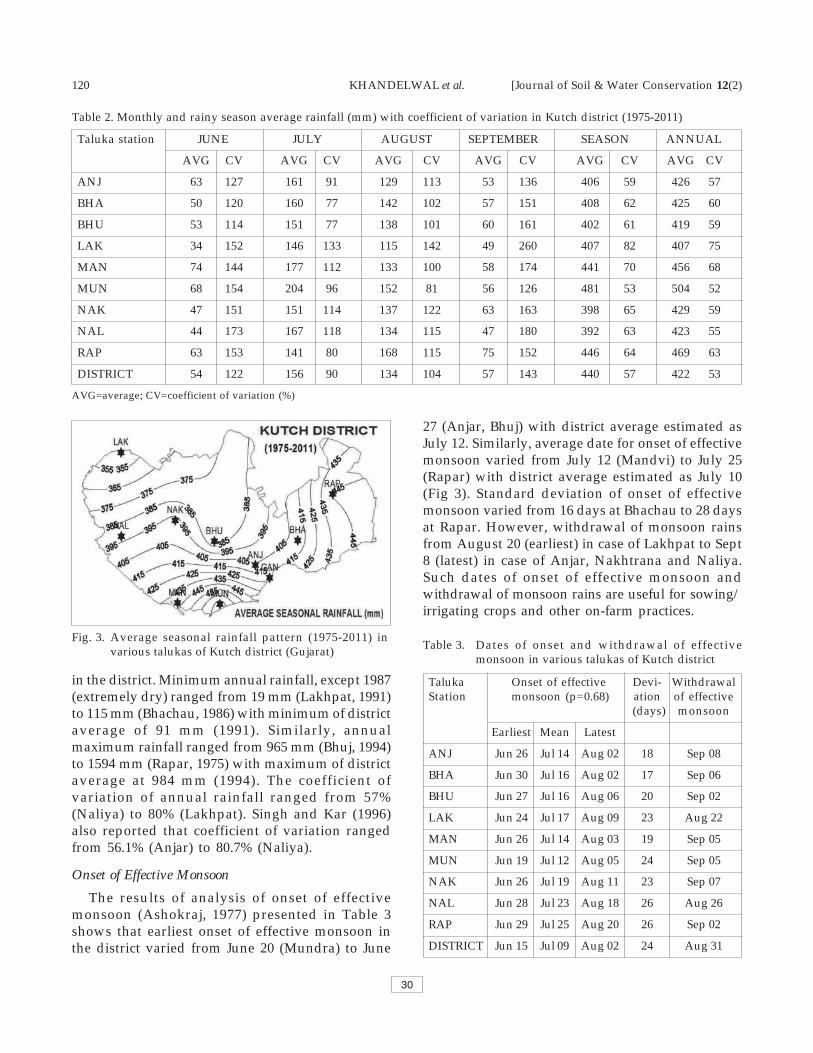
120 KHANDELWAL et al. [Journal of Soil & Water Conservation 12(2)
in the district. Minimum annual rainfall, except 1987(extremely dry) ranged from 19 mm (Lakhpat, 1991)to 115 mm (Bhachau, 1986) with minimum of districtaverage of 91 mm (1991). Similarly, annualmaximum rainfall ranged from 965 mm (Bhuj, 1994)to 1594 mm (Rapar, 1975) with maximum of districtaverage at 984 mm (1994). The coefficient ofvariation of annual rainfall ranged from 57%(Naliya) to 80% (Lakhpat). Singh and Kar (1996)also reported that coefficient of variation rangedfrom 56.1% (Anjar) to 80.7% (Naliya).
Onset of Effective Monsoon
The results of analysis of onset of effectivemonsoon (Ashokraj, 1977) presented in Table 3shows that earliest onset of effective monsoon inthe district varied from June 20 (Mundra) to June
Table 2. Monthly and rainy season average rainfall (mm) with coefficient of variation in Kutch district (1975-2011)
Taluka station JUNE JULY AUGUST SEPTEMBER SEASON ANNUAL
AVG CV AVG CV AVG CV AVG CV AVG CV AVG CV
ANJ 63 127 161 91 129 113 53 136 406 59 426 57
BHA 50 120 160 77 142 102 57 151 408 62 425 60
BHU 53 114 151 77 138 101 60 161 402 61 419 59
LAK 34 152 146 133 115 142 49 260 407 82 407 75
MAN 74 144 177 112 133 100 58 174 441 70 456 68
MUN 68 154 204 96 152 81 56 126 481 53 504 52
NAK 47 151 151 114 137 122 63 163 398 65 429 59
NAL 44 173 167 118 134 115 47 180 392 63 423 55
RAP 63 153 141 80 168 115 75 152 446 64 469 63
DISTRICT 54 122 156 90 134 104 57 143 440 57 422 53
AVG=average; CV=coefficient of variation (%)
Fig. 3. Average seasonal rainfall pattern (1975-2011) invarious talukas of Kutch district (Gujarat)
27 (Anjar, Bhuj) with district average estimated asJuly 12. Similarly, average date for onset of effectivemonsoon varied from July 12 (Mandvi) to July 25(Rapar) with district average estimated as July 10(Fig 3). Standard deviation of onset of effectivemonsoon varied from 16 days at Bhachau to 28 daysat Rapar. However, withdrawal of monsoon rainsfrom August 20 (earliest) in case of Lakhpat to Sept8 (latest) in case of Anjar, Nakhtrana and Naliya.Such dates of onset of effective monsoon andwithdrawal of monsoon rains are useful for sowing/irrigating crops and other on-farm practices.
Table 3. Dates of onset and withdrawal of effectivemonsoon in various talukas of Kutch district
Taluka Onset of effective Devi- WithdrawalStation monsoon (p=0.68) ation of effective
(days) monsoon
Earliest Mean Latest
ANJ Jun 26 Jul 14 Aug 02 18 Sep 08
BHA Jun 30 Jul 16 Aug 02 17 Sep 06
BHU Jun 27 Jul 16 Aug 06 20 Sep 02
LAK Jun 24 Jul 17 Aug 09 23 Aug 22
MAN Jun 26 Jul 14 Aug 03 19 Sep 05
MUN Jun 19 Jul 12 Aug 05 24 Sep 05
NAK Jun 26 Jul 19 Aug 11 23 Sep 07
NAL Jun 28 Jul 23 Aug 18 26 Aug 26
RAP Jun 29 Jul 25 Aug 20 26 Sep 02
DISTRICT Jun 15 Jul 09 Aug 02 24 Aug 31
30

April-June 2013] SPATIAL AND TEMPORAL VARIATIONS IN RAINFALL & RAINWATER 121
Critical Dry Spells
On an average, the entire district experiences atleast one critical dry spell (Table 4) in each year.Duration of the critical dry spells varied from 45(Rapar) to 85 (Nakhtrana) days with a districtaverage of 77 days. The first critical dry spellcommenced mostly in July and with durationranging from 24 days (Nakhtrana, Naliya andRapar) to 34 days (Bhuj). Similarly, the secondcritical dry spell occurred mostly in August withduration ranging from 18 days (Naliya) to 38 days(Nakhtrana).
Table 4. Distribution of critical dry spells (CDS) in Kutch district
Taluka First CDS Second CDS Third CDS Total
Station Date Length Date Length Date Length Length
ANJ Jul 22 32 Jul 31 26 Aug 16 18 76
BHA Jul 25 26 Aug 08 26 Sep 2 16 68
BHU Jul 22 33 Aug 18 21 - - 54
LAK Jul 18 25 Jul 31 28 - - 53
MAN Jul 23 25 Aug 19 27 Sep 06 23 75
MUN Jul 19 29 Aug 09 23 Aug 16 15 68
NAK Jul 22 26 Aug 07 38 Aug 30 23 85
NAL Jul 23 24 Aug 10 20 Aug 19 10 52
RAP Aug 01 23 Aug 21 21 - - 45
DISTRICT Jul 13 27 Aug 06 27 Aug 27 20 77
Rainfall during Wet Spells
On an average, total rainfall during the wet spells(Table 5) ranged from 418.3 mm (Bhuj) to 550 mm(Mundra). It is estimated that a total of nearly of524 mm could be retained during the four wet spellsoccurring in the district and it can be suitablyharvested and harnessed for use for agriculturalproduction. It is estimated that rainfall in order of210 mm (Rapar) to 314 mm (Mundra), 55.8 mm(Nakhtana) to 169.8 mm (Rapar) and 14.5 mm(Naliya) to 96 mm (Nakhtrana) during the first,second and third wet spells in months of July,
Table 5. Rainfall during wet spells at different talukas in Kutch district
Taluka Rainfall (mm) during Wet Spells
First Second Third Fourth Total
ANJ 241.6(Jul 14-30) 66.0(Aug 25-28) 87.9(Aug 27-29) 32.0(Sep 04-05) 427.5
BHA 209.7(Jul 16 - Jul 29) 117.7(Aug22-27) 93.0(Sep 4-10) 55.0(Sep 19) 475.4
BHU 219.2(Jul 16-26) 108.8(Aug25-Aug30) 90.3(Sep 9-15) - 418.3
LAK 290.7(Jul 17-30) 116.8(Aug 13-18) 50.7(Aug 29-Sep2) 38.0(Aug 17) 496.2
MAN 283.0(Jul 14-Aug3) 120.8(Aug 19-24) 26.2(Sep 17) 17.0(Oct 1) 447.0
MUN 314.3(Jul 12-26) 100.6(Aug 19-24) 90.1(Sep 03-07) 45.0(Sep 02-04) 550.0
NAK 282.7(Jul 19-Aug 05) 55.8(Aug 18-20) 96.1(Sep 15-17) - 434.6
NAL 249.2(Jul 23-Aug 02) 132.5(Aug 18-22) 14.5(Aug 31) 45.0(Aug30-31) 441.2
RAP 210.1(Jul 25-Aug 06) 169.8(Aug 26-31) 54.9(Sep 12-15) - 434.8
DISTRICT 202.1(Jul09-23) 164.3(Aug10-20) 80.3(Sep 04-10) 102.0(Sep 17-22) 548.7
31

122 KHANDELWAL et al. [Journal of Soil & Water Conservation 12(2)
Fig. 4. Harnessable rainfall in various talukas of Kutch district
August and September can be harvested andutilized for crop production (Fig 4).
REFERENCESAnonymous 1996. Process of Desertification in Kutch
and Banaskantha Districts of Gujarat, India (1961-1991), Gujarat Institute of Desert Ecology, Bhuj, Kutch.
Ashokraj, P. C. 1977. Onset of Effective Monsoon andCritical Spells- A computer Based ForecastingTechnique. Water Technology Centre, IndianAgricultural Research Institute, New Delhi.
Khandelwal, M. K. 1999. Harvesting Rainwater forOptimal Agricultural Production. Unpublished Ph.D. Dissertation, PAU, Ludhiana 141004 (Punjab).
Singh, R.S., Ramakrishna Y.S., Purhohit, R.S. andBhasndari C.S. 1990. Agro-climatology of Kutchdistrict (Gujarat State). Division of ResourceManagement, Central Arid Zone Research Institute,Jodhpur 342003 (Rajasthan).
Khandelwal, M. K., Yagnik, V.M., Jain, R. C., Patel, P.P.Shekh, A.M. and Shah, T. 2002. Assessment ofrainwater harvesting and artificial recharge potentialbased on rainfall time series analysis for Junagadhand Rajkot Districts (Gujarat). Paper No. SWE-2001-III-12 (page 100). 36th Annual National Conventionof Indian Society of Agricultural Engineers,Agricultural and Food Engineering Department,Indian Institute of Technology, Kharagpur, Jan 28-30, 2002.
32

April-June 2013] MOISTURE DISTRIBUTION AND FERTILIZER 123
Journal of Soil and Water Conservation 12(2): 123-129, April-June 2013ISSN: 022-457X
Moisture distribution and fertilizer mobilityunder drip fertigation in Mulberry
K. ARUNA DEVI1 and P.K. SELVARAJ2
Received: 24 December 2012; Accepted: 19 May 2013
ABSTRACT
A study was conducted to find the moisture distribution and fertilizer mobility as affected by irrigationand fertigation on mulberry in clay loam soil at Tamil Nadu Agricultural University Farm, Tamil Nadu.The irrigation treatment consist of single row drip, paired row drip and paired row Micro-tube irrigationat 80%, 60% and 40% of surface irrigation level were given once in 2 days. Surface irrigation with 5 cmdepth of water was applied once in a week. Two fertigation levels of 100 and 75 % of recommendeddose of N and K fertilizers were applied through fertigation for drip treatments. For surface irrigationfertilizers were applied as band placement method. Soil moisture content at surface layers in surfaceirrigation treatment was lower compared to subsurface layers. In drip irrigation treatments, the moisturecontent decreased as depth and distance increased from the emitting point. The fertilizer distributionin the soil layers was more or less similar for all the fertigation treatments. Due to difference in thequantum of water applied through different drip treatments, the concentration differed in differentlayers due to variations of leaching.
Key words: drip irrigation; fertigation; fertilizer mobility; soil moisture distribution
1Research Associate, Water Technology Centre, IARI, New Delhi-110 012; e-mail: [email protected](SWCE), Anbil Dharmalingam Agricultural College and Research Institute, Tiruchirappali-620 009, TamilNadu
INTRODUCTION
Drip irrigation is a technique in which drop bydrop application of water is done in the crop rootzone in order to meet the crop water requirementand maintain the optimum soil water status aroundthe vicinity of plant roots. It generates a restrictedbut concentrated root system requiring frequentnutrient supply that may be satisfied by applyingfertilizers in irrigation water i.e. by fertigation. Manyscientists revealed the superiority of fertigation andbalanced fertilization in different crops and orchards(Vaezi et al., 2003, Malakouti et al., 2003 and Asadi etal., 2005). Fertigation not only economizes the wateruse, but also improves the nutrient use efficiency, asthe fertilizer applied remains confined to therootzone of the crop. Studies revealed significantfertilizer savings of 20–60% and 8–41% increase inyields of horticulture and vegetable crops due tofertigation. Fertilizer use efficiency up to 95% can beachieved through drip fertigation (Singh et al., 2010).
Maximization of crop yield and quality andminimization of leaching below the rooting zone maybe achieved by managing fertilizer concentrationsin measured quantities of irrigation water, accordingto crop requirements. Fertigation saves fertilizer asit permits applying fertilizer in small quantities at atime matching with the plants nutrient need. Besidesit is considered eco-friendly as it avoids leaching offertilizers (Sharma et al., 2012).
Information on the nutrient movement anddistribution under fertigation is rather scanty. Verylittle work has been done on spatial distribution ofthe fertilizer nutrients supplied through fertigation.Hence, an attempt was made to investigate thenitrogen and potassium dynamics in soil under dripirrigation and fertigation system in mulberry. Theobjective of this paper is to study the movement anddistribution of moisture and fertilizer under dripfertigation and compare it with conventionalirrigation method.
33
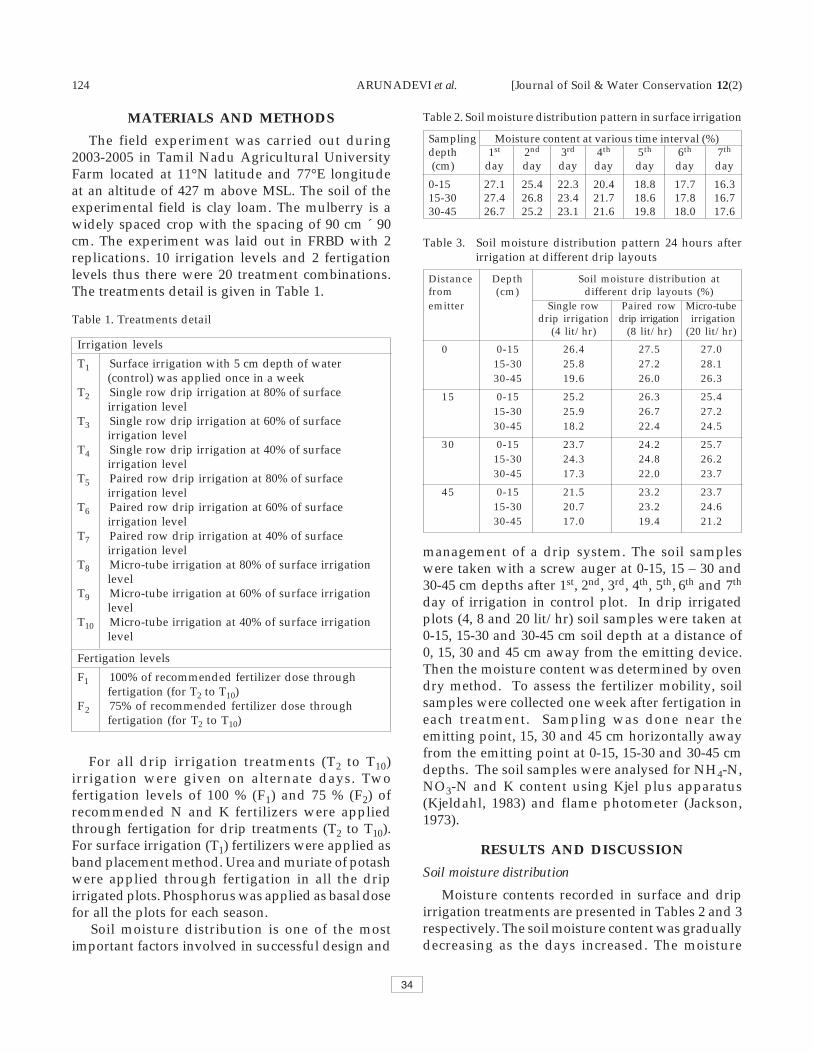
124 ARUNADEVI et al. [Journal of Soil & Water Conservation 12(2)
MATERIALS AND METHODS
The field experiment was carried out during2003-2005 in Tamil Nadu Agricultural UniversityFarm located at 11°N latitude and 77°E longitudeat an altitude of 427 m above MSL. The soil of theexperimental field is clay loam. The mulberry is awidely spaced crop with the spacing of 90 cm ´ 90cm. The experiment was laid out in FRBD with 2replications. 10 irrigation levels and 2 fertigationlevels thus there were 20 treatment combinations.The treatments detail is given in Table 1.
Table 1. Treatments detail
Irrigation levels
T1 Surface irrigation with 5 cm depth of water(control) was applied once in a week
T2 Single row drip irrigation at 80% of surfaceirrigation level
T3 Single row drip irrigation at 60% of surfaceirrigation level
T4 Single row drip irrigation at 40% of surfaceirrigation level
T5 Paired row drip irrigation at 80% of surfaceirrigation level
T6 Paired row drip irrigation at 60% of surfaceirrigation level
T7 Paired row drip irrigation at 40% of surfaceirrigation level
T8 Micro-tube irrigation at 80% of surface irrigationlevel
T9 Micro-tube irrigation at 60% of surface irrigationlevel
T10 Micro-tube irrigation at 40% of surface irrigationlevel
Fertigation levels
F1 100% of recommended fertilizer dose throughfertigation (for T2 to T10)
F2 75% of recommended fertilizer dose throughfertigation (for T2 to T10)
Table 2. Soil moisture distribution pattern in surface irrigation
Table 3. Soil moisture distribution pattern 24 hours afterirrigation at different drip layouts
Distance Depth Soil moisture distribution atfrom (cm) different drip layouts (%)emitter Single row Paired row Micro-tube
drip irrigation drip irrigation irrigation(4 lit/hr) (8 lit/hr) (20 lit/hr)
0 0-15 26.4 27.5 27.015-30 25.8 27.2 28.130-45 19.6 26.0 26.3
15 0-15 25.2 26.3 25.415-30 25.9 26.7 27.230-45 18.2 22.4 24.5
30 0-15 23.7 24.2 25.715-30 24.3 24.8 26.230-45 17.3 22.0 23.7
45 0-15 21.5 23.2 23.715-30 20.7 23.2 24.630-45 17.0 19.4 21.2
For all drip irrigation treatments (T2 to T10)irrigation were given on alternate days. Twofertigation levels of 100 % (F1) and 75 % (F2) ofrecommended N and K fertilizers were appliedthrough fertigation for drip treatments (T2 to T10).For surface irrigation (T1) fertilizers were applied asband placement method. Urea and muriate of potashwere applied through fertigation in all the dripirrigated plots. Phosphorus was applied as basal dosefor all the plots for each season.
Soil moisture distribution is one of the mostimportant factors involved in successful design and
management of a drip system. The soil sampleswere taken with a screw auger at 0-15, 15 – 30 and30-45 cm depths after 1st, 2nd, 3rd, 4th, 5th, 6th and 7th
day of irrigation in control plot. In drip irrigatedplots (4, 8 and 20 lit/hr) soil samples were taken at0-15, 15-30 and 30-45 cm soil depth at a distance of0, 15, 30 and 45 cm away from the emitting device.Then the moisture content was determined by ovendry method. To assess the fertilizer mobility, soilsamples were collected one week after fertigation ineach treatment. Sampling was done near theemitting point, 15, 30 and 45 cm horizontally awayfrom the emitting point at 0-15, 15-30 and 30-45 cmdepths. The soil samples were analysed for NH4-N,NO3-N and K content using Kjel plus apparatus(Kjeldahl, 1983) and flame photometer (Jackson,1973).
RESULTS AND DISCUSSION
Soil moisture distribution
Moisture contents recorded in surface and dripirrigation treatments are presented in Tables 2 and 3respectively. The soil moisture content was graduallydecreasing as the days increased. The moisture
Sampling Moisture content at various time interval (%)depth 1st 2nd 3rd 4th 5th 6th 7th
(cm) day day day day day day day
0-15 27.1 25.4 22.3 20.4 18.8 17.7 16.315-30 27.4 26.8 23.4 21.7 18.6 17.8 16.730-45 26.7 25.2 23.1 21.6 19.8 18.0 17.6
34

April-June 2013] MOISTURE DISTRIBUTION AND FERTILIZER 125
content of soil after 1 day of irrigation varies in therange of 26 to 27.4 % in various soil depths. After 7days of irrigation the moisture content was reducedgradually in the range of 16.3 to 17.6 %. The soilmoisture content at surface layer in surface irrigationtreatment was lower compared to subsurface layersas the days after irrigation increased and there wasmore depletion of moisture in 0-15 cm layer due toevaporation.
Moisture content estimated 24 hours afterirrigation at various horizontal distances from theemitter point indicated that the moisture contentdecreased in deeper soil layers as the distance fromemitters increased. In single row drip irrigationsystem (with emitter capacity 4 lit/hr) the highermoisture content (25.9 %) was found at 15-30 cmdepth at 15 cm away from the emitting point,whereas the lowest moisture content was found at30-45 cm depth at 45 cm away from the emittingpoint. In paired row drip irrigation (with emittercapacity 8 lit/hr) and paired row micro tubeirrigation (emitter capacity 20 lit/hr) the highermoisture content was found in the upper layer ofsoil depth near the emitting point. Overall in 8 and20 lit/hr emission devices, the estimated moisturecontent was more or less equal and the field capacitylevel was maintained in all the layers since thedripper capacity is more. The moisture contentdecreased as the distance and depth increased fromthe emitting point in all the drip layouts. Themoisture content decreased as the distance increasedfrom the emitting point. Soil moisture distributionmainly depended on the rate of application, amountof water and initial moisture content of the soil(Khepar et al., 1983). The moisture content in thelower layers was high compared to the surface layer.Further, soil moisture decreased with decreased levelof irrigation. This was also indicated by Chakrabortyet al. (1998) that the soil water content was relativelyhigher by volume near the emitter throughout theexperiment. The soil water content decreased as thedistance from the emitting point increased.
Fertilizer distribution in soil
Observations were taken on potassium,ammonium and nitrate concentrations in the soilsamples taken at 0-15, 15-30 and 30-45 cm depths ofthe profile at the emitting points and 15, 30 and 45cm horizontally away from the emitting points oneweek after fertigation.
Nitrate-nitrogen movement and distribution
During crop growth period, in the fertigationtreatments the maximum concentrations of NO3-Nwere found at some depth in the profile. Thedistribution pattern was more or less similar for allthe fertigation treatments, although there wasdifference in the level of concentration.
Surface irrigation with 100 % recommended fertilizer dose(T1F1)
In surface irrigation with 100 % recommendedfertilizer dose treatment the maximum concentration(35 mg g-1) was found in depth of 15-30 cm comparedto 0-15 cm and 30-45 cm layers.
Comparison of surface irrigation with drip at 80 % ofsurface irrigation and 100 % of recommended fertilizerdose (T2F1 and T5F1)
In treatments T2 and T5 (80 % of surface irrigation),maximum NO3-N concentration occurred at 45 cmdepth below the emitting point but it was more at0-15 cm depth at a distance of 15 cm away from theemitter. At a distance of 30 cm away from emitter,concentration was more at 15-30 cm depth for T2 andit was more at 45 cm depth for T5. At a distance of45 cm away from emitter, similar distribution andconcentration were found. In T2, the maximumconcentration was 49 mg g-1 at 30-45 cm depth andin T5, the maximum concentration was 42 mg g-1 at0-15 cm depth 15 cm away from the emitting point(Fig. 1). In T5, the concentration at 30-45 cm depthbelow the emitting point was 35 mg g-1. This maybe due to higher emitter discharge (8 lit/hr), whichleached NO3-N to lower layers i.e. beyond 45 cmdepth.
Fig. 1. NO3-N distribution for surface irrigation vs. dripirrigation at 80% of surface irrigation
35

126 ARUNADEVI et al. [Journal of Soil & Water Conservation 12(2)
Comparison of surface irrigation with drip and Micro-tube system at 60% of surface irrigation and 75% ofrecommended fertilizer dose (T6F2 and T9F2)
In the treatments T6 and T9 (60% of surfaceirrigation with 75 % of recommended fertilizer dose),maximum NO3-N concentrations of 42 and 35 mgg-1 were obtained at 30-45 cm depth below theemitting point and 15-30 cm depth at 15 cm awayfrom emitting point respectively (Fig. 2). In T9, theconcentration at 30-45 cm depth below the emittingpoint was 35 mg g-1. Due to higher emitter discharge(20 lit/hr), the NO3-N might be leached to lowerlayers, i.e. beyond 45 cm depth.
maximum at 30-45 cm depth below the emittingpoint and at 0-15 cm depth at 30 cm away from theemitting point. In both the treatments, at 45 cm awayfrom the emitting point, the concentration was less,which may be due to application of water at 40 % ofsurface irrigation, wherein water movement beyond30 cm is less. Under micro irrigation treatments (T2to T10) urea was applied through drip and Micro-tubes, whereas in T1, the flood irrigation system wasemployed with band placement of fertilizers. Dueto difference in the quantum of water appliedthrough different drip treatments, the concentrationwas different in different layers. Due to leachingeffect in T1, the concentration was less up to 30-45cm depth, but maximum concentration in driptreatments was confined to within 30-45 cm depthsince Nitrate ion being mobile had a tendency tomove away from the emitter to the periphery of thewater front. Gerstle et al. (1981) reported the bromacildistribution for the weekly irrigation treatmentexhibited a highly leached zone around and underthe emitter and a small zone of concentration on thesoil surface near the wetting front due to alternatewetting and evaporation cycles. Karlen et al. (1985)studied the effect of N fertilizer application to tomatoand found that NO3-N concentration was higher inupper 30 cm soil layer due to fertigation thanbroadcasting of fertilizer. Subbarayappa et al. (1994)stated that mulberry absorbed nitrogen either asammonium (NH4
+) or as nitrate ion (NO3-). The
ammonium ions could be held in a exchangeable andavailable form on the surfaces of clay and humus.Chakraborty et al. (1999) stated that NO3-N neitheraccumulated at the periphery of the wetting frontnor was leached from the root zone under dripsystems.
NH4-N movement and distribution
NH4-N movement and distribution did not showany marked difference among the treatments.
Surface irrigation with 100 % recommended fertilizer dose(T1F1)
In T1, maximum NH4-N concentration of 56 mgg-1 was registered at 30-45 cm depth followed by 49mg g-1 at 15-30 cm depth. It was unevenly distributedat different distances from plant. Uniformdistribution of fertilizers through fertigation wasfound in drip treatments rather than in bandplacement in surface irrigation method.
Fig. 2. NO3-N distribution for surface irrigation Vs dripirrigation at 60% of surface irrigation
Comparison of surface irrigation with drip and Micro-tube system at 40 % of surface irrigation and 75 % ofrecommended fertilizer dose (T4F2 and T10F2)
Maximum NO3-N concentration (35 mg g-1) wasrecorded at 15-30 cm depth below the emittingpoint and 15 cm away from the emitting point in T4(Fig. 3). In T10, the concentration of NO3-N was
Fig. 3. NO3-N distribution for surface irrigation Vs dripirrigation at 40% of surface irrigation
36
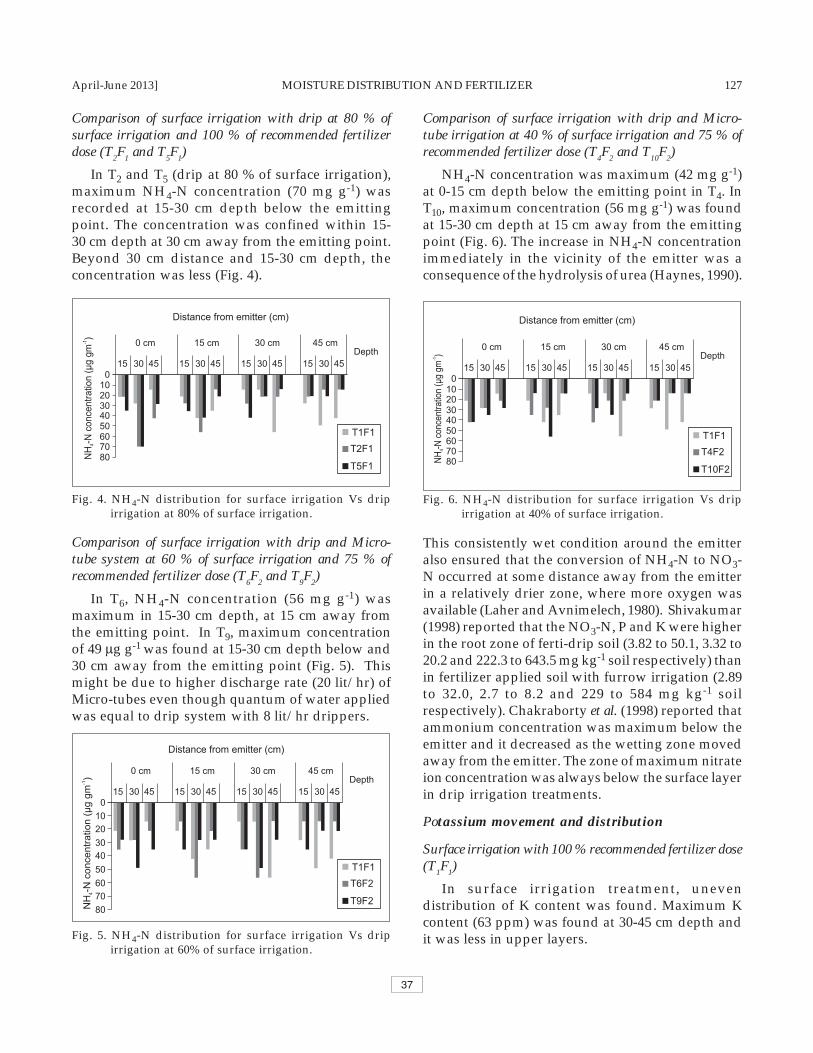
April-June 2013] MOISTURE DISTRIBUTION AND FERTILIZER 127
Comparison of surface irrigation with drip at 80 % ofsurface irrigation and 100 % of recommended fertilizerdose (T2F1 and T5F1)
In T2 and T5 (drip at 80 % of surface irrigation),maximum NH4-N concentration (70 mg g-1) wasrecorded at 15-30 cm depth below the emittingpoint. The concentration was confined within 15-30 cm depth at 30 cm away from the emitting point.Beyond 30 cm distance and 15-30 cm depth, theconcentration was less (Fig. 4).
Comparison of surface irrigation with drip and Micro-tube irrigation at 40 % of surface irrigation and 75 % ofrecommended fertilizer dose (T4F2 and T10F2)
NH4-N concentration was maximum (42 mg g-1)at 0-15 cm depth below the emitting point in T4. InT10, maximum concentration (56 mg g-1) was foundat 15-30 cm depth at 15 cm away from the emittingpoint (Fig. 6). The increase in NH4-N concentrationimmediately in the vicinity of the emitter was aconsequence of the hydrolysis of urea (Haynes, 1990).
Comparison of surface irrigation with drip and Micro-tube system at 60 % of surface irrigation and 75 % ofrecommended fertilizer dose (T6F2 and T9F2)
In T6, NH4-N concentration (56 mg g-1) wasmaximum in 15-30 cm depth, at 15 cm away fromthe emitting point. In T9, maximum concentrationof 49 g g-1 was found at 15-30 cm depth below and30 cm away from the emitting point (Fig. 5). Thismight be due to higher discharge rate (20 lit/hr) ofMicro-tubes even though quantum of water appliedwas equal to drip system with 8 lit/hr drippers.
Fig. 5. NH4-N distribution for surface irrigation Vs dripirrigation at 60% of surface irrigation.
This consistently wet condition around the emitteralso ensured that the conversion of NH4-N to NO3-N occurred at some distance away from the emitterin a relatively drier zone, where more oxygen wasavailable (Laher and Avnimelech, 1980). Shivakumar(1998) reported that the NO3-N, P and K were higherin the root zone of ferti-drip soil (3.82 to 50.1, 3.32 to20.2 and 222.3 to 643.5 mg kg-1 soil respectively) thanin fertilizer applied soil with furrow irrigation (2.89to 32.0, 2.7 to 8.2 and 229 to 584 mg kg-1 soilrespectively). Chakraborty et al. (1998) reported thatammonium concentration was maximum below theemitter and it decreased as the wetting zone movedaway from the emitter. The zone of maximum nitrateion concentration was always below the surface layerin drip irrigation treatments.
Potassium movement and distribution
Surface irrigation with 100 % recommended fertilizer dose(T1F1)
In surface irrigation treatment, unevendistribution of K content was found. Maximum Kcontent (63 ppm) was found at 30-45 cm depth andit was less in upper layers.
Fig. 4. NH4-N distribution for surface irrigation Vs dripirrigation at 80% of surface irrigation.
Fig. 6. NH4-N distribution for surface irrigation Vs dripirrigation at 40% of surface irrigation.
37

128 ARUNADEVI et al. [Journal of Soil & Water Conservation 12(2)
Comparison of surface irrigation with drip at 80 % ofsurface irrigation and 100 % of recommended fertilizerdose (T2F1 and T5F1)
Maximum K content (64 ppm) was recorded at15-30 cm below the emitting point in T2. Up to 45 cmdepth and 45 cm away from the emitting point thedistribution was similar. In T5, maximum K content(67 ppm) was recorded at 45 cm below the emittingpoint (Fig. 7).
recorded at 0-15 cm depth below the emitting point.In T10, maximum K content of 62 ppm was estimatedat 0-15 cm depth at 15 cm away from the emittingpoint (Fig. 9). The concentration decreased as thedistance increased from the emitting point due toless quantum of water supplied in this treatment.
Comparison of surface irrigation with drip and Micro-tube system at 60 % of surface irrigation and 75 % ofrecommended fertilizer dose (T6F2 and T9F2)
In T6, maximum K content (62 ppm) wasestimated at 15-30 cm depth at 15 cm away fromthe emitting point. In T9, maximum K content (64ppm) was found at 30-45 cm below the emittingpoint (Fig. 8).
Comparison of surface irrigation with drip and Micro-tube system at 40 % of surface irrigation and 75 % ofrecommended fertilizer dose (T4F2 and T10F2)
In T4, maximum K content (59 ppm) was
CONCLUSIONS
Soil moisture content at surface layers in surfaceirrigation treatment was lower compared tosubsurface layers because of higher density of rootsand more depletion of moisture in the 0-15 cm layerdue to evaporation. In drip irrigation treatments, themoisture content decreased as depth and distanceincreased from the emitting point. The fertilizerdistribution in the soil layers was more or less similarfor all the fertigation treatments, although there wasdifference in the level of concentration in differentdepths of the soil. Since, venturi device was used forfertigation, there was a high pressure loss in thesystem which might results in uneven fertilizerdistribution in the soil. A drip irrigation systemproducing a uniform water application does notnecessarily mean a uniform fertilizer distributionwhen it is used for fertigation. The fertigation devicesperformances should be considered in detail foruniform fertilizer distribution, hence therelationship between water application uniformityand fertigation uniformity for a drip irrigationsystem was highly associated with injection method.
REFERENCES
Asadi, A., Malakouti,M.J and Emdad, M.R. 2005. Effectof Irrigation Methods and Balanced Fertilization onthe Yield and Water Use Efficiency of Citrus inMazandaran. Soil and Water Sciences Journal. 18(2):125-135.
Fig. 7. Potassium distribution for surface irrigation Vs dripirrigation at 80% of surface irrigation.
Fig. 8. Potassium distribution for surface irrigation Vs dripirrigation at 60% of surface irrigation.
Fig. 9. Potassium distribution for surface irrigation Vs dripirrigation at 40% of surface irrigation.
38

April-June 2013] MOISTURE DISTRIBUTION AND FERTILIZER 129
Chakraborty, D., Singh, A.K., Kumar, A., Uppal, K.S. andKhanna, M. 1998. Effect of fertigation on nitrogendynamics in Broccoli. Workshop on Micro Irrigationand Sprinkler Irrigation Systems, 28-30 April 1998.New Delhi. Proceedings, Central Board of Irrigation andPower. Editors. C.V.J. Varma and A.R.G. Rao, MalchaMarg, New Delhi -21.
Chakraborty, D., Singh, A.K., Kumar,A. and Khanna, M.1999. Movement and distribution of water andnitrogen in soil as influenced by fertigation inBrocccoli. Journal of Water Management. 7 (1&2): 8-13.
Gerstle, Z., Saltzman, S., Kliger, L. and Yaron, B. 1981.Distribution of herbicides in soil in a simulated dripirrigation system. Irrigation Science. 2: 155-166.
Haynes, R.J. 1990. Movements and transformations offertigated nitrogen below trickle emitters and theireffects on pH in the wetted soil volume. FertilizerResearch. 23:105-112.
Jackson, M.L. 1973. Soil Chemical Analysis. Prentice Hallof India, New Delhi. India. pp. 326-338.
Karlen, D.L., Camp, C.R. and Robbins, M.L. 1985. Freshmarket tomato response to N and K fertilization andwater management. Soil Sci. and Plant Analysis.16: 7-81.
Khepar, S.D., Neogy, P.K. and Kausal, M.P. 1983. Moistureand salt distribution pattern under drip irrigation.Proceeding Second National Seminar on Drip Irrigation.TNAU, Coimbatore-3.
Kjeldahl, L. 1983. A. Chem. 22: 336.Laher, M. and Avnimelech, Y. 1980. Nitrification
inhibition in drip irrigation systems. Plant and Soil. 55:35-42.
Malakouti, M. J. and Basirat, M. 2003. Fertigation is animportant to increase yield, water use efficiency(WUE) and fertilizer use efficiency (FUE). HorticulturalAffairs, Ministry of Jihad-e-Agriculture. Tehran, Iran.
Sharma, S., Halder, A., Patra, S.K. and Ray, R. 2012. Effectof drip irrigation and nitrogen fertigation on wateruse efficiency (WUE) and cost economics of guava cv.Khaja. Progressive Horticulture. 44(1): 136-141.
Shivakumar, H.R. 1998. Effect of fertigation on growth,leaf yield and quality of mulberry and its impact onsilkworm larval growth, cocoon and silk qualitycharacters. Mysore J. Agri. Sci., 33: 191-192.
Singh, R.M., Singh, D.K. and Rao, KVR. 2010. Fertigationfor Increased Crop Yield and Fertilizer Saving.Agricultural Engineering Today. 34(2): 12-16. Print ISSN: 0970-2962. Online ISSN : 2230-7265.
Subbarayappa, C.T., Sundareswaran, P., Sinha, A.K. andReddy, M.M. 1994. Nitrogen Nutrition in mulberrygarden. Indian Silk. 33(1): 7-10.
Vaezi, A. R., Homaee,M. and Malakouti, M.J. 2003. Effectof Fertigation on Fertilizer Use Efficiency and WaterUse Efficiency on Forage Corn. Soil and Water SciencesJournal. 16(2): 150-160.
39

130 PATANAIK et al. [Journal of Soil & Water Conservation 12(2)
Journal of Soil and Water Conservation 12(2): 130-135, April-June 2013ISSN: 022-457X
Determination of drainage coefficient for surface drainagedesign in rainfed low land rice areas of Mahanadi Delta
P. K. PATANAIK1, J. C. PAUL2 and B. PANIGRAHI3
Received: 7 December 2012; Accepted: 17 May 2013
ABSTRACT
The concept of drainage coefficient is used in the design of drainage systems for agricultural lands.The design of an economic and hydrological efficient surface drainage system depends largely onthe selection of a proper drainage coefficient. In this paper, an attempt was made to compute thedrainage coefficient from rainfall data in the lowland water logged areas of Daya-Bhargavi doab ofMahanadi delta, Odisha, for paddy crop. The computation procedure involved the probabilityanalysis of 21 yrs daily rainfall data and use of Simplified Hydrologic Procedure, Curve Numbermethod, Cypress-Creek formula and Rational method. The values of drainage coefficient computedby Curve Number method and Cypress-Creak formula were found to be closer and the SimplifiedHydrologic Procedure gave a slightly higher value. The values of drainage coefficient computed byCurve Number method and Cypress-Creak formula are found to be 26.86 mm/day and 31.69 mm/day, respectively and the Simplified Hydrologic Procedure and Rational formula give higher valuesof 45 mm/day and 360.56 mm/day, respectively. The drainage coefficient of 26.86 mm/day ascomputed by Curve Number method is found to be the best fit value for the study area that is to beadopted for design of surface drainage system with 7 days storm and 8 years return period.Accordingly the value of design method of discharge as obtained by the curve number method fordesign of surface drainage system is computed as 0.59 m3/s. A value of 0.59 m3/s as design dischargefrom CN method and 6.74 m3/s as peak discharge from Rational method are found suitable for thedesign of the channel and the outfall structure, respectively.
Key words: Drainage coefficient, lowland rice, Mahanadi delta, Surface drainage system, Waterlogged area
1Assistant Agricultural Engineer, Deptt. of Agriculture, Govt. of Orissa, Bhubaneswar2Associate Professor, 3Professor, College of Agricultural Engineering and Technology, OUAT, Bhubaneswar – 751 003, Orissa, Email: [email protected]
INTRODUCTIONMahanadi river basin is the biggest drainage
basin among all the drainage basins of Odisha whichspreads over an area of 65,581 sq.km. having achannel length of 494 km in the state. Mahanadidelta is the oldest irrigation system of Odishaoccupying an area of 9 lakh sq. km. out of which,irrigation is provided to a gross command area of5.2 lakh ha and culturable command area of 3.03lakh ha. The general slope of the area is 0.20%to0.03%. The delta area is divided into two distinctstages viz. stage-I and stage-II. The total commandarea of Mahanadi Delta is divided into eight
numbers of sub areas bonded by river branchingand the sea. Each sub area becomes the commandarea between two rivers and is called a ‘doab’which is an independent drainage unit. Each stagecomprises of 4 numbers of doabs. In stage-I deltacommand area, the flood embankments arecontinuous. There is no possibility of water fromother drainage basins entering into the commandarea except in case of breaches. But in stage- II area,escapes have been provided in the riverembankments to give them relief by allowing certainquantities of flood water into the command areaafter the river discharge exceeds a fixed limit. These
40

April-June 2013] DETERMINATION OF DRAINAGE COEFFICIENT 131
escapes are located near the head of the doabs andthe water gets entry into the drainage channelsincreasing their congestion problem (Annonymous,1989). Hence the stage-II delta has more acute waterlogging problems than stage-I delta. The flattopography, non uniform and heavy rainfall duringsouth-west monsoon season i.e. June to Septemberand congestion of drainage channels aggravate theproblems of water logging. Once the flood water isallowed to enter the doab area, it is not easily drainedand water logging remains there for a long period.Most of the irrigated areas under paddy crop aresubjected to submergence for periods more than 4to 10 days. The rising water table restricts soilaeration and root development of the crops, affectssoil temperature, hinders with tillage operations andbrings up harmful substances to the crop root zonedepth. It is a recurring phenomenon every yearleading to considerable crop damage and economicloss at many places of coastal belt of Orissa.However, existing drainage systems in the Mahanadidelta of Odisha are poor due to improper designof surface drainage system. Further, variousreasons for water logging condition of these areasare seepage from unlined canals, damaged portionsof lined canal beds, blockage of natural drainagedue to the net work of canal and roads, poorworking of existing surface drainage systems,under utilization of groundwater for irrigation,internal flow of subsurface water and injudiciouswater management (Chitale, 1991).
During monsoon, the heavy and concentratedrainfall causes severe water logging and damage tothe rice crop at some growth stage or the other. It isa recurring phenomenon every year leading toconsiderable crop damage. Efforts are thereforeneeded to develop the surface drainage system ofthese areas to reduce the severity of water logging.The design of an economic and efficient surfacedrainage system depends to a very great extent onthe selection of a proper drainage coefficient (Raoand Dhruvanarayana, 1979). In this paper, thevarious methods of determining drainage coefficientare discussed and compared so as to test theirsuitability for adoption as per the present fieldconditions.
Study Area
The study area comes within MahanadiCommand Area Stage-II under Daya- Bhargavi doab,
the third largest doab of Mahanadi delta system.The GCA and CCA of the doab are 0.089 Mha and0.047 Mha respectively out of which 0.0203 Mhaarea is affected by poor drainage (Panda and Rajput,2003). The study area belongs to villages KakudiKusanga and Parinjhar and is getting its runoff froma catchment area of 190 ha covering village KakudiKusanga and surrounding villages namely Parinjharand Jhintisasan. The ayacut of the study area isbounded by Tarakaj trunk drain in the south,Sakhigopal branch canal in the east and Binayakpurminor in the west. The water logging problems ofthe area become aggravated by its flat topographyand paddy - paddy cropping pattern. Thetopography is nearly flat with average land slope of0.05% and the soil texture is generally sandy loamto clay loam. The average annual rainfall of the regionis found to be 1419 mm. During crop growth period,the average standing water depth in the rice fieldsvary from 15 cm to 75 cm.
MATERIALS AND METHODSDrainage coefficient is the key parameter for
design of surface drainage system. An increase indrainage coefficient value helps in reduction ofmaximum ponding depth and duration of pondage,but it involves larger channel dimensions, more lossof agricultural land and more cost of construction.On the other hand, an underestimation of this valuemay result in crop loss due to yield reduction. Hencethere is a need for balance between the drainagecoefficient and the depth/duration of submergencebased on the crop tolerance limit. The materialsused and various methods and procedures adoptedfor determination of drainage coefficient aresummarized into the following steps-
The daily rainfall data covering a period of 21years (1990-2010) was collected for the study areafrom the District Emergency (Flood) Cell, Puri. Forthe rice area under study, crop tolerance period andthe depth of submergence allowed were assumed as7 days and 150 mm, respectively. A return period of8 years was adopted for rainfall analysis byconsidering one crop failure in 4 years due toirrigation i.e. 75 % dependable irrigation as well asone failure in 8 years due to drainage congestion(Anonymous, 1989). The moving total method wasadopted using Microsoft-Excel to make the movingtotals of daily rainfall data for 7 consecutive daysand their maximum values were obtained for a
41

132 PATANAIK et al. [Journal of Soil & Water Conservation 12(2)
particular year. The process was repeated forcomputation of 7 consecutive days rainfall for whole21 years of data. Probabilities of occurrence of 7days maximum consecutive rainfall at various returnperiods were computed by Weibull’s plottingposition formula. The 7-day maximum rainfallcorresponding to return period of 8 years werecomputed. Deducting a storage depth of 150 mm,the resulting rainfall magnitude was used for thehydrologic design i.e. computation of the drainagecoefficient and design runoff. The followingapproaches were considered for estimation ofdrainage coefficient.1) Methods for direct depth measurement-
a) Simplified hydrologic procedure or DDFcurve method, b) Curve number method
2) Methods for Volumetric measurement-a) Cypress-Creek formula, b) Rational formula
Simplified Hydrologic ProcedureThis procedure was established by Raadsma and
Schulze (1974) and also suggested by Ritzema (1994).This is a graphical method to determine drainagecoefficient with the help of rainfall depth-duration-frequency curve. The losses due to interception,infiltration and evapotranspiration are neglected inthis procedure due to maximum saturated conditionsof atmosphere and soil surface. The drainagecoefficient computed by this method is independentof the size of the watershed. A minimum allowanceis made for surface ponding for the said crop andany water excess than this limit is to be removedby the drainage system within that particularperiod. The low land rice areas like Mahanadi deltacommand area usually satisfy the aboveassumptions and the drainage coefficient iscomputed accordingly.
To compute drainage coefficient, the maximumconsecutive daily rainfall are determined for thestudy area for different return periods. Theduration and depth of rainfall are plotted along Xand Y axis, respectively. For each return period,the depth–duration curve is drawn which is calledDDF curve of rainfall. For paddy crop and for thestudy area, as discussed earlier, a storage depth of150 mm and a return period of 8 years has beenadopted. A tangent from 150 mm point on depth Yaxis is drawn to the depth duration frequency(DDF) curve. The slope of this tangent line givesthe drainage coefficient or design discharge rate in
mm/day. To make the slope calculation easy, thetangent line is simply shifted to pass through theorigin of graph to get a line parallel to the originaltangent line. Here the area bounded by thisdrainage coefficient line and the X axis representsthe water to be drained out from crop field.Similarly the area between this line and the rainfallcurve indicates the storage depth of excess waterwithin that period.
Curve Number (CN) Method
It is known as Hydrologic Soil Cover Complexmethod or simply CN method. The term HydrologicSoil Cover Complex is adopted as it considers theeffect of soil type or group, soil wetness or antecedentmoisture condition (AMC), land coverage byvegetation and nature of cultivation practices etc andthe combined effect of all these parameters isexpressed by the term ‘Curve Number’. By CNmethod, the ‘design rainfall’ is converted to the‘design runoff’ and the drainage coefficient iscomputed as follows:
Direct runoff or surface runoff,
Where, Ia = Initial abstraction from rain=0.3 Staken for the present project,
P = Rainfall depth and S = Maximum or potentialabstraction
So, where,
This depth of runoff is to be removed within aperiod of 7 days.
Cypress-Creek Formula
The formula estimates the design discharge rateof runoff as,
Q = CAp
where, Q = Design discharge in cumec,A = Watershed area in Sq.km = 1.9 sq.km.p = Index of A, usually equal to 5/6 or 0.833.C =Coefficient which takes care of characteristics
of soil/vegetation, land slope, rainfall condition etc.and is calculated by Stephens & Mills formula as,
C = 0.2089 + 0.0074 ReWhere, Re = Rainfall excess in mm as estimated
by CN method.
42

April-June 2013] DETERMINATION OF DRAINAGE COEFFICIENT 133
Rational Formula
Rational formula is the most widely usedprocedure to estimate the peak rate of runoff atthe outlet of watershed.
The peak discharge is given by,
Q = CIA / 36where, Q = peak runoff rate in m3/sec;
A= watershed area in ha; I = rainfall intensity incm/hr for a duration equal to time of concentration(Tc) and for a particular return period; C = runoffco-efficient = 0.3 assumed for the study area.
The time of concentration ‘Tc’ is the mostimportant factor to decide the rainfall intensity ‘I’ inthe formula which is given by Kirpitch formula as:
Tc = 0.0195 L0.77 S-0.385
where, Tc= time of concentration in minute;L = maximum length of water flow i.e from mostremote point to the outlet in metre (calculated 1800m for the study area); S = average slope of watershedland in m/m (calculated 0.0005 for the study area).
To find the rainfall intensity for the estimated Tcvalue, the 1 hour rainfall maps of India for 10yr &25yr return periods and the intensity conversiongraph have been obtained from Murty and Jha (2009).Now corresponding to the available value of 1hrrainfall intensities (along Y-axis), the intensity forduration equal to Tc(in min.) can be found out fromX-axis. This value will be the ‘I’ value in the Rationalequation.
RESULTS AND DISCUSSION
Simplified Hydrologic Procedure
The maximum consecutive daily rainfall valuesfrom 1 to 7 days are determined for different returnperiods as shown in table 1 and the DDF curves weredrawn and is presented in Fig. 1. For the presentstudy, 8 yrs return period was considered. So a
tangent was drawn to the 8 yr return period curvefrom the point of 150mm rainfall as shown in fig.no.4. The slope of the line was coming out as 45.Thus the drainage coefficient was found to be 45mm/day. Here, as indicated in the graph, the excessponding water within these 7 consecutive daysperiod, reaches to a height ranging from 30 mm(end of 7 day) to 170.6 mm (end of 2 days).
Table 1. Maximum consecutive day rainfall (mm) atdifferent return periods
Return 1 2 3 4 5 6 7Period day days days days days days days
5 years 172.7 252.2 288.8 300.7 301.2 309.1 323.3
8 years 177.5 260.6 299.1 313.4 313.4 319.1 345.1
10 years 181.8 265.5 311.4 323.6 323.6 325.5 387.7
20 years 192.2 279.5 347.4 424.7 497.5 572.7 662.6
SCS-Curve Number Method
The project area falls into AMC–III category andsoil group–B. Under such conditions the value of thecurve number using the conversion factor for AMC–III came out to be 98. Now, potential maximumretention,
= 5.18 mm
The 7 days consecutive rainfall for 8 yrs returnperiod from the probability analysis =345 mm
Deducting the storage depth of 150mm, rainfalldepth (P) =195mm
Direct runoff depth, Q = (P-0.3S) 2/ (P+0.7S) =(195-0.3×5.18)2/ (195+0.7×5.18) =188mm
Hence, Drainage coefficient or rainfall excess =
= 26.86 mm/ day
Cypress – Creek Formula
Rainfall excess , Re = 26.86 mm/ day, as foundout by CN method
Runoff coefficient, C = 0.2089 + 0.0074 (Re) =0.4086
Fig 1. Rainfall DDF Curve at different return periods
43
134 PATANAIK et al. [Journal of Soil & Water Conservation 12(2)
Design Discharge, Q = CAp = 0.4086(1.9)0.833
= 0.697 cumec So, Drainage coefficient = Discharge / Area =
0.697 cumec / 190 ha = 31.69 mm/day
Rational Formula
The time of concentration (Tc) = 0.0195 (1800)0.77 (0.0005) -0.385 =116.8 mins.a) For channel design, the 10 year return period
map indicates that the 1 hour rainfall for thegiven location= 80mm/hr or, 8cm/hr. Usingconversion graph, the desired rainfall intensityfor a duration equal to time of concentration of116.8mins = 5.0cm/hr
Hence, Peak discharge, Qp = CIA / 36 =(0.3x5.0x190)/36 = 7.92 cumec
So, the Discharge rate or the Drainage Coefficientfor the area = Qp / Area = 7.92cumec / 190ha =0.36 m / day i.e. 360 mm / dayb) For Structural design, usually a return period
of 25 yrs is considered and the map shows that,the 1 hour rainfall for the given location= 100mm/hr or 10cm/hr. From conversion graph,the desired rainfall intensity for duration equaltime of concentration of 116.8 min = 7.1 cm/hr.
Hence, peak discharge will be Qp = CIA/36 =(0.3x7.1x190)/36 = 11.24 cumec
Now the drainage coefficient and design/peakdischarge as calculated by different approaches aresummarized below:
Methods Drainage Design Peakadopted coefficient discharge discharge
(mm/day) (cumec) (cumec)
SHP/DDF 45.00 0.989 -curve method
SCS-CN method 26.86 0.59 -
Cypress-Creek 31.69 0.697 -formula
Rational formula 360.56 - 7.92 (channel)11.24
(Structure)
safer side as it is a general practice to provideprotection to farm crops against storms of 2 to 5year return periods (Rao and Dhrubanarayan, 1979).A higher drainage coefficient indicates higher costand larger dimensions that consume moreagricultural land which may not accommodate tothe available field conditions. Higher drainagecoefficient values are required for vegetables fortheir survival as they can withstand only 24hrs ofsubmergence (Murthy and Jha, 2009). But in caseof paddy, higher drainage coefficient is notrequired for surface drainage design as the cropcan withstand relatively higher depth of standingwater for some days. On the contrary, lower valuesof drainage coefficient are permissible although itcreates the temporary inundation of theneighbouring agricultural lands (Bhattacharya andMichael, 2003). The SCS-CN method or Cypress-Creek formula give similar and acceptable resultsfor drainage rates to be taken for drainage channeldesign. But preference should be given to CurveNumber method because it takes in to account manyparameters like soil characteristics, rainfall, fieldmoisture conditions, physical condition ofwatershed etc, where as Cypress-Creek formula isonly an empirical formula which is developed basedon observations at a particular place and may notexactly fit to the other areas. Hence the valueobtained by CN method may be taken for designof surface drainage channels.
The Rational method gives a very high value ofdrainage coefficient for drainage design. This isbecause this formula assumes a uniform distributionof rainfall intensity over the whole catchment areawhich does not occurs in real situation. Rather,rainfall occurs with high intensities and shortdurations over small areas and never becomesuniform. Moreover a relatively higher return period(10 yrs) in the climatological map has beenconsidered for drainage channel design, which giveshigher results. Also the discharge calculated by thisformula is the peak discharge which is much morethan the design discharge value to be consideredfrom drainage channel design. Hence for channeldesign, this value is not advisable to accept.However this peak discharge value may beconsidered for structural design purpose as failureof structures may cause serious problem to the cropand involve more economic loss.
The result obtained by SHP/DDF is higher thanthose coming out from SCS-CN method or Cypress-Creek formula. This may be due to the fact that areturn period of 8 yrs is taken for plotting the depth-duration-frequency curve. This is on a higher and
44

April-June 2013] DETERMINATION OF DRAINAGE COEFFICIENT 135
CONCLUSIONSelection of proper drainage coefficient is very
much essential in the design of an efficient surfacedrainage system as higher values mean larger andcostly channels whereas lower values may not givethe desired protection causing damage to crops.The design of surface drainage network is a functionof drainage coefficient selected for the area andthe drainage coefficient is a function of the drainagearea and the run off created from rainfall. The valuesof drainage coefficient computed by Curve Numbermethod and Cypress-Creak formula were found tobe 26.86 mm/day and 31.69 mm/day respectivelyand the Simplified Hydrologic Procedure andRational formula gave higher values of 45 mm/dayand 360.56 mm/day respectively. The drainagecoefficient of 26.86 mm/day as computed by CurveNumber method was found to be the best fit valuefor the study area to be adopted for design ofsurface drainage system with 7 days storm and8 year return period. Accordingly the value ofdesign method of discharge as obtained by the curvenumber method for design of surface drainagesystem was computed as 0.59 m3/s. A value of 0.59m3/s as design discharge from CN method and6.74 m3/s as peak discharge from Rational methodwere found suitable for the design of the channeland the outfall structure respectively.
The low land rice cultivation requires surfaceponding throughout the crop growing season. Thusthe drainage coefficient in lowland rice fieldsshould be based on the quantity of rainfall whichmay cause excess flooding lasting for several daysand occurring at a particular frequency. Hence, thedrainage coefficient for the study area wasdetermined basing on the analysis of rainfall data.The curve number method resulted in the minimumvalue among all the approaches followed. Thesimplified hydrologic procedure in which the aerialdistribution of rainfall and losses like interception,infiltration, etc are neglected, gave drainagecoefficient little higher than the value obtained byCurve Number method. The use of empiricalformulae should be avoided and if it is inevitableto use due to want of other data, then Cypress-Creek formula should be followed for the delta area
which also gives closure value of drainagecoefficient.
In the field it always becomes very difficult tomaintain a stable section of drain which can carrythe design discharge. Design discharge flowsoccasionally in the drain. As found from fieldobservations, drains of bigger size than designsection tend to deteriorate fast as they have to carryin general a smaller discharge, than the design valueand heavy weed growth as well as siltation take placeinside the drain. On the other hand, the drains ofsmaller size than the design section remain in bettercondition and can carry occasionally higherdischarge with marginal scouring of the channel andovertopping of side lands. Hence the value obtainedby the Curve Number approach is suggested as thesuitable value of drainage coefficient for design ofsurface drainage channel for the study area.
REFERRENCESAnonymous 1989. Delta Development Plan of Mahanadi
Delta Command Area, Vol.I,VII. Project Report ofEngineer-in-Chief (Irrigation), Govt. of Orissa,Bhubaneswar.
Bhattacharya, A. K., Michael, A. M. 2003. Land Drainage- Principles, Methods, Applications. KonarkPublishers Pvt Ltd, New Delhi.
Chitale, M.A. 1991. Environmental management in waterresources project – Indian experience of irrigationpower project. Journal of Indian Water ResourcesSociety, 1(2): 56-59.
Murty, V. V. N. and Jha, M. K. 2009. Land and WaterManagement Engineering. 5th Edition KalyaniPublishers, New Delhi.
Panda, R. K. and Rajput T. B. S. 2003. An EconomicDrainage System for Coastal Paddy Areas of Orissa.Indian Journal of Soil Conservation, 31 (1): 66-73.
Raadsma, S. and Schulze, F. E. 1974. Surface field drainagesystems. Drainage Principles and Practices – IV.International Institute for Land Reclamation andImprovement, Wageningn, The Nethelands.
Rao, K. V. G. and Dhrubanarayan, V. V. 1979. Analysisof Drainage Coefficient for Surface Drainage Designin Rainfed Low Land Rice Fields. Indian Journal ofSoil Conservation, 7(2):12-20.
Ritzema, H. P. 1994. Drainage Principles andApplication. International Institute for LandReclamation and Improvement, Publication 16, 2nd
Edition, The Netherlands.
45
136 KUMAR et al. [Journal of Soil & Water Conservation 12(2)
Journal of Soil and Water Conservation 12(2): 136-140, April-June 2013ISSN: 022-457X
Wind drift and evaporation losses under variousoperating conditions of sprinkler irrigation system
JITANDER KUMAR1, DHEERAJ KUMAR2, DHARMENDERA KUMAR3 and H.K. MITTAL4
Received: 19 November 2012; Accepted: 12 May 2013
ABSTRACT
Sprinkler irrigation is an advanced method of irrigation through which water can be used effectively.However in the field, sprinkler irrigation is also associated with problems like water losses due to winddrift and evaporation, distortion of application pattern by wind and modification of infiltrationcharacteristics of the soil by impact of drops on the soil surface. These problems are associated with themovement and physical condition of individual droplets sprinkled through the system. Sprinkler dropsize influences important aspect of irrigation such as sprinkler pattern distortion by wind, evaporationand wind drift losses, wind drift when irrigating with effluent water. As a step to explore proper solutionto some of the above problems, a field investigation was conducted to determine the wind drift andevaporation losses from rotary sprinkler and to study the effect of nozzle size, operating pressureand nozzle elevation on it. Wind drift and evaporation losses were determined by catch can methodat three operating pressures i.e. 2.5, 2.0 and 1.5 kg cm-2 with three nozzles elevations 150, 110 and 75cm for 5.6, 4.7 & 3.1 mm nozzle sizes. As per the results of the field study, it was found that wind driftand evaporation losses were increased with an increase in pressure and nozzle elevation but decreasedwith an increase in nozzle size. It was also found that rates of increase of wind drift and evaporationlosses were more at lower pressure (1.5 kg cm-2) and less at higher pressure (2.5 kg cm-2).
Key words: rotary sprinkler, wind drift & evaporation losses, nozzle size,operating pressure,nozzle elevation
1Lecturer, Dairy Engineering, Jawahar Lal Nehru Polytechnic, Mahmudabad, Dist-Sitapur-261203 (U.P.), Email: [email protected] Professor, Deptt. of Irrigation & Drainage Engineering, College of Technology, G.B.Pant. University of Agriculture &Technology, Pantnagar, Dist-Udham Singh Nagar-263145 (U.K). Email: [email protected]; 3M.Sc. student of Sam HigginbottomInstitute of Agriculture, Technology & Sciences, Allahabad; 4Associate Professor, Deptt. of Soil & Water Engineering, College ofAgricultural Engineering & Technology, Maharana Pratap University of Agriculture & Technology, Udaipur-313001 (Rajasthan).
INTRODUCTIONIn the sprinkler method of irrigation, water is
sprayed into the air and allowed to fall on theground surface somewhat resembling rainfall. Theflexibility of sprinkler equipment and its efficientcontrol of water application make this methodadaptable to most topographical conditions withoutextensive land preparation. It is specially suitablefor steep slopes or irregular topography. Thedevelopment of a variety of sprinkler devices hasincreased dramatically in recent years. The sameare available from the conventional single or doublenozzle impact sprinkler with many types of nozzleto various type of deflection plate sprinklers. Thebasic objective of sprinkler irrigation is to simulate
the rainfall and to apply uniformly a calculateddepth of water at a predetermined application rate.The irrigation efficiency of the sprinkler irrigationsystem depends upon the degree of uniformity ofwater application. Water spray distributioncharacteristics and spacing regulate the uniformityof water application. The spray distributioncharacteristics of sprinkler heads are typical andchange with nozzle size, operating pressure andnozzle elevation. But wind drift and evaporationlosses affect the water distribution pattern ofsprinklers. Spray evaporation was negligiblerelative to drift loss (Seginer and Kostrinsky, 1975).Some authors found losses of 5-10 % undermoderate evaporative demand (Keller and Bliesner,
46

April-June 2013] EFFECT OF RAINFALL DISTRIBUTION 137
1990), losses of 30 % (Yazar, 1984) and losses up to50 % (Frost and Schwalen, 1955). It is a general beliefthat WDEL are not fully consumptive, since theypartly contribute to decrease crop waterrequirements (Tarjuelo et al., 2000). So, knowledgeabout wind drift and evaporation losses forsprinkler is important to achieve proper distributionof spray water and the maximum efficiency fromthe system. Hence, a sprinkler operating onparticular soil, slope, crop and climatic conditions,the knowledge of wind drift and evaporation lossesbecomes an essential requirement. Numerousstudies (Dechmi et al., 2003; Fukui et al., 1980;Kincaid et al., 1996; Kohl, 1974; Lorenzini, 2002;Lorenzini and DeWrachien, 2005; Tarjuelo et al.,1999; Zapata et al., 2007) have surveyed the factorsinfluencing sprinkler irrigation performance.Nozzle size, operating pressure and nozzleelevation are some factors which play an importantrole to influence sprinkler irrigation performancewith respect to droplet size falling at different radialdistances from the nozzle due to wind drift.Therefore, a study was under taken with theobjective to understand the effect of nozzle size,operating pressure & nozzle elevation on wind driftand evaporation losses from rotary sprinklers.
MATERIAL AND METHODSThe study was conducted in the agricultural field
of the instruction farm of College of Technology andEngineering, Udaipur. The variables taken under thestudy were nozzle size, operating pressure andnozzle elevation. Three-nozzle sizes of 5.6, 4.7 & 3.1mm with three nozzle elevations of 150, 110 and 75cm were tested at three operating pressures i.e. 2.5,2.0 and 1.5 kg cm-2.
The wind drift and evaporation losses werecomputed using catch can method. The catch cansof cylindrical metal, 100 mm diameter and 115 mmheight were placed in a square grid network of 2×2meter within the sprinkler area. The pressure at thesprinkler nozzle was measured with the help of pitottube and pressure gauge attachment. The test wasrun for 1 hour and at the termination of duration;the amount of water collected in catch can wasmeasured in terms of depth with the help of ameasuring cylinder.
Wind drift and evaporation losses represent thepercentage of the water emitted by the sprinklerswhich never reached the soil surface and therefore
was either drifted to other locations or evaporated.In each experiment, the wind drift and evaporationlosses was determined using following relationship:
where, WDEL = wind drift and evaporation losses,
per cent Vd = discharged volume, m3
Vc = catch can volume, m3
RESULTS AND DISCUSSIONThe wind drift and evaporation losses were
estimated using amount of water caught in catch cansand discharge obtained from nozzles under differentoperating conditions. The values of wind drift andevaporation losses (WDEL) for each experiment areshown in Table 1 and Fig. 1, 2 and 3. During theexperiment, wind speed ranged from 1.9 to 6.6 km/hr and wind drift and evaporation losses rangedfrom 1.04 to 2.48 per cent. Wind speed during theexperiment with 5.6 mm nozzle size ranged from 2.3to 6.6 km/hr and the wind drift and evaporationlosses ranged from 1.04 to 2.48 per cent (Table 1).For 4.7 mm nozzle size (wind speed 1.9 to 3.6 kmhr-1.) and for 3.1 mm nozzle size (wind speed 2.1to 4.1 km hr-1) wind drift and evaporation lossesranged from 0.96 to 1.72 per cent and 1.47 to 2.46per cent respectively.
Table 1 indicates that WDEL decreased from 2.24to 2.41 per cent when nozzle diameter reduced from5.6 m to 3.1 mm at 1.5 kg cm-2 operating pressureand 75 cm nozzle elevation. Same trend also observedfor another operating pressure and nozzle elevation.Hence, it is concluded that WDEL increased withdecrease in nozzle size (Fig.1) However, this trendwas not observed for 4.7 mm nozzle size. This maybe due to the low wind velocity. From these resultswe can conclude that wind drift and evaporationlosses decreased with in an increase in nozzle sizecorresponding to wind speed at specific operatingpressure and nozzle elevation. These outcomes maybe due to the fact that, greater diameter of nozzleproduces larger diameter of water drops and thatcan resist the effect of wind strongly. Larger sizedrops remain in air for shorter duration resultingin low wind drift and evaporation losses. It wasalso observed that wind drift and evaporation lossesincreased with decrease in nozzle size. This may
47

138 KUMAR et al. [Journal of Soil & Water Conservation 12(2)
be due to the fact that small nozzle size producedlesser water drop diameter which can sustain inair for longer duration and provide more chanceand time to affect the drops for wind to drift andfor evaporation losses also. Same results of winddrift and evaporation losses for different nozzlesizes were observed by Playan et al. (2006) fromrotating spray plate sprinkler.
Further, it is observed from Table 1 and Fig. 2that wind drift and evaporation losses increased
Table 1. Wind drift and evaporation losses (WEDL) from different nozzle sizes at different operating pressures and nozzleelevations
Nozzle Pressure, Nozzle Wind Temp. Humidity Discharged Catch cans WDELsize, (mm) (kg cm-2) elevation, velocity, (°C) (%) volume, volume, (%)
(cm) (km hr-1) (lph) (lph)
1.5 75 5.2 29.4 58.0 1787.69 1747.65 2.24
5.6 110 6.6 26.8 64.5 1766.90 1723.09 2.48
150 5.0 27.2 44.0 1745.55 1705.76 2.28
2.0 75 2.3 26.9 43.5 2045.59 2021.95 1.16
5.6 110 2.5 30.2 43.5 2025.41 2002.73 1.12
150 1.9 21.1 59.5 2006.55 1985.69 1.04
2.5 75 3.5 34.2 45.5 2283.15 2248.45 1.52
5.6 110 4.5 31.6 54.5 2269.23 2225.12 1.94
150 5.4 29.9 52. 2248.65 2195.77 2.35
1.5 75 3.5 29.8 42.5 994.96 978.49 1.65
4.7 110 3.6 21.0 50.5 983.62 966.49 1.72
150 3.2 31.6 49.0 970.83 954.84 1.64
2.0 75 1.9 12.3 43.7 1140.93 1129.49 0.96
4.7 110 2.0 13.8 36.0 1129.68 1118.28 1.01
150 2.6 14.0 37.0 1116.17 1103.67 1.12
2.5 75 2.0 15.0 43.0 1291.19 1278.08 1.16
3.1 110 2.4 16.8 46.0 1277.43 1263.38 1.10
150 3.6 16.0 42.0 1262.24 1240.03 1.76
1.5 75 4.0 21.4 31.0 591.14 577.16 2.41
3.1 110 4.1 19.0 27.5 582.29 567.16 2.46
150 3.0 20.1 34.0 575.10 563.95 1.94
2.0 75 2.4 18.2 41.0 673.39 662.39 1.58
3.1 110 2.1 19.8 43.5 664.50 654.72 1.472
150 2.8 29.0 26.5 652.80 640.38 1.90
2.5 75 3.4 29.4 38.0 746.50 729.07 2.33
3.1 110 3.4 26.8 40.5 737.50 720.07 2.36
150 3.5 27.2 33.0 725.57 707.99 2.42
with an increase in operating pressure. This maybe due to the fact that with higher pressures, thewater from the nozzle breaks into very fine dropsand fell very near to sprinkler. These fine dropsremain air borne for more time that provides morechance to be affected by wind and also providemore time for evaporation of water drops resultingin more wind drift and evaporation losses.However, this trend was not observed for 1.5 kgcm-2 operating pressure and 2.0 kg cm-2 operating
48

April-June 2013] EFFECT OF RAINFALL DISTRIBUTION 139
pressure which attained minimum WDEL that maybe due to climatology data variation. Here it cannot be said that how much percentage of wind driftand evaporation losses increased or decreasedbecause different operating pressures attaineddifferent wind speeds which produce variation inwind drift and evaporation losses shown in Fig. 2.This may be due to the fact that as we increased
Fig.2. Effect of operating pressure on wind drift andevaporation losses with 75 cm nozzle elevation atdifferent pressures
Fig. 3. Effect of nozzle elevation on wind drift andevaporation losses with 75 cm nozzle elevation fordifferent nozzle sizes
the operating pressure the breakup of water streamincreases and also broke the water into fine dropsand these fine drops are more sensitive to beaffected by wind resulting in high wind drift andevaporation losses.
Also, Table 1 and Fig. 3 showed the effect of nozzleelevation on wind drift and evaporation losses fromwhich it is observed that wind drift and evaporationlosses increased with an increase in nozzle elevationand vice versa. This is because as the nozzle elevationincreases, the water stream breaks in fine drops thateasily get affected by wind which may driftsignificantly. Besides, time of sustaining of drops inair or flying of drop in air gets increased whichprovides time and chances for effect of wind on waterdrops and also provides more time for evaporationof water drops. Here it cannot give the percent ofdecreased or increase in wind drift and evaporationlosses by virtue of nozzle elevation because differentnozzle elevations attain the different velocity whichsignificantly increase or decrease the wind drift andevaporation losses of respective nozzle elevation. Itcan be concluded that wind drift and evaporationlosses will be increased with an increase nozzleelevation, if the wind velocity keeps constant. Samewas also observed by Salvador et al. (2005), when hestudied the characteristics of WDEL for solid settype sprinkler in the semi – arid metrologicalcondition of Zaragoza (Spain).
Hence, with all these observations it can beconcluded that the wind drift and evaporation lossesincreased with decrease in nozzle diameter, lowernozzle elevation and increased pressure with therespective wind speeds during data collection ifwind speed remained constant. Besides, wind speedis a factor which significantly affects the wind driftand evaporation losses as compare to nozzlediameter, operating pressure and nozzle elevation.The rate of wind drift and evaporation losses wasless at greater nozzle size and lower nozzleelevation than smaller nozzle size and higher nozzleelevation. The rate of increase of wind drift andevaporation loss was more at operating pressureof 1.5 kg cm-2 (lower pressure). The rate of increaseof wind drift and evaporation losses was less at 2.0to 2.5 kg cm-2 (higher pressure). This may be dueto the fact that drops produced at high pressurecan resist and reduce the effect of wind velocityresulting into low wind drift and evaporation losses.Here we can not say how much percentage ofWDEL increased or decreased, because we did not
Fig. 1. Effect of nozzle size on wind drift and evaporationlosses with 75 cm elevation at different pressures
49

140 KUMAR et al. [Journal of Soil & Water Conservation 12(2)
obtain a fix trend of WDEL due to climatologicaldata variation
CONCLUSIONWind drift and evaporation losses increase with
an increase in pressure & nozzle elevation butdecrease with an increase in nozzle size, if windblows uniformly during the operating time ofsprinkler.
The rate of increase of wind drift and evaporationlosses are more at lower operating pressure (1.5 kgcm-2) while the rate of increase of wind drift andevaporation losses was less at higher operatingpressure (2.5 kg cm-2). However, no fixed trend wasobserved due to climatological data variation.WDEL are dependent upon climatic parameters,operating conditions and sprinkler configuration.
REFERENCES
Dechmi, F., Playán, E., Faci, J.M., Tejero, M., Bercero, A.,2003. Analysis of an irrigation district in northeasternSpain: II. Irrigation evaluation, simulation andscheduling. Agric. Water Manage 61, 93–109.
Frost, K.R., Schwalen, H.C., 1955. Sprinkler evaporationlosses. Agricultural Engineering 36(8), 526-528.
Fukui, Y., Nakanishi, K., Okamura, S., 1980. Computerevaluation of sprinkler irrigation uniformity. Irrig.Sci. 2 (1), 23–32.
Keller, J., Bliesner, R.D., 1990. Sprinkle and trickle irrigation.Van Nostrand Reinhold, New York, NY, USA.
Kincaid, D.C., Solomon, K.H., Oliphant, J.C., 1996. Dropsize distributions for irrigation sprinklers. Trans.ASAE 39 (3), 839–845.
Kohl, R.A., 1974. Drop size distributions from medium-sized agricultural sprinklers. Trans. ASAE 17 (4), 690–693.
Lorenzini, G., De Wrachien, D., 2005. Performanceassessment of sprinkler irrigation systems: a newindicator for spray evaporation losses. Irrig. Drain.54,295–305.
Lorenzini, G. 2006. Water droplet dynamics andevaporation in an irrigation spray. Transaction ofASAE, 49: 545-549.
Playán, E., Zapata, N., Faci, J.M., Tolosa, D., Lacueva,J.L., Pelegrín, J., Salvador, R., Sánchez, I. and Lafita,A. 2006. Assessing sprinkler irrigation uniformityusing a ballistic simulation model. Agricultural WaterManagement , 84: 89-100.
Salvador, R., Playán, E., Sánchez, I., Martínez-Cob, A.,Faci, J. M. and Zapata, N. 2005. Day and night winddrift and evaporation losses in sprinkler solid-setsand moving laterals. Agricultural Water Management,76: 139-159.
Segner, I., and Kosrinsky, M.1975. Wind, sprinklerpatterns and system design. J. Irrig. Drain. Div.,ASCE, 101:251-264.
Tarjuelo, J. M., Montero, J., Carrión, P. A., Honrubia, F. T.and Calvo, M. A. 1999. Irrigation uniformity withmedium size sprinklers part ii: influence of windand other factors on water distribution. Transactionof ASAE, 42: 677-690.
Tarjuelo, J.M., Ortega, J.F., Montero, J., de Juan, J.A., 2000.Modelling evaporation and drift losses in irrigationwith medium size impact sprinklers under semi-aridconditions. Agricultural Water Management. 43, 263-284.
Yazar, A. 1984. Evaporation and drift losses fromsprinkler irrigation systems under various OperatingConditions. Agricultural Water Management, 8: 439-449.
Zapata, N., Playán, E., Martínez-Cob, A., Sanchez, I.,Faci, J.M., Lecina, S., 2007. From on-farm solid-setsprinkler irrigation design to collective irrigationnetwork design in windy areas. Agric. Water Manage.87 (2), 187–199.
50

April-June 2013] INNOVATIVE DESIGN AND LAYOUT OF STAGGERED CONTOUR TRENCHES 141
Journal of Soil and Water Conservation 12(2): 141-148, April-June 2013ISSN: 022-457X
Innovative design and layout of Staggered ContourTrenches (SCTs) leads to higher survival of plantation
and reclamation of wastelands
R.R. BABU1 and PURNIMA MISHRA2
Received: 10 January 2013; Accepted: 17 May 2013
ABSTRACT
Considering the soil depth, soil type, slope of land, maximum possible 6-hr rainfall and consequentrunoff (for 5 year return period), Staggered Contour Trenches (SCTs) were identified as suitable treatmentfor reclamation of highly degraded upper reaches across different watersheds under Indo-GermanWatershed Development Programme- Andhra Pradesh (IGWDP-AP). The design of SCTs involved infixing the horizontal interval and vertical interval between the successive contour lines and spacingbetween the successive trenches in a row, after selecting the suitable length, width and depth as per siteconditions. Contour lines were marked using A-frame. In the new design of SCT, the trench length waseither set equal to base width of A-frame or fixed two times of base width of frame. The dug out soilfrom the trenches is placed in the half moon fashion around the trench. Usually berm of 0.3-0.5 m ismaintained between the trench and half moon embankment in the conventional design and layout.However, with a view to improve survival of plants, planting on the berm of excavated trench andbund placed in the half moon fashion around the trench has been incorporated in the layout. Accordingly,berm of 1.5 m was followed between the trench and half moon shaped bund. This innovative SCTdesign and layout was successfully field tested across 15 watersheds under IGWDP-AP. The length ofSCTs varied from 2-4 m. The width of trenches was 0.5- 0.6 m and the depth varied from 0.3-0.6 m.Custard apple, Pongamia, Glyrecidia, Amla, Cashew, etc. were planted on the berm. In case of trencheswith 2 m length, single plant on the berm and those with 4 m length 2 plants on the berm were planted.It was observed that simple modification (of restricting the length of SCT to either base width of A-frame or two times of it, increasing the berm space to 1.5 m, placing the dugout soil around the trenchin half moon fashion and planting on the berm of excavated trench) in the design and layout of SCTsimproved the survival of plants. The data collected from 15 different watersheds revealed that theaverage survival percentage of plantation was more than 90 per cent. Thus, the modified and innovativedesign and layout of SCTs helped in situ rain water harvesting and availability of soil moisture forlonger period leading to better survival of plantation and reclamation of wastelands.
Key words: Staggered Contour Trench (SCT), rain water, plantation, wasteland and survival ofplantation
1Asst. General Manager, Programme Support Unit, IGWDP-AP, 10-1-128/4, Masab Tank X Road, Hyderabad- 500028(E-mail: [email protected])2Department of Horticulture Engineering, College of Horticulture, APHU, Rajendranagar, Hyderabad – 500030
INTRODUCTIONAs per the latest estimates of National Bureau
of Soil Survey and Land Use Planning (NBSS&LUP),India, about 45 per cent of total geographical areai.e. 146 m. ha in India is affected by variousdegradation processes with water erosion being the
chief contributor. Large-scale land degradation haslong-term environmental and socio-economicimplications. The negative environmentalimplications include loss of biodiversity andecological stability, frequent occurrence of floods anddroughts, silting up of reservoirs and changes in
51

142 BABU et al. [Journal of Soil & Water Conservation 12(2)
hydrological regimes. Sustainable agriculturalproduction can be achieved by preventing landdegradation, reclaiming the already affected areas,maintaining soil’s productive potential and reducingenvironmental pollution, while emphasizingreduction in chemical and energy – intensive inputs(Sharda, 2007). In this context, participatoryintegrated watershed development is now widelyrecognized as a potential approach for vitalizingrural economy by regenerating the degradedecosystems. Watershed development aims to bringabout the best possible balance in the environmentbetween natural resources on one side and man andgrazing animals on the other.
The Indo-German Watershed DevelopmentProgramme (IGWDP), a bilateral programme ofGovernment of Germany and Government of Indiais a novel initiative for regeneration of naturalresources through participatory approaches thatemphasizes on self help, environmental protectionand poverty alleviation. The programme isimplemented by Village Watershed DevelopmentCommittee (VWDC- a body nominated by villagers)in association with local Non-GovernmentalOrganization (NGO), known as Project FacilitatingAgency (PFA) in each watershed. The Indo GermanWatershed Development Programme- AndhraPradesh (IGWDP-AP) was initiated to address theissues concerning the rehabilitation of degradedwatersheds in the districts of Karimnagar, Medak,Warangal and Adilabad in Telangana region ofAndhra Pradesh. KfW, a German Development Bankis the funding agency on behalf of Government ofGermany and NABARD is the legal holder of theprojects in India.
The upper reaches of watersheds usually have anundulating topography and are foci for soil erosion.The uncontrolled runoff from these areas causesextensive damage to the adjoining agricultural land.Contour trenching is useful for soil and moistureconservation and afforestation purposes both on hillslopes as well as degraded and bare wastelands(Murty, 1998; Ravi Babu and Mishra, 2005 andMishra et al., 2006). Contour trenching helps in insituconservation of soil moisture and thus facilitatesquick establishment of vegetation and rehabilitationof sloping wastelands. However, the fieldsupervisors/engineers in India often adopt thumbrules in layout and design of contour trenches, whichleads to either under or over design resulting in their
failure or excessive cost (Mishra and Ravi Babu,2010).
Contour trenching is of two types (1) ContinuousContour Trenching (CCT) and (2) Staggered ContourTrenching (SCT). Considering the field levelproblems associated with layout and alignment ofcontours for longer lengths, SCTs are preferred toCCTs. The design of SCT involves fixing theHorizontal Interval (HI) and Vertical Interval (VI)between the successive contour lines and intersspacing between the successive trenches in a row,after selecting the suitable length, width and depthas per site conditions (Ravi Babu, 2009). The step bystep procedure described by Ravi Babu, (2009) wasused in design of SCTs with the modification thatthe trench length was either set equal to or fixed twotimes that of base width of A-frame. Furher, with aview to improve survival of plants, planting on theberm of excavated trench and bund placed in the halfmoon fashion around the trench has been thoughtof. Accordingly, berm of 1.5 m was consideredbetween the trench and half moon shaped bund.
This modified SCT design and layout wassuccessfully field tested across 15 watersheds(Shivarvenkatpur, Kasireddipalli, Tigulnarsapur andMylaram in Medak district; Ayyagaripalli andChintapalli in Warangal district; Battulapalli inKarimagar district and Settihadapnoor, Sakeda,Kohinoor B, Dhurvaguda, Dharmasagar, Rampur,Yammaikunta and Indervelli in Adilabad district)under IGWDP-AP. The modifications in the designand layout of SCTs and its impact on survival ofplantation is presented and discussed in this paper.
MATERIALS AND METHODSConsidering the soil depth, soil type, slope of
land, maximum possible 6-hr rainfall andconsequent runoff (for 5 year return period),Staggered Contour Trenches (SCTs) were designedfor reclamation of highly degraded upper reachesacross different watersheds under IGWDP-AP.
The design of SCT involved in fixing the HI andVI between the successive contour lines and spacingbetween the successive trenches in a row, afterselecting the suitable length, width and depth as persite conditions. First, the design depth of rainfall for5-year return period and for 6-hrs. duration of stormwas found. The runoff coefficient duly consideringthe land use, soil texture and land slope wasestimated. Subsequently, the expected runoff depth
52

April-June 2013] INNOVATIVE DESIGN AND LAYOUT OF STAGGERED CONTOUR TRENCHES 143
was calculated using runoff coefficient ad designdepth of rainfall. The step by step proceduredescribed by Ravi Babu, (2009) as below was usedin the design of SCTs.
Assuming rectangular cross-section, the followingrelationship is used in case of SCTs:
W x D = (Q x HI) ( 1+ X/L) …(1)Where, Q= Runoff depth, mHI = Horizontal Interval, mW = Width of trench, mD = Depth of trench, mX = Inter space between trenches, mL = Length of trench, mIn the improved design of SCT, the length of
trench was set equal to base width of A-frame. Incase, the base width of A-frame is less than 2 m, thelength of trench was set equal to two times that ofbase width of trench. The spacing between successivetrenches (X) in each row is set equal to length oftrench (L) for simplicity of calculations. Therefore,the above relationship becomes the following:
W x D = (Q x HI)x (2) …(2)Depending on the site conditions and available
soil depth, the depth of trench was fixed. Asrectangular cross-section was assumed, the width ofthe trench was set as 1.5 – 2 times that of depth oftrench. Then, HI was worked out as
HI = (W x D)/(2 x Q) …(3)
Total length of trenches per ha =(1/2) x [10000/((HI)] …(4)
(Since Length of each trench = inter space betweensuccessive trenches)
Number of trenches per ha = Total length/lengthof each SCT …(5)
Volume of earth work per trench = length x cross-section …(6)
Total volume of earth work per ha = No. oftrenches per ha x volume of earth work per trench
…(7)Contour lines were marked using A-frame. In the
modified design of SCT, the trench length was eitherset equal to base width of A-frame or fixed two timesof base width of frame. The dug out soil from thetrenches is placed in the half moon fashion aroundthe trench. Usually berm of 0.3-0.5 m is maintainedbetween the trench and embankment in theconventional design and layout. However, with aview to improve survival of plants, planting on theberm of excavated trench and soil/bund placed inthe half moon fashion around the trench.Accordingly, berm of 1.5 m was followed betweenthe trench and half moon shaped bund has beenattempted. The point wise comparison of modifieddesign and layout of SCTs with conventional SCTshas been given in Table 1.
Table 1. Modified vs. conventional design and layout of SCTs
S.No. Parameter/Activity Modified design and layout Conventional design and layout
1. Design procedure (a) Considering the soil depth, soil texture, (a)Thumb rules are generallyfollowed slope of land, maximum possible 6-hr rainfall followed.
and consequent runoff (for 5 year return period),SCTs are designed. (b) The length, width and depth of(b) The design of SCT involved in fixing the trench and horizontal/verticalhorizontal interval/vertical interval between the interval are fixed withoutsuccessive contour lines and spacing between the considering land use, soil slope, soilsuccessive trenches in a row, after selecting the conditions. texture and expectedsuitable length, width and depth as per site runoff, etc.
2. Cross-section Depending on the site conditions and available The usual cross section of SCT(width x depth) soil depth, the depth of trench is fixed. As (in terms of width x depth) is 0.6 m xof trench rectangular cross-section was assumed, the 0.3 m or 0.5 x 0.5 m
width of the trench was set as 1.5 – 2 timesthat of depth of trench.
3. Length of trench (a) In the improved design of SCT, the length of (a) Staggered trenches aretrench was set equal to base width of A-frame. constructed across the slope withIn case, the based width of A-frame is less than lengths varying from 5 to 15 m2 m, the length of trench is set equal to two times (Katyal et al., 1995).that of base width of trench. (b) Under MGNREGA in AP, SCTs(b) The length of trench varied between 2-4 m of length varying between 7-15 m aredepending on the base width of A-frame. found to be made.
53

144 BABU et al. [Journal of Soil & Water Conservation 12(2)
S.No. Parameter/Activity Modified design and layout Conventional design and layout
4. Inter spacing between The spacing between successive trenches in each As longer trench length is adopted the trenches in a row is set equal to length of trench facilitating the spacing between trenches ingiven row easy layout by even unskilled labour. each row is also found to be
relatively high.
5. Horizontal Interval Proper Horizontal Interval of 2-10 m is Thumb rules are generally followed.between successive maintained between successive SCTs dependingtrench lines on the soil texture, slope, location, selected cross-
section of the trench and design depth of runoff, etc.
6. Marking of contour (a) Contour lines are marked using A-frame/ (a)Marking of SCTs is done acrosslines and layout hydromarker the slopeof trenches (b) Layout of SCTs is very easy as the length of (b) As the length of SCT has no
SCTs is limited to base width of A-frame relation to base width of A-frame,(c) As the length of SCT is linked to base width the layout of contours and SCTs isof A-frame, the errors in layout of contours and always prone to errors.SCTs is avoided and trenches are laid exactly (c) Poor alignment of contours son the contours thus facilitating better over long length would result inharvesting of rainwater. breaches due to concentration of
runoff. A breach in one SCT wouldlead to chain reaction and formationof gullies.
7. Berm Minimum berm of 1.5 m was followed between Usually berm of 0.3-0.5 m isthe trench and half moon shaped bund. maintained between the trench and
embankment
8. Placement of soil The soil excavated (i.e. spoil) is placed in half Excavated soil is placed at themoon shape at the downstream side of the trench. downstream side of the trench.Thus the trench and half moon shaped bund actas catch pit for the plant.
9. Bund sectioning Clod breaking and proper sectioning (as per the Required attention is not paiddesign specification) of the soil is carried out. towards clod breaking and proper
sectioning of the bund.
10. Revetment In highly sloping land, the bund on the This is not attended to in thedownstream side is supported with local conventional methodstone revetment
11. Plantation (a) Planting is done on the berm of excavated (a) Trench layout is not taken intotrench and bund placed in the half moon account while taking up plantation.fashion around the trench. The plantation is carried out as per(b) It is easy for the plant roots to extract soil the spacing norms.moisture from the trenches as it is available (b) It is difficult for the plants towithin 0.3- 0.5 m radius. Planting on the berm extract soil moisture (seepage) fromenables shallow root system of plants to absorb the trenches because of shallow roottrapped rain water, which seeps through the system of plants (in thesoil from the trenches. establishment stage) and relatively
possible higher distance of trenchand plant.
12. Availability of Separate catch pit for each plant is available Separate catchment pit (trench) maycatch pit facilitating better establishment and survival not be available for each plant.
of plantation and reclamation of wastelands.
The modified SCT design and layout wassuccessfully field tested across 15 watersheds(Shivarvenkatpur, Kasireddipalli, Tigulnarsapur andMylaram in Medak district; Ayyagaripalli and
Chintapalli in Warangal district; Battulapalli inKarimagar district and Settihadapnoor, Sakeda,Kohinoor B, Dhurvaguda, Dharmasagar, Rampur,Yammaikunta and Indervelli in Adilabad district).
54

April-June 2013] INNOVATIVE DESIGN AND LAYOUT OF STAGGERED CONTOUR TRENCHES 145
Planting was carried out in the year 2010 on the bermof trench and half moon shaped bund across 15watersheds. The data related to watershed wisenumber plants planted and the number of survivingplants as on 30 May 2012 in the SCT treated areawas collected and the survival percentage wasworked out. Thus the impact of innovative designand layout of SCTs on survival percentage ofplantation was assessed and interpretations weredrawn.
RESULTS AND DISCUSSIONThis innovative SCT design and layout was
successfully field tested across 15 watersheds underIGWDP-AP. The design details of SCTs for twoselected watersheds (one for red sandy loam soilsand the other with black cotton soils) are furnishedas sample in Table 2. Based on the width of fabricatedA-frame at the base, the length of SCT is fixed s 2 min Ayyagaripalli watershed and the same in the caseof Kohinoor B watershed is 3 m. The spacing oftrenches in a line was set equal to length of SCT andthe HI between the consecutive lines was 7 and 4 min Ayyagaripalli and Kohinoor B watersheds,respectively (Table 2).
Table 2. Design details of SCTs for two selected watersheds(Ayyagaripalli, Warangal and Kohinoor B,Adilanad)
S. Item Ayyagaripalli, Kohinoor,No. Warangal Adilabad
1. Area in ha 2.5 4
2. Slope of land in % 12 16
3. Type of soil Sandy Heavyloam clay
4. Estimated depth of 20 42.6runoff (mm)
5. Cross-section of 0.27 0.3trench (sq.m)
6. Length of trench in m 2 3
7. Spacing of trenches 2 3in a line in m
8. Horizontal Interval in m 7 4
9. Vertical Interval in m 0.8 0.6
Across 15 watersheds in which SCTs wereexecuted, the length of SCTs varied from 2 - 4 m.The width of trenches was 0.5- 0.6 m and the depthvaried from 0.3-0.4 m. The excavated soil is placedaround the trench in half moon fashion leaving bermof 1.5 m. Custard apple, Pongamia, Glyrecidia, Casiasiamia, Teak, Bamboo, Amla, Cashew, etc. wereplanted on the berm. In case of trenches with 2 mlength, single plant on the berm and those with 4 mlength 2 plants on the berm were planted. The datacollected from different watersheds is presented inTable 3. It can be observed from Table 3 that thesurvival percentage of plantation varied from 61 to97 % across 15 watersheds in which this activity wastaken up. The average percentage of survival ofplantation was found to be 91 per cent (Table 3). Theviews of (treated) area and plantation during pre andpost development were depicted in plates 1 to 6. Theexcavated trench, plantation on the berm and halfmoon shaped bund around the trench can be seenfrom the plates. The impact of the SCTs in trappingrainwater, improvement of soil moisture andconsequent facilitation of establishment of greengrass and plantation in wastelands could bevisualized from the plates.
For most of the plants, concentration of moistureabsorbing roots is greatest in upper part of the rootzone and near the base of plants. Extraction of soilmoisture is very rapid in the zone of greatest rootconcentration and under favorable environmentalconditions. Further, the shorter length of SCTs hasvery less chance of deviating from contours and theyare found to be very effective in trapping runoff andas a result increased the soil moisture availability.Thus, better moisture conservation in the soil profilehas been observed in the case of modified SCTs. Asthe planting is done on the berm of excavated trenchand bund placed in the half moon fashion aroundthe trench, it is easy for the plant roots to extract soilmoisture from the trenches as it is available within0.3- 0.5 m radius. Planting on the berm thus enabledshallow root system of plants to absorb trapped rainwater, which seeps through the soil from the trenchesand resulted in facilitating plants to establish andsurvive in the severely degraded uplands inwatersheds.
55

146 BABU et al. [Journal of Soil & Water Conservation 12(2)
Table 3. Watershed wise survival percentage of plantation
S. Name of the Name of Area Average Total No. Species Total no. Percentage No. watershed the farmer/ treated slope(%) of plants of of surviving of(1) (2) owner with SCTs (5) planted plants plants as on survival
(3) (ha) (4) (6) (7) 30.05.2012 (8) (9)
1. Mylaram Chakali 0.5 8 256 Custard 234 91Mallaiah apple,
Pongamia
2. Mylaram Chutta 2 8 321 Custard 287 89Kanakaiah apple,
Pongamia
3. Settihad- Kanaka 2.83 14 1833 Fruit 1685 92punoor Jugadhirao plants
4. Settihad- Pendhur 1 12 180 Fruit 171 95punoor Thulasi Ram plants
5. Kohinoor-B Common 4.04 16 758 Pongamia, 714 94land Glyrecidia,
Custardapple,
Bamboo, etc.
6. Sakeda Marapa 1 8 220 Fruit 188 85Jyothibai plants
7. Sakeda Kotrenga 1 8 385 Fruit 369 96nagu plants
8. Dhurvaguda Common 20 15 7500 Pongamia, 7125 95land Custard
apple,Teak, Amla
9. Dharmasagar A.Bheemrao 12 6 5100 Pongamia, 4590 90and others Custard
apple, Teak
10. Rampur Common land, 6 4 4500 Pongamia, 4050 90 K.Dharmu Custard and others apple, Teak
11. Shivarven- Gout Land 34 8 12500 Custard 11890 95katapur apple
12. Kasireddypally Gout Land 8 5 6000 Custard 5824 97apple
13. Thigulnarsapur Gout Land 12 6 6000 Custard 4842 81apple
14. Ayyagaripally Govt Land 2.5 12 2040 Custard 1800 88apple,
Pongamiaand
Casia siamia
15. Chintapally Govt Land 3 12 1547 Pongamia 950 61and
Casia siamia
Total 49140 44719 91
56

April-June 2013] INNOVATIVE DESIGN AND LAYOUT OF STAGGERED CONTOUR TRENCHES 147
Fig. 1& 2: Close view of Cashew and Custard apple plants surviving only on account of SCTs in Settihadapnoor (Adilabad)and Shivarvenkatpur (Medak) watersheds
Fig. 3 &4: Pre-development (Dhurvaguda, Adilabad) Post-development (Dhurvaguda, Adilabad)
Fig. 4 & 5: Pre-development (Yammaikunta, Adilabad) Post-development (Yammaikunta, Adilabad)
57

148 BABU et al. [Journal of Soil & Water Conservation 12(2)
It was observed that simple modification (ofrestricting the length of SCT to either base width ofA- frame or two times of it, increasing the berm spaceto 1.5 m, placing the dugout soil around the trenchin half moon fashion and planting on the berm ofexcavated trench) in the design and layout of SCTsimproved the survival of plants.
CONCLUSIONThe modified and innovative design and layout
of SCTs helped insitu rain water harvesting andavailability of soil moisture for longer period leadingto better survival of plantation and reclamation ofwastelands. This design and layout may be adoptedin other degraded upper reaches of watersheds forbetter establishment and survival of plantation andreclamation of wastelands.
REFERENCES
Katyal, J.C., Singh, R.P., Sharma, S., Das, S.K.,Padmanabhan, M.V. and Mishra, P.K. 1995. FieldManual on Watershed Management. Pp.18.
Mishra, P., Mazumdar, A. and Ravi Babu, R. 2006.Application of probability analysis of rainfall fordesign of Continuous Contour Trenches, ContourBund and Waste Weirs in Bankura. Journal ofAgricultural Engineering, 43(4): 22-29.
Mishra, P. and Babu, R.R. 2010. Simple User Interface forDesign and Cost Estimation of Contour Trenches forRehabilitation of Non-Arable Degraded Lands in IndiaPaper published in Book Hydrology and WatershedManagement. BS Publications, Hyderabad. In: Sarala,C., Rao, B.V., Giridhar, M.V.S.S. and Varalakshmi, V.(ed).Pp: 531-541.
Murty, V.V.N. 1998. Measures for erosion control on hillslopes. Land and Water Management Engineering,Kalyani publishers Pp: 448-450.
Ravi Babu, R. 2009. Field Manual on design and costestimation of soil and water conservation measuresin watershed development projects. 56 p.
Ravi Babu, R.and Mishra, P. 2005. Design and constructionof Staggered Contour Trenches in Paharpur micro-watershed. Hydrology and watershed management,Himanshu publications, Udaipur. In: Kumar, V, Singh,PK and Purohit, R.C.(ed). pp: 261-267.
Sharda, V.N. 2007. Managing Natural Resources. TheHindu Survey of Indian Agriculture 2007. Pp: 134-142.
58
April-June 2013] STUDY OF THE SHIFTING CULTIVATION SCENARIO IN AIZWAL DISTRICT 149
Journal of Soil and Water Conservation 12(2): 149-152, April-June 2013ISSN: 022-457X
Study of the shifting cultivation scenario in Aizwal district,Mizoram using remote sensing techniques
S. N. DAS1 and S. SAHA2
Received: 18 September 2012; Accepted: 11 March 2013
ABSTRACT
Shifting cultivation is an age old practice in north eastern states. Mizoram is one of the seven statesof the region where 70% of the total population is engaged in agriculture. Aizwal, the capital ofMizoram also thrives on the primitive practice of shifting cultivation (jhuming) as a source oflivelihood. The introduction of watershed approach in the shifting cultivation area during 1994-95was an innovation from Government of India for central assistance to the region for eco-developmentthrough conserving soil and water. The impact of central effort has been studied with the aid ofdigital IRS remote sensing data at a periodicity of 5 years. Supervised classification of land use/ landcover of digital remote sensing data for 2000, 2005 and 2010 have been employed to abstract theextent of current jhum land and abandoned jhum land of Aizwal district. Over-all biomass changesduring the period have also been derived using Normalized Difference Vegetation Index (NDVI)analysis. Increasing trend of both current jhuming (1.45 to 4.18%) and abandoned jhum (27.82 to50.01%) land have been observed during the span of 10 years (2000- 2010). The forest area of Aizwaldistrict has been reduced from 69% to 44% during the period. The over-all biomass has also beenreduced from 91% to 64% from 2000 to 2010. All these points indicate negative impact of the centralassistance programme to contain shifting cultivation. However, introduction of new land use policyby the Mizoram government is a positive step to discourage shifting cultivation practice in the state.
Key words: Shifting cultivation, current jhum land, abandoned jhum land, land use/ land coverchanges, NDVI
1Amity University, Noida (UP);2Soil and Land Use Survey of India, New Delhi
INTRODUCTIONShifting cultivation is a form of agriculture in
which the cultivated or cropped area is shiftedregularly to allow soil fertility to recover underconditions of natural regetation re-growth. Theeconomic survey indicated that 32 per cent of thecultivated area was under jhum and only 20 percent of the demand for rice could be met fromwithin the state. More than 70% of the totalpopulation of Mizoram is engaged in some form ofagriculture (Anon 2012).
In India shifting cultivation is very common innorth eastern states of which it is very extensive inNagaland. In Mizoram, Aizwal is one of theprogressive districts practicing shifting or jhumcultivation over decades. The usual practice iscleaning forest area by slashing and burning
followed by agriculture and horticulture cropping.Such kind of age old agriculture practice is nowbeing discouraged by the Government of Mizoramin the new land use policy adopted in 2009(Anonymous 2012).
Land use/ land cover changes play an importantrole in the environmental processes, and also act asa sensitive indicator for environmental and globalchanges (Van Wijngaarden, 1991). The monitoringof vegetation cover can provide useful cluesconcerning our changing environment and helpnatural resource management. Traditional methodto monitor the vegetation is by field investigation. Itis less efficient and high labor demanding,especially for large areas, and impossible to conductcontinuous investigations and that too forinaccessible areas (Li et al. 2010).
59

150 DAS & SAHA et al. [Journal of Soil & Water Conservation 12(2)
The Department of Agriculture and Cooperation,Ministry of Agriculture, Govt. of India also madean initiative to conserve the natural resourcesthrough Watershed Development Programme inthe Shifting Cultivation Area (WDPSCA) as per thedirectives of National Development Council during1994-95 (Anonymous 2012).
Satellite remote sensing by virtue of tremendouscapability in terms of synoptic view, multi-spectralsensing, multi-temporal data acquisition, real timedata acquisition and computer compatibility serveas a potent tool to study the land resources ofinaccessible terrain, mountains, hills and remotevillages in the country from laboratory using imageanalysis system. Remote Sensing (RS) is nowadays,an advanced powerful monitoring tool for itsconvenience and high efficiency. Thereby, it has beenwidely employed to monitor the vegetation changes(Sabins and Floyd 1977; Justice and Hiernaux 1986;Townshend and Justice 1986; Al-Bakri and Taylor2003). The impact assessment of this scheme on theland use / land cover pattern has been studied usingremote sensing and geographic information system.
The paper deals with the study of dynamics ofshifting cultivation using digital image analysis ofIRS LISS III and IRS P6 data of five years periodicitysince 2000 to 2010 of Aizwal district, Mizoram.
MethodologyThe study has been carried out using ERDAS
Imagine software with following steps:Scanning of SOI toposheets on 1:50000 scale to.tiff formatGeometric correction of each Survey of Indiatoposheet using 16 GCPs and GCS- Everest 1956,India (India,Nepal)Image to image rectification of un-projected2000 digital IRS 1C data using rectified SOItoposheet as reference imageImage to image rectification of re-projected 2005and 2010 digital IRS 1D and IRS P6 data usingrectified Survey of India toposheet as referencebaseMosaic of geo-rectified image of adjacent pathand rowPreparation of district shape file polygon vectorlayer of appropriate projection systemCreation of image file for Aizwal districtGeneration of Un-supervised classified imagesfrom district subset images for necessaryground truth collection
Supervised classification of image for land use/land cover changes and over-all biomass analysishave been carried out by adopting followingapproach:
Ground truth collectionSupervised classification of summer imagesbased on ground informationExtraction of aerial extent of shifting cultivationareaGeneration of statistics on different land use /land cover classesGeneration of NDVI for evaluation of biomasscontentChange detection analysis (2000 & 2010) usingNDVI to evaluate the overall impact of shiftingcultivation over a time span of 10 years
RESULTS AND DISCUSSIONIt is observed out of supervised classification of
land use/ land cover analysis that spatial extent ofshifting cultivation area (Fig.1 and Table 1) in Aizwaldistrict, Mizoram is increasing over the time. The areaunder abandoned jhum land increased from 27.82to 50.01% during 2000 to 2010. The extent of currentjhum land is also increased to 4.18% in 2010 from1.45% in 2000 and 1.72% in 2005 respectively.However, it reflects the influence of Local VillageCouncil in controlling the jhum cultivation in thedistrict. The new land use policy of MizoramGovernment is aimed to discourage the shiftingcultivation through shifting to stable farming with aprovision of financial support to 120000 shiftingcultivators within five years.
Fig 1. Land Use/ Land Cover changes in Aizwal districtduring 2000 - 2010
60

April-June 2013] STUDY OF THE SHIFTING CULTIVATION SCENARIO IN AIZWAL DISTRICT 151
It is also observed that an inverse relationshipexists between forest vegetation and shiftingcultivation area (i.e., current and abandoned jhumland) in the district (Fig.2).
Table 1. Statistics on land use/ land cover changes in Aizwal during 2000-2010
Land use 2000 2005 2010
Area (ha) % Area (ha) % Area (ha) %
Forest 218255 69.20 160647 50.94 138998 44.07
Current jhum land 4585 1.45 5428 1.72 13185 4.18
Abandoned jhum land 87754 27.82 143860 45.61 157728 50.01
Habitation 2539 0.81 2799 0.89 2954 0.94
River 2266 0.72 2664 0.84 2533 0.80
Total 315398 100 315398 100 315398 100
Fig. 2. Scenario of Shifting Cultivation in Aizwal Districtduring 2000 - 2010
The impact of watershed development is reflectedin terms of overall change in biomass fromNormalized Differential Vegetative Index (NDVI)(Fig. 3). The higher value of NDVI (-1 to +1) indicateshigher biomass content. NDVI values are classifiedin five different categories which are presented inTable 2. The study reveals that the biomass contenthas been reduced to 63.69% in 2010 from 91.46 % in2005 and 91.78% in 2000 which reflects the negativeimpact of watershed development in containingshifting cultivation in Aizwal district. Higherbiomass content in 2000 and 2005 are indicative oflesser area under shifting cultivation (Fig. 4).
It is seen from the study that the shiftingcultivation practices was in check till 2005 which hasbeen increased more than two folds in 2010 resultingdepletion of forest cover in from 69 to 44% in aspan of 10 years. Such depletion of green cover will
Fig. 3. NDVI analysis for Biomass Change Detection during2000- 2010
Table 2. Statistics on Overall changes of biomass during 2000– 2010 in Aizwal
NDVI class Area (ha)2000 2005 2010
Very Low 873 1259 6294
Low 10718 8185 23031
Medium 14326 17516 85202
High 44723 35185 151228
Very High 244758 253252 49642
Total 315398 315398 315398
61

152 DAS & SAHA et al. [Journal of Soil & Water Conservation 12(2)
impact carbon sequestration and induce ecologicalimbalance in the district. There is a need to controlthe shifting cultivation practice as per the new landuse policy of Government of Mizoram to stemecological disaster in the region.
CONCLUSIONIt may be inferred from the supervised
classification of land use/ land cover that bothcurrent and abandoned jhum area have increasedfrom 2000 to 2010 that point towards insignificantimpact of watershed development to arrest shiftingcultivation practice in Aizwal district, Mizoram.Similar observation has also been made from NDVIanalysis. It is hoped that the new land usepolicy would be effective in controlling theshifting cultivation of Aizwal and the Mizoram stateas well.
REFERENCES
Al-Bakri, J.T and Taylor, J. C. 2003. Application of NOAAAVHRR for monitoring vegetation conditions andbiomass in Jordan, Journal of Arid Environments;54, pp. 579-593.
Anonymous. 2012. Wikipedia, the free encyclopedia.http://www.en.wikipedia.org.
Anonymous. 2012 http://www.mizoram.gov.inAnonymous. 2012 http://www.dac.nic.inJustice, C.O and Hiernaux, P. H. Y. 1986 Monitoring the
grasslands of the Sahal using NOAA AVHRR data:Niger (1983) International Journal of Remote Sensing,7, pp. 1475–1497.
Sabins, Jr and Floyd, F. 1977. Remote Sensing - Principlesand Interpretation, published by W.H. Freeman andCo., NY.
Townshend, J. R. G and Justice, C. O. 1986. Analysis of dynamicsof African vegetation using the NDVI, InternationalJournal of Remote Sensing; 7, pp. 1224–1242.
62

April-June 2013] CHALLENGES IN MANAGING AGRICULTURAL KNOWLEDGE 153
Journal of Soil and Water Conservation 12(2): 153-158, April-June 2013ISSN: 022-457X
Challenges in managing agricultural knowledge
V.K. BHARTI1, HANS RAJ2, SURAJ BHAN3 and MEETALI BHARTI4
Received: 22 February 2013; Accepted: 26 April 2013
ABSTRACT
The emergence of Information and Communication Technologies (ICT) in the last decade has openednew avenues in knowledge management that could play important roles in meeting the prevailingchallenges related to sharing, exchanging and disseminating knowledge and technologies. ICTallows capitalizing to a greater extent on the wealth of information and knowledge available forAgriculture Knowledge, Science and Technology Knowledge and information have become the majordrivers of social and economic transformation in the world. They are of even higher significance inagriculture, which sustains the food and livelihood security as well as economic growth. Presently,the agriculture across the globe is facing challenges in the wake of increasing climatic variability,biotic stresses, and competitive global market; declining base of production resources; growingessentiality of application of hi-tech and precision farming for adaptation and increasing need formatching the pace of technological advancements and knowledge explosion. Generation anddissemination of market oriented information is very essential for making agriculture profitable andsustainable. Integrated technology dissemination system combining all the available technologiesfrom research institutes, extension organizations, input dealers, corporate R&D companies andmarketing agencies need to be promoted for effective adoption of agriculture technologies anddevelopment of agri- business models. There is need to tap the large reservoir of farmers' tacitknowledge to consider their perspective and for blending with the scientific findings to developapplicable knowledge and appropriate technologies. Promotion of mobile networks along withcommunity radios may enhance the knowledge management at grassroots level. Various ContentManagement tools used in different portals may be adapted for extension systems. Knowledge Portalsmay be developed with vernacular language content to meet out local needs. More focus should begiven to farmers' success stories through print media and ICT tools. Market Information Systemsshould be integrated with KVK system so that knowledge is provided along with market information.
Key words: Portal, documentation, Geographical Information System, agro-climatic, knowledgeexplosion, Integrated technology
1 Chief Production Officer, 2 Information System Officer, Directorate of Knowledge Management in Agriculture, ICAR, Pusa, New Delhi-110012, 3 President, Soil Conservation Society of India, New Delhi-110012, 4 M.Tech. Electronics and Communication Engineering
INTRODUCTIONKnowledge management in agriculture is crucial
factor concerned with ways of exchangingknowledge among those who can develop it andthose who can use it. Knowledge managementprogrammes, based on this approach, attempt tomanage the process of information exchangebetween groups of specialists, companies, andresearch and development (R&D) organizations.
Information technology (IT) has become thebuzzword in India these days. It is making
tremendous impact on the rural economy due toits wide application and reach. The Nationalagricultural research and extension systems of Indiahave developed content in English, Hindi andregional languages in support of extension andeducation over the time. Presently, the availabilityof information in the digital format or media isscarcely available. Thus, the need for contentdigitization and creation of new content in thedigital mode has become indispensable. The vast
63

154 BHARTI et al. [Journal of Soil & Water Conservation 11(4)
quantum of knowledge is being shared ininteractions among experts and with farmers.However, this rich information is most of the timenot capitalized for synthesis, analysis andcodification for re-use. The agricultural extensionsystem requires timely, adequate and qualityupdate and accurate content for providing theeffective information delivery to the farmers. Theprospective of ICT lies in bringing about an overallqualitative development in life by providing timelyand quality information inputs for decision making.
Usefulness of ICT
Planning tools and systems for the agriculturesector are the areas where ICTs can addsignificant value. The Geographic InformationSystems (GIS) offer agriculture and natural resourcemanagement planners an increasingly way to planfor land use, track or estimate environmentalimpacts, visualize important social data, andcompare different agricultural developmentscenarios. Agricultural and land use planners haveused maps as a standard tool for years, but theability of GIS to remake maps rapidly inresponse to new data or analysis allows plannersnew degrees of freedom in foreseeing andpreventing disaster, or planning developmentscenarios (Eastman et al., 1996).
Accurate and timely information regardingareas of food surplus and shortages driven by thevagaries of climate can be facilitated through ICT.Such use can contribute to improved foodmanagement and food security. Effective andresponsible GIS use demands extensive data setsincluding detailed data gathered from multiplelocations, each geo-referenced (i.e. with locationinformation) so that it can be mapped correctly bythe GIS.
Large data sets present a human andmanagement challenge, but ICT systems can bedeployed to aggregate such data from multiplesources, permitting distributed teams of surveyorsto gather data and use the telephone, Internet torecord and synchronize survey information to acentral database. ICT enables a betterunderstanding of issues such as can be changedand linked to the management and conservationof biodiversity. The power of ICT as an
information and networking medium enablescitizens to act as environmental enforcementagents, alerting decision makers to complianceinfringements while leveraging on their powerto reach and influence public opinion. Anyprogramme that provides connectivity has thepotential to increase sustainability, givenappropriate content and training. Two applicationareas key to natural resource management areGIS mapping and land registration. ICT cancontribute to environmental sustainability byproviding public access to information and a meansof participation by the public in decision making,information dissemination, public awareness,promotion of best practice techniques andtechnologies; source of alternative livelihoods;and environmental monitoring, mapping andmanagement (Nnadi, et al, 2010).
Effective environmental databases can be usedto track the status of various environmentalindicators and impacts for sustainableenvironmental management and protection.
Impact of ICT on Research and Extension
The impact of ICT in agricultural research isquite significant. This is taking place through threemeans. The first is the changing nature ofagricultural information systems, which is havinga profound impact on how research results arecommunicated and disseminated.
With the development of web-based informationsystems the possibility of accessing databasesand information on-line has increaseddramatically, with the incidental problems that isgenerating from the point of view of theconfidentiality of the information and of theeconomics of information management.
The rapid expansion of web publishing isdramatically changing the way people accessinformation, and is leading to the developmentof metadatabases. Based on virtual libraries thatprovide direct access to the publication, whereverit is located, as long as the publication is accessiblethrough the web. Secondly, the significantadvances that are being made in softwareapplications related to agricultural researchtechniques, coupled with advances in other areasof science.
64

April-June 2013] CHALLENGES IN MANAGING AGRICULTURAL KNOWLEDGE 155
ICT Role in Agricultural Knowledge Management
Knowledge sharing, exchanging anddissemination are elements in a broader themewhich is knowledge management. The centralpurpose of knowledge management is totransform our intellectual assets into enduringvalue (Metcalfe, 2005). The basic idea is tostrengthen, improve and propel the organizationby using the wealth of information andknowledge that the organization and its memberscollectively possess (Milton, 2003). Large part ofknowledge is a tacit knowledge not explicit.This istrue for knowledge in agriculture where a lot ofgood practices are transferred without being welldocumented in books, papers or extensiondocuments. To manage the knowledge properly,ICT is needed. In effect, there are manyinformation technologies that can be used forknowledge management. Content managementsystem in its wider sense including data bases andmultimedia, is the core technology of informationand knowledge management. This technologycan be used in different applications.� Building a national agriculture research
information system needs to include researchoutcomes, projects, institutions and researchersin every country, and a regional researchinformation system that works as a portal forall the national agriculture research informationsystem for:
� Developing an information system ofindigenous agricultural practices can enableresearchers to examine this knowledge anddecide on its usefulness for sustainabledevelopment. Such a system will also keepthis knowledge for future generation beforeit disappear as a result of advancedtechnologies.
� Developing an information system recordingmatured technologies that on a trial basishave proven successful and success storiesthat have achieved economic growth willstrengthen the interaction between inventorsand innovators. This will lead to an innovation-driven economic growth paradigm
� Storing and retrieving images, videotapesand audiotapes related to different agriculturalactivities.
� Geographic Information System (GIS) areneeded to store databases about natural
resources with a graphical user interface thatenables users to access these data easily usinggeographical maps. Decision support systemtechniques are needed in many applications:
� Simulating and modeling methods can be usedto build computer systems that can modeland simulate the effect of different agriculturalproduction policies on the economy and theenvironment to help top management makedecisions.
Agricultural Knowledge Generation, Refinement andDissemination
Technology assessment, refinement anddissemination are important for agriculturaltransformation. The foremost requirement fordeveloping appropriate technologies for itsacceptance by the farmers may be increasedinvolvement of farmers in the process of technologygeneration, refinement and dissemination. Farmerparticipatory research (FPR) encourages farmers toengage in experiments in their own fields so thatthey can learn, adopt new technologies share withother farmers. New information, technologies andconcepts get communicated to farmers through theFPR approach.The rise of FPR was a deliberate effortamong agricultural professionals to combinefarmers' indigenous traditional knowledge (ITK)with the more widely recognized expertise of theagricultural research community. The technologyinnovation process includes research followed bytechnology development, testing and adaptation,technology diffusion. The Technology Integrationrefers to the process or a set of activities that musthappen if new information can be put to use in thefarm production system.
It is to be reemphasized that technology andresearch information has been used as synonymwithout considering their basic structuraldifferences. A more holistic approach through theprocess of technology integration can provide abase for reconciling the need for higher productivitywith productive employment and incomegeneration without displacing labour. While theneed for a technological base for extension mightseem a truism, it is frequently poorly handled inthe design and operation of extension systems.
The current emphasis on transfer of technologyis on high potential areas with the main issue onadaptation of available technology. The real
65
156 BHARTI et al. [Journal of Soil & Water Conservation 11(4)
challenge is on transfer of technology in themarginal areas to small-scale production systems.In resource-poor areas, it is required to optimizereturns from the minimum use of external inputsand to quantify the level of inputs required to ensurethat the system is truly sustainable. The strategyfollowed in designing and implementing transferof technology projects has been based more on thesupply of technological information than on theprior consideration of limitations at the farm level.The usual approach has been that any technologywhich produces the best results at the experimentallevel is superior, and that is what should be offeredto the farmers.What is needed is a technologygeneration and transfer mechanism and amethodology that will make it possible to recognizeand classify the different types of small farmers.Then and only then, the organizational design cangenerate and make available to farmers anappropriate technology which they will be able toadapt.
More participatory and demand driven researchis the need of the hour. The social scientists have tobe involved as member of the Inter-disciplinaryteam at the time of formulation of projects and itsimplementation. Research in extension educationhas to be based on appropriate sampling, quasiexperimental designs and statistical tools. Theextension research findings have to be utilized foragricultural research and development.
In order to have appropriate convergence andintegration of research, education and extension,the ICAR may specifically play more role toAgricultural universities and Deemed universities.There is need to tap the large reservoir of farmers'tacit knowledge to consider their perspective andfor blending with the scientific findings to developapplicable knowledge and appropriate technologies.
The impact assessment of the technologicalinterventions need to be researched withappropriate use of new tools focusing onprofitability and livelihood security indicatorsrather than collecting data only on yield. Thereshould be institutional arrangements with adequatefunding support for validation and effectiveapplication of the innovations developed by farmer-innovators.
It is essential to do process documentation ofvarious multi extension multi extension modelsprevailing across India so as to encourage greater
adoption of technologies to suit regional agro-climate and location specific needs. It is essentialto do process documentation of various multiextension multi extension models prevailing acrossIndia so as to encourage greater adoption oftechnologies to suit regional agro-climate andlocation specific needs.Enabling policies arerequired for effective application of emergingtechnologies having good production potential likeBt Brinjal and other technologies developed in India.
Knowledge Generation and Dissemination
Krishi Vigyan Kendras to play the role ofknowledge resource centre for effective knowledgemanagement. There is a need to mobilize small andmarginal farmers for diversified Agriculture tomeet the increasing demand for horticulturalproducts.
Institutionalization of linkage among farmers,researchers, extension workers and otherstakeholders need to be made to promote mutualtrust. Generation and dissemination of marketoriented information is very essential for makingagriculture profitable and sustainable.
Institution based training has its own importance.For effective communication and dissemination oftechnologies, the community based trainingprogrammes in villages need to be encouraged.Integrated technology dissemination systemcombining all the available technologies fromresearch institutes, extension organizations, inputdealers, corporate R&D companies and marketingagencies need to be promoted for effective adoptionof agriculture technologies and development ofagri- business models.
There are large number of indigenoustechnologies innovated by the farmers mostappropriate to their agro- climatic situation. Suchtechnologies should be meticulously identified,validated on scientific principlesand shared amongfarmers. It is essential to do process documentationof various multi extension multi extension modelsprevailing across India so as to encourage greateradoption of technologies to suit regional agro-climate and location specific needs. Frontlinedemonstrations conducted by KVKs in India havebeen found to be proven and effective mechanismto demonstrate the production potential oftechnologies to farmers and extension personnel.
66

April-June 2013] CHALLENGES IN MANAGING AGRICULTURAL KNOWLEDGE 157
Use of ICT for Agricultural Knowledge Management
Knowledge and information have become themajor drivers of social and economic transformationin the world. They are of even higher significancein agriculture, which sustains the food andlivelihood security as well as economic growth.Presently, the agriculture across the globe is facingchallenges in the wake of increasing climaticvariability, biotic stresses, and competitive globalmarket; declining base of production resources;growing essentiality of application of hi-tech andprecision farming for adaptation and increasingneed for matching the pace of technologicaladvancements and knowledge explosion.Therefore, access to real time information andvalidated as well as processed technologicalknowledge have to be ensured to the farmingcommunity and other related stakeholders forinformed, quality and prompt decisions. Theconcern is how to strengthen the collation,integration and customization of knowledge andinformation as well as their speedy flow andutilization among the community at large.Information and Communications Technologies(ICT), such as the World Wide Web, e-mail,telephones, fibre optics and satellites haverevolutionized the way not only of interaction andnetworking pattern in the societies but also the verydesign and functioning of knowledge managementmodels and information sharing mechanisms. ICTcan enable individuals, communities and institutionsto generate, access, share, adapt and apply largervolume of information at an enhanced rate and atreduced costs. They are also the potential meansfor community empowerment as well as solutionsto the dwindling strength of extension functionaries.
ICT can facilitate larger awareness and extent ofpeople's participation in development processes.The existing gaps between the haves and haves notwith respect to knowledge and information couldbe bridged effectively across societies, cultures,communities and gender. Realizing their immensepotential as engine of growth and development,several countries made initiatives of ICT applicationin agricultural knowledge and informationmanagement. The use of ICT to improveinformation flow and to connect people within therural areas has proved that illiteracy of farmingcommunities may no longer be an excuse to bedenied of some form of extension system. Mobile
telephony, innovative community radio andtelevision programs, mobile phones in combinationwith radio, video shows, information kiosks, webportals, rural tele-centers, farmer call centers, video-conference, offline multimedia CDs, open distancelearning, etc are the major forms of ICTs applied invarious countries.
Major IssuesOpportunities and challenges of using ICT as well
as various forms and cases of ICT applications is amajor concern. The other important issues is locationspecific and vernacular based content development,user friendliness, cost-effectiveness, capacitybuilding, development and deployment of usableICT products, enhanced investments in ICTapplication and impact assessment, etc.
A range of challenges which ICT-based initiativeexperience include technological dependence; lackof accessible telecommunication and internetinfrastructure in rural and remote areas; capital costof ICTs, high cost of on-going access and support;inherent need for capacity building; difficulty inintegrating with existing media, localcommunication methods and traditions; and, lackof involvement of all stakeholders, especiallywomen and youth were highlighted.
For effective application of ICTs for agriculturalknowledge management, there is a need to:� Build capacity of farmers and extension workers
in optimum use of mobile networks.� Promotion of mobile networks along with
community radios will enhance the knowledgemanagement at grassroots level.
� Voice-based mobile advisory in local languageis to be emphasized for easy understanding offarmers.
� Low cost teleconferencing may be encouragedto enhance the knowledge sharing and problemsolving capabilities of extension personnel.
� Commodity based Knowledge Portals may bedeveloped with vernacular language contentusing combination of knowledge managementtools and based on local needs.
� To enhance the uses of ICT in agriculture, thereis a need for capacity building and training ofusers, KVK staff and farmers for the strengthof ICT for extension purposes.
� Farmers' success stories should be disseminatedthrough print media and ICT tools.
67

158 BHARTI et al. [Journal of Soil & Water Conservation 11(4)
CONCLUSIONInformation and communication technology
for development is a phenomenon as well as amedium that' has radically improved interactionthroughout the world. Thus, there is the need todevelop a strong linkage complimented by flawlessinformation flow enhanced through the effectiveuse of information and communication technologiesby the extension service to significantly boostagricultural production and improve rurallivelihoods. This will enhance the quality ofinteraction between extension agents and theirclientele instead of moving messages through along chain of hierarchical system. The web-basedsystem would not only strive to generate high-yielding agricultural technologies that aresufficiently adapted and relevant to specific localenvironments, but also provide useful servicesneeded to raise the quality of life by acceleratingthe diffusion and mass adoption of newtechnologies on farms. An effective informationtechnology does not only create demand for butalso supply information package that are desiredto undertake necessary modifications of giventechnologies or help to plan new agriculturalresearch agenda. There is need to tap the largereservoir of farmers' tacit knowledge to considertheir perspective and for blending with the scientific
findings to develop applicable knowledge andappropriate technologies. Promotion of mobilenetworks along with community radios mayenhance the knowledge management at grassrootslevel.
REFERENCES
Indian Council of Agricultural Research 2011.Proceedings of fourth national conference on KrishiVigyan Kendra on KVK as Resource and KnowledgeCentre for Agricultural Technology
Indian Council of Agricultural Research 2011.Proceedings of International Conference onInnovative Approaches for Agricultural KnowledgeManagement: Global Extension Experiences held on9-12 November, 2011 at New Delhi, India.
Kokate, K.D. and others 2011. Future AgriculturalExtension
Krishi Vigyan Kendra- Kisan Mobile Advisory, 2010,Zonal Project Directorate, Zone-7, ICAR, JNKVVCampus, Jabalpur (M.P.)
National Institute of Science, Technology andDevelopment Studies(2008):India Science &Technology 2008, New Delhi, CSIR 265
Sharma, Arpita, Community Radio as an effective toolfor agricultural development by traditional media.
Yaduraju, N.T. (2009): NAIP e-Agriculture Initiatives.Information for Development, 2009.(www.i4donline.net).
68

April-June 2013] DEVELOPMENT OF COMPUTER AIDED DESIGN 159
Journal of Soil and Water Conservation 12(2): 159-167, April-June 2013ISSN: 022-457X
Development of Computer Aided Designprocedure for bench terraces
AKHILESH KUMAR1, P V SINGH, VARUN TIWARI and R K TEWARI
Received: 4 December 2012; Accepted: 26 May 2013
ABSTRACT
Bench terracing in which step like fields are developed by cutting and filling of the soil acrossgeneral slope is the only way to practice agriculture on steep slopes. The design of a bench terracingsystem involves a large number of parameters pertaining to climate, topography, soil characteristics,cropping systems, farming operations and availability of construction material. Based on the natureof bench and riser these terraces are classified into a number of types like table top, inclined inwardor inclined outward with inclined or vertical riser. Each type of bench terrace system has its ownpeculiarity which makes them suitable to a particular set of conditions. Thus before taking up thedesign, the selection of an appropriate type of bench terracing system required to be designed in anarea becomes necessary in order to make the system effective under existing conditions at the place.The functional utility, limitation and requirement of each design parameter in isolation and incombinations are to be understood adequately to arrive at a logical solution. To examine efficacy ofdifferent design alternatives, one has to work out a number of design solutions based on differentpossible combinations of input variables which becomes time consuming and tedious task particularlywhen attempted through use of a number of mathematical relationships. In this paper a computeraided design solution for bench terracing system for easy and accurate determination of designparameters for various combinations of input variables at a place has been developed. This computeraided design procedure is likely to prove immensely helpful to field level workers and organizationsto arrive at an optimal design of bench terraces for all possible combinations of input variables.
Key words: Bench terrace, computer algorithm, flow chart
1Department of Soil and Water Conservation Engineering College of Technology, Pantnagar-263145E mail: [email protected]
INTRODUCTIONAdoption of bench terracing is the only way to
put steep sloping lands in hilly areas to agriculturaluse. In Bench terraces the soil is cut from the upperarea and filled in the lower area. By cutting andfilling of the soil a series of steps like fields areconstructed across the general slope of the landwhich also helps in reducing soil erosion andconserving runoff water. On the basis of the natureof riser inclination and the nature of the bench, theseterraces are classified into different categories asterraces with vertical risers and level bench terraceswith inclined risers and level bench, terraces withvertical risers and outward sloping bench, terraceswith inclined risers and outward sloping bench,
terraces with vertical risers and inward slopingbench and terraces with inclined risers and inwardsloping bench (Fig. 1). The design and adoptabilityof each type of these terraces is referred to aparticular set of site conditions and requirements.This limitation thus makes it essential to select anappropriate type of bench terracing system at aplace before attempting design and construction.For example, in low rainfall areas where the soildepth is shallow the outward sloping benches arefound to be more relevant as compared to inwardsloping bench terraces. Similarly, in high rainfallareas where the soil depth is sufficient, inwardsloping bench terraces will prove to be moreeffective in comparison to others. Also, depending
69

160 KUMAR et al. [Journal of Soil & Water Conservation 12(2)
A. Level bench terraces
B. Outward sloping bench terraces
C. Inward sloping bench
Fig. 1. Line diagram of different bench terraces with vertical and inclined risers
upon the height and stability of the soil material,the riser may be kept as vertical or inclined.
The design of a bench terracing system iscumbersome and tedious job as it involves largenumber of parameters pertaining to climate,topography, soil characteristics, cropping system,
farming operations and availability of constructionmaterial. The construction of bench terraces in an areanot only requires a sound technical know how butalso huge monetary provisions as it involvestremendous amount of earth work. To make thedesign of bench terraces cost effective and efficient,
70

April-June 2013] DEVELOPMENT OF COMPUTER AIDED DESIGN 161
not only selection of an appropriate type of benchterracing system as per the existing conditions butalso accurate determination of design parametersconsidering various design variables at a placebecomes essential. Field level organizations involvedin this area of work may find it difficult to arrive atan optimal design using conventional mathematicaldesign procedures as it will require lot of efforts andtime. As an alternative approach, a design solutionbased on computer aided design will prove to beimmensely helpful to easily and quickly determinedesign parameters for various combinations of inputvariables at a place. Based on above considerationsa computer aided design solution for bench terracingsystem for easy and accurate determination of designparameters for various combinations of inputvariables at a place has been developed. This designprocedure is very simple and user friendly as itprovides various design parameters of benchterracing system by just entering the values of inputdesign variables for any conditions.
MATERIALS AND METHODSLand slope, soil depth, rainfall conditions, soil
type, type of crops grown and type of machinerybeing used are basic information required in theselection and design of a bench terracing system inan area. Considering these input information andtheir combinations, the design parameters like widthof the bench (W), vertical interval (VI), horizontalinterval (HI), required depth of cut (Dc), riserinclination (n), slope across the bench (g), slope alongthe bench (s), earthwork volume (Ew) and percentarea loss (AL) are to be determined.
The permissible available depth of cut of soilproves to be a limiting factor and in no case the soilshould be dug more than the permissible depth.Further, in developing the computer program thedepth of cut has been considered upto a maximumof 1m only as digging more than 1m depth willincrease the cost of construction. Similarly, the widthof bench has been considered in the range of 3mminimum to a maximum of 6m depending uponavailable land slope. This is because less than 3mwide bench will make agricultural operationsdifficult while keeping bench width more than 6mwill increase the depth of cut. Similarly, themaximum height of riser has been considered as 2m,as risers greater than 2 m height will becomeunstable. The values of inclination of the risers (n)
have been fixed as n = 0 for vertical risers and n = 6(6 vertical to 1 horizontal) for stone boulder inclinedrisers, the slope across the bench (g) has been fixedat 5% and the slope along the length of bench is fixedat 0.1%. The nature of the riser is decided accordingto the extent of its size and the nature of the soil.With above consideration, the design parameters ofbench terrace were determined as below.
Width of bench
The actual width of the bench depends upon theslope of the land. The bench width decreases withincreasing land slope and is decided based on thefollowing recommendations (Das, 2002).
Slope of land (S), % Width of bench (W), m
10-15 6.0-4.5
15-25 4.5
> 25 3.0
Vertical and horizontal interval
The vertical interval (VI) is the elevation differenceand the horizontal interval (HI) is the horizontalspacing between two consecutive benches. Both arerelated with land slope as expressed in the followingrelationship,
… (1)
The horizontal interval is related with benchwidth as,
HI =W + n (VI) … (2)
where, n is inclination of the riser and is kept as1:6 (H:V) for stone boulder risers. For vertical riserthe value of n is zero.
Required depth of cut
The required depth of cut (Dc) depends on verticalinterval and the width of bench and is expressed as,
…(3)
where, g is the slope across the bench in m/m.Positive and negative signs are used in inward andoutward sloping bench terraces respectively. In caseof level bench, the value of g is zero and the depth ofcut is just half of the vertical interval. Generally thevalue of inward slope ranges between 2 to 10%depending upon the drainage requirement (Suresh,
71
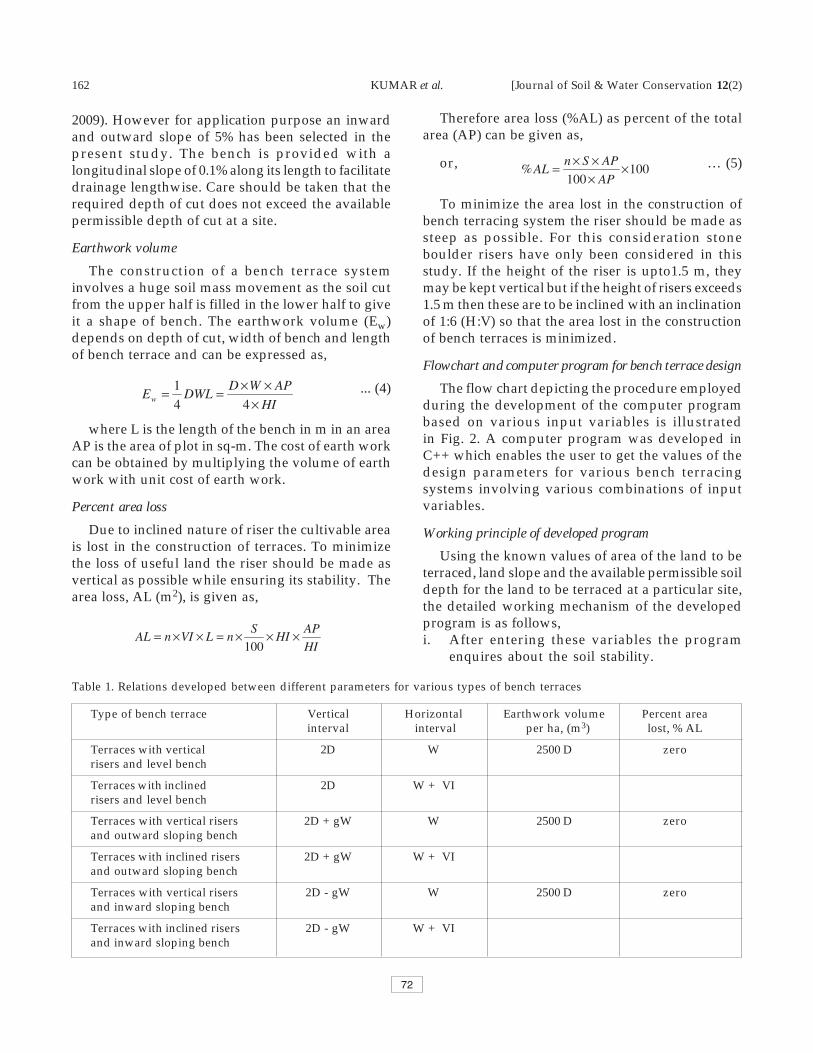
162 KUMAR et al. [Journal of Soil & Water Conservation 12(2)
2009). However for application purpose an inwardand outward slope of 5% has been selected in thepresent study. The bench is provided with alongitudinal slope of 0.1% along its length to facilitatedrainage lengthwise. Care should be taken that therequired depth of cut does not exceed the availablepermissible depth of cut at a site.
Earthwork volume
The construction of a bench terrace systeminvolves a huge soil mass movement as the soil cutfrom the upper half is filled in the lower half to giveit a shape of bench. The earthwork volume (Ew)depends on depth of cut, width of bench and lengthof bench terrace and can be expressed as,
... (4)
where L is the length of the bench in m in an areaAP is the area of plot in sq-m. The cost of earth workcan be obtained by multiplying the volume of earthwork with unit cost of earth work.
Percent area loss
Due to inclined nature of riser the cultivable areais lost in the construction of terraces. To minimizethe loss of useful land the riser should be made asvertical as possible while ensuring its stability. Thearea loss, AL (m2), is given as,
Therefore area loss (%AL) as percent of the totalarea (AP) can be given as,
or, … (5)
To minimize the area lost in the construction ofbench terracing system the riser should be made assteep as possible. For this consideration stoneboulder risers have only been considered in thisstudy. If the height of the riser is upto1.5 m, theymay be kept vertical but if the height of risers exceeds1.5 m then these are to be inclined with an inclinationof 1:6 (H:V) so that the area lost in the constructionof bench terraces is minimized.
Flowchart and computer program for bench terrace design
The flow chart depicting the procedure employedduring the development of the computer programbased on various input variables is illustratedin Fig. 2. A computer program was developed inC++ which enables the user to get the values of thedesign parameters for various bench terracingsystems involving various combinations of inputvariables.
Working principle of developed program
Using the known values of area of the land to beterraced, land slope and the available permissible soildepth for the land to be terraced at a particular site,the detailed working mechanism of the developedprogram is as follows,i. After entering these variables the program
enquires about the soil stability.
Table 1. Relations developed between different parameters for various types of bench terraces
Type of bench terrace Vertical Horizontal Earthwork volume Percent areainterval interval per ha, (m3) lost, % AL
Terraces with vertical 2D W 2500 D zerorisers and level bench
Terraces with inclined 2D W + VIrisers and level bench
Terraces with vertical risers 2D + gW W 2500 D zeroand outward sloping bench
Terraces with inclined risers 2D + gW W + VIand outward sloping bench
Terraces with vertical risers 2D - gW W 2500 D zeroand inward sloping bench
Terraces with inclined risers 2D - gW W + VIand inward sloping bench
72

April-June 2013] DEVELOPMENT OF COMPUTER AIDED DESIGN 163
Fig. 2 Flow chart for developed computer program
ii. Enter ‘0’ for stable soil and ‘1’ for unstable soilat the prompt.
iii. If the soil is stable, the program sets the slope ofthe riser as zero (n = 0) for the case of unstablesoil the riser inclination is taken as n = 0.167.
iv. According to the slope entered, the width of thebench is fixed as recommended.
v. The values of vertical interval (VI) andhorizontal interval (HI) are determined.
vi. The available soil depth (Da) is compared withVI/2; ifa. Da = VI/2 the depth of cut (Dc) is fixed to
be equal to Dab. Da > VI/2 we can go either for an inward
sloping bench or a flat bench according tothe cropping pattern of the region and Dcis calculated.
c. Da < VI/2 we can go for flat or outwardsloping bench; to be decided on the basisof moisture conservation required.
73

164 KUMAR et al. [Journal of Soil & Water Conservation 12(2)
ix. Then the earthwork and percent area loss aredetermined.
x. The program calculated values of designparameters are displayed indicating the type ofbench system best suited for the enteredparameters/conditions
RESULTS AND DISCUSSIONThe developed program is easy and accurate for
determining design parameters of a bench terracingsystem as compared to the existing designprocedure. The developed approach also enables
the user to analyze various sets of input restrictionsand the values of various design parameters can bedetermined without involving any mathematics. Asemi skilled person with a basic knowledge ofcomputer application can perform the design ofbench terraces for any set of conditions. The designparameters obtained for a table top bench terracesystem by using developed computer program areshown in Tables 2 to 7. To ensure the validity andapplicability of the developed design procedureusing a computer program, hypothetical problems
Table 2. Calculated values of design parameters for bench terraces with vertical riser (n=0) and level bench (g=0)
Land Width of Available Slope Stability Cropping Moisture VI HI Calculated Earthwork Areaslope, bench depth (%) pattern conser- (m) (m) depth of (EW) (cu. loss(%) (m) (Da), (m) requires vation cut (Dc), m/ha.) (%)
level field required (m)
6.0 0.3 10 “ —- —- 0.60 6.0 0.300 375.00 0
10 -15 6.0 0.5 12 “ “ —- 0.72 6.0 0.360 450.00 0
6.0 0.7 14 “ “ —- 0.84 6.0 0.420 525.00 0
6.0 0.9 15 “ “ —- 0.90 6.0 0.450 562.50 0
4.5 0.3 16 “ —- “ 0.72 4.5 0.360 450.00 0
15 - 25 4.5 0.5 18 “ “ —- 0.81 4.5 0.405 506.25 0
4.5 0.7 20 “ “ —- 0.90 4.5 0.450 562.50 0
4.5 0.9 24 “ “ —- 1.08 4.5 0.540 675.00 0
3.0 0.3 30 “ —- “ 0.90 3.0 0.450 562.50 0
>25 3.0 0.5 35 “ —- “ 1.05 3.0 0.525 656.25 0
3.0 0.7 40 “ “ —- 1.20 3.0 0.600 750.00 0
3.0 0.9 45 “ “ —- 1.35 3.0 0.675 843.75 0
Table 3. Calculated design parameters for bench terraces with inclined riser (n=1/6) and level bench (g=0)
Land Width of Available Slope Stability Cropping Moisture VI HI Calculated Earthwork Areaslope, bench depth (%) pattern conser- (m) (m) depth of (EW) (cu. loss(%) (m) (Da), (m) requires vation cut (Dc), m/ha.) (%)
level field required (m)
6.0 0.3 10 × —- “ 0.610 6.102 0.305 375.00 1.670
10 - 15 6.0 0.5 12 × “ —- 0.735 6.123 0.367 450.00 2.004
6.0 0.7 14 × “ —- 0.860 6.144 0.430 520.00 2.338
6.0 0.9 15 × “ —- 0.923 6.154 0.462 562.50 2.505
4.5 0.3 16 × —- “ 0.740 4.624 0.370 450.00 2.672
15- 25 4.5 0.5 18 × “ —- 0.835 4.639 0.418 506.25 3.006
4.5 0.7 20 × “ —- 0.931 4.655 0.466 562.49 3.340
4.5 0.9 24 × “ —- 1.125 4.688 0.563 675.00 4.000
3.0 0.3 30 × —- “ 0.947 3.158 0.474 562.50 5.010
>25 3.0 0.5 35 × “ —- 1.115 3.186 0.558 656.25 5.845
3.0 0.7 40 × “ —- 1.286 3.215 0.643 750.00 6.680
3.0 0.9 45 × “ —- 1.460 3.244 0.730 843.75 7.515
74

April-June 2013] DEVELOPMENT OF COMPUTER AIDED DESIGN 165
Table 4. Calculated values of design parameters for bench terraces with vertical riser (n=0) and outward sloping (g=5%)
Land Width of Available Slope Stability Cropping Moisture VI HI Calculated Earthwork Areaslope, bench depth (%) pattern conser- (m) (m) depth of (EW) (cu. loss(%) (m) (Da), (m) requires vation cut (Dc), m/ha.) (%)
level field required (m)
6.0 0.25 10 “ —- —- 0.600 6.0 0.150 187.50 0
10-15 6.0 0.35 12 “ —- —- 0.720 6.0 0.210 262.50 0
6.0 0.40 14 “ —- —- 0.840 6.0 0.270 337.49 0
6.0 0.42 15 “ —- —- 0.900 6.0 0.300 374.99 0
4.5 0.3 16 “ —- —- 0.720 4.5 0.248 309.37 0
15-25 4.5 0.4 18 “ —- —- 0.810 4.5 0.292 365.62 0
4.5 0.44 20 “ —- —- 0.900 4.5 0.337 421.87 0
4.5 0.5 24 “ —- —- 1.000 4.5 0.428 534.37 0
3.0 0.3 30 “ —- —- 0.900 3.0 0.375 468.75 0
>25 3.0 0.5 35 “ —- —- 1.050 3.0 0.450 562.50 0
3.0 0.7 50 “ —- —- 1.500 3.0 0.675 843.75 0
3.0 0.9 70 “ —- —- 2.100 3.0 0.975 1218.75 0
Table 5. Calculated values of design parameters for bench terraces with inclined riser (n=1/6) and outward sloping (g= 5%)
Land Width of Available Slope Stability Cropping Moisture VI HI Calculated Earthwork Areaslope, bench depth (%) pattern conser- (m) (m) depth of (EW) (cu. loss(%) (m) (Da), (m) requires vation cut (Dc), m/ha.) (%)
level field required (m)
6.0 0.25 10 × —- —- 0.610 6.102 0.155 190.63 1.670
10-15 6.0 0.35 12 × —- —- 0.735 6.123 0.217 266.25 2.004
6.0 0.40 14 × —- —- 0.860 6.144 0.280 341.88 2.338
6.0 0.42 15 × —- —- 0.923 6.154 0.312 379.69 2.505
4.5 0.3 16 × —- —- 0.740 4.624 0.257 313.13 2.672
15-25 4.5 0.4 18 × —- —- 0.835 4.639 0.305 369.85 3.006
4.5 0.44 20 × —- —- 0.931 4.655 0.353 426.57 3.340
4.5 0.5 24 × —- —- 1.125 4.688 0.450 540.01 4.000
3.0 0.3 30 × —- —- 0.947 3.158 0.399 473.44 5.010
>25 3.0 0.5 35 × —- —- 1.115 3.186 0.483 567.97 5.845
3.0 0.7 50 × —- —- 1.637 3.273 0.743 851.57 8.350
3.0 0.9 70 × —- —- 2.378 3.397 1.114 1229.7 11.69
75

166 KUMAR et al. [Journal of Soil & Water Conservation 12(2)
Table 6. Calculated values of design parameters for bench terraces with vertical riser (n=0) and inward sloping (g= 5%)
Land Width of Available Slope Stability Cropping Moisture VI HI Calculated Earthwork Areaslope, bench depth (%) pattern conser- (m) (m) depth of (EW) (cu. loss(%) (m) (Da), (m) requires vation cut (Dc), m/ha.) (%)
level field required (m)
6.0 0.50 10 “ —- —- 0.600 6.0 0.450 562.50 0
10-15 6.0 0.70 12 “ —- —- 0.720 6.0 0.510 637.50 0
6.0 0.90 14 “ —- —- 0.840 6.0 0.570 712.50 0
6.0 1.00 15 “ —- —- 0.900 6.0 0.600 749.00 0
4.5 0.50 16 “ —- —- 0.720 4.5 0.473 590.62 0
15- 25 4.5 0.70 18 “ —- —- 0.810 4.5 0.517 646.87 0
4.5 0.90 24 “ —- —- 1.080 4.5 0.653 815.62 0
4.5 1.00 25 “ —- —- 1.125 4.5 0.675 843.75 0
>25 3.0 0.50 30 “ —- —- 0.900 3.0 0.525 656.25 0
3.0 0.70 35 “ —- —- 1.050 3.0 0.600 750.00 0
3.0 0.90 40 “ —- —- 1.200 3.0 0.675 843.75 0
3.0 1.00 45 “ —- —- 1.350 3.0 0.750 937.50 0
Table 7. Calculated values of design parameters for bench terraces with inclined riser (n=1/6) and inward sloping (g=5%)
Land Width of Available Slope Stability Cropping Moisture VI HI Calculated Earthwork Areaslope, bench depth (%) pattern conser- (m) (m) depth of (EW) (cu. loss(%) (m) (Da), (m) requires vation cut (Dc), m/ha.) (%)
level field required (m)
6.0 0.50 10 × —- —- 0.610 6.102 0.455 559.36 1.670
10-15 6.0 0.70 12 × —- —- 0.735 6.123 0.517 633.74 2.004
6.0 0.90 14 × —- —- 0.860 6.144 0.580 708.11 2.338
6.0 1.00 15 × —- —- 0.923 6.154 0.612 745.30 2.505
4.5 0.50 16 × —- —- 0.740 4.624 0.482 586.86 2.672
15- 25 4.5 0.70 18 × —- —- 0.835 4.639 0.530 642.64 3.006
4.5 0.90 24 × —- —- 1.125 4.688 0.675 809.88 3.340
4.5 1.00 25 × —- —- 1.174 4.696 0.700 837.87 4.000
3.0 0.50 30 × —- —- 0.947 3.158 0.549 651.55 5.010
>25 3.0 0.70 35 × —- —- 1.115 3.186 0.633 744.52 5.845
3.0 0.90 40 × —- —- 1.286 3.215 0.718 837.48 6.680
3.0 1.00 45 × —- —- 1.460 3.244 0.805 930.45 7.715
were considered with various input information andthe results obtained by the developed procedurewere compared with the results obtained by usingconventional method for the similar input variables.
The values of design parameters obtained from boththese methods were found exactly similar astabulated in Table 8.
76

April-June 2013] DEVELOPMENT OF COMPUTER AIDED DESIGN 167
CONCLUSIONConsidering the hypothetical design problems,
the developed design procedure has been comparedand verified with existing design procedure forvarious types of terrace systems. Under variousinput design variables the solutions obtained byusing these two procedures were observed to besame and thus the developed design procedurebecomes applicable for all the conditions of benchterracing systems considered in the study.Moreover the developed procedure has an edgeover the conventional procedure as it is simple touse, accurate, user friendly and enables analysis ofvariety and wide range of design alternatives veryquickly. As an added advantage, any semi skilledperson with only basic knowledge of computerapplication can perform the design very effectively.
REFERRENCESCox, M.B. 1968. Conservation bench terraces in Kansas,
Transactions of the ASAE. Vol. 11, No. 3, May-June,pp. 257-259.
Das, Ghanshyam 2002. Hydrology and Soil ConservationEngineering. Prentice Hall India, New Delhi.
Samra, J.S. and Sharda, V.N. 2002. Hydrologicalsimulation of a conservation bench terrace system ina sub humid climate. Hydrological Sciences -Journal—des Sciences Hydrologiques, 47(4) August2002, pp. 549–561.
Suresh, R. 2009. Soil and Water Conservation Engineering.Standard Publishers Distributors, New Delhi.
Table 8. Comparison of design parameters obtained bydeveloped design procedure and by conventionalmethod for terraces with vertical riser and levelbench
Type of Para- Existing Developed Remarksbench meters method softwareterrace
S, % 12 12 sameW, m 6.0 6.0 sameDc, m 0.360 0.360 sameVI, m 0.720 0.720 sameHI, m 6.000 6.000 same
EW, m3/ha. 450.00 450.00 same% AL 0 0 sameS, % 20 20 same
W, m 4.5 4.5 sameDc, m 0.466 0.466 sameVI, m 0.931 0.931 sameHI, m 4.655 4.655 same
EW, m3/ha. 562.49 562.49 same% AL 3.34 3.34 sameS, % 14 14 same
W, m 6.0 6.0 sameDc, m 0.270 0.270 sameVI, m 0.840 0.840 sameHI, m 6.000 6.000 same
EW, m3/ha. 337.49 337.49 same% AL 0 0 sameS, % 20 20 same
W, m 4.5 4.5 sameDc, m 0.353 0.353 sameVI, m 0.931 0.931 sameHI, m 4.655 4.655 same
EW, m3/ha. 426.57 426.57 same% AL 3.340 3.340 sameS, % 14 14 same
W, m 6.0 6.0 sameDc, m 0.570 0.570 sameVI, m 0.840 0.840 sameHI, m 6.000 6.000 same
EW, m3/ha. 712.50 712.50 same% AL 0 0 sameS, % 24 24 same
W, m 4.5 4.5 sameDc, m 0.675 0.675 sameVI, m 1.125 1.125 sameHI, m 4.688 4.688 same
EW, m3/ha. 809.88 809.88 same% AL 3.340 3.340 same
Terraceswithinclinedriserandlevelbench
Terraceswithverticalriser andlevelbench
Terraceswithverticalriser andoutwardslopingbench
Terraceswithinclinedriserandlevelbench
Terraceswithverticalriser andoutwardslopingbench
Terraceswithverticalriser andoutwardslopingbench
77

168 SACHAN et al. [Journal of Soil & Water Conservation 12(2)
Journal of Soil and Water Conservation 12(2): 168-178, April-June 2013ISSN: 022-457X
NREGA: Science based perspective plan preparationand ex-ante impact assessment – A case study for
Sitapur district of Uttar Pradesh
R.C. SACHAN, K. SRINIVAS, P. PATHAK, A.V.R. KESAVA RAO and S.P. WANI
Received: 24 November 2012; Accepted: 29 March 2013
ABSTRACT India has long experience in implementing employment generation programs. However the programshad little success in generating employment for sustainable development to address the poverty issue.National Rural Employment Guarantee Act (NREGA), with its rights-based framework and demanddriven approach, marks a paradigm shift from the previous wage programs to address causes of povertythrough natural resource management for sustainable development. The Ministry of RuralDevelopment, Government of Uttar Pradesh requested International Crops Research Institute for theSemi-Arid Tropics (ICRISAT) to prepare five-year perspective plan of NREGA for Sitapur district forcreating self sustaining economy to reduce poverty and make visible impact on major problems ateach gram panchayat,. Based on gram panchayat level survey results, secondary data and consultationwith gram panchayat various works were proposed to enhance productivity of natural resourcesand employment. Proposed works include water conservation, tree plantations, drainage and floodprotection, land improvement for eroded lands and rural connectivity. The perspective plan for five-year period would result in 33,334 works for district and an average of 25 works per gram panchayat.Potential employment of 12.92 million person-days would be generated which would benefit 2,58,324 households to employ a person in each household for 100 days.This would result in benefiting49% of total households of the district at an average cost of 495.1 crores per year. A total of 11,048 ha-m additional storage capacity would be created through water conservation which would helpincreasing cropping intensity and productivity, flood protection and rise of water table. The monetaryvalue of the expected benefits of the proposed works would be significant, when implemented.NREGA works would provide fillip to create increased employment opportunities through bettermanagement of natural resources for increased and sustained production which would be multiplierand productivity and employment accelerator process to transform livelihood of rural community.
Key words: poverty, Gram Panchayat, productivity, households, NREGA, employment
International Crops Research Institute for Semi-Arid Tropics (ICRISAT), Patancheru, Andhra Pradesh, India - 502 324,Email: [email protected]
INTRODUCTIONIn agricultural based rural Indian economy there
are sections of rural population which depend onthe earned, unskilled and casual manual labor wages.Inadequate labor demand or unpredictable crisissuch as natural disaster or personal ill- health impacttheir employment opportunity and they arevulnerable to sink into transient poverty to chronicpoverty. Workfare programs had been importantinterventions for many years in developed anddeveloping countries to overcome poverty and
employment. These programs typically providedunskilled manual workers with short-termemployment on public works such as irrigationinfrastructure, afforestation, soil conservation androad construction. The rationale for workfareprograms was based on basic considerations ofincome transfers to the poor household, enableconsumption and prevent poverty from worseningduring slack agricultural seasons or lean periods.
The Government of India recognized early,during development planning, the need to evolve
78

April-June 2013] NREGA: SCIENCE BASED PERSPECTIVE PLAN 169
a mechanism to supplement existing livelihoodsources in rural areas. The country has longexperience in implementing workfare programs likeRural Manpower (1960-61), Crash Scheme for Ruralemployment (1971-72), Pilot Intensive RuralEmployment Program (1972), Small FarmersDevelopment Agency (1971-72), Marginal Farmersand Agricultural Labor Scheme (1971-72) and SmallFarmers, Marginal Farmers and Agricultural LaborsProject (1971-72). After 1980 there were manyemployment generation programs includingNational Food for Work Program in 2005 launchedin rural India. Major Weaknesses of many of thepast employment generation programs have been theinadequate emphasis on creating communitycapabilities and durable assets that enhance thelivelihood security and augment the naturalresources.
National Rural Employment Guarantee Act
The National Rural Employment Guarantee Act(NREGA-2005) was brought into force by thegovernment of India in February 2006. The NREGA,now renamed as Mahatma Gandhi National RuralEmployment Guarantee Act, had come at a crucialtime, when rural economy in the country is facingerosion of livelihoods due to rural unemployment.NREGA aims at enhancing the livelihood securityof people in rural areas by guaranteeing hundreddays of wage-employment in a financial year to arural household whose members volunteer to dounskilled manual work. The NREGA faces a two-pronged challenge: addressing immediateunemployment crisis in rural areas and a longer-termobjective of contributing to village economy in asustained manner.
NREGA puts major emphasis on generation andenhancement of ecosystems services throughenhancement of quantity and quality of naturalresources such as water and soil thus helping inincreasing agricultural productivity and cropdiversification. The focus was also given forafforestation and rural connectivity for access tomarkets and various services to enhance systemsproductivity and income levels of the community.Past experiences suggest that to mitigate arrest orreverse acute rural distress there has to be greateremphasis on systematic and comprehensive ruralarea development focusing on the regeneration ofthe agro-ecological resources like land, water and bio
resources for sustainable livelihoods.Instruments for providing employment under
NREGA are permissible works which are mentionedin NREGA guidelines (GOI, 2008). These worksinclude water conservation, drought proofingincluding plantation and horticulture, irrigationworks, development of land owned by schedule casteand tribes, land reforms and Indira Awas Yojanabeneficiaries, flood control and protection works andrural connectivity.
The Act attempts to unlock the potential of therural poor to contribute to the development andprotection of their environment through creation ofproductive assets in the villages. Out of permissibleworks under the NREGA guidelines, most focus onwater and soil conservations and poverty issues suchas drought, deforestation etc . NREGA marks aparadigm shift from the previous wage programswith its rights-based framework and demand drivenapproach. Outcomes include strengthening thegrassroots processes of democracy by giving apivotal role to the panchayat raj institutions inplanning, monitoring and implementation, infusingtransparency and accountability in governance.
Effective implementation of the Act requiresplanning labor-intensive works for the needy poorin a slack agricultural season or lean periods. Theseworks must build the appropriate, sustainable anddurable assets and manage them to generate benefitsand economic growth to the poor. Thus NREGAshould be seen more as a livelihood-generatingprogram than a wage-earning scheme. It also offersa unique opportunity to reform rural development.
The Ministry of Rural Development, Governmentfor Uttar Pradesh, requested International CropsResearch Institute for the Semi-Arid Tropics(ICRISAT) to prepare five-year NREGA perspectiveplan of Sitapur district in the state. The districtperspective plan was intended to facilitate advanceplanning and provide a development perspectivefor the district. The main objectives of the districtperspective plan were:• To identify the types of works that should be
promoted to develop , manage and strengthenlivelihood resource base of gram panchayat.
• To ensure that the district is prepared well inadvance to offer employment on demand bydeveloping annual plan consisting of shelvesof projects.
79

170 SACHAN et al. [Journal of Soil & Water Conservation 12(2)
District profile
Location and demography
The Sitapur district of Uttar Pradesh is locatedbetween 270 05’ and 27 054’ N latitude and 80018Eand 810 25’ E longitude and has geographical area of5743 km2. The district topography is a vast plainsloping mildly from an elevation of 150 m abovemean sea level (msl) in the northwest to 100 m abovemsl in the southeast. Gomti and Ghagra are majorrivers of the district. The administrative set up ofthe district consists of 6 tehsils (revenue divisions)and 19 community development blocks (kshetra)panchayats and 1329 gram panchayats.
Total population of the district is 36, 19,661persons (Census of India, 2001), which constitutes1.9 percent of the state. The sex ratio of the district isonly 865 female per 1000 male, which is lower thanthe state (898). The population density is 630 in 2001(689 for the state), which is twice that of the countryaverage. Literacy rate is 35.4% in 2001. Presently, thedistrict has negligible industrial activities except forfive sugar mills, some flour and rice mills and cottageindustries making cotton and woolen mats.
Agro-climatic features of Sitapur district
Soils
The district is typically hot dry sub humid withmostly loam alluvium-derived soils. Inceptisolsdominate the western and central parts of the districtand the eastern part is dominated by Entisols. Thereis a small patch of Mollisols in the easternmostregion of the district (figure 1).
Figure 2 shows the Agro-Ecological Sub Regions(AESR) of the district according to classificationsmade by National Bureau of Soil Survey and LandUse Planning (NBSS&LUP, 1996). Major portion ofthe district falls under the AESR 9.2. This AESR isdefined as ‘Rohilkhand, Avadh and south BiharPlains, hot dry sub humid ESR with deep loamyalluvium-derived soils, medium to high availablewater capacity (AWC) and length of growing period(LGP) 150-180 days’. Eastern parts of the district fallunder the AESR 13.1 and are described as “NorthBihar and Avadh Plains, hot dry to moist sub humidESR with deep, loamy alluvium-derived soils, lowto medium AWHC and LGP 180-210 days”(Velayutham, et al., 1999).
Figure 1. Soils of Sitapur district
Figure 2. Ecological sub-regions of Sitapur district
Climate
Normal annual rainfall of the district is 978 mm(Table 1) received in about 50 rainy days. About 87%of the annual rainfall is received during thesouthwest monsoon period of June to September.July and August are the wettest months, receivingmore than 65% of the monsoon rainfall. In the post-monsoon season, winter and summer, rainfall isgenerally low and contributes about 15% of theannual rainfall. April to June is the summer period(max average temperature 40°C). Winter is duringDecember to February (min average temperature10°C).
Weekly rainfall distribution at Biswan (Figure 3)shows that the rainfall is well distributed during thesouthwest monsoon season. The total rainfallduring the season is about 1000 mm. Averageweekly rainfall begins to reach above 20 mm from
80

April-June 2013] NREGA: SCIENCE BASED PERSPECTIVE PLAN 171
June 20th onwards and continues up to October 20.The probability analysis indicates that assuredrainfall begins only by first week of July and endsby the 3rd week of September. Probability ofoccurrence of dry spells during the season is low.Water harvesting potential is high during the periodfrom middle of July to the middle of August. Otherlocations in the district show similar rainfall distribution.
Climatic water balance of Sitapur is presented inthe figure 4. At Sitapur, the annual rainfall is 975 mmof which about 840 mm is received in the monsoonperiod. Annual potential evapotranspiration (PET)is about 1400 mm. During November to February,the weekly PET is generally below 20 mm. Duringsummer, the weekly PET may total up to 40 mm andin the monsoon season the weekly PET is in between30-40 mm.
The annual actual evapotranspiration is about 750mm, indicating good moisture availability to crops.Rainfall begins to exceed the PET from the middleof June and the excess rainfall starts to recharge thesoil and by the end of July, soil is fully rechargedand water surplus begins. The total water surplus isabout 230 mm and the annual water deficit is about655 mm. Though the rains cease by the first week ofNovember, moisture stored in the soil meets thepartial water requirements of the crops till the middleof December.
Crop productivity and irrigation sources
The district is endowed with rich and fertile soiland plain lands and about 77% of the land is undercultivation. Total agricultural land of the district is4, 33,000 ha and about 22,200 ha (3.9%) is wasteland.Seasonal floods due to major rivers, minor rivuletsand plain lands affect about 21% of geographicalarea of the district. Approximately 91.4% of landholdings belong to small and marginal farmers (<2ha) and such land holdings cover 66.4% of totalcultivated lands.
Predominant crops of the district are paddy,wheat, sugarcane, maize, pulses and oilseeds.Sugarcane is major cash crop in the district. Thoughthe district is endowed with abundant fertile andproductive soil and sufficient rainfall, theproductivity of most crops are far below theirpotential yields. The average yields of wheat, paddysugarcane are 2450, 1720 and 5300 kg ha-1respectively(Sankhikiya Patrika, 2003). Cropping intensity in thedistrict is approximately 150%. About 69% ofcultivated area is irrigated in which major source ofirrigation is groundwater (NABARD, 2008).Irrigation is required after January for the Rabi cropsand also for cultivation of summer crops. There aresome 89 reservoirs in the district which are spreadover 5 ha each.
Opportunities to enhance livelihoods in the district
There are plenty of opportunities for creatinglivelihood and increasing income. Water balanceresults show that there is surplus water available forwater harvesting which can be stored byconstruction of new ponds and de-silting of existingponds. Low- land rice cultivation is feasible wherethere is flooding for longer time. The additionalwater can be used for intensification of croppingsystems. By using improved technologies the rice-wheat cropping system yields can be raised up toFigure 4. Climatic normal water balance of Sitapur
Figure 3. Rainfall characteristics of Biswan, Sitapur district(IMD, 1995)
Table 1. Rainfall (mm) characteristics of the Sitapur district
Period Biswan Misrikh Sidhauli Sitapur
Annual 1062 989 881 978Southwest monsoon 920 860 761 839(June-Sept)Post-monsoon 56 49 51 59(Oct-Nov)Winter (Dec-Feb) 47 47 42 44Summer (March-May) 39 33 27 36
81

172 SACHAN et al. [Journal of Soil & Water Conservation 12(2)
18 t ha -1 year -1 (Aggarwal, , et al. 2000, Aggarwal,et al., 2000a). Rice-chickpea-mint and pigeonpea-wheat-mint could be profitable compared to rice-wheat system in the central Indo- Gangetic Plains(Singh et al, 2003). Poplar plantation in the fieldand lemon grass in the inter space can be taken upfor increasing income (Jain and Singh, 2000). Practicesuch as zero tillage for rice-wheat cropping system,sugarcane intercropped with onion/cucurbits/marigold, legume based cropping system, seedproduction seed bank for chickpea, pigeonpea andgroundnut can enhance the income. Cultivation ofhorticultural crops, preparation of vermicompostingand other income generating activities wouldfurther enhance livelihood opportunities(Anonymous, 2004).
MATERIALS AND METHODS
Primary information through structuredquestionnaire on socio-economic and biophysicalparameters was collected from each gram panchayat.The data collected include demography, land use,area under different crops and their productivity,water sources, flood prone areas, degraded anderosion susceptible lands, de-silting needs, roadconnectivity, access within village, land owned bySC/ST, land reforms and Indira Awas Yojanabeneficiaries.
Secondary information on soils, climate, on- goingdevelopment activities, schedule rate of works andwages in the district were collected from differentsources. Remote sensing data and satellite imagerieswere used for demarcating degraded lands, wetlands, forest cover and other physical infrastructuressuch as roads, water bodies and drainage networksin the district. Historical weather and soils data fromthe district were used to estimate the occurrence ofdrought using water balance (ICRISAT, 2008).
Taking into consideration the resources, needs,feasibility and NREGA guidelines, various workswere proposed. The work proposals were discussedin the gram sabha and which made therecommendation for works to be taken up in the grampanchayat. The recommended works in grampanchayats were assembled at communitydevelopment block (kshetra) panchayat wise andfinally for the district. The recommended workswere discussed by kshetra panchayat and zila (district)panchayat and their final suggestions, if any, wereincorporated in list of proposed works. The Figure
5 shows the flow chart of the process of preparationof the perspective plan of the Sitapur district.
Figure 5. Process flow chart for preparation of NREGperspective plan.
Various works were categorized into permissibleworks under NREGA. The activities wereprioritized for five-year plan period. Works underwater conservation were accorded highest priorityfollowed by soil conservation and landimprovement, irrigation, forestry and plantation,flood protection, drainage, access and drainagewithin village and rural connectivity. Details of eachwork by their type, category, description, year ofbeginning, labor, material and total costs, persondays generated for five-year plan period providedfor each gram panchayat. The types of works proposedworks were as follows.• De-silting of existing ponds for increasing
storage capacity ,flood protection andgroundwater recharge
• Construction of new ponds for water harvesting,flood protection and groundwater recharge
• Construction of bathing ghats on existing pondand rejuvenation of ghats
• Cleaning and de-silting of drains in the villagefor sanitation
• Construction of drains in the village forsanitation
• De-silting and shaping of burrow pits on bothside of roads for drainage and water conservation
• Construction of drains for waterlogged areas• De-silting of canal and irrigation channels• Field bunding of eroded land and flood - prone
areas
82

April-June 2013] NREGA: SCIENCE BASED PERSPECTIVE PLAN 173
• Leveling of degraded and eroded lands• Plantation on community lands ,avenue roads ,
school ground and private lands and field bundsof rural poor
• Connectivity to main road• Culverts and causeway culverts on drains and roads• Link road between villages• Internal brick road for access in the village
Table 2 provides the details of typical works forChandra gram panchayat in Pisawan communityblock of the district. Original tables were preparedin Hindi (local language) of the district for easyunderstanding by the village community. Costdetails were estimated by taking into consideration
the estimate of works quantity and their schedulework rates, schedule wage rates (Rs100 day –1),number of household in the village and costescalation (10% year-1) and 15% maintenance cost ofsum of labor and material cost for the particularyear. The total cost of the work was estimated assum of labour, material and maintenance costs.
RESULTS AND DISCUSSION
A total of 33,334 works were proposed for thedistrict. On an average 25 works per gram panchayatfor the five -year period (Table 3) were created.Maximum works were proposed for Behta block(3312) and minimum for Misrikh (1051). These
Work type Work Work Starting Estimated Estimated Estimated stimateddescription category year total cost labour cost material cost person
(Rs lakh) (Rs lakh) (Rs lakh) days
De-silting of De-silting of Water 1 17.07 14.85 0.00 14846 ponds Haria talab conservation
De-silting of drains From Chandra Drainage 1 0.31 0.27 0.00 267on both side of to Pisawanroads approach road
De-silting of canal Grant culvert to Irrigation 1 0.93 0.81 0.00 809next culvert
De-silting of From Ramprasad Irrigation 1 0.16 0.14 0.00 136irrigation to Gaya Prasadchannels house
Plantation on Near gram Forestry and 1 0.93 0.77 0.04 770common lands panchayat plantation
bhawan
Plantation on On main road Forestry and 1 0.41 0.34 0.02 340approach roads of Chandra plantation
Land leveling on On Gaya Prasad Soil conservatori 1 0.04 0.01 0.03 5private lands field and Land
improvement
Earth work for road On east side of Rural 1 2.10 1.83 0.00 1830Chandra village connectivity
Culvert On West side of Rural 1 1.24 0.45 0.63 450the village connectivityChandra
Inter village From hamlet to Rural 1 53.25 19.00 27.30 19000connectivity Chandra connectivity
Brick road in the From Rajendra to Access & drainage 1 3.11 1.13 1.58 1125village Virendra house with in the village
Repair of Brick road From Vinod house Access & drainage 1 0.21 0.08 0.11 75in the village to open well with in the village
Bathing ghat Kanua talab Water 1 1.46 0.67 0.60 667construction Purva ghat conservation on the pond
Table 2. An example of works proposed, estimated costs, person days generated under NREGA in Chandra village in Pisawancommunity development block of the Sitapur district, UP
contd...
83

174 SACHAN et al. [Journal of Soil & Water Conservation 12(2)
works would generate 129,161,978 person-days ofemployment for 5–year period, which would benefit49% of the total households in the district. The totalcost of the proposed NREGA works for the 5–yearperiod in the district was Rs 2475.5 crores andaveraged Rs 37.3 lakhs for a gram panchayat peryear.
About 73% of proposed works and 59% of totalcost relate to natural resource management (Table4). About 63% employment generated through waterconservation activities. Due to heavy populationpressure on land, limited common lands areavailable for construction of new ponds andreservoirs in the district and hence mostrecommended water conservation works were
Rejuvenation and Jamuna talab Water 1 5.83 2.67 2.40 2667ghat construction conservation
De-silting of ponds Hansi Talab Purva Water conservation 2 23.48 20.41 0.00 18558
De-silting of drains From Purva to Drainage 2 1.13 0.98 0.00 890 on both side of roads Chandra
De-silting of From west side Irrigation 2 0.22 0.19 0.00 170 irrigation channels to approach road
Plantation on Near Durga Temple Forestry and 2 1.02 0.85 0.04 770common lands plantation
Land leveling on On Ganga Prasad Soil conservaton 2 0.04 0.01 0.03 5private lands field and Land
improvement
Culvert Near Chandra Rural 2 1.37 0.50 0.69 450village connectivity
Repair of Brick road From Ramprasad Access & drainage 2 0.46 0.17 0.23 150 in the village house to Ganga with in the village
Prasad
De-silting of ponds Guda pond Water conservation 3 21.69 18.86 0.00 15588
De-silting of From East side to Irrigation 3 0.09 0.08 0.00 68irrigation channels Rajendra field
Plantation on On Primary Forestry and 3 0.56 0.47 0.02 385common lands School land plantation
Land leveling on On Chote lal field Soil conservation 3 0.04 0.01 0.03 5private lands and Land
improvement
De-silting of ponds Kapat Talab of Purva Water conservation 3 15.49 13.47 0.00 11135
Land leveling on On Hemraj field Soil conservation 3 0.04 0.01 0.03 5private lands and Land
improvement
De-silting of ponds Samera talab Water conservation 4 34.09 29.64 0.00 22269
De-silting of ponds Jangi talab Water conservation 4 23.86 20.75 0.00 15588
Total 210.61 149.36 33.78 129022
Work type Work Work Starting Estimated Estimated Estimated stimateddescription category year total cost labour cost material cost person
(Rs lakh) (Rs lakh) (Rs lakh) days
related to de-silting of existing ponds. About 41%of total cost of all NREGA works was for ruralconnectivity. Similarly, 81% of the total materialcost of all proposed works was towards theconnectivity in Sitapur district. Historicallydominant paradigm of development worksexecuted by government agencies for ruralemployment programs have been related to roadconnectivity, access and drainage works withinvillage and hence the village community preferredsuch type of works. The rural community needs tobe oriented towards common land re-generation,and development of natural resources which wouldlead to increased productivity and creation oflivelihood opportunity.
84

April-June 2013] NREGA: SCIENCE BASED PERSPECTIVE PLAN 175
S.No. Community Development Estimated Estimated Percent Estimated total No. ofBlock Name person days household benefited cos.( Rs , lakhs ) projects
1. Pisawan 64,22,989 42 11,375.56 1,2792. Biswan 95,42,614 52 18,776.27 2,5943. Maholi 40,58,346 36 7,026.02 1,3164. Khairabad 64,74,699 49 13,900.62 1,7425. Parsendi 70,75,804 49 14,776.54 2,1686. Mishrikh 56,39,058 43 10,889.03 1,0517. Hargaon 55,07,708 39 10,269.10 1,4278. Sidhauli 75,66,943 54 12,686.67 1,7519. Machrehta 54,92,281 41 9,834.77 1,52110. Mahmudabad 39,45,299 35 6,386.61 1,07311. Gondlamau 73,18,101 49 14,134.37 1,96812. Laharpur 53,65,620 47 9,730.30 1,69513. Reusa 92,94,810 51 18,796.58 2,70914. Sakran 61,63,272 44 12,893.18 1,61415. Rampur Mathura 62,56,375 44 12,088.35 1,15816. Pahla 92,19,153 71 16,460.41 1,83117. Aliya 66,73,343 52 12,671.60 1,87118. Kasmanda 73,50,949 53 13,097.51 1,25419. Behta 97,94,614 67 21,762.68 3,312
District Total 129,16,1978 49 (average) 247,556.20 33,334
Table 3. Estimated person days, percent household benefited, total cost and no of projects for various community developmentblocks in the Sitapur district.
Impact assessment
Figure 6 provides the Google imageries ofvillage Khagasia Mau in Aliya block on two dates: March 3, 2006 ( before implementation of NREGAworks ) and June 3 ,2011( after implementation ofNREGA works ) for better appreciation of theimpact, The imagery taken on June 3, 2011 showsmore number of ponds compared to March 2006.
Table 5 provides quantitative estimates of
outcomes of various works. De-silting of theexisting ponds and construction of new pondswould result in additional storage capacity of 11,048ha-m at the end of plan period. It is expected thatincreased water availability would result inincreased irrigated area and increasing croppingintensity by 19%, additional yields of paddy by25,072 metric tons and wheat by 39,327 metric tonsover existing production. Total cost incurred on
Table 4. Estimated Number of Projects, Person days , labour, material and Total costs for various work categories underNREGA in Sitapur district
Work category No. of Estimated Estimated labour Estimated Estimated total costprojects person days cost, Rs. Lakhs Material cost, including maintenance,
(% of total) (% of total) (% of total) Rs. Lakhs Rs. Lakhs (% of total) (% of total)
Water conservation 4,718 (14) 812,58,582 (62.9) 97,105 (62.9) 3,047 (5.0) 115,175 (46.5)Land development 1,720 (5) 1,36,733 (0.1) 163 (0.1) 184 (0.3) 398 (0.2)Irrigation 1,451 (4) 16,12,279 (1.2) 1,787 (1.2) nil 2,056 (0.8)Forestry and plantation 4,555 (14) 25,08,633 (1.9) 3,042 (2.0) 154 (0.3) 3,676 (1.5)Flood protection 428 (1) 10,83,651 (0.8) 1,232 (0.8) nil 1,417 (0.6)Drainage 4,437(13) 45,63,893 (3.5) 5,147 (3.3) nil 5,919 (2.4)Access & drainage 7,181 (22) 49,51,313 (3.8) 6,043 (3.9) 8,316 (13.7) 16,513 (6.7)within the villageRural connectivity 8,844 (27) 330,46,893( 25.9) 39,967 (25.9) 49,078 (80.7) 1,02,402 (41.4)District total 33,334 1291,61,978 154,486 60,780 2,47,556
85

176 SACHAN et al. [Journal of Soil & Water Conservation 12(2)
works related to water conservation during fiveyears was estimated as Rs 1151.75 crores.Considering the minimum support price (MSP) forpaddy and wheat in 2009 and 5% increase in MSPand yields of paddy and wheat per year, it isestimated that additional monetary return over 10-year period totals Rs 1102 crores. The monitorybenefits are in addition to employment generation,flood protection and arrest of ground waterdepletion. Land degradation and nutrient losseswould also reduce with reduction in peak runoffrates.
Increasing storage capacity in ponds would alsoprovide livelihood opportunities through seasonalfish cultivation. Research results elsewhere suggest
that de-silted soil from existing ponds, when re-deposited on the agricultural fields, would provide,on an average, 730 mg nitrogen, 357 mg phosphorusand 11.64 gms organic carbon per kg of soil (PadmajaKV, et al., 2003). Approximately 176, 970 thousandmetric tons of soil excavated from existing pondswould provide 111,703 thousand metric tones of N,about 5,724 thousand metric tons of P and 20, 600thousand metric tons of organic C. Monetary valuefor recovered N and P amounts to Rs 12.3 croresand Rs 278 crores respectively at subsidized cost.Higher amount of organic carbon in soil would alsohelp in increased mineralization of nutrients andtheir availability for improved crop production andincrease income.
Table 5. Expected outcomes of various works in Sitapur district
Category and NREGA works Estimated Work Quantity
Water conservationIncreased runoff storage capacity through de -silting of existing ponds 10,687.5 ha mCreation of new storage facility through digging new ponds 1,110 ha-m
DrainageDe-silting of drains in the field 611.5 kmConstruction of new drains in the field 936.5 kmDe-silting/reshaping of drainage channels on both side of access road 2,318 kmConstruction of new drainage channels for canal seepage 364 kmSoil conservation and land improvementField bunding on rural Poor’s field 238 haField leveling on rural Poor’s fields 450 ha
Forestry and tree plantationTree plantation on community lands 1,461 haTree plantation on both sides of roads 3,106 kmTree plantation on rural poor’ s field bunds 470 ha
IrrigationCanal de-silting 478 kmIrrigation channel de-silting 1,946 km
Rural connectivityEarth work for road 1,34,172 m3
Connectivity to main road 382 kmCulverts 1,800 noCauseway culvert 213 noConnectivity within village in gram panchayats 2,400 kmRoad connectivity to the villages of other gram panchayats 2,228 kmConstruction and repair of brick road within villages 234.9 K m
Access and drainage within villagesDrain de-silting and drain repair in the village 248.3 km
Flood protectionConstruction of bunds 428 kmTotal household likely to benefit each year (100 days) under non-NREG work 52,962 householdsTotal employment created under NREGA work, for 5 years 1291,61,978 person daysTotal household likely to benefit each year (100 days) under NREG works 2,58,324 householdsTotal cost for NREGA works Rs 2,475.56 croresCost of NREGA works/village 1.863 crores
86
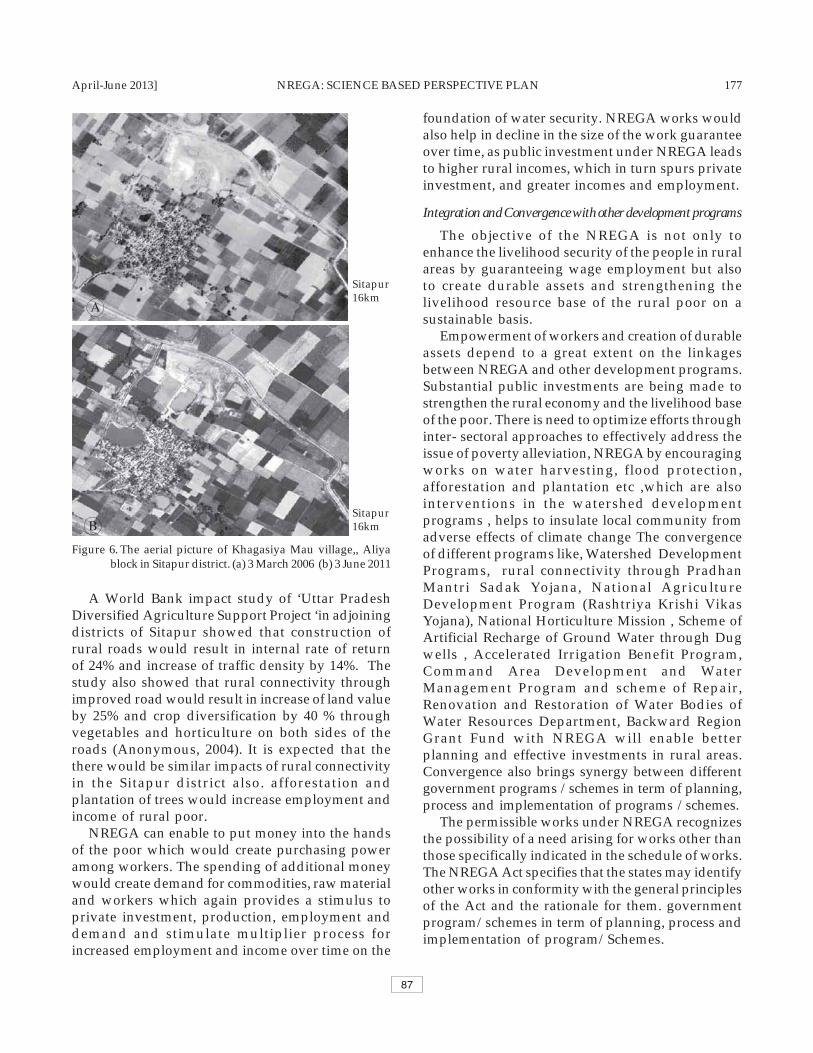
April-June 2013] NREGA: SCIENCE BASED PERSPECTIVE PLAN 177
A World Bank impact study of ‘Uttar PradeshDiversified Agriculture Support Project ‘in adjoiningdistricts of Sitapur showed that construction ofrural roads would result in internal rate of returnof 24% and increase of traffic density by 14%. Thestudy also showed that rural connectivity throughimproved road would result in increase of land valueby 25% and crop diversification by 40 % throughvegetables and horticulture on both sides of theroads (Anonymous, 2004). It is expected that thethere would be similar impacts of rural connectivityin the Sitapur district also. afforestation andplantation of trees would increase employment andincome of rural poor.
NREGA can enable to put money into the handsof the poor which would create purchasing poweramong workers. The spending of additional moneywould create demand for commodities, raw materialand workers which again provides a stimulus toprivate investment, production, employment anddemand and stimulate multiplier process forincreased employment and income over time on the
foundation of water security. NREGA works wouldalso help in decline in the size of the work guaranteeover time, as public investment under NREGA leadsto higher rural incomes, which in turn spurs privateinvestment, and greater incomes and employment.
Integration and Convergence with other development programs
The objective of the NREGA is not only toenhance the livelihood security of the people in ruralareas by guaranteeing wage employment but alsoto create durable assets and strengthening thelivelihood resource base of the rural poor on asustainable basis.
Empowerment of workers and creation of durableassets depend to a great extent on the linkagesbetween NREGA and other development programs.Substantial public investments are being made tostrengthen the rural economy and the livelihood baseof the poor. There is need to optimize efforts throughinter- sectoral approaches to effectively address theissue of poverty alleviation, NREGA by encouragingworks on water harvesting, flood protection,afforestation and plantation etc ,which are alsointerventions in the watershed developmentprograms , helps to insulate local community fromadverse effects of climate change The convergenceof different programs like, Watershed DevelopmentPrograms, rural connectivity through PradhanMantri Sadak Yojana, National AgricultureDevelopment Program (Rashtriya Krishi VikasYojana), National Horticulture Mission , Scheme ofArtificial Recharge of Ground Water through Dugwells , Accelerated Irrigation Benefit Program,Command Area Development and WaterManagement Program and scheme of Repair,Renovation and Restoration of Water Bodies ofWater Resources Department, Backward RegionGrant Fund with NREGA will enable betterplanning and effective investments in rural areas.Convergence also brings synergy between differentgovernment programs /schemes in term of planning,process and implementation of programs /schemes.
The permissible works under NREGA recognizesthe possibility of a need arising for works other thanthose specifically indicated in the schedule of works.The NREGA Act specifies that the states may identifyother works in conformity with the general principlesof the Act and the rationale for them. governmentprogram/schemes in term of planning, process andimplementation of program/Schemes.
Sitapur16km
Sitapur16km
Α
Β
Figure 6. The aerial picture of Khagasiya Mau village,, Aliyablock in Sitapur district. (a) 3 March 2006 (b) 3 June 2011
87

178 SACHAN et al. [Journal of Soil & Water Conservation 12(2)
Convergence through NREGA will have theadvantage of: ?a wide range of works: almost allworks required for watershed development in rain-fed area, command area development in irrigatedareas and fair weather road for ruralconnectivity,???? untied funds for local areaplanning, the provision of decentralized planningwhich enables comprehensive need assessment atgrassroots and greater ownership of projects, legalsafeguard of the Act ,facilitating sustainabledevelopment through natural resourcemanagement???? effective targeting and developmentof human capital and physical capital throughinstitutional linkages. Convergence of the NREGAfunds with funds from other sources can help increation of durable assets. Funds available withPanchayat Raj institutions from other sources forinstance, can also be dovetailed with NREGA fundsfor the construction of durable community assetsunder the permissible works.
CONCLUSION
Earlier employment programs followed focusedon quantitative approach which resulted inunproductive assets leaving people eitherunemployed or grossly underemployed. NREGA,with a focus on natural resource conservation andcreation of productive assets, attempts to be relevantto local needs. The NREGA perspective plan forSitapur district has shown that adequate employmentcan be created at each gram panchayat through creationof productive assets and development of naturalresources for sustainable development.
The community development block and districtperspective plans are result of collection andconsolidation of gram panchayat level planning andneeds to be done in planned manner at a landscapelevel so that discrepancies in gram panchayat level planningis taken care and concerns of inter- gram panchayatare addressed and contradiction are avoided.
Appropriate technology solutions have beenworked out by various national and internationalresearch institutions in India to provide a rationaldatabase for agricultural and rural development whichcan be used for preparing NREGA plans and itstechnical norms and designs so that the choice ofworks is guided not just by the expediency ofimmediate employment provisioning but also by thelogic of sustainable natural resource developmentgiving primacy to water conservation.
REFERENCES
Aggarwal PK, Bandyopadhyay SK, Pathak H, Kalra N,Chander S and Sujith Kumar S. (2000). Analyses of yieldtrends of the rice-wheat system in north-western India.Outlook on Agric., 29 (4):259-268.
Aggarwal PK, Talukdar KK and Mall RK.9 2000a). PotentialYields of Rice-Wheat System in the Indo-Gangetic Plainsof India. Rice-Wheat Consortium Paper Series 10. NewDelhi, India: Rice-Wheat Consortium for the Indo-Gangetic Plains. pp 16.
Anonymous (2004). Implementation Completion andResults Report no 29529, Vol 1, India DiversifiedAgriculture Support Project. Agriculture and RuralDevelopment Unit. South Asia Region. The World Bank,New Delhi, India. 47 pp.
Census of India. 2001. Office of the Registrar Generaland Census Commissioner, India, (http://www.censusindia.gov.in/Dist_File/datasheet-0924.pdf
GOI (Government of India). 2008 .National RuralEmployment Guarantee Act, 2005: OperationalGuidelines (3rd edition), Ministry of Rural development,Government of India. (http://www.nrega.nic.in )
ICRISAT (International Crops Research Institute for SemiArid tropics). 2008. Five year Perspective Plan for Sitapurdistrict under National Rural Guaranteed Program.2008. International Crops Research Institute for the SemiArid Tropics. 2375 pp.
IMD (India Meteorological Department). 1995. Weekly rainfallprobability for selected stations of India Vol 2.
Jain, SK and Singh P. 2000.Economic Analysis of IndustrialAgroforestry: poplar (populus deltoids) in UttarPradesh (India). Agroforestry Systems. Volume 49 (3),Number 3. August 2000. 255-273.
NABARD (National Bank for Agriculture and RuralDevelopment). 2008. Potential linked credit plan,Sitapur, 2008-09. NABARD.
Padmja KV, Wani SP, Agrawal Lav and Sahrawat KL. 2003.Economic assessment of desilted sediment in terms ofplant nutrients equivalent: A case study in Medakdistrict, Andhra Pradesh. Global Theme 3. Water, Soiland Agro diversity Management for EcosystemResilience. Report No 4. Patancheru, Andhra Pradesh502324. 24 pp.
Sankhiya Patrika, 2003. District Sitapur, Economics andStatistics officer, Sitapur, Division of Economics andStatistics, State Planning Institute, Uttar Pradesh.
Singh AK, Srivastava RK, Kalra A., Bansal RP, Tomar VS,Bahl JR and Kumar S. 2003. New practices in thecultivation of the mint, menthe arvensis in the indo-gangetic plains. Experimental Agriculture 39: 199-207
Uttar Pradesh Diversified Agriculture Support Project(http://www.updasp.in); The World Bank, New Delhi,India. 30 p.
Velayuthan M, Mandal DK, Mandal C., and Sehgal J, 1999.Agroecological sub- regions of India for planning anddevelopment. Publication No 35.NBSSLUP, Nagpur,Maharasrta, India. 372 pp.
88