APRIL-JUNE-2020.pdf - Orissa Journal Of Commerce
184
-
Upload
khangminh22 -
Category
Documents
-
view
0 -
download
0
Transcript of APRIL-JUNE-2020.pdf - Orissa Journal Of Commerce


Orissa Commerce AssociationJournal’s website: www.ojcoca.org
E-mail id: [email protected]
A Publication of
ISSN-0974-8482
ORISSA JOURNAL OF COMMERCEU.G.C. CARE Listed, Group- I, A Peer Reviewed and Referred Journal
VOLUME - XXXXI April-June 2020 ISSUE No. - II
The

ORISSA COMMERCE ASSOCIATION
President : Prof. Sasmita Rani Samanta, KIIT University,Bhubaneswar
Vice-President : Prof. Kishore Chandra Raut, Former Professor,Berhampur University, Berhampur
Gen. Secretary : Major Dr. S. A. Taher, Principal, VyasanagarAutonomous College, Jajpur
Joint Gen. Secretary : Dr. Arta Bandhu Jena, F. M. University, BalasoreTreasurer : Dr. Bhagabat Behera, Ravenshaw University, CuttackManaging Editor : Prof. Malay Kumar Mohanty, Former President, OCA(OJC and OCA Dean, Com and Manageement Sambalpur UniversityNews Letter) Registrar and Ravenshaw University, CuttackConference Secretary : Mr. Narendra Kumar Panda, L. N. College, JharsugudaExecutive Members :Bhubaneswar : Dr. Sabat kumar Digal, Ramadevi Women’s
University, BhubaneswarCuttack, Jagatsinghpur : Dr. Tushar Kanta Pany, Ravenshaw University,
CuttackPuri, Khordha, Nayagarh : Dr. (Mrs.) Elina Kanungo, SCS College, PuriGanjam, Gajapati Sri Sakti Ranjan Dash, Berhampur University,
BerhampurKoraput, Rayagada, : Dr. Ranjan Kumar Swain, Malkangiri College,Malkangiri, Nabarangapur MalkangiriKalahandi, Nuapada, : Dr. Kishore Ch. Sahu, Dungurupalli College, SonepurBalangir, Subarnapur,Sambalpur, Bargarh, : Dr. Biswa Mohan Jena, NSB College, SambalpurDeogarhSundergarh, Jharsuguda : Sri. Samir Ranjan Nayak, Brajaraj Nagar college,
BrajanagarKendujhar, Mayurbhanj : Dr. Smruti Ranjan Das, Faculty of Mgt., North Orissa
University, BaripadaAngul, Dhenkanal, : Mr. Rajanikant Kuntia, Dhenkanal AutonomousBoudh, Kandhamal College, DhenkanalBalasore, Bhadrak : Dr. Durga Madhab Mahapatra, Fakir Mohan
Autonomous College, BalasoreJajpur, Kendrapara : Mr. Sanjib Kumar Das, Pattamundai CollegeEx-Officio Executive All Past PresidentsMembers
EXECUTIVE COMMITTEE-2020-21

Contents
1. Predictors of Success for a Small Family based Real Estate Developer: AnInvestigation in IndiaHarish Kumar Singla & Pradeepta Kumar Samanta
2. Performance of the Indian Tourism and Hospitality Stocks during the 2019-nCoV Outbreak - An Event Study using Stocks Listed on the NSEDharen Kumar Pandey & Vineeta Kumari
3. An Empirical Study on Investment Strategies and Behavioral Biases ofIndividual Investors in Goa Juao Costa & Ancy Gonsalves
4. Insolvency and Bankruptcy Code 2016: A Study of Large Stressed AccountManindra N. Nayak
5. Corporate Environment Responsibility (CER)of the Paradip Port Trust (PPT)with special reference to Air and WaterK.P. Rao, Srinivas Subbarao Pasumarti & Kamala Kanta Dash
6. Celebrity Endorsement and Overexposure: A Case Study of “Brand Virat”Kishore Bhattacharjee & Shiv Shankar Prasad
7. Is Homogeneity a Hurdle for Introducing Tea Futures in India?Rajat Bhattacharjee & Santosh Kumar Mahapatra
8. Relationship Between Demographic Variables and Awareness on CybersecurityThreats: An Empirical AnalysisLeena B. Dam & Kalyani Deshpande
9. An Analysis of Strategic Port Reform: the way Forword to Economic ProsperityAlaka Panda, Kshiti Bhusan Das & Rabindra Kumar Swain
ORISSA JOURNAL OF COMMERCEU.G.C. CARE Listed Group-I, A Peer Reviewed and Referred Journal
ISSN-0974-8482

10. A Study of Economic Impact of COVID-19 Pandemic on the Tea Growers ofAssamUddipana Gogoi & Rama Chandra Parida
11. Qualitative Study of Employee Perception on Retention Strategies: A Caseof Bule Hora University, EthiopiaDawit Udessa & Kishor Chandra Meher
12. Leadership role and its effectiveness for exploring benefits of implementingHuman Resource Development programsG. P. Mishra, J. K. Chandel & K. L. Mishra
EDITORIALFirst of all, l express my heartfelt condolence for the departed souls owing
to CORONA virus and I pray to Lord Jagannath to give us enough strength tofight the COVID-19 menace. COVID-19 pandemic is probably the biggest disasterof the current and past century. It is not just a health hazard which has affectedthe health and medical conditions of the world but it can be termed as a bigdevastation which has badly hit the global economy. In my life time I havenever heard of such a global economic crisis which has affected all segments ofcitizens starting from the labour class to big industrial tycoon s. the most affectedcommercial sectors are the MSMEs and Start-ups. Probably, the economy, moreparticularly the Indian economy is pushed ten years back. The GDP is at a verymiserably stage. At the juncture I can recall the high vision and slightness ofthe great leader Mahatma Gandhi who always emphasised on the developmentof cottage industries for a stronger and sustainable Indian economy. I stronglyadmire the steps taken by our beloved Prime Minister Mr. Narendra bhai Modiwho has on his nation wide address emphasised on two iconic ideas of “Makein India project” and “Atma Nirver Bharat Yojana”.
The financial minister Mrs Nirmala Sitaraman has also declared certainpackages and relaxations which gives some ease meat in the citizens in several.Still then, it needs a conceptualised focused policy to revive the economy ofour country. However I can foresight that there is a great opportunity in spiteof the adversity for India. The attract a good number MNCs and FDI in toinvest in our country as some global market leaders in the fields of telecommunications, pharmaceutical industries are no more interested to invest inChina and inform of business opportunity, Human Resources, political stabilityof course, India comes next as an alternate destination for the MNCs and FDI.
Now coming to the education and educational institutions, the lockdownand shutdown due to COVID-19 pandemic situation has directly affected theeducation and the academic scenario of the entire country. The COVIS-19 situationhas disrupted the examination which if halfway, consequently the admissionto the next session and the duration and quantum of course curriculum to becovered in future. If the situation prevails for the entire calendar year, manyunseen problems may arises in quality, quantity and productivity.
Prof. Malay Kumar Mohanty(Managing Editor)


1. Senior Associate Professor, National Institute of Construction Management and Research (NICMAR),Pune, India-411045, Email:[email protected].
2. Senior Associate Professor, School of General Management, National Institute of Construction Managementand Research (NICMAR), Pune, India, Email:[email protected].
Predictors of Success for a Small Familybased Real Estate Developer: An
Investigation in India
Dr. Harish Kumar Singla1 & Dr. Pradeepta Kumar Samanta2
ABSTRACTThe current study is an attempt to understand the predictors of success for small family based real
estate developer in India. A total of 32 critical factors, based on the literature review and expert viewwere identified. A comprehensive questionnaire was developed and was circulated among small familybased real estate developers across the nation. Snowball sampling technique was used for data collectionand a total of 165 developers responded to the survey. The data was analyzed using the relativeimportance index, and ordered logistic and ordered Probit regression.
The relative importance index (RII) reveal that leadership quality of owner, creative thinking, abilityto take risk, experience of the owner, effective communication skill, training of younger generation andfamily commitment to work are some of the most critical predictors of success of real estate developer.The results of ordered Logistic and ordered Probit regression model suggest that linkages with politicalparties, linkages with approving authorities, relationship with bankers, relationship with subcontractors,relationship with suppliers, relationship with employees, relationship with labor unions, years ofexperience of owner, educational qualification of owner, knowledge of contracts, leadership quality,ability to resolve disputes, ability to take risk, creative thinking, effective communication skill of owner,employee loyalty, qualification of employees, employee honesty, training of younger generation, opencommunication among family members and family commitment to work and government policy haspositive influence on success of small family based real estate developer while changing marketconditions and corruption has negative influence on their success.
Keywords: Family; Real Estate Developer; Success; Construction; Regression.

2 Orissa Journal of Commerce, Volume XXXXI, April- June-2020, Issue No-II
IntroductionThe role of real estate and construction industry in the economic development is immense throughout
the world. The real estate sector is critical for a developing country like India, with massive need forinfrastructure development and housing. “Housing for all by 2022’ is a major initiative by Governmentof India (GOI) under which a total of 50 million houses are targeted to be built by financial year 2022.As reported by Economic Times (2017, December), the government’s budgetary support for theseschemes has risen from INR 1,16000 Million in FY16 to INR 2,90430 Million in FY18. In India, thereis an estimated shortage of around 40 Million houses (urban and rural). In addition, population growthof 1.3 per cent per annum, favorable demographics, “nuclearization” and “urbanization” of families,rising income/aspirations all could lead to another 10 Million per annum demand for houses. This ismassive gap both in terms of the investment requirement and creating the facilities and it cannot beachieved alone by government. This investment will require foreign direct investment, contributionfrom existing public and private limited companies that are doing business in India.
GOI has taken several steps to facilitate both home buyers as well as companies engaged in the realestate sector by creating national programs like real estate investment trusts, announcement of 100Smart Cities, the real estate regulation and development act, 2016 and modification to the land acquisitionbill of 2013. Gupta et al. (2017) pointed that these initiatives, along with digitization of land recordscontributes to increasing transparency in the Indian real estate sector. Further, the goods and servicestax rates on under construction real estate residential property has been reduced to one percent foraffordable housing to help the home buyers. Authors of the current study believe that the current situationputs India’s real estate and construction industry in a situation, which will see emergence of many newentrants in the sector, consolidation of exiting players through mergers and acquisitions.
Importance of Family FirmsCurrently, the real estate and construction industry in India is highly fragmented. Though there is
no official database, it is estimated that there are more than 1,30,000 registered construction contractorsin India engaged in various construction activities, apart from more than 400 listed companies. Most ofthese companies in India (either small or big in size) have a unique similarity that their ownership ishighly concentrated. Bang et al. (2017) in a study in India identified that a total of 4,367 listed firms inIndia are family owned companies, if we follow the criteria of 20% ownership. Several attempts havebeen made in the past to understand the performance of such family companies and the factors thataffect their performance. Wagner et al. (2015) in a Meta-analysis found that family based companiesoutperform the non-family based companies, and these findings are supported by Anderson and Reeb(2003), Aguiló and Aguiló (2012), Belenzon et al. (2016), Chu (2011), Daily and Dollinger (1992),Neubauer and Lank (1998) and Viswanathan (2014). On the contrary, Cucculelli et al. (2014), Schulzeet al. (2003) and Sciascia and Mazzola (2008) found an inferior performance of family-based companies.Gallucci et al. (2015) and Sciascia et al. (2014) found that the presence of family members in themanagement enhances companies’ performance. Overall, the performance of a family-based companygets affecting primarily by family characteristics such as family management, ownership structure, boardcomposition, family involvement and control (Dyer, 2006; Habbershon et al. 2003; Villalonga and Amit,2006). The company specific characteristics such as age, size, leverage, liquidity, taxation, cash flow,R&D intensity etc. (Kole, 1995; Poza 2007); the industry specific factors such as competition, industry

3Orissa Journal of Commerce, Volume XXXXI, April- June-2020, Issue No-II
attractive (Porter, 1980; 1985) and the economy factors such as growth in gross domestic product andinflation also affect the performance of family-based companies.
However, most of these studies have been conducted for publicly listed companies, as their data iseasily available. Authors in the present study found that existing literature does not differentiate betweenthe small and large family-based companies. This is despite that fact that small and unlisted family-based companies represent approximately 70% of all family-based companies in any country (Astrachanet al., 2002; Chrisman et al., 2004; Sharma, 2004). The small family companies have been understudied,with less than 20% of papers in the family business literature dedicated to such companies (e.g., Wagneret al., 2015). Moreover, even research on small and medium size companies (SMEs) has paid mostattention to larger family SMEs with over 500 employees (De Massis et al., 2012) and very little attentionis being paid to small family companies. This is a huge gap in the existing body of knowledge. Further,the sector specific studies are almost non-existent such as studies that deal with “small family basedreal estate developers”. Hence, knowing the vital role that these small family based real estate developercan play in the economic development process in India and how it can help GOI to achieve its policytargets, the current study is an attempt to explore the predictors that affect the performance of thesecompanies.
The rest of the study is divided into four sections. The next section is literature review which dealswith defining the small family company and factors contributing to the success of small family company.The literature review is followed by research methodology, which talks about the method followed inthe study to collect data and analysis techniques used in the study. This is followed next by data analysis,conclusion of results and discussion about implications of the study on various stakeholders and futureresearch.Literature Review
Defining Small Family CompanyIt is very difficult to define, a “small family company”. In a recent study Ahluwalia et al. (2017)
noted that despite agreement among scholars about the contribution of small family companies ineconomic development of nation, a consistent definition of “small family company” is absent acrossthe world. Mahto et al. (2018) compared the performance of small family companies with small nonfamily based companies, however, does not define, what a small family-based company is. Batten andHettihewa (1999) found that most of the small companies in Srilanka are family based. Shanker andAstrachan (1996) also pointed towards a significant overlap in small companies and family companies.Cunningham et al. (2016) Intihar and Pollack (2012), Swoboda and Olejnik (2013) and Garcés-Galdeanoet al. (2017) have examined small family companies, but none of the studies has provided the exactdefinition of small family company. In fact, the literature lacks a standard definition for a family companyas noted by Cano-Rubio et al. (2017). They point that the conceptual spectrum used by researchers isvery broad to define family company, which is ranging from the simplest definition i.e. a company isclassified as a family business on the basis of the perception of its owners and/or managers, to thecomplex once where researchers consider variables such as ownership, management, involvement ofthe family in the business, continuity and combinations thereof, however, none of these family companiesdefinition is universally accepted in the literature. Cano-Rubio et al. (2017) highlights the need for astandard definition of family-based company so as to enabling researchers to continue advancing in the

4 Orissa Journal of Commerce, Volume XXXXI, April- June-2020, Issue No-II
knowledge of this topic and avoid coming to different conclusions merely as a result of having basedresearch on different definitions. Ramadani and Hoy (2015) reveal that ownership is the most preferredcriteria followed by management, dictatorship, self identification, multiple generations and Intra familysuccession intention.
If we break the definition of small family-based company and only look at what a small companyis, several definitions are available. Ahluwalia et al. (2017) notes that in the United States of America, asmall company is defined as a manufacturing entity with fewer than 500 employees or a service companywith annual sales revenue lower than $7.5 million (US Small Business Administration, 2010). Theseentities are the dominant form of enterprises in the US economy representing 99.7% of employercompanies and are responsible for generating 64% of private sector jobs. Globally small and mediumenterprises are defined based on the criteria of number of employees, turnover or total assets in IndiaMinistry of micro, small and medium enterprises (MSME) defines a small firm as “A small enterpriseis an enterprise where the investment in plant and machinery is more than INR 2.5 Million but does notexceed INR 50 Million”.
Factors Affecting Success of Small Family Based CompaniesSufficient literature is available on factors affecting success of “family-based companies” and success
of “small companies” separately. But, literature on factors affecting success of “small family-basedcompanies” is limited, still the authors complied few papers in the section to proceed further.
In one of the most important and related study, Mokhber et al. (2017) found that family membersskills play a vital role in terms of the performance of family business in small and medium sizedenterprises. In other study Ghee et al. (2015) found the success of a family owned business is based onseveral integrated factors such as founder’s business management skills, including the formation of asolid foundation for successors, to the successor transition process, however, Ghee et al. (2015) doesnot differentiate family firm as small and large. Duchesneau and Gartner (1990) found that entrepreneurialvalues, business experience, start-up behavior and business strategy affect the success of small business.Norfadhilah and Halimah (2010) and Najihah et al. (2014) defined entrepreneurial values as leadership,active, responsible, self-confident, risk-taking, farsighted, dedicated to work, creative and innovative,appreciating and grabbing opportunities continually, and possessing an internal locus of control. Risk-taking behavior, innovation and training also have a positive impact on performance of a small company(Bird’s, 1989).
Bakar et al. (2012) in their study found that human factor, management factor, product qualityfactor, customer orientation and environmental factor have a significant positive influence on performanceof construction companies in Malaysia. Experience of owner in small business also plays a vital role inthe success of business (Miskin and Rose, 2015) and this experience may be acquired through familymembers, relatives and friends (Davidson and Honig, 2003; Baughn et al., 2006).
Mahmood et al. (2017) studied the performance of small Malaysian housing construction companiesand found that good management skills, leadership style and efficient organization structure in smallconstruction companies is must have strong links. Besides, the housing construction companies need todevelop beyond their management and technical skills. Mahmood et al. (2017) also found that businessexperience of owner also a significant positive effect on success.

5Orissa Journal of Commerce, Volume XXXXI, April- June-2020, Issue No-II
There has been a dramatic increase in the number of studies focusing on networks of individuals,their relationships, and their effects on groups and organizations (Hoang and Antoncic, 2003; Parkhe etal., 2006) as relations management not only influence individuals but also significantly affect the waysthat organizations are managed, developed, maintained, and sustained (Jack, 2010; Omri and Frikha,2012; Omri and Ayadi-Frikha, 2014). Omri et al. (2015) found that human and social capital are majorinfluence on the success of small companies, where human capital is measured in terms of all cognitiveabilities, knowledge acquired through formal education, and skills and competencies acquired informallyin the workplace. The social capital is measured through relationship with bankers, suppliers, customers,or other relevant individuals.
A brief summary of the factors that affect the success of small companies/family companies ispresented in Table I.
Table I: Literature review
Category Used in the paper Alternative Names in Literature
Authors
F-1 Relationship Management Social Capital Omri et al. (2015), Hoang and Antoncic (2003), Parkhe et al. (2006), Jack (2010), Omri and Frikha (2012), Omri and Ayadi-Frikha (2014), Bakar et al. (2012).
F2-Owner Knowledge and Experience
Entrepreneurial Values/Human Capital
Duchesneau and Gartner (1990), Gherhes et al. (2016), Ghee et al. (2015), Omri et al. (2015), Mahmood et al. (2017), Walker and Brown (2004).
F3- Owner Skills and Attitude
F4-Employee Related Bakar (1993), Bakar et al. (2012), Ofori and Chan (2000), Walker and Brown (2004).
F5-Family Related Ghee et al. (2015), Mokhber et al. (2017), Vozikis et al. (2013)
F6-Others (Government Policy, Changing Market Conditions and Corruption)
Davidsson et al. (2007), Ofori and Chan (2000)
Source: Authors Compilation
Research MethodologyAs discussed in the literature review, there is no standard definition of small family-based company;
authors used a step wise step process to have a working definition of “Small Family Company”. Atfirst, the definition of small company given by MSME was taken as a base. Further, two importantcriteria were used to find family companies among these small companies. First criteria were theownership. All those companies, where ownership of more than 50% was within a family were consideredas family companies. Secondly, if the important decision-making position was occupied by the familymembers. Therefore, the criteria of ownership and management were considered for defining familycompany. Hence, authors in the present study arrived at a working definition of a “small family based

6 Orissa Journal of Commerce, Volume XXXXI, April- June-2020, Issue No-II
real estate developer in India”. According to this, “any real estate developer, where the investment inplant and machinery is more than INR 2.5 Million but does not exceed INR 50 Million; the ownershipof more than 50% is with a family and the important decision-making position was occupied by thefamily members” is a small family based real estate developer.
After arriving at the definition, authors, based on the extensive literature review and opinion soughtfrom experts within the real estate sector, developed a comprehensive questionnaire. The questionnairesought details of the family business like average annual turnover in past three years and the form ofbusiness. The data owner’s education qualification, age and experience were also collected. Initially 38predictors of success were identified to be included in the survey that were felt useful by the authors,however, after preliminary survey and further inputs from the experts, six of them were dropped andthe final questionnaire contained 32 predictors of success. These 32 predictors of success were dividedinto six categories namely relationship management, owner knowledge and experience, owner skillsand attitude, employee related, family related and others factors. The questionnaire was developed on afive-point scale, where the respondents were asked to rate the predictors of success based on its criticalityfor success of their business. If the factor is not critical at all, the rating is one and if the factor is verycritical, the rating is five.
There are several ways to measure the success of a company and these measures are both quantitativeas well as qualitative. Direct quantitative variables are growth in revenue and profits, whereas the indirectqualitative variables are owner’s perception about profitability, growth of business etc. Simpson et al.(2004) points that success is a subjective term and each company may look at success in different way.Similarly, Walker and Brown (2004) noted that the characteristics of the businesses and owners mayinfluence their perceptions of their success and its relative importance. Therefore, in the current studythe dependent variables i.e. success is measured in terms of the perception of owner through a questionabout “how successful their business is based on the profitability in past three to five years” on a scaleof five, where highly successful mean five and not successful at all mean one. The approach is similarto the one followed by Kotey and Meredith (1997), Gadenne (1998), Swinney et al. (2006), Rhodesand Butler (2004) and Mahmood et al. (2017).
A total of 187 owners of small family based real estate developer responded to the survey. Duringthe data analysis, 22 questionnaires were found to be incomplete in some aspect or the other, hencedropped and 165 complete responses were analyzed. The data analysis was done in two stages, the firstpart of the data analysis was relative importance index (RII) and the second part was ordered logisticand ordered probit regression model.Data Analysis
The profile of the respondents is given in Table II. Authors find that most of the small family basedreal estate developers are run by people below 45 age (70%). Fifty percent of the respondents aregraduate, 21% engineers and only 13% are post graduate. 15% respondents have formal education onlyup-to 12th class. Fourth three percent companies are registered as private limited companies, and thatis a big number, considering, they are operating at very small level. Eighty percent companies haveaverage annual turnover above 50 Million INR.

7Orissa Journal of Commerce, Volume XXXXI, April- June-2020, Issue No-II
Table II: Respondent and Firm Profile
Age Numbers Percentage 21-35 Year 48 29.09%
36-45 Years 65 39.39% 46-60 Years 36 21.81%
61 and Above 16 09.69% Education
Up to 12th Class 25 15.15% Under Graduate (B.Sc., B.Com., BA etc.) 82 49.69%
Under Graduate (Engineer) 36 21.81% Post Graduate (Any-MTech. MBA,M.Com., M.Sc etc.) 22 13.33%
Form of Business Individual (Including Hindu undivided family) 71 43.03%
Partnership 23 13.93% Private Limited Company 71 43.03%
Other 00 00 Years Since in the Business
Less Than 5 Years 29 17.57% 6 to 10 Years 41 24.84%
11 to 20 Years 56 33.93% More Than 20 years 39 23.63%
Average Annual Turnover in Last 3 Years (Indian Rupees-INR)
Less Than 50 Million 23 13.93% 50 to 200 Million 67 40.60%
Above 200 Million 75 45.45%
Source: Authors Compilation
Many researchers (Assaf et al., 1995; Faridi and El-Sayegh, 2006; Iyer and Jha, 2005; Kumaraswamyand Chan, 1998) are of the opinion that mean and standard deviation of each individual attribute is nota suitable measure to assess overall rankings as they do not reflect any relationship between them andhence recommends the use of relative importance Index (RII) which can be calculated using the RIIfunction. Therefore, authors in the present study, choose to avoid the mean and standard deviation andthe data collected through survey is analyzed using RII.
RII=Relative Importance Index= ÓW/A x NWhere W Weight given to each attribute by respondentA Highest weightN Total number of respondentsThe values so obtained range between zero and one. These values are arranged in an order from
highest to lowest, where higher RII indicate higher rank and vice versa. Table III provides the RII andthe ranking of each factor. The rankings indicate that top three variables relate to owner’s skill andattitude namely leadership quality, ability to take risk and creative thinking. Hence the respondents areof the view that owner’s skill and attitude play a vital role in the success of a small family based realestate developer. Owner’s technical knowledge and experience also ranks very high. The family influenceon the success is evident from the fact that training of younger generation and family commitment towork ranks among the top ten factors.

8 Orissa Journal of Commerce, Volume XXXXI, April- June-2020, Issue No-II
Table III. Relative Importance Index
S.No. Attribute RII Rank F-1 Relationship Management
1 Relationship with Political Parties 0.6727 16 2 Relationship with Government Officials 0.7964 12 3 Relationship with Approving Authorities 0.3964 21 4 Relationship with Bankers 0.7927 13 5 Relationship with Subcontractors 0.4145 20 6 Relationship with Suppliers 0.8327 8 7 Relationship with Employees 0.8182 10 8 Relationship with Labor Unions 0.7091 14
F2-Owner Knowledge and Experience in Business 9 Experience of Owner 0.8509 4
10 Educational Qualification of Owner 0.7018 15 11 Technical Knowledge of Construction 0.8400 7 12 Knowledge about Financial Management 0.3600 25 13 Knowledge about Project Management 0.3891 22 14 Knowledge of Contracts 0.3818 23
F3- Owner Skills and Attitude 15 Man-Management Skill 0.3164 30 16 Leadership Quality 0.8945 1 17 Ability to Resolve Disputes 0.3636 24 18 Willingness to Accept New Ideas 0.3127 31 19 Ability to Take Risk 0.8582 2 20 Creative Thinking 0.8582 2 21 Effective Communication Skill of Owner 0.4291 19
F4-Employee Related 22 Employee Loyalty 0.3455 26 23 Qualification of Employees 0.4582 18 24 Employee Honesty 0.3127 31 25 Employee Commitment 0.3345 26
F5-Family Related
26 Succession Planning 0.3345 29 27 Training of Younger Generation 0.8473 5 28 Open Communication among Family Members 0.3455 26 29 Family Commitment to Work 0.8436 6
F6-Others 30 Changing Market Conditions 0.8073 11 31 Corruption 0.6691 17 32 Government Policy 0.8218 9
Source: Authors Compilation

9Orissa Journal of Commerce, Volume XXXXI, April- June-2020, Issue No-II
In order to find, the factors that affect the success of small family based real estate developer,authors developed a regression model.
Y=á+âX+å (1)where Y is the perception of the developer about success of their business measured on five-point
scale, X’s are the 32 explanatory variables and á, â and å are intercept, beta coefficient and errorrespectively. All the explanatory variables are also measured on a five point scale. Since, there are 32explanatory variables and the data collected is cross sectional, the model may suffer from the problemof multicollinearity and heteroscedasticity. Therefore, before going for the regression analysis, thesetwo issues are addressed.
Multicollineraity is a situation, when explanatory variables are significantly correlated to each other.The multicollinearity is tested using variance inflation factor (VIF). A high value of VIF indicates thepresence of multicollinearity, which may result in overestimation of R-square value. Belsley (1991)and Hair et al. (2010) recommend elimination of any variable that has VIF value above 10. The resultsof the VIF values are reported in Table IV. The results indicate the only one variable i.e. knowledgeabout project management exhibit high multicollinearity, hence dropped for the further analysis.Considering that the VIF values are all well within acceptable range, authors decided to proceed withregression using with 31 explanatory variables.

10 Orissa Journal of Commerce, Volume XXXXI, April- June-2020, Issue No-II
Table IV: VIF Values
Variable VIF Linkages with Political Parties 3.7 Linkages with Government Officials 4.8 Linkages with Approving Authorities 3.9 Relationship with Bankers 3.5 Relationship with Subcontractors 5.1 Relationship with Suppliers 4.7 Relationship with Employees 3.1 Relationship with Labor Unions 3.3 Years of Experience of Owner 3.4 Educational Qualification of Owner 6.4 Technical Knowledge of Construction 5.3 Knowledge about Financial Management 6.2 Knowledge about Project Management* 12.2 Knowledge of Contracts 7.0 Man-Management Skill 4.8 Leadership Quality 6.1 Ability to Resolve Disputes 2.8 Willingness to Accept New Ideas 5.1 Ability to Take Risk 3.2 Creative Thinking 2.7 Effective Communication Skill of Owner 6.3 Employee Loyalty 3.7 Qualification of Employees 4.4 Employee Honesty 3.4 Employee Commitment 5.8 Succession Planning 2.9 Training of Younger Generation 4.6 Open Communication among Family Members 3.5 Family Commitment to Work 4.4 Changing Market Conditions 3.0 Corruption 5.4 Government Policy 4.5
Source: Authors Compilation *Dropped for further Analysis

11Orissa Journal of Commerce, Volume XXXXI, April- June-2020, Issue No-II
Since, the data is cross sectional in nature, the regression model may suffer from the problem ofheteroscedasticity. Heteroscedasticity is a problem when the residuals of the regression are not normallydistributed i.e. have a non constant variance (Wang and Akabay, 1994). Heteroscedasticity is a majorproblem as it may lead to forecasting error. The standard errors computed in such cases for the leastsquares estimators are incorrect. Therefore, authors test the regression model for heteroscedasticityusing the Breusch Pagan / Cook Weisberg test before going ahead. The results indicate that the chisquare value is 0.00 with p value, 0.9, hence the null hypothesis of constant variance is accepted andthe data is free from heteroscedasticity.
Peel et al. (1998) points that when the dependent variable is categorical and also ordinal in nature(for example likert scale), then ordered logistic or probit regression must be used (Greene, 1990). Chatlaand Shmueli (2017) identify four major problems with the use of ordinary least square (OLS) regressionin cases, where the data is not continuous. These problems are non normal error term, non constanterror variance, constraints on the response function and the forth one is that since the OLS model islinear, a unit increase in one of the covariates of 5ØKÜ is interpreted as a constant change of 5ØýÞ inthe probability of an event while holding the remaining covariates constant. In many applications, thisis unrealistic. Long and Freese (2006) states this as a major problem. Gordon et al. (1994) suggestsusing generalized linear models (GLMs) with logistic or probit link functions to overcome all fourissues. The logistic or probit links are symmetric and can produce diminishing effects as the probabilityapproaches 0 or 1, and they mostly differ from each other at the tails. For small samples, both techniquesproduce similar results, but, as the sample size increases, the differences are more evident (Gordon etal., 1994). Despite this most of the studies continue to use OLS regression, which is fundamentally notappropriate.
Taking a note of it, authors use both ordered logistic and ordered probit regression and the best fitis identified the Akaike information criterion (AIC) (Akaike, 1974) and Bayesian information criterion(BIC) (Stone, 1979) criterion. AIC and BIC are “in-sample” fit techniques to estimate the likelihood ofa model to predict/estimate the future values. A good model is the one that has minimum AIC and BICamong all the models. The results of both the models are presented in Table V.
The results produced by both the models are similar; however, the ordered logistic regression modelis marginally better compared to ordered probit model using AIC and BIC criteria. The R-square of thelogistic model is 63.41% and both the model is found to be fit as p=0.000 with Chi-square=265.060and 264.940 respectively for logistic and probit model. Most of the factors significantly contributetowards the success of small family based real estate developers. It is to be noted that corruption andchanging market condition have a negative influence on the performance. The factors that are notsignificant are linkages with government officials, technical knowledge of construction, knowledgeabout financial management, man management skill, willingness to accept new ideas and successionplanning.

12 Orissa Journal of Commerce, Volume XXXXI, April- June-2020, Issue No-II
Table V: Ordered Logistic Regression and Ordered Probit Regression Results
Dependent Variable-Perception About Success
Ordered Logistic Regression Ordered Probit Regression
Coef. Std. Err. P>z Coef.
Std. Err. P>z
Linkages with Political Parties 3.139 0.714 0.000** 1.788 0.405 0.000** Linkages with Government Officials 1.048 0.695 0.132 0.561 0.397 0.157
Linkages with Approving Authorities 8.971 1.722 0.000** 4.853 0.911 0.000** Relationship with Bankers 4.186 0.881 0.000** 2.258 0.464 0.000** Relationship with Subcontractors 10.170 1.871 0.000** 5.557 0.994 0.000** Relationship with Suppliers 1.990 0.678 0.003** 1.016 0.363 0.005** Relationship with Employees 4.304 1.026 0.000** 2.314 0.559 0.000**
Relationship with Labor Unions 2.600 0.600 0.000** 1.420 0.325 0.000** Years of Experience of Owner 4.433 0.903 0.000** 2.413 0.464 0.000**
Educational Qualification of Owner 3.143 0.748 0.000** 1.641 0.381 0.000** Technical Knowledge of Construction 1.229 0.733 0.094 0.715 0.418 0.087 Knowledge about Financial Management 0.331 0.500 0.509 0.145 0.296 0.624
Knowledge of Contracts 4.660 0.888 0.000** 2.616 0.475 0.000** Man-Management Skill 0.500 0.933 0.592 0.283 0.501 0.572 Leadership Quality 9.014 1.611 0.000** 4.869 0.834 0.000** Ability to Resolve Disputes 11.594 2.290 0.000** 6.218 1.212 0.000** Willingness to Accept New Ideas 1.288 0.878 0.142 0.587 0.472 0.214
Ability to Take Risk 3.225 0.970 0.001** 1.829 0.551 0.001** Creative Thinking 3.193 0.754 0.000** 1.768 0.412 0.000**
Effective Communication Skill of Owner 1.142 0.476 0.017* 0.576 0.263 0.029* Employee Loyalty 3.573 0.866 0.000** 2.043 0.489 0.000**
Qualification of Employees 8.402 1.617 0.000** 4.537 0.850 0.000** Employee Honesty 2.391 0.898 0.008** 1.288 0.492 0.009** Employee Commitment 0.888 0.840 0.291 0.495 0.454 0.276
Succession Planning 0.140 0.651 0.830 0.149 0.361 0.681 Training of Younger Generation 6.583 1.244 0.000** 3.652 0.678 0.000**
Source: Authors Compilation**Significant at 1%*Significant at 5%

13Orissa Journal of Commerce, Volume XXXXI, April- June-2020, Issue No-II
Discussion of ResultsThe current study investigates the factors that affect the success of a small family based real estate
developers in India. The study finds a ranking of all 32 explanatory variables using RII technique. All32 variables are grouped into six broad categories namely, relationship management, owner’s knowledgeand experience about business, owner’s skills and attitude, employee related factors, family relatedfactors and others. This classification is based on the past studies. At an individual level, the studyfinds that leadership quality, ability to take risk; creative thinking, experience of owner and training ofyounger generation are the top five factors for the success of real estate developer. These factors relateto owners skill and attitude, his knowledge and experience and the family factors.
In stage two of the analysis, ordered logistic regression and ordered probit regression analysis isperformed on 31 variables. The results of the regression analysis reveal that 23 out of 31 factors i.e.linkages with political parties, linkages with approving authorities, relationship with bankers, relationshipwith subcontractors, relationship with suppliers, relationship with employees, relationship with labor unions,years of experience of owner, educational qualification of owner, knowledge of contracts, leadership quality,ability to resolve disputes, ability to take risk, creative thinking, effective communication skill of owner,employee loyalty, qualification of employees, employee honesty, training of younger generation, opencommunication among family members, family commitment to work, changing market conditions,corruption and government policy have a significant influence on the success of small family based realestate developers in India. Among these 23, two factors i.e. changing market conditions and corruptionbecome more critical as they have a negative influence on the success. These results are similar to thestudies of Bakar et al. (2012), Miskin and Rose (2015), Mahmood et al. (2017) and Omri et al. (2015).Conclusion, Implications, Limitations and Future Scope
The current study is undertaken with a perspective to understand the predictors of success of asmall family based real estate developer in India. Overcoming the practical difficulties in defining a“Small Family Company” which is still a challenge, authors choose a working definition for this purpose.The data is analyzed using RII and ordered logistic and probit models. The findings indicate therelationship management, knowledge-skill and aptitude (KSA) of owner; employee related issues andfamily involvement all play a vital role in the success of a small family company engaged in real estatedevelopment activity. The study highlights the importance of social capital and human capital for thesuccess of small family company. The social capital in current study is defined as relationshipmanagement and human capital is defined as owner’s knowledge, experience, skill and aptitude.
The current study addresses a very important area i.e. the factors affecting success of small familybased real estate developers and the findings are vital for these developers. As the need for housing isgrowing because of “nuclearization” and “urbanization” and a push by GOI to have “Housing for all by2022”, the small family based real estate developers are growing at a rapid pace. The findings clearlyindicate that relationship management, owner’s knowledge, skill and aptitude and the family influenceon business plays a vital role in the success of small family based real estate developer; therefore, thesecompanies need to maintain a cordial relationship with all stakeholders. The developers should givedue importance to soft and intrapersonal skills like dispute handling and leadership. The developersneed to think creatively and train the younger generation and pass on their experience, so that younggeneration comes forward, take challenges and face the market.

14 Orissa Journal of Commerce, Volume XXXXI, April- June-2020, Issue No-II
The government as a stakeholder also needs to look at these findings and take a note that corruptionand changing market conditions affects the success of a small family company. There is nothinggovernments and stakeholders can do about changing market conditions except for to forecast theupcoming changes in advance and adapt, but a lot come be done to eradicate the menace of corruptionand the government need to take right steps in this direction.
Despite best efforts, the study is not without limitations. The limited sample size is a concern as itwas very difficult to identify the real target respondent. The other aspect is that since the data is collectedthrough primary investigation on five point scale, the data may suffer from the respondent and thesurveyor bias.
Notwithstanding the limitations, the present study is an important one and contributes significantlyto the body of knowledge. It is one of the first study that looks at the predictors of success for smallfamily based real estate developers in India.References• Ahluwalia, S., Mahto, R. V., and Walsh, S. T. (2017), “Innovation in small firms: Does family vs. non-
family matter?”, Journal of Small Business Strategy, Vol. 27 No. 3, pp. 39-49.• Anderson, R.C., and Reeb, D.M. (2003), “Founding–family ownership and firm performance:
evidence from the S&P 500”, Journal of Finance, Vol. 58 No. 3, pp. 1301–1328.• Assaf, S.A., Al-Hejji, S. (2006), “Causes of delay in large construction projects”, International
Journal of Project Management, Vol. 24, pp. 349–357.• Astrachan, J. H., Klein, S. B., and Smyrnios, K. X. (2002), “The F-PEC scale of family
influence: A proposal for solving the family business definition problem”, Family BusinessReview, Vol. 15 No. 1, pp. 45–58.
• Baughn, C.C., Cao, J.S.R., Le, L.L.M., Lim, V.A. and Neupert, K.E. (2006), “Normative,social and cognitive predictors of entrepreneurial interest in China, Vietnam and the Philiphines”,Journal of Developmental Entrepreneurship, Vol. 11 No. 1, pp. 57-77.
• Cano-Rubioa, M., Fuentes-Lombardob, G., Vallejo-Martosc, M.C. (2017), “Influence of thelack of a standard definition of “family business” on research into their international strategies”,European Research on Management and Business Economics, Vol. 23, pp. 132–146.
• Chatla, S. B., and Shmueli, G. (2017), “An extensive examination of regression models witha binary outcome variable”, Journal of the Association for Information Systems, Vol. 18 No.4, pp. 340-371.
• Chrisman, J. J., Chua, J. H., and Litz, R. A. (2004), “Comparing the agency costs of familyand non family firms: Conceptual issues and exploratory evidence”, Entrepreneurship Theoryand Practice, Vol. 28 No. 4, pp. 335–354.
• Chu, W. (2011), “Family ownership and firm performance: Influence of family management,family control, and firm size”, Asia Pacific Journal of Management, Vol. 28, pp. 833–851.
• Cucculelli, M., Mannarino, L., Pupo, V. and Ricotta, F. (2014), “Owner-management, firmage, and productivity in Italian family firms”, Journal of Small Business Management, Vol.52 No. 2, pp. 325-343.

15Orissa Journal of Commerce, Volume XXXXI, April- June-2020, Issue No-II
• Cunningham, J., Seaman, C., and McGuire, D. (2016), “Knowledge sharing in small familyfirms: A leadership perspective”, Journal of Family Business Strategy, Vol. 7 No. 1, pp. 34-46.
• Daily, C.M., and Dollinger, M.J. (1992), “An empirical examination of ownership structure infamily and personally managed firms”, Family Business Review, Vol. 5 No. 2, pp. 375-386.
• Davidson, P. and Honig, B. (2003), “The role of social and human capital among nascententrepreneurs”, Journal of Business Venturing, Vol. 18, pp. 301-331.
• Davidsson, P., Achtenhagen, L., and Naldi, L. (2007), “What do we know about small firmgrowth?”, in Parker, Simon. (Ed.). The life cycle of entrepreneurial ventures, Vol. 3, pp. 361-398.
• De Massis, A., Sharma, P., Chua, J. H., and Chrisman, J. J. (2012), Family business studies:An annotated bibliography. Northhampton, MA: Edward Elgar.
• Duchesneau, D.A. and Gartner, W.B. (1990), “A profile of new venture success and failure inan emerging industry”, Journal of Business Venturing, Vol. 5, pp. 297-312.
• Dyer, W.G. (2006), “Examining the ‘family effect’ on firm performance”, Family BusinessReview, Vol. 19 No. 4, pp. 253-273.
• Economic Times (2017), “Affordable Housing: An attractive trigger for all-round growth”a v a i l a b l e a t / / e c o n o mi c t i m e s . i n d i a t i m e s . c o m/ a r t i c l e s h o w / 6 2 0 6 6 4 6 4 . c m s ?utm_source=contentofinterest&utm_medium=text&utm_campaign=cppst (accessed on 11th Feb.2019).
• Faridi, A., and El-Sayegh, S. (2006), “Significant factors causing delay in the UAE constructionindustry”, Construction Management and Economics, Vol. 24, pp. 1167–1176.
• Gadenne, D. (1998), “Critical success factors for small business: an inter-industry comparison”,International Small Business Journal, Vol. 17 No. 1, pp. 36-51.
• Gallucci, C., Santulli, R., and Calabrò, A. (2015), “Does family involve-ment foster or hinderfirm performance? The missing role of family-based branding strategies”, Journal of FamilyBusiness Strategy, Vol. 6 No. 3, pp. 155-165.
• Garcés-Galdeano, L., Larraza-Kintana, M., Cruz, C., and Contín-Pilart, I. (2017), “Just aboutmoney? CEO satisfaction and firm performance in small family firms”, Small BusinessEconomics, Vol. 49 No. 4, pp. 825839.
• Ghee, W.Y., Ibrahim, M.D. and Abdul-Halim, H. (2015), “Family business succession planning:unleashing the key factors of business performance”, Asian Academy of Management Journal,Vol. 20 No. 2, pp. 103-126.
• Gherhes, C., Williams, N., Vorley, T., and Vasconcelos, A. C. (2016), “Distinguishing micro-businesses from SMEs: a systematic review of growth constraints”, Journal of Small Businessand Enterprise Development, Vol. 23 No. 4, pp. 939-963.
• Gordon, D. V., Lin, Z., Osberg, L., and Phipps, S. (1994), “Predicting probabilities: Inherentand sampling variability in the estimation of discrete-choice models”, Oxford Bulletin ofEconomics and Statistics, Vol. 56 No. 1, pp. 13-31.

16 Orissa Journal of Commerce, Volume XXXXI, April- June-2020, Issue No-II
• Greene, H.W. (1990), Econometrics, New York, NY: Macmillan
• Gupta, A., Sawhney, A., Bajaj, D., and Agarwal, S. (2017), “Significance of real estate fundmanagement in India”, Journal of Real Estate Literature, Vol. 25 No. 1, pp. 141-168.
• Habbershon, T., Williams, M., and McMillan, I. (2003), “A unified systems perspective offamily firm performance”, Journal of Business Venturing, Vol. 18 No. 4, pp. 451–465.
• Hair, J., Black, W., Babin, B.Y.A., Anderson, R. and Tatham, R. (2010), Multivariate DataAnalysis. A Global Perspective, Pearson Prentice Hall, New Jersey, NJ.
• Hoang, H. and Antoncic, B. (2003), “Network-based research in entrepreneurship: a criticalreview”, Journal of Business Venturing, Vol. 18 No. 2, pp. 165-187.
• https://msme.gov.in/faq (accessed on 11th Feb. 2019)
• Intihar, A., and Pollack, J. M. (2012), “Exploring small family-owned firms’ competitiveability”, Journal of Family Business Management, Vol. 2 No. 1, pp. 76-86.
• Iyer, K.C., and Jha, K.N. (2005), “Factors affecting cost performance: evidence from Indianconstruction projects”, International Journal of Project Management, Vol. 23, pp. 283–295.
• Jack, S.L. (2010), “Approaches to studying networks: implications and outcomes”, Journal ofBusiness Venturing, Vol. 25 No. 1, pp. 120-137.
• Kole, S. (1995), “Measuring managerial equity ownership: A comparison of sources of ownershipdata”, Journal of Corporate Finance, Vol. 1 No. 3–4, pp. 413–435.
• Kotey, B. and Meredith, G.G. (1997), “Relationship among owner/manager values, businessstrategies and enterprise performance”, Journal of Small Business Management, Vol. 35 No.2, pp. 37-64.
• Kumaraswamy, M.M., and Chan, D.W.M. (1998), “Contributors to construction delays”,Construction Management and Economics, Vol. 16, pp. 17–29.
• Long, J. S., and Freese, J. (2006), Regression models for categorical dependent variablesusing Stata, College Station, TX: Stata Press.
• Mahto, R. V., Ahluwalia, S., Khanin, D., and Walsh, S. T. (2018), “Financial performanceenhancing strategies: Small family firms vs. small non-family firms”, Journal of Small BusinessStrategy, Vol. 28 No. 3, pp. 18-30.
• Miskin, V. and Rose, J. (2015), “New venture initiation: factors influencing success”, Journalof Small Business Strategy, Vol. 1 No. 2, pp. 1-9.
• Mokhber, M., Gi Gi, T., Abdul Rasid, S. Z., Vakilbashi, A., Mohd Zamil, N., and Woon Seng,Y. (2017), “Succession planning and family business performance in SMEs”, The Journal ofManagement Development, Vol. 36 No. 3, pp. 330-347.
• Najihah, M.Y., Rosman, M., Sakinah, M.Z. and Mazidah, P. (2014), “An investigation of thesmall business start-up’ performance”, Journal of Basic and Applied Scientific Research, Vol.4 No. 3, pp. 10-17.

17Orissa Journal of Commerce, Volume XXXXI, April- June-2020, Issue No-II
• Neubauer, F. and Lank, A.G. (1998), The Family Business: Its Governance for Sustainability,Macmillan Press, London.
• Norfadhilah, N. and Halimah, H. (2010), “Aspirasi kerjaya keusahawanan dalam kalanganpelajar Institusi Pengajian Tinggi Awam”, Jurnal Pendidikan Malaysia, Vol. 35 No. 1, pp. 11-17.
• Ofori, G., and Chan, S. L. (2000), “Growth paths of construction enterprises in Singapore1980-98”, Engineering Construction and Architectural Management, Vol. 7 No. 3, pp. 307-321.
• Omri, A. and Ayadi-Frikha, M. (2014), “Constructing a mediational model of small businessgrowth”, International Entrepreuneurship an Management Journal, Vol. 10 No. 2, pp. 319-342.
• Omri, A. and Frikha, M. (2012), “How entrepreneurs identify opportunities and access toexternal financing in Tunisian’s micro-enterprises?”, African Journal of Business Management,Vol. 6 No. 12, pp. 4635-4647.
• Omri, A., Frikha, M. A., and Bouraoui, M. A. (2015), “An empirical investigation of factorsaffecting small business success”, The Journal of Management Development, Vol. 34 No. 9,1073-1093.
• Peel, M. J., Goode, M. M. H., and Moutinho, L. A. (1998), “Estimating consumer satisfaction:OLS versus ordered probability models”, International Journal of Commerce andManagement, Vol. 8 No. 2, pp. 75-93.
• Porter, M. E. (1980), Competitive Strategy. Free Press.
• Porter, M. E. (1985), Competitive Advantage. Free Press.
• Poza, E. J. (2007). Family business. New York: Thomson South-Western.
• Ramadani, V., and Hoy, F. (2015), Context and uniqueness of family business. In L. P.Dana,and V. Ramadani (Eds.), Family businesses in transition economies. Springer.
• Rhodes, C. and Butler, J.S. (2004), “Understanding self-perceptions of business performance:an examination of black American entrepreneurs”, Journal of Developmental Entrepreneurship,Vol. 9 No. 1, pp. 55-71.
• Schulze, W.S., Lubatkin, M.H., and Dino, R.N. (2003), “Toward a theory of agency andaltruism in family firms: theory and evidence”, Journal of Business Venturing, Vol. 18 No. 4,pp. 473-490.
• Sciascia, S., and Mazzola, P. (2008), “Family involvement in ownership and management:exploring nonlinear effects on performance”, Family Business Review, Vol. 21 No. 4, pp. 331-345.
• Sciascia, S., Mazzola, P., and Kellermanns, F.W. (2014), “Family management and profitabilityin private family-owned firms: introducing generational stage and the socio emotional wealthperspective”, Journal of Family Business Strategy, Vol. 5 No. 2, pp. 131-137.

18 Orissa Journal of Commerce, Volume XXXXI, April- June-2020, Issue No-II
• Shanker, M. C., and Astrachan, J. H. (1996), “Myths and realities: Family businesses’ contributionto the US economy–A framework for assessing family business statistics”, Family BusinessReview, Vol. 9 No. 2, pp. 107- 123.
• Sharma, P. (2004), “An overview of the field of family business studies: Current status anddirections for the future”, Family Business Review, Vol. 17 No. 1, pp. 1–36.
• Simpson, M., Tuck, N. and Bellamy, S. (2004), “Small business success factors: the role ofeducation and training”, Education + Training, Vol. 46 No. 8/9, pp. 481-91.
• Stone, M. (1979), “Comments on model selection criteria of Akaike and Schwarz”, Journal ofthe Royal Statistical Society, Vol. 41, pp.276–278.
• Swoboda, B., and Olejnik, E. (2013), “A taxonomy of small- and medium-sized internationalfamily firms”, Journal of International Entrepreneurship, Vol. 11 No. 2, pp. 130-157.
• US Small Business Administration (2010), “Analysis of Small Business & Jobs”, accessed athttps://www.sba.gov/ sites/default/files/files/an%20analysis%20of%20small%20business%20and%20jobs.pdf (accessed on 11th Feb. 2019).
• Viswanathan, K.G. (2014), “State-owned, family-owned and publicly-owned firms in India:financial and operating performance and characteristics”, Proceedings for the Northeast RegionDecision Sciences Institute (NEDSI), Philadelphia, PA, 679-687.
• Vozikis, G. S., Weaver, K. M., and Liguori, E. W. (2013), “Do family cohesion and familymember skill evaluation affect family business internal or external hiring decisions?”, Journalof Management Policy and Practice, Vol. 14 No. 1, pp. 75-89.
• Wagner, D. P., Block, J., Miller, D., Schwens, C., and Xi, G. (2015), “A meta-analysis of thefinancial performance of family firms: Another attempt”, Journal of Family Business Strategy,Vol. 6, pp. 3-13.
• Walker, E. and Brown, A. (2004), “What success factors are important to small businessowners?”, International Small Business Journal, Vol. 22 No. 6, pp. 577-94.
• Wang, G. C. S. and Akabay, C. K. (1994), “Heteroscedasticity: How to handle in regressionmodeling”, The Journal of Business Forecasting Methods & Systems, Vol. 13 No. 2, pp. 11-17. Retrieved from https://search.proquest.com/docview/226926246?accountid=34791.

19Orissa Journal of Commerce, Volume XXXXI, April- June-2020, Issue No-II
Performance of the Indian Tourism and HospitalityStocks during the 2019-nCoV Outbreak - An Event
Study using Stocks Listed on the NSEDr. Dharen Kumar Pandey1 & Smt. Vineeta Kumari2
ABSTRACTWith a sample of 25 NSE listed stocks of the Indian tourism and hospitality industry using the
event study methodology the hypothesis that “the 2019-nCoV outbreak had no impact on the stockprices of the tourism and hospitality industry” has been tested. The study evidence that the averageabnormal returns (AARs), cumulative average abnormal returns (CAARs) and cumulative abnormalreturns (CARs) are negative and significant for the long and the shorter event windows inferring thatthe global pandemic has significantly impacted the performance of the stocks of the Indian tourism andhospitality industry.
Keywords: Event study, abnormal returns, market model, global pandemic.
IntroductionThe 2019-nCoV outbreak was not an anticipated one. Had it been so, it could not have done much
harm to the society and the economy. Great economies failed to sustain its ill effects. Being a disease ofeasy human transmission, it taught the world the lessons of good hygiene and social distancing. Peoplewere forced to remain in their houses. A long holiday, indeed but no tour plan. The anticipated incomesof the tourism and hospitality industry went in vain. Almost all the industries have been worst hit butthis industry will remain affected for time till the outbreak is permanently contained. Not only domesticbut also international tourism has been hit hard. Be it a pilgrim or season’s celebration, a birthday, or ananniversary, the people were forced to celebrate it at home. Previous outbreaks including the SARShave affected a certain portion of the world but the 2019-nCoV outbreak has affected the whole world.The impact on a certain industry could be assessed by the performance of the stocks of that particularindustry. The value of the stocks expressed in terms of the returns provides a basis for the interpretationof the degree of impact on that industry. We move forward to record the evidence of the outbreakaffecting the returns of the tourism and hospitality industry using the event study methodology.
1. (Corresponding author) Assistant Professor, P.G. Department of Commerce, Magadh University, Bodh Gaya, Bihar, India-824234Email: [email protected] Mobile: 8170080042
2. Assistant Professor, P.G. Department of Commerce, Magadh University, Bodh Gaya, Bihar, India-824234 Email:[email protected] Mobile: 8709744046

20 Orissa Journal of Commerce, Volume XXXXI, April- June-2020, Issue No-II
Pandey & Kumari (2020) discussed some literature relevant to event study methodologies in theirunpublished paper wherein they studied the impact of the 2019-nCoV outbreak on the stock markets inthe developed and emerging nations. They found that the studies conducted by Dimson (1979), Brown& Warner (1980 & 1985), Dyckman, et. al. (1984), Corrado (1989), Boehmer, et. al. (1991), Cowan(1992), Corrado&Zivney (1992), Campbell &Wasley (1993), Park (2004), Kolari &Pynnonen (2010 &2011), Luoma&Pynonnen (2010), Ataullah, Song &Tippett (2011), Luoma (2011) and Dutta (2014)deals with the event study methodologies while providing evidence of best parametric and non-parametrictest statistics. The review of the above literature provides the basis for conducting this event study. Wereview only the literature relevant to this study. A few numbers of researches have been conducted tostudy how such outbreaks affect the tourism and hospitality industry. Henderson & Ng (2004) conducteda study on the impacts of SARS on the hotel industry in Singapore and how managements react to it.They conclude that disasters are inevitable and will continue to occur but the world needs to be prepared.Pine & McKercher (2004) studied the impact of SARS on the tourism industry in Hong Kong andconcluded that the tourism industry around the world has been badly hit by way of a decrease in personaland business travels as well as a reduction in capital investments. Chen, Jang & Kim (2007) used theevent study method to study the impacts of SARS on the performance of the Taiwanese hotel stocksand found significant negative cumulative abnormal returns on and around the SARS outbreak. Chen,et. al. (2009) studied the impacts of SARS on the Taiwanese industries using the event study methodwith the GARCH process and concluded that the outbreak had negatively impacted the tourism, retailand wholesale industry. Min, Lim & Kung (2010) analyzed the impacts of SARS on Japanese inboundtourism using an intervention model with SARIMA to conclude that Japanese inbound tourism hasbeen worst hit by the SARS outbreak during the first 5 months.Donadelli, Kizys& Riedel (2017) collectedthe data of 102 NYSE listed pharmaceutical companies during dangerous disease outbreaks and studiedthe impact on investor’s behaviorto conclude that “although the disease spread is bad news for themainstream, some of the market traders make it a good news using profitable trading strategies to getsignificant positive returns”. Kim et. al. (2020) examined how the food-related epidemics impacted thefinancial performance of restaurants using the event study method to conclude that the epidemics havea negative impact on the restaurant industry.
Although a few studies are available in respect of impacts of disease outbreaks on the tourism andhospitality industry, they claim that such outbreaks negatively impact this industry. The studies arefocused on the impacts of the SARS on the Asian tourism industry because only a few nations wereaffected by the outbreak. However, unexpectedly the 2019-nCoV outbreak has spread all over the worldforcing the workforce and development mechanisms to pause. Not only tourism and hospitality butalmost every industry has been hit by the outbreak. A series of lockdowns and travel restrictions haveimpacted the tourism and hospitality industry but to trace the abnormality of such impacts, statisticalinferences are necessary. A timely study on the impacts of 2019-nCoV outbreak will not only providethe actual impact on the stocks of this industry but also help management to plan for future unexpectedoutbreaks. An event study is anticipated to add to the literature of tourism as well as finance.
Objectivesand Research MethodologyObjectives of the study: The study aims to examine the impacts of the 2019-nCoV outbreak on
the performance of the stocks of the tourism and hospitality industry in India. The null hypothesis that

21Orissa Journal of Commerce, Volume XXXXI, April- June-2020, Issue No-II
“the 2019-nCoV outbreak had no impact on the stock prices of the tourism and hospitality industry”will be tested to conclude whether or not the outbreak has impacted the performance of theIndian tourismand hospitality industry stocks.
Sample construction: The initial sample for the study consisted of 29 stocks from the tourism,hospitality, and tourism finance. Out of these, two companies were not listed on the NSE and sufficientdata was not available for two other companies which were listed just a few months before the event.The final sample consisted of 25 stocks from the tourism and hospitality industry. The list of samplestocks is provided in table 1.
Table: List of Sample Stocks
Table: List of Sample Stocks Sl. No. Name NSE Code 1 India Tourism Development Corporation Ltd ITDC 2 Tourism Finance Corporation India Ltd TFCILTD 3 Cox & Kings Ltd COX&KINGS 4 Thomas Cook (India)Ltd THOMASCOOK 5 BLS International Services Ltd BLS 6 Wonderla Holidays Ltd WONDERLA 7 Country Club Hospitality & Holidays Ltd CCHHL 8 Mahindra Holidays & Resorts India Ltd MHRIL 9 The Byke Hospitality Ltd BYKE 10 Taj GVK Hotels & Resorts Ltd TAJGVK 11 EIH Associated Hotels Limited EIHAHOTELS 12 Lemon Tree Hotels Ltd LEMONTREE 13 Asian Hotels (EAST) Ltd AHLEAST 14 Asian Hotels (WEST) Ltd AHLWEST 15 TGB Banquets & Hotels Ltd TGBHOTELS 16 EIH Ltd EIHOTEL 17 Kamat Hotels (I) Ltd KAMATHOTEL 18 Chalet Hotels Ltd CHALET 19 Apollo Sindoori Hotels Ltd APOLSINHOT 20 Viceroy Hotels Ltd VICEROY 21 Asian Hotels (NORTH) Ltd ASIANHOTNR 22 Royal Orchid Hotels Ltd ROHLTD 23 The India Hotels Company Ltd INDHOTEL 24 Advani Hotels & Resorts (India) Ltd ADVANIHOTR 25 Oriental Hotels Ltd ORIENTHOT

22 Orissa Journal of Commerce, Volume XXXXI, April- June-2020, Issue No-II
Event Date and Estimation Period: The event for this study is the declaration made by the WHOon 11th March, 2020. The WHO declared the 2019-nCoV outbreak as a global pandemic on this date.Hence, this is the event for our study. The effective date of the announcement has been adjusted to 12th
March 2020 because, by the time the declaration was made on 11th March 2020, the Indian stock marketwas already closed. So the event date (t) is 12th March, 2020 for our study. The event window beginsfrom (t-30)th day and ends on (t+30)th day. A 120-days estimation window has been taken for this study.A pictorial view of the event timeline is provided in figure 1.
Figure 1: Timeline of the event
Estimation of normal returns:The estimation of normal returns is very essential for calculatingabnormal returns. The normal return may be defined as such return which would have been yielded ifthe event had not occurred. There are many methods available for the estimation of normal returns.Dyckman, Philbrick & Stephan (1984) recommend the Ordinary Least Squares market model for betterresults. Hence,the normal returns are estimated using the Ordinary Least Squaresmarket model. For themarket return we chose NIFTY. The normal return is estimated with the following equation:
Where,ERstis the estimated normal return of the stock s on day t.á&â are intercept and slope coefficients of the OLS modelRmt is the benchmark return (NIFTY) on day t.The alpha and beta coefficient are calculated from the regression of the data available for the 120
days from t-150 to t-31.Daily abnormal returns: The daily abnormal return refers to the abnormal behavior of the stock
returns as compared to the market reaction. It is assumed that the stocks should behave similar to themarket based on its previous beta values. Any abnormal fluctuations mean the presence of abnormality.The daily returns are required to be calculated first. We use the log returns for this purpose. The dailylog returns are calculated with the help of MS-excel. The daily abnormal return is calculated as below:

23Orissa Journal of Commerce, Volume XXXXI, April- June-2020, Issue No-II
Where,ARstis the abnormal return on stock s on day t;ERstis the normal return as per eq. (i) above, and,Rstis the actual return (log returns) on stock s on day t.Average and cumulative average abnormal returns:We aggregate the abnormal returns of each
sample stocks on each of the days in the event window to arrive at the total abnormal return for eachday. The same is then divided by the sample size (N) to get the average abnormal return. The followingequation is used for calculating the average abnormal return:
Where,AARtdenotes the average abnormal return on day t, and,N is the number of stocks.These AARs becomes the basis for calculating the cumulative AARs for the event window.Test for significance: The calculated AARs and the CAARs need to be tested for their significance
to accept or reject the null hypothesis.We use the test-statistics used by Brown & Warner (1980 &1985). For this purpose, the standard deviation of the AARs for the estimation window of each of thestocks is calculated and the same is aggregated for the entire sample. The aggregated estimation windowstandard deviation is arrived as follows:
Where, σs,e is the estimation window standard deviation for stock s.
Once the aggregate estimation window standard deviation is calculated, the t-statistics are calculatedas below:
Similarly, the t-statistics for CAARs is calculated as:

24 Orissa Journal of Commerce, Volume XXXXI, April- June-2020, Issue No-II
Where,tAARtandtCAARtare the test statistics for AARs and CAARs on day tNt+1denotes the absolute value (ignores the -ve sign) of event day t plus 1Further, we use the Corradorank test statistic, a non-parametric test, developed by Corrado (1989)
as modified by Ataullah, Song & Tippet (2011). The simplified equation is as below:
........................eq.(vii)
Where,N is the sample size
T is the total number of ARs for the stock(in our case, it is 181)K(ARst) is the rank of the AR of the stock s in the 181 daysWe also use the Ataullah, Song & Tippet (2011) modified Corrado equation for measuring the
t-statistics for the CARs of shorter event windows as below:
................ eq.(viii)
Where,K(CARstM) is the sum of the K(ARst) for the period MM is the no of days in the Event Window
Interpreting the empirical results:We use the calculated test statistics for interpreting the significantimpact on the stock performance. The significance is tested at 1% and 5%. If the critical value of thetest statistics is higher than the calculated value (absolute value), the abnormal returns are not significant.The critical values for a degree of freedom of 24 for the sample size 25 are 2.797 and 2.063 at 1% and5% level respectively. Further, if the abnormal returns are negative and the respective test statistics aresignificant, it may indicate that the performance of the stocks is negatively and significantly impactedby the event.
Quantitative AnalysisThis section covers the analysis of the sample data obtained from the NSE website for the study
period. A total of 4525 observations of daily returns across 25 stocks are available for analysis. Dyckman,Philbrick & Stephan (1984) compared various event study methodologies and concluded that abnormaldata do not have any effect on the conclusions made on the basis of the t-test. Their results arecongruentwith Brown & Warner (1984). So we do not test the normality of the data and proceed towardsdata analysis. The data has been processed in the MS-excel for calculating the AARs, CAARs, and thetest statistics.
The AARs and CAARs for the entire event window of 61 days are presented in table 2. It can beseen that a total of 24 negative AARs are present in the pre-event day window while only 14 negative

25Orissa Journal of Commerce, Volume XXXXI, April- June-2020, Issue No-II
AARs are present in the post-event day window. The AAR on the event day is also negative. The AARsare negative throughout the period t-11 to t+1. Negative CAARs are noticed on all the days during theevent window except on t-21. The presence of negative AARs and CAARs indicate some abnormalityin the daily returns of the stocks in the Indian tourism and hospitality industry.
Table 2: AARs and CAARs during the event window
Days AARs CAARs Days AARs CAARs t-30 -0.005 -0.005 t -0.032 -0.185 t-29 -0.005 -0.010 t+1 -0.041 -0.226 t-28 -0.001 -0.011 t+2 0.007 -0.219 t-27 -0.007 -0.019 t+3 -0.016 -0.235 t-26 -0.014 -0.033 t+4 -0.014 -0.249 t-25 -0.002 -0.035 t+5 -0.035 -0.284 t-24 0.001 -0.034 t+6 -0.003 -0.287 t-23 0.006 -0.027 t+7 0.002 -0.286 t-22 0.009 -0.018 t+8 -0.020 -0.305 t-21 0.026 0.008 t+9 -0.035 -0.340 t-20 -0.013 -0.005 t+10 0.009 -0.331 t-19 -0.021 -0.025 t+11 0.010 -0.321 t-18 -0.009 -0.035 t+12 0.003 -0.318 t-17 -0.003 -0.038 t+13 0.003 -0.315 t-16 -0.003 -0.040 t+14 0.038 -0.277 t-15 -0.009 -0.049 t+15 0.014 -0.264 t-14 -0.006 -0.055 t+16 -0.045 -0.308 t-13 0.018 -0.038 t+17 0.034 -0.275 t-12 0.008 -0.029 t+18 -0.002 -0.276 t-11 -0.009 -0.038 t+19 0.018 -0.259 t-10 -0.009 -0.047 t+20 0.027 -0.232 t-9 -0.014 -0.061 t+21 0.012 -0.220 t-8 -0.013 -0.074 t+22 0.005 -0.216 t-7 -0.011 -0.085 t+23 0.008 -0.208 t-6 -0.007 -0.092 t+24 0.007 -0.201 t-5 -0.023 -0.115 t+25 -0.013 -0.213 t-4 -0.010 -0.125 t+26 0.021 -0.193 t-3 -0.010 -0.135 t+27 -0.021 -0.214 t-2 -0.010 -0.145 t+28 -0.022 -0.237 t-1 -0.007 -0.152 t+29 -0.007 -0.244 T -0.032 -0.185 t+30 -0.006 -0.250
Source: Author’s calculation in MS-excel

26 Orissa Journal of Commerce, Volume XXXXI, April- June-2020, Issue No-II
The graphical representation of these AARs and CAARs has been provided in figure2. The trendof CAARs is seen moving steeply downwards from the (t-12)th day with a recovery on (t+12)th day butagain a sharp downward trend from (t+26)th day. The R2 value of the trend-line is 0.98 which indicatesthat it almost accurately predicts the trend of the CAARs. The trend shows negative CAARs for theentire event window period indicating that the performance of the stocks of the Indian tourism andhospitality industry has been negatively impacted. However, this negative impact must be tested forsignificance.
Figure 2: AARs and CAARs in the event window
Source: Based on the author’s calculation in MS-excel
The analysis of the AARs and CAARs indicated a negative impact but its significance is yet to betested. Table 3 presents the test statistics (as in Brown & Warner, 1980 & 1985) and the Corrado teststatistics for all the days through the event window. During the pre-event day period 6 AARs (3 each at1% and 5% level) and 10 CAARs (2 at 5% level and 8 at 1% level) are found significant. During thepost-event day period 15 AARs (4 at 5% level and 11 at 1% level) are significant while all the CAARs(3 at 5% level and 27 at 1% level) are significant for this period.The event day AAR and CAAR arealso significant at a 1% level. The table also depicts that 2 pre-event day AARs and 6 post-event dayAARs are positive as well as significant. The Corrado test statistics indicate 5 significant CARs (2 at5% level and 3 at 1% level) in the pre-event day period and 10 significant CARs (all at 1% level) in thepost-event day period. The Corrado test statistics indicate significant CAR at a 5% level on the eventday also. The negative and significant CAARs through the days t-10 to t+30 indicate that the 2019-nCoV outbreak being declared as a global pandemic has negatively impact the performance of thestocks of the Indian tourism and hospitality industry. The results are similar to Chen, Jang & Kim(2007), and Chen, et. al.(2009).

27Orissa Journal of Commerce, Volume XXXXI, April- June-2020, Issue No-II
Table 3: Test statistics for all the days during the event window period
Days tAAR tCAAR tCorrado Days tAAR tCAAR tCorrado t-30 -0.828 -0.149 0.815 t -4.998** -28.582** 2.147* t-29 -0.737 -0.286 0.869 t+1 -6.415** -24.746** 2.986** t-28 -0.209 -0.330 -0.299 t+2 1.034 -19.608** -0.295 t-27 -1.092 -0.542 1.179 t+3 -2.423* -18.193** 1.225 t-26 -2.216* -0.978 2.622* t+4 -2.213* -17.262** 1.053 t-25 -0.266 -1.049 1.171 t+5 -5.389** -17.958** 4.134** t-24 0.145 -1.041 0.191 t+6 -0.479 -16.807** 0.279 t-23 0.987 -0.861 -1.424 t+7 0.267 -15.627** 0.456 t-22 1.413 -0.585 -0.662 t+8 -3.025** -15.741** 1.478 t-21 4.098** 0.276 -1.822 t+9 -5.401** -16.642** 2.729** t-20 -2.012 -0.157 1.788 t+10 1.399 -15.446** -0.348 t-19 -3.206** -0.878 3.292** t+11 1.596 -14.327** -1.424 t-18 -1.419 -1.226 1.776 t+12 0.442 -13.643** -1.210 t-17 -0.474 -1.371 0.528 t+13 0.389 -13.043** 0.586 t-16 -0.446 -1.519 0.777 t+14 5.887** -11.080** -4.195** t-15 -1.378 -1.910 1.374 t+15 2.096* -10.205** -1.554 t-14 -0.907 -2.207 0.011 t+16 -6.896** -11.573** 4.628** t-13 2.732* -1.555 -2.140* t+17 5.224** -10.015** -4.272** t-12 1.294 -1.254 -0.727 t+18 -0.255 -9.807** 1.060 t-11 -1.398 -1.709 0.945 t+19 2.717* -8.951** -1.405 t-10 -1.355 -2.194* 1.221 t+20 4.127** -7.834** -3.074** t-9 -2.149* -2.980** 3.016** t+21 1.800 -7.270* -0.643 t-8 -2.061 -3.829** 1.298 t+22 0.702 -6.964** -1.060 t-7 -1.659 -4.647** 0.896 t+23 1.204 -6.572** -1.221 t-6 -1.143 -5.400* 1.382 t+24 1.104 -6.218** -0.272 t-5 -3.571** -7.291** 3.816** t+25 -1.945 -6.479** 2.033 t-4 -1.506 -8.660** 1.566 t+26 3.184** -5.745* -2.963** t-3 -1.581 -10.473** 1.194 t+27 -3.310** -6.267** 3.437** t-2 -1.563 -12.996** 0.574 t+28 -3.475** -6.803** 3.977** t-1 -1.074 -16.676** 0.509 t+29 -1.095 -6.889** 1.631 t -4.998** -28.582** 2.147* t+30 -0.945 -6.947* 1.876
*Significant at 5% level **Significant at 1% level
Source: Author’s calculation in MS-excel

28 Orissa Journal of Commerce, Volume XXXXI, April- June-2020, Issue No-II
The analysis of the shorter event window periods may reflect results that may strongly evidencethe inferences drawn by the event window period of 61 days. Table 4 presents the test statistics ofAARs, CAARs, and Corrado (modified) test statistics for CARs around the event day. We have calculatedthese test statistics for -1 to +1, -3 to +3, and -7 to +7 event windows. It is noticed that the AARs,CAARs, and CARs for all the three shorter event windows are significant. Although the AARs for 15days and 7 day’s event window are found to be significant at a 5% level, the rest of the figures aresignificant at 1% level. The AARs and CAARs for all three event windows are negative. Negative andsignificant figures indicate that the event has significantly impacted the stock performance of the Indiantourism and hospitality industry and the impact is negative, too.
Table 4: AARs and CAARs around Event Day
Window Period AAR CAAR tAAR tCAAR tCor(modified)
-7 to +7 -0.014 -0.211 -2.181* -8.447** 27.74** -3 to +3 -0.016 -0.110 -2.432* -6.433** 14.744** -1 to +1 -0.027 -0.081 -4.162** -7.209** -85.572** *Significant at 5% level **Significant at 1% level
Source: Author’s calculation in MS-excel
ConclusionsThe analysis of the AARs, CAARs, and CARs for both longer (61 days) and the shorter (3 days, 7
days & 15 days) event windows reveal that the stocks of the Indian tourism and hospitality industryhave been significantly impacted by the global pandemic. The news of the 2019-nCoV outbreak beingdeclared as a global pandemic led to a series of lockdowns and travel restrictions all over the worldcreating a crisis for the tourism and hospitality industry. With no clear predictions about the end of thispandemic, the shareholders are uncertain about the revival of this industry-leading to low confidence inthe stocks of the tourism and hospitality industry. The Brown & Warner (1980 & 1985) test statistic,Corrado rank test statistics, and the Ataullah, Song & Tippet (2011)-modified Corrado rank test statisticsare statistically significant indicating the presence of significant AARs, CAARs and CARs during theevent window. This study provides evidence that the 2019-nCoV outbreak being declared as a globalpandemic has had a significant negative impact on the performance of the Indian tourism and hospitalityindustry stocks. The weak market sentiments as a result of the uncertainty regarding the revival haveresulted in such performance.
Implications and Limitations of the StudyThere is a lack of event study on the impacts of epidemics on the stocks of the Indian tourism and
hospitality industry. Although a few event studies have been conducted in respect of the tourism andhospitality industry in the Asia region, they are a decade old. We anticipate that this study will add tothe literature of the event study methodologies as well as the literature of tourism and hospitalitydiscipline. The study will help the management understand the reactions of the shareholders/investorsduring such outbreaks. The study may possess some limitations as the normality of data has not been

29Orissa Journal of Commerce, Volume XXXXI, April- June-2020, Issue No-II
assessed but the use of both parametric and non-parametric tests eliminates the misinterpretation of thesignificance. Further, we could not do an event study on the impacts of the outbreak on the globaltourism industry. Hence, future research may be conducted to study the impact on the global tourismand hospitality industry as the outbreak has impacted the whole world.
References• Ataullah, A., Song, X., &Tippett, M. (2011). “A modified Corrado test for assessing abnormal
security returns”. The European Journal of Finance, 17(7): pp 589-601. Retrieved from http://dx.doi.org/10.1080/1351847X.2011.554294
• Boehmer, E, Masumeci, J., & Poulsen, A. B. (1991). “Event study methodology under conditionsof event-induced variance.” Journal of Financial Economics, 30 (2): pp 253-272. Retrievedfrom https://doi.org/10.1016/0304-405X(91)90032-F
• Brown, S. J., & Warner, J. B. (1980). “Measuring security price performance. Journal ofFinancial Economics, 8(3), 205–258. Retrieved from http://citeseerx.ist.psu.edu/viewdoc/download?doi=10.1.1.553.4024&rep=rep1&type=pdf
• Brown, S. J., & Warner, J. B. (1985). Using daily stock returns, the case of event studies.”Journal of Financial Economics, 14(1): pp 3–31. Retrieved from http://leeds-faculty.colorado.edu/bhagat/brownwarner1985.pdf
• Campbell C. J. & Wesley, C. E. (1993). “Measuring Security Price performance using dailyNASDAQ returns.” Journal of Financial economics, 33(1): pp 73-92. Retrieved from https://econpapers.repec.org/scripts/redir.pf?u=http%3A%2F%2Fwww.sciencedirect.com%2Fscience%2Farticle%2Fpii%2F0304-405X%2893%2990025-7;h=repec:eee:jfinec:v:33:y:1993:i:1:p:73-92
• Campbell, J. Y., Lo, A. W., &MacKinlay, A.C. (1997). “The Econometrics of Financial Markets.”Princeton University Press. Available online at: https://www.nrc.gov/docs/ML1208/ML12088A329.pdf
• Chen, et. al. (2009). “The Positive and Negative Impacts of the Sars Outbreak: A Case of theTaiwan Industries.” The Journal of Developing Areas, 43(1)” pp 281-293. Retrieved fromhttps://www.jstor.org/stable/40376284
• Chen, M., Jang, S., Kim, W. G. (2007). “The impact of the SARS outbreak on Taiwanesehotel stock performance: An event-study approach.” Hospitality Management, 26: pp 200-212. Retrieved from https://scihub.bban.top/https://doi.org/10.1016/j.ijhm.2005.11.004
• Corrado, C. J. (1989). “A Nonparametric Test for Abnormal Security-price Performance inEvent Studies.” Journal of Financial Economics, 23: pp 385–95. Retrieved from https://doi.org/10.1016/0304-405X(89)90064-0
• Corrado, C. J., &Zivney, T. L. (1992). “The Specification and Power of the Sign Test in EventStudy Hypothesis Tests Using Daily Stock Returns.” Journal of Financial and QuantitativeAnalysis, 27: pp 465–78. DOI: 10.2307/2331331
• Cowan, A. R. (1992). “Nonparametric event study tests.” Review of Quantitative Finance andAccounting, 2: pp 343-358. Retrieved from https://doi.org/10.1007/BF00939016

30 Orissa Journal of Commerce, Volume XXXXI, April- June-2020, Issue No-II
• Dash, S. D., &Bagha, P. (2017). “Impact of Demonetization on Stock Price Movements inBanking Sector of India.” International Journal of Research and Scientific Innovation, IV(VIIS):pp 33-36. Retrieved from https://www.rsisinternational.org/IJRSI/Issue44/33-36.pdf
• Dimson, E. (1979). “Risk measurement when shares are subject to infrequent trading.” Journalof Financial Economtcs, 7: pp 197-226. Retrieved from https://doi.org/10.1016/0304-405X(79)90013-8
• Donadelli, M., Kizys, R. & Riedel, M. (2017). “Dangerous infectious diseases: Bad news forMain Street, good news for Wall Street?.” Journal of Financial Markets, 35: pp 84 – 103.R e t r i e v e d f r o m h t t p s : / / r e s e a r c h p o r t a l . p o r t . a c . u k / p o r t a l / f i l e s / 6 5 1 9 5 2 5 /Dangerous_infectious_diseases.pdf
• Dutta, A. (2014). “Parametric and Nonparametric Event Study Tests: A Review.” InternationalBusiness Research, 7(12): pp 136-142. Retrieved from http://www.ccsenet.org/journal/index.php/ibr/article/download/38913/23293
• Dyckman, T., Philbrick, D., & Stephan, J. (1984). “A Comparison of Event Study MethodologiesUsing Daily Stock Returns: A Simulation Approach.” Journal of Accounting Research, 22: pp1-30. Retrieved from http://dx.doi.org/10.2307/2490855
• Kim et. al. (2020). “Effects of epidemic disease outbreaks on financial performance of restaurants:Event study method approach.” Journal of Hospitality and Tourism Management, 43: pp 32-41. Retrieved from https://scihub.bban.top/https://doi.org/10.1016/j.jhtm.2020.01.015
• Kolari, J. W., &Pynnonen, S. (2010). “Event Study Testing with Cross-sectional Correlationof Abnormal Returns.”The Review of Financial Studies, 23(11): pp 3996-4025. Retrievedfrom https://doi.org/10.1093/rfs/hhq072
• Kolari, J. W., &Pynnonen, S. (2011). “Nonparametric rank tests for event studies.” Journal ofEmpirical Finance, 18(5): pp 953-971. Retrieved from https://doi.org/10.1016/j.jempfin.2011.08.003
• Kothari, S. P. & Warner, J. B. (2006). “Econometrics of Event Studies.” Retrieved from http://www.bu.edu/econ/files/2011/01/KothariWarner2.pdf
• Luoma, T. (2011). “Nonparametric Event Study Tests for Testing Cumulative Abnormal Returns.”Vaasa: Vaasanyliopisto. Retrieved from https://www.univaasa.fi/materiaali/pdf/isbn_978-952-476-372-1.pdf
• McKercher, B., & Chon, K. (2004). “The Over-Reaction to SARS and the Collapse of AsianTourism.” Annals of Tourism Research, 31(3): pp 716–719. Retrieved from https://www.ncbi.nlm.nih.gov/pmc/articles/PMC7148758/
• Pandey, D., K., & Kumari, V. (2020). “Event study on the reaction of the developed andemerging stock markets to the 2019-nCoV outbreak.” Unpublished work. Magadh University,Bodh Gaya, Bihar.
• Park, N. K. (2004). “A Guide to using event study methods in multi-country settings.” StrategicManagement Journal, 25(7): pp 655-668. Retrieved from https://doi.org/10.1002/smj.399

31Orissa Journal of Commerce, Volume XXXXI, April- June-2020, Issue No-II
ABSTRACTBehavioral finance deals with what goes in the mind of a person whenever he takes an investment
decision.Individuals’ investments in various financial assets are based on a number of informationsources that include financial advisors, family, friends and the strategies adopted by him to invest.However, investorsmay over emphasize or discount information that may lead to wrong investmentstrategies and irrationality while investing. Irrationality is a bias, which affects an investor while takinginvestment decisions. Although the established finance theory assumes that investors are well informedand careful and have little difficulty in making financial decisions, it is usually not the case as investorsare affected by various biases while investing. The paper attempts to relate the investment strategiesadopted by respondents with the herding, anchoring, regret aversion and loss aversion biases. Usingprimary data, from 63 investors across the state of Goa and statistical tools such as Correlation, Analysisof variance test and Independent T-test, the relationship between investment strategies, the sociodemographic factors-annual income, gender and biases is studied. The Analysis found correlationbetween anchoring bias and investment strategy score. With an exception of herding bias, the remainingthree biases tested significant,confirming the existence of relationship between anchoring, regret aversionand loss aversion bias with annual income. There exist no significant difference in gender and thestudied biases.
Keywords: behavioral bias; individual investors; investment strategies; demographic factors.
IntroductionEvery investor considers information for his investment decision from varied sources. Irrationality
may occur due to misunderstanding of information or wrong interpretation with inconsistent investmentdecisions. Behavioural finance focuses on how an investor understands and takes steps based on the
1. Professor and Head, Department of Commerce, Rosary College of Commerce & Arts, Navelim,Salcete- Goa. [email protected]; 9421247421
2. Assistant Professor and Research Scholar, Department of Commerce, Rosary College of Commerce& Arts, Navelim, Salcete- Goa. [email protected]; 9765323167
An Empirical Study on Investment Strategies andBehavioral Biases of Individual Investors in Goa
Dr. Juao Costa1 & Ms Ancy Gonsalves2
32 Orissa Journal of Commerce, Volume XXXXI, April- June-2020, Issue No-II
information to make an informed investment decision, so while taking this decision he may not alwaysact rational and unbiased. Even though traditional finance assumes that people, institutions, and evenmarkets act rationally, it may not be so, as the investorsare influenced by his behavioural traits andpreferences while making investment decisions.
The manner in which an investor reacts to the information available to him and the decision hetakes, can be applied to stereo type him based on many well established behavioural biases. These arethe biases that investors may show in spite of full information available to them that may lead to marketsbeing inefficient. Even though every participant has the information, the participant may not take thesame decision as other market participants and this is exactly where personal biases and behaviour ofindividual investors affect the market efficiency.
Behavioural finance theories attemptto explain the behavioural aspects of investment decisions,the selections made under risk and uncertainty. While observing the investor’s investment behaviour, itwas found that most of the investment decisions are done doubtfully and with difficulty.The need tosimplify the decision making process through a clear understanding of the irrationalities and biases thatshape the behavioural dimensions in investment decisions was found necessary (Hayat, 2016). Awan(2019) discussed about investors using fundamental analysis, technical analysis and tracking marketopinions to arrive at investment decisions. However, many investors use one or all to enhance optimumdecision making but the usage will depend on goals and objectives for investments.
The present study considers four different behavioural biases to study the relationship betweeninvestment strategies and socio demographic factors. These behavioural biases are Herding bias,Anchoring Bias, Regret aversion Bias and Loss Aversion Bias.
Herding is an investment information source as often investors look at friends and family whiletaking financial investment decisions. However one of the effects considered occurring from herdbehaviour is the stagnation of information accumulation (Tuominen, 2016). However, Topol (1991)explained that to gain some more information, it is rational for the investor to adjust his prices to someother agent’s prices which may contain information which is not yet available to him. Informationneeds are the prime reasons why an investor would decide to herd.
Anchoring bias happens when an investor will constantly compare the current price of the investmentto the reference point to determine if he is in profit or loss. Also an investor may hold a reference pointbased on information from unofficial sources (Singh 2012) and not on company’s historical data (Kaustia,Alho, & Puttonen, 2008)
Regret aversion bias is investor’s anticipating regret if they make a wrong choice and they take thisanticipation into consideration when making decisionsGanesan(2013). This bias also looks into sentimentthat an investor may experience due to wrong purchase decision. So, when his investments are intolosses he still holds on to them so as to evade the awkwardness of reporting a loss(Pareto, 2020) and(Jagongo & Mutswenje 2014).
Loss Aversion Bias is wherein an investor considers gains from investments more than losses, andtherefore while taking investment decision he considers the arising gains as more significant than thearising losses. If an investor is given two alternatives, both being alike, presented as possible gains andother possible losses; the possible gains will be considered by the investor.The Prospect theory

33Orissa Journal of Commerce, Volume XXXXI, April- June-2020, Issue No-II
(Kahneman & Tversky, 1979) relates to an individual’s strong desire to avoid losing rather than longingfor making gains. The pain of losing money is felt more than the gain of same amount.
Review of LiteratureIndividual investors have different background, experience and motives while investing. Based on
the influence of many human attributes individual investments are emotional, fast and automatic(Charles&Kasilingan, 2016). Given the varied and diverse background of individual investors, exploringthe predictability of decision behavioursusing demographic characteristicsin different decision stages,the need to potentially value investor behavior exists(Lan, Xiong, He, & Ma, 2018).Besides, investorsentiment, overreaction and under reaction, over confidence and herd behaviour also significantly affectinvestment decisions.(Hassan et al., 2018)
Scharfstein & Stein (1988)analysed the forces that lead to herd behaviour wherein he found thatmanagers/investors who care about their reputation will herd whereas those who care about profits willnot. A study by Baddeley (2010) found that the influence to use the same investments as other investorsis due to purpose and sentiments. Herding financial decision-making reflects a societal learning methodwhich is influenced sentiments.Prosad, Kapoor, & Sengupta, (2012) using secondary data, found herdingbeing prominent in the Indian stock market especially during the bullish phase but not during the bearishphase. Alquraan, Alqisie, & Al Shorafa (2016)investigated the factors of investment decision makingand concluded that Risk Perception,Loss Averse and Overconfidence are relevant on investment decisionmaking.
Anchoring is the most researched bias. Every investor has a price in mind before making aninvestment decision. To understanding the role of anchoring bias in investment decisions a number ofstudies are available.(Zaiane 2015) and (Saraswati 2015), found positive linear connection betweenanchoring bias andfinancial decision making. Studies foundthe anchoring bias affect investmentdecisions, and were solely determined by years of experience as an investor(Usman, Muturi, & Memba,2017) and (Dolreen, 2014). (Cen, Hilary, & Wei, 2013) and (Fernandes, Matsumoto, Chagas, & Ferreira,2014) found anchoring bias affecting investment decision making.Jahanmiri(2018) studied informationand anchoring bias, found with an increase in information uncertainty, investors make greater use ofanchoring in decisions about buying and selling and investing in the stock. Studies on regret aversionand investment decisions reveal in certain cases, respondents are not influenced by this bias. (Sukamulja,Meilita, & Senoputri, 2019) and(Kumar, Samir, Barua, Jacob, & Varma, 2013).
Every investor is skeptical about the loss arising from an investment more than the gain from thesame investment, making him extremely averse to losses (Isidore R & Christie, 2019). Polman(2012)conducted an investigative study, to find whether individual’s choices for decision making for self andfor other differ. Using loss aversion as the measure for decision making, found when decisions aretaken for other, this bias lessened.However, few studies have shown investment decisions as affectedby loss aversion bias. (Mbaluka, Muthama, & Kalunda, 2012) and (Alquraan et al., 2016)
Investment strategies and Behavioural BiasesMany investors consider certain investment strategies while investing. He may adopt time and
tested investment strategies like buy and hold, technical analysis or fundamental analysis. Many followpassive investment strategies for a long time horizon and fail to exit from an investment despite potential

34 Orissa Journal of Commerce, Volume XXXXI, April- June-2020, Issue No-II
gains. (Ricciardi et al., 2017)When rationality is considered to be most important in investor decisionmaking so is the use of fundamental analysis, technical analysis and intuitions(Ogunlusi & Obademi,2019). Singh (2012) found that certain behavioral biasesincludingloss aversion bias causesthe currentsecurity prices to move away from fundamental values. Onsomu (2018)found a relation betweenbehavioural biases and investment strategies using primary data of stock market investors. Accordingto Gupta, Preetibedi, & Mlakra(2014)investors while examining financial statements, create an imageof the company which they will consider including in their portfolio.
Technical Analysis as an investment strategy makes uses of charts and past market data. However,use of this strategy should not be the principal focus of high returns and a past reference. The assumptionof past performances is repeated again in the economy should not be considered as the basis for investmentdecisions. (Konstantinidis, Katarachia, & Borovas, 2012).
Socio Demographic factors and Behavioural BiasesAgrawal, Singhal, & Swarup (2016)studied demographic factors using the Causal Loop Diagram and
found that herding exists in the Indian stock market due to lack of financial literacy, market image ofmarket leader and social factors. The authors also confirmed that demographic factors like age andinvestment period has negative cause towards herding bias. Lee et al (2013)analysedthe portfolioperformance of male and female students, the study establishedthat females and males show differentbehavioural biases which finally shape investment decisions.The paper also confirmed that females areless risk tolerant than males;(Shaikh, Karim, Kalhoro, & Kamal, 2019). A study by Nair, Balasubramanian,& Yermal (2017)found that male investors portray less herding bias than female investors. However, astudy of investors in Oman by Jamil & Khan, (2016)gender of an investor is not affected by herding bias.
Studies have shown that with increasing income the degree of biases reduces.(Sarkar & Sahu, 2018)confirmed that annual income do have a significant influence on biases. Isidore R &Christie (2019) usedgender as independent variable to find if female investors behaved differently in secondary equity marketand found female investors were more prone to biases. Beblo, Beniger, & Markowsky(2017) studied anchoringbias using an experiment found that level of education and not gender influences the anchoring value.
The review of literature shows that behavioural biases do have a relation to an investment decisionsand investment strategies. There is a tendency of investors to be affected by biases while taking investmentdecision and adopting investment strategies. Also socio-demographic factors of income and gendershows mixed association with certain behavioural biases.Whether this holds true for the current sampleis what motivates this study.
Objectives of the StudyThe objectives of this study are1. To study the relationship between individual investments strategies and the behavioural biases.2. To study whether behavioural biases are influenced by the individual investor income.3. To analyse the relationship between gender and behavioural biases in investment decision
making.

35Orissa Journal of Commerce, Volume XXXXI, April- June-2020, Issue No-II
Hypotheses of the StudyH1: There is no significant relationship between the individual investment strategies and behavioural
biases.H2: There is no significant difference in behavioural bias and individual investor’s income in
formulating investment strategies.H3: Investment decisions are not influenced by gender of an investor and his behaviourial biases
Research MethodologyThe present study considers only four behavioural biases namely, herding, anchoring, regret aversion
and loss aversion. The first hand data was collected on the basis of convenience sampling through anon disguised structured closed ended questionnaire, divided into three sections. The sections coveredquestions on respondent’s demographics; investment strategies and his behavioral biases. The datawas collected from 63 respondents across Goa from June 2019 to December 2019 using Google forms.This data was processed using SPSS. Using Correlation Analysis,the relationship between investmentstrategies and biases was determined. Statistical tools of Anova, and Independent T-test measured therelationship between behavioral biases and socio-demographic factors namely income and gender.
Table 1: Demographic Profile of the Respondents
Variable Description Percentage Age 18 years to 40 years 76
41 years to 60 years 22 61 years and above 2
Gender Male 48 Female 52
Qualification Up to Graduation 3 Graduation 14 Post Graduation 78 Professional 5
Annual Income Up to Rs 2,50,000 24 Rs 2,50,001 to 5,00,00 21 Rs 5,00,001 to 10,00,000 38 Rs 10,00,001 and above 19
Investment Period Less than 5 years 76 More than 5 years 24

36 Orissa Journal of Commerce, Volume XXXXI, April- June-2020, Issue No-II
Analysis and DiscussionRelation between Behavioral Bias and Investment StrategiesThe data about the biases was collected through nine statements in the third section of the
questionnaire. The features of the biases were used for framing the questions. Based on the investmentstrategy identified by respondents, relation between investor strategies and biases was explored.
Table No 2 : Results of Correlation
Herding Anchoring Regret Aversion
Loss Aversion
INVESTMENT STRATEGY
SCORE
Herding Pearson Correlation 1 .447 .085 .068 .058
Sig. (2-tailed) .000 .510 .595 .651 N 63 63 63 63 63
Anchoring
Pearson Correlation .447 1 -.041 .097 .319
Sig. (2-tailed) .000 .749 .448 .011* N 63 63 63 63 63
Regret Aversion Pearson Correlation .085 -.041 1 .240 -.200
Sig. (2-tailed) .510 .749 .058 .117 N 63 63 63 63 63
Loss Aversion Pearson Correlation .068 .097 .240 1 -.075
Sig. (2-tailed) .595 .448 .058 .560 N 63 63 63 63 63
INVESTMENT STRATEGY SCORE
Pearson Correlation .058 .319* -.200 -.075 1
Sig. (2-tailed) .651 .011 .117 .560
N 63 63 63 63 63 Source: Primary data Significant at * 0.05 level
Source: Primary data Significant at * 0.05 level
In order to determine the relationship between the investment strategies and biases, the Pearsoncorrelation test was carried out and the result is presented in Table 2. The correlation matrix revealsthat the Herding bias has a non significant and weak correlation of 0.058 ; Anchoring has a positiverelation of .319 and Regret Aversion and Loss Aversion biases are negatively related with -.200 and -.075 respectively.

37Orissa Journal of Commerce, Volume XXXXI, April- June-2020, Issue No-II
However, a positive correlation between investment strategies score and anchoring bias is seen,which is statistically significant with Pearson Correlation of 0.319, n=63, p=0.11, at 5% level ofsignificance. This depicts the existence of correlation of anchoring bias and investment strategies adoptedby respondents and the dependence on investment strategies increases as anchoring bias increase. Thefindingreveals that while using investment strategies in the process of investment decision,theanchoringbias isprevalent. It is reasonable for any middle class individual investor the price of the script and itssecurity is of utmost importance. He is more conservative and interested in the price, return and securityof his investments.
Relationship between Annual Income and behavioural BiasesThe data collected through Google forms were sorted according to the income brackets of the
respondents namely up to Rs 2,50,000; Rs 2,50,001 to Rs 5,00,000; Rs 5,00,001 to Rs 10,00,000 andRs 10,00,001 and above. The data had investors with highest income that is 38 percentin annual incomebracket of Rs 5, 00,001 to Rs 10, 00,000. The responses to the biases based on the questions askedusing Likert scale was categorized into Herding, Anchoring, Regret bias and Loss Aversion Bias. Therelationship linking the annual income and the biases displayed by the respondents is explored usingAnalysis of Variance.
Table 3: ANOVA between Annual Income and Biases
BIASES F Sig. Herding Anchor Regret Loss
5.238 .003* 1.031 .386 .245 .864 .552 .649
Source: Primary Data Significant at * 0.05 level
The above table shows the outcomes of analysis of variance. The results depicts that herding biashas no significant difference between annual incomes as this biashas ap-value less than 0.05. Thisindicates that irrespective which bracket of annual income the investors belong, herding bias exist,while taking investment decisions.
The remaining biases, that is, anchoring, regret aversion and loss aversion have a p-value greaterthan 0.05 representingthe existence of significant difference between these biases and annual income.The following table explains the relationship between incomeand the biases.

38 Orissa Journal of Commerce, Volume XXXXI, April- June-2020, Issue No-II
Table 4: Annual Income and Biases
Income Level Anchoring Bias Mean
Regret Aversion Bias Mean
Loss Aversion Bias Mean
Up to Rs 2,50,000 3.36 3.46 3.20 Rs 2,50,001 to Rs 5,00,000
3.74 3.61 3.61 Rs 5,00,001 to Rs 10,00,000 3.41 3.65 3.39 Rs 10,00,001 and above
3.14 3.33 3.08 Total 13.65 13.65 13.28
Source : Primary Data
In the above table, respondents with high mean in annual income bracket of Rs 2, 50,001 to Rs 5,00,000 exhibitsthe presence of Anchoring bias and Loss aversion bias. High mean in annual incomebracket of Rs 5, 00,001 to Rs 10, 00,000 indicate the presence of Regret Aversion bias.As per the aboveanalysis, the lowest mean is in the annual income bracket of ‘Rs 10, 00,001 and above’ is relevant forall biases. This indicates that as income increase the investors are less prone to biases. These resultsare in tune with previous studies which confirm that investors with higher income use the services offinancial advisors, have high level of financial literacy, have access to relevant information whichhelps(Michael, 2012)(Burke & Hung, 2015)(Isidore R & Christie, 2019) in reducing biases while takinginvestment decisions.
Relationship between Gender and Behavioural BiasesIn order to understand the impact of biases on the males and females an Independent sample test
was conducted.

39Orissa Journal of Commerce, Volume XXXXI, April- June-2020, Issue No-II
Table 5: Biases and Annual Income
GENDER N Mean Std. Deviation Std. Error Mean HERDING males 30 2.8083 .59337 .10833
females 33 3.0000 .62812 .10934 ANCHORING males 30 3.4000 .84605 .15447
females 33 3.4242 .91410 .15912 REGRET AVERSION males 30 3.3333 1.24106 .22659
females 33 3.7273 .97701 .17008 LOSS AVERSION
males 30 3.2333 1.22287 .22326 females 33 3.4242 1.03169 .17959
Levene's Test for Equality of Variances
T-test for Equality of Means
F Sig. t df Sig. (2-
tailed)
Mean Difference Std. Error
Difference
95% Confidence Interval of the Difference
Lower Upper HERDING Equal
variances assumed .572 .453 -1.242 61 .219 -.19167 .15434 -.50030 .11696
Equal variances not assumed
-1.245 60.903 .218 -.19167 .15392 -.49946 .11613
ANCHOR Equal variances assumed .390 .535 -.109 61 .914 -.02424 .22260 -.46935 .42087
Equal variances not assumed
-.109 60.977 .913 -.02424 .22177 -.46770 .41921
REGRET AVERSION
Equal variances assumed 2.044 .158 -1.406 61 .165 -.39394 .28011 -.95406 .16618
Equal variances not assumed
-1.390 55.047 .170 -.39394 .28331 -.96170 .17382
Source: Primary data Significant at 5% level

40 Orissa Journal of Commerce, Volume XXXXI, April- June-2020, Issue No-II
The T- test observes the p- value being greater than 0.05 for all biases. This means that none of thebiases are significant. This confirms the existence of no significant difference between the genderandbehavioural biases. Thus biases do not seem to impact any gender during investment decisions. Thisresult is dependable and is consistent with the studies of (Bashir, 2013),(Shadi 2018) and(Mahapatra &Mehta, 2015). However relevant studies of Rekik & Boujelbene(2013), (Onsomu2018) and (Kudryavtsev& Cohen, 2011) found significant difference between biases and gender.
DiscussionThere exists a correlation between behavioural biases and investment strategies. In the studies of
Onsomu (2018)and Coffie(2013)an evidence of relations between behavioural biases and investmentstrategies was found. The present study found a positive correlation between anchoring bias andinvestment strategies. Anchoring Bias is depending on reference points while taking an investmentdecision. As an investment strategy, the investors may depend on published financial data or on historicalcharts as reference points while making investment decisions. The findings reflect that while usinginvestment strategies be it technical, fundamental or any other,the impact of anchoring bias isrelevantinthe process of investment decisions.
Using the same data to test the impact of biases on socio demographic factors of annual incomeand gender, statistical tools of Anova and Independent sample test were used. The annual income andthe biases were tested at 5% level of significance. Only herding bias was found to be not significant,the remaining biases namely anchoring, regret aversion and loss aversion bias were found significantwith relation to annual income. This study also showed that as income increased the impact of biasesdecreased; confirming that as annual income increase the investors are less prone to biases. (Isidore R& Christie, 2019)
With regards to gender, the study found no significant difference for all biases and gender, confirmingwith the studies of Velumoni (2017) and Mishra& Metilda (2015).
ConclusionInvestment strategies are used to make investment decisions which are influenced by behavioural
biases. The relation of behavioural biases withinvestment strategies, annual income and gender is exploredin this pilot study. The study ably points out; investment strategies adopted by investors are correlatedto anchoring bias. This bias, of having wrong reference point to make an investment decision can weakenthe whole investment process and thereby defeat the investment goals. With regards to annual incomeand behavioural biases, the results are in tune with Isidore R & Christie (2019); the conclusion, whichis widely researched and accepted fact,that with an increase in income the investors are less prone tobiases as they have access to financial advisors and other relevant information sources. The study testedno significant difference between the four biases and gender in the financial decision making.
Furture ResearchThe analysis of behavioural biases and investment decision is a well researched area. It is in focus
among the researchers as it motivates them to understand why investors deviate from establishedrationalities and theories and why they keep repeating the same mistake. This study is carried out as apilot study with sample size of 63 respondents. There are 23 biases (Lee et al 2013)which are documented

41Orissa Journal of Commerce, Volume XXXXI, April- June-2020, Issue No-II
and researched. The future direction would be to conduct a comprehensive analysis all these biases totruly understand which bias has a profound impact on investment decision making process.
References• A, C., & R, K. (2016). Impact of Selected Behavioural Bias Factors on Investment Decisions
of Equity Investors. ICTACT Journal on Management Studies, 2(2), 297–311. https://doi.org/10.21917/ijms.2016.0039
• Agrawal, D., Singhal, T., & Swarup, K. S. (2016). Role of Herding Behavior in InfluencingInvestor Decision Making in India. Indian Journal of Research in Capital Markets, (December),43–48.
• Alquraan, T., Alqisie, A., & Al Shorafa, A. (2016). DDistinguishing Informational Cascadesfrom Herd Behavior in the Laboratory Author ( s ): Boðaçhan Çelen and Shachar KarivSource/ : The American Economic Review , Vol . 94 , No . 3 ( Jun ., 2004 ), pp . 484-498Published by/ : American International Journal of Contemporary Research, 6(3), 159–169.Retrieved from www.aijcrnet.com
• Awan, H. M. (2019). An Evaluation of Investment Behavior of Individual Investors and itsImpact on Investment Decision making University of Wah An Evaluation of Investment Behaviorof Individual Investors and its Impact on Investment Decision making. (July).
• Baddeley, M. (2010). Herding, social influence and economic decision-making: Socio-psychological and neuroscientific analyses. Philosophical Transactions of the Royal SocietyB: Biological Sciences, 365(1538), 281–290. https://doi.org/10.1098/rstb.2009.0169
• Beblo, M., Beniger, D., & Markowsky, E. (2017). It’s education, not gender: A research noteon the determinants of an anchoring bias in experimental WTA elicitations. Journal of BehavioralEconomics for Policy, 1(2), 51–55.
• Cen, L., Hilary, G., & Wei, K. C. J. (2013). The Role of Anchoring Bias in the Equity Market/: Evidence from Analysts ’ Earnings Forecasts and Stock Returns Author ( s ): Ling Cen ,Gilles Hilary and John Wei Published by/ : Cambridge University Press on behalf of theUniversity of Washington School. 48(1), 47–76.
• Coffie, W. (2013). Behavioural Finance Theories Effecting on Individual Investor’s Decision-Making.
• Dolreen, M. (2014). The Effect of Anchoring on Investment Decision Making by IndividualInvestors in Kenya. University of Nairobi, 86.
• Fernandes, J., Matsumoto, A., Chagas, P., & Ferreira, I. (2014). Behavioral Finance: a Studyof Affect Heuristic and Anchoring in Decision Making of Individual Investors. Journal ofInternational Business and Economics, 14(1), 59–64. https://doi.org/10.18374/jibe-14-1.5
•. Finance, M. E., Metawa, N., Hassan, M. K., Metawa, S., Safa, M., Hospital, E., & Banking,T. I. (2018). Impact of behavioral factors on investors ’ financial decisions/ : case of theEgyptian stock market International Journal of Islamic and Middle Eastern Finance andManagement Article information/ : (June 2019). https://doi.org/10.1108/IMEFM-12-2017-0333

42 Orissa Journal of Commerce, Volume XXXXI, April- June-2020, Issue No-II
• Gupta, E., Preetibedi, P., & mlakra, P. (2014). Efficient Market Hypothesis V/S BehaviouralFinance. IOSR Journal of Business and Management, 16(4), 56–60. https://doi.org/10.9790/487x-16445660
• Hayat, A. (2016). Impact of Behavioral Biases on Investment Decision; Moderating Role ofFinancial Literacy. SSRN Electronic Journal. https://doi.org/10.2139/ssrn.2842502
• Isidore R, R., & Christie, P. (2019). The relationship between the income and behaviouralbiases. Journal of Economics, Finance and Administrative Science, 24(47), 127–144. https://doi.org/10.1108/JEFAS-10-2018-0111
• Jagongo, A., & Mutswenje, V. S. (2014). A Survey of the Factors Influencing InvestmentDecisions: The Case of Individual Investors at the NSE. In International Journal of Humanitiesand Social Science (Vol. 4).
• Jahanmiri, M. (2018). Anchoring Bias a Criterion for Explain Profitability of 52-Weeks Highand Momentum Strategies. Pacific Business Review International, 10(7), 115–124.
• Jamil, S. A., & Khan, K. (2016). Does gender difference impact investment decisions? Evidencefrom Oman. International Journal of Economics and Financial Issues, 6(2), 456–460.
• Kahneman, D., & Tversky’, A. (n.d.). E C O N Ometrica I C I Volume 47 March, 1979Number 2 Prospect Theory: An Analysis Of Decision Under Risk.
• Kaustia, M., Alho, E., & Puttonen, V. (2008). How much does expertise reduce behavioralbiases? The case of anchoring effects in stock return estimates. Financial Management, 37(3),391–412. https://doi.org/10.1111/j.1755-053X.2008.00018.x
• Konstantinidis, A., Katarachia, A., & Borovas, G. (2012). From Efficient Market HypothesisTo Behavioural Finance: Can Behavioural Finance Be the New Dominant Model for Investing?Scientific Bulletin/ : Economic Sciences, 11(2), 16–26.
• Kudryavtsev, A., & Cohen, G. (2011). Behavioral Biases in Economic and Financial Knowledge:Are They the Same for Men and Women? In Advances in Management & Applied Economics(Vol. 1). online) International Scientific Press.
• Kumar, S., Samir, A., Barua, K., Jacob, J., & Varma, J. R. (2013). Financial Literacy amongWorking Young in Urban India Indian Institute Of Management Ahmedabad-380015 IndiaFinancial Literacy Among Working YoungIn Urban India.
• Lan, Q., Xiong, Q., He, L., & Ma, C. (2018). Individual investment decision behaviors basedon demographic characteristics/ : Case from China. 1–16.
• Lee, K., Miller, S., Velasquez, N., & Wann, C. (2013). THE EFFECT OF INVESTOR BIASAND GENDER ON. 7(1), 1–16.
• Mahapatra, M. S., & Mehta, S. (2015). Behavioral Finance/ : A Study on Gender BasedDilemma in Making Investment Decisions. SUMEDHA Journal of Management, 4(1), 4–17.
• Mbaluka, P., Muthama, C., & Kalunda, E. (2012). Prospect Theory/ : Test on Framing andLoss Aversion Effects on Investors Decision-Making Process At the Nairobi Securities Exchange, Kenya. 3(9), 31–42.

43Orissa Journal of Commerce, Volume XXXXI, April- June-2020, Issue No-II
• Michael, J. (2012). Financial advice: A substitute for financial literacy? In Financial ServicesReview; Winter (Vol. 21). Retrieved from http://ssrn.com/abstract=2046227
• Mishra, K. C., & Metilda, M. J. (2015). A study on the impact of investment experience,gender, and level of education on overconfidence and self-attribution bias. IIMB ManagementReview, 27(4), 228–239. https://doi.org/10.1016/j.iimb.2015.09.001
• Nair, M. A., Balasubramanian, & Yermal, L. (2017). Factors influencing herding behavioramong Indian stock investors. 2017 International Conference on Data Management, Analyticsand Innovation, ICDMAI 2017, 326–329. https://doi.org/10.1109/ICDMAI.2017.8073535
• Ogunlusi, O. E., & Obademi, O. (2019). The Impact of Behavioural Finance on InvestmentDecision-making: A Study of Selected Investment Banks in Nigeria. Global Business Review,(August 2019), 0–17. https://doi.org/10.1177/0972150919851388
• Onsomu, Z. (2018). Behavioral Biases, Demographics, Investment Strategy and PortfolioPerformance of Individual Investors at the Nairobi Securities . Retrieved from http://erepository.uonbi.ac.ke:8080/handle/11295/104386
• Pareto, C. (2019, May 17). Understanding Investor Behavior. Retrieved January 30, 2020,from https://www.investopedia.com/articles/05/032905.asp
• Polman, E. (2012). Self-other decision making and loss aversion. Organizational Behaviorand Human Decision Processes, 119(2), 141–150. https://doi.org/10.1016/j.obhdp.2012.06.005
• Prosad, J. M., Kapoor, S., & Sengupta, J. (2015). Theory of behavioral finance. In Handbookof Research on Behavioral Finance and Investment Strategies: Decision Making in the FinancialIndustry (pp. 1–24). https://doi.org/10.4018/978-1-4666-7484-4.ch001
• Rekik, Y. M., & Boujelbene, Y. (2013). Determinants of Individual Investor s ’ Behaviors/ :Evidence from Tunisian Stock Market. 8(2), 109–119.
• Ricciardi, V., Science, S., & Baker, H. K. (2017). Behaviour. (March 2014).• Saraswati, A. R. (2015). the Effect of Anchoring and Adjustment Bias and Conservatism Bias
on Investment Decision Making. (1970).• Sarkar, A. K., & Sahu, T. N. (2018). Analysis of Investment Behaviour of Individual Investors
of Stock Market/ : A Study in Selected Districts of West Bengal. Pacific Business ReviewInternational, 10(7), 7–17. Retrieved from http://www.pbr.co.in/2018/2018_month/Jan/1.pdf.
• Scharfstein, D. S., & Stein, J. S. (1988). 2062- 88. (August).• Shaikh, G. M., Karim, N., Kalhoro, M., & Kamal, Y. (2019). Do behavioral biases in gender
differences affect investment decisions/ ?3(4), 326–336. https://doi.org/10.15406/sij.2019.03.00194• Singh, S., & Dean, A. (2012). Investor Irrationality and Self-Defeating Behavior/ : Insights
from Behavioral Finance. 8(1), 116–122.• Sukamulja, S., Meilita, A. Y. N., & Senoputri, D. (2019). Regret Aversion Bias, Mental
Accounting, Overconfidence, and Risk Perception in Investment Decision Making on GenerationY Workers in Yogyakarta. International Journal of Economics and Management Studies, 6(7),102–110. https://doi.org/10.14445/23939125/ijems-v6i7p116
44 Orissa Journal of Commerce, Volume XXXXI, April- June-2020, Issue No-II
• Topol, R. (1991). Bubbles and Volatility of Stock Prices: Effect of Mimetic Contagion. TheEconomic Journal, 101(407), 786. doi: 10.2307/2233855
• Tuominen, N. (2017). A Basic Theory of Rational Herd Behavior and Informational CascadesDoes it apply to Financial Markets? . Retrieved from https://aaltodoc.aalto.fi/handle/123456789/27215
• Usman, D. I., Muturi, W. M., & Memba, F. S. (2017). Influence Of Anchoring Bias OnInvestors ’ Decision Making In Property Market In Plateau State. International Journal ofManagement and Commerce Innovations, 5, 2348–75(1), 49–59.
• Velumoni, D. (2017). Analysis of prospect theory on equity investment decision making-Abehavioural perspective. Indian Journal of Science Research, 14(1), 211–215.Zaiane, S. (2015). Behavioral Biases of Individual Investors: The Effect of Anchoring. EurasianJournal of Social Sciences, 3(1), 13–19. https://doi.org/10.15604/ejss.2015.03.01.002

45Orissa Journal of Commerce, Volume XXXXI, April- June-2020, Issue No-II
Insolvency and Bankruptcy Code 2016: A Study ofLarge Stressed Account
Dr. Manindra N. Nayak
ABSTRACTThe Insolvency and Bankruptcy Code, 2016 (IBC2016) is considered a game changer with regards
to early resolution of insolvency and bankruptcy issues. Theaim the code i.e. faster insolvency resolutionand value maximization of corporate person and other business entities seems to have started showingresults. The code, in its last three years, has brought a visible change in insolvency resolution issuesand in handling the stressed asset cases in India. Though there was a plethora of Indian Laws startingfrom the Presidency Towns Insolvency Act, 1909 to Companies Act 2013, but it could not help muchforearly resolution of insolvency issues. This is evident as the average insolvency resolution processeswas 4.5 years in India, compared to 9 months for Singapore and 6 months in Japan. It is also foundthat due to longer litigation process, India experienced one of the lowest recovery rates of the debts inthe world which was about only 26.5 percent of the debt value.
The objective of the study is to find the importance of timely resolution of insolvency issues, andalso to examines the resolution process of large stressed accounts. The study is mostly dependent onthe secondary source of data. Statistical methods such as correlation, regression analysis, F-testandthegraphs have been used in thestudy for analysis of data,
The study strongly suggests that the timely resolution of insolvency cases leads to a better recoveryof debts. Itis also found that there are still challenges in resolving insolvency issues within mandatedperiod under IBC.
Keywords: Insolvency, Bankruptcy, Stressed assets, Insolvency resolution, mandated days.Insolvency resolution studies the time, cost and outcome of insolvency proceedings involving
domestic legal entities. These variables are used to calculate the recovery rate, which is recorded ascents on the dollar recovered by secured creditors through reorganization, liquidation or debtenforcement (foreclosure or receivership) proceedings.
Resolving Insolvency Methodology, World Bank, May 2019
1. Professor, School of Commerce, Xavier University, Bhubaneswar -752050 India [email protected] Contact No.- 9437058892

46 Orissa Journal of Commerce, Volume XXXXI, April- June-2020, Issue No-II
IntroductionThe enactment of IBC in the year 2016, for faster insolvency resolution and value maximization of
corporate and other business entities., is looked upon as an important game changer with regards toinsolvency resolution in India. Though therewere a plethora of Indian Laws for addressing insolvencyresolution issues of individuals, partnership and companies form of business, but the average insolvencyresolution processes were taking a longer time in India i.e. 4.5 years, against 9 months for Singaporeand 6 months in Japan. It is also found that due to longer litigation process, India experiences one ofthe lowest recovery rates of the debts in the world i.e. approximately 26 percent of the debt value. Thelaws like The Presidency Towns Insolvency Act,1909, Provincial Insolvency Act 1920, Sick IndustrialCompanies (Special Provisions) Act 1985, Recovery of Debt due to Banks and Financial InstitutionsAct 1993, the Securitisation and Reconstruction of Financial Assets and Enforcement of Security InterestAct (SARFAESI) 2002 and the Companies Act 2013 could not contribute much for early resolution ofinsolvency issues.
The ineffectiveness of the previous laws can be well observed by examining the prolonged litigationperiod and gigantic volume of non-performing asset (NPA). “NPA rose to 11.2 percent or at ¹ 10.39trillion in FY18 from 9.3 percent a year ago, and the share of public sector banks stood at ¹ 8.95trillion, or at 14.6 percent. In FY17, the gross NPA stood at 9.3 percent and that of state-run lendersstood at 11.7 per cent”.(RBI 2018).India’s situation with regard to NPA can be well realized when it iscompared with other countries i.e. Brazil has 3.6%, Sri lank has2.5%, Argentinahas 1,8%, Australiahas 0.9%, UK has 0.7 and USA has 1.1% NPA (IMF,2019)
The poor performance of previous laws became a strong reason for enactment of a new code.Government of India enacted the code in 2016, with an introduction “an act to consolidate and amendthe laws relating to reorganisation and insolvency resolution of corporate persons, partnership firmsand individuals in a time bound manner for maximisation of value of assets of such persons, to promoteentrepreneurship, availability of credit and balance the interests of all the stakeholders including alterationin the order of priority of payment of Government dues and to establish an Insolvency and BankruptcyBoard of India, and for matters connected therewith or incidental there to1.”
It is pertinent to note that “insolvency resolution” is one of the parameters determining the rankingin “ease of doing business” (DB) index by the World Bank2. India’s position in ease of doing business(DB) was 130 among 190 countries in the first quarter of 2017 which moved up to 100th position in2018 and the recent survey shows that India has moved up to 63rd position. Among various factors forthe upward movement in India’s position in DB, the legislation of IBC- 2016 is an important one.
IBC is a well-intentioned enactment with a strong political will of the government to tackle theissue of stressed asset. The code has put Indian corporate on tenterhooks. The deep pocketed corporateshave already realised either they must clear the debts not only of financial creditors but also ofoperational creditors within the stipulated time frame. Non-adherence to timely repayment of debtsmay trigger insolvency proceedings against the debtor company under IBC, following which there maybe a change in management or may face liquidation within a very short period. Recently in her speechin Rajya Sabha on IBC amendments in July 2019, honourable finance minister Nirmala Sitharamansaidthat IBC has been able to bring about a “behavioural change” in corporate sector. This has sent a strong
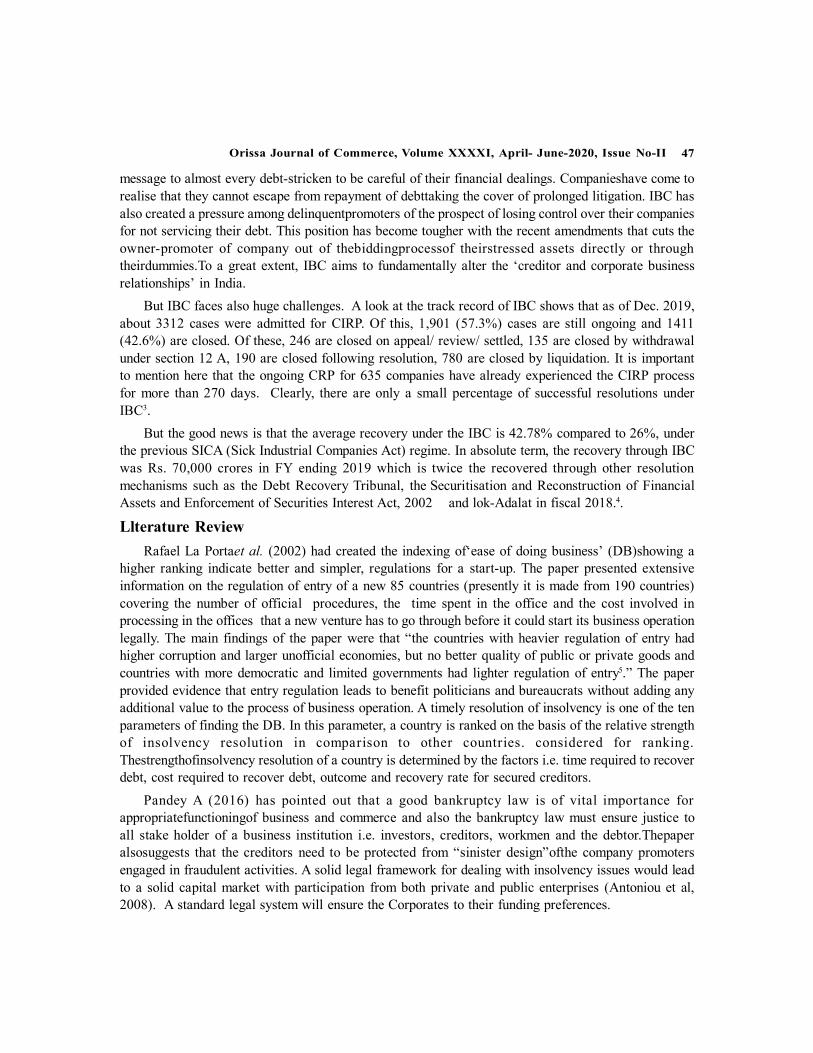
47Orissa Journal of Commerce, Volume XXXXI, April- June-2020, Issue No-II
message to almost every debt-stricken to be careful of their financial dealings. Companieshave come torealise that they cannot escape from repayment of debttaking the cover of prolonged litigation. IBC hasalso created a pressure among delinquentpromoters of the prospect of losing control over their companiesfor not servicing their debt. This position has become tougher with the recent amendments that cuts theowner-promoter of company out of thebiddingprocessof theirstressed assets directly or throughtheirdummies.To a great extent, IBC aims to fundamentally alter the ‘creditor and corporate businessrelationships’ in India.
But IBC faces also huge challenges. A look at the track record of IBC shows that as of Dec. 2019,about 3312 cases were admitted for CIRP. Of this, 1,901 (57.3%) cases are still ongoing and 1411(42.6%) are closed. Of these, 246 are closed on appeal/ review/ settled, 135 are closed by withdrawalunder section 12 A, 190 are closed following resolution, 780 are closed by liquidation. It is importantto mention here that the ongoing CRP for 635 companies have already experienced the CIRP processfor more than 270 days. Clearly, there are only a small percentage of successful resolutions underIBC3.
But the good news is that the average recovery under the IBC is 42.78% compared to 26%, underthe previous SICA (Sick Industrial Companies Act) regime. In absolute term, the recovery through IBCwas Rs. 70,000 crores in FY ending 2019 which is twice the recovered through other resolutionmechanisms such as the Debt Recovery Tribunal, the Securitisation and Reconstruction of FinancialAssets and Enforcement of Securities Interest Act, 2002 and lok-Adalat in fiscal 2018.4.
Llterature ReviewRafael La Portaet al. (2002) had created the indexing of‘ease of doing business’ (DB)showing a
higher ranking indicate better and simpler, regulations for a start-up. The paper presented extensiveinformation on the regulation of entry of a new 85 countries (presently it is made from 190 countries)covering the number of official procedures, the time spent in the office and the cost involved inprocessing in the offices that a new venture has to go through before it could start its business operationlegally. The main findings of the paper were that “the countries with heavier regulation of entry hadhigher corruption and larger unofficial economies, but no better quality of public or private goods andcountries with more democratic and limited governments had lighter regulation of entry5.” The paperprovided evidence that entry regulation leads to benefit politicians and bureaucrats without adding anyadditional value to the process of business operation. A timely resolution of insolvency is one of the tenparameters of finding the DB. In this parameter, a country is ranked on the basis of the relative strengthof insolvency resolution in comparison to other countries. considered for ranking.Thestrengthofinsolvency resolution of a country is determined by the factors i.e. time required to recoverdebt, cost required to recover debt, outcome and recovery rate for secured creditors.
Pandey A (2016) has pointed out that a good bankruptcy law is of vital importance forappropriatefunctioningof business and commerce and also the bankruptcy law must ensure justice toall stake holder of a business institution i.e. investors, creditors, workmen and the debtor.Thepaperalsosuggests that the creditors need to be protected from “sinister design”ofthe company promotersengaged in fraudulent activities. A solid legal framework for dealing with insolvency issues would leadto a solid capital market with participation from both private and public enterprises (Antoniou et al,2008). A standard legal system will ensure the Corporates to their funding preferences.
48 Orissa Journal of Commerce, Volume XXXXI, April- June-2020, Issue No-II
Chatterjee.S etal. (2017) have initiated an innovative data base from the orders passed by the NationalCompany Law Tribunal (NCLT) in the insolvency cases under the IBC. The authors have produced anempirical analysis of the economic effect of the IBC and the performance of the judiciary under theIBC. There are various fields of information examining different orders passed during the initial sixmonthsof the IBC. This attempts to answer questions such as who were the initial users of the insolvencyprocess under the IBC, the kind of evidence used to support their claims before the NCLT, the averagetime taken by the NCLT to dispose of insolvency cases and the outcome of the process. Authors havealso indicated that a larger time frame is required to measure the impact of the newly enacted code andthe change in the eco-system in resolving Indian bankruptcy issues.
RajeswariSenguptaetal. (2015) examined the corporate insolvency resolution process in India. Thisis a study made in pre-IBC era. The authors have made a comparative analysis of insolvency resolutionprocess of three countries, i.e. India, UK and Singapore. Since it is a pre-IBC work, the author haspointed out that there was no single and comprehensive law in India that addresses all aspects ofinsolvency of an enterprise. “The presence of multiple laws and adjudication floors has createdopportunities for debtor firms to exploit the arbitrage between the systems to frustrate recovery effortsof creditors”. It has been pointed out that a well-functioning and orderly corporate insolvency frameworkconsisting of well-defined rules, procedures, timelines and efficient institutions are critical forencouraging the development of strong domestic credit markets. In a reference to another work (LaPorta -1996) in the same article, it was pointed out that there is significant evidence in the literaturewhich indicates legal protection of creditors’ rights supports development of credit markets. Studieshave also shown when lenders can easily enforce repayment, they are more willing to extend credit andat lower prices. A major finding of the article was that since there was no comprehensive legal frameworkfor addressing insolvency resolution in India, it led to delay in enforcement of insolvency process.Further it was suggested that if a strong market for credit was to develop in India, the corporate insolvencyprocess must be given a clarity to all creditors and debtors from the outset about the procedures to dealwith in event of insolvency and there would be a better enforcement of contract.
GoelS (2017) has indicated the shortcomings of all previous laws in connection to insolvencyresolution. “There is no single umbrella legislation in India that governs the insolvency and bankruptcyproceedings. There is a slew of legislation governing the legal framework albeit insolvency andbankruptcy in India”. Goel had suggested that Government of India must go for a strong insolvencyresolution particularly in the context of globalisation and DB. The paper pointed out that one of thereasons of lower ranking DB by world bank group is due to lack of a comprehensive law on insolvencyresolution. The limitation of the previous acts as well as the procedure of insolvency resolution underdifferent laws has been explained in the article.
KPMG (2016) had made major contribution on the need of the code in the present business contextand emphasized on the need of infrastructure for successful implementation of the code. It highlightedon appointing of members of the Board, appointing judges for the adjudication authority, setting up ofbenches for the adjudication authority identifying and licensing insolvency agencies, licensinginformation utilities and training of insolvency professionals (IP). It states, “overall this legislation is ahuge step towards the ease of doing business in India and has the potential to bring business practicesin India closer to more developed markets over the long term”.

49Orissa Journal of Commerce, Volume XXXXI, April- June-2020, Issue No-II
Sahoo MS (July.2019) indicates how the life of companies are becoming shorter. Mr Sahoo said,“It is not surprising that the average life of S&P 500 companies has reportedly reduced from 90 years to18 years over the last century. A company having perpetual succession now lives shorter than a human!”He states that before company completely comes to closure, the GoI, through IBC has developed aneco-system of early detection of sickness and through resolution plan of the ailing company which istaken over as a going concern, preserving its underlying values as well as value enhancement, retrievethe value lost on account of irregular transactions. The IBC is able to create a market for competing,feasible and viable resolution plans ensuring maximisation of value of the company.
Desai, N (2019) has explained the success story of IBC over the previous acts. The author is ofview that the debt recovery is much better despite cases in NCLT are going beyond the mandated timeof 270 days. The author has explained theamendments that has been made post IBC 2016. However,the author has suggested for capacity building of all the institutions that are associated withimplementation of IBC.
Agrawal S (2019) commented that it had taken 841 days for approval to Arcerlor Mittal on takingover troubled Essar Steel which is much beyond mandated time frame, However he is of opinion thatmost agree IBC is a well-intentioned code backed by strong political will from the government to tackle‘bad credit’. He further added that in order to get the benefits of IBC, the time taken for resolutionsmust come down drastically by bringing competent people into the system and by empowering theinstitutions who are responsible for the delivery. He points out that reducing delays is very importantbecause banks, promoters and bidders are suffering. It is found that recoveries in well-managedcompanies, particularly, the steel sector, have been really good. The, average recovery from 120 casesresolved under the IBC is 42.78% compared to 26%, under the erstwhile SICA (Sick Industrial CompaniesAct) regime in pre-IBC era.
Research GapThe extensive review of literature shows that enactment of IBC was essential as India’s previous
insolvency laws were not effective for timely resolution of insolvency issues.A research gap is observed to establish whether a longer litigation process has a negative impact
over the recovery of debts and vice versaacross countries of the world or this is confined only to certaingeographical locations. Secondly, a research gap is also observed to find how far the IBC2016 has beensuccessful in resolving the insolvency cases within the mandated time period.
Objectives of the StusyThe specific objectives of the paper are:1. To study whether a longer time period has a negative impact on the recovery rate of debts
across most of the countries of the world or this behaviour is confined to some geographicallocations
2. To examine the insolvency resolution process of 12 large stressed accounts and whether theCIRP process is complete within mandated time period.
3. To suggest the measures to make IBC more effective

50 Orissa Journal of Commerce, Volume XXXXI, April- June-2020, Issue No-II
Research Methodology The study is dependent mainly on secondary data. However, some amount of primary data has
been collected from different banking professionals who are involved in credit decisions and recoveryand resolution process. The secondary data has been collected from sources i.e. publications of WorldBank, Reserve Bank of India, Ministry of Corporate affairs, Insolvency and Bankruptcy Board of India,publication of professional body like Institute of Company Secretaries of India and certain importantbusiness newspapers. For analysis of data, statistical methods such as correlation, regression, F-testand graphs have been used in this study.
Time and Debt RecoveryA country’s efficiency in resolving insolvency refers to the percentage of recovery of debts, the
cost of recovering the debt and the time required to recover debt measured including appeals for extension.These factors finally determine a country’s ranking in insolvency resolution across countries in theword. The specific parameters for measuring efficiency are as follows:
i. Cost to recover debt: This is measured as percentage of assets value of debtor’s estate. Thismainly includes court fees, fees of insolvency administrators, fees of insolvency professional,advocate’ fees, fees of valuers’ and auctioneers’ and other related fees.
ii. Outcome from the process: Whether the business after resolution, continues as a going concernor whether the assets are sold piecemeal.
iii. Recovery rate for secured creditors: This measures the percentage of recovery by securedcreditors. The official costs of the insolvency proceedings are deducted, and depreciation ofassets are taken into account. It is also important to find the outcome for the resolution processi.e. whether the business continues as a going concern or the assets are sold in piecemeal.
The following analysis shows a relationship between the time taken for recovery of the debts andthe percentage of recovery after the insolvency proceeding are over. The countries and region-wisedata have beenused from the publications oftheworld bank group
Country -wise ResultsIn this part of analysis consisting of 190 countries World Bank 2019), we find that the model fit as
given by F-statistics is highly significant at 1% level of significance. The regression results reflect thattime to recovery is explained by the recovery rate to the extent of 55% across countries as given by ther-square statistics. Consistent with region-wise results, the country wise regression also posits that astime to recovery increases by one year, the rate of recovery decreases by 15 %.

51Orissa Journal of Commerce, Volume XXXXI, April- June-2020, Issue No-II
Regression Statistics
Multiple R 0.74225
R Square 0.55094
Adjusted R Square 0.54855
Standard Error 15.7620
Observations 190
ANOVA
df SS MS F Significance F
Regression 1 57303.89 57303 230.6 0.00
Residual 188 46706.89 248.4
Total 189 104010.8
Coeff Stan Error t Stat P-val Lower 95% Upper 95% Lower 95.0% Upper 95.0%
Intercept 79.95885 2.682724 29.80 0.00 74.66674 85.250 74.666 85.2509 X Variable 1 -15.24 1.00347 -15.18 0.00 -17.2195 -13.26 -17.219 -13.260
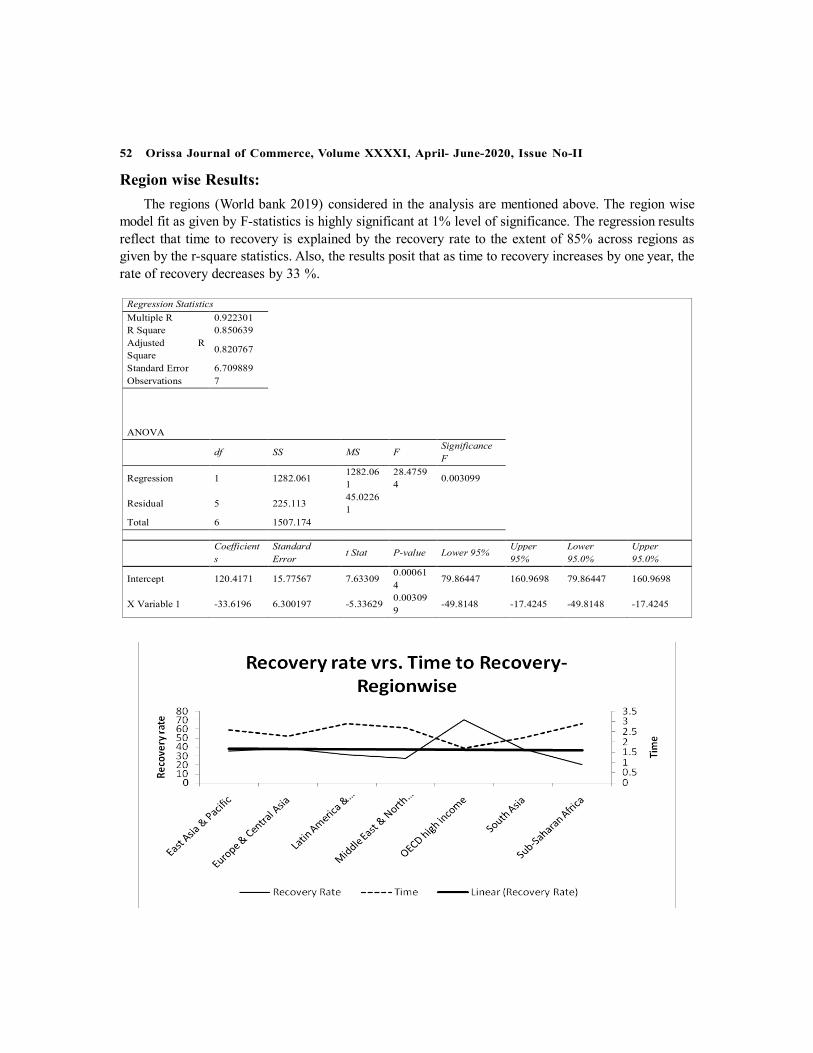
52 Orissa Journal of Commerce, Volume XXXXI, April- June-2020, Issue No-II
Region wise Results:The regions (World bank 2019) considered in the analysis are mentioned above. The region wise
model fit as given by F-statistics is highly significant at 1% level of significance. The regression resultsreflect that time to recovery is explained by the recovery rate to the extent of 85% across regions asgiven by the r-square statistics. Also, the results posit that as time to recovery increases by one year, therate of recovery decreases by 33 %.
Regression Statistics Multiple R 0.922301 R Square 0.850639 Adjusted R Square 0.820767
Standard Error 6.709889 Observations 7
ANOVA
df SS MS F Significance F
Regression 1 1282.061 1282.061
28.47594 0.003099
Residual 5 225.113 45.02261
Total 6 1507.174
Coefficients
Standard Error
t Stat P-value Lower 95% Upper 95%
Lower 95.0%
Upper 95.0%
Intercept 120.4171 15.77567 7.63309 0.000614
79.86447 160.9698 79.86447 160.9698
X Variable 1 -33.6196 6.300197 -5.33629 0.003099
-49.8148 -17.4245 -49.8148 -17.4245

53Orissa Journal of Commerce, Volume XXXXI, April- June-2020, Issue No-II
Findings:The recovery of debts from the stressed assets depends to a great extent on the timetaken for finalisation of the insolvency proceedings. The above analysis confirms the behaviour i.e.value recovered is inversely related to the time period for recovery, across the region and the countries.
TABLE 1. Resolving Insolvency: Some Asian Countries.
Economy Resolving Insolvency rank
Resolving Insolvency score
Recovery rate (cents on the dollar)
Time (years)
China 51 62.1 36.9 1.7
India 52 62.0 71.6 1.6
Indonesia 38 68.1 65.5 1.1 Japan 3 90.2 92.1 0.6 Malaysia 40 67.0 81.0 1.0 Philippines 65 55,1 21.2 2,7 Thailand. 24 76.8 70.1 1.5
Source: World Bank Publication 2019
Table-2. Ease of Doing Business Ranking on Different Parameters(FROM2016TO20200)
World Bank 'Ease of Doing Business India: Rank in 2016 Rank in 2020
Dealing with construction permits 183 27 Getting electricity 70 22 Registering property 138 154 Getting Credit 42 25 Protecting Minority Investors 8 13 Paying Taxes 157 115 Trading across Borders 133 68 Enforcing Contracts 178 163 Resolving Insolvency 136 52 OVERALL 130 63
Source: Ease of Doing Business, World Bank 2020.

54 Orissa Journal of Commerce, Volume XXXXI, April- June-2020, Issue No-II
Figure :3. Ease of Doing Business Index: India(2010 TO 2019)
Source: World Bank publicationsTable :3. India’s Position in Insolvency Resolution.
Year Insolvency ranking Ease of doing Business ranking 2017 136 130 2018 103 100 2019 77 77 2020 52 63
Source: World Bank publications.
It is observed that though there are some fluctuations in India’s ranking in last three years withregards toinsolvencyresolution, but there is a trend showing that India has substantially benefitted fromthe introduction of IBC. In last part of 2016, India’s ranking was in 136 position which improved to 52position in the last part of 2019. Presently India’s ranking is 52 which is very close to China’s rankingof 51. However, Thailand and Malaysia ranking are much better than India.
“Before IBC, the recovery (of debt) rate was around 26% and the time taken for closure of the casewas over four years. IBC has changed this. Now the average recovery rate is 43% in case of financialcreditors and 49% in case of operational creditors. The time average time taken under IBC is 1.6 yearscompared to 4.3 years earlier. In the earlier resolution regime, the cost of the resolution was 9%, whichhas come down to 1% post IBC”1.

55Orissa Journal of Commerce, Volume XXXXI, April- June-2020, Issue No-II
Table 4. Recovery Rate and the Cost of Resolution
Time Recovery Cost of resolution Before IBC 4.3 years 26% 9% After IBC 1.6 years 46.5% 1%
Source: Business Today magazine, Oct 14, 2019
IBC, Mandated Days and 12 Large Stressed Accounts:Reserve Bank of India in the year 2017 had sent a list of high valued twelve stressed accounts
to respective banks to resolve the NPA issue through Insolvency and Bankruptcy Code. Accordingly,resolutions of 12 large accounts were initiated by banks. All these companies in total had an outstandingclaim of Rs.3.45 lakh crore as against liquidation value of Rs. 73,220 crores. These cases in a wayposed a challenge to the newly enacted IBC and also for the newly created institutions under IBC.Thebanks (FIs) approached the National Company Law Tribunal (NCLT). The defaulters’ list comprised ofBhushan Steel Ltd, Bhushan Power & Steel Ltd, Essar Steel Ltd, JaypeeInfratech Ltd, LancoInfratechLtd, Monnet Ispat& Energy Ltd, Jyoti Structures Ltd, Electrosteel Steels Ltd, Amtek Auto Ltd, EraInfra Engineering Ltd, Alok Industries Ltd and ABG Shipyard Ltd, constituting 25% of total non-performing assets in the country. All these corporates were chosen on the basis of NPA of more thanRs.5000 crores each. The objective was to complete the corporate insolvency resolution process withinmandated time which would ensure value maximization through faster resolution.
Table 5 . Mandated Time for Corporate Insolvency Resolution Process Under IBC
Source: IBC 2016.

56 Orissa Journal of Commerce, Volume XXXXI, April- June-2020, Issue No-II
As against these mandated day for each process, the following table shows the hitsand misses of the twelve large account.
Table 6.IBC Process Timelines For RBI in12 Large Cases (in Days)
Filling to Admission
Admission to Public Announcement
Admission to EOI
Admission on to Receipt of Plans
Admission to Plan Submission to NCIT
Admission to Final NCIT Order
Total Days Taken for Resolution /Closing
Prescribed 14 3 75 135 165 180-270 ABC Shipyard 29 3 41 258 290 NA 621 days
Alok Industries
19 1 72 - - NA 270 days
Amtek Auto - 5 - 225 266 357 848 days liquidation
Bhushan P&S - 2 57 391 NA NA Still under NCLT
Bhushan Steel
23 0 73 205 - 285 285 (9.8.18)
Electrosteel Steels
- 0 68 - 255 265 265.(17.4.18)
Era Infra - - 97 NA NA NA 861
Engineering 3.3.19
ESSAR Steel - 14 65 - NA NA 23.3.19(841 days)
JAYPEE Infra
- 1 79 - - NA 14.1.19 (under liquidation)
Jyoti Structures - - 51 - NA NA
Lanco Infra - 3 103 260 269 399
Monnet Ispat - 7 65 228 - 358
Actual average
24 4 70 261 270 333
1- NA indicates ‘not applicable’. It indicates that the case has not reached this stage in the process. 2- -indicates that the timeline date is not available.
Source: Watching The IBC: Lessons from the RBI-12 Cases Bloomberg Quint Opinion September24, 2018.

57Orissa Journal of Commerce, Volume XXXXI, April- June-2020, Issue No-II
A look at these stressed account after 3 years reveals that the resolution plan in respect of sevencorporate debtors (CD) have been finally approved and liquidation order have been passed in respectof two CDs. Further, due to failure of implementation of approved resolution plan in respect of one CD(Amtek Auto Limited), again the liquidation process has restarted. Thus, the corporate insolvencyresolution processes (CIRP) in respect of 3 CDs and liquidation in respect of 2 CDs are ongoing.
TABLE 7: Twelve Large Accounts:
Name of Corporate Debtor
Claims of Financial Creditors Dealt Under Resolution
Realisation by all Claimants as a percentage
Successful Resolution Applicant Amount
Admitted Amount Realised
Realisation as Percentage of Claims
Of Liquidation Value
Completed Electrosteel Steels Ltd. 13175 5320 40.38 183.45 Vedanta Ltd.
Bhushan Steel Ltd. 56022 35571 63.5 252.88 Bamnipal Steel Ltd.
Monnet Ispat& Energy Ltd. 11015 2892 26.26 123.35
Consortium of JSW and AION Investments Pvt. Ltd.
Essar Steel India Ltd. 49473 41018 82.91 266.65 Arcelor Mittal
India Pvt. Ltd.
Alok Industries Ltd. 29523 5052 17.11 113.96
Reliance Industries Ltd. JM Financial Asset Reconstruction Company Ltd. JMFARC-March 2018-Trust
Jyoti Structures Ltd. 7365 3691 50.12 387.44
Group of HNIs led by Mr. Sharad Sanghi
Bhushan Power & Steel Ltd. 47158 19350 41.03 203.39 JSW Ltd.
Under Process Amtek Auto Ltd. CIRP re-commenced Era Infra Engineering Ltd. Under CIRP
JaypeeInfratech Ltd. Under CIRP
LancoInfratech Ltd. Under Liquidation ABG Shipyard Ltd. Under Liquidation
Source: Insolvency and Bankruptcy News IBBI, Sept-Dec. 2019 issue. Vol 13

58 Orissa Journal of Commerce, Volume XXXXI, April- June-2020, Issue No-II
It is found from the above study that seven out of twelve corporate debtors have been successfullyresolved and there is continuation of business. It is futher observed that the average realisation asPercentage of Claims is 45.89 percentage which is much better than under the previous laws.Therealisation by all Claimants as a percentage of liquidated value (the price of an asset when it is allowedinsufficient time to sell in theopen market. It is typically lower than fair market value. The seller isunder extreme compulsion to sell) is about 221%. (IBBI 2020)
The average days taken for resolution, excepting in one case, is more than the mandated days of270 days. In three cases it has taken more than 800 days and three cases are still under CIRP. Thisshows there are still some unresolved issues in the code which need to be addressed to make IBCeffective. According to the Insolvency and Bankruptcy Board of India (IBBI) data, till September2019, 156 CIRPs have yielded resolutions and the average time taken for resolution, including the timeexcluded by the adjudicating authority (AA) is 374 days; if the time excluded by the AA is consideredthen the average time taken would stand at 347 days. Either way, the time taken for resolution is morethan the government’s revised deadline of 330 days.
Table 8. Overall Corporate Insolvency Resolution Process
Quarter CIRPs at the beginning of the Quarter
Admitted
Closure by CIRPs at the end of the Quarter Appeal/Revie
w/Settled
Withdrawal under Section 12A
Approval of Resolution Plan
Commencement of Liquidation
Jan-Mar, 2017 0 37 1 0 0 0 36
Apr-Jun, 2017 36 130 8 0 0 0 158 Jul-Sept,2017 158 235 18 0 2 8 365 Oct-Dec,2017 365 144 40 0 7 24 438 Jan-Mar,2018 438 196 21 0 11 59 543 Apr-Jun,2018 543 250 22 1 14 52 704 Jul-Sept,2018 704 242 32 27 29 87 771 Oct-Dec,2018 771 276 10 39 18 82 898 Jan-Mar,2019 898 376 35 22 20 86 1111 Apr-Jun,2019 1111 300 22 24 27 95 1243 Jul-Sept,2019 1243 565 23 18 32 153 1582 Oct-Dec,2019 1582 561 14 4 30 134 1961 Total NA 3312* 246 135 190** 780 1961
Source: IBBI Newsletter Dec 31,2019

59Orissa Journal of Commerce, Volume XXXXI, April- June-2020, Issue No-II
Table 9. Clogging the Process (in Days)
Status of CIRPs No. of CIRPs > 270 days 635 > 180 days ≤ 270 days 247 > 90 days ≤ 180 days 537 ≤ 90 days 542
Source: IBBI Newsletter Dec 31,2019
Table 10: CIRPS Orders for Liquidation
Sate of Corporate Debtor at the Commencement of CIRP No. of CIRPs initiated by FC OC CD Total
Either in BIFR or Non-functional or both 215 249 97 561 Resolution Value ≤ Liquidation Value 263 295 102 660 Resolution Value > Liquidation Value 57 31 26 114
Source: IBBI Newsletter Dec 31,2019
It is observed that the cases admitted by NCLT have grown at exponential rate. During April-June2017, (in the initial days of IBC) there were only 36 cases admitted but it is found that 561 cases wereadmitted during October 2019 to Dec.2019. This is a rise of 15 times. But the rate of resolution of casesis far behind therateof admission of cases at NCLT. This is evident from the fact that, against admissionof561 cases during last quarter of 2019, only 30 were resolved, 134 were liquidated, 246 have beensent to Appeal/review/settled. Further looking at the numbers of disposal from the beginning of IBC,60% cases are still under CIRP and More than 20% of cases admitted so far have already crossed theinitially mandated period of 270 days.
Table 11. India’ Relative in Insolvency Ranking
Parameter India South Asia OECD High Income Resolving Insolvency Rank 52 104 28 Resolving Insolvency Score (0-100) 62 40.8 74.9 Recovery Rate (Cents on the Dollar) 71.6 38.1 70.2 Time (Years) 1.6 2.2 1.7 Cost (% of Estate) 9 9.9 9.3 Strength of Insolvency Framework Index (0-16) 7.5 6.5 11.9
Source: World Bank’s Doing Business Report 2020

60 Orissa Journal of Commerce, Volume XXXXI, April- June-2020, Issue No-II
The Big Picture: According to National Judicial Data Grid (NJDG.2018), the backlog of cases indifferent courts in India is touching 3.3 crore. While 2.84 crore cases are pending in different subordinatecourts, the backlog which are clogging the High Courts and Supreme Court is 43 lakh and 57,987cases, respectively. Of all the pending cases, 60% are more than two years old, while 40% are morethan five-year-old. In the Supreme Court, more than 30% of pending cases are more than five years old.In the Allahabad High Court, 15% of the appeals have been pending since 1980s1. This is sufficient tounderstand the judiciary eco- system of India. This is important because the insolvency resolution isbasically a judiciary process. In a globalised economy, when the best economies of the world have aninsolvency resolution period of less than one year, the longer process of judiciary proceedings willpush the India downward in DB. All the previous laws were a kind of open-ended approach withoutmuch of importance of time-bound resolution. The major drawbacks of the previous laws are wellevident from the fact that 70,000 cases are pending in the Debt Recovery Tribunal involving more thanfive lakh crores of rupees which has recently gone up to more than 1 lakh cases.
The bigger question here is that can IBC2016 be different from the previous Insolvency Acts? Canit be different from the usual long litigation and delay that happens in Indian judiciary system? Can themandated 330 resolution period be really achieved?
Challenges for Effective Working of IBC: It is evident from the above analysis that the timetaken to resolve insolvency is critical as it has a direct impact over the percentage of recovery of thedebts from the corporate debtor. A major challenge to the resolution process under the IBC is cloggingof the 27 NLCT benches functioning around the country. There are various reasons for chocking theCIRP. The main reasons are:
i. Due to market disruption there is a rising financial stress on the corporates leading to morecases under IBC.
ii. A low threshold (the default of Rs 1 lakh) for the IBC process are attracting a greater numberof operational creditors to file cases under IBC.
iii. Lack of enough judiciary and technical personnel in NCLTiv. Lack of adequate information asymmetry as resolution applicants often do not have complete
information.v. Delays caused by multiple appeals and contradictory verdicts at different levels.Strengthening of the Institutions: One of the major findings of this paper is that it is essential to
strengthen the institutions associated with the CIRP for effective and timely disposal of insolvencycases. The institutionswhich needs to be strengthened are:
1. Insolvency and Bankruptcy Board of India. ((IBBI)2. National Company Law Tribunal. (NCLT)3. Insolvency professionals (IP)4. Information Utilities. (IU)1. IBBI: is the main regulator and is entrusted to implement the Insolvency and Bankruptcy Code
in the country. IBBI also ensures that the resolution is made within the mandated time to get maximum

61Orissa Journal of Commerce, Volume XXXXI, April- June-2020, Issue No-II
gain from debtor’s assets to pay off the creditors. It handles the cases using tribunals i.e. NCLT andNCLAT IBBI is also responsible for creating information utilities. The IBBI is constituted by ten-member committee which includes one chairman, three members from central government, one memberis nominated by RBI and five members are nominated by Central Government The main challengesbefore IBBI is to ensure the resolution within the mandated time. So, strengthening all the institutionsinvolved in the process i.e. NCLT, appointment of enough number of IPs and ensuring informationutility services are the major challenge before IBBI.
2. NCLT: Presently there are sixteen of benches of NCLT including the principal bench. Thereare 18 judicial members and 7 technical members. The experts are afterview that there should be atleast 64 members in the NCLT for handling increasing number of cases. As per the data provided byNational Company Law Tribunal (NCLT), 19771 cases were pending with NCLT benches ason30.09.2019, out of which 1961 cases were filed under IBC 2016. So, with huge number of pendingcases in NCLT, the increase in number of both judiciary and technical members must be increasedsubstantially. Some also argue that a higher threshold limit for filing under IBC from the current levelof Rs 1 lakh maybe increased to regulate the number of cases.
3. Insolvency Professionals (IP): The IPs form a crucial pillar for timely functioning as well ascredibility of the entire edifice of the resolution process under IBC. The role of IPs encompasses a widerange of functions, such as identification of the assets and liabilities of the defaulting debtors, itsmanagement during the insolvency proceedings, preparation of the resolution proposal, implementationof the solution for individual resolution and negotiation of deals as well as distribution of the realisationproceeds under bankruptcy resolution. Since IPs are one of the most important pillars of theimplementation of IBC, they need continuous hand holding support from insolvency professionalagency (IPA) who gives the registration to the IPs. IBBI, so far has recognised three IPAs i.e. IndianInstitute of Insolvency Professionals of ICAI, ICSI Institute of Insolvency Professionals and InsolvencyProfessional Agency of Institute of Cost Accountants of India. There are now 2915IPsregistered withthese IPA till December,2019. Sharing the experience, one of the IPs told the author that it is a lonelyfight of IPs without the support of IBBI and IPA. They need to guide the IPs as the they are all individuals.The IPs feel sometimes harassed by the corporate debtors. Even if there is a non-cooperation clause inthe IBC to face such kind of CDs but there are sometimes grey areas where the IPA should come andhandhold the IPs for the smooth functioning of IBC.’
4. Information utility (IU): Presently there is only one organization functioning as National e-Governance Services Ltd. (NeSL) This is a professional organization, registered under section 210 ofIBC to provide authenticated information of debts and defaults of debtors. A major roadblock in theresolution process under IBC is the lack of information regarding the assets, the list of claimants, contractsare in operation of the CD and also on the financial transactions of the lender under one roof. TheInformation Utility aims at providing relevant and authentic information to IP, NCLT and all otherinvolved in the resolution process. IU is expected to play a key role in sharing financial information ofthe users helping the lenders in taking the informed decision and it would also make CD cautious as thefinancial information is available with the utilities. But the major challenge is the getting authenticinformation from the CD, financial creditors and operational creditors Mostly there is a resistance from

62 Orissa Journal of Commerce, Volume XXXXI, April- June-2020, Issue No-II
CD, particularly regarding the contracts and other assets and liabilities associated with the CD. Sometimesboth CD and FI are resistant for the risk of exposure to data piracy and data theft.
Findings:The study strongly suggests that timely resolution of insolvency cases leads to a better recovery of
debts across all countries of the world. It is found that when time taken for insolvency resolutions isless, recovery of debt is more and vice versa is the case. So, the resolution process must be madespeedier which is the very purpose of the regime.
It is found from the study that seven out of twelve large accounts have been successfully resolvedand there is a continuity of business. The average realisationasapercentage of claims areapproximately45 percentage which is much better than under the previous laws. The realisation by all claimants as apercentage of liquidated value is about 221%.The average days taken for resolution excepting in onecase is more than the mandated days of 270 days. In three of these cases, it has taken more than 800days and three cases are still under CIRP. This shows there are still some unresolved issues in the codewhich need to be addressed to make IBC effective.
The number of cases admitted by NCLT have grown at an exponential rate. But the resolution ofcases has not been able to keep up at desired pace. This is evident from the fact that, against admission561 cases during last quarter of 2019, only 30 were resolved, 134 were liquidated, 246 have been sentto appeal or review. Further looking at the nos. of disposal from the beginning of IBC, 60% of the casesare still under CIRP. More than 20% of cases admitted so far have already crossed the initial mandatedperiod of 270 days.Therewere total numberof 19,771cases pending with NCLT benches as on 30.09.2019,out of which 1961 cases were filed under IBC 2016.GoI must strengthen the institutions such as IBBI,NCLT, IP and IU to make IBC really effective in long run.
The major reasons for rise in the case are due to market disruption leading to financial stress, a lowthreshold (the default of Rs 1 lakh) limit for the IBC process, lack of sufficient number of judiciary andtechnical personnel in NCLT and lack of adequate information services.
Conclusion:The IBC 2016 is conceived to be a game changer code for insolvency resolutions in India. IBC for
the first time in the insolvency resolution process seeks proactive engagement with all stake holderssuch as financial creditors, operational creditors, employees as well as the promoters. The main objectiveof faster insolvency resolution and value maximization of corporate person and other business entities,to promote entrepreneurship, availability of credit and balance the interests of all the stakeholders isbeing realised to an extent. There is a visible change in perception now among the corporates, investors,financial and operational creditors. The government is also largely contributing by bringing in timelychanges through necessary amendments to the code. It must also contribute further by way ofstrengthening of all institution involved in the process. An eco-system must be created where competentpeople must come and contribute to make sure that the process is completed on time. Otherwise, it willmeet fate of all previous laws relating to insolvency.

63Orissa Journal of Commerce, Volume XXXXI, April- June-2020, Issue No-II
References:
• Anand, P. (2017) “The IBC 2016 route to industrial revival corporate insolvency resolutionthrough revival packages” Chartered Secretary. Vol.47 (90-92)
• Bandhyopadhyay, T. (2018)”Why Indian bankers are on overdrive to clean-up books”. Mint15 January.
• Bansal, S, (2017).”Resolving the conflict between the Corporate Insolvency Resolution Processand Relief Undertaking Legislation”.
• Chatterjee, S. Shaikh,G. and Zaveri, B.,(2017) “Watching India’s insolvency reforms: a newdataset of insolvency cases” IGIDR, Mumbai,
• Chemin, M (2010) “Does Court Speed Shape Economic Activity? Evidence from a CourtReform in India”. The Journal of Law, Economics, & Organization, - academic.oup.com.Companies Act, 2013 (2013).
• ET Bureau, (2018) IBC Bill Passed in RS, Norms may change for MSMEs. The EconomicTimes (7th Jan.18)
• Gaitonde,H, (2017) “The role of insolvency and bankruptcy board of India under the insolvencyand bankruptcy code 2016” Chartered Secretary.Vol.47 Sept. 50-55
• Gokumar, G., Archana, A. (2017)”Banks to refer 25 firms on RBI’s second list to NCLT”Mint 30 December.
• Goswami, D. (2017) “Insolvency resolution professionals’ predicament against difficult “corporatedebtors”. Chartered Secretary, Vol.47 (61-64)
• IBBI (2019) The Quarterly Newsletter of the Insolvency and Bankruptcy Board of India Vol.13,12&11,
• IBBI (2017) The Quarterly Newsletter of the Insolvency and Bankruptcy Board of India. Vol,2,3& 4,
• Adalet, M. McGowan, Andrews,D. (2018) Design of Insolvency Regimes Across Countries• Binder, J, H. (2019) Research Handbook on cross-boarder Bank reconciliation, Edward Ellgar
Publishing Limited, USA (30-56)• Economics Department Working Papers No. 1504 (30-31)• IBC (2016).Insolvency and Bankruptcy Code, 2016.• International Monetary Fund, Global Financial Stability Report. 2019 The World Bank Group.• Jagatramka, A. (2018) “NPA resolution through liquidation” The Economic Times (18th Jan.
18)• Jain, K. (2017) “Insolvency and bankruptcy code, 2016: a sustainable structuring of stressed
assets, Chartered Secretary, Vol.47• Kothiyal, K. (2017) “Execution is key to NPA resolution under the bankruptcy code” Mint
(26th Dec.17)

64 Orissa Journal of Commerce, Volume XXXXI, April- June-2020, Issue No-II
• Krishnan, R. (2017) “Bumpy road ahead of RBI” Mint (11th Jan 2017).• Mehra, A. (2018) “Will the bankruptcy code fix the NAP issue?” Mint. (8th Jan.18)• Ravi, A. (2015). The Indian insolvency regime in practice: An analysis of insolvency and debt
recovery proceedings, IGIDR(027).• RBI Notification (2019) Prudential Framework for Resolution of Stressed Assets. 7th June.• Sahoo, M. (2019 “A journey of endless hope” keynote address at the 2ndAnnual Singapore
on 1stApril, 2019• Sahoo, M. (2019) “IBC: A code for corporate governance” IBBI Newsletter vol 13 (3-4)• Sahoo, M. (2019) “Whose Company is it anyway?” IBBI Newsletter vol 12 (2-2)• Shah, Ajay, and Pratik (2015).How to make courts work.IGIDR Working Paper. Nov. 2015.• Sumit, S. (2017) “IBC: Potential game changer for asset reconstruction companies” Mint (26
Dec.17)• Sunita, C. Kshamta, C, Anita D. Journey (2019) Towards Recovery: Insolvency & Bankruptcy
Code of India –A Mirage or a Milestone? IJRTE, Volume-8 (1-4)• The report of the Bankruptcy Law Reforms Committee Volume I: (2015). (35-44)• Unnikrishnan, A. (2019) Safe Harbour in Insolvency Proceedings, www.ibbi.gov.in. (29-35)• World Bank Group (2019) Doing Business: Measuring Business Regulations• World Bank Group (2019) Ease of Doing Business Index• World Bank Group (2019) Resolving insolvency• WWW,nipfp.org.in(2018)Value Destruction and Wealth Transfer under Insolvency. Working
Paper 247 (24-32)(Footnotes)1. Insolvency and Bankruptcy Code, 2016.2. The World Bank is an international financial institution that provides loans to countries of the world
for capital projects. It comprises two institutions: The International Bank for Reconstruction andDevelopment, and the International Development Association. The World Bank is a component ofthe World Bank Group, which is head quartered at Washington, D.C. USA.
3. Insolvency and Bankruptcy News, IBBI, Oct –Dec 2019. Vol. 134. Credit Rating Information Services of India Limited, Mumbai14.05.195. The pressing need to recode the IBC, 22 Nov 2019 Shriji Agrawal.6. Business Today, Oct 14, 20197. The WB national uno=iversity of judicial sciences 2019.
65Orissa Journal of Commerce, Volume XXXXI, April- June-2020, Issue No-II
Corporate Environment Responsibility(CER)of theParadip Port Trust (PPT) with Special Reference to
Air and WaterK.P. Rao1, Prof. Srinivas Subbarao Pasumarti2 & Kamala Kanta Dash3
ABSTRACTPorts are the gateways for global trade and are crucial to economies around the world. But there
are also major sources of ship pollutions, vehicle emissions, dust, and noise which leads to Air andWater pollution. Ports are often close to heavily populated urban areas exposing millions of populationsto pollution. Ports contain shipping vessels, powered machinery which runs on heavy fuel results inelevated emission. The trucks supplying the materials in and out of the port also causes air and waterpollution like dust, smoke, and particulate matter. Air and Water pollution causes severe respiratoryproblems, cardiovascular diseases, lung cancer, and premature death also. So, here the researchertook two components i.e. “Awareness about Air & Water Pollution”, and “Challenges on Air & WaterPollution” and collect the opinions from the 336 public persons who are from surrounding areas ofPPT. He analyzed it with some demographic factors by using regression analysis.
Keywords:Corporate Environment Responsibility (CER), Paradip Port Trust (PPT), Air, WaterIntroduction:
Corporate Environment Responsibility (CER) is a modern idea/form of business-to-environmentcooperation. Environmental sustainability measures strategically take care of present as well as futureinterest. The environmental responsibility of the corporation is comprehended as an extra-sensitiveengagement and significant contemplation since it regulates and directs the achievement of sustainablepractices. It also enables all living things in the Air and Water to share their distilled freedom of expressionand wellbeing in an equal part.The entire universe is scattered with an understated system of unseenthreads and every little vibration counts the gory of damage.
According to UNEP1, “Environmental pollution is one of the sternest and grave problems facinghumanity and other living beings today”. Air pollution globally destroys 3.5 million people’s lives ayear. A. Pruss-Ustun and C. Corvalan, (2006)2 told that “it is also possible to estimate an expected 24%of total sickness and 23% of demises owed to ecological causes around the world”. As per EPI3, India
1. Research Scholar, FMS, Sri Sri University, Cuttack Email:[email protected], Mobile:94398717892. Professor & Dean, FMS, Sri Sri University, Email:[email protected] Mobile:93481 450683. Asst. Prof, FMS, Sri Sri University, Email:[email protected] Mobile:8018809778

66 Orissa Journal of Commerce, Volume XXXXI, April- June-2020, Issue No-II
has done very poorly on the environmental performance index and ranked out of 178 countries as155thcountry. Chetan Chauhan (2011)4 said it was valued little, and initiate to be the world’s 7thecologicallydangerous nation. Ecological deprivation charges India around $80 billion a year, almost 6% of GDP(Victor Mallet, 2013)5. It also has the worst air pollution in the world and has 13 of the twenty utmostcontaminated towns amongst the large markets. Ecological contamination stands a major problem bothglobally and in India.
A port is simply a place of transfer through the water at which products are moved through onemeans of transportation to another. During the context of increased global economy ports areprogressively undergoing transition land/sea functionalities to full providers of the logistics network.This ensures ports have experienced many obstacles due to uncertain environmental changes andirregularities in the shipment, storing, and supply chain businesses.The extent of destruction anddysfunction the company is doing at a specific location negatively impacts the natural world and theecosystem’s transboundary effect. The running of water and the flowing air knows no boundaries. Forexample, in 1984 Bhopal Gas Tragedy caused the deaths of people regarding corporate irresponsibility;even 30 years of community movements can’t fix the perpetual misery of health and terrifying demiseand dreary subsequent dirge. There are many cases of company indifference that have caused significantharm to the environment and human life.Such examples demand study focus on a critical issue such asCorporate Environment Responsibility (CER) in the Ports.
Corporate Environment Responsibility relates to the sustenance of environmental sustainabilityand ecological balance i.e. maintain quality Air, Water, Land, Aquatic animals, Flora fauna of the ocean,etc. Generally, CER practices are like planting trees, sustainable use of resources, life cycle process,renewable use of energy, recycling, green management, use of state-of-art technology, etc. are alsonecessary for corporate to improve upon. Here the researcher takes Air and Water elements from thetotal CERpractices particularly in the Paradip Port Trust and reviews it with related literature in thefollowing sections.Air and Water Pollution:
Pollution including greenhouse gas emissions, acid deposition, water pollution, waste managementis considered as public health problems. Generally, elderly people, children, and pregnant women aremore prone to health issues. Long term exposure to the pollutants causing permanent health problemsin humans. Exposing to air pollutants causing severe breathing problems, exposure to hazardous wastecauses skin problems and some of the pollutants are even carcinogenic. Drinking polluted water causesinfectious diseases in living organisms.Air and Water Pollution at PPT:
The port areas are highly polluted. Ships release 70% of the emissions within 400km of land withthe wind carrying them shoreward. Ship generated emissions are often the chief source of air pollutionand water pollution. Industrial activities at port areas and truck traffic are the major sources of airpollution. Shipping vessels use heavy fuel oil and produce high pollution. Ports handle huge amountsof bulk materials e.g.: foodstuffs, fertilizers, and these materials in dry and windy conditions cause dustdrifting into neighbouring areas. Ports face the challenge of maintaining water quality. Activities suchas boat repair, transportation, terminal operations, cargo handling, and storage all have a potential impacton water quality. Due to changes in water quality, marine habitats can’t survive and they move to other

67Orissa Journal of Commerce, Volume XXXXI, April- June-2020, Issue No-II
places. Apart from the port activities, the domestic waste from the residential areas will also be releasedinto the sea which also has an impact on the quality of water.Review og Literature:
Paradip is situated uniquely of twelve Odisha Industrialized Areas. Much of Odisha’s large-scalefactories are bright6. Both sectors in Paradip stand comprehensive and category red. Paradip area is thenatural home of fauna & flora. Nadiya Chand Kanungo (2013)7expressed that “This area of biodiversityhas been affected by the large-scale destruction of mangrove forests and vulnerable environmentalconditions caused primarily by rapid industrialization.”
“The survival of Hilsa fish and Olive Ridley has also been adversely impacted by industrialization.The Paradip Port area is the place where horseshoe crabs mating and nest. A rare species of frogsnamed F.cancrivora are also seen in this area. If adequate safety measures for the survival of thesecreatures are not taken then they are exposed to industrial pollution.”8
K.O. Konhauser(1997)9 “Few factories contribute tremendous amounts of wastewater or agriculturaleffluent polluting the Mahanadi River at the Atharbanki Creek confluence.”
“Fertilizer industry extracts (Paradip Phosphates Limited) in the form of gypsum waste threat(calcium sulphate), are stored in the gypsum pool. Gypsum pond management needs to be performedcorrectly or the negative effects would affect stakeholder lives. When heavy dumping happens, thepolluted water brings to a large degree pollutes the water source” (Manipadma Jena2008)10.
According to Orissa State Pollution Control Board11 “The fluoride content in the test wells exceedsthe permissible limit, whereas the groundwater quality outside the plant area is within the requireddrinking limit.”
K. Venugopala Rao (2000)12 said that “The amount of Suspended Particulate Material (SPM) hereis very troubling and beyond the defined requirement since a significant quantity of container dust inthe port area is widespread. So the industry’s Corporate Environmental Responsibility at Paradip raisesquestions about their commitment to society and the environment”.
Claudio Comoglio& Serena Botta (2012)13 expressed that “Empirical research finding onEnvironmental Sensitive Management (ERM) shows that performance enhancement and cost savingsare interrelated and also introduces a firm’s attention to improving environmental efficiency. OtherCER’s self-motivating activities like life cycle thinking, green attitude, and commitment to self-regulation”. The opponents, who accept external forces as the driving force for successful enforcementof CER, stress competition from creditors, regulatory authority, customer expectations, and interventionfrom civil society etc. (Melanie Beth Oliviero and Adele Simmons, 2013)14.
Ports show a major part in many ways in the growth of nations’ economies and areas (Chang et al.,2014)15. Because ports are worth generating supply chain centers (Robinson, 2002)16and an essentialportion of the business series scheme, their relevance develops far more critical for port operators.
Port authority in a nation thus needs wide-ranging legislation to ensure that ports are operatedefficiently, and ports support their customers and the interests of the public. Governments around theglobe use privatization and port governance strategies to ensure that ports consumers gain reliable andcost-effective infrastructure and eventually make a full public profit (Baird, 2002)17.

68 Orissa Journal of Commerce, Volume XXXXI, April- June-2020, Issue No-II
Ports and their officials are critical portals for economies of nations, just as the global maritimemarket as a whole positions national and international expansion at a very central role in globaleconomics. Without it, transferring manufactured goods and equipment from the developed Westernworld via the supply chain to the consumer markets of developing countries becomesdifficult(Chrizanosky, A., 1985)18.
From the above, all literature review researcher understands the importance and need for environmentalsustainability especially in the Ports. So, he decided to study the possibilities through Corporate EnvironmentResponsibility (CER) to maintain environmental sustainability and ecological balance in the Paradip PortTrust (PPT). According to these in the cognizance and its significance, he takes two elements from wholeCER i.e. Air & Water, and developed the below research objectives for the study.Objective of the Study:
• To identify the Air & Water quality parameters of Corporate Environment Responsibilityandtheir impact on Environmental Sustainability in Paradip Port Trust.
• To suggest ways and means improve Air & Water quality for better efficiency of Paradip Port Trust.Air and Water Management in PPT:
In Paradip Port Trust they gave more importance to environmental sustainability. For maintainingecological balance they prepare Environmental Management Plan (EMP) which was explained detailedlyin the following sections.
Environmental Management Plan (EMP) of PPT:A significant key to ensuring a harmless and hygienic atmosphere or climate is the Environmental
Management Plan (EMP). Without a strategic strategy to ensure its correct execution and operation, theexpected outcomes from the environmental protection steps included in the project can not beachieved.The detailed EMP method is shown in the below figure.
Fig. 1: Environmental Management Planning process in PPT
EMP was prepared to tackle these concerns as:Measures to monitor emissions/minimize the negativeimpacts incurred during the project’s building and service process. Description of management plans

69Orissa Journal of Commerce, Volume XXXXI, April- June-2020, Issue No-II
such as air quality control devices/measures, use of treated effluents, plan for the disposal of solidwaste, etc. Establishments identified or recommended for implementation of the EMP. Per the projectmanagement plan to be conducted for expenditure on environmental conservation initiatives and theEMP bill. The EMP shall be prepared for the project’s construction and operational phases also.Environmental Management for PPT Construction Phase:
The change in land use, however, and any associated flora loss, is definite. Modern equipment tobe implemented for emission management through the implementation process of a project, anytimeand where appropriate. Port site planning and construction on a vacant area of the Paradip Port complexshall be undertaken.
• Air Environment: The major source of air pollution is increased vehicular movementduring the phase of project construction. Consequently, mitigation measures arerecommended following: In arid climate time, the dust disturbance caused by earthworks,leveling, and transport operations (vehicle movement) must be controlled by watersprinkling (dust removal). All equipment used in port building for containers, tugboats,barges, launches, etc. shall be adequately managed for maximum fuel consumption andair pollution mitigation. The daily sprinkling of water to be performed on the buildingsite for dust clearance. Appropriate plant species need to be cultivated within and aroundthe planned project site.
• Water Environment: Effect on surface water can be attributed to non-point sewage releaseduring construction period produced at the project site/campsite from the building workforcestations. Therefore the demand for water and the supply of wastewater would be very low.Provide adequate sanitation services for the construction workers. Sanitation services shouldbe made available for worker-generated sewage removal according to OSPCB guidelines.Thenegative impacts of construction activities can be reduced by proper dig up equipment, siltcurtains, etc. Beach erosion may be avoided by proper consideration of the steepness of thedredging slope and the shoreline divergence.Containers used for building purposes shouldbe removed from their buoyancy or ballast into the water body, but the same should bedischarged from the available ballast water treatment facility at the Paradip port.
Environmental Management for During PPT Operation Phase:a) Air Environment: Preventive servicing of valves and other devices should be routinely carried
out. At the design stage, near installations will be designed to reduce workplace hydrocarbon exposure.Continuous monitoring of the ambient air and monitoring of the workplace should be carried out regularlyunder the guidelines of OSPCB/CPCB.
Monitoring functions are like, Ambient air quality checking posts would be arranged;Given theproximity of the Paradip terminal, SPM, RPM, etc. should be continuously monitored to create thedatabase of ambient air quality; Meteorological parameters should be tracked. Testing at sites wheretraffic emissions are high for external criteria, HC and Pb;PM10 and CO testing will be done periodically,as these emissions directly impact the respiratory system; It is recommended that fugitive emissionsfrom welding and painting operations resulting in PM-10 particulates (RPM) and VOCs be minimizedat the open space and around potentially pollution sources inside the PPT.

70 Orissa Journal of Commerce, Volume XXXXI, April- June-2020, Issue No-II
b) Water Environment: Sewage sludge from the dwelling house and sanitary use activities shouldbe treated and used for planting inside the port and premises of Paradip.Sewage treatment plants shouldhave an equalization tank with sufficient size to ensure consistent discharge into sewage treatmentplants.Appropriate housekeeping would be implemented to avoid spillage and polluted surface runofffrom running into stormwater drains.The prospect of recovery and reuse of the effluent by watermanagement initiatives should be researched and implemented.A stormwater control system will bedesigned and installed in and near the areas allocated for processing material to prevent polluted surfacewater and heavy metals from entering, infiltrating, and draining.CER Initiatives in Paradip Port Trust:
According to Corporate Environment Responsibility, in PPTthe tasks and procedures areecologicallybalanced and dedicated to maintaining healthier and eco-friendly activities.The Port engagedin several Green Port initiative activities/schemes. They are – After super-cyclone 1999 PPT planted 8lakh trees in 250 hectares. Around the Port and township every year they planted one lakh trees. PPThas provided 3kms long net barricade with a height of 12ZAqmtrs in the edge of the forbidden area foreradicating air pollution that occurred by coal & iron ore dust.
To Reduce greenhouse gasesPPT developed various Parks, Gardens, and Nurseries in and aroundthe township.They check from time to timeand maintain the pollution level within the permissible limit.For Water Management,through the Taldanda canal, the port fulfilled its water demand of 5.8 MLD.For settling dust/silt etc. PPT constructs three resolving ponds and another three are under constructionof the capacity of 2 MLD two and one 2.5 MLD. Besides that, an Effluent Treatment Plant in theHospital premises is also under construction. Irrigation of port greenbelt and dust suppression will bedone by treated water. For rainwater harvesting structure PPT already invested Rs.0.29 crores. For Spillmanagement, PPT is adequately furnished through oil spill retort equipment and its controlling plan. Itis well-organized to switch any oil spill substitute.
These are all the different CER initiatives to control the Air and Water pollution and maintain theQuality Air and Water in and around the PPT.
Methodology:Primary data:Total population in Paradip is 68,585. Out of which persons having minimum
awareness on environmental impact around 80% of 49786 adult population is 39830 (approximately).Thus, the sample size considered for this study based on the formula i.e., people who participated in thesurvey are 336.
i) Sample Size Formula:

71Orissa Journal of Commerce, Volume XXXXI, April- June-2020, Issue No-II
With a population of 39830 assuming a 90% confidence interval with 5% precision level and withestimated variation in the population assumed 50%(0.5). The response rate observed from the pilotstudy is 80%. Thus, the sample size obtained from the population is approximately 336 (which was theactual sample size considered for the present study for the General Public questionnaire).The researcherhas considered all the categories of the respondents by considering above 18yrs of age respondents bycovering both the genders with different marital status. Also, the researcher considered different yearsof stay in Paradip, different educational backgrounds, different types of respondents (Skilled andTechnical) as well as different primary activities of the respondents.The researcher, on completion ofthe pilot study, has collected the required data using schedule, interview, and observation methods.
a) Scoring and Measurement of Variables:The multiple elements in the Questionnaire representspecific scale factors, i.e. variables linked both to the dependent variable and to the correspondingvariables are given on a 5-point Likert pattern. Along with the numerical values assigned to them forcalculation purposes, the five answer groups are: Strongly Agree (5), Agree (4), Positive (3), Disagree(2) and Strongly Disagree (1). Since the test used a five-point scale, average scores of 3 and abovesuggest a mild propensity to this dimension and scores above 4 mean that there is a greater degree tothis dimension.
b) Data Interpretation:An effort is made to examine and consider the opinions of the surveyrespondents in Delhi NCR regarding Organizational Leadership for Progress in the ICT Industry.
They feed the data to the machine. Tabulations and empirical tests were carried out using SPSS(Statistical System for Social Sciences) version 16, MINITAB version-18, and Microsoft Excel 2010for statistical measures such as basic percentages, normal mean values anomalies, etc. The student t-test is conducted to assess the relevant mean discrepancy between the respondents’ two groups, such asSex. When more than two groups have been performed ANOVA tests to determine the major differencebetween groups such as age, employment, profession, monthly income, monthly savings, and total savingsspent. The ANOVA analyses and T-tests are carried out using the multiple linear regression model,based on the relevant findings found for the independent variables in each aspect of the current subject.
Regression analysis was carryforward by taking the dependent variables as dimensions related toall the dimensions of all the three questionnaires with the demographic variables(Age, Years of stay in

72 Orissa Journal of Commerce, Volume XXXXI, April- June-2020, Issue No-II
Paradip, Qualification, and Primary Activity). Data is verified with Normal assumptions. The responsegiven by the authorities follows the normal distribution. So, for this data student-tests performed forthe demographic variables age and qualification to know the difference in the opinion of the authoritiesbelonging to different age groups as well as different qualifications. For this non-normal data, KruskalWallis tests were administered to know the significant difference in response among different categoriesof the respondents by their respective age group, by their educational background, by their primaryactivity and by their years of stay at Paradip on all the significant aspects related to the present researchbased on the significant level(5%) observed from the regression analysis. The significance level isconsidered 5% (P-value< 0.05) for all the statistical tests.
Secondary Data:The researcher has collected the information from various published sources aboutthe Corporate Environmental Responsibility in Ports. He collected huge information on Paradip PortTrust from various libraries, internet, Government policies, Acts, etc.Data Analysis:
Here the researcher took two components i.e. “Awareness about Air & Water Pollution”, and“Challenges on Air & Water Pollution”with nine statements and collect the opinions from the 336 publicpersons who are from surrounding areas of PPT and analyzed it in the following tables. He also comparesthe results with demographic factors.
Awareness about Air & Water Pollution:Here the researcher collected the opinions on the different statements of “Awareness about Air &
Water Pollution” from sample Public and depicted it in the following table.Table 1: Opinion of the respondents on “Awareness about Air & Water Pollution”
Q. No.
Awareness about Air & Water Pollution
SDA DA N A SA Mean % Score
1. Paradip Port main roads, inside port areas, and port residential areas are free from Trash, no dust accumulation on roads, no dust pollution, no unwanted smell, etc.
129 (38.4%)
132 (39.3%)
24 (7.1%)
47 (14%)
4 (1.2%)
2.0 25.1
2. Paradip port is taking the necessary precautions to control the pollution.
5 (1.5%)
137 (40.8%)
136 (40.5%)
49 (14.6%)
9 (2.7%)
2.8 44.0
3. Air quality levels in Paradip are under safe limits.
102 (30.4%)
173 (51.5%)
37 (11%)
19 (5.7%)
5 (1.5%)
2.0 24.1
4. Very good quality of drinking water available at Paradip.
68 (20.2%)
205 (61%)
33 (9.8%)
24 (7.1%)
6 (1.8%)
2.1 27.3
5. PPT, Central, and State governments are already taking preventive measures to control air pollution?
12 (3.6%)
90 (26.8%)
139 (41.4%)
88 (26.2%)
7 (2.1%)
3.0 49.1

73Orissa Journal of Commerce, Volume XXXXI, April- June-2020, Issue No-II
Analysis of the statements:1. Regarding the statement “Paradip Port main roads, inside port areas and port residential areas
are free from Trash, no dust accumulation on roads, no dust pollution and no unwanted smell,etc.” 39.3% of the respondents disagree, 38.4% of the respondents strongly disagree and only1.2% of the respondents strongly agree to the above statement. The percentage score of theabove statement is 25.1 which indicates most respondents are in a negative opinionon the abovestatement.
2. When analyzed among the public in Paradip that “The Paradip port authorities are taking thenecessary precautions to control the pollution, 40.8% of the respondents disagree, 40.5% ofthe respondents have a neutral opinion and less than 20% of the respondents have a positiveopinion. The percentage score of the above statement is 44 which indicates almost half of thetotal respondents are positive on the statement, others are in negative opinion, some individualsmay not have any awareness, and some may feel fear to express their views.
3. Regarding the statement that “Air quality levels in Paradip are under safe limits”, more than 3/4thof the total respondents responded negatively and less than 10% of the total respondentsagree. The percentage score of the above statement is 24.1 which means most of them are in anopinion that air quality levels in Paradip are not under safe limits.
4. Regarding the statement that “Very good quality of drinking water available at Paradip”, 61%of the respondents disagree, 20.2% of the respondents strongly disagree, 9.8% of them have aneutral opinion, 7.1% of them agree and remaining 1.8% of the respondents strongly agree tothe above statement. The percentage score of the above statement is 27.3 which means most ofthem are in the opinion that a very good quality of water is not available at Paradip.
5. When analyzed among the public in Paradip whether “PPT, Central, and State government arealready taking preventive measures to control air pollution”, 41.4% of the respondents have aneutral opinion and only 2.1% of the respondents strongly agree to the above statement. Thepercentage score of the above statement is 49.1 which indicates most of the respondents arenot having a clear opinion on this statement.
Regression Analysis:Awareness about Air & Water Pollution vs. Age, Years of Stay in Paradip,Qualification, Primary Activity.Table 2:Model Summary of “Awareness about Air & Water Pollution” vs. Age, Years
of Stay in Paradip, Qualification, and Primary Activity
S R2 R2(adj) R2(pred) 0.629757 49.31% 48.21% 45.61%
The R2(Adj) value is below 60% which concludes that the data is not a good fit for the multiplelinear regression. The R2 value explains that the categorical/demographic variables(Age, Years of Stay,Qualification, and Primary activity) explain around approximately 48% of variation on the factor“Awareness about Air & Water Pollution”.

74 Orissa Journal of Commerce, Volume XXXXI, April- June-2020, Issue No-II
Table 3:Coefficients of “Awareness about Air & Water Pollution” vs. Age, Years ofStay in Paradip, Qualification, and Primary Activity
Term Coef SE Coef T-Value P-Value Constant 1.286 0.199 6.45 0.000 Age 0.01639 0.00426 3.85 0.000 Years of Stay in Paradip 0.00022 0.00566 0.04 0.969 Qualification -0.0064 0.0309 -0.21 0.836 Primary Activity 0.1648 0.0426 3.87 0.000
The p-value of the demographic factors like Age(0.000) and primary Activity (0.000) plays asignificant role in the response given by the public on the dimension “Awareness about Air & WaterPollution”. For these variables, further Kruskal Wallis tests were carry forwarded to know which categoryof age group and which category of primary activity public are opined more positively on this aspectwhen compared with other categories of the public. Whereas other demographic variables like Years ofstay in Paradip and Qualification do not show any significant impact on “Awareness about Air & WaterPollution”.
Table 4: Comparison of public opinion on Awareness about Air & Water pollutionby their Age and Primary activity
Demographic Category N Median Mean Rank
H-Value P-value Decision
Age Below 30Yrs 83 2.2 170.7 23.64 0.000 Significant 30-35Yrs 84 2.2 165.6 35-40Yrs 82 2.0 131.8 Above 40Yrs 87 2.6 203.8
Primary Activity
Business 24 1.9 91.3 19.11 0.001 Significant Government Service
18 2.2 144.9
Private 252 2.2 174.3 Self Employed
17 2.2 187.2
Others 25 2.4 188.6
The above table depicts the comparison of public opinion on Awareness about Air & Water pollutionby their age and primary activity. The median value(2.6) and mean rank(203.8) of the public whose agegroup is above 40years are having significantly more awareness on Air & Water Pollution when comparedto other categories of age groups at a 5% level of significance. The median scores are below 3.00which further confirms that the majority of the public does not have more Awareness about Air & Water
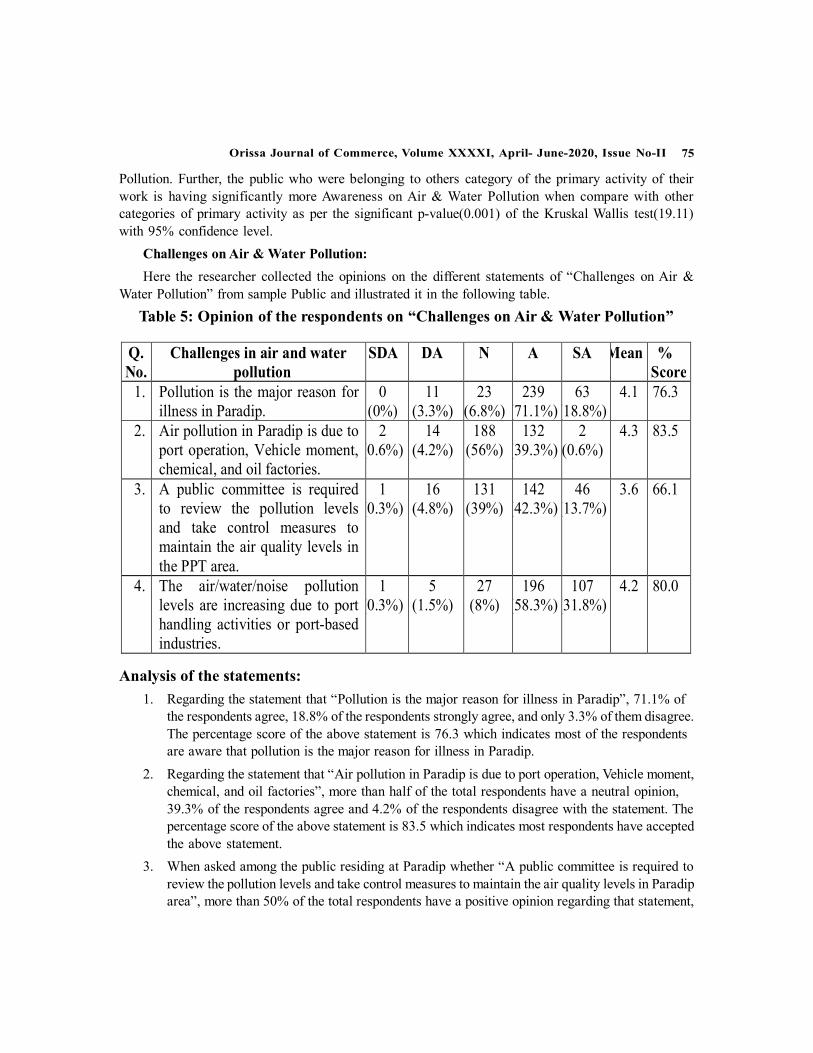
75Orissa Journal of Commerce, Volume XXXXI, April- June-2020, Issue No-II
Pollution. Further, the public who were belonging to others category of the primary activity of theirwork is having significantly more Awareness on Air & Water Pollution when compare with othercategories of primary activity as per the significant p-value(0.001) of the Kruskal Wallis test(19.11)with 95% confidence level.
Challenges on Air & Water Pollution:Here the researcher collected the opinions on the different statements of “Challenges on Air &
Water Pollution” from sample Public and illustrated it in the following table.Table 5: Opinion of the respondents on “Challenges on Air & Water Pollution”
Q. No.
Challenges in air and water pollution
SDA DA N A SA Mean % Score
1. Pollution is the major reason for illness in Paradip.
0 (0%)
11 (3.3%)
23 (6.8%)
239 (71.1%)
63 (18.8%)
4.1 76.3
2. Air pollution in Paradip is due to port operation, Vehicle moment, chemical, and oil factories.
2 (0.6%)
14 (4.2%)
188 (56%)
132 (39.3%)
2 (0.6%)
4.3 83.5
3.
A public committee is required to review the pollution levels and take control measures to maintain the air quality levels in the PPT area.
1 (0.3%)
16 (4.8%)
131 (39%)
142 (42.3%)
46 (13.7%)
3.6 66.1
4. The air/water/noise pollution levels are increasing due to port handling activities or port-based industries.
1 (0.3%)
5 (1.5%)
27 (8%)
196 (58.3%)
107 (31.8%)
4.2 80.0
Analysis of the statements:1. Regarding the statement that “Pollution is the major reason for illness in Paradip”, 71.1% of
the respondents agree, 18.8% of the respondents strongly agree, and only 3.3% of them disagree.The percentage score of the above statement is 76.3 which indicates most of the respondentsare aware that pollution is the major reason for illness in Paradip.
2. Regarding the statement that “Air pollution in Paradip is due to port operation, Vehicle moment,chemical, and oil factories”, more than half of the total respondents have a neutral opinion,39.3% of the respondents agree and 4.2% of the respondents disagree with the statement. Thepercentage score of the above statement is 83.5 which indicates most respondents have acceptedthe above statement.
3. When asked among the public residing at Paradip whether “A public committee is required toreview the pollution levels and take control measures to maintain the air quality levels in Paradiparea”, more than 50% of the total respondents have a positive opinion regarding that statement,

76 Orissa Journal of Commerce, Volume XXXXI, April- June-2020, Issue No-II
less than 5% of the respondents disagree and Percentage score of the given statement is 66.1which indicates most respondents agree that a public committee is required to review thepollution levels.
4. When people residing at Paradip were asked whether “The air/water/noise pollution levels areincreasing due to port handling activities or port-based industries”, approximately 90% of therespondents agree and only 1.5% of the respondents disagree with the statement. The percentagescore of the above statement is 80 which indicates most of the respondents agree with theabove statement.
Regression Analysis: Challenges in Air &Water pollution vs. Age, Years of Stay in Paradip,Qualification, and Primary ActivityTable 6: Model Summary of”Challenges in air and water pollution”vs. Age, Years of
Stay in Paradip, Qualification, and Primary Activity
S R2 R2(adj) R2(pred) 0.473467 52.08% 50.90% 50.00%
The R2(Adj) value is less than 60% describing that the data is not a good fit for the regressionanalysis. The R2 value reveals that the categorical/demographic variables(Age, Years of Stay,Qualification, and Primary activity) explain 51% of variation on the factor “Challenges in Air andWater pollution”.Table 7: Coefficients of” Challenges in air and water pollution”vs. Age, Years of Stay
in Paradip, Qualification, and Primary Activity
Term Coef SE Coef T-Value P-Value Constant 4.119 0.150 27.48 0.000 Age 0.00277 0.00320 0.86 0.389 Years of Stay in Paradip 0.00047 0.00426 0.11 0.913 Qualification 0.0174 0.0232 0.75 0.454 Primary Activity -0.0737 0.0320 -1.89 0.062
All the independent variables like age, years of stay in Paradip, Qualification, and Primary Activitydo not show any significant impact on “Challenges in Air &Water pollution”. Since, the p-value ofthese variables is greater than 0.05, the level of significance. i.e., the public belonging to different agegroups, different categories of the year of stay, different educational backgrounds, and different categoriesof primary activity are opined consistently at a 5% level of significance on the said aspect.
Conclusion:Based on the above data, from the opinion of the public, it is evident that there is a decrease in the
quality of Air & Water at Paradip. PPT area is polluted with a lot of dust, smoke and the people residingin that area are facing a lot of health issues. There is no good quality of water and food supplied tothose residents. Accumulation of dust, trash, and unwanted smell causes a nuisance to the public as

77Orissa Journal of Commerce, Volume XXXXI, April- June-2020, Issue No-II
well it also causes serious ill effects. The port authorities can use various technologies and prevent therelease of effluents into the sea and air. They should also take proper care of disposing of the waste.Health care facilities should be provided as well the government should give high priority to the publicresiding in those areas by giving them the best quality of food and drinking water to improve theirhealth conditions. It is the responsibility of the public to take care of themselves as well as theenvironment.
Suggestions:Frequent monitoring of Air and Water quality should be done and necessary measures should be
taken to improve the quality of air and water.The health care professionals should educate the publicand provide awareness among them regarding the safety measure to be taken and quality food thatshould be taken to avoid the health issues that occur due to various kinds of pollution. The pollutioncontrol board team can work on the environment and the changes that occurred due to pollution andcome up with long term measures. Board will meet at regular intervals to draw up a plan and ensure theenforcement of various measures; Public and Port should go for planting trees in the surroundingareas.Port should release domestic waste through proper channels and use recyclable or eco-friendlymaterials.The authorities should take necessary control measures to prevent air pollution from shipsand improve air quality.References:• Assunta Di Vaio, Luisa Varriale, Federico Alvino, “Key performance indicators for developing
environmentally sustainable and energy efficient ports: Evidence from Italy”, Energy Policy122, pp. 229–240, 2018.
• Afaq Hussain,”Reforming the Indian Port Sector”, Global Journal of Emerging Market Economies,Vol.10, No.1, pp.1–12, 2018.
• Andrei Kuznetsov, John Dinwoodie, David Gibbs, Mark Sansom, Harriet Knowles,”TowardsPort Sustainability Management Systems for Smaller Ports”, Marine Policy, Vol.54, pp.59–68,2015.
• AnneliesBoerema, Katrien Van der Biest, Patrick Meire,”Towards sustainable port development”,https://www.researchgate.net/ publication/321974575, 2017.
• Barnett, M.L., Jermier, J.M., Lafferty, B.A., “Corporate Reputation: The Definitional Landscape”,Corporate Reputation Review, 9(1), p. 28-34, 2006.
• Baron, D.P., “Private politics, corporate social responsibility, and integrated strategy”, Journalof Economics and Management Strategy, 10, pp. 7–45, 2001.
• Basu, K., Mueller, M., “CSR Innovation and Corporate Reputation: a Cross-cultural PerspectiveSummary”, Centre for Corporate Reputation, Oxford University, 2012.
• Beatriz Tovar, Sergio Jara-Diaz & Lourdes Trujillo, “Econometric Estimation of Scale andScope Economies within the Port Sector: A Review”, CCRP Working Paper No 7,Centre forCompetition and Regulatory Policy (CCRP), DAEA, Universidad de Las Palmas de GranCanaria.

78 Orissa Journal of Commerce, Volume XXXXI, April- June-2020, Issue No-II
• “Business plan for Chennai Port Trust: Final report”, December 2006• C.A. Schipper, H. Vreugdenhil, M.P.C. de Jong,”A sustainability assessment of ports and
port-city plans: Comparing ambitions with achievements”, Transportation Research Part D 57,pp. 84–111,2017.
• Delmas, M., Blass, V.D., “Measuring corporate environmental performance: the trade-offs ofsustainability ratings”, Business Strategy and the Environment, 19(4), pp. 245-260, 2010.
• Delmo Alves de Moura, DaviGoulart de Andrade, “Concepts of green port operations – onekind of self-diagnosis method to the Port of Santos – Brazil”, Independent Journal of Management&Production (IJM&P), http://www.ijmp.jor.br, Vol. 9, No.3, 2018.
• DesJardins, J., “Corporate Environmental Responsibility”, Journal of Business Ethics, 17(8),pp. 825-838, 1998.
• G.S Dwarakish, Akhil Muhammad Salim,”Review on the Role of Ports in the Development ofa Nation, International Conference on Water Resources, Coastal and Ocean Engineering(ICWRCOE 2015), Aquatic Procedia 4 , pp.295 – 301, 2015.
• Gãnescu, C., “A methodology to assess the performance of corporate social responsibility. Astudy of the European automotive sector”, StrategiiManageriale, IV (Special no. 2013), Ed.IndependenþaEconomicã, pp. 312-320, 2013.
• “Guide to the Economic Value of Texas Ports”, Center for Transportation Research, TheUniversity of Texas at Austin, Revised December 2008.
• Guoqiang, Zhang, Ning, Zhang, Qingyun, Wang, 2005,”Container ports development andregional economic growth: an empirical research on the pearl river delta region of China”,Proceedings of the Eastern Asia Society for Transportation Studies, Vol. 5, pp. 2136 – 2150.
• Hairui Wei, Zhaohan Sheng,”Dry ports-seaports sustainable logistics network optimization:considering the environmental constraints and the concession cooperation relationships”, PolishMaritime Research, Special Issue 2017 S3 (95) 2017 Vol. 24,pp. 143-151, 2017.
• Hillenbrand, C., Money, K., “Corporate Responsibility and Corporate Reputation: two separateconcepts or two sides of the same coin?” Corporate Reputation Review, 10(4), pp. 261-277, 2007.
• Rao, S.R.1965,”Shipping And Maritime Trade of The Indus People, Expedition”, Spring,1965,pp. 31-37
• Rao, S.R.1992,”A navigational instrument of the Harappan sailors, Marine Archaeology”, Vol3, July 1992,pp. 61-67
• Reinhardt, F.L., Stavins, R.N., Vietor, R.H.K., “Corporate Social Responsibility through aneconomic lens”, Review of Environmental Economics and Policy, 2(2), pp. 219-239, 2008.
• Sayre, D., “Inside ISO 14001: the competitive advantage of environmental management”, St.Lucie Press, Delray, 1996.
• Shinya Hanaoka, Madan B. Regmi,”Promoting intermodal freight transport through thedevelopment of dry ports in Asia: An environmental perspective”, International Associationof Traffic and Safety Sciences, Production and hosting by Elsevier Ltd., 2011.

79Orissa Journal of Commerce, Volume XXXXI, April- June-2020, Issue No-II
• Sleeper, Dana Marie, 2012,”Port Significance: Contributions to Competitiveness in LatinAmerica and Asia”, Journal for Global Business and Community, Volume 3, Issue 1, 22-28.
• “The economic impact of the UK Maritime Services Sector: Ports - A report for Maritime UK(including regional breakdown)”, February 2013.
• “The port development plan to 2025”, Hamburg port authority• Tripati, Sila, 2011,”Ancient maritime trade of the eastern Indian littoral”, Current Science,
Vol. 100, no. 7, 10 April.• Uwe Breitling, “Sustainable Shipping and Port Development”, Sustainable Port Development
in the ASEAN Region, 5thRegional EST Forum in Asia Bangkok, Thailand, pp.23-25 August2010.
• Vijay Hiranandani, “Sustainable development in seaports: a multi-case study”, World MaritimeUniversity 2013, WMU J Marit Affairs, Vol.13, pp.127–172, 2014.
• World Business Council for Sustainable Development, “Corporate Social Responsibility: MakingGood Business Sense”, 2000, [Online], Available: http://www.wbcsd.org/web/publications/csr2000.pdf/ [Accessed Dec. 12, 2013].
• Xavier Seguí, MartíPuig, Eugenio Quintieri, Chris Wooldridge, Rosa Mari Darbra, “Newenvironmental performance baseline for inland ports”, A benchmark for the European inlandport sector, 2016.
• Zhang Y, Kim C-W, Tee KF, Lam JSL, “Optimal sustainable life cycle maintenance strategiesfor port infrastructures”, Journal of Cleaner Production, 2016.
(Footnotes)1. Research Scholar, FMS, Sri Sri University, Cuttack Email:[email protected], Mobile:94398717892. Professor & Dean, FMS, Sri Sri University, Email:[email protected] Mobile: 93481 450683. Asst. Prof, FMS, Sri Sri University, Email:[email protected] Mobile:80188097784. UNEP Year Book, Air Pollution: World’s Worst Environmental Health Risk, (2014), http://
www.unep.org/yearbook/2014/PDF/chapt7.pdf.5. A. Pruss-Ustun and C. Corvalan, Preventing Disease through Healthy Environments, World Health
Organisation 09, (2006),http://www.who.int/quantifying_ehimpacts/publications/preventingdiseasebegin.pdf
6. The Environmental Performance Index (EPI): http://epi.yale.edu/epi/country-profile/india (last visitedSeptember 21, 2014).
7. Chetan Chauhan, India 7th most environmentally hazardous country, The Hindustan Times January10, 2011.
8. Victor Mallet, Environmental Damage Costs India $80 BN A Year, The Financial Times Ltd., July17, 2013.
9. Industries carrying out activities viz., Port, Fertilizer, Vegetable Oils, Oil Refinery, Iron and Steeland Carbon are identified as red-category by the Forest and Environment Department, Governmentof Orissa, (Reference – No. 6194/Env.I – 40/2007/F&E, Dt. 24th April 2007).

80 Orissa Journal of Commerce, Volume XXXXI, April- June-2020, Issue No-II
10. Nadiya Chand Kanungo, POSCO: Ecological Disaster in Coastal Orissa, 2006,http://www.cpiml.org/liberation/year_2006/January/posco_orissa.htm (last visited May 20, 2013).
11. Vibhu Sinha &AteetVatanBahmani, A study on industrial growth along coast line of Orissa and itsundesirable effect on environment using GIS - an olive ridley (sea turtle) perspective,http://www.gisdevelopment.net/application/environment/wildlife/mi08_250.htm (last visited May20, 2013).
12. K.O. Konhauser, Trace Element Geochemistry of River Sediment, Orissa State, India, 193, Journalof Hydrology 258 -269 (1997).
13. Manipadma Jena, Pollution in the Mahanadi: Urban Sewage, Industrial Effluents and BiomedicalWaste, Economic and Political Weekly, 88- 93 (2008).
14. Orissa State Pollution Control Board, Annual Report, Bhubaneswar (2010).15. K. Venugopala Rao., Environmental Degradation in Major Ports of India, 57(3) International Journal
of Environmental Studies 339 (2000).16. Claudio Comoglio& Serena Botta, The Use of Indicators and the Role of Environmental Management
Systems for Environmental Performances Improvement: A Survey on ISO 14001 Certified Companiesin the Automotive Sector, 20 Journal of Cleaner Production 92-102 (2012).
17. Melanie Beth Oliviero and Adele Simmons, Who’s Minding the Store? Global Civil Society andCorporate Responsibility, Chapter 4, 77- 107,h t t p : / / w w w. l e a d . c o l me x . mx / d o c s / s 4 / 0 2 _ s o c i e d a d % 2 0 c i v i l % 2 0 y % 2 0 O N G /OLIVIERO_who%27s%20minding%20the%20store.pdf (last visited Jul 25, 2013).
18. Chang, Y.T., Shin, S.H., and Lee, P.T.W. (2014),Economic impact of port sectors on South Africaneconomy: An input output analysis, Transport Policy, 35, 333-340.
19. Robinson, R. (2002),Ports as elements in value-driven chain systems: the new paradigm, MaritimePolicy and Management, 29(3), 241-255.
20. Baird, A.J. (2002),Privatization Trends to the top-100 container ports, Maritime Policy andManagement, 29(3), 271-284.
21. Chrizanosky, A., (1985), An introduction to shipping economics, London, Fairplay.

81Orissa Journal of Commerce, Volume XXXXI, April- June-2020, Issue No-II
Celebrity Endorsement and Overexposure: A CaseStudy of “Brand Virat”
Dr. Kishore Bhattacharjee1 & Dr. Shiv Shankar Prasad2
ABSTRACTThis study aims to discuss whether the surge in continuous exposure of the celebrities as an
endorserof brandscould lead to overexposure and ultimately have an adverse effecton the brand valueor not.The current study has taken the Indian cricket captain, the youth icon Virat Kohli as the case.The marketing experts are of the view that the growing number ofinvolvement of Virat Kohli, withmultiple brands can hamper the seriousness of the endorsement in the long run.This study adopts amixed method where an exploratory design (case study method) has been followed at the beginning toexplore the current status of ‘Brand Virat’ and later a descriptive study has been conducted to measurethe current status of the effectiveness of the celebrity as an endorser. The study was confined to theurban areas of Bihar and West Bengal.To get the intended outcome, the components of ‘tri-component’model of source credibility have been taken as the independent variables and the attitude of the customerhas been taken as the dependent variable. The results have been collated on the basis of responseobtained from 222 customers/potential customers exposed to the advertisements endorsed by Virat.The resultof regression analysis indicates that, the rising popularity of a particular celebrity might notguarantee effective brand positioning over the long period.
Keywords: Celebrity Exposure, Overexposure, Brand Virat, Celebrity Attractiveness, CelebrityTrustworthiness, Celebrity ExpertiseIntroduction:
In the globalized era of cut-throat competition (since late nineties), the Indian market has witnesseda massive surge in the number of brands, fighting out to carve a strong position in the minds of theconsumers. To stay ahead of the competition and to occupy a strong position in the market, celebrityendorsement is one of the pivotal instruments into the hands of the marketers.
The endorsers are considered as the celebrities who command a high degree of recognition, trust,respect or awareness amongst the people. Such people advertise for a product lending by their names orimage. They are highly acclaimed persons in their respective field of profession(Friedman and Friedman,
1. Assistant Professor- Amity Business School, Amity University, Patna, Bihar E Mail:[email protected] Mob No: 8102427626
2. Associate Professor- Vanijya Mahavidyalaya, Patna University, Patna E Mail:[email protected] Mob No: 9431662241

82 Orissa Journal of Commerce, Volume XXXXI, April- June-2020, Issue No-II
1979). It is the common belief amongst the advertisers that the personalities of such fame could generatemore appeal than that of the unknown faces. Marketers are investing huge amount every year in ‘celebrityendorsement’ to promote their brands. The common belief is that celebrities are able to upgrade: brandvisibility (Friedman and Friedman, 1979; Tom, Clark, Elmer, Grech, Masetti and Sandhar, 1992, et.al.,),levels of attention (Friedman and Friedman, 1979; Atkin and Block, 1983, et.al.,), positive attitudestowards the product (Friedman and Friedman, 1979; Atkin and Block, 1983; Freiden, 1984; Kamins,1989; Tripp, Jensen and Carlson, 1994, et.al.,) and greater purchase intentions (Friedman, Termini andWashington, 1976, et.al.,). Marketers also believe that, it has a positive influence on brand recall (Schultzand Brens, 1995) of the customers as well. Companies all around the world are spending huge amountsto make their brands associated with the persona of such popular icons. India too is not an exception.Indian corporates are also investing enormous amount to align their brands with the persona of thecelebrities from various fields.Celebrity Endorsement in India: Highlights
Since the late nineteenth century, celebrity endorsement has played a substantial role in marketer’sstrategy formulation (Erdogan, 1999). The ultimate purpose is to give a ‘face’ to the brands; so topenetrate deeper into the market and to uphold the market share to its best.
Over the last few decades, usages of celebrities in brand endorsement have been growing at asteady speed in India. The reason for this could be attributed to the fan-following of the celebrities,especially the film stars and the cricketers in the country. The attraction of the celebrities helps thecompanies to tap the target market more effectively. It is a common belief that, the people have anatural tendency to get attracted towards the stars either from the entertainment industry or from thesports arena (Agam, 2017) and India is not an exception.Highly acclaimed Brand Personalities
According to the Duff & Phelps report (2019), in the late nineteenth and early twenties, the mostpopular celebs in India were in the likes of Amitabh Bachchan, Shah Rukh Khan, DeepikaPadukone,Ranveersingh and many more(Table: 1). Although the cine-stars seem to bag the largest number ofdeals, many of the sports personalities have also cut into the celebrity endorsements pie. Most popularnames with the top-most fan following among them were M.S. Dhoni, Rohitsharma, Virat Kohli andfew others. Currently the name sought after by most of the top brands is the Indian ‘youth icon’, theIndian cricket captain; Virat Kohli.

83Orissa Journal of Commerce, Volume XXXXI, April- June-2020, Issue No-II
Table 1Top Brand Endorsers and their Brand Value- 2018& 2019
Source: Duff & Phelps Report, 2019. Extracted From: https://www.duffandphelps.in/-/media/assets/pdfs/publications/valuation/celebrity-brand-valuation-report-2019.ashx
A Snippet of ‘Brand Virat’Over the last few years Indian cricket captain Virat Kohli became one of such prominent personalities
rising in Indian advertising landscape. With time he has became one of the most marketable brandpersonalities. According to the Duff & Phelps report (2017) ‘Rise of the Millennials: India’s Most ValuableCelebrity Brands’, he was the topmost brand endorser with a brand value of $144 million. Starting hiscareer in the early age, the numbers of endorsement offers under his belt started increasing and till theend of 2019 Virat had endorsed more than 30 brands and the numbers are increasing till date.
With time the number of brands under his belt is getting increased at a rapid speed. He is endorsingthe brands of different product categories. Numbers of existing literatures have revealed the effectivenessof celebrity endorsement on consumer buying behavior and some of them have supported the effectivenessof such to attract the consumers (Khatri, 2006). Moreover, Zoubi and Bataineh (2003), Ranjbarian andShekarchizade (2009) revealed that attitude toward celebrity endorser has direct or indirect influence onconsumer attitude toward a brand. Erdogan (1999) opined celebrity endorsement as a two-edged swordwhich can have a positive as well as the negative impact (if overexposed) on consumers.
In the light of this scenario, the question arises, whether the numbers and types of brands the youthicon is endorsing is still adding value to the brands? Is it really making a positive effect on the attitudeof the consumers? Or with time and increasing numbers of brand association, it is creating an adverseeffect on the customer’sattitude? Whether the ‘Brand Virat’ is getting overexposed?

84 Orissa Journal of Commerce, Volume XXXXI, April- June-2020, Issue No-II
Research GapWhile analyzing the utility of celebrity endorsements, it had been revealed that the increasing number
of brand associations of Virat might let him towards ‘overexposure’. As per the available literature, noprior study has been found; which measures the effect of such exposure of any celebrity in the Indianadvertising arena, specifically; the effectiveness of such protuberant brand icon the ‘Brand Virat’, onconsumer attitude. The current study will measure whether the growing numbers of endorsement canoverexposethe celebrity or not.Objectives of the Study
The study will focus light on the effectiveness of the brand icon in generating brand value amongthe customersby analyzing the effect of the endorsements done by Kohlion customer’s attitude. Thisresearch has taken ‘Brand Virat’ as the case to be studied. The purpose was to reveal the effectivenessof such prominent celebrity icons when they advertiseover a long period of time, associates with variousproduct categories and when they become a very popular face in the advertising arena.
In the light of the above scenario the objectives of this study is to measure –i. The effect of celebrity attractiveness (brand Virat) on consumer attitudeii. The effect of celebrity expertise (brand Virat) on consumer attitudeiii. The effect of the trustworthiness of celebrity (brand Virat) on consumer attitude
Literature review:A common phenomenon in human history is to express veneration to their heroes having the
astonishing superhuman abilities. In modern day scenario celebrities fulfill this role and are protuberantin the marketing communications landscape (Sharma et al., 2019). It is evident from the literature that,using celebrities as an endorser is one of the very popular tools into the hands of the marketers (Erdoganet al., 2001; Mehulkumar, 2005) across different product and service categories (Doss, 2011). The risingstar of Indian cricket Virat Kohli became one of the most marketable brand personalities in the early21st century. With time, he became the top most preference for many of the companies as their brandambassador. His brand value exhibited a tremendous growth over time.‘Brand Virat’ – The Evolution
According to the Duff & Phelps report, during the period of 2016-17, Virat registered 56% growthin his brand value and replaced the Bollywood star Shah Rukh Khan (SRK) from the peak. All hisachievements, success and business associations made him more popular and he became thenumerounocelebrity endorser in 2017-18 with a brand value of $144 million. According to one report, Virat usedto earn about ‘32 million per brand and he was having 17 million followers on ‘Instagram’, as ofDecember 2017. He was the only Indian athlete to command such a high emolument. The Forbes rankingof the world’s most valuable athletes ranked Virat seventh in 2017 and calculated his brand value at$14.5 million.He is the only athlete from India in the Forbes World’s 100 Highest-Paid athletes list;ranked 83rd in 2018 and 100th in 2019.
The major brands he has been associated with are the likes of Footwear and Apparel brand- Puma,Traditional Apparel brand- Manyavar, youth fashion items- WROGN, electronics brand - MuveAcoustics,beverages- Pepsi, Royal Challenge, confectionaries- Yumm, watches- Tissot, Fastrack, energy drink-

85Orissa Journal of Commerce, Volume XXXXI, April- June-2020, Issue No-II
Boost, luggage- American Tourister, healthcare product- Vicks India, tyre manufacturer- MRF, cab serviceprovider-Uber India, money transfer services- Remit 2 India, lubricants brand- Valvoline. His associationhas also been with the two-wheelers brand TVS, Beauty care brand Fair and Lovely, Foot ware RedChief Shoes, Clothing and Fashion accessories Flying Machine etc.
The numbers have increased at a steady rate and gradually Virat has become the apical choice formost of the prominent brands in the country. However, experts believe that the association of one celebritywith such large number of brandmight lead to overexposure and might lead to dilution of brand value.
‘Brand Virat’: Overexposed?The professional success with his personal traits, made Virat the most sought after name in the
arena of Indian advertising. While analyzing the utility of celebrity endorsements, it has been revealedthat the increasing number of brand associations of Virat might let him towards ‘overexposure’. It wasevident from the ‘Meaning Transfer Theory’, proposed by Grant McCracken (1988), that every celebrityencodes certain unique set of traits which, if skillfully portrayed can generate powerful communicationthan that of lay endorsers. According to the theory, every celebrity possesses certain set of meaning(personal traits) which could be listed as age, gender, race, wealth, personality or lifestyle. The personaltraits of the young Indian batsman placed him into the top of the list of exposure. The theory alsorevealed that the increasing ‘exposure’ could be ascribed to the increasing ‘Air Time’ of a celebrity onTV screen. The gradual increase of brands visibility/Air time is an indicating sign of ‘overexposure’ ofthe great brand personality. As over the period;the number of brands has increased under his belt, thestudy is an attempt to measure the impact of exposure of the celebrity (Virat) on customer attitude. Toidentify the components to measure the credibility of Virat as an endorser the ‘Tri-component’ modeldeveloped by Ohanian (1990) has been referred.
The Celebrity Credibility Sources – The ‘Tri-component’ modelLiterature reveals that ‘source credibility’ is the blend of “communicator’s positive characteristics
that subsequently influence the receiver’s evaluation of the message” (Hovland and Weiss 1951; Ohanian1991). An endorser, who is considered as a source of credibility has a positive impact on the purchaseintention of the consumer (Liu et al., 2007) and can also channelize their beliefs, opinion and attitudethrough internalization process. This happens when receiver embraces a source of influence that is intune with their personal attitude and value (Erdogan 1999).
Using an endorser of repute may be a means to add credibility to the advertising message (Beltraminiand Sirsi 1992).Source credibility model contends that the efficacy of a message depends on the factors;such as: the perceived expertise and trustworthiness of the endorser (Dholakia and Stemthai 1977;Hovland, et al. 1953; Hovland and Weiss 1951; Ohanian 1991; Solomon 1996).
Expertise states to “the perceived level of knowledge, experience or skills possessed by an endorser”(Hovlandet al. 1953), being this way perceived to be a source of valid assertion (Roozen, 2008). Ohanian(1991) contends that the perceived expertise of a celebrity in the eyes of the consumers is more importantin explaining purchase intentions.
Trustworthiness, according to Ohanian (1990) is “the degree of confidence consumers place in acommunicator’s intent to convey the assertions s/he considers most valid.” Erdoganet al. (2001) also

86 Orissa Journal of Commerce, Volume XXXXI, April- June-2020, Issue No-II
define trustworthiness as “the honesty, integrity, and believability of an endorser as perceived by thetarget audience.” Marketers capitalize on the trustworthiness endorser characteristic by selecting personswho are widely regarded as honest, believable and dependable (Shimp 1997). In terms of the effect oftrustworthiness on attitude change, Miller and Baseheart (1969) conducted an experiment and concludedthat, attitude change was more likely to occur when the perceived communicator’s trustworthiness ishigh. Friedman and Friedman (1976); Friedman, Santeramo and Traina (1978) found that trustworthinesshad high association with the level of source’s expertise, source’s attractiveness and respondent’sperceived similarity to the source.
In addition to trustworthiness and expertise, the attractiveness of the communication source can alsoenhance the effect of the message conveyed (Canning and West, n.d). Attractiveness is understood todepend upon whether the source is: classy, beautiful, elegant and attractive (Ohanian 1990). Thus, expertise,trustworthiness and attractiveness are considered to be the components of source credibility. A tri-componentmodel was developed by Ohanian (1990) to measure and to assess a celebrity endorser’s perceived expertise,trustworthiness, and attractiveness(Figure: 1). The present study has taken the three components ofOhanian’s model to measure the customers/potential customers’ attitude for ‘Brand Virat’.
Attractiveness
Trustworthiness
Expertise
Similarity
Familiarity
Likability
Dependence
Honest
Reliable Sincere
Truthful
Skilled
Qualified
Knowledgeable
Experienced
Expert
Figure 1: Source Credibility ModelHypotheses of the Study
1. H01: There is no significant effect of celebrity attractiveness (brand Virat) on consumer attitude2. H02: There is no significant effect of celebrity expertise (brand Virat) on consumer attitude3. H03: There is no significant effect of the trustworthiness of celebrity (brand Virat) on consumer
attitude

87Orissa Journal of Commerce, Volume XXXXI, April- June-2020, Issue No-II
Methodology:This study has taken a mixed method from research ‘onion’ approach (Saunders et al., 2007). The
initial section of the research is exploratory in nature; where, on the basis of extensiveliteraturereview;the evolution and the current status of the endorser ‘Virat Kohli’ in the landscape of Indian advertisinghas been explored.In the second section of the study a cross-sectional descriptive design has been foundmost suitable to measure the effect of Virat’s credibility as the endorser on consumer’s attitude.
A survey has been conducted as a method of collecting data. The population of the study consistsof different age group people, specifically the young generation, exposes to the ads endorsed by ViratKohli. Aim for selecting the said population is that young people having keen interest and awarenessabout what is being offered by advertisement and by whom it is being endorsed, so they can easilyrecall for making linkages and respond correctly for presented questions (Pabalkar and Balgaonkar,2014).The study was confined to the different urban and semi-urban respondents of Bihar and WestBengal.A convenience sampling technique has been used to reach the respondents and they wereapproached personally and through e-mails.
Following the recommendation of Roscoe (1975) (“number of items in a questionnaire * 10” i.e.19*10 = 190) a sample size of 224was considered as appropriate and sufficient for the purpose. Over 600questionnaires were distributed. A total of 318 filled in questionnaires were received. And finally, afterremoval of outliers and incomplete responses, 222 responses were found usable and valid for furtheranalysis.Rest has been discarded due to non-response and missing value errors (Litte and Rubin, 1987).
A questionnaire based on five-point Likert’s scale has been developed as a tool for data collection.The selections of the variables and the items in the questionnaire have been done with the support ofexisting literature(Table 2).
Both descriptive and inferential analyses have been performed to analyze the valid data collectedthrough the survey and the analyses have been performed with SPSS 20.0.
Before going for actual data analysis and hypothesis testing, the data were screened to ensure thatthe data get cleaned and ready for further analyses(Tabachnick&Fidell, p 139). Assumptions ofmultivariate regression analysis (normal distribution of data, linearity, freedom from outliers and multi-co-linearityetc.) have been confirmed at the initial level (Buyukozturk, 2002). Data was examined forthe presence of any missing values and outliers.Outliers were identified using Cook’s distance. A totalof 02 responses were deleted as they exceeded the threshold limit of 1. Questions with missing valueshave been discarded.Normality of the data has been checkedwith a histogram and P-PPlotand found asnormally distributed.Linearity of the independent and the dependent variables have been ensured bychecking the correlation matrix.Freedom from multicollinearity has been tested by checking the VarianceInflation Factors (VIF) and no such issues have been found (all VIF were found as <5)(Daoud, 2017).
Reliability of the ScalesBefore analyzing the data, the reliability of the scales developed has been verified with the help of
Cronbach’s coefficient alpha value calculated for each of the scales.The Cronbach’s alpha of all theconstructs have been found well exceeded to 0.7 points(Table 2).It established a good internal reliabilityofthe scales (George &Mallery, 2003).The alpha values and the referred literatures for each of the scalesdeveloped are listed as below-

88 Orissa Journal of Commerce, Volume XXXXI, April- June-2020, Issue No-II
Table 2: Referred Studies for Item Selection
Factors Referred Research Papers No. of Items
Cronbach’sAlpha
Celebrity Attractiveness
Syed Rameezul Hassan and Raja
Ahmed Jamil (2014).
3
0.789
Celebrity Expertise
Antonio Filipe Esteves Miguel de
Carvalho (2012).
5
0.873
Celebrity Trustworthiness
Okorie Nelson (2017).
5
0.839
Customer Attitude
OluwafunmitoJatto (2014).
6
0.839
Source: Authors Compilation
Validity of the ScalesValidity is the degree to which a measure accurately represents what it is supposed to (Hair at al.,
1998). The current study addressed the content validity through expert opinion and later through pilot-testing of the instrument developed for data collection. The variables for the study have been adoptedfrom the instruments used in previous research, which has been modified purposefully as per the expertopinion. Later a pilot-testing has been conducted to ensure the accuracy of the variables taken for thestudy. Minor modifications have been done after the pre-testing of the instrument to make it moremeaningful and understandable.For the construct validity, Composite Reliability (CR) and AverageVariance Explained (AVE) have been computed. It has been found that all the constructs have CR morethan .7 (CR>.7) and AVE more than .5 (AVE>.5). This signifies that the scales adopted in this study arevalid (Hair, Black, Babin& Anderson, 2016)Analysis and Results:
Demographic Profile of the RespondentsThe demographic distribution of the respondents is depicted as below (Table 3):

89Orissa Journal of Commerce, Volume XXXXI, April- June-2020, Issue No-II
Table 3: Demographic profile Sample Size- 222
Gender Distribution of Sample Respondents
Category Frequency Percentage (%) Gender
Male 131 59 Female 91 41 Age Distribution of Sample Respondents > 30 104 46.84 31-40 80 36.03 41-50 25 11.26 51-60 13 05.85 Qualification/Education of Sample respondents
Non-Graduate 42 18.91 Graduate 129 58.10 Post-Graduate 51 22.97
Source: Authors Compilation
Table 3 shows the demographic characteristics of 222 respondents. The gender distribution ofrespondents consisted 59 per cent males and 41 percent females. It also indicates that 83 per cent respondentsfell in the age group below 40 years, which shows that the respondent’s falls mostly in the young andmiddle-aged category may have more chances of getting exposed to TV advertisements. Out of 222respondents, almost 19 percent are non-graduate and rest 81 percent is having either the graduation orpost-graduation degree. The demographic profile indicates the true representativeness of the respondents.Testing of Hypotheses
To test the hypotheses (H01, H02 and H03) Multiple Regression has been performed. The resultof the analysis is depicted as below-
Table 4: Model Summary
Model R
R
Square
Adjusted R
Square
Std. Error of
the
Estimate
Change Statistics
Durbin-
Watson
R Square
Change
F
Change df1 df2
Sig. F
Change
1 .892a .796 .793 .40173 .796 282.785 3 218 .000 1.588
a. Predictors: (Constant), Expertise, Attractiveness, Trustworthinessb. Dependent Variable: Attitude
Source: SPSS output

90 Orissa Journal of Commerce, Volume XXXXI, April- June-2020, Issue No-II
Table 4 depicts high correlation (R = .892) between the independent and the dependent variables.R-squared is 0.796, meaning that 79.6 percent of the variability of customer attitude is explained by theexpertise, attractiveness and trustworthiness in the model. The adjusted R square shows 79% ofpredictability in Attitude is by the three independent variables.This again depicts a very good explanatoryresult (Miles, 2014).
The standard error of the estimate (0.40173) measures the high accuracy of predictions made witha regression line. It also shows possibilities of unexplained variability that could not be explained bythe independent variables taken in this study.
The Durbin-Watson statistics tests the correlation between unexplained errors. The Durbin-Watsonvalue in this caseis 1.588,which isbetween the acceptable region(1.5 to 2.5) and therefore it can beinterpreted that the data is not auto correlated(Field, 2011).
Table 5: ANOVAb
Table 5: ANOVAb
Model Sum of Squares Df Mean Square F Sig.
1 Regression
136.915 3 45.638 282.785 .000a
Residual 35.183 218 .161
Total 172.097 221
a. Predictors: (Constant), Expertise, Attractiveness, Trustworthinessb. Dependent Variable: Attitude
Source: SPSS output
Table 5 reports the model fitness; which is highly significant (p=0.000, F= 282.785) and signifies agood regression model for dependent and independent variables.
Table 6: Coefficients
Model
Unstandardized
Coefficients
Standardized
Coefficients
T Sig.
Collinearity Statistics
B Std. Error Beta Tolerance VIF
1 (Constant) .389 .127 3.074 .002
Trustworthiness .119 .049 .131 2.433 .016 .323 3.098
Expertise .821 .030 .877 27.821 .000 .945 1.058
Attractiveness -.063 .045 -.075 -1.398 .164 .322 3.108
a. Dependent Variable: Attitude
Source: SPSS output

91Orissa Journal of Commerce, Volume XXXXI, April- June-2020, Issue No-II
Table 6 explains the coefficients (Beta) of Independent Variables upon the Dependent Variable. Thethree Independent Variables taken in this study show their relative importance for the prediction of theDependent Variable i.e. attitude. Attractivenessis found to be insignificant in predicting customer attitude.(Attractiveness: p=0.164, t= -1.398). The other Independent Variablestrustworthiness and expertiseshowsa highly significant effect (Trustworthiness: p= 0.016, t= 2.433; Expertise: p=0.000, t = 27.821) on attitude.
Further the standard beta coefficients(â= 0.084, -0.065&0.920) depicts the relative strengths of the predictors.Customer trustworthiness shows 13.1%predictability for attitude, whereas expertise was found to be mostsignificant with 87.7% predictability. To test the covariance between the independent variables themulticollinearity test has been performed. The result for all the predictors (Trustworthiness: VIF=1.062; Expertise:VIF = 1.058; Attractiveness: VIF = 3.108)are less than 5 (<5) indicates there is no/less chance ofmulticollinearityexists(Daoud, 2017).Based on this table, the equation for the regression line developed is:
Customer Attitude = 0.389+ (0.119*Celebrity Trustworthiness) + (0.821*Celebrity Expertise)Table 7: Result of Hypotheses Testing:
Null Hypotheses No.
Test Results
Accepted Rejected
H01 Null Alternative
H02 Alternative Null H03 Alternative Null
Source: Authors Compilation
To show the relational effect of the independent variables on the dependent variable, the conceptualmodel developed is portrayed as below (Figure: 2):
ß= 0.131, p=0.016< 0.05
Celebrity Attractiveness
Celebrity Trustworthiness
Celebrity Expertise
Customer Attitude
ß= -0.075, p=0.164> 0.05
ß= 0.877, p= 0.000<0.05
Figure 2: Conceptual Model

92 Orissa Journal of Commerce, Volume XXXXI, April- June-2020, Issue No-II
Discussion:This study was undertaken to measure the effect of increasing number of brand endorsement by the
Indian cricket captain Virat Kohli, on customer/potential customer attitude.The impact of Kohilis’attractiveness, trustworthiness and expertise as an endorser of brands has been tested on customerattitude. These three factors have been taken from the literature and considered as the essential antecedentof attitude building (Seiler and Gunther, 2017).
The result indicates that,trustworthiness of Virat as an endorser is having positive effect on consumerattitude and the finding is in the line of Shimp (1997), as he has also opined in the similar way.Theresult is also showing that people still considers him as an expert endorser as celebrity expertise ishaving significant relationship with the customer attitude. Pornpitakpan (2004) also argued that, expertisemight have its effect on customer attitude formation. Acelebrity who has sufficient expertise in thefield of the product advertised may create more favorable attitude because consumers can trust theirexpertise to judge the product. (Kumar Rakesh, Kaushal, S. K., (2014).Seiler and Gunther (2017) alsofound these two factors (trustworthiness and expertise) significant to create positive attitude among theconsumers.
On the other hand; the result reveals that, the attractiveness of Virat as an endorser is having noeffect on peoples’ (customer and the potential customers) attitude. This contradicts the findings ofOhanian(1990), where the role ofattractivenesshas been found to be significant on customers’ attitude formation.
It is evident from theliterature that, the popularity of the Indian skipper was getting increased overthe past few years and he became the number one endorser in the list (Gupta & Jain, Duff & PhelpsCelebrity Brand Valuation Report, 2018). According to the findings of this study, the present daypopularity of the celebrity could be attributedonly to theexpertise and trustworthinessof Virat as anendorser. The result of the current study alsoindicates that, the customers / potential customers are nolonger considering Virat as attractive.
The reason behind this contradictory result could be the irrelevant selection of brand for endorsementby the Indian skipper (Hussain and Khan, 2015) or it is an indication of diminishing attractiveness dueto over-exposure of ‘Brand Virat’. The finding of the study indicates that the star cricketer has startedlosing his impact among the customers.
It is evident from the source that over the last 10 years Virat had endorsed more than 25 brands ofdifferent categories (Shukla, Akshata, 2019). He was advertising for apparel and fashion items forbeverages, electronic goods, mobile phones, healthcare products, automobiles, confectionaries, cabservices and many more.In expert’s opinion; when a celebrity endorses multiple brands (as Virat wasdoing), it can lead to overexposure and can dilute the brand value as well (McCracken, 1989). Theresult of this study is an indication of the same. From this study it can be predicted that the increasedvisibility of Virat could also dilute the credibility of his brand persona. Moreover, the rapid growth inthe number of brand he was endorsing could also question the connectivity between the type of productand Virat’s personality as the similarity of features from the celebrity and the product, targets the senseof the customer more positively (Michael, 1989).The possible reason behind losing the attractivenesscould also be the increasing level of education and awareness of the consumers about the brands. It isevident from the literature that, the physical attractiveness of the celebrity has positive impact on the

93Orissa Journal of Commerce, Volume XXXXI, April- June-2020, Issue No-II
consumer attitude towards the advertisement (Said and Napi, 2015). Although; the current study revealsthat, increasing number of endorsement might have an adverse effect on consumer attitude.Significance of the Study
Contribution to the LiteratureThis study contributes to the Celebrity Endorsement and Customer Attitude literature. This research
contributes to the body of existing knowledge by providing a substantive understanding of the impactof celebrity overexposure and customer attitude formation.
Managerial ImplicationsSingh (2014) argues that to create a unique positioning of their brands or products in the minds of
their target audience andto promote sales faster,companies endorses celebrities to position their brandsdistinctively to their customers.The findings of the current study suggest that the companies / marketersneed to be conscious while selecting the celebrities as their endorsers. Mere popularity of the celebritysometimes might have the adverse effect on their brand positioning as well. It indicates that, risingpopularity of a particular celebrity might not guarantee effective brand positioning over a long periodof time. So, the findings would be helpful for the marketer’s strategic decision making while promotingtheir brands.Limitations of the Study
The inherent limitations of the study can be summarized as below:The geographical area chosen is limited to the state of Biharand West Bengal only and the sample
size considered for the studymay not be sufficient to generalize the findings. Moreover, number ofvariables chosen for the study might not be exhaustive.
Apart from this, the study is confined to only one celebrity (Virat Kohli), so; a detailed study onlarge number of celebrities might lead to a different scenario. It is also a fact that respondents may ratecelebrities according to their own liking and disliking of celebrity.Avenues for Future Research
Several issues, linked with the limitations intrinsic in the current study, require additional researchconsiderations. Future research should concentrate on improving the conceptual model as there is enoughscope to add other decision-making variables to enrich the empirical findings of this study. Even thoughthe current study provided encouraging and promising preliminary results, supplementary results arerequired to appraise the research model’s stability and applicability across different market segments,geographical areas, products, and industries and more importantly among the celebrity fraternity atlarge.Conclusion
Using celebrities for building brands became the trend over the decade and the professional successwith his personal traits, made Virat Kohlione of the most sought after names in Indian advertisinglandscape. Moreover, the findings of the study indicates that for protectingthe brand persona thecelebrities need to be conscious with the numbers of brands and the types of brandthey are endorsing.The companies also need to be careful while selecting the celebrities to promote their brands. Otherwise;

94 Orissa Journal of Commerce, Volume XXXXI, April- June-2020, Issue No-II
it may lead to over-exposure as the sign of such is evident in the current study. Ultimately the over-exposure may lead to loss in the positioning of the brands in the long run. The media experts have alsoopined in the similar line, that;”Virat should avoid the danger of over-exposure. Doing too manyendorsements, indiscriminate choice of brands, creative not consonant to his own brand image … allto be avoided”(Laghate, Gaurav, 2016).References:• Abhishek, &Sahay, A. (2016). Role of culture in celebrity endorsement: brand endorsement
by celebrities in the Indian context. International Journal of Indian Culture and BusinessManagement, 13(3), 394-413.
• Agam, D. N. L. A. (2017). Celebrity endorser physical attractiveness effect on consumers’attitude toward online advertisement. Australian Journal of Accounting, Economics and Finance,3(1), 25-29.
• Atkin, C., & Block, M. (1983). Effectiveness of celebrity endorsers. Journal of advertisingresearch.
• Beltramini, R. F., &Sirsi, A. K. (1992). Physician information acquisition and believability: afield experiment on source and type of information. Marketing Health Services, 12(4), 52.
• Büyüköztürk, ª. (2002). Sosyalbilimleriçinveriveanalizi el kitabý: istatistik, araþtýrmadeseni,SPSS uygulamalarýveyorum. Pegem A Yayýncýlýk.
• Carvalho, A. F. E. M. D. (2012). The effects of celebrity endorsement on consumers purchasingintentions (Doctoral dissertation).
• Choudhary, Vidhi. “Virat Kohli Looks Set To Become A Rs100 Cr Brand”. Https://Www.Livemint.Com, (2019). https://www.livemint.com/Consumer/dZMTVU0L1uHA11OeMmbrfL/Virat-Kohli-set-to-become-a-Rs100-crore-brand.html. Accessed 25 December 2019.
• Daoud, J. I. (2017). Multicollinearity and regression analysis. In Journal of Physics: ConferenceSeries (Vol. 949, No. 1, p. 012009). IOP Publishing.
• Doss, S. (2011). The transference of brand attitude: the effect on the celebrity endorser.Journal of Management and Marketing Research, 7, 1.
• Duff & Phelps Report. (2019). https://www.duffandphelps.in/-/media/assets/pdfs/publications/valuation/celebrity-brand-valuation-report-2019.ashx. Accessed 27 March 2020.
• Editorial. “Top 15 Indian Celebrity Brand Values Reaches $712 Million; Virat on Top with$144 Million: Duff & Phelps Report.” MediaNews4U, (21 Dec. 2017).tvnews4u.com/top-15-indian-celebrity-brand-values-reaches-712-million-virat-top-144-million-duff-phelps-report.Accessed 27 December 2019.
• Elberse, A. (2009). Risks and rewards of celebrity endorsements.• Erdogan, B. Z. (1999). Celebrity endorsement: A literature review. Journal of marketing
management, 15(4), 291-314.

95Orissa Journal of Commerce, Volume XXXXI, April- June-2020, Issue No-II
• Erdogan, B. Z., Baker, M. J., &Tagg, S. (2001). Selecting celebrity endorsers: The practitioner’sperspective. Journal of advertising research, 41(3), 39-48.
• Field, A. (2011). Discovering Statistics. Sage Publication Ltd, London EC1Y 1SP.[2]. John W.Creswell, Research Design, Sage Publications India Pvt Ltd, New Delhi, 110, 044.
• Friedman, H. H., & Friedman, L. (1979). Endorser effectiveness by product type. Journal ofadvertising research.
• Friedman, H. H., Santeramo, M. J., &Traina, A. (1978). Correlates of trustworthiness forcelebrities. Journal of the Academy of Marketing Science, 6(4), 291-299.
• George, C., & Solomon, J. (1996). Representational models of relationships: Links betweencaregiving and attachment. Infant Mental Health Journal: Official Publication of The WorldAssociation for Infant Mental Health, 17(3), 198-216.
• George, D., &Mallery, P. (2016). IBM SPSS statistics 23 step by step: A simple guide andreference. Routledge.
• Goyal, Parul. “Celebrity Endorsement In India”. Knowledge Tank , (2019).https://www.projectguru.in/publications/celebrity-endorsement-in-india/. Accessed 9 Mar 2019.
• Gupta, Varun, and Aviral Jain. “Celebrity Brand Valuation Report 2018.” Duff & Phelps, (10Jan. 2019). https://www.duffandphelps.in/insights/publications/valuation/celebrity-brand-valuation-report-2018. Accessed 27 December 2019.
• Hair, J., Andreson, R., Tatham, R., & Black, W. (1998). Multivariate data analysis. 5th (ed)Prentice-Hall Inc. Unites States of America.
• Hair, J., Anderson, R., Black, B., &Babin, B. (2016). Multivariate data analysis. New York:Pearson.
• Hermawan, H., Sularso, R. A., Yulisetiarini, D., & Sukarno, H. (2018). The Influence ofElement Marketing Communication, Relationship Commitment, Business on the Quality onConsumer Relations Against Customer Loyalty. 1(2), 32-54
• Hovland, C. I., & Weiss, W. (1951). The influence of source credibility on communicationeffectiveness. Public opinion quarterly, 15(4), 635-650.
• Hovland, C. I., Janis, I. L., & Kelley, H. H. (1953). Communication and persuasion.• Hussain, D., & Khan, K. M. (2015). Understanding the Effectiveness of Celebrity Endorsements.
Editorial Team Editorial Advisory Board, 44.• Jamil, R. A., &Rameezul Hassan, S. (2014). Influence of celebrity endorsement on consumer
purchase intention for existing products: a comparative study. Syed Rameezul Hassan, RAJ(2014). Influence of celebrity endorsement on consumer purchase intention for existing products:a comparative study. Journal of Management Info, 4(1), 1-23.
• Jatto, O. (2014). Consumer attitude towards celebrity endorsements on social media (Doctoraldissertation, Dublin Business School).

96 Orissa Journal of Commerce, Volume XXXXI, April- June-2020, Issue No-II
• Kamins, M. A. (1989). Celebrity and noncelebrity advertising in a two-sided context. Journalof advertising research.
• Kaur, S., &Garg, A. (2016). Celebrity endorsement and buying behavior: a study of PanjabUniversity Students. International Journal of Research, 4, 2394-3629.
• Khatri, P. (2006). Celebrity endorsement: A strategic promotion perspective. Indian mediastudies journal, 1(1), 25-37.
• Knoll, J., &Matthes, J. (2017). The effectiveness of celebrity endorsements: a meta-analysis.Journal of the Academy of Marketing Science, 45(1), 55-75.
• Kumar, Rakesh&Kaushal, S. K. (2014). Pros and Cons of Celebrity Advertising in India.International Journal of Scientific & Engineering Research, 5(12), 34-45
• Laghate, Gaurav, and ET BrandEquity. “Here’s Why Virat Kohli Is the Man of the BrandMatch - ET BrandEquity.” ETBrandEquity.com , ET BrandEquity, (18 May 2016).brandequity.economictimes.indiatimes.com/news/advertising/heres-why-virat-kohli-is-the-man-of-the-brand-match/52316211. Accessed 24 November 2019.
• Laghate, Gaurav. “Man of the Brand Match: Virat Kohli Is Batting for Sixes Even When ItComes to His Brand Partnerships.” The Economic Times, Economic Times, (18 May 2016).https://economictimes.indiatimes.com/man-of-the-brand-match-virat-kohli-is-batting-for-sixes-even-when-it-comes-to-his-brand-partnerships/articleshow/52307286.cms?from=mdr. Accessed25 December 2019.
• Liu, J., Dietz, T., Carpenter, S.R., Alberti, M., Folke, C., Moran, E., Pell, A.N., Deadman, P.,Kratz, T., Lubchenco, J. and Ostrom, E. (2007). Complexity of coupled human and naturalsystems. science, 317(5844), 1513-1516.
• McCracken, G. (1986). Culture and consumption: A theoretical account of the structure andmovement of the cultural meaning of consumer goods. Journal of consumer research, 13(1),71-84.
• McCracken, G. (1989). Who is the celebrity endorser? Cultural foundations of the endorsementprocess. Journal of consumer research, 16(3), 310-321.
• Mehulkumar, P., (2005). An Examination of Universal Personality Endorser and Interactionbetween Perceived Celebrity Image (PCI) and Perceived Brand Image (PBI) across NationalBoundaries. available at: http://business.leeds.ac.uk/fileadmin/webfiles/research/WPS/Pajuani.pdfAccessed 15 December 2019.
• Miles, J. (2014). R squared, adjusted R squared. Wiley StatsRef: Statistics Reference Online.• Miller, G. R., &Baseheart, J. (1969). Source trustworthiness, opinionated statements, and
response to persuasive communication.• Nair, Siddharth. “How Virat Kohli Became the Biggest Indian Superstar of All-Time!” The
Sports Rush, (24 Mar. 2018).thesportsrush.com/rise-rise-brand-virat-kohli. Accessed 1 January2020.

97Orissa Journal of Commerce, Volume XXXXI, April- June-2020, Issue No-II
• Nelson, O., & Deborah, A. (2017). Celebrity Endorsement Influence on Brand Credibility: ACritical Review of Previous Studies. Online Journal of Communication and Media Technologies,7(1), 15.
• Newman, I., Benz, C. R., & Ridenour, C. S. (1998). Qualitative-quantitative research methodology:Exploring the interactive continuum. SIU Press.
• Ohanian, R. (1991). The impact of celebrity spokespersons’ perceived image on consumers’intention to purchase. Journal of advertising Research.
• Pabalkar, V., &Balgaokar, V. (2014). The effects of advertising on youth. International Journalof Management, 5(6), 63-70.
• Pornpitakpan, C. (2004). The persuasiveness of source credibility: A critical review of fivedecades’ evidence. Journal of applied social psychology, 34(2), 243-281.
• Prendergast, G., Liu, P. Y., & Poon, D. T. (2009). A Hong Kong study of advertising credibility.Journal of Consumer Marketing.
• Roscoe, J. T. (1975). Fundamental research statistics for the behavioral sciences [by] JohnT. Roscoe.
• S, Abhijeet. “Latesh Trends In Celebrity Endorsement | Management Paradise”.Managementparadise.Com, (2019).http://www.managementparadise.com/forums/introduction-advertising/205622-latesh-trends-celebrity-endorsement.html. Accessed 9 December 2019.
• Said, M., Pujawati, N., Napi, W., &Noraini, W. (2015). Celebrity and non-celebrity endorsementeffectiveness on consumers’ attitude towards advertisement. International Academic ResearchJournal of Business and Technology, 1(2), 51-57.
• Seiler, Roger, and Gunther Kucza. “Source credibility model, source attractiveness model andmatch-up-hypothesis: an integrated model.” Journal of International Scientific Publications:Economy and Business 11 (2017). Accessed 5 November 2019.
• Sharma, P., Morales, M., Gountas, J., &Gountas, S. (2019). Celebrity Endorsement Influenceon Consumer Decision Making: New Insights and Research Directions. Journal of MarketingManagement, 35, 1-52.
• Shimp, T. A. (1997). Advertising, promotion, and supplemental aspects of integrated marketingcommunications. Harcourt Brace College Publishers.
• Shukla, Akshata. “List of Brands That Virat Kohli Currently Endorses.” All About Ads, 28July 2019, https://aksharit.org/2019/05/16/brands-endorsed-by-virat-kohli/.
• Sternthal, B., Dholakia, R., & Leavitt, C. (1978). The persuasive effect of source credibility:Tests of cognitive response. Journal of Consumer research, 4(4), 252-260.
• Tabachnick, B.G., &Fidell, L.S. (1996). Using multivariate statistics . Northridge. Cal.: HarperCollins.

98 Orissa Journal of Commerce, Volume XXXXI, April- June-2020, Issue No-II
Is Homogeneity a Hurdle for Introducing TeaFutures in India?
Rajat Bhattacharjee1 & Dr. Santosh Kumar Mahapatra2
ABSTRACTCommodity derivatives market plays a significant role in the economy through price discovery and
risk management mechanism. A wide number of agricultural commodities have secured place in thederivatives market, despite the inherent issues of homogeneity or standardisation in terms of quality whereasderivative trading in tea is yet to start in the exchanges. A commodity to be eligible for trading in exchangeneeds to fulfil certain conditions, and standardisation or homogeneity is one of such pre-requisites for thefutures trading. However, coffee being a substitute of tea has found its place in the derivatives market.This paper attempts to examine the feasibility of tea futures on the grounds of homogeneity. For thispurpose, different grades of tea are studied in relation with coffee. Also the quality specifications of coffeefutures are taken into consideration. The observations of the study indicate the fulfilment of homogeneitybased criteria for tea and thereby make it conducive for the trading of tea futures.
Keywords: Coffee, Commodity derivatives, Futures, Homogeneity, Tea.Introduction
Commodity derivatives have played an important role in the economy of India by extending themechanism of price discovery and price-risk management. Various reforms have been made for thegrowth and development of this market over the years which include introduction of futures and optionsin the Indian market.
At present, there are five exchanges in India offering commodity derivative contracts. These are:Multi Commodity Exchange of India Ltd. (MCX), National Commodity Derivatives Exchange Limited(NCDEX), Indian Commodity Exchange Limited (ICX), National Stock Exchanges of India Ltd. (NSE)and Bombay Stock Exchange Ltd. (BSE). NSE and BSE offer derivative contracts in both equity andcommodity segments whereas the others offer derivative contracts in commodity segment only. MCXoffers contracts in bullion, base metals, energy and agricultural products. NCDEX offers trading primarily
1. Assistant Professor, Royal School of Commerce, Royal Global University, Guwahati-781035 Assam(India) Email: [email protected]
2. Associate Professor,Department of Commerce, Gauhati University Guwahati-781014 Assam (India)Email: [email protected]

99Orissa Journal of Commerce, Volume XXXXI, April- June-2020, Issue No-II
in agriculture products whereas ICX offers derivative contracts in agri-products including plantationand non-agri products (diamond and steel). The total turnover in the commodity derivatives market inIndia was ¹ 60,22,530 crores in the financial year 2017-18 (SEBI Annual Report, 2017-18) which signifiesthe importance of derivative market. The commodities found in the Indian derivative markets are shownin Table 1. There are a good number of commodities being traded in the Indian derivatives market. However,the inclusion of newer commodities in the derivatives market would certainly extend the benefits to thevarious stakeholders. In this context ‘tea’ is one of the products having all potential and inclusion ofwhich may extend the benefits to various stake holders. India is one of the largest producers and consumersof black tea in the world with a substantial share of 23 per cent of the world tea production and yet tea hasnot entered the derivatives market so far. However, coffee has established itself in the derivatives marketin India irrespective of the fact that it is similar to tea in many commercial aspects.
Table 1: Trading Commodities in Indian Derivative Market
MCX
NCDEX ICEX NSE BSE
• Metal • Bullion • Fibre • Energy • Spices • Plantations • Pulses • Petrochemicals • Cereals
• Cereals and pulses • Fibres • Oil and oil seeds • Spices • Plantation products • Gold • Silver • Steel • Copper • Crude Oil • Brent Crude Oil • Polyvinyl chloride
• Gold • Silver • Copper • Lead • Crude oil • Natural gas • Mustard • Soyabean • Soyabean oil • Jute • Menthe oil • Iron
Gold Silver Brent
Turmeric Guar seed Almond Cotton Gold Silver
Source: Official websites of the respective exchanges.
A review of the existing literature on commodity derivatives have revealed the focus areas of researchwhich mainly revolve around – studying the evolution, growth and performance of such markets;exploring the relationship between spot and futures price; highlighting the importance of behaviour indecision making concerned with trading in commodity exchange; investigating the feasibility ofintroduction of new commodities in the derivatives market. Brorsen & Fofana (2001), Shim (2006),Hosseini-Yekami, Zibaci & Allen (2009), Zhang (2012) and Qehaja (2014) have concentrated on thevarious factors influencing the success or failure of futures contracts, especially in case of agriculturalcommodities in countries other than India. But very little work is found on tea and it remains one suchgenre which has been barely explored and more so, in the Indian context. Damodoran (2000) hadexamined the feasibility of tea-futures and suggested for the introduction of tea-futures, but therecommendations could not be materialised. Bhattacharjee & Mahapatra (2020) in their work have

100 Orissa Journal of Commerce, Volume XXXXI, April- June-2020, Issue No-II
raised the question and examined the feasibility of tea futures in India at the backdrop of another popularbeverage – coffee which has a remarkable presence in the derivatives market, both at national andinternational level. They found a considerable market demand and supply along with adequate pricevolatility for introducing tea in the futures market.
Raipuria (2001), in the study Report on the Group of Forwards and Futures Markets, has identifiedcertain essential pre-requisites, to consider suitability of a commodity for futures trade – one of thembeing homogeneity. The commodity should be homogenous or alternatively it must be possible to specifya standard grade and to measure deviations from that grade. This condition is necessary for the futuresexchange to deal in standardized contracts.
Homogeneity means the quality or state of being all the same or all of the same kind. It is a vitalfeature to be present in the commodity to be incorporated in the derivatives market. In order to standardizethe lots of commodity there must be a uniformity or similarity in the quality of the commodity onwhich derivative trading is to be made. Simply stated, the existence of a scope of standardization orhomogeneity makes a commodity fit for being traded or introduced in the derivatives market.
The concept of Quality is very subjective and differs from person to person. Therefore, to determinea standard as the benchmark for quality of anything and a commodity in particular is not an easy task.Launching of a derivative product is largely dependent on the possibility or scope of standardisation ofthe product. The production of agricultural commodities is dependent on numerous factors inclusive ofboth controllable and uncontrollable factors. There are many differing views as to what constitutes‘quality’. But it can be said that the quality of a parcel of coffee comes from a combination of thebotanical variety, topographical conditions, weather conditions, and the care taken during growing,harvesting, storage, export preparation and transport. Botanical variety and topographical conditionsare constant and therefore dominate the basic or inherent character of a coffee. Weather conditions arevariable and cannot be influenced, resulting in fluctuating quality from one season to another(International Trade Centre, 2011).
Thus, in order to establish the quality or a standard of quality certain parameters need to beascertained. These parameters would facilitate the assessment of a standard quality which in turnincorporates homogeneity or uniformity to the derivative contracts on the commodity to be dealt with.Objevtive og the Study
The introduction of commodities in the derivatives market needs the fulfilment of certaincharacteristics by the commodity. One of the vital features is homogeneity which provides scope forstandardization of the commodity. The objective of this paper is to examine whether there is a possibilityof establishing homogeneity or some uniformity/standard in the quality of tea which may pave the wayof introducing tea in the commodity futures market.Methodology
Absence of homogeneity poses a challenge to the introduction of tea futures in the market. As thereare no futures on tea, the homogeneity aspect can be examined by a detailed study of various types oftea and correlating to some similar commodity where future trading already prevails. Coffee is a worldbeverage which is a good substitute to tea and has a close resemblance to tea in many aspects. Thepresent study puts special emphasis on the parameter - homogeneity or scope of standardisation of tea

101Orissa Journal of Commerce, Volume XXXXI, April- June-2020, Issue No-II
vis-a-vis coffee which has a place in the derivatives market. In doing so, quality has been consideredfor the standardisation purpose. The current research work relies mostly on secondary data collectedfrom various reports and published journals. However, the primary sources also include interview/conversation with few officials of the tea manufacturing concerns. The various secondary data sourcesused for the study are: (i) Coffee Board of India and (ii) Indian Tea Association. The present work isexploratory and descriptive in nature. The study is exploratory in the sense that it tries to examine thehomogeneity aspect of tea, which is one of the essential conditions for the introduction of tea futures.This study being novel one, inferences are drawn through discussions based on logical reasoning.
Observations and DiscussionThe task of examining the quality is a difficult one because of wide variation in case of any agricultural
commodity either by species or by type of processing. The concept of quality is also very subjective. Thevarious grades contain specifications for the particular commodity which usually represent its distinguishingquality. The product may be having several classifications and the price of the product will differ on thebasis of its product gradation. A particular grade of product should also have demand and large volume oftrading. It is essential to have an understanding of tea processing so as to gain idea on the quality of tea.
Quality of TeaThe quality of tea is largely influenced by the plantation and processing system at different stages.
Production and processing systems influence quality. The components and inputs that make up consistentquality are not certain at all the times, yet the basic norms in climate, soil and other agricultural factorsin the growing areas are responsible in influencing the quality of the tea. The initial stage rests with thetea growers. The quality depends on the clone of the garden and their maintenance which includesplantation of original seeds for the upgraded biological factors of tea bushes and leaves. This is followedby the practices of plucking, pruning and others which influence the quality of tea at a later stage.Processing of the tea leaves in the factories is the secondary factor that contributes to the quality of thetea. The tea factories procure the tea leaves from the tea growers. On transhipment of the same, thetotal volume of the produce is weighed at the door gate and a sample (45% - 60%) of the same is sortedin order to assess the fine leaves from the lot. Fine leaves are those having two leaves and a single budwhile the rest consists of single leaves. The proportion of the same in the sample is assumed for theentire lot and the lot is priced accordingly.
The moisture content of tea leaves plays a significant role for determining and maintaining qualityof final tea. The first step in the processing of tea leaves is known as withering. This process entails drying ofthe leaves and reducing the moisture content. This may be done either through natural process by drying outin the sunlight or exposing the leaves to gases in troughs. Here the tea leaves are subject to around 70 percentwithering which implies reducing the moisture content by 30 percent and retaining 70 percent of the moisture.The single leaf (also known as baanji in colloquial term) along with the hard leaf is also put to withering.Usually, the hard leaves are separated but if the hard leaves somehow pass through production, it results inthe presence of black matter in the final produce which is not a good fit. Once the withering is completed, thewithered leaves are passed to the machinery for a treatment known as Cut-Tear-Curl (CTC) to turn into teagranules. In this process, most of the extraneous matters present in the tea leaves are removed.

102 Orissa Journal of Commerce, Volume XXXXI, April- June-2020, Issue No-II
The next stage involves the fermentation process. In this stage, the tea granules are chemicallytreated with water and oxygen leading to the black colour of tea. The objective of this oxidization is tostandardize the moisture content. This process exudes the bloom (lustre) and briskness (harshness) ofthe tea granules. The shiner the produce, the better is the quality.
The lot is then passed into the dryer whereby the moisture content is further standardized to a rangeof 2.7% to 3.1%. Once this is done, the tea granules are then further processed for sorting and grading.Here, the tea granules are sorted on the basis of their size and extraction of the fibre present in the lot.Based on their size, the granules are sorted into different grades namely, Pekoe (P), Flower Pekoe (FP),Broken Pekoe Souchong (BPS), Broken Orange Pekoe Large (BOPL), Broken Orange Pekoe (BOP),Broken Orange Pekoe Small (BOPSM), Broken Pekoe (BP), Broken Pekoe Small (BPS), Pekoe Fannings(PF), Orange Fannings (OF), Broken Orange Pekoe Fanning (BOPF) and Dust. All these grades arefurther divided into primary and secondary – the former has basically clean and sharp cut granuleswith very little or no fibre content and fetches a higher price while the latter has greater fibre contentwith comparatively less price than the former. The produce is then packed as per the various grades andput for private sale or auction sale.
Grades of TeaTea has its variety consisting of Black Tea (Orthodox and CTC) and Green Tea and others. India is
a major producer of Black CTC Tea. After the processing, Black Tea is segregated and is gradedaccordingly. The Tea Board recognizes the following standardised grades of Orthodox and CTC Tea asenlisted out in Table 2.
Table 2: Grades of Tea
CTC Broken Leaf Fanning Dust
FP BPS Pekoe BOPL BOP BOPS BP BPS
OF PF BOPF
Pekoe Dust Dust Churamoni Dust Golden Dust Super Red Dust Fine Dust Super Fine Dust
ORTHODOX
Whole Leaf Broken Flowery Pekoe Fine Tippy Golden Flowery Orange Pekoe Tippy Golden Flowery Orange Pekoe Tippy Golden Flowery Orange Pekoe 1 Golden Flowery Orange Pekoe Flowery Orange Pekoe Orange Pekoe
Broken Orange Pekoe 1 Golden Flowery Broken Orange Pekoe Broken Orange Pekoe Soucheng Golden Broken Orange Pekoe Flowery Broken Orange Pekoe Broken Orange Pekoe
Fanning Dust Golden Orange Fanning Flowery Orange Fanning Broken Orange Pekoe Fanning
Orthodox Churamani Dust Orthodox Pekoe Dust Broken Orange Pekoe Dust Broken Orange Pekoe Fine Dust Fine Dust Dust A Special Dust Golden Dust Orthodox Dust
Source: Indian Tea Association, www.indiatea.org

103Orissa Journal of Commerce, Volume XXXXI, April- June-2020, Issue No-II
Table 3: Summary of Tea Grades
Tea Grades / Sub-grades Orthodox CTC Total
Whole leaf 7 - 7
Broken 6 8 14
Fannings 3 3 6
Dust 9 7 16
Total 25 18 43
Source: Indian Tea Association, www.indiatea.org
With a total of 43 varieties of sub-grades of tea based on the processing system as reflected inTable 3, the question of establishing homogeneity on the basis of quality becomes a little difficult. Forthis purpose, we shall be comparing the variants/grades prevailing in case of coffee at a later stage.
While marketing tea, the packed tea granules from the factories are sent to the warehouses and asample of the same, according to the various grades are also sent to the tea brokers. The brokers play avital role in marketing of the produce especially for sale through auction. They are the intermediariesbetween the buyers and sellers of tea. The brokers are responsible for fetching the right buyer and pricefor the lot. In order to further the process, they make an evaluation report on the quality of the teagranules after proper tasting of the cup prepared. This report contains the following elements:-
(i) Appearance – The following aspects are carefully considered here:a. Size and colour of raw teab. Fibre contentc. Bloom or glow or shine or lustre(ii) Infusion – This pertains to the remains of tea grains after boiling. The purpose of this is to
check the appearance or colour of the tea granules which speaks about the fermentation process. A dullor dark colour of the remains reflects a negative quality.
(iii) Liquor – This entails the taste of the tea cup prepared i.e., liquid tea. The following aspects areobserved hereunder:
a. Briskness – harshness in tasteb. Strength – capacity to hold the brisknessc. Cup colour – shiny colour of the liquid tea after pouring milk.

104 Orissa Journal of Commerce, Volume XXXXI, April- June-2020, Issue No-II
The broker mentions all these features of the tea produce regarding the various grades separatelyand based on such factors estimates the value or price that it should fetch. Based on the report, thebroker sends lots to the various buyers and tries to fetch as much value for the lots which is revealed inthe auction process. This makes the role of the brokers very pivotal for determining the quality of thetea and its commercialization. Damodaran (2000) had also suggested a framework for the issue onhomogeneity in his Report to the Tea Board of India ‘…a framework for commodity based futurescontracts in tea could work out by segregating more than 50 grades on which such contracts could betraded. The tea brokers would be the key to shaping up the quality regulation mechanism’.
Coffee Quality and GradesCoffee includes 500 genera and over 6,000 species but only two of them are currently of real
economic importance- Arabica and Robusta. Coffee Arabica, referred to in trade as Arabica accountsfor 60-70 per cent of the world coffee production while Coffee Robusta accounts for 30 – 40 per cent ofthe world coffee production. Two other species are also traded, but to a very limited extent – Coffealiberica and Coffea excelsa.
The above classification of coffee is based on the bean size. The grades of coffee are made on thebasis of the size of the coffee beans. The theory behind classification based on bean size is that coffeesof the highest altitudes are more dense and larger in size than those produced at lower altitudes. Similarlycoffees develop more slowly at higher altitudes and often have the best flavour profiles. The size andsize distribution of beans also has an impact on the optimization of roasting conditions. Each producingcountry has developed its own classification and grade charts, often used to set minimum standards forexport.
Quality doesn’t only mean exceptionally good looking (visually perfect) bold beans. Small beanscoffee can also show excellent quality. Conversely, visually perfect bold beans could in fact hide veryunpleasant cup characteristics. In reality, there exists a market for everything- from expensive top qualityto qualities at the other end of the spectrum. There is room in the marketplace for just about anyonewho honours their contractual obligations and who adequately satisfies the market’s quality expectationsfor the type of coffee they produce.
The coffee is generally classified on the basis of their economic importance into two viz., Arabicaand Robusta, but it has quite a few variants under the two mentioned classifications and is graded asshown in Table 4.
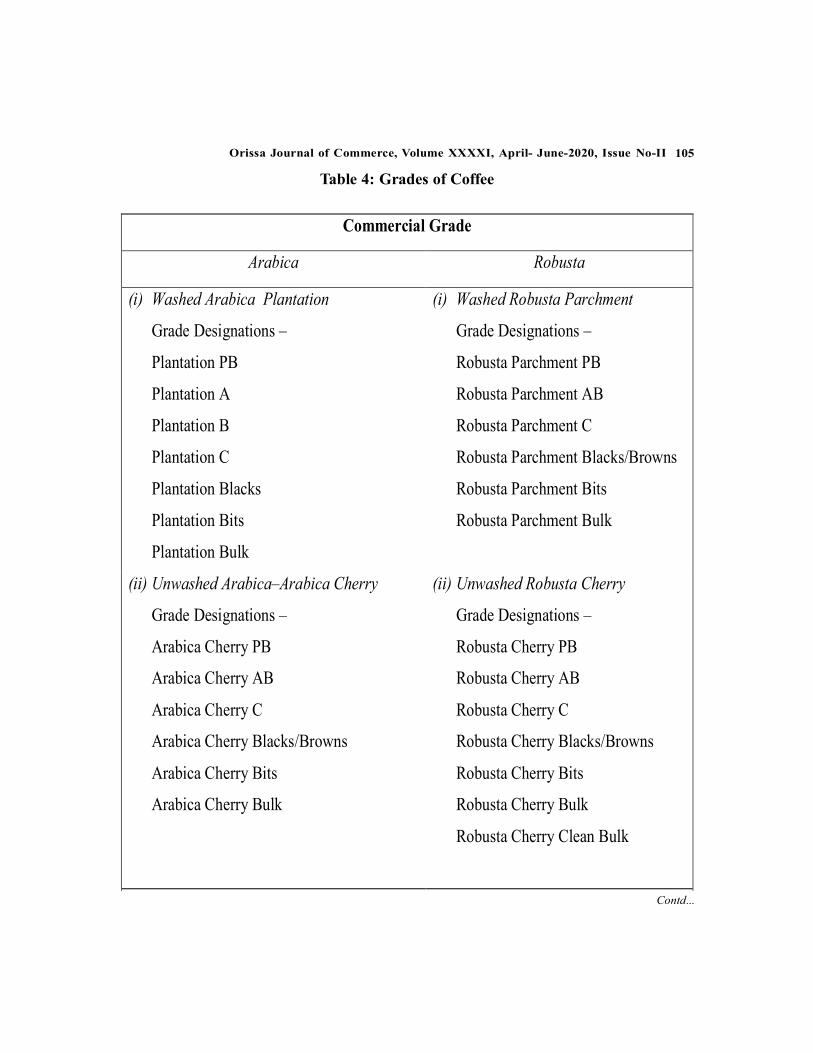
105Orissa Journal of Commerce, Volume XXXXI, April- June-2020, Issue No-II
Table 4: Grades of Coffee
Commercial Grade
Arabica Robusta
(i) Washed Arabica Plantation
Grade Designations –
Plantation PB
Plantation A
Plantation B
Plantation C
Plantation Blacks
Plantation Bits
Plantation Bulk
(i) Washed Robusta Parchment
Grade Designations –
Robusta Parchment PB
Robusta Parchment AB
Robusta Parchment C
Robusta Parchment Blacks/Browns
Robusta Parchment Bits
Robusta Parchment Bulk
(ii) Unwashed Arabica–Arabica Cherry
Grade Designations –
Arabica Cherry PB
Arabica Cherry AB
Arabica Cherry C
Arabica Cherry Blacks/Browns
Arabica Cherry Bits
Arabica Cherry Bulk
(ii) Unwashed Robusta Cherry
Grade Designations –
Robusta Cherry PB
Robusta Cherry AB
Robusta Cherry C
Robusta Cherry Blacks/Browns
Robusta Cherry Bits
Robusta Cherry Bulk
Robusta Cherry Clean Bulk
Premium Grade Contd...

106 Orissa Journal of Commerce, Volume XXXXI, April- June-2020, Issue No-II
Premium Grade
Arabica Robusta
(i) Washed Arabica – Plantation
Grade Designation –
Plantation AA
Plantation PB Bold
(ii) Unwashed Arabica – Arabica Cherry
Grade Designation –
Arabian Cherry AA
Arabian Cherry A
Arabian Cherry PB Bold
(i) Washed Robusta Parchment
Grade Designation –
Robusta Parchment A
Robusta Parchment PB Bold
(ii) Unwashed Robusta Cherry
Grade Designation –
Robusta Cherry AA
Robusta Cherry A
Robusta Cherry PB Bold
Speciality Coffee
Arabica Robusta
(i) Mysore Nuggets Extra Bold
(Arabica Plantation Washed)
(ii) Monsooned Malabar-Arabica
Coffees
Monsooned Malabar AAA
Monsooned Malabar AA
Monsooned Malabar A
Monsooned Malabar Arabica
Triage
(i) Robusta Kaapi Royale
(ii) Monsooned Malabar
Robusta Coffees
Monsooned Malabar
Robusta RR
Monsooned Malabar
Robusta Triage
Miscellaneous Grades
(i) Liberia Bulk
(ii) Excelsia Bulk
Source: Coffee Board of India, www.indiacoffee.org

107Orissa Journal of Commerce, Volume XXXXI, April- June-2020, Issue No-II
A summary with regard to the variants of coffee has been presented in Table 5, which shows thatthere are 44 varieties of coffee in the Indian market with 23 grades in Arabica and 21 varieties inRobusta. The size-based classification of coffee beans has enabled to assess the homogeneity of theproduct and thereby making it conducive for the introduction of coffee futures. The presence of a numberof sub-grades in each of the two broader grades of coffee – Arabica and Robusta – reflects the diversityin quality of coffee.
Table 5: Summary of Coffee Grades
Coffee Grades / Sub-grades
Arabica Robusta
Washed Unwashed Total Washed Unwashed Total
Commercial grade
7 6 13 6 7 13
Premium grade
2 3 5 2 3 5
Speciality grade
- - 4+1=5 - - 1+2=3
Total 23 21
Source: Coffee Board of India, www.indiacoffee.org
The Homogeneity CriterionThe summary of the foregone discussion is presented in Table 6 and it is observed that the number
of broad classifications and the basis of such classification in both tea and coffee are similar. Tea isbroadly classified into two categories – CTC & Orthodox, based on the size of the granules, which arefurther grouped into Primary and Secondary with due regard to the fibre content and clean cut of thegranules. In a similar manner, Arabica & Robusta are two broad categories of coffee based on the sizeof the beans, and are further grouped into Washed and Unwashed on the basis of the method of processinginvolved. In both the cases, the classification owes its origin to the processing system involved. Again,it is found that tea has been segregated into 43 grades while there are 44 different grades of coffee; eachwith different quality specifications. The presence of 43 varieties of tea based on the processing systemmay pose a challenge to establish homogeneity of tea and thus it may not be feasible for introduction oftea futures. As per our observations made with regard to coffee, a similar constraint in coffee has beensuccessfully resolved. And considering the number of varieties prevalent in coffee which stands around44 - more or less similar to the number of tea varieties/grades, coffee futures have been doing well inderivative market. Further, coffee in itself is not a standardised commodity. The quality differs from lotto lot but these are clearly recognized and valued. Inter-governmental Group on Tea (2012) pointed out

108 Orissa Journal of Commerce, Volume XXXXI, April- June-2020, Issue No-II
that ‘…coffee sector participants have become used to thinking of their product in relation to a somewhatabstract ‘standard contract’ rather than existing in isolation.’ A similar mechanism could be adoptedfor tea also to be considered for the introduction of tea futures. It is evident from the discussion thatthere is not much divergence in case of tea and coffee with respect to quality specification and regulation.Hence, it can be said that the issues involved in terms of quality are more or less similar for both thecommodities. If the future trading in coffee has been performing successfully with so many variants,we may conclude that a good number of tea variants may not be the hurdle to introduce tea futures.
Table 6: Comparative Statement on Homogeneity
Issues on Quality Tea Coffee
Broad classification CTC & Orthodox Arabica & Robusta
Sub-classification 43 grades 44 grades
Basis of classification Size of Tea Granules
Primary & Secondary
Size of Coffee Beans
Washed & Unwashed
In augmentation, a case of coffee futures introduced in the NCDEX is undertaken in order to drawa reference to the quality specifications based on which trading of coffee futures was initiated. In spiteof the varying grades in quality of coffee, the introduction of coffee futures has been facilitated withcertain specifications.
The contract grade for delivery of Arabica Coffee futures contracts made under NCDEX Regulationsshall be Plantation A or B Arabica Coffee conforming to the quality specification as follows:
Quality Specification of Plantation A(i) A minimum of 90% by weight of the coffee shall stand on a sieve with round holes of 6.65 mm
(screen no. 17)(ii) A maximum of 1.5% by weight of the coffee may pass through a sieve with round holes of
6.00 mm (screen no. 15)(iii) The coffee may contain ‘Pea Berry’ subject to a maximum of 2% by weight.(iv) The coffee may contain a ‘triage’ subject to a maximum of 2% by weight.(v) Black beans should not exceed 0.25% by weight.(vi) Maximum permissible moisture 11.0%(vii)Should be totally free from foreign and extraneous matter.Quality Specification of Plantation B(i) A minimum of 7.5% by weight of the coffee shall stand on a sieve with round holes of 6.0 mm
(screen no. 15)(ii) A maximum of 1.5% by weight of the coffee may pass through a sieve with round holes of
5.50 mm (screen no. 14)

109Orissa Journal of Commerce, Volume XXXXI, April- June-2020, Issue No-II
(iii) The coffee may contain ‘Pea Berry’ subject to a maximum of 2% by weight.(iv) The coffee may contain a ‘triage’ subject to a maximum of 3% by weight.(v) Black beans should not exceed 0.25% by weight.(vi) Maximum permissible moisture 11.0%(vii)Should be totally free from foreign and extraneous matter.The contract grade for delivery of Robusta Coffee futures contracts made under NCDEX Regulations
shall be Robusta Cherry Clean Bulk or Robusta Cherry AB conforming to the quality specification asfollows:
Quality Specification of Clean Cherry Bulk(i) A minimum of 98.5% by weight of the coffee shall stand on a sieve with round holes of 5.0
mm (screen no. 13)(ii) A minimum of 50% by weight of the coffee may pass through a sieve with round holes of 6.00
mm (screen no. 15)(iii) The coffee may contain ‘Pea Berry’ subject to a maximum of 25% by weight.(iv) A maximum of 0.5% by weight of the coffee might be blacks and browns.(v) The coffee may contain a ‘triage’ subject to a maximum of 3% by weight.(vi) Maximum permissible moisture 12.0%(vii)Extraneous matter and mould not to exceed 0.2% by weight.Quality Specification of Cherry AB(i) A minimum of 90% by weight of the coffee shall stand on a sieve with round holes of 6.0 mm
(screen no. 15)(ii) A minimum of 25% by weight of the coffee may pass through a sieve with round holes of 6.65
mm (screen no. 17)(iii) A maximum of 1.5% by weight of the coffee may pass through a sieve with round holes of
5.50 mm (screen no. 14)(iv) The coffee may contain ‘Pea Berry’ subject to a maximum of 2% by weight.(v) A maximum of 0.5% by weight of the coffee might be blacks and browns.(vi) The coffee may contain a ‘triage’ subject to a maximum of 1.0% by weight.(vii)Maximum permissible moisture 12.0%(viii)Extraneous matter and mould not to exceed 0.2% by weight.It is essential to ensure standardization of commodity or develop delivery standards before offering a
commodity for derivatives trading. However, wide quality variations in farm produce within a state andeven wider variations across states become a challenge for putting up common quality parameters for acommodity before the same has been offered for futures trading. Under such circumstances, there may notbe a reliance on offering standardized contracts alone, and may also consider offering trading of customized

110 Orissa Journal of Commerce, Volume XXXXI, April- June-2020, Issue No-II
contracts. Plantation A or B of Arabica coffee and Cherry Clean Bulk or Cherry AB of Robusta coffee waslaunched with further specifications pertaining to quality for futures trading in NCDEX.
As in the case of coffee, conforming tea to certain specifications, in similar fashion, with adherenceto its processing and tasting in terms of appearance, infusion, liquor and specifying the criteria couldbe made possible for the introduction of tea futures. Instead of specifying all the grades, a limitednumber of grades of tea futures could be traded in the derivatives market as is the case with coffeefutures traded in NCDEX. The role of the tea brokers would be very vital in this regard.
Furthermore, the Committee on Commodity Problems (2012) in its Report had suggested analternative framework comprising of developing an index based futures contract where the index couldbe an auction average price for a defined category of tea. The advantage of this would be totaltransparency of the asset price at closing and absence of any disputes regarding quality issues. The onlything critical for the success of this futures market is the selection of the correct index.
ConclusionThough many agricultural commodities are traded in the Indian derivatives market, some of the
important products have not entered this market. Tea is such a product which does not have a place inthe commodity exchanges in India so far. Coffee being a similar kind of product has a strong positionin the derivative market at national and international level. The quality aspect of agricultural cropsmakes agri-derivatives somewhat complex and believed to be a deterrent factor in introduction of ‘teafutures’. The question of homogeneity is always a persisting issue when it comes to launching derivativeson agricultural commodities. Both coffee and tea have quite a large number of grades and sub-gradeswith different quality specifications. However, there are similarities on the classifications, sub-classification and the basis of classification as evident from our observation in the study. The hugenumber of grades did not hinder the introduction of coffee futures. As coffee is getting traded in NCDEXwith certain parameters of quality specifications, the quality specifications of tea could also be assessedand made suitable for introduction of ‘tea futures’.
In conclusion it can be said that there is scope of standardisation on tea and the problem ofhomogeneity is less likely to be a hurdle for introduction of tea futures in India. However, furtherinvestigation is necessary on development of standard specifications for tea as well as fulfilment ofother requisites like durability or storability, market coverage, value chain, price control/regulationsand correlation with the international market.
References• Bhattacharjee, R., & Mahapatra, S. K. (2020). Examining the feasibility of tea futures in
India. Space and Culture India, 8(1), 154-163. https://doi.org/10.20896/saci.v8i1.645• Brorsen, B. W., & Fofana, N. F. (2001). Success and failure of agricultural futures contracts.
Journal of Agribusiness, 19(2), 129-145. Retrieved on 10-06-2017 from http://citeseerx.ist.psu.edu/viewdoc/download?doi=10.1.1.515.6248&rep=rep1&type=pdf
• Coffee Board of India. Karma & quality: A guide to Indian coffee quality specifications forgreen coffee. Government of India. Retrieved from https://www.indiacoffee.org/Indian%20Coffee/coffee%20karma.pdf accessed on 22-01-2020.

111Orissa Journal of Commerce, Volume XXXXI, April- June-2020, Issue No-II
• Damodaran, A. (2000). Feasibility Report on Futures Market for Tea. Tea Board of India.Retrieved on 04-01-2017 fromhttp://www.fao.org/fileadmin/templates/est/COMM_MARKETS_MONITORING/Tea/Documents/IGG_20/12-3-Futures.pdf
• Hosseini-Yekani, S. A., Zibaei, M., & Allen, D. E. (2009). The choice of feasible commoditiesfor futures trading: A study of Iranian agricultural commodities. African Journal of AgriculturalResearch, 4(3), 193-199. Article D16E00D33722. Retrieved on 09-09-2017 fromhttps://academicjournals.org/journal/AJAR/article-abstract/D16E00D33722
• Intergovernmental Group on Tea. (2012). Risk Management Practices in Tea Markets: A CaseStudy of Possible Futures Contracts In India. Committee on Commodity Problems. Retrievedon 08-07-2017 fromhttp://www.fao.org/fileadmin/templates/est/COMM_MARKETS_MONITORING/Tea/Documents/IGG_20/12-3-Futures.pdf
• International Trade Centre. (2011). The Coffee Exporter’s Guide. Third Edition.• NCDEX. Arabica Coffee Product Document. India. Retrieved on 22-01-2020 from http://
www.cmlinks.com/pub/commodity/ProductNotes/Arabica_Coffee.pdf• NCDEX. Robusta Coffee Product Document. India. Retrieved on 22-01-2020 from http://
www.cmlinks.com/pub/commodity/ProductNotes/Robusta_Coffee.pdf accessed• Qehaja, L. (2014). Feasibility studies on future exchange of agricultural commodities in
Kosovo [Thesis, Rochester Institute of Technology]. Retrieved on 05-05-2019 from http://scholarworks.rit.edu/theses/8113/
• Raipuria, K. (2001). Report of the Group on Forward and Futures Markets. Department ofAgriculture and Cooperation. Government of India. Retrieved on 17-03-2016 from http://www.fmc.gov.in/WriteReadData/links/report7-925109181.pdf
• Securities and Exchange Board of India. (2018). Annual Report 2017-18. Government ofIndia. Retrieved on 20-10-2019 from https://www.sebi.gov.in/reports/annual-reports/aug-2018/annual-report-2017-18_39868.html
• Shim, E. (2006). Success factors of agricultural futures markets in developing countries andtheir implication on existing and new local exchanges in developing countries [Dissertation,Tufts University]. Retrieved on 12-03-2018 from https://dl.tufts.edu/concern/pdfs/vt150v994
• Zhang, J. (2012). The feasibility and challenges of introducing futures exchange to the shrimpmarkets [Master Thesis, Norwegian School of Economics Bergen]. Retrieved on 03-04-2017from https://openaccess.nhh.no/nhh-xmlui/bitstream/handle/11250/169995/Zhang_2012.PDF?

112 Orissa Journal of Commerce, Volume XXXXI, April- June-2020, Issue No-II
Relationship Between Demographic Variables andAwareness on Cybersecurity Threats: An Empirical
AnalysisDr. Leena B. Dam1 & Kalyani Deshpande2
ABSTRACTTrillions of transactions are hit every day by the online mode of Banking. As the number of
transactions is exponentially increasing, there is an increase in cybersecurity breaches resulting in afinancial loss to the customers. For any risk to get materialized there is some vulnerability left open bythe users which are triggered by the external threats by attackers. The first point of the target is alwaysthe human being in any attack, and how he responds to that always decides the level of losses after theincident. E-banking channels is a boon in today’s digital world when operated safely with due care,and following all norms of distancing from cybersecurity threats. Scheduled Urban Cooperative Banksin India has a major stake in the banking sector providing all E-banking services to its customers.Using primary data this paper attempts to assess the relationship of demographic variables oncybersecurity measures adopted by users of E-banking holding bank accounts in Scheduled Urban Co-operative Banks in India. The study reveals that users across all age groups, education levels, andgender are strongly susceptible to cybersecurity threats, and vulnerabilities. Bank’s effort to educateusers through education emails and messages is not sufficient to improve the awareness of users aboutvarious types of threats, and security lapse. Banks are urged to go beyond mass mailing, and propagatepersonalized safe protocols to adhere during E-banking.
Keywords: Cybersecurity, E-Banking, Threats, Vulnerabilities, Cyber Frauds, Urban Co-operative Banks
IntroductionTechnology has changed the way of customer service in Banks from former branch banking to the
E-banking modes, and fraudsters have also changed the ways of making theft in Bank accounts. E-banking is flourished through various channels of Internet Banking, Mobile banking, UPI (UnifiedPayment Interface) for customers for speed, convenience, and cost of delivery is concerned, but alongsideit has brought many risks and more security challenges. It has also ushered new orientation to risks,
1. Professor, Global Business School, and Research Centre, Dr. D.Y. Patil Vidyapeeth, Pune Email:[email protected]
2. Research Scholar, Global Business School, and Research Centre, Dr. D.Y. Patil Vidyapeeth, PuneEmail: [email protected]

113Orissa Journal of Commerce, Volume XXXXI, April- June-2020, Issue No-II
and innovative forms of risks.With the ongoing digital drive in India, the number of users opting for online banking is increasing
exponentially. The number of mobile banking payments across India in the fiscal year 2019 accountedfor approximately 6.2 billion. This was a tremendous increase compared to the previous fiscal yearhaving 1.8 billion transactions. The Indian digital payments market is estimated to reach the one trillionU.S. dollar mark by the year 2023 (Keelery, 2020). As per NPCI out of 144 banks that were live on theUPI, cooperative banks formed a substantial chunk, and more than 360 cooperative banks live on IMPS(Immediate Payment Service). Thus, customers of cooperative banks are also opting for digital bankingchannels for performing financial transactions. As more individuals access their bank accounts on mobileapps more cyber risks are emerging from mobile apps, and due to careless/unaware handling of mobiledevices. This study attempts to assess how demographic variables influence the cybersecurity measuresadopted by E-banking users.
Hackers use various innovative ways, and advanced techniques to mimic the customers to becomevictim of the attack by luring the information security implemented by banks. Cyber-attacks are becomingmore sophisticated, and cybercriminals continue to develop insidious ways to breach networks.Maneuvering ways to gain access to customer’s private and sensitive data includes social engineering,phishing, spoofing, and malware attack, is on the rise. A breach can lead to online fraud, identity theft,and corporate account takeover causing extensive non-irrecoverable financial damage. In all these attacksthe customer’s response plays a critical role. How the customer responds to suspicious activities like aphone call, fake/spam mail, or fake link determine the extent of damage. Vulnerabilities left open bythe customers like weak passwords, storing sensitive information on the device, not using the auto-lock/ timeout feature of the mobile device are most attack prone and make them susceptible. The security ofany cyber infrastructure primarily depends on how users exercise self-protective information securitybehavior, and on how users implement the definition of cybersecurity in the context in which theyoperate.
Literature ReviewImportant research work in the domain of cybersecurity has been reviewed to identify the research
gap. The summary of the selected reviews is discussed hereunder in brief.Gratian, (2018) has correlated human characteristics with cybersecurity challenges intentions to
present a comprehensive study that examines how risk-taking preferences, decision-making styles,demographics, and personality traits influence the security behavior intentions, and demonstrated thatthe influence of individual differences on security behavior intentions can vary between environments.The differences, and/or relationships in the awareness level of individuals towards cybersecurity issues,considering four basic demographic factors: Gender, Age, and Education of students are studied byBarrera, (2019). The study proves that there is no relationship between the cybersecurity awarenesslevel of individuals, and their age, in an academic setting in higher education.
Customer’s expectations about the modern digital banking channels were studied by Rajan, et al.(2018), and found that the majority of the customers are opting for use of ATM, Internet Banking,Mobile Banking, and Tele Banking as their channel of interacting with banks. But there is a need toincrease customer’s awareness about cybercrimes when dealing with online Banking, and sensitive

114 Orissa Journal of Commerce, Volume XXXXI, April- June-2020, Issue No-II
financial data was pointed by Ali, et al. (March 2017) in their study on the effects of cyber threats whiledealing with online banking services. The increase in the attack has led to a decrease in the use ofonline Banking, and has negatively reduced consumers’ trust in the ability of financial bank institutionsto protect them is mentioned in the study of Williamson, et al. (2006). E-banking users face commonattacks like social engineering, phishing, password cracking, Trojans, DOS-Denial of Service, etc. DOSis an attack-type in which legitimate users are unavailable with the required services of E-banking.There are various defence mechanisms required to be implemented by Banking organizations that includeenabling network security firewalls and enabling policies, implementing secure socket layer, passwordpolicies, and auditing security logs. Zachary (July 2012) studied the challenges in electronic bankingfor security issues to maintain the privacy of information, and the ways of subsequent misuse ofconsumers’ confidential information for recommending security measures. Information security threatsin terms of technology, human traits, and organizational vulnerability were examined by Jacob, et al(Sept 2016). This study concluded with the fact that human-related threats pose more security issueswhen comparing to other types of threats. Therefore, there is an urgent need for employee orientation,and reorientation to address this critical issue by encouraging effective training, and education programson information security. Potential dangers threatening the security of e-Banking services were observedin Anica & Liana (2010) through a comprehensive investigation of the cyber-attacks to identify thetools and methods that can ensure the consumers’ protection in E-Banking. Cybersecurity risks of internetbanking in emerging countries was analysed by the Alghazo & Kazimi (2017) to propose a novel modelto reduce the cybersecurity risk to bridge the gap between banks, and customers which mainly emphasizesthe security guideline required to be followed by Banks, and customers. The guideline includes usingthe trusted device to ensure the identity of the users while the user is logging on, sending an SMS alertto confirm if it was the intended user, providing security warnings on Bank websites, and using ArtificialIntelligence to judge the user behaviour with continuous user Education to ensure safe Internet bankingexperience. Marshall (2010) has mentioned the negative impact, and data integrity consequences withendless degradation of sensitive commercial, and personal financial information due to internet hackersgetting access to unsecure financial systems online if cybercrimes using technology bombs like maliciouscode Trojans directed at financial institutions is not minimized, and standard global, and domestic policyregulation requirement for all financial institution’s information system security along with legalenforcement for is non-compliance is needed.
Various information security threats faced by the Indian banks were studied by Priya (2018) showingthat phishing and DoS has been a major threat to Indian banking organizations, and further proposedpractical suggestions for managing the information security threats as Banks shall give adequate trainingon information technology fundamentals, and basics on the technical aspects of information security toall staff along with a regular review on their policies related information security, and conduct auditexercises at appropriate time duration. Research work of Adholiya & Adholiya (August 2019) pointsout that most of the e-banking users have now gained a good level of awareness or knowledge aboutthe cybersecurity threats, and issues, and tips, and practices to deal with the potential cybercrime intheir electronic or online banking but how frequently they follow the guidelines of the banks, and atwhat extent their approach of building the complete awareness is influenced by their socio-economicprofile which may lead into formulating the effective online banking services usage policies for thebank customers based on their socio-economic variables. The use of radio advertisements has also been

115Orissa Journal of Commerce, Volume XXXXI, April- June-2020, Issue No-II
proposed after finding that bank customers are vulnerable to all cybersecurity risks and threats by Olalereet al. (2014).
Research Gap Literature review gives an insight that Banking customers are opting for E-bankingchannels for ease of transactions. Nevertheless cybersecurity threats looms large that can be exploitedto execute an attack. Considerable research is done to suggest cybersecurity measures to be undertakenby Banking organizations but the review asserts that human-related threats pose more security issueswhen compared to other types of threats.
Scheduled Urban Cooperative Banks have a significant presence in the states of Maharashtra, Gujarat,and Goa in India. Customer base of Scheduled Urban Banks is different compared to the private, andpublic sector banks. They are less technical savvy but more enthusiastic to adopt new techniques. Fewstudies have been done to understand the relationship of demographic factors with cybersecurity forcustomers, and employees of private, and public sector banks. However, customers of Urban Co-operativeBanks have not been studied elaborately where the risk is the same for all E-banking users. Given thisbackdrop, the gap is identified to focus on the customers of Scheduled Urban Cooperative Banks fortheir awareness about cybersecurity threats, and vulnerabilities. This study will fill up the gaps and addto a new body of knowledge.
Objectives of the Study1. To study the level of awareness for cybersecurity threats, and vulnerabilities among the users
of e-banking facilities.2. To analyze the responsiveness of cybersecurity risks among the users of E-banking facilities.
Research HypothesesIn accordance with the above objectives, the following hypotheses have been formulated and
examined for the study:H1- There is significant difference among the respondents in different age groups towards
susceptibility to cybersecurity threats.H2- There is significant difference among the education level and vulnerability for cyber attack.H3- There is significant difference between the gender and their exposure to cyber security risk.
Research DesignThere are a total of 54 Scheduled Urban Cooperative Banks in India out of which 37 banks are
registered in Mumbai region. A focus was given to identify the Banks which are providing online servicesincluding Internet Banking, IMPS and UPI to their customers from Mumbai region. Out of these, weselected customers of 2 banks having their head offices in Pune and providing online services for datacollection. Using random sampling technique equal number of questionnaires were circulated to thetarget respondents of these two Banks located in Mumbai, Pune and Kolhapur districts.
A structured close-ended questionnaire was designed addressing cybersecurity threats, vulnerabilities,and security awareness. The questionnaire was vetted from bank experts. Respondents were asked torate on the 5 point Likert scale questions number 1 to 6 which captured information on their awareness,and knowledge of vulnerabilities, and threats. For studying the security awareness of customers 8

116 Orissa Journal of Commerce, Volume XXXXI, April- June-2020, Issue No-II
questions were asked on a 5 point Likert scale; the responses ranging from 5 Strongly Agree to 1 forStrongly Disagree.
Out of the 156 responses received, 140 responses were found to be complete in all regards andthereby used for the study.Data Analysis and Discussion
The demographic characteristics of the respondents are summarized below:Table 1: Profile of the respondents:
Total responses: 140
Parameters Categories Number of
Respondent (%) Gender Male 70 (50%)
Female 70 (50%) Age group
18-25 Years 43 (31%) 25-35 Years 42 (30%) 35-45 Years 32 (23%) 45-55 Years 18 (13%) Above 55 Years 5 (4%)
Educational Background
12th pass 12 (9%) Graduate 69 (49%) Post Graduate 54 (39%) Doctorate 1 (1%) Others 4 (3%)
E-banking mode Used Internet Banking 63 (25%) POS 22 (9%) Mobile E-banking 61 (24%) Payment Wallet 26 (10%) UPI 77 (31%)
Period of using E-banking mode
Less than 1 month 11 (8%) 1 month to 6 month 8 (6%) 6 month to 12 months 12 (9%) More than 1 year 109 (77%)
Source: Primary Data
The analysis of the profile indicates that the age group of 18-25 years constituted the highest numberof respondents accounting for 43 percent of the sample size followed by 42 percent amongst the agegroup of 25-35 years of customers who are availing E-banking channels for making transactions.Maximum customers of 49 percent are graduate followed by 39 percent of customers who arepostgraduate whereas 9 percent of respondents were undergraduate. All of these respondents were familiarwith the use of E-banking channels. Each of the customers was using one or more of the modes for

117Orissa Journal of Commerce, Volume XXXXI, April- June-2020, Issue No-II
making online banking transactions. The highest number of respondents of 31 percent of the total havemarked UPI as their mode of transactions followed by Internet Banking mode with 25 percent use. Thesample shows that E-banking is no more a new methodology for the customers but it has gained itspopularity since 77 percent of people are using any of these channels for more than a year. Only 8percent of customers are new to E-banking modes registered within a month at the time of data collection.
Analysis for Hypothesis 1H1- There is significant difference among the respondents in different age groups towards
susceptibility to cybersecurity threats.
Table 2: Response of different age group customers towards external threats.
Sl. No. Type of external threat F value p value
1 Use of free public wi-fi, and access the internet in public places. 2.793 .029
2 Perform online-banking transactions using free public Wi-fi. 4.643 .002
3 Jailbreak or root to customize operating system utilities of the mobile device.
3.133 .017
4 Download apps where maximum incentives and discounts are offered.
3.760 .006
5 Open links received from emails, and social media platforms. 3.277 .013
Source: SPSS output
As per evidence thrown by the sample in Table 2, we accept the H1, as the p value is less than 0.05.We are 95% confident that respondents in different age groups have different susceptibility to variouscyber security threats discussed above. Users in the age group of 18 to 35 are more susceptible to thethreats of use of free public wi-fi, and to access the internet in public places. Free public wi-fi is madeavailable on the airports’ railway stations, hotels, coffee shops, etc but it exposes the customer to severaldisguised vulnerabilities. Free wi-fi access points may also be “rogue access points” tricking victimsinto connecting to what they think is a legitimate network because the name sounds reputable, andknown. Downloading unknown apps where maximum incentives and discounts are offered and threatof jailbreak or root the mobile device to customize operating system is also more exposed to theyoungsters in the age group of 18 to 25 years. They want to gain more access to the device to use theadditional features without knowing security risks. Jailbreaking in iOS, and root access in androidgives the privileged administrator access allowing using many interesting features of the device. At thesame time, it makes them more susceptible to malicious attacks. The operating systems of mobile devicesare locked by the manufacturer to provide minimum privilege access to the users. This is designed forthe user to stay safe against malicious attacks. If a user has administrator access, any attack that isspecialized enough will have the same access to a user account, and consequently total control to doanything with data. Users in the young age respond to phishing mails by opening unknown links received.

118 Orissa Journal of Commerce, Volume XXXXI, April- June-2020, Issue No-II
These are social engineering tactics where criminals impersonate trustworthy sources to get customersto click on a link or download an app that contains malware. When user clicks on unverified links ordownload suspicious apps they increase the risk of exposure to malware. Users in the age group above35 years are more reluctant to download new apps or respond to any links or mails and so makethemselves safe from these attacks. Statistics reveal age has a significant role while responding to thesethreats.
Analysis for Hypothesis 2H 2- There is significant difference between the education level and vulnerability for cyber attack.
Table 3: Education and exposure to vulnerabilities for cyber attack
Sl. No. Type of vulnerability F value p value
1 Use an auto-lock or time-out feature on your mobile phone. 1.148 .337
2 Change online bank passwords after accessing the internet through public wi-fi.
1.649 .166
3 Upgrade the operating system to latest versions, and regularly update patches for the operating system
1.020 .399
4 Installation of antivirus software in your phone device. 1.145 .338
5 Storing sensitive data (debit card, Aadhar, Pan Card) on the mobile device
.766 .549
6 Password protection to sensitive data stored (debit card, Aadhar, Pan Card) on your mobile device
1.434 .226
Source: SPSS output
As per evidence shown by the sample in Table 3, p value is greater than 0.05 in all the parametersand therefore we reject H2. For ease of use and simplicity in operations, customers do not auto-locktheir mobile devices of all education levels. They do not change their passwords even after makingbanking transactions using public wi-fi. Customers do not understand the risk behind the credentialswhich get captured through public wi-fi and thereby increase chances of cyber frauds. Cybercriminalsmay buy special software kits, and even devices to help assist them with eavesdropping on Wi-Fi signals.This technique can allow the attackers to access everything that people are doing online, any informationthey may have filled out while visiting webpage to being able to capture login credentials and evenhijacking the accounts. Hence entering credentials to perform online banking transactions with free wi-fi is extremely dangerous. Particular care is necessary to change the login credentials immediatelyafter completing the transaction on public wi-fi. Online Banking users are reluctant in upgrading theiroperating system of the mobile device to latest versions, and regularly update patches for the operatingsystem. All users keep their system equally vulnerable by not installing proper antivirus software intheir mobile device. Education does not make any difference when all users normally store their sensitive

119Orissa Journal of Commerce, Volume XXXXI, April- June-2020, Issue No-II
data (debit card, Aadhar, Pan Card) on the mobile device for future use without password protection inunencrypted form. Thereby we conclude that Education level does not have significant difference onthe exposure to vulnerabilities for cyber-attacks.
Analysis of Hypothesis 3H3- There is significant difference between gender and their exposure to cyber security risk.
Table 4: Gender and responsiveness to security awareness while using E-bankingchannels.
Sl. No. General security awareness tips F value p value
1 Providing Bank credentials on phone calls. .580 .677
2 Check for security and authenticity of any website before entering any personal or financial data. 1.419 .240
3 Awareness about phishing, malware, etc circulated through emails. .391 .759
4 Reconciliation of Bank statements with the SMS alerts received from the bank. 1.830 .127
5 Online E-banking passwords are kept simple for easy recall. 2.336 .059
6 Sharing passwords with bank personnel for performing online transactions. 2.441 .050
7 Sharing passwords with friends/family/colleagues for performing online transactions. 2.211 .071
8 Immediately changing the passwords in case it is shared with others. 0.193 .942
Source: SPSS output
We studied the relationship between gender and responsiveness to security awareness while usingE-banking channels. As per evidence thrown by the sample in Table 4, we are 95% confident that bothgenders are equally exposed to cybersecurity risks. There is no difference in the awareness of followingthe tips for secured E-banking transactions based on gender. As the p value is greater than 0.05 in allthe cases, we accept H 3.
Both gender customers can become the victim of fraudulent calls. When cyber criminals purport aslegitimate bank personnel and seek confidential information people concede to request easily. Customersdo not check for security and authenticity of any website before entering any personal or financial data.They keep simple passwords for an easy recall which can be breached effortlessly by the brute-forcingattacks. People become victim of social engineering attacks. People are less aware of phishing, malware,or any other type of cybersecurity attack that may occur through their mobile devices resulting in financiallosses. Phishing mails are most common weapon used for executing online frauds where the senderpretends as known person or Bank or government body asking for confidential credentials. The resultshows that gender does not make any difference while responding to such phishing mails which thenperform various malicious activities like executing malware, or Trojan to steal the data.

120 Orissa Journal of Commerce, Volume XXXXI, April- June-2020, Issue No-II
Customers of both genders are less aware of basic security guidelines of changing the passwordsonce it is shared with someone or reconciling bank statements with the online transactions and checkingthe transaction alerts generated on the mobile devices. Banks mandatorily send SMS alerts on theregistered mobile number and email id of the customers. These alerts are the best navigator to spotfraudulent activity for users. For any suspicious alert received on the activity not done by the user, ifreported faster in minimal time to the Bank call center or helpdesk number, the bank may be able toresolve it sooner and restore any missing funds to customer’s account. It may also block the accountimmediately to prevent further attack. Our study finds that general security awareness is lacking inboth the gender equally.
ConclusionThis study largely signals that general users of e-banking channels are unaware of the inherent
cybersecurity threats, and vulnerabilities as they perform online banking operations. Despite having ahigher educational degree most users do not realize the unseen threat camouflaged under freebies,discounts, and look alike authentic sites of government authorities, banks, etc. There exists a highprobability that the negligent customers might not realize funds being usurped from their account. Forfailing to immediately reconcile bank SMS alerts with digital passbook balance to check for authorizedtransactions, customers tend to lose the battle as fund reversal is not feasible due to being time-barred.
When educated people fall easy prey to cyber-criminal attacks, it raises questions on the securityof E-banking transactions and makes the E-banking system vulnerable. An increase in the growth ofonline banking suffers challenges due to attacks, and the risk of fraud (phishing) data compromise.Urban Co-operative banks may lose customer trust if cyber frauds remain unchecked. ContinuousCustomer education and reinforcement of safety protocols to be followed while using E-banking channelsneed to be constantly harped upon the users.
RecommendationsShort quizzes with rewards attached to cybersecurity threats like social engineering, Phishing,
Vishing, Trojans, Malware attacks may help to increase individual awareness. Providing proper, andadequate information regarding security best practices to the customers on Bank websites or whilelogging into the digital application can be a step towards reducing the risk of fraud occurrence. There isa need for incorporating compulsory topics on cybersecurity in the academic courses in all educationlevels to increase the awareness about security. Extensive use of social media to propagate securitymeasures to be integrated as a lifestyle measure while using e-banking channels should be done by thebanks. Mandatory training clips about cybersecurity guidelines, and various possible threats in vernacularlanguage should be provided to the customers in higher age groups, and customers having low educationlevels when they register for E-banking applications. E-banking channels is a boon in today’s digitalworld when operated safely with due care, and following all norms of distancing from cybersecuritythreats.
References• Adholiya, A., & Adholiya, S. (August 2019). A Study on Cyber Security Practices and Tips
Awareness among EBanking Services Users of Udaipur, Rajasthan. International Journal ofScientific Research in multidisciplinary research, 148-154.

121Orissa Journal of Commerce, Volume XXXXI, April- June-2020, Issue No-II
• Anica, & Liana. (2010). Considerations Regarding the Security and Protection of E-BankingServices. Article in Amfiteatru Economic, 388-403.
• Barrera, & Dr. Juan Carlos. (August 2019). The Influence of Demographic Factors on theCybersecurity Awareness Level of Individuals. The Journal of International ManagementStudies, 31-41.
• Dr. Somanadevi Thiagarajan, Dr. A. Ramachandran, & Dr. M. Thyagarajan. (2012). RiskAwareness among Public and Private Sector banks. Research Journal of social science andManagement, 102-106.
• Fatokun, F. B., Hamid, S., Fatokun, J. O., & A Norman. (2019). The Impact of Age, Gender,and Educational level on the Cybersecurity Behaviors of Tertiary Institution Students. InternationalConference Computer Science and Engineering, 1-14.
• Jaafar Alghazo, & Zafar Kazimi. (Nov 2017). Cyber security analysis of internet banking inemerging countries: User and bank perspectives. Conference: 2017 4th IEEE InternationalConference on Engineering Technologies and Applied Sciences (ICETAS) , 1-14.
• Keelery, S. (2020, March 27). Number of mobile banking payments across India from financialyear 2013 to 2019. Retrieved from statista.com: Retrieved from https://www.statista.com/statistics/870487/india-mobile-banking-payment-volume/#statisticContainer
• Liaqat Ali, Faisal Ali, Surendran, P., & Thomas, B. (March 2017). The Effects of CyberThreats on Customer’s Behaviour in e-Banking Services. International Journal of e-Education,e-Business, e-Management and e-Learning, 70-79.
• Margaret Gratian , Michel Cukier, & Sruthi, B. (2018). Correlating human traits and cybersecurity behavior intentions. ELSEVEIR computers & security, 345–358.
• Marshall, & Paul Jeffery. (Oct 2010). Online Banking: Information Security vs. HackersResearch Paper. International Journal of Scientific & Engineering Research, 1-5.
• Morufu Olalere, Victor Waziri, & Idris Ismaila. (July 2014). Assessment of Information SecurityAwareness among Online Banking Costumers in Nigeria. International Journal of AdvancedResearch in Computer Science and Software Engineering, 13-24.
• Nisha Ann Jacob, Dr George , & V Antony. (Sept 2016). A Critical Review on InformationSecurity Threats Faced by. International Journal of Advance Research in Computer Scienceand Management Studies, 7-13.
• Paliwal, N. (June 2017). E-banking- influence, threats and security. Journal of AdvancedComputing and Communication Technologies, 43-47.
• Popa, Marinela Vrîncianu , & Liana Anica. (June 2010). Considerations regarding the securityand protection of E-banking services consumers interests. Article in Amfiteatru Economic ·June 2010, 388-403.
• Priya Elizabeth Issac, & Venkatachalam. (2018). Security Threats Faced by the Indian Banks.International Journal of Pure and Applied Mathematics, 1667-1678.

122 Orissa Journal of Commerce, Volume XXXXI, April- June-2020, Issue No-II
• Rajan, P. A., Allen, D., & Shamini, R. (2018). Information Technology plays a vital role inbanking sector: Future Banking Services. JETIR, 413-417.
• Rohit Mahajan, & KV Karthik. (April 2015). India Banking Fraud Survey. Deloitte.• Sarvade, N., & Bhalla, A. (2019). Emerging trends and challenges in cyber security. Navi
Mumbai: Reserve Bank Information Technology Pvt Ltd.• Solanki, & Prof Virendar Singh. (September 2012). Risks in E-banking and their management.
International Journal of Marketing, Financial Services & Management Research, 164-178.• The importance of cyber security in banking. (n.d.). Retrieved from https://
www.theglobaltreasurer.com/2019/09/25/the-importance-of-cyber-security-in-banking/• Williamson, Gregory D, & Money, G. (2006). Enhance authentication in online banking.
Journal of economic crime management, volume 4 issue 2, Fall 2006., 1-42.• Yazdanifard, D. R., Wan Fadzilah Wan Yusoff , & Abu Bakar Sade. (2011). Electronic banking
fraud; The need to enhance security and customer trust in online banking. InternationalJournal in Advances in Information Sciences and Service Sciences, 505-509.
• Zachary B. Omariba, N. B. (July 2012). Security and privacy of electronic banking. InternationalJournal of Computer Science, 432-446.

123Orissa Journal of Commerce, Volume XXXXI, April- June-2020, Issue No-II
An Analysis of Strategic Port Reform: the wayForward to Economic Prosperity
Alaka Panda, Prof. Kshiti Bhusan Das & Dr. Rabindra Kumar Swain
1. Research Scholar, Utkal University, Email: [email protected], Contact: 99378873112. Pro- Vice Chancellor, IGNOU, New Delhi3. Asst. Professor, PG Department of Commerce, Utkal University, Bhubaneswar
ABSTRACTPort vis a vis the logistics and transportation & other allied sectors are critical to the economic
prosperity of an economy. The ports are the gateways to the global market. The state of Odisha isknown for its maritime history and overseas trade for centuries. The economic history especially thecotton route legacy reveals the contribution of this trade to the prosperity of the state. Probably, becauseof successive invasions and British occupation this activity did not get patronage, subjected to subjugationand therefore, it could not flourish. Even after independence and five year plans this sector was deprivedof its due importance. The world witnessed the role of ports in economic upsurge of different countriesincluding our neighboring countries. Therefore, the government of India after 2014 started the projectSagarmala to strengthen this sector. Fact remains that, Odisha’s is known for its geological endowmentsand whatever economic development has been achieved so far in the state, and its contribution issignificant. At the same time the state is also equally strong in its geographical features. A synergisticand strategic convergence of these two will help the state to emerge as an economic power- house ofthe country. This paper, therefore, discusses the geographical feature, especially how to harness itsbenefits. As port is one such crucial asset. This paper, therefore, discusses the geographical feature thatis the imperatives of port, port infrastructure and the enabling legal framework that can boost the tradingactivities of the region.
Keywords: Port, Logistics, Transportation, Economic Development, Legal framework
IntroductionHigh quality public infrastructure accelerates growth and prosperity of an economy. Therefore
designing a strategic vision of type and quality of infrastructure is very crucial. Integrated infrastructureplanning is sin quo non for regional development. One of the very important infrastructure planning isefficient ports with better throughput which is supported by a network of transportation and logistics.

124 Orissa Journal of Commerce, Volume XXXXI, April- June-2020, Issue No-II
There are evidences where many economic benefits’ have accrued to many countries. The countrieshave become prosperous because of well functioning multimodal ports and its hinterlands. Empiricalresults also show that the countries have experienced their bilateral trade volume has increasedsignificantly because of raising the efficiency of ports. Even there was a marked difference in theeconomic value addition and surprise increase in employment.
The port plays an important role in global supply chain and act as facilitation of trade. For thatmatter ports need to be more competitive if a region or a country needs to be benefitted. Ports can becompetitive by strengthening their maritime links, ancillary infrastructure and operations apart fromhinterland connections. Just for one example: Shenzhen which was once a small fishing village turnedinto world’s largest metropolis through an export driven growth, triggered by free trade zone enabledby an ultra modern port. Further, (a) Economic Value Addition (EVA) created by ports and port relatedindustries are substantial; (b) There are four different types of impacts of port; direct, indirect, inducedand catalyst. Direct impacts are jobs and income generated by construction and operation of the port.Indirect impacts are the employment and impact on the suppliers of goods and services. The catalystimpact is the income and employment generated by the port as driver of productivity growth andincentivizing and inviting new firms. And the induced impact is the employment& income generatedby the consumption of goods and services by the employees.
Odisha’s maritime heritage is known for its rich maritime advantages with a long coast line of 470kms. The economic history of Kalinga (earlier name of Odisha) reveals its glorious maritime trade withSouth East and South East Asian countries. This trade route was known as “Cotton Route”. Once upona time the traders with the patronage of the Gajapati and other kings contributed to the prosperity ofthis kingdom. The merchandise traded ranged from cotton and silk textile to various types of spices andhandicrafts of wood, horns, stone, silver filigree. With the advent of Mughals and British occupationover centuries, this trade got a setback. There were systematic attempts to destroy the activities. Duringthat time, historians report that, there exist more than 15 ports in the state on the Bay of Bengal whichwere connected through river ways. Now efforts are being made to promote bilateral trade, ties withthese countries leveraging the Diasporas linkage and ethnocentric linkages. Considering the potentialof trade, an integrated planning is very much essential. A good and vibrant industrial base keeping inmind the local resources, efficient transport connectivity and strong logistics sector, Ports in India andOdisha can deliver economic wonders if it has proper logistics.
Review of LiteratureMusso E, Benacchio M, Ferrari C (2000) in his research paper “Ports and Employment in port
cities” found that port attracted industries can represent a relatively large share of employment andvalue added of port regions. According to them a functional approach is to be used to capture the portattracted industries. Input and output models should be frequently used to identify the inter-sectorallinks of these industries with the port. This study has found that 10% of employment and 16% of valueadded of the main port regions in North West Europe. Korinek.J.,Sourdin P (2009) in his researchpaper “Maritime transport costs and their impact on trade policy” discusses that a higher maritimetransport costs are related to lower external trade volumes and doubling of maritime transport costsbetween two countries is associated with a decline in the value of imports and a decrease in the tradevolume. Olaf Merk (2010) in his research paper “The competitiveness of global port cities” discusses

125Orissa Journal of Commerce, Volume XXXXI, April- June-2020, Issue No-II
that many economic benefits are associated with a well functioning port like they lower the cost oftrade, generate value added and employment and attract certain economic sectors. He analyzed thatdoubling the port efficiency of two countries is found to increase their bilateral trade volume and firmsin other regions also benefit from efficient ports when exporting and importing and links with othersectors mostly takes place outside the port region. He discussed that the ports can also be made morecompetitive by strengthening their maritime links, port operations and hinterland connections. Merk,Ducruet, Haezendonck, Dooms (2011) in their research paper “Competitiveness of port cities: Thecase of the Seine Axis” explains that the value added creations by ports and port related industries canbe substantial. It includes both direct and indirect value added. Even higher shares of regional andnational GDP are attained for the port cluster of Le Havre representing more than 21% of regional GDPin 2007 and the case of the port cluster Antwerp that generates 3% of national GDP. Ferrari, Merk,Bottaso (2011) in their research paper “Ports and regional development: An European perspective” Ingeneral four different types of impact are distinguished direct, indirect, induced and catalytic impact.Direct impacts are job and income generated by the construction and operation of the port. Indirectimpacts are the employment and the impact by the suppliers of goods and services and the inducedimpact is the employment and income generated by the spending of incomes by employees created bythe direct and indirect, Catalytic impact is generated by the port as a driver of productivity growth andattractor of new firms. Mohammad Monirul Islam Monir (2017) in his research paper “The role ofport Chittagong on the economy of Bangladesh” analyzed and found that performance of Chittagongport authority is considerably low. There will be shortage in the capacity in near future without creatingnew capacity and performance improvement. Average ship turnaround time is 4.26days and dwell timefor a container is 17.48 days. Moreover the port has some natural limitations because of this reason theport cannot provide services to larger vessels. CPA is lacking with the use of IT system as result castinga lots of mismanagement and unnecessary delays. They have also issues of lack of skilled labour andlack of modern cargo equipment at the port.
Relevance of the StudyThere is no denying the fact that the industrialization contributes significantly to both the GDP of
the country and the per capita income. The industries of the country need to be competitive which isdependent on the logistics and the port sector. According to the Ministry of Shipping, around 95% ofIndia’s trading by volume and 70% of value is carried out through maritime transport. The Indian portsand shipping industry is the life line of country’s economic prosperity. The country occupies 16th positionin the world with regard to maritime activities and coast line length. Realizing the contribution of thissector Govt. of India opened up for 100% foreign direct investment through automatic route along witha ten year tax holidays. Hence study is mandatory on the economic prosperity of paradeep port.
Scope of the Study:Port sector in India were driven by high growth in External trade. In the year 2019, traffic at major
ports of the country reached 699.05 million tones. Many countries with large coastlines like Chinahave leveraged ports for aiding industrialization. India has a long coastline about 7,517 km with morethan 200 ports, providing ample opportunities for the port sector. Special Economic Zones (SEZs) arealso being developed in close proximity to ports. India is striving to improve its manufacturingcompetitiveness with the “Make in India” initiative. Ports are the drivers of socio- economic change

126 Orissa Journal of Commerce, Volume XXXXI, April- June-2020, Issue No-II
and aid long term growth trajectory of the economy. The Government is making effort towards developingports into manufacturing eco-systems which attract trade as well as investments. Ports also aid in creatingemployment and economic and industrial growth of an entire region. The major ports are performingwell financially, despite their shortcomings and inadequacies. It also underlines the significance toimprove on these inadequacies at the earliest so that the stakeholders, especially the users are benefitedby the improved efficiency in terms of cost and time.
ObjectivesOn the premise of this proposition this paper discusses and analyses the following.(i) To analyze the status of the infrastructure and the services rendered by the Paradeep port.(ii) To analyze the trade volume transacted through port to verify whether the modernization of
port is a stimulating factor to promote trade and manufacturing in the state.Research Design
This study is purely based on secondary data. Only a time series analysis has been made withregard to the transactions effected through this port from 2014 to 2019. At the same time the presentinfrastructure status of the port was also assessed. Most of the information was collected from theParadeep port website and Export promotion Board of Odisha. The study postulates a hypothesis that,port mordnisation accelerates the economic activities in the region and not vice versa. Therefore attemptsare made to correlate the two
Analysis and InterpretationTable 1: Showing value (in lakhs) of GSVA and GSDP of Odisha from the year 2011-12 to
2019-20
2011-12 2012-13 2013-14 2014-15 2015-16 2016-17 2017-18 2018-19 2019-20
Primary 65832.8 80098.6 85433.6 92601.2 90256.2 107159.5 112066 135669.9 148843.8
Secondary 69517.3 72239 85276.4 81259.6 82442.7 106682.4 114327.4 131921.6 137051.1
Tertiary 84881.6 96825.5 109732.6 121340.8 131807.1 141892.7 161595.3 179888.7 194675
Gross State Domestic Product
230987.1 261699.6 296475.4 314250 328549.5 393562.4 434769.2 495840.1 533822.5
Percentage
GSVA/GSDP 0.95 0.95 0.95 0.94 0.93 0.90 0.89 0.90 0.90
Source: Self compiled

127Orissa Journal of Commerce, Volume XXXXI, April- June-2020, Issue No-II
Table1 stated the showing the value and percentage of GSVA and GSDP of Odisha, during the year2011-12 to 2019 -20. The percentage of GSVP and GDP 2019 -20 is 0.90 % which shows that the growthis steady as compared to the previous year. As we can see the tertiary sector is growing in terms of valueso rapidly as compared to primary and secondary sectors of previous years. Which means Odishacontribution in the GSDP needs to be improvised more specially in primary and secondary sectors?
Figure-1: Showing GSVA and GSDP of Odisha from the year 2011-12 to 2019-20
Figure1.1—highlights the Gross State Value Added (GSVA) by economic activity at current prices for theyear starting from 2011-12 to 2019-20.
Economic Features of Odisha:
Table 2: Showing the GDP, FDI and infrastructure of Odisha and India
Parameter Odisha India Percentage of Odisha
GDP as percentage of all states GSDP 2.5 100 0.025 GSDP growth rate(%) 10.28 9.8 1.049 Per capita GSDP(US$) 1438.74 1456.76 0.988 Industrial Infrastructure PPP Projects(Operational) 6 740 0.008 SEZ(Operational) 4 222 0.018 Physical Infrastructure Major and minor ports 1+2=3 13+187=200 0.015 Airports 2 125 0.016 Installed power capacity(MW) 7338.42 3433788.39 0.002 Wireless Subscribers(Feb 2018) 33044432 1156867852 0.029 Internet Subscribers(Dec 2017) 10440000 445960000 0.023 National Highways (Length) 5413 115435 0.047 FDI INFLOWS Cumulative FDI equity inflows since April 2000(US $ billions 0.425 368.05 0.001
Source: Self Compiled

128 Orissa Journal of Commerce, Volume XXXXI, April- June-2020, Issue No-II
Table: 2: the above table depicts the indicators of the economy of the state in percentage termssuch as: GDP, Infrastructure and FDI during the year 2019. From the figures it is construed that theGDP growth of the state is positive and higher than the national average. Many factors have contributedto this growth like the industries, transport, port, agriculture and services sectors. Except the GSDP inall other indices, the industrial and physical infrastructure Odisha’s picture is gloomy. So far port andFDI are concerned the state has a very discouraging picture where the cumulative FDI is only 0.001percent. Investment in infrastructure both from the state and private sources need to be augmented tomatch with other developing states of the union.
Table: 3: Showing the Traffic handled capacity of Paradeep port from 2010-11 to 2017-2018in MT (Million Tones)
Year Overseas Coastal Total Unloaded Loaded Total Unloaded Loaded Total Unloaded Loaded Traffic Percentage increase
2010-11 12826 13951 26777 836 10904 11740 13662 24855 38517 --------- 2011-12 15103 14793 29896 1751 10790 12541 16854 25583 42437 10.177 2012-13 18482 15181 33663 1409 11340 12749 19891 26521 46412 9.366 2013-14 27509 17206 44715 1666 10630 12296 29175 27836 57011 22.836 2014-15 29655 14489 44144 1565 9821 11386 31220 24310 55530 -0.0259 2015-16 33790 7507 41297 2203 10754 12957 35993 18261 54254 -2.297 2016-17 36848 2098 38946 2268 15338 17606 39116 17436 56552 4.235 2017-18 38509 7346 45855 2163 19985 22148 40672 27331 68003 20.248
Source: Self Compiled
Table: 3 discusses the traffic handled by Paradeep Port from 2010 to 2018. It indicates the averagegrowth of coastal and overseas traffic growth at Paradeep Port. It is observed from the data that thegrowth of traffic of both overseas and coastal is more or less unstable. However, the average growth of2013-14 and 2017-18 are very impressive with 22 and 20 percent growth over the previous years.Therefore, it can be construed that efforts are being made to enhance the traffic in times to come.Increase in traffic means increase in the business activities in the state.
Table 4: showing the commodity wise traffic handled (percentage wise) in Paradeep port
Commodity 2014-15 2015-16 2016-17 2017-18 Coal 52.60% 40.60% 41.50% 48.80% Petroleum, Oil&Lubricants 26.60% 31.10% 33.10% 25.10% Others 13.60% 9.10% 7.50% 9.90% Iron 1.00% 12.40% 11.90% 8.70% Fertilizers 6.00% 5.00% 4.40% 5.50% Container 0.20% 0.10% 0.10% 0.20% Total 100.0 100.0 100.0 100.0
Source: Self Compiled

129Orissa Journal of Commerce, Volume XXXXI, April- June-2020, Issue No-II
Table: 4. Shows the commodity wise traffic handled by Paradeep port from the year 2014-15 to2017-18 in percentage terms.. The data reveals the fact that only coal dominates the total traffic handledby the port followed by Petroleum products. Iron ore traffic has picked up gradually after a shrink in2014-15. In the year 2017-18, But what is the cause of concern is the gradual fall in the traffic of othercommodities, which constitute handicraft, handloom, minor forest produces ,agri produces etc. Thetraffic handled in fertilizers, has increased in the year 2018-19 to 5.50% which is satisfactory as comparedto the previous years but below the percentage of 2014-15.. Container has gradually given a satisfactoryresult in the year 2018-19 with 0.20% as compared to the previous years. The results of the traffic ofcommodities might be fluctuating in percentage terms but in monetary terms there was a significantincrease, as indicated in table 1.3
Table 5: Table showing the percentage and value of exports made through Paradeep portfrom the year 2013 -14 to 2017- 2018 (In Crores Rupees )
Item 2013-2014 2014-2015 2015-2016 2016-2017 2017-2018 Metallurgical products 7682.25
(40.89%) 10836.98 (55.42%)
13132 (66.07%)
25185.93 (61.62%)
31566.46 (61.00%)
Engineering, chemical and allied products
3531.21 (18.70%)
3383.49 (17.30%)
1294.79 (6.51%)
4478.72 (10.96%)
5892.73 (11.18%)
Mineral products 3546.78 (18.89%)
634.00 (3.24%)
539.44 (2.71%)
8389.53 (20.53%)
8117.91 (15.41%
Agriculture and forest products
02.92 (0.02%)
04.39 (0.02%)
07.58 (0.03%)
16.51 (0.04%)
165.22 (0.31%)
Marine products including Fish and shrimps products
1699.41 (9.05%)
2069.00 (10.58%)
1969.00 (09.90%)
2508.32 (6.137%)
3086.97 (5.86%)
Handloom 0.64 (0.003%)
0.84 (0.004%)
0.87 (0.004%)
235.16 (0.57%)
0.53 (0.02%)
Handicraft products 0.85 (0.004%)
0.67 (0.003%)
0.22 (0.001%)
2.73 (0.006%)
1.63 (0.003%)
Textiles 10.00 (0.053%)
40.29 (0.20%)
17.23 (0.08%)
5.44 (0.013%)
15.31 (0.029%)
Pharmaceutical 0.93 (0.004%)
2.52 (0.012%)
2.31 (0.01%)
6.30 (0.015%)
13.67 (0.025%)
Electronics 2300.46 (12.24%)
2567.17 (13.13%)
2902.21 (14.60%)
5.65 (0.013%)
3776.11 (7.16%)
Gems and Jewelry NIL 0.54 (0.002%)
0.50 (0.002%)
NIL NIL
Others (Service Provider) 10.00 (0.053%)
12.01 (0.061%)
09.62 (0.04%)
37.90 (0.092%)
40.55 (0.076%)
Total 18785.45 (100.00%)
19551.90 (100.00%)
19875.77 (100.00%)
40866.54 (100.00%)
52677.09 (100.00%)
Source: Self Compiled

130 Orissa Journal of Commerce, Volume XXXXI, April- June-2020, Issue No-II
Table 5; Table showing the percentage and value of exports made through Paradeep port from theyear 2013 -14 to 2017- 18. From the value we can analyze that the export of metallurgical products inthe year 2013-14 was Rs. 7682.25 cr has gradually increased in 2015-16 to Rs. 13132.00 cr then in2016-17 it increased to Rs. 25185.93 cr and 2017- 18 it has increased to Rs. 31566.46 cr .The export ofengineering, chemical and allied products in the year 2013-14 was Rs. 3531 cr where has in the year2017-18 the total export was Rs.5892.73 cr is encouraging. But it needs more attention. The export ofmineral products in the year 2013 -14 was Rs. 3546.78 cr it had a remarkable increase in the year 2016-17 , and in the year 2017-18 the value was Rs. 8117.91.The export of agriculture and forest product in2013-14 was 0.02% where as it has increased in 2017-18 to 0.31%. This is an encouraging trend thatexports of agricultural and forest products from the state are increasing. Both the activities providelivelihood to approximately 60% of the total population of the state.
Therefore, it is construed that such increase in exports of such commodities from the state contributesto the economy of the households as well as to the state. The export of marine product in the year 2013-14 was 9.90% it increased in the year 2014-15 to 10.58% then it declined in the year 2017-18 to 5.86%.Again, there is a great potential of marine products trade which could not be achieved. Again the exportof handloom, handicraft in the year 2013 -14 was Rs.0.64 cr while the export of these product was notin a satisfactory position towards the year 2017- 2018 was Rs. 0.53 cr. Thus these products need aspecial attention. The export of textile product in the year 2013-14 was Rs.10 cr. And it increasedrapidly in the year 2014-15 to Rs. 40.29 cr. And gradually decreased in the coming year of 2015-16 toRs.17.23cr and decreased to Rs. 5.44 cr. in the year 2016-17. But again the export of textile productincreased Rs.15.31 cr. in the year 2017-18. The export of pharmaceutical product has given a satisfactorygrowth from the year 2013-14 to 2017-2018. From the table we can see that the export of pharmaceuticalproduct in the year 2013-14 was Rs. 0.93 cr. it gradually increased during the year and in the year2017-18 the value of export increased to Rs.13.67 cr. which is quite satisfactory. The export of otherproducts from paradeep port during the year 2013-14 was 10 cr. and it increased in the year to 2017-18to 40.55 cr. which is satisfactory.
FindingsThe key issues of current times for India are how to create the globally competitive India and to
ably surge ahead leading economy of the world. In order to mature into a developed economy from anemerging economy the country has to reduce its biggest problem, unemployment and poverty. Here inthis paper the infrastructure and services rendered by Paradeep port has been analysed from the year2011 to 2018 for a period of 8 years and found that the external trade between the countries is dependenton maritime transaction costs. The cost and volume of trade by the land locked countries have alwayshigher costs of trade. A study of 97 developing countries by researchers Prof. Radelet & Sachs (1998)found that 17 countries from the group are landlocked and their transport and insurance costs are twicehigh in comparison to the coastal countries.
ConclusionThis study reveals an important positive correlation between port infrastructure expansion and
economic activities being carried out in the state. But, one disheartening fact was marked whileenumerating the composition of commodities exported. That the commodities and activities which aremaximum economic multipliers are not performing up to the mark. The export potentiality of the products

131Orissa Journal of Commerce, Volume XXXXI, April- June-2020, Issue No-II
belonging to agriculture, forest, textile, handloom, handicraft, electronics, pharmaceuticals etc are huge.The Atma Nirvar Bharat, the Start up and Stand up India initiatives can be leveraged by the state toderive the benefits. The ports and the necessary infrastructure will play a catalyst as the economicbooster.
References• Olaf Merk & Ceser Ducruet & Patrick Dubarle & Elvira Haezendock & Michael Dooms,
2011, The competitiveness of global port cities : The case of Senine Axis, OECD publishing,Regional development working papers ISSN 1973-3208.
• Ferrari, Merk, Bottaso (2011) in their research paper “Ports and regional development: AnEuropean perspective” Ports and Regional Development: A European Perspective,” OECDRegional Development Working Papers 2012/7, OECD Publishing.
• Nordas, H. K., E. Pinali and M. Geloso Grosso (2006),”Logistics and Time as a TradeBarrier”, OECD Trade Policy Working Papers, No. 35, OECD Publishing.
• Musso, E., Benacchio, M. & Ferrari, C. Ports and Employment in Port Cities. Marit EconLogist 2, 283–311 (2000).
• Martin, A. (2017). The Local and Regional Economic impacts of the Port of Houston. 2006,Houston. MNPO, Annual reports from 1987 to 2012, Merchant Navy and Port Office, Tunisia.
• Musso, E., Ferrari, C., & Benacchio, M. (2006). Port investment: Profitability, economicimpact and financing. Research in Transportation Economics, 16, 171
• Hyuksoo, C., & Yeongseok, H.A (2009). Determinants of FDI Inflow in Regional Port withResource-Based Developing Country Studies www.iiste.org ISSN 2224-607X

132 Orissa Journal of Commerce, Volume XXXXI, April- June-2020, Issue No-II
A Study of Economic Impact of COVID-19Pandemic on the Tea Growers of Assam
Uddipana Gogoi1 & Prof. Rama Chandra Parida2
ABSTRACTThe tea industry of Assam is 172 years old and it contributes significantly to the economy of Assam
in terms of production, revenue, employment etc. The tea industry in Assam provides average dailyemployment to more than 6.86 lakh persons in the State(Economic Survey of Assam, 2018). Assamalone produces more than half of India’s tea production. Due to outbreak of the pandemic, the teagardens of Assam have been closed down since 24th March 2020. Due to the continuation of lockdownduring the peak season, the stakeholders of the tea industry of Assam will face huge hardships in termsof production, revenue and employment. Even tea garden labour force would face the samemusic. TheNETA figured out that estimated loss of total crop yield will be about 80 million Kg. and estimated totalrevenue loss worth of Rs. 1,218 cores for the state.
In this paper an attempt has been made to study the impact of COVID-19 lockdown on the financialhealth of tea industry of Assam. The research is descriptive in nature. Three variables i.e., production,revenue and employment are considered for the study. Data source is secondary which are collectedfrom Annual Reports of Tea Board, Economic Survey of Assam, reports of NETA, WHO, Tea MarketResearch Report and related research articles, newspaper articles and websites. Data are analysedwith the help of tables, diagrams, correlation and regression analysis. The study highlights abouteconomic loss suffered by the stakeholders due to decline in production, revenue and employment ofthe industry. It also highlights the measures taken by the Tea Board and the Ministry of Industry andCommerce for revival and minimisation of financial impact (Covid impact) among tea growers of state.
Keywords: Tea Industry of Assam, COVID-19, pandemic, economic impact etc.
IntroductionIn India the tea industry was set up by the British Rulers in the nineteenth century which now
occupies a significant position in the economy (Gogoi, U.). Tea is one of the industries which is controlledby Tea Board and the board is created by an act of Parliament. Tea is cultivated in 15 states in India
1. Research Scholar, Department of Commerce, Rajiv Gandhi University, Doimukh,Arunachal Pradesh-791112, India Mob: 8876747827 ; Email id: [email protected]
2. Professor, Department of Commerce, Rajiv Gandhi University, Doimukh, Arunachal Pradesh-791112,India.Mob: 94360 43129 ; Emal id: [email protected]

133Orissa Journal of Commerce, Volume XXXXI, April- June-2020, Issue No-II
comprising Assam, West Bengal, Tamil Nadu, Kerala, Tripura, Himachal Pradesh, Uttarakhand, Bihar,Karnataka, Arunachal Pradesh, Manipur, Meghalaya, Mizoram, Nagaland and Sikkim. Tea produces ofAssam, Darjeeling, Nilgiri and Kangra are world famous for their finest quality, delicate flavour, strengthand brightness (Tea Board). Indian tea is primarily sold through Tea Auction Centres including Darjeelingtea, Assam tea, Nilgiri tea, Kangra tea, Munnar tea, Dooars-Terai tea, Masala tea and Sikkim tea. TheTea Board of India has allowed license to some of the producing states to market and sell their productsunder their own brand like Assam Orthodox, Assam CTC, Nilgiri Orthodox, Sikkim Tea Organic, MunnarGreen Tea, Dooars-Terai Tea, Kangra Tea and Tripura Tea. Moreover, the small tea growers of Assamalso produce and sell small amount of tea varieties like green tea, oolong tea, orthodox black tea,dheki-made tea, white tea, golden tea etc.
Status of Assam in Indian Tea IndustryAssam is one of the major tea producing state of the country. According to the 64th Annual Report
(2017-18) of Tea Board, India ranked second position in the world tea production by producing 1,322million kgs of tea where share of Assam is 676.31 which account for 51.16 per cent of total tea productionof India. During 2018-19, India produced 1350.04 million kgs of tea out of which Assam contributed701.35 million kgs of tea which accounts for 51.95 per cent of total tea production of the country. Herethe contributions of big tea growers of Assam are 389.80 million kgs. which accounts for 55.57 percent and small tea growers of Assam produced 311.55 million kgs. which accounts for 44.42 per centof the total tea production of the state (Tea Board Statistical Report). The Tea Board figured that Assamhas the highest number of tea gardens i.e, 1,01,850 which accounts for 48.08 per cent out of total2,11,794 tea gardens in the country. Here, the number of big tea gardens of the state are 765 which isbeing cultivated in 2,32,399.35 hectors of land and the number of small tea gardens in the state are1,01,085 cultivated in 1,05,291 hectors of land. The tea cultivated land area of the state is also highesti.e. 53.04 per cent of total tea cultivated land area of the country.
The tea industry in Assam provides average daily employment to more than 6.86 lakh persons inthe State, which is more than 50 per cent of the total average daily number of labour employed (on anaverage 11.1 lakh labour employed per day) in the country as a whole under tea industry (EconomicSurvey of Assam, 2018). The tea industry employs 1.2 million permanent workers making the industrylargest employer in formal private sector (Saha, D., Bhue, C. & Singha, R.). It provides livelihood totea estate owners, professionals, tea garden workers, owners of small tea gardens and home based micro-mini factories, tea agents, tea shop owners, sellers of equipment, chemicals, pesticides etc., employeesof research institutions and other related institutions. Tea gardens provide employment both on permanentand temporary basis. Permanent workers are mainly engaged in clerical, factory and garden assistants,supervisory work etc. While temporary workers are engaged in plucking, helper, cleaner etc. Moreover,a good number unemployed youths of the state are engaged in the small scale tea farming for theirlivelihood and gradually it becomes a promising home based industry as well as a source of livelihoodin the rural economy of Assam. The 64th annual report (2017-18) of the Tea Board figured out thatthere are 87, 675 of registered small tea growers in the state which is highest among all tea growingstates of the country and they contributed 44.42 per cent of total tea production of the state.
India ranked fourth position in the world tea export by exporting 256.06 million kgs of tea (TeaBoard statistical report). Although India is the second largest producer of tea in the world it ranked

134 Orissa Journal of Commerce, Volume XXXXI, April- June-2020, Issue No-II
fourth in world tea export because around 80 per cent of such production of the country goes for domesticconsumption (Tea Board). During 2018-19, the figure is 80.74 and in 2017-18 it was 80.63 (compiledfrom Tea Board statistical report). The total export of the country for the year 2018 is 2,56,060 thousandKgs. which valued Rs. 53,3,53,260 (thousand). The exported tea varieties are bulk tea, instant tea,packet tea and tea bags (Tea Board Statistical Report). The exports are generally made to Europeancountries, Middle East countries, USA, UK, Sri Lanka, Pakistan, Bangladesh, Taiwan, Malaysia, China,Japan etc. The average annual world auction price for Indian tea is US$ 2.03/Kg. Assam has sizablecontribution of the total tea export of the country The Auction Data 2018-19 of Tea Board figured thatthe Guwahati Tea Auction Centre sold total 1,53,470 thousand Kg. tea at annual average price ofRs.148.07/kg. The total Assam Tea sold through Tea Auction centres during the year 2018-19 was2,89,311 thousand Kg. at an annual average price of Rs.158.87/Kg. generating revenue of Rs.4,59,62,838.57 thousand for the state.COVID-19 Pandemic and Tea Growers of Assam
The COVID-19 pandemic has spread over 213 countries and globally the number of reportedconfirmed cases is 3,0,90,445 and confirmed deaths are 21,7,769 (as on April 30, 2020, WHO). Due tooutbreak of the pandemic, nationwide lockdown was called by the Government of India from midnightof 24th March, 2020 and since then the operation of tea gardens of Assam have been completelysuspended. Due to the continuation of lockdown during the peak season, the stakeholders of the teaindustry of Assam face huge hardships in terms of production, revenue and employment in days ahead.The Tea Association of India reported that the country will loss estimated 110 million kg. tea due to on-going lockdown. The lockdown will cause an estimated loss around 150 million kg. of tea and revenueloss of 12 per cent for the state of Assam and West Bengal (The Assam Tribune dated 1st April, 2020).The North Eastern Tea Association (NETA) figured out that estimated loss of total crop yield will beabout 80 million Kg. and estimated total revenue loss will be about Rs. 1,218 crores for the state. TheMinistry of Industry and Commerce, Assam reported that the state has incurred a loss nearly Rs.600crore due to decline in production estimated at 32 million kg. during the lockdown. The employment ofworkers and employees also become uncertain due to non-operation of the tea gardens.Objectives of the Study
The study of Covid impact on tea growers of Assam has been made with the following Objectives;1.4.1 To examine of the impact of COVID-19 pandemic on the production, revenue and
employment of tea growers of Assam.1.4.2 To figure out the role of government and Tea Board to minimise the economic loss of
the tea growers of Assam.Research Methodology
The present research study is descriptive in nature. Three variables i.e., production, revenue andemployment are considered for the study. The population of study is tea growers of Assam includingboth big growers and small growers. Data source is secondary which is collected from Annual Reportsof Tea Board, Economic Survey of Assam, reports of NETA, WHO, Tea Market Research Report andrelated research articles, newspaper reports and websites. Data are analysed with the help of tables,diagrams, correlation analysis, ANOVA, regression analysis by using SPSS.

135Orissa Journal of Commerce, Volume XXXXI, April- June-2020, Issue No-II
Results and Discussions of the StudyThe results and discussions of the study are made under the headings like (i) impact of the pandemic
on tea production, (ii) impact of the pandemic on tea revenue, (iii) impact of the pandemic on employmentand, (iv) role of the government and institutions for the tea sector of Assam in view of Covid 19 pandemic.
Impact of the pandemic on tea production of Tea Growers of the study areaDue to break out of the pandemic the nationwide lockdown has been implemented in phases by the
Government of India. The on-going lockdown temporarily suspended all economic activitiesof thecountry except some selected emergency service sectors. The tea industry sector of the country alsocompletely suspended their operations since 24th March, 2020. Although the State Government allowedfor commencement of operations of tea gardens of Assam with only 50 per cent of workforce from 15thApril, 2020, it also led to crop loss due to insufficient workforce. During these lock downs, the teagarden owners faced huge losses of their crop productions because the first flush season begins duringthis period and even such loss will continue till May 2020. Because there is a necessity for skiffing1 ofovergrown tea leaves to maintain proper plucking of tea. It also leads to loss in manufacturing of madetea of the state and the country as a whole.
To figure out the probable loss of green tea leaves production in Assam due to the lockdown, the researchershave estimated productions for the month of March and April for the current year (2020) by considering last tenyear’s productions of respective months with the help of correlation analysis. The table-1, table-2, table-3 andtable-4 are related to the estimated production of Assam for the month of March, 2020.
The table 1 (correlation) shows that value of Person Correlation is .670 which indicates high positivecorrelation between the dependent and independent variables. The P value is .034 which is less than .05implying that correlation is significant at .05 level of significance.
Table 1: Correlations
Year Production of March
Year Pearson Correlation 1 .670* Sig. (2-tailed) .034 N 10 10
ProductionofMarch Pearson Correlation .670* 1 Sig. (2-tailed) .034 N 10 10
Source: SPSS outcome (calculated by using last ten years statistical data of Tea Board)
Table 2: Model Summary
Model R R Square Adjusted R Square
Std. Error of the Estimate
1 .670a .449 .380 7.31851
Source: SPSS outcome (calculated by using last ten years statistical data of Tea Board)

136 Orissa Journal of Commerce, Volume XXXXI, April- June-2020, Issue No-II
The model summary table 2 revealed that the R square value is .449 implying that independentvariable (i.e. year) is 44.9 per cent responsible for variance in dependent variable (i.e. production ofMarch). The ANOVA test (table 3) provides that the regression is significant (i.e. P value of .034).
Table 3: ANOVAa
Model Sum of Squares
df Mean Square
F Sig.
1
Regression 349.603 1 349.603 6.527 .034b
Residual 428.484 8 53.561
Total 778.087 9
Source: SPSS outcome (calculated by using last ten years statistical data of Tea Board)
Table 4: Coefficientsa
Model Unstandardized Coefficients
Standardized Coefficients
t Sig.
B Std. Error Beta
1 (Constant) -4126.378 1623.167 -2.542 .035
year 2.059 .806 .670 2.555 .034
a. Dependent Variable: Production of March 2020Source: SPSS outcome (calculated by usinglast ten years statistical data of Tea Board)
From the values of co-efficient table (table 4), the estimated production for the month of March2020 is calculated by using the appropriate equation-
Here, dependent variable (y) = estimated production of MarchIndependent/predictor variable (x) = year(i.e. 2020)Constant (m)=2.059And, beta value (b)= -4126.378Therefore, the equation is y =mx+bY= 2.059*2020+(-4126.378) = 32.802 (approx)Thus, the estimated production of Assam for March, 2020 in Assam is approximately 32.80 million
kg. which is lost by the tea growers of the state.

137Orissa Journal of Commerce, Volume XXXXI, April- June-2020, Issue No-II
The table-5, table-6, table-7 and table-8 are related to the estimated production of Assam for themonth of April, 2020. The correlation table 5 revealed the value of Pearson correlation is .647, implyingthat the dependent and independent variables are highly correlated with each other. The correlationcoefficient is significant as P value (.043) which is less than .05.
Table 5: Correlations
Year Production of April
Year Pearson Correlation 1 .647*
Sig. (2-tailed) .043 N 10 10
ProductionofApril Pearson Correlation .647* 1
Sig. (2-tailed) .043 N 10 10
*. Correlation is significant at the 0.05 level (2-tailed).
Source: SPSS outcome (calculated by using last ten years statistical data of Tea Board)
The model summary table 6 reveals that the R square value is .419 implying that the independentvariable (i.e. year) is 41.9 per cent and is responsible for any variance in dependent variable (i.e.production of April). The ANOVA test (table 7) highlights that the regression is significant as P value is.043.
Table 6: Model Summary
Model R R Square Adjusted R Square Std. Error of the Estimate
1 .647a .419 .346 5.62062
a. Predictors: (Constant), yearSource: SPSS outcome (calculated by using last ten years statistical data of Tea Board)
Table 8: Coefficientsa
Model Unstandardized Coefficients
Standardized Coefficients
t Sig.
B Std. Error Beta
1 (Constant) -2955.266 1246.595 -2.371 .045
year 1.485 .619 .647 2.400 .043 a. Dependent Variable: Production of April
Source: SPSS outcome (calculated by using last ten years statistical data of Tea Board)
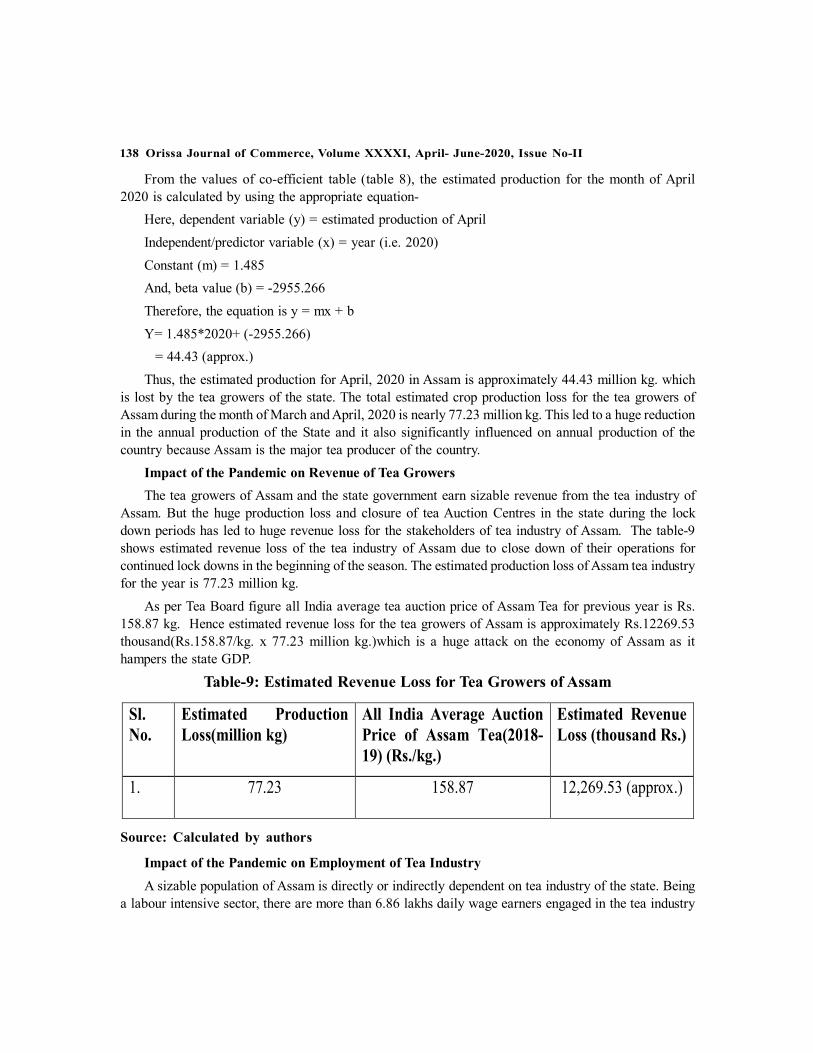
138 Orissa Journal of Commerce, Volume XXXXI, April- June-2020, Issue No-II
From the values of co-efficient table (table 8), the estimated production for the month of April2020 is calculated by using the appropriate equation-
Here, dependent variable (y) = estimated production of AprilIndependent/predictor variable (x) = year (i.e. 2020)Constant (m) = 1.485And, beta value (b) = -2955.266Therefore, the equation is y = mx + bY= 1.485*2020+ (-2955.266) = 44.43 (approx.)Thus, the estimated production for April, 2020 in Assam is approximately 44.43 million kg. which
is lost by the tea growers of the state. The total estimated crop production loss for the tea growers ofAssam during the month of March and April, 2020 is nearly 77.23 million kg. This led to a huge reductionin the annual production of the State and it also significantly influenced on annual production of thecountry because Assam is the major tea producer of the country.
Impact of the Pandemic on Revenue of Tea GrowersThe tea growers of Assam and the state government earn sizable revenue from the tea industry of
Assam. But the huge production loss and closure of tea Auction Centres in the state during the lockdown periods has led to huge revenue loss for the stakeholders of tea industry of Assam. The table-9shows estimated revenue loss of the tea industry of Assam due to close down of their operations forcontinued lock downs in the beginning of the season. The estimated production loss of Assam tea industryfor the year is 77.23 million kg.
As per Tea Board figure all India average tea auction price of Assam Tea for previous year is Rs.158.87 kg. Hence estimated revenue loss for the tea growers of Assam is approximately Rs.12269.53thousand(Rs.158.87/kg. x 77.23 million kg.)which is a huge attack on the economy of Assam as ithampers the state GDP.
Table-9: Estimated Revenue Loss for Tea Growers of Assam
Sl. No.
Estimated Production Loss(million kg)
All India Average Auction Price of Assam Tea(2018-19) (Rs./kg.)
Estimated Revenue Loss (thousand Rs.)
1. 77.23 158.87 12,269.53 (approx.)
Source: Calculated by authors
Impact of the Pandemic on Employment of Tea IndustryA sizable population of Assam is directly or indirectly dependent on tea industry of the state. Being
a labour intensive sector, there are more than 6.86 lakhs daily wage earners engaged in the tea industry

139Orissa Journal of Commerce, Volume XXXXI, April- June-2020, Issue No-II
(Economic Survey of Assam, 2017-18). It provides direct employment approximately to four lakhspeople and indirectly to approximately 20 lakhs people (The Assam Tribune dated May 7, 2020). Theoutbreak of covid-19 pandemic brought economic crisis to all these people as they are unable to generateearnings due to the suspension of activity during the season. With permission of State Government 50per cent of the workforce get back to employment. The State Labour Welfare Minister has ordered allemployers and management to pay wages on due dates and also the rations to labourers without anydeduction. Recently the State Government has ensured the payment of full wages to all workers andemployees of Assam Tea Corporation Limited (ATCL) for the lockdown period. The tea labourers havingPMJDY have been credited in their accounts of Rs.500 and those who do not have ration card or bankaccount have been given Rs.1000 each. Although such financial relief packages are provided by thegovernment, but their employment security is still uncertain. The owners of small tea gardens of Assamhave been already suffering from financial crisis and liasoning with the State Government over theyears for financial packages and other benefits. And now the Covid 19 has further aggravated economiccrisis to them.
Government and Institutional role for the Tea Industry of AssamThe measures and strategies adopted by the Central/State Government and Tea Board to minimise
the economic losses of the tea industry of the study area are;a) The state government allowed tea gardens to resume the operations from 15th April, 2020with
50 per cent workforce with various health safety conditions.b) A Standard Operating Procedure guideline for Tea Sector COVID-19 is issued by the Tea Board
for implementation of various preventive measures by the tea gardens during their work time.Some of them are
All Estates (big and small growers) have to adhere to the guidelines issued from time to timeregardingthe preventive measures for COVID-19 outbreak by the Central/ the State Government.The garden management should ensure the screening of health parameters of their workersandstaff deployed in the field operations, and provide basic protection care such as handgloves,notified face masks, protective uniforms, sanitizers, water facility (in fields, crèches)for handwash with soaps etc.
Only minimum number of workers have to be deployed (as prescribed by the StateGovernment/District administration from time to time) in production activity and due consent from eachworker/staff shall have to be obtained. Details of workers, such as name, age, medical historyof their family members have to be maintained in a separate register. Proper social distancingnorms have to be adopted during the field operations and otherduty hours within the estate andfactory premises as directed by the respective State healthdepartment/ District Administration.
The migrant workers must be properly screened before they are deployed for the field operations.Their details such as travel history, previous nature of work, general health conditions etc.,shall also be recorded, maintained and shared with the respective District administration.
Depending upon the pruning cycle, the un-pruned sections may be skiffed so that the overgrown tea leaves are discarded to get the new shoots.

140 Orissa Journal of Commerce, Volume XXXXI, April- June-2020, Issue No-II
Minimum handling of green leaves and proper hygiene shall be ensured while plucking andhandling of green tea leaves. The agriculture equipment used in the garden operation shallproperly be sanitized before and after use.
The management may organize health awareness camps in the gardens to disseminate variousregulations issued by the State Government/the Central Government regarding prevention ofCOVID-19 out break among the workers.
The management should furnish the list of vehicles and workers with necessary informationsuch as registration number, name and designation of worker, etc., to obtain vehicle pass andexemption permits from the respective District Administration.
c) The Tea Board conducts random checking of auction teas to check the compliance of FoodSafety and Standards of India (FSSAI) so that sellers able to realise better remunerative priceto minimise their loss occurred during lockdowns.
d) The Consultative Committee of Plantation Associations (CCPA), the largest apex body of TeaAssociation of India (TAI) has cited to the Government of India about the crisis situation of teaindustry due to the lockdowns and asked liberal financial support from Central Governmentduring this situation.
e) The Kamrup (metro) District Authorities permitted the Guwahati Tea Auction Centre (GTAC)to restart and conduct e-auctions in a limited manner from 20th April, 2020.
f) In order to help sellers during the lockdown GTAC has decided to reduce “waiting time forsellers” to 17 days instead of 19-21 days. Now, the producers need not to wait for usual 19-21days to sell their crops and it will reduce their cost of warehousing.
ConclusionTea industry of Assam has a great influence in the economy of our country as it occupies highest
position in terms of production, quality, demand, area of cultivation, export and employment among alltea producing states of the country. Assam tea has a good demand in international market for its quality,liker and good aroma. A sizable amount of local population and also from outside the state people aredirectly or indirectly earning livelihood from the tea industry of Assam. But due to outbreak of the pandemicthe economy of the tea industry like all others is badly affected. The covid-19 pandemic is considered asthreat for the whole tea industry since nationwide lockdowns, during beginning of peak season of teaindustry, cause decline in production, consumption, export, revenue and employment rate. As it is a primarysource of livelihood of many rural people, it also declined per capita income and finally GDP of the state.The state Government, Central Government, Tea Board, GTAC etc. have adopted some measures minimisethe negative impact of the pandemic by issuing health safety norms, societal norms, financial relief packages,tea garden operation procedures etc. The collective effort of government and the society as a whole willcertainly help to overcome the economic losses in the days ahead.References• Dwaipayan. (2020, May1). Tea Industry and COVID-19 threat. The Assam Tribune, p. 6.• Borthakur, R. (2020, April 25). Good demand for Assam Tea aimed Challenges. The Assam
Tribune, 4.
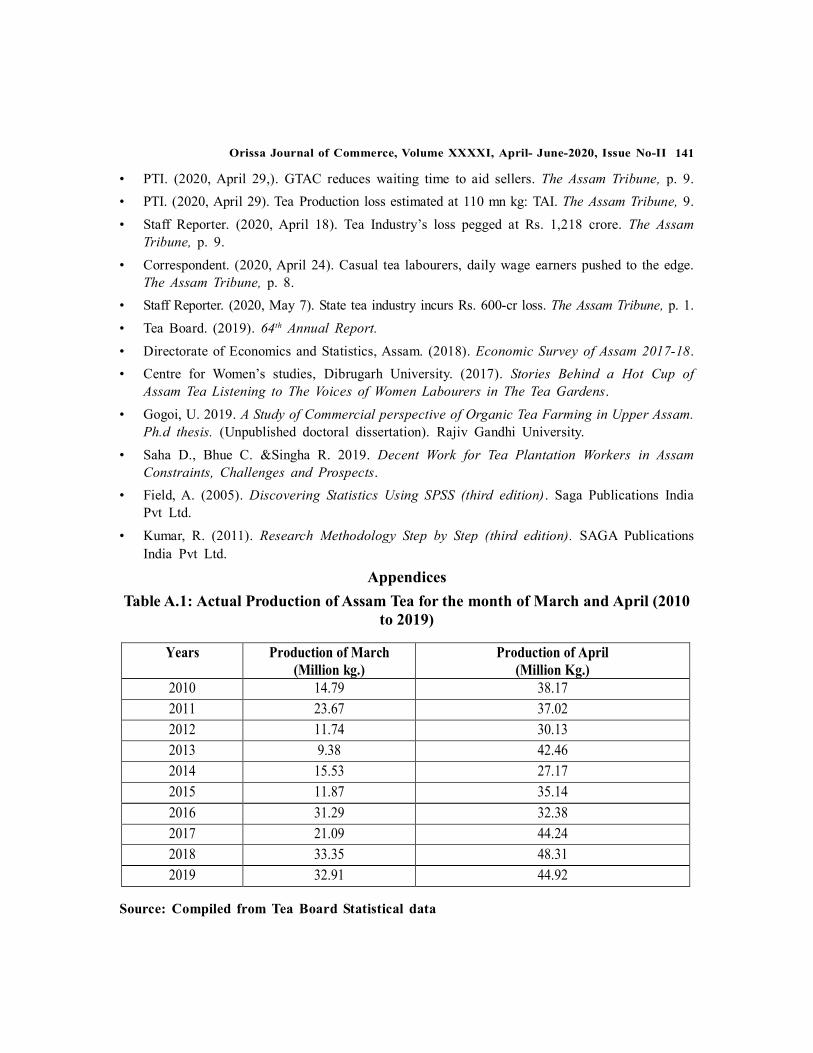
141Orissa Journal of Commerce, Volume XXXXI, April- June-2020, Issue No-II
• PTI. (2020, April 29,). GTAC reduces waiting time to aid sellers. The Assam Tribune, p. 9.• PTI. (2020, April 29). Tea Production loss estimated at 110 mn kg: TAI. The Assam Tribune, 9.• Staff Reporter. (2020, April 18). Tea Industry’s loss pegged at Rs. 1,218 crore. The Assam
Tribune, p. 9.• Correspondent. (2020, April 24). Casual tea labourers, daily wage earners pushed to the edge.
The Assam Tribune, p. 8.• Staff Reporter. (2020, May 7). State tea industry incurs Rs. 600-cr loss. The Assam Tribune, p. 1.• Tea Board. (2019). 64th Annual Report.• Directorate of Economics and Statistics, Assam. (2018). Economic Survey of Assam 2017-18.• Centre for Women’s studies, Dibrugarh University. (2017). Stories Behind a Hot Cup of
Assam Tea Listening to The Voices of Women Labourers in The Tea Gardens.• Gogoi, U. 2019. A Study of Commercial perspective of Organic Tea Farming in Upper Assam.
Ph.d thesis. (Unpublished doctoral dissertation). Rajiv Gandhi University.• Saha D., Bhue C. &Singha R. 2019. Decent Work for Tea Plantation Workers in Assam
Constraints, Challenges and Prospects.• Field, A. (2005). Discovering Statistics Using SPSS (third edition). Saga Publications India
Pvt Ltd.• Kumar, R. (2011). Research Methodology Step by Step (third edition). SAGA Publications
India Pvt Ltd.
AppendicesTable A.1: Actual Production of Assam Tea for the month of March and April (2010
to 2019)
Years Production of March (Million kg.)
Production of April (Million Kg.)
2010 14.79 38.17 2011 23.67 37.02 2012 11.74 30.13 2013 9.38 42.46 2014 15.53 27.17 2015 11.87 35.14 2016 31.29 32.38 2017 21.09 44.24 2018 33.35 48.31 2019 32.91 44.92
Source: Compiled from Tea Board Statistical data
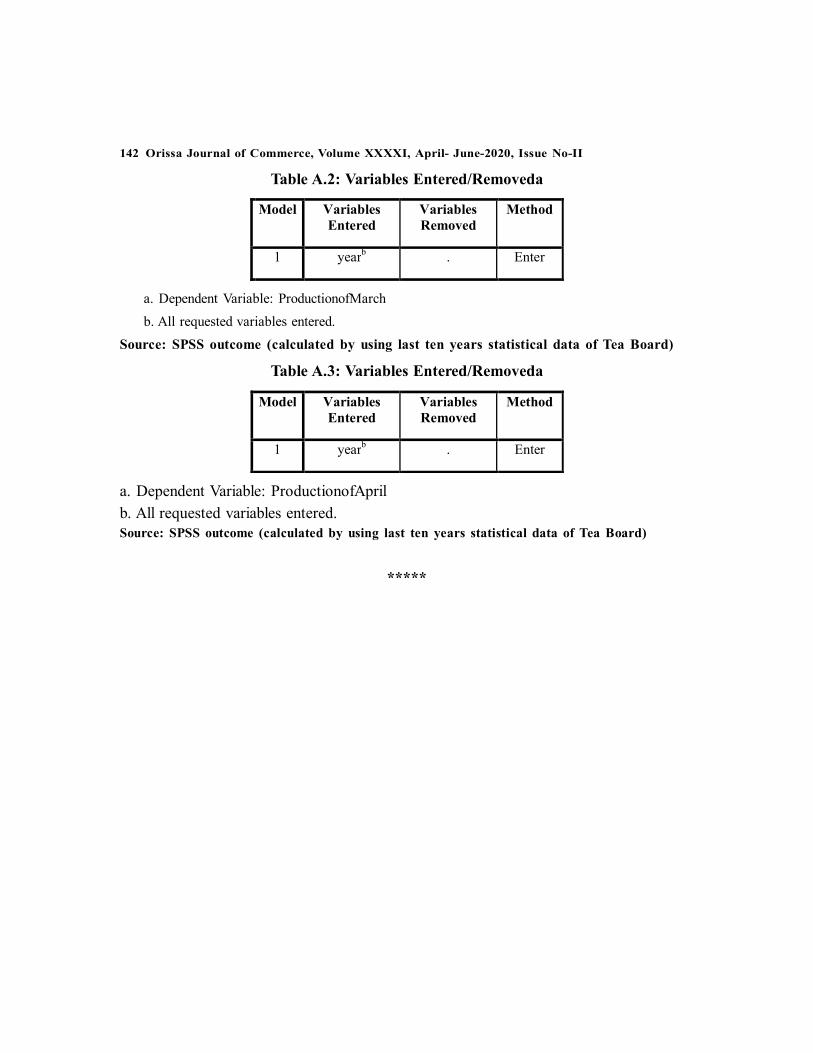
142 Orissa Journal of Commerce, Volume XXXXI, April- June-2020, Issue No-II
Table A.2: Variables Entered/Removeda
Model Variables Entered
Variables Removed
Method
1 yearb . Enter
a. Dependent Variable: ProductionofMarch a. Dependent Variable: ProductionofMarchb. All requested variables entered.
Source: SPSS outcome (calculated by using last ten years statistical data of Tea Board)
Table A.3: Variables Entered/Removeda
Model Variables Entered
Variables Removed
Method
1 yearb . Enter
a. Dependent Variable: ProductionofAprilb. All requested variables entered.Source: SPSS outcome (calculated by using last ten years statistical data of Tea Board)
*****

143Orissa Journal of Commerce, Volume XXXXI, April- June-2020, Issue No-II
Qualitative Study of Employee Perception onRetention Strategies:
A Case of Bule Hora University, EthiopiaDawit Udessa1 & Prof. Kishor Chandra Meher2
ABSTRACTThe purpose of the study is toassessperception of employee on organizational work force retention
strategies at Bule Hora University, Ethiopia. The study adopts qualitative research with interpretativephenomenology approach. From those population of study of staff, purposive sampling techniques hasbeen adopted for data collection throughsemi-structured questions for the interview of the respondentsand focus group discussions.The data has been collected, grouped, coded, analyzed and interpretedthrough narrative study. Findings of the study reveal that mutual expectation of employer and employeeis binding contract between employees and organization. Further, understanding employee expectationbefore developing retention strategy is helpful to develop acceptable strategies. Although Bule HoraUniversity has good employee retention strategies, there is still employee dissatisfaction because ofinclusiveness problem of major strategies and unfairness in employee handling system.The studycontributes to the management of the University in redefining the staff retention strategy in the light ofthe findings.
Keywords: Employee Retention, Employee Perception, Retention Strategies, EmployeeSatisfaction.
IntroductionEmployees are the most important, valuable and productive asset of an organization and needed to
be retained for the betterment of the organization (Singh, 2019). The best organizational retentionstrategies begin from hiring the right categories of people who consider themselves as valuable asset oforganization and deserve their commitment for organizational goal achievement (Lincoln (1996). Boxalland Purcell (2003) suggestthat organization need to attract and retain high quality people in order togain a competitive advantage.
1. PhD. Scholar, Dept. of Management, Bule Hora University, Ethiopia2. Professor, Dept. of Management, Bule Hora University, Ethiopia Corresponding Author Email::

144 Orissa Journal of Commerce, Volume XXXXI, April- June-2020, Issue No-II
Effective employee retention is the systematic effort by the employers to generate and promote anenvironment that encourages existing employees to stay behind employed by having policies and practicesin place that address their varied needs (Mitala, 2003&Gary, 2008). Best way to enhance employeeretention is to understand what the employees require from organization and providing them. Pitiris(2009) suggests that if the strategies developed is aligned with the expectation of the employees andcommunicated well to them; they are most likely remaining to be employee of the organization. Hismain idea here is that organization need to understand employees’ expectation to succeed with employeeretention. The means through which understanding employees’ expectation is assessment of employeeperception about organizational employee handling practices. Therefore, this study isconducted to assessemployee perception on Bule Hora University work force retention strategies.
Literature ReviewPerception is a personal manifestation of how one view the world which is colored by many socio
cultural elements (Mc Donald, 2011). Dictionary meaning of perception is the ability to see, hears, orbecome aware of something through the senses. Psychological definition of perception is theneurophysiologic processes, including memory, by which an organism becomes aware of and interpretsexternal stimuli.It is also defined as a process of take in sensory information from our environment anduses that information in order to interact with our environment. Perception is personal interpretation ofobserved phenomena in the environment after experiencing situation. People can give their perceptionabout what they saw or heard by selecting, organizing and interpreting their sensory stimuli intomeaningful information.
Importance of Knowing Employee PerceptionAssessing and knowing employees feeling about the retention strategies; support organization not
to invest in ineffective strategies that cannot yield comparative advantage, because most of the retentionstrategies practiced by organization required an additional investment either in the form of cash or inthe form of time and commitment. James and Mathew (2012) stated that having better understandingabout why the employees are leaving or want to leave organization is bases to develop effective retentionstrategies. Leign (2002) forwarded that companies have to understand employees’ expectations in thework place before implementing retention strategies in order to achieve desired objectives of employeeretention.
Employee Retention StrategiesEmployees are the most important, valuable and productive asset of an organization and needed to
be retained for the betterment of the organization (Singh, 2012). The long term health and success ofany organization is the result of competent employees in the organization. The best organizationalretention strategies begin from hiring the right categories of people who consider themselves as valuableasset of organization and deserve their commitment for organizational goal achievement Lincoln (1996).Boxall and Purcell (2003) suggested that organization need to attract and retain high quality people inorder to gain a competitive advantage. According to this view the investments on recruitment, trainingand salary costs expected to be returned in the form of organizational performance improvement(Hammersak, 2002). If the right person is appointed, costs relating to training will be minimized, deliverybreaks decreased, production or services increased and putting organization in the position of achieving

145Orissa Journal of Commerce, Volume XXXXI, April- June-2020, Issue No-II
its key performance objectives (Slack, Chamber and Johnson, 2007). According to these scholars iforganization did not hire right person for the job, retention is not good as it may affect organizationnegatively by having inefficient employees for long period of time.
Types of Employee Retention StrategiesMany researchers studied about employee retention strategies and identified different types of
strategies. Walker (2001) identified seven factors that encourage employees to stay with organization:compensation and appreciation of the work performed, the provision of challenging work, opportunitiesto learn, positive relationships with colleagues, recognition of capabilities and performance contributions,good work-life balance, and good communication within the organization. Echols (2007) argued thatnot only strategies identified by Walker (2001) is sufficient to retain employees but he suggested thatwhen it combined with selective promotion and salary action, the learning and development processthen itis strong retention activity. Hytter (2007) concluded that employee retention strategies areworkplace factors such as rewards, leadership style, career opportunities, training and development ofskills, physical working conditions, and work-life balance. An others researchers such as Arnold (2005),Herman (2005)and Hiltrop (1999) stated that effective training, and opportunities to learn anddevelopment is key strategies to retain talented employees. Some authors argued that providingpromotion and career development opportunities to individuals make employees stick to organization(Kellough and Osuna, 1995). Mitala (2003) identified primary retention strategies into five majorelements namely employee compensation strategies, working environment strategies, employee growthstrategies, employee relationship strategies and employee support strategies. According to the findingsof this scholar, under each category of strategies there are sub elements that need to be addressed toretain employees.
Employee Compensation StrategiesAccording to Mitala (2003) competitive compensation benefit packages include financial and non-
financial incentives. Financial rewards are the rewards given for employees in the forms ofcash andexpected to assists the employees to boost their financial and social status. It includes bonuses given toemployee who have achieved given assignment and increased profitability or customers satisfactionbeyond expectation (Khan, W. & O. Mufti,2012). Non-financial rewards arethe rewards thatgrantedto employees to increase their morale like recognition through an appreciation letter. This appreciationis in any form from the supervisor, customer or colleagues will foster employees’ loyalty with theirorganization (Walker, 2001). Gomez-Mejia, Luis and Balkin (1992), Scott, Morajda and Bishop (2002)identified reward as one of the motivating factors to retain workforce. Heneman and Judge (2003)argued that reward is retention strategy if and only if it is large and unique that its difference is noticeablefor it to be meaningful, create confidences between employees and organization and fair and justifiable.
Working Environment StrategiesWorking environment strategies include physical structure, surrounding and atmosphere of the
workplace (Mitala, 2003). Working environment is considerable important to retain employees forlong periods of time. Hytter (2008) discussed in his study about working environment as industrialperspective, focus on aspect that is noise, toxic substances exposure and heavy lifts. An environmentalissue of the organization is dependent on nature of the job. Ramalall (2003) indicated that people

146 Orissa Journal of Commerce, Volume XXXXI, April- June-2020, Issue No-II
prefer to work in and stay with the organization that provide positive work environment, where employeesperceived work environment is good and different from others.
Work life balance is one of the working environment strategies, which includes flexible hours,telecommuting, dependent care, alternate work schedules, vacation and wellness (Freyermuth, 2007).Robert (2005) suggested that it is comparatively a recent trend that being used by various organizationto promote healthy balance between individual personal and professional life to retain talented workforces. In the current increased work demand and complex work environment balancing employeeswork environment with personal life is help employees to cop up with their issues of elder and childcare, and many other issues of life (Spinks,2004). The stress due to load of work or imbalance betweenpersonal and professional life is resulted in frustration of employees and lead to decline in employeeperformance that overall affect organizational effectiveness and competencies (Devies, 2001).
Employee Growth StrategiesEmployee growth strategies include advancement prospect and development on the job and
organization (Mitala, 2003).Training and development is one of the employee growth strategies that teach existing employees
new knowledge, skills and abilities to ensure their continued usefulness to the organization and meetingtheir personal desires for advancement. When employees are provided training, they feel that organizationis interested in them and want to develop their career(Villegas, 2006).He suggested that they feelorganization consider them so important and capable that is why the employer is investing on them.This leads to employee retention. Most of the organization offer training considering it as advantagefor organization to retain and to use improved skills and advanced knowledge for organizational goalachievement, but few authors argued that training and development can have negative impact onemployee retention if it is not managed properly as it may open opportunities to join other organizationby the skills gained from training or learning (Sommer, R.D, 2000).
Some authors argued that promotion and career development opportunities make employees stickto the organization (Kellough and Osuma, 1995 and Rawat, 2013). According to them, having promotionstrategy is essential in retaining organizational workforces as they are looking for advancing their careergoals. Moncarz et al, (2009) stated that Organizations that focus on employees’ career developmentand give promotion on regular bases are more effective in retaining their employees. Authors such asRawat, (2013), Pargamit and Veum (1989), Meyer et al, (2003), prince (2005) and Eyster, et al (2008)forwarded that career development important strategy to retain employee.Employee Relationship Strategies
Employee relationship strategies include mode of interactions existing between employer andemployees, superior and subordinates, subordinates and subordinates, organization and outside world(Mitala, 2003). Greenhaus (2004) suggested that the relationship between supervisor and worker playimportant role in employee retention as employees views regarding organization are strongly concernedto their relationship with supervisor. According to him, if supervisor support, open communication andhave good relationship with employees, the intentions of employees to leave organization are likelyless and more engaged with organization. Bratton and Gold (2003) argued that supervisor feedbackhelps employees to feel more confident and empowered to deal with organizational matters and beingorganizational staff.
147Orissa Journal of Commerce, Volume XXXXI, April- June-2020, Issue No-II
Employee Support StrategiesEmployee support strategy is about giving assistance to the needy of the employee in order to
develop trustworthy in the employees as they feel organization is their home (Mitala, 2003). Thisstrategy involves giving people the tools and equipment to get the job done. Employees felt acceptedand recognized if they receive a range of support for their work aid from top level management of theorganization. People feel happy when they have what they need to perform and when they give supportivematerials for their job accomplishment. This will increase employee job satisfaction make them stick toorganization. According to Greenhaus, (1994) Expected employee supports are learning support,providing written documentation, employee handbook and operating manuals to assist them how toknow more about the job they assigned to. He further suggests that employees become more engagedand involved in their tasks if they have an open and transparent communication with their bosses.Statement of Problem
Employee retention requires different measures to be take in order to encourage employees letthem to stick to organization for the long period of time. It is not ease task for organization to apply andsucceed in retention strategies because of individual differences and preferences among the employees.Mello (2011) stated that the significant challenges to retain employees is the fact that the differentemployees motivated by different factors in relation to their desire to stay with organization.
Different scholars have studied aboutemployees’ retention strategies at different organization andtime.All of the studies conducted on the matter of employee retention are reflecting importance ofstrategies to retain talented workforce regardless of the differences in strategies.Boxall and Purcell,(2003), prince (2005), Hytter (2008), Greenhaus, (2004), and chapman (2009)conformed importanceof strategies to retain talented work force and its implication on organizational growth anddevelopment.All of the scholars stated above whom conduct research on retention strategies are givefocusonly to show importance of retention strategies by overlooking employee feelings on strategiesand strategy implementation.
James and Mathew (2012) stated that having better understanding about why the employees areleaving or want to leave organization is bases to develop effective retention strategies. Leign (2002)forwarded that companies have to understand employees’ expectations in the work place beforeimplementing retention strategies in order to achieve desired objectives of employee retention. Despiteof stating importance of understanding employee expectation before strategy development andimplementation; two scholarshave not included employee feeling or perception in their study.
Most of the researches have studied about employee retention strategies are out of Ethiopia butvery few research has been done in Ethiopian context. Thus the study takes cognizance of setting gapbecause the results of these studies may not be applicable in the context of Bule Hora University. Thereis also evidence of methodological gap, because methodology used for that study is not applied for thisstudy.Therefore, this motivates the researcher to conduct study at Bule Hora University to fill theidentified gaps.Research Questions
The purpose of the study is to explore employee perception on organizational work force retentionstrategies and the following questions are framed for the study.
148 Orissa Journal of Commerce, Volume XXXXI, April- June-2020, Issue No-II
1. How do the employees perceive work force retention strategies of the organization?2. How do the employees think of post implementations of retention strategies?3. How do the employees feel about the challenges of strategiesimplementation?
Specific Objectives1. To assess how employees perceive organizational work force retention strategies2. To explore how employees think of post implementations of retention strategies by the
management3. To examine employees feelings about the challenges of implementation of retention strategies.
Research MethodologyThe Study approach employed in this study is qualitative phenomenological research designto
investigate employees’ perception and attitudes about University retention strategies and practicalapplication. Qualitative phenomenological approach help the researcher to describe human behavior atwork place through observation and it also assist research to understand attitude, feeling and perceptionof the people about Bule HoraUniversityretention strategies.
The totalPopulation of the study is 2910 staff of Bule HoraUniversityboth academic and administrative.The sample size of the study was 22 from which 14 are for interview including two middle level managers’and8participants for focus group selected by purposive sampling technique.Source of data was primarysources and data collected through semi-structured question with probing. All information has been collectedthrough note taking during interview and focus group discussions. The data collected are organized, groupedand coded according to its similarities and analyzedby explanation and narration.
Results and DiscussionTo maintain confidentiality and for the sake of simplicity of data analysis and presentation, the
information gathered from respondents are grouped into themes and coded. The information collectedfor this study is grouped into three themes: General retention strategies and employee perception, postimplementationof the retention strategies and employee perception, and Challenges on implementationof retention strategies. Each and every question asked for data collection are grouped under its themeand coded into two broad categories: Codes according to the categories of respondents and accordingto responses from them. The codes as per respondents are used to analyze data from different categoriesof respondents to triangulate results for the credibility assurance, and codes according to the responsesareclubbed in one place where different responses are given for single question. Accordingly codes aregiven as follows. Individual respondents have been given the code of (IR), Focus Group Discussiongiven the code of (FGD)and leaders’ respondents are coded as(LR). Individual respondents have beengiven further codes because of multiple responses obtained for single question. Individual responsecategory one (IRC1), individual response category two(IRC2) and so on are coded for all questions ifrespondents answer are different for single question.
Employee Expectation and Organizational PracticesEmployees have certain expectations regarding their employers, such as the provision of satisfactory
working conditions, adequate remuneration for the work done, open communication channels.

149Orissa Journal of Commerce, Volume XXXXI, April- June-2020, Issue No-II
Respondents were asked about their expectation of Bule HoraUniversity while they join it. IR repliedthat they havehigh expectation about employees handling system of Universityas it is a federalgovernment institution that accommodatesall nations and nationality of the country and the place whereemployees are treated well.Responses of FGDshow that, employees expecting Bule HoraUniversity asthe place where (institution in which) Ethiopian federal Civil Servant proclamation are really practicedand employees are treated fairly. As the view of Leadersemployees prefer Bule HoraUniversitybecauseofeducational opportunity.
Expectation gaps consequently may affect the employee’s motivation and the decision to accepttheoffered job and to meet employer’s expectation (Presti&Pluviano, 2015). Lotko, Razgale and Vilka(2015)have stated that the expectations gap is the phenomenon which can be a factor of an employee’s negativeexperience or the employer’s inadequate offering. According to the IRC1Actual practices in the BuleHora University are more than their expectation, because University providing themfree educationalScholarship and 80% discounted rate of payment in continuous education program, as well as, discountedrate of payment for their children in community school. In opposite viewIRC2replied that actual practicesof the Universityare not asmuchthey expected. They said “University is federal institution that actsinternationally, but there is high sense of localization during assignment of positions and placement inhigher job post. According to the FGD responses, there is the gap between expectation and whatexperienced, because in our Universitythey said “disciplinary procedure is not as per the proclamation,but higher officials take the measure they like without consent of immediate supervisor”. As the viewof leaders, Bule HoraUniversityemployee handling system is better than employees’expectation.
Employee Experiences of Retention StrategiesEmployee Retention Strategies refer to policies and practices that an organization uses to satisfy
the diverse needs of employees and create an environment that encourages them to stay with theorganization.
Respondents were asked about employee retention strategies of the University and replied as follows.IR said, Bule HoraUniversityhas good employee retention strategies, especially educational andpromotion strategies are the most important strategies that employees are happy with. Most of therespondents expressed as they are happy with University retention strategies, but very few said, Currentlydesigned and implemented strategies are not sufficient, but it need additional strategies to retain highlyskilled and competent employees, especially academic staff.
FGD expressed that Bule HoraUniversity retention strategies are good, but there are some actionsthat make employees dissatisfied. They said further as they are happy with Bule HoraUniversity employeeretention strategies, but they commented on employees placement issues as it is not good because, theysaid,employees placement during JEG (Job Evaluation and Grading) redeployment are not based onthe employees profession, rather it were based on higher officials interest to assign someone at theposition where they want to place him/her. LR replied as management of theUniversity designed andimplemented different types of strategies in both wings according to the nature of the jobs they assignedto. What they consider as retention strategies are Housing services for academic staff, community schoolfor children of all staff with discounted payment, free scholarship and 80% discounted payment incontinuous educational program for admin staff and transportation and staff cafeteria services as corestrategies, employees’ supportive services and beautification of the working environment.

150 Orissa Journal of Commerce, Volume XXXXI, April- June-2020, Issue No-II
Employee Feeling About Retention StrategiesDenton (2000) argued that employees who are satisfied with their current jobs are more committed
towards their work and always put their best efforts to improve their organizational effectiveness aswell as focus on better customer’s satisfaction. While formulating retention strategies the employersshould keep into consideration some of the basic expectations that almost all the employees have fromtheir employer. IR replied that the feeling of all employees of the University is somewhat good, butthere is mixed feeling, because those employees who are placed out of their professions during JEGredeployment are not happy with retention as they are not satisfied with the position they assigned on.The members of the focus group agreed upon the feelings of the most employees are good, but lowerlevel employees who have no access to educational opportunity because of their current educationallevel are not happy with the retention strategies, because even though they have been learning in privatecollege or Bule Hora TVAT College University didn’t support them. Regardless of their low salarypayment, they pay full amount of educational fee for their respective colleges. Hence they arenot happywith employee handling system of the University.Leaders have opined thatemployees feeling are goodwith employee retention strategies of the University.
Strategy Implementation and Employee PerceptionRespondents were asked about implementation of specific employee retention strategies of Bule
HoraUniversity to assess deep feeling about employees handling practices of the University and repliedas follows.
Working Environment and Employee PerceptionTajammal and Sana (2013) conformed that providing an attractive and healthy physical environment
at the workplace helps in creating a positive energy in the organization which ultimately enhancesoverall productivity and satisfaction of employees. Accordingly respondents were asked about physicalworking environment ofBule HoraUniversityand replied; IR said thatphysical working environment ofthe Bule HoraUniversityis dramatically improved and becoming attractive now, but before one or twoyears it was bad because of dust at winter and mud in the rainy season. The conjunction at one smallroom for expertise and teachers are disgusting before two or three years, but it has been improved nowespecially for administrative expertise. Even though there is a shortage of offices and office facilitiesfor teachers till now, things are hopefully improving and employees feel good. FGD members are agreedthat physical working environment is improved and safe for health of employees. LR also confirmedthat physical working environment has been improved than before and it is progressively improving.
Work Life Balance and Employee PerceptionVimala (2012) forwarded that the role of work life balance is important in everybody’s work life.If
the organization cares about it, employee will be more satisfied, committed and engaged with theorganization and there is no point in leaving the organization.Answer from respondents about BuleHoraUniversity work life balances strategy implementation are as follows.IRC1said work life balancesare good, becauseBule HoraUniversity facilitates work shift schedule for employees who work in stressedenvironment like employee cafeteria services, Library, Dormitory and security services. IRC2arguedthat work life balanceis not good because of levelof salary paid for employees comparing to high livingstandard of the area.FGD argue that, work life balance is good in relation to the Universitystrategies;

151Orissa Journal of Commerce, Volume XXXXI, April- June-2020, Issue No-II
because University gives relief for employees to readjust their workload life by resting time providedthem with work shift schedule. LR believes that work life balance is good with respect to Universitystrategies rather thanhigh living cost of Bule Hora town.
Growth Strategies and Employee PerceptionEmployees work in an organization to achieve their personal as well as organizational goal.
Employees’ priority is to work for themselves and later on for the organization and if they are notsatisfiedwith their growth, they will not be able to contribute in the organization’s growth (Lewis and Sequeira,2012).
Employees have replied about Bule HoraUniversity employee growth strategies as follows Accordingto the responses of IR, career development opportunities is good before two or three years, but now nocareer development for administration staff. FGDhas raised issues about free scholarship and discountedrate of payment as the best retention strategy, but they have agreed that learning strategy is not inclusivebecause lower educational level employees who are following their education out of Bule HoraUniversityare not considered and supported. LR says, growth strategy is good regarding education opportunity,but there is inclusiveness problem training and development program is there, LR argues as BuleHoraUniversity annually invests huge financial resources on training and development program to buildcapacity of employees with necessary skills. They said about employee career development as it isstoppedbecause of Job Evaluation Grading (JEG) redeployment.
Employee Relation Strategies and Employee PerceptionPatricia (2015) suggested that having good relationships with superiors as well as colleagues tends
to create a positive work environment and a special bond amongst the employees where they trust andsupport each other to deliver the best of their performance. All respondentsreplied as Bule HoraUniversityemployee relation is good.
Supportive Strategies and Employee PerceptionEmployee support strategy is about giving assistance to the need of the employee in order to develop
trustworthinesswithin the employees as they feel organization is their home (Mitala, 2003). It involvesgiving people the tools and equipment to get the job done. Samuel (2008) suggested thatemployeesfeel accepted and recognized if they receive a range of support for learning and working including jobaids, written documentation, employee handbooks, operating manuals, or even software tools forindependent learning.
Respondents were asked about Bule HoraUniversity employee supportive strategy and replied.According to IR Bule HoraUniversity employee support services are good, but most of the administrativestaffs have reservation as there is no balancing between administration and academic staff and academicstaffs are privileged than admin staff. As evidence they raised issues of housing services and housingallowance for all academic staff and none of admin staff are paid even directors and office holders.They said also administrative directors and team leaders are not paid even position allowance that paidfor academic director at similar positions leading to disparity. The members of focus group are agreedas employee supportive services are good. Even if the ideas about differences in supportive servicesbetween admin and academic staff are raised during discussion, members of group are agreed as strategies

152 Orissa Journal of Commerce, Volume XXXXI, April- June-2020, Issue No-II
derived at University level are not different. So they conclude that strategies of the University regardingemployee support services are good. For their evidence they raised about transportation services to andout of the University to their home, community school for children of the staff with discounted rate ofpayment, all working materials supply in office like computer, cleaning materials such as soap and softand like. LR replied, University has good employee supportive system.
Compensation Strategies and Employee PerceptionThe employees always have high expectations regarding their compensation packages. So an
attractive compensation package plays a critical role in retaining the employees.Mitala (2003) identifiedcompetitive compensation benefit packages include financial and non-financial incentives. IR repliedthat in Bule HoraUniversity there is no compensation system. They further argued that salary level ofthe university is not even attractive than local institutions’ salary. FGD also agreed with the ideas of IR,as Bule HoraUniversity has no good strategies regarding employee compensation. Leaders also confirmedthat as University currently has not compensation packages such as bonus and rewarding system.
Challenges of Strategy ImplementationRespondents are asked about their attitude, opinion, perception and believe on Bule HoraUniversity
employees’ retention strategyimplementation challenges and replied as follows. IRC1 said, currentlyeverything is good, but for the future there will be challenges because of the saturation of Universityjob structure. Today most of the employees are learning in continuous education program to upgradetheir educational status and they need better job position after their graduation. According to theirargument currently providing educational access for employees is good retention strategy, but for thefuture it may be challenging if compensating strategy haven’t developed side by side. IRC2said,Employees retention strategies implemented by University is good, but there are challenges of assigningright person at the right positions during redeployment, as the result, the employees placed withouttheir professions are not happy with the positions they are assigned to.
As per the view of FGD, employee retention strategies of the Universityaregood;but there arepractices that make employees dissatisfied and challenging implementation of the strategies. Theydiscussed about and agreed upon the disciplinary measure which is not good, because higher officialstake disciplinary measure immediately as they are informed by someone without clarifying issues byasking about offence from immediate supervisor or from employee suspected to be penalized. Theyimmediately suspend employees from job and salary without further inquiry. According to their argumentmost of the employees are dissatisfied with such cases and fear that they may also suffer from similaraction.
Leaders replied that the challenges of the implementation of the retention strategies are behaviorsof the employees at workplace. As per their argument, employees expecting and requesting thatUniversitycurrently can’t afford them. When they are not provided with what they were asked, they may nothappy. Theyreplied about employee complaint on redeployment issues and said, the problem of JEGredeployment is because of the mistakes of redeployment committee. During the redeployment,committee needs to refer personal documents of each and every employee, but at a time they didn’trefer it. As the result, employees were misplaced out of their professions.

153Orissa Journal of Commerce, Volume XXXXI, April- June-2020, Issue No-II
Summary of FindingsThe result of the first research question, which is about opinion and expectation of employees on
retention strategies of the University reveal that employees have very high expectation fromUniversityduring the application and joining theUniversity for Employment. As their argument,University is federal government institution in which all employees over all the country are taking partin and treated fairly and equally, but the results from respondents reveals that there is a tendency ofinclination to localization, especially during job position assignment.
Regarding the employee retention strategies the study reveals that Bule HoraUniversity has goodemployee retention strategies such as employee education policy for staff and children of the staff,housing provision policy for academic staff, facilitation of working environment both physical andpsychological. As the findings of the study, working environment is bad before two years, but now ithas dramatically changed and in fast phases it is improving. Employees are provided with shiftingschedule to balance their life with burden of the job because of nature of the job they assigned to. Thestudy also reveals that Bule HoraUniversity employee relation and support services are good.
The results of assessment about implementations of employees’ retention strategies reveals thatemployees feel happy with implementations of strategies like working environment both physical andpsychological, employee relation and employee supportive services. Employees are not happy withcompensation strategies at all. Regarding growth strategies there are mixed reaction amongst theemployees of the University, because there are some groups of the employees that not taking advantagefrom University educational policy. Those employees who get access to educational policy are happyand consider implementation of growth strategy is good, but others not. As per the finding, there is agap in inclusiveness of the policy. Employees who have not graduated with diploma or not havingLevel 4 COC (Centre of competency) certificate are not included in the policy, but more than half ofthe University administrative staff are within this category of employees.
Findings of the study also reveals that the strategies designed and implemented are good, but practicalactivities and action taken at the level of University management create challenges of implementation,because most of the employees are dissatisfied by disciplinary action taken by University managementby breaking discipline procedure. Another challenge is employee placements out of their professions.
ConclusionOrganizational success highly depends onhiring and retaining competent and talented
workforces.Successful employee retention is required having viable strategy that attract and retaincompetent employee to an organization. The study concludes that understanding employee expectationand perception can help organization to develop viable strategies that hold employees for long timewith the organization. Not only having good strategies retain employees, rather employees are moresatisfied when they are treated fairly and equitably. Researcher also conclude that employees are eagerand happy more for their handling (treatment) than tangible and affordable strategies given tothem.Employees of Bule HoraUniversityareprovided with number of retention strategies from University,but most of themstill unhappy with slight deviationof activities or action from its normal procedure.

154 Orissa Journal of Commerce, Volume XXXXI, April- June-2020, Issue No-II
Implication of the StudyThis study will assist Bule HoraUniversity management to develop important and acceptable
employees’ retention strategies, as it has identified gaps with existing strategies. If the management ofthe University accept and use the findings of the study it would contribute more for University goalachievement. Because, this study has identified important issues which make employees happy ifimplemented properly. If employees happy with University handling system they will serve themanagement well and this will improve organizational acceptability among the community.
Limitation and Direction for Future ResearchersThis study has methodological limitation as it used pure qualitative research approach that cannot
evaluate relation between variables; so that the findings of this study need further study to fill gapsresulted from research approach. This study is not including impact assessment of retention strategiesto evaluate how retention strategies reduce employee turnover and how University get benefited fromstrategies it implemented. Further research studiesmay be necessary to assess both negative and positiveimpacts of retention strategies of the University.
References• Arnold, E. (2005), Managing human resources to improve employee retention, The Health
Care Manager, Vol. 24 No. 2, pp. 132-40• Bratton, J., & Gold, J. (2003), Human Resource Management, Theory and Practice, New
York: Palgrave Macmillan• Boxall, P. & Purcell, J. (2003), Strategy and Human Resource Management, Palgrave Macmillan,
Hampshire• Chapman, C. (2009). Retention begins before day one: orientation and socialization in libraries,
New Library World, Vol. 110 (¾), pp. 122-135• Denton J. (2000). Using Web-based projects in a systems design and development course.
Journal of Computer Information Systems, 40(3), 85-7.• Echols, M.E. (2007), “Learning’s role in talent management”, Chief Learning Officer, Vol. 6
No. 10, pp. 36-40.• Eyster, L., Johnson, R. and Toder, E. (2008). Current strategies to employ & retain older
workers.• Freyermuth. (2007). Retaining Employees in a Tightening Labor Market, RSM Mc Gladrey.• Gary (2008). Inc. New York Dyke TV, Strick Recruitment, selection and retention of managers
in the hotel and restaurant industry. FIU Hospitality Review. Pp.1-9.• Gomez-Mejia, Luis and Balkin (1992). Structure and process of diversification, compensation
strategy and firm performance: Strategic management journal, vol. 13 p. 381-397• Hammersak, S. (2002). The secret of Strategic Recruiting: How to hire better, faster and less
expensively in any market. Resource and Recruitment Guide• Heneman, H. G. and T. A. Judge (2003) Staffing Organization (4th edition).

155Orissa Journal of Commerce, Volume XXXXI, April- June-2020, Issue No-II
• Herman, R.E. (2005), “HR managers as employee-retention specialists”, Employment RelationsToday, Vol. 32 No. 2, pp. 1-7.
• Hiltrop, J.M. (1999), “The quest for the best: human resource practices to attract and retaintalent”, European Management Journal, Vol. 17 No. 4, pp. 422-30.
• Hytter, A. (2008), “Retention strategies in France and Sweden”, The Irish Journal of Management,Vol. 28No. 1, pp. 59-79
• James, L., and Mathew, L., (2012). Employee Retention Strategies: IT Industry. SCMS Journalof Indian Management, 9(3).
• Lincoln, J.R., (1996) Commitment, quits, and work organization in Japanese and U.S. plant.Industrial and labour. Relation Review
• Lotko .M, Razgale .I and Vilka L, (2015) Mutual Expectations of Employers and Employeesas a Factor Affecting Employability: The European Journal of Social and BehavioralSciencesEJSBS Volume XVII (eISSN: 2301-2218)
• Kellough, J. Edward, and Will Osuna. (1995). Cross-agency comparisons of quit rates in thefederal service. Review of Public Personnel Administration 15:58–68.
• Khan, W.& O. Mufti, (2012). “Effect of Compensation on Motivating Employees in Publicand Private Banks of Peshawar”, Journal of Basic and Applied Scientific Research, II (5),
• Moncarz, E., Zhao, J., and Kay, C., (2009). An Exploratory Study of US Lodging Properties’Organizational Practices on Employee Turnover and Retention. International Journal ofContemporary Hospitality Management, 21 (4), 437 – 458.
• Mello, J. A (2011) Strategic Human Resource Management, 3rd Ed, OH: South-western CengageLearning
• Meyer, John, LaryssaTopolnytsky, HenrykKrajewski and Ian Gellatly (2003). Best Practices:Employee Retention. Toronto: Tomson-Carswell
• Mitala, John (2003): Recruitment and Retention Strategies and Development of ProfessionalStandards, fifth Global Forum on reinvesting Government and Capacity Building Workshop,Mexico
• Pitiris, M. (2009). Why Retention Strategies Fail? (http://www.hcs4.ec/staffturnover.htm)• Prince, B.J. (2005). Career-focused employee transfer processes. Career Development International,
10(4), 293-309• Rawat, R. (2013) Emerging Employee Retention Strategies in IT Industry’.• Scott, K. D., D. Morajda and J. W. Bishop (2002) “Increase Company Competitiveness.”
World at Work Journal. Vol. 1. No. 1.• Singh, S. (2012). Developing e-skills for competitiveness, growth and employment in the 21st
century. International Journal of Development Issues, 11(1): 37-59• Slack, N., Chambers, S. & Johnston, R. (2007). Operations management. 5th Edition. Harlow,
England: Pearson Education, FT Prentice-Hall

156 Orissa Journal of Commerce, Volume XXXXI, April- June-2020, Issue No-II
• Spinks, N. (2004). Work-life balance: Achievable goal or pipe dream? Journal for quality andparticipation, 27 (3), 4-11.
• Sommer, R.D, (2000), Retaining Intellectual capital in the 21st century, society for humanresource management. Alexandria, VA
• Walker, J.W. (2001), “Zero defections?” Human Resource Planning, Vol. 24 No. 1, pp. 6-8.• Villegas, R. (2006). Training is not enough. Retrieved 2013, from Saipan Tribune: http://
www.- saipantribune.com/new sstory.aspx? NewsID=62172 &cat=3

157Orissa Journal of Commerce, Volume XXXXI, April- June-2020, Issue No-II
Leadership Role and its Effectiveness for ExploringBenefits of Implementing Human Resource
Development ProgramsDr. G. P. Mishra1, Dr. J. K. Chandel2 & Dr. K. L. Mishra3
ABSTRACTThis article explores the role of leadership toward realizing financial benefits of implementing
Human Resource Development programs by contemporary organizations. Views and findings of differentleading authors like James Adetunji Odumeru, Oladele AyodejiIlesanmi, Bob Hill, Richard A. Swanson,Yongmei Liu, James G.Combs, David J. KetchenJr., R. DuaneIreland, Jerry W. Gilley, Steven A. Egglandand Ann Maycunich Gilleyhave been discussed in this article. The findings shows that line and staffmanagers in financial firms use a consultative Leadership style, with staff managers being moreconsultative than line managers. The statistical test confirms the findings.
Keywords: Human Resource Development, Return on Investment, Human Capital, FinancialBenefits, Leadership, effectiveness
IntroductionLeadership has become the most important topic for research in recent times (Yukl, 2002), this
study does not show that the research is done at managerial levels. Various researches on leadershipsuggest that it is the key determinant of organizational success (House, R.J & Podaskoff, P.M., 1995).Leadership is the process whereby one individual influences other group members toward the attainmentof organizational goals (Yukl, 2002). Employees are required to follow their leaders (in our casemanagers) as they provide direction to the organization (Cialdini, R.B., 1988) but why employees orfollowers respect and admire the leaders and what is the leaders position across managerial levels, thisis not clear from the previous research done by many researchers, hence there was need to find thecause of it for which this research is done. Thus we may say that every individual is different to each
1. Professor, Birla Institute of Technology Mesra, Jaipur Campus, 27, Malviya Industrial Area, Jaipur,Rajasthan Email: [email protected]
2. Assistant Professor , Birla Institute of Technology Mesra, Jaipur Campus, 27, Malviya IndustrialArea, Jaipur, Rajasthan Email: [email protected] Contact no-8628822225
3. Associate Lecturer, Birla Institute of Technology Mesra, Jaipur Campus, 27, Malviya IndustrialArea, Jaipur, Rajasthan Email: [email protected],Contact no-6378354466

158 Orissa Journal of Commerce, Volume XXXXI, April- June-2020, Issue No-II
other and that each individual possess different characteristics (Geier, J.G, 1969). According to Greatperson theory, leaders possess key traits that totally different from other and they possess special traitsthat distinguish them from others (Barker, R.A. 2001). In this theory role across is not incorporated butsome researchers have different views than stated above (Argyris & Schon, 1996). In this research theeffects of independent variables on dependent variable was not known, hence there was need to doresearch. In a study of leadership behavior, Ganguli (1964) found that majority of the managers preferredthe autocratic style and almost 31 % also showed their preference toward autrocratic style of leadership.Similar results are reported by Myers. But these researches were not conducted across the manageriallevel. The role of Indian culture has also been emphasized in describing the leadership orientation ofmanagers. Chattopadhyay (1975) and Moddie (1968) described Indian managers as authoritarian andhierarchical. This attitude in the Indian culture is also reported by Kalra (1975). He found that 75 % ofthe managers studied expressed their concern on this issue. In an experimental study of three cultures,namely, India, Africa and South America, Meade and Whittaker (1967) found Indians to be highest inauthoritarian than any other group. Another reason of their being authoritarian is that most of themanagers are young and are from the marketing function. This is also shown in a study by Pinder andPinto (1974) that young managers tend to be more autocratic and inclined to make quick and independentdecisions. In the same study, they found that managers from sales department demonstrate orientationtowards autocratic style. None of the researchers tried to find the effectiveness across the manageriallevel, hence there was need to take this study.
The research findings of Meade (1967) , Kakar (1971) , Ganguli (1964) , Thiagrajan and Deep(1970), Meade and Whittakar (1967), Reilly and Roberts (1978), assert the importance of authoritarianstyle for the division and effectiveness of the organization. Calvin Hoffman and Harden, (1957) Lippittand White (1989), Katz, Maccoby and Mores (1950); Kidd and Cristy (1960) found that authoritarianstyle leads to better performance. In a field study, Litwin and Stringer (1968) examined the influence ofleadership styles on organizational effectiveness.
ObjectiveThe objective of the study is to find Leadership role and its effectiveness in financial firms toward
realizing financial benefits of implementing Human Resource Development programs and leadershipeffectiveness of Line and Staff Managers with reference to Financial Firms
Sample size50 Managers (Males and females) were selected for the study. 92.7% were male and 7.3% were
females. Among the male managers 97.6% were married and 2.4% were single. Among the femalemanagers 53.8% were married, 23.1% were single and 23.1% were divorced. As far as educationalqualifications of the managers, 57.9% were post – graduates, 38.2% were graduates, 3.9% wereundergraduates and 77.5% were certified associates of the Indian Institute of Bankers. As far as therespondents student – life details is concerned, 52.2.% had excelled in academics, 39.3% were classmonitors, 20.2% held positions in student union and 48.3% perceived themselves as leaders.
Design of QuestionnaireDichotomous questions and Multiple-choice questions were circulated to ascertain the basis on
which managers had chosen financial firms as their career. The findings shows that 49.4% of the managers

159Orissa Journal of Commerce, Volume XXXXI, April- June-2020, Issue No-II
adopted this profession by chance, 24..2% of the managers had the liking for the profession, 13.5% hadthe attitudes for the job, 11.2% had no options and 1.75% adopted this profession as family tradition. Ina nutshell the Indian Bank Managers are well educated and professionally qualified. They have anexcellent scholastic record. Nearly 40% held Leadership positions during their student days and thefemale managers have a less stable marital status than the male Managers.Hypothesis
Thus we hypothesize that the association among the Superior’s position within an organizationalset up and their Leadership style, with lower subordinates adopt a more participative Leadership styleas compared to their participation with their senior Managers.Variables:
Organizational effectiveness and Leadership stylesFindings of Financial Benefits of HRD
Many authors have researched on cost-benefit analysis of Human Resource Development. During1970’s, Alexander (1971) had proposed cost–benefit analyses of Human Resource Developmentinitiatives. Pyle (1970) had suggested using Human Resource Accounting (HRA) to calculate ROI fromhuman resources. Cheek (1973) had described cost-effectiveness assessments of personnel developmentprograms. According to King (1970), there are three different accounting models which are essentialfor assessing HRD programs: (1) a cost model (2) an effectiveness model(3) a synthesizing model. Theaim of cost model is to recognize firms’ direct cost and losses during production time. The aim of aneffectiveness model is to measure and validate the effects of the project on work environment expressingits effect on financial terms. The aim of synthesizing model is to understand and explore associationwith leadership stylesa dn benefits derived from human resource development program. Herrick, (1975)identified a group of non-productive behaviourswhich are likely to be influenced by human resourcedevelopment programs and suggested cost-cutting measures for unproductive behaviours.Top of Form
One of the famousarticles discusses the optimization of human capital (Crawford & Cabanis-Brewin,2005). Employees require HRD initiatives that build their self-actualization. Maslow (1965) describesself-actualization as the intrinsic motivation exhibited by individuals to take initiative and full devotionto the work provided. Crawford and Cabanis-Brewin (2005) describe a self-actualizing employee asthe one who is motivated by continuous learning, social interaction and new challenges. Individualswith this skillset are able to build intellectual capital and contribute to the organization’s strategic goals.Liu et al. (2007) provide specific examples for building human capital through individual and groupincentives,behaviours and resultsbased performance appraisals.Financial Benefits of Human Resource Development by Richard A. Swanson
Swanson (2001) posits that the financial benefits of human resources development complement anorganization’s processes and offerings to bring value to consumers. Further, according to Swanson, it isimportant for HRD activities to be assessed from financial perspective in order to assign a value tothese activities. Monetary values speak in terms that organizational leaders and stakeholders are ableto understand and support. Swanson provides several methods to assist in assessing the cost of activities

160 Orissa Journal of Commerce, Volume XXXXI, April- June-2020, Issue No-II
associated with human resource development.The approximation method is one of three methods.Swanson (2001) identified the method “as the lowest-cost and highest-gain method of the threepresented”. A case described the process of approximation by answering a question. The question –“Did you make any sales as a result of your participation in the sales communication program?” (p.125) – provided an opportunity for employees to assign a dollar value to sales made as a result ofparticipation in HRD activities. Approximating presents several difficulties. It works when assigning avalue to general outcomes but it is more complex when approximating performance. First, it is difficultto navigate the diverse characteristics of clients, in regards to processing time. Personalities and jobvariety also make it difficult to determine a consistent unit of work performance. Finally, a consensus isrequired to assign value to the unit of performance.
In one of the article,Swanson (2001) presented a very interesting and easy to read text addressingthe financial benefits of HRD. Swanson (2001) asks three questions in order to assess the financialbenefits of HRD dealing with forecasting financial benefits, actual financial benefits, and approximatefinancial benefits (p. 5). HRD professionals need to demonstrate the performance value of inclusion ofHRD in financial planning alongside the other departments in an organization (Swanson,2001). According to Swanson (2001), “the HRD professionals should either be tuned into the businessof making money or be prepared to keep expenses to an absolute minimum” (p. 28). This highlights theimportance of being able to demonstrate the financial benefits associated with HRD. The financialbenefits of HRD are important component of justifying continuing to devote organizational resourcesto them (Jacobs, Jones, & Neil, 1992, p. 31). Rowden (2005) conducted a study to capture financialbenefits associated with training programs. Rowden (2005) used return-on- investment calculations todemonstrate the value of training programs to an organization (pp. 33-34). Jacobs et al. (1992) alsoconducted a study investigating the financial benefits of HRD, in this case of on-the-job training (OJT).The findings showed that structured OJT provides nearly twice the amount of financial benefits to anorganization than non-structured OJT (Jacobs et al., 1992, p. 138). The conclusions from both Rowden(2005) and Jacobs et al. (1992) demonstrate the financial benefits that different HRD programs canhave for organizations. HRD practitioners, who can demonstrate the financial benefits associated withHRD programs, will be able to justify the importance of HRD to modern organizations.
All HRD functions, roles and responsibilities intendto improve performance and performance resultsin financial benefits (Swanson, R. A., 1995). Schwoerer et al. (2005) are of the view that HRD is aimedat developing employee skills, abilities and proficiencies to accomplish efficiency and meet performancerelated expectations which in turn leads to increase the turnover of the firm.
A positivecorrelation exists between a HRD and a firm’s financial performance (Garavan, T. N.,Costine, P., &Heraty, N., 1995, Katou, A. A., 2009 and Macky, K., &Boxall, P., 2007). Many of theresearchers state that for an improved financial performance, organisations must engage in HRDinitiatives on a regular and consistent basis to transform employees into effective and efficient contributors(James Adetunji Odumeru1 & Dr. OladeleAyodejiIlesanmi, 2013).Financial Benefits of HRD by Bob Hill
Hill (2014) suggests that during global financial crisis that HRD should not be illuminated as thecritical element that could save the day as the “mithridate” (antidote to poison, had to look that oneup). Instead, HRD planning should be conducted in concert with the other department planning, just asSwanson (2001) suggests.

161Orissa Journal of Commerce, Volume XXXXI, April- June-2020, Issue No-II
Keeble-Ramsay &Armitage (2015) reported in the United Kingdomthat from 2000-2008 duringthe “Global Financial Crisis” (p. 86), HRD investments were reduced and/or ignored during the planning,matching the premises outlined in Swanson (2001). Interestingly findings of Swanson published in2001 and Keeble-Ramsay &Armitage in 2015 in the UK matches. Financial Benefits of HRD by James Adetunji Odumeru and Oladele Ayodeji Ilesanmi
The findings from Odumeru and Ilesanmi (2013) determine financial performance. As stated intheir conclusion, these factors are some of the factors that improve financial performance. This articlebrought a topic common to HRD: Knowledge, Skills and Abilities (KSA). They state that in the lastdecade a vast number of organizations invested huge amount of money in HRD programs with littleresults. They account this to the HRD programs forgetting about the most important resource i.e. people. If the HRD interventions don’t include the inputs of the people they are attempting to affect there islittle success (Odumeru and Ilesanmi, 2013).Odumeru and Ilesanmi (2013) state that development ofhuman capital builds competitive advantage for organizations. Their specific discussion on projectmanagement brings unique perspectives to the idea of building human resources. In regards to projectmanagement, they state that it assists in focusing “attention on the training, rewards and career path ofthe project professional” (p. 14). However, the insights provided in this text also build understandingon developing human resources to contribute to the organization’s financial assets. Through thedevelopment of the professional, organizational effectiveness increases through better project, portfolioand strategy management.Financial Benefits of HRD by Yongmei Liu, James G. Combs, David J. Ketchen Jr.and R. Duane Ireland
Liu et al (2007) expound on activities and practices that enhance Knowledge, Skills and Attitudes.Selection practices including structured interviews, cognitive aptitude and ability tests, and follow-upstudies of recruiting sources improve selection to enhance person-organization fit. Compensation levelsalso enhance human capital by attracting highly skilled employees. Finally, training attracts employeeswith high KSA by offering access to skills to advance their professional careers.Liu et al (2007) alsofound three factors which influence the effectiveness of HRD practices. Vertical alignment betweenhuman resources and organizational goals are important. Also, horizontal alignment between practiceswith HR and work context impact effectiveness. The article concludes that HRD activities add value toan organization by increasing performance, which in turns connects to increased financial benefit.Asnoted in Lui, Combs, Kethen, & Ireland (2007), executives had wondered for decades prior ifappropriating funds to HRD would make a difference in the financial performance of the organization(p. 503). Their study looked at over 19,000 organizations and found that indeed, there was evidencethat applying funds to HRD programs improved performance. Swanson (2001) presented three modelsfor assessing the financial benefit of HRD programs in their forecasted, actual, and approximated models.Financial Benefits of HRD by Jerry W. Gilley, Steven A. Eggland and AnnMaycunich Gilley
Gilley, Eggland, and Gilley (2002) define human resources as “the people employed by anorganization” (p. 5). In other realms of business, liquid and fixed assets are easier to define. But peopleare the most important resource of an organization and enhancement of human capital has potential todeliver better financial results as well.

162 Orissa Journal of Commerce, Volume XXXXI, April- June-2020, Issue No-II
Leadership EffectivenessThere are many authors which are associated with leadership effectiveness like (Katz and Kahn
1966, Friendlander and Pickle 1968; Yuchtman and Seashore 1967, Jobson and Schneck 1982, Whettenand Cameron 1981) and Cunnigham 1977). They believe that the effectiveness of an organization dependsupon the effectiveness of leadership styles.
FindingsThe finding shows that both line and staff managers have consultative style of Leadership while
the managers holding staff positions scored higher within the consultative range. Table 1 shows theLeadership style (Likert) score of Line and Staff Managers
Table 1 Leadership style of Line and Staff Managers
Job Specialization
Number of Managers
Mean Standard Deviation Standard error of Mean
Line 82 3.28 0.75 0.08 Staff 78 3.80 0.87 0.09
The analysis of Variance (ANOVA) also proves that there is a statistically significant difference inthe Leadership styles of Line and Staff Managers. Table 2 shows the ANOVA test
Table 2 ANOVA Table
Source of variability Sum of Squares Degrees of Freedom Mean Square Between job means 10.93 1 10.93 Within jobs 104.39 158 0.66 Total 115.32 159
Since the obtained value of f is higher than its critical value, a statistically significant difference inthe Leadership style of line and staff managers of financial firms has been established.
The t – test to estimate the significance of the difference in the means of the Leadership stylescores of line and staff managers confirm the findings that the Leadership styles of line and staff managersdiffer as shown in table – 3
Table – 3 Difference in means of Leadership styles of Line and staff managers
Job specification Mean Difference in Means t statistic Line Managers 3.28
0.52 t (158) = 4.333 p < 0.05 Staff Managers 3.80

163Orissa Journal of Commerce, Volume XXXXI, April- June-2020, Issue No-II
The findings of the study indicate that both line and staff managers had a consultative style ofLeadership, but the staff managers scored higher within the consultative range, and this difference wasproved to be statistically significant. This difference may be on account of line positions in financialfirms being more strait - jacketed and rule – bound than staff assignments giving line managers lessfreedom of action and making them mare task – oriented. An example of line assignment in a commercialfinancial firms is the position of a Branch Manager, who operates under many internal and externalconstraints, line staff problems, budgetary goals, customer expectations etc., all of which cut into thefreedom of action and make him task – oriented. Compared to this, a development manager at the HeadOffice, which is a staff position, has broad goals of business development assigned to him and enjoys afair degree of freedom of action. In such a position, There are greater chances of the manager solicitingthe views of his subordinates before making decision. The study is relevant with Ohio study on foremanLeadership measurement and training, using “initiating structure” and “Consideration” ads the majorindices of effectiveness. This study is often quoted for the doubt it threw on the value of human relationstraining for foremen, but it is rarely remembered that this research also discovered a very importantdifference in Leadership style between production and non – production departments. In productiondepartments, or departments working under time constraints, “initiating structure” correlated positivelyand “consideration” negatively with proficiency, while the reverse relationship held for non – productiondepartments. In another study it was found that the Directive style was effective in the case of highlystructured groups.
Contribution (Theoretical)The findings shows that line and staff managers in financial firms use a consultative Leadership
style, with staff managers being more consultative than line managers to realize financial benefits ofimplementing Human Resource Development Programs.. The ANOVA and t test had confirmed thefindings. This difference in the degree of consultative behavior of line and staff managers could bebecause the former, by virtue of the nature of the jobs they handle, enjoy less freedom of action thanthe latter.
Contributions (Practical)None of the financial firm managers have an exploitative authoritarian style of Leadership. The
ANOVA and t test confirmed the research hypothesis that as managers move up in hierarchy theirLeadership styles become more consultative and participative. This could perhaps indicate that seniormanagers are more self – assured and confident than junior managers and are therefore, willing toallow subordinates to participate in decision making.
Future DirectionsWe did not use leadership style and personality interchangeably as done in Hersey and Blanchard
model, this could be explored further in future. The industries surveyed were of mixed categories andhence further research can be done taking each organization separately. Further research could be doneby inducing Knowledge management taking each leadership style separately and its affect on theorganizational effectiveness in financial firms for exploring financial benefits of Human ResourceDevelopment.

164 Orissa Journal of Commerce, Volume XXXXI, April- June-2020, Issue No-II
ConclusionIt seems counterintuitive that big businesses pounce on the latest fad or theme that is promised to
provide huge returns-on-investment but often forget the most crucial part that they wish to influencethe process. Thus we conclude that cost-benefit analysis is very important to understand the real valueof Human Resource Development in any organization.
References• Alexander, M. O. (1971). Investments in People.Canadian Chartered Accountant, 1–8.• Argyris, C., and Schon, D. A. (1996), “Organizational Learning II: Theory, Method and
Practice”, Redding: Addison-Wesley Publishing Co.• Barker, R.A, (2001) “The nature of Leadership”, Human Relations, Vol. 54, 469 – 494.• Calvin, A.D., F.K. Hoffman, and E.L. Harden, (1957), “The Effect of Intelligence and Social
Atmosphere on Group Problems Solving Behavior,” The Journal of Social psychology, Vol.45, pp. 61-74
• Cameron, S. (1981), “Domains of Organisational effectiveness in colleges andUniversities”,Academy of Management Journal, Vol. 24, No.1, 25-47.
• Chattopadhayay, G.P. (1975), “Dependence in Indian Culture: from Mud Huts to companyBoard Rooms”, Economic and Political Weekly, Vol. 10, No. 22, pp. 30-38.
• Cheek, L. M. (1973). Cost Effectiveness Comes to the Personnel Function. Harvard BusinessReview, 51(2), 96–105.
• Cialdini, R.B (1988), “Influence”, (2nd edition), Glenview II: Scott, Foresman.• Crawford, J. &Cabanis-Brewin, J. (2005).Optimizing Human Capital with a Strategic Project
Office: Select, Train, Measure and Reward People for Organization Success. New York:Auerbach Publications.
• Cunningham, J.B. (1977), “Approaches to the evaluation of Organizational Effectiveness”,Academy of Management Review, Vol. 2, 463-474
• Friedlander F. and Pickle H (1968),”Components of Effectiveness in small Organizations”,Administrative Science Quarterly,Vol. 13, No. 2, 289-304.
• Ganguli, H.C. (1964), “Structure and Process of Organization”, Bombay: Asia PublishingHouse, pp 142-160.
• Garavan, T. N., Costine, P., &Heraty, N. (1995). The emergence of strategic human resourcedevelopment.Journal of European Industrial Training, 19(10), 4-10.
• Geier, J.G (1969), “A trait approach to the study of leadership in small groups”, Journal ofCommunications, Vol. 17, 316 – 323.
• Gilley, J. W., Eggland, S. A., & Gilley, A. M. (2002). Principles of Human Resource Development,Second Edition. Cambridge, MA: Perseus Publishing.
• Herrick, N., (1975). The Quality of Work and its Outcomes: Estimating Potential Increases inLabor productivity (Columbus, Ohio: The Academy for Contemporary Problems, 1975).

165Orissa Journal of Commerce, Volume XXXXI, April- June-2020, Issue No-II
• Hill, B. (2014). Critical HRD - A mithridate? Advances in Developing Human Resources,16(4).
• House, R.J, & Podaskoff, P.M (1995), “Leadership & effectiveness: Past perspectives andfuture directions for research. In J. Green berg (Ed.)” Organizational behavior: The state ofscience, Hillsdale, Lawrence Erlbaum Associates, 45-82.
• Jobson, J.D., and Schneck, R (1962), “Constituent views of organizational effectiveness: Evidencefrom Police Organizations”, Academy of Management Journal, Vol. 25, No.1, 25-46.
• Jacobs, R. L., Jones, M. J., & Neil, S. (1992). A Case Study in Forecasting the FinancialBenefits of Unstructured and Structured On-the-Job Training. Human Resource DevelopmentQuarterly, 3(2), 133-139.
• Kakar, S. (1971), “The Theme of Authority in Social Relationship in India”, Journal of SocialPsychology, Vol. 84, pp. 93-101.
• Kalra, S. (1975), “ Are We Ripe For Participate Management”? I.S.T.D. Review, Vol. 5, No.3, pp. 12-13
• Katz, D. and Kahn, R.L. (1966), “The social Psychology of Organizations”, New York, Wiley.• Katz, D., N. Maccoby, and N. Morse (1950), “Productivity, Supervision and Morale in an
Office Situation”, Ann Arbor, Michigan : Survey Research Centre, Institute of Social Research,University of Michigan,
• Katou, A. A. (2009). The impact of human resource development on organisational performance:Test of a causal model. Journal of Behavioural & Applied Management, 10, 335-356.
• Keeble-Ramsaym D. R., &Armitage, A. (2015). HRD challenges faced in the post globalfinancial crisis period insights. European Journal of Training and Development, 39(2), 86-103
• King, B. G., (1970). Cost-Effectiveness Analysis: Implications for Accountants, The Journalof Accountancy, pp. 43-49.
• Lewin, K.R., Lippitt, and R.K. White (1989), “Pattern of Aggressive Behavior in ExperimentallyCreated Social Climates”, Journal of Social psychology, Vol. 10, pp. 271-299.
• Litwin, G.H., and R.A. Stringer (1968), “Motivation and Organizational Climate”, Boston,Mass,; Division of Research, Graduate School of Business Administration, Harvard University.
• Lui, Y., Combs, J. G., Kethen, D. J., & Ireland, R. D. (2007).The value of human resourcemanagement for organizational performance. Business Horizons, 50(6), 503-511.
• Macky, K., &Boxall, P. (2007). The relationship between highperformance work practices andemployee attitudes: An investigation of additive and interaction effects. InternationalJournalof Human Resource Management, 18, 537-567
• Maslow, A. (1965). Self-Actualization And Beyond. Retrieved from https://eric.ed.gov/?id=ED012056

166 Orissa Journal of Commerce, Volume XXXXI, April- June-2020, Issue No-II
• Meade, R.D. (1967), “An Experimental study of Leadership in India,” Journal of SocialPsychology, Vol. 72,pp 35-43.
• Meade, R.D., and J.O. Whittaker (1967), “A Cross Cultural Study of Authoritarianism,” TheJournal of Social Psychology, Vol. 72, pp. 3-7
• Miles, R.H. and K.S. Cameron (1982),”Coffin nails and corporate strategies”, EnglewoodCliffs, N.J. Prentice Hall.
• Moddie, A.D. (1968), “The Brahmanical Culture and Modernity”, Bombay: Asia PublishingHouse.
• Odumeru, J. A.&Ilesanmi, O.A. (2013), “The Effects of Human Resources Development onFinancial Performance of Organisations “, Asian Business Review, Volume 2, Number 1, Issue 3, ISSN 2304-2613 (Print); ISSN 2305-8730 (Online)
• Pinder, C.C., and P.R. Pinto (1974), “Demographic Correlates of Managerial Styles”, PersonalPsychology, Vol. 27, pp. 257-270.
• Reily, C.A., and K.H. Roberts (1978), “Supervisor Influence and Subordinate Mobility Aspirationsas Moderators of Considerations and Initiating Structure”, Journal of Applied psychology,Vol. 63, pp. 96-102.
• Pyle, W. C., (1970). Monitoring Human Resources - ‘On Line’, Michigan Business Review,pp. 19 -32.
• Robert W. Rowden. (2005). Exploring methods to evaluate the return-on-investment fromtraining. Business Forum, 27(1), 31–36.
• Schwoerer, C. E., May, D. R., Hollensbe, E. C., &Mencl, J. (2005). General and specific self-efficacy in the context of a training intervention to enhance performance expectancy.HumanResource Development Quarterly, 16(1), 111–129. https://doi.org/10.1002/hrdq.1126
• Swanson, R. A. (1995). Human resource development: Performance is the key. Human ResourceDevelopment Quarterly, 6(2), 207–213. https://doi.org/10.1002/hrdq.3920060208
• Swanson, R. A. (2001). Assessing The Financial Benefits Of Human Resource Development.Boulder, United States: Ingram Publisher Services US.
• Thiagrajan, K.M., and S.D. Deep (1970), “A Study of Supervisor—Subordinate Influence andSatisfaction in Four Cultures”, The Journal of Social psychology, Vol. 82, pp. 173-180.
• Whetten, D.A., and Cameron, K.S. (1981), “Perceptions of Organizational effectiveness overorganisational life cycles”, Administrative Science Quarterly, Vol. 26, No. 4, 525-544.
• White, R.E. and Hamermesh, R.G. (1981), “Toward a model Business Unit performance: AnIntegrative approach”, Academy of Management Review, Vol. 6, 213-224
• Yucthman E. and Seashore S.E. (1967), “A system Resource Approach to OrganizationalEffectiveness”, Academy of Management Review, Vol. 9, No. 4, 606 – 616.
• Yukl, G (2002), “Leadership in organizations”, 5th ed. Upper saddle river, NJ: Prentice Hall.

167Orissa Journal of Commerce, Volume XXXXI, April- June-2020, Issue No-II
INCUMBENCY CHART OF OFFICE BEARERSOrissa Commerce Association (OCA) started in 1970 in G. M. College Sambalpur, which was thefirst College to have B. Com. as an under Graduate course in Orissa. The pioneering foundingmembers of OCA are:
1. Prof. Paresh Chandra Ray2. Prof. Suryakanta Das3. Prof. Batakrushna Mohanty4. Prof. Durga Prasad Nayak
Year Venue President Secretary
1 1970 G.M. College, Sambalpur Sri Harihar Patel, Ministry of Industires, Govt. of Orissa
* * *
2 1971 Khalikote College, Berhampur Prof. P.C.Ray, Secretary, Board of Secondary Education, Orissa
* * *
3 1973 Ravenshaw College, Cuttack Prof. P.C.Ray, Secretary, Board of Secondary Education, Orissa
* * *
4 1974 G.M. College, Sambalpur Prof. (Dr) Surya Kant Das Professor of Commerce, Utkal University, Bhubaneswar
Prof. Batakrushna Mohanty, Prof. of Commere, G. M. College, Sambalpur
Dr. Abhaya Kumar, Reader, Department of Commerce, Utkal University
One Issue
5 1976 Utkal University, Bhubaneswar Mr. M.P. Modi, I.A.S. Managing Director, IDC
* * *
6 1977 Bhadrak College, Bhadrak Prof. (Dr) Surya Kant Das Professor of Commerce, Utkal University, Bhubaneswar
* * *
7 1978 S.C.S. College, Puri Prof. Batakrushna Mohanty, Principal, G.M. College, Sambalpur
* * *
8 1980 Berhampur University, Bhanja Vihar, Berhampur
Prof. Batakrushna Mohanty, Principal, G.M. College, Sambalpur
* * *
9 1981 K.S.U.B. College, Bhanjanagar Prof. Ganga Prasad Panda, Principal Lingaraj Law College, Berhampur
* * *
10 1982 Dhenkanal College, Dhenkanal Shri Durga Prasad Nayak, Principal, Sonepur College, Sonepur.
Dr. Girija Prasad Acharya Dr. Pramod Ku. Sahu, Berhampur University
One Issue
11 1983 Ispast College, Rourkela Prof. Bijay Narayan Pattnaik, Utkal University, Bhubaneswar
Dr. Girija Prasad Acharya * *
12 1985 F.M. College, Balasore Prof. (Dr.) J.J. Rao, Ravenshaw College, Cuttack
Dr. Girija Prasad Acharya * *
Sl. No Managing Editor of Orissa Journal of Commerce
Number of Issues
Published

168 Orissa Journal of Commerce, Volume XXXXI, April- June-2020, Issue No-II
13 1986 Ganjam College, Ganjam Prof. (Dr) Ramakanta Jena, Dean, Faculty of Commerce, Utkal University, Bhubaneswar
Dr. Girija Prasad Acharya Dr. Ghanashyam Panda, Berhampur University
One Issue
14 1987 L.N.College, Jharsuguda Prof. (Dr) Pramod Ku. Sahu, Professor , Berhampur University, Berhampur
* Dr. Ghanashyam Panda, Berhampur University
One Issue
15 1988 Dhenkanal College, Dhenkanal Prof. Sambhu Prasad Mishra, Professor of Commerce, G.M. College, Sambalpur
* Dr. Ghanashyam Panda, Berhampur University
One Issue
16 1990 Dept. of Commerce, Berhampur University
Sri S.C. Patro, Head, P.G. Department of Commerce, Khalikote College
Dr. Swaroop Ch. Sahoo Dr. Gunanidhi Sahoo, Principal, Khalikote, Berhampur
One Issue
17 1994 Bhadrak College, Bhadrak Prof. (Dr) Gunanidhi Sahu, Principal, Khalikote College, Berhampur
Dr. Jagannath Panda Dr. Swaroop Ch. Sahoo One Issue
18 1995 S.C.S. College, Puri Prof. (Dr) Girija Prasad Acharya, Professor of Commerce, Ravenshaw College, Cuttack
Dr. Bidhu Bhusan Panigrahi, Prof. Pramod Ku. Sahu, Berhampur University
One Issue
19 1997 Womens’ College, Jharsuguda Shri Ayodhya P. Nayak, BJB College, Bhubaneswar
Dr. Damodar Biswal, S.C.S. College, Puri
Prof. Pramod Ku. Sahu, Berhampur University
One Issue
20 1998 Prananath College, Khurda Prof. (Dr.) Pradeep Chandra Tripathy, Professor , Utkal University, Bhubaneswar
Prof. Tahalu Sahoo, Principal Womens College, Jharsugara
Prof. Pramod Ku. Sahu, Berhampur University
One Issue
21 1999 Khalikote (Auto) College, Berhampur
Prof. (Dr) R.P. Choudhury, Principal, Khalikote College (Auto), Berhampur
Malay Kumar Mohanty, Ravenshaw College (Auto)
Prof. Pramod Ku. Sahu, Berhampur University
One Issue
22 2000 Ispat College, Rourkela Prof. Minaketan Mohapatra Principal, Dehenkanal College
Malay Kumar Mohanty, Ravenshaw College (Auto)
Prof. Pramod Ku. Sahu, Berhampur University
One Issue
23 2001 Maharshi College of Natural Law, Bhubaneswar
Prof. (Dr) Damodar. Biswal, Professor, Ravenshaw College (Auto), Cuttack
Malay Kumar Mohanty, Ravenshaw College (Auto), Cuttack
Prof. Pramod Ku. Sahu, Berhampur University
24 2004 Kendrapara College, Kendrapara
Prof. (Dr) Jagannath Panda Professor Berhampur University, Berhampur
Prof. Ranjan Kumar Bal, Utkal University
Prof. Pramod Ku. Sahu, Berhampur University
One Issue
25 2005 V.N.College, Jajpur Road Prof. (Dr) Umesh Ch. Pattnaik Professor Berhampur University, Berhampur
Prof. Ranjan Kumar Bal, Utkal University
Prof. Jagannath Panda, Berhampur University
One Issue
26 2006 Rayagada College, Raygada Prof. Tahalu Sahu, Principal Belpahar College, Belpahar
Prof. Ranjan Kumar Bal, Utkal University
Prof. Jagannath Panda, Berhampur University
One Issue
27 2007 P.G. Department of Commerce Utkal University, Bhubaneswar
Prof (Dr) Samson Moharana Professor Utkal University, Bhubaneswar
Prof. Kishore Ch. Rout,Berhampur University
Prof. Jagannath Panda, Berhampur University
One Issue
28 2008 Fakir Mohan Autonomous College, Balasore
Dr. Arun Kumar Barik, Head, Department of Commerce, Vyasanagar College, Jajpur Road
Prof. Kishore Ch. Rout,Berhampur University
Prof. Ranjan Kumar Bal, Utkal University
One Issue
29 2009 Govt. Autonomous College, Angul
Maj (Dr.) Abhay Kumar Panda, Principal, Fakir Mohan Autonomous College, Balasore.
Prof. Kishore Ch. Rout,Berhampur University
Prof. Ranjan Kumar Bal, Utkal University
One Issue
30 2010 Department of Commerce, Ravenshaw University
Shri Baladev Kar, Principal, Govt. College (Auto), Angul
Dr. Kshiti Bhusan Das, Utkal University
Prof. Ranjan Kumar Bal, Utkal University
One Issue

169Orissa Journal of Commerce, Volume XXXXI, April- June-2020, Issue No-II
* Information not available: People concerned are requested to provide the above missing informationwith proper references. If any error has crept in the above incumbency chart inadvertently, persons arerequested to intimate the correction with the required documentation.
31 2011 P. G. Department of Commerce, Berhampur University
Prof. Malay Kumar Mohanty, Former Registrar, Ravenshaw University, Professor G. M. College, Dean Sambalpur University
Dr. Kshiti Bhusan Das, Utkal University
Prof. Ranjan Kumar Bal, Utkal University
One Issue
32 2012 P. G. Department of Commerce, Utkal University
Prof. P. K. Biswasray, Professor , Berhampur University
Dr. Kshiti Bhusan Das, Utkal University
Prof. Ranjan Kumar Bal, Utkal University
One Issue
33 2013 Choudwar College, Choudwar Prof. Prasant Kumar Sahu, Vice- Chancellor, Utkal University
Prof. Kshiti Bhusan Das, Utkal University
Prof. Malay Kumar Mohanty One Issue
34 2014 P. N. (Auto) College, Khurda Prof. Ranjan Kumar Bal, Professor, Utkal University
Prof. Kshiti Bhusan Das, Utkal University
Prof. Malay Kumar Mohanty Two Issue
35 2014-15 Kendrapada (Auto) College Prof. Kshiti Bhusan Das, Professor, Utkal University
Dr. G. K. Panigrahi Prof. Malay Kumar Mohanty Two Issues
36 2016 Belpahar College, Belpahar Prof. Girish Ku. Patra, Kendrapada (Auto) College
Dr. G. K. Panigrahi Prof. Malay Kumar Mohanty Two Issues
37 2017 F. M. University, Balasore Prof. Jayanta Kumar Parida, Professor,Utkal University
Dr. G. K. Panigrahi Prof. Malay Kumar Mohanty Three Issues
38 2018 Ravenshaw University, Cuttack Prof. Bhagaban Das, Professor, F. M. University
Major (Dr) S. A. Taher Prof. Malay Kumar Mohanty Four Issues
39 2019 P. G. Department of Commerce, Utkal University
Prof. Sanjay Kumar Satapathy, Professor, Ravenshaw University
Major (Dr) S. A. Taher Prof. Malay Kumar Mohanty Four Issues
40 2019-20 KIIT, Deemed to be University, Prof. P. K. Hota, Major (Dr) S. A.Taher Prof. Malay Kumar Mohanty Four Issues
41 2020-21 L.N.College, Jharsuguda Prof.Sasmita Samanta, Pro-Vice Chancellor, KIIT University, Bhubaneswar
Major (Dr) S. A.Taher Prof. Malay Kumar Mohanty Two Issues

170 Orissa Journal of Commerce, Volume XXXXI, April- June-2020, Issue No-II
KUNAL BOOKS LIST OF BOOKSFundamental of Remote Sensing and GIS Debabrata Nandi 978-93-89234-50-3 2020 `295
Hydrogeology of Hardrock Terrain D.Nandi P.C. Sahu 978-93-89234-08-4 2020 `895 A Geospital Approach S. Goswami
Mahatma Gandhi A Ray of Hope For The World M. P. Tripahti 978-93-89234-37-4 2020 `795
Professional Ethics Need For The 21st Century M. P. Tripahti 978-93-89234-51-0 2020 `695
Sociological Perspectives of Education Satyaki Sarkar 978-93-89234-55-8 2020 `450
Women Empowerment Through Self Help S. K. Nayak & A. K Sahu 978-93-89234-90-0 2020 `995Group and Microfinance
Contribution of Mughals to the Society and Cultur e of B.K. Sahu 978-93-86714-61-9 2019 `650Medival Odisha 1593-1707
Connecting Asia Understanding Foreign Debasish Nandi 978-93-89224-94-8 2020 `1195Relations, Organizations and Contemporary Issues
A Study of Freedmom Movement In india Ganeswar Nayak 978-93-89224-31-3 2020 `450
Destination Marketing: The Diamond Triangle of Odisha Tushar Kanta Pany 978-93-86714-90-9 2019 `1195
Arthur Miller’s Approach to Reality: Dr. Geetashree Roy 978-93-89224-24-5 2019 `595A Critical Analysis
Contemporary Issues and Challenges in G.S. Lall, V.R. Bhanotu & 978-93-86714-64-0 2019 `1095Finance and Taxation (Royal Size) S.R. Dash
Consumer Behaviour in Durable Products Dr. Smruti Ranjan Das & 978-93-89234-03-9 2019 `895An Empirical Study* Dr. Devi Prasad Misra
Contemporary Essays in International Relations Dr. Prosenjit Pal 978-93-89224-44-3 2019 `750
Climate Change and Urbanisattion S. Patra, S.Das, B.C.Behera, 978-93-89224-08-5 2019 `1095P. Singh & D. Mishra
Corporate Social Responsibility: Dr. Smruti Ranjan Das 978-93-89224-26-9 2019 `695Practices in Manufacturing Industry Dr. K. Palani
Corporate Governance in Indian Companies: Smruti Ranjan Das, 978-93-89224-28-3 2019 `895New Prespectives K. Palani & D.P. Misra
Culture Through The Ages: A Study of India S. Nayak & S. Malik 978-93-86714-96-1 2019 `995
Customer Retentation Practices in Banking Sector Swayambhu K. Mishra & 978-93-86714-88-6 2019 `895An Indian Evidence Kishore Kumar Das
A Hand Book of Teacher Education R.K. Nayak & H. Panda 978-81-938362-6-2 2019 `1295
Digital Technology Its Downsides and How to Debasish Sanyal 978-93-86714-60-2 2019 `1395Handle Them S.K. Dutta & S.K. Roy
Digitized Times S. Adhikari, D. Sanyal, 978-93-89224-13-9 2019 `895S.K. Dutta & S.K. Roy

171Orissa Journal of Commerce, Volume XXXXI, April- June-2020, Issue No-II
Development of SCs & STs in Globalised World Jayanta Mete & K. Roy 978-81-938362-2-4 2019 `1195
Development of Tribal Economy: A Study of Sanjay Kumar Satapathy 978-93-86714-84-8 2019 `695LAMPs the District of Kalahandi
Development with Disparity in India S.K. Ray & G.C. Mandal 978-93-89224-39-9 2019 `1195
Educational Management and Administration P.K. Panda 978-93-89224-30-6 2019 `950
Educational Planning in The context of Salil K. Dutta, 978-93-89224-23-8 2019 `895Secondary Education Suman K. Roy
Educational Philosophy Arnab Chowdhury, 978-93-89224-40-5 2019 `1095J. Roy & Jayanta Mete
Educational Psychology Arnab Chowdhury, J Mete 978-93-89224-50-4 2020 `1195
Educational Research Methodology Arnab Chowdhury, 978-93-89224-41-2 2019 `1095Sanjib Roy & Jayanta Mete
Economic Policy Issues and Challenges Malay Kumar Mohanty, 978-93-86714-94-7 2019 `995S.K. Satapathy & S.A. Taher
Exploring Sub-Himalayan Region of West Bengal Dr. Madhab C. Adhikary, 978-93-89224-27-6 2019 `1195and Her Neighbours: Society, Religion and Ananda Gopal Ghosh &Culture Since 1947 Dr. Kartik Chandra Sutradhar
Financial Accounting and Statement Analysis Sudhansu Sekhar Nanda, 978-93-86714-98-5 2019 `1095Satyanath Mohapatra
Financial Markets Institutions and Services Biswa Mohan Jena, 978-93-86714-82-4 2019 `700S.K. Mishra & R Sain
Financial Research-Trends and Issues (Crown Size) Kailash Chandra Biswal 978-93-86714-85-5 2019 `1050
Fundamental of Mutual Fund: A Beginner's Module S. Panda & K.K. Das 978-93-89224-37-5 2019 `550
Geology and Man P.C. Sahu & S.R. Sahoo 978-93-86714-44-2 2019 `795
History and Culture of Kandhmal Ramakanta Bhuyan 978-93-86714-63-3 2019 `995(A Study on Missionary Activities)
Human Right Issues and Perspectives M. Ghosh & S.K. Ray 978-93-86714-92-3 2019 `1095
India and the World D.K. Giri 978-93-89224-02-3 2019 `995
India and South Asia Challenges and Opportunities Dr. Prosenjit Pal 978-93-89224-43-6 2019 `595
Inclusive Education A. Choudhury & J. Mete 978-93-89224-16-0 2019 `1150
Institutions, System and Structures in Kaustuv Bhattacharyya 978-93-89224-51-1 2020 `895Secondary Education Suman Kalyan RoyInteral Humanism: Revisited in Contemporary India S.K. Mishra 978-93-86714-97-8 2019 `895
Indira Sagar National Project (Polavaram) Its Pradeepta Kumar Mishra, 978-93-86714-83-1 2019 `795Anticipated Impect on Economy and Ecology Satyabrata Mishra
Kandhmal Turmeric: The Spice Queen S. Kanungo & S. K. Satapathy 978-81-938362-0-0 2019 `695

172 Orissa Journal of Commerce, Volume XXXXI, April- June-2020, Issue No-II
Management of Non-Performing Assets in the P.K. Pardhan & 978-81-938362-1-7 2019 `1195State Financial Corporation Bhagabata Behara
Managing Organisations in the Digital Era : Anil Kumar Sahu, 978-93-86714-99-2 2019 `995Issues & Challenges S.K. Chaudhury, S.K. Pradhan
Mapping Economics History of Colonial Odisha Ganeswar Nayak 978-93-86714-79-4 2019 `995
Micro Finance Institutions and NBFCs in Sudhansu Sekhar Dash, 978-93-86714-91-6 2019 `995Indian Prespectives Suman K. Chaudhury
Need for Skill and Competency Development in Pratap K. Panda & 978-93-89224-07-8 2019 `995Teacher Education Gourhari Manna
Pedagogy of Social Science (Political Science) A. Choudhury & J. Mete 978-93-89224-20-7 2019 `895
Principles and Practics of Management: Srinibash Dash, 978-81-935479-4-6 2019 `895A Concept and Cases P. Routray & A.K. Dash
Profiling Women in Progressive India Sunita Mangla, 978-93-86714-62-6 2019 `1195N. Giri, M. Tomar
Reforming The Indian Economy: Some Prespectives S.K. Ray & T. Banerjee 978-93-86714-89-3 2019 `1195
Risk Sharing: Finance and Accounting in a Nutshell Z.H. Shaikh, A.M. Sarea 978-93-86714-93-0 2019 `1195& Malay Kumar Mohanty
Rural Reporting Focus Local Bodies: A Study Bibhudatta Mahapatra 978-93-86714-75-6 2019 `650
Semantics of Inclusive Education Dr. Sharmista 978-93-86714-56-5 2019 `550
Self Help Group and Microfinance: Strategy for Suman Kalyan Chaudhury, 978-81-938362-8-6 2019 `895Women Empowerment and Poverty Eradication S. Sarkar & S.K. Dash
Socio-Economy of Malkangiri District of Odisha: Pradeepta Kumar Mishra 978-93-86714-86-2 2019 `750Issues and Challenges on Development
Studies of Histology and Paleontology Subhasmita Panda 978-93-86714-05-3 2019 `895
Sustainable Managements of Sundarbans : Haraprasad Bairagya 978-81-938362-3-1 2019 `550A Critical Analysis
Teacher Education Growth and Development R.K. Nayak & P.K. Panda 978-81-938362-4-82019 `1095
Teacher Education Post Independence Period A. Choudhury & J. Mete 978-93-89224-18-4 2019 `795
Teacher Education Pre Independence Period A. Choudhury & J. Mete 978-93-89224-17-7 2019 `850
Teacher Education Modern Period Arnab Choudhury, 978-93-89224-19-1 2019 `850J. Roy & Jayanta Mete
The Philosophical Foundation of R.K. Nayak & 978-93-86714-58-9 2019 `1195Educational Psychology P.K. Panda
Tensions in Rural Bengal: Landloards, Planters and Dr. Chittabrata Palit 978-93-86714-68-8 2019 `750Colonial Rule
Tribal Women and Society A.K. Srivastava 978-81-938362-5-5 2019 `795

173Orissa Journal of Commerce, Volume XXXXI, April- June-2020, Issue No-II
Understanding Discipline and Subject Sarmila Banerjee, 978-93-89224-42-9 2019 `1095A. Chowdhury & J. Mete
International Financial Management (PB) K.K. Das & R.K. Sain 978-93-89234-32-9 2020 `450
International Marketing (PB) S, K Baral 978-93-89234-54-1 2020 `495
Indian Federal System A Covid-19 Perspective Jitendra Sahoo 978-93-89224-56-6 2020 `995Krittibas Datta
India Tajikistan Relations A Big partnership for Jajneswar Sethi 978-93-89224-52-6 2020 `795the 21st Century
A Comparative Study of Environmental Dr. M. P. Tripathi 978-93-89234-71-8 2020 `395Awareness, Scientific Temper and Self-Conceptof Students studying in Kendriya Vidyalayas andOther Schools at 10+ Level
A Socio- Cultural Study of the Rita Bhowmick 978-93-89224-64-1 2019 `695Jaminiya Berhmna
Application of Space Technology Debabrata Nandi 978-93-89234-30-5 2020 `795
Alexander Pope: The Satirist H. Prasad 978-81-938328-3-7 2019 `95
Biologically Inspired Techniques for Financial P. S. Mishra & 978-93-89234-26-8 2020 `695ModelingS. Dehuri
Connecting Asia: Understanding Foreign Debasish Nandy 978-93-89224-94-8 2020 `1395Relations, Organizations andContemporary Issues
COVID-19 Migration and Sustainable Development Sudhakar Patra, 978-93-89224-65-8 2020 `1395Kabita Kumari SahuShakuntala Pratihary &Ambika Prasad Nanda
Development, Environment and Sustainability Prof. Sudhakar Patra 978-93-89224-85-6 2020 `1195Dr. Ambika Prasad Nanda
Education In A New Outlook Suman Kalyan Roy & 978-93-89234-59-6 2020 `1095Jayanta Mete
Essays on Education Jayanta Mete & 978-93-89234-58-92020 `1095Suman Kalyan Roy
Ethnography of Strategic Leadership Towards S K Baral 978-93-89224-64-12020 `1095Sustainability Durga Madhav Mahapatra
Festivals A New Avenue for India -Thailand Samhita Chaudhari 978-93-89224-51-1 2020 `795Cultural Linkage
Goods & Services Tax (GST) and Demonetization Dr. Sujit Deb & 978-93-89234-64-0 2020 `250Meteriality to Present Economics Situation and Dr, Sameer ShekharFuture ProspectsGrowth, Productivity and Employment of Subhashree Biswal & 978-93-89234-72-5 2020 `1095Manufacturing Industry Sudhakar Patra

174 Orissa Journal of Commerce, Volume XXXXI, April- June-2020, Issue No-II