Science Process Skills Levels of Primary School Seventh Grade Students in Science and Technology...
14
Science Process Skills Levels of Primary School Seventh Grade Students in Science and Technology Lesson Nurhan ÖZTÜRK 1 , Özden TEZEL 2 , M. Bahaddin ACAT 3 1 Ph.D. Student, Gazi University, Department of Primary Education, Ankara-TURKEY 2 Assoc. Prof. Dr., Eskişehir Osmangazi University, Department of Primary Education, Eskişehir -TURKEY 3 Prof. Dr., Eskişehir Osmangazi University, Department of Education Sciences, Eskişehir-TURKEY Received: 13.03.2009 Revised: 02.08.2010 Accepted: 12.08.2010 The original language of article is English (v.7, n.3, September 2010, pp.15-28) ABSTRACT The aim of this study was to determine the science process skill achievement level of primary school seventh grade students in a Science and Technology lesson and relations among academic background of the parents, monthly income of the parents, having a computer, having own room and students’ science process skill levels. To this end, “Science Process Skills Test (SPST)” was prepared and used as a data collection means by the researchers. The Cronbach Alpha reliability coefficient of the test was found 0,88. The sample of the study consists of 828 seventh grade students from 21 primary schools which are choosen by chance from Kocaeli Province Center (within Turkey). Scanning model has been used in the study. The data were analyzed by using frequency, percentage, arithmetic average, standard deviation values, and t-test and ANOVA analyze techniques. According to the research findings, it was found that students’ science proce ss skill levels were in middle level. As a result, primary school seventh grade students’ science process skill levels did display differences according to parents’ academic background, their monthly income, having a computer, having own room, but the students’ SPS do not change in terms of gender. Key Words: Science and Technology Lesson; Science Process Skills, Seventh Grade Primary School Students INTRODUCTION In this day and age, which is the information era, the main aim of the education is to show the accession ways of knowledge to the students rather than transforming the existing knowledge. Thus, the person learning by comprehending can improve his Science Process Correspondence Author: [email protected] © ISSN:1304-6020 *This study includes a part of the master thesis of Nurhan ÖZTÜRK which has been handled by the counselling of Özden TEZEL and M.Bahaddin ACAT in 2008. TÜRK FEN EĞİTİMİ DERGİSİ Yıl 7, Sayı 3, Eylül 2010 Journal of TURKISH SCIENCE EDUCATION Volume 7, Issue 3, September 2010 http://www.tused.org
Transcript of Science Process Skills Levels of Primary School Seventh Grade Students in Science and Technology...

Öztürk, Tezel & Acat / TUSED / 7(3) 2010 15
Science Process Skills Levels of Primary School Seventh Grade
Students in Science and Technology Lesson
Nurhan ÖZTÜRK1, Özden TEZEL2
, M. Bahaddin ACAT3
1 Ph.D. Student, Gazi University, Department of Primary Education, Ankara-TURKEY
2 Assoc. Prof. Dr., Eskişehir Osmangazi University, Department of Primary Education, Eskişehir-TURKEY
3 Prof. Dr., Eskişehir Osmangazi University, Department of Education Sciences, Eskişehir-TURKEY
Received: 13.03.2009 Revised: 02.08.2010 Accepted: 12.08.2010
The original language of article is English (v.7, n.3, September 2010, pp.15-28)
ABSTRACT
The aim of this study was to determine the science process skill achievement level of primary school
seventh grade students in a Science and Technology lesson and relations among academic background of the
parents, monthly income of the parents, having a computer, having own room and students’ science process
skill levels. To this end, “Science Process Skills Test (SPST)” was prepared and used as a data collection
means by the researchers. The Cronbach Alpha reliability coefficient of the test was found 0,88. The sample
of the study consists of 828 seventh grade students from 21 primary schools which are choosen by chance
from Kocaeli Province Center (within Turkey). Scanning model has been used in the study. The data were
analyzed by using frequency, percentage, arithmetic average, standard deviation values, and t-test and
ANOVA analyze techniques. According to the research findings, it was found that students’ science process
skill levels were in middle level. As a result, primary school seventh grade students’ science process skill
levels did display differences according to parents’ academic background, their monthly income, having a
computer, having own room, but the students’ SPS do not change in terms of gender.
Key Words: Science and Technology Lesson; Science Process Skills, Seventh Grade Primary
School Students
INTRODUCTION
In this day and age, which is the information era, the main aim of the education is to
show the accession ways of knowledge to the students rather than transforming the existing
knowledge. Thus, the person learning by comprehending can improve his Science Process
Correspondence Author: [email protected] © ISSN:1304-6020
*This study includes a part of the master thesis of Nurhan ÖZTÜRK which has been handled by the counselling
of Özden TEZEL and M.Bahaddin ACAT in 2008.
TÜRK FEN EĞİTİMİ DERGİSİ
Yıl 7, Sayı 3, Eylül 2010
Journal of
TURKISH SCIENCE EDUCATION
Volume 7, Issue 3, September 2010
http://www.tused.org

Öztürk, Tezel & Acat / TUSED / 7(3) 2010 16
Skills (SPS) and solve the problems which encountered in new situations. SPS provide
students to learn by doing, experiencing and associating science subject with daily life. SPS
are skills which make the learning in Science and Technology lesson easy, develop students’
curiosity and make them active, introduce the laboratory atmosphere by driving the students
to make research and facilitate to convey the learning from Science and Technology lesson to
the real life.
SPS are skills which we use to create information, think on problems and formulate the
results. These skills are used by the scientist during their studies. We can make them learn and
understand their life by enabling the students gain these important skills. These skills are
fundamental of the thought and research in the science content (Erdoğan, 2005).
When the literature has been examined, it is seen that the researchers approached SPS
differently. Monhardt and Monhardt (2006) claimed that these skills get the students learn
thinking like scientist. SPS have been defined by Çepni et al., (1997) as basic skills which
facilitate learning in science, make students active, improve the feeling of taking
responsibility in their own learning, raise the stableness of the learning, and also show
research methods and ways.
Aydoğdu (2006) describes SPS as basic skills which facilitate learning, and, teaching
discovering methods, make students active, improve their responsibilities and help them to
understand practical studies. Aydoğdu indicates that these skills are dominantly used in the
laboratory. In the Science and Technology lesson curriculum, the SPS have been defined as
thinking skills which are used by scientist creating information, thinking on the problems and
formulating the results (MEB, 2006).
SPS help children to learn the nature of the science well, contribute to their mental
growth positively. These skills are used and needed in every part of the daily life. For
example, a farmer can try out to take efficiency from his field by forming hypothesis and
testing it though he has not take any science training. A financial councilor can make a
prediction and draw graphic in order to predict the exchange rate. A conscious consumer, is an
individual whose observation skill is developed, can use deduction and data explication
appropriately (Tan & Temiz, 2003).
One of the most important reasons to teach children science is that they can obtain
knowledge and skills which they can use for life by learning science. Also, they can attain
with science skills like improving creative and critical thinking skills, making the conceptual
systems understandable which consist of the base of the science thoughts, understanding the
process dimensions of the science, improving the self confidence in understanding the
questions and the problems, having the ability of analyzing the answers and solutions.
Developing attitudes such as sensitivity about environment problems and curiosity of the
children is possible with science teaching (Yılmaz, 2005).
SPS have been a major theoretical force in science education. Whether the argument is
philosophical or practical, the solution is usually the same; SPS need to be strongly
emphasized in elementary, middle, and secondary science curricula and classrooms (Padilla &
Okey, 1984).
The purpose of this study is to identify seventh grade students’ SPS achievement levels
in Science and Technology lesson and to explore the effects of personal features on students’
SPS. The study tries to answer the following research questions:
1. How are primary school seventh grade students’ SPS achievement levels in Science
and Technology lesson?
2. Whether primary school seventh grade students’ SPS achievement levels in Science
and Technology lesson differentiate according to;

Öztürk, Tezel & Acat / TUSED / 7(3) 2010 17
a. Gender,
b. Mother’s education background,
c. Father’s education background,
d. Parents’ income,
e. Student’s owning a computer,
f. Student’s owning a room at home?
METHODOLOGY
In this study relational survey model was used, because it was thought that relational
survey model would be suitable for addressing the research questions. The investigated SPS in
the present study are: Observation, Classification, Variable Definition, Prediction, Measure
and Data Explication, Number and Space Relations, Formulating Hypothesis, Decisions,
Modelling, Changing Variables and Controlling, Recording Data, Experimenting, and
Inference. These skills are decribed as below:
Observation: Observation is known as a common technique for collecting information
which has been used in all disciplines. Observation is to determine the properties of a situation
or an object by using any of the sensory organs. Making observation takes place on the basis
of the SPS.
Classification: Classification is grouping the defined criteria of the objects or events
according to the similar or different groups by using some methods and system. The previous
knowledge of the students is important in classification skill (Tatar, 2006). By this way,
students can make relation between previous knowledge and faced new concepts.
Identifying Variables: This process includes recognition of the features of the factors
or components of the event, which varies or not in different circumstances. Identifying of
variables, states all the factors that can affect the experiment. Identifying of variables process
is in the core of the making experiment (Çepni et al., 1997).
Predicting (Guessing before): Predicting is to guess the most likely outcome of a future
event based upon a pattern of evidence (Tatar, 2006).Science research is a process of consistent
guessing, and data are collected in order to disprove or support the guess. And for this process
experiment or observation is used (Tan & Temiz, 2003).
Measurement and Data Explication: Measurement is the conversion of the
observation into quantitative data. The comparison and counting are the simplest way; it
includes the use of units in order to determine the measurable quality, capacity, time and mass
of the linear dimension. Measurement knowledge is a critical factor in learning and it does not
develop without experiment. Data explication includes seeing the relation between events or
facts by organizing and analyzing the acquired data (Çepni et al., 1997).
Number and Space Relations: In learning processes of space, students try to describe
and understand the objects according to plane and three dimension shapes. Students who have
gained these skills can understand abstract concepts better. They can revive the possible shape
of the substance in their mind and think their three dimension shapes.
Formulating Hypothesis: Hypothesis is a proposal whose accuracy has not been
proven, but based on scientific proves. Hypothesis is used to create theory and law.
Hypothesis usually focuses on the experiment. Also, hypothesis gives a hint about method
which will be used in an experiment (Çepni et al., 1997).
Making Decision: This process includes reaching a result by using all the basic
processes mentioned. Here, the decision of a problem must be investigated. A decision can be
reached by using research methods (Çepni et al., 1997).
Formulating Models: This process of information or data; with graphic, shape or tables
includes arrangement appeal to sensory organs. Student whose formulating model skill is
developed cannot think up the models in order to explain the relations among events, objects
and thoughts.

Öztürk, Tezel & Acat / TUSED / 7(3) 2010 18
Changing and Controlling Variables: In most of scientific research the events which
influenced the variables are researched and tried to find the impact of the variable on another
variable (Tatar, 2006).
Recording Data: To be able to reach the results from the experiments, it is necessary to
save the data. The data is saved like charts, tables, graphics, histograms, models or other
regulatory form (Çepni et al., 1997).
Experimenting: This process skill includes many other process skills. The main point
of making experiment is to establish correlation between variables by setting up a hypothesis
and with the help of it. Extract and test predictions, identifying variables, editing the collected
information, using variables, and controlling are determination of the system's limits, sub-
systems, components, inputs and outputs, variables which are open to change through the
interaction (Erdoğan, 2005).
Inference: Inference is formulating assumptions or possible explanations based upon
observations or experiences. How much the observations are better so the results will be
certain. In this study, it was thought that survey method would be suitable for determining the
existing students’ science process skill achievement levels.
a. Sample: The population of this study consists of seventh grade students from
primary schools which are bound to Kocaeli National Education Directory. The population
consists of 110 primary schools. There are total 7787 seventh grade students in the population.
It is seen that 828 students are enough for representing the population with 0, 05 tolerance.
The sample consists of seventh grade students from 21 primary schools which are choosen by
chance from Kocaeli Province Center.
b. Data Collecting Means: SPS test which consisted of 26 questions was prepared for
the students as a data collecting mean for this research. Expert opinions were taken for every
question while they were having prepared, necessary arrangements were made and availability
of the test was determined for being used. The Cronbach Alpha reliability coefficient of the
test was found 0,88. SPS test consists of questions related to observation, classification,
variable definition, prediction, measure and data explication, number and space relations,
formulating hypothesis, decisions, modeling, changing variables and controlling, data
recording, making experimenting and inference skills.
The personal information form which was prepared by the researchers, consists of 6
questions related to personal information, gender, mother education background, father
education background, parents’ income, having a computer and having own room. This form
takes places in the SPS test.
c. Collecting the Data: SPS Test and the Personal Information Form were applied to
the students by the researchers with the permission document taken from the Kocaeli Province
National Directory. The implementation was done in the second term of 2007-2008 academic
years, during two weeks between 26 February-7 March 2008 at Science and Technology
lesson.
d. Analyzing the Data: In the first phase of the data analysis the status of the sample
according to personal information was evaluated. For this, in the tables average scores related
to variable level and standard deviation of them were referred. The data analysis was done by
using SPSS 13.0 statistic program. In the prepared questions about the scientific process the
scoring was set as true (1) and false (0). The total score for the entire test is 26. The total score
for each skill is up to the number of questions that belong to it. The scientific process skill
levels of the students were evaluated both over the total of all skills and by taking the average
of the answers on individual skills. The questions on "scientific process skills test" answered
by the students consisted of 26 questions; arithmetic mean, minimum-maximum scores and
standard deviation values of the answers were calculated. Also, the frequency (f), percentage

Öztürk, Tezel & Acat / TUSED / 7(3) 2010 19
(%), average (M) and standard deviation (SD) values of the students’ answers of the question
related to thirteen skills were calculated. In the test which was prepared to determine thirteen
different skills level of the students, there are two questions for observation, classification,
identifying of variables, predicting, measurement and data explication, number and space
relation, formulating hypothesis, formulating models, changing and controlling variables,
recording data, and experimenting; there are three questions for making decision and there is
one question for inference skill. The average of the answers which was given to the questions
prepared on thirteen skills was found over the number of questions. In the second phase on the
scientific process skills levels; in order to determine whether or not there are differences in
terms of the mother and father educational status and total family income status, one-way
variance analysis (ANOVA) was used. As a post-doc analysis of ANOVA, Tukey multiple
comparison tests were used in order to determine the differences on the groups whose number
is more than two. T-test was used to determine whether differences occur between the groups
according to students’ gender, having a computer and having their own room in terms of
scientific process skill levels.
FINDINGS
1) Primary School Seventh Grade Students’ SPS Level
In the questions about the scientific process the scoring was set as true (1) and false (0).
The total score for the entire test is 26. The total score for each skill is up to the number of
questions that belong to. The scientific process skill levels of the students were evaluated both
over the total of all skills and by taking the average of the answers on individual skills. As
regards to scores of students’ receive from the total of all the answers to questions on
"scientific process skills test" which consists of 26 questions; arithmetic mean, minimum-
maximum scores and standard deviation values were given in Table 1.
The arithmetic mean of the students’ answers regarding the SPS test is 15, 39.
According to these data it can be said that the students’ SPS achievements are in the middle
level. Table 1. Arithmetic Mean Score, Minimal-Maximum Points and Standard Deviation Values
Related to Total Science Process Skills
The Total of
Skills
f M Minimal Maximum S.D.
828 15,39 2,00 26,00 4,671
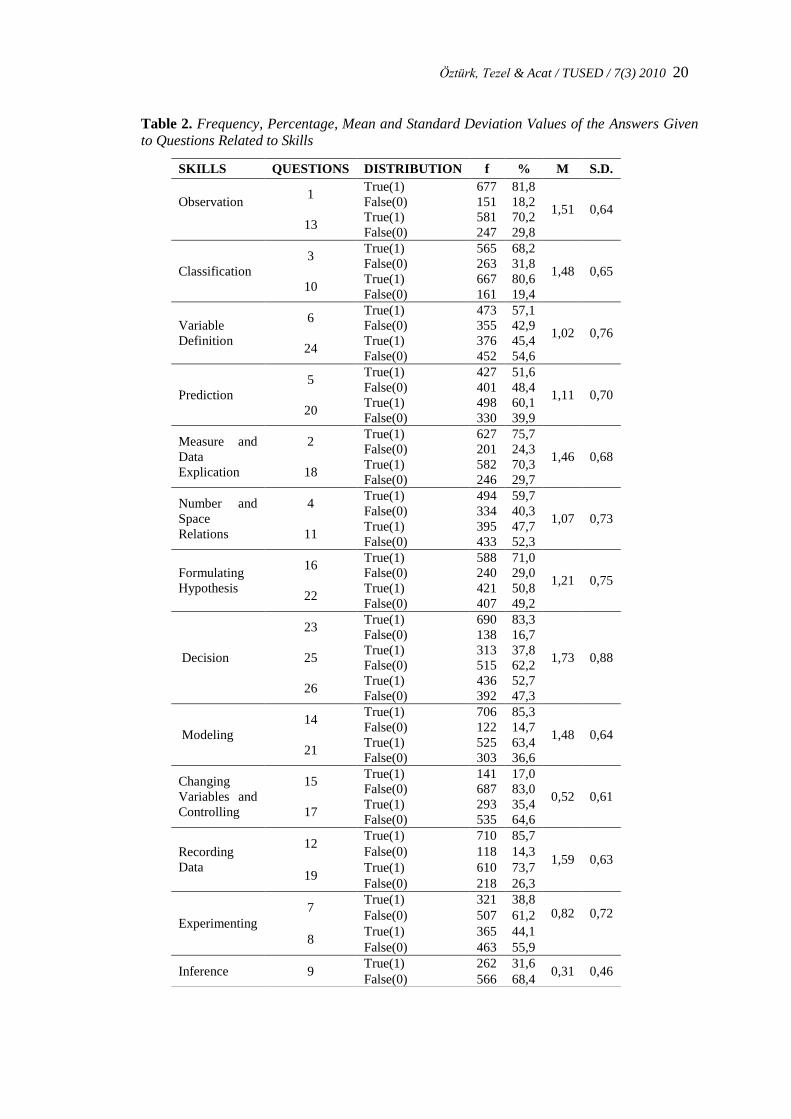
Also, the frequency, percentage, average and standard deviation value of the students’
answers of the question related to thirteen skills were given in Table 2. The average scores of
the answers related to thirteen skills were found over the number of questions. When Table 2
is examined, the mean score of the answers about observation is 1,51 on 2 points. According
to this finding, it can be said that the students’ observation skill has been achieved at high
level.
The mean score of the answers about classification is 1,48 on 2 points. According to this
finding, it can be said that the students’ classification skill has been achieved at high level.
The mean score of the answers about variable definition is 1,02 on 2 points. According
to this finding, it can be said that the students’ variable definition skill has been achieved at
middle level.
The mean score of the answers about prediction is 1,11 on 2 points. According to this
finding, it can be said that the students’ prediction skill has been achieved at middle level.
Öztürk, Tezel & Acat / TUSED / 7(3) 2010 20
Table 2. Frequency, Percentage, Mean and Standard Deviation Values of the Answers Given
to Questions Related to Skills
SKILLS QUESTIONS DISTRIBUTION f % M S.D.
Observation
1 True(1) 677 81,8
1,51 0,64 False(0) 151 18,2
13 True(1) 581 70,2
False(0) 247 29,8
Classification
3 True(1) 565 68,2
1,48 0,65 False(0) 263 31,8
10 True(1) 667 80,6
False(0) 161 19,4
Variable
Definition
6 True(1) 473 57,1
1,02 0,76 False(0) 355 42,9
24 True(1) 376 45,4
False(0) 452 54,6
Prediction
5 True(1) 427 51,6
1,11 0,70 False(0) 401 48,4
20 True(1) 498 60,1
False(0) 330 39,9
Measure and
Data
Explication
2 True(1) 627 75,7
1,46 0,68 False(0) 201 24,3
18 True(1) 582 70,3
False(0) 246 29,7
Number and
Space
Relations
4 True(1) 494 59,7
1,07 0,73 False(0) 334 40,3
11 True(1) 395 47,7
False(0) 433 52,3
Formulating
Hypothesis
16 True(1) 588 71,0
1,21 0,75 False(0) 240 29,0
22 True(1) 421 50,8
False(0) 407 49,2
Decision
23 True(1) 690 83,3
1,73 0,88
False(0) 138 16,7
25 True(1) 313 37,8
False(0) 515 62,2
26 True(1) 436 52,7
False(0) 392 47,3
Modeling
14 True(1) 706 85,3
1,48 0,64 False(0) 122 14,7
21 True(1) 525 63,4
False(0) 303 36,6
Changing
Variables and
Controlling
15 True(1) 141 17,0
0,52 0,61 False(0) 687 83,0
17 True(1) 293 35,4
False(0) 535 64,6
Recording
Data
12 True(1) 710 85,7
1,59 0,63 False(0) 118 14,3
19 True(1) 610 73,7
False(0) 218 26,3
Experimenting
7 True(1) 321 38,8
0,82 0,72 False(0) 507 61,2
8 True(1) 365 44,1
False(0) 463 55,9
Inference 9 True(1) 262 31,6
0,31 0,46 False(0) 566 68,4

Öztürk, Tezel & Acat / TUSED / 7(3) 2010 21
The mean score of the answers about measure and data explication is 1,46 on 2 points.
According to this finding, it can be said that the students’ measure and data explication skill
has been achieved at high level.
The mean score of the answers about number and space relations is 1,07 on 2 points.
According to this finding, it can be said that the students’ number and space relations skill has
been achieved at middle level.
The mean score of the answers about formulating hypothesis is 1,21 on 2 points.
According to this finding, it can be said that the students’ formulating hypothesis skill has
been achieved at middle level.
The mean score of the answers about decision is 1,73 on 3 point. According to this
finding, it can be said that the students’ decision skill has been achieved at middle level.
The mean score of the answers about modeling is 1,48 on 2 points. According to this
finding, it can be said that the students’ modeling skill has been achieved positively.
The mean score of the answers about changing variables and controlling is 0,52 on 2
points. According to this finding, it can be said that the students’ changing variables and
controlling skill has been achieved at low level.
The mean score of the answers about recording data is 1,59 on 2 points. According to
this finding, it can be said that the students’ recording data skill has been achieved positively.
The mean score of the answers about experimenting is 0,82 on 2 points. According to
this finding, it can be said that the students’ experimenting skill has been achieved at low
level.
The mean score of the answers about inference is 0,31 on 1 point. According to this
finding, it can be said that the students’ inference skill has been achieved at low level.
When all of the skills are examined it is seen that the maximum point is at data
recording skill with 1,59 on 2 points and the minimum point is at changing variables and
controlling skill with 0,52 on 2 points. By considering these findings it is seen that the
students’ data recording skill is in the highest level and their changing variables and
controlling skill is in the lowest level.
2) The Differentiation Situation of Students’ SPS Achievement Level in Science
and Technology Lesson According to Gender
Table 3. The Findings Related to Difference between Female and Male Students’ SPS
(*p<0.05)
GENDER f M S.D. t Sig.
Female 402 15,67 4,512 1,716 ,086
Male 426 15,11 4,806
The results of t-test which was used to determine whether differences occur in
students’ scientific process skill levels according to students’ gender were given in Table 3.
This test was performed using the average of the total science process skills.
As shown in Table 3, there is no significant difference (p>0,05) between the male and
female students’ total SPS scores. That finding shows that the students’ science process skill
levels do not differentiate meaningfully in terms of gender.

Öztürk, Tezel & Acat / TUSED / 7(3) 2010 22
3) The Differentiation Situation of Students’ SPS Achievement Level in Science
and Technology Lesson According to Mother Academic Background
The results of variance analysis (ANOVA) which was used to determine whether
differences occur in students’ science process skills in terms of mother academic backgrounds
are presented in Table 4.
Table 4. The Findings Related to Students’ SPS in Terms of Mother Academic Background
(*p<0,05)
TH
E T
OT
AL
OF
S
KIL
LS
Sum of
Squares df
Mean
Square F Sig.
Difference
Between
Groups
Between
Groups 1444,367 3 481,456 23,895 ,000
primary-high
school
primary-
university
secondary-
university
high school-
university
Within
Groups 16602,632 824 20,149
Total 18046,999 827
According to Table 4, it is seen that the level of students’ science process skill
differentiate significantly in terms of mother academic background. According to Tukey test
results which was done to determine the difference, it is seen that there is differentiation in
favor of ones whose academic level is high between the group of where mother academic
level is lowest and the group of where mother academic level is highest. When this is taken
into consideration it can be said that while mother academic level increases, the students’
science process skill levels also increase.
4) The Differentiation Situation of Students’ SPS Achievement Level in Science and
Technology Lesson According to Father Academic Background
The results of variance analysis (ANOVA which was used to determine whether
differences occur in students’ science process skills in terms of father academic backgrounds
are presented in Table 5.
According to Table 5, it is seen that the level of students’ science process skill
differentiate significantly in terms of father academic background. According to Tukey test
results which was done to determine the difference, it is seen that there is differentiation in
favor of ones whose academic level is higher than the group where the father academic level
is high between the group of where father academic level is lowest and the group of where
father academic level is highest. When this is taken into consideration it can be said that while
father academic level increase, the students’ science process skill levels also increase.

Öztürk, Tezel & Acat / TUSED / 7(3) 2010 23
Table 5. The Findings Related to Students’ SPS in Terms of Father Academic Background
(*p<0,05)
TH
E
TO
TA
L O
F
SK
ILL
S
Sum of
Squares df
Mean
Square F Sig.
Difference
Between
Groups
Between
Groups 2122,434 3 707,478 36,608 ,000*
primary-high
school
primary-
university
secondary-
university
high school-
university
Within
Groups 15924,565 824 19,326
Total 18046,999 827
5) The Differentiation Situation of Students’ SPS Achievement Level in Science
and Technology Lesson According to Parents’ Income
The results of variance analysis (ANOVA) which was used to determine whether
differences occur in students’ science process skills in terms of parents’ income are presented
in Table 6.
Table 6. The Findings Related to Students’ SPS in Terms of Parents’ Total Income (*p<0,05)
TH
E T
OT
AL
OF
S
KIL
LS
Sum of
Squares df
Mean
Square F Sig.
Difference Between
Groups
Between
Groups 1604,138 3 534,713 26,796 ,000* 0400 / 401–750
0–400 / 751–1500
0–400 / 1500 and more
401–750 / 751–1500
401–750 / 1500 and more
751–1500 / 1500 and more
Within
groups
16442,861 824 19,955
Total 18046,999 827
According to Table 6, it is seen that the level of students’ science process skill
differentiate significantly in terms of parents’ income. According to Tukey test results which
was done to determine the difference, it is seen that there is differentiation in favor of ones
whose parents’ income is high between the group of where parents’ income is low and the
group of where parents’ income is high. When this is taken into consideration it can be said
that while parents’ income increases the students’ science process skill levels also increase.

Öztürk, Tezel & Acat / TUSED / 7(3) 2010 24
6) The Differentiation Situation of Students’ SPS Achievement Level in Science
and Technology Lesson According to Having a Computer
The results of t-test which was used in order to determine whether there is a difference
in students’ science process skills in terms of having a computer by the students. are presented
in Table 7. T-test was performed using the average scores of the total science process skills.
According to Table 7, t =6,168, it was found a significant difference between the
students’ SPS of whom have computer or not at p< 0,05 importance level. That finding shows
that the students’ science process skill levels do differentiate significantly according to having
a computer. According to the t-test results which were done to determine the difference, it is
seen that there is differentiation in favour of ones who have computer.
Table 7. t-Test Results of Total Scores of the Students’ SPS According to Having Computer
(*p<0,05)
HAVING
COMPUTER f M S.D. t Sig.
Yes 570 16.04 4.694 6,168 ,000*
No 258 13.93 4.281
7) The Differentiation Situation of Students’ SPS Achievement Level in Science
and Technology Lesson According to Having Own Room
The results of t-test which was used in order to determine whether there is a difference
in students’ science process skills in terms of having their own room by the students are
presented in Table 8. T-test was performed using the average scores of the total science
process skills.
Table 8. t-Test Results of Total Scores of the Students’ SPS According to Having Own Room
HAVING
ROOM f M S.D t Sig.
Yes 546 16.16 4.645 6,753 ,000*
No 282 13.90 4.360
*p<0,05
According to Table 8, t =6,753, it was found a significant difference between the
students’ science process skills of whom have own room or not at p < 0,05 importance level.
This finding shows that the students’ science process skill levels do differentiate significantly
according to having an own room. According to the t-test results which were done to
determine the difference, it is seen that there is differentiation in favor of ones who have own
room.
Öztürk, Tezel & Acat / TUSED / 7(3) 2010 25
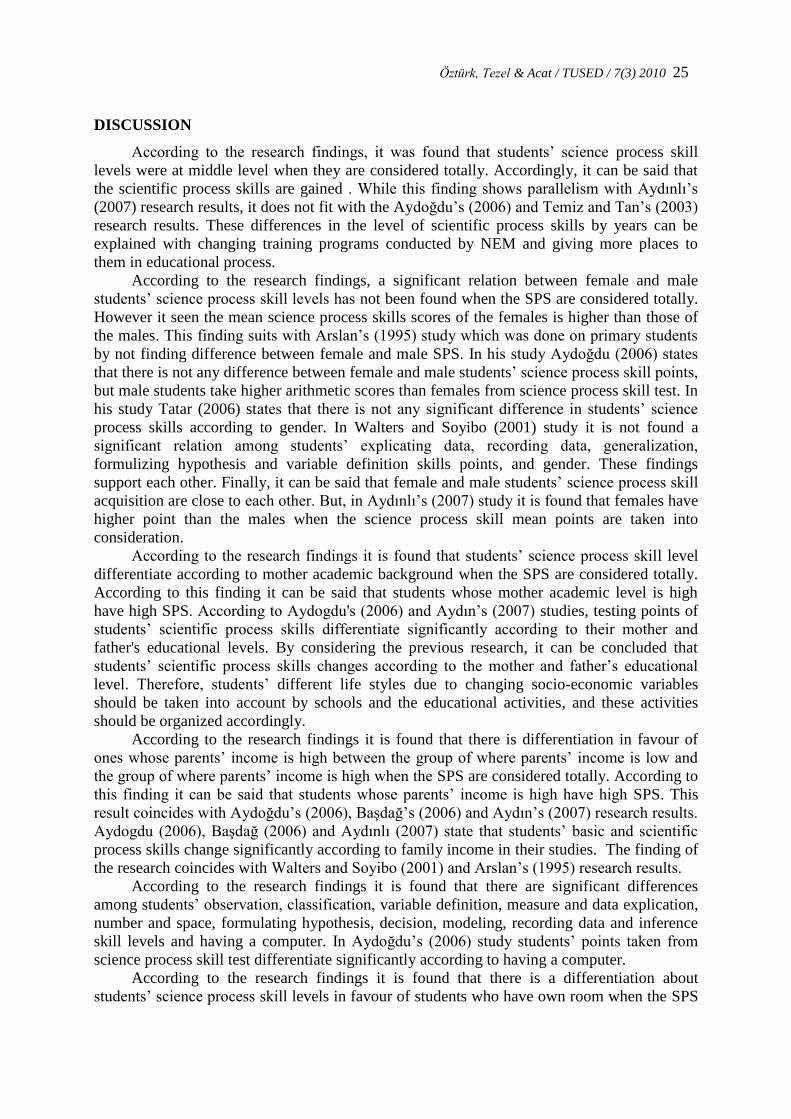
DISCUSSION
According to the research findings, it was found that students’ science process skill
levels were at middle level when they are considered totally. Accordingly, it can be said that
the scientific process skills are gained . While this finding shows parallelism with Aydınlı’s
(2007) research results, it does not fit with the Aydoğdu’s (2006) and Temiz and Tan’s (2003)
research results. These differences in the level of scientific process skills by years can be
explained with changing training programs conducted by NEM and giving more places to
them in educational process.
According to the research findings, a significant relation between female and male
students’ science process skill levels has not been found when the SPS are considered totally.
However it seen the mean science process skills scores of the females is higher than those of
the males. This finding suits with Arslan’s (1995) study which was done on primary students
by not finding difference between female and male SPS. In his study Aydoğdu (2006) states
that there is not any difference between female and male students’ science process skill points,
but male students take higher arithmetic scores than females from science process skill test. In
his study Tatar (2006) states that there is not any significant difference in students’ science
process skills according to gender. In Walters and Soyibo (2001) study it is not found a
significant relation among students’ explicating data, recording data, generalization,
formulizing hypothesis and variable definition skills points, and gender. These findings
support each other. Finally, it can be said that female and male students’ science process skill
acquisition are close to each other. But, in Aydınlı’s (2007) study it is found that females have
higher point than the males when the science process skill mean points are taken into
consideration.
According to the research findings it is found that students’ science process skill level
differentiate according to mother academic background when the SPS are considered totally.
According to this finding it can be said that students whose mother academic level is high
have high SPS. According to Aydogdu's (2006) and Aydın’s (2007) studies, testing points of
students’ scientific process skills differentiate significantly according to their mother and
father's educational levels. By considering the previous research, it can be concluded that
students’ scientific process skills changes according to the mother and father’s educational
level. Therefore, students’ different life styles due to changing socio-economic variables
should be taken into account by schools and the educational activities, and these activities
should be organized accordingly.
According to the research findings it is found that there is differentiation in favour of
ones whose parents’ income is high between the group of where parents’ income is low and
the group of where parents’ income is high when the SPS are considered totally. According to
this finding it can be said that students whose parents’ income is high have high SPS. This
result coincides with Aydoğdu’s (2006), Başdağ’s (2006) and Aydın’s (2007) research results.
Aydogdu (2006), Başdağ (2006) and Aydınlı (2007) state that students’ basic and scientific
process skills change significantly according to family income in their studies. The finding of
the research coincides with Walters and Soyibo (2001) and Arslan’s (1995) research results.
According to the research findings it is found that there are significant differences
among students’ observation, classification, variable definition, measure and data explication,
number and space, formulating hypothesis, decision, modeling, recording data and inference
skill levels and having a computer. In Aydoğdu’s (2006) study students’ points taken from
science process skill test differentiate significantly according to having a computer.
According to the research findings it is found that there is a differentiation about
students’ science process skill levels in favour of students who have own room when the SPS
Öztürk, Tezel & Acat / TUSED / 7(3) 2010 26
are considered totally. Thus, having own room which is one of the socio-economic level
indicators shows that there is a relation between opportunities offered to students and
development of these skills.
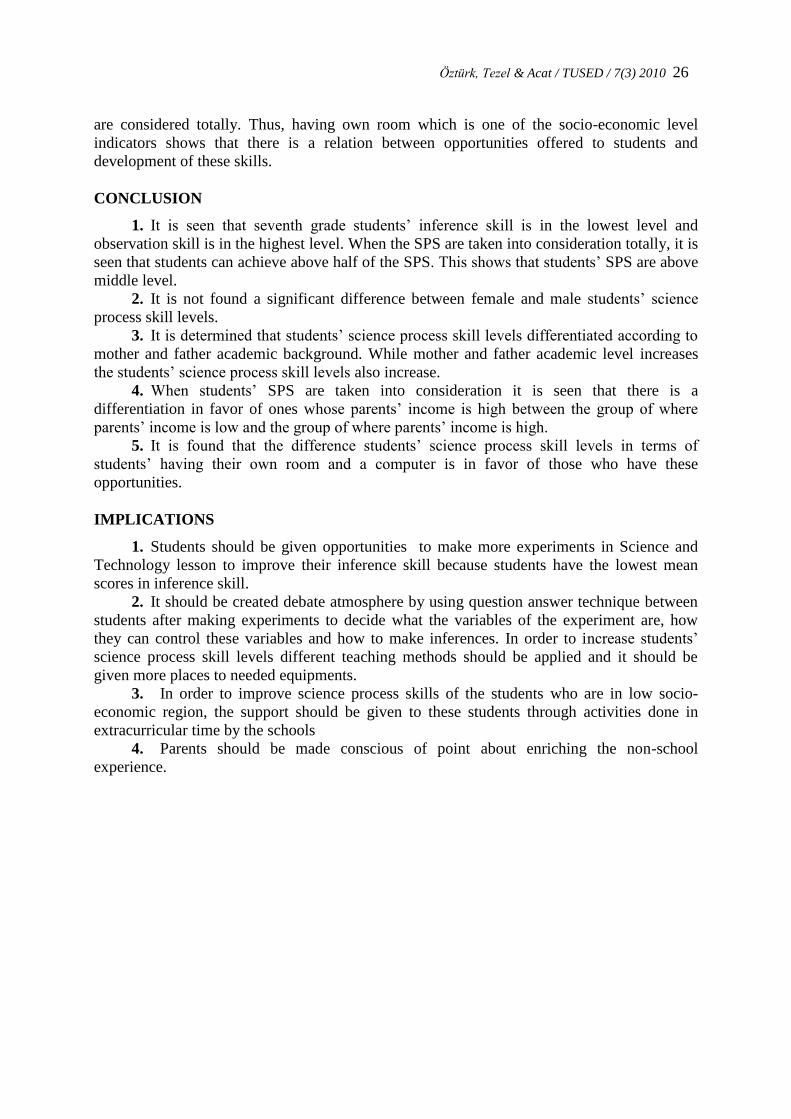
CONCLUSION
1. It is seen that seventh grade students’ inference skill is in the lowest level and
observation skill is in the highest level. When the SPS are taken into consideration totally, it is
seen that students can achieve above half of the SPS. This shows that students’ SPS are above
middle level.
2. It is not found a significant difference between female and male students’ science
process skill levels.
3. It is determined that students’ science process skill levels differentiated according to
mother and father academic background. While mother and father academic level increases
the students’ science process skill levels also increase.
4. When students’ SPS are taken into consideration it is seen that there is a
differentiation in favor of ones whose parents’ income is high between the group of where
parents’ income is low and the group of where parents’ income is high.
5. It is found that the difference students’ science process skill levels in terms of
students’ having their own room and a computer is in favor of those who have these
opportunities.
IMPLICATIONS
1. Students should be given opportunities to make more experiments in Science and
Technology lesson to improve their inference skill because students have the lowest mean
scores in inference skill.
2. It should be created debate atmosphere by using question answer technique between
students after making experiments to decide what the variables of the experiment are, how
they can control these variables and how to make inferences. In order to increase students’
science process skill levels different teaching methods should be applied and it should be
given more places to needed equipments.
3. In order to improve science process skills of the students who are in low socio-
economic region, the support should be given to these students through activities done in
extracurricular time by the schools
4. Parents should be made conscious of point about enriching the non-school
experience.

Öztürk, Tezel & Acat / TUSED / 7(3) 2010 27
REFERENCE
Arslan, A. (1995). İlkokul Öğrencilerinde Gözlenen Bilimsel Süreç Becerileri. Yayınlanmamış
Doktora Tezi, Hacettepe Üniversitesi Sosyal Bilimler Enstitüsü, Ankara. [Observed
Science Process Skills on the Primary Students. Unpublished Dissertation, Hacettepe
University Social Sciences Institute, Ankara].
Aydınlı, E. (2007). İlköğretim 6, 7 ve 8. Sınıf Öğrencilerinin Bilimsel Süreç Becerilerine
İlişkin Performanslarının Değerlendirilmesi. Yayınlanmamış Yüksek Lisans Tezi, Gazi
Üniversitesi Eğitim Bilimleri Enstitüsü, Ankara. [Evaluation of Science Process Skill
Study on the 6, 7 and 8. Students. Unpublished Master Thesis, Gazi University
Educational Sciences Institute, Ankara].
Başdağ, G. (2006). 2000 Yılı Fen Bilgisi Dersi ve 2004 Yılı Fen ve Teknoloji Dersi Öğretim
Programlarının Bilimsel Süreç Becerileri Yönünden Karşılaştırılması. Yayınlanmamış
Yüksek Lisans Tezi, Gazi Üniversitesi Eğitim Bilimleri Enstitüsü, Ankara. [Comparing
the Science and Technology Curriculum of the 2004 with the Science Curriculum of the
2000 with Regard to Scientific Process. Unpublished Master Thesis, Gazi University
Educational Sciences Institute, Ankara].
Aydoğdu, B. (2006). İlköğretim Fen ve Teknoloji Dersinde Bilimsel Süreç Becerilerini
Etkileyen Değişkenlerin Belirlenmesi. Yayınlanmamış Yüksek Lisans Tezi, Dokuz Eylül
Üniversitesi Eğitim Bilimleri Enstitüsü, İzmir. [Identification of variables effecting
Science Process Skills in Primary Science and Technology Course. Unpublished Master
Thesis, Dokuz Eylül University Educational Sciences Institute, İzmir].
Çepni, S., Ayas, A., Johnson, D. & Turgut, F. M. (1997). Fizik Öğretimi. Ankara: YÖK/
Dünya Bankası Milli Eğitimi Geliştirme Projesi, Hizmet Öncesi Öğretmen Eğitimi.
[Physics Teaching. Ankara: Turkish Council of Higher Education/ The World Bank
National Education Development Project, Pre-service Teacher Training].
Erdoğan, M.N. (2005). İlköğretim 7.Sınıf Öğrencilerinin Atomun Yapısı Konusundaki
Başarılarına, Kavramsal Değişimlerine, Bilimsel Süreç Becerilerine ve Fene Karşı
Tutumlarına Sorgulayıcı-Araştırmacı Yöntemin Etkisi. Yayınlanmamış Yüksek Lisans
Tezi, Gazi Üniversitesi Eğitim Bilimleri Enstitüsü, Ankara. [The Effects of Inquiry
Method on Middle School (level7) Students’ Achievement, Conceptual Change,
Scientific Process Skills and Attitude towards Science about the Atomic Structure.
Unpublished Master Thesis, Gazi University Educational Sciences Institute, Ankara].
Germann, P. J. (1994). Testing A Model of SPS Acquisition : An Interaction with Parents’
Education, Preffered Language, Gender, Science Attitude, Cognitive Development,
Academic Ability, and Biology Knowledge. Journal of Research in Science Teaching,
31, 7, 749-783.
MEB, (2006). Talim ve Terbiye Kurulu Başkanlığı. İlköğretim Fen ve Teknoloji Dersi (6,7 ve
8. Sınıflar) Öğretim Programı. Ankara: MEB Yayınları. [Board of Education Talim.
Primary School Science and Technology Lesson (6,7 ve 8. Classes) Teaching Program.
Ankara: NEM (National Education Directory) Publication].
Monhardt, L. & Monhardt, R. (2006). Creating a Context for the Learning of Science Process
Skills Through Picture Books. Early Childhood Education Journal, 34, 1, 67-71.
Padilla, M. J., & Okey, J. R. (1984). The Effects of Instruction on Integrated Science Process
Skill Achivement. Journal of Research in Science Teaching, 21, 3, 277-287.

Öztürk, Tezel & Acat / TUSED / 7(3) 2010 28
Tan, M. & Temiz, B. K. (2003). Fen Öğretiminde Temel Bilimsel Süreç Becerilerinin Yeri ve
Önemi. Pamukkale Üniversitesi Eğitim Fakültesi Dergisi 1, 13, 89-101. [Teaching
Scientific Process Skills in Science of Place and Importance. Pamukkale University
Education Faculty Journal 1, 13, 89-101].
Tatar, N. (2006). İlköğretim Fen Eğitiminde Araştırmaya Dayalı Öğrenme Yaklaşımının
Bilimsel Süreç Becerilerine, Akademik Başarıya ve Tutuma Etkisi. Yayınlanmamış
Doktora Tezi, Gazi Üniversitesi Eğitim Bilimleri Enstitüsü, Ankara. [The Effects of
Inquiry-Based Learning Approaches in the Education of Science in Primary School on
the Science Process Skills, Academic Achievements and Attitude. Unpublished
Dissertation, Gazi University Educational Sciences Institute, Ankara].
Temiz, B. K. & Tan M. (2003). İlköğretim Fen Öğretiminde Bütünleyici Bilimsel Süreç
Becerileri. Çağdaş Eğitim, 296, 34-40. [The Integrated Science Process Skills in
Elementary School Science Teaching. Modern Education, 296, 34-40].
Walters, Y.B. & Soyibo, K. (2001). An Analysis of High School Students’ Performence on
Five Integrated Science Process Skills. Research in Science & Technological Education.
19, 2, 133-145.
Yılmaz, F., (2005). İlköğretimde Bilimsel Tutum ve Davranışları Kazandırmada Fen Bilgisi
Dersinin Etkinliğine İlişkin Öğretmen Görüşleri. Yayınlanmamış Yüksek Lisans Tezi,
Anadolu Üniversitesi Eğitim Bilimleri Enstitüsü, Eskişehir. [Teachers’ Opinions
About the Effectiveness of Science Course to Have Students Acquire Scientific Attitude
and Behavior in Primary Education. Unpublished Master Thesis, Anadolu University
Educational Sciences Institute, Eskişehir].