Science Fair Project Information Bauder Elementary School
31
Science Fair Project Information Bauder Elementary School
-
Upload
khangminh22 -
Category
Documents
-
view
4 -
download
0
Transcript of Science Fair Project Information Bauder Elementary School

Science Fair Project InformationBauder Elementary School


If we just read about Science and DON’T DO Science, we will NOT have the learning experiences necessary to be
successful in Science.
Let’s Do A Science Project!

Why are we doing this????
1. Twenty-five percent (25%) of the 5th grade SSA (State Science Assessment) and MAP tests requires understanding of “the nature of science” standards.
2. Completing a science research project is a powerful and authentic way for students to internalize this knowledge and to practice the process skills of science.

Ways to Support Your Child…A Guide for Parents:
Begin your science project experience with a planning meeting.
This entire process should be fun. It is a great opportunity to spend time together doing something of educational value.
Budget more time for the project than you think you will need...then double it. *Use the project timeline (posted and given to your child) to pace your project.
Topic selection should be at the child’s level. Please keep in mind the final project choice should remain with the child.

Start With A Diary!
Remember, a science project is the diary –this is also part of the rubric
The board is simply the display
Record all information in the diary
The diary must be attached to the science fair project when the board is turned in
You may use the Inquiry Journal for your diary – this is also posted on the website

Rubric for ProjectThis rubric will be used for judging and overall grade:

Research QuestionA research question should be phrased
properly. It should reflect the student’s understanding of what he/she is testing.
When I change ______, what happens to ______?
Does ________ affect _________?
Example Questions:
Does the height of a ramp affect the distance a marble will roll in centimeters?
How does the weight (number of paperclips) of a paper airplane affect the time it stays in flight?

PredictionsThere are three ways an independent variable
(the one thing that changes) can affect the dependent variable (what you are measuring).
Example:1. The paperclips will increase
how long the paper airplane stays in flight.
2. The paperclips will decrease how long the paper airplane stays in flight.
3. The paperclips will have no affect on how long the paper airplane stays in flight.
Predictions must be worded in this format and the prediction MUST be marked of what you think will happen in the experiment. You will
comment about your prediction in your explanation.
Example:1. The height of the ramp will
increase how far a marble rolls down a ramp.
2. The height of the ramp will decrease how far a marble rolls down a ramp.
3. The height of the ramp will have no affect on how far a marble rolls down a ramp.

Independent Variable The one thing (or object) you
will change in the experiment.
Example:
I will CHANGE the height of the ramp to see how far a marble will roll.
I will CHANGE the weight of the paper airplane by adding paperclips to the airplane.

What will you measure in this investigation?
The dependent variable is ________.
Dependent Variable
Example:
I will MEASURE the distance the marble rolls down a ramp in centimeters.
I will MEASURE the time the paper airplane stays in flight using a stopwatch, measured in seconds.
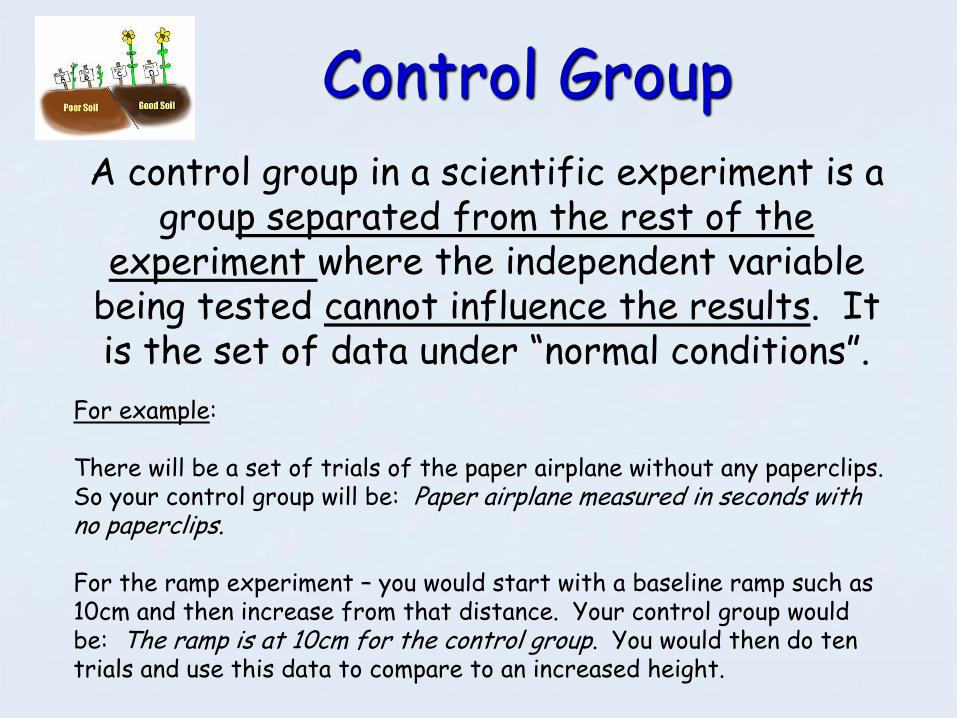
A control group in a scientific experiment is a group separated from the rest of the
experiment where the independent variable being tested cannot influence the results. It is the set of data under “normal conditions”.
Control Group
For example:
There will be a set of trials of the paper airplane without any paperclips. So your control group will be: Paper airplane measured in seconds with no paperclips.
For the ramp experiment – you would start with a baseline ramp such as 10cm and then increase from that distance. Your control group would be: The ramp is at 10cm for the control group. You would then do ten trials and use this data to compare to an increased height.

Set-Up ConditionsAlso known as the “Constants” these
are the things (materials & procedures) that will remain
constant to ensure the independent variable is the only thing being
tested.Example:If you decide to change only the amount of water given to the radish plant (Independent Variable), thenyou must keep everything else constant. These would include: Same temperature (How will temperature be the same?) Same soil type (specify soil type) Same soil amount (specify how much soil per cup or plant) Same amount of sunlight (How will sunlight be the same?) Same growing location (describe the location)

Materials ListThis is the list of items that will be used in the investigation. It
should be very specific and include the size, quantity, anddescriptions of each material needed so someone else could
duplicate your project.Example:
Water: 10mL in one cup, 20mL in one cup (amount used in watering daily) Seeds: 25 radish seeds in each cup Cup: 3-500mL, clear plastic cups

ProceduresThis is a step-by-step list of how to
set up the investigation and what you did (or how each item in your material list will be used) and the
exact order it was done.Be specific!
NON-EXAMPLE EXAMPLE
1. Water plants 1. gather materials necessary to conduct the experiment
2. Measure plants 2. measure and add 250mL of soil to each of the three sets of cups
3. Repeat steps 1 and 2 3. spread 25 radish seeds on top of the soil in each of the three sets of cups

Data Collection
This is an organized and complete account of everything that was measured and observed in the
experiment (using metric units). There should be at least 10 trials of
each variable and control group.
(Chart with the data that was measured in the experiment)

Trials (Increasing the number of trials will provide more valid data)
1 2 3 4 5 6 7 8 9 10 Avg
Control Group:
Group 1
Group 2
Independent
Variable
Data Collection ChartMake sure to record your data in metric units –
Centimeters, Meters, Milliliters etc…

GraphThis is a
mathematical picture of the data, using
averages (mean) to plot the data
in the experiment.

Results
Use the data and graphs (from the experiment) to explain what happened in the experiment. List at least three data results
for full rubric points. When writing the results statement, integrate mathematical terms such as twice as much, one-third as much, or no
significant difference.

Explanation
This statement explains whether your data supports your identified prediction. Does what you change (independent variable) affect what you measured (dependent variable)? Describe the affect. It is acceptable if your data does not support your prediction.
Be accurate and specific in your explanation
This is a summary of findings that evaluate the experimental procedure and provides scientific reason that supports experiment findings

Real World Uses
This is a description of the ways, places, or situations in which the information from
your experiment might be useful.List at least three
real-world uses to earn full rubric points.

Science Diary
The science diary (journal) is an ongoing record from day one that contains each phase of the scientific process along with anecdotal records of observations and further wonderings
Each page should contain the date and specific details of record keeping either in the form of summary statements, numbers or diagrams
You may use the Inquiry Journal for your diary – this is posted on the Bauder website

Research Question
Prediction
Independent
Variable
Dependent
Variable
Set Up
Conditions
Real World
Uses
Procedures Materials List
Diary
Data
Collection
Graph
Results
Explanations
Display Board OrganizationThis is just a sample of how the board will look – there is no certain
order for the board setup but must contain these components
Control Group
Materials List
Research Question
Independent
Variable
Dependent
Variable
Set Up Conditions
Real World Uses
Diary
Data
Collection
Graph
Results
Explanations
Control Group
Procedures
Prediction
picturespictures
Sample 1

Component HeadlinesYou can print out to be used on your board
Research Question Prediction
IndependentVariable
Dependent Variable
Control Group Set-up Conditions
Materials List Procedures
Data Collection Graph
Results Explanation
Real World Uses Science Diary

Do’s & Don'ts for your project Your project cannot display the following: No sharp object; glass;
food; liquid (including water); chemical; microbe; laser operation; unshielded wiring; temperature exceeding 70o C; loud or distracting sound; bright or distractive light; pressurized gas; unshielded belt, pulley, chain or moving part may be displayed. Pictures of these (except as prohibited in the regulations above) may be taken to document and explain what was done in the experiment.
No brand names of products
No vertebrate animal may be used in any way
No humans may be used as subjects of experimentation
No living organism is to be harmed in any way (plants excluded)
No drugs (including over the counter medications such as aspirin, cigarettes, alcohol) or substances that may be a safety/health hazard may be used
No microbes (mildew, mold, fungus, bacteria) may be cultured or used
No explosives of any type, including firecrackers and/or firearms, may be used
No burning of materials in an uncontrolled environment may be used

Do’s & Don'ts for your project Do NOT put your name on the front of the display board – it should
be on the back right hand corner (when board is closed) – a sticker will be provided by your child’s teacher
MAKE sure to average (mean) your data to use in the graph – you are NOT graphing every trial – only the AVERAGE of each trial
Make sure to use metric units when recording data
Make sure to have ALL component headings on the display board and attach the science diary to the board
Turn your board in ON TIME – points will be deducted each day it is late
Follow the science project timeline and rubric
Use the word “affect” instead of “effect” in your research question
Make sure your prediction is clearly marked (for example, circle it or put a star next to it)
Make sure your science diary is complete and reflects your experiment in detail

Sample QuestionsSuggestions from PCS Project Inquiry
Heat and Temperature:
• Does the temperature of the water affect how fast an Alka-Seltzer tablet will dissolve?
• Does the color of water affect the time it takes to freeze?
• Does the kind of water affect how long it takes to boil?
• Does the kind of water affect how quickly it will evaporate?
• Does the surface area of a container of water affect its evaporation rate?
• Does the depth of the water affect its evaporation rate?
• Does the temperature of water affect its evaporation rate?
• Does the kind of material used to insulate a refrigerated can of soda affect its temperature change?
• Does the color of a can affect its rate of temperature change when placed in the sun?
• Does the kind of soil (sand, gravel, clay) affect its temperature change in the sun?
• Does the color of a crayon affect its melting rate?
• Does the temperature of a tennis ball affect how high it bounces when dropped?
• Does the shape of an ice cube affect how slowly it melts?
• Does the mass of an ice cube affect how slowly it melts?
• Does temperature affect the density of a liquid?
• Does the temperature of water affect the height at which an object floats?

Sample QuestionsForce and Motion:
• Does the number of coils of wire in an electromagnet affect its magnetic strength?
• Does voltage affect the strength of an electromagnet?
• Does the weight of a permanent magnet affect its strength?
• Does the height of a ramp affect the distance a toy car will roll?
• Does the mass of a car affect the distance it will roll from the bottom of a ramp?
• Does the material that the ramp is made of affect the distance a toy car will roll?
• Does the distance a rubber band is stretched affect how far it will fly when released?
• Does the amount of weight suspended from a rubber band affect how far it stretches?
• Does the weight of a wooden block affect the force that it takes to drag it across a table top?
• Does the height from which a rubber ball is released affect the height that it bounces?
• Does the surface of the ground affect how far a ball will roll?
• Does the amount of air (pressure) in a basketball affect how high it bounces?
• Does the number of blades of a propeller affect how fast it will turn in the wind?
• Does the angle of a wing affect the amount of lift it develops in the wind?
• Does the number of pulleys affect the force necessary to lift a weight?
• Does the length of a lever (from the fulcrum) affect the force necessary to lift a weight?
• Does the length of a pendulum affect its period (time it takes to swing)?
• Does the weight of a pendulum affect its period (time that it takes to swing)?

Sample QuestionsPlants:
• Does the type of fertilizer affect the height that a bean plant grows?
• Does the amount of fertilizer affect the height that grass will grow?
• Does the kind of water affect the number of leaves on a Marigold plant?
• Does the size of a bean seed affect its germination rate?
• Does temperature affect the germination rate of bean seeds?
• Does the amount of sunlight affect the germination rate of radish seeds?
• Does the amount of moisture affect the germination rate of pepper seeds?
• Does temperature affect the height of petunias?
• Does classical music affect the height of tomato plants?
• Does the diameter of an apple affect the number of seeds inside?
• Does the circumference of a pumpkin affect the number of seeds inside?
• Does water drainage affect the height of sunflower plants?

Sample QuestionsEarth/Space and Environmental:
• Does the kind of soil affect the rate of water erosion?
• Does moisture affect the rate of decomposition in a compost pile?
• Does the slope of the surface affect the rate of water erosion?
• Does the kind of soil affect how much water it will hold (retain)?
• Does salt affect the freezing rate of water?
• Does wind speed affect the evaporation rate of water?
• Does the rotation of the earth (time of the day) affect the length of a shadow?
• Does the kind of water (fresh or salt) affect how long it takes an ice cube to melt?
• Does the velocity of the wind affect the height of waves?
• Does the direction of the wind affect the outdoor temperature?
• Does the velocity of the wind affect the timing (high and low) of the tides?
• Does barometric pressure affect the chance of rainfall?
• Does the phase of the moon affect the height of the tides?
• Does gravel affect the rate that sand erodes on a beach?

Bauder Website
http://www.bauder-es.pinellas.k12.fl.us/
Go to Academics – Click Science Fair