
Scheme Details as on February 26 2021
31
Scheme Details As on February 26, 2021
-
Upload
khangminh22 -
Category
Documents
-
view
0 -
download
0
Transcript of Scheme Details as on February 26 2021

Scheme Details As on February 26, 2021
1
Franklin India Bluechip Fund FIBCF
FUND MANAGER(S)Roshi Jain & Anand Radhakrishnan
VOLATILITY MEASURES (3 YEARS)Standard Deviation 6.58%Beta 0.96Sharpe Ratio* 0.29
* Annualised. Risk-free rate assumed to be 3.47% (FBIL OVERNIGHT MIBOR)
#EXPENSE RATIO#EXPENSE RATIO (DIRECT)
MINIMUM INVESTMENT/MULTIPLES FOR NEW INVESTORS
` 5000/1
ADDITIONAL INVESTMENT/MULTIPLES FOR EXISTING INVESTORS
` 1000/1
LOAD STRUCTURE
ENTRY LOAD NilEXIT LOAD (for each purchase of Units)
In respect of each purchase of Units - 1% ifthe Units areredeemed/switched-outwithin one year ofallotment
PORTFOLIO
Company Name No. ofshares
Market Value` Lakhs
% ofassets
Company Name No. ofshares
Market Value` Lakhs
% ofassets
As on February 26, 2021
NAV AS OF FEBRUARY 26, 2021
Franklin Templetonwww.franklintempletonindia.com
# The above ratio includes the GST on Investment Management Fees. The rates specified are the actual expenses charged as at the end of the month. The above ratio also includes, proportionate charge in respect sales beyond T-30 cities subject to maximum of 30 bps on daily net assets, wherever applicable.
FUND SIZE (AUM)
Month End ` 6020.90 crores
Monthly Average ` 6117.41 crores
: 1.91%: 1.18%
Auto
Bajaj Auto Ltd 250000 9496.75 1.58
Banks
ICICI Bank Ltd* 9500000 56786.25 9.43
State Bank of India* 14269231 55671.40 9.25
Axis Bank Ltd* 7500000 54360.00 9.03
HDFC Bank Ltd* 1900000 29153.60 4.84
Federal Bank Ltd 20000000 16710.00 2.78
Cement
ACC Ltd* 1250000 21665.00 3.60
Ultratech Cement Ltd 250000 15287.50 2.54
Grasim Industries Ltd 750000 9006.00 1.50
Ambuja Cements Ltd 3000000 8205.00 1.36
Construction Project
Larsen & Toubro Ltd* 2000000 28850.00 4.79
Consumer Non Durables
United Spirits Ltd 2000000 10702.00 1.78
Gas
GAIL (India) Ltd* 16000000 22688.00 3.77
Healthcare Services
Apollo Hospitals Enterprise Ltd 375000 11469.94 1.91
Non - Ferrous Metals
Hindalco Industries Ltd 2000000 6805.00 1.13
BENCHMARK
Nifty 100
INVESTMENT OBJECTIVEThe investment objective of the scheme is to generate long-term capital appreciation by actively managing a portfolio of equity and equity related securities. The Scheme will invest in a range of companies, with a bias towards large cap companies.
DATE OF ALLOTMENT
December 1, 1993
TURNOVER
Portfolio Turnover 33.57%
Product Label
This product is suitable for
investors who are seeking*:
• Long term capital
appreciation
• A fund that primarilyinvests in large-cap stocks
*Investors should consult their financial advisers if in doubt about whether the product is suitable for them.
TYPE OF SCHEME
Large-cap Fund- An open ended equity scheme predominantly investing in large cap stocks
* Top 10 holdings
Total Holdings 554,634.38 92.12
Call,cash and other current asset 47,455.42 7.88
Total Asset 602,089.80 100.00Growth Plan ` 602.6156Dividend Plan ` 40.6134Direct - Growth Plan ` 644.2604Direct - Dividend Plan ` 45.0053
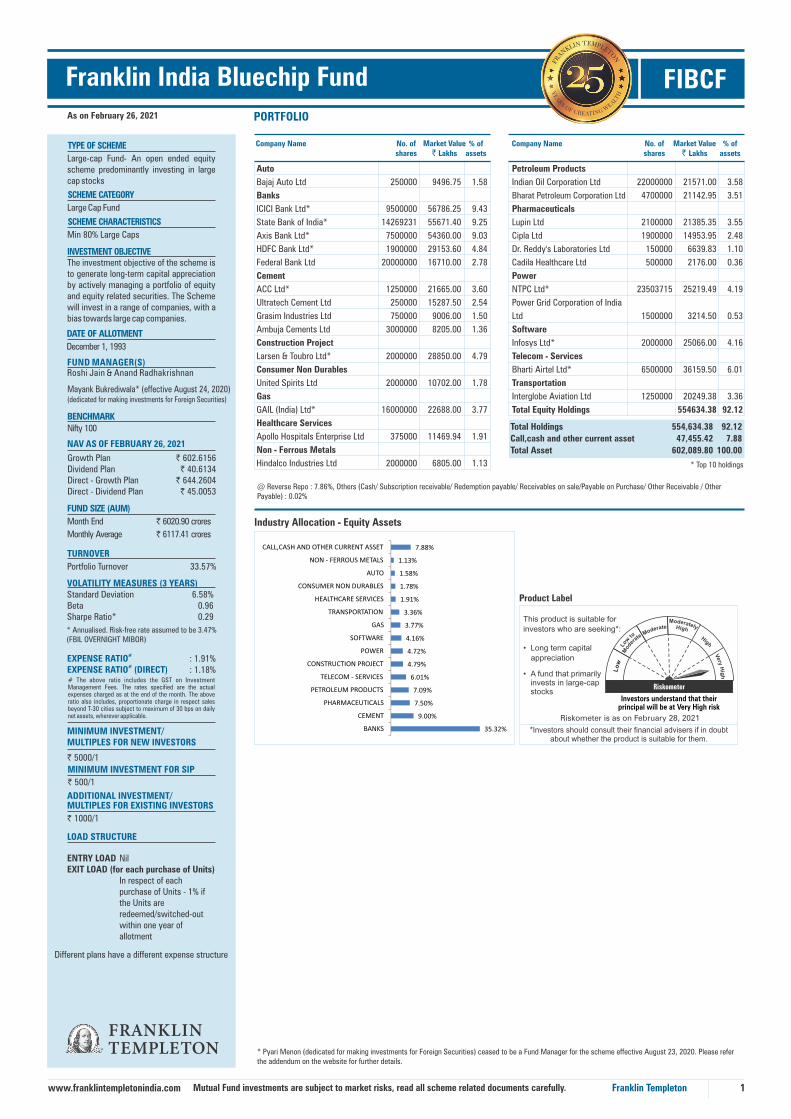
Industry Allocation - Equity Assets
Different plans have a different expense structure
SCHEME CATEGORY
Large Cap Fund
SCHEME CHARACTERISTICS
Min 80% Large Caps
MINIMUM INVESTMENT FOR SIP
` 500/1
Mutual Fund investments are subject to market risks, read all scheme related documents carefully.
@ Reverse Repo : 7.86%, Others (Cash/ Subscription receivable/ Redemption payable/ Receivables on sale/Payable on Purchase/ Other Receivable / Other Payable) : 0.02%
Mayank Bukrediwala* (effective August 24, 2020) (dedicated for making investments for Foreign Securities)
* Pyari Menon (dedicated for making investments for Foreign Securities) ceased to be a Fund Manager for the scheme effective August 23, 2020. Please refer the addendum on the website for further details.
Investors understand that their principal will be at Very High risk
Riskometer is as on February 28, 2021
Petroleum Products
Indian Oil Corporation Ltd 22000000 21571.00 3.58
Bharat Petroleum Corporation Ltd 4700000 21142.95 3.51
Pharmaceuticals
Lupin Ltd 2100000 21385.35 3.55
Cipla Ltd 1900000 14953.95 2.48
Dr. Reddy's Laboratories Ltd 150000 6639.83 1.10
Cadila Healthcare Ltd 500000 2176.00 0.36
Power
NTPC Ltd* 23503715 25219.49 4.19
Power Grid Corporation of India
Ltd 1500000 3214.50 0.53
Software
Infosys Ltd* 2000000 25066.00 4.16
Telecom - Services
Bharti Airtel Ltd* 6500000 36159.50 6.01
Transportation
Interglobe Aviation Ltd 1250000 20249.38 3.36
Total Equity Holdings 554634.38 92.12
35.32%
9.00%
7.50%
7.09%
6.01%
4.79%
4.72%
4.16%
3.77%
3.36%
1.91%
1.78%
1.58%
1.13%
7.88%
BANKS
CEMENT
PHARMACEUTICALS
PETROLEUM PRODUCTS
TELECOM - SERVICES
CONSTRUCTION PROJECT
POWER
SOFTWARE
GAS
TRANSPORTATION
HEALTHCARE SERVICES
CONSUMER NON DURABLES
AUTO
NON - FERROUS METALS
CALL,CASH AND OTHER CURRENT ASSET

2
Franklin India Flexi Cap Fund(Erstwhile Franklin India Equity Fund)
FIFCF
* Annualised. Risk-free rate assumed to be 3.47% (FBIL OVERNIGHT MIBOR)
PORTFOLIO
Company Name No. ofshares
Market Value` Lakhs
% ofassets
Company Name No. ofshares
Market Value` Lakhs
% ofassets
As on February 26, 2021
Franklin Templetonwww.franklintempletonindia.com
Auto Tata Motors Ltd* 10000000 32295.00 3.37Mahindra & Mahindra Ltd* 3000000 24192.00 2.52Tata Motors Ltd DVR 6000000 7722.00 0.81Banks HDFC Bank Ltd* 5000000 76720.00 8.00ICICI Bank Ltd* 11000000 65752.50 6.86Axis Bank Ltd* 8500000 61608.00 6.42State Bank of India* 10000000 39015.00 4.07Karur Vysya Bank Ltd 7000000 4175.50 0.44Cement Grasim Industries Ltd 1600000 19212.80 2.00ACC Ltd 720000 12479.04 1.30Ultratech Cement Ltd 130000 7949.50 0.83JK Lakshmi Cement Ltd 2100000 7845.60 0.82Construction Project Larsen & Toubro Ltd* 2900000 41832.50 4.36Consumer Durables Voltas Ltd 2200000 22399.30 2.34Bata India Ltd 326000 4688.53 0.49Consumer Non Durables United Breweries Ltd 1970000 22878.60 2.39United Spirits Ltd 3600000 19263.60 2.01Marico Ltd 4800000 19082.40 1.99Jyothy Labs Ltd 9200000 13694.20 1.43Finance Aditya Birla Capital Ltd 12000000 14838.00 1.55ICICI Prudential Life Insurance Co Ltd 3000000 13846.50 1.44Gas GAIL (India) Ltd 12000000 17016.00 1.77Healthcare Services Metropolis Healthcare Ltd 230000 4506.39 0.47Industrial Capital Goods Bharat Electronics Ltd 6000000 8226.00 0.86Industrial Products SKF India Ltd 403861 9013.37 0.94Finolex Industries Ltd 1000000 6131.00 0.64Media & Entertainment Jagran Prakashan Ltd 7000000 4179.00 0.44
Product Label
*Investors should consult their financial advisers if in doubtabout whether the product is suitable for them.
This product is suitable for investors who are seeking*:
• Long term capital appreciation
• Dynamic Investing in large, mid and small cap stocks
LOAD STRUCTURE
ENTRY LOAD NilEXIT LOAD (for each purchase of Units) In respect of each purchase of Units - 1% if the Units are redeemed/switched-out within one year of allotment
` 1000/1
ADDITIONAL INVESTMENT/MULTIPLES FOR EXISTING INVESTORS
` 5000/1
MINIMUM INVESTMENT/MULTIPLES FOR NEW INVESTORS
#EXPENSE RATIO #EXPENSE RATIO (DIRECT)
# The above ratio includes the GST on Investment Management Fees. The rates specified are the actual expenses charged as at the end of the month. The above ratio also includes, proportionate charge in respect sales beyond T-30 cities subject to maximum of 30 bps on daily net assets, wherever applicable.
TURNOVER
Portfolio Turnover 22.49%
NAV AS OF FEBRUARY 26, 2021
Growth Plan ` 768.5296Dividend Plan ` 43.3692Direct - Growth Plan ` 827.6261Direct - Dividend Plan ` 47.8204
FUND MANAGER(S)Anand Radhakrishnan, R. Janakiraman &
DATE OF ALLOTMENT
September 29, 1994
INVESTMENT OBJECTIVE
The investment objective of this scheme is to provide growth of capital plus regular dividend through a diversified portfolio of equities, fixed income securities and money market instruments.
FUND SIZE (AUM)
Month End ` 9590.37 crores
Monthly Average ̀ 9806.68 crores
VOLATILITY MEASURES (3 YEARS)Standard Deviation 6.73%Beta 0.96Sharpe Ratio* 0.27
TYPE OF SCHEME
Flexi cap Fund- An open-ended dynamic equity scheme investing across large, mid and small cap stocks
BENCHMARK
Nifty 500
Total Holdings 896,686.38 93.50
Call,cash and other current asset 62,351.05 6.50
Total Asset 959,037.43 100.00
Industry Allocation - Equity Assets
Different plans have a different expense structure
MINIMUM INVESTMENT FOR SIP
` 500/1
SCHEME CATEGORY
Flexi Cap Fund
SCHEME CHARACTERISTICSMin 65% Equity across Large, Mid & Small Caps
Mutual Fund investments are subject to market risks, read all scheme related documents carefully.
Paper Century Textile & Industries Ltd 1600000 7702.40 0.80Petroleum Products Hindustan Petroleum Corporation Ltd 8500000 20608.25 2.15Gulf Oil Lubricants India Ltd 1000000 7300.50 0.76Indian Oil Corporation Ltd 7000000 6863.50 0.72Pharmaceuticals Sun Pharmaceutical Industries Ltd 3000000 17838.00 1.86Lupin Ltd 1550000 15784.43 1.65Dr. Reddy's Laboratories Ltd 150000 6639.83 0.69Cadila Healthcare Ltd 1500000 6528.00 0.68Power NTPC Ltd* 22000000 23606.00 2.46Retailing Aditya Birla Fashion and Retail Ltd 12000000 22032.00 2.30Arvind Fashions Ltd 2800000 4407.20 0.46Aditya Birla Fashion and Retail Ltd- Partly Paid 1344155 1937.60 0.20Arvind Fashions Ltd - Rights Entitlements ## 413663 92.66 0.01Software Infosys Ltd* 5300000 66424.90 6.93HCL Technologies Ltd 2500000 22736.25 2.37Tech Mahindra Ltd 1900000 17458.15 1.82JustDial Ltd 243720 1741.26 0.18Telecom - Services Bharti Airtel Ltd* 11000000 61193.00 6.38Transportation Gujarat Pipavav Port Ltd 5288295 5230.12 0.55Unlisted Numero Uno International Ltd 73500 0.01 0.00**Quantum Information Systems 45000 0.00 0.00**Quantum Information Services 38000 0.00 0.00**Total Equity Holdings 896686.38 93.50
* Top 10 holdings** Less than 0.01
@ Reverse Repo : 6.48%, Others (Cash/ Subscription receivable/ Redemption payable/ Receivables on sale/Payable on Purchase/ Other Receivable / Other Payable) : 0.02%
: 1.83%: 1.08%
Mayank Bukrediwala* (effective August 24, 2020) (dedicated for making investments for Foreign Securities)
The scheme has undergone a fundamental attribute change with effect from January 29, 2021. Please read the addendum on our website for further details.
* Pyari Menon (dedicated for making investments for Foreign Securities) ceased to be a Fund Manager for the scheme effective August 23, 2020. Please refer the addendum on the website for further details.
Investors understand that their principal will be at Very High risk
Riskometer is as on February 28, 2021
## Suspended Security
25.78%
11.30%
7.81%
6.70%
6.38%
4.95%
4.88%
4.36%
3.63%
2.99%
2.97%
2.82%
2.46%
1.77%
1.58%
0.86%
0.80%
0.55%
0.47%
0.44%
0.00%
6.50%
BANKS
SOFTWARE
CONSUMER NON DURABLES
AUTO
TELECOM - SERVICES
CEMENT
PHARMACEUTICALS
CONSTRUCTION PROJECT
PETROLEUM PRODUCTS
FINANCE
RETAILING
CONSUMER DURABLES
POWER
GAS
INDUSTRIAL PRODUCTS
INDUSTRIAL CAPITAL GOODS
PAPER
TRANSPORTATION
HEALTHCARE SERVICES
MEDIA & ENTERTAINMENT
UNLISTED
CALL,CASH AND OTHER CURRENT ASSET
Industrial Products Mahindra CIE Automotive Ltd 2493349 4505.48 1.78SKF India Ltd 90000 2008.62 0.79Finolex Cables Ltd 360275 1406.33 0.56Media & Entertainment Jagran Prakashan Ltd 1656994 989.23 0.39Non - Ferrous Metals National Aluminium Co Ltd 3050843 1830.51 0.72Petroleum Products Indian Oil Corporation Ltd 3938381 3861.58 1.53Hindustan Petroleum Corporation Ltd 525067 1273.02 0.50Pharmaceuticals Cadila Healthcare Ltd 1052564 4580.76 1.81Lupin Ltd 311893 3176.16 1.26Dr. Reddy's Laboratories Ltd 67295 2978.85 1.18Power Tata Power Co Ltd* 13377483 12728.68 5.03NHPC Ltd 18217899 4399.62 1.74Retailing Aditya Birla Fashion and Retail Ltd 805716 1479.29 0.59Aditya Birla Fashion and Retail Ltd- Partly Paid 94174 135.75 0.05Software Infosys Ltd* 1729339 21673.81 8.57Tech Mahindra Ltd 283932 2608.91 1.03Telecom - Services Bharti Airtel Ltd* 1433873 7976.64 3.15Textile Products K.P.R. Mill Ltd 417110 3863.90 1.53Himatsingka Seide Ltd 656332 1020.60 0.40Transportation Container Corporation Of India Ltd 441969 2465.52 0.98Total Equity Holdings 247653.92 97.95
3
Franklin India Equity Advantage Fund FIEAFPORTFOLIOAs on February 26, 2021
Franklin Templetonwww.franklintempletonindia.com
This product is suitable for
investors who are seeking*:
• Long term capital appreciation
• A fund that primarily invests in large and mid-cap stocks
Product Label
*Investors should consult their financial advisers if in doubt about whether the product is suitable for them.
* Annualised. Risk-free rate assumed to be 3.47% (FBIL OVERNIGHT MIBOR)
LOAD STRUCTURE
ENTRY LOAD NilEXIT LOAD (for each purchase of Units) In respect of each purchase of Units - 1% if the Units are redeemed/switched-out within one year of allotment
#EXPENSE RATIO #EXPENSE RATIO (DIRECT)
# The above ratio includes the GST on Investment Management Fees. The rates specified are the actual expenses charged as at the end of the month. The above ratio also includes, proportionate charge in respect sales beyond T-30 cities subject to maximum of 30 bps on daily net assets, wherever applicable.
ADDITIONAL INVESTMENT/MULTIPLES FOR EXISTING INVESTORS
` 1000/1
MINIMUM INVESTMENT/MULTIPLES FOR NEW INVESTORS
` 5000/1
TURNOVER
Portfolio Turnover 26.18%
NAV AS OF FEBRUARY 26, 2021
Growth Plan ` 99.2429Dividend Plan ` 17.3976Direct - Growth Plan ` 105.5662Direct - Dividend Plan ` 18.9681
FUND MANAGER(S)Lakshmikanth Reddy, R. Janakiraman &
DATE OF ALLOTMENT
March 2, 2005
INVESTMENT OBJECTIVE
To provide medium to long-term capital appreciation by investing primarily in Large and Mid-cap stocks
VOLATILITY MEASURES (3 YEARS)Standard Deviation 7.55%Beta 0.96Sharpe Ratio* 0.17
FUND SIZE (AUM)
Month End ` 2528.49 crores
Monthly Average ` 2551.78 crores
TYPE OF SCHEME
Large & Mid-cap Fund- An open ended equity scheme investing in both large cap and mid cap stocks
BENCHMARK
Nifty LargeMidcap 250 (effective February 11, 2019)
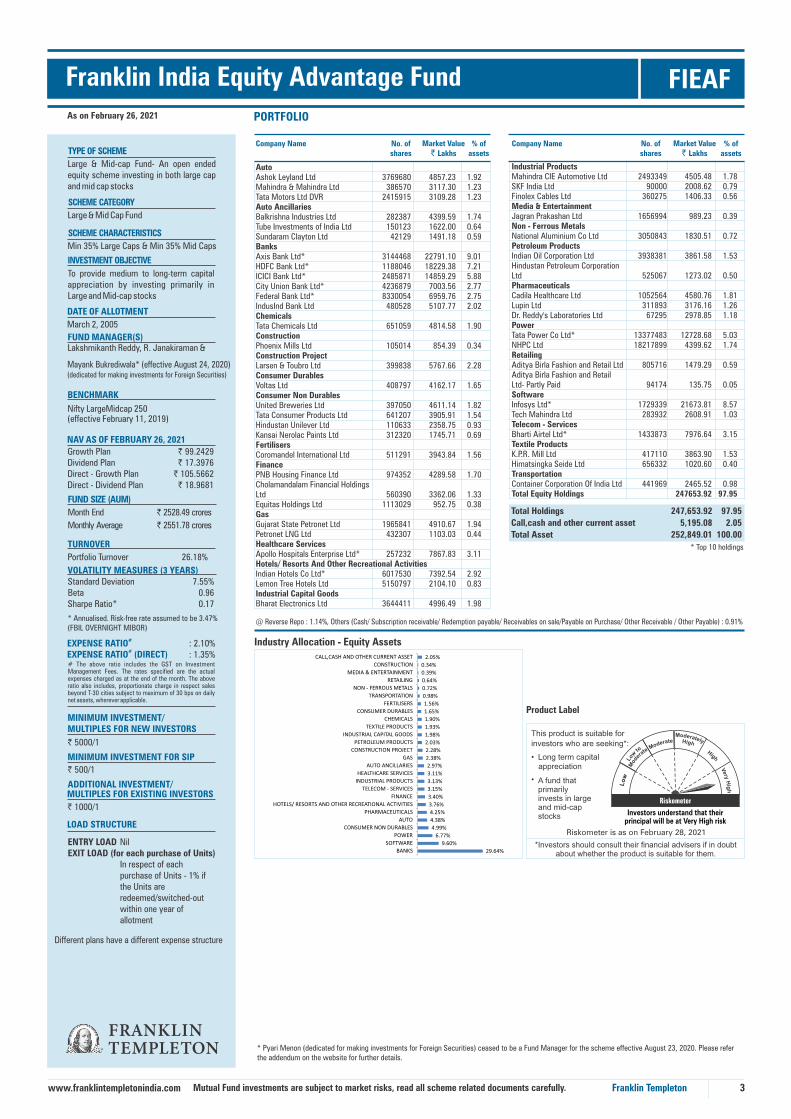
Industry Allocation - Equity Assets
Different plans have a different expense structure
SCHEME CATEGORY
Large & Mid Cap Fund
SCHEME CHARACTERISTICS
Min 35% Large Caps & Min 35% Mid Caps
MINIMUM INVESTMENT FOR SIP
` 500/1
Mutual Fund investments are subject to market risks, read all scheme related documents carefully.
@ Reverse Repo : 1.14%, Others (Cash/ Subscription receivable/ Redemption payable/ Receivables on sale/Payable on Purchase/ Other Receivable / Other Payable) : 0.91%
Company Name No. ofshares
Market Value` Lakhs
% ofassets
Company Name No. ofshares
Market Value` Lakhs
% ofassets
Auto Ashok Leyland Ltd 3769680 4857.23 1.92Mahindra & Mahindra Ltd 386570 3117.30 1.23Tata Motors Ltd DVR 2415915 3109.28 1.23Auto Ancillaries Balkrishna Industries Ltd 282387 4399.59 1.74Tube Investments of India Ltd 150123 1622.00 0.64Sundaram Clayton Ltd 42129 1491.18 0.59Banks Axis Bank Ltd* 3144468 22791.10 9.01HDFC Bank Ltd* 1188046 18229.38 7.21ICICI Bank Ltd* 2485871 14859.29 5.88City Union Bank Ltd* 4236879 7003.56 2.77Federal Bank Ltd* 8330054 6959.76 2.75IndusInd Bank Ltd 480528 5107.77 2.02Chemicals Tata Chemicals Ltd 651059 4814.58 1.90Construction Phoenix Mills Ltd 105014 854.39 0.34Construction Project Larsen & Toubro Ltd 399838 5767.66 2.28Consumer Durables Voltas Ltd 408797 4162.17 1.65Consumer Non Durables United Breweries Ltd 397050 4611.14 1.82Tata Consumer Products Ltd 641207 3905.91 1.54Hindustan Unilever Ltd 110633 2358.75 0.93Kansai Nerolac Paints Ltd 312320 1745.71 0.69Fertilisers Coromandel International Ltd 511291 3943.84 1.56Finance PNB Housing Finance Ltd 974352 4289.58 1.70Cholamandalam Financial Holdings Ltd 560390 3362.06 1.33Equitas Holdings Ltd 1113029 952.75 0.38Gas Gujarat State Petronet Ltd 1965841 4910.67 1.94Petronet LNG Ltd 432307 1103.03 0.44Healthcare Services Apollo Hospitals Enterprise Ltd* 257232 7867.83 3.11Hotels/ Resorts And Other Recreational Activities Indian Hotels Co Ltd* 6017530 7392.54 2.92Lemon Tree Hotels Ltd 5150797 2104.10 0.83Industrial Capital Goods Bharat Electronics Ltd 3644411 4996.49 1.98
: 2.10%: 1.35%
Mayank Bukrediwala* (effective August 24, 2020) (dedicated for making investments for Foreign Securities)
* Pyari Menon (dedicated for making investments for Foreign Securities) ceased to be a Fund Manager for the scheme effective August 23, 2020. Please refer the addendum on the website for further details.
Investors understand that their principal will be at Very High risk
Riskometer is as on February 28, 2021
Total Holdings 247,653.92 97.95
Call,cash and other current asset 5,195.08 2.05
Total Asset 252,849.01 100.00
* Top 10 holdings
29.64%
9.60%
6.77%
4.99%
4.38%
4.25%
3.76%
3.40%
3.15%
3.13%
3.11%
2.97%
2.38%
2.28%
2.03%
1.98%
1.93%
1.90%
1.65%
1.56%
0.98%
0.72%
0.64%
0.39%
0.34%
2.05%
BANKS
SOFTWARE
POWER
CONSUMER NON DURABLES
AUTO
PHARMACEUTICALS
HOTELS/ RESORTS AND OTHER RECREATIONAL ACTIVITIES
FINANCE
TELECOM - SERVICES
INDUSTRIAL PRODUCTS
HEALTHCARE SERVICES
AUTO ANCILLARIES
GAS
CONSTRUCTION PROJECT
PETROLEUM PRODUCTS
INDUSTRIAL CAPITAL GOODS
TEXTILE PRODUCTS
CHEMICALS
CONSUMER DURABLES
FERTILISERS
TRANSPORTATION
NON - FERROUS METALS
RETAILING
MEDIA & ENTERTAINMENT
CONSTRUCTION
CALL,CASH AND OTHER CURRENT ASSET

Industrial Products Mahindra CIE Automotive Ltd 2627584 4748.04 1.08Finolex Cables Ltd 990217 3865.31 0.88Media & Entertainment Jagran Prakashan Ltd 3057159 1825.12 0.41Non - Ferrous Metals Hindalco Industries Ltd* 4049242 13777.55 3.13Petroleum Products Hindustan Petroleum Corporation Ltd 2520962 6112.07 1.39Indian Oil Corporation Ltd 5948967 5832.96 1.32Pharmaceuticals Dr. Reddy's Laboratories Ltd 127107 5626.45 1.28Lupin Ltd 503898 5131.45 1.16Cadila Healthcare Ltd 720735 3136.64 0.71Power Tata Power Co Ltd* 20624428 19624.14 4.45Power Grid Corporation of India Ltd* 8119223 17399.49 3.95NTPC Ltd 3977486 4267.84 0.97Retailing Aditya Birla Fashion and Retail Ltd 1075124 1973.93 0.45Aditya Birla Fashion and Retail Ltd- Partly Paid 125663 181.14 0.04Software Infosys Ltd* 2778479 34822.68 7.90Tech Mahindra Ltd 530548 4874.94 1.11Tata Consultancy Services Ltd 148117 4286.95 0.97Cyient Ltd 381063 2486.25 0.56Telecom - Services Bharti Airtel Ltd* 2294619 12764.97 2.90Textile Products Himatsingka Seide Ltd 1278633 1988.27 0.45Unlisted Globsyn Technologies Ltd 30000 0.00 0.00**Quantum Information Services 3500 0.00 0.00**Numero Uno International Ltd 2900 0.00 0.00**Total Equity Holdings 430358.98 97.65
FITPORTFOLIO
Company Name No. ofshares
Market Value` Lakhs
% ofassets
Company Name No. ofshares
Market Value` Lakhs
% ofassets
4
Franklin India TaxshieldAs on February 26, 2021
Franklin Templetonwww.franklintempletonindia.com
Product Label
*Investors should consult their financial advisers if in doubt about whether the product is suitable for them.
This product is suitable for investors who are seeking*:
Long term capital appreciation
An ELSS fund offering tax benefits under Section 80C of the Income Tax Act
* Annualised. Risk-free rate assumed to be 3.47% (FBIL OVERNIGHT MIBOR)
INVESTMENT OBJECTIVEThe primary objective for Franklin India Taxshield is to provide medium to long term growth of capital along with income tax rebate.
TURNOVER
Portfolio Turnover 26.77%
VOLATILITY MEASURES (3 YEARS)Standard Deviation 6.93% Beta 0.99Sharpe Ratio* 0.21
#EXPENSE RATIO #EXPENSE RATIO (DIRECT)
# The above ratio includes the GST on Investment Management Fees. The rates specified are the actual expenses charged as at the end of the month. The above ratio also includes, proportionate charge in respect sales beyond T-30 cities subject to maximum of 30 bps on daily net assets, wherever applicable.
MINIMUM INVESTMENT/MULTIPLES FOR NEW INVESTORS
` 500/500
ADDITIONAL INVESTMENT/MULTIPLES FOR EXISTING INVESTORS
` 500/500
LOAD STRUCTURE
ENTRY LOAD NilEXIT LOAD (for each purchase of Units) NilDifferent plans have a different expense structure
TAX BENEFITS
LOCK-IN-PERIOD
Growth Plan ` 697.8475Dividend Plan ` 42.7327Direct - Growth Plan ` 750.4978Direct - Dividend Plan ` 47.4708
NAV AS OF FEBRUARY 26, 2021
FUND MANAGER(S)
Lakshmikanth Reddy & R. Janakiraman
DATE OF ALLOTMENT
April 10, 1999
FUND SIZE (AUM)
Month End ` 4407.05 crores
Monthly Average ` 4475.69 crores
TYPE OF SCHEME
An Open-End Equity Linked Savings Scheme
BENCHMARKNifty 500
Total Holdings 430,358.98 97.65
Call,cash and other current asset 10,346.25 2.35
Total Asset 440,705.22 100.00
Industry Allocation - Equity Assets
Scheme specific risk factors: All investments in Franklin India Taxshield are subject to a lock-in-period of 3 years from the date of respective allotment and the unit holders cannot redeem, transfer, assign or pledge the units during this period. The Trustee, AMC, their directors of their employees shall not be liable for any of the tax consequences that may arise, in the event that the equity Linked Saving Scheme is wound up before the completion of the lock-in period. Investors are requested to review the prospectus carefully and obtain expert professional advice with regard to specific legal, tax and financial implications of the investment/participation in the scheme
Auto Mahindra & Mahindra Ltd 1029699 8303.49 1.88Tata Motors Ltd 1546634 4994.85 1.13Bajaj Auto Ltd 87369 3318.89 0.75Tata Motors Ltd DVR 1791828 2306.08 0.52Auto Ancillaries Balkrishna Industries Ltd 302972 4720.30 1.07Banks Axis Bank Ltd* 5829842 42254.69 9.59HDFC Bank Ltd* 2280104 34985.92 7.94ICICI Bank Ltd* 4283052 25601.94 5.81Kotak Mahindra Bank Ltd* 699652 12456.25 2.83State Bank of India 1935519 7551.43 1.71City Union Bank Ltd 3914508 6470.68 1.47IndusInd Bank Ltd 605270 6433.72 1.46Federal Bank Ltd 3293517 2751.73 0.62Cement Grasim Industries Ltd 881440 10584.33 2.40Construction Prestige Estates Projects Ltd 771008 2298.37 0.52Construction Project Larsen & Toubro Ltd* 757133 10921.64 2.48Consumer Durables Voltas Ltd 300000 3054.45 0.69Consumer Non Durables United Breweries Ltd 871834 10125.04 2.30United Spirits Ltd 896279 4795.99 1.09Hindustan Unilever Ltd 206440 4401.40 1.00Kansai Nerolac Paints Ltd 607174 3393.80 0.77Ferrous Metals Tata Steel Ltd 960704 6870.47 1.56Finance Housing Development Finance Corporation Ltd 268692 6823.16 1.55Cholamandalam Financial Holdings Ltd 1115794 6694.21 1.52PNB Housing Finance Ltd 1158898 5102.05 1.16Equitas Holdings Ltd 1695647 1451.47 0.33Gas Gujarat State Petronet Ltd 3795176 9480.35 2.15Petronet LNG Ltd 3078627 7855.12 1.78GAIL (India) Ltd 2792178 3959.31 0.90Hotels/ Resorts And Other Recreational Activities Indian Hotels Co Ltd 6223868 7646.02 1.73Lemon Tree Hotels Ltd 6320734 2582.02 0.59Industrial Capital Goods Bharat Electronics Ltd 3970503 5443.56 1.24
SCHEME CATEGORY
ELSS
SCHEME CHARACTERISTICS
Min 80% Equity with a statutory lock in of 3 years & tax benefit
MINIMUM INVESTMENT FOR SIP
` 500/500
Mutual Fund investments are subject to market risks, read all scheme related documents carefully.
•
•
@ Reverse Repo : 2.65%, Others (Cash/ Subscription receivable/ Redemption payable/ Receivables on sale/Payable on Purchase/ Other Receivable / Other Payable) : -0.30%
* Top 10 holdings** Less than 0.01
: 1.91%: 1.04%
Investors understand that their principal will be at Very High risk
Riskometer is as on February 28, 2021
31.43%10.54%
9.37%5.15%4.83%4.55%4.29%
3.15%3.13%2.90%2.71%2.48%2.40%2.32%1.95%1.56%1.24%1.07%0.69%0.52%0.49%0.45%0.41%0.00%
2.35%
BANKSSOFTWARE
POWERCONSUMER NON DURABLES
GASFINANCE
AUTOPHARMACEUTICALS
NON - FERROUS METALSTELECOM - SERVICES
PETROLEUM PRODUCTSCONSTRUCTION PROJECT
CEMENTHOTELS/ RESORTS AND OTHER RECREATIONAL ACTIVITIES
INDUSTRIAL PRODUCTSFERROUS METALS
INDUSTRIAL CAPITAL GOODSAUTO ANCILLARIES
CONSUMER DURABLESCONSTRUCTION
RETAILINGTEXTILE PRODUCTS
MEDIA & ENTERTAINMENTUNLISTED
CALL,CASH AND OTHER CURRENT ASSET

Franklin India Focused Equity Fund FIFEFPORTFOLIO
Company Name No. ofshares
Market Value` Lakhs
% ofassets
Company Name No. ofshares
Market Value` Lakhs
% ofassets
5
As on February 26, 2021
Franklin Templetonwww.franklintempletonindia.com
This product is suitable for investors who are seeking*:
• Long term capital appreciation
• A fund that invests in stocks of companies / sectors with high growth rates or above average potential
Product Label
*Investors should consult their financial advisers if in doubt about whether the product is suitable for them.
* Annualised. Risk-free rate assumed to be 3.47% (FBIL OVERNIGHT MIBOR)
ENTRY LOAD NilEXIT LOAD (for each purchase of Units) 1% if redeemed/switched- out within one year of allotment.
INVESTMENT OBJECTIVEAn open-end focused equity fund that seeks to achieve capital appreciation through investing predominantly in Indian companies/sectors with high growth rates or potential.
DATE OF ALLOTMENT
July 26, 2007
FUND MANAGER(S)Roshi Jain, Anand Radhakrishnan &
#EXPENSE RATIO #EXPENSE RATIO (DIRECT)
# The above ratio includes the GST on Investment Management Fees. The rates specified are the actual expenses charged as at the end of the month. The above ratio also includes, proportionate charge in respect sales beyond T-30 cities subject to maximum of 30 bps on daily net assets, wherever applicable.
LOAD STRUCTURE
ADDITIONAL INVESTMENT/MULTIPLES FOR EXISTING INVESTORS
` 1000/1
MINIMUM INVESTMENT/MULTIPLES FOR NEW INVESTORS
` 5000/1
NAV AS OF FEBRUARY 26, 2021
Growth Plan ` 53.2971Dividend Plan ` 26.7828Direct - Growth Plan ` 57.9435Direct - Dividend Plan ` 30.0835
TURNOVER
Portfolio Turnover 32.35%
VOLATILITY MEASURES (3 YEARS)Standard Deviation 7.32%Beta 1.01Sharpe Ratio* 0.28
FUND SIZE (AUM)
Month End ` 8028.71 crores
Monthly Average ` 8143.44 crores
TYPE OF SCHEME
An open ended equity scheme investing in maximum 30 stocks. The scheme intends to focus on Multi-cap space
BENCHMARK
Nifty 500 Total Holdings 750,091.55 93.43
Call,cash and other current asset 52,779.61 6.57
Total Asset 802,871.16 100.00
Industry Allocation - Equity Assets
Different plans have a different expense structure
SCHEME CATEGORY
Focused Fund
SCHEME CHARACTERISTICS
Max 30 Stocks, Min 65% Equity, Focus on Multi-Cap
MINIMUM INVESTMENT FOR SIP
` 500/1
Mutual Fund investments are subject to market risks, read all scheme related documents carefully.
Aerospace & Defense
Hindustan Aeronautics Ltd 300000 3261.15 0.41
Banks
State Bank of India* 21769231 84932.65 10.58
ICICI Bank Ltd* 12400000 74121.00 9.23
Axis Bank Ltd* 10000000 72480.00 9.03
Federal Bank Ltd* 40000000 33420.00 4.16
HDFC Bank Ltd* 2000000 30688.00 3.82
Cement
ACC Ltd 1500000 25998.00 3.24
JK Lakshmi Cement Ltd 4800000 17932.80 2.23
Ultratech Cement Ltd 260000 15899.00 1.98
Orient Cement Ltd 16000000 14688.00 1.83
Construction
Sobha Ltd 4800000 21088.80 2.63
Somany Ceramics Ltd 3100000 13545.45 1.69
ITD Cementation India Ltd 15000000 11595.00 1.44
Construction Project
Larsen & Toubro Ltd* 2300000 33177.50 4.13
Consumer Non Durables
United Spirits Ltd 1000000 5351.00 0.67
Gas
GAIL (India) Ltd 21000000 29778.00 3.71
Healthcare Services
Apollo Hospitals Enterprise Ltd 425000 12999.26 1.62
Industrial Products
KEI Industries Ltd 4000000 20008.00 2.49
Petroleum Products
Bharat Petroleum Corporation Ltd* 8700000 39136.95 4.87
Indian Oil Corporation Ltd* 31000000 30395.50 3.79
Pharmaceuticals
Lupin Ltd 2700000 27495.45 3.42
Cipla Ltd 2500000 19676.25 2.45
Power
NTPC Ltd* 32000000 34336.00 4.28
Software
Infosys Ltd 200000 2506.60 0.31
Telecom - Services
Bharti Airtel Ltd* 9000000 50067.00 6.24
Transportation
Interglobe Aviation Ltd 1500000 24299.25 3.03
Spicejet Ltd 1469972 1214.93 0.15
Total Equity Holdings 750091.55 93.43
* Top 10 holdings
@ Reverse Repo : 6.51%, Others (Cash/ Subscription receivable/ Redemption payable/ Receivables on sale/Payable on Purchase/ Other Receivable / Other Payable) : 0.06%
: 1.86%: 1.00%
Mayank Bukrediwala* (effective August 24, 2020) (dedicated for making investments for Foreign Securities)
* Pyari Menon (dedicated for making investments for Foreign Securities) ceased to be a Fund Manager for the scheme effective August 23, 2020. Please refer the addendum on the website for further details.
Investors understand that their principal will be at Very High risk
Riskometer is as on February 28, 2021
36.82%
9.28%
8.66%
6.24%
5.88%
5.76%
4.28%
4.13%
3.71%
3.18%
2.49%
1.62%
0.67%
0.41%
0.31%
6.57%
BANKS
CEMENT
PETROLEUM PRODUCTS
TELECOM - SERVICES
PHARMACEUTICALS
CONSTRUCTION
POWER
CONSTRUCTION PROJECT
GAS
TRANSPORTATION
INDUSTRIAL PRODUCTS
HEALTHCARE SERVICES
CONSUMER NON DURABLES
AEROSPACE & DEFENSE
SOFTWARE
CALL,CASH AND OTHER CURRENT ASSET
6
Templeton India Value Fund TIVF
* Annualised. Risk-free rate assumed to be 3.47% (FBIL OVERNIGHT MIBOR)
LOAD STRUCTURE
ENTRY LOAD NilEXIT LOAD (for each purchase of Units) In respect of each purchase of Units - 1% if the Units are redeemed/switched-out within one year of allotment
PORTFOLIO
Company Name No. ofshares
Market Value` Lakhs
% ofassets
Company Name No. ofshares
Market Value` Lakhs
% ofassets
As on February 26, 2021
Franklin Templetonwww.franklintempletonindia.com
Minerals/Mining
Coal India Ltd 800000 1217.60 2.34
Oil
Oil & Natural Gas Corporation Ltd 1300000 1443.00 2.78
Paper
Century Textile & Industries Ltd 130000 625.82 1.21
Petroleum Products
Indian Oil Corporation Ltd 1200000 1176.60 2.27
Bharat Petroleum Corporation Ltd 200000 899.70 1.73
Gulf Oil Lubricants India Ltd 56246 410.62 0.79
Power
NTPC Ltd* 1900000 2038.70 3.93
Power Grid Corporation of India Ltd 500000 1071.50 2.06
Software
Infosys Ltd* 180000 2255.94 4.34
Tech Mahindra Ltd 100000 918.85 1.77
HCL Technologies Ltd 50000 454.73 0.88
Telecom - Services
Bharti Airtel Ltd* 400000 2225.20 4.28
Textile Products
Himatsingka Seide Ltd 300000 466.50 0.90
Total Equity Holdings 48240.89 92.89
Auto
Tata Motors Ltd DVR* 2300000 2960.10 5.70
Mahindra & Mahindra Ltd* 200000 1612.80 3.11
Auto Ancillaries
Bosch Ltd 7000 1039.84 2.00
Sundaram Clayton Ltd 22219 786.45 1.51
Banks
ICICI Bank Ltd* 750000 4483.13 8.63
State Bank of India* 1100000 4291.65 8.26
Axis Bank Ltd* 385000 2790.48 5.37
HDFC Bank Ltd* 150000 2301.60 4.43
Federal Bank Ltd 1500000 1253.25 2.41
Cement
Grasim Industries Ltd* 190000 2281.52 4.39
ACC Ltd 30000 519.96 1.00
Chemicals
Tata Chemicals Ltd 100000 739.50 1.42
Consumer Non Durables
ITC Ltd 600000 1223.10 2.36
Finance
PNB Housing Finance Ltd 200000 880.50 1.70
Equitas Holdings Ltd 800000 684.80 1.32
Gas
Gujarat State Petronet Ltd 550000 1373.90 2.65
GAIL (India) Ltd 800000 1134.40 2.18
Industrial Capital Goods
Bharat Electronics Ltd 1100000 1508.10 2.90
Industrial Products
Finolex Cables Ltd 300000 1171.05 2.25
Product Label
This product is suitable for investors who are seeking*:
• Long term capital appreciation
• An equity fund that follows value investment strategy
*Investors should consult their financial advisers if in doubt about whether the product is suitable for them.
ADDITIONAL INVESTMENT/MULTIPLES FOR EXISTING INVESTORS
` 1000/1
MINIMUM INVESTMENT/MULTIPLES FOR NEW INVESTORS
` 5000/1
#EXPENSE RATIO #EXPENSE RATIO (DIRECT)
# The above ratio includes the GST on Investment Management Fees. The rates specified are the actual expenses charged as at the end of the month. The above ratio also includes, proportionate charge in respect sales beyond T-30 cities subject to maximum of 30 bps on daily net assets, wherever applicable.
VOLATILITY MEASURES (3 YEARS)Standard Deviation 7.83%Beta 1.09Sharpe Ratio* 0.09
TURNOVER
Portfolio Turnover 40.34%
FUND MANAGER(S)
Anand Radhakrishnan & Lakshmikanth Reddy
DATE OF ALLOTMENT
September 10, 1996
INVESTMENT OBJECTIVE
The Investment objective of the scheme is to provide long-term capital appreciation to its Unitholders by following a value investment strategy
NAV AS OF FEBRUARY 26, 2021
Growth Plan ` 319.4631Dividend Plan ` 64.0799Direct - Growth Plan ` 339.5654Direct - Dividend Plan ` 69.8268
FUND SIZE (AUM)
Month End ` 519.33 crores
Monthly Average ` 520.06 crores
TYPE OF SCHEME
An open ended equity scheme following a value investment strategy
BENCHMARK
S&P BSE 500
(effective February 11, 2019)
* Top 10 holdings
Total Holdings 48,240.89 92.89
Call,cash and other current asset 3,692.47 7.11
Total Asset 51,933.36 100.00
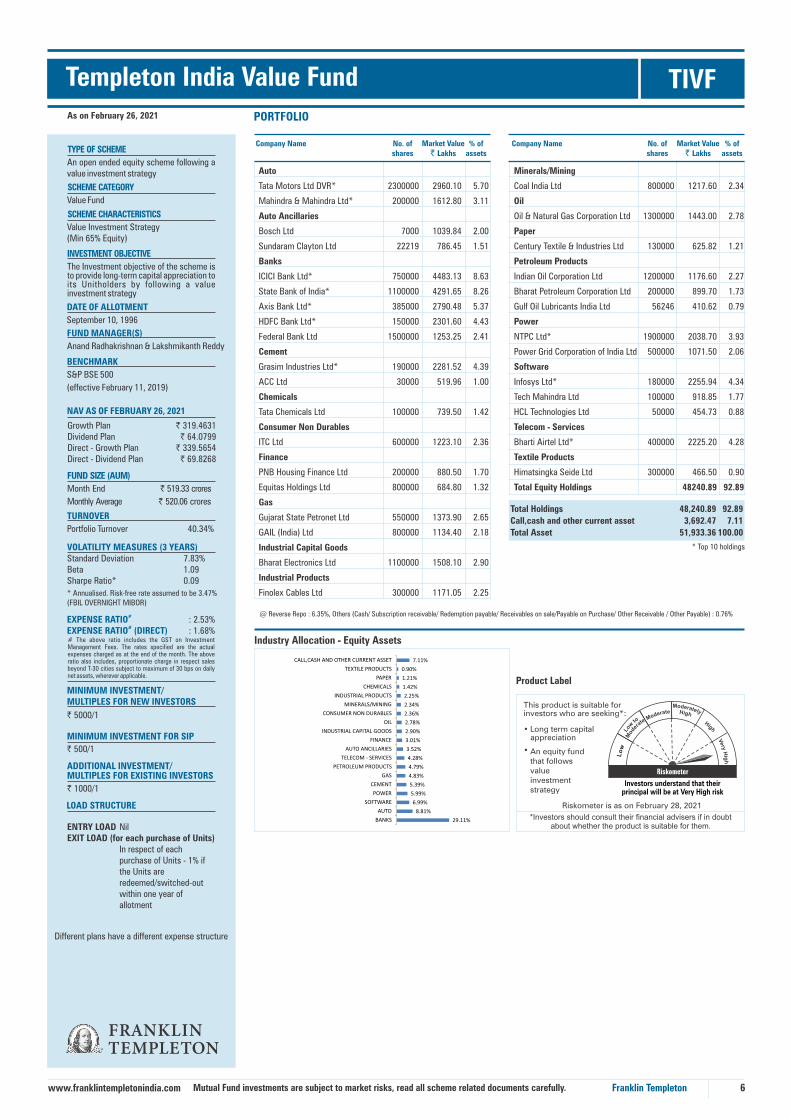
Industry Allocation - Equity Assets
Different plans have a different expense structure
SCHEME CATEGORY
Value Fund
SCHEME CHARACTERISTICS
Value Investment Strategy (Min 65% Equity)
MINIMUM INVESTMENT FOR SIP
` 500/1
Mutual Fund investments are subject to market risks, read all scheme related documents carefully.
@ Reverse Repo : 6.35%, Others (Cash/ Subscription receivable/ Redemption payable/ Receivables on sale/Payable on Purchase/ Other Receivable / Other Payable) : 0.76%: 2.53%: 1.68%
Investors understand that their principal will be at Very High risk
Riskometer is as on February 28, 2021
29.11%
8.81%
6.99%
5.99%
5.39%
4.83%
4.79%
4.28%
3.52%
3.01%
2.90%
2.78%
2.36%
2.34%
2.25%
1.42%
1.21%
0.90%
7.11%
BANKS
AUTO
SOFTWARE
POWER
CEMENT
GAS
PETROLEUM PRODUCTS
TELECOM - SERVICES
AUTO ANCILLARIES
FINANCE
INDUSTRIAL CAPITAL GOODS
OIL
CONSUMER NON DURABLES
MINERALS/MINING
INDUSTRIAL PRODUCTS
CHEMICALS
PAPER
TEXTILE PRODUCTS
CALL,CASH AND OTHER CURRENT ASSET

Templeton India Equity Income Fund TIEIFPORTFOLIO
* Annualised. Risk-free rate assumed to be 3.47% (FBIL OVERNIGHT MIBOR)
MINIMUM INVESTMENT/MULTIPLES FOR NEW INVESTORS
` 5000/1
ADDITIONAL INVESTMENT/MULTIPLES FOR EXISTING INVESTORS` 1000/1
LOAD STRUCTURE
ENTRY LOAD NilEXIT LOAD (for each purchase of Units) In respect of each purchase of Units - 1% if the Units are redeemed/switched-out within one year of allotment
7
As on February 26, 2021
Franklin Templetonwww.franklintempletonindia.com
VOLATILITY MEASURES (3 YEARS)Standard Deviation 5.96%Beta 1.03Sharpe Ratio* 0.28
TURNOVER
Portfolio Turnover 19.66%
#EXPENSE RATIO #EXPENSE RATIO (DIRECT)
# The above ratio includes the GST on Investment Management Fees. The rates specified are the actual expenses charged as at the end of the month. The above ratio also includes, proportionate charge in respect sales beyond T-30 cities subject to maximum of 30 bps on daily net assets, wherever applicable.
FUND MANAGER(S)
Lakshmikanth Reddy & Anand Radhakrishnan
DATE OF ALLOTMENT
May 18, 2006
INVESTMENT OBJECTIVEThe Scheme seeks to provide a combination of regular income and long-term capital appreciation by investing primarily in stocks that have a current or potentially attractive dividend yield, by using a value strategy.
Product Label
This product is suitable for investors who are seeking*:
• Long term capital appreciation
•
*Investors should consult their financial advisers if in doubt about whether the product is suitable for them.
FUND SIZE (AUM)Month End ` 992.75 croresMonthly Average ` 987.76 crores
TYPE OF SCHEME
A n o p e n e n d e d e q u i t y s c h e m e predominantly investing in dividend yielding stocks
Growth Plan ` 62.0007Dividend Plan ` 17.0253Direct - Growth Plan ` 65.5628Direct - Dividend Plan ` 18.3710
NAV AS OF FEBRUARY 26, 2021
BENCHMARK
Nifty Dividend Opportunities 50 (effective February 11, 2019)
Industry Allocation - Equity Assets
Different plans have a different expense structure
MINIMUM INVESTMENT FOR SIP
` 500/1
SCHEME CATEGORY
Dividend Yield Fund
SCHEME CHARACTERISTICS
Predominantly Dividend Yielding Stocks (Min 65% Equity)
Mutual Fund investments are subject to market risks, read all scheme related documents carefully.
@ Reverse Repo : 2.01%, Others (Cash/ Subscription receivable/ Redemption payable/ Receivables on sale/Payable on Purchase/ Other Receivable / Other Payable) : 1.75%
Hindustan Petroleum Corporation Ltd 339633 823.44 0.83Pharmaceuticals Dr. Reddy's Laboratories Ltd 20000 885.31 0.89Power Power Grid Corporation of India Ltd* 3009054 6448.40 6.50Tata Power Co Ltd* 6297866 5992.42 6.04NTPC Ltd* 3291938 3532.25 3.56NHPC Ltd* 14497327 3501.10 3.53CESC Ltd 100000 605.70 0.61Semiconductors Novatek Microelectronics Corp. Ltd (Taiwan) 187038 2336.37 2.35Software Infosys Ltd* 775444 9718.64 9.79Tata Consultancy Services Ltd 81194 2350.00 2.37Travelsky Technology Ltd, H (Hong Kong) 633055 1173.94 1.18Tech Mahindra Ltd 121952 1120.56 1.13Cyient Ltd 119545 779.97 0.79Textile Products K.P.R. Mill Ltd 178656 1654.98 1.67Himatsingka Seide Ltd 439349 683.19 0.69Textiles - Cotton Vardhman Textiles Ltd 136944 1621.35 1.63Transportation Redington (India) Ltd* 1436293 2628.42 2.65Aramex PJSC (UAE) 2562198 1988.39 2.00Total Equity Holdings 92180.68 92.85Real Estate Investment Trusts Embassy Office Parks REIT* 933400 2993.13 3.01Brookfield India Real Estate Trust 151600 373.07 0.38Total Real Estate Investment Trusts 3366.21 3.39
Company Name No. ofshares
Market Value` Lakhs
% ofassets
Company Name No. ofshares
Market Value` Lakhs
% ofassets
Total Holdings 95,546.89 96.24
Call,cash and other current asset 3,728.16 3.76
Total Asset 99,275.04 100.00
Auto Ashok Leyland Ltd 1239545 1597.15 1.61Mahindra & Mahindra Ltd 155566 1254.48 1.26Tata Motors Ltd DVR 658906 848.01 0.85Auto Ancillaries Sundaram Clayton Ltd 46395 1642.17 1.65Mahle-Metal Leve SA (Brazil) 200000 476.32 0.48Banks Federal Bank Ltd 1505600 1257.93 1.27Cement J.K. Cement Ltd 51875 1394.45 1.40Grasim Industries Ltd 114691 1377.21 1.39Dalmia Bharat Ltd 40800 585.95 0.59Chemicals Tata Chemicals Ltd 254134 1879.32 1.89Consumer Durables Xtep International Holdings Ltd (Hong Kong) 3297307 1155.45 1.16Consumer Non Durables Unilever PLC, (ADR)* 86900 3435.41 3.46Tata Consumer Products Ltd 401912 2448.25 2.47Hindustan Unilever Ltd 88206 1880.60 1.89Colgate Palmolive (India) Ltd 64045 1012.68 1.02Finance Tata Investment Corporation Ltd* 234585 2603.31 2.62Equitas Holdings Ltd 1505501 1288.71 1.30Fanhua Inc, (ADR) 25000 258.24 0.26Gas Petronet LNG Ltd 803388 2049.84 2.06Gujarat State Petronet Ltd 624255 1559.39 1.57GAIL (India) Ltd 621258 880.94 0.89Hardware Primax Electronics Ltd (Taiwan) 500000 803.77 0.81Industrial Capital Goods Xinyi Solar Holdings Ltd (Hong Kong) 1575983 2432.93 2.45Bharat Electronics Ltd 821499 1126.28 1.13Industrial Products Finolex Industries Ltd* 419757 2573.53 2.59Minerals/Mining Coal India Ltd 1247000 1897.93 1.91NMDC Ltd 709254 900.75 0.91Non - Ferrous Metals National Aluminium Co Ltd 3209748 1925.85 1.94Oil Oil & Natural Gas Corporation Ltd 753071 835.91 0.84Petroleum Products Indian Oil Corporation Ltd 972460 953.50 0.96
* Top 10 holdings
: 2.35%: 1.59%
Mayank Bukrediwala* (effective August 24, 2020) (dedicated for making investments for Foreign Securities)
* Pyari Menon (dedicated for making investments for Foreign Securities) ceased to be a Fund Manager for the scheme effective August 23, 2020. Please refer the addendum on the website for further details.
Investors understand that their principal will be at Very High risk
Riskometer is as on February 28, 2021
A fund that focuses on Indian and emerging market stocks that have a current or potentially attractive dividend yield, by using a value strategy
20.23%15.25%
8.84%4.65%4.52%4.18%3.73%3.59%3.39%3.38%2.82%2.59%2.36%2.35%2.13%1.94%1.89%1.79%1.63%1.27%1.16%0.89%0.84%0.81%
3.76%
POWERSOFTWARE
CONSUMER NON DURABLESTRANSPORTATION
GASFINANCE
AUTOINDUSTRIAL CAPITAL GOODS
REAL ESTATE INVESTMENT TRUSTSCEMENT
MINERALS/MININGINDUSTRIAL PRODUCTS
TEXTILE PRODUCTSSEMICONDUCTORSAUTO ANCILLARIES
NON - FERROUS METALSCHEMICALS
PETROLEUM PRODUCTSTEXTILES - COTTON
BANKSCONSUMER DURABLES
PHARMACEUTICALSOIL
HARDWARECALL,CASH AND OTHER CURRENT ASSET

8
Franklin India Prima Fund FIPFPORTFOLIOAs on February 26, 2021
Franklin Templetonwww.franklintempletonindia.com
This product is suitable for investors who are seeking*:
• Long term capital appreciation
• A fund that primarily invests in mid-cap stocks
Product Label
*Investors should consult their financial advisers if in doubt about whether the product is suitable for them.
* Annualised. Risk-free rate assumed to be 3.47% (FBIL OVERNIGHT MIBOR)
LOAD STRUCTURE
ENTRY LOAD NilEXIT LOAD (for each purchase of Units) In respect of each purchase of Units - 1% if the Units are redeemed/switched-out within one year of allotment
ADDITIONAL INVESTMENT/MULTIPLES FOR EXISTING INVESTORS
` 1000/1
MINIMUM INVESTMENT/MULTIPLES FOR NEW INVESTORS
` 5000/1
#EXPENSE RATIO #EXPENSE RATIO (DIRECT)
# The above ratio includes the GST on Investment Management Fees. The rates specified are the actual expenses charged as at the end of the month. The above ratio also includes, proportionate charge in respect sales beyond T-30 cities subject to maximum of 30 bps on daily net assets, wherever applicable.
VOLATILITY MEASURES (3 YEARS)Standard Deviation 7.13%Beta 0.84Sharpe Ratio* 0.20
INVESTMENT OBJECTIVE
The investment objective of Prima Fund is to provide medium to longterm capital appreciation as a primary objective and income as a secondary objective.
TURNOVER
Portfolio Turnover 26.88%
NAV AS OF FEBRUARY 26, 2021
Growth Plan ̀ 1251.5600Dividend Plan ` 65.6992Direct - Growth Plan ` 1357.3466Direct - Dividend Plan ` 74.0169
FUND MANAGER(S)R. Janakiraman, Hari Shyamsunder &
DATE OF ALLOTMENT
December 1, 1993
FUND SIZE (AUM)
Month End ` 7395.67 crores
Monthly Average ` 7402.48 crores
TYPE OF SCHEME
Mid-cap Fund- An open ended equity scheme predominantly investing in mid cap stocks
BENCHMARK
Industry Allocation - Equity Assets
Nifty Midcap 150
Different plans have a different expense structure
SCHEME CATEGORY
Mid Cap Fund
SCHEME CHARACTERISTICS
Min 65% Mid Caps
MINIMUM INVESTMENT FOR SIP
` 500/1
Mutual Fund investments are subject to market risks, read all scheme related documents carefully.
@ Reverse Repo : 2.05%, Others (Cash/ Subscription receivable/ Redemption payable/ Receivables on sale/Payable on Purchase/ Other Receivable / Other Payable) : -0.03%
Auto
Ashok Leyland Ltd* 16789858 21633.73 2.93
TVS Motor Co Ltd 1763341 10487.47 1.42
Auto Ancillaries
Balkrishna Industries Ltd 1061879 16544.07 2.24
Sundram Fasteners Ltd 1950821 13983.48 1.89
Apollo Tyres Ltd 5610107 13021.06 1.76
Bosch Ltd 68736 10210.66 1.38
Banks
HDFC Bank Ltd* 1858877 28522.61 3.86
ICICI Bank Ltd* 4592911 27454.13 3.71
City Union Bank Ltd* 13060416 21588.87 2.92
Federal Bank Ltd* 23869927 19943.32 2.70
Kotak Mahindra Bank Ltd 1085442 19324.67 2.61
RBL Bank Ltd 5234341 12332.11 1.67
Karur Vysya Bank Ltd 12530441 7474.41 1.01
Cement
The Ramco Cements Ltd* 2918543 28261.71 3.82
J.K. Cement Ltd 607739 16336.63 2.21
Chemicals
Deepak Nitrite Ltd 1125123 15399.00 2.08
Aarti Industries Ltd 1206117 14895.54 2.01
Atul Ltd 39595 2597.21 0.35
Construction
Oberoi Realty Ltd 2606125 14219.02 1.92
Kajaria Ceramics Ltd 968720 9174.26 1.24
Phoenix Mills Ltd 821062 6680.16 0.90
Consumer Durables
Crompton Greaves Consumer
Electricals Ltd* 7341052 28274.06 3.82
Voltas Ltd* 2622087 26696.78 3.61
Consumer Non Durables
Kansai Nerolac Paints Ltd* 4023612 22489.98 3.04
Tata Consumer Products Ltd 2435553 14836.17 2.01
Emami Ltd 3166673 14414.70 1.95
Fertilisers
Coromandel International Ltd 1586228 12235.37 1.65
Finance
Sundaram Finance Ltd 699058 18504.41 2.50
Cholamandalam Financial
Holdings Ltd 2871672 17228.60 2.33
Equitas Holdings Ltd 11253507 9633.00 1.30
Total Holdings 724,613.06 97.98Call,cash and other current asset 14,953.51 2.02Total Asset 739,566.57 100.00
* Top 10 holdings** Less than 0.01
Company Name No. ofshares
Market Value
` Lakhs
% ofassets
Company Name No. ofshares
Market Value
` Lakhs
% ofassets
: 1.87%
: 1.06%
Mayank Bukrediwala* (effective August 24, 2020) (dedicated for making investments for Foreign Securities)
* Pyari Menon (dedicated for making investments for Foreign Securities) ceased to be a Fund Manager for the scheme effective August 23, 2020. Please refer the addendum on the website for further details.
Investors understand that their principal will be at Very High risk
Riskometer is as on February 28, 2021
Gas
Gujarat State Petronet Ltd 5451482 13617.80 1.84
Healthcare Services
Apollo Hospitals Enterprise Ltd 537865 16451.41 2.22
Metropolis Healthcare Ltd 432925 8482.30 1.15
Hotels/ Resorts And Other Recreational Activities
Indian Hotels Co Ltd 12640848 15529.28 2.10
Industrial Capital Goods
Bharat Electronics Ltd 11687252 16023.22 2.17
Industrial Products
Finolex Cables Ltd 3745052 14618.81 1.98
Schaeffler India Ltd 239692 12447.33 1.68
AIA Engineering Ltd 408622 7433.86 1.01
EPL Ltd 2553763 5480.38 0.74
Bharat Forge Ltd 758421 4626.75 0.63
SKF India Ltd 114773 2561.50 0.35
Pesticides
PI Industries Ltd 511704 11140.31 1.51
Petroleum Products
Bharat Petroleum Corporation
Ltd 3864460 17384.27 2.35
Pharmaceuticals
IPCA Laboratories Ltd 595458 11013.29 1.49
Retailing
Trent Ltd 2131049 17232.73 2.33
Aditya Birla Fashion and
Retail Ltd 4468223 8203.66 1.11
Aditya Birla Fashion and
Retail Ltd- Partly Paid 387844 559.08 0.08
Software
Info Edge (India) Ltd* 458016 22490.19 3.04
Mphasis Ltd 855954 14096.71 1.91
Transportation
Container Corporation Of India
Ltd 1940126 10822.99 1.46
Unlisted
Numero Uno International Ltd 8100 0.00 0.00**
Total Equity Holdings 724613.06 97.98
18.48%7.43%7.27%7.00%
6.38%6.13%6.03%
4.95%4.45%4.34%4.07%
3.51%3.37%
2.35%2.17%2.10%1.84%1.65%1.51%1.49%1.46%
0.00%2.02%
BANKSCONSUMER DURABLES
AUTO ANCILLARIESCONSUMER NON DURABLES
INDUSTRIAL PRODUCTSFINANCECEMENT
SOFTWARECHEMICALS
AUTOCONSTRUCTION
RETAILINGHEALTHCARE SERVICES
PETROLEUM PRODUCTSINDUSTRIAL CAPITAL GOODS
HOTELS/ RESORTS AND OTHER RECREATIONAL ACTIVITIESGAS
FERTILISERSPESTICIDES
PHARMACEUTICALSTRANSPORTATION
UNLISTEDCALL,CASH AND OTHER CURRENT ASSET
FISCFPORTFOLIO
9
Franklin India Smaller Companies Fund As on February 26, 2021
Franklin Templetonwww.franklintempletonindia.com
Product Label
*Investors should consult their financial advisers if in doubt about whether the product is suitable for them.
This product is suitable for investors who are seeking*:
• Long term capital appreciation
• A fund that invests primarily in small cap stocks
* Annualised. Risk-free rate assumed to be 3.47% (FBIL OVERNIGHT MIBOR)
TURNOVER
Portfolio Turnover 22.93%
LOAD STRUCTURE
ENTRY LOAD NilEXIT LOAD (for each purchase of Units) 1% if the Units are redeemed/switched-out within one year of allotment
ADDITIONAL INVESTMENT/MULTIPLES FOR EXISTING INVESTORS
` 1000/1
MINIMUM INVESTMENT/MULTIPLES FOR NEW INVESTORS
` 5000/1
#EXPENSE RATIO #EXPENSE RATIO (DIRECT)
# The above ratio includes the GST on Investment Management Fees. The rates specified are the actual expenses charged as at the end of the month. The above ratio also includes, proportionate charge in respect sales beyond T-30 cities subject to maximum of 30 bps on daily net assets, wherever applicable.
VOLATILITY MEASURES (3 YEARS)Standard Deviation 8.03%Beta 0.83Sharpe Ratio* -0.02
FUND MANAGER(S)R. Janakiraman, Hari Shyamsunder &
DATE OF ALLOTMENTJanuary 13, 2006 (Launched as a closed end scheme, the scheme was converted into an open end scheme effective January 14, 2011).
INVESTMENT OBJECTIVEThe Fund seeks to provide long-term cap i ta l apprec iat ion by invest ing predominantly in small cap companies
Growth Plan ` 66.4934Dividend Plan ` 26.6906Direct - Growth Plan ` 72.5363Direct - Dividend Plan ` 30.1622
NAV AS OF FEBRUARY 26, 2021
FUND SIZE (AUM)
Month End ` 6360.09 crores
Monthly Average ` 6308.58 crores
TYPE OF SCHEME
Small-cap Fund- An open ended equity scheme predominantly investing in small cap stocks
BENCHMARK
Nifty Smallcap 250
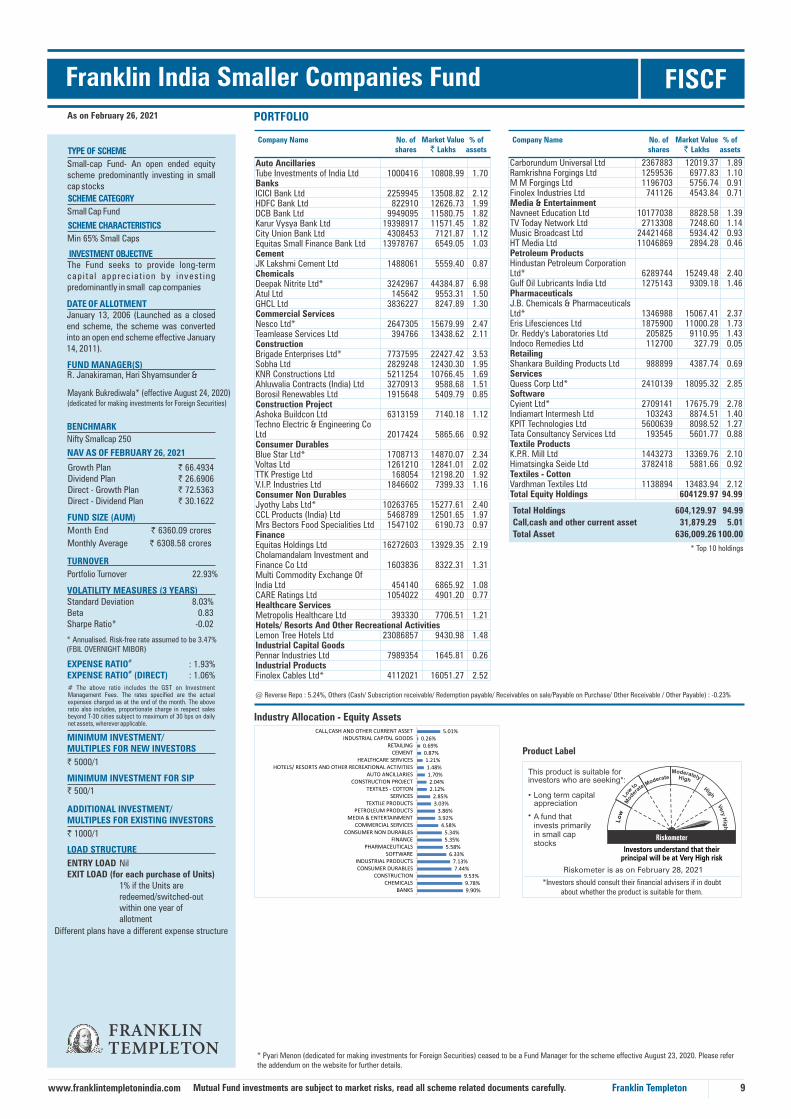
Industry Allocation - Equity Assets
Different plans have a different expense structure
SCHEME CATEGORY
Small Cap Fund
SCHEME CHARACTERISTICS
Min 65% Small Caps
MINIMUM INVESTMENT FOR SIP
` 500/1
Mutual Fund investments are subject to market risks, read all scheme related documents carefully.
@ Reverse Repo : 5.24%, Others (Cash/ Subscription receivable/ Redemption payable/ Receivables on sale/Payable on Purchase/ Other Receivable / Other Payable) : -0.23%
Company Name No. ofshares
Market Value` Lakhs
% ofassets
Company Name No. ofshares
Market Value` Lakhs
% ofassets
Auto Ancillaries Tube Investments of India Ltd 1000416 10808.99 1.70Banks ICICI Bank Ltd 2259945 13508.82 2.12HDFC Bank Ltd 822910 12626.73 1.99DCB Bank Ltd 9949095 11580.75 1.82Karur Vysya Bank Ltd 19398917 11571.45 1.82City Union Bank Ltd 4308453 7121.87 1.12Equitas Small Finance Bank Ltd 13978767 6549.05 1.03Cement JK Lakshmi Cement Ltd 1488061 5559.40 0.87Chemicals Deepak Nitrite Ltd* 3242967 44384.87 6.98Atul Ltd 145642 9553.31 1.50GHCL Ltd 3836227 8247.89 1.30Commercial Services Nesco Ltd* 2647305 15679.99 2.47Teamlease Services Ltd 394766 13438.62 2.11Construction Brigade Enterprises Ltd* 7737595 22427.42 3.53Sobha Ltd 2829248 12430.30 1.95KNR Constructions Ltd 5211254 10766.45 1.69Ahluwalia Contracts (India) Ltd 3270913 9588.68 1.51Borosil Renewables Ltd 1915648 5409.79 0.85Construction Project Ashoka Buildcon Ltd 6313159 7140.18 1.12Techno Electric & Engineering Co Ltd 2017424 5865.66 0.92Consumer Durables Blue Star Ltd* 1708713 14870.07 2.34Voltas Ltd 1261210 12841.01 2.02TTK Prestige Ltd 168054 12198.20 1.92V.I.P. Industries Ltd 1846602 7399.33 1.16Consumer Non Durables Jyothy Labs Ltd* 10263765 15277.61 2.40CCL Products (India) Ltd 5468789 12501.65 1.97Mrs Bectors Food Specialities Ltd 1547102 6190.73 0.97Finance Equitas Holdings Ltd 16272603 13929.35 2.19Cholamandalam Investment and Finance Co Ltd 1603836 8322.31 1.31Multi Commodity Exchange Of India Ltd 454140 6865.92 1.08CARE Ratings Ltd 1054022 4901.20 0.77Healthcare Services Metropolis Healthcare Ltd 393330 7706.51 1.21Hotels/ Resorts And Other Recreational Activities Lemon Tree Hotels Ltd 23086857 9430.98 1.48Industrial Capital Goods Pennar Industries Ltd 7989354 1645.81 0.26Industrial Products Finolex Cables Ltd* 4112021 16051.27 2.52
Total Holdings 604,129.97 94.99
Call,cash and other current asset 31,879.29 5.01
Total Asset 636,009.26 100.00
* Top 10 holdings
: 1.93%: 1.06%
Mayank Bukrediwala* (effective August 24, 2020) (dedicated for making investments for Foreign Securities)
* Pyari Menon (dedicated for making investments for Foreign Securities) ceased to be a Fund Manager for the scheme effective August 23, 2020. Please refer the addendum on the website for further details.
Carborundum Universal Ltd 2367883 12019.37 1.89Ramkrishna Forgings Ltd 1259536 6977.83 1.10M M Forgings Ltd 1196703 5756.74 0.91Finolex Industries Ltd 741126 4543.84 0.71Media & Entertainment Navneet Education Ltd 10177038 8828.58 1.39TV Today Network Ltd 2713308 7248.60 1.14Music Broadcast Ltd 24421468 5934.42 0.93HT Media Ltd 11046869 2894.28 0.46Petroleum Products Hindustan Petroleum Corporation Ltd* 6289744 15249.48 2.40Gulf Oil Lubricants India Ltd 1275143 9309.18 1.46Pharmaceuticals J.B. Chemicals & Pharmaceuticals Ltd* 1346988 15067.41 2.37Eris Lifesciences Ltd 1875900 11000.28 1.73Dr. Reddy's Laboratories Ltd 205825 9110.95 1.43Indoco Remedies Ltd 112700 327.79 0.05Retailing Shankara Building Products Ltd 988899 4387.74 0.69Services Quess Corp Ltd* 2410139 18095.32 2.85Software Cyient Ltd* 2709141 17675.79 2.78Indiamart Intermesh Ltd 103243 8874.51 1.40KPIT Technologies Ltd 5600639 8098.52 1.27Tata Consultancy Services Ltd 193545 5601.77 0.88Textile Products K.P.R. Mill Ltd 1443273 13369.76 2.10Himatsingka Seide Ltd 3782418 5881.66 0.92Textiles - Cotton Vardhman Textiles Ltd 1138894 13483.94 2.12Total Equity Holdings 604129.97 94.99
Investors understand that their principal will be at Very High risk
Riskometer is as on February 28, 2021
9.90%9.78%9.53%
7.44%7.13%
6.33%5.58%5.35%5.34%
4.58%3.92%3.86%
3.03%2.85%
2.12%2.04%
1.70%1.48%1.21%
0.87%0.69%
0.26%5.01%
BANKSCHEMICALS
CONSTRUCTIONCONSUMER DURABLES
INDUSTRIAL PRODUCTSSOFTWARE
PHARMACEUTICALSFINANCE
CONSUMER NON DURABLESCOMMERCIAL SERVICES
MEDIA & ENTERTAINMENTPETROLEUM PRODUCTS
TEXTILE PRODUCTSSERVICES
TEXTILES - COTTONCONSTRUCTION PROJECT
AUTO ANCILLARIESHOTELS/ RESORTS AND OTHER RECREATIONAL ACTIVITIES
HEALTHCARE SERVICESCEMENT
RETAILINGINDUSTRIAL CAPITAL GOODS
CALL,CASH AND OTHER CURRENT ASSET

Franklin Build India Fund FBIF
Company Name No. ofshares
Market Value` Lakhs
% ofassets
Company Name No. ofshares
Market Value` Lakhs
% ofassets
PORTFOLIOAs on February 26, 2021
Power
NTPC Ltd* 4688274 5030.52 5.10
Power Grid Corporation of India Ltd 400000 857.20 0.87
Telecom - Services
Bharti Airtel Ltd* 1000000 5563.00 5.64
Transportation
Interglobe Aviation Ltd 200000 3239.90 3.28
Gateway Distriparks Ltd 1200000 2120.40 2.15
Gujarat Pipavav Port Ltd 2000000 1978.00 2.01
Container Corporation Of India Ltd 200000 1115.70 1.13
Total Equity Holdings 94250.30 95.54
Total Holdings 94,250.30 95.54
Call,cash and other current asset 4,401.30 4.46
Total Asset 98,651.60 100.00
10Franklin Templetonwww.franklintempletonindia.com
Product Label
This product is suitable for investors who are seeking*:
• Long term capital appreciation
• A fund that invests in infrastructure and allied sectors
*Investors should consult their financial advisers if in doubt about whether the product is suitable for them.
DATE OF ALLOTMENT
September 4, 2009
FUND MANAGER(S)Roshi Jain & Anand Radhakrishnan
#EXPENSE RATIO #EXPENSE RATIO (DIRECT)
TURNOVER
Portfolio Turnover 14.94%
` 5000/1
MINIMUM INVESTMENT/MULTIPLES FOR NEW INVESTORS
ENTRY LOAD NilEXIT LOAD (for each purchase of Units) 1% if redeemed/switched-
out within one year of allotment.
LOAD STRUCTURE
VOLATILITY MEASURES (3 YEARS)Standard Deviation 7.84%Beta 0.82Sharpe Ratio* 0.13
* Annualised. Risk-free rate assumed to be 3.47% (FBIL OVERNIGHT MIBOR)
# The above ratio includes the GST on Investment Management Fees. The rates specified are the actual expenses charged as at the end of the month. The above ratio also includes, proportionate charge in respect sales beyond T-30 cities subject to maximum of 30 bps on daily net assets, wherever applicable.
Growth Plan ` 50.6262Dividend Plan ` 22.2130Direct - Growth Plan ` 55.6367Direct - Dividend Plan ` 25.4734
ADDITIONAL INVESTMENT/MULTIPLES FOR EXISTING INVESTORS` 1000/1
FUND SIZE (AUM)Month End ` 986.52 croresMonthly Average ` 992.23 crores
INVESTMENT OBJECTIVEThe Scheme seeks to achieve capital appreciation through investments in companies engaged either directly or indirectly in infrastructure-related activities.
TYPE OF SCHEMEAn open ended equity scheme following Infrastructure theme
BENCHMARKS&P BSE India Infrastructure Index
NAV AS OF FEBRUARY 26, 2021
Banks
State Bank of India* 2861538 11164.29 11.32
Axis Bank Ltd* 1275000 9241.20 9.37
ICICI Bank Ltd* 1525000 9115.69 9.24
Cement
ACC Ltd* 200000 3466.40 3.51
JK Lakshmi Cement Ltd 900000 3362.40 3.41
Ultratech Cement Ltd 30000 1834.50 1.86
Construction
Sobha Ltd 700000 3075.45 3.12
Somany Ceramics Ltd 550000 2403.23 2.44
Puravankara Ltd 2233265 1758.70 1.78
ITD Cementation India Ltd 2100000 1623.30 1.65
Construction Project
Larsen & Toubro Ltd* 235000 3389.88 3.44
Finance
The New India Assurance Co Ltd 600000 921.90 0.93
Gas
GAIL (India) Ltd* 2700000 3828.60 3.88
Industrial Products
KEI Industries Ltd 675000 3376.35 3.42
Finolex Cables Ltd 525000 2049.34 2.08
NRB Bearings Ltd 1200000 1401.00 1.42
M M Forgings Ltd 250000 1202.63 1.22
Oil
Oil & Natural Gas Corporation Ltd 2000000 2220.00 2.25
Petroleum Products
Bharat Petroleum Corporation Ltd* 1000000 4498.50 4.56
Indian Oil Corporation Ltd* 4500000 4412.25 4.47
Different plans have a different expense structure
Industry Allocation - Equity Assets
SCHEME CATEGORY
Thematic - Infrastructure
SCHEME CHARACTERISTICS
Min 80% Equity in Infrastructure theme
MINIMUM INVESTMENT FOR SIP
` 500/1
Mutual Fund investments are subject to market risks, read all scheme related documents carefully.
* Top 10 holdings
@ Reverse Repo : 4.42%, Others (Cash/ Subscription receivable/ Redemption payable/ Receivables on sale/Payable on Purchase/ Other Receivable / Other Payable) : 0.04%
: 2.36%: 1.29%
Mayank Bukrediwala* (effective August 24, 2020) (dedicated for making investments for Foreign Securities)
* Pyari Menon (dedicated for making investments for Foreign Securities) ceased to be a Fund Manager for the scheme effective August 23, 2020. Please refer the addendum on the website for further details.
Investors understand that their principal will be at Very High risk
Riskometer is as on February 28, 2021
29.92%
9.03%
8.98%
8.78%
8.57%
8.14%
5.97%
5.64%
3.88%
3.44%
2.25%
0.93%
4.46%
BANKS
PETROLEUM PRODUCTS
CONSTRUCTION
CEMENT
TRANSPORTATION
INDUSTRIAL PRODUCTS
POWER
TELECOM - SERVICES
GAS
CONSTRUCTION PROJECT
OIL
FINANCE
CALL,CASH AND OTHER CURRENT ASSET

11Franklin Templetonwww.franklintempletonindia.com
Franklin India Opportunities Fund FIOFPORTFOLIO
Company Name No. ofshares
Market Value` Lakhs
% ofassets
Company Name No. ofshares
Market Value` Lakhs
% ofassets
As on February 26, 2021
Auto
Mahindra & Mahindra Ltd* 274264 2211.66 3.52
Tata Motors Ltd 484457 1564.55 2.49
Auto Ancillaries
Bosch Ltd* 21180 3146.27 5.01
Banks
HDFC Bank Ltd* 395485 6068.32 9.67
ICICI Bank Ltd* 583651 3488.77 5.56
Axis Bank Ltd* 458037 3319.85 5.29
Kotak Mahindra Bank Ltd* 169031 3009.34 4.80
Cement
J.K. Cement Ltd 60992 1639.53 2.61
Grasim Industries Ltd 93194 1119.07 1.78
Construction
Borosil Renewables Ltd 538877 1521.79 2.43
Construction Project
Larsen & Toubro Ltd 116490 1680.37 2.68
Ashoka Buildcon Ltd 1262673 1428.08 2.28
Consumer Non Durables
Asian Paints Ltd 73037 1663.20 2.65
Tata Consumer Products Ltd 106104 646.33 1.03
Finance
Multi Commodity Exchange Of India
Ltd 71018 1073.69 1.71
Equitas Holdings Ltd 1247117 1067.53 1.70
Kalyani Invest Co Ltd 12795 203.38 0.32
Healthcare Services
Metropolis Healthcare Ltd 10788 211.37 0.34
Media & Entertainment
GTPL Hathway Ltd 583460 713.28 1.14
Petroleum Products
Bharat Petroleum Corporation Ltd* 523765 2356.16 3.75
Hindustan Petroleum Corporation Ltd 551423 1336.93 2.13
Pharmaceuticals
Dr. Reddy's Laboratories Ltd 38978 1725.38 2.75
Cadila Healthcare Ltd 354144 1541.23 2.46
Caplin Point Laboratories Ltd 145673 676.72 1.08
Retailing
Aditya Birla Fashion and Retail Ltd 226247 415.39 0.66
Aditya Birla Fashion and Retail Ltd-
Partly Paid 26444 38.12 0.06
Software
Infosys Ltd* 405492 5082.03 8.10
Info Edge (India) Ltd* 85910 4218.48 6.72
HCL Technologies Ltd* 229692 2088.93 3.33
JustDial Ltd 183588 1311.64 2.09
Indiamart Intermesh Ltd 11431 982.58 1.57
Majesco Ltd 176709 187.40 0.30
Telecom - Services
Bharti Airtel Ltd 242272 1347.76 2.15
Unlisted
Brillio Technologies Pvt Ltd 489000 0.05 0.00**
Numero Uno International Ltd 98000 0.01 0.00**
Quantum Information Services 44170 0.00 0.00**
Chennai Interactive Business
Services Pvt Ltd 23815 0.00 0.00**
Total Equity Holdings 59085.22 94.16
This product is suitable for investors who are seeking*:
• Long term capital appreciation
•
Product Label
*Investors should consult their financial advisers if in doubt about whether the product is suitable for them.
Total Holdings 59,085.22 94.16
Call,cash and other current asset 3,665.96 5.84
Total Asset 62,751.18 100.00
DATE OF ALLOTMENT
February 21, 2000
FUND MANAGER(S)R Janakiraman & Hari Shyamsunder
#EXPENSE RATIO #EXPENSE RATIO (DIRECT)
TURNOVERPortfolio Turnover 37.50%
ENTRY LOAD NilEXIT LOAD (for each purchase of Units) In respect of each purchase
of Units - 1% if the Units are redeemed/switched-out within one year of allotment
LOAD STRUCTURE
# The above ratio includes the GST on Investment Management Fees. The rates specified are the actual expenses charged as at the end of the month. The above ratio also includes, proportionate charge in respect sales beyond T-30 cities subject to maximum of 30 bps on daily net assets, wherever applicable.
INVESTMENT OBJECTIVETo generate capital appreciation by investing in opportunities presented by special situations such as corporate restructuring, Government policy and/or regulatory changes, companies going through temporary unique challenges and other similar instances.
ADDITIONAL INVESTMENT/MULTIPLES FOR EXISTING INVESTORS
` 1000/1
` 5000/1
MINIMUM INVESTMENT/MULTIPLES FOR NEW INVESTORS
VOLATILITY MEASURES (3 YEARS)Standard Deviation 6.79%Beta 0.98Sharpe Ratio* 0.29
* Annualised. Risk-free rate assumed to be 3.47%(FBIL OVERNIGHT MIBOR)
FUND SIZE (AUM)Month End ` 627.51 croresMonthly Average ` 645.62 crores
Growth Plan ` 100.1137Dividend Plan ` 22.0782Direct - Growth Plan ` 105.9765Direct - Dividend Plan ` 23.8097
TYPE OF SCHEME
An open ended equity scheme following special situations theme
NAV AS OF FEBRUARY 26, 2021
BENCHMARKNifty 500
* Top 10 holdings** Less than 0.01
Industry Allocation - Equity Assets
A fund that takes stock or sector exposures based on special situations theme.
Different plans have a different expense structure
SCHEME CATEGORY
Thematic - Special Situations
SCHEME CHARACTERISTICS
Min 80% Equity in Special Situations theme
MINIMUM INVESTMENT FOR SIP
` 500/1
Mutual Fund investments are subject to market risks, read all scheme related documents carefully.
@ Reverse Repo : 6.09%, Others (Cash/ Subscription receivable/ Redemption payable/ Receivables on sale/Payable on Purchase/ Other Receivable / Other Payable) : -0.25%
: 2.51%: 1.81%
Mayank Bukrediwala* (effective August 24, 2020) (dedicated for making investments for Foreign Securities)
* Pyari Menon (dedicated for making investments for Foreign Securities) ceased to be a Fund Manager for the scheme effective August 23, 2020. Please refer the addendum on the website for further details.
Investors understand that their principal will be at Very High risk
Riskometer is as on February 28, 2021
25.32%
22.10%
6.28%
6.02%
5.89%
5.01%
4.95%
4.40%
3.74%
3.68%
2.43%
2.15%
1.14%
0.72%
0.34%
0.00%
5.84%
BANKS
SOFTWARE
PHARMACEUTICALS
AUTO
PETROLEUM PRODUCTS
AUTO ANCILLARIES
CONSTRUCTION PROJECT
CEMENT
FINANCE
CONSUMER NON DURABLES
CONSTRUCTION
TELECOM - SERVICES
MEDIA & ENTERTAINMENT
RETAILING
HEALTHCARE SERVICES
UNLISTED
CALL,CASH AND OTHER CURRENT ASSET
12Franklin Templetonwww.franklintempletonindia.com
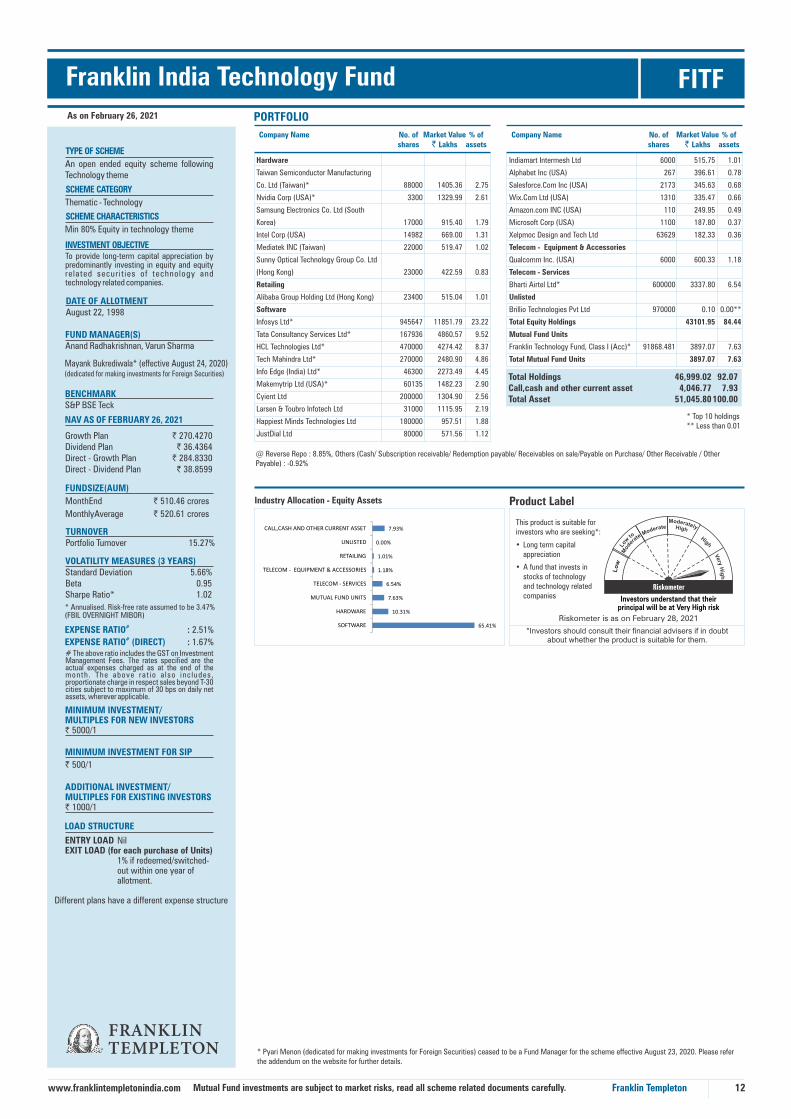
Hardware
Taiwan Semiconductor Manufacturing
Co. Ltd (Taiwan)* 88000 1405.36 2.75
Nvidia Corp (USA)* 3300 1329.99 2.61
Samsung Electronics Co. Ltd (South
Korea) 17000 915.40 1.79
Intel Corp (USA) 14982 669.00 1.31
Mediatek INC (Taiwan) 22000 519.47 1.02
Sunny Optical Technology Group Co. Ltd
(Hong Kong) 23000 422.59 0.83
Retailing
Alibaba Group Holding Ltd (Hong Kong) 23400 515.04 1.01
Software
Infosys Ltd* 945647 11851.79 23.22
Tata Consultancy Services Ltd* 167936 4860.57 9.52
HCL Technologies Ltd* 470000 4274.42 8.37
Tech Mahindra Ltd* 270000 2480.90 4.86
Info Edge (India) Ltd* 46300 2273.49 4.45
Makemytrip Ltd (USA)* 60135 1482.23 2.90
Cyient Ltd 200000 1304.90 2.56
Larsen & Toubro Infotech Ltd 31000 1115.95 2.19
Happiest Minds Technologies Ltd 180000 957.51 1.88
JustDial Ltd 80000 571.56 1.12
Franklin India Technology Fund FITF
INVESTMENT OBJECTIVE
DATE OF ALLOTMENTAugust 22, 1998
FUND MANAGER(S)Anand Radhakrishnan, Varun Sharma
TURNOVER Portfolio Turnover 15.27%
LOAD STRUCTURE
Company Name No. ofshares
Market Value` Lakhs
% ofassets
As on February 26, 2021
Company Name No. ofshares
Market Value` Lakhs
% ofassets
ENTRY LOAD NilEXIT LOAD (for each purchase of Units) 1% if redeemed/switched- out within one year of allotment.
To provide long-term capital appreciation by predominantly investing in equity and equity related securit ies of technology and technology related companies.
PORTFOLIO
ADDITIONAL INVESTMENT/MULTIPLES FOR EXISTING INVESTORS ` 1000/1
MINIMUM INVESTMENT/MULTIPLES FOR NEW INVESTORS ` 5000/1
#EXPENSE RATIO #EXPENSE RATIO (DIRECT)
# The above ratio includes the GST on Investment Management Fees. The rates specified are the actual expenses charged as at the end of the month . The above ra t io a lso inc ludes , proportionate charge in respect sales beyond T-30 cities subject to maximum of 30 bps on daily net assets, wherever applicable.
VOLATILITY MEASURES (3 YEARS)Standard Deviation 5.66%Beta 0.95Sharpe Ratio* 1.02
* Annualised. Risk-free rate assumed to be 3.47% (FBIL OVERNIGHT MIBOR)
FUNDS IZE (AUM)
Month End ` 510.46 crores
Monthly Average ` 520.61 crores
TYPE OF SCHEME
An open ended equity scheme following Technology theme
BENCHMARKS&P BSE Teck
Product Label
This product is suitable for investors who are seeking*:
Long term capital appreciation
A fund that invests in stocks of technology and technology related companies
*Investors should consult their financial advisers if in doubt about whether the product is suitable for them.
•
•
Total Holdings 46,999.02 92.07Call,cash and other current asset 4,046.77 7.93Total Asset 51,045.80 100.00
Indiamart Intermesh Ltd 6000 515.75 1.01
Alphabet Inc (USA) 267 396.61 0.78
Salesforce.Com Inc (USA) 2173 345.63 0.68
Wix.Com Ltd (USA) 1310 335.47 0.66
Amazon.com INC (USA) 110 249.95 0.49
Microsoft Corp (USA) 1100 187.80 0.37
Xelpmoc Design and Tech Ltd 63629 182.33 0.36
Telecom - Equipment & Accessories
Qualcomm Inc. (USA) 6000 600.33 1.18
Telecom - Services
Bharti Airtel Ltd* 600000 3337.80 6.54
Unlisted
Brillio Technologies Pvt Ltd 970000 0.10 0.00**
Total Equity Holdings 43101.95 84.44
Mutual Fund Units
Franklin Technology Fund, Class I (Acc)* 91868.481 3897.07 7.63
Total Mutual Fund Units 3897.07 7.63
Industry Allocation - Equity Assets
Growth Plan ` 270.4270Dividend Plan ` 36.4364Direct - Growth Plan ` 284.8330Direct - Dividend Plan ` 38.8599
NAV AS OF FEBRUARY 26, 2021
Different plans have a different expense structure
SCHEME CATEGORY
Thematic - Technology
SCHEME CHARACTERISTICS
Min 80% Equity in technology theme
MINIMUM INVESTMENT FOR SIP
` 500/1
Mutual Fund investments are subject to market risks, read all scheme related documents carefully.
* Top 10 holdings** Less than 0.01
@ Reverse Repo : 8.85%, Others (Cash/ Subscription receivable/ Redemption payable/ Receivables on sale/Payable on Purchase/ Other Receivable / Other Payable) : -0.92%
: 2.51%
: 1.67%
Mayank Bukrediwala* (effective August 24, 2020) (dedicated for making investments for Foreign Securities)
* Pyari Menon (dedicated for making investments for Foreign Securities) ceased to be a Fund Manager for the scheme effective August 23, 2020. Please refer the addendum on the website for further details.
Investors understand that their principal will be at Very High risk
Riskometer is as on February 28, 202165.41%
10.31%
7.63%
6.54%
1.18%
1.01%
0.00%
7.93%
SOFTWARE
HARDWARE
MUTUAL FUND UNITS
TELECOM - SERVICES
TELECOM - EQUIPMENT & ACCESSORIES
RETAILING
UNLISTED
CALL,CASH AND OTHER CURRENT ASSET

13Franklin Templetonwww.franklintempletonindia.com
This product is suitable for investors who are seeking*:
• Long term capital appreciation
• A fund of funds investing in an overseas equity fund
Product Label As on February 26, 2021 PORTFOLIO
FUND MANAGER(S) (FOR FRANKLIN INDIA FEEDER - FRANKLIN US OPPORTUNITIES FUND)
FUND MANAGER(S) (FOR FRANKLIN USOPPORTUNITIES FUND)Grant Bowers Sara Araghi
DATE OF ALLOTMENTFebruary 06, 2012
# EXPENSE RATIO#EXPENSE RATIO (DIRECT)
BENCHMARKRussell 3000 Growth Index
MINIMUM APPLICATION AMOUNT
`5,000 and in multiples of Re.1 thereafter
LOAD STRUCTURE
Entry LoadEXIT LOAD (for each purchase of Units)
Nil
Indian Investorsin `
Franklin India Feeder - Franklin U.S. Opportunities
Fund
in $ Franklin U.S.Opportunities
Fund
invests in
US Companies
The Fund seeks to provide capital appreciation by investing predominantly in units of Franklin U. S. Opportunities Fund, an overseas Franklin Templeton mutual fund, which primarily invests in securities in the United States of America.
INVESTMENT OBJECTIVE
Mutual Fund Units 5348649 285165.19 99.99Total Mutual Fund Units 285165.19 99.99
# The above ratio includes the GST on Investment Management Fees. The rates specified are the actual expenses charged as at the end of the month. The above ratio also includes, proportionate charge in respect sales beyond T-30 cities subject to maximum of 30 bps on daily net assets, wherever applicable.
*Investors should consult their financial advisers if in doubt about whether the product is suitable for them.
Growth and Dividend (with payout andreinvestment opiton)
PLANS
FUND SIZE (AUM)Month End ` 2851.90 croresMonthly Average ` 2915.92 crores
TYPE OF SCHEME
An open ended fund of fund scheme investing in units of Franklin U. S. Opportunities Fund
Total Holdings 285,165.19 99.99Call,cash and other current asset 24.67 0.01Total Asset 285,189.86 100.00
Franklin U.S. Opportunities Fund, Class I (Acc)
Company Name No. ofshares
Market Value` Lakhs
% ofassets
‘Investors may note that they will be bearing the recurring expenses of this Scheme in addition to the expenses of the underlying Schemes in which this Scheme makes investment’
Different plans have a different expense structure
MINIMUM INVESTMENT/MULTIPLES FOR NEW INVESTORS
` 5,000/1
ADDITIONAL INVESTMENT/MULTIPLES FOR EXISTING INVESTORS
` 1000/1
MINIMUM INVESTMENT FOR SIP
` 500/1
SCHEME CATEGORYFOF - Overseas - U.S.
SCHEME CHARACTERISTICS
Minimum 95% assets in the underlying funds
Mutual Fund investments are subject to market risks, read all scheme related documents carefully.
@ Reverse Repo : 0.62%, Others (Cash/ Subscription receivable/ Redemption payable/ Receivables on sale/Payable on Purchase/ Other Receivable / Other Payable) : -0.61%
Disclaimer :Subscriptions to shares of the Luxembourg-domiciled SICAV Franklin Templeton Investment Funds (“the Fund”) can only be made on the basis of the current prospectus, and, where available, the relevant Key Investor Information Document, accompanied by the latest available audited annual report and the latest semi-annual report if published thereafter. The value of shares in the Fund and income received from it can go down as well as up, and investors may not get back the full amount invested. Past performance is not an indicator or a guarantee of future performance. Currency fluctuations may affect the value of overseas investments. When investing in a fund denominated in a foreign currency, your performance may also be affected by currency fluctuations. An investment in the Fund entails risks which are described in the Fund’s prospectus and in the relevant Key Investor Information Document. In emerging markets, the risks can be greater than in developed markets. Investments in derivative instruments entail specific risks more fully described in the Fund’s prospectus or in the relevant Key Investor Information Document. No shares of the Fund may be directly or indirectly offered or sold to residents of the United States of America. Only Class A shares can be offered by way of a public offering in Belgium and potential investors must receive confirmation of their availability from their local Franklin Templeton Investments representative or a financial services representative in Belgium before planning any investments. Any research and analysis contained in this document has been procured by Franklin Templeton Investments for its own purposes and is provided to you only incidentally. Top Ten Holdings: These securities do not represent all of the securities purchased, sold or recommended for clients, and the reader should not assume that investment in the securities listed was or will be profitable. The portfolio manager for the Fund reserves the right to withhold release of information with respect to holdings that would otherwise be included in the top holdings list.
The expenses of the Fund of Funds scheme will be over and above the expenses charged by the underlying scheme. Investments in overseas financial assets are subject to risks associated with currency movements, restrictions on repatriation, transaction procedures in overseas markets and country related risks.
Investors cannot directly invest in the Underlying fund, as the Underlying fund is not available for distribution.
Growth Plan ` 49.8739Dividend Plan ` 49.8739Direct - Growth Plan ` 53.9679Direct - Dividend Plan ` 53.9679
NAV AS OF FEBRUARY 26, 2021
Franklin India Feeder - Franklin U.S. Opportunities Fund FIF-FUSOF
1% if Units are redeemed/switched out within one year from the date of allotment
(effective January 15, 2020)
Top Ten Holdings (%of Total) Composition of Fund
Franklin U.S. Opportunities Fund Russell 3000® Growth Index
Market Capitalisation Breakdown in USD % of Equity
<5.0 Billion 2.46
5.0-15.0 Billion 5.83
15.0-25.0 Billion 8.36
25.0-50.0 Billion 18.42
50.0-100.0 Billion 11.11
100.0-150.0 Billion 7.98
>150.0 Billion 41.37
N/A 4.48
Franklin U.S. Opportunities Fund (data as on 31 January 2021)(This is the Underlying Fund, not available for direct subscription in India)
Sector % of Total
Information Technology / 39.96 43.40
Health Care / 17.09 15.35
Consumer Discretionary / 15.01 16.76
Industrials /7.15 5.03
Communication Services / 6.40 10.49
Financials /4.78 1.91
Consumer Staples /3.12 4.19
Real Estate / 2.43 1.78
Materials /1.17 0.88
Others /0.50 0.21
Cash & Cash Equivalents /2.38 0.00
: 1.60%
: 0.55%
Mayank Bukrediwala* (effective August 24, 2020)
* Pyari Menon ceased to be a Fund Manager for the scheme effective August 23, 2020. Please refer the addendum on the website for further details.
Issuer Name
AMAZON.COM INC 8.18
MICROSOFT CORP 4.62
APPLE INC 3.92
MASTERCARD INC 3.88
VISA INC 3.12
SERVICENOW INC 2.93
ALPHABET INC 2.34
COSTAR GROUP INC 2.31
SBA COMMUNICATIONS CORP 1.97
PAYPAL HOLDINGS INC 1.93
Investors understand that their principal will be at Very High risk
Riskometer is as on February 28, 2021

Templeton European Opportunities Fund (data as on 31 January 2021)(This is the Underlying Fund, not available for direct subscription in India)
14Franklin Templetonwww.franklintempletonindia.com Mutual Fund investments are subject to market risks, read all scheme related documents carefully.
This product is suitable for investors who are seeking*:
• Long term capital appreciation
• A fund of funds investing in an overseas equity fund having exposure to Europe.
As on February 26, 2021 PORTFOLIO
FUND MANAGER(S) (FOR FRANKLIN INDIA FEEDER - TEMPLETON EUROPEAN OPPORTUNITIES FUND)
FUND MANAGER(S) (FOR TEMPLETON EUROPEAN OPPORTUNITIES FUND)John ReynoldsDylan Ball
PLANSGrowth and Dividend (with Reinvestment & Payout Options) Direct – Growth and Dividend (with Reinvestment & Payout Options)
DATE OF ALLOTMENTMay 16, 2014
BENCHMARK
MSCI Europe Index
MINIMUM APPLICATION AMOUNT
`5,000 and in multiples of Re.1 thereafter
LOAD STRUCTUREEntry LoadEXIT LOAD (for each purchase of Units)
Nil
Product Label
Indian Investors in ` Franklin India Feeder-
Templeton European Opportunities Fund
in $ Templeton European
Opportunities Fund
invests inEuropean Companies
Templeton European Opportunities Fund, Class I (Acc)
*Investors should consult their financial advisers if in doubt about whether the product is suitable for them.
FUND SIZE (AUM)Month End ` 20.67 croresMonthly Average ` 20.42 crores
The Fund seeks to provide capital appreciation by investing predominantly in units of Templeton European Opportunities Fund, an overseas equity fund which primarily invests in securities of issuers incorporated or having their principal business in European countries. However, there is no assurance or guarantee that the objective of the scheme will be achieved.
INVESTMENT OBJECTIVE
TYPE OF SCHEME
An open ended fund of fund scheme investing in units of Templeton European Opportunities Fund
Total Holdings 2,040.30 98.69Call,cash and other current asset 27.12 1.31Total Asset 2,067.43 100.00
MINIMUM INVESTMENT/MULTIPLES FOR NEW INVESTORS
` 5,000/1
# EXPENSE RATIO#EXPENSE RATIO (DIRECT)
# The above ratio includes the GST on Investment Management Fees. The rates specified are the actual expenses charged as at the end of the month. The above ratio also includes, proportionate charge in respect sales beyond T-30 cities subject to maximum of 30 bps on daily net assets, wherever applicable.
ADDITIONAL INVESTMENT/MULTIPLES FOR EXISTING INVESTORS
` 1000/1
Company Name No. ofshares
Market Value` Lakhs
% ofassets
Different plans have a different expense structure
‘Investors may note that they will be bearing the recurring expenses of this Scheme in addition to the expenses of the underlying Schemes in which this Scheme makes investment’
MINIMUM INVESTMENT FOR SIP
` 500/1
SCHEME CATEGORYFOF - Overseas - Europe
SCHEME CHARACTERISTICSMinimum 95% assets in the underlying funds
@ Reverse Repo : 1.66%, Others (Cash/ Subscription receivable/ Redemption payable/ Receivables on sale/Payable on Purchase/ Other Receivable / Other Payable) : -0.35%
Disclaimer :This document does not constitute legal or tax advice nor investment advice or an offer for shares of the Fund. Subscriptions to shares of the Fund can only be made on the basis of the current prospectus and where available, the relevant Key Investor Information Document, accompanied by the latest available audited annual report and semi-annual report accessible on our website at www.franklintempleton.lu or which can be obtained, free of charge, from Franklin Templeton International Services, S.à r.l. - Supervised by the Commission de Surveillance du Secteur Financier - 8A, rue Albert Borschette, L-1246 Luxembourg. The value of shares in the Fund and income received from it can go down as well as up, and investors may not get back the full amount invested. No shares of the Fund may be directly or indirectly offered or sold to residents of the United States of America. Shares of the Fund are not available for distribution in all jurisdictions and prospective investors should confirm availability with their local Franklin Templeton Investments representative before making any plans to invest. An investment in the Fund entails risks, which are described in the Fund’s prospectus and where available, in the relevant Key Investor Information Document. Special risks may be associated with a Fund’s investment in certain types of securities, asset classes, sectors, markets, currencies or countries and in the Fund’s possible use of derivatives. These risks are more fully described in the Fund’s prospectus and where available, in the relevant Key Investor Information Document and should be read closely before investing. Information is historical and may not reflect current or future portfolio characteristics. All portfolio holdings are subject to change. References to particular industries, sectors or companies are for general information and are not necessarily indicative of a fund's holding at any one time. All MSCI data is provided “as is.” The Fund described herein is not sponsored or endorsed by MSCI. In no event shall MSCI, its affiliates or any MSCI data provider have any liability of any kind in connection with the MSCI data or the Fund described herein. Copying or redistributing the MSCI data is strictly prohibited. Top Ten Holdings: These securities do not represent all of the securities purchased, sold or recommended for clients, and the reader should not assume that investment in the securities listed was or will be profitable. The portfolio manager for the Fund reserves the right to withhold release of information with respect to holdings that would otherwise be included in the top holdings list.
The expenses of the Fund of Funds scheme will be over and above the expenses charged by the underlying scheme. Investments in overseas financial assets are subject to risks associated with currency movements, restrictions on repatriation, transaction procedures in overseas markets and country related risks.
Investors cannot directly invest in the Underlying fund, as the Underlying fund is not available for distribution.
Growth Plan ` 9.1852Dividend Plan ` 9.1852Direct - Growth Plan ` 9.9594Direct - Dividend Plan ` 9.9594
NAV AS OF FEBRUARY 26, 2021
Franklin India Feeder - Templeton European Opportunities Fund FIF-TEOF
Top Ten Holdings (%of Total) Composition of Fund
Templeton European Opportunities Fund
MSCI Europe Index
Sector % of Total
Industrials / 26.36 14.53
Health Care /11.65 14.65
Consumer Staples /8.81 13.22
Utilities / 8.76 4.97
Consumer Discretionary / 8.04 11.36
Information Technology /7.50 7.86
Energy /6.04 4.47
Materials / 4.90 8.37
Real Estate /4.83 1.40
Others / 3.10 19.16
Cash & Cash Equivalents /10.01 0.00
Geographic % of Total
United Kingdom / 24.59 22.80
Germany / 19.78 15.03
France / 11.13 17.31
Spain / 10.48 3.80
Netherlands / 8.97 6.39
Switzerland / 5.33 15.39
Lithuania /3.03 0.00
Belgium /2.54 1.56
Ireland / 2.12 1.10
Others / 2.00 16.62
Cash & Cash Equivalents /10.01 0.00
Market Capitalisation % of EquityBreakdown in EUR
Issuer Name
DASSAULT AVIATION SA 6.72
IMPERIAL BRANDS PLC 6.47
SBM OFFSHORE NV 6.04
COATS GROUP PLC 5.90
INFINEON TECHNOLOGIES AG 4.70
APPLUS SERVICES SA 4.40
LIVANOVA PLC 3.50
BEFESA SA 3.31
FRESENIUS MEDICAL CARE
AG & CO KGAA 3.08
AB IGNITIS GRUPE 3.03
<2.0 Billion 33.40
2.0-5.0 Billion 22.44
5.0-10.0 Billion 14.13
10.0-25.0 Billion 19.40
25.0-50.0 Billion 7.82
>50.0 Billion 2.81
1% if the Units are redeemed/switched out within one year from the date of allotment(effective January 15, 2020)
Mutual Fund Units 83643 2040.30 98.69Total Mutual Fund Units 2040.30 98.69
: 1.38%
: 0.62%
The name of the Scheme stands changed from Franklin India Feeder – Franklin European Growth Fund to Franklin India Feeder – Templeton European Opportunities Fund with effect from August 18, 2020. Please read the addendum for further details.
Mayank Bukrediwala* (effective August 24, 2020)
* Pyari Menon ceased to be a Fund Manager for the scheme effective August 23, 2020. Please refer the addendum on the website for further details.
Investors understand that their principal will be at Very High risk
Riskometer is as on February 28, 2021

Franklin Asian Equity Fund FAEFPORTFOLIO
Company Name No. ofshares
Market Value` Lakhs
% ofassets
Industry Allocation - Equity Assets
* Annualised. Risk-free rate assumed to be 3.47% (FBIL OVERNIGHT MIBOR)
ENTRY LOAD NilEXIT LOAD (for each purchase of Units)1% if the Units are redeemed/switched- out within one year from the date of allotment(effective January 15, 2020)
15
As on February 26, 2021
Franklin Templetonwww.franklintempletonindia.com
Product Label
*Investors should consult their financial advisers if in doubt about whether the product is suitable for them.
LOAD STRUCTURE
ADDITIONAL INVESTMENT/MULTIPLES FOR EXISTING INVESTORS
` 1000/1
MINIMUM INVESTMENT/MULTIPLES FOR NEW INVESTORS
` 5000/1
#EXPENSE RATIO#EXPENSE RATIO (DIRECT)
# The above ratio includes the GST on Investment Management Fees. The rates specified are the actual expenses charged as at the end of the month. The above ratio also includes, proportionate charge in respect sales beyond T-30 cities subject to maximum of 30 bps on daily net assets, wherever applicable.
VOLATILITY MEASURES (3 YEARS)Standard Deviation 5.11%Beta 1.03Sharpe Ratio* 0.54
TURNOVER
Portfolio Turnover 33.56%
FUND MANAGER(S)Roshi Jain
DATE OF ALLOTMENT
January 16, 2008
INVESTMENT OBJECTIVEFAEF is an open-end diversified equity fund that seeks to provide medium to long term appreciation through investments primarily in Asian Companies / sectors (excluding Japan) with long term potential across market capitalisation.
NAV AS OF FEBRUARY 26, 2021
Growth Plan ` 32.9156Dividend Plan ` 17.3169Direct - Growth Plan ` 34.6506Direct - Dividend Plan ` 18.4099
FUND SIZE (AUM)
Month End ` 270.73 crores
Monthly Average ` 275.87 crores
TYPE OF SCHEME
An open ended equity scheme following Asian (excluding Japan) equity theme
BENCHMARK
MSCI Asia (ex-Japan) Standard Index
* Top 10 holdings
Total Holdings 26,121.82 96.49Call,cash and other current asset 951.40 3.51Total Asset 27,073.21 100.00
Company Name No. ofshares
Market Value` Lakhs
% ofassets
Banks China Merchants Bank Co Ltd (Hong Kong)* 86000 485.03 1.79HDFC Bank Ltd 30253 464.20 1.71ICICI Bank Ltd 64814 387.43 1.43Bank Central Asia Tbk Pt (Indonesia) 211929 366.32 1.35Kotak Mahindra Bank Ltd 19241 342.56 1.27Cement Semen Indonesia (Persero) Tbk PT (Indonesia) 662300 348.04 1.29China Resources Cement Holdings Ltd (Hong Kong) 372000 325.54 1.20Indocement Tunggal Prakarsa Tbk Pt (Indonesia) 371100 238.99 0.88The Siam Cement PCL, Fgn. (Thailand) 24212 214.51 0.79Chemicals LG Chem Ltd (South Korea) 750 406.79 1.50Commercial Services China Resources Mixc Lifestyle Services Ltd (Hong Kong) 646 2.93 0.01Construction China Resources Land Ltd (Hong Kong) 122000 425.78 1.57Godrej Properties Ltd 20861 321.37 1.19Oberoi Realty Ltd 27579 150.47 0.56Construction Project Larsen & Toubro Ltd 18232 263.00 0.97Consumer Durables Midea Group Co Ltd (China) 34200 361.85 1.34Largan Precision Co. Ltd (Taiwan) 1000 86.83 0.32Consumer Non Durables Kweichow Moutai Co. Ltd, A (China) 1800 434.33 1.60China Mengniu Dairy Co. Ltd (Hong Kong) 106000 425.66 1.57Budweiser Brewing Co. Apac Ltd (Hong Kong) 144400 324.12 1.20Yum China Holdings INC (USA) 6800 300.55 1.11Tata Consumer Products Ltd 40295 245.46 0.91Samsonite International Sa (Hong Kong) 101700 145.44 0.54United Spirits Ltd 25284 135.29 0.50Diversified Consumer Services New Oriental Education & Technology Group Inc (Hong Kong) 3560 460.90 1.70Tal Education Group, (ADR) 2900 165.48 0.61Engineering Services Beijing Oriental Yuhong Waterproof Technology Co Ltd (China) 21250 114.08 0.42Finance AIA Group Ltd (Hong Kong)* 113324 1041.62 3.85Ping An Insurance (Group) Co. Of China Ltd, H (Hong Kong)* 82810 747.42 2.76SM Investments Corp (Philippines) 17275 263.45 0.97Motilal Oswal Financial Services Ltd 32972 198.99 0.73Hardware Taiwan Semiconductor Manufacturing Co. Ltd (Taiwan)* 159714 2550.64 9.42Samsung Electronics Co. Ltd (South Korea)* 44987 2422.41 8.95
Mediatek INC (Taiwan) 14000 330.57 1.22SK Hynix INC (South Korea) 1942 179.35 0.66Healthcare Services Alibaba Health Information Technology (Hong Kong) 84000 206.84 0.76Narayana Hrudayalaya Ltd 36747 158.51 0.59Bangkok Dusit Medical Services Pcl (Thailand) 118300 57.27 0.21Hotels/ Resorts And Other Recreational Activities Indian Hotels Co Ltd 235400 289.19 1.07Minor International Pcl, Fgn. (Thailand) 217546 159.30 0.59Minor International Pcl- Warrants (31-July-2023) (Thailand) 8388 2.05 0.01Minor International Pcl - Warrants (30-Sep-2021) (Thailand) 8195 0.24 0.00Industrial Capital Goods Singapore Technologies Engineering Ltd (Singapore) 60600 126.01 0.47Xinyi Solar Holdings Ltd (Hong Kong) 46000 71.01 0.26Longi Green Energy Technology Co Ltd (China) 5700 67.68 0.25Media & Entertainment Naver Corp (South Korea)* 3076 752.88 2.78Non - Ferrous Metals Hindalco Industries Ltd 83344 283.58 1.05Pharmaceuticals Laobaixing Pharmacy Chain Jsc (China) 13280 108.38 0.40Retailing Alibaba Group Holding Ltd (Hong Kong)* 97004 2135.09 7.89Meituan Dianping (Hongkong)* 24800 798.58 2.95Techtronic Industries Co. Ltd (Hong Kong) 36521 409.53 1.51Trent Ltd 31095 251.45 0.93ACE Hardware Indonesia Tbk Pt (Indonesia) 2265900 178.03 0.66Services Country Garden Services Holdings Co Ltd (Hongkong) 57000 344.42 1.27Software Tencent Holdings Ltd (Hong Kong)* 38500 2415.67 8.92JD.Com Inc (Hong Kong)* 16700 569.39 2.10Sea Ltd (ADR) 1900 328.52 1.21Kuaishou Technology (Hong Kong) 8300 242.74 0.90Makemytrip Ltd (USA) 6700 149.29 0.55Info Edge (India) Ltd 2435 119.57 0.44Transportation Trip.Com Group Ltd, (ADR) 7538 219.19 0.81Total Equity Holdings 26121.82 96.49
Different plans have a different expense structure
SCHEME CATEGORY
Thematic - Asian Equity
SCHEME CHARACTERISTICS
Min 80% in Asian equity (ex-Japan) theme
MINIMUM INVESTMENT FOR SIP
` 500/1
Mutual Fund investments are subject to market risks, read all scheme related documents carefully.
@ Reverse Repo : 3.81%, Others (Cash/ Subscription receivable/ Redemption payable/ Receivables on sale/Payable on Purchase/ Other Receivable / Other Payable) : -0.30%
: 2.74%: 1.92%
Mayank Bukrediwala* (effective August 24, 2020) (dedicated for making investments for Foreign Securities)
* Pyari Menon (dedicated for making investments for Foreign Securities) ceased to be a Fund Manager for the scheme effective August 23, 2020. Please refer the addendum on the website for further details.
Investors understand that their principal will be at Very High risk
Riskometer is as on February 28, 2021
This product is suitable for
investors who are seeking*:
• Long term capital
appreciation
• A fund that invests in stocks of Asian companies / sectors (excluding Japan)
20.25%14.13%13.94%
8.32%7.56%7.43%
4.16%3.32%2.78%2.31%
1.67%1.66%1.56%1.50%1.27%1.05%0.98%0.97%0.81%0.42%0.40%0.01%
3.51%
HARDWARESOFTWARERETAILING
FINANCEBANKS
CONSUMER NON DURABLESCEMENT
CONSTRUCTIONMEDIA & ENTERTAINMENT
DIVERSIFIED CONSUMER SERVICESHOTELS/ RESORTS AND OTHER RECREATIONAL ACTIVITIES
CONSUMER DURABLESHEALTHCARE SERVICES
CHEMICALSSERVICES
NON - FERROUS METALSINDUSTRIAL CAPITAL GOODS
CONSTRUCTION PROJECTTRANSPORTATION
ENGINEERING SERVICESPHARMACEUTICALS
COMMERCIAL SERVICESCALL,CASH AND OTHER CURRENT ASSET

FUND MANAGER(S)Varun Sharma
MINIMUM INVESTMENT/MULTIPLES FOR NEW INVESTORS
` 5000/1
ADDITIONAL INVESTMENT/MULTIPLES FOR EXISTING INVESTORS
` 1000/1
LOAD STRUCTUREENTRY LOAD NilEXIT LOAD (for each purchase of Units) 0.25% (if redeemed / switchedout within 7 days from date of allotment) (Effective December 23, 2019)
PORTFOLIO
Company Name No. ofshares
Market Value` Lakhs
% ofassets
Franklin India Index Fund - NSE NIFTY Plan FIIFAs on February 26, 2021
Company Name No. ofshares
Market Value` Lakhs
% ofassets
Reliance Industries Ltd* 200903 4190.43 10.79
HDFC Bank Ltd* 271286 4162.61 10.72
Infosys Ltd* 228375 2862.22 7.37
Housing Development Finance
Corporation Ltd* 111903 2841.66 7.32
ICICI Bank Ltd* 430892 2575.66 6.63
Tata Consultancy Services Ltd* 64223 1858.81 4.79
Kotak Mahindra Bank Ltd* 91938 1636.82 4.21
Hindustan Unilever Ltd* 55978 1193.48 3.07
Axis Bank Ltd* 153822 1114.90 2.87
ITC Ltd* 542707 1106.31 2.85
Larsen & Toubro Ltd 75178 1084.44 2.79
State Bank of India 234249 913.92 2.35
Bajaj Finance Ltd 16438 865.44 2.23
Bharti Airtel Ltd 145301 808.31 2.08
Asian Paints Ltd 27893 635.18 1.64
HCL Technologies Ltd 67654 615.28 1.58
Maruti Suzuki India Ltd 8243 565.98 1.46
Mahindra & Mahindra Ltd 58902 474.99 1.22
Ultratech Cement Ltd 7098 434.04 1.12
Sun Pharmaceutical Industries Ltd 66051 392.74 1.01
IndusInd Bank Ltd 34804 369.95 0.95
Titan Co Ltd 25864 363.88 0.94
Bajaj Finserv Ltd 3766 363.37 0.94
Wipro Ltd 87723 359.93 0.93
Nestle India Ltd 2189 352.46 0.91
Tata Motors Ltd 108853 351.54 0.91
Tech Mahindra Ltd 38236 351.33 0.90
Power Grid Corporation of India Ltd 156065 334.45 0.86
HDFC Life Insurance Co Ltd 47558 333.22 0.86
Tata Steel Ltd 46210 330.47 0.85
Dr. Reddy's Laboratories Ltd 7297 323.01 0.83
DATE OF ALLOTMENTAugust 4, 2000
INVESTMENT OBJECTIVE
The Investment Objective of the Scheme is to invest in companies whose securities are included in the Nifty and subject to tracking errors, endeavouring to attain results commensurate with the Nifty 50 under NSE Nifty Plan.
FUND SIZE (AUM)
Month End ` 388.39 crores
Monthly Average ` 401.56 crores
TYPE OF SCHEME
An open ended scheme replicating/ tracking Nifty 50 Index
BENCHMARKNifty 50
16Franklin Templetonwww.franklintempletonindia.com
Different plans have a different expense structure
SCHEME CATEGORY
Index - Nifty
SCHEME CHARACTERISTICS
Minimum 95% of assets to replicate / track Nifty 50 index
MINIMUM INVESTMENT FOR SIP
` 500/1
Mutual Fund investments are subject to market risks, read all scheme related documents carefully.
Total Holdings 38,649.19 99.51
Call,cash and other current asset 190.05 0.49
Total Asset 38,839.24 100.00
* Top 10 holdings
TRACKING ERROR (for 3 year period) : 0.40%
Note : Sector allocation as per Nifty 50
Product Label
*Investors should consult their financial advisers if in doubt about whether the product is suitable for them.
A passively managed index fund
Long term capital appreciation
NTPC Ltd 297973 319.73 0.82
Adani Ports and Special Economic
Zone Ltd 45543 307.83 0.79
Bajaj Auto Ltd 8023 304.77 0.78
Hindalco Industries Ltd 85899 292.27 0.75
Grasim Industries Ltd 23973 287.87 0.74
Divi's Laboratories Ltd 7753 260.74 0.67
Hero MotoCorp Ltd 7692 247.99 0.64
Britannia Industries Ltd 7346 247.10 0.64
Cipla Ltd 30814 242.52 0.62
Oil & Natural Gas Corporation Ltd 210784 233.97 0.60
JSW Steel Ltd 58927 233.03 0.60
Shree Cement Ltd 806 213.60 0.55
Bharat Petroleum Corporation Ltd 47078 211.78 0.55
Eicher Motors Ltd 8296 207.28 0.53
SBI Life Insurance Co Ltd 23408 202.92 0.52
Coal India Ltd 123394 187.81 0.48
UPL Ltd 32142 180.49 0.46
GAIL (India) Ltd 110952 157.33 0.41
Indian Oil Corporation Ltd 146180 143.33 0.37
Yes Bank Ltd 92088 0.00 0.00
Total Equity Holdings 38649.19 99.51
@ Reverse Repo : 0.00%, Others (Cash/ Subscription receivable/ Redemption payable/ Receivables on sale/Payable on Purchase/ Other Receivable / Other Payable) : 0.49%
NAV AS OF FEBRUARY 26, 2021
Growth Plan ` 114.6533Dividend Plan ` 114.6533Direct - Growth Plan ` 118.4248Direct - Dividend Plan ` 118.4248
# EXPENSE RATIO#EXPENSE RATIO (DIRECT)
# The above ratio includes the GST on Investment Management Fees. The rates specified are the actual expenses charged as at the end of the month. The above rat io a lso inc ludes, proportionate charge in respect sales beyond T-30 cities subject to maximum of 30 bps on daily net assets, wherever applicable.
: 0.67%: 0.26%
Mayank Bukrediwala* (effective August 24, 2020) (dedicated for making investments for Foreign Securities)
* Pyari Menon (dedicated for making investments for Foreign Securities) ceased to be a Fund Manager for the scheme effective August 23, 2020. Please refer the addendum on the website for further details.
Investors understand that their principal will be at Very High risk
Riskometer is as on February 28, 2021
This product is suitable for
investors who are seeking*:
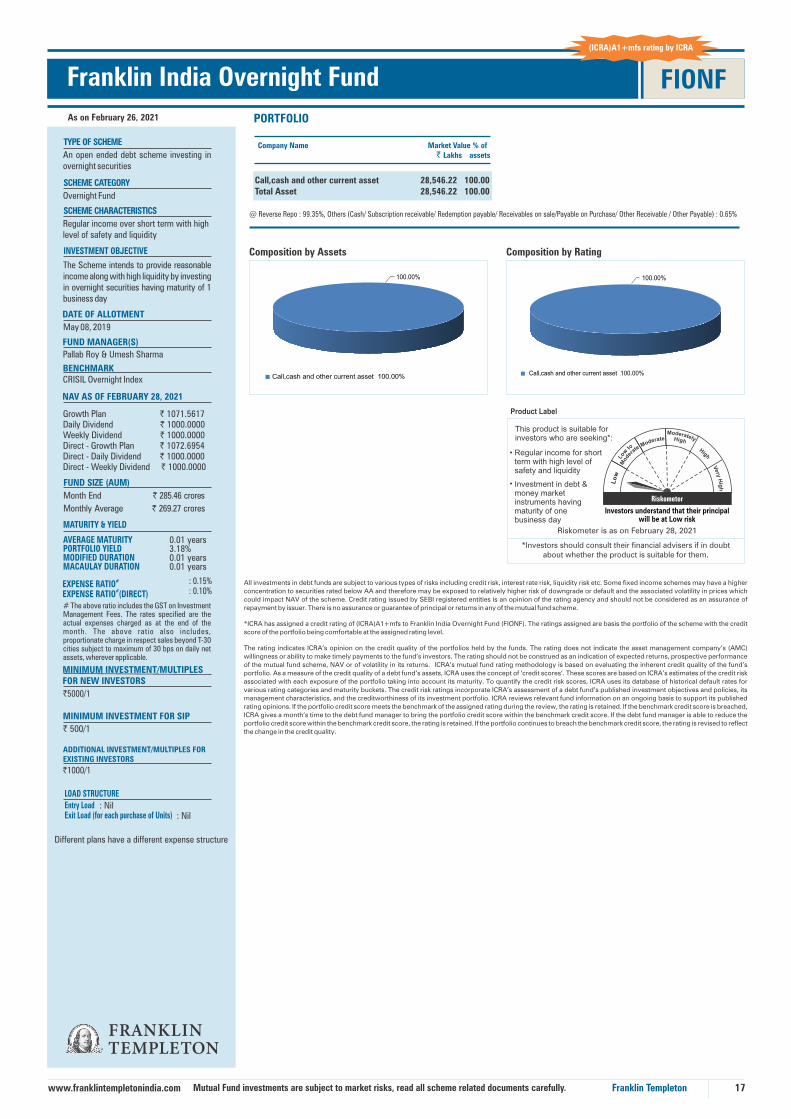
Company Name Market Value` Lakhs
% ofassets
17
As on February 26, 2021 PORTFOLIO
Franklin Templetonwww.franklintempletonindia.com
*Investors should consult their financial advisers if in doubtabout whether the product is suitable for them.
This product is suitable for investors who are seeking*:
• Regular income for short term with high level of safety and liquidity
• Investment in debt & money market instruments having maturity of one business day
Product Label
Franklin India Overnight Fund FIONF
@ Reverse Repo : 99.35%, Others (Cash/ Subscription receivable/ Redemption payable/ Receivables on sale/Payable on Purchase/ Other Receivable / Other Payable) : 0.65%
Call,cash and other current asset 28,546.22 100.00Total Asset 28,546.22 100.00
All investments in debt funds are subject to various types of risks including credit risk, interest rate risk, liquidity risk etc. Some fixed income schemes may have a higher
concentration to securities rated below AA and therefore may be exposed to relatively higher risk of downgrade or default and the associated volatility in prices which
could impact NAV of the scheme. Credit rating issued by SEBI registered entities is an opinion of the rating agency and should not be considered as an assurance of
repayment by issuer. There is no assurance or guarantee of principal or returns in any of the mutual fund scheme.
Mutual Fund investments are subject to market risks, read all scheme related documents carefully.
Composition by Assets
Call,cash and other current asset 100.00%
Composition by Rating
Call,cash and other current asset 100.00%
DATE OF ALLOTMENT
May 08, 2019
FUND MANAGER(S)
Pallab Roy & Umesh Sharma
MINIMUM INVESTMENT/MULTIPLES FOR NEW INVESTORS
`5000/1
AVERAGE MATURITYPORTFOLIO YIELD MODIFIED DURATIONMACAULAY DURATION
MATURITY & YIELD
0.01 years3.18%0.01 years0.01 years
#EXPENSE RATIO#EXPENSE RATIO (DIRECT)
: 0.15%: 0.10%
# The above ratio includes the GST on Investment Management Fees. The rates specified are the actual expenses charged as at the end of the month. The above ratio also includes, proportionate charge in respect sales beyond T-30 cities subject to maximum of 30 bps on daily net assets, wherever applicable.
FUND SIZE (AUM)
Month End ` 285.46 crores
Monthly Average ` 269.27 crores
INVESTMENT OBJECTIVE
The Scheme intends to provide reasonable income along with high liquidity by investing in overnight securities having maturity of 1 business day
Growth Plan ` 1071.5617Daily Dividend ` 1000.0000Weekly Dividend ` 1000.0000Direct - Growth Plan ` 1072.6954Direct - Daily Dividend ` 1000.0000Direct - Weekly Dividend ` 1000.0000
NAV AS OF FEBRUARY 28, 2021
TYPE OF SCHEME
An open ended debt scheme investing in overnight securities
BENCHMARKCRISIL Overnight Index
ADDITIONAL INVESTMENT/MULTIPLES FOR EXISTING INVESTORS
`1000/1
LOAD STRUCTURE
: NilEntry LoadExit Load (for each purchase of Units)
Different plans have a different expense structure
SCHEME CATEGORY
Overnight Fund
SCHEME CHARACTERISTICS
Regular income over short term with high level of safety and liquidity
MINIMUM INVESTMENT FOR SIP
` 500/1
: Nil
*ICRA has assigned a credit rating of (ICRA)A1+mfs to Franklin India Overnight Fund (FIONF). The ratings assigned are basis the portfolio of the scheme with the credit
score of the portfolio being comfortable at the assigned rating level.
The rating indicates ICRA’s opinion on the credit quality of the portfolios held by the funds. The rating does not indicate the asset management company’s (AMC)
willingness or ability to make timely payments to the fund’s investors. The rating should not be construed as an indication of expected returns, prospective performance
of the mutual fund scheme, NAV or of volatility in its returns. ICRA’s mutual fund rating methodology is based on evaluating the inherent credit quality of the fund’s
portfolio. As a measure of the credit quality of a debt fund’s assets, ICRA uses the concept of ‘credit scores’. These scores are based on ICRA’s estimates of the credit risk
associated with each exposure of the portfolio taking into account its maturity. To quantify the credit risk scores, ICRA uses its database of historical default rates for
various rating categories and maturity buckets. The credit risk ratings incorporate ICRA’s assessment of a debt fund’s published investment objectives and policies, its
management characteristics, and the creditworthiness of its investment portfolio. ICRA reviews relevant fund information on an ongoing basis to support its published
rating opinions. If the portfolio credit score meets the benchmark of the assigned rating during the review, the rating is retained. If the benchmark credit score is breached,
ICRA gives a month’s time to the debt fund manager to bring the portfolio credit score within the benchmark credit score. If the debt fund manager is able to reduce the
portfolio credit score within the benchmark credit score, the rating is retained. If the portfolio continues to breach the benchmark credit score, the rating is revised to reflect
the change in the credit quality.
(ICRA)A1+mfs rating by ICRA
100.00% 100.00%
Investors understand that their principal will be at Low risk
Riskometer is as on February 28, 2021
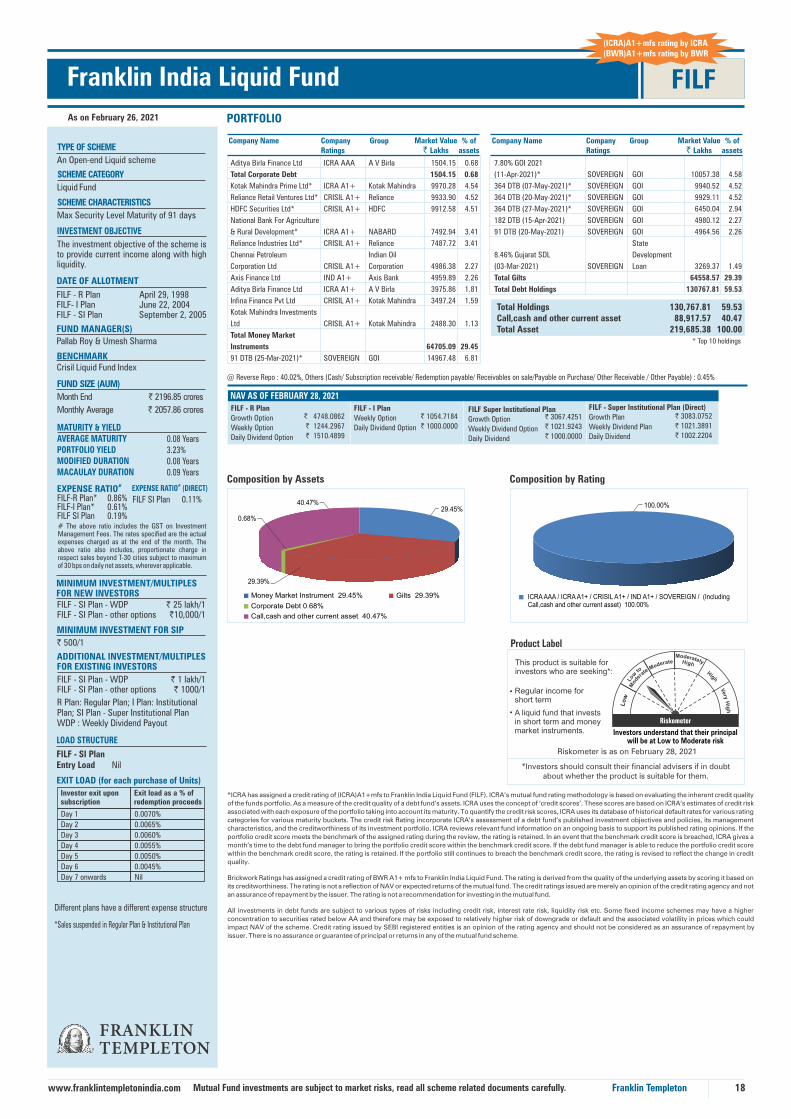
18
As on February 26, 2021
Franklin Templetonwww.franklintempletonindia.com
*Investors should consult their financial advisers if in doubt about whether the product is suitable for them.
This product is suitable for investors who are seeking*:
• Regular income for short term
• A liquid fund that invests in short term and money market instruments.
Product Label
Franklin India Liquid Fund FILF
(ICRA)A1+mfs rating by ICRA(BWR)A1+mfs rating by BWR
@ Reverse Repo : 40.02%, Others (Cash/ Subscription receivable/ Redemption payable/ Receivables on sale/Payable on Purchase/ Other Receivable / Other Payable) : 0.45%
DATE OF ALLOTMENT
FILF - R PlanFILF- I PlanFILF - SI Plan
April 29, 1998June 22, 2004September 2, 2005
FUND SIZE (AUM)
Month End ` 2196.85 crores
Monthly Average ` 2057.86 crores
INVESTMENT OBJECTIVE
The investment objective of the scheme is to provide current income along with high liquidity.
LOAD STRUCTURE
FILF - SI PlanEntry Load
EXIT LOAD (for each purchase of Units)
Nil
*Sales suspended in Regular Plan & Institutional Plan
FUND MANAGER(S)
Pallab Roy & Umesh Sharma
FILF - Super Institutional Plan (Direct)
Growth Plan
Weekly Dividend Plan
Daily Dividend
` 3083.0752
` 1021.3891
` 1002.2204
NAV AS OF FEBRUARY 28, 2021
FILF - R Plan
Growth Option
Weekly Option
Daily Dividend Option
` 4748.0862
` 1244.2967
` 1510.4899
FILF - I Plan
Weekly Option
Daily Dividend Option
` 1054.7184
` 1000.0000 ` 3067.4251
` 1021.9243
` 1000.0000
FILF Super Institutional Plan
Growth Option
Weekly Dividend Option
Daily Dividend
ADDITIONAL INVESTMENT/MULTIPLES FOR EXISTING INVESTORS
FILF - SI Plan - WDPFILF - SI Plan - other options
` 1 lakh/1` 1000/1
R Plan: Regular Plan; I Plan: InstitutionalPlan; SI Plan - Super Institutional PlanWDP : Weekly Dividend Payout
MINIMUM INVESTMENT/MULTIPLES FOR NEW INVESTORSFILF - SI Plan - WDPFILF - SI Plan - other options
` 25 lakh/1`10,000/1
MATURITY & YIELDAVERAGE MATURITYPORTFOLIO YIELD MODIFIED DURATIONMACAULAY DURATION
0.08 Years3.23%0.08 Years0.09 Years
#EXPENSE RATIO FILF-R Plan*FILF-I Plan*FILF SI Plan
0.86%0.61%0.19%
#EXPENSE RATIO (DIRECT)
FILF SI Plan 0.11%
# The above ratio includes the GST on Investment Management Fees. The rates specified are the actual expenses charged as at the end of the month. The above ratio also includes, proportionate charge in respect sales beyond T-30 cities subject to maximum of 30 bps on daily net assets, wherever applicable.
TYPE OF SCHEME
An Open-end Liquid scheme
BENCHMARKCrisil Liquid Fund Index
Composition by Rating
ICRA AAA / ICRA A1+ / CRISIL A1+ / IND A1+ / SOVEREIGN / (Including Call,cash and other current asset) 100.00%
*ICRA has assigned a credit rating of (ICRA)A1+mfs to Franklin India Liquid Fund (FILF). ICRA’s mutual fund rating methodology is based on evaluating the inherent credit quality
of the funds portfolio. As a measure of the credit quality of a debt fund’s assets. ICRA uses the concept of ‘credit scores’. These scores are based on ICRA’s estimates of credit risk
associated with each exposure of the portfolio taking into account its maturity. To quantify the credit risk scores, ICRA uses its database of historical default rates for various rating
categories for various maturity buckets. The credit risk Rating incorporate ICRA’s assessment of a debt fund’s published investment objectives and policies, its management
characteristics, and the creditworthiness of its investment portfolio. ICRA reviews relevant fund information on an ongoing basis to support its published rating opinions. If the
portfolio credit score meets the benchmark of the assigned rating during the review, the rating is retained. In an event that the benchmark credit score is breached, ICRA gives a
month’s time to the debt fund manager to bring the portfolio credit score within the benchmark credit score. If the debt fund manager is able to reduce the portfolio credit score
within the benchmark credit score, the rating is retained. If the portfolio still continues to breach the benchmark credit score, the rating is revised to reflect the change in credit
quality.
Brickwork Ratings has assigned a credit rating of BWR A1+ mfs to Franklin India Liquid Fund. The rating is derived from the quality of the underlying assets by scoring it based on
its creditworthiness. The rating is not a reflection of NAV or expected returns of the mutual fund. The credit ratings issued are merely an opinion of the credit rating agency and not
an assurance of repayment by the issuer. The rating is not a recommendation for investing in the mutual fund.
All investments in debt funds are subject to various types of risks including credit risk, interest rate risk, liquidity risk etc. Some fixed income schemes may have a higher
concentration to securities rated below AA and therefore may be exposed to relatively higher risk of downgrade or default and the associated volatility in prices which could
impact NAV of the scheme. Credit rating issued by SEBI registered entities is an opinion of the rating agency and should not be considered as an assurance of repayment by
issuer. There is no assurance or guarantee of principal or returns in any of the mutual fund scheme.
Different plans have a different expense structure
SCHEME CATEGORY
Liquid Fund
SCHEME CHARACTERISTICS
Max Security Level Maturity of 91 days
MINIMUM INVESTMENT FOR SIP
` 500/1
Mutual Fund investments are subject to market risks, read all scheme related documents carefully.
Investor exit upon subscription
Exit load as a % of redemption proceeds
Day 1 0.0070%
Day 2 0.0065%
Day 3 0.0060%
Day 4 0.0055%
Day 5 0.0050%
Day 6 0.0045%
Day 7 onwards Nil
Composition by Assets
Money Market Instrument 29.45%
Corporate Debt 0.68%
* Top 10 holdings
Total Holdings 130,767.81 59.53Call,cash and other current asset 88,917.57 40.47Total Asset 219,685.38 100.00
Company Name Group Market Value` Lakhs
% ofassets
Company Ratings
Company Name Market Value` Lakhs
% ofassets
7.80% GOI 2021
(11-Apr-2021)* SOVEREIGN GOI 10057.38 4.58
364 DTB (07-May-2021)* SOVEREIGN GOI 9940.52 4.52
364 DTB (20-May-2021)* SOVEREIGN GOI 9929.11 4.52
364 DTB (27-May-2021)* SOVEREIGN GOI 6450.04 2.94
182 DTB (15-Apr-2021) SOVEREIGN GOI 4980.12 2.27
91 DTB (20-May-2021) SOVEREIGN GOI 4964.56 2.26
State
8.46% Gujarat SDL Development
(03-Mar-2021) SOVEREIGN Loan 3269.37 1.49
Total Gilts 64558.57 29.39
Total Debt Holdings 130767.81 59.53
Aditya Birla Finance Ltd ICRA AAA A V Birla 1504.15 0.68
Total Corporate Debt 1504.15 0.68
Kotak Mahindra Prime Ltd* ICRA A1+ Kotak Mahindra 9970.28 4.54
Reliance Retail Ventures Ltd* CRISIL A1+ Reliance 9933.90 4.52
HDFC Securities Ltd* CRISIL A1+ HDFC 9912.58 4.51
National Bank For Agriculture
& Rural Development* ICRA A1+ NABARD 7492.94 3.41
Reliance Industries Ltd* CRISIL A1+ Reliance 7487.72 3.41
Chennai Petroleum Indian Oil
Corporation Ltd CRISIL A1+ Corporation 4986.38 2.27
Axis Finance Ltd IND A1+ Axis Bank 4959.89 2.26
Aditya Birla Finance Ltd ICRA A1+ A V Birla 3975.86 1.81
Infina Finance Pvt Ltd CRISIL A1+ Kotak Mahindra 3497.24 1.59
Kotak Mahindra Investments
Ltd CRISIL A1+ Kotak Mahindra 2488.30 1.13
Total Money Market
Instruments 64705.09 29.45
91 DTB (25-Mar-2021)* SOVEREIGN GOI 14967.48 6.81
GroupCompany Ratings
PORTFOLIO
Gilts 29.39%
Call,cash and other current asset 40.47%
29.45%40.47% 100.00%
29.39%
0.68%
Investors understand that their principal will be at Low to Moderate risk
Riskometer is as on February 28, 2021

19Franklin Templetonwww.franklintempletonindia.com
As on February 26, 2021
Franklin India Savings Fund FISF
Product Label
This product is suitable for investors who are seeking*:
•
•
short term
A money market fund that invests in money market instruments
Regular income for
*Investors should consult their financial advisers if in doubt about whether the product is suitable for them.
@ Reverse Repo : 15.11%, Others (Cash/ Subscription receivable/ Redemption payable/ Receivables on sale/Payable on Purchase/ Other Receivable / Other Payable) : -0.02%
Composition by Rating
CARE A1+ / IND A1+ / CRISIL A1+ / ICRA A1+ / SOVEREIGN / (Including Call,cash and other current asset) 100.00%
INVESTMENT OBJECTIVE
To provide income and liquidity consistent with the prudent risk from a portfolio comprising of money market instruments.
Pallab Roy & Umesh Sharma
FUND MANAGER(S)
NAV AS OF FEBRUARY 26, 2021
DATE OF ALLOTMENT (MAIN PORTFOLIO)Retail OptionInstitutional OptionSup. Institutional Option
Feb 11, 2002Sep 6, 2005May 9, 2007
FUND SIZE (AUM)Month End ` 1151.60 croresMonthly Average ` 1146.13 crores
MATURITY & YIELDAVERAGE MATURITYPORTFOLIO YIELD MODIFIED DURATIONMACAULAY DURATION
0.24 years3.43%0.23 years0.24 years
TYPE OF SCHEME
An open ended debt scheme investing in money market instruments
BENCHMARKNIFTY Money Market Index
LOAD STRUCTURE Entry LoadExit Load (for each purchase of Units)
Nil
Nil
MINIMUM INVESTMENT/MULTIPLES FOR NEW INVESTORSRetail Plan: `10,000/1
ADDITIONAL INVESTMENT/MULTIPLES FOR EXISTING INVESTORSRetail Plan: `1000/1
Different plans have a different expense structure
IND A1+mfs rating by India Ratings
“India Ratings and Research (Ind-Ra) has assigned a credit rating of “IND A1+mfs” to “Franklin India Savings Plus Fund”. Ind-Ra’s National Scale Money Market Fund Rating
primarily focuses on the investment objective of preservation of capital. India Ratings reviews, among other factors, applicable fund regulation, track record of the fund
industry, industry standards and practices. An India Ratings MMF rating is primarily based on an analysis of the fund’s investment policy. India Ratings expects MMFs to be
diversified and to adhere to conservative guidelines limiting credit, market and liquidity risks. India Ratings typically requests monthly portfolio holdings and relevant
performance statistics to actively monitor national scale MMF Ratings. Ratings do not guarantee the return profile or risk attached to the investments made. Ratings are not a
recommendation or suggestion, directly or indirectly, to you or any other person, to buy, sell, make or hold any investment, loan or security or to undertake any investment
strategy with respect to any investment, loan or security or any issuer. Ratings do not comment on the adequacy of market price, the suitability of any investment, loan or
security for a particular investor (including without limitation, any accounting and/or regulatory treatment), or the tax-exempt nature or taxability of payments made in respect
of any investment, loan or security. India Ratings is not your advisor, nor is India Ratings providing to you or any other party any financial advice, or any legal, auditing,
accounting, appraisal, valuation or actuarial services. A rating should not be viewed as a replacement for such advice or services.
This is a Simple and Performing scheme which is eligible for distribution by new cadre of distributors.
SCHEME CATEGORY
Money Market Fund
SCHEME CHARACTERISTICS
Money Market Instruments with Maturity upto 1 year
MINIMUM INVESTMENT FOR SIP
` 500/1
Mutual Fund investments are subject to market risks, read all scheme related documents carefully.
All investments in debt funds are subject to various types of risks including credit risk, interest rate risk, liquidity risk etc. Some fixed income schemes may have a higher
concentration to securities rated below AA and therefore may be exposed to relatively higher risk of downgrade or default and the associated volatility in prices which could
impact NAV of the scheme. Credit rating issued by SEBI registered entities is an opinion of the rating agency and should not be considered as an assurance of repayment by
issuer. There is no assurance or guarantee of principal or returns in any of the mutual fund scheme.
Composition by Assets
Money Market Instrument 65.22%
Call,cash and other current asset 15.09%
* Top 10 holdings
Total Holdings 97,780.52 84.91Call,cash and other current asset 17,379.06 15.09Total Asset 115,159.58 100.00
Company Name Group Market Value` Lakhs
% ofassets
Company Ratings
Company Name Market Value` Lakhs
% ofassets
National Bank For Agriculture
& Rural Development CRISIL A1+ NABARD 2425.17 2.11
National Bank For Agriculture
& Rural Development IND A1+ NABARD 2398.89 2.08
Aditya Birla Finance Ltd ICRA A1+ A V Birla 993.96 0.86
Total Money Market
Instruments 75104.56 65.22
182 DTB (04-Mar-2021)* SOVEREIGN GOI 9996.17 8.68
364 DTB (25-Mar-2021)* SOVEREIGN GOI 5188.73 4.51
364 DTB (11-Mar-2021)* SOVEREIGN GOI 4995.16 4.34
182 DTB (18-Mar-2021) SOVEREIGN GOI 2495.91 2.17
Total Gilts 22675.96 19.69
Total Debt Holdings 97780.52 84.91
Axis Bank Ltd* CRISIL A1+ Axis Bank 5001.95 4.34
Reliance Industries Ltd* CARE A1+ Reliance 4997.43 4.34
Bank of Baroda* CRISIL A1+ Bank Of Baroda 4995.79 4.34
Reliance Industries Ltd* CRISIL A1+ Reliance 4993.11 4.34
Bajaj Finance Ltd* CRISIL A1+ Sanjiv Bajaj 4992.73 4.34
Kotak Mahindra Investments
Ltd* CRISIL A1+ Kotak Mahindra 4988.69 4.33
Chennai Petroleum Indian Oil
Corporation Ltd* CRISIL A1+ Corporation 4986.38 4.33
Kotak Mahindra Prime Ltd ICRA A1+ Kotak Mahindra 4985.14 4.33
Reliance Retail Ventures Ltd CRISIL A1+ Reliance 4965.32 4.31
LIC Housing Finance Ltd CRISIL A1+ LIC 4924.09 4.28
ICICI Securities Ltd CRISIL A1+ ICICI 4905.21 4.26
Kotak Mahindra Bank Ltd CRISIL A1+ Kotak Mahindra 4806.41 4.17
Bajaj Housing Finance Ltd IND A1+ Sanjiv Bajaj 4786.16 4.16
Housing Development
Finance Corporation Ltd CRISIL A1+ HDFC 2497.52 2.17
Power Finance Corporation
Ltd CARE A1+ PFC 2460.65 2.14
GroupCompany Ratings
PORTFOLIO
Gilts 19.69%
#EXPENSE RATIO : 0.28% (Retail)
: 0.13% (Retail)#EXPENSE RATIO (Direct)
# The above ratio includes the GST on Investment Management Fees. The rates specified are the actual expenses charged as at the end of the month. The above ratio also includes, proportionate charge in respect sales beyond T-30 cities subject to maximum of 30 bps on daily net assets, wherever applicable.
All investors have redeemed from the Institutional Plan in FISF effective June 19, 2020 and this Plan has been closed for subscription / redemption
100.00%65.22%15.09%
19.69%
Retail PlanGrowth Plan ` 38.7831Quarterly Dividend ` 10.6563Monthly Dividend ` 10.1202Daily Dividend ` 10.1099Retail Plan (Direct)Growth Plan ` 39.7942Quarterly Dividend ` 11.0493Monthly Dividend ` 10.4638Daily Dividend ` 10.1198
Investors understand that their principal will be at Low to Moderate risk
Riskometer is as on February 28, 2021

20Franklin Templetonwww.franklintempletonindia.com
As on February 26, 2021
Franklin India Floating Rate Fund FIFRF
MINIMUM INVESTMENT/MULTIPLES FOR NEW INVESTORS
`1000/1
DATE OF ALLOTMENT
April 23, 2001
FUND MANAGER(S)
Pallab Roy, Umesh Sharma
INVESTMENT OBJECTIVE
To provide income and liquidity consistent with the prudent risk from a portfolio comprising of floating rate debt instruments, fixed rate debt instruments swapped for floating rate return, and also fixed rate i n s t r u m e n t s a n d m o n e y m a r k e t instruments.
BENCHMARKCrisil Liquid Fund Index.
ADDITIONAL INVESTMENT/MULTIPLES FOR EXISTING INVESTORS
`1000/1
LOAD STRUCTURE
NilEntry LoadExit Load (for each purchase of Units) Nil
Product Label
This product is suitable for investors who are seeking*:
• Regular income for short term
• A fund that invests primarily in floating rate and short term fixed rate debt instruments.
*Investors should consult their financial advisers if in doubt about whether the product is suitable for them.
TYPE OF SCHEME
A n o p e n e n d e d d e b t s c h e m e predominantly investing in floating rate instruments ( including f ixed rate instruments converted to floating rate exposures using swaps/ derivatives)
#EXPENSE RATIO#EXPENSE RATIO (DIRECT)
: 0.96%: 0.41%
# The above ratio includes the GST on Investment Management Fees. The rates specified are the actual expenses charged as at the end of the month. The above ratio also includes, proportionate charge in respect sales beyond T-30 cities subject to maximum of 30 bps on daily net assets, wherever applicable.
AVERAGE MATURITYPORTFOLIO YIELD MODIFIED DURATIONMACAULAY DURATION
MATURITY & YIELD
2.20 years4.17%0.40 years0.42 years
FUND SIZE (AUM)Month End ` 314.78 croresMonthly Average ` 260.06 crores
Growth Plan ` 31.2606Dividend Plan ` 10.1441Direct - Growth Plan ` 33.0968Direct - Dividend Plan ` 10.0474
NAV AS OF FEBRUARY 26, 2021
Composition by Rating
ICRA AAA / CRISIL AAA / CRISIL A1+ / SOVEREIGN / (Including Call,cash and other current asset) 93.68%
CARE AA- / ICRA AA 6.32%
@ Reverse Repo : 25.33%, Others (Cash/ Subscription receivable/ Redemption payable/ Receivables on sale/Payable on Purchase/ Other Receivable / Other Payable) : 0.30%
Different plans have a different expense structure
SCHEME CATEGORY
Floater Fund
SCHEME CHARACTERISTICS
Min 65% in Floating Rate Instruments
MINIMUM INVESTMENT FOR SIP
` 500/1
Mutual Fund investments are subject to market risks, read all scheme related documents carefully.
Composition by Assets
Gilts 44.31%
Money Market Instrument 7.76%
Corporate Debt 22.30%
All investments in debt funds are subject to various types of risks including credit risk, interest rate risk, liquidity risk etc. Some fixed income schemes may have a higher
concentration to securities rated below AA and therefore may be exposed to relatively higher risk of downgrade or default and the associated volatility in prices which could
impact NAV of the scheme. Credit rating issued by SEBI registered entities is an opinion of the rating agency and should not be considered as an assurance of repayment by
issuer. There is no assurance or guarantee of principal or returns in any of the mutual fund scheme.
Total Holdings 23,410.25 74.37Call,cash and other current asset 8,067.62 25.63Total Asset 31,477.87 100.00
Company Name Group Market Value` Lakhs
% ofassets
Company Ratings
Company Name Market Value` Lakhs
% ofassets
GOI FRB 2031
(07-Dec-2031)* SOVEREIGN GOI 3000.00 9.53
6.17% GOI 2021
(15-Jul-2021)* SOVEREIGN GOI 2525.60 8.02
182 DTB (12-Aug-2021)* SOVEREIGN GOI 2461.60 7.82
6.84% GOI 2022
(19-Dec-2022) SOVEREIGN GOI 521.55 1.66
Total Gilts 13949.40 44.31
Total Debt Holdings 23410.25 74.37
Aditya Birla Housing Finance
Ltd* ICRA AAA A V Birla 2525.37 8.02
HDB Financial Services Ltd* CRISIL AAA HDFC 2504.91 7.96
Indostar Capital Finance Ltd* CARE AA- Indostar 1002.38 3.18
JM Financial Credit Solutions
Ltd* ICRA AA JM Financial 985.87 3.13
Total Corporate Debt 7018.54 22.30
Kotak Mahindra Bank Ltd* CRISIL A1+ Kotak Mahindra 1441.92 4.58
Axis Bank Ltd* CRISIL A1+ Axis Bank 1000.39 3.18
Total Money Market
Instruments 2442.31 7.76
GOI FRB 2024
(07-Nov-2024)* SOVEREIGN GOI 5440.64 17.28
GroupCompany Ratings
PORTFOLIO
93.68%6.32%
44.31%
25.63%
7.76%
Mayank Bukrediwala* (effective August 24, 2020) (dedicated for making investments for Foreign Securities)
* Pyari Menon (dedicated for making investments for Foreign Securities) ceased to be a Fund Manager for the scheme effective August 23, 2020. Please refer the addendum on the website for further details.
Call,cash and other current asset 25.63%
22.30%
Investors understand that their principal will be at Low to Moderate risk
Riskometer is as on February 28, 2021
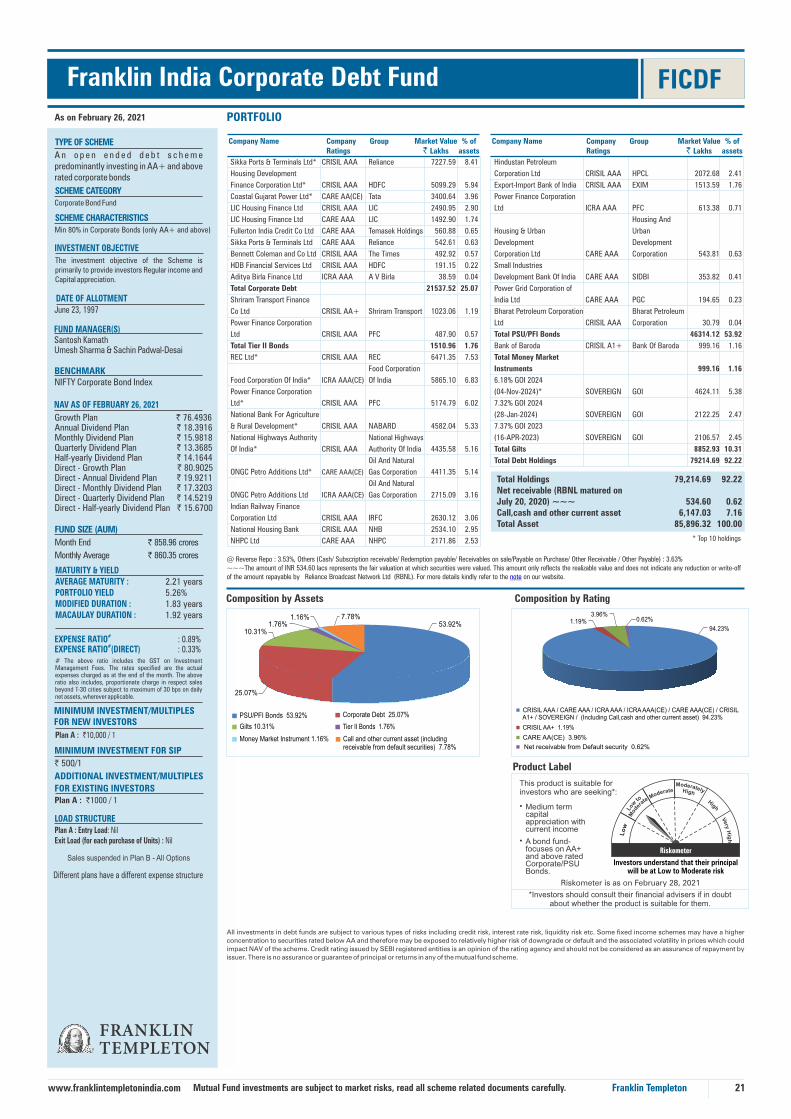
21
As on February 26, 2021
Franklin Templetonwww.franklintempletonindia.com
Franklin India Corporate Debt Fund FICDF
@ Reverse Repo : 3.53%, Others (Cash/ Subscription receivable/ Redemption payable/ Receivables on sale/Payable on Purchase/ Other Receivable / Other Payable) : 3.63%~~~The amount of INR 534.60 lacs represents the fair valuation at which securities were valued. This amount only reflects the realizable value and does not indicate any reduction or write-off of the amount repayable by Reliance Broadcast Network Ltd (RBNL). For more details kindly refer to the on our website. note
*Investors should consult their financial advisers if in doubt about whether the product is suitable for them.
This product is suitable for investors who are seeking*:
• Medium term capital appreciation with current income
• A bond fund-focuses on AA+ and above rated Corporate/PSU Bonds.
Product Label
DATE OF ALLOTMENTJune 23, 1997
FUND MANAGER(S)Santosh Kamath Umesh Sharma & Sachin Padwal-Desai
MINIMUM INVESTMENT/MULTIPLES FOR NEW INVESTORS
Plan A : `10,000 / 1
LOAD STRUCTUREPlan A : Entry Load: NilExit Load (for each purchase of Units) : Nil
Sales suspended in Plan B - All Options
#EXPENSE RATIO#EXPENSE RATIO (DIRECT)
: 0.89%: 0.33%
# The above ratio includes the GST on Investment Management Fees. The rates specified are the actual expenses charged as at the end of the month. The above ratio also includes, proportionate charge in respect sales beyond T-30 cities subject to maximum of 30 bps on daily net assets, wherever applicable.
NAV AS OF FEBRUARY 26, 2021
Growth Plan ` 76.4936Annual Dividend Plan ` 18.3916Monthly Dividend Plan ` 15.9818Quarterly Dividend Plan ` 13.3685Half-yearly Dividend Plan ` 14.1644Direct - Growth Plan ̀ 80.9025Direct - Annual Dividend Plan ` 19.9211Direct - Monthly Dividend Plan ` 17.3203Direct - Quarterly Dividend Plan ` 14.5219Direct - Half-yearly Dividend Plan ` 15.6700
FUND SIZE (AUM)
Month End ` 858.96 crores
Monthly Average ` 860.35 crores
INVESTMENT OBJECTIVE
The investment objective of the Scheme is primarily to provide investors Regular income and Capital appreciation.
ADDITIONAL INVESTMENT/MULTIPLES
FOR EXISTING INVESTORSPlan A : `1000 / 1
MATURITY & YIELDAVERAGE MATURITY :PORTFOLIO YIELD MODIFIED DURATION :MACAULAY DURATION :
2.21 years5.26%1.83 years1.92 years
TYPE OF SCHEME
A n o p e n e n d e d d e b t s c h e m e predominantly investing in AA+ and above rated corporate bonds
BENCHMARKNIFTY Corporate Bond Index
Composition by Rating
Different plans have a different expense structure
CRISIL AAA / CARE AAA / ICRA AAA / ICRA AAA(CE) / CARE AAA(CE) / CRISIL A1+ / SOVEREIGN / (Including Call,cash and other current asset) 94.23%
CRISIL AA+ 1.19%
CARE AA(CE) 3.96%
Net receivable from Default security 0.62%
SCHEME CATEGORYCorporate Bond Fund
SCHEME CHARACTERISTICSMin 80% in Corporate Bonds (only AA+ and above)
MINIMUM INVESTMENT FOR SIP
` 500/1
Mutual Fund investments are subject to market risks, read all scheme related documents carefully.
All investments in debt funds are subject to various types of risks including credit risk, interest rate risk, liquidity risk etc. Some fixed income schemes may have a higher
concentration to securities rated below AA and therefore may be exposed to relatively higher risk of downgrade or default and the associated volatility in prices which could
impact NAV of the scheme. Credit rating issued by SEBI registered entities is an opinion of the rating agency and should not be considered as an assurance of repayment by
issuer. There is no assurance or guarantee of principal or returns in any of the mutual fund scheme.
Composition by Assets
PSU/PFI Bonds 53.92% Corporate Debt 25.07%
Gilts 10.31% Tier II Bonds 1.76%
PORTFOLIO
* Top 10 holdings
Total Holdings 79,214.69 92.22Net receivable (RBNL matured on July 20, 2020) ~~~ 534.60 0.62Call,cash and other current asset 6,147.03 7.16Total Asset 85,896.32 100.00
Company Name Group Market Value` Lakhs
% ofassets
Company Ratings
Company Name Market Value` Lakhs
% ofassets
Sikka Ports & Terminals Ltd* CRISIL AAA Reliance 7227.59 8.41
Housing Development
Finance Corporation Ltd* CRISIL AAA HDFC 5099.29 5.94
Coastal Gujarat Power Ltd* CARE AA(CE) Tata 3400.64 3.96
LIC Housing Finance Ltd CRISIL AAA LIC 2490.95 2.90
LIC Housing Finance Ltd CARE AAA LIC 1492.90 1.74
Fullerton India Credit Co Ltd CARE AAA Temasek Holdings 560.88 0.65
Sikka Ports & Terminals Ltd CARE AAA Reliance 542.61 0.63
Bennett Coleman and Co Ltd CRISIL AAA The Times 492.92 0.57
HDB Financial Services Ltd CRISIL AAA HDFC 191.15 0.22
Aditya Birla Finance Ltd ICRA AAA A V Birla 38.59 0.04
Total Corporate Debt 21537.52 25.07
Shriram Transport Finance
Co Ltd CRISIL AA+ Shriram Transport 1023.06 1.19
Power Finance Corporation
Ltd CRISIL AAA PFC 487.90 0.57
Total Tier II Bonds 1510.96 1.76
REC Ltd* CRISIL AAA REC 6471.35 7.53
Food Corporation
Food Corporation Of India* ICRA AAA(CE) Of India 5865.10 6.83
Power Finance Corporation
Ltd* CRISIL AAA PFC 5174.79 6.02
National Bank For Agriculture
& Rural Development* CRISIL AAA NABARD 4582.04 5.33
National Highways Authority National Highways
Of India* CRISIL AAA Authority Of India 4435.58 5.16
Oil And Natural
ONGC Petro Additions Ltd* CARE AAA(CE) Gas Corporation 4411.35 5.14
Oil And Natural
ONGC Petro Additions Ltd ICRA AAA(CE) Gas Corporation 2715.09 3.16
Indian Railway Finance
Corporation Ltd CRISIL AAA IRFC 2630.12 3.06
National Housing Bank CRISIL AAA NHB 2534.10 2.95
NHPC Ltd CARE AAA NHPC 2171.86 2.53
GroupCompany Ratings
Hindustan Petroleum
Corporation Ltd CRISIL AAA HPCL 2072.68 2.41
Export-Import Bank of India CRISIL AAA EXIM 1513.59 1.76
Power Finance Corporation
Ltd ICRA AAA PFC 613.38 0.71
Housing And
Housing & Urban Urban
Development Development
Corporation Ltd CARE AAA Corporation 543.81 0.63
Small Industries
Development Bank Of India CARE AAA SIDBI 353.82 0.41
Power Grid Corporation of
India Ltd CARE AAA PGC 194.65 0.23
Bharat Petroleum Corporation Bharat Petroleum
Ltd CRISIL AAA Corporation 30.79 0.04
Total PSU/PFI Bonds 46314.12 53.92
Bank of Baroda CRISIL A1+ Bank Of Baroda 999.16 1.16
Total Money Market
Instruments 999.16 1.16
6.18% GOI 2024
(04-Nov-2024)* SOVEREIGN GOI 4624.11 5.38
7.32% GOI 2024
(28-Jan-2024) SOVEREIGN GOI 2122.25 2.47
7.37% GOI 2023
(16-APR-2023) SOVEREIGN GOI 2106.57 2.45
Total Gilts 8852.93 10.31
Total Debt Holdings 79214.69 92.22
Money Market Instrument 1.16% Call and other current asset (including receivable from default securities) 7.78%
53.92%
25.07%
7.78%1.16%1.76%
10.31% 94.23%
3.96%1.19% 0.62%
Investors understand that their principal will be at Low to Moderate risk
Riskometer is as on February 28, 2021
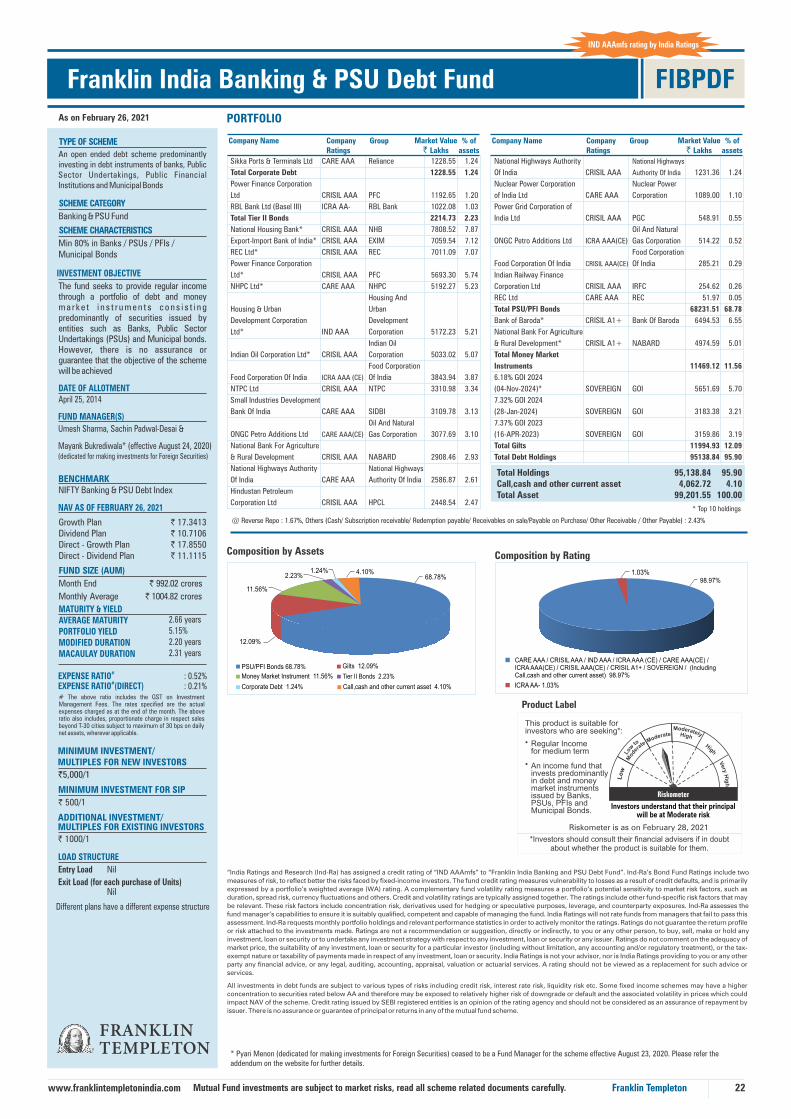
Franklin India Banking & PSU Debt Fund FIBPDFAs on February 26, 2021
INVESTMENT OBJECTIVE
Umesh Sharma, Sachin Padwal-Desai &
FUND MANAGER(S)
LOAD STRUCTURE
Entry Load
Exit Load (for each purchase of Units)
Nil
Nil
The fund seeks to provide regular income through a portfolio of debt and money m a r ke t i n s t r u m e n t s c o n s i s t i n g predominantly of securities issued by entities such as Banks, Public Sector Undertakings (PSUs) and Municipal bonds. However, there is no assurance or guarantee that the objective of the scheme will be achieved
DATE OF ALLOTMENTApril 25, 2014
NAV AS OF FEBRUARY 26, 2021
Growth Plan ` 17.3413Dividend Plan ` 10.7106Direct - Growth Plan ` 17.8550Direct - Dividend Plan ` 11.1115
FUND SIZE (AUM)
Month End ` 992.02 crores
Monthly Average ` 1004.82 crores
22Franklin Templetonwww.franklintempletonindia.com
TYPE OF SCHEME
An open ended debt scheme predominantly investing in debt instruments of banks, Public Sector Undertakings, Public Financial Institutions and Municipal Bonds
BENCHMARKNIFTY Banking & PSU Debt Index
# The above ratio includes the GST on Investment Management Fees. The rates specified are the actual expenses charged as at the end of the month. The above ratio also includes, proportionate charge in respect sales beyond T-30 cities subject to maximum of 30 bps on daily net assets, wherever applicable.
#EXPENSE RATIO#EXPENSE RATIO (DIRECT)
: 0.52%: 0.21%
MATURITY & YIELDAVERAGE MATURITYPORTFOLIO YIELD MODIFIED DURATIONMACAULAY DURATION
2.66 years5.15%2.20 years2.31 years
Product Label
*Investors should consult their financial advisers if in doubt about whether the product is suitable for them.
This product is suitable for investors who are seeking*:
• Regular Income for medium term
• An income fund that invests predominantly in debt and money market instruments issued by Banks, PSUs, PFIs and Municipal Bonds.
IND AAAmfs rating by India Ratings
MINIMUM INVESTMENT/MULTIPLES FOR NEW INVESTORS
`5,000/1
ADDITIONAL INVESTMENT/MULTIPLES FOR EXISTING INVESTORS
` 1000/1
Composition by Rating
CARE AAA / CRISIL AAA / IND AAA / ICRA AAA (CE) / CARE AAA(CE) / ICRA AAA(CE) / CRISIL AAA(CE) / CRISIL A1+ / SOVEREIGN / (Including Call,cash and other current asset) 98.97%
ICRA AA- 1.03%
@ Reverse Repo : 1.67%, Others (Cash/ Subscription receivable/ Redemption payable/ Receivables on sale/Payable on Purchase/ Other Receivable / Other Payable) : 2.43%
“India Ratings and Research (Ind-Ra) has assigned a credit rating of “IND AAAmfs” to “Franklin India Banking and PSU Debt Fund”. Ind-Ra’s Bond Fund Ratings include two
measures of risk, to reflect better the risks faced by fixed-income investors. The fund credit rating measures vulnerability to losses as a result of credit defaults, and is primarily
expressed by a portfolio’s weighted average (WA) rating. A complementary fund volatility rating measures a portfolio’s potential sensitivity to market risk factors, such as
duration, spread risk, currency fluctuations and others. Credit and volatility ratings are typically assigned together. The ratings include other fund-specific risk factors that may
be relevant. These risk factors include concentration risk, derivatives used for hedging or speculative purposes, leverage, and counterparty exposures. Ind-Ra assesses the
fund manager’s capabilities to ensure it is suitably qualified, competent and capable of managing the fund. India Ratings will not rate funds from managers that fail to pass this
assessment. Ind-Ra requests monthly portfolio holdings and relevant performance statistics in order to actively monitor the ratings. Ratings do not guarantee the return profile
or risk attached to the investments made. Ratings are not a recommendation or suggestion, directly or indirectly, to you or any other person, to buy, sell, make or hold any
investment, loan or security or to undertake any investment strategy with respect to any investment, loan or security or any issuer. Ratings do not comment on the adequacy of
market price, the suitability of any investment, loan or security for a particular investor (including without limitation, any accounting and/or regulatory treatment), or the tax-
exempt nature or taxability of payments made in respect of any investment, loan or security. India Ratings is not your advisor, nor is India Ratings providing to you or any other
party any financial advice, or any legal, auditing, accounting, appraisal, valuation or actuarial services. A rating should not be viewed as a replacement for such advice or
services.
Different plans have a different expense structure
SCHEME CATEGORY
Banking & PSU Fund
SCHEME CHARACTERISTICS
Min 80% in Banks / PSUs / PFIs / Municipal Bonds
MINIMUM INVESTMENT FOR SIP
` 500/1
Mutual Fund investments are subject to market risks, read all scheme related documents carefully.
All investments in debt funds are subject to various types of risks including credit risk, interest rate risk, liquidity risk etc. Some fixed income schemes may have a higher
concentration to securities rated below AA and therefore may be exposed to relatively higher risk of downgrade or default and the associated volatility in prices which could
impact NAV of the scheme. Credit rating issued by SEBI registered entities is an opinion of the rating agency and should not be considered as an assurance of repayment by
issuer. There is no assurance or guarantee of principal or returns in any of the mutual fund scheme.
Composition by Assets
PSU/PFI Bonds 68.78% Gilts 12.09%
Money Market Instrument 11.56% Tier II Bonds 2.23%
* Top 10 holdings
Total Holdings 95,138.84 95.90Call,cash and other current asset 4,062.72 4.10Total Asset 99,201.55 100.00
Company Name Group Market Value` Lakhs
% ofassets
Company Ratings
Company Name Market Value` Lakhs
% ofassets
National Highways Authority National Highways
Of India CRISIL AAA Authority Of India 1231.36 1.24
Nuclear Power Corporation Nuclear Power
of India Ltd CARE AAA Corporation 1089.00 1.10
Power Grid Corporation of
India Ltd CRISIL AAA PGC 548.91 0.55
Oil And Natural
ONGC Petro Additions Ltd ICRA AAA(CE) Gas Corporation 514.22 0.52
Food Corporation
Food Corporation Of India CRISIL AAA(CE) Of India 285.21 0.29
Indian Railway Finance
Corporation Ltd CRISIL AAA IRFC 254.62 0.26
REC Ltd CARE AAA REC 51.97 0.05
Total PSU/PFI Bonds 68231.51 68.78
Bank of Baroda* CRISIL A1+ Bank Of Baroda 6494.53 6.55
National Bank For Agriculture
& Rural Development* CRISIL A1+ NABARD 4974.59 5.01
Total Money Market
Instruments 11469.12 11.56
6.18% GOI 2024
(04-Nov-2024)* SOVEREIGN GOI 5651.69 5.70
7.32% GOI 2024
(28-Jan-2024) SOVEREIGN GOI 3183.38 3.21
7.37% GOI 2023
(16-APR-2023) SOVEREIGN GOI 3159.86 3.19
Total Gilts 11994.93 12.09
Total Debt Holdings 95138.84 95.90
Sikka Ports & Terminals Ltd CARE AAA Reliance 1228.55 1.24
Total Corporate Debt 1228.55 1.24
Power Finance Corporation
Ltd CRISIL AAA PFC 1192.65 1.20
RBL Bank Ltd (Basel III) ICRA AA- RBL Bank 1022.08 1.03
Total Tier II Bonds 2214.73 2.23
National Housing Bank* CRISIL AAA NHB 7808.52 7.87
Export-Import Bank of India* CRISIL AAA EXIM 7059.54 7.12
REC Ltd* CRISIL AAA REC 7011.09 7.07
Power Finance Corporation
Ltd* CRISIL AAA PFC 5693.30 5.74
NHPC Ltd* CARE AAA NHPC 5192.27 5.23
Housing And
Housing & Urban Urban
Development Corporation Development
Ltd* IND AAA Corporation 5172.23 5.21
Indian Oil
Indian Oil Corporation Ltd* CRISIL AAA Corporation 5033.02 5.07
Food Corporation
Food Corporation Of India ICRA AAA (CE) Of India 3843.94 3.87
NTPC Ltd CRISIL AAA NTPC 3310.98 3.34
Small Industries Development
Bank Of India CARE AAA SIDBI 3109.78 3.13
Oil And Natural
ONGC Petro Additions Ltd CARE AAA(CE) Gas Corporation 3077.69 3.10
National Bank For Agriculture
& Rural Development CRISIL AAA NABARD 2908.46 2.93
National Highways Authority National Highways
Of India CARE AAA Authority Of India 2586.87 2.61
Hindustan Petroleum
Corporation Ltd CRISIL AAA HPCL 2448.54 2.47
GroupCompany Ratings
PORTFOLIO
Corporate Debt 1.24% Call,cash and other current asset 4.10%
68.78%4.10%1.24%
2.23%
11.56%
12.09%
1.03%98.97%
Mayank Bukrediwala* (effective August 24, 2020) (dedicated for making investments for Foreign Securities)
* Pyari Menon (dedicated for making investments for Foreign Securities) ceased to be a Fund Manager for the scheme effective August 23, 2020. Please refer the addendum on the website for further details.
Investors understand that their principal will be at Moderate risk
Riskometer is as on February 28, 2021

PORTFOLIO
23
As on February 26, 2021
Franklin Templetonwww.franklintempletonindia.com
FUND MANAGER(S)
Sachin Padwal - Desai & Umesh Sharma
INVESTMENT OBJECTIVE
The Primary objective of the Scheme is to generate return through investments in sovereign securities issued by the Central Government and / or a State Government and / or any security unconditionally guaranteed by the central Government and / or State Government for repayment of Principal and Interest
DATE OF ALLOTMENTDecember 7, 2001
Franklin India Government Securities Fund
# The above ratio includes the GST on Investment Management Fees. The rates specified are the actual expenses charged as at the end of the month. The above ratio also includes, proportionate charge in respect sales beyond T-30 cities subject to maximum of 30 bps on daily net assets, wherever applicable.
NAV AS OF FEBRUARY 26, 2021
FIGSFGrowth Plan ` 46.6061Quarterly Dividend Plan ` 10.5007
FIGSF (Direct)Growth Plan ` 50.0114Quarterly Dividend Plan ̀ 11.5875
FUND SIZE (AUM)
Month End ` 232.19 croresMonthly Average ` 234.98 crores
FIGSF
Product Label - FIGSF
This product is suitable for investors who are seeking*:
• Medium term capital appreciation with current income
• A fund that invests in Indian government securities
*Investors should consult their financial advisers if in doubt about whether the product is suitable for them.
LOAD STRUCTURE
Entry Load: Nil Exit Load (for each purchase of Units)*: Nil*CDSC is treated similarly
ADDITIONAL INVESTMENT/MULTIPLES FOR EXISTING INVESTORS` 1000/1
MINIMUM INVESTMENT FOR NEW / EXISTING INVESTORS ` 10,000/1 (G);
` 25,000/1 (D);
TYPE OF SCHEME
An open ended debt scheme investing in government securities across maturity
BENCHMARKI-SEC Li-Bex
Composition by Assets
Gilts 95.46% Call,cash and other current asset 4.54%
Composition by Rating
SOVEREIGN / (Including Call,cash and other current asset) 100.00%
@ Reverse Repo : 3.00%, Others (Cash/ Subscription receivable/ Redemption payable/ Receivables on sale/Payable on Purchase/ Other Receivable / Other Payable) : 1.54%
Different plans have a different expense structure
Franklin India Government Securities Fund (FIGSF) - Composite and PF Plan (Merging Plans) to be merged into FIGSF – Long Term Plan (Surviving Plan) effective June 4, 2018.
5.83 years5.73%4.43 years4.57 years
MATURITY & YIELDAVERAGE MATURITY PORTFOLIO YIELDMODIFIED DURATION MACAULAY DURATION
SCHEME CATEGORY
Gilt Fund
SCHEME CHARACTERISTICS
Min 80% in G-secs (across maturity)
MINIMUM INVESTMENT FOR SIP
` 500/1
Mutual Fund investments are subject to market risks, read all scheme related documents carefully.
#EXPENSE RATIO #EXPENSE RATIO (DIRECT)
All investments in debt funds are subject to various types of risks including credit risk, interest rate risk, liquidity risk etc. Some fixed income schemes may have a higher
concentration to securities rated below AA and therefore may be exposed to relatively higher risk of downgrade or default and the associated volatility in prices which
could impact NAV of the scheme. Credit rating issued by SEBI registered entities is an opinion of the rating agency and should not be considered as an assurance of
repayment by issuer. There is no assurance or guarantee of principal or returns in any of the mutual fund scheme.
Company Name Group Market Value` Lakhs
% ofassets
Company Ratings
5.15% GOI 2025 (09-Nov-2025) SOVEREIGN GOI 5362.75 23.10
6.79% GOI 2027 (15-May-2027) SOVEREIGN GOI 5348.38 23.03
7.17% GOI 2028 (08-Jan-2028) SOVEREIGN GOI 3599.60 15.50
6.22% GOI 2035 (16-Mar-2035) SOVEREIGN GOI 2842.55 12.24
364 DTB (25-Mar-2021) SOVEREIGN GOI 2494.58 10.74
7.27% GOI 2026 (08-Apr-2026) SOVEREIGN GOI 2002.40 8.62
7.32% GOI 2024 (28-Jan-2024) SOVEREIGN GOI 318.34 1.37
5.22% GOI 2025 (15-Jun-2025) SOVEREIGN GOI 196.50 0.85
Total Gilts 22165.10 95.46
Total Debt Holdings 22165.10 95.46
Total Holdings 22,165.10 95.46Call,cash and other current asset 1,054.32 4.54Total Asset 23,219.41 100.00
: 1.02%: 0.61%
100.00%4.54%95.46%
Investors understand that their principal will be at Moderate risk
Riskometer is as on February 28, 2021
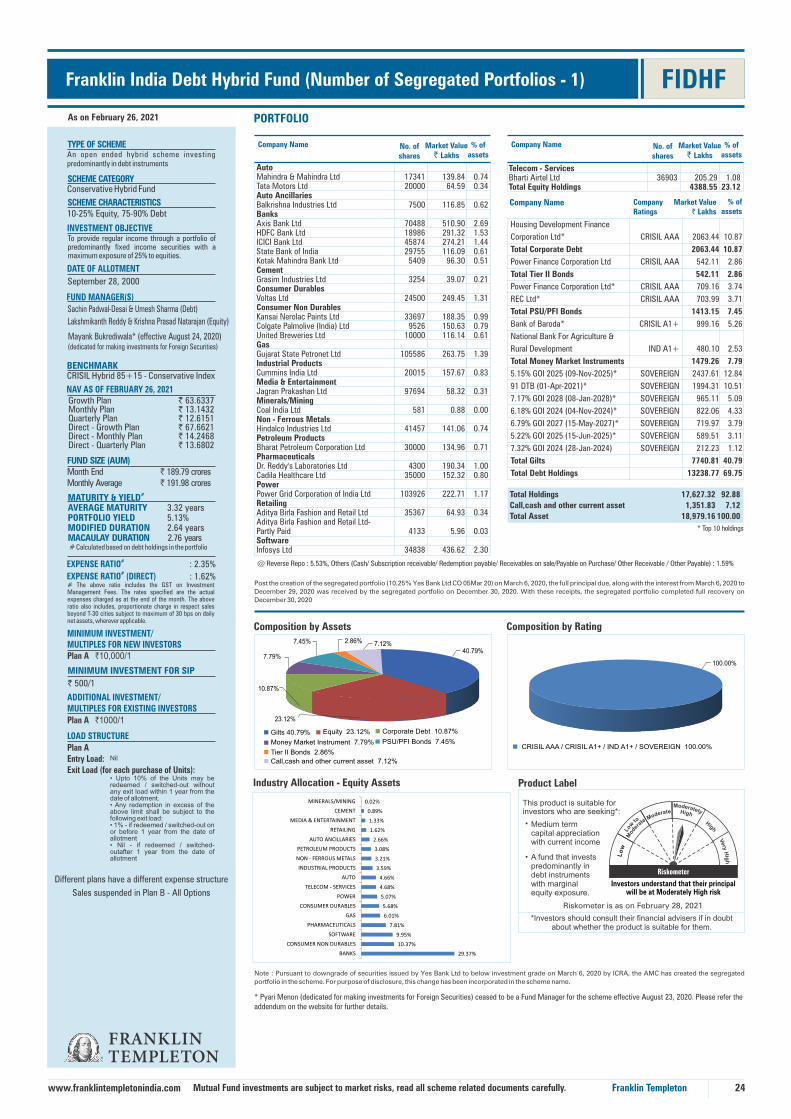
FIDHFFranklin India Debt Hybrid Fund (Number of Segregated Portfolios - 1)
24
@ Reverse Repo : 5.53%, Others (Cash/ Subscription receivable/ Redemption payable/ Receivables on sale/Payable on Purchase/ Other Receivable / Other Payable) : 1.59%
LOAD STRUCTURE
Plan AEntry Load:Exit Load (for each purchase of Units):
Nil
• Upto 10% of the Units may be redeemed without / switched-outany exit load within 1 year from the date of allotment.• Any redemption in excess of the above limit shall be subject to the following exit load:• 1% - if redeemed on / switched-outor before 1 year from the date of allotment• Nil - if redeemed / switched-outafter 1 year from the date of allotment
Sales suspended in Plan B - All Options
As on February 26, 2021
Franklin Templetonwww.franklintempletonindia.com
#EXPENSE RATIO#EXPENSE RATIO (DIRECT)
: 2.35%
: 1.62%# The above ratio includes the GST on Investment Management Fees. The rates specified are the actual expenses charged as at the end of the month. The above ratio also includes, proportionate charge in respect sales beyond T-30 cities subject to maximum of 30 bps on daily net assets, wherever applicable.
NAV AS OF FEBRUARY 26, 2021Growth Plan ` 63.6337Monthly Plan ` 13.1432Quarterly Plan ` 12.6151Direct - Growth Plan ` 67.6621Direct - Monthly Plan ` 14.2468Direct - Quarterly Plan ` 13.6802
FUND MANAGER(S)
DATE OF ALLOTMENT
September 28, 2000
INVESTMENT OBJECTIVETo provide regular income through a portfolio of predominantly fixed income securities with a maximum exposure of 25% to equities.
ADDITIONAL INVESTMENT/MULTIPLES FOR EXISTING INVESTORS
Plan A `1000/1
MINIMUM INVESTMENT/MULTIPLES FOR NEW INVESTORSPlan A `10,000/1
FUND SIZE (AUM)Month End ` 189.79 croresMonthly Average ` 191.98 crores
TYPE OF SCHEMEAn open ended hybrid scheme investing predominantly in debt instruments
BENCHMARKCRISIL Hybrid 85+15 - Conservative Index
#MATURITY & YIELDAVERAGE MATURITY 3.32 yearsPORTFOLIO YIELD 5.13%MODIFIED DURATION 2.64 yearsMACAULAY DURATION 2.76 years# Calculated based on debt holdings in the portfolio
Sachin Padwal-Desai & Umesh Sharma (Debt)
Lakshmikanth Reddy & Krishna Prasad Natarajan (Equity)
Composition by Assets Composition by Rating
CRISIL AAA / CRISIL A1+ / IND A1+ / SOVEREIGN 100.00%
Gilts 40.79% Equity 23.12%
This product is suitable for investors who are seeking*:
Medium term capital appreciation with current income
Product Label
*Investors should consult their financial advisers if in doubt about whether the product is suitable for them.
•
•
Industry Allocation - Equity Assets
Company Name No. ofshares
Market Value` Lakhs
% ofassets
Company Name Company Ratings
Market Value ` Lakhs
% ofassets
Total Holdings 17,627.32 92.88
Call,cash and other current asset 1,351.83 7.12
Total Asset 18,979.16 100.00
* Top 10 holdings
Housing Development Finance
Corporation Ltd* CRISIL AAA 2063.44 10.87
Total Corporate Debt 2063.44 10.87
Power Finance Corporation Ltd CRISIL AAA 542.11 2.86
Total Tier II Bonds 542.11 2.86
Power Finance Corporation Ltd* CRISIL AAA 709.16 3.74
REC Ltd* CRISIL AAA 703.99 3.71
Total PSU/PFI Bonds 1413.15 7.45
Bank of Baroda* CRISIL A1+ 999.16 5.26
National Bank For Agriculture &
Rural Development IND A1+ 480.10 2.53
Total Money Market Instruments 1479.26 7.79
5.15% GOI 2025 (09-Nov-2025)* SOVEREIGN 2437.61 12.84
91 DTB (01-Apr-2021)* SOVEREIGN 1994.31 10.51
7.17% GOI 2028 (08-Jan-2028)* SOVEREIGN 965.11 5.09
6.18% GOI 2024 (04-Nov-2024)* SOVEREIGN 822.06 4.33
6.79% GOI 2027 (15-May-2027)* SOVEREIGN 719.97 3.79
5.22% GOI 2025 (15-Jun-2025)* SOVEREIGN 589.51 3.11
7.32% GOI 2024 (28-Jan-2024) SOVEREIGN 212.23 1.12
Total Gilts 7740.81 40.79
Total Debt Holdings 13238.77 69.75
Different plans have a different expense structure
Auto Mahindra & Mahindra Ltd 17341 139.84 0.74Tata Motors Ltd 20000 64.59 0.34Auto Ancillaries Balkrishna Industries Ltd 7500 116.85 0.62Banks Axis Bank Ltd 70488 510.90 2.69HDFC Bank Ltd 18986 291.32 1.53ICICI Bank Ltd 45874 274.21 1.44State Bank of India 29755 116.09 0.61Kotak Mahindra Bank Ltd 5409 96.30 0.51Cement Grasim Industries Ltd 3254 39.07 0.21Consumer Durables Voltas Ltd 24500 249.45 1.31Consumer Non Durables Kansai Nerolac Paints Ltd 33697 188.35 0.99Colgate Palmolive (India) Ltd 9526 150.63 0.79United Breweries Ltd 10000 116.14 0.61Gas Gujarat State Petronet Ltd 105586 263.75 1.39Industrial Products Cummins India Ltd 20015 157.67 0.83Media & Entertainment Jagran Prakashan Ltd 97694 58.32 0.31Minerals/Mining Coal India Ltd 581 0.88 0.00Non - Ferrous Metals Hindalco Industries Ltd 41457 141.06 0.74Petroleum Products Bharat Petroleum Corporation Ltd 30000 134.96 0.71Pharmaceuticals Dr. Reddy's Laboratories Ltd 4300 190.34 1.00Cadila Healthcare Ltd 35000 152.32 0.80Power Power Grid Corporation of India Ltd 103926 222.71 1.17Retailing Aditya Birla Fashion and Retail Ltd 35367 64.93 0.34Aditya Birla Fashion and Retail Ltd- Partly Paid 4133 5.96 0.03Software Infosys Ltd 34838 436.62 2.30
SCHEME CATEGORYConservative Hybrid Fund
SCHEME CHARACTERISTICS10-25% Equity, 75-90% Debt
MINIMUM INVESTMENT FOR SIP
` 500/1
Mutual Fund investments are subject to market risks, read all scheme related documents carefully.
Money Market Instrument 7.79% PSU/PFI Bonds 7.45%
Note : Pursuant to downgrade of securities issued by Yes Bank Ltd to below investment grade on March 6, 2020 by ICRA, the AMC has created the segregated
portfolio in the scheme. For purpose of disclosure, this change has been incorporated in the scheme name.
Telecom - Services Bharti Airtel Ltd 36903 205.29 1.08Total Equity Holdings 4388.55 23.12
Company Name No. ofshares
Market Value` Lakhs
% ofassets
PORTFOLIO
Tier II Bonds 2.86%
Corporate Debt 10.87%
Call,cash and other current asset 7.12%
40.79%7.12%2.86%7.45%
7.79%
23.12%
10.87%
100.00%
Mayank Bukrediwala* (effective August 24, 2020) (dedicated for making investments for Foreign Securities)
* Pyari Menon (dedicated for making investments for Foreign Securities) ceased to be a Fund Manager for the scheme effective August 23, 2020. Please refer the addendum on the website for further details.
Post the creation of the segregated portfolio (10.25% Yes Bank Ltd CO 05Mar 20) on March 6, 2020, the full principal due, along with the interest from March 6, 2020 to
December 29, 2020 was received by the segregated portfolio on December 30, 2020. With these receipts, the segregated portfolio completed full recovery on
December 30, 2020
Investors understand that their principal will be at Moderately High risk
Riskometer is as on February 28, 2021
A fund that invests predominantly in debt instruments with marginal equity exposure.
29.37%
10.37%
9.95%
7.81%
6.01%
5.68%
5.07%
4.68%
4.66%
3.59%
3.21%
3.08%
2.66%
1.62%
1.33%
0.89%
0.02%
BANKS
CONSUMER NON DURABLES
SOFTWARE
PHARMACEUTICALS
GAS
CONSUMER DURABLES
POWER
TELECOM - SERVICES
AUTO
INDUSTRIAL PRODUCTS
NON - FERROUS METALS
PETROLEUM PRODUCTS
AUTO ANCILLARIES
RETAILING
MEDIA & ENTERTAINMENT
CEMENT
MINERALS/MINING

Power
Tata Power Co Ltd 207938 197.85 1.59
NTPC Ltd 150349 161.32 1.30
Power Grid Corporation of India
Ltd 70523 151.13 1.22
Software
Infosys Ltd* 26745 335.20 2.70
Tech Mahindra Ltd 17733 162.94 1.31
Telecom - Services
Bharti Airtel Ltd 27951 155.49 1.25
Textile Products
Himatsingka Seide Ltd 76471 118.91 0.96
Total Equity Holdings 8061.29 64.94 (33.99)
Auto
Maruti Suzuki India Ltd* 4600 315.84 2.54 (2.56)
Banks
Axis Bank Ltd* 136500 989.35 7.97 (4.93)
ICICI Bank Ltd* 84061 502.47 4.05 (2.66)
State Bank of India 55462 216.38 1.74
HDFC Bank Ltd 13878 212.94 1.72
Kotak Mahindra Bank Ltd 5528 98.42 0.79
Federal Bank Ltd 10000 8.36 0.07 (0.07)
Construction Project
Larsen & Toubro Ltd* 16100 232.24 1.87 (1.88)
Consumer Non Durables
United Breweries Ltd 18456 214.34 1.73
Dabur India Ltd 41250 207.53 1.67 (1.68)
Colgate Palmolive (India) Ltd 7787 123.13 0.99
Nestle India Ltd 402 64.73 0.52
Finance
Housing Development Finance
Corporation Ltd* 46100 1170.66 9.43 (8.88)
Cholamandalam Financial
Holdings Ltd 23811 142.85 1.15
PNB Housing Finance Ltd 21957 96.67 0.78
Gas
Petronet LNG Ltd 43156 110.11 0.89
Gujarat State Petronet Ltd 42933 107.25 0.86
GAIL (India) Ltd 47372 67.17 0.54
Hotels/ Resorts And Other Recreational Activities
Indian Hotels Co Ltd 122059 149.95 1.21
Industrial Products
Mahindra CIE Automotive Ltd 64953 117.37 0.95
Media & Entertainment
Sun TV Network Ltd* 123000 606.64 4.89 (4.90)
Petroleum Products
Hindustan Petroleum Corporation
Ltd* 329400 798.63 6.43 (6.44)
Indian Oil Corporation Ltd 121901 119.52 0.96
Pharmaceuticals
Dr. Reddy's Laboratories Ltd 2392 105.88 0.85
Company Name
FIESFFranklin India Equity Savings Fund
25
LOAD STRUCTURE
Plan AEntry Load:Exit Load (for each purchase of Units) :
Nil
As on February 26, 2021 PORTFOLIO
Franklin Templetonwww.franklintempletonindia.com
This product is suitable for investors who are seeking*:
Income generation and capital appreciation over medium to long term.
Investment in equity and equity related securities including the use of equity derivatives strategies and arbitrage opportunities with balance exposure in debt and money market instruments
Product Label
*Investors should consult their financial advisers if in doubt about whether the product is suitable for them.
#EXPENSE RATIO#EXPENSE RATIO (DIRECT)
: 2.09%
: 0.68%# The above ratio includes the GST on Investment Management Fees. The rates specified are the actual expenses charged as at the end of the month. The above ratio also includes, proportionate charge in respect sales beyond T-30 cities subject to maximum of 30 bps on daily net assets, wherever applicable.
NAV AS OF FEBRUARY 26, 2021
FUND MANAGER(S)
DATE OF ALLOTMENT
August 27, 2018
INVESTMENT OBJECTIVE
The Scheme intends to generate long-term capital appreciation by investing a portion of the Scheme’s assets in equity and equity related instruments. The Scheme also intends to generate income through investments in fixed income securities and using arbitrage and other derivative Strategies. There can be no assurance that the investment objective of the scheme will be realized.
ADDITIONAL INVESTMENT/MULTIPLES FOR EXISTING INVESTORS
Plan A `1,000/1
MINIMUM INVESTMENT/MULTIPLES FOR NEW INVESTORS
Plan A `5,000/1
FUND SIZE (AUM)Month End ` 124.14 croresMonthly Average ` 127.19 croresOutstanding exposure in derivative instruments ` 42.20 croresOutstanding derivative exposure 33.99%
TYPE OF SCHEMEAn open-ended scheme investing in equity,arbitrage and fixed income
BENCHMARKNifty Equity Savings Index
#MATURITY & YIELDAVERAGE MATURITY 2.27 yearsPORTFOLIO YIELD 4.46%MODIFIED DURATION 1.97 yearsMACAULAY DURATION 2.03 years# Calculated based on debt holdings in the portfolio
Lakshmikanth Reddy (Equity)Sachin Padwal-Desai and Umesh Sharma(Fixed Income)
Composition by Assets Debt Portfolio : Composition by Rating
SOVEREIGN 100.00%
•
•
Industry Allocation - Equity Assets
In respect of each purchase of Units:• Upto 10% of the Units may be redeemed without any exit load in
each year from the date of allotment.*• Any redemption in excess of the above limit shall be subject to
the following exit load:• 1% - if redeemed on or before 1 year from the date of allotment• Nil - if redeemed after 1 year from the date of allotment
* This no load redemption limit is applicable on a yearly basis (from the date of allotment of such units) and the limit not availed during a year shall not be clubbed or carried forward to the next year.
Different plans have a different expense structure
No. ofshares
Market Value
` Lakhs
% of Assets % of Assets Derivatives
Growth Plan ` 11.6076Dividend Plan ̀ 11.6076Monthly Plan ` 11.4677Quarterly Plan ` 11.3878Direct - Growth Plan ` 12.1092Direct - Dividend Plan ` 12.1092Direct - Monthly Plan ` 11.9665Direct - Quarterly Plan ` 11.8893
TURNOVER $Total Portfolio Turnover 421.70%
**Portfolio Turnover (Equity) 412.37%$ Includes fixed income securities and equity derivatives** Computed for equity portion of the portfolio including equity derivatives
No. ofshares
Market Value
` Lakhs
% of Assets % of Assets Derivatives
SCHEME CATEGORY
Equity Savings FundSCHEME CHARACTERISTICS
65-90% Equity, 10-35% Debt
MINIMUM INVESTMENT FOR SIP
` 500/1
Company Name
Mutual Fund investments are subject to market risks, read all scheme related documents carefully.
Debt Holdings Rating Market Value ` Lakhs
% ofassets
Total Holdings 9,183.10 73.97
Margin on Derivatives 2,146.41 17.29
Call,cash and other current asset 1,084.80 8.74
Total Asset 12,414.30 100.00
* Top 10 holdings
5.22% GOI 2025 (15-Jun-2025)* SOVEREIGN 491.26 3.96
5.15% GOI 2025 (09-Nov-2025)* SOVEREIGN 487.52 3.93
Total Gilts 978.78 7.88
Total Debt Holdings 978.78 7.88
Real Estate Investment Trusts
Embassy Office Parks REIT 44600 143.02 1.15
Total Real Estate Investment Trusts 143.02 1.15
@ Reverse Repo : 7.72%, Others (Cash/ Subscription receivable/ Redemption payable/ Receivables on sale/Payable on Purchase/ Other Receivable / Other Payable) : 1.02%
Real Estate Investment Trusts 1.15%
Equity 64.94%
Gilts 7.88%
Call,cash and other current asset 26.03%
64.94%26.03%
7.88%
100.00%
Mayank Bukrediwala* (effective August 24, 2020) (dedicated for making investments for Foreign Securities)
* Pyari Menon (dedicated for making investments for Foreign Securities) ceased to be a Fund Manager for the scheme effective August 23, 2020. Please refer the addendum on the website for further details.
1.15%
Investors understand that their principal will be at Moderate risk
Riskometer is as on February 28, 2021
25.16%
17.49%
11.39%
7.56%
7.53%
6.33%
6.18%
3.92%
3.53%
2.88%
1.93%
1.86%
1.48%
1.46%
1.31%
BANKS
FINANCE
PETROLEUM PRODUCTS
CONSUMER NON DURABLES
MEDIA & ENTERTAINMENT
POWER
SOFTWARE
AUTO
GAS
CONSTRUCTION PROJECT
TELECOM - SERVICES
HOTELS/ RESORTS AND OTHER RECREATIONAL ACTIVITIES
TEXTILE PRODUCTS
INDUSTRIAL PRODUCTS
PHARMACEUTICALS

Auto Mahindra & Mahindra Ltd 51526 415.51 0.92Bajaj Auto Ltd 4923 187.01 0.41TVS Motor Co Ltd 23121 137.51 0.30Tata Motors Ltd 39940 128.99 0.29Auto Ancillaries Balkrishna Industries Ltd 40000 623.20 1.38Banks HDFC Bank Ltd* 108000 1657.15 3.67Axis Bank Ltd* 206475 1496.53 3.32ICICI Bank Ltd 146474 875.55 1.94Kotak Mahindra Bank Ltd 33853 602.70 1.34State Bank of India 88509 345.32 0.77Karur Vysya Bank Ltd 301582 179.89 0.40Consumer Durables Voltas Ltd 60000 610.89 1.35Consumer Non Durables Colgate Palmolive (India) Ltd 26468 418.51 0.93United Breweries Ltd 15000 174.20 0.39Kansai Nerolac Paints Ltd 27182 151.93 0.34Ferrous Metals Tata Steel Ltd 74355 531.75 1.18Gas Petronet LNG Ltd 190244 485.41 1.08Gujarat State Petronet Ltd 168573 421.10 0.93Industrial Products Cummins India Ltd 32100 252.87 0.56Media & Entertainment Jagran Prakashan Ltd 153047 91.37 0.20Minerals/Mining Coal India Ltd 984 1.50 0.00Non - Ferrous Metals Hindalco Industries Ltd 129936 442.11 0.98Petroleum Products Hindustan Petroleum Corporation Ltd 156244 378.81 0.84Bharat Petroleum Corporation Ltd 43000 193.44 0.43Pharmaceuticals Cadila Healthcare Ltd 72000 313.34 0.69Torrent Pharmaceuticals Ltd 7072 171.72 0.38Power Power Grid Corporation of India Ltd 130625 279.93 0.62NTPC Ltd 217407 233.28 0.52Retailing Aditya Birla Fashion and Retail Ltd 65910 121.01 0.27
As on February 26, 2021 PORTFOLIO
Company Name No. ofshares
Market Value` Lakhs
% ofassets
26
INVESTMENT OBJECTIVEThe Fund seeks to provide investors regular income under the Dividend Plan and capital appreciation under the Growth Plan.
DATE OF ALLOTMENTMarch 31, 1997
FUND MANAGER(S)Sachin Padwal-Desai & Umesh Sharma (Debt)
Lakshmikanth Reddy & Krishna Prasad Natarajan (Equity)
MINIMUM INVESTMENT/MULTIPLES FOR NEW INVESTORS
` 500/1
ADDITIONAL INVESTMENT/MULTIPLES FOR EXISTING INVESTORS
` 500/1
Franklin India Pension Plan
LOAD STRUCTURE
ENTRY LOAD NilEXIT LOAD (for each purchase of Units) 3%, if redeemed before the age of 58 years (subject to lock-in period) and target amount Nil, if redeemed after the age of 58 years
TAX BENEFITS
LOCK-IN PERIOD & MINIMUM TARGET INVESTMENTFor investment (including registered SIPs and incoming STPs) made on or before June 1, 2018: Three (3) full financial years For investments (including SIPs & STPs registered) made on or after June 4, 2018: 5 years or till retirement age (whichever is earlier)Minimum target investment ̀ 10,000 before the age of 60 years.
Franklin Templetonwww.franklintempletonindia.com
FIPEP
#EXPENSE RATIO #EXPENSE RATIO (DIRECT)
# The above ratio includes the GST on Investment Management Fees. The rates specified are the actual expenses charged as at the end of the month. The above ratio also includes, proportionate charge in respect sales beyond T-30 cities subject to maximum of 30 bps on daily net assets, wherever applicable.
Growth Plan ` 148.1928Dividend Plan ` 17.0047Direct - Growth Plan ` 157.0059Direct - Dividend Plan ` 18.3443
NAV AS OF FEBRUARY 26, 2021
FUND SIZE (AUM)Month End ` 451.39 crores Monthly Average ` 455.83 crores
AVERAGE MATURITY PORTFOLIO YIELD MODIFIED DURATION MACAULAY DURATION
3.78 years5.79%3.02 years3.13 years
#MATURITY & YIELD
TYPE OF SCHEMEAn open ended retirement solution oriented scheme having a lock-in of 5 years or till retirement age (whichever is earlier)
BENCHMARK40% Nifty 500+60% Crisil Composite Bond Fund Index
# Calculated based on debt holdings in the portfolio
Composition by Assets Debt Portfolio : Composition by Rating
Gilts 46.59% Equity 31.28%
Debt Holdings Rating Market Value ` Lakhs
% of Assets
This product is suitable for investors who are seeking*:
• Long term capital appreciation
• A retirement fund investing upto 40% in equities and balance in fixed income instruments.
Product Label
*Investors should consult their financial advisers if in doubt about whether the product is suitable for them.
Note : Sector Allocation is provided as a percentage of Equity holding totaling to 100%Composition by Rating is provided as a percentage of Debt Holding totaling to 100%
Company Name No. ofshares
Market Value` Lakhs
% ofassets
* Top 10 holdings
Total Holdings 43,431.47 96.22Call,cash and other current asset 1,707.98 3.78Total Asset 45,139.45 100.00
CRISIL AAA / CRISIL A1+ / SOVEREIGN 91.47%
CRISIL AA / CARE AA- 8.53%
Different plans have a different expense structure
Retirement age : 60 years
SCHEME CATEGORY
Retirement Fund
SCHEME CHARACTERISTICS
Lock-in of 5 years or till retirement age, whichever is earlier
MINIMUM INVESTMENT FOR SIP
` 500/1
Mutual Fund investments are subject to market risks, read all scheme related documents carefully.
@ Reverse Repo : 2.48%, Others (Cash/ Subscription receivable/ Redemption payable/ Receivables on sale/Payable on Purchase/ Other Receivable / Other Payable) : 1.30%
Industry Allocation - Equity Assets
PSU/PFI Bonds 2.40%Corporate Debt 13.76%
Money Market Instrument 1.11% Tier II Bonds 1.08%
: 2.28%: 1.53%
Housing Development Finance Corporation Ltd* CRISIL AAA 2063.44 4.57KKR India Financial Services Pvt Ltd* CRISIL AA 1998.75 4.43Reliance Industries Ltd* CRISIL AAA 1649.29 3.65Indostar Capital Finance Ltd CARE AA- 501.19 1.11Total Corporate Debt 6212.68 13.76Power Finance Corporation Ltd CRISIL AAA 487.90 1.08Total Tier II Bonds 487.90 1.08REC Ltd CRISIL AAA 1028.55 2.28Power Finance Corporation Ltd CRISIL AAA 54.55 0.12Total PSU/PFI Bonds 1083.10 2.40Bank of Baroda CRISIL A1+ 499.58 1.11Total Money Market Instruments 499.58 1.116.79% GOI 2027 (15-May-2027)* SOVEREIGN 5759.79 12.765.15% GOI 2025 (09-Nov-2025)* SOVEREIGN 4875.23 10.8091 DTB (01-Apr-2021)* SOVEREIGN 3988.63 8.847.27% GOI 2026 (08-Apr-2026)* SOVEREIGN 2740.12 6.077.17% GOI 2028 (08-Jan-2028)* SOVEREIGN 2217.15 4.916.18% GOI 2024 (04-Nov-2024) SOVEREIGN 924.82 2.057.32% GOI 2024 (28-Jan-2024) SOVEREIGN 424.45 0.945.22% GOI 2025 (15-Jun-2025) SOVEREIGN 98.25 0.22Total Gilts 21028.44 46.59Total Debt Holdings 29311.70 64.94
Call,cash and other current asset 3.78%
46.59%3.78%1.11%2.40%
13.76%
8.53%
91.47%
Aditya Birla Fashion and Retail Ltd- Partly Paid 7703 11.10 0.02Software Infosys Ltd 109904 1377.43 3.05Telecom - Services Bharti Airtel Ltd 145373 808.71 1.79Total Equity Holdings 14119.77 31.28
1.08%
Investors understand that their principal will be at Moderately High risk
Riskometer is as on February 28, 2021
31.28%
36.52%
9.76%
6.42%
6.15%
5.73%
5.27%
4.41%
4.33%
4.05%
3.77%
3.63%
3.44%
3.13%
1.79%
0.94%
0.65%
0.01%
BANKS
SOFTWARE
GAS
AUTO
TELECOM - SERVICES
CONSUMER NON DURABLES
AUTO ANCILLARIES
CONSUMER DURABLES
PETROLEUM PRODUCTS
FERROUS METALS
POWER
PHARMACEUTICALS
NON - FERROUS METALS
INDUSTRIAL PRODUCTS
RETAILING
MEDIA & ENTERTAINMENT
MINERALS/MINING

Composition by Assets
Mutual Fund Units 60.41%
Call,Cash And Other Current Asset 39.59%
Composition by Assets
Mutual Fund Units 43.89%
ETF 21.68%
Call,Cash And Other Current Asset 34.43%
Rs. 1 lakh* (however, Trustee may vary these limits on a prospective basis).
*Fresh/additional purchase (including switch-in, fresh SIP & STP-in registrations) by an investor on a single day across Plan(s) under the scheme will be allowed/accepted only up to aggregated amount at the investor level (same holders/joint holders identified by their Permanent Account Numbers (PAN) in the same sequence).
PORTFOLIO
Total Holdings 53,529.66 60.41
Call,cash and other current asset 35,075.43 39.59
Total Asset 88,605.09 100.00
Company Name No. ofshares
Market Value` Lakhs
% ofassets
@ Reverse Repo : 39.86%, Others (Cash/ Subscription receivable/ Redemption payable/ Receivables on sale/Payable on Purchase/ Other Receivable / Other Payable) : -0.27%
Mutual Fund Units
Franklin India Flexi Cap Fund-Direct Growth Plan
(Formerly known as Franklin India Equity Fund) 4904745 40592.95 45.81
Franklin India Short-Term Income Plan (No. of
Segregated Portfolios in the Scheme- 3) - (under
winding up) Direct-Growth Plan 618584 12936.71 14.60
Franklin India Short Term Income Plan-
Segregated Portfolio 3- 9.50% Yes Bank Ltd
CO 23Dec21-Direct-Growth Plan 1370528 0.00 0.00
Franklin India Short Term Income Plan-
Segregated Portfolio 2- 10.90% Vodafone Idea Ltd
02Sep2023 (P/C 03Sep2021)-Direct-Growth Plan 1235135 0.00 0.00
Total Mutual Fund Units 53529.66 60.41
Company Name No. ofshares
Market Value` Lakhs
% ofassets
PORTFOLIO
Total Holdings 2,450.59 65.57
Call,cash and other current asset 1,286.54 34.43
Total Asset 3,737.13 100.00
ETF
Nippon India ETF Gold Bees 2012993 810.23 21.68
Total ETF 810.23 21.68
Mutual Fund Units
Franklin India Bluechip Fund Direct-Growth Plan 173635 1118.66 29.93
Franklin India Short-Term Income Plan (No. of
Segregated Portfolios in the Scheme- 3) -
(under winding up) Direct-Growth Plan 24946 521.70 13.96
Franklin India Short Term Income Plan-Segregated
Portfolio 3- 9.50% Yes Bank Ltd CO 23Dec21-
Direct-Growth Plan 23974 0.00 0.00
Franklin India Short Term Income Plan-
Segregated Portfolio 2- 10.90% Vodafone Idea
Ltd 02Sep2023 (P/C 03Sep2021)-Direct-
Growth Plan 22876 0.00 0.00
Total Mutual Fund Units 1640.36 43.89
@ Reverse Repo : 34.48%, Others (Cash/ Subscription receivable/ Redemption payable/ Receivables on sale/Payable on Purchase/ Other Receivable / Other Payable) : -0.05%
27Franklin Templetonwww.franklintempletonindia.com
DATE OF ALLOTMENT October 31, 2003
As on February 26, 2021
To provide long-term capital appreciation with relatively lower volatility through a dynamically balanced portfolio of equity and income funds. The equity allocation (i.e. the allocation to the diversified equity fund) will be determined based on the month-end weighted average P/E and P/B ratios of the Nifty 500 Index.
INVESTMENT OBJECTIVE
# The above ratio includes the GST on Investment Management Fees. The rates specified are the actual expenses charged as at the end of the month. The above ratio also includes, proportionate charge in respect sales beyond T-30 cities subject to maximum of 30 bps on daily net assets, wherever applicable.
FUND MANAGER(S)
Paul S Parampreet
FUND SIZE (AUM)Month End ` 886.05 croresMonthly Average ̀ 873.47 crores
TYPE OF SCHEMEAn open ended fund of fund scheme investing in dynamically balanced portfolio of equity and income funds
As on February 26, 2021
DATE OF ALLOTMENT November 28, 2014
FUND MANAGERPaul S Parampreet
The Fund seeks to achieve capital appreciation and diversification through a mix of strategic and tactical allocation to various asset classes such as equity, debt, gold and cash by investing in funds investing in these asset classes. However, there is no assurance or guarantee that the objective of the scheme will be achieved.
INVESTMENT OBJECTIVE
#EXPENSE RATIO#EXPENSE RATIO (DIRECT)
: 1.83%: 0.95%
# The above ratio includes the GST on Investment Management Fees. The rates specified are the actual expenses charged as at the end of the month. The above ratio also includes, proportionate charge in respect sales beyond T-30 cities subject to maximum of 30 bps on daily net assets, wherever applicable.
Franklin India Multi – Asset Solution Fund FIMAS
Product Label
This product is suitable for investors who are seeking*:
• Long Term Capital appreciation
• A fund of funds investing in diversified asset classes through a mix of strategic and tactical allocation.
*Investors should consult their financial advisers if in doubt about whether the product is suitable for them.
FUND SIZE (AUM)Month End ` 37.37 croresMonthly Average ` 36.57 crores
TYPE OF SCHEMEAn open ended fund of fund scheme investing in funds which in turn invest in equity, debt, gold and cash
NAV AS OF FEBRUARY 26, 2021
Growth Plan ` 11.8602Dividend Plan ` 11.8602Direct - Growth Plan ` 12.8259Direct - Dividend Plan ` 12.8259
LOAD STRUCTUREENTRY LOAD NilEXIT LOAD (for each purchase of Units) In respect of each purchase of Units -1% if redeemed within 3 year of allotment
Different plans have a different expense structure‘Investors may note that they will be bearing the recurring expenses of this Scheme in addition to the expenses of the underlying Schemes in which this Scheme makes investment’
SCHEME CATEGORYFOF - Domestic
SCHEME CHARACTERISTICSMinimum 95% assets in the underlying funds
SCHEME CATEGORYFOF - Domestic
SCHEME CHARACTERISTICSMinimum 95% assets in the underlying funds
‘Investors may note that they will be bearing the recurring expenses of this Scheme in addition to the expenses of the underlying Schemes in which this Scheme makes investment’
Mutual Fund investments are subject to market risks, read all scheme related documents carefully.
LOAD STRUCTUREENTRY LOAD Nil
EXIT LOAD (for each purchase of Units) In respect of each purchase of Units -• NIL Exit load – for 10% of the units upto completion of 12 months.o The “First In First Out (FIFO)” logic will be applied while selecting the
units for redemptiono Waiver of Exit load is calculated for each inflow transaction separately
on FIFO basis and not on the total units through multiple inflowso The load free units from purchases made subsequent to the initial
purchase will be available only after redeeming all units from the initial purchase
• All units redeemed /switched-out in excess of the 10% load free units will be subject to the below mentioned exit load.
o 1.00% - if Units are redeemed/switched-out on or before 1 year from the date of allotment
o Nil - if redeemed after 1 year from the date of allotment*This no load redemption limit is applicable on a yearly basis (from the date of allotment of such units) and the limit not availed during a year shall not be clubbed or carried forward to the next year.
MINIMUM INVESTMENT/MULTIPLES FOR NEW INVESTORS
` 5000/1
ADDITIONAL INVESTMENT/MULTIPLES FOR EXISTING INVESTORS
` 1000/1
BENCHMARKCRISIL Hybrid 35+65 - Aggressive Index
MINIMUM INVESTMENT FOR SIP
` 500/1
NAV AS OF FEBRUARY 26, 2021
Growth Plan ` 85.4429Dividend Plan ` 31.7976Direct - Growth Plan ` 92.6725Direct - Dividend Plan ` 35.6865
MINIMUM INVESTMENT/MULTIPLES FOR NEW INVESTORS
` 5000
ADDITIONAL INVESTMENT/MULTIPLES FOR EXISTING INVESTORS
` 1000
BENCHMARK
CRISIL Hybrid 35+65 - Aggressive Index
MINIMUM INVESTMENT FOR SIP
` 500
Franklin India Dynamic Asset Allocation Fund of Funds FIDAAF
#EXPENSE RATIO #EXPENSE RATIO (DIRECT)
: 1.90%: 0.61%
Investors understand that their principal will be at Moderately High risk
MAXIMUM APPLICATION AMOUNT
Rs. 2 lakh* (however, Trustee may vary these limits on a prospective basis).
*Fresh/additional purchase (including switch-in, fresh SIP & STP-in registrations) by an investor on a single day across Plan(s) under the scheme will be allowed/accepted only up to aggregated amount at the investor level (same holders/joint holders identified by their Permanent Account Numbers (PAN) in the same sequence).
MAXIMUM APPLICATION AMOUNT
Riskometer is as on February 28, 2021
Product Label
*Investors should consult their financial advisers if in doubt about whether the product is suitable for them.
This product is suitable for investors who are seeking*:
• Long Term Capital appreciation
• A hybrid fund of funds investing in equity and debt mutual funds Investors understand that their principal
will be at High risk
Riskometer is as on February 28, 2021

FILSFFranklin India Life Stage Fund of Funds
As on February 26, 2021
DATE OF ALLOTMENT
December 1, 2003July 9, 2004 (The 50s Plus Floating Rate Plan)
FUND MANAGER(S) Paul S Parampreet
ADDITIONAL INVESTMENT/MULTIPLES FOR EXISTING INVESTORS` 1000/1
INVESTMENT OBJECTIVEThe primary objective is to generate superior risk adjusted returns to investors in line with their chosen asset allocation.
#EXPENSE RATIO20s Plan: 1.38%30s Plan: 1.38%40s Plan: 1.43%50s Plus Plan: 1.13%50s Plus FloatingRate Plan: 0.78%
(Direct) : 0.88%(Direct) : 0.85%(Direct) : 0.56%(Direct) : 0.20%
(Direct) : 0.14%# The above ratio includes the GST on Investment Management Fees. The rates specified are the actual expenses charged as at the end of the month. The above ratio also includes, proportionate charge in respect sales beyond T-30 cities subject to maximum of 30 bps on daily net assets, wherever applicable.
MINIMUM INVESTMENT/MULTIPLES FOR NEW INVESTORS` 5000/1
28Franklin Templetonwww.franklintempletonindia.com
` 12.79 crores` 5.87 crores
` 18.69 crores` 17.19 crores` 21.21 crores
TYPE OF SCHEMEAn open ended fund of fund scheme investing in funds which in turn invest in equity and debt
BENCHMARK20s Plan - 65% S&P BSE Sensex + 15% Nifty 500 + 20% Crisil Composite Bond Fund Index;
30s Plan - 45%S&P BSE Sensex + 10% Nifty 500 + 45%Crisil Composite Bond Fund Index;
40s Plan - 25%S&P BSE Sensex + 10% Nifty 500 + 65% Crisil Composite Bond Fund Index;
50s Plus Plan - 20% S&P BSE Sensex+ 80% Crisil Composite Bond Fund Index;
50s Plus Floating Rate Plan - 20% S&P BSE Sensex + 80% Crisil Liquid Fund Index.
20s Plan:30s Plan:40s Plan:50s Plus Plan:50s Plus Floating Rate Plan
` 12.68 crores` 5.78 crores` 18.76 crores` 17.23 crores` 21.01 crores
FUND SIZE (AUM) Month End
20s Plan:30s Plan:40s Plan:50s Plus Plan:50s Plus Floating Rate Plan
Monthly Average
‘Investors may note that they will be bearing the recurring expenses of this Scheme in addition to the expenses of the underlying Schemes in which this Scheme makes investment’
SCHEME CATEGORY
FOF - DomesticSCHEME CHARACTERISTICS
Plans Equity Debt20s Plan 80% 20%30s Plan 55% 45%40s Plan 35% 65%50s Plus Plan 20% 80%50s Plus Floating Rate Plan 20% 80%
MINIMUM INVESTMENT FOR SIP
` 500/1
Under normal market circumstances, the investment range would be as follows:
Mutual Fund investments are subject to market risks, read all scheme related documents carefully.
NAV AS OF FEBRUARY 26, 2021 (Direct)
The 20s PlanThe 30s PlanThe 40s PlanThe 50s Plus PlanThe 50s Plus Floating Rate Plan
Growth` 104.0509` 69.6100` 51.9281` 33.5711` 45.4349
Dividend` 31.6874` 22.9608` 13.5803` 11.5137` 15.0231
This product is suitable for investors who are seeking*:
• Long term capital appreciation
• A fund of funds investing in equity and debt mutual funds.
Product Label - FILSF 20’s Plan
*Investors should consult their financial advisers if in doubt about whether the product is suitable for them.
PORTFOLIOFranklin India Life Stage Fund Of Funds - 20'S Plan
Company Name No.of Shares
Market Value` Lakhs
% ofassets
Franklin India Life Stage Fund Of Funds - 50'S Plus Floating Rate Plan
Mutual Fund Units
Franklin India Savings Fund Direct-Growth Plan 4199054 1670.98 79.53
Templeton India Value Fund Direct-Growth Plan 59815 203.11 9.67
Franklin India Bluechip Fund Direct-Growth Plan 30897 199.06 9.47
Total Mutual Fund Units 2073.15 98.67
Total Holdings 2,073.15 98.67Call,cash and other current asset 28.02 1.33Total Asset 2,101.17 100.00
Franklin India Life Stage Fund Of Funds - 30'S Plan
Franklin India Life Stage Fund Of Funds - 40'S Plan
Load structure
Entry Load
Exit Load (for each purchase of Units):
20’s Plan
50’s Plus Plan And
50’s Plus Floating
Rate Plan
30’s Plan
40’s Plan
Nil for all the plans
In respect of each purchase of Units - 1%
if redeemed within 1 year of allotment
In respect of each purchase of Units – 0.75%if redeemed within 1 year of allotmentIn respect of each purchase of Units – 0.75%if redeemed within 1 year of allotment
In respect of each purchase of Units – 1%if redeemed within 1 year of allotment
Different plans have a different expense structure
NAV AS OF FEBRUARY 26, 2021
20s Plan30s Plan40s Plan50s Plus Plan50s Plus Floating Rate Plan
Growth` 100.0696` 66.3624` 49.2061` 31.7771` 43.8324
Dividend` 30.1017` 21.5437` 12.8775` 10.8805` 14.4477
Franklin India Life Stage Fund Of Funds - 50'S Plus Plan
@ Reverse Repo : 1.52%, Others (Cash/ Subscription receivable/ Redemption payable/
Receivables on sale/Payable on Purchase/ Other Receivable / Other Payable) : -0.19%
@ Reverse Repo : 1.35%, Others (Cash/ Subscription receivable/ Redemption payable/ Receivables on sale/Payable on Purchase/ Other Receivable / Other Payable) : -0.19%
@ Reverse Repo : 1.29%, Others (Cash/ Subscription receivable/ Redemption payable/ Receivables on sale/Payable on Purchase/ Other Receivable / Other Payable) : 0.29%
@ Reverse Repo : 1.60%, Others (Cash/ Subscription receivable/ Redemption payable/ Receivables on sale/Payable on Purchase/ Other Receivable / Other Payable) : 0.08%
@ Reverse Repo : 1.52%, Others (Cash/ Subscription receivable/ Redemption payable/ Receivables on sale/Payable on Purchase/ Other Receivable / Other Payable) : -0.01%
Total Holdings 1,253.13 98.84Call,cash and other current asset 14.74 1.16Total Asset 1,267.87 100.00
Company Name No.of Shares
Market Value` Lakhs
% ofassets
Mutual Fund Units Franklin India Corporate Debt Fund Direct-Growth Plan 273663 221.40 38.28Franklin India Bluechip Fund Direct-Growth Plan 30676 197.63 34.17Franklin India Prima Fund Direct-Growth Plan 4163 56.51 9.77Templeton India Value Fund Direct-Growth Plan 16623 56.45 9.76Franklin India Dynamic Accrual Fund (No. of Segregated Portfolios in the Scheme- 3) - (under winding up) Direct-Growth Plan 100174 37.17 6.43Franklin India Dynamic Accrual Fund- Segregated Portfolio 3- 9.50% Yes Bank Ltd CO 23Dec21-Direct-Growth Plan 196087 0.00 0.00Franklin India Dynamic Accrual Fund- Segregated Portfolio 2- 10.90% Vodafone Idea Ltd 02Sep2023 (P/C 03Sep2021)-Direct-Growth Plan 177292 0.00 0.00Total Mutual Fund Units 569.15 98.42
Total Holdings 569.15 98.42Call,cash and other current asset 9.16 1.58Total Asset 578.32 100.00
Company Name No.of Shares
Market Value` Lakhs
% ofassets
Total Holdings 1,844.85 98.32Call,cash and other current asset 31.48 1.68Total Asset 1,876.33 100.00
Company Name No.of Shares
Market Value` Lakhs
% ofassets
Mutual Fund Units Franklin India Corporate Debt Fund Direct-Growth Plan 1570345 1,270.45 73.71Templeton India Value Fund Direct-Growth Plan 49170 166.96 9.69Franklin India Bluechip Fund Direct-Growth Plan 25500 164.28 9.53Franklin India Dynamic Accrual Fund (No. of Segregated Portfolios in the Scheme- 3) - (under winding up) Direct-Growth Plan 258101 95.77 5.56Franklin India Dynamic Accrual Fund- Segregated Portfolio 3- 9.50% Yes Bank Ltd CO 23Dec21-Direct-Growth Plan 489502 0.00 0.00Franklin India Dynamic Accrual Fund- Segregated Portfolio 2- 10.90% Vodafone Idea Ltd 02Sep2023 (P/C 03Sep2021)-Direct-Growth Plan 371181 0.00 0.00Total Mutual Fund Units 1697.47 98.49
Total Holdings 1,697.47 98.49Call,cash and other current asset 26.00 1.51Total Asset 1,723.47 100.00
Company Name No.of Shares
Market Value` Lakhs
% ofassets
Mutual Fund Units Franklin India Bluechip Fund Direct-Growth Plan 97361 627.26 49.47Franklin India Corporate Debt Fund Direct-Growth Plan 271379 219.55 17.32Franklin India Prima Fund Direct-Growth Plan 13984 189.81 14.97Templeton India Value Fund Direct-Growth Plan 55329 187.88 14.82Franklin India Dynamic Accrual Fund (No. of Segregated Portfolios in the Scheme- 3) - (under winding up) Direct-Growth Plan 77152 28.63 2.26Franklin India Dynamic Accrual Fund- Segregated Portfolio 3- 9.50% Yes Bank Ltd CO 23Dec21-Direct-Growth Plan 167005 0.00 0.00Franklin India Dynamic Accrual Fund- Segregated Portfolio 2- 10.90% Vodafone Idea Ltd 02Sep2023 (P/C 03Sep2021)-Direct-Growth Plan 147480 0.00 0.00Total Mutual Fund Units 1253.13 98.84
Mutual Fund Units Franklin India Corporate Debt Fund Direct-Growth Plan 1339375 1,083.59 57.75Franklin India Bluechip Fund Direct-Growth Plan 42119 271.35 14.46Franklin India Prima Fund Direct-Growth Plan 13572 184.22 9.82Templeton India Value Fund Direct-Growth Plan 53313 181.03 9.65Franklin India Dynamic Accrual Fund (No. of Segregated Portfolios in the Scheme- 3) - (under winding up) Direct-Growth Plan 335975 124.66 6.64Franklin India Dynamic Accrual Fund- Segregated Portfolio 3- 9.50% Yes Bank Ltd CO 23Dec21-Direct-Growth Plan 631309 0.00 0.00Franklin India Dynamic Accrual Fund- Segregated Portfolio 2- 10.90% Vodafone Idea Ltd 02Sep2023 (P/C 03Sep2021)-Direct-Growth Plan 584730 0.00 0.00Total Mutual Fund Units 1844.85 98.32
This product is suitable for investors who are seeking*:
• Long term capital appreciation
• A fund of funds investing in equity and debt mutual funds.
Product Label - FILSF 30’s Plan
*Investors should consult their financial advisers if in doubt about whether the product is suitable for them.
This product is suitable for investors who are seeking*:
• Long term capital appreciation
• A fund of funds investing in equity and debt mutual funds.
Product Label - FILSF 40’s Plan
*Investors should consult their financial advisers if in doubt about whether the product is suitable for them.
This product is suitable for investors who are seeking*:
• Long term capital appreciation
• A fund of funds investing in equity and debt mutual funds.
Product Label - FILSF 50’s Plus Plan & 50’s Plus Floating Rate Plan
*Investors should consult their financial advisers if in doubt about whether the product is suitable for them.
Investors understand that their principal will be at Moderate risk
Investors understand that their principal will be at Moderately High risk
Investors understand that their principal will be at High risk
Investors understand that their principal will be at Very High risk
Riskometer is as on February 28, 2021 Riskometer is as on February 28, 2021
Riskometer is as on February 28, 2021 Riskometer is as on February 28, 2021
Fresh/additional purchase (including switch-in, fresh SIP & STP-in registrations) by an investor on a single day allowed/accepted only up to:20’s Plan – Rs. 50,00030’s Plan – Rs. 25,00040’s Plan – Rs. 50,00050’s Plus Plan – Rs. 25,00050’s Plus Floating Rate Plan - There is no upper limit.However, Trustee may vary these limits on a prospective basis.
MAXIMUM APPLICATION AMOUNT
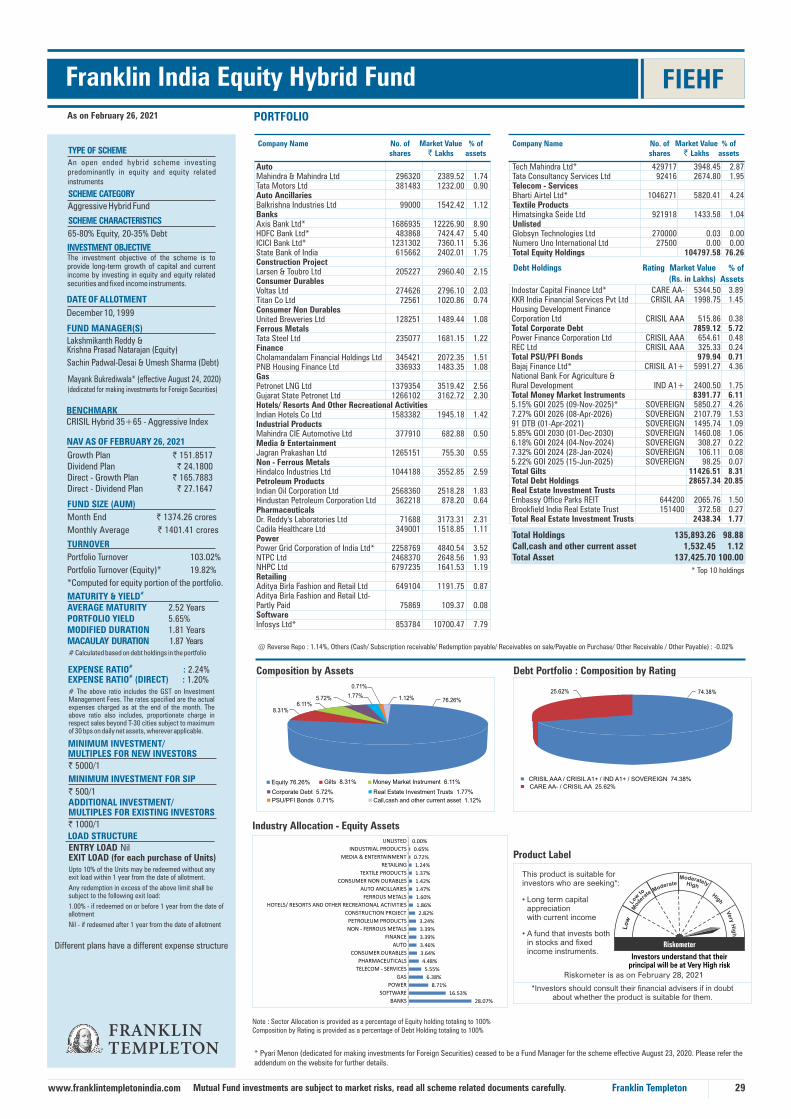
As on February 26, 2021 PORTFOLIO
Company Name No. ofshares
Market Value` Lakhs
% ofassets
29
INVESTMENT OBJECTIVEThe investment objective of the scheme is to provide long-term growth of capital and current income by investing in equity and equity related securities and fixed income instruments.
Franklin Templetonwww.franklintempletonindia.com
FIEHF
Growth Plan ̀ 151.8517Dividend Plan ` 24.1800Direct - Growth Plan ` 165.7883Direct - Dividend Plan ` 27.1647
NAV AS OF FEBRUARY 26, 2021
Franklin India Equity Hybrid Fund
#MATURITY & YIELDAVERAGE MATURITY 2.52 Years
5.65%PORTFOLIO YIELDMODIFIED DURATION 1.81 YearsMACAULAY DURATION 1.87 Years
#EXPENSE RATIO : 2.24%#EXPENSE RATIO (DIRECT) : 1.20%
# The above ratio includes the GST on Investment Management Fees. The rates specified are the actual expenses charged as at the end of the month. The above ratio also includes, proportionate charge in respect sales beyond T-30 cities subject to maximum of 30 bps on daily net assets, wherever applicable.
DATE OF ALLOTMENT
December 10, 1999
FUND MANAGER(S)
Lakshmikanth Reddy & Krishna Prasad Natarajan (Equity)
Sachin Padwal-Desai & Umesh Sharma (Debt)
FUND SIZE (AUM)
Month End ` 1374.26 crores
Monthly Average ` 1401.41 crores
MINIMUM INVESTMENT/MULTIPLES FOR NEW INVESTORS
` 5000/1
ADDITIONAL INVESTMENT/MULTIPLES FOR EXISTING INVESTORS
` 1000/1
LOAD STRUCTUREENTRY LOAD NilEXIT LOAD (for each purchase of Units) Upto 10% of the Units may be redeemed without any exit load within 1 year from the date of allotment.
Any redemption in excess of the above limit shall be subject to the following exit load:
1.00% - if redeemed on or before 1 year from the date of allotment
Nil - if redeemed after 1 year from the date of allotment
Debt Portfolio : Composition by RatingComposition by Assets
Tech Mahindra Ltd* 429717 3948.45 2.87Tata Consultancy Services Ltd 92416 2674.80 1.95Telecom - Services Bharti Airtel Ltd* 1046271 5820.41 4.24Textile Products Himatsingka Seide Ltd 921918 1433.58 1.04Unlisted Globsyn Technologies Ltd 270000 0.03 0.00Numero Uno International Ltd 27500 0.00 0.00Total Equity Holdings 104797.58 76.26
TYPE OF SCHEMEAn open ended hybrid scheme investing predominantly in equity and equity related instruments
BENCHMARKCRISIL Hybrid 35+65 - Aggressive Index
# Calculated based on debt holdings in the portfolio
*Investors should consult their financial advisers if in doubt about whether the product is suitable for them.
This product is suitable for investors who are seeking*:
• Long term capital appreciation with current income
• A fund that invests bothin stocks and fixed income instruments.
Product Label
Industry Allocation - Equity Assets
Note : Sector Allocation is provided as a percentage of Equity holding totaling to 100%Composition by Rating is provided as a percentage of Debt Holding totaling to 100%
CRISIL AAA / CRISIL A1+ / IND A1+ / SOVEREIGN 74.38%
CARE AA- / CRISIL AA 25.62%
* Top 10 holdings
Total Holdings 135,893.26 98.88Call,cash and other current asset 1,532.45 1.12Total Asset 137,425.70 100.00
Debt Holdings Rating Market Value
(Rs. in Lakhs)
% of
Assets
Company Name No. ofshares
Market Value` Lakhs
% ofassets
TURNOVER
Portfolio Turnover 103.02%
Portfolio Turnover (Equity)* 19.82%
*Computed for equity portion of the portfolio.
Auto Mahindra & Mahindra Ltd 296320 2389.52 1.74Tata Motors Ltd 381483 1232.00 0.90Auto Ancillaries Balkrishna Industries Ltd 99000 1542.42 1.12Banks Axis Bank Ltd* 1686935 12226.90 8.90HDFC Bank Ltd* 483868 7424.47 5.40ICICI Bank Ltd* 1231302 7360.11 5.36State Bank of India 615662 2402.01 1.75Construction Project Larsen & Toubro Ltd 205227 2960.40 2.15Consumer Durables Voltas Ltd 274626 2796.10 2.03Titan Co Ltd 72561 1020.86 0.74Consumer Non Durables United Breweries Ltd 128251 1489.44 1.08Ferrous Metals Tata Steel Ltd 235077 1681.15 1.22Finance Cholamandalam Financial Holdings Ltd 345421 2072.35 1.51PNB Housing Finance Ltd 336933 1483.35 1.08Gas Petronet LNG Ltd 1379354 3519.42 2.56Gujarat State Petronet Ltd 1266102 3162.72 2.30Hotels/ Resorts And Other Recreational Activities Indian Hotels Co Ltd 1583382 1945.18 1.42Industrial Products Mahindra CIE Automotive Ltd 377910 682.88 0.50Media & Entertainment Jagran Prakashan Ltd 1265151 755.30 0.55Non - Ferrous Metals Hindalco Industries Ltd 1044188 3552.85 2.59Petroleum Products Indian Oil Corporation Ltd 2568360 2518.28 1.83Hindustan Petroleum Corporation Ltd 362218 878.20 0.64Pharmaceuticals Dr. Reddy's Laboratories Ltd 71688 3173.31 2.31Cadila Healthcare Ltd 349001 1518.85 1.11Power Power Grid Corporation of India Ltd* 2258769 4840.54 3.52NTPC Ltd 2468370 2648.56 1.93NHPC Ltd 6797235 1641.53 1.19Retailing Aditya Birla Fashion and Retail Ltd 649104 1191.75 0.87Aditya Birla Fashion and Retail Ltd- Partly Paid 75869 109.37 0.08Software Infosys Ltd* 853784 10700.47 7.79
Indostar Capital Finance Ltd* CARE AA- 5344.50 3.89KKR India Financial Services Pvt Ltd CRISIL AA 1998.75 1.45Housing Development Finance Corporation Ltd CRISIL AAA 515.86 0.38Total Corporate Debt 7859.12 5.72Power Finance Corporation Ltd CRISIL AAA 654.61 0.48REC Ltd CRISIL AAA 325.33 0.24Total PSU/PFI Bonds 979.94 0.71Bajaj Finance Ltd* CRISIL A1+ 5991.27 4.36National Bank For Agriculture & Rural Development IND A1+ 2400.50 1.75Total Money Market Instruments 8391.77 6.115.15% GOI 2025 (09-Nov-2025)* SOVEREIGN 5850.27 4.267.27% GOI 2026 (08-Apr-2026) SOVEREIGN 2107.79 1.5391 DTB (01-Apr-2021) SOVEREIGN 1495.74 1.095.85% GOI 2030 (01-Dec-2030) SOVEREIGN 1460.08 1.066.18% GOI 2024 (04-Nov-2024) SOVEREIGN 308.27 0.227.32% GOI 2024 (28-Jan-2024) SOVEREIGN 106.11 0.085.22% GOI 2025 (15-Jun-2025) SOVEREIGN 98.25 0.07Total Gilts 11426.51 8.31Total Debt Holdings 28657.34 20.85Real Estate Investment Trusts Embassy Office Parks REIT 644200 2065.76 1.50Brookfield India Real Estate Trust 151400 372.58 0.27Total Real Estate Investment Trusts 2438.34 1.77
Different plans have a different expense structure
SCHEME CATEGORY
Aggressive Hybrid Fund
SCHEME CHARACTERISTICS
65-80% Equity, 20-35% Debt
MINIMUM INVESTMENT FOR SIP
` 500/1
Mutual Fund investments are subject to market risks, read all scheme related documents carefully.
Equity 76.26% Gilts 8.31% Money Market Instrument 6.11%
Corporate Debt 5.72%
@ Reverse Repo : 1.14%, Others (Cash/ Subscription receivable/ Redemption payable/ Receivables on sale/Payable on Purchase/ Other Receivable / Other Payable) : -0.02%
Real Estate Investment Trusts 1.77%
PSU/PFI Bonds 0.71% Call,cash and other current asset 1.12%
76.26%1.12%
0.71%
1.77%5.72%6.11%
8.31%
74.38%25.62%
Mayank Bukrediwala* (effective August 24, 2020) (dedicated for making investments for Foreign Securities)
* Pyari Menon (dedicated for making investments for Foreign Securities) ceased to be a Fund Manager for the scheme effective August 23, 2020. Please refer the addendum on the website for further details.
Investors understand that their principal will be at Very High risk
Riskometer is as on February 28, 2021
28.07%
16.53%
8.71%
6.38%
5.55%
4.48%
3.64%
3.46%
3.39%
3.39%
3.24%
2.82%
1.86%
1.60%
1.47%
1.42%
1.37%
1.24%
0.72%
0.65%
0.00%
BANKS
SOFTWARE
POWER
GAS
TELECOM - SERVICES
PHARMACEUTICALS
CONSUMER DURABLES
AUTO
FINANCE
NON - FERROUS METALS
PETROLEUM PRODUCTS
CONSTRUCTION PROJECT
HOTELS/ RESORTS AND OTHER RECREATIONAL ACTIVITIES
FERROUS METALS
AUTO ANCILLARIES
CONSUMER NON DURABLES
TEXTILE PRODUCTS
RETAILING
MEDIA & ENTERTAINMENT
INDUSTRIAL PRODUCTS
UNLISTED