Scenario of Solid Waste Generation and its Management in Kamarhati Municipality of Kolkata, West...
330
Transcript of Scenario of Solid Waste Generation and its Management in Kamarhati Municipality of Kolkata, West...

ISBN 93-82880-95-X


www.groupexcelindia.com
Managing Editor
Vishwambhar Prasad Sati
Editors G. Kumar
P. Rinawma Rintluanga Pachuau
Ch. Udayabhaskara Rao K.C. Lalmalsawmzauva Benjamin L. Saitluanga
N. Bobby Singh Department of Geography and Resource ManagementSchool of Earth SciencesMizoram University, Aizawl-796004, Mizoram
EXCEL INDIA PUBLISHERS
NEW DELHI

First Impression: 2014
© Mizoram University, Aizawl, Mizoram
Management of Natural Resources for Sustainable Development: Challenges and Opportunities
ISBN: 978-93-82880-95-0
No part of this publication may be reproduced or transmitted in any form by any means, electronic or mechanical, including photocopy, recording, or any information storage and retrieval system, without permission in writing from the copyright owners. DISCLAIMER The authors are solely responsible for the contents of the papers compiled in this volume. The publishers or editors do not take any responsibility for the same in any manner. Errors, if any, are purely unintentional and readers are requested to communicate such errors to the editors or publishers to avoid discrepancies in future.
Published by EXCEL INDIA PUBLISHERS 91 A, Ground Floor Pratik Market, Munirka, New Delhi–110067 Tel: +91-11-2671 1755/ 2755/ 3755/ 5755 ● Fax: +91-11-2671 6755 E-mail: [email protected] Web: www.groupexcelindia.com Typeset by Excel Publishing Services, New Delhi–110067 E-mail: [email protected] Printed by Excel Printing Universe, New Delhi–110067 E-mail: [email protected]

Prologue
Management of natural resources for sustainable development is highly inevitable in the wake of over-exploitation of natural resources, mainly non-renewable resources, on the one hand, and due to tremendous increase in human population on the other. Growing population and tremendous rate of development activities have led to over-use of natural resources. Consequently, in due course of time, the availability of natural resources has reduced which has resulted in food scarcity, malnutrition and starvation. It was observed mostly in the Third World countries of the southern hemisphere that has led to division between north and south countries on development issues. If this situation prevails, with the same intensity and frequency, its impact will be catastrophic. Keeping all these circumstances in view, the concept of sustainable development was coined. Sustainable development may be defined as a kind of development that is able to sustain the present population and keep the promises of feeding the future generation, sustainably. India is still an emerging economy in the world, yet a large number of people are still living below poverty line although it has an abundance of natural resources as land, water, and biodiversity—the life sustaining layers. It needs a holistic approach for the management of natural resources and sustainable development. There are many areas in India including North-East India (NEI), which are economically backward where development could not take shape till now. It is a need of the hour to develop a policy of sustainable development and management of natural resources and economic development of the backward areas. To commemorate these issues, the present efforts to organize a seminar in the Department of Geography and Resource Management, Mizoram University, Aizawl will be a milestone and a noteworthy contribution in temporal and spatial perspectives. The theme of the national seminar: ‘Management of Natural Resources for Sustainable Development: Challenges and Opportunities’ is a very burning, far-reaching and comprehensive issue, as the management of natural resources is inevitable for the sustenance of present and future generations. Based on the main theme of seminar, there are many sub-themes incorporated for the presentation of the papers. Those papers are being published in the proceedings of the national seminar. They are concepts of sustainable development, management planning, utilization pattern of natural resources, management of major resources—forest, water, land and biodiversity; development–environment interface, development dilemma, environmental degradation—causes and consequences and major challenges and opportunities of management of natural resource. Utilization pattern of natural resources varies from one region to the other. The nations, those have utilized natural resources optimally, have received a progressive developed stage. Contrary to that, the underdeveloped nations could not utilize the natural resources sustainably. This anomaly has led to disparities in development amongst the world countries. This is also a case with NEI, where availability of natural resources is in plenty but at the same time, their management could not take shape largely during the past decades. This national seminar will focus on the issues and will widely elaborate the management aspects of resources. It is hoped that the outcome of the seminar will be useful for framing up policies and implementing them for the management of the natural resources. It was decided at the department level by the members of organizing committee to publish the pre-seminar proceedings along with souvenir and abstract book separately. Thus, keeping the promise, we called for submission of full length papers from the academicians and we received good response from far and wide. There are total 42 papers selected for the publication in the pre-seminar proceedings. These papers illustrate the various aspects of natural resources management, viz., land resource management, water resource management, forest resource management and etc.

Prologue
vi
The seminar will bring together the academicians from all over the country and will discuss on the various issues, which are related to the natural resources and their management. A brainstorming session will be organized within the seminar period where all the major issues related to availability of natural resources, utilization pattern and management for the sustainable development will be discussed. This will be done on the issues of the sustainable development in India, in general and the Eastern Himalaya in particular. The recommendations by the experts will be disseminated to the various stakeholders—government, academicians, researchers and policy makers. These will also be useful for the students of different streams. Follow up events at the university level in the form of field visit of students, debate, quiz and essay competitions on management of natural resources will be organized. This volume is an output of the ‘National Seminar on Management of Natural Resource for Sustainable Development: Challenges and Opportunities’. Many public and private institutions have sponsored this seminar: the Indian Council of Social Science Research, the Indian National Science Academy, Mizoram University, and the like. We are thankful to them for their generous support. Without their support, it could not have been possible to organize this seminar and subsequent publication of this volume. We are thankful to everybody who were involved in any capacity for the successful accomplishment of this seminar and the publication of this volume. Aizawl, Mizoram Editors

vii
Contents
Prologue v
1. Biodiversity Conservation through Revival of Sacred Groves—A Contemporary Issue in Geography
Malay Mukhopadhyay and Saswati Roy 1
2. Changing Scenario of Resources and Development in the Globalized Market Economy: A Case of Tribal Areas of Madhya Pradesh
Y.G. Joshi 6
3. Assessment of Water Potential and Irrigation Water Requirement for Crop Planning
Bharat Chandra Nath 16
4. Non-Timber Forest Products as Alternative Livelihood Options in Transboarder Villages of Champhai District of Eastern Mizoram, North-East India
J. Lalremruata, U.K. Sahoo and H. Lalramnghinglova 23
5. Scenario of Solid Waste Generation and its Management in Kamarhati Municipality of Kolkata, West Bengal
Md. Mustaquim and Md. Ismail 31
6. Impact of Ranganadi Hydro Project on Environmental Degradation in the Lower Dikrong Basin of Assam, India
Gajen Bhuyan and H.J. Syiemlieh 43
7. Ecotourism, Livelihood and Resource Management: A Case in Pakhui-Nameri Tiger Reserve of Assam and Arunachal Pradesh
Niranjan Das 54
8. Using GIS Techniques for the Study of Soil Resource and its Physical Characteristics in Nasik District of Maharashtra, India
Suryawanshi D.S., Pagar S.D. and Kate A.M. 64
9. Value Addition and Marketing of NTFPs and MAPs: A Brief Study of Murlen Village, Mizoram
John Zothanzama and F. Lalnunmawia 71
10. Consequences of Dilemmatic Development on the Little Andaman Island of India Saswati Roy 77
11. Changes in Village Safety and Supply Forest in Kolasib District of Mizoram H. Lalchamreia and Rintluanga Pachuau 86
12. Provisioning of Municipal Services in Gangtok: Water and Garbage Management Amrita Singh and Ranjana Laskar 92
13. Community based Ecotourism as a Tool for Biodiversity Management: A Case Study of Manas Maozigendri Ecotourism Society, Assam
Annesha Borah and Nazneen Akhtar 100
14. Conservation and Management of Water Resources: A Case study of Duga, Sikkim Himalaya
Basanti Rai 108
15. Participatory Water Projects Bringing in Unequal Burden: Women’s Experiences from Kerala
Lekha D. Bhat 115

Contents
viii
16. Studies of Rhododendron arboreum Sm.: Its Distribution and Conservation in Mizoram, India
B. Malsawmkima, David C. Vanlalfakawma, U.K. Sahoo and V.P. Khanduri 122
17. Forest Resources and Santals: A Micro-Level Conceptual Overview on Birbhum District, West Bengal
Prakash Ray 127
18. Status of Muga Culture and Technology Adoption in Assam Ranuma Das, B.N. Choudhary, M. Sankar, J. Mahanta and K. Giridhar 132
19. Pisciculture Oriented Agriculture in the Ziro Valley Modang Reena and Anku Nani 136
20. Jhummias Innovations for Land Degradation Control and Sustainable Agriculture in Sakei Lui Sub-Watershed
R. Zonunsanga, Ch. Udaya Bhaskara Rao and P. Rinawma 142
21. Joint Forest Management and Women Access to Non-Timber Forest Product in East Sikkim
Karma Detsen and Ongmu Bhutia 146
22. Development and Environment: North-East India Chapter Yumnam Premananda Singh 152
23. Betel Vine (Piper betel L.): The Neglected Green Gold Claims Livelihood and Health Security in Rural India
Ranjan Kumar Kar, Poly Saha, Kalidas Upadhyaya and Sanjay Kumar Mohanty 167
24. Phytosociological Analysis of Woody Vegetation in Tropical Forest of Manipur Gurumayum Sanahal Sharma, P.S. Yadava and Angom Sarjubala Devi 177
25. Role of Plant Resources in the Abatement of Air Pollution: An Eco-Sustainable Approach
Lalita L.S. Panda and Prabhat Kumar Rai 180
26. Morphometric Analysis and Land Use Mapping of Sathaiyar River Basin in Sirumalai Hill Dindigul District, using Remote Sensing and GIS
Mayavan N. and Sundaram A. 185
27. Wetland Resources of Northeast India: A Case Study of the Loktak Lake, Manipur, India
Mayanglambam Muni Singh and Prabhat Kumar Rai 192
28. Status of Western Hoolock Gibbon Hoolock hoolock in Longai Reserve Forest of Southern Assam and Issues Related to its Conservation
Pallab Deb, Prabhat Kumar Rai and P.C. Bhattacharjee 198
29. Forest Dependent Livelihood in Relation to Socio-Economic Status of the Khasi Tribe of Meghalaya: A Case Study of Three Villages
V.P. Khanduri, Dafiralin Lyngdoh and K.S. Kumar 203
30. The Water Availability and Management in Context of Emerging Water Scarcity Problem in Jhabua District of Madhya Pradesh: A Temporal Prespective
Rekha Verma 216
31. Magnetic Properties of Tree Leaves and Their Significance in Atmospheric Particulate Pollution in Aizawl City, Mizoram
Biku Moni Chutia, Prabhat Kumar Rai and S.K. Patil 219
32. Integrated Impact on Urpod Beel of Goalpara District, Assam Sarma Brindaban 226

Contents
ix
33. The Effect of Disaster in Agriculture of Uttarakhand Hills with Special Reference to 16–18 June 2013
M.S. Negi and S.P. Sati 232
34. Altered Environments: Land Use Land Cover Change Due to Construction of Teesta Low Dam Project IV at Kalijhora, West Bengal
Phu Doma Lama, S.K. Bandooni and Laishram Mirana Devi 236
35. Morphometric and Hypsometric Analysis of Sairang Sub-basin for Natural Resources Management
Fuzal Ahmed and K. Srinivasa Rao 244
36. Application of TiO2 and Dye Coated TiO2 Thin Films for Solar Energy Conversion for Sustainable Alternative Energy Source
S. Rai and P.J. Dihingia 257
37. Impact of Sandstone Quarry on Water Quality of Tlawng River in Aizawl District, Mizoram, North-East India
B.P. Mishra and G. Premeshowri Devi 263
38. Potential of Rain Water Harvesting Prashant Thote, L. Mathew and D.P.S. Rathoure 270
39. Tragedy of the Commons Revisited: Governance and Management of Natural Resources in Mizoram
Benjamin L. Saitluanga 279
40. Water Resource Management in Hilly Terrain with Special Reference to Kolasib District, Mizoram
Vinod K. Bharati and Shiva Kumar 287
41. Sustainable Utilization of Natural Resources for Poverty Reduction: A Case for the Indian Central Himalayan Region
Vishwambhar Prasad Sati 296
42. Information System Approach for Integrated Natural Resource Management, Learning and Practices in Nauguda Gad, Uttarakhand
S.K. Bandooni, Vijendra Kumar Pandey and Kaushal Kumar Sharma 304
AUTHOR INDEX 318


1
1 Biodiversity Conservation through Revival of Sacred Groves—A Contemporary Issue in Geography
Malay Mukhopadhyay and Saswati Roy Department of Geography, Visva Bharati, Santiniketan
E-mail: [email protected], [email protected]
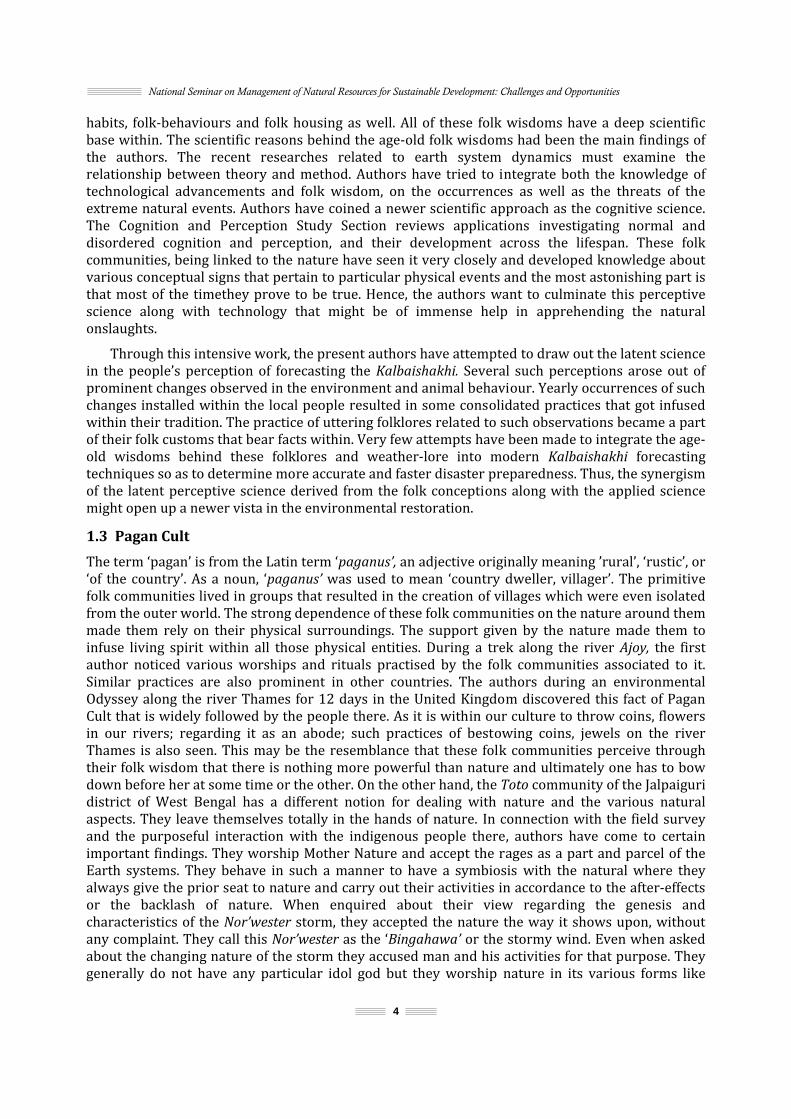
1. Introduction Throughout the past periods of our ancient world, nature heralded the utmost position in the life culture of every civilization. Nature had full control on the civilization then. It was the cult of fear instilled amongst the humans that made them to fear nature and bow in front of her. It was through this fear as well as honour to the bountiful nature that the idea of worship came within the cult. This behaviour resulted in the development of cultures that varied from place-to-place. Folk cultures are promoted by isolation. The physical landscapes provide barriers to movement and bring out themes for the folk cultural practices. On the basis of the available resources and material, the rural community who are generally in geographical isolation, make a way out for their physical habits, social habits and entertainment which make them unique. It is through this culture and habits instilled within the primitive cultures which creates deep faith on the nature. As these folk cultural practices were isolated, or were not communicated, they became distinct cultural hearths. It was the birthplace of religion. With this religious sanctity, several natural entities got the concern of being treated as the Almighty. It depended on the torment of the particular physical entities that ensured their worship, for, it may be volcanoes, deep forest, sea or even wild animals. The community—those who were exposed to the fury of wind, regarded it as the Almighty, those who drew maximum benefits from the Sun worshipped the Sun as God like the Toto of Coochbehar; those who received the basic amenities from the forest, regarded it as their deity like the Rajbangsi of Coochbehar and many such other communities are also found. These folk communities always had an intention to learn from ‘nature’ as well as tried to understand ‘nature’. This trial of understanding nature resulted into a folk intelligence with which they derived their culture. This eco-folk wisdom has enriched them in being closely associated with the rhythms of nature. Such a religious ideology got materialized through the worship of these physical entities. Age-old environmental awareness amongst the society got materialized that resulted in the several religions like Christianity, Buddhism, Hinduism, Islam etc,all of which have a deep concern with nature within their worship. The touch with nature, with due respect and honour, is particularly seen amongst the primitive tribes of the world—those who are devoid of any particular religion. This materialistic idealism is still pertinent in the Eastern Asian culture, mainly India, which is vivid through the sacred groves, folklore associated with several physical entities and pagan cult associated with several folk beliefs. Authors, with their little interaction within several intrinsic cultures in India and abroad, have come to an annotation that the folk wisdom could be used as a means of ‘Environmental Restoration’.

National Seminar on Management of Natural Resources for Sustainable Development: Challenges and Opportunities
2
1.1 Sacred Groves—As an Environmental Restoration Measure Human beings have the basic instinct to have faith on something and when religious confinement comes within, the faith further gets strengthened to belief. Such facts are pertinent in the society. Our ancestors acquired all sorts of benefits from the nature and developed bondage with it. It was through the eco-folk wisdom developed within the communities, that instilled within them a deep love and respect for the ‘mother nature’. Authors explored that most of the religious activities of the world have a deep sense of understanding the nature that leads to environmental faith and dependency. It is thus an apprehension of the authors that if this religious aspect is used up for environmental and biodiversity conservation, then the burden upon the several conservation organizations would be relaxed. Revival of sacred groves is one such measure. Sacred groves are such micro-spatial units where devotees of a particular religion come for retaining their mental sanctity. Sacred groves are patches of natural or near-natural vegetation dedicated by local communities to deities, or their ancestral spirits. Such groves may consist of a multi-species forestry; a clump of trees belonging to one species or even a single old tree, depending on the history of the local culture. This region where the flora and fauna is kept untouched where human belief in nature’s co-existence could be used as an effective conservation technique. India is painted with huge number of such sacred groves scattered all throughout. In India, sacred groves are scattered all over the country, and do not enjoy protection via federal legislation. Some NGOs work with local villagers to protect such groves. Each grove is associated with a presiding deity, and the grove is referred to, by different names in different parts of India. They are maintained by local communities with hunting and logging strictly prohibited within these patches. While most of these sacred deities are associated with local Hindu gods, sacred groves of Islamic and Buddhist origins are also known. Sacred groves exist in a variety of places—from scrub forests in the Thar desert of Rajasthan maintained by the Bishnois, to rain forests in the Kerala Western Ghats maintained by the Kani tribes. Himachal Pradesh in the north and Kerala in the south are specifically known for large numbers of such sacred groves. The Kodavas of Karnataka maintained over 1000 sacred groves in Kodagu alone. Around 14, 000 sacred groves have been reported from all over India, which act as reservoirs of rare fauna, and more often, rare flora, amidst rural and even urban settings. Experts believe that the total number of sacred groves could be as high as 1,00,000. Threats to the groves include urbanization, over-exploitation of resources, and environmental destruction from several modified religious practices. While many of the groves are looked upon as abode of gods, in the recent past, a number of them have been partially cleared for construction of shrines and temples. Ritualistic dances and dramatizations based on the local deities that protect the groves are a part of entertainment within the folk culture of various communities. Similar activities are still persistent amongst the folk communities in Kerala who entertain themselves with the folk ritualistic dances and performances called Theyyam and Nagmandalam. Even such folk practices are observed amongst the Kani tribes of the Nilgiris in the Western Ghats, Santhals, Bhil, Munda of Eastern India where they observe the ‘forest’ as their sacred hearth. But the present day strategies are interrupting into their arena and forsaking them from maintaining their serenity. But with modernity and exposure to technology, man started gripping nature under his control. In the present day status the overwhelmed modern culture is intended towards rupturing the nature. The first author with his deep study after visiting varied places all over the globe has put forward that there are certain practices amongst several cultural units, which, if thought deeply, would help in the environmental renewal. According to the authors, the environmental restoration would be successful if such clumps of sacred groves are put in a mosaic altogether.

Biodiversity Conservation through Revival of Sacred Groves—A Contemporary Issue in Geography
3
1.2 Folk Wisdom and Cognitive Science The authors have carried out several field studies to extract the in-depth science within the various cultural practices instilled within the folk communities. The main intention was to extract the scientific relevance behind the folk wisdoms, as related with the physical entities. For this purpose, the authors have considered the Nor’wester or Kalbaishakhi which is regarded as a natural calamity in and around the states of Eastern India. The authors carried out an intensive field work particularly in the state of West Bengal and also in other states like Bihar, Jharkhand and Assam where the Nor’wester is generally predominant. The researchers in their field survey in North Bengal during 2012 had come through several inquisitions as carried out by several communities prevailing there for decades together. Amongst them are the Cooch, Rajbangsi, Rava and Toto community who communicated us their interesting customary practices before and during this storm period. To start with the Cooch community of North Bengal, on the basis of their perceptive folk wisdom, they perform several practices like Bao kumta before the Nor’wester, which bears a scientific relevance. On the basis of such traditional wisdoms, they determine the position of the winds and get to build the architectural framework of their houses accordingly. According to their traditional culture, they have a proverb based on which they culminate the architectural framework of their houses.
“Pube hans paschime bas.
Uttare gua dokkhine dhua” This proverb goes in this way: 1.2.1. Pube hans
‘Pube’ means east and ‘hans’ means pond. While constructing the house, there has to be a pond in the east. This is done keeping in mind that the first rays of the rising sun could enter the house along with the fresh air passing over the cool pond. 1.2.2. Paschime bans
‘Paschime’ means west, ‘bans’ means bamboo plantations. As the Kalbaishakhi storm along with other storms generally commensurate from the west, the presence of these bamboo plantations act as a barrier and hence prove helpful in dissipating the storm, or, sometimes reducing the strength of the prevailing storms. Even these plantations prevent the entry of twigs, leaves, barks and other materials into the house which is brought by the storms. 1.2.3. Uttare gua
‘Uttare’ means north and ‘gua’ means betel plants. To the north, palm and betel plants are grown; this is so because these plants are very slender and tensile which prevents them from breaking by the strong Kalbaishakhi winds. Hence, they prove to be a very good barrier as well as permanent green coverage. 1.2.4. Dokkhine dhua
‘Dokkhine’ means south and ‘dhua’ means open fields. It is a mandatory to keep the south of the houses absolutely free from any structures as well as any plantations. This is so, because all the favourable winds come from the south. Hence, to prevent any restraint to those winds, the south has to be kept open. The acceptance of nature’s diction due to fear has developed a folk wisdom within the folk culture. This has been transmitted through ages which have influenced the communities’ folk
National Seminar on Management of Natural Resources for Sustainable Development: Challenges and Opportunities
4
habits, folk-behaviours and folk housing as well. All of these folk wisdoms have a deep scientific base within. The scientific reasons behind the age-old folk wisdoms had been the main findings of the authors. The recent researches related to earth system dynamics must examine the relationship between theory and method. Authors have tried to integrate both the knowledge of technological advancements and folk wisdom, on the occurrences as well as the threats of the extreme natural events. Authors have coined a newer scientific approach as the cognitive science. The Cognition and Perception Study Section reviews applications investigating normal and disordered cognition and perception, and their development across the lifespan. These folk communities, being linked to the nature have seen it very closely and developed knowledge about various conceptual signs that pertain to particular physical events and the most astonishing part is that most of the timethey prove to be true. Hence, the authors want to culminate this perceptive science along with technology that might be of immense help in apprehending the natural onslaughts. Through this intensive work, the present authors have attempted to draw out the latent science in the people’s perception of forecasting the Kalbaishakhi. Several such perceptions arose out of prominent changes observed in the environment and animal behaviour. Yearly occurrences of such changes installed within the local people resulted in some consolidated practices that got infused within their tradition. The practice of uttering folklores related to such observations became a part of their folk customs that bear facts within. Very few attempts have been made to integrate the age- old wisdoms behind these folklores and weather-lore into modern Kalbaishakhi forecasting techniques so as to determine more accurate and faster disaster preparedness. Thus, the synergism of the latent perceptive science derived from the folk conceptions along with the applied science might open up a newer vista in the environmental restoration. 1.3 Pagan Cult The term ‘pagan’ is from the Latin term ‘paganus’, an adjective originally meaning ’rural’, ‘rustic’, or ‘of the country’. As a noun, ‘paganus’ was used to mean ‘country dweller, villager’. The primitive folk communities lived in groups that resulted in the creation of villages which were even isolated from the outer world. The strong dependence of these folk communities on the nature around them made them rely on their physical surroundings. The support given by the nature made them to infuse living spirit within all those physical entities. During a trek along the river Ajoy, the first author noticed various worships and rituals practised by the folk communities associated to it. Similar practices are also prominent in other countries. The authors during an environmental Odyssey along the river Thames for 12 days in the United Kingdom discovered this fact of Pagan Cult that is widely followed by the people there. As it is within our culture to throw coins, flowers in our rivers; regarding it as an abode; such practices of bestowing coins, jewels on the river Thames is also seen. This may be the resemblance that these folk communities perceive through their folk wisdom that there is nothing more powerful than nature and ultimately one has to bow down before her at some time or the other. On the other hand, the Toto community of the Jalpaiguri district of West Bengal has a different notion for dealing with nature and the various natural aspects. They leave themselves totally in the hands of nature. In connection with the field survey and the purposeful interaction with the indigenous people there, authors have come to certain important findings. They worship Mother Nature and accept the rages as a part and parcel of the Earth systems. They behave in such a manner to have a symbiosis with the natural where they always give the prior seat to nature and carry out their activities in accordance to the after-effects or the backlash of nature. When enquired about their view regarding the genesis and characteristics of the Nor’wester storm, they accepted the nature the way it shows upon, without any complaint. They call this Nor’wester as the ‘Bingahawa’ or the stormy wind. Even when asked about the changing nature of the storm they accused man and his activities for that purpose. They generally do not have any particular idol god but they worship nature in its various forms like

Biodiversity Conservation through Revival of Sacred Groves—A Contemporary Issue in Geography
5
mountain god (Hispa), Sun god (Sani). They perform several festivals in association with several natural activities like ‘Guati’ or ‘sordeh’ festival at the end of Chaitra (the summer month in the Bengal calendar), which is to show acceptance of the enraged Nor’wester and the eager expectation for the monsoon. The Rava community of the Jalpaiguri district also performs several such tasks as related to the activities of the nature. They also accept the natural events as normal phenomenon and when the rage is too furious, they opt for worshipping their village god who they call the Mahakal. Besides, there are a few beliefs, rhymes, festivals, treatise with latent science within them which needs immense study to inculcate them within our measures meant for recouping with natural events. Thus, it is from these findings that although man has reached heights in technological development, but there are still certain cultures which bow down before nature with due honour. This pagan cult if recognized and allowed to survive would groom out a newer approach towards environmental restoration. 2. Conclusion Each and every folk culture throughout this globe has sustained through its own eco-folk wisdoms. These folk wisdoms must be honoured. This would only be possible when the researchers would try to synergize the science lying within their folk-practices along with their technological knowhow. These latent eco-folk wisdoms should be encouraged for environmental renewal and restoration. Recently scientists feel themselves to be very powerful and equipped with the gadgets, they even go for taming the nature. Though the great social philosophers demarcated phases of human attitude towards nature and categorized them sequentially as: environmental determinism, possibilism, neo-determinism and so on. But if thought literally, man has passed through all these stages but overlooked the neo-deterministic phase where he was about to stop for some time, look back about his doings and then decide his ways further. According to the authors, it is actually the right time where man should stop, try to feel the essence within the folk wisdoms of these folk communities and then judge their proceedings. References Ayoade, J.O. (1983), An Introduction to Climatology for the Tropics, John Willey and Sons, New York, p. 258. Bose, S.C. (1968), Geography of West Bengal, National Book Trust, New Delhi, p. 65. Critchfield, H.J. (1999), General Climatology, Prentice Hall of India, pp. 355–376, 377–389. Dikshit, R.D. (1999), Geographical Thought: A Contextual History of Ideas, Prentice-Hall of India, New Delhi, pp. 139–140. Holford, I. (1973), Interpreting the Weather, David and Charles, Newton Abbot, London, pp. 16–42,69–119. John,Gribbin and Mary (1998), Watching the Weather, University Press, Hyderabad. Mishra, Swades, Norwester of Bengal, Phenomena of Curse and Blessings, Agricultural Meteorology and Rainfall Registration Authority, Govt. of West Bengal. Mukhopaddhay, M. et al., (2011), “Preparation of Data Base for Holistic Study of Popular Perception on Kalbaishakhi”,
Jr. Eastern Geographer, Vol. XVII, June 2011, pp. 61–68, ISSN: 0973-7642. Mukhopadhyay, M. and Pal, T. (2012), Sacred Groves-an Issue of Identity Crisis, Lap Lambert Publishing House, Germany. Niyogi, M. (2007), Environmental Perception–A Key to Disaster Management: Some Observations. Shibnath Sastri College, Kolkata. Rakshit, D.K. (1999), Cyclone Disasters in India and their Mitigation through Prediction and Closer Monitoring, Natural Disaster Management Cell, Visva Bharati, Santiniketan. Romero, R. and Ramis, C. (1999), “Daily Rainfall Patterns in Spanish Mediterranean Area”, Jr. International Journal of Climatology, The University of Birmingham, Vol. 19, No. 1, January 1999, pp. 95–112. Roy, S. and Mukhopadhyay, M. (2012), Nor’wester—A Cognitive Study for Environmental Appraisal, Lap Lambert Publishing House, Germany, pp. 55–58, 82–87. Smith, K. (2004), Environmental Hazard: Assessing Risks and Reducing Disasters, Routledge, London, pp. 4–8. Southern R.L. (1979), “Global Socio-economic Impact of Tropical Cyclones”, Ausst Meteor Mag, p. 27, pp. 175–195.
6
2 Changing Scenario of Resources and Development in the Globalized Market Economy: A Case of Tribal Areas of Madhya Pradesh
Y.G. Joshi M.P. Institute of Social Sciences Research, Ujjain
1. Introduction The interlinking of the resource-rich, but economically poor areas, with the economically prosperous urban areas under the globalized market economy, has now initiated a process by which the resources and cheap labour is being drained out from these poor area towards already prosperous areas. At the global level, due to the technological advancement and networking, the natural resources of the poor countries are being drawn to the prosperous countries for profit maximization, while the reverse flow of capital to the source area is relatively week. At the national level, this process of internal colonialism is enriching the already rich areas at the cost of marginalized natural resource-rich fifth schedule tribal areas. In a sense, the resource-rich fifth schedule areas have not been able to link themselves to the mainstream economy, in a way, to take a real advantage of their natural resources, but on the contrary, they are being pushed to the position of disadvantage due to this linkage. Therefore, the natural resources for them do not mean the same, as perceived by the people of the developed parts of the country. The tribal dominated region of Vidhyachal, Satpura, Mahadev and Maikal of Madhya Pradesh also presents a scenario of a similar equation between resources and development, which is quite different than perceived in the developed parts. The objective of the present paper is to present this dimension of the inverse relationship of resources and development. For an ease of presentation the content of the paper has been divided into the following three parts: 1. Theoretical context of the relationship between resources and development. 2. The tribal belt of Madhya Pradesh and its resource base. 3. The scenario of socio-economic development of the area, under the emerging globalized market economy. 2. Theoretical Context of the Relationship between
Resources and Development
2.1 Resource Resources are the aspects of bio-physical environment and are that portion of total stock that could be used under specified technical, economic and social conditions (Haggett, 1975). These substances existed in the environment since geological times but they could function as resources, only when man perceived their utility and developed technologies for their exploitation. Natural resources existing in some areas are only passive elements of production. Factors of other group, are the attributes of man and society. These factors not only determine the availability and exploitability of natural resources but also their distribution and utilization. When viewed with
Changing Scenario of Resources and Development in the Globalized Market Economy: A Case of Tribal Areas of Madhya Pradesh
7
reference to the tribal areas, the primary natural resources are: forest, land, water and minerals. Out of these, water, forests and minerals are such resources which are transferable, i.e., they may be siphoned out in the name of national development or utilization in other demand areas. Viewed in the local perspective, it is always possible that the local population may not derive any benefit out of these resources, but on the contrary, may be adversely affected by the environmental fallout and the problem of displacement. Out of these natural resources, land is the only resource which could not be transferred out, however, viewed in the perspective of social development and justice, it will have to be seen as to who controls the better quality of land in the area. 2.2 Development We all know that the word ‘development’ has a much wider coverage, as compared to ‘economic growth’, which merely means increasing capacity of the economy to satisfy the wants of its members and may be measured in terms of GDP or GNP. Conceptually, the term ‘development’ has undergone a number of changed interpretations, including, economic development, social development, sustainable development, human centred and inclusive development. In the concept of sustainable development, which is largely based on the concern for environment and future generation, sociologists have added the concept of ‘socio-cultural sustainability’ based on the principals of human dignity, equality and social justice (Gangarade, 1998) that includes the elements, like, improving social quality of life, elevation of moral fabric and invoking wider participation (Sharma, 1998). However, while all the above perceived models of social development, environmental sensibility, inclusive growth, and people’s participation may look impressive and desirable, in actual practice, it is the economic model, based on infusion of capital, infrastructure and integration with market forces and urban demand that dominates the scene, and the aspired social agenda is pushed to the background. 2.3 The Equation of Resources and Development Economic development is a complex phenomenon that depends on a myriad of spatial and non-spatial factors, natural resources being one of them. Merely existence of a natural resource cannot induce development. It depends on various human elements, ranging from individual participation, attitude and wants to various attributes of culture; such as, technological innovations, legal, political, financial, institutional and bureaucratic setup. Resource availability is exploited through techno-feasibility and socio-political accessibility, and therefore, its relationship with development is a complex process that should not be analyzed with a world view, but with reference to specific area and people in question. With reference to the development scenario of underdeveloped areas and underprivileged people, their situation of underdevelopment should not be viewed as lack of natural resource, or simply neglect, but to have been actively produced by exploitative processes (Frank, 1967). It has also been argued that in the present politico-economic structure, those people who are conscious of their rights and those areas which are dominated by such people get the benefits of developmental efforts, irrespective of existence or non-existence of natural resources (Sundaram, 1983). Natural resources and development do not mean the same for all, hence should be viewed differently with reference to different areas and different people. Natural resource-rich areas do not mean developed areas. The proponents of ‘dependency theory’ argue that resources flow from the ‘periphery’ of poor and underdeveloped states and regions to the ‘core’ of wealthy states and regions, and thus, poor regions and states are impoverished and the rich ones are enriched by the way poor areas are linked to the markets of the developed countries, or developed urban areas (Munck, 1999). This paradox of the inverse relationship of natural resources with development, termed as ‘poverty in plenty’ or ‘rich lands and poor people’ is clearly discernable in the Indian

National Seminar on Management of Natural Resources for Sustainable Development: Challenges and Opportunities
8
context. If the areas of forests, mineral wealth, watersheds and tribal habitations in India are mapped together, they will overlay one another on almost the same area, and surprisingly, these are also the homes of India’s poorest population. This paradox of poverty and poor economic growth in areas of abundant natural resources has been dealt with in detail by the proponents of the ‘resource curse thesis’ (Auty, 1993). This situation can more or less be perceived throughout the central tribal belt of India, especially, in the mineral-rich belt. The exploitation of forests and minerals of these areas are not benefiting the local population, but on the contrary, they are being adversely affected by environmental degradation and displacement. Therefore, these local aggrieved groups of people have been referred as ‘victims of development’ or ‘refugees of development’ (Farnandis, 1993). 2.4 Tribal Belt of Madhya Pradesh and its Resource Base Madhya Pradesh is the home to largest tribal concentration in the country. It has a concentration of 14.5% of the India’s tribal population, which is 20.3% of the total population of the state. If all the tribal sub-groups are included, their number in the state is 46. Six are the principal tribal groups which are respectively, Bhil, Gond, Kol, Korku, Saharia and Baiga who together constitute 92.2% of the total tribal population. Baiga, Saharia and Bharia of the state have been included in the list of primitive tribal groups, by the government of India. It has been stated that most of the tribal groups of Madhya Pradesh have in-migrated from outside and initially occupied the plane areas. Till the twelfth century, when the Rajput kings established their control on Madhya Bharat, tribals controlled this region. Even upto sixteenth century, the territory of Gond kingdom existed in the Mahakoshal region. Later on, the Moughals established their control on this area (Kumar and Sharma, 2010). In this process of conflicts, the tribals shifted to interior forested areas, for safety. From the regional point of view, the existing tribal belt of Madhya Pradesh extends to the Vidhyachal, Satpura, Mahadev and Maikal region. The following 19 districts have been designated as tribal districts by the state administration.
Table 1: Tribal Districts of Madhya Pradesh
S. No. District1 Sheopur2 Ratlam3 Jhabua4 Dhar5 Barwani6 Khargone7 Khandwa8 Burahanpur9 Hoshangabad10 Baitul11 Chhindwara12 Seoni13 Balaghat14 Mandla15 Dindori16 Anuppur17 Shahdol18 Sidhi19 UmariaSource: Department of Scheduled Tribes Development, Bhopal

Changing Scenario of Resources and Development in the Globalized Market Economy: A Case of Tribal Areas of Madhya Pradesh
9
Table 2: Tribal Blocks of Madhya Pradesh
S. N. Tribal Zone District Name T.D. Block S. N. Block Name Block Code1 Saharia Zone Sheopur 1 1 Karahal 012 Western Region Ratlam 2 1 Sailana 02 2 Bajna 033 Western Region Dhar 12 1 Dhar 04 2 Nalchha 05 3 Tirla 06 4 Sardarpur 07 5 Manawar 08 6 Dharampuri 09 7 Gandhwani 10 8 Bakaner(Umarban) 11 9 Kukshi 12 10 Nisarpur 13 11 Bagh 14 12 Dahi 154 Western Region Jhabua 6 1 Jhabua 16 2 Rama 17 3 Ranapur 18 4 Petlawad 19 5 Thandla 20 6 Meghanagar 215 Western Region Alirajpur 6 1 Alirajpur 22 2 Sondawa 23 3 Katthiwada 24 4 Jobat 25 5 Udaigarh 26 6 Bhavra 276 Western Region Khargone 7 1 Khargone 28 2 Gogaon 29 3 Bhagwanpura 30 4 Segaon 31 5 Bhikangaon 32 6 Jhiranya 33 7 Maheshwar 347 Western Region Badwani 7 1 Badwani 35 2 Pati 36 3 Thikri 37 4 Rajpur 38 5 Pansemal 39 6 Sendhawa 40 7 Niwali 418 Western Region Khandwa 1 1 Khalwa 429 Western Region Burhanpur 1 1 Khaknar 4310 Central Region Betul 7 1 Betul 44 2 Chicholi 45 3 Ghoradongari 46 4 Shahpur 47 5 Bhainsdehi 48 6 Aathner 49 7 Bhimpur 5011 Central Region Hoshangabad 1 1 Keshla 5112 Central Region Chhindwara 4 1 Tamia 52 2 Jamai 53 3 Bichhua 54 4 Harrai 5513 Central Region Seoni 5 1 Kurai 56Table 2 (Contd.)…

National Seminar on Management of Natural Resources for Sustainable Development: Challenges and Opportunities
10
…Table 2 (Contd.) 2 Lakhnadon 57 3 Chhapara 58 4 Kahanapas(Ghansaur) 59 5 Dhanaura 6014 Eastern Region Mandla 9 1 Mandla 61 2 Mohgaon 62 3 Ghughri 63 4 Nainpur 64 5 Bichhiya 65 6 Mawai 66 7 Niwas 67 8 Narayan Ganj 68 9 Bijadandi 6915 Eastern Region Dindori 7 1 Dindori 70 2 Amarpur 71 3 Karanjiya 72 4 Samnapur 73 5 Bajag 74 6 Mehadwani 75 7 Shahpura 7616 Eastern Region Balaghat 3 1 Baihar 77 2 Paraswada 78 3 Birsa 7917 Eastern Region Shahdol 4 1 Sohagpur 80 2 Gohparu 81 3 Burhar 82 4 Jaisinghnagar 8318 Eastern Region Anuppur 4 1 Anuppur 84 2 Pushprajgarh 85 3 Kotma 86 4 Jaithari 8719 Eastern Region Umaria 1 1 Pali 8820 Eastern Region Sidhi 1 1 Kusmi 89
Fig. 1: Tribal Devolopment Blocks
Changing Scenario of Resources and Development in the Globalized Market Economy: A Case of Tribal Areas of Madhya Pradesh
11
Out of the above 19 districts: Jhabua, Barwani, Dhar, Mandla and Dindori are the districts where more than 50% of the population is tribal; in Jhabua 86.8% of the population is tribal. There are 89 development blocks in the state which are designated as tribal blocks (Map 1), besides, there are 26 MADA pockets and 30 clusters which are included in the tribal sub-plan area. Based on the resource base, the tribal areas of Madhya Pradesh may be divided into following two regions: 2.4.1. Saharia and Western Tribal Region The region is characterized by low rainfall, deficient in natural resources of forest and minerals, excessive population pressure as compared to available resources, and resultant large scale seasonal migration. 2.4.2. Satpura, Mahadev and Maikal Region The region is characterized by medium to heavy rainfall, rich in forest and mineral resources but less accessible and relatively economically backward area. Viewed with reference to land resource, the entire tribal belt is the rugged hilly region of Vidhyachal, Satpura, Maahadev and Maikal, where soils are stony, less deep and due to sloppy terrain, are subject to rapid erosion. In Jhabua, there is a vast stretch of rugged terrain, known as, ‘Raath land’. In Balaghat, Mandla, Umaria and Sheopur, cultivable land is less than 30% and the fields are fragmented. Besides, in the entire tribal belt, a large chunk of good quality of agricultural land is under the control of non-tribal farmers. That is why, in spite of the fact that landlessness among the tribal farmers is relatively less, due to low agricultural productivity and increasing pressure of population on agriculture, sustaining the family on agriculture alone has not been possible in a majority of cases. Frequent losses due to monsoon failures make the agricultural resource increasingly risky, resulting in the condition of ‘chronic poverty’. In a comprehensive study conducted in the interior locations of south-western Madhya Pradesh, about two-third of the tribal families were found to be under the grip of chronic poverty (Sah and Shah, 2003). The source of all the major rivers, like, Narmada, Tapti, Son, Ken, Wainganga, and Chambal lie in the tribal areas. As such, any environmental degradation occurring in these source areas, will hit the entire catchment region. With respect to water resources, the whole of Saharia and Bhil-dominated tribal region is a low rainfall tract, where rainfall is less than 100 cm. With low rainfall, its variability is also high. Due to sloppy terrain, low retention, and percolation, the runoff rate is higher. This results into drying off of available water resource and resultant water scarcity condition, even with minor shortage of rainfall. A majority of the tribal development blocks of the Sheopur, Jhabua, Dhar, Barwani, Khargone and Burahanpur are covered under the Drought Prone Area Programme of the Government of India. The underground water level in this area has also gone very deep, and during summer, a majority of wells and tube wells go dry, resulting in a scarcity of drinking water. In Jhabua and Nimar belt, during drought years, cases of widespread looting and illegal felling of trees are often reported (Joshi, 2008). The average rainfall of Betul-Chhindwara is 100 cm to 120 cm, which increases to 160 to 180 cm in Balaghat-Mandla; the highest rainfall of above 200 cm is recorded around Panchmarhi. In the central and eastern part of the tribal belt, despite higher rainfall, due to higher runoff on the sloppy surface, the availability of water for rabi season is limited. Wells, tubewells and tanks are the principal sources of irrigation in the area. Excepting the Narmada and Wainganga basins, in the rest of tribal region, the irrigation is on a limited scale, and therefore, the area is largely single cropped. In the Mandla-Dindori tract, the irrigated area is less than even 10%. Excepting the deforested central and northern tracts of Jhabua, the entire tribal belt of Madhya Pradesh is rich with respect to forest resources. Noticeable within this is the forest belt extending from Alirajpur-Barwani to Satpura, Mahadev and Maikal ranges. In the districts of Barwani,

National Seminar on Management of Natural Resources for Sustainable Development: Challenges and Opportunities
12
Burahanpur, Balaghat, Mandla and Umaria the area under forests is more than 50% of the total geographical area, against the state average of 30.7%. According to the forest department of Madhya Pradesh, out the total forest area 19.4% are Teak forests, 4.2% are Sal, 0.5% is bamboo and 22.8% are mixed forests. Besides timber, fuel wood and bamboo, forests are the source of tendu leaves and a variety of minor forest produce, like, harra, gum, sal seed, etc. According to the 2009 Annual Report of the forest department, the revenue from the forest was 6890 million. As far as the benefits derived by the forest-dwellers from the forests is concerned, they derive some income from fuelwood, collection of tendu leaves and minor forest produce and wages. However, various micro-level field studies conducted in different parts of tribal belt clearly indicate that today the contribution of forests in the household income is meagre, and it is decreasing every year (Joshi, 2004, Rai, 2009, Sen, 1999, Mahor, 2005). The figures available in the government reports clearly indicate that the forest-dwellers get only a negligible share of the total revenue earned by the state. The report of the Indian Forest Institute, 2009 brings out that during 2003–04 the earning of the state from the sale of timber, bamboo and khair was Rs 5100 million, against which the total help rendered as Nistar facility to the forest-dwellers was just Rs 67 million, i.e., merely 1.3% (Verma and Vijay Kumar, 2009). A majority of the mineral-producing areas of the state lie in the tribal region. Coal, manganese, bauxite, copper and dolomite are the major minerals mined in the state, which generated revenue of Rs 6400 million as per the report of 2006–07. Out of this, the revenue from coal alone was 95%. The Sohagpur-Singrauli-Umaria-Korar coal belt lies in the eastern tribal districts of Shahdol, Sidhi and Umaria, while the Satpura coal fields of Kanahn, Pnach and Tawa valleys and of Patharkheda lie in Betul and Chhindwara districts. Maikal plateau of Mandla, Dindori and Shahdol districts produce best grade bauxite, while the Malanjkhand mine of Balaghat is one of the richest copper mines of the country. The important manganese rich belt lies in Balaghat and Chhindwara districts, while the mines of dolomite are situated in Mandla, Balaghat, Sioni, Chhindwara and Jhabua. No doubt these minerals play an important role in the development of the state and the country; however, how much of these benefit the local tribal population, is a debatable issue. The ground reality is that the problems of environmental degradation, pollution, erosion of economic base and displacement are more or less common in all the mining areas. 3. Present scenario of Socio-economic Development and Problems The inverse relationship of natural resources and development is also discernable in the tribal belt of Madhya Pradesh, i.e., despite being rich in mineral, water and forest resources, the tribals of these areas are most backward with regard to socio-economic development. With an increased pace of development and linkage with market economy, the pressure on natural resources of these areas is ever increasing, resulting in adverse environmental fallout, erosion of traditional economic base and displacement on the one hand, and increasing regional disparity, on the other. A study of natural resources and development conducted in this area, points out that the utilization of the natural resources has not been made for the development of these areas but their wealth has been drained out for increasing the wealth of the prosperous and urban areas of the state (Sharma, 2008). The World Bank Report has reported this situation as ‘mirage of mining and growth’ and holds that, as far as the mining areas of central India are concerned, the mining dependence is associated with retarded economic performance, higher levels of poverty, lower growth rate, higher levels of mortality, malnutrition, and morbidity in the source areas (Shrivastava, 2006). Extreme poverty in some cases has compelled the tribals to permanently leave their home land in search of work. In one study, it has been reported, that only in Delhi, more than 60, 000 tribal girls from Jharkhand and adjoining Jaspurnagar of Madhya Pradesh, are working as domestic servants (Gupta, 2007).

Changing Scenario of Resources and Development in the Globalized Market Economy: A Case of Tribal Areas of Madhya Pradesh
13
Land acquisition, displacement and the related discontent and violence is the contemporary serious problem in the tribal areas. The economic reforms have triggered 8%–9% rate of an expected growth which demands exploitation of the country’s mineral and head water resources; the largest part of which lies in the 5th schedule areas. Every new industry, mining, power, dam, rail-road or port project, or related township that intrudes into these areas and calls for land acquisition, creates great controversy, tension, opposition, and violence. During last 15–20 years, the private real estate players related with ecotourism, resorts and amusement parks are also making deep inroads in the tribal dominated tracts. Even the eco -parks and the wild life protection area programmes which do not directly displace people, restrict their entry, and thus, reduce their access to forest produce. This results into impoverishment of the forest-dwellers (Gisler, 2003). Thousands of people have been displaced due to the construction of dams on the Narmada and its tributaries, and a majority of these are tribals. According to one report, till 2010, nearly 100000 of the displaced were still waiting for rehabilitation (Sharma, 2010). In hundreds of adverse reports brought out by the activists and the clarifications and denials published by the government agencies, one thing is quite clear, that whatever has been done in the name of rehabilitation, has been too less and too delayed. Hundreds of micro-level studies have been conducted and a number of Ph.D dissertations have been written to evaluate the affectivity of different government programmes in different parts of the tribal areas of Madhya Pradesh. Though, due to different ecological and socio-economic conditions their results may vary, however, it has clearly been observed that, at the ground level, even after more than six decades of Independence, we have failed to fulfill our constitutional commitment towards the tribals and meet their aspirations. The exploitation in different forms still exists; the pace of economic development is slow, and the gap between them and other communities is ever widening. Though it cannot be said that there has been no positive change in the human development parameters of these area, however, one thing is certain that the overall situation is still far from being satisfactory. Some of the common indicators derived from secondary data and a number of micro-level studies that depict an overall sorry state of affairs in the tribal areas of the state, may be listed out as follows: • The economy of the tribals in many parts is still based on survival compulsions. The ratio of families living below poverty line is very high and a significant area is in the grip of chronic poverty. • At one place, when the resource base is ever declining, the population growth in these tribal areas has been very fast. The growth of population in Jhabua district had been second highest after Indore, which is a highly urbanized district. In the absence of a desired rise of employment in the tertiary sector, the rapid growth of population is putting extra pressure on the decreasing land resources. • Though there has been an improvement in the economy of the tribals, the gap between them and the other sections of the society, and even within their different groups, has widened. • In spite of the fact that three-fourth of their workforce is engaged in agriculture, the agricultural produce is not sufficient to give them round the year sustenance. Food security is still a serious concern for at least three-to-four months. • The contribution of the forests in their household economy has drastically reduced. • There has been an apparent downward occupational mobility. The one time self-sufficient household economy now largely depends on wage paid employment. Many of the one-time cultivators are now part-time ones, and a major share of their income is derived from wages earned as unskilled labourers, both from nearby and distantly located places.

National Seminar on Management of Natural Resources for Sustainable Development: Challenges and Opportunities
14
• Despite rise in literacy, there has not been perceptible rise in the skill component. The contribution of the service and self-employment sector is negligible, even much lower than that of the Scheduled Castes. • In spite of various legislations, large-scale alienation of land is still taking place, resulting in displacement. • Seasonal migration to urban areas, mines, brick kilns, industries, or rich agricultural areas has now been an established coping-strategy to mitigate the deficit, or to fight the adversities. • Together with lower efficacy, the government expenditure on various programmes, targeted at improving the economic condition of the people, largely failed to induce a self-generating multiplier impact. In many places, the condition of dependency syndrome is observable. • Barring certain exceptions, the PDS system which is basic to their survival, is not delivering desired results. • High child mortality, more deaths during pregnancy and delivery, high mortality due to preventable diseases, like, malaria, jaundice and diarrhoea are some of the indicators which depict the poor reach and ill accessibility of basic health facilities. In the last, it may be concluded that the equation between development and natural resources in the tribal areas of Madhya Pradesh is not the same as perceived in the developed regions. In the contemporary globalized market economy where the resource-rich tribal areas are under a constant threat of resource depletion, land acquisitions and displacement, their concerns should not be underestimated, ignored, or perceived with an overall consideration. No sustainable development of the state or the nation is possible, unless the concerns of the local population are seriously attended to. It has rightly been said that we should ‘think globally, but act locally’.
References Auty, R.M. (1993), Sustainable Development in Mineral Economics: The Resource Curse Thesis, Routledge, London. Farnandis, W. (1993), “Indian Tribals and Search for an Indigenous Identity”, Social Change, Vol. 23(2&3), pp. 33–42. Frank, A. (1967), “Capitalism and Underdevelopment in Latin America”, Monthly Review Press, New York. Gangarade, K.D. (1998), “Environmental Crisis: A Challenge to Modern Civilization for Secularization of Environmental Stewardship in Joshi”, Y.G. and Verma, D.K. (ed.): Social Environment for Sustainable Development, Rawat Publications, New Delhi, 1998, pp. 51–85. Geisler, C. (2003), “A New Kind of Trouble: Evictions in Eden”, International Social Science Journal, 55(1), p. 175. Gupta, R. (2007), Tribal Contemporary Issues: Appraisal and Intervention, Concept Publishing Company, New Delhi. Haggett, P. (1975), Geography: A Modern Synthesis, Harper and Row, New York. Joshi, Y.G. (2003), “Food Security Measures to Check Felling of Trees in Tribal Areas of M.P.”, Unpublished Report Submitted to Dr. Ambedkar Institute, Mhow. Joshi, Y.G. (2004), “Economic Development of Primitive Tribal Groups: a Study of Baigas of M.P. and Chhattisgarh”, in Sah, D.C. and Sisodia (2004): Tribal Issues in India, Rawat Publisher, Jaipur pp. 195–229. Joshi, Y.G. (2008), “Perceptions and Management of Droughts by the Tribals and its Planning Implications”, in Choudhary, S.N.(ed): Tribes and their Indigenous Knowledge: Implications for Development, Indira Gandhi Rashtrya Sangrahalaya and Pratibha Prakashan, New Delhi, pp 63-96. Joshi, Y.G. (2010), “Indebtedness and Land Alienation among Tribals of Madhya Pradesh”, in Chudhary, S.N., Tribal Economy on the Cross Road, Rawat Publications, New Delhi, pp. 119–165. Kumar, Pramila and Sharma, S.K. (2010), Madhya Pradesh: Ek Bhougolic Adhyayan, Madhya Pradesh Hindi Granth Academy, Bhopal Mahor, Rajesh (2005), “The Development Process of the Saharia Tribes with Reference to Changing Livelihood Base, (in Hindi)”, Unpublished Ph.D Dissertation, Devi Ahilya Vishvavidyalaya, Indore. Munck, R. and Danis, O’ Hearn (ed.) (1999), Critical Development Theory: Contributions to a New Paradigm, Zed Book Ltd., New York. Rai, Ajay (2009), “Evaluation of Changing Relation of Tribals with Forests: With Special Reference to Betul-Chhindawara Plateau, (in Hindi)”, Unpublished PhD Dissertation, Devi Ahilya Vishvavidyalaya, Indore.

Changing Scenario of Resources and Development in the Globalized Market Economy: A Case of Tribal Areas of Madhya Pradesh
15
Sah, D.C. and Shah, Amita (2003), Chronic Poverty in Remote Rural Areas of South-Western Madhya Pradesh, Mimeo, MPISSR, Ujjain and GIDR Ahemedabad. Sen, H.B. (1999), “Socio-economic Change and its Future Trends with Reference to Development Programmes: A Study of Bharia Tribes of Patalkot (in Hindi)”, Unpublished PhD Dissertation, Devi Ahilya Vishvavidyalaya, Indore. Sharma, (2010), Counter Current, Organization, Internet Source. Sharma, S.L. (1998), “Sustainable Development: Socio-cultural Imperatives”, in Joshi, Y.G. and Verma, D.K. (ed.): Social Environment for Sustainable Development, Rawat Publications, New Delhi, 1998, pp. 35–51. Shrama, S.K. (2005), Man, Environment, Resource and Development: A Search for Interrelationship in Madhya Pradesh”, Indian Cartographer, Vol. 25, pp. 23–31. Shrivastava, S. (2006), Economic and Social Challenges of Mineral Based Growth in Orissa, World Bank, New Delhi. Sundaram, K.V. (1983), Geography of Underdevelopment, Concept Publishing Company, New Delhi. Verma, Madhu and Kumar, Vijay (2009), Natural Resource Accounting of Land and Forestry Sector for M.P., Indian Institute of Forest Management, Bhopal, p. 132.
16
3 Assessment of Water Potential and Irrigation Water Requirement for Crop Planning
Bharat Chandra Nath North-Eastern Regional Institute of Water and Land Management (NERIWALM),
Ministry of Water Resources, Govt. of India, Tezpur (Assam)–784027
E-mail: [email protected]
1. Introduction Water is the primary input in crop production. Its availability plays an important role in crop growth and development. In recent times, need has arisen to grow more crops to increase production in order to meet the increasing demand of rapidly growing population. Apart from the suitable soil and climate, irrigation is a prerequisite to grow more crops and increase production. Increasing demand of water use in agricultural sector with the advent of crop diversification has spurred the need of assessment of crop water requirement and irrigation demand of crops; and irrigation water potentiality to meet the water demand. Many-a-time, it is observed that farmers have been utilizing water resource extensively for crop production due to ignorance of information on crop water requirement as well as irrigation water requirement of the crops. Proper crop planning based on irrigation availability is also not in practice, leading to improper utilization of water. To make the water management practices easier, crop planning is imperative. A study was undertaken in the Lower Kameng Basin (Jia-Bhareli river basin) in Assam. The study area falls under the ’North Bank Plain Agro-climatic Zone’ of the Brahmaputra Valley extending between longitudes 91058' and 93023' East, and latitudes 26036' and 27059' North. The study area was delineated to some morphological zones which were further divided into some homogenous land units. These homogenous land units were considered as the smallest land unit for assessment of ground-water potential, which has formed the basis of crop planning with a view that this would make crop planning easier, effective and location-specific. The required database and information on different climatic parameters, soil, crops etc. was generated and collected to meet up the requirement for assessment of water potential for irrigation. Assessment of crop water requirement along with irrigation water requirement of different crops was also done. Attempt was made to assess the scope of growing multiple crops in the study area on the basis of irrigation water potential. Crop planning exercise was done matching the irrigation availability with the crop water requirement of different rabi crops including paddy, in each of the homogenous land units in the Lower Kameng Basin.

Assessment of Water Potential and Irrigation Water Requirement for Crop Planning
17
2. Database Used Following primary data was generated during the study: 1. Climatic data like humidity, maximum-minimum temperature, sunshine hours, wind velocity etc. recorded and maintained by NERIWALM in its Agromet station at Tezpur for the period of 1999–2007. 2. Data on rooting depth and growing period and other necessary physiological and yield attributing characters of the tested crops was generated during the cropping trials. 3. Apart from the above-mentioned primary data, a number of secondary data was also collected and utilized in different stages of the research. 4. Daily rainfall data of 37 years (1970 to 2007) of Sonitpur District (Assam), of which the Lower Kameng basin is a part, was collected from Indian Meteorological Department (IMD), Govt. of India, Pune. In addition, daily rainfall data for the same period has also been collected from by four tea gardens situated in and around the study area. 5. Ground-water level data recorded and maintained by the Central Ground Water Board (CGWB), Ministry of Water Resources, Govt. of India, North-Eastern Region, Guwahati during the period 2002 to 2007 in selected wells located in and around the study area has also been collected. 6. Data on irrigation status of Sonitpur District, of Assam from the Department of Irrigation, Govt. of Assam, Guwahati and from the District Agricultural Office, Sonitpur, Govt. of Assam. 7. Geomorphic map prepared by the Geological Survey of India (1977) and modified by Debnath (2007). 8. Survey of India Toposheets No. 83 B9, 10, 13, 14 and 83 F 1, 2. 9. Population data of Census of India (2001). 3. Methodology The thematic map of the study area i.e. Lower Kameng Basin was extracted from maps prepared by GSI (1977) and Debnath (2007) and brought to GIS platform. The terrain features of the study area was extracted from the Survey of India toposheets of 1:50,000 scale, and updated with satellite imagery of IRS LISS III, PANCHROMATIC and LANDSAT data with the help of GIS software ILWIS. Morphological zones were delineated from the geomorphic units already demarcated in the geomorphic maps of Geological Survey of India (1977) and further modified by Debnath (2007). For detailed analysis, the Morphological Zones (MZs) were further divided into some Homogenous Land Units (HLUs). The HLUs were prepared by adopting the process developed by the North-Eastern Regional Institute of Water and Land Management (NERIWALM), Tezpur, Govt. of India to determine the safe yield of ground-water of Assam (Anonymous, 2004). The HLUs in each of MZs were prepared by using Theissen polygon method. The locations of rain gauge stations as well as locations of ground-water observation wells present within the study area and its adjacent areas were plotted and separate thematic maps of Theissen polygons generated. These two thematic maps further overlapped. The output map was further overlapped with the geomorphic thematic map. The final map demarcated the HLUs which bear uniform rainfall distribution, uniform ground-water fluctuation and identical geomorphic characteristics. The assessment of the water potential for irrigation of the study area was done adopting the specific procedure and modified guidelines recommended by Ministry of Water Resources (MOWR, 2009; CGWB, 2009), Govt. of India. The rainfall infiltration method as well as ground-water fluctuation method was used and compared for a compromised output. The population data

National Seminar on Management of Natural Resources for Sustainable Development: Challenges and Opportunities
18
obtained from Census of India 2001was also used to compute the present ground-water use in domestic sector etc. The Irrigation Water Potential (IWP) was assessed for each of the HLU in hectare, metre (ha-m) which is equivalent to 10,000 m³ of water. Assessment of Irrigation Water Requirement (IWR) was done based on Crop Water Requirement (CWR) of different Rabi crops and three different paddy growing during Kharif, Rabi and Summer seasons adopting standard hydrological procedure suggested by the FAO (1998) using the corresponding software CROPWAT 8.0. Climatic data like temperature, humidity, sunshine and wind speed and monthly rainfall data of 37 years of five different rain gauge stations and necessary data related to crop and soil were processed and used to calculate the CWR and IWR. Crops selection was done based on the performance of crops in the crop trials and also as per information obtained in relation to crop suitability from a study undertaken by NBSSLUP, ICAR, Jorhat Centre. Based on irrigation water potential of the HLUs, crop planning was attempted. Matching the irrigation availability to meet the crop water requirement of different crops was tried by adopting the following procedure: • Crop planning was done as per the calendar year, i.e., from January to December. Emphasis was given for crop planning during the Rabi season which shows great potentiality for crop diversification in the study area. However, different paddy crops like Autumn paddy (Ahu
paddy), Winter paddy (Sali paddy) and Summer paddy (Boro paddy) grown during Kharif and Summer seasons were also included. • The seasonal Rabi crops were arranged and approximate dates of planting to harvesting also mentioned. • The volume of water required (ha-m) as per IWR (m) of the crops to be grown in the allotted area (ha) was computed separately for each of the crop. • Net Irrigation Water Requirement (NIWR), Gross Irrigation Water Requirement (GIWR) and Total Irrigation Water Requirement (TIWR) were computed seasonwise. • The Grand Total Irrigation Water Requirement (GTIWR) was worked out by summing up the TIWR of different seasons and was matched with that of IWP for each of the HLU. • Necessary adjustment of allocation of area for certain crops, inclusion or exclusion of crops was done whenever required to match the GTIWR with that of IWP of the HLU.
4. Results & Discussion
4.1 Delineation of Study Area, Morphological Zones and Homogenous Land Units The study area i.e., the Lower Kameng Basin has a total area of 95,840 ha with different morphological features. The alluvial regime of the basin comprises of older alluvium to recent alluvium in the active flood plain with distinguished features having imprint of the fluvial process during the Pleistocene and Holocene epochs (Husain, 2002). Uniform soil may be available in an area but it may not be homogenous in terms of water availability. The availability of water for irrigation may not also be uniform in the entire area. Assessment of water potential for irrigation was therefore, done at micro-level i.e. in each of the homogenous land unit present in the different Morphological Zones (MZs). The study area was delineated to 14 morphological zones (Fig. 1). However, Homogenous Land Units (HLUs) were delineated in nine morphological zones (MZs) namely, Aggraded Valley, Point Bars, Sand Bars, Flood Basin, Older Alluvium, Recent Flood Plain, Seijosa Surface, and Solabari Surface which are found to be suitable for agricultural purpose.

Assessment of Water Potential and Irrigation Water Requirement for Crop Planning
19
Altogether, 57 HLUs were delineated which are considered to be homogenous in terms of uniform rainfall distribution, ground-water availability and specific geomorphic characteristics with identical soil type. Therefore, the HLUs were named referring its morphological zone, location of rain gauge stations and ground-water well. 4.2 Assessment of Irrigation Water Potential (IWP) Assessment of the irrigation water potential (IWP) reveals that the study area has about 29,183 ha-m potential. Among the different Morphological Zones (MZs), the ‘Solabari Surface’ has the maximum IWP of 11,207 ha-m against an area of 25,453 ha followed by ‘Seijosa Surface’ of 9,924 ha-m against an area of 22,339 ha. Among the Homogenous Land Units (HLUs), ‘Seijosa Surface *Phulbari x Kolony’ has the highest IWP of 4,671 ha-m against an area of 9,518 ha. The per hectare IWP was also computed which was found to be varied among the 57 HLUs. The highest per hectare IWP of 0.6 ha-m was computed in HLU ‘Solabari*Phulbari x Kolony’. The lowest per hectare IWP of only 0.03 ha-m was found in ‘Aggraded Valley*Tezpur x Jamuguri North’. The most potential morphological zone for different Rabi crops was observed to be ‘Recent Flood Plain’ which has about 4972 ha-m IWP in an area of 12, 542 ha. Therefore, the IWP of 13 different HLUs of Recent Flood Plain is presented in Table 1 to highlight as an example of the water potential for irrigation assessed during the study.
Table 1: Irrigation Water Potential of Recent Flood Plain of Lower Kameng Basin
Sl. No. Names of Homogenous Land Unit Geographical Area (ha)
Irrigation Water Potential (ha-m)
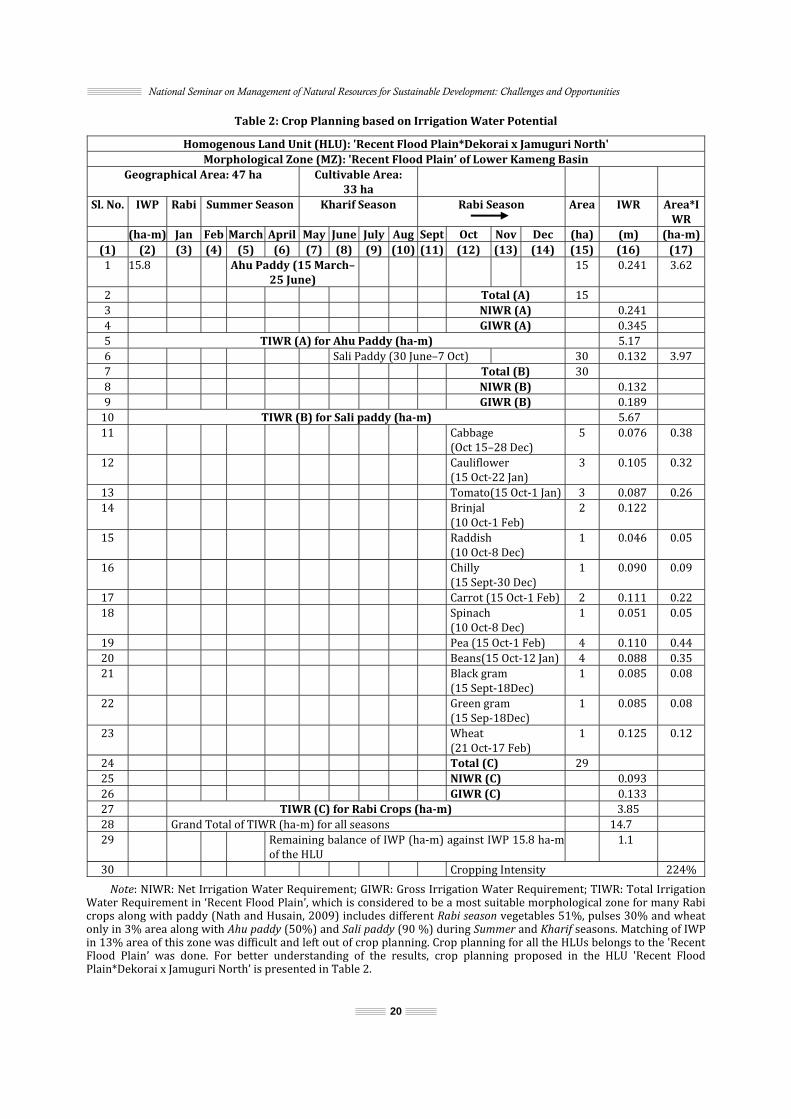
(1) (2) (3) (4) 1 Recent Flood Plain * Dekorai x Dhalaibil 1741 583.972 Recent Flood Plain * Dekorai x Garumari 2339 788.983 Recent Flood Plain * Dekorai x JamuguriNorth 47 15.814 Recent Flood Plain * Phulbari x Balipara 890 436.905 Recent Flood Plain * Phulbari x Garumari 482 237.396 Recent Flood Plain * Phulbari x Kolony 3025 1442.357 Recent Flood Plain * Dekorai x Sotia 32 17.598 Recent Flood Plain * Sonabeel x Balipara 316 99.089 Recent Flood Plain * Sonabeel x Dhalaibil 1079 354.9310 Recent Flood Plain * Sonabeel x JamuguriNorth 1229 483.5411 Recent Flood Plain * Sonabeel x Tezpur 4 2.1812 Recent Flood Plain * Tezpur x JamuguriNorth 742 114.9113 Recent Flood Plain * Tezpur x Tezpur 616 214.5114 Total 12, 542 4972.154.3 Crop Planning based on Irrigation Water Potential Crop planning indicates the inclusion of series of crops to be grown in an area during a year based on their suitability to soil, climate and water availability for irrigation. The basic purpose of crop planning is to facilitate horizontal crop diversification through expanding the crop base by adding more crops in to the cropping system. However, crop planning normally practised, based of soil site suitability without giving due importance to irrigation requirement, or irrigation availability. Recently, many workers are in the view that the potential crops which can be grown in an area may be identified based on irrigation water availability. Crop planning was done in each of the Homogenous Land Units (HLUs) based on the irrigation water potential. Summary of the crop coverage proposed in the crop planning of a morphological zone reflects overall possibility of crop coverage based on irrigation water potentialexample.g.,, crop planning.
National Seminar on Management of Natural Resources for Sustainable Development: Challenges and Opportunities
20
Table 2: Crop Planning based on Irrigation Water Potential
Homogenous Land Unit (HLU): 'Recent Flood Plain*Dekorai x Jamuguri North' Morphological Zone (MZ): 'Recent Flood Plain’ of Lower Kameng Basin
Geographical Area: 47 ha Cultivable Area: 33 ha
Sl. No. IWP Rabi Summer Season Kharif Season Rabi Season Area IWR Area*IWR
(ha-m) Jan Feb March April May June July Aug Sept Oct Nov Dec (ha) (m) (ha-m)(1) (2) (3) (4) (5) (6) (7) (8) (9) (10) (11) (12) (13) (14) (15) (16) (17) 1 15.8 Ahu Paddy (15 March–
25 June) 15 0.241 3.62 2 Total (A) 15 3 NIWR (A) 0.241 4 GIWR (A) 0.345 5 TIWR (A) for Ahu Paddy (ha-m) 5.17 6 Sali Paddy (30 June–7 Oct) 30 0.132 3.97 7 Total (B) 30 8 NIWR (B) 0.132 9 GIWR (B) 0.189 10 TIWR (B) for Sali paddy (ha-m) 5.67 11 Cabbage (Oct 15–28 Dec) 5 0.076 0.38 12 Cauliflower (15 Oct-22 Jan) 3 0.105 0.32 13 Tomato(15 Oct-1 Jan) 3 0.087 0.26 14 Brinjal (10 Oct-1 Feb) 2 0.122 15 Raddish (10 Oct-8 Dec) 1 0.046 0.05 16 Chilly (15 Sept-30 Dec) 1 0.090 0.09 17 Carrot (15 Oct-1 Feb) 2 0.111 0.22 18 Spinach (10 Oct-8 Dec) 1 0.051 0.05 19 Pea (15 Oct-1 Feb) 4 0.110 0.44 20 Beans(15 Oct-12 Jan) 4 0.088 0.35 21 Black gram (15 Sept-18Dec) 1 0.085 0.08 22 Green gram (15 Sep-18Dec) 1 0.085 0.08 23 Wheat (21 Oct-17 Feb) 1 0.125 0.12 24 Total (C) 29 25 NIWR (C) 0.093 26 GIWR (C) 0.133 27 TIWR (C) for Rabi Crops (ha-m) 3.85 28 Grand Total of TIWR (ha-m) for all seasons 14.7 29 Remaining balance of IWP (ha-m) against IWP 15.8 ha-m of the HLU 1.1 30 Cropping Intensity 224%
Note: NIWR: Net Irrigation Water Requirement; GIWR: Gross Irrigation Water Requirement; TIWR: Total Irrigation Water Requirement in ‘Recent Flood Plain’, which is considered to be a most suitable morphological zone for many Rabi crops along with paddy (Nath and Husain, 2009) includes different Rabi season vegetables 51%, pulses 30% and wheat only in 3% area along with Ahu paddy (50%) and Sali paddy (90 %) during Summer and Kharif seasons. Matching of IWP in 13% area of this zone was difficult and left out of crop planning. Crop planning for all the HLUs belongs to the 'Recent Flood Plain’ was done. For better understanding of the results, crop planning proposed in the HLU 'Recent Flood Plain*Dekorai x Jamuguri North’ is presented in Table 2.

Assessment of Water Potential and Irrigation Water Requirement for Crop Planning
21
From Table 2, it is evident that for the HLU, namely 'Recent Flood Plain*Dekorai x Jamuguri North' ground-water potential for irrigation is 15.8 ha-m against cultivable area of 33 ha. While computing the Gross Irrigation Water Requirement (GIWR), 30% more water of Net Irrigation Water Requirement (NIWR) was taken considering irrigation efficiency as 70%. The Irrigation Water Requirement (IWR) of Ahu paddy (0.241 m) was found to be more than IWR of Sali paddy (0.132 m). To match the irrigation availability with that of crop water requirement through irrigation water, Ahu paddy only in 15 ha during March to June could be proposed in the crop planning keeping in view the water requirement for Sali paddy and other rabi crops. The Total Irrigation Water Requirement for Ahu paddy, denoted as TIWR (A) is about 5.17 ha-m. Considering the farmers’ affinity towards cultivation of Sali paddy, 30 ha area was proposed to be covered by medium duration Sali paddy variety that would require total water for irrigation, denoted as TIWR (B) of 5.67 ha-m. Based on the availability of ground-water for irrigation after utilization in cultivation of both Ahu and Sali paddy, rabi crops have been suggested in the crop planning. Depending on IWR of each of the crops, allocation of area was made. The Total Irrigation Water Requirement of different rabi crops, denoted as TIWR(C) is 3.85 ha-m. The total water requirement for three different seasons crops proposed to be grown in the HLU 'Recent Flood Plain*Dekorai x Jamuguri North' is 14.7 ha-m which could be computed by summing up the TWIR of all the different seasons i.e. TIWR(A), TIWR(B) and TIWR(C). After utilization of 14.7 ha-m ground water for irrigation, an amount of 1.1 ha-m was kept as reserve for future utilization. With the proposed crop planning about 224% cropping intensity can be achieved. Similarly, crop planning based on irrigation water availability was proposed for all the other Homogenous Land Units (HLUs) of the Lower Kameng Basin. 5. Conclusion Irrigation has important link with crop diversification to increase productivity of land per unit area per year against per unit of water. A soil may be suitable for a particular crop or a crop group but its optimal growth and development largely depends on climate and water availability to meet the crop water requirement. Assessment of crop water requirement and irrigation water requirement is necessary based on climate and soil type. It facilitates inclusion or exclusion of crops in the crop planning. Thus, matching the irrigation water supply and crop water demand can make a crop planning fruitful and location specific. The scope of crop diversification is tremendous in the study area as it has good water potential for irrigation to meet water requirements of the crops proposed in the crop planning. The study area has enough irrigation water potential to meet the irrigation requirement of the proposed crops to be grown, especially, in Rabi season. Crop planning at micro-level (at homogenous land unit), mainly on the basis of assessment of irrigation water potential, crop water requirements and irrigation water requirements of different crops, is probably an attempt—the first of its kind—to bring hitherto uncultivated land or fallow land of Rabi season under cultivation of high value crops. A proper assessment of land and water resources is a must in agrarian country like India as a whole, and in the alluvial tracts of the Brahmaputra and its tributaries in particular, especially during the Rabi season in which most of the land remains uncultivated, both in the plains and hills of north-eastern India. This will also usher in socio-economic development of the people of the study area. This research work has not only been able to unravel inter-relationship among different factors related to land, water, climate, and soil influencing growth and development of agriculture crops; but also to find out complexity of the functioning of the inter-relationship which is of great fundamental and applied importance. The proposed crop planning will provide useful inputs for preparing crop calendar and can form guiding principles for structuring new and suitable cropping pattern based on season and water availability.

National Seminar on Management of Natural Resources for Sustainable Development: Challenges and Opportunities
22
References Anonymous (2004), Unpublished Report on Study on Assessment of Safe Yield of Groundwater and Level of Iron, Flouride, Arsenic and Hydrocarbon in Assam. NERIWALM under the Sponsorship of the World Bank-IDA Aided ARIASP Society, Govt. of Assam. Census of India (2001), Series 1, India, Paper 1 of 2001. CGWB (2009), Details Guidelines for Implementing Ground Water Estimation Methodology. Central Ground Water Board, Ministry of Water Resources, Govt. of India, New Delhi. Debnath, A.C. (2007), Changing Course of Kameng River in the Lower Reaches, Unpublished Ph.D Thesis, Department of Geography, North-Eastern Hills University, Shillong. FAO (1998), Crop Evapotranspiration-guidelines for Computing Crop Water Requirements. Irrigation and Drainage paper 56, FAO, Rome. GSI (1977), Contributions to Geomorphology and Geohydrology of the Brahmaputra Valley, G.S.I. Misc. Publ. No. 42, Calcutta. Husain, Zahid (2002), Geoecology of Kameng Himalaya, Regency Publications, New Delhi. MOWR (2009), Ground Water Resources Estimation Methodology, Report of the Ground Water Resources Estimation Committee, Ministry of Water Resources, Govt. of India, New Delhi. Nath, B.C. and Husain, Zahid (2009), “Productive Use of Soil Moisture in the Flood Affected Areas of the Lower Kameng Basin through Appropriate Crop and Water Management Practices”, International Seminar on Water Crisis in Indian Subcontinent: Issues and Challenges, 23-25, Nov, 2009, NEHU, Shillong.
23
4 Non-Timber Forest Products as Alternative Livelihood Options in Transboarder Villages of Champhai District of Eastern Mizoram, North-East India
J. Lalremruata1, U.K. Sahoo1 and H. Lalramnghinglova2 1Department of Forestry, School of Earth Sciences & Natural Resource Management,
Mizoram University Aizawl, Mizoram 2Department of Environmental Science,
Mizoram University Aizawl, Mizoram E-mail: [email protected]
1. Introduction The use of non-timber forest products (NTFPs) is as old as human existence. The range of NTFPs include valuable food, fodder, fibre, medicinal plants, bamboos, canes, tannin and dyes, oils, gums and many other products of both plant and animal origin (Belcher, 2003). The term NTFPs was coined by de Beer and McDermott (1996) and it consists of goods of biological origin other than wood that are produced in forests. The fuel wood, of late, has also been included in NTFPs (Shiva and Mathur, 1997). Non-timber forest products are also important parts of the biodiversity and are considered as component of livelihoods in terms of their economic, social and ecological value (Falconer and Arnold, 1988, FAO, 1990, 1992).A growing body of review suggests that different users define NTFPs differently, depending on their interests and objectives. Nevertheless, these products are among the oldest trade commodities in the world (Paoayotou and Ashton, 1993) which have recently gained a remarkable significance throughout the world in determining the rural economy (Godoy and Bawa, 1993; Gunatilake et al., 1993). However, the sustainable production of many NTFPs is no longer assured due to shrinkage of forest areas, increasing human populations, high market demand, and loss of traditional knowledge practices (Miah et al., 2003). According to Tiwari (2000), NTFPs are of crucial important to hills of north eastern India in providing employment to unskilled and skilled labourers and thus improvising to the otherwise stagnant rural economy. There are options that NTFPs can provide opportunity to increase the extractive resource value of forests (Godoy et al., 1993; Ros-Tonen and Wiersum, 2003) in a sustainable manner. During the past three decades, a lot of research have been carried out on various aspects of NTFPs such as non-timber forest products assessment (FAO, 1993, 2000), income generation from NTFPs (FAO, 1995), socio-economic benefits and issues in non-wood forest produces use (Arnold, 1995), assessing the economic value of traditional medicines from tropical rain forests (Balick & Mendelsohn, 1992), trade and marketing of non-wood forest products (Lintu, 1995), income generation potential for rural women through NWFPs (Malhotra et al., 1993, Perez and Arnold, 1995) etc. at global level. However, the data on NTFPs have not been recovered systematically from most of the forest areas in India (Lalremruata et al., 2007). Compared to other parts of our country, north-eastern India in general, and Mizoram in particular, lack in depth studies on various aspects of NTFPs.
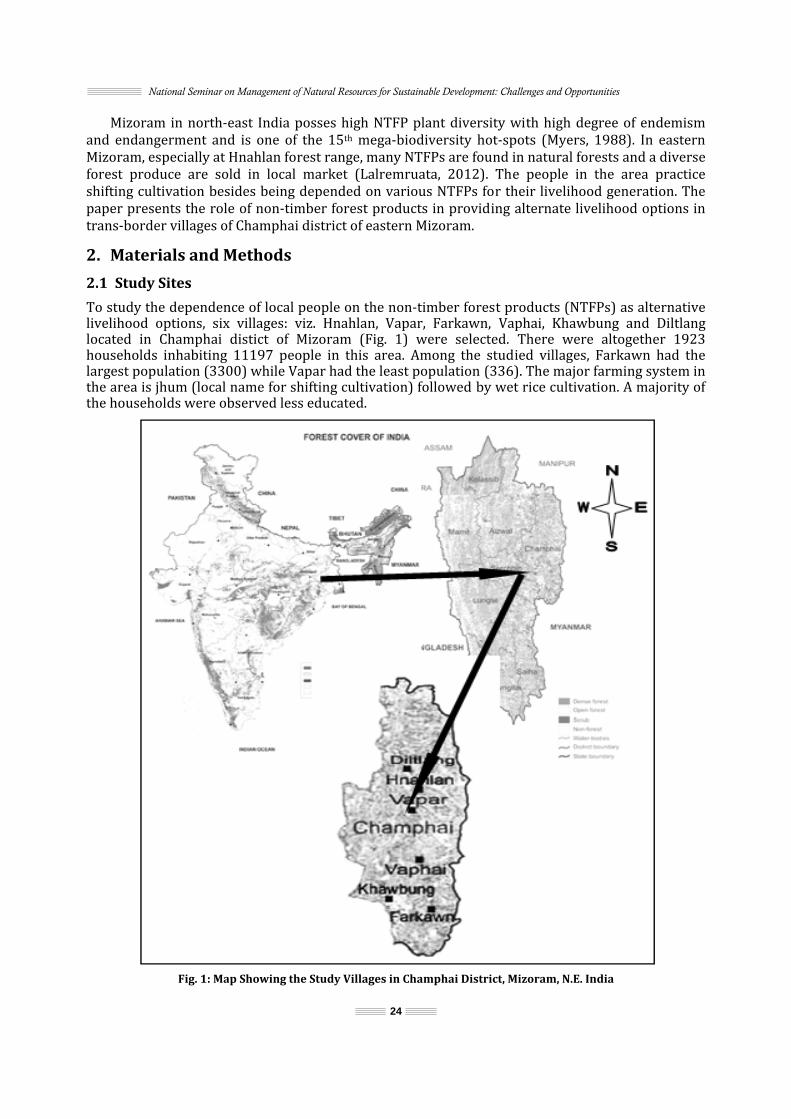
National Seminar on Management of Natural Resources for Sustainable Development: Challenges and Opportunities
24
Mizoram in north-east India posses high NTFP plant diversity with high degree of endemism and endangerment and is one of the 15th mega-biodiversity hot-spots (Myers, 1988). In eastern Mizoram, especially at Hnahlan forest range, many NTFPs are found in natural forests and a diverse forest produce are sold in local market (Lalremruata, 2012). The people in the area practice shifting cultivation besides being depended on various NTFPs for their livelihood generation. The paper presents the role of non-timber forest products in providing alternate livelihood options in trans-border villages of Champhai district of eastern Mizoram. 2. Materials and Methods
2.1 Study Sites To study the dependence of local people on the non-timber forest products (NTFPs) as alternative livelihood options, six villages: viz. Hnahlan, Vapar, Farkawn, Vaphai, Khawbung and Diltlang located in Champhai distict of Mizoram (Fig. 1) were selected. There were altogether 1923 households inhabiting 11197 people in this area. Among the studied villages, Farkawn had the largest population (3300) while Vapar had the least population (336). The major farming system in the area is jhum (local name for shifting cultivation) followed by wet rice cultivation. A majority of the households were observed less educated.
Fig. 1: Map Showing the Study Villages in Champhai District, Mizoram, N.E. India

Non-Timber Forest Products as Alternative Livelihood Options in Transboarder Villages of Champhai District of Eastern Mizoram
25
2.2 Socio-Economic Profile and Use of NTFP at Household Level For this study, extensive field surveys were made in all the study sites. Detailed household surveys using a semi-structured questionnaire mostly emphasized on the used pattern of NTFPs. To estimate the extraction and utilization of NTFPs, 10% households in each village were sampled. In each village, the people were asked to develop their own methods of stratifying the population based on income, family size, land-holding to capture the dependence of NTFP. From each stratum, sample households were drawn on random basis and the detailed information pertaining to socio-economic conditions were collected through personal interviews with the headmen and other villagers, questionnaire and small group discussion during 2005–2007 (Sahoo et al., 2010). Both men and women were included in the interviews so as to get a realistic picture and to avoid any gender biasness in the data. Participatory Rural Appraisal technique (Pretty et al., 1995) was also used for enlisting major NTFPs available, their household use and sell and income generation and means of sustaining livelihood (Godoy et al., 1993, Malhotra et al., 1993). The value of the NTFP was determined from the local market price of the item. 3. Results and Discussion A large number of households were found collecting different types of non-timber forest products (Table 1). More than 400 households in Hnalhan, Farkawn and Khawbung and relatively much smaller number of households in Diltlang and Vapar were found engaged in NTFP collections. The number of households collecting different types of NTFPs also varied widely. Among the socio-economic strata, the landless group was found more involved in the collection of different NTFPs than the small and large landholders. A higher number of households were found engaged in collecting fuelwood, bamboo shoots and fodder irrespective of village while smaller number of households collected mushrooms, fruits, tubers and edible leaves. The NTFP species belonged to a diverse plant habits, families, genera and species (Fig. 2) and there were some variations with respect to availability of different groups of plants/ families in the villages. Among the different NTFPs, medicinal plants alone were drawn from 85 families with 148 genera while fodder plants were from 8 families with 14 genera, fuel-wood from 18 plants with 18 genera and fruit plants and food plants from 43 families with 61 genera. The results obtained from the study suggest that Mizoram is very rich in NTFPs diversity covering broadly medicinal plants, wild fruit plants, wild edible plants, fodder plants, fuel-wood species, ornamental plants, bamboo, cane and palm species. However, in the present study, the dependence of medicinal plants to the household was not considered. A larger proportion of the gathered NTFPs were consumed by the collectors at household levels (Table 2). The incomes generated from various NTFPs are given in Table 3. The data revealed that even after household consumption, the sale of surplus NTFPs could provide handsome income to the households. A wide range of variation on consumption of different NTFPs have been observed; fuelwood, thatch grass, broom sticks were found sold in relatively higher proportion, compared to edible leaves, bamboo shoots and wild edible vegetables. Almost all the people/ household participated in collection of one or more forms of NTFPs. For example, the entire household required broomstick for domestic use which were found in the entire household. Likewise, bamboo shoot is extensively consumed by almost all the household during its season to supplement household agricultural requirements. From the surveys it is found out that local people dependence on NTFPs is very less as compared to that of their dependence on agricultural products. This may be because of their farming system i.e., shifting cultivation wherein vast areas of forests were destructed from where these NTFPs are collected. On an average, the total contribution of NTFPs to annual household income was maximum (23% of the total income) in Hnalhan and minimum in Diltlang (21% of the total income). According to Edwards (1996), in some rural areas, the cash obtained from the harvest of NTFPs is the only income obtained from forest land but may still contribute more than 50% of the annual average household income. Many
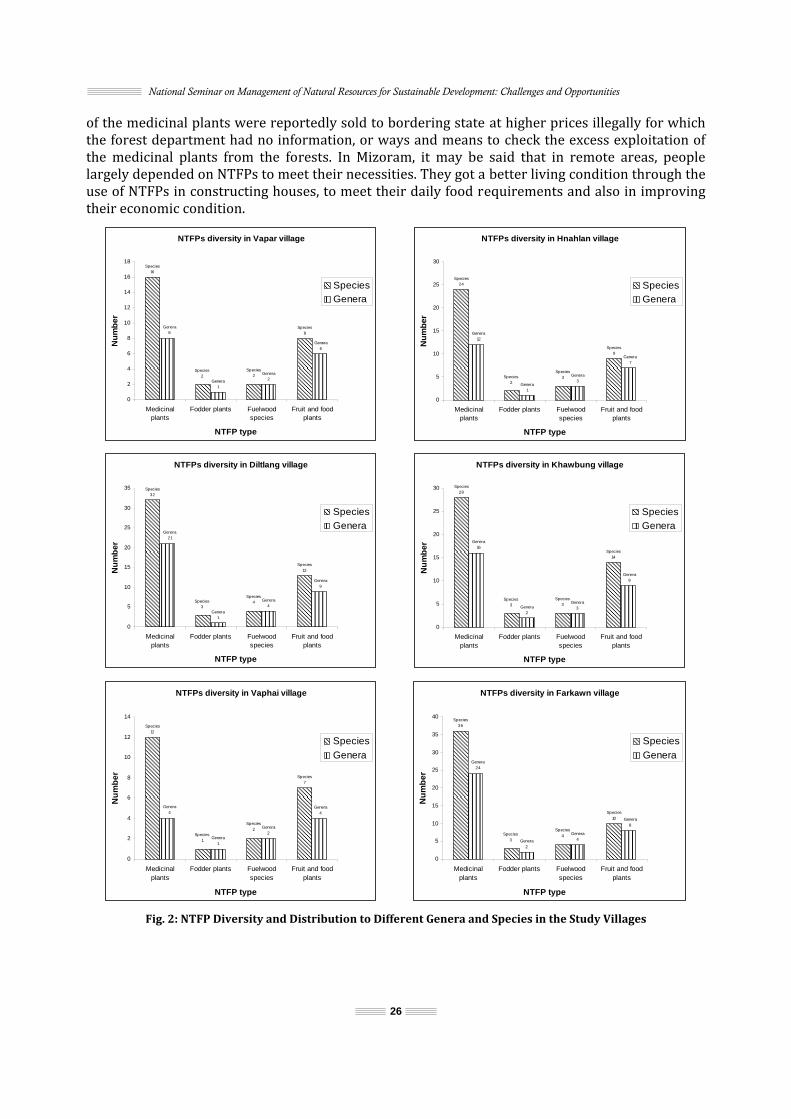
National Seminar on Management of Natural Resources for Sustainable Development: Challenges and Opportunities
26
of the medicinal plants were reportedly sold to bordering state at higher prices illegally for which the forest department had no information, or ways and means to check the excess exploitation of the medicinal plants from the forests. In Mizoram, it may be said that in remote areas, people largely depended on NTFPs to meet their necessities. They got a better living condition through the use of NTFPs in constructing houses, to meet their daily food requirements and also in improving their economic condition.
Fig. 2: NTFP Diversity and Distribution to Different Genera and Species in the Study Villages
NTFPs diversity in Vapar village
Species16
Species8
Genera1
Genera2
Species2
Species2
Genera6
Genera8
0
2
4
6
8
10
12
14
16
18
Medicinalplants
Fodder plants Fuelwoodspecies
Fruit and foodplants
NTFP type
Num
ber
SpeciesGenera
NTFPs diversity in Hnahlan village
Species24
Species9
Genera1
Genera3
Species2
Species3
Genera7
Genera12
0
5
10
15
20
25
30
Medicinalplants
Fodder plants Fuelwoodspecies
Fruit and foodplants
NTFP typeN
umbe
r
SpeciesGenera
NTFPs diversity in Diltlang village
Species32
Species13
Genera1
Genera4
Species3
Species4
Genera9
Genera21
0
5
10
15
20
25
30
35
Medicinalplants
Fodder plants Fuelwoodspecies
Fruit and foodplants
NTFP type
Num
ber
SpeciesGenera
NTFPs diversity in Khawbung village
Species28
Species14
Genera2
Genera3
Species3
Species3
Genera9
Genera16
0
5
10
15
20
25
30
Medicinalplants
Fodder plants Fuelwoodspecies
Fruit and foodplants
NTFP type
Num
ber
SpeciesGenera
NTFPs diversity in Vaphai village
Species12
Species7
Genera1
Genera2Species
1
Species2
Genera4
Genera4
0
2
4
6
8
10
12
14
Medicinalplants
Fodder plants Fuelwoodspecies
Fruit and foodplants
NTFP type
Num
ber
SpeciesGenera
NTFPs diversity in Farkawn village
Species36
Species10
Genera2
Genera4
Species3
Species4
Genera8
Genera24
0
5
10
15
20
25
30
35
40
Medicinalplants
Fodder plants Fuelwoodspecies
Fruit and foodplants
NTFP type
Num
ber
SpeciesGenera

Non-Timber Forest Products as Alternative Livelihood Options in Transboarder Villages of Champhai District of Eastern Mizoram
27
As was obvious, each household utilized various NTFPs for livelihood (Table 3) which clearly indicates that NTFPs play an important role in social domain of villagers. The gathering and selling of NTFPs, nevertheless, is a source of income for local communities. These products support village-level artistry and craft activity and provide raw materials to support some small scale processing enterprises such as grass, bamboo and cane furniture, fruit plants in the state of Mizoram. Among NTFPs, fuelwood (85%) was directly consumed by the collectors while only 15% of total fuelwood collected was made available in the market; 92.67% of fodder was utilized by the primary collector to feed their livestock while only 7.33% of total extracted was sold out. Similarly, 81.17% of total edible leaves collected from the forest were consumed by the collectors while about 18.83% were sold out in the market; 85.17% of fruits/tubers were consumed while 14.83 were available in the market; 13.33 % of bamboo shoot was available in the market while the rest 86.67 was consumed directly by the primary collector; 95.67% of total broomsticks collected from the forest were utilized by the collector while only 4.33% out of the total broomstick collected were available in the market; 94% of total mushroom collected was consumed while rest 6% was sold out in the market. Again, only 6% of the thatch grass collected from the forest was available in the market and the rest 96% was utilized by the collector for different purposes, like roofing etc. Our results suggest that NTFP species have high potential for income generation in the rural areas, especially, around forest fringe villages and it is therefore essential to promote sustainable management of NTFPs. In this direction, major reforms in the policy and institutional setups in the favour of management authorities should be carried out (Anon, 2006). Necessary support and facilitation by the government and non-government agencies to reach the NTFP collectors and adequate provisions were required to be made as per the Forestdweller Acts (2006). Introduction of various non-timber forest product species under joint forest management (JFM) schemes with active participation of local people should also be promoted for sustainable utilization of these resources. Our study also supports the idea that the quality of life can be secured through the promotion of NTFPs as an additional resource for safety net, especially, of the rural poor. Nevertheless, mass production of NTFPs and diversification could be the best option for increasing standard of living in these areas as also suggested by Wiersum et al. (2005) elsewhere. Table 1: Number of Households Gathering NTFPs in Different Landholding Categories in the
Surveyed Villages in Champhai District Forest, Mizoram, N.E. India
NTFPs Landholding Surveyed VillagesHNA VAP FAR VAPH KHB DIL TotalFuelwood Large (>3 ha) - - 3 2 1 - 6Small (<3 ha) 60 14 47 38 90 7 256Landless 400 42 400 300 329 60 1531Total 460 56 450 340 420 67 1793Fodder Large (>3 ha) - - 3 - - - 3Small (<3 ha) 80 5 67 10 30 7 199Landless 300 35 350 290 270 43 1288Total 380 40 420 300 300 50 1490Bamboo shoot Large (>3 ha) - - - - - - Small (<3 ha) 30 6 20 30 5 5 96Landless 220 34 280 170 75 50 829Total 250 40 300 200 80 55 925Mushroom Large (>3 ha) - - - - - - Small (<3 ha) 20 - 20 4 5 - 49Landless 130 20 30 26 35 20 261Total 150 20 50 30 40 20 310Fruit/ tubers Large (>3 ha) - - - - - - Small (<3 ha) 5 4 20 15 20 5 69Landless 45 16 40 55 180 10 346Total 20 60 70 200 15 365
Table 1 (Contd.)…
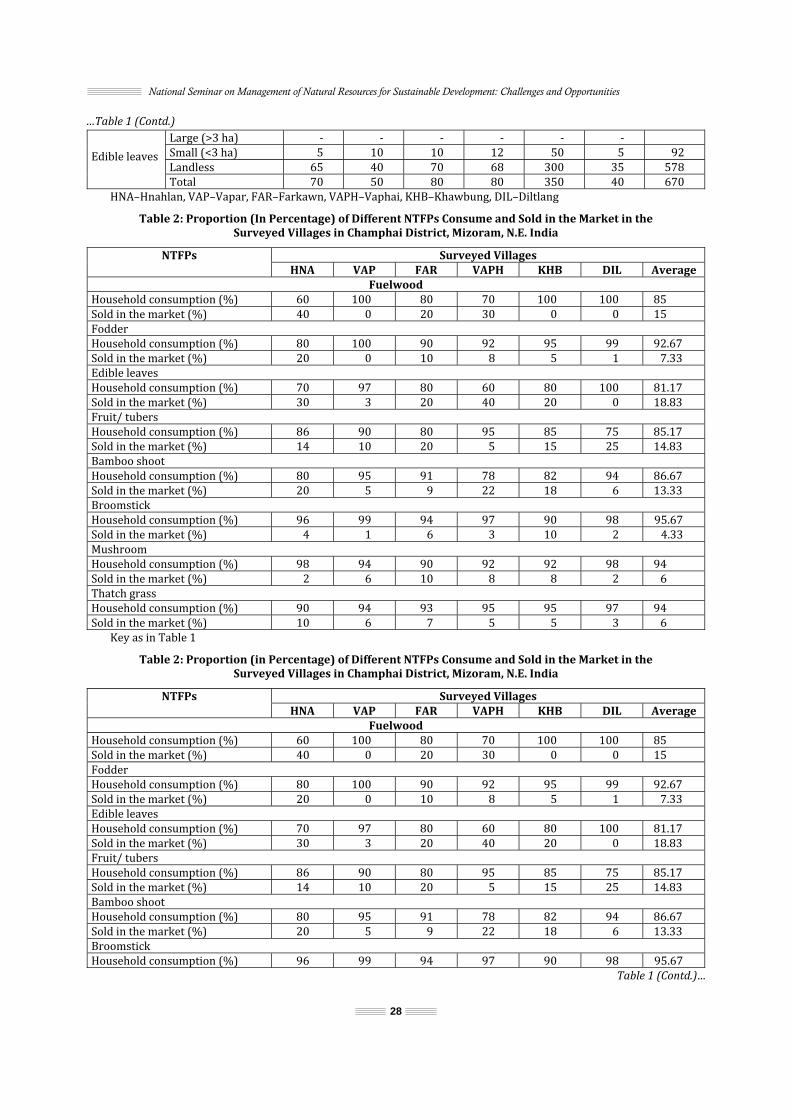
National Seminar on Management of Natural Resources for Sustainable Development: Challenges and Opportunities
28
…Table 1 (Contd.)
Edible leaves Large (>3 ha) - - - - - - Small (<3 ha) 5 10 10 12 50 5 92Landless 65 40 70 68 300 35 578Total 70 50 80 80 350 40 670HNA–Hnahlan, VAP–Vapar, FAR–Farkawn, VAPH–Vaphai, KHB–Khawbung, DIL–Diltlang Table 2: Proportion (In Percentage) of Different NTFPs Consume and Sold in the Market in the
Surveyed Villages in Champhai District, Mizoram, N.E. India
NTFPs Surveyed VillagesHNA VAP FAR VAPH KHB DIL Average
FuelwoodHousehold consumption (%) 60 100 80 70 100 100 85Sold in the market (%) 40 0 20 30 0 0 15Fodder Household consumption (%) 80 100 90 92 95 99 92.67Sold in the market (%) 20 0 10 8 5 1 7.33Edible leaves Household consumption (%) 70 97 80 60 80 100 81.17Sold in the market (%) 30 3 20 40 20 0 18.83Fruit/ tubers Household consumption (%) 86 90 80 95 85 75 85.17Sold in the market (%) 14 10 20 5 15 25 14.83Bamboo shoot Household consumption (%) 80 95 91 78 82 94 86.67Sold in the market (%) 20 5 9 22 18 6 13.33Broomstick Household consumption (%) 96 99 94 97 90 98 95.67Sold in the market (%) 4 1 6 3 10 2 4.33Mushroom Household consumption (%) 98 94 90 92 92 98 94Sold in the market (%) 2 6 10 8 8 2 6Thatch grass Household consumption (%) 90 94 93 95 95 97 94Sold in the market (%) 10 6 7 5 5 3 6Key as in Table 1 Table 2: Proportion (in Percentage) of Different NTFPs Consume and Sold in the Market in the
Surveyed Villages in Champhai District, Mizoram, N.E. India
NTFPs Surveyed VillagesHNA VAP FAR VAPH KHB DIL Average
FuelwoodHousehold consumption (%) 60 100 80 70 100 100 85Sold in the market (%) 40 0 20 30 0 0 15Fodder Household consumption (%) 80 100 90 92 95 99 92.67Sold in the market (%) 20 0 10 8 5 1 7.33Edible leaves Household consumption (%) 70 97 80 60 80 100 81.17Sold in the market (%) 30 3 20 40 20 0 18.83Fruit/ tubers Household consumption (%) 86 90 80 95 85 75 85.17Sold in the market (%) 14 10 20 5 15 25 14.83Bamboo shoot Household consumption (%) 80 95 91 78 82 94 86.67Sold in the market (%) 20 5 9 22 18 6 13.33Broomstick Household consumption (%) 96 99 94 97 90 98 95.67Table 1 (Contd.)…

Non-Timber Forest Products as Alternative Livelihood Options in Transboarder Villages of Champhai District of Eastern Mizoram
29
…Table 1 (Contd.) Sold in the market (%) 4 1 6 3 10 2 4.33Mushroom Household consumption (%) 98 94 90 92 92 98 94Sold in the market (%) 2 6 10 8 8 2 6Thatch grass Household consumption (%) 90 94 93 95 95 97 94Sold in the market (%) 10 6 7 5 5 3 6Key as in Table 1 Table 3: Income Generated through NTFP Collection from Champhai District Forest by
Different Villages in Mizoram, N.E. India
NTFP Surveyed VillagesHNA VAP FAR VAPH KHB DIL TotalFuelwood % of household (%) 92.2 88 90.4 80 87.4 100 89.67Quantity (kg/hh/year) 1095 1460 1095 1095 1460 1460 7665Income (Rs./hh/year) 2190 2920 2190 2190 2920 2920 15330Fodder % of household (%) 85 83 52 78 75 45 69.67Quantity (kg/hh/year) 1500 1200 1000 1600 850 1420 7570Income (Rs./hh/year) 1500 1200 1000 1600 850 1420 7570Thatch grass % of household (%) 12.2. 28.6 6.02 8.01 24.5 83.3 25.07Quantity (kg/hh/year) 450 300 280 580 420 540 2570Income (Rs./hh/year) 1125 750 700 1450 1050 1350 6425Bamboo shoot % of household (%) 50 50 49.7 50 50.3 50 50Quantity (kg/hh/year) 60 60 50 100 80 100 450Income (Rs./hh/year) 600 600 500 1000 800 1000 4500Broomstick % of household (%) 100 100 100 100 100 100 100Quantity (kg/hh/year) 15 10 8 20 10 20 83Income (Rs./hh/year) 900 600 480 1200 600 1200 4980Edible leaves % of household (%) 49.2 52 60.5 63.1 48 70 57.13Quantity (kg/hh/year) 130 80 40 140 100 120 610Income (Rs./hh/year) 1300 800 400 1400 1000 1200 6100Mushroom % of household (%) 40 25 40 60 20 50 39.17Quantity (kg/hh/year) 10 5 10 10 10 5 50Income (Rs./hh/year) 2500 1250 2500 2500 2500 1250 12500Fruit/ tubers % of household (%) 90 67.8 51.2 60.8 49.6 50 61.57Quantity (kg/hh/year) 15 25 20 25 20 10 115Income (Rs./hh/year) 750 1250 1000 1250 1000 500 5750Key as in Table 1 Fuelwood bundle containing 10 kg fresh wt @ Rs. 20/-or 1 kg @ Rs. 2/- Fodder (miscellaneous) species bundle containing 20 kg @ Rs. 20/-or 1 kg @ Rs 1/- Thatch grass bundle containing 20 kg @ Rs. 50/-or 1 kg @ Rs. 2.5/- Bamboo shoot (10 pieces bundle = 1kg) @ Rs. 10/-or 1 kg @ Rs. 10/- Broomstick = 150gm @ Rs. 10 per piece or 1 kg @ Rs. 60/- Edible leaves (Miscellaneous species) 2 bundles = 1kg @ Rs. 10/-or 1 kg @ Rs. 10/- Mushroom (1 bundle wrap in banana leaves = 200gm) @ Rs. 50/-or 1 kg @ Rs. 250/- Fruit/ tubers (1 tin = 200gm) @ Rs. 10/-or 1 kg @ Rs. 50/-
Acknowledgement This study was financially supported by GB Pant Institute of Himalayan Environment and Development, Almora (Grant No. GBPI/IERP/03-04/40/855). References Anonymous (2006), The Scheduled Tribes and other Traditional Forest Dwellers (Recognition of Forest Rights) Act, 2006. Ministry of Law and Justice, New Delhi, pp. 1–14. Arnold, J.E.M. (1995), “Socio-economic Benefits and Issues in Non-wood Forest Products Use”, In: Report of the International Expert Consultation on Non-wood Forest Products, FAO Rome, pp. 89–123.

National Seminar on Management of Natural Resources for Sustainable Development: Challenges and Opportunities
30
Balick, M. and Mendelsohn, R. (1992), “The Economic Value of Traditional Medicine from Tropical Rain Forests”, Conservation Biology, Vol. 6, pp. 128–139. Belcher, B.M. (2003), “What isn’t an NTFP?”, Int. Forestry Rev., Vol. 5(2), pp. 161–168. De Beer, J.H. and McDermott, M.J. (1996), The Economic Value of Non-timber Forest Products in South East Asia, 2nd Rev Edn. The Netherlands Committee for IUCN, Amsterdam. Edwards, DM. (1996), “Non Timber Forest Products and Community Forestry: Are they Compatible?”, Banko Jankari, Vol. 6(1), pp. 3–8. Falconer, J. and Arnold, J.E.M. (1988), Forest Trees and Household Security, Social Forestry Network, Paper 7a, Overseas Developmental Institute, London. Food and Agricultural Organization of the United Nations FAO (1990), The Major Significance of Minor Forest Product. The Local Use and Value of Forest in the West. African Humid Forest Zone. Community Forestry Note 6 Rome, Italy. Food and Agricultural Organization of the United Nations FAO (1992), Forest, Trees and Food Rome, Forest History Society. Durham NCP 57, pp. 2–4. Godoy, R., Lubowski, R. and Markandya A. (1993), “A Method for Economic Valuation of Non-timber Tropical Forest Products”, Economic Botany, Vol. 47(3), pp. 220–233. Godoy, R.A. and Bawa, K.S. (1993), “The Economic Value and Sustainable Harvest of Plants and Animals from the Tropical Forest: Assumptions, Hypotheses and Methods”, Eco Bot., Vol. 47(3), pp. 215–219. Gregersen, H.M. Arnold, J.E.M, Lindgren, A.L. and Contreras–Hernosilla, “Food and Agricultural Organization of the United Nation FAO (1995)”, Valueing Forest: Context, Issues and Guidelines, by FAO Forestry Paper No. 127, Rome, Italy. Gunatilake, H.M., Senaratne, D.M.A.H. and Abeygunawardena, P. (1993), “Role of Non-timber Forest Products in the Economy of Peripheral Communities of Knuckles National Wilderness Area of Sri Lanka: A Farming Systems Approach”, Economy Botany, Vol. 47(3), pp. 275–281. Lalremruata, J. (2012), Inventory on Non-timber Forest Products and Livelihood Strategies by the Rural Poor in Northern Mizoram, India. Ph.D Thesis. Mizoram University, Aizawl (Unpublished). Lalremruata, Sahoo U.K. and Lalramnghinglova (2007), “Inventory on Non-timber forest products of Mizoram in North-East India”, Journal of Non-Timber Forest Products, Vol. 14, pp. 173–180. Lintu, L. (1995), “Trade and Marketing of Non-wood Forest Products”, Paper presented in Expert Consultation ON NWFPs, 17-27 January, 1995, FAO, Indonesia. Malhotra, K.C, Deb, D., Dutta, M., Vasulu, T., Yadav, G. and Adhikari, M. (1993), “The Role of Non-timber Forest Products in Village Economics of South-West Bengal”, Rural Development Forestry Network Paper, 15d (ODI Regent’s College, Regent’s Park, London), pp. 1–8. Miah, M.D. and Chowdhury, M.S.H. (2003), “Indigenous Healthcare Practice through Medicinal Plants from Forests by the Mro Tribe in Bandarban Region, Bangladesh”, African J. Indigenous Knowledge System., Vol. 2(2), pp. 61−73. Myers, N. (1988). “Threatened biotas:’hot spots’ in tropical forests.” The Environmentalists. 8: 187-208 Panayotou, T. and Ashton, P. (1993), Not by Timber Alone: Economics and Ecology for SustainingTropical Forests, Island Press, Washington DC. Perez, M.R. and J.E.M. Arnold (Eds.) (1995), Current Issues in Non Timber Forest Products Research. CIFOR, Indonesia, p. 264. Pretty, J.N., Guijt, I., Scoones, I. and Thompson, J. (1995), A Trainers Guide to Participatory Learning and Action, International Institute for Environment and Development (IIED) Series, London, p. 267. Ros-Tonen, M.A.F. and Wiersum, F.K. (2003), “The Importance of Non-Timber Forest Products for Forest Based Rural Livelihoods: An Evolving Research Agenda”, International Conference on Livelihoods and Biodiversity, Amsterdam Research Institute for Global Issues and Development Studies, Bonn. Sahoo, U.K., Jeeceelee, L., Lalremruati, J.H., Lalremruata, J., Lalliankhuma, C. and Lalramnghinglova, H. (2010), “Assessing the Role of NTFPs in the Livelihood of Communities in and Around Dampa Tiger Reserve in North-East India”, The Bioscan Special, Vol. 1 (II), pp. 779–790. Shiva, M.P. and Mathur, R.B. (1997), Standard NTFP Classification and Documentation Manual, pp. 9–10. Tiwari, B.K. (2000), “Non-Timber Forest Product of North East India. In: Jha et al. (eds)”, Agroforestry and Forest Products, Proc. International Workshop, NEHU, Mizoram Campus, Aizawl, 28-30th November 2000. pp. 359–372. Wiersum K.F, Mirjam, A.F. and Ros-Tonen, R. (2005), The Role of Forests in Poverty Alleviation: Dealing with Multiple Millennium Development Goals. North-South Centre, The Netherlands.

31
5 Scenario of Solid Waste Generation and its Management in Kamarhati Municipality of Kolkata, West Bengal
Md. Mustaquim and Md. Ismail Department of Geography,
Aliah University, Kolkata E-mail: [email protected], [email protected]
1. Introduction Civilization began journey and development of settlements were found around river banks. Everything was manageable during those times as people lived in harmony with nature. Industrialization process and rapid development changed everything. At the end of the 19th century, the Industrial Revolution saw the rise of the world of consumers and dense population packets developed at and around industrial areas. Government and local administration have beentrying their level best to provide all the basic amenities to the population. While doing so, one difficult challenge before administration is to manage waste generated by this large population. Solid waste generation is a continually growing problem at global, regional and local levels. The growth of the world’s population, increasing urbanization, rising standards of living, and rapid developments in technology have all contributed to an increase in both, the amount and the variety of solid wastes, generated by industrial, domestic and other activities (UNEP, 1991). The problems of dealing with greater volumes of, often more dangerous, waste materials are particularly acute in developing countries where these changes have not been met by improvements in waste management technologies (Wilson & Balkau, 1990). Even domestic solid waste has become a health hazard in many developing countries as a result of careless handling and a failure to organize appropriate solid waste collection schemes. This issue has now received the attention by international and national policy-making bodies and citizens. At the international level, the awareness regarding waste began in 1992 with the Rio Conference, here waste was made one of the priorities ofAgenda 21*. Here specific attention was given to the environmentally sound management of solid wastes. The Johannesburg World Summit on Sustainable Development in 2002 focussed on initiatives to accelerate the shift to sustainable consumption and production, and the reduction of resource degradation, pollution and waste. The priority was given to waste minimization, recycle, and reuse followed by the safe disposal of waste to minimize pollution. The government of India started encouraging proper management of solid waste as early as during1960s by giving loans for setting composting plants for municipal solid waste (MSW). Over the years, the government of India has taken many initiatives and implemented new technologies and methods. With the rapid urbanization, the problem of the municipal solid waste management (MSWM) problem has compounded and India is awakening to the magnitude of the problem. Due to increased public awareness of MSWM, a public litigation was filed and resulted in the Municipal Solid Waste (Management and Handling) Rules, 2000.
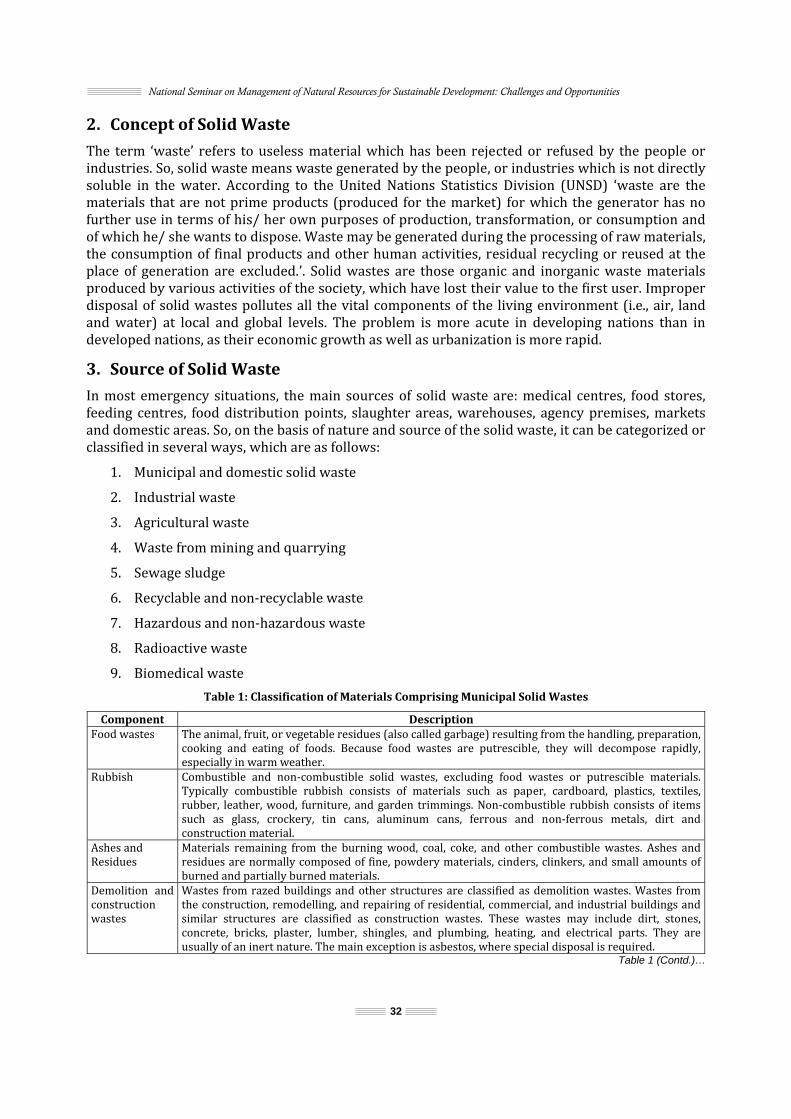
National Seminar on Management of Natural Resources for Sustainable Development: Challenges and Opportunities
32
2. Concept of Solid Waste The term ‘waste’ refers to useless material which has been rejected or refused by the people or industries. So, solid waste means waste generated by the people, or industries which is not directly soluble in the water. According to the United Nations Statistics Division (UNSD) ‘waste are the materials that are not prime products (produced for the market) for which the generator has no further use in terms of his/ her own purposes of production, transformation, or consumption and of which he/ she wants to dispose. Waste may be generated during the processing of raw materials, the consumption of final products and other human activities, residual recycling or reused at the place of generation are excluded.’. Solid wastes are those organic and inorganic waste materials produced by various activities of the society, which have lost their value to the first user. Improper disposal of solid wastes pollutes all the vital components of the living environment (i.e., air, land and water) at local and global levels. The problem is more acute in developing nations than in developed nations, as their economic growth as well as urbanization is more rapid. 3. Source of Solid Waste In most emergency situations, the main sources of solid waste are: medical centres, food stores, feeding centres, food distribution points, slaughter areas, warehouses, agency premises, markets and domestic areas. So, on the basis of nature and source of the solid waste, it can be categorized or classified in several ways, which are as follows: 1. Municipal and domestic solid waste 2. Industrial waste 3. Agricultural waste 4. Waste from mining and quarrying 5. Sewage sludge 6. Recyclable and non-recyclable waste 7. Hazardous and non-hazardous waste 8. Radioactive waste 9. Biomedical waste
Table 1: Classification of Materials Comprising Municipal Solid Wastes
Component DescriptionFood wastes The animal, fruit, or vegetable residues (also called garbage) resulting from the handling, preparation, cooking and eating of foods. Because food wastes are putrescible, they will decompose rapidly, especially in warm weather. Rubbish Combustible and non-combustible solid wastes, excluding food wastes or putrescible materials. Typically combustible rubbish consists of materials such as paper, cardboard, plastics, textiles, rubber, leather, wood, furniture, and garden trimmings. Non-combustible rubbish consists of items such as glass, crockery, tin cans, aluminum cans, ferrous and non-ferrous metals, dirt and construction material. Ashes and Residues Materials remaining from the burning wood, coal, coke, and other combustible wastes. Ashes and residues are normally composed of fine, powdery materials, cinders, clinkers, and small amounts of burned and partially burned materials. Demolition and construction wastes Wastes from razed buildings and other structures are classified as demolition wastes. Wastes from the construction, remodelling, and repairing of residential, commercial, and industrial buildings and similar structures are classified as construction wastes. These wastes may include dirt, stones, concrete, bricks, plaster, lumber, shingles, and plumbing, heating, and electrical parts. They are usually of an inert nature. The main exception is asbestos, where special disposal is required. Table 1 (Contd.)…

Scenario of Solid Waste Generation and its Management in Kamarhati Municipality of Kolkata, West Bengal
33
…Table 1 (Contd.) Special wastes Wastes such as street sweepings, roadside litter, catch-basin debris, dead animals, trash like abandoned vehicles, electrical appliances are classifies as special wastes. Treatment plant wastes and dredged soil The solid and semisolid wastes from water, sewage and industrial waste water treatment facilities are included in this classification. Sewage sludge isa slurry of fine organic-rich particles with a highly variable chemical composition depending on the sources of the effluent and the type and efficiency of the treatment processes. Sewage sludges tend to concentrate heavy metals and water-soluble synthetic organic compounds, but they may also contain greases, oils and bacteria. Dredged materials are excavated from river estuaries, harbours and other waterways to aid navigation. It is estimated that 10% of dredgedmaterials is contaminated by oil, heavy. metals, nutrients and organochlorine compounds.
Source: Adapted from Peavy, Rowe and Tchobanoglous, 1985. 3.1 Municipal Solid Waste Municipal solid waste applies to those wastes generated by the households and to wastes of similar character derived from shops, offices, and other commercial units. Municipal waste productions related to the level of industrialization, urbanization, income of the citizens, and food habit of the people. Municipal solid waste contains paper, plastic, tetra packs, etc. Although municipal waste may contain some hazardous waste, such as hospital waste, paints, solvents and batteries. Careless handling and disposal of hospital waste thus pose a threat to human health in many developing countries of the world. In recent times, packaging materials are becoming an increasingly important component of municipal waste in developed countries and developing countries of the globe. 3.2 Industrials and Mining Waste Different hazardous and non-hazardous waste comes from the industries, like rubbish, packaging materials, organic waste, acids, alkalis, pesticides, polish, paints, stain removers, certain types of oil solvents, plastic, rubber etc. Mining waste arises as by-products of the extraction process and may include soiling, rocking and many contaminated with small quantities of such materials as metal and coal. 3.3 Agricultural Waste Agricultural wastes, which may include horticultural and forestry wastes, comprise of crop residues, animal manure, diseased carcasses, unwanted agrochemicals and 'empty' containers. Their composition will depend on the system of agriculture. Estimates of agricultural waste arising are rare, but they are generally thought of as contributing to a significant proportion of the total waste matter in the developed world. Since 1960, as a result of huge rises in productivity, there have been corresponding increases in the volumes of crop residues and animal manure requiring disposal. There is likely to be a significant increase in agricultural wastes globally, if developing countries continue to intensify farming systems. 3.4 Hazardous Waste Hazardous waste is those that are toxic to plants and animals, inflammable, explosive, corrosive or highly reactive chemically. Hazardous waste is generated by process of industries, mainly chemical sector, mineral and metal processing industries and engineering industries. So, if proper steps have not been taken to initiate and stored permanently, it may prove to be a threat to surface and ground-water as well as soil, plants, and animals habitats in the industrial regions. Hazardous waste arises not only as the by-products of industrial processes, but also when consumers discard empty chemical packages and other items at the end of their useful life. Pesticides, asbestos, polish, paints, stain remover etc are the hazardous waste. Non-hazardous wastes are substance like metal and glass pieces, plastic, rubber.

National Seminar on Management of Natural Resources for Sustainable Development: Challenges and Opportunities
34
3.5 Radioactive Waste This type of waste arises mostly from nuclear power generation. Smaller quantities are derived from military sources and variety of uses in medical, industrial and university establishment. Spent fuel from nuclear power plants, together with liquid and solid residues from reprocessing of spent fuels, are high level radioactive waste laboratories debris, biological materials, building materials and uranium mine fallings are low level radioactive waste. Legally, no country can dump radioactive waste in sea. These have to disposed off, or rendered harmless through established procedures defined under Vienna Convention (1963) to manage these types of problem. 3.6 Biomedical Waste The term ‘biomedical waste’ refers to those types of wastes which are derived from health care facilities like hospitals, nursing homes, and medical laboratories. Anatomical waste, pathological waste, infectious waste etc. are the examples of biomedical waste. Biomedical waste is also classified as human anatomical waste, animal waste, microbiology and biotechnology waste, waste sharps, discard medical and cytotoxic drugs, solid waste from disposable items other than sharp, incineration ash, chemical waste etc. 4. Problems of Study Area Solid waste disposal system of Kamarhati Municipality involves primary collection, roadside storage, transportation and dumping of solid waste and garbage. There are different problems like unauthorized roadside dispose etc. So, waste moves freely along the roads, drains. Another problem is less frequency of collection of wastes from the vats. Passenger walking on the roads passed the vats with closing their nose and eyes. These are not the end, some shopkeepers push solid waste in the drain after breaking the drain which blocks water movement and ultimately water-logging takes place in the rainy season in general and all the seasons in particular. In the area, collection of wastes from vats is not proper and regularly. Garbage collecting staff do their works according to their own desire. So, key features of the problems are as follows: (i) Unauthorized road side storage of waste, (ii) Less frequency of collection of waste from the vats and open spaces, (iii) Pushing the waste in the drain, mainly in the market areas, (iv) Water-logging due to waste congestion in the drain, (v) Workers are not sincere in their duty, (vi) Degradation of air quality, (vii) Increase chronic diseases, (viii) Increase mosquito problem, and (ix) Destroy aesthetic view of the city. 5. Objectives of the Study The objectives of the present research study are as follows: 1. To analyze the amount of generation of solid waste by the sample respondents. 2. To find out the impacts of solid waste on human health and environment in the study area. 3. To trace out the level of existing facilities available to overcome the problems in the study unit. 6. Database and Methodology The present study is based on both primary and secondary sources of data. Primary data are collected through field survey with suitable questionnaire in Ward No. 20 of Kamarhati Municipality in Kolkata. Total 100 sample respondents (households) are interviewed from various parts of the selected ward. All the 100 sample respondents are categorized into five groups based on their income. All the data are converted into percentages, ratios and other relative numbers, and depicted through bar diagrams to show the overall situation of the area.

Scenario of Solid Waste Generation and its Management in Kamarhati Municipality of Kolkata, West Bengal
35
6.1 Review of Literature The study about the problems and management of solid waste is not a new thing. It has been studied for a very long time. So, many research papers and books have been published related to solid waste and its management within India and outside India. Many researchers tried to find out the main problems of solid waste and its management in different ways. But it is very difficult to review all the research works related to solid waste problem and its management. However, some important and current research works done by various scholars are reviewed here. Sarkar (2010) in his work has clearly discussed the meaning and nature of municipal waste in Indian context and he also indicates some problems and management related to solid waste. Roy and Basu (2010) analyzed the different problems related to roadside storage and dumping system with their recovery solution of solid waste in urban centres. They also noted that how less awareness of the people makes the problem more complicated in Indian nature of urban centres. Prakasam et al. (2010) studied about the amount of solid waste generation, nature of solid waste and their spatial variation in Salem city. Sultana (2005), in her research paper, presented very lucidly regarding the selection of solid waste dumping area in urban centres. She has also mentioned the characteristics of dumping ground in urban areas. Side-by-side she also highlighted the ideas regarding the use of GIS and Remote Sensing techniques which helps to prevent water and environment pollution. Developed countries have provided technical assistance in SWM to developing countries focussing SWM as a technical problem with an assumption that solid waste problem can be solved with machineries (Lardinois, et al., 1997). The ‘blind technology transfer’ of machinery from developed countries to developing countries and subsequent failure has brought attention to the need for appropriate technology (Beukering, et al., 1999) to suit the conditions in developing countries (type of waste, composition, treatment, etc.). The Government of India (GoI) has encouraged the proper management of MSW from as early as 1960s when the Ministry of Food and Agriculture gave soft loans to the local municipal authorities for MSWM. GoI also gave grants and loans to state government for setting up MSW composting facilities under the Fourth Five-Year Plan (1969–74) (Beukering, 1999). In 1974, GoI modified this scheme making it specific only for cities having a population above 30 lakhs. The Water (Prevention and Control of Pollution) Act of 1974 resulted in the creation of Central and State Pollution Control Boards (CPCB and SPCB) with the aim of prevention, abatement and control of water pollution. The Air (Control and Prevention of Pollution) Act of 1981 also empowered the CPCB and SPCB (Harashima, 2000). These Boards now authorize process plants and sanitary landfill sites. A high level committee was set up in 1975 to review the problems of urban solid waste in India. This Committee covered all aspects of waste management and based on these recommendations, between 1975 and 1980, ten mechanical compost plants were set up in the country. Out of all the plants commissioned, there is only one functional at Bangalore. A major step in the direction of managing waste happened with Government of India (GoI) setting up of the National Waste Management Council (NWMC) in 1990. This Council provided financial assistance to 22 municipalities to undertake surveys to assist them in improving the MSWM situation (Marandi, 1998). As per the recent estimates, the country produces about 100000 MT urban solid wastes daily (The Expert Committee, 2000) with typical characteristics as per the Table 1 below. The municipal waste generation in metropolitan cities varies between 0.2–0.6 kg/capita/day (Zurbrugg, 2002 and Agarwal, et al., 2005), and urban MSW generation is estimated to be approximately 0.49 kg per capita per day. This is estimated to be two or three times more than the waste generated by rural residents (Devi, et al., 2001). The figures, however, vary from city-to-city. For example, while the per capita waste generated in Delhi is 0.5 kg per day, MSW generated per capita per day is 0.35 kg in Hyderabad and 0.64 kg in Bangalore (Huysman, 1994). Studies show that in most urban areas it is the slums and areas where the poorer communities reside which are most badly served (Fritz, 1990 and Furedy, 1994).
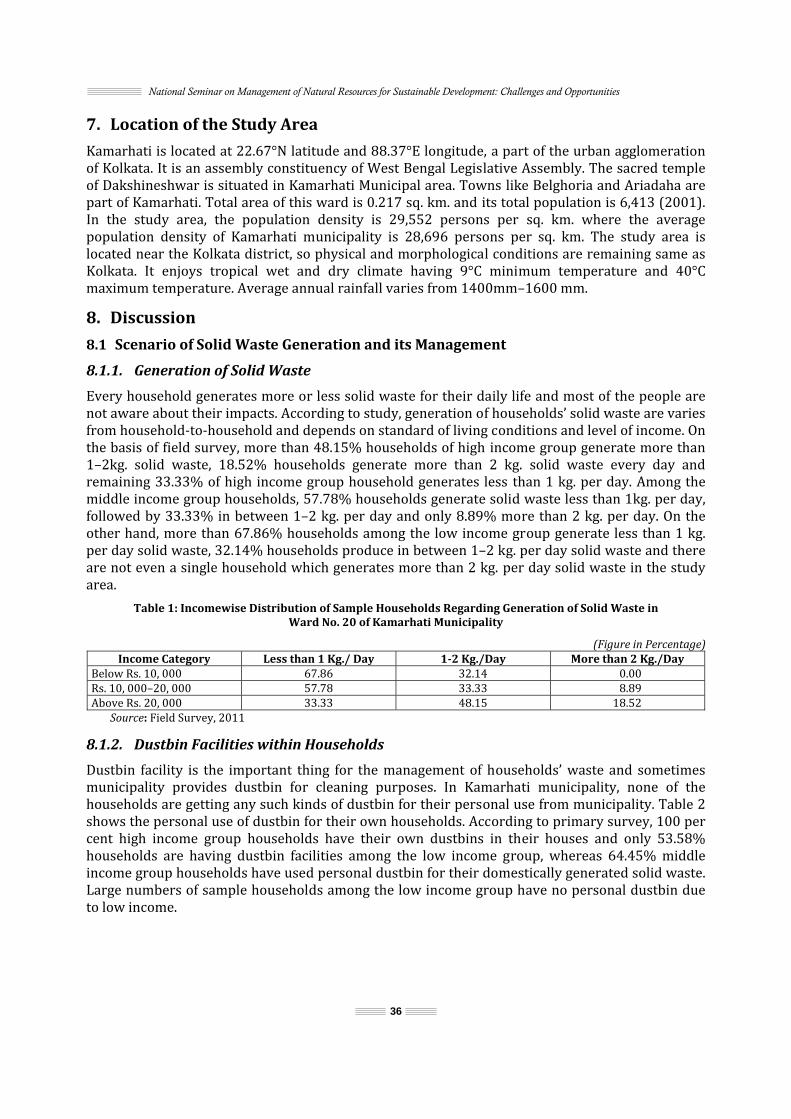
National Seminar on Management of Natural Resources for Sustainable Development: Challenges and Opportunities
36
7. Location of the Study Area Kamarhati is located at 22.67°N latitude and 88.37°E longitude, a part of the urban agglomeration of Kolkata. It is an assembly constituency of West Bengal Legislative Assembly. The sacred temple of Dakshineshwar is situated in Kamarhati Municipal area. Towns like Belghoria and Ariadaha are part of Kamarhati. Total area of this ward is 0.217 sq. km. and its total population is 6,413 (2001). In the study area, the population density is 29,552 persons per sq. km. where the average population density of Kamarhati municipality is 28,696 persons per sq. km. The study area is located near the Kolkata district, so physical and morphological conditions are remaining same as Kolkata. It enjoys tropical wet and dry climate having 9°C minimum temperature and 40°C maximum temperature. Average annual rainfall varies from 1400mm–1600 mm. 8. Discussion
8.1 Scenario of Solid Waste Generation and its Management
8.1.1. Generation of Solid Waste Every household generates more or less solid waste for their daily life and most of the people are not aware about their impacts. According to study, generation of households’ solid waste are varies from household-to-household and depends on standard of living conditions and level of income. On the basis of field survey, more than 48.15% households of high income group generate more than 1–2kg. solid waste, 18.52% households generate more than 2 kg. solid waste every day and remaining 33.33% of high income group household generates less than 1 kg. per day. Among the middle income group households, 57.78% households generate solid waste less than 1kg. per day, followed by 33.33% in between 1–2 kg. per day and only 8.89% more than 2 kg. per day. On the other hand, more than 67.86% households among the low income group generate less than 1 kg. per day solid waste, 32.14% households produce in between 1–2 kg. per day solid waste and there are not even a single household which generates more than 2 kg. per day solid waste in the study area. Table 1: Incomewise Distribution of Sample Households Regarding Generation of Solid Waste in
Ward No. 20 of Kamarhati Municipality
(Figure in Percentage) Income Category Less than 1 Kg./ Day 1-2 Kg./Day More than 2 Kg./DayBelow Rs. 10, 000 67.86 32.14 0.00 Rs. 10, 000–20, 000 57.78 33.33 8.89 Above Rs. 20, 000 33.33 48.15 18.52
Source: Field Survey, 2011 8.1.2. Dustbin Facilities within Households Dustbin facility is the important thing for the management of households’ waste and sometimes municipality provides dustbin for cleaning purposes. In Kamarhati municipality, none of the households are getting any such kinds of dustbin for their personal use from municipality. Table 2 shows the personal use of dustbin for their own households. According to primary survey, 100 per cent high income group households have their own dustbins in their houses and only 53.58% households are having dustbin facilities among the low income group, whereas 64.45% middle income group households have used personal dustbin for their domestically generated solid waste. Large numbers of sample households among the low income group have no personal dustbin due to low income.

Scenario of Solid Waste Generation and its Management in Kamarhati Municipality of Kolkata, West Bengal
37
Table 2: Distribution of Sample Households Having Dustbin Facility within the House in Ward No. 20 of Kamarhati Municipality
(Figure in Percentage) Income Category Yes (% of Household) No (% of Household)Below Rs. 10, 000 53.58 46.43 Rs. 10, 000–20, 000 64.45 35.55 Above Rs. 20, 000 100.00 0.00
Source: Field Survey, 2011 8.1.3. Use of Separate Dustbin There are mainly two types of solid wastes generated by sampling households in the study area such as biodegradable and non-degradable waste. Table 3 depicts the separate use of dustbin for biodegradable and non-degradable waste. It is very important for the better management of solid waste which leads to reduce the degradation of environment. Unfortunately, there was no household in Ward No. 20 of Kamarhati municipality using the separate dustbin for biodegradable and non-degradable waste.
Table 3: Distribution of Separate Dustbin among Sample Households Regarding Biodegradable and Non-Degradable Waste in Ward No. 20 of Kamarhati Municipality
Income Category Yes (% of Household) No (% of Household)Below Rs. 10, 000 0.00 100.00 Rs. 10, 000–20, 000 0.00 100.00 Above Rs. 20, 000 0.00 100.00 Source: Field Survey, 2011
8.1.4. Collection of Solid Waste Table 4 and Figure 4 show the number of frequency per week of waste collection by municipality workers from the households. The collection of waste varies from one part to other parts and there is also found very interesting variation among different categories of sample households. According to data, among all sample households, more than 92.86% households of low income group, 88.89% households of middle income and 88.84% of high income group reported that municipality workers collect waste from their houses in 6 days in a week whereas, remaining households get this facility 5 days in a week. Table 4: Collection of Solid Waste by Workers in a Number of Days per Week in
Ward No. 20 of Kamarhati Municipality (Figure in Percentage)
Income Category 5 Days in a Week 6 Days in a WeekBelow Rs. 10, 000 7.14 92.86 Rs. 10, 000–20, 000 11.11 88.89 Above Rs. 20, 000 11.11 88.89 Source: Field Survey, 2011
8.1.5. Collection of Waste from Vats and Roadsides Table 5 reveals the distribution of respondents among sample households regarding frequency of collection of solid waste from vats and roads by municipality workers. About 75% households of low income group said that the municipality workers collect the garbage from the vats within 2–3 days in a week and middle (75.56%) and high income group (62.96%) make the same comment respectively. Remaining percentage of sample households of all income group said that they have no idea about waste collection from the vats by municipality workers.

National Seminar on Management of Natural Resources for Sustainable Development: Challenges and Opportunities
38
Table 5: Collection of Solid Waste by Workers from Vats and Roadsides in Number of Days per Week in Ward No. 20 of Kamarhati Municipality
(Figure in Percentage) Income Category Yes No Don’t KnowBelow Rs. 10, 000 75.00 0.00 25 Rs. 10, 000–20, 000 75.56 0.00 24.44 Above Rs. 20, 000 62.96 0.00 37.04
Source: Field Survey, 2011 8.1.6. Staffs and Municipality Services Table 6 shows the opinion of local people regarding the sufficiency of municipality staffs in the ward for the collection of waste. Among the sample households, 53.57% of low income group believed that there are sufficient municipality staffs in the ward, but they are very irregular in their work; 62.22% (middle income group) and 62.96% (high income group) respondents also believed the same.
Table 6: Availability of Staffs for Collection of Solid in Ward No. 20 of Kamarhati Municipality
(Figure in Percentage) Income Category Yes No Below Rs. 10, 000 53.57 46.43 Rs. 10, 000 20, 000 62.22 37.78 Above Rs. 20, 000 62.96 37.04
Source: Field Survey, 2011 8.1.7. Solid Waste Production and People Perception Disposal of solid waste in open space has been increasing day-by-day due to increase in population and change of living pattern. The study tries to find out the local people’s opinion, and Table 7 reveals the view of the people about increase of solid waste in the open space.
Table 7 Distribution of Sampled Households Regarding the View of Increase of Solid Waste in the Open Space by Income Wise in Ward No. 20 of Kamarhati Municipality
(Figure in Percentage) Income Category Yes No Below Rs. 10, 000 60.71 39.29 Rs. 10, 000–20, 000 60.00 40.00 Above Rs. 20, 000 77.78 22.22
Source: Field Survey, 2011 The table shows that 60.71% households of low income, 60% households of middle income and 77.78% households of high income group reported that solid waste problems increased in the streets and roads due to hotels, tea stalls, shops etc. most of the sample population reported that common people do not dispose off their solid waste in the open place, they store their generated solid waste in dustbins and municipality workers collect it from their houses. 8.1.8. Slum Population: Responsible for Increase of Solid Waste Slum population is one of the most important problems in Indian cities; they create a number of problems in the city life because they do not have proper habitation and created pressure on public places in various ways. Table 8 depicts the householdwise opinion regarding the increase of solid waste in roadside. Nearly 28.57% households of low income, 24.44% households of middle income and 48.14% households of high income groups reported that the slums populations are responsible for increase in solid waste on roadsides.

Scenario of Solid Waste Generation and its Management in Kamarhati Municipality of Kolkata, West Bengal
39
Table 8: Household-wise Opinion Regarding Increase of Slums Population and Disposal of Solid Waste on Roadside in Ward No. 20 of Kamarhati Municipality
(Figure in Percentage) Income Category Yes No Don’t KnowBelow Rs. 10, 000 28.57 25 46.43 Rs. 10, 000–20, 000 24.44 37.78 37.78 Above Rs. 20, 000 48.15 22.22 29.63
Source: Field Survey, 2011 8.1.9. Waterlogging Problems Disposal of solid waste and waterlogging are closely related to each other. Some parts of the city face very bad experiences on regular basis of water-logging problem on Feeder Road and B. M. Banerjee Road due to disposal of solid waste into the canal. Most of the sample households have been suffering water-logging problems for a very long time. According to primary data, more than 57.14% of the households of low income group faced water-logging problem during the time of rainy seasons followed by 53.33% households of middle and 66.67% of high income group respectively experienced waterlogging problems in the streets in rainy season.
Table 9: Distribution of Sample Households Regarding Roadside Disposal of Solid Waste Increase Waterlogging by Income Categories in Ward No. 20 of Kamarhati Municipality
(Figure in Percentage) Income Category Yes No Below Rs. 10,000 57.14 42.86 Rs. 10,000-20,000 53.33 46.67 Above Rs. 20,000 66.67 33.33
Source: Field Survey, 2011 8.1.10. Use of Plastic Items Use of plastic items is the major cause of increase of solid waste in roadside as well as open places. Table 10 shows the distribution of plastic items user on the basis of income category. Table reveals that 100% of both low and middle income group households use plastic itemswhereas, only 88.89% households of high income group use plastic items.
Table 10: Distribution of Sample Households Regarding Use of Plastic Items by Income Categories in Ward No. 20, Kamarhati Municipality
(Figure in Percentage) Income Category Yes No Below Rs. 10,000 100.00 0.00 Rs. 10,000–20,000 100.00 0.00 Above Rs. 20, 000 88.89 11.11
Source: Field Survey, 2011 8.2 Health and Environment Problems Table 11 and Figure 10 show the percentage distribution of sample households regarding the health and environment problems due to improper management of solid waste. The analysis of the data shows that 64.29% households of low income group, 68.89% households of middle income group and 70.37% households of high group have been suffering of health and environmental related problems due to solid waste and waterlogging.
Table 11: Distribution of Sample Households Regarding Road side Disposal of Solid Waste Create Health Problems by Income Categories in Ward No. 20 of Kamarhati Municipality
(Figure in Percentage) Income Category Yes No Below Rs. 10, 000 64.29 35.72 Rs. 10, 000–20, 000 68.89 31.11 Above Rs. 20, 000 70.37 29.63
Source: Field Survey, 2011
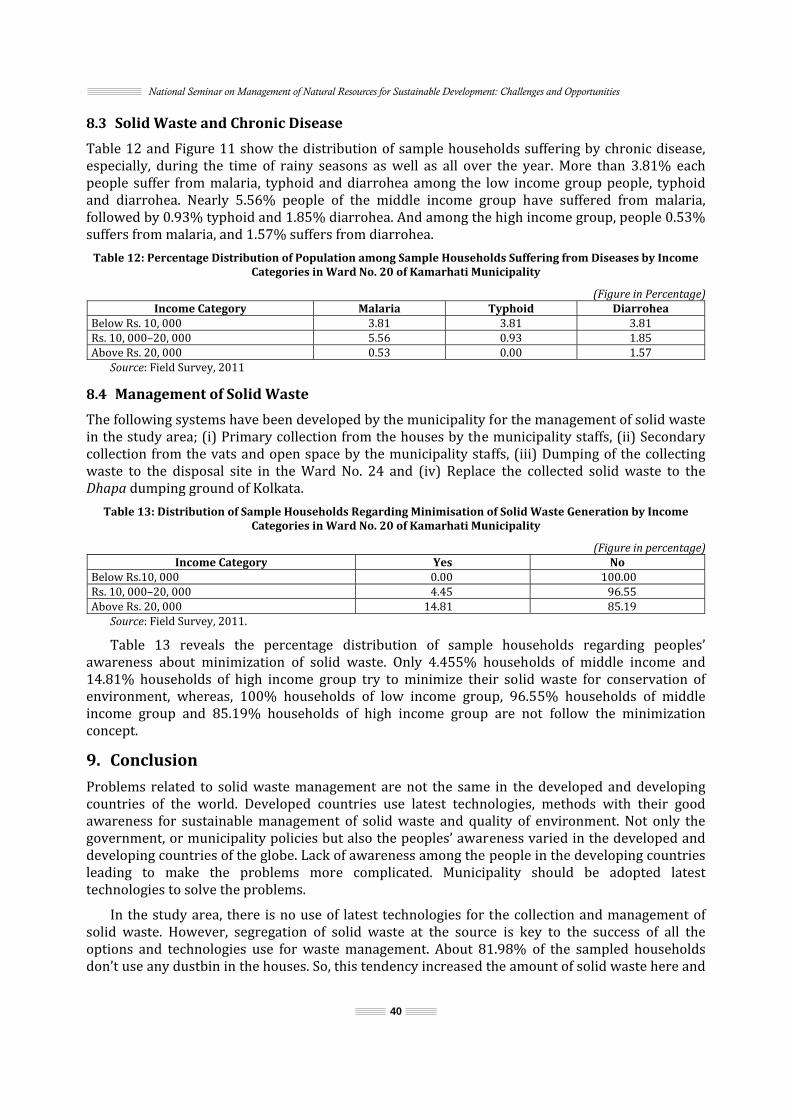
National Seminar on Management of Natural Resources for Sustainable Development: Challenges and Opportunities
40
8.3 Solid Waste and Chronic Disease Table 12 and Figure 11 show the distribution of sample households suffering by chronic disease, especially, during the time of rainy seasons as well as all over the year. More than 3.81% each people suffer from malaria, typhoid and diarrohea among the low income group people, typhoid and diarrohea. Nearly 5.56% people of the middle income group have suffered from malaria, followed by 0.93% typhoid and 1.85% diarrohea. And among the high income group, people 0.53% suffers from malaria, and 1.57% suffers from diarrohea. Table 12: Percentage Distribution of Population among Sample Households Suffering from Diseases by Income
Categories in Ward No. 20 of Kamarhati Municipality
(Figure in Percentage) Income Category Malaria Typhoid DiarroheaBelow Rs. 10, 000 3.81 3.81 3.81 Rs. 10, 000–20, 000 5.56 0.93 1.85 Above Rs. 20, 000 0.53 0.00 1.57
Source: Field Survey, 2011 8.4 Management of Solid Waste The following systems have been developed by the municipality for the management of solid waste in the study area; (i) Primary collection from the houses by the municipality staffs, (ii) Secondary collection from the vats and open space by the municipality staffs, (iii) Dumping of the collecting waste to the disposal site in the Ward No. 24 and (iv) Replace the collected solid waste to the Dhapa dumping ground of Kolkata.
Table 13: Distribution of Sample Households Regarding Minimisation of Solid Waste Generation by Income Categories in Ward No. 20 of Kamarhati Municipality
(Figure in percentage) Income Category Yes No Below Rs.10, 000 0.00 100.00 Rs. 10, 000–20, 000 4.45 96.55 Above Rs. 20, 000 14.81 85.19
Source: Field Survey, 2011. Table 13 reveals the percentage distribution of sample households regarding peoples’ awareness about minimization of solid waste. Only 4.455% households of middle income and 14.81% households of high income group try to minimize their solid waste for conservation of environment, whereas, 100% households of low income group, 96.55% households of middle income group and 85.19% households of high income group are not follow the minimization concept. 9. Conclusion Problems related to solid waste management are not the same in the developed and developing countries of the world. Developed countries use latest technologies, methods with their good awareness for sustainable management of solid waste and quality of environment. Not only the government, or municipality policies but also the peoples’ awareness varied in the developed and developing countries of the globe. Lack of awareness among the people in the developing countries leading to make the problems more complicated. Municipality should be adopted latest technologies to solve the problems. In the study area, there is no use of latest technologies for the collection and management of solid waste. However, segregation of solid waste at the source is key to the success of all the options and technologies use for waste management. About 81.98% of the sampled households don’t use any dustbin in the houses. So, this tendency increased the amount of solid waste here and

Scenario of Solid Waste Generation and its Management in Kamarhati Municipality of Kolkata, West Bengal
41
there. Most of the people living in the market areas tend to push the plastic items in the drain which are very effective for the occurrence of water-logging problems. Main drain of A.A. Pai Road use as a dustbin leading the waterlogging problem more complicated. People of the study area know the problems related to solid waste but they do not adopt any measures to overcome these problems. 10. Suggestions Following suggestions should be followed to minimize the solid waste problems in the study area:
• Latest technologies should be adopted by the municipal authority. • The reduction of waste can happen only when everybody reduces waste generation in the first place. • Every individual has to contribute in doing so. There is an urgent need of public awareness about waste generation. There should be awareness at all levels of the society, which will motivate them to change their casual habits which creates waste. • Energy, water and solid waste audits were conducted at the representative buildings which consume large amount of energy, water and generate huge amount of solid waste. • Dustbin facility should be provides to the households by the municipality with minimum cost. • After identifying the potential sources of energy and water consumption and solid waste generation, CP options are proposed, to suggest measures to reduce energy and water consumption and solid waste generation. • Separation of solid waste should be followed among the households. • Use different types of vermin-composing system for the management of biodegradable waste. • Pushing of the waste in the drain should be restricted or punishable. • Minimize unauthorized roadside storage. • The frequency of collection of solid waste from vats and roads should be increased. • Recycling system should be adopted. • Inactive municipality staff should be punished. • Successful and energetic municipality staff should be awarded. • Public should be made aware regarding solid waste problems and management. • Strictly follow the rules of government for reduction of plastic items. • Use of eco-friendly products should be increased. • Take extra care for the management of solid waste in the market areas.
Acknowledgement The authors would like to thank Mr. Md. Asadul Islam for his assistance and hard work, without him this research paper would have been impossible.
National Seminar on Management of Natural Resources for Sustainable Development: Challenges and Opportunities
42
References Benjamin, N. (1995), Environmental Management, UNESCO Series of Learning Materials in Engineering Sciences. Beukering, P., Sehker, M., Gerlagh, R. and Kumar, V., (1999), “Analysing Urban Solid Waste in Developing Countries: A Perspective on Bangalore, India”, Working Paper 24, CREED, India. Bharucha, E. (2010), Text Book of Environmental Studies, University Press (India) Private Limited, pp. 139–146. Cunningham, W.P. and Cunningham, M.A. (2009), Principle of Environmental Science-Inquiry and Applications, McGraw Hill Company, pp. 310–329. Devi, K. and Satyanarayana, V. (2001), Financial Resources and Private Sector Participation in SWM in India. Indo-US Financial Reform and Expansion (FIRE) Project, New Delhi. Fritz, J. (1990), “Comparatives Issues in Solid Waste Management in India and China”, Paper Presented at the International Workshop on Waste Management and Resource Recovery, October 27-November 4, Kathmandu. Furedy, C. (1990), Social Aspects of Solid Waste Recovery in Asian Cities, Environmental Systems Review, No. 30, Bangkok, Thailand: Environmental Systems Information Center, (ENSIC), Asian Institute of Technology. Harashima, Y. (2000), “Environmental Governance in Selected Asian Countries”, International Review for Environmental Strategies, Vol. 1, No 1, pp. 193–207. Huysman, M. (1994), A Profile of Bangalore, Proceedings Workshop Linkages in Urban SWM Organised, Jointly by Karnataka State Council for Science and Technology, Bangalore, India and the University of Amsterdam Netherlands. IPE, (2004), Study of Management of Solid Waste in Indian Cities, Twelfth Finance Commission, Government of India. Lardinios, I. and Klundert, van de A. (1997), Integrated Sustainable Waste Management, Paper for the Programme Policy Meeting Urban Waste Expertise Programme, pp. 1–6. Local Bodies Status-Maharashtra Pollution Control Board Maharashtra Non-biodegradable Garbage (Control) Act 2006 Maharashtra Plastic Carry Bags (Manufacture and Usage) Rules 2006. Marandi, B.L. (1998), Hazardous Waste Management, Central Pollution Control Board (CPCB). http://www.cpcb.nic.in/news.htm as on 21st May 2005, Energy from Municipal Solid Waste (MSW), Environmental Technology, Vol. 21, pp. 345–349. Municipal Solid Waste (Management & Handling) Rule, 2000. Prakasam, C., Thirumorthy, G. and Biswas, B. (2010), “Solid Waste Management in Salem City, Tamil Nadu, Using GIS Techniques”, Indian Journal of Landscape Systems and Ecological Studies, Institute of Landscape, Ecology and Ekistics, Kolkata, Vol. 33, pp. 65–70. Roy, S. and Basu, R. (2010), “An Appraisal the Roadside Storage System of Solid Waste in Kolkata”, Indian Journal of Landscape Systems and Ecological Studies, Institute of Landscape, Ecology and Ekistics, Kolkata, Vol. 33, pp. 33–36. Santra, S.C. (2010), Environmental Science, New Central Book Agency Private Limited, pp. 251–260. Sarkar, S. (2010), “Present Scenario of Municipal Solid Waste Management in India with Special Reference to Kolkata”, Indian Journal of Landscape Systems and Ecological Studies, Institute of Landscape, Ecology and Ekistics, Kolkata, Vol. 33, pp. 515–522. State of Environment Report-Ministry of Environment & Forest 2009. Sultana, S. (2005), “Identification and Selection of Suitable Site for Solid Waste Disposal using Remote Sensing and GIS”, Asian Studies, Vol. XXIII, No. 1 and 2, pp. 47–56. Uberoi, N.K., Environmental Management, Second Edition, pp. 272–302. Zurbrügg, C., Drescher, S., Patel, A.H. and Sharatchandra, H.C. (2004), “Decentralised Composting of Urban Waste–An Overview of Community and Private Initiatives in Indian Cities”, Waste Management, Vol. 24, Issue 7, pp. 655–662. Zurbrügg, C., Drescher, S., Patel, A.H. and Sharatchandra, H.C. (2002), Decentralised Composting-An Option for Indian Cities?, Report of a Workshop Held in Bangalore, India. http//www.google.com. http://edugreen.teri.res.in/. http://en.wikipedia.org/wiki/Waste_management. http://www.cpcb.nic.in. http://www.infrastructureindia.com/monitoreval_cs2.htm. http://www.mcgm.gov.in/. http://www.unep.or.jp/ietc/estdir/pub/msw/.

43
6 Impact of Ranganadi Hydro Project on Environmental Degradation in the Lower Dikrong Basin of Assam, India
Gajen Bhuyan1 and H.J. Syiemlieh2 1Kherajkhat Junior College,
Deotola–787033, Lakhimpur, Assam, India 2Department of Geography,
North-Eastern Hill University (NEHU), Shillong–793014 E-mail: [email protected], [email protected]
1. Introduction The studies of river and their basins began at the dawn of human civilization that had occurred mainly along the river basins. Human endeavour as a response to land, water and other resources had increased gradually; the need of river regimes also increased. One of such problems may be related to floods, which also lies in the domain of environmental geomorphology in addition to their role and influence in fluvial geomorphology and hydrology (Barman, 1986). Flood plains have always been significant areas of human occupancy and are recognized as the arteries of life; these are usually affected by floods. The important issues of downstream ecological impact on the rivers and the Beels (wetlands) in the Brahmaputra plains that may be caused by proposed dams in the eastern Himalayas have got very little attention (Gogoi, 1997). The seasonal inundation of Beels by rivers is essential to the nutrient cycle of local aquatic ecosystems and is crucial for fisheries. This is likely to be adversely affected by dams. As Boruah and Biswas point out, this will affect the ‘auto-stocking’ of wetlands by riverine species. The profuse pre-Monsoon growth of aquatic weeds will also not be ‘flushed out’ by the flood waters (Boruah et. al 2000). In the process of development of hydro-electric projects, valuable forests are destroyed, resulting to a different ecosystem. Besides, most inhabitants evicted from such areas are made to fend for themselves. These projects create adverse impacts on the hilly or mountainous ecosystem and also to the rural community inhabiting along the stream (Brierley et al., 2005). Ranganadi Hydel Project, the first major project in Arunachal Pradesh, had been commissioned in 2002. This area has been receiving an average annual precipitation about 3311.18 mm. during the last 22 years. It also shows the seasonal variation of rainfall in both upper and lower part of the basin which is shown in the table. Table 1: Seasonal Distribution of Rainfall in Doimukh and Harmutty Tea Estate Rain Gauge Station
Rain gauge station
Period Winter (Dec to Feb)
Pre- Monsoon (March to May)
Monsoon (June to
Sept)
Post Monsoon (Oct to Nov)
Total rainfall (in mm)
Average
Doimukh 1988-2004 1948 mm. 14300.2 mm. 39716.09 mm. 3938.8 mm. 59903.09 mm. 3523.71 mm.Percentage 3.25% 23.87% 66.30% 6.58%
Harmutty 1987-2008 2620.75 mm. 17470 mm. 48293.5 4459.75 72846.09 3311.18Percentage 3.60% 23.98% 66.30% 6.12%
Source: Harmutty Tea Estate & Rural Works Department of Arunachal Pradesh, 2009.

Annu844.19 mat the samwater frodiameter create mobasin, espland is 2002–20
The dbe much HoweverStage-I Prthe Dikroimpacts, Ranganadproject dof the conwith silt dThe iactivity. Tentire are2. ObjeThe followa. Tofb. Tcoc. T
National Seminaual dischargem³/s respectme period oom Rangana channels isore floods, specially durseverely 08.
Figdirect displasmaller (in , there are lroject in Aruong river. Tprimarily bdi and incrid little to anstruction wdeposits beiimportance Therefore, cea before it iectives wing broad o study the f the Rangano identify tonstruction o assess the
ar on Managemene rates of Ditively and thof time (Boadi to Dikros about 160 siltation, soring the peaaffected b
g. 1: Rainfall, Dacement of cnumerical tikely to be sunachal PraThis is likelbecause of teased flow address the was evident ing as much of environconstructionis used as a objectives adischarge rnadi Projectthe changinof the projee flood affect
nt of Natural Resoukrong and Rhe minimumra et al., 19ong river thm3/s. This dil erosion aak dischargeby flood
Discharge andcommunitiesterms) than substantial ddesh, commy to have cthe change in the Dikdownstreamin the early as 15-45 cmnmental man of hydro-elresource. are identifieates and flot. ng spatial pect). ted areas an
urces for Sustainab
44
Ranganadi (m discharge r988b). Afterhrough a 10diversion ofnd displacee period (in in downst
d Flood Affects upstream what has bedownstreammissioned in considerablein flow regkrong). The m impacts ostages of thm. in the riveanagement lectric projed for researw of the Dik
pattern of fnd the impac
ble Development: 1991) reachrates are recr commissio km. long hf water fromment of peosummer). Atream area
ted Villages inof existing deen the expem impacts (B2002 diverte social congimes of botEnvironmeof the Rangahe project. Her bed werecannot be ect calls for rch: krong river bflood affectct of the pro
Challenges and Oph a maximumcorded 7.46oning of the head race tum Ranganadople in loweAround 335as of Dik
n Lower Reachdams in the erience in thBora et al., 1ts water fronsequences,th rivers (aental Impacanadi Projeceavy sedimee found (Dutignored ina complete before and a
ted areas (boject on the h
pportunities m of 263.696 m³/s and 3project, divunnel of 6.8i to Dikronger portion o53 ha. of agkrong rive
hes north-east he rest of th1998). The Rm the Ranga, including reduced flct Assessmect on Dikronentation dowtta et al., 201n any develunderstandafter the conbefore and human popu
m³/s and 36.27m³/s version of 8 metre in g seems to of Dikrong gricultural r during
India may e country. Ranganadi anadi into livelihood ow in the ent of the ng. Impact wnstream 10). lopmental ding of the nstruction
after the ulation.

Impact of Ranganadi Hydro Project on Environmental Degradation in the Lower Dikrong Basin of Assam-India
45
3. Research Questions The following research questions will be taken up for investigation: a. Diversion of water from Ranganadi to Dikrong river must have serious geomorphological consequences. How changes have occurred, the nature of changes and their pattern may jeopardize the natural fluvial system. b. Effect of the changes that occur beyond the meeting point of the diverted water in Dikrong river cause lot problems to human population. The problems may be more acute as time passes; hence, what are the human responses and adaptation. 4. Study Area The Dikrong and Ranganadi rivers are two major north bank tributaries of the Brahmaputra river. Both these rivers are rain fed. The Dikrong basin lies between latitudes 260 55´N and 270 22´N and longitudes 93o13´E and 94oE. It drains the area covering a part of the lower hills of Arunachal Pradesh and the Lakhimpur district of Assam. The river originates at an elevation of 2840 metres above sea level (m.a.s.l.) near the border of Lower Subansiri and East Kameng districts of Arunachal Pradesh. The catchment area of this river system is about 1,557 sq km. of which about 253 sq. km. lies in Assam and remaining part lies in Arunachal Pradesh. The downstream portion of the basin suffered from floods each year. Besides this, an additional 160 m3/s/day of water is released from the Ranganadi to Dikrong for electricity generation which thought to have increased to the floods in this area.
Fig. 2: Longitudinal Profile of Dikrong River Basin
5. Methodology and Data Collection The present research work focuses on the flood affected areas downstream of the Dikrong river below the dam site. It covers an area of 253 sq. km. This work will be based on the information available for three major phases: 1. The period till the project was constructed (1986–2001). 2. The conditions after the project was constructed (2002–2008). 3. Field data collection for assessment of flood affected areas.

National Seminar on Management of Natural Resources for Sustainable Development: Challenges and Opportunities
46
5.1 Phase–I The basic objective during this phase is the collection of already published data. There is a need to understand different parameters in the period before the dam construction started. The information for the period 1986–2001 would pay attention to information on topography, geological formation, vegetation cover, rainfall pattern, discharge and flood levels, siltation and also the human population residing in the study area. Relevant toposheets of 1:50,000 scale and other available maps was used to extract information for the present purpose. Remote sensing data was also used to understand the flood affected area. Physiographic units of the study area are identified and mapped using methods available from existing literature (Pandey et al., 2008; Joshi et al. 2004; and Taher, 1986). Morphometric techniques were used for understanding the basin’s general configuration and drainage network channel characteristics in terms of pattern of channel changes, bank erosion and flood have been taken as the basis for understanding the nature of shifting of the river courses over time and space have been related to displacement of settlement take place. Other quantitative methods like stream order, stream number, stream length, drainage density, bifurcation ratio, sinuosity index, relationship between stream order, number and length etc. were analyzed and different maps were prepared. 5.2 Phase–II The basic objective during this phase is the collection of already published data from different sources. There is a need to understand similar parameters as considered in Phase I for the period after the project was commissioned. Relevant information from government sources like Revenue Circle Officer, Brahmaputra Board, Water resource and Agriculture were collected. 5.3 Phase–III In this phase, relevant data through questionnaires was collected pertaining to socio-economic conditions of flood-affected villages, human responses to floods and efforts of the government to mitigate effects of floods were considered. 6. Methods Used for Deriving Relevant Maps and Figures 1. Toposheets of (83E/3, 83E/4, 83E/7, 83E/8, 83E/11, 83I/4and 83J/1) at RF. 1:50,000 were used to carve out the AOI (Area of Interest). 2. Satellite imageries of the years 1973, 1987, 1999 and 2008 were downloaded from NASA, Global Land Cover Facility, Earth Science Data Interface and NRSA (National Remote Sensing Agency) to find out channel shifting and land use pattern for different time period. 3. Methods proposed by R.E. Horton (1932, and 1945) were used to analyze stream ordering, bifurcation ratio and relationship between stream order, number and length. The formula used for this purpose is mentioned below. a. Bifurcation ratio is calculated following the formula Nu/Nu+1 where, the number of stream segment of a given order (Nu) to the number of stream of next higher order (Nu+1). b. Stream length ratio has been calculated according to the following equation. RL = Lu / Lu-1 Where Lu = ∑Lu /Nu Here Lu is the mean length of all stream segments of a given order (u), ∑Lu is the sum of lengths of all stream segments of a given order and Nu is the number of stream segments of a given order.

Impact of Ranganadi Hydro Project on Environmental Degradation in the Lower Dikrong Basin of Assam-India
47
c. To find out relationship between stream orders vs number the following method was used with the help of MS Excel (2007). y = a–bx. Where y = order of stream segment. x = stream number. a = constant. b = regression coefficient. d. To find out the relationship stream order and stream length following formula was used in MS Excel (2007). y = y = a–bx. x = cumulative stream length. Where a = constant. b = regression coefficient. y = stream order. e. For calculation of Sinuosity Index Mullers method, S.S.I = CL/ VL is used. Where SSI, = Standard sinuosity index. CL = Channel length VL = Valley length Therefore, S.S.I = CL/ VL f. For identifying basin shape, Horton’s form factor (F) (1932), was used with the help of following the formula, F = A²/L, Where F = form factor indicating elongation of the basin shape. A = Basin Area. L = Basin Length. Therefore, F = A²/ L g. For calculating drainage density Hortons (1945) method was used, Dd = Lk /Ak. Where, Lk = Total lengths of all stream segments of a basin. Ak = Total area of the basin. Length and area of the stream and basin is find out with the help of Arc GIS 9.3 software. 1. MS Excel (2007) was used to derive the graph of average rainfall and discharge, deviation diagram of rainfall and discharge, hydrographs, maximum and minimum water level, correlation between rainfall and discharge and rainfall, discharge and flood affected village’s relationship. 2. Arc GIS 9.3 software are used to represent the average slope pattern of the study area by preparing of DEM, several other figures like physiographic divisions, land use pattern and channel shifting pattern in different time periods, area affected by flood, embankment map etc were also prepared under ARC GIS 9.3 environment.

National Seminar on Management of Natural Resources for Sustainable Development: Challenges and Opportunities
48
3. Erdas Imagine 9.2 software used to find out the maximum and minimum height of the basin from the sea level and different elevation zones. 4. Relationship between stream order, number and length was analyzed according to Horton’s law of stream lengths as co-efficient of correlation and a regression line has been prepared in MS Excel 2007. 5. The analysis of remotely sensed data was done by using the ‘Digital Image Processing’ technique. This image processing includes three general steps, namely (i) Pre-processing (ii) Display and enhancement and (iii) Information extraction. 6. GARMIN GPS-76 was utilized during ground truth data collection. ‘Kappa Coefficient’ method was also employed for ascertaining its accuracy levels. The methodology in a nutshell can be depicted in the following diagram:
Fig. 3: Flow Diagram of Methodology
7. Case Study of Some Selected Flood Affected Villages To understand the extent and magnitude of flood damage and the nature of people’s adjustment to flood, eleven (11) severe affected villages have been selected in the Dikrong basin. Out of these villages selected for survey, were three from Narayanpur Revenue Circle and eight from Bihpuria Revenue Circle which were severely affected during 2005 to 2008. Among these villages, nine villages located in the right bank and two villages are located in the left bank. The people inhabiting these villages are Hindu Bengalis, Adivasi (tea garden labourers), Missings, Nepalis, Muslims and some Assamese people. They mostly cultivate ‘Ahu’ and ‘Rabi’ crops. As revealed from the field survey, No. 65/68. Grant, No. 80 Grant, No. 2 Pithaguri and Ahom Gaon have been severally affected by flood. These three villages are located in upper part of the lower reach of Dikrong river and out of this No. 65/68. Grant and No. 80 Grant was almost completely eroded by the river during 2005 to 2008 and more than 100 families were displaced from their original location and most of the people took shelter in the PWD roads, hospitals etc. and some of them migrated out of the area.

Impact of Ranganadi Hydro Project on Environmental Degradation in the Lower Dikrong Basin of Assam-India
49
Table 2: Socio-economic Status of the Surveyed Households Affected Due to Flood
Sl No.
Name of the Villages
No. of A.P.L.
Families
No. of B.P.L. Families
No. of Electrified
House
No. of Traditional
House
Assam Type
House
Percentage of Cultivated Land
(in ha.)
Percentage of Built-up Land
(in ha.) 1 1 No. Dahgharia 5 10 Nil 10 5 85.29 13.182 No. 2 Dahgharia 3 14 Nil 9 8 84.16 14.253 Ahom Gaon 22 15 10 25 12 57.87 42.124 Mornoi Grazing 20 17 5 37 Nil 80.68 18.825 No. 1Pithaguri 2 18 13 14 6 80.41 17.926 No. 2 Pithguri 13 14 12 20 7 82.12 16.857 No. 1 Dikrong Chapori 1 14 Nil 14 1 77.65 17.928 Sonari Gaon 10 4 Nil 14 Nil 73.13 23.869 No. 80 Grant 27 52 41 32 47 88.91 11.0810 No. 65/68 Grant 12 35 14 33 14 85.82 14.1711 Bungo 2 21 Nil 23 Nil 76.71 21.68Total 117 214 77 238 93 In Merbil and Kapichala, about 109 families were displaced due to erosion and are now living in another area of Dikrong River. The people have migrated to some other places so the detail information about the populace is not available. From the observation, it was found that poor families are economically affected by the floods and erosion. It is also to be noted that the environmental impact assessment of the project did not address downstream impact evident in the early stages of the project itself. 8. Response to Flood through Land Use Land use refers to ‘man’s activities on land’ which are related to man. Land use and land cover maps describe the landscape of a particular area by assigning each land unit to a specific category or class, such as water bodies, dense forest, moderately dense forest, agricultural land, open forest area, abundant land, sandy patches and built up area. As per the Survey of India topographical sheets and satellite imageries of 1973, 1987, 1999 and 2008 the land use and land cover of the Dikrong river basin have been identified considering eight categories of land use. GIS techniques are used to identify and demarcate the land use change. ‘Bao’ rice is cultivated mainly in the southern part and drainage congestion areas of Mora Dikrong channel where there are plenty of marshy lands or Beels which are now converted into ‘Boro’ cultivated area. The other important Rabi crops, besides ‘Boro’ and ‘Ahu’ rice, are mustard, pulses, wheat and varieties of vegetable cultivated into a considerable extent in the south and south-eastern part of the basin. The production of oilseeds and pulses is also confined mainly towards south-eastern part where rich alluvial soils are found. Besides these crops, various types of vegetables, spices and fruits are grown throughout the year. In the recent years, the area was affected by frequent floods and erosion almost every year and 11 villages were almost eroded and some were partly eroded which results in a lack of habitable land and increases population pressure on land. It was also observed from the field that the areas under cultivation before commissioning the dam gradually decrease and become fallow due to heavy siltation. According to the victims, after 2008 devastating flood, the percentage of fallow land was found to be increased, which are shown in the table. Therefore, some varieties of crops such as jute, sugarcane, oilseeds and potatoes are decreasing day-by-day and forest areas also decrease rapidly. From the analysis of personal interviews, it was found that cultivation of Boro rice has reduced significantly due to reduction of marsh land as a result of siltation.
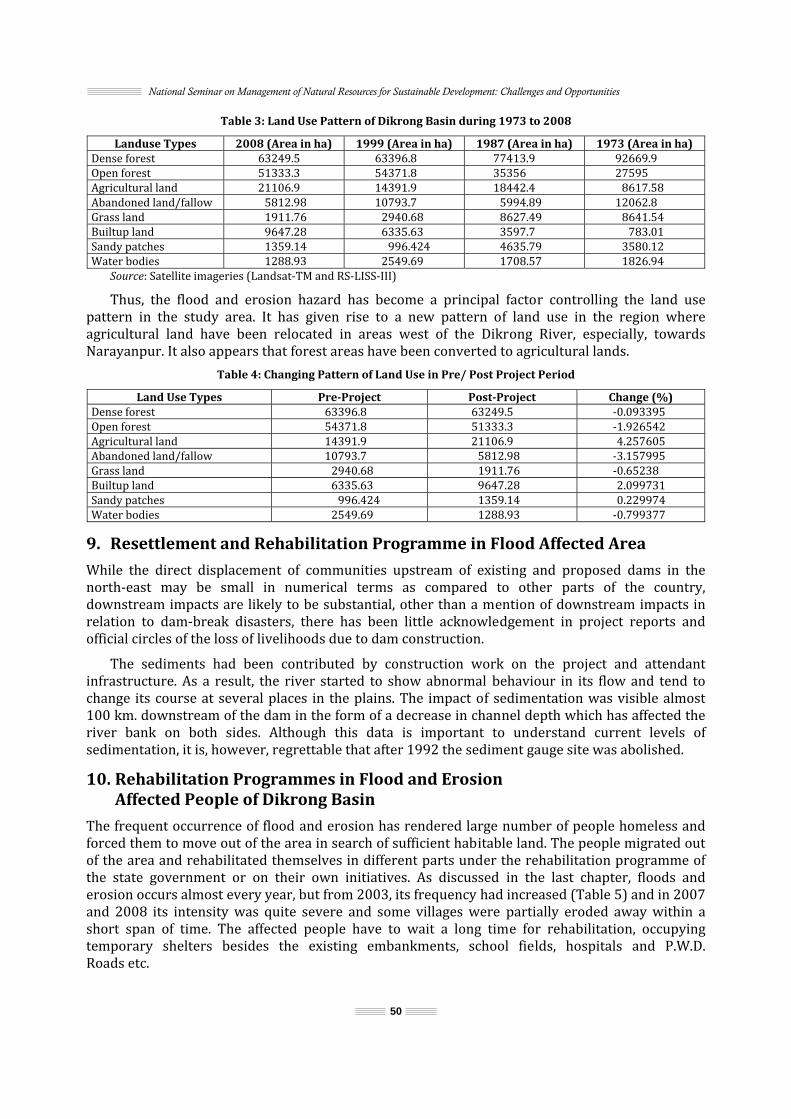
National Seminar on Management of Natural Resources for Sustainable Development: Challenges and Opportunities
50
Table 3: Land Use Pattern of Dikrong Basin during 1973 to 2008
Landuse Types 2008 (Area in ha) 1999 (Area in ha) 1987 (Area in ha) 1973 (Area in ha)Dense forest 63249.5 63396.8 77413.9 92669.9Open forest 51333.3 54371.8 35356 27595 Agricultural land 21106.9 14391.9 18442.4 8617.58Abandoned land/fallow 5812.98 10793.7 5994.89 12062.8Grass land 1911.76 2940.68 8627.49 8641.54Builtup land 9647.28 6335.63 3597.7 783.01Sandy patches 1359.14 996.424 4635.79 3580.12Water bodies 1288.93 2549.69 1708.57 1826.94Source: Satellite imageries (Landsat-TM and RS-LISS-III) Thus, the flood and erosion hazard has become a principal factor controlling the land use pattern in the study area. It has given rise to a new pattern of land use in the region where agricultural land have been relocated in areas west of the Dikrong River, especially, towards Narayanpur. It also appears that forest areas have been converted to agricultural lands.
Table 4: Changing Pattern of Land Use in Pre/ Post Project Period
Land Use Types Pre-Project Post-Project Change (%)Dense forest 63396.8 63249.5 -0.093395 Open forest 54371.8 51333.3 -1.926542 Agricultural land 14391.9 21106.9 4.257605Abandoned land/fallow 10793.7 5812.98 -3.157995 Grass land 2940.68 1911.76 -0.65238 Builtup land 6335.63 9647.28 2.099731Sandy patches 996.424 1359.14 0.229974Water bodies 2549.69 1288.93 -0.799377 9. Resettlement and Rehabilitation Programme in Flood Affected Area While the direct displacement of communities upstream of existing and proposed dams in the north-east may be small in numerical terms as compared to other parts of the country, downstream impacts are likely to be substantial, other than a mention of downstream impacts in relation to dam-break disasters, there has been little acknowledgement in project reports and official circles of the loss of livelihoods due to dam construction. The sediments had been contributed by construction work on the project and attendant infrastructure. As a result, the river started to show abnormal behaviour in its flow and tend to change its course at several places in the plains. The impact of sedimentation was visible almost 100 km. downstream of the dam in the form of a decrease in channel depth which has affected the river bank on both sides. Although this data is important to understand current levels of sedimentation, it is, however, regrettable that after 1992 the sediment gauge site was abolished. 10. Rehabilitation Programmes in Flood and Erosion
Affected People of Dikrong Basin The frequent occurrence of flood and erosion has rendered large number of people homeless and forced them to move out of the area in search of sufficient habitable land. The people migrated out of the area and rehabilitated themselves in different parts under the rehabilitation programme of the state government or on their own initiatives. As discussed in the last chapter, floods and erosion occurs almost every year, but from 2003, its frequency had increased (Table 5) and in 2007 and 2008 its intensity was quite severe and some villages were partially eroded away within a short span of time. The affected people have to wait a long time for rehabilitation, occupying temporary shelters besides the existing embankments, school fields, hospitals and P.W.D. Roads etc.

Impact of Ranganadi Hydro Project on Environmental Degradation in the Lower Dikrong Basin of Assam-India
51
Table 5: Families Displaced in Different Villages & their Current Status
Village Families Displaced Current Status Year 1998 2005 2007 2008Ahomgaon > 24 24 13 Now living in Reserved Forest No. 1 & 2 Pithaguri 14 33 28 families in Assam-Arunachal border No. 65/68 Grant 21 11 15 PWD Roads & Vety. Hospital; some relocated themselves; 30 families received compensation of Rs. 10,000 No. 80 Grant 32 28 19 PWD Roads & School field; some relocated themselves; 64 families received compensation of Rs. 10,000 Mornoi Grazing 18 19 Compensation of Rs. 10,000received; Living on protection bund; others migrated to left bank Bungo 23 EmbankmentNo. 1 & 2 Dahgharia 14 18 Compensation of Rs. 10,000 received and living in nearby areas No.1Dikrong Chapori 15 Within 600–700 away from river Sonarigaon 14 Compensation of Rs. 10,000received Source: Field Survey, 2007–08 Generally, people do not want to change their original place of settlement. They try to resettle themselves within the locality after being displaced, but this is no longer possible now due to high density of population (Gogoi, 2008). During the field survey it was observed that displaced families first try to settle in the same village with a hope that there will be no erosion again. However, in reality it is different and some families even have to change their residential location several times. From the above table, it is evident that the displaced people have received due compensation from the government sources to partially cover their losses. However, their rehabilitation is still a question to be answered. Some of them are living in temporary shelters and are yet to be resettled.
Table 6: Flood Affected and Displaced Villages along the Dikrong Channel Flood Affected/ Displaced Villages along Dikrong Channel Right Bank villages Left Bank Villages
Chro
nic
ally
af
fect
ed Banderdewa, Dikrong chapori, Pithaguri No 1&2, No. 65/68 & No. 80 Grant, Dongibeel, Keyamora, Sonari Gaon,Mornoi Gaon Moricha Pathar, Mornoi Grazing, Ahom Gaon,No. 1&2 Dahgharia, Badati Miri, Battumchuk, Bongaligaon,Nepali Gaon, Kalawani
Merbil, Parbatipur, Kapichala, Bungo, Baligaon, Sisapathar, Merbil Dighali.
Occ
asio
nal
ly
affe
cted
Jakaipelowa, Bihpuria, Bamun Gaon Boraikhana, Japjup,Kenduguri, Hamara, Madhupur, Kholaguri, Dighal Jarani. Pokadol, Gandhia, Santapur, Sisapathar, Bhogdoiguri, Source: Field survey, 2007 The role of physical factors is clearly seen as a major cause of floods in the study area. Rainfall during summer after sufficient saturation of the soil usually causes large amount of runoff thereby leading to overflowing of the channels and submerging large areas. During pre-project period, the frequency of floods as indicated by the number of days of flow above danger levels have increased. Though this area is affected by flood almost every year, the indications are that recurrence of floods would be more. Again, the maintenance of the water levels during the winter season as indicated by the minimum water level in the post-project period is a threat to floods during non-flood seasons too.

National Seminar on Management of Natural Resources for Sustainable Development: Challenges and Opportunities
52
Table 7: Physical and Socio-economic Characteristics of Dikrong Basin, Pre-and Post Project Period P
re-P
roje
ct
Year Rainfall
Water Level Total Discharge
Days above Families Flood affected Area(ha) Min Max Danger Level Affected 1991 3481.75 85.60 87.22 15917.5 62 405 2051992 2698.50 85.76 87.55 23660.23 33 465 2601993 3863.50 85.84 87.47 37560.57 56 380 2131994 3386.50 85.62 87.37 25020.02 13 170 1951995 3473.75 85.54 87.17 41850.34 72 370 1601996 3158.00 85.79 87.25 41595.23 34 290 1251997 3182.25 85.73 87.53 34742.09 48 400 2001998 4255.75 85.75 87.62 44228 104 1600 134451999 3345.25 NA NA 16201.75 NA 785 11002000 2889.50 85.88 87.05 32676.02 68 825 16052001 2497.50 85.05 87.16 22017.56 65 1100 1625Total 36232.25 856.56 873.39 555 6790 19033Average 3293.841 85.656 87.339 37.800 617.273 1730.273
Pos
t-P
roje
ct
2002 2516.25 86.07 88.12 26347.8 93 600 8032003 3208.50 86.24 87.46 34518.12 183 570 11022004 3825.00 86.10 87.43 50233.06 174 913 14602005 2957.75 85.97 87.42 64653.96 228 813 19502006 2766.00 85.53 87.22 45234.81 32 895 8202007 3661.25 85.61 87.37 59734.87 127 3047 212852008 3524.75 86.16 87.67 59953.16 171 1719 6133Total 22459.50 601.68 612.69 1008 8557 33553Average 3208.50 85.954 87.527 90.143 1222.429 4793.286Change (%) -2.659 0.347 0.214 57.319 49.504 63.902It is projected that a probable increase of 7.34% of peak discharges for 5% conversion of forest area to paddy cultivation. From the table it can be inferred that agricultural land, which is mostly paddy cultivation, increased by about 4.25% between the pre-and post project periods. Under these conditions, if the estimates are true, the peak discharge in Dikrong basin would increase by about 6% (Ghosh et al. 2011). Besides, the growing built-up areas would also contribute to higher discharge. Table 8: Changing Pattern of Land Use in Pre-and Post Project Period
Land Use types Pre-Project Post-Project Change (%)Dense forest 63396.8 63249.5 -0.093395 Open forest 54371.8 51333.3 -1.926542 Agricultural land 14391.9 21106.9 4.257605Abandoned land/ fallow 10793.7 5812.98 -3.157995 Grass land 2940.68 1911.76 -0.65238 Builtup land 6335.63 9647.28 2.099731Sandy patches 996.424 1359.14 0.229974Water bodies 2549.69 1288.93 -0.799377 11. Conclusion It has been observed that there is great insufficiency and inconsistency of data to give a clear view of the situation on the ground. If rainfall data could have been available for the upper reaches of the basin, the rainfall-discharge responses could have been better understood. There is a great need for a water level gauging site in the upper reaches to establish this relationship. An additional sediment discharge measuring site could have been incorporated along with the Sisapathar discharge gauge site for understanding sediment flow in the basin. The abandoned channels and Beels have become shallow after deposition of silt and sand and are transformed to agricultural and built up areas. Land use activities of the study area including timber harvest, agriculture, shifting cultivation, construction of road, bridge, canals that are the

Impact of Ranganadi Hydro Project on Environmental Degradation in the Lower Dikrong Basin of Assam-India
53
primary causes of altered flow regimes. Converting forest to agricultural lands generally decreases soil infiltration and results in increased overland flow. There has been rapid conversion of land use categories due mainly to the pressure of population in recent times which could be seen as factors of altered flow regime. Hence, further changes need to stop. Sand and gravel are the two most important material resources extracted from the Dikrong low lying areas. Main sources of sands and gravels of Dikrong are recovered from river deposits. Rapid extraction of downstream sediment delivery cause channel aggradations and instability. Illegal collection of sand and boulders by digging the river bank promote erosion of and results channel shifting. Quarrying is a major problem in the Dikrong basin in Banderdewa area leading to bank slumping. Measures should be taken to reduce the threats in a proper manner. The erosion problem is more acute in Dikrong basin and seems to be related to natural as well as human influence. No.1 Pithaguri, No. 2 Pithaguri, No. 65/68 Grant, No. 80 Grant, Merbil, Mornoi Grazing, and Ahom Gaon area were subjected to greater erosion and hence the basin is to be provided adequate soil conservation scheme. In conclusion, the flood control measure adopted so far have provided reasonable degree of protection to the basin area but to check further flood hazards some action should be taken as earliest as possible. The suggestions incorporated here may help the people of this area to a great extent. Both short term and long term measures need to be thought of, in the light of this work to mitigate to the best possible extent the problems faced by the flood-prone areas of the study area and surrounding areas. References Barman, R. (1986), Geomorphology of Kamrup District, Amorphometric and Quantitative Analysis, Unpublished, Ph.D. Thesis, Geography Dept. Gauhati University, Assam, India. pp. 245–246. Bora, A.K. and Goswami, D.C. (1988b), “Some Observations on Flow Characteristics of the Jia Bharali River in Assam”,
Indian Journal of Landscape System and Ecological Studies, Calcutta, Vol. II, No. 2, pp. 103–111. Bora, A.K. and Roy, L. (1998), “A Study on Hydrological Behavior of the Gabharu River in Assam”, Gauhati University Journal of Science, Golden Jubilee, pp 19–29. Boruah, S. and Biswas, S.P. (2000), “Fisheries Ecology of the North Eastern Himalaya with Special Reference to the Brahmaputra”, River. Ecol., Vol. 16, pp. 39–50. Brierley, G.J. and Fryirs, K.A. (2005), Geomorphology and River Management Application of the River Styles Framework, Blackwell Publishing, pp. 320–330. Dutta, S., Medhi, H., Karmakar, T. and Sarma, M. (2010), Probabilistic Flood Inundation Maps for Lakhimpur District, Assam using Hydro Informatics Concept. Dept. of Civil Engineering, I.I.T. Guwahati, pp. 17–23. Gogoi, B. (1997), “Impact of Flood and Bank Erosion on Population Migration”, Flood Hazards in Assam and Their Impact on Human Occupance, Kaustubh Prakashan, Dibrugarh, pp. 155–164. Gogoi, B. (2008), “Impact of Flood on Human Occupance in the Sadiya Region”, Flood Hazards in Assam and Their Impact on Human Occupance, Kaustubh Prakashan, Dibrugarh, pp. 145–149. Horton, R.E. (1932), “Drainage Basin Characteristics”, Trans. Amer. Geophys. Union., Vol. 14, pp. 350–61. Horton, R.E. (1945), “Erosional Development of Streams and their Drainage Basins: Hydrological Approach to Quantitative Geomorphology”, Bulletin of the Geological Society of America, Vol. 56, pp. 275–370. Joshi, R.C. and Rawat, A.S. (2004), “Morphotectonic Observation: A Case Study from the outer Himalaya along Main Boundary Thrust in Between Ranga and Dikrong River, Arunachal Pradesh”, A.U. Research Journal, Vol. 7(2), 2004, pp. 35–46. Pandey, A. Dabral, P.P., Chowdary, V.M. and Yadav, N.K. (2008), “Landslide Hazard Zonation using Remote Sensing and GIS: A Case Study of Dikrong River basin, Arunach al Pradesh, India”, Environ Geol, Vol. 54, pp 1517–1529. Taher, M. (1975), “Regional Basis for Agricultural Planning in the Brahmaputra Valley”, The North Eastern Geographer, Vol. 7, No. 1&2, pp. 10–11.

54
7 Ecotourism, Livelihood and Resource Management: A Case in Pakhui-Nameri Tiger Reserve of Assam and Arunachal Pradesh
Niranjan Das Department of Business Administration,
Tezpur University, Napaam–784028, Sonitpur, Assam, India E-mail: [email protected]
1. Introduction The Nameri National Park and its adjacent Pakhui Wildlife Sanctuary along with its adjoining areas of Assam and Arunachal Pradesh have been selected for the current research. Livelihood comprises the capabilities, assets (including both material and social resources) and activities required as means of living. A livelihood is sustainable when it can cope with and recover from stresses and shocks and maintain or enhance its capabilities and assets both now and in the future, while not undermining the natural resource base. Local people have complex livelihood strategies (due to multiple land uses and diversification of risks across several activities), which are affected by ecotourism in many different ways, positively and negatively, directly and indirectly. Different people have different livelihood priorities and different types of community tourism ventures have different kinds of impacts. Community-based ecotourism (CBET) has become a popular tool for biodiversity conservation; based on the principle that biodiversity must give for itself by generating economic benefits, particularly, for local people. It is popular, as a means of supporting biodiversity conservation, particularly in developing countries. The premise is that ecotourism depends on maintaining attractive natural landscapes and a rich flora and fauna; therefore, helping communities earn money from ecotourism provides both, an incentive for conservation and an economic alternative, to destructive activities. The aim of the present research is to highlight the livelihood types pursued by the local people in the area after inception of Assam Bhorelli Anglers and Conservation Association (ABACA), who introduced the ecotourism initiatives in the park since 1956. An assessment has been made during the study to develop the area as ecotourism destination in and around Nameri National Park and Pakhui Wildlife Sanctuary utilizing its local tourism resources. Nameri National Park and Pakhui Wildlife Sanctuary is an ideal place where ecotourism can flourish best. However, there are various other factors that have to be considered and worked upon to develop ecotourism venture. These factors include active participation of host community, government as well as private entrepreneur’s initiation and to explore ecotourism resources in this region. Active involvement of local communities can also be a good source of revenue generation for livelihood challenges which in turn can lead to long-term biodiversity conservation measures. 2. Background of the Study Area Assam is a part of mega-biodiversity hotspots of the world. It also forms parts of two endemic bird areas, viz. Eastern Himalayas and Assam Plain (Choudhury, 2000). Both the protected areas (Nameri National Park and Pakhui Wildlife Sanctuary) are a part of the north bank landscape designated by WWF and also a part of Eastern Himalayan biodiversity regime rich in endemic biota of the world.

Ecotourism, Livelihood and Resource Management: A Case in Pakhui-Nameri Tiger Reserve of Assam and Arunachal Pradesh
55
The Nameri National Park of Assam is located in 26o50/48//N to 27o03/43//N Latitudes and 92o39/E to 92o59/E Longitudes covering an area of 200 km2 in the northern bank of river Brahmaputra, in Sonitpur district of Assam. Nameri is covered by tropical evergreen, semi-evergreen, moist deciduous forests with cane and bamboo brakes and narrow stripes of open grassland along rivers. Grassland comprises of less than 10% of the total area of the park while the semi-evergreen and moist deciduous species dominate the area. The park is enriched with threatened plants and animal species under International Union for Conservation of Natures (IUCN) Red List categories (Barua et al. 1999). Parts of the area were declared as Naduar Reserve Forest (Present East Buffer) in 1876 and Nameri Wildlife Sanctuary in the year 1985. The Nameri National Park was formed in the year 1998. Similarly, Pakhui Wildlife Sanctuary adjoins Nameri National Park of Assam. The terrain of Pakhui Wildlife Sanctuary is undulating and hilly. The altitude ranges from 150 metre to over 2000 metre above sea level. The area was declared as a Game Sanctuary in 1977. Later, it was declared as Pakhui Wildlife Sanctuary in 2001, and was finally declared, as Pakhui-Nameri Tiger Reserve on April 23, 2002 as the twenty sixth tiger reserve under Project Tiger of the National Tiger Conservation Authority. During the British period this area was designated as Game Sanctuary for hunting of animals. Presently no village is situated inside the core area of both the parks. There are four forest villages and one agriculture farming corporation has been situated in the west buffer of the park. Similarly five forest villages are located in the east buffer. There is a total of eighteen revenue villages situated outside but along the southern and south-western boundary of both the protected area. The villagers in the south buffer area are dependent on the park for sustaenance of their livelihood. They have been traditionally engaged in collection of NTFP (non timber forest produce) and grazing of livestock. A sizable proportion of local populace is also engaged in ecotourism activities as tour guide, providing local accommodation selling handicraft, engaging in the eco-camp, etc for their livelihood (Bhattacharya, 2003). The Assam (Bhorelli) Angling & Conservation Association (ABACA) in the park has been organizing white water rafting with the assistance and cooperation of the Department of Sports; Department of Tourism and Department of Environment and Forest, Government of Assam. 3. Review of Literature Studies on tourism and livelihood are of recent origin and the available literature/ records in this field are rather few. However, much of the studies done earlier are mostly confined to the areas outside India. Such studies are inherent in analysis pertaining to tourism industry itself. Gossling (1999) suggests that nature-based tourism is derived from the existence of natural areas with no specific concern for their protection, whereas ecotourism is concerned with the protection of natural areas (Naidoo, 2005). Typical services offered at ecotourism destinations might include local arts and crafts, guided hikes and wildlife viewing, publications, natural history lectures, photography, and local food. Revenues are generated from fees for these services, as well as natural area user fees and local expenditures for hotels, restaurants and bars, and transportation services (Seidl 1994). Orams (1995) argues that ecotourism must provide more than mere enjoyment; it must foster changes in the attitudes and behaviour of tourists about the protection of natural resources. Researchers also have discussed ecotourism in the context of the tourism life cycle (Butler 1980). Measuring the economic impacts of tourism and outdoor recreation has received considerable attention in academic literature (Eadington and Redman 1991, Frederick 1992). Economic impacts generally are examined within a cost benefit framework (Dixon and Sherman 1990, Walsh 1986) with the benefits measured by using expenditure surveys combined with input-output analysis (Briassoulis 1991, Propst 1985). Travel cost or contingent valuation methods also are commonly used to place dollar values on natural areas or marginal changes in their characteristics (Bostedt

National Seminar on Management of Natural Resources for Sustainable Development: Challenges and Opportunities
56
and Mattsson 1995, Durojaiye and Ikpi 1988, Echeverria and others 1995, Forster 1989, Lee 1997, Lee and others 1998, Loomis 1989, Moran 1994). Measuring economic impacts or values derived from tourism necessitates differentiating between the economic benefits derived from the various forms of tourism. One of the problems in determining the economic impact of ecotourism, for example, knows what is meant by the term (Tisdell 1996). Differentiating between economic benefits derived from ecotourism and those derived from general tourism can depend on how each is defined (Goodwin, 2002). When ecotourism is defined less restrictively, as simply tourism derived from nature preserves, parks, or refugees, researchers tend to assume that all economic impacts derived from those natural areas are ecotourism-derived impacts (Boo 1990). Economic impacts are measured by using expenditure surveys of tourists visiting those areas. Tourism expenditures assumed to be generated by a particular natural area may be reported for a well-defined geographic area (English 1992). An alternative to surveying tourists is surveying local businesses (Kangas and others 1995) and residents (Lindberg and others 1996). When ecotourism is defined more restrictively and confined to particular types of tourism activity or particular types of tourists, researchers attempt to segment tourists into the categories of ecotourist and general tourist. 4. Ethnic Identities of Local Population Forest villages located in the area acquire culture of different ethnic groups. The Mising, Garo, Karbi, Bodo, Napali, Adivasi and other groups of indigenous community resides in the south buffer area. The Mising people, a riverine community resides in the forest villages of both, buffers as well as in the revenue villages of south buffer. There are two villages of native Mising community in the area. They are tribal people with their own identity as ‘Pile dwellers’ (house with elevated floor from the ground on posts) made of wooden or bamboo posts, floor and walls and thatch or palm leaf roof covering. Rearing cattle for agriculture farming, poultry and pigs are the main sources of livelihood of the community. People belong to the community weave their clothes in their traditional loom for their dresses as well for selling them to earn. Traditionally, Misings are good in bamboo and cane crafts. The Karbi people also ‘Pile dwellers’. But now-a-days they have constructed their house on plinth level (modified house). They also rear cattle for their agricultural purpose. Karbi people rear poultry and pigs for their economic benefit. Weaving of clothes in their traditional loom is a long drawn process of the communities’ tradition, but their population is limited in the forest villages. There is one Garo forest village in the west buffer. Earlier they were ‘Pile dwellers’. But at present they are gradually shifting to plinth houses. They also cultivate in the paddy field and rear cattle, poultry and pigs. They collect their agricultural implements locally. Four Bodo forest villages are situated, one each in both east and west buffers. They are having their own customs and culture. They also construct their dwelling houses mostly by locally collected building materials. Bodo people rear cattle for farming and also rear poultry and pigs. They are good in bamboo and cane crafts. The Nepalese are traditionally cattle-rearing communities. They also cultivate their land and some of them rear poultry and pigs. They are very much dependent on the forests for rearing cattle. Nepalese are good in dairy products. The Adivasis (ex tea garden labourers) are mostly cultivators. Some of them are dependent on forests for collection of wild tubers and roots for their consumption, other household materials and implements. They work in their paddy fields or village agricultural labourer. Adivasis have their social customs and traditions of community hunting, which is now very much limited.
Ecotourism, Livelihood and Resource Management: A Case in Pakhui-Nameri Tiger Reserve of Assam and Arunachal Pradesh
57
The other communities of the locality are mostly cultivators. People also rear cattle and poultry and good in bamboo and crafts. Relationship of these people with forests is not very close as they are deprived of grazing of their cattle; collection of firewood and other agricultural implements has been stopped since constitution of the National Park. Though bamboos are locally grown but cane and thatch were collected from the forests, which are now being stopped by the park authority. All these have aggravated the people, as they do not have alternative source for their requirements. 5. Status of Economy, Land Use and Forest Resources The forest villagers mostly depend on agriculture. There is no industry nearby for employment. Most of the villagers are below poverty line and as they depend on the well-to-do households of the villages for their employment as seasonal agricultural labourer. The vocations of the villagers are limited to cottage industry, particularly, cane and bamboo crafts, carpentry etc. Some people are adopting dairy farming with the traditional system and indigenous cattle variety. Earlier, some people used to work in riverbed sand and gravel quarry in the park, but due to creation of national park the same has been stopped and the unemployment has increased. The lands in possession of the villagers are used mostly for their small homestead where they marginally grow arecanut, banana, bamboo and other vegetables. Very limited people have fuel-wood in their homesteads. The paddy lands are cultivated for one crop only due to lack of irrigation facilities. People collect their firewood and agricultural implements and house construction materials from the forests of the buffer area. Grazing is done in these areas. Seasonally, some villagers do take up cottage industry of weaving bamboo and cane crafts. The land use pattern of the locality is gradually changing by way of increasing horticulture, fishery etc. The irrigation facility and acceptance of modern agriculture improves the economic condition of the people. Due to high dependency of the people on the resources of the forests, the conservation of the park has become difficult as the community land reserved for the villagers is insufficient and has been utilized for agricultural and other developmental works. The fallow land nearby the areas has been decreasing due to encroachment. 6. Objectives The objective of the present study is: 1. To highlight the resource base of the Nameri National Park. 2. To evaluate the ecotourism impact on livelihood of the community in the park. 7. Research Methodology The present research is based on data collected between January and April 2013 using semi-structured interviews, and update using information gathered during successive local meetings. A process of triangulation was ensured whereby key informants and focus group were interviewed and different sites (e.g. homestead, ecocamp, village market, river bank and in the forest) visited. Snowball sampling procedure was used. This is a procedure where the researcher start off with one informant who in turn introduces the next person considers useful to the investigation. Interview questions touched on livelihood options, wildlife conservation, and tourist resource management. The operation of ecocamp and the management committee was also investigated. A total of 28 individuals (10 local tour guide, 6 women group, 4 boatman, 4 cultivator and 4 four forest personnel) interviewed during the visit. 8. Ecotourism Activities in the Area Protected areas have great potential for recreation and ecotourism. Recreation and ecotourism have been introduced into protected areas which have helped to reveal the ecological value and

National Seminar on Management of Natural Resources for Sustainable Development: Challenges and Opportunities
58
fragility of the area (Brechin, et al. 1991). The impression of Nameri National Park on tourists and visitors has always been associated with outdoor recreation. Despite being small in area, it has a significant array of landscape, scenic beauty and cultural variety of the communities residing near the park. This natural setting also embraces a variety of ecological habitats and various animals and plant species, essential for the development of ecotourism (Bhattacharya, 2004). As mentioned in the previous section, Nameri National Park/ Pakhui Wildlife Sanctuary and its adjoining areas are rich in culture with different communities inhabiting there. Ecotourism tries to preserve cultural integrity because human value cannot be separated from natural value. Most potential ecotourism sites are inhabited by ethnic minorities (Nepal, 2000). The principle of ‘encouraging community participation in ecotourism activities’ create income and maintain cultural identity of the host community. These communities have a deep understanding of traditional festivals, cultivation and land use customs, culinary culture, traditional lifestyle and handicrafts including historical places (Zurick, 1992). Ecotourism highly depends on the elements available in a particular tourist destination. The strength of these elements directly affects the flow of tourists into the spot (Gee, 1959). The following pleasure seeking activities attracts tourist to the area. 8.1 Rafting Rafting is one of the recreational activities available in the park’s rivers. This is usually done on whitewater or different degrees of rough water, in order to thrill and excite the riders. The development of this activity as a leisure sport has become popular since the mid-1980s.
Table 1: Rafting Graded in Jia-Bhoreli Rivers Grade: I Small, easy waves; mainly flat waterGrade: II Mainly clear passages; some areas of difficultyGrade: III Difficult passages; narrow in places and with high wavesSource: Association of Adventure Sports, India–2003 The Jia-Bhoreli River has been included to Nameri National Park and is well looked after by the Department of Forest (Wildlife), Government of Assam. A stretch of 20 km in length of Jia-Bhoreli River from 16th milepoint to Potasali is included for rafting. Tourists may avail a shorter distance in this route starting from other rafting points from 13th mile area. Rafting period starts from 1st November to 31st March. It is a popular tourist activity in the park which is preferred by 10.47% and 9% of domestic foreign tourist respectively (Dept. of Forest, 2012). A large number of boatmen are engaged from amongst the local people, for rafting who also earn for their livelihood from this activity.
8.2 Trekking Trekking is one of the best ways to view the landscape of a particular tourist destination. Nameri National Park and adjacent Pakhui Wildlife Sanctuary offers some of the most awesome trekking opportunities to the tourists. It has breathtaking trekking trails all across, from north to south and from east to west. The trekking season in the park starts from late spring to late winter and covers almost the whole year. The park also offers a considerable bonanza for trekkers that range from moderate to strenuous trekking which takes about 3 to 5 days. Though the season starts from October to March, the ideal trekking time is between the months of October to May. However, trekking can also be done in the summer months. This activity attracted 4.76% of and 4% of domestic and foreign tourists (Dept. of Forest, 2012).

Ecotourism, Livelihood and Resource Management: A Case in Pakhui-Nameri Tiger Reserve of Assam and Arunachal Pradesh
59
Table 2: Potential Trekking Route in Nameri National Park
Trekking Route Distances Duration (Day) Altitude (Meters)Bhalukpung-Confluence of Diji River (trekking along the bed of the Diji River (14 km.) Rafting along Jia-Bhorelli to Bhalukpung-26 km. 53 3 130 to 270Bhalukpung-confluence of Nameri river (trekking along the bed of the Nameri River (12 km)-confluence of Papu river rafting along Jia-Bhorelli upto Bhalukpung (53km.). 102 5 130 to 263Potasali-Confluence of Khari River (trekking along the bed of the Khari river-(8km.)-Trekking along the bed of the Jia-Bhorelli River to Sijussa camp via Pakhui wildlife sanctuary. 36 2 96 to 113Potasali-Trekking along the bank of Jia-Bhorelli to Owbari, Morisuti and Koroibari to Rangajan Chapori to Potasali camp. 17 1 87 to 103Sijussa-trekking along the bed of the Bogijuli Nala (14km.) Confluence of Bogijuli Nala to Potasali camp (23 km.). 46 3 110 to 230Tourists rout approximately 17 km. length from Seijosa inside Pakhui Wildlife Sanctuary to Khari River via Bogijuli camp. 18 1 79 to 104
Source: SOI Topographical Maps and Researcher field visits 2011-2012. 8.3 Elephant Safari Elephant safari helps the visitors to travel through difficult terrains and also provides suitable mode of wildlife viewing in the inaccessible part of the area. Elephant safari is ideal in and around the wild regions where riding the elephant can give easy access for viewing the wildlife. In the area elephant safari is the best option for exploring the wildlife distributed all along the area, about 9.84% domestic and 13% foreign tourists enjoyed the trails (Dept. of Forest, 2012). It offers an opportunity to view some of the rare and endangered animals occasionally migrated from the adjacent Pakhui Wildlife Sanctuaries of Arunachal Pradesh. 8.4 Bird Watching The area is famous for avian species. The most active time of the year for birding is during the spring, when a large variety of birds are seen. On these occasions, a large number of birds travel north or south to wintering or nesting locations (Choudhury, 2000). Certain locations in the park such as the forest, rivers and wetlands may be favoured according to the position and season. Nameri National Park/ Pakhui Wildlife Sanctuary is gifted with more than 337 species (Baruah, 1999) of both resident and migratory birds. The tourist can enjoy a long season of bird watching during winter (November to March). During the season, 21% and 13% of foreign and domestic tourist enjoy bird watching (Dept. of Forest, 2012).
Table 3: Major Bird Watching Areas of Nameri National Park
Locality Resident Bird MigratoryBird
Grassland Bird Hill Bird in Winter
Hill Bird Round the Year Potasali (Watch tower) a a a a naKurua Beel a a na a aBorghulli Beel a a a a naMagurmari beel a a na a naBalipung area a a a a naAlong the bed of the Jia-Bhoreli river a a a na naNear Bogijuli Nala na a a a a
Source: Check List of Birds of Nameri National Park prepared by Pankaj Sarmah and Mann Baruah, 1999 and Authors, field visit, 2006-2007 (a: available, na: not-available) 9. Impact of Ecotourism The Assam (Bhorelli) Anglers and Conservation Association (ABACA) is a joint venture between the local community and the tourism entrepreneur. Since its inception in 1956, ABACA has contributed to livelihood opportunities and natural resource management initiatives to the local community in
National Seminar on Management of Natural Resources for Sustainable Development: Challenges and Opportunities
60
Nameri National Park in different way. The community has been benefitting from a fee that is paid by ABACA for the lease of land. About 2 hectare of land have been leased at a fee of Rs. 94,000 per year. Over and above, the community receives amounts ranging between Rs. 3000 per year as bed charges (local accommodation) paid by the tourist who visits the area. The community uses these earnings to support different community livelihood initiatives such as the provide money to self-help group, construction of schools, community houses, roads and expanses for community festivals. Eco-camp provides eco-friendly accommodation in the park and pays monthly salaries to 18 members of staff, drawn from the local community who serve at the camp. The workers include security guards, camp attendants, maintenance and clerical staff as well as cultural troops (performing local dances in the camp during tourist seasons) from nearby villages. More and more local people are complementing their sources of income with payments received as casual workers. Upto 15 casual workers are absorbed by ecocamp, especially during construction and repairs. Individual households benefit from the sale of firewood and charcoal and the different organic food stuff that are sold at the camps and tourist. Earnings received from ecotourism are used in various ways, including purchase of livestock; land as well other necessary item, initiatives that are contributing towards livelihood in general and local food security in specific. There are limitations with these gains, which include dominance by a few households and unwillingness of the private developer to rely on locally available alternative materials and goods. Most people lack exposure to the outside world. It is found that there is a lack of awareness among the local people on how tourist demand dictates the type of goods and materials purchased at the camp. The community reside nearby the park is benefitting from improved infrastructural systems. These include over 8 km earth road network that has been constructed by the forest department in the conservation area and outside. The all-weather road has improved community accesses to outside markets. To increase the resident wild life and bird, the community constructed five small barrages on the tributaries and planted fruit bearing trees and trees which are most favourable for wildlife habitation. These water sources and plantations have reduced competition for grazing resources between livestock and wildlife. The camp authority allowed to the community to use grazing, especially during drought. Access to the new water sources has reduced community vulnerability to drought-related disasters. Community contact to the outside world has improved following access to electricity and telephone line provided by ecocamp authority and forest department. More benefits to the local community come in a form of contribution from the Department of Forest and Environment, Government of Assam. The Forest Department has been involved in the establishment of ABACA and also facilitated negotiations between the community and ABACA through workshops and exposure tours, helped to build trust for the project among the members of the community. Amounts are paid to local people in the area who have livestock and have agreed to share grazing resources with wildlife. This contribution is meant to offset the costs incurred by the communities for living with wildlife and build trust and ownership of wildlife resources among the local people. The positive impact of this contribution, notwithstanding, the beneficiaries have expressed disappointment over this amount, pointing out that it is too little compared with the costs incurred. This is partly associated with poor negotiation skills by the ABACA coupled with limited knowledge of market value of resources involved and the implications of the lease agreement on the local economy. The major investment of ecotourism-related earnings is used for livelihood because there is no other foremost means of income generation.

Ecotourism, Livelihood and Resource Management: A Case in Pakhui-Nameri Tiger Reserve of Assam and Arunachal Pradesh
61
The affected individuals called for diversification of the investment of wildlife-related earnings beyond community projects. The women’s groups have, for instance, approached the ABACA for funding to improve their small-scale business opening self-help group. Awareness and mobilization workshops that were funded by Department of Forest and ABACA have improved the capacity of individuals working in different sectors. The members have been empowered through exposure tours organized to surrounding areas. Selected members were exposed to different ecotourism complementary technologies in the other parts of the states like Kaziranga, Dibru-Saikhowa, Mazuli River Island and Manas National Park etc. Tour participants identified organic fodder production, handicraft, local cuisine, eco-friendly accommodation and beekeeping as ecotourism complementary packages suitable to the local setting and conditions. A proposal has been developed and resources are being mobilized to implement selected packages. Following exposure tours and consultative meetings, local members have identified various forums for sharing information on technological innovations and possible funding. Tour participants have been instrumental in facilitating negotiations on wildlife-related conflicts, using experience gained as they listened to narration by host institutions during the tours. Despite the different gains, reports from consultative meetings point to negative effects of ecotourism on livelihood. It is clear, for instance, that only a few members and/ or institutions benefit. While the ‘empowered few’ help to mobilize locally available resources and create awareness among the rest of the members to participate in ecotourism initiatives, the same members marginalize the rest of the community in benefiting from ecotourism related gains. 10. Impacts on Natural Resource Management Impacts on natural resource management on ecotourism initiatives have made little positive impact on natural resource management. This is primarily because of lack of a national policy to integrate the initiatives with resource management and conservation. Conservation is still being influenced by the premise that wildlife needs to be protected to avoid overutilization and/ or through competition with livestock. Despite this orthodox practice, there is evidence that the numbers of wildlife (including charismatic species) in the park have either remained stable or increased. The number of White Winged Wood Duck (Cairina scutulata) stands at 424, having risen from almost few at the time of project inception in 1981. Elephant, bird species and bush-loving wildlife have more than doubled following the increase in biomass and anti-poaching campaigns spearheaded by community reside nearby the park. ABACA has plans to introduce certain floral species to meet ‘customer demand’. Following exposure tours, the community has expressed interest to introduce an orchid sanctuary, vermin-composting plant and an organic orchard. Through exposure tours and consultative meetings, the community member has been sensitized to the need to reduce livestock numbers. The membership consists of individuals who are promoting cultivation along buffers in the Nameri National Park and Pakhui Wildlife Sanctuary. To reduce pressure on natural pastures and dependence on forest, most of these members use complementary pastures such as nappier grass and maize stalks. Improved maintenance of community pond, dependence on piped water and the construction of private water pans/ barrages over tributaries have reduced competition between livestock and wildlife over water resources. Consequently, formerly degraded sites around community watering points are regenerated. Pressure on grazing resources has also reduced following the construction of ponds and development of grassland under eco-restoration programme in the conservation area funded by Department of Forest and Environment, Government of Assam and Arunachal Pradesh. The different interventions have reduced competition on resources available for livestock, especially, from resident wildlife species. Abject poverty, improved contact with the outside world and increased numbers of resident wildlife have contributed to poaching. This situation leads to
National Seminar on Management of Natural Resources for Sustainable Development: Challenges and Opportunities
62
either the community losing valuable sources of income or the numbers of the specific animal species exceeding the ecological limit leading to environmental degradation. Respondents confirmed that poaching was caused by individuals who feel that they do not own ecotourism initiatives. In a way, this reaction reflects a problem that ecotourism has either failed to address or one that is beyond its scope in the context of existing institutional frameworks. Measures in place to restrain wildlife poaching/ interference have met with resistance. They include anti-poaching patrols by forest personnel, the local administration and the community. Following such encounters with poachers, the community has become reluctant to perform their duties leading to increased wildlife molestation outside the protected area. The situation is worsened by low motivation due to poor remuneration, and delay in payment of salaries. Salaries for local people engaged in protection of the park are paid by the Department of Forest and Environment, Government of Assam and Arunachal Pradesh. 11. Conclusion This paper has established how pilot ecotourism initiatives under the Assam (Bhorelli) Angling and Conservation Association (ABECA) have changed local practices and attitudes towards wildlife and natural resources. The impacts that include accumulation of savings by individuals are leading to social differentiation beyond traditional realms further marginalizing the already impoverished groups/individuals at the expense of the elite. Young well-to-do local who are increasingly controlling power in the community following their exposure to the outside world and the wealth they have accumulated, are eroding long-established settings. This new form of marginalization have to be addressed, especially through empowerment of individuals, and are motivated to actively participate in emerging livelihood options. References Barua, M. and Sharma, P. (1999), “Occurrence of the Hill Blue Flycatcher (Cyornis Banyumas), in Nameri National Park, Assam”, Newsletter for Birdwatchers, Vol. 39(4), pp. 61–62. Bhattacharya, P. (2003), “Ecotourism as Means of Conserving Wildlife Sanctuaries and National Parks of Assam”, in P.P. Baruah (eds.), Proc. Biodiversity of Eastern Himalayan Protected Areas, Baniprokash Mudranee, Guwahati- Vol. 21, pp. 189–197. Bhattacharya, P. (2004), “Tourist Demand and Potentiality of Ecotourism”, In: Tourism in Assam, Trend and Potentialities, Bani Mandir, Guwahati, pp. 186–198. Boo, Elizabeth (1990), Ecotourism: The Potential Pitfalls, Country Case Studies. Washington, DC: World Wildlife Fund. Vol. 2, p. 173. Bostedt, Goran and Mattsson, Leif (1995), “The Value of Forests for Tourism in Sweden”, Annals of Tourism Research, Vol. 22, pp. 671–680. Brechin, S.R., P.C. West., D. Harmon and Kutay, K. (1991), “Resident Peoples and Protected Areas: A Framework for Enquiry”, In P.C. West and S.R. Brechin. (eds.), Resident Peoples and National Parks. Tucson: University of Arizona Press, pp. 5–30. Briassoulis, Helen (1991), “Methodological Issues: Tourism Input-output Analysis”, Annals of Tourism Research. Vol. 18, pp. 485–495. Butler, R.W. (1980), “The Concept of a Tourist Area Cycle of Evolution: Implications for Management of Resources”,
Canadian Geographer, Vol. 24, pp. 5–12. Chase, Lisa C., Lee, David R., Schulze, William D. and Anderson, Deborah J. (1998), “Ecotourism Demand and Differential Pricing of National Park Access in Costa Rica”, Land Economics, Vol. 74, pp. 466–482. Choudhury, A. (2000), The Birds of Assam, Gibbon Books & WWF-India, North-East Regional Office, Guwahati, p. 222. Department of Forest and Environment Report, Western Assam Wildlife Division-Sonitpur (Nameri Wildlife Range) Govt. of Assam-2012. Dixon, John A. and Sherman, Paul B. (1990), Economics of Protected Areas: A New Look at Benefits and Costs, Washington, DC: Island Press, p. 234. Eadington, William R. and Redman, Milton (1991), “Economics and Tourism”, Annals of Tourism Research, Vol. 18, pp. 41–56. Echeverria, Jaime, Hanrahan, Michael and Solorzano, Raul (1995), “Valuation of Non-priced Amenities Provided by the Biological Resources within the Monteverde Cloud Forest Preserve, Costa Rica”, Ecological Economics, Vol. 13, pp. 43–52.

Ecotourism, Livelihood and Resource Management: A Case in Pakhui-Nameri Tiger Reserve of Assam and Arunachal Pradesh
63
Forster, Bruce A. (1989), “Valuing Outdoor Recreational Activity: A Methodological Survey”, Journal of Leisure Research, Vol. 21, pp. 181–201. Frederick, Martha (1992), “Tourism as a Rural Development Tool: An Exploration of the Literature”, Bibliographies and Literature of Agriculture, No. 122. Washington, DC: U.S. Department of Agriculture, Economic Research Service, Agriculture and Rural Economy Division, p. 33.. Gee, E.P. (1959), “The Management of Indian Wildlife Sanctuaries and National Parks”, Journal of Bombay Natural History Societies, Vol. 52, pp. 717–734. Goodwin, H. (2002), “Local Community Involvement in Tourism around National Parks: Opportunities and Constraints”, Current Issues in Tourism, Vol. 5, pp. 338–360. Gossling, S. (1999), “Ecotourism: A Means to Safeguard Biodiversity and Ecosystem Functions?”, Ecological Economics, Vol. 29, pp. 303–320. Kangas, Patrick, Save, Mary and Shave, Paul (1995), “Economics of an Ecotourism Operation in Belize”, Environmental Management, Vol. 19, pp. 669–673. Laarman, Jan G. and Gregersen, Hans M. (1996), “Pricing Policy in Nature-based Tourism”, Tourism Management, Vol. 17, pp. 247–254. Lee, Choong-Ki (1997), “Valuation of Nature-based Tourism Resources using Dichotomous Choice Contingent Valuation Method”, Tourism Management, Vol. 18, pp. 587–591. Lee, Choong-Ki, Lee, Ju-Hee and Han, Sang-Yoel (1998), “Measuring the Economic Value of Ecotourism Resources: The Case of South Korea”, Journal of Travel Research, Vol. 36, pp. 40–47. Lindberg, K. (1996), The Economic Impacts of Ecotourism. Lecture, Charles Sturt Universtity, http:// www.ecotourism.ee/ oko/ kreg.html Accessed 17th April 2013. Loomis, John B. (1989), “Estimating the Economic Activity and Value from Public Parks and Outdoor Recreation Areas in California”, Journal of Park and Recreation Administration, Vol. 7, pp. 56–65. Moran, Dominic (1994), “Contingent Valuation and Biodiversity: Measuring the user Surplus of Kenyan Protected Areas”, Biodiversity and Conservation, Vol. 3, pp. 663–684. Naidoo, R. and Adamowicz, W.L. (2005), “Biodiversity and Nature-based Tourism at Forest Reserves in Uganda”, Environment and Development Economics, Vol. 10, pp. 159–178. Nepal, S.K. (2000), “Tourism, National Parks and Local Communities”, In Tourism and National Parks: Issues and Implications. R. Butler and Boyd (eds). London John Wiley & Sons Ltd., pp. 73–94. Orams, Mark B. (1995), “Towards a more Desirable form of Ecotourism”, Tourism Management, Vol. 16, pp. 3–8. Propst, Dennis B. comp. (1985), “Assessing the Economic Impacts of Recreation and Tourism”, In: Proceedings of a conference. Ashville, NC: Michigan State University, Southeastern Forest Experiment Station, p. 64. Seidl, Andrew (1994), “Ecotourism: Reworking the Concepts of Supply and Demand”, Trends, Vol. 31, pp. 39–45. Tisdell, Clem. (1996), “Ecotourism, Economics and the Environment: Observations from China”, Journal of Travel Research, Vol. 34, pp. 11–19. Van Sickle, Kerry and Eagles, Paul F.J. (1998), “Budgets, Pricing Policies and User Fees in Canadian Parks’ Tourism”, Tourism Management, Vol. 19, pp. 225–235. Walsh, Richard G. (1986), Recreation Economic Decisions: Comparing Benefits and Costs. State College, PA: Venture Publishing, Inc., p. 637. Zurick, D.N. (1992), “Adventure Travel and Sustainable Tourism in the Peripheral Economy of Nepal”, Annals of the Association of American Geographers, pp. 608–628.
64
8 Using GIS Techniques for the Study of Soil Resource and its Physical Characteristics in Nasik District of Maharashtra, India
Suryawanshi D.S.1, Pagar S.D.2 and Kate A.M.1 1VWS College, Dhule (M.S.), India
2Dept. of Geography, M.V.P. Samaj’s, Arts, Science & Commerce College, Ozar (MIG), Nashik E-mail: [email protected]
1. Introduction The term is precisely used from the point of view of pedology. It is highly weathered or decomposed upper layers of the earth’s crust, which have been influenced by climate, plant growth, and micro-organism, to support plant life, can be termed as soil (Prithwish Roy, 1997).3 Every soil has its natural fertility, which differs from soil-to-soil. In the world, cropping pattern is not same; it changes from one place to another place with response to types of their soil and its characteristics. Soil is formed by certain physical, chemical and biological processes. The process of soil formation is one of the natural and continuous processes (Salunke, 2004).5 Soils come from rocks. It is a very slow, but a ceaseless process and begins simultaneously with weathering of rocks. Whereas weathering is a destructive process, soil formation is a constructive process resulting in the soil profile. At any specific location of the earth, five factors are simultaneously in operation in developing soil. These are climate, parent material, relief, plant and animal life and time. However, any soil property is a function of the collective effect of all these five soil-forming factors. The attention of some of the scientists during the early nineteenth century was turned to investigations on the physical condition of the soil. Davy in England and Schubler in Germany recognized the importance of physical properties of soil in plant growth. In the latter half of the nineteenth century, Wolly in Germany and King and Hilgard in America further extended these studies in an attempt to unravel the relation between physical properties of soil and crop production. Wollny studied the influence of physical properties on soil heat, soil air, percolation of water in soil and availability of water to plants. He obtained information of fundamental importance that proved to be valuable in later researches. 2. Study Region Nasik district is situated partly in the Tapi and upper Godavari basin. It lies between 19° 3‘ to 20° 53‘ north latitude and 73°15’ to 75°16’ east longitude. The location of the study area is shown in Fig. 1.1. Nasik district has an area of 15530 sq. km and population of 49,93,796, as per the 2011 census. The 15 tehsils and 66 revenue circles are located in the Nasik district. The main system of hill is the sahyadries, which runs north-south in the western portion of the district. From the main Sahyadrian range, three prominent spurs stretch out to the east. In the extreme north is Selbari range, which approximately forms the boundary between Nasik and Dhule district. The average annual rainfall of the district as a whole is 1034.5 mm. The rainfall, in general, decreases from west to east. The summer season is moderately hot and the temperature varies from 36°C to 43°C. The air is humid during the monsoon season and is generally dry during the rest of the year.

Using GIS Techniques for the Study of Soil Resource and its Physical Characteristics in Nasik District of Maharashtra, India
65
3. Objectives The specific objectives of the present paper are as follows: 1. To explain the formation, profile and testing of soil in the study region. 2. To find out the physical characteristics of soil and their distribution in Nasik district. 3. To search the cause–effect soil characteristics in the district. 4. Materials and Methods The primary data regarding characteristics of soils were collected with the help of their different samples from the study region. For this, randomly each 66 soil samples were collected from 15 tehsils of the study region and tested in the laboratory. The inaccessible data is collected from interviews of farmers of the Nasik district with the help of structural questionaire. These data are collected from personal study visit. Secondary data is obtained from District Gazetteer, Annual Socio-economic Review, and Land Revenue Department. The topographical information is gathered from Survey of India’s Toposheets. Laboratory work includes preparation of base-map. The report about characteristics of soil is prepared with the help of their laboratory test. Data is processed and represented with the help of various maps. A Geographical Information System (GIS) technique is also used to prepare maps of the study region. For that Autodesk Map 2004, Ilwis 3.7 and Arc View 3.2 are used for preparing chloropleth, isopleths and point maps for the study region.
Fig. 1: Nashik District: Location Map

National Seminar on Management of Natural Resources for Sustainable Development: Challenges and Opportunities
66
5. Results & Discussion 5.1 Soil Formation The kind of soil that develops partly depends upon the kind of the rock present. Granite is slow to weathering and soils developed from it are usually not very productive. Limestones in the parent rock develop a dark coloured soil of greater productivity. Sandy soil of low fertility develops from sandstone, and silt loam soil of low productive potential is formed from shale. The acid igneous rocks and sandstones give rise to coarse sandy soils with low base status. Climate influences soil formation largely through rainfall and temperature. High temperature and high humidity accelerate the chemical withering of rocks. Vegetative matter decomposes at a faster rate under these conditions to provide organic matter and humus to soil. Rainfall affects percolation and leaching, which in turn affects soil formation. The rainwater that enters into the soil and starts flowing, carries loose, unconsolidated soil particles. Down the slope, certain nutrients get dissolved in this rainwater and thus get removed from the soil. In the mountains and hilly regions, angle of slope is always high which results in removal of soil particles. The soils in this region are coarse, thin, and dry. In the plain region, there is no perceptible slope. Plant exerts its main influence on the soil formation through the amount and nature of the organic matter, which is added to the soil. Soil developed under forest vegetation has more horizons, than the soil developed under grass vegetation. Bacteria, fungi and many birds and other animals are constantly a part of the environment during soil formation. Burrowing animals, rodents, earthworms, ants and termites, when present in large numbers are highly important in the soil formation. They interfere with the weathering processes, which should have normally resulted in the distinct layer or horizon differentiation. Mature soil is formed due to principal factors acting for longer period than in young soils. Sometimes, the longer period soil remains young. 5.2 Soil profile Soil is formed out of many horizontal layers arranged one below the other. this is called soil profile. The layers are called horizons. Soil profile is vertical section of the soil as viewed from top layer to the bedrock below. Soil is formed by five main horizons (Pawar, 2005).2 They are indicated in Fig. No. 2. 5.2.1. ‘O’ Horizon It is the top soil, very rich in organic matter content, dark in the colour and of the light texture marked by intense biological activity. This horizon is divided into two parts. O1 is the upper layer formed of the fresh fallen dead leaves, twigs, barks, flowers, fruits, and animal’s excreta. O2 horizon contains humus. 5.2.2. ‘A’ Horizon It is the zone of alleviation or leaching. In this layer, humus mixes with mineral particles. It is divided into A1, A2, and A3

Using GIS Techniques for the Study of Soil Resource and its Physical Characteristics in Nasik District of Maharashtra, India
67
Soil Profile
Fig. 2: Soil Profile
5.2.3. ‘B’ Horizon This horizon forms the sub-soil and contains iron and aluminum compounds with clay and humus. It is again divided into three sub-horizon. B1 is the transitional layer between A and B. The B2 layer shows maximum accumulation of silicates, clay, mineral and organic matters. 5.2.4. ‘C’ Horizon This is mineral horizon containing incompletely weathered large masses of rocks. It consists of CaCO3 and CaSO4. Long roots of big plants reach this horizon. 5.3 Soil Testing For understanding the nature and characteristics of soil, testing is very essential. Through such testing, it is possible to evaluate the quality of soil. Soil evaluation includes physical as well chemical condition of soil. Soil testing result provides basic information on the supplying capacity of soil. The soil test is a process by which elements are chemically removed from the soil and measured for their plant available content within the sample. It is a process of evaluating soil quality in the laboratory. Meaning of soil testing is not the same for both: the farmer and soil scientist (Deshmukh, 1999)1 As for the farmers, soil testing is concerned with collection of a soil sample, sending it to a laboratory and receiving an evaluation of fertility together with fertilizer. To the soil scientist, soil testing pertains to the process of quantitatively relating all parameters to know soil fertility information influencing plant growth to soil properties that can be measured in the laboratory. 5.4 Physical Characteristics of Oil For getting information about the physical characteristics of soil of the Nasik district, four physical parameters were selected. They were bulk density, water-holding capacity, pore space and volume expansion 5.4.1. Soil Density Density represents weight (mass) per unit volume of substance (Sahai, 2004).4 It means density of soil is the mass per unit volume. Density of soil varies greatly depending upon the degree of weathering. Soil density is expressed into two terms. Weight per unit volume of the solid portion of

National Seminar on Management of Natural Resources for Sustainable Development: Challenges and Opportunities
68
soil is called particle density. Generally, particle density of normal soil is 2.65 gram/cm3. In all tehsils of the study area, it is from 0.80 to 1.94 gram/cm3. The particle density is higher, if large amount of heavy minerals are present in the soil. Dry weight of unit volume of soil inclusive of pore spaces is called bulk density. It is always smaller than its particle density. Bulk density is of greater importance than particle density in understanding the physical behaviour of soil. Generally, soil with low bulk density has favourable physical condition. The bulk density of soil of the study area can be classified into three classes. These classes are shown in the Table 1. Table 1: Nasik District: Soil Bulk Density-2009–10
Sr. No. Range (gm/cc)
Rating Name of Tehsil1 < 1.4 Low Nashik, Sinnar, Kalwan, Dindori, Nandgaon, Trimbak, Deola, Niphad, Peth. Igatpuri, Satana, Chandwad, Surgana and Malegaon. 2 1.4 to 1.6 Medium Yeola.3 > 6 High Nil Source: Compiled by the researcher, 2010. The first class of low bulk density has the range less than 1.4 gram/cm3. In this class, 14 tehsils are included. They are Sinnar, Niphad, Nandgaon, Nashik, Deola, Peth, Dindori, Kalwan, Trimbak, Igatpuri, Satana, Chandwad, Surgana and Malegaon. The second class of medium soil bulk density has the range from 1.4 to 1.6 gram/cm3. Such types of soil density are found in only Yeola tehsil of the study region. The last class of high soil bulk density has the range more than 1.6 gram/cm3. Such bulk density is not found in the study region. Figure 3 (A) indicates that bulk density of soil is found high in the north-western part of the study region due to solid soil particles and organic matter content available in the soil. The bulk density of soil is found low in the central, southern and north-eastern part of the study region. It is due to loose and porous soil. In the study region, generally surface soil has low bulk density, but underlying lower horizon has higher bulk density.
5.4.2. Porosity of Soil (Pore Space) The volume of soil mass that is not occupied by soil particle is known as pore space. The pore space usually occupied by air has water. In pore spaces, plant roots grow and exit. It directly controls the amount of water and air in the soil and thus indirectly controls plant growth and crop production (Sahai, 2004).4 The pore space of soil is always measured in percentage. On the basis of percentage of soil pore space, soil can be classified into three classes, which are shown in Table 2. The first class of low pore space is having range less than 40%. Such soil is found in Sinnar, Niphad, Nandgaon, Nasik, Satana, Dindori, Chandwad, Deola, Kalwan, Yeola, Trimbak and Malegaon tehsils of the study region. The second class of medium pore space has its range from 40% to 60%. The soil of Igatpuri, Surgana and Peth tehsils have this range of pore space. The last class of high soil pore space acquires range more than 60%. Such types of soils are not found in any part of the study region. The average pore space of soil in study region is 34.39%. It is the maximum in Igatpuri (43.26%), whereas it is a minimum in Trimbak (24.33%). Figure 3(B) shows that soil pore space is more in western part of the region. It is due to availability of moderate texture soil in this area. In other parts of the study region, it is varying from 35% to 43%. Table 2: Nasik District: Pore Space of Soil-2009–10
Sr.No. Range (%) Rating Name of Tehsil1 < 40 Low Sinnar, Niphad, Nandgaon, Nasik, Satana, Dindori, Chandwad, Deola, Kalwan, Malegaon, Trimbak & Yeola. 2 40 to 60 Medium Igatpuri, Surgana & Peth.3 > 60 High Nil Source: Compiled by the researcher, 2010.

Using GIS Techniques for the Study of Soil Resource and its Physical Characteristics in Nasik District of Maharashtra, India
69
5.4.3. Water Holding Capacity The capacity of soil to hold the maximum amount of total water is known as its water-holding capacity. It represents the maximum amount of water that a soil can hold against the gravity. Under this condition, as explained above, water occupies almost the whole of the pore space except large interstices, the water-holding capacity varies with the size of the water particles. Fine textured soils have a higher water holding capacity than coarse-texture soil. Plant roots cannot make use of water unless it is present within the root range. Even where there is an underground water-table, unless it is present within about 2 metre from the surface, it is not available for the use of plants. Based on soil samples analysis, soil of the study region can be classified into three classes. These classes, range, rating and tehsils of each class are shown in the Table 3. The first class of low soil has the per cent of water holding capacity is less than 30. Such soil is found in Igatpuri, Surgana and Peth tehsils of the study region. The soil has the water holding capacity from 30 per cent to 60 per cent is rated as medium soil. Such range water holding of soil is found in eleven tehsils of the study region. They are Malegaon, Sinnar, Dindori, Nandgaon, Trimbak, Niphad, Nasik, Satana, Chandwad and Deola. The last class of soil, which acquires the range of soil water holding more than 60 per cent and rated as high soil.In this class only Yeola tehsil, is included. The average water holding capacity of soil in Nasik district is 39.82 per cent. It is high in Yeola (61.7 per cent), whereas it is low in Igatpuri (23.22 per cent) tehsils of the study region. Figure No.4 (A) shows that water holding capacity of soil in the eastern part of the study region is high due to high volume expand of soil. It is low in the southeastern part of the study region due to low volume expand of soil. Table 3: Nasik District: Water-holding Capacity of Soil-2009–10
Sr. No. Range (%) Rating Name of Tehsil 1 < 30 Low Igatpuri, Surgana & Peth.2 30 to 60 Medium Nasik, Malegaon, Sinnar, Kalwan, Dindori, Nandgaon, Trimbak,Deola, Niphad, Satana and Chandwad. 3 > 60 High YeolaSource: Compiled by the researcher, 2010.
5.4.4. Volume Expand of Soil On the basic of volume expand of soil; the soil of the study region can be classified into three classes, which are shown in the Table 4. Table 4: Nasik District: Volume Expand of Soil, 2009–10
Sr. No. Range (%) Rating Name of Tehsil 1 < 5 Low Nil2 5 to 10 Medium Nil3 > 10 High Nashik, Malegaon, Sinnar, Kalwan, Dindori, Nandgaon, Trimbak, Deola, Niphad, Igatpuri, Satana, Chandwad, Surgana, Yeola and Peth. Source: Compiled by the Researcher, 2010. The first class of low soil has the range of volume expand less than 5%. But such range of volume expand of soil is not found any tehsil of the study region. The medium soil has the range from 5% to 10%. It is also not found in any tehsil of the study region. Last class of high soil has the range more than 10%. Such soil is found in all tehsils of the study region. The average soil volume expand of the Nasik District is 25.29%. It is very low in Trimbak (16.73%), whereas it is high in Niphad (42.20%) tehsil of the study region. Figure 4(B) shows that the northern and central part of the study region has high volume expand due to high water-holding capacity of soil. In the western and eastern part of the study region volume expand of soil is low due to low water-holding capacity of soil.

National Seminar on Management of Natural Resources for Sustainable Development: Challenges and Opportunities
70
6. Conclusion Generally soil refers to the loose surface off the earth as distinguished from soil rock. Soil is formed by certain physical, chemical and biological processes. The physical properties of soil are obtained from these parent materials. The thickness and texture of soil is directly influenced by the topography of the region. The soil provides all of the mineral nutrient, water and mechanical support to the crop through the root system. Therefore, soil fertility plays important role in agricultural development. For understanding the nature and characteristics of soil, testing of soil is very essential. Through such testing it is possible to evaluate the quality of soil. The average bulk density in soil of the study region is 1.36 gm/cc. The average pore space of soil in Nasik district is 34.39%. It is a minimum in Trimbak (9.12%) tehsil of the study region due to hilly and mountains region. The average water holding capacity of soil in Nasik district is 42.29%. It is high in Yeola (61.70%) due to clay and black soil, whereas it is low in Igatpuri (23.15%) tehsil due to hilly and mountain region. The average soil volume expands of the Nasik district is 25.29%. It is very low in Trimbak (16.73%), whereas it is high in Niphad (47.20%) of the study region due to presence of deep black soil. References Deshmukh, K. (1999), Agricultural Chemistry, Manasi Prakashan, Sangamner, p. 140. Kishor, Pawar (2005), Environmental Awareness, Nirali Prakashan, Pune, p. 14. Roy, Prithwish (1997), Economic Geography: A Case Study of Resources, Central Educational Enterprises, Patuatola Lane Calcutta, p. 26. Sahai V.A. (2004), Fundamentals of Soil, Kalyani Publication Ludhiana, p. 26. Suryawanshi, D.S. (2010), Geography of Tribal Agriculture, ABD. Publishers, Jaipur, pp. 71–92. Vijaya, Salunke (2004), Fundamentals of Agricultural Geography, A.V. Publishers, Nasik, pp. 35–42.

71
9 Value Addition and Marketing of NTFPs and MAPs: A Brief Study of Murlen Village, Mizoram
John Zothanzama and F. Lalnunmawia Department of Environmental Science,
Mizoram University, Aizawl, India E-mail: [email protected]
1. Introduction Non-Timber Forest Products (NTFPs) constitute the single largest determinant of maintaining livelihoods of forest fringe communities and people in the tropics. About 80% of the total populations of the developing countries use non-timber forest products (NTFPs) to meet some of their health and nutritional needs (Beer and McDermott, 1996). In India, over 50 million people are believed to be directly dependent upon NTFPs for their subsistence and cash income (NCHSE, 1987; Hegde et al., 1996). It is also estimated that currently, some US$ 90 billion worth of NTFPs are reportedly extracted worldwide annually, and about one-third of the same is consumed in the local economy without the same entering the market (Pimental et al., 1997). In India, about 200 to 300 million villagers depend on NTFPs to varying degrees (Shiva, 1995) and 1.6 million person-years of employment are generated in the NTFP sector (Gupta, 1994). Medicinal and aromatic plants (MAPs) are known to ensure the healthcare needs and enhance livelihoods of millions of rural people, however, 70%–80% of the market demand is met from the wild (Prasad and Bhattacharya 2003). As per the estimates of the World Health Organization, over 80% of the world’s population relies on traditional medicines, largely plant-based, for primary health care (WHO, 2002). The international market for herbal products is estimated to be of US$ 62 billion, and it is poised to grow to US$ 5 trillion by the year 2050 (Purohit and Vyas, 2004). The contributions of NTFPs and MAPs have a positive impact on rural livelihood. Their use is less ecologically destructive than timber harvesting. This has encouraged more intensive management of forests for such products which could contribute to both development and conservation objectives, and have thus led to initiatives to expand commercial use of NTFPs (Arnold and Perez, 2001). It has also been said of some forest regions, ‘the sustainable exploitation of non-wood forest resources is the most immediate and profitable method for integrating the use and conservation of forests’ (Browder 1992:33 and Peters, Gentry and Mendelsohn 1989). Mizoram has one of the highest forest cover in India, which is recorded as 91.58% of its total geographic area (ISFR, 2011). However, the contribution of forest products—NTFPs or MAPs—to the economy of the state of Mizoram still remains yet unaccounted. In Mizoram, some studies have been conducted on the different uses of various plant and forest species to local population (Lalramnghinglova, 1996; Jeeceelee et al., 2010; Lalremruata et al., 2010), but assessment on the value addition and market chain mechanism of majority of the species have not been documented. The objective of the paper is to study the community livelihood sources of the forest fringe village of Murlen located near Murlen National Park of Mizoram with regard to the NTFPs and MAPs and suggesting the necessary strategies for value addition and marketing to improve their livelihood using SWOC Analysis as a tool.
National Seminar on Management of Natural Resources for Sustainable Development: Challenges and Opportunities
72
2. Value Addition and Marketing A traditional source of household income and sustenance in rural areas around the world is collection and marketing of non-timber forest products (NTFPs) and medicinal and aromatic plants (MAPs). Local, regional, national, and international trade of NTFPs and MAPs can significantly contribute to community and household economies. It is important to have an extensive knowledge on NTFP and MAP collection, utilization and marketing to have a positive effect on communities and households. Basic information regarding NTFPs and MAPs is necessary for communities to make optimal use of their natural resource. Aspects of NTFP and MAP trade must be examined before they can be developed as a means to economic growth and forest resource conservation (Fox, 1994). Simple value addition options which can be easily carried out at primary collector's level can substantially enhance remuneration to the collectors. These options include washing, cleaning, drying, proper storage and grading. Through simple value adding options the forest-dependent communities can achieve higher returns and thus may not be tempted to practice destructive harvests. Adoption of these value adding options could also reduce the labour of collection and ultimately prove to be an effective tool to eliminate hard labour to women and children engaged in collection and sale of NTFPs and MAPs. Most opportunity for value addition belongs to those who process NTFPs and MAPs, increased returns to local people can be achieved by developing community-based processing industries, developing local technology for its use, and improving marketing capacity of local people (Kant, 1997). However, little is known about marketing systems and available knowledge points to their poor development, inefficiency, and inequity (Padoch, 1992). Therefore, research on local and regional markets, marketing patterns, problems, and opportunities is both timely and important. Information on NTFP ecology, market potential, and development of government and non-government institutional capacity for managing and marketing NTFPs and MAPs will be required before NTFPs can become optimally profitable and balanced with the limits of the natural resource (Everett, 1996). 3. Materials and Methods 3.1 Study Site and Socio-economic Profile Murlen village is located in the north-eastern part of Mizoram within Champhai district and close to the Chin Hills of Indo-Myanmar bordering area. It is located nearby Murlen National Park. The distance from Aizawl-via-Champhai is about 234 km towards the north-east Mizoram. The temperature varies between 8oC–28oC with an average rainfall of about 2000 mm/year. The socio-economic profile of the village and the NTFPs and MAPs was studied using Participatory Rural Appraisal (PRA) technique. 3.2 SWOC Analysis One useful tool for synthesizing the evidence gathered and drawing out recommendations is to conduct a SWOC analysis. The purpose of a SWOC analysis is to identify the main Strengths, Weaknesses, Opportunities and Constraints (or Challenges) that characterize a particular situation or entity. SWOC analysis is often used as a management tool (FAO, 2007). SWOC analysis aims to identify the key internal and external factors seen as important to achieving an objective. The factors come from within a company's unique value chain. SWOC analysis groups key pieces of information into two main categories: 1. Internal factors–the strengths and weaknesses internal to the organization or system. 2. External factors–the opportunities and Constraint (or Challenges) presented by the environment external to the organization or system.

Value Addition and Marketing of NTFPs and MAPs: A Brief Study of Murlen Village, Mizoram
73
In this paper SWOC analysis is applied on the value addition and marketing of NTFPs and MAPs at Murlen Village. 3.3 Results The information on the socio-economic profile of the village was collected through PRA method of interviews and questionnaires from the villagers and yields the following results.
Table 1: Socio-economic Condition of Murlen Village
Sl. No Particulars Numbers1 Population 607 2 Number of houses 101 3 No of BPL family 37 4 Occupation (a) Cultivators 60 (b) Piggery - (c) Poultry - (d) Industry 3 (e) Govt.service 14 (f) Private business 4 5 Education (A) Post Graduates 8 (b) Graduates 3 (c ) X+II 4 (d) Class-X 16 (e) Illiterate 418 6 Institution (a) Number of H/S/Teacher/Student (1/1/12) (b) No. of M/S/Teacher /Student (1/6/22) (c) No. of Primary/Teacher/Student (1/5/72) (d) No. of Anganwadi/Teacher/Student (1/2/80) 7 Basic Amenities (a) House with Electric Connection 64 (b) Water connection - (c) LPG connection 10 (d) Power station 1 (e) Public water point 14 (f) Local Water Fountain 6 (g) Hospital 0 (h) Sub centre/PHC/CHC 0 (i) Rest house 0 (j) Police Station 0 (k) Post Office/ SPO/ BPO 1 (l) Playground 1 (m) Community Hall 1 3.4 NTFPs and MAPs of Murlen Villagers
3.4.1. Fuel-wood
Artocarpus heterophyllus (Moraceae) ‘Lamkhuang’, Betula cylindrostachys (Betulaceae) ‘Hriang’, Bauhinia variegata (Caesalpiniaceae) ‘Vaube’, Castanopsis tribuloides (Fagaceae) ‘Thingsia’, Cinnomomum glaucescens (Lauraceae) ‘Saperbul’, Derris robusta (Fabaceae) ‘Thingkha’, Diospyros toposia (Ebenaceae) ‘Zothinghang’, Dipterocarpus retus (Dipterocarpaceae) ‘Thingsen’, Engelhardtia spicata (Juglandaceae) ‘Hnum’, Glochidion khasicum (Euphorbiaceae) ‘Thingpawnchhia’, Lithocarpus elegans (Fagaceae) ‘Fah’, Macaranga pustulata (Euphorbiaceae) ‘Hnahkhar’, Myrica esculenta (Myricaceae) ‘Keifang’, Quercus glauca (Fagaceae) ‘Thalfang/ Hrumhrui’, Quercus leucotricophora (Fagaceae) ‘Then’, Quercus polystachya (Fagaceae) ‘Thil’, Quercus helferiana (Fagaceae) ‘Hlai’,
National Seminar on Management of Natural Resources for Sustainable Development: Challenges and Opportunities
74
Schima wallichii (Theaceae) ‘Khiang’, Trema orientalis (Ulmaceae) ‘Belphuar’, Vaccinum sprengelii (Vaccinaceae) ‘Sirkam’, Wenlandia grandis (Rubiaceae) ‘Batling’.
3.4.2. Medicinal Plants
Bergenia ciliata (Saxifragaceae) ‘Khamdamdawi’, Cannabis sativa (Cannabinaceae) ‘Kanza’, Chromolaena odorata (Compositae) ‘Tlangsam’, Centella asiatica (Umbelliferae) ‘Lambak’, Curcuma longa(Zingiberaceae) ‘Aieng’, Curcuma caesia (Zingiberaceae) ‘Ailaidum’, Emblica officinallis (Euphorbiaceae) ‘Sunhlu’, Gingiber officinale (Zingiberaceae) ‘Sawhthing’, Helicia robusta (Proteaceae) ‘Pasaltakaza’, Musa sylvestris (Musaceae) ‘Changel’, Mycenia macranta (Compositae) ‘Japan hlo’,
3.4.3. Edible Plants
Acasia pinnata (Mimosaceae) ‘Khanghu’, Aganope thyrsiflora (Fabaceae) ‘Hulhu’, Caryota urens (Palmae) ‘Tum’, Cassia occidentalis (Caesalpiniaceae) ‘Reng-an’, Clerodendron colebrookianum (Verbenaceae) ‘Phuihnam’, Dysoxylum gobar (Meliaceae) ‘Thingthupui’, Diplazium maxima (Athyriaceae) ‘Chakawk’, Fagyropum dibotrys (Polygonaceae) ‘Anbong’, Gynura bicolor (Asteraceae) ‘Tlangnal’, Marsdenia formosana (Asclepiadaceae) ‘Ankhate’, Parkia roxburghii (Mimosaceae) ‘Zawngtah’, Plantago major (Plantaginaceae) ‘Kel-ba-an’, Trevesia palmata (Anacardiaceae) ‘Kawhtebel’, Wendlandia grandis (Rubiaceae) ‘Batling’, Zanthoxylum rhetsa (Rutaceae) ‘Ching-it’. 3.4.4. Fruit Plants
Aphananthe cuspidata (Ulmaceae) ‘Thei-seh-ret’, Artocarpus lacucha (Moraceae) ‘Thei tat’, Bruinsmia polysperma (Styraceae) ‘Theipalingkawh’, Carallai brachiata (Rhizophoraceae) ‘Theiria’, Cayratia obovata (Ampelidaceae) ‘Puarpeng’, Citrus maxima (Rutaceae) ‘Sertawk’, Elaeocarpus lanceifolius (Tiliaceae) ‘Kharuan’, Elaeocarpus tectorius (Elaeocarpaceae) ‘Umkhal’, Emblica officinalis (Euphorbiaceae) ‘Sunhlu’, Mangifera indica (Anacardiaceae) ‘Theihai’, Nyssa javanica (Cornaceae) ‘Bul thur’, Prunus persica (Rosaceae) ‘Theitehmul’, Passiflora edulis (Passifloraceae) ‘Sapthei’, Pyrus communis (Rosaceae) ‘Pear’, Psidium guajava (Myriaceae) ‘Kawlthei’, Prunus jenkinsii (Rosaceae) ‘Keipui’, Prunus undulata (Rosaceae) ‘Thei ar lung’, Rubus acuminatus (Rosaceae) ‘Theihmu’, Protium serratum (Burceraceae) ‘Bil’, Spondias pinnata (Anacardiaceae) ‘Taitaw’, Vitis vinifera (Ampelidaceae) ‘Grape’.
3.4.5. Canes & Bamboos
Arenda nana (Palmae) ‘Lem’, Bambusa khasiana (Poaceae) ‘Raw te’, Callamus erectus(Palmae), ‘Hruipui’, Chimnobambusa callosa (Poaceae) ‘Nat’, Chimnobambusa griffithiana (Gramineae)‘Phar’, Dendrocalamus longispathus (Gramineae) ‘Raw nal’, Dendrocalamus hamiltonii (Gramineae) ‘Phul rua’, Drepanostachyum intermedium (Gramineae)‘Lik’, Dinochloa compactiflorus (Poaceae) ‘Sai ril’, Melocanna baccifera (Gramineae) ‘Mautak’, Schizostachyum fuchsianum (Gramineae) ‘Raw ngal’, Schizostachyum pergracile, (Gramineae) ‘Chal’.
4. SWOC Analysis on Value Addition and Marketing of NTFPs and MAPs 4.1 Strengths a. Sufficient rainfall and water sources with rich fertile soil. b. Rich biodiversity with availability of many wild plant and animal species. c. Availability of sufficient forest land.

Value Addition and Marketing of NTFPs and MAPs: A Brief Study of Murlen Village, Mizoram
75
4.2 Weakness a. No proper roads for transport and communication, inaccessible during monsoon. b. Lack of infrastructure for forest-based industry such as storage or drying centre, etc. c. Lack of knowledge on values of NTFPs and MAPs. 4.3 Opportunities a. Training on harvesting, processing and marketing for available NTFPs and MAPs. b. Research on the sustainable harvesting of important NTFPs and MAPs. c. Increasing demand for natural herbal products in world market. 4.4 Constraints a) Overharvesting which may lead to extinction. b) Recurrent Forest fires. c) Poor marketing facilities. 5. Discussion and Conclusion The contribution of NTFPs and MAPs to the livelihood and economy in the forest fringe village of Murlen in Mizoram is quite significant. All produces derived from the forest was found to be livelihood supporting for the communities in the form of food, fodder, fuel and medicine. SWOC Analysis on the NTFP and MAPs inventory of the village reveal that a diverse variety of forest produce could potentially find alternative livelihood for the villagers provided that value additions, marketing interventions and other measures are undertaken. To promote the value additions and marketing of the NTFPs and MAPs, facilitation by appropriate policies and incentives can be made to the people to promote cultivation of such produce in degraded or un-classed forests. It is therefore recommended to promote such forest products facilitated by appropriate policies and incentives. It is also important to seek new markets for potentially marketable NTFPs and MAPs to capitalize on hidden opportunities. Large-scale forest-based industries do not seem viable, but forest-based small-scale industries are the most feasible options in the current scenario. Small scale industry requires low capital, is less prone to political changes, raw material supply is adequate for cottage industries, and creates employment generation opportunities at local level. Potential NTFP-based enterprises that can be set up at the local level include handicraft items from bamboos and canes, local medicinal products, orchids for ornamental purposes and processing of wild fruits. Acknowledgement The authors offer thanks to Dr. Lalchhuanawma, Mr. Lalchhanhima and also to the Department of Environmental Science, Mizoram University for the support obtained in part through arrangement of field trips. Thanks are also extended to the M.Sc students of 2008 and 2010 who helped in the data generation. References Arnold, J.E.M. and Perez, M.R. (2001), “Can Non Timber Forest Products Match Tropical Forest Conservation and Development Objectives?, Ecological Economics, Vol. 39(3), pp. 437–447. Beer, J.H.D. and McDermott, M.J. (1996), The Economic Value of Non-timber Forest Products in South East Asia, 2nd Rev., Edn. The Netherlands Committee for IUCN, Amsterdam. Everett, Yvonne (1996), Research and Activities Focused on Non-Timber Forest Products in the Hayfork AMA. Watershed Research and Training Center, USDA Forest Service Pacific Southwest Research Station, California.

National Seminar on Management of Natural Resources for Sustainable Development: Challenges and Opportunities
76
FAO (2007), SWOC Analysis. (Annex to the lesson “Improving Food Security Information Systems”). In: Food Security Information Systems and Networks. Fox, Jefferson (1994), “Introduction: Society and Non-Timber Forest Products in Asia”, Society and Natural Resources, Vol. 8, pp. 189–192. Gupta, B.N. (1994), Durst, P.B., Ulrich, W. and Kashio, M. (eds.), Noon Wood Forest Products in Asia, RAPA Publication 1994/28. RAP/FAO, Bangkok, pp. 19–48. Hegde, R., Suryaprakash, S., Achoth, L., and Bawa, K.S. (1996), “Extraction of NTFPs in the Forests of BR Hills: Contribution to Rural Income”, Economic Botany, Vol. 50, pp. 243–250. ISFR (2011), Indian State of Forest Report, 2011, Forest Survey of India, Ministry of Environment & Forests. Jeeceelee, L., Sahoo, U.K., Lalremruati, J.H., Lalremruata, J., Lalliankhuma, C. and Lalramnghinglova, H. (2010), “Role of NTFPs in the Livelihood of Tribals around Dampa Tiger Reserve in North-East India”, Paper Presented in International Conference on Energy, Environment & Development during 10–12 December, 2010 at Sambalpur University, Orissa, Abstract No EPP 10, Pg. 177, Full Length Paper in Press, Special Vol. III of The Bioscan. Kant, Shashi (1997), “Integration of Biodiversity Conservation and Economic Development of Local Communities”, Journal of Sustainable Forestry, Vol. 4, No. ½, pp. 33–61. Lalramnghinglova, J.H. (1996), “Ethnobotany of Mizoram–A Preliminary Survey”, J of Eco and Taxon Bot, Addl Series. Vol. 12, pp. 439–459. Lalremruata, J., Sahoo, U.K., Jeeceelee, L., Lalremruati, J.H, Lalliankhuma, C. and Lalramnghinglova, H. (2010), “Utilization of Non-timber Forest Products by the Tribal around Dampa Tiger Reserve in Mizoram”, Paper presented in International Conference on Energy, Environment & Development, during 10–12 December, 2010 at Sambalpur University, Orissa, Abstract No EPP 11, Pg. 178., Full Length Paper in Press, Special Vol. III of the Bioscan. NCHSE (1987), Documentation of Forest and Rights, Vol. 1, National Centre for Human Settlements and Environment, New Delhi. Padoch, Christine (1992), “Marketing of Non-Timber Forest Products inWestern Amazonia: General Observations and Research Priorities”, Non-Timber Forest Products from Tropical Forests. Nepstad, Daniel C. and Stephen Schwartzman. The New York Botanical Gardens, New York. Pimental.D, Mcnair. M, Buck. L, Pimental, M. and Kamal, J. (1997), “The Value of Forests to World Food Security”, Human Ecology, Vol. 25(1), pp. 91–121. Prasad, R. and Bhattacharya, P. (2003), “Sustainable Harvesting of Medicinal Plant Resources”, In S.B. Roy, ed. Contemporary Studies in Natural Resource Management in India, pp. 168–198. New Delhi, India, Inter-India Publications. Purohit, S.S. and Vyas, S.P. (2005), “Marketing of Medicinal and Aromatic Plants in Rajasthan”, National Consultative Workshop on Medicinal and Aromatic Plants, held at G.B. Pant University of Agriculture and Technology, Pantnagar, Uttarakhand. 25–27, June. Shiva, M.P. (1995), Collection, “Utilization and Marketing of Medicinal Plants from Forests of India”, In: Durst, P.B. and Bishop, A. (eds), Beyond Timber: Social, Economic and Cultural Dimensions of Non-Wood Forest Products in Asia and the Pacific. Proceedings of a Regional Expert Consultation, Bangkok, 28 Nov-2 Dec, 1994. RAP/ FAO, Bangkok. p. 271–281. WHO (2002), Traditional Medicines Strategy 2002–2005, Geneva, In: WHO website, www.who.int/ medicines/ library/ trm/trm_strat_eng.pdf.

77
10 Consequences of Dilemmatic Development on the Little Andaman Island of India
Saswati Roy Department of Geography,
Visva Bharati, Santiniketan, West Bengal, India E-mail: [email protected]
1. Introduction The main genre of development is to believe that all people are equal and deserve equal rights and opportunities. With the advent of globalization and the introduction of new technology, these principles of development gained importance not only in protecting human beings from the ill effects of change but also in ensuring that all are allowed a share of benefits. If viewed from the other angle, this once again implies that all are labelled with the same logo—homogenous, uncategorized and thus follows up with an identity crisis. Development in any society or nation senses good but is effective only up to a limit. This limit ensures the point up to which the makeover is desirable both for the physical, social and economic perspectives. Development done by virtue of competition i.e., with an attempt to act similarly in every aspect with the already developed might affect the carrying capacity of the developing. Thus, it is worthy to understand the nature of the area, its compatibility and obviously the apprehended outcome before intruding with any such developmental programmes. In this materialistic advancement state of our world there still exists a few handful pockets of groups of people who are still living with their primitive background and knowledge, being carried down from ages together, totally virgin, without any intervention from the outer world. The modern people assume that these primitive groups who follow a different track of sustenance, off-beat from the present rhythm are backward and need their extended helping hand. Not only this, the modern world has even extended their helping hands to prove a support to the misnomer, backward community. This is still being done in the name of globalization. Development, henceforth, generates a social identity crisis amongst the community residing in remote pockets complacent with nature and who does not have any interest in intermingling with the outer world. The tendency of the planners in order to sustain their immediate benefitting policies abstain them from thinking at the grassroots level. So, by the name of development, the intervention within their community with certain alien concepts has jeopardized them and loosened their socio-cultural knit. Similarly, such an exalted scenario is portrayed by the present researcher from our much known part of India—The Little Andaman Island where such a pristine traditional community called the ‘Onge’ survives. The summarization in gist would expose the consequences of development on the physical, social as well on the environmental aspects of this tiny island. 2. Geographical Account of Little Andaman Island Little Andaman Island is the fifth largest island amongst the 348 islands that make up the Andaman and Nicobar archipelago and is the southernmost island of the Andaman district. Geographically, the Little Andaman Island is situated between 10°30' to 10°54' North latitude and 92°21' to 92°37' East longitude. Hut Bay is the administrative centre of this island which is about 140 km from Port

Blair, theHeadquarPassage aan area oBrother IIsland in Islands inspreads iwidth is 2(a Palaeo
Geolotertiary fThe calcaGabbre forecent comoisture richer grehumid, trhumidityof AndamDecembe3500mmDry weat3. The The Littlrevenue chronologAndamandevelopmRegulatiothe LittleC.V.C. Pan
National Seminae capital torters of Nicand from theof 732.8 sqsland in thethe west con the northin north-sou25 km. The lithic Negro
Fig. 1: Locatiogically, the fine grey sanareous sandsormations aoral reef formretaining cey, brown aropical climy, between 8mans, May er from th/year. Cyclther occurs fChronoloe Andamanunit of Sougical declinn Island wament prograon (ANPATRe Andaman ndien).
ar on Managemenown of thecobar Districe Nicobars bq. km. The Ie north and tast of the Lih-west and uth directionlittle Andamoid tribe) fro
ion of Little AnLittle Andandstone, shstones are inare found atmations. Thcapacity. Sanand red soilmate with a2% and 85%to Septembhe North-ealones and tfrom Januarogy of Falln Island is outh Andamane in the poas declaredamme ignorR), which in Island (Wo
nt of Natural Resoue Union Tect. It is sepby the 10° (TIsland is bothe Bay of Bittle Andamnorth-east n. Maximumman Island wom time imm
ndaman Islanaman Islandales and siltnterspersedt higher elehe soils are indy alluvialls are founda temperatu%, throughober from thast (Retreathunderstorry to March. lacies one of the an. Hut Bay opulation o as a tribared the An1957 accorrking Plan f
urces for Sustainab
78
rritory andarated fromTen Degree)ound by theBengal Sea inan Island. Orespectivelm length of twas originamemorial (P
nd in Respect is mainly ot with intrud with conglevations whimmature, lol soil is found in the inlaure range oout the year.he South-wating) monrms are fre administratis the onlyf the Onge al reserve. ndaman andrded the stafor Little An
ble Development: d 150 km m the Great ) Channel. Te ‘Ten Degrn the east anOther off-liery. The islanthe island islly inhabitePortman, 189
to India and iof thick Eoceusion of basomerates anile the interoose in textnd in creeksand forests.of 200 to 3. It receives west (Advannsoon. The equent duritive units oy port towntribal comThe governd Nicobar Ptus of a tribndaman For
Challenges and Opfrom Car NAndaman gThe Little Anee Channelnd west. Aprs are Southnd has an es about 40 kd by the eth99).
its Neighbourene sedimenic and ultrand intercalartidal belts ture, poor ins and shelteThe island 20 Celsius arainfall twiccing) monsaverage ring the proof Andamann of Little Amunity, in nment teamProtection bal reserve trest Divisio
pportunities Nicobar, thgroup by thndaman Isla’ in the soui Island is th Sentinel anelongated skm and the mhnic Onge co
ing Countriesnts depositea basic igneoted Serpentare charactn drainage aered coasts possesses wand a meance a year, liksoon and Orainfall is olonged wen Districts wAndaman. Dthe year 19m suggestedof Aboriginto the entiren, Vol-I, pre
e District he Duncan and covers uth, South he nearest nd Brother shape and maximum ommunity
s ed on pre-ous rocks. tinites and terized by and low in while the warm and n relative ke the rest October to 3000 to et season. within the Due to the 957 Little d that the nal Tribes e island of epared by

Consequences of Dilemmatic Development on the Little Andaman Island of India
79
3.1 Rehabilitation Programme: 1965 The entire Little Andaman Island was initially declared as ‘Tribal Reserve’ in 1957 which was subsequently constituted into ‘Reserve Forest’ during 1963. In fact, the forests of this island remained practically untouched and undisturbed till about 1964–65 when some suitable forest area were cleared under rehabilitation scheme for the settlement of refugees from East Pakistan (now Bangladesh) and repatriates from Ceylon (now Sri Lanka) and Burma (now Myanmar) and this continued till about the early years of 1970. Each refugee family was handed over with about 5 acres of land that were derived by clearing the tropical rainforest. Not only that, those lands were planted with coconut and betelnut trees which were alien amidst the rainforest lands. In the present day, the refugees are gradually encroaching upon the forest lands and are increasing in number at a rapid pace. The rehabilitation was carried on along a thin strip of the eastern coastal part of the island where they were allotted with 5 villages at Hut Bay, Netaji Nagar, Rabindranagar, Ramkrishnapuram, Vivekanandapur stretching for 28 kms from the southern tip of the island (Bose, 1994). All these rehabilitated settlements were developed at the expense of the forest areas, which were once the hunting grounds and gathering fields of the Onge. With the recognition of the natural forestry and its potentialities in the year 1965, a Report was made by the Interdepartmental Team on Accelerated Development Programme for the Andaman and Nicobar Islands, Ministry of Rehabilitation, Government of India. This initiated the policy makers to seek into this island for extraction of economic gains. 3.2 Introduction of Forest Management Division in Andaman: 1970 Earlier, three territorial forest divisions existed viz. North Andaman, Middle Andaman and South Andaman Forest Division; no separate plan was prepared for Little Andaman, hence the forests of Little Andaman Island were covered under South Andaman Division with its headquarters at Hut Bay (working plan 1952–53 to 1967–68 prepared by Mr. Chengappa). Timber extraction began in this island in the year 1970. This was carried out in the name of Andaman Canopy Lifting Shelterwood System and was recognised of being a scientific system of forestry. In 1972, about 20,000 hectares (roughly 30%) of the island was denotified from its tribal reserve status in two stages. In the year 1974, assessment was done for the timber productivity of the forests of Little Andaman Island. In the year 1975, Little Andaman Forest Division was created for the intensive management of its forests. At present, it is one of the seven territorial divisions functioning under the Department of Environment and Forest, Government of India. Even the Forest Division map of Little Andaman demarcates the revenue area of the island in a peculiar rectangular shape that has been created due to the inaccessibility of the dense forest (Fig. 2). On the establishment of the Andaman and Nicobar Islands Forests and Plantation Development Corporation Ltd. (ANIFPDCL) for the development of logging, marketing and raising of plantations in the year 1977, the harvestable forests were leased out to this Corporation. Since 1977, the ANIFPDCL established an intensive field station in Little Andaman to expedite the forest exploitation programs by taking over some 19, 600 hectares of the forest in the name of timber harvesting. The Andaman administrators encouraged private traders to extract timber under ANIFPDCL supervision. The most damning critique of forestry operations on the islands as a whole was contained in a 1983 report from the Department of Environment, Government of India. Environmental scientists S.C. Nair and Shanthi Nair had argued that the basic assumption of scientific forestry underlying the Andaman Canopy Lifting Shelterwood System was absolutely wrong. This forestry system, they pointed out, was leading to a preponderance of deciduous elements in the evergreen system that would eventually destroy the whole island ecosystem.
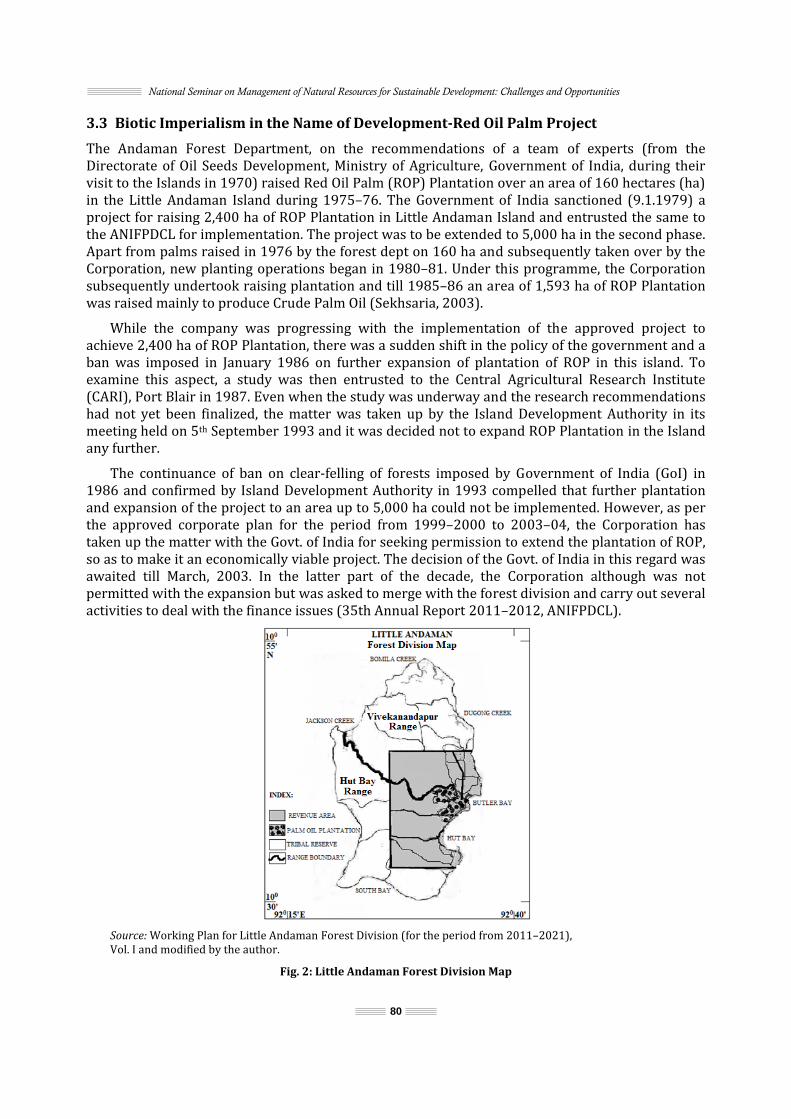
National Seminar on Management of Natural Resources for Sustainable Development: Challenges and Opportunities
80
3.3 Biotic Imperialism in the Name of Development-Red Oil Palm Project The Andaman Forest Department, on the recommendations of a team of experts (from the Directorate of Oil Seeds Development, Ministry of Agriculture, Government of India, during their visit to the Islands in 1970) raised Red Oil Palm (ROP) Plantation over an area of 160 hectares (ha) in the Little Andaman Island during 1975–76. The Government of India sanctioned (9.1.1979) a project for raising 2,400 ha of ROP Plantation in Little Andaman Island and entrusted the same to the ANIFPDCL for implementation. The project was to be extended to 5,000 ha in the second phase. Apart from palms raised in 1976 by the forest dept on 160 ha and subsequently taken over by the Corporation, new planting operations began in 1980–81. Under this programme, the Corporation subsequently undertook raising plantation and till 1985–86 an area of 1,593 ha of ROP Plantation was raised mainly to produce Crude Palm Oil (Sekhsaria, 2003). While the company was progressing with the implementation of the approved project to achieve 2,400 ha of ROP Plantation, there was a sudden shift in the policy of the government and a ban was imposed in January 1986 on further expansion of plantation of ROP in this island. To examine this aspect, a study was then entrusted to the Central Agricultural Research Institute (CARI), Port Blair in 1987. Even when the study was underway and the research recommendations had not yet been finalized, the matter was taken up by the Island Development Authority in its meeting held on 5th September 1993 and it was decided not to expand ROP Plantation in the Island any further. The continuance of ban on clear-felling of forests imposed by Government of India (GoI) in 1986 and confirmed by Island Development Authority in 1993 compelled that further plantation and expansion of the project to an area up to 5,000 ha could not be implemented. However, as per the approved corporate plan for the period from 1999–2000 to 2003–04, the Corporation has taken up the matter with the Govt. of India for seeking permission to extend the plantation of ROP, so as to make it an economically viable project. The decision of the Govt. of India in this regard was awaited till March, 2003. In the latter part of the decade, the Corporation although was not permitted with the expansion but was asked to merge with the forest division and carry out several activities to deal with the finance issues (35th Annual Report 2011–2012, ANIFPDCL).
Source: Working Plan for Little Andaman Forest Division (for the period from 2011–2021), Vol. I and modified by the author. Fig. 2: Little Andaman Forest Division Map

Consequences of Dilemmatic Development on the Little Andaman Island of India
81
This ROP was grown all over the forest area by cutting down the canopy and hence squeezing out the Onges of their hunting spots. In this plantation area, the government hired labourers from the mainland and outskirted the aboriginals allowing them to be at stake of the limited resources left out at mercy by the policymakers (Reddy and Sudersan). The optimum productive age of the ROP is 30 to 35 years after which yields are believed to decline i.e. by 2015, the productivity is assumed to be in its decline. Even the plantation at present are infected with diseases due to mismanagement and improper maintenance. Now the Forest Department after a failure has decided to cut off the planted area and return it back to the natural forest once again. But a period of 30–35 years being invested for an exotic species has led to the destruction of the natural ecosystem of the island forest. Before jumping into a newer approach with an alienated concept in a virgin area there should have been a scientific assessment of the impact in the long run. 3.3.1. Development and Reciprocation from the Tribal Folk Culture The Onges are concentrated in Little Andaman. Earlier, three distinct places were inhabited by this tribe and they were the Dugong Creek, Jackson Creek and South Bay within this particular island. Prompted partly by the changed situation in the aftermath of the colonization of the Little Andaman Island and partly by the intention to do good to the Onge, the Government took the decision to settle the Onge at Dugong Creek in 1976–1977 and South Bay in 1980. But after the tsunami, 2004 they all were shifted to the Dugong creek alone. 4. Impact on the Folk Spirithood—A Feeling of Topophilia Little Andaman is the homeland of the Onge community. Earlier, three distinct places were inhabited by this tribe and they were the Dugong Creek, Jackson Creek and South Bay within this particular island. Prompted partly by the changed situation in the aftermath of the colonization of the Little Andaman Island and partly by the intention to do good to the Onge tribe, the government took the decision to settle the Onge at Dugong Creek in 1976–1977and South Bay in 1980 (Mann, 1978). Another treacherous impact on the habitat of the Onge was visualized after the tsunami hit this island on 26th December 2004. The tsunami affected the South Bay camp much more than the Dugong Creek due to its geographical location (Fig. 3). Though they were successful enough in escaping the wrath of the nature with their rich oral tradition, the administration persuaded them to join the Onge of the Dugong Creek. However, the Onge of the South Bay were unwilling to settle together with the Onge of the Dugong Creek (Haider and Kumar). On the contrary, they wanted to be resettled near South Bay due to Topophilia—attachment to their traditional habitat where the spirits of their ancestors exist. Further, the Onge of South Bay informed that for observing certain rites and rituals they require to go back to their traditional site where their ancestors are buried. They bear a higher degree of strong community life and greater organic relationship with nature where the individual is seen to be a part of the man-nature-spirit complex. This sense of place has emerged out of this attachment with the forest (Haider and Kumar). The Onges are attached to nature from attaining their very basic livelihood to the broad sense of spiritual feelings. But the administration paid no heed which gave a serious threat to the mentifacts that bear an important aspect within the Onge’s folk spiritual culture. The present Dugong Creek tribal area has been extended in order to allocate the translocated Onge and even to have a proper introduction of the developmental strategies. All these generally included the installation of helipad, community halls, generator and pump houses, ration units and the pseudo-houses imitating the Onge’s indigenous huts but at the cost of the lush greens.

National Seminar on Management of Natural Resources for Sustainable Development: Challenges and Opportunities
82
Source: Anthropological Survey of India and modified by the author Fig. 3: Chronological Translocation of the Onge Tribal Settlement
4.1 Impact of Developmental Strategies on the Tribal Environment The so-called development of this archipelago began in 1789, when the British lieutenant Archibald Blair arrived at Chatham Island along with his establishment programme with the intention to settle there. Development of the Little Andaman was initiated after the successful ventures of M.V. Portman (1880 and 1886–87) to develop friendship with the Onges. Since then, several development strategies have come into operation, which are doing immense damage to the Onge community. The present author, based on fieldwork in areas inhabited by the Onges over a ten-year period i.e. 1987 to 1996 would like to suggest a few strategies for restoration of their lost environment and put forward a few critical comments (Mukhopadhyay, 1999): • Welfare agencies have constructed nearly 31 wooden huts with raised platforms and tin-roofs. These huts have no structural resemblance to the traditional Korali (temporary) and
Beyra (communal) huts. • The Onges share a nomadic lifestyle. Due to the rapid increase of ticks and insects in and around a settlement, the Onge people have to shift from one place to another within a short span of time i.e., their nomadic character is motivated by scientific reasons and compulsions. But this has been restricted due to the invisible wall fenced by the government in the name of development. • The concept of Raja or King has been introduced by the outsiders for implementation of programmes through a particular person, similar to the role of a bureaucrat in our society. Still, for extracting more benefit, the planners are introducing such a system to people who consider themselves equal in their society.
After their island was ‘opened to settlement’ by the Indian authorities in the 1950s the Onge were moved from their habitats. Spotted grey area: Two Onge populations, including the one at Jackson Creek (1) and (2) were moved to the South Bay reservation (medium grey area) in the 1970s. After the devastating tsunami of 26th December 2004 the survivors of South Bay reservation were moved to Dugong Creek reservation (dark grey area) which is now the only remaining Onge area. Dotted line: main road. Square: Administrative headquarters of the Indian administration.

Consequences of Dilemmatic Development on the Little Andaman Island of India
83
• Introduction of a market culture is one of the developmental strategies in this island. A cooperative society, Onge Multi-purpose Cooperative Society, has been started with the idea of collecting forest products like coconut, honey, resin, cane etc. and selling them in the market of Hut Bay and even in Port Blair town. Initially, this system made the Onges business-minded which encouraged them to extract more forest products; but as a result it disturbed the ecology of the forest to a great extent. • The Onges have always survived in the tropical climate without dress. Children upto age 5 to 7 remain naked, women wear traditional dresses that are made of cane and palm leaves. Men are found wearing loin cloth of the traditional kind. Recently, under welfare programmes all kinds of Indian dresses are supplied to them. It has been seen that unable to understand the proper sartorial mode, they end up wearing a peculiar combination of both traditional and modern dresses at the same time. Moreover, frequently they wear supplied clothes without washing the same for months at a stretch. Wearing those dirty dresses constantly has caused skin diseases which formerly they were unaware of. • The colourful plastic bead necklace has gradually replaced the traditional necklaces of dentalium or tusk shell. Onge women nowadays rarely adorn themselves with traditional ornaments. The introduction of these plastics goods is pushing them towards the same fate of pollution which the modern world is facing. • Traditional material culture has been replaced by the use of modern utensils. For example, the replacement of the 'Ookoo' dugout wooden bucket, (which is prepared by each man for his wife) by the ubiquitous plastic bucket. ‘Toleh’ is a kind of cane bucket, mainly used during hunting and fruit gathering. But, with the introduction of the plastic ‘carry bag’ the Onges are losing interest in making such traditional articles of daily use. • The Onges apply white and red clay as their indigenous method of treatment for all diseases. They use red clay for curing headaches and fever. On the other hand, white clay is meant to save the skin from insect-bite. Recently with the introduction of modern treatment, the Onge people tend to face a dilemma and are gradually losing their confidence in their age-old medical treatments. • Providing radio and other electronic items is perhaps a mistake; these tend to make the Onge idle. Almost every day they keep their radio sets on. Such activities divert them from their own rich culture. During field surveys, the author heard some typical Hindi songs and news from BBC in Onge families. These unnecessary elements have spoiled their pristine environment diluting it with extraneous elements which are not necessarily wholesome for them.
5. Snatching an Eco-adjusted Life Pattern Brings Despondency! Snatching the livelihood and monitored life pattern, not directly but the other way round, created a feeling of despondency amongst the community. It was a fortune on the part of the Indian government that the Onge were not hostile, hence could easily be treated as guinea pigs in the name of development. But many a times they have shown their resentment in a friendly tone, but in vain. The government was deaf to their desires and the encroachment within their livelihood made them depressed. The mental reluctance cropped within them as they are going through an identity crisis which is evident from a crucial impact on their population generation (Myka, 1993). Table 1: Temporal Change of the Onge Population Year 1901 1911 1921 1931 1941 1951 1961 1971 1981 1984 1987 1988 2008Population 672 631 346 250 N.A. 150 129 112 N.A. 102 98 101 92
Note: Estimated, Enumerated Source: Census Reports of India

National Seminar on Management of Natural Resources for Sustainable Development: Challenges and Opportunities
84
A century ago, the population of Onges numbered 127, but thereafter, due to different kinds of campaigning, the number dropped from 127 to a mere 98. For the past 20 years these poor tribal inhabitants had to face a great deal of disruption in their mode of living due to the arrival of different groups of people from different regions including the 700 mainland settlers and among them the prominent were the Nicobarese, transferred from Car Nicobar to Harminder Bay in 1973. The gradual decline in the population was due to the physiological as well as the psychological stress that has been impounded on this humble community. 6. Eco-tourism Project under VVET, 2011: Already in Pipeline The other islands of the Andaman district which earn a handsome amount from tourism are on the verge of losing its physical as well as the social integrity of the island dwellers. Hence, the nature lovers are now ready to pay high to get into the uninvaded islands of this archipelago. The Corporation involved itself in eco-tourism making a small beginning in 1999 under the nomenclature “VVET” (Van Vikas Eco-tourism). Currently, the activities are located at two parts—Little Andaman and Mayabunder, catering to accommodation and nature tourism. Hence, going through the tourism potentiality, the Van Vikas Eco-tourism has spotted five locations along the eastern coastal strip of the island: Butler Bay, White surf waterfall, Kalapaththar, Krishna Nala and Harminder Bay. These are going to be done in the name of eco-tourism. To avail the huge influx of tourist hotels, inns and restaurants are in the project proposal which is going to be installed at the stake of the natural plots. All these proposed activities would be very much threatening for such an evergreen rainforest of Little Andaman. 7. Author’s Inferences It is an advantage for this rainforest to be remote and isolated from the mainland. The island is fortunate that yet 90% of the total forest is more or less intact. The aforesaid fallacies have cropped as the policies were undertaken with shallow environmental understanding. Rather, it may be the other way round—the economical benefit extracting policies out-swayed the intellectual apprehension. This was the reason why, each and every policy undertaken here were regarded undesirable in the mid-way after its initiation. Author after vividly going through the impacts of the policies has come to a conclusion of rethinking and finally would like to propose for a deterministic approach. When the whole world is running after a possibilistic approach of quenching the demands by usurping the virgin forests, it is also necessary enough to leave a clump to retain its pristinity. References Bose, Saradindu (1994), “The Onges of Little Andaman-The tribe in transition”, Geographical Review of India, Vol. 56, No. 1. Kumar, U. and Haider, R. (2007), “Impact of Tsunami at the Onge settlements at Dugong Creek, Little Andaman”, in
Tsunami in South Asia-Studies of Impact on Commodities of Andaman and Nicobar Islands, Allied Publishers Private Ltd, New Delhi, pp. 116–118. Mann, R.S. (1978), The Bay Islanders, Midnapur: Institute of Social Research & Applied Anthropology. Mukhopadhyay, M. (1999), “Impact of Changing Environment on the Onge Tribal Community of Little Andaman Island”, South Asian Anthropologist, Vol. 20, No. 1, pp. 27–33. Myka, Frank P. (1993), Decline of indigenous populations: The Case of the Andaman Islands, Jaipur and New Delhi: Rawat Publication, pp. 116–125. Portman, M.V. (1899), The History of our Relations with Andamanese, Asian Educational Service, New Delhi, pp. 118–125. Reddy, G.P. and Sudersan, V. (1990), “Onge Foraging System: Strategies of Resource Utilization”, In Arabinda Basu, Jayanta Sarkar et al. (Eds.), Andaman and Nicobar Islanders, Indian Anthropological Society, Kolkata, pp. 101–110. Sekhsaria, Pankaj (2003), Onge-A People in Peril. Troubled Island, Kalpavriksh. LEAD-India, p. 29.

Consequences of Dilemmatic Development on the Little Andaman Island of India
85
Working Plan for Little Andaman Forest Division (from 2011 to 2021) Prepared by Pandien, C.V.C., Vol. I, Andaman and Nicobar Administration, Department of Environment and Forests. Working Plan for the Middle Andaman forest Division (from 1952–53 to 1967–68) Prepared by Chengappa, Andaman and Nicobar Administration, Department of Environment and Forests. Working Plan for the North Andaman forest Division (from 1952–53 to 1967–68) prepared by Chengappa, Andaman and Nicobar Administration, Department of Environment and Forests. Working Plan for the South Andaman Forest Division (from 1952–53 to 1967–68) Prepared by Chengappa, Andaman and Nicobar Administration, Department of Environment and Forests. 35th Annual Report 2011–2012, Andaman & Nicobar Islands Forest & Plantation Development Corporation Limited, Port Blair, pp. 3–6.

86
11 Changes in Village Safety and Supply Forest in Kolasib District of Mizoram
H. Lalchamreia and Rintluanga Pachuau Department of Geography and Resource Management,
School of Earth Sciences, Mizoram University, Aizawl E-mail: [email protected]
1. Introduction The growing concern of climate change and its negative consequences had made the people from all walks of life to pay more attention on forest and its ecosystem, their services and function for the future of the planet earth. The realization of tangible and intangible services of forest for mankind and the world climatic condition by different sections of the world community had called for the urgency of sustainable management of forest to mitigate the ongoing process of climate change (Kaimowitz & Angelsen, 1998). The remaining forests of the world are largely confined in the tropical regions (Myers, 1994) harbouring a rich flora and fauna. Meanwhile, these remaining forests of the world are under intense pressure to meet the demand of the ever-increasing world population, as such deforestation rate is high in this region. The forest cover and land-use changes are mainly anthropogenic in tropical countries and are being increasingly recognized as critical factors influencing global environmental changes. (Helmut et al., 2002, Nagendra et al., 2004). However, tropical countries are less developed and different tribal communities are largely concentrated in this region. Majority of these tribal communities depend solely on forests for their livelihood. They have a symbiotic relationship with forest since a long time ago. India is one of the tropical countries where two of the world’s important biological diversity hotspot region is located. One of its biodiversity hotspot is found in the North Eastern Region (NER) of India. The NER comprised of seven states of the Indian union. Majority of the population belongs to the tribal community. Forest had been their source of livelihood and conversion of forested land to shifting cultivation is common in this eastern Himalayan region (Singh et al., 1984, Rai et al., 1994, Ramakrishna et al., 1994, Schweik et al., 1997, Sen et al., 2002). It is part of their culture and history for majority of the people of this region. The state of Mizoram is one of the seven states in the NER. The people of Mizoram have a long history and culture of clearing forest for jhum purposes while maintaining forest conservation. However, in due course of time, it is difficult for the Mizo community to continue their tradition of conservation due to socio-economic pressure. The tradition of allotting a portion of forest in the vicinity of the village, called Village Safety and Supply Forest, has even become difficult though the Mizoram Forest Act 1955 demands every village leaders to constitute the village safety and supply forest in their own jurisdiction. The present paper analyzes changes in the village safety and supply forest at district level. Kolasib district, located in the northern most part of the state is selected for the present study.
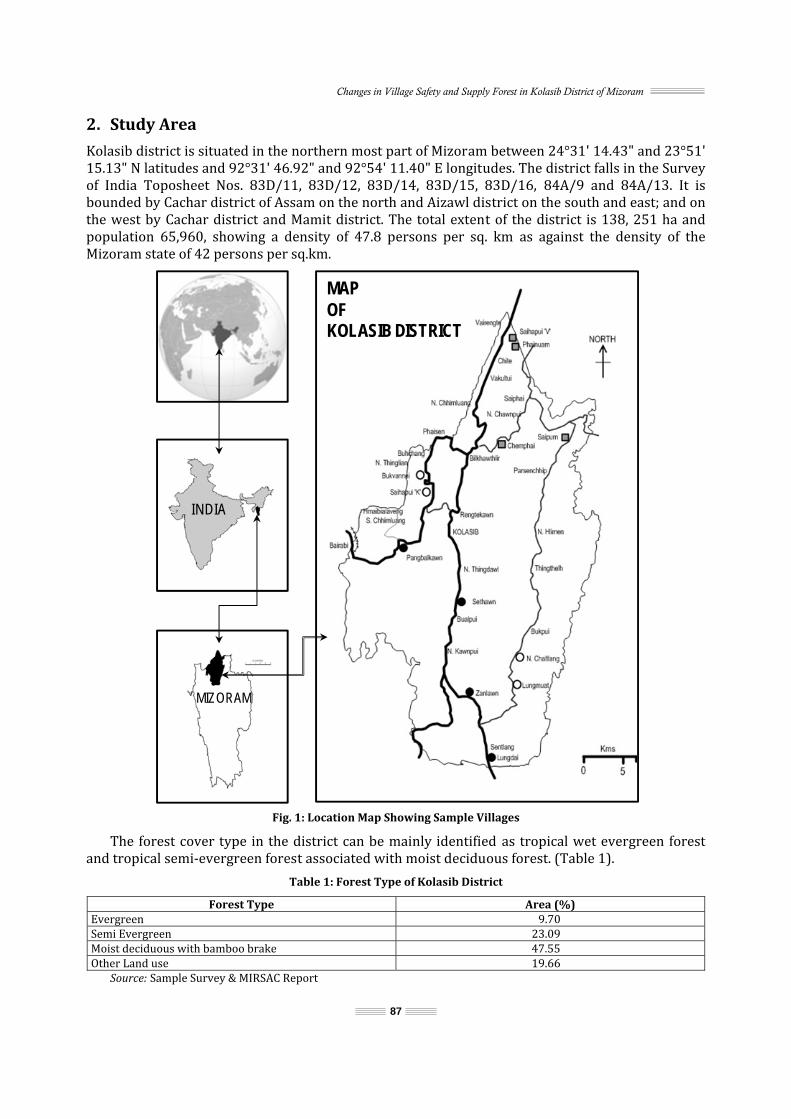
Changes in Village Safety and Supply Forest in Kolasib District of Mizoram
87
2. Study Area Kolasib district is situated in the northern most part of Mizoram between 24°31' 14.43" and 23°51' 15.13" N latitudes and 92°31' 46.92" and 92°54' 11.40" E longitudes. The district falls in the Survey of India Toposheet Nos. 83D/11, 83D/12, 83D/14, 83D/15, 83D/16, 84A/9 and 84A/13. It is bounded by Cachar district of Assam on the north and Aizawl district on the south and east; and on the west by Cachar district and Mamit district. The total extent of the district is 138, 251 ha and population 65,960, showing a density of 47.8 persons per sq. km as against the density of the Mizoram state of 42 persons per sq.km.
Fig. 1: Location Map Showing Sample Villages The forest cover type in the district can be mainly identified as tropical wet evergreen forest and tropical semi-evergreen forest associated with moist deciduous forest. (Table 1). Table 1: Forest Type of Kolasib District
Forest Type Area (%) Evergreen 9.70 Semi Evergreen 23.09 Moist deciduous with bamboo brake 47.55 Other Land use 19.66 Source: Sample Survey & MIRSAC Report
INDIA
MIZORAM
MAP OF KOLASIB DISTRICT

National Seminar on Management of Natural Resources for Sustainable Development: Challenges and Opportunities
88
3. The Concept The Mizos, in their history and culture have a tradition of respecting nature. Conservation of forest is part of the culture while forest and its product were their resort for livelihood. A large tract of wood forest and bamboo forest called ‘Mauhak’ was conserved in the vicinity of the village to protect the village from enemies and forest fire, while it is also used to ensure the continuous water supply and to meet the needs of village community for various purposes like housing materials. It is well protected and managed on a sustainable basis. However, the advances in society and economy coupled with administration changes (from traditional village chief to modern democratic system) witnessed the beginning of the deteriorating condition of village safety and supply forest (Singh, 2010). It was realized that it is imperative to continue allocating a plot of forest land nearby the village. Therefore, The Mizoram Forest Act 1955 was passed at the time of District Council Administration to enforce the reserve of three classes of Village Forest in all the village of Mizoram, namely–Village Safety Reserve, Village Supply Reserve and Protected Forest Reserve. Village Safety Reserve is a reserve for the protection against fire and constituted in the interest of health and water supply. No one shall utilize for any purpose, any portion of land inside this reserve and no trees shall be cut in this reserve except with the permission of the State Government. The Village Council may dispose off any dead trees in the manner it considers most beneficial for the Village. Village Supply Reserve is a reserve for the supply of the needs of the village. Any person resident in the Village may cut trees and bamboos from this reserve for his household needs. Protected Forest Reserve is reserved for protection of valuable forest from destruction for the interest of the village communities. No one shall utilize, for any purpose any portion of land, inside this Protected Forest Reserve and no tree shall be cut in the Protected Forest Reserve except with the permission of the State Government. Any person doing anything in contravention of any of the provision of this section shall be punishable with a fine not exceeding Rs. 50. The boundary of the village Forest Reserve being properly demarcated shall be marked by sign posts and stone pillars. The record of the boundaries, stating places where such posts or marks are made shall be kept by the President of the Village Council Committee. A copy signed by the President shall be submitted to the State Government. 4. Method and Material Kolasib district is the only district, with a railway connection and interstate road link. The assumption is that accessibility will play a crucial role in the socio-economic development of the district and levels of natural resources exploitation. Twelve villages out of forty villages were stratified into three categories based on bus frequency and accessibility to the market.
Table 2: Stratification of Villages in Terms of Accessibility
Characteristics Very Accessible
MediumAccessible
Relatively Inaccessible
WholeDistrict No. of villages 12 8 20 40Average household/village 249 142 109 158Average population/village 1161 748 502 740Average distance from town 21 30 28Average Bus frequency 11 4 2After stratification, four villages from each stratum were randomly selected for sample survey representing about 30% of the village in the district. It may be regarded that the results and findings are reasonable enough to draw a conclusion for the study area. The villages in Strata-1 like Sethawn/ Thingdawl and Sentlang/ Lungdai were clubbed together as they were under one jurisdiction of the Village Council Committee respectively.

Changes in Village Safety and Supply Forest in Kolasib District of Mizoram
89
Table 3: List of Randomly Selected Twelve Villages with their Toposheet References
Strata Code Name of Villages Toposheet References1 Sethawn/ N. Thingdawl 83D/12, 2C1 Sentlang/ Lungdai 84A/9, 2A1 Pangbalkawn 83D/12, 1B1 Zanlawn 84A/9, 1C2 Bukvannei 83D/11, 3B2 Saihapui 'K' 83D/11, 3B2 Lungmuat 84A/13, 1A2 N. Chaltlang 83D/16, 3A3 Phainuam 83D/5, 3B3 Chemphai 83D/15, 2A & 3A 3 Saihapui 'V' 83D/15, 2A3 Saipum 83D/15, 2BThe survey tools used consisted of interaction with the village community, participatory appraisal, structured questionnaire and field verification/ quality control. The randomly selected sample villages were assessed using the aforementioned survey tools for two dates (i.e 1997 & 2007) to estimate changes in socio-economic and forest condition. Data were collected on socio-economic attributes, land use pattern and trend of the observed change for the aforesaid parameters with possible causes. The satellite image of the study area by Indian Remote Sensing Satellite IRS-1D LISS-III of 2005 procured from NRSA Data Centre Hyderabad was used for classification and change assessment of land use land cover in the study area. 5. Results and Discussion The forest in the study area was classified into six categories: Dense Forest, Open Forest, Bamboo Dominant, Teak Plantation, Safety and Supply Forest and Other Forest. It is regarded as necessary to assess other forest land use to compare with the safety and supply forest to know which path of change is followed by different categories of forest land use in their respective stratum. Table: 4 is presented to know the status of various forest land use in sampled villages. It is to be noted that 1997 was taken as the base year for calculating changes in percentage.
Table 4: Changes in Various Forest Land Use (1997 and 2007)
Year/ Strata
Dense Forests
Open Forests
BamboosDominant
Teak Safety/ SupplyForest
Other Forests
TotalForests 1997 1 1, 649 4, 141 3, 841 143 126 8 9, 9072 2, 284 1, 315 3, 632 0 136 0 7, 3663 2, 535 2, 057 14, 461 335 218 307 19, 913Total 6, 467 7, 512 21, 934 479 480 315 37, 1862007 1 1, 414 4, 790 3, 534 153 82 13 9, 9862 2, 101 1, 644 3, 955 46 132 23 7, 9013 1, 247 2, 063 13, 150 553 70 565 17, 647Total 4, 761 8, 496 20, 639 752 284 601 35, 534
Ten Years Change (In Per cent)1 -14.3 15.7 -8 6.7 -34.9 75 0.82 -8 25 8.9 0 -3 0 7.33 -50.8 0.3 -9.1 65 -67.9 83.7 -11.4Total -26.4 13.1 -5.9 57.2 -40.9 90.8 -4.4Source: Sample Survey There is a significant decrease in dense forest and safety and supply forest in all the strata while open forest and teak plantation is increasing in all the strata at the cost of dense forest. The inaccessible villages witness the largest decrease in dense forest and village safety/ supply forest. The open forest is increasing in very accessible and medium accessible village, the teak plantation is also increasing in very accessible village, and likewise, it is dramatically increasingin inaccessible villages. The factor of accessibility closely follows the path of changes in various forest land use.
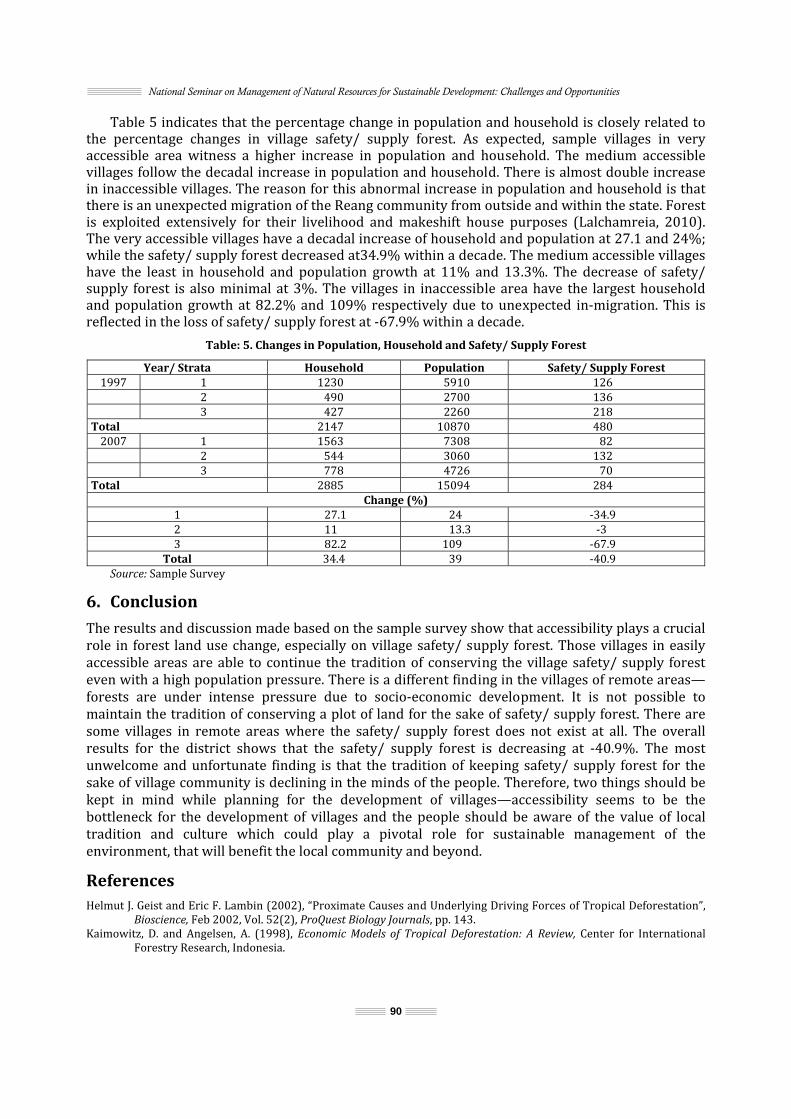
National Seminar on Management of Natural Resources for Sustainable Development: Challenges and Opportunities
90
Table 5 indicates that the percentage change in population and household is closely related to the percentage changes in village safety/ supply forest. As expected, sample villages in very accessible area witness a higher increase in population and household. The medium accessible villages follow the decadal increase in population and household. There is almost double increase in inaccessible villages. The reason for this abnormal increase in population and household is that there is an unexpected migration of the Reang community from outside and within the state. Forest is exploited extensively for their livelihood and makeshift house purposes (Lalchamreia, 2010). The very accessible villages have a decadal increase of household and population at 27.1 and 24%; while the safety/ supply forest decreased at34.9% within a decade. The medium accessible villages have the least in household and population growth at 11% and 13.3%. The decrease of safety/ supply forest is also minimal at 3%. The villages in inaccessible area have the largest household and population growth at 82.2% and 109% respectively due to unexpected in-migration. This is reflected in the loss of safety/ supply forest at -67.9% within a decade. Table: 5. Changes in Population, Household and Safety/ Supply Forest
Year/ Strata Household Population Safety/ Supply Forest1997 1 1230 5910 126 2 490 2700 136 3 427 2260 218 Total 2147 10870 480 2007 1 1563 7308 82 2 544 3060 132 3 778 4726 70 Total 2885 15094 284
Change (%)1 27.1 24 -34.9 2 11 13.3 -3 3 82.2 109 -67.9 Total 34.4 39 -40.9
Source: Sample Survey 6. Conclusion The results and discussion made based on the sample survey show that accessibility plays a crucial role in forest land use change, especially on village safety/ supply forest. Those villages in easily accessible areas are able to continue the tradition of conserving the village safety/ supply forest even with a high population pressure. There is a different finding in the villages of remote areas—forests are under intense pressure due to socio-economic development. It is not possible to maintain the tradition of conserving a plot of land for the sake of safety/ supply forest. There are some villages in remote areas where the safety/ supply forest does not exist at all. The overall results for the district shows that the safety/ supply forest is decreasing at -40.9%. The most unwelcome and unfortunate finding is that the tradition of keeping safety/ supply forest for the sake of village community is declining in the minds of the people. Therefore, two things should be kept in mind while planning for the development of villages—accessibility seems to be the bottleneck for the development of villages and the people should be aware of the value of local tradition and culture which could play a pivotal role for sustainable management of the environment, that will benefit the local community and beyond. References Helmut J. Geist and Eric F. Lambin (2002), “Proximate Causes and Underlying Driving Forces of Tropical Deforestation”,
Bioscience, Feb 2002, Vol. 52(2), ProQuest Biology Journals, pp. 143. Kaimowitz, D. and Angelsen, A. (1998), Economic Models of Tropical Deforestation: A Review, Center for International Forestry Research, Indonesia.
Changes in Village Safety and Supply Forest in Kolasib District of Mizoram
91
Lalchamreia, H. and Rintluanga, Pachuau (2010), “Land Use Land Cover Change in Tuichhuahen Watershed, Kolasib District of Mizoram”, Geographic, Vol. 5, July, 2010, pp. 15–20, Geography Association of Mizoram, Aizawl, Mizoram. Myers, N. (1994), “Tropical Deforestation: Rates and Patterns”, The Causes of Tropical Deforestation, in Brown and Pearce (eds.), UCLP, pp. 27–40. Nagendra, H., Munroe, D.K. and Southworth, J. (2004), “From Pattern to Process: Landscape Fragmentation and the Analysis of Land Use/ Land Cover Change”, Agric., Ecosyst. Environ., Vol. 101, pp. 111–115. Rai, S.C., Sharma, E. and Sundriyal, R.C. (1994), “Conservation in the Sikkim Himalaya: Traditional knowledge and land use of the Malay Watershed”, Environmental Conservation, Vol. 21, pp. 30–34. Ramakrishna, P.S., Purohit, A.N., Saxena, K.G. and Rao, K.S. (1994), Himalayan Environment and Sustainable Development, Indian National Science Academy Diamond Jubilee Publication, New Delhi. Schweik, C.M., Adhikari, K. and Pandit, K.N. (1997), “Land Cover Change and Forest Institutions: A Comparison of Two Sub-basins in the Southern Shivalik Hills of Nepal”, Mountain Research and Development, Vol. 17, pp. 99–116. Sen, K.K., Semwal, R.L., Rana, U., Nautiyal, S., Maikhuri, R.K., Rao, K.S. and Saxena, K.G. (2002), “Patterns and Implications of Land Use/cover Change: A Case Study in Pranmati Watershed”. Mountain Research and Development, Garhwal Himalaya, India, Vol. 22, pp. 56–62. Singh, J.S., Pandey, U. and Tiwari, A.K. (1984), “Man and Forests: A Central Himalayan Case Study”, Ambio, Vol. 13, pp. 80–87. Singh, K.D., Sinha, B. and Lalchamreia, H. (2010), Report on ‘Survey Technique and Planning for Conservation and Sustainable Use of Biodiversity in Mizoram’ (Unpublished). State Remote Sensing Centre, (2005), Natural Resources Mapping of Mizoram using Remote Sensing and GIS, Kolasib District (A Project Report), Science, Technology and Environment, Planning Department, Aizawl, Mizoram. Website:http://lad.mizoram.gov.in/page/forest-act-1955.html (Access on: 8th November, 2013)
92
12 Provisioning of Municipal Services in Gangtok: Water and Garbage Management
Amrita Singh1 and Ranjana Laskar2 1Department of Geography,
Sikkim University, Tadong, Sikkim 2Department of Geography,
North-Eastern Hill University, Shillong, Meghalaya E-mail: [email protected], [email protected]
1. Introduction With regard to water, where the world is and where it might be, there is a gap between distribution of sustainable water supply and sanitation services which is simply astounding. People in the industrialized world use highly treated drinking water to flush their toilets, wash their cars and also water their lawns and golf courses while women in Africa walk many kilometres each day carrying water urns on their backs to provide a minimal supply of fresh water for their families. These conditions must be changed if the human beings have to avoid the global water crisis. Towards the end of the 20th century, world made great steps in providing water and sanitation services to the growing population. The overall percentage of people who have access to some form of improved water supply increased from 79 in 1990 to 82 in 2000 i.e. 4.1 billion people to 4.9 billion1 and this has been one of the remarkable change but still there was lot to cover on the global, as well as local context. At the turn of the century, there are still 1 billion people who lacked safe drinking water and almost 3 billion people lacked adequate sanitation. It was found that more than 2 billion children were dying every year from water-related diseases.2 Only three-fifth of Africans have access to safe and reliable water supplies while in North America and Europe, 90% of population have access to safe drinking water3 and this shows that the water is unevenly distributed across the world. One of the fundamental causes of water supply shortages is a short-circuiting of the water cycle. The capacity of water cycle increases due to environmental degradation, which decreases the quantity of good quality water to support expanding population. Poor land-use management practices and direct pollutant discharge also reduces the availability of fresh water, surface and ground-water. Water shortages are exacerbated by the lack of sanitation facilities which ultimately leads to the spread of water-borne disease. A modern water supply system involves industrial scale treatment and distribution systems which are inefficient and energy intensive. Modern sewage treatment systems waste nutrients as well as water and use excessive amount of energy. About 2% to 3% of the world’s energy consumption is used to pump and treat waste water. The cost of energy to supply water can easily consume half of a municipality’s budget in the developing countries.4 1.1 Scenario in the Study Area
Distribution of Water in Gangtok: Water is planet’s most vulnerable resource. Yet, as population continues to grow, many municipalities are faced with growing concerns about the availability of usable water to meet the demand. Even in areas where the water is plentiful, it must often be purified before it is acceptable for drinking. The cost of water is increasing and so, the drinking water standards grow increasingly more complex.
Provisioning of Municipal Services in Gangtok: Water and Garbage Management
93
In order to survive, water becomes pre-requisite and indispensable. There are two catchment areas in Sikkim, the upper Teesta and the Upper Rangit and these two rivers have been originating from the glacier and is the main river of the state with many of its tributary streams. Glacial fed lake Tamze (altitude-12, 500 ft.) is one of the sources of water supply and also the main source of water for Gangtok and another one is the stream named Ruteychu which is 16 km from the city. Most of the households get water by the central water system which is maintained and operated by Public Health and Engineering Department (PHED) and the main source of PHED water supply is this river only. Forty local seasonal streams are used by the Rural Management and Development Department of Sikkim government to supply water to outlying areas. Earlier, all these springs were very clean and the quality of water was also good. But with advancement of time, dumping of wastes in the springs and rivers has increased due to which environmental pollution has increased. 2. Objectives
• To study the distribution of water in the Gangtok city and in other different wards and whether there is water deficit or not. • To study the perception of people about the water supply system and the quality of water. • To study the success of Gangtok Municipal Corporation and the expectations of the citizens.
3. Database and Methodology Data is mainly collected through questionnaires and through discussions to the common people and also through interviewing the officials about the supply of water as well as waste disposal. Secondary data is through Urban Development and Housing Department (UDHD). The methodology followed generally includes the field survey and desk research. 4. Findings There are basically two ways in mountains from where people collect water or it can be said that these are the main sources of water—one is from natural springs and other is government water supply. In Gangtok, also these are the two main sources of water for the people but with bloom in construction and tourist activities, shortage of water is stirring as a more common problem in the recent days. Another reason for the shortage of water may be the increase in population and due to high demand or necessity and fulfilling this demand is a major challenge for the government maintaining the quality of water too. It has been found during the study that only 35%–40% of users receive 24-hour supply of water in Gangtok from GMC. As water has emerged as a global issue in the recent past, likewise waste disposal is also emerging as an area of concern in the global as well as local context. Waste management is also gaining its importance because these two: water and waste, are interconnected and together it contributes for the environmental betterment as well as degradation both. Waste disposal is another problem in front of the GMC. Solid waste disposal in GMC is estimated to be around 45 tonnes and only around 40% of this is collected by the UDHD and collection of wastes is almost negligible from the areas where road network is not good. In these inaccessible areas, many people burn the wastes in a fix or common place to maintain the hygiene but in doing so, they forget that it’s effecting the environment in other way. It ultimately leads to the pollution of the environment. And in many cases, these wastes are dumped into the Jhora’s1, polluting the river or stream water in the area. 1‘Jhora’s’ is a Local word Used in Sikkim to Represent Small Streams and Natural Springs are Referred as ‘Dhara’.

National Seminar on Management of Natural Resources for Sustainable Development: Challenges and Opportunities
94
Source: Survey, August 2012 Photo Plate 4.1: Dumping of Garbage in the Jhora’s Main problems responsible for this are: 1. The densely populated urban area of Gangtok does not have a combined drainage system to drain out the rainstorm water and waste water from the buildings and this is one of the problems of waste disposal. 2. Without a proper sanitation system, the practice of disposing sewage through septic tanks directly discharging into Jhora’s and open drains is prevalent which creates havoc for people as well as environment. The amount of supply of water through GMC is done through divisions of tanks and reservoirs in all the 15 wards and which is as follows:
Table 1.1: Supply of Water in all the Wards of GMC & Their Capacity
Sl. No. Zonal Tanks/ Reservoirs Total Capacity Area Covered 1. ENCHEY TANK It has two tanks of capacity 90000 & 55000 litres Covers the whole area of Gangtok bazar2. PRESS TANK 55,000 gallon Tadong, Deorali bazar, Syariand area of Panihouse 3. FIRE TANK 55,000 gallon Lingding, Panihouse&Namnam area4. BAZAR TANK 90,000 gallon Enchey compound & M.G Marg 5. HIGH-COURT TANK 35,000 gallon Old post Office area and below High Court area 6. SNT TANK Water is supplied from Enchey tank-55, 000 gallon Narkil hotel area below Palzor stadium & Upper Sichey 7. ZERO-POINT TANK 85,000 gallon Arithang& Development area 8. ALL SELEP TANK (main reservoir cum Supply tank) 90,000 gallon Goes to 3 Lakh gallon tank 9. SONA TANK Consists of two tanks, 35, 000 gallon and 85, 000 gallon TNHS complex (School) & Upper Development area 10. FOREST COLONY TANK 15, 000 gallon Forest colony area 11. UPPER DEVELOPMENT TANK Water comes from Sona tank-35,000 gallon Mandir Hotel area, Upper Development area 12. 3 LAKH GALLON TANK 3 lakh gallon Supplies to Housing Tank and Lower Sichey area 13. LOWER SICHEY TANK 85, 000 gallon Lower Sichey Complex, VIP complex &Sabjimandi 14. HOUSING TANK Consist of two tanks-55, 000 gallon & 85, 000 gallon Supplied to ICR complex, Daragaon& Upper & lower Tadongrespectively 15. 90, 000 GALLON TANK (reservoir tank) 90, 000 gallon Two lines-1) manipal Hospital complex &Saraswatimandir complex& Upper Tadong complex, 2) 5th& 6th Mile area as well as Ranipool area 16. SYARI TANK 1 lakh gallon Supplies to other tanks 17. 55, 000 GALLON TANK 55, 000 gallon Covers entire Syari Source: Survey 2012
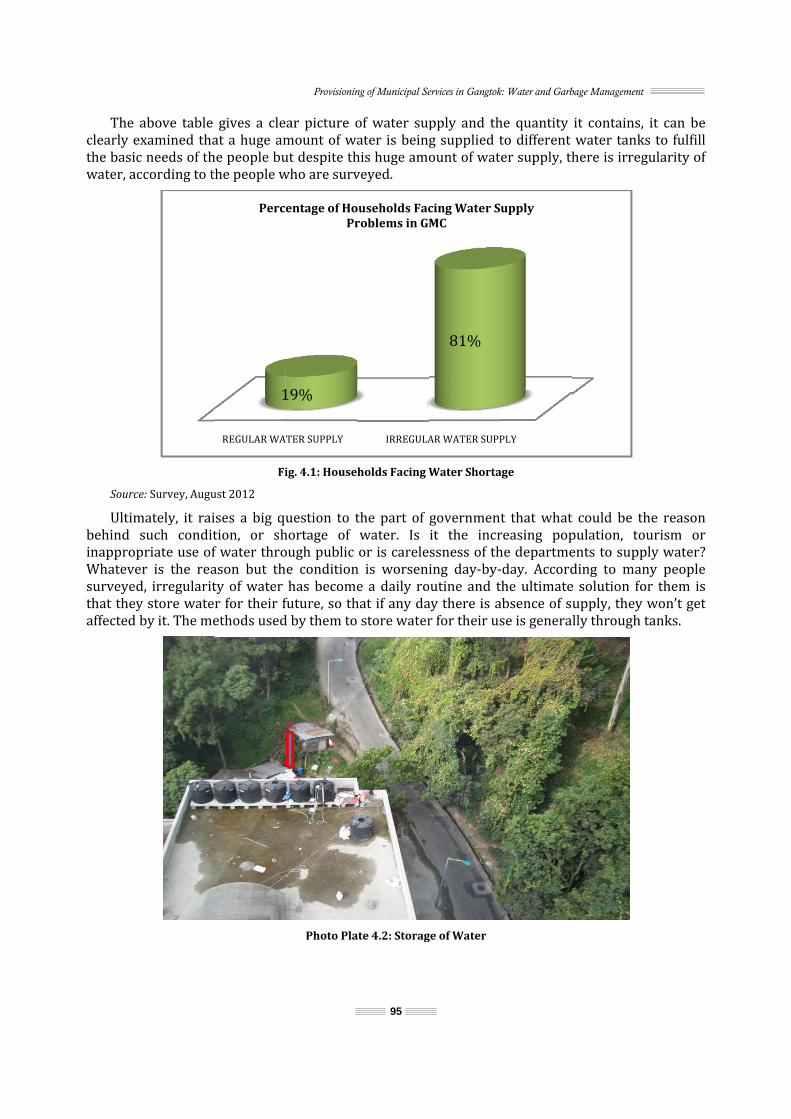
The aclearly exthe basic water, ac
SourceUltimbehind sinappropWhateversurveyedthat theyaffected b
above table xamined thaneeds of thcording to t
e: Survey, Augumately, it raisuch conditpriate use ofr is the read, irregularity store wateby it. The me
gives a cleat a huge amhe people buthe people w
Fiust 2012 ises a big qution, or shf water throason but thty of water r for their fethods used
REGULAR WA1
Perce
Provisioninar picture omount of waut despite thwho are surv
ig. 4.1: Househ
uestion to thortage of ough public e conditionhas becomefuture, so thd by them to
Photo Pla
TER SUPPLY19%
entage of HoPr
ng of Municipal Se
95
of water supater is beinhis huge amoveyed.
holds Facing W
the part of water. Is or is carelen is worsene a daily rohat if any da store water
ate 4.2: Storag
IRREGULA
ouseholds Facroblems in G
ervices in Gangtokpply and thg supplied tount of wat
Water Shorta
governmenit the incrssness of thing day-by-outine and tay there is ar for their us
ge of Water
AR WATER SUPP
81%
cing Water SMC
k: Water and Garbhe quantity to different er supply, th
age
t that whatreasing pophe departme-day. Accordthe ultimateabsence of sse is genera
PLY
upply
bage Managementit contains,water tankhere is irreg
t could be thpulation, toents to suppding to mane solution foupply, they lly through
t it can be ks to fulfill gularity of
he reason ourism or ply water? ny people or them is won’t get tanks.
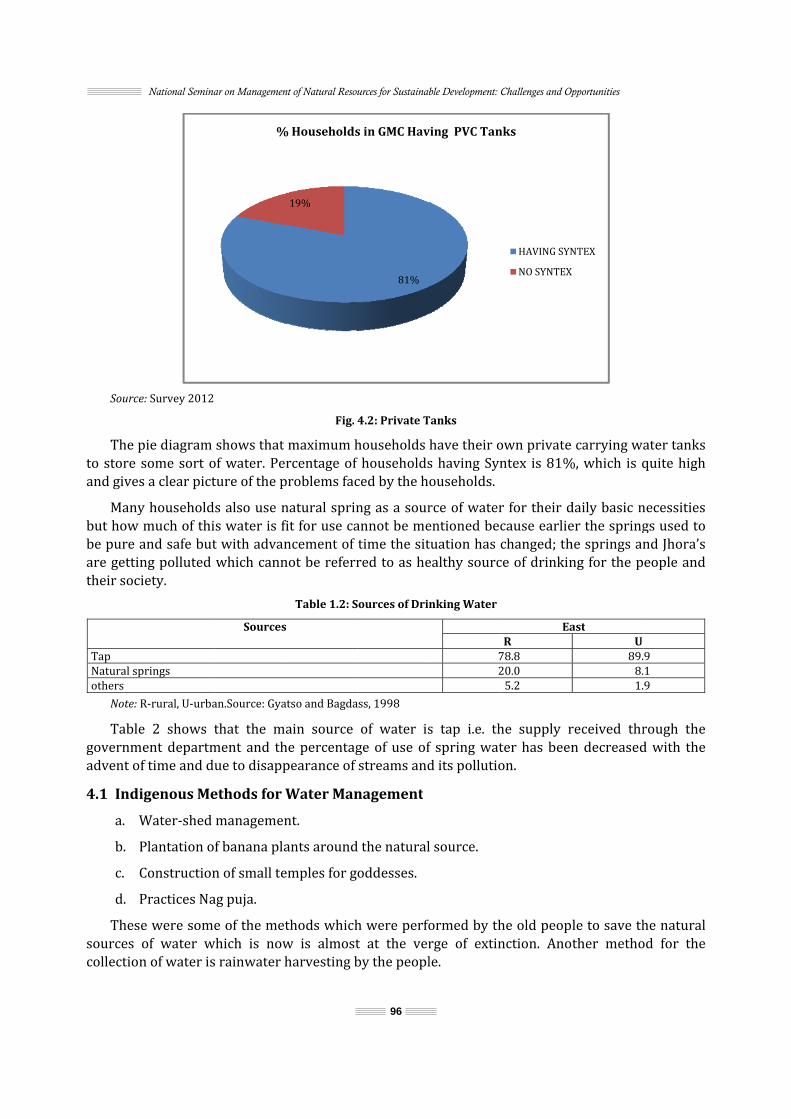
Source
The pto store sand givesManybut how be pure aare gettintheir sociTap Natural spothers
Note: RTablegovernmeadvent of4.1 India. Wb. Pc. Cd. PThesesources ocollection
National Semina
e: Survey 2012 pie diagram some sort os a clear picty householdmuch of thiand safe butng polluted iety. prings R-rural, U-urbae 2 shows tent departmf time and digenous MeWater-shed Plantation oConstructionPractices Nae were someof water wn of water is
ar on Managemen
shows that of water. Peture of the ps also use ns water is fit with advanwhich cannSources
an.Source: Gyathat the mament and thue to disappethods for Wmanagemenf banana plan of small teag puja. e of the metwhich is nows rainwater h
%
nt of Natural Resou
Fig. maximum hrcentage of problems facnatural sprinfit for use cancement of not be referrTable 1.2: S
s
atso and Bagdaain source he percentagpearance of Water Mannt. ants aroundemples for gthods whichw is almostharvesting b
19%% Households
urces for Sustainab
96
4.2: Private Thouseholds f householdsced by the hng as a sourannot be metime the sitred to as heSources of Dri
ass, 1998 of water isge of use ofstreams andnagement
d the naturaloddesses. h were perfot at the verby the peopl
81%
s in GMC Hav
ble Development:
Tanks have their os having Synouseholds.rce of waterentioned bectuation has ealthy sourcnking Water
72s tap i.e. thf spring watd its pollutiol source. ormed by thrge of extinle.
ving PVC Tan
Challenges and Op
own private ntex is 81%r for their dcause earliechanged; thce of drinkin
EaR78.820.05.2
he supply rter has beenon.
he old peopnction. Ano
nks
HAVING SYNNO SYNTEX
pportunities
carrying wa%, which is qdaily basic ner the springhe springs anng for the past
U 89.8.1.received thrn decreased
le to save thther metho
NTEX
ater tanks quite high necessities gs used to nd Jhora’s eople and
9 1 9 rough the d with the
he natural od for the

Source
In Figthe agricu
Source
Source
e: Survey 2011 g. 3, 77% peulture purpo
e: Survey 2012
e: Survey 2012
Photople’s answose, which h% Ho
Acceptable 9%
Provisionin
to Plate 4.3: Mwer is ‘yes’ thhelp them ov
Fig. 4.3: Rain
Fig. 4
23%ousehold's R
Una
ng of Municipal Se
97
Methods for What they do pvercome the
nwater Harve
.4: Quality of
7Rainwater Ha
cceptable 1%
ervices in Gangtok
Water Managepractice thise problem of
sting Method
Water
77%arvesting Sce
Excell5%
Good 8
k: Water and Garb
ment s method tof water to so
d
nario
ent %
85%
bage Management
o utilize rainome extent.
YESNO
t
water for

National Seminar on Management of Natural Resources for Sustainable Development: Challenges and Opportunities
98
In Fig. 3, the quality of water according to 85% of people is good because it has been noticed that main source of water supply is government and another reason is that almost 85%–90% of people do boil the water before consuming it. The below table clears the picture and shows the data for different methods used for the purification of drinking water. Table 3: Methods of Drinking Water Purification in Sikkim*
Methods Urban Rural TotalStraining through cloth 1.2 2.0 1.9With alum 0.0 0.3 0.2With water filter 25.0 4.9 7.8Boils water 86.6 67.5 70.3Electronic purifier 0.0 0.5 0.5Other methods 0.0 0.4 0.3Does not purify 9.1 29.5 26.5Note: In Table 3, total adds to more than 100% because households may use more than one method of purification. Source: NFHS-2, 1998–99, 2001 During the survey also, it is very clearly mentioned by the people that they boil the water before drinking it and which in one way purifies the water and other way fulfills the habit of consuming warm water too.
5. Conclusion and Suggestions At the end it can be said that water is the basic need of life for all human being with proper sanitation and sewage facilities, lacking which creates a lot of problem for the people as well as for the environment also. With the increase in population the need for the augmentation of drinking water supply in urban centers are becoming more and more pressing. Therefore, the government has been taking up the works of augmentation of water supply in such centres where the yield of water sources is decreasing. Therefore, while locating a water source for a particular urban area, selection of main source is very important. The department has been taking extreme care while executing project to maintain the stability of slope along the pipeline and the catchment areas by avoiding quarrying and deforestations. 5.1 Development Investment Program-Gangtok Water Supply Initial Environmental Examination (IEE) has been prepared for the Gangtok Water Supply Sub-project, especifically for the: 1. De-bunching existing pipelines with standard size and quality. 2. Extending water supply to peripheral areas. 3. Construction of additional 7 storage reservoirs of total capacity of 34.30 million litres. 4. Provision of 48 bulk water meters; and 5. Provision of 12, 000 household water meters and re-connections. 6. Further Suggestions
• Recycle system for the water generated after the sewage treatment. • Use of the sludge residue. • The health quality of women and children. • Rain harvesting methods. • Preservation and modernization of the indigenous methods of water management.

Provisioning of Municipal Services in Gangtok: Water and Garbage Management
99
• Proper documentation of complaints. • Access of garbage management in the inaccessible areas. • Educating people about effects of pollutions of garbage's when dumped into the Jhora’s through various programmes.
References James, K., Campbell, S.L. and Godlove, C.E. (2002), Watergy: Taking Advantage of Untapped Energy Efficiency. Opportunities in Municipal Water Systems, Alliance to Save Energy, Washington, p. 1. WHO and UNCF, 2000, Global Water Supply and Sanitation Assessment, p. 1. "Water Supply and Sanitation Collaborative Council (2000), Vision, Vol. 21, p. 1. World Health Organization (WHO) and United Nations Children’s Fund (UNCF), 2000, Global Water Supply and Sanitation Assessment, p. 1.
100
13 Community based Ecotourism as a Tool for Biodiversity Management: A Case Study of Manas Maozigendri Ecotourism Society, Assam
Annesha Borah and Nazneen Akhtar Department of Geography,
North-Eastern Hill University, Shillong, Meghalaya E-mail: [email protected], [email protected]
1. Introduction Biodiversity is a common concern of humankind, and an integral part of the development process. It is recognized that while biodiversity conservation can require substantial investments, it brings significant environmental, economic and social benefits in return. The Convention on Biological Diversity at the Rio Earth Summit, 1992, recognizes that ecosystems, species and genes are used for the benefit of humans. However, this should be done in a way and at a rate that does not lead to the long-term decline of biological diversity (LPSDP, 2007). Biodiversity matters for a whole variety of reasons: ethically, emotionally, environmentally and economically. It is at the very foundation of our society and the basis of our economic success and wellbeing. Hence, the need for its conservation and management can come in a way of sustainable ecotourism. Sustainable ecotourism can generate employment and income, thus providing a strong incentive for conservation. One such form of sustainable ecotourism is Community Based Ecotourism which helps to generate incentives to local communities for nature conservation through alternative income sources and livelihoods, and empower local communities. Great aesthetic value is attached to the biodiversity for which people visit from far and wide and spend a lot of money to visit wilderness and enjoy the aesthetic value of biodiversity amidst local culture. The ‘willingness to pay’ for the aesthetic value of wilderness and biodiversity has led to the development of ecotourism which is a sustainable form of tourism based on monetary estimate for the aesthetic value of biodiversity. Involvement of local community in ecotourism activities helps generating revenue thereby gaining the motivation to conserve the biodiversity. Community Based Ecotourism (CBET) has emerged as one of the development tools for biodiversity conservation based on the principle that biodiversity must pay for itself by generating economic benefits particularly for the local people. In the context of conservation, CBET is a form of community based natural resource management, a strategy for biodiversity conservation. CBET is therefore, the prospect of linking conservation and local livelihoods whilst simultaneously reducing rural poverty on a sustainable basis. Manas, situated in the north-eastern state of Assam, is known for its rare and endangered wildlife, not found anywhere else in the world. It is a National Park, Tiger Reserve and a World Heritage Site. The 80s were a turbulent time for Assam with the beginning of the movement to demand a separate land for the Bodos (an ethnic tribal community of Assam). This movement took a huge toll on the national park first, since the insurgent groups and militants used the forests as hideouts and second because, both national and international poaching groups took advantage of the situation leading to destruction. In 2003, the Bodo Accord resulted in the establishment of the

Community based Ecotourism as a Tool for Biodiversity Management: A Case Study of Manas Maozigendri Ecotourism Society, Assam
101
Bodoland Territorial Council (BTC) which brought with it a realization that Manas, once the pride of the Bodos, needed to be restored to its former glory. It was further realized that involvement of the local community in ecotourism activities will enable them to understand the value of resources, thereby leading to better protection, strong conservation as well as touristic utilization of resources in a sustainable manner. 2. Study Area The Manas National Park is one of the important world heritage sites (nature) situated in North-East India. The park is famous for tigers. It was declared a sanctuary on October 1, 1928 with an area of 360 km². In 1955, the area was increased to 391 km². Manas Tiger Reserve was created in 1973. It was declared a World Heritage site in December 1985 by the UNESCO. MNP is located at the confluence of Indian, Ethiopian and Indo-Chinese realms resulting in the magnificent biodiversity. The park which is situated in the north-west bank of river Brahmaputra is about 175 kms away from Guwahati, the capital of Assam. As per information provided by the Forest Department of Assam, there are 61 fringe villages in the park with total population 28,795 in 4,885 households. The main livelihood of these people is agriculture and other activity related to forest resources. People are aware about the conservation of forest resources and interested in tourism.
Fig. 1: Location Map of Manas National Park
3. Objective 1. To provide a broad conceptual framework for Community Based Ecotourism (CBET), and 2. To assess the activities undertaken by Manas Maozigendri Ecotourism Society (MMES), a community based organization for restoration of biodiversity in Manas National Park.

National Seminar on Management of Natural Resources for Sustainable Development: Challenges and Opportunities
102
4. Database and Methodology The study is primarily based on empirical view substantiated by both primary and secondary data obtained through field visits to MNP, from the staff of Manas Maozigendri Ecotourism Society, Aranyak, a Guwahati based NGO working for environment-related issues and State Forest Department. The research paper is qualitative and exploratory in nature. 5. Discussions
5.1 Community Based Ecotourism: A Tool for Biodiversity Conservation
5.1.1. Community based Ecotourism—A Conceptual Background Ecotourism is used simply to identify a form of tourism where the motivation of visitors and the sales pitch to them, centres on the observation of nature. Increasingly, this general sector of the market is called ‘nature tourism’. Ecotourism depends on maintaining attractive natural landscapes and a rich flora and fauna; therefore, helping communities earn money from ecotourism which provides both an incentive for conservation and an economic alternative to destructive activities (Wearing and Neil, 1999). True ‘ecotourism’, however, requires a proactive approach that seeks to mitigate the negative and enhance the positive impacts of nature tourism (United Nations, 2001). The International Ecotourism Society defines ecotourism as responsible travel to natural areas that conserves the environment and sustains the well-being of local people (ICES, 2004). This definition not only implies that there should be a recognition of, and positive support for, the conservation of natural resources, both by suppliers and consumers, but also that there is a necessary social dimension to ecotourism. The term ‘community-based ecotourism’ takes this social dimension a stage further. The term ‘community-based ecotourism’ is used to describe ecotourism ventures that are characterized by high environmental consideration, increased control and involvement of the local residents, as well as significant benefits for the host community (WWF-International, 2001). This is a form of ecotourism where the local community has substantial control over, and involvement in its development and management, and a major proportion of the benefits remain within the community (Wood, 2002). 5.1.2. Community-Based Ecotourism as a Tool for Biodiversity Conservation Community-based ecotourism (CBET) has become a popular tool for biodiversity conservation; based on the principle that biodiversity must pay for itself by generating economic benefits, particularly for local people. The main aim of CBET is the prospect of linking conservation and local livelihoods, preserving biodiversity whilst simultaneously reducing rural poverty, and of achieving both objectives on a sustainable (self-financing) basis. Conservation organizations fund CBET as a means of reducing local threats to biodiversity, such as through expanding agriculture, unsustainable harvesting of wild plants and animals, and killing wildlife that threatens peoples’ crops, their livestock or themselves. CBET provides an effective incentive for communities to take conservation action. This incentive is so high that people deliberately protect biodiversity to protect that income (Kiss, 2004). Case studies of CBET projects typically claim success in motivating communities to reduce their exploitation of wild plants and animal species, to help control poaching by outsiders, or to set aside part of their farm or grazing land as conservation areas. A study of CBET in Ecuadorian Amazon, brought to light that changes have taken place in hunting practices of the local community i.e. the Huaorani community due to CBET practices. For instance, the Amazon tapir and White-throated toucan was frequently hunted previously; but after CBET development, the Huaorani considered it a species that should be conserved because it is a preferred attraction for tourists (Rodríguez, 2008).

Community based Ecotourism as a Tool for Biodiversity Management: A Case Study of Manas Maozigendri Ecotourism Society, Assam
103
In a case study on CBET development around Simien Mountains National Park, it has been found that after the development of CBET in the village, the villagers have become aware that the park tourism is greatly dependent on biodiversity of the park. Because of economic reward from CBET, local communities are feeling the sense of ownership for the biodiversity. Economic benefits from ecotourism to local communities are clearly linked to conservation of the biodiversity that draws the tourists (Astarey, 2011). In another case study of CBET in Bale Mountain National Park, Ethiopia it has been found that the majority of the local villagers were engaged in conservation activities of fire protection (63%) followed by wildlife and forest protection (53%) in the national park, 23% helped providing information about illegal activities noticed in the park, and 18% were involved in ecotourism associations of the park. The communities were also involved with the work of park boundary demarcation and fence construction around homesteads to protect crops of local people from wildlife damage (Asmamaw and Verma, 2013). The success of CBET in biodiversity conservation has also been seen in India through several case studies. A study of CBET in Kerwa Village in Madhya Pradesh shows that after development of CBET in the village, the local villagers have contributed a lot to the conservation of forest. The villagers involved in plantation, fencing, checking illegal felling of trees, protection from fire, land filling, sanitation works etc. 70.2% of the villagers took part in plantation, 15.7% in fencing, 8.5% in checking illegal felling of trees, 2.8% in protection from fire, 1.4% in land filling and 1.4% in sanitation work (Bhattacharya et al., 2003). A study on CBET impact on conservation and environment brought to light that CBET in Andaman has led to coral reef protection training and environmental education. CBET provided an economic alternative to fishing, hunting, and harvesting forest and mangrove products (Goodwin, 2009). 6. Manas Maozigendri Ecotourism Society (MMES)
6.1 Origin The origin of Manas Maozigendri Ecotourism Society relates to the violent Bodo movement of 1990s. For many years, the Bodos had been suppressed by the state government, forcing them to start a mass political movement for a separate state. In 1993, a tripartite agreement was signed between the Bodo leaders, Central government and State government. But a couple of years after signing the accord, frustrated by the failure of the government to implement the agreement, the Bodos grouped together to form an armed outfit under the banner of Bodo Liberation Tigers to press for their demands. This was the dark period during which Manas was depleted of its resources. Since the southern boundary of Manas spans across the entire Bodo dominated territory, there was vast deforestation. Due to the complete breakdown of the law and order situation in and around Manas, the locals often took shelter in the forest to escape the atrocities of the policing forces. Taking advantage of this lawless situation, some unscrupulous businessmen started forming organized groups for poaching and felling, which got free access to the park. Some groups of poachers made sporadic attacks on the forest offices causing destruction to most of the protection camps in the park. This grim situation compelled the forest guards to abandon almost all the protection camps. The situation was so perilous that UNESCO declared it as a ‘world heritage site in danger’. Even during these troubled times, a small group of Bodo youth, the All Bodo Students Union (ABSU) from the Chapaguri Koklabari Anchalik Committee in the Koklabari area went ahead with their crusade of conserving Manas. They conducted motivation campaigns at selected areas where
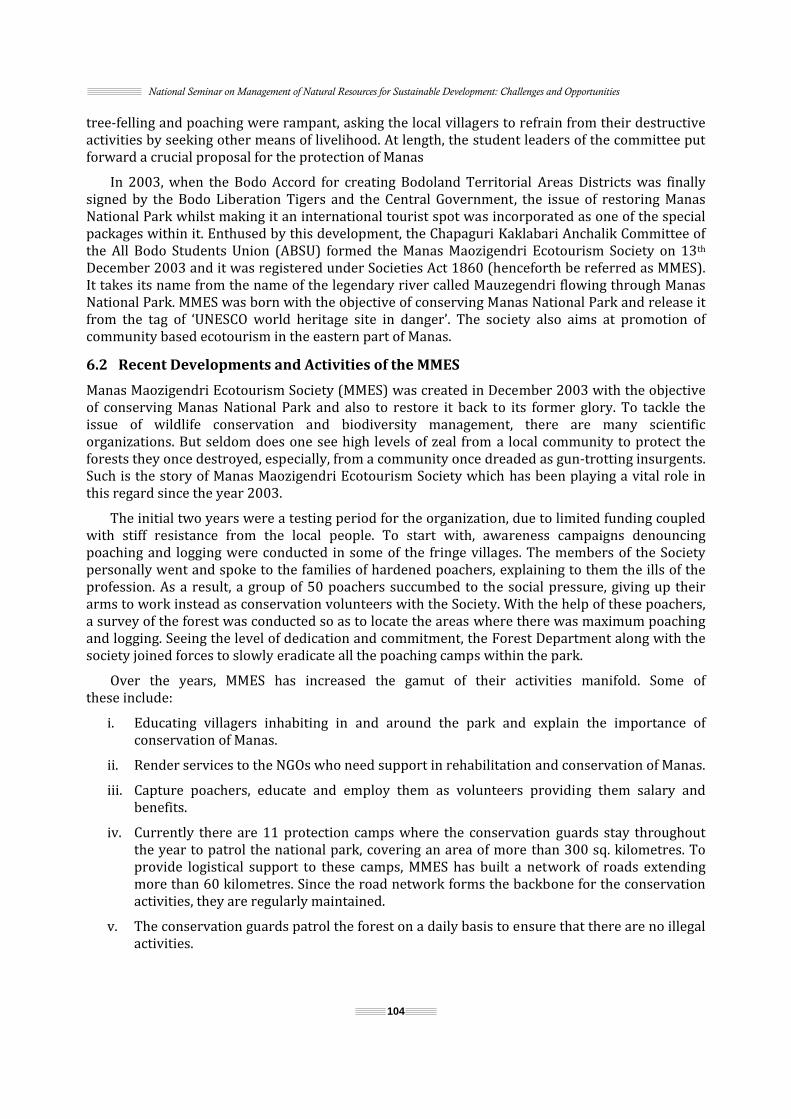
National Seminar on Management of Natural Resources for Sustainable Development: Challenges and Opportunities
104
tree-felling and poaching were rampant, asking the local villagers to refrain from their destructive activities by seeking other means of livelihood. At length, the student leaders of the committee put forward a crucial proposal for the protection of Manas In 2003, when the Bodo Accord for creating Bodoland Territorial Areas Districts was finally signed by the Bodo Liberation Tigers and the Central Government, the issue of restoring Manas National Park whilst making it an international tourist spot was incorporated as one of the special packages within it. Enthused by this development, the Chapaguri Kaklabari Anchalik Committee of the All Bodo Students Union (ABSU) formed the Manas Maozigendri Ecotourism Society on 13th December 2003 and it was registered under Societies Act 1860 (henceforth be referred as MMES). It takes its name from the name of the legendary river called Mauzegendri flowing through Manas National Park. MMES was born with the objective of conserving Manas National Park and release it from the tag of ‘UNESCO world heritage site in danger’. The society also aims at promotion of community based ecotourism in the eastern part of Manas. 6.2 Recent Developments and Activities of the MMES Manas Maozigendri Ecotourism Society (MMES) was created in December 2003 with the objective of conserving Manas National Park and also to restore it back to its former glory. To tackle the issue of wildlife conservation and biodiversity management, there are many scientific organizations. But seldom does one see high levels of zeal from a local community to protect the forests they once destroyed, especially, from a community once dreaded as gun-trotting insurgents. Such is the story of Manas Maozigendri Ecotourism Society which has been playing a vital role in this regard since the year 2003. The initial two years were a testing period for the organization, due to limited funding coupled with stiff resistance from the local people. To start with, awareness campaigns denouncing poaching and logging were conducted in some of the fringe villages. The members of the Society personally went and spoke to the families of hardened poachers, explaining to them the ills of the profession. As a result, a group of 50 poachers succumbed to the social pressure, giving up their arms to work instead as conservation volunteers with the Society. With the help of these poachers, a survey of the forest was conducted so as to locate the areas where there was maximum poaching and logging. Seeing the level of dedication and commitment, the Forest Department along with the society joined forces to slowly eradicate all the poaching camps within the park. Over the years, MMES has increased the gamut of their activities manifold. Some of these include: i. Educating villagers inhabiting in and around the park and explain the importance of conservation of Manas. ii. Render services to the NGOs who need support in rehabilitation and conservation of Manas. iii. Capture poachers, educate and employ them as volunteers providing them salary and benefits. iv. Currently there are 11 protection camps where the conservation guards stay throughout the year to patrol the national park, covering an area of more than 300 sq. kilometres. To provide logistical support to these camps, MMES has built a network of roads extending more than 60 kilometres. Since the road network forms the backbone for the conservation activities, they are regularly maintained. v. The conservation guards patrol the forest on a daily basis to ensure that there are no illegal activities.

Community based Ecotourism as a Tool for Biodiversity Management: A Case Study of Manas Maozigendri Ecotourism Society, Assam
105
vi. Understanding the importance that the grasslands play in the ecosystem, the MMES annually maintain the grasslands by burning them in a controlled way. Wildlife populations have surged back as have the migratory birds. vii. In case of man–animal conflict, where the elephants often damage the houses of villagers, MMES is paying the affected villagers compensation to repair the house. viii. A conservation and monitoring centre of the critically endangered Bengal Florican has been set up in the Koklabari farm. Awareness campaigns are regularly held in fringe villages for educating the people on the importance of conserving the rich biodiversity of Manas. School children are taught to appreciate their rich inheritance by taking them on excursions in the national park. ix. MMES’s long cherished dream to make Manas into an international tourist destination was accomplished in 2005 when the first foreign tourist stayed at their Jungle camp. x. Open jeep safaris, bird watching, jungle trails, rafting on the Manas, cultural trails are some of the options which MMES offers to tourists depending on their interest. With very limited sources of revenue for their conservation activities, tourism has been providing them with the much needed funds. xi. Five eco-camps at Gomphu, Pangtang, Shillingtoe, Pangbang and Norbugang have been set up along the trail for visitors. The eco-camps and the trails, both are being managed by community committees with a benefit-sharing mechanism (75% goes to individuals providing services; 20% towards community fund; and 5% to the park). RMNP in collaboration with Nature Recreation & Ecotourism Division, Ministry of Agriculture & Forests, and Tourism Council of Bhutan has also drawn up strategy plans for its marketing, service delivery, monitoring, upkeep and others. xii. On June 6, 2012, MMES Celebrated World Environment Day by planting 100000 trees at Daodhara Reserve Forest adjacent to core area of Manas National park. The area was encroached upon for inhabitation and farming. MMES appealed to the encroachers and with the help of the local community was able to relocate them. The area also forms part of the proposed extension of the Park. 7. Findings and Conclusion We find that MMES is doing commendable work in the restoration of biodiversity in Manas National Park and they are using tourism as a tool. MMES is one of the numerous dedicated community-based organisations (CBOs) that have been formed since the Bodo Peace Accord in 2003 to protect Manas. It has been found that: i. MMES has successfully motivated the erstwhile poachers and former extremists about the importance of conservation of our biodiversity and involved them in the work of maintenance of Manas National Park. ii. For the development of Manas, MMES is using eco-tourism activities and participation of local people of fringe villages.
iii. MMES runs various conservation programs, cultural self-help groups, handicraft self-help groups and conducts regular patrolling inside the park in association with the Forest Department to stop poaching and cattle grazing. iv. Manas Maozigendri jungle camp has been set up for the tourists and is successful in offering the most pleasing tourism services to the visitors and one of the most authentic wilderness experiences. The camp is set up at the eastern border of the park, in a plantation meant for rearing the famous Muga silk of Assam.

National Seminar on Management of Natural Resources for Sustainable Development: Challenges and Opportunities
106
v. And like them, other community based organizations like Raigajli Eco-tourism and Social Welfare Society (RESWS) in Chirang district, (now dissolved) Manas Souchi Kongor Ecotourism Society (MSKETS) in Baksa have evolved. vi. MMES is able to get international recognition for their commendable work. Their initiative has received appreciation from UNESCO World Heritage Commission. vii. In recognition of their outstanding services towards biodiversity restoration in Manas, they received Anirudh Bhargava Award of Environment from INTACH in 2005. viii. MMES also received the Prestigious Amrita Devi Bishnoi Wildlife Protection Award-2006–from the Ministry of Environment & Forests, Govt. of India. ix. MMES received the Award of Excellence in Conservation 2006 from Kolkata Conservators of Nature. x. Today, the Manas National Park, a tiger reserve under Project Tiger, an elephant reserve, and a biosphere reserve, spread across 950 square km, is out of the UNESCO danger list and has been commended for conservation efforts. The national park is one of the richest biodiversity hotspots in the country: home to over 550 species of plants, 60 mammals, 400 birds, 42 reptiles, 7 amphibians, 54 fishes, and at least a 103 recorded species of invertebrates. It’s perhaps the last place on earth where one can spot out the critically endangered pygmy hog, the Assam roofed turtle, and the hispid hare. The credit for this successful turn-around in part belongs to MMES. To conclude, Manas National Park has been able to make rapid strides in initiatives relating to eco-tourism as well improve forest management through community based eco-tourism. It has tremendously helped to improve the standard of living of the Bodo people for example, through increased disposable income of individuals. Besides these, there is an underlying concept of development of empowerment of local people of host communities which can be divided into four different categories: Economic, psychological, social and political. In economic terms, CBET in MNP has generated long-term benefits that are distributed equitably within the host communities and can be used for the constant improvement of the community’s infrastructure. Moreover, it has contributed to the psychological empowerment of the local people by enhancing their sense of self-esteem and by cultivating pride for their cultural and natural heritage. This happens because ecotourism reveals to the public the value of host community in terms of natural beauty or cultural uniqueness. In addition, CBET has strengthened social bonds within the community by promoting cooperation among its members. Finally, it has brought about political empowerment, since it creates a forum for the expression of peoples’ voices concerning issues of local development. Therefore, CBET activities through organizations like Manas Maozigendri Ecotourism Society in Manas National Park have been benefitting both, local community in particular and biodiversity conservation and management at large. References Asmamaw, D. and Verma, A. (2013), “Ecotourism for Environmental Conservation and Community Livelihoods, the Case of the Bale Mountain National Park”, Ethiopia Journal of Environmental Science and Water Resources, Vol. 2(8), pp. 250–259. Asteray and Mulugeta (2011), Community Based Ecotourism (CBET) as a Tool for Biodiversity Conservation and
Sustainable Development: A Case Study on the Simien Mountains National Park, Addis Ababa University. Bhattacharya, A.K., Banerjee, S. and Saksena, V. (2003), “Community Based Ecotourism–A Case Study of Kerwa”, Van Vihar National Park Catchments, Bhopal (Madhya Pradesh), India. Tourism Recreation Research, Vol. 28(1). Goodwin, H. and Rosa, S. (2009), Community-Based Tourism: A Success?, University of Greenwich.

Community based Ecotourism as a Tool for Biodiversity Management: A Case Study of Manas Maozigendri Ecotourism Society, Assam
107
Kiss, A. (2004,) “Is community-based Ecotourism a Good Use of Biodiversity Conservation Funds?”, Trends in Ecology and Evolution, Vol. 19(5). Leading Practice Sustainable Development Program for the Mining Industry (2007), Biodiversity Management, Department of Industry, Tourism and Resources, Australian Government. Stronza, A. Durham, H. and William (2008), Ecotourism and Conservation in the Americas. Available at www.cabi.org (Accessed on 21/11/2013). United Nations. (2001), UNEP Manual for the International Year of Ecotourism, pp. 1–18, Retrieved from www.uneptie.org/tourism/home/html: United Nations Environment Program. Wearing, S. and Neil, J. (1999), Ecotourism: Impacts, Potentials and Possibilities. Reed Educational and Professional Publishing Ltd, Oxford, p. 163. Wood, M.E. (2002), Ecotourism: Principles, Practices and Policies for Sustainability. United Nations Environment Program, Division of Technology, Industry and Economics and the International Ecotourism. Paris, France.

108
14 Conservation and Management of Water Resources: A Case study of Duga, Sikkim Himalaya
Basanti Rai Department of Geography, Sikkim University, Gangtok
E-mail: [email protected]
1. Introduction Water is an inherent human need. Among all the services of nature, water is indispensable for survival of all forms of life on earth. Three-quarters of the world is covered with water, but most of it is saline. The saline water present in the earth is 92%, 2% is locked in ice and only 1% is potable water. Springs are the important source of water for mountain people. The mountain areas cover 24% of the world’s land surfaces and are home to 12% of the global human population with a further 14% living in their immediate vicinity (ICIMOD, 2010). Most of the world’s major rivers have their origin in the mountains and more than half of the world’s mountain areas play a vital role in supplying water to downstream region. The Himalayas, generally considered to have an abundance of water, are suffering from seasonal drying and extinction of its springs—the main source of water for many people living there (L. Coulson et al., 2010; G.C. Joshi, 2004; S. Tambe et al., 2009; G.C.S Negi et al., 1996). Mountain springs, locally known as Dharas are the natural discharges of groundwater from underlying various aquifers (Tambe et al., 2012). Springs form the only reliable and sustainable source of fresh water in the Himalayan region. The mountain people have been using spring as source of water for domestic as well as for agricultural purposes (G.C. Joshi et al. 1996, 2002, 2004; S. Tambe et al., 2012). Various studies from Western and Eastern Himalaya show that the probable factors for the marked decline of spring discharge and incidence of springs becoming seasonal are climatic and anthropogenic factor; where anthropogenic factor is adding more support in making springs dead, especially due to the developmental activities such as road and bridges, buildings, construction work etc. (Tambe et al., 2012). Thus, it is leading to inadequate amount of rainwater percolation down into the aquifers, preventing the springs recharge during monsoon season and causing water shortages in the dry winter season. Most of the studies have also focused climate change as a new threat to natural springs and its marked decline (Tambe et al., 2012, L. Coulson et al., 2010, P.K. Rawat et al., 2011). Various studies done on springs advocate that they are highly dependent on local precipitation and also depend on recharge area characteristics (Negi and Joshi, 2004, Tambe et al., 2012). The precipitation pattern of the region usually gets influenced by presence of local orographic features. The lower part of South and West district of Sikkim receives comparatively less amount of rainfall due to being located in rain shadow zone of Darjeeling Hills. According to Dhara Vikas Report, 8 blocks, 53 Gram Panchayat units and 293 Gram Panchayat ward of Sikkim are under dry condition and 700 springs are under critical situations. The study was carried out in the watershed of rural Central Pendam, Duga Block, Eastern part of Sikkim Himalaya embracing nine natural springs with an idea to understand relationship between spring discharge and rainfall pattern. It is also to address the water problem of the area and to document the adaptive water management initiatives taken by water user group and the local people.

Conservation and Management of Water Resources: A Case study of Duga, Sikkim Himalaya
109
2. Study Area Descriptions
2.1 Location and Climate The Central Pendam watershed lies in the Eastern part of Sikkim Himalaya which is located between 27.197-27.215 N to 88.526-88.548 E and altitude ranges from 711 to 1486 metre. This area has been recognized as among the driest part of Sikkim. The entire population of this belt relies on natural springs for drinking water and domestic purpose as well as for agriculture. The household survey shows dependency of 30 households per springs. The area exhibits temperate climatic condition with mean temperature highest in July (21.98±0.42) and lowest in January (9±1.24). The temperature usually remains moderate in rest of the period. The highest mean rainfall has been observed in the month of July-August (886.57±74.94) and lowest in the month of October-February (16.80±9.88).
Map I: Map Showing Study Area, Duga Map II: Map Showing Driest Part of Sikkim
2.2 Methodology Meteorological data such as rainfall, temperature, humidity data are acquired from Automatic Weather Station (AWS) of Indian Space Research Organization (ISRO), which has been placed in study area at Block Administration Centre, Duga. This data has been be used to develop relationship between spring discharge, rainfall and other factors. Springs discharge measurement is taken at monthly intervals from March to August 2013 with the help of a measuring jar and a stop watch. Altitude and co-ordinates system of the spring catchment are taken using GPS. 3. Results and Discussion
3.1 Rainfall Characteristics The local climatic condition and orographic features plays an important role in rainfall distribution. The rainfall trend of the last three years of the study area shows that rainfall starts increasing from March to August and diminishing trend starts from onset of September to February (see Fig. II).
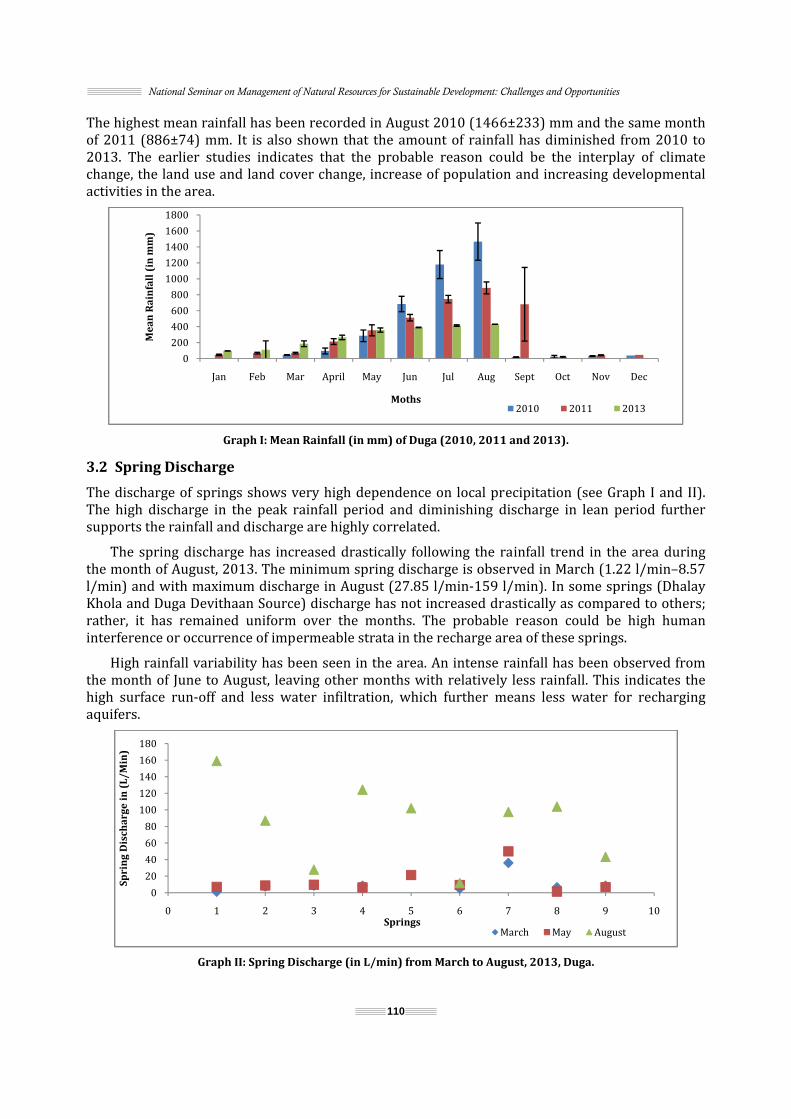
National Seminar on Management of Natural Resources for Sustainable Development: Challenges and Opportunities
110
The highest mean rainfall has been recorded in August 2010 (1466±233) mm and the same month of 2011 (886±74) mm. It is also shown that the amount of rainfall has diminished from 2010 to 2013. The earlier studies indicates that the probable reason could be the interplay of climate change, the land use and land cover change, increase of population and increasing developmental activities in the area.
Graph I: Mean Rainfall (in mm) of Duga (2010, 2011 and 2013).
3.2 Spring Discharge The discharge of springs shows very high dependence on local precipitation (see Graph I and II). The high discharge in the peak rainfall period and diminishing discharge in lean period further supports the rainfall and discharge are highly correlated. The spring discharge has increased drastically following the rainfall trend in the area during the month of August, 2013. The minimum spring discharge is observed in March (1.22 l/min–8.57 l/min) and with maximum discharge in August (27.85 l/min-159 l/min). In some springs (Dhalay Khola and Duga Devithaan Source) discharge has not increased drastically as compared to others; rather, it has remained uniform over the months. The probable reason could be high human interference or occurrence of impermeable strata in the recharge area of these springs. High rainfall variability has been seen in the area. An intense rainfall has been observed from the month of June to August, leaving other months with relatively less rainfall. This indicates the high surface run-off and less water infiltration, which further means less water for recharging aquifers.
Graph II: Spring Discharge (in L/min) from March to August, 2013, Duga.
020040060080010001200140016001800
Jan Feb Mar April May Jun Jul Aug Sept Oct Nov Dec
Mea
n R
ain
fall
(in
mm
)
Moths 2010 2011 2013
020406080100120140160180
0 1 2 3 4 5 6 7 8 9 10Spri
ng
Dis
char
ge in
(L/
Min
)
Springs March May August

Conservation and Management of Water Resources: A Case study of Duga, Sikkim Himalaya
111
3.3 Water Conservation and Management The rural inhabitants of Sikkim: Himalaya in general and Duga area in particular, have been implying a variety of measures to preserve water resources. Based on the local people’s perception, it has been three decades that the area has undergone through water crisis. The change in land use and land cover and water scarcity has some causal relationship as such the change in land use may lead to water scarcity and vice versa. A typical example is, people used to cultivate rice before which is a form of terrace farming. In rice cultivation, sufficient water is required and holding the water in the blocked field’s means sufficient water will be able to infiltrate in the ground thereby recharging the aquifers. Presently, the area under rice cultivation is very less and it is done only in the lower part area. Thus, people feel that the change in land uses could be a probable reason for diminishing discharge. In order to cope with the water-scarce situation, water user group and local people have initiated various water management techniques and practices. 3.3.1. Fencing and Plantation Fencing and plantation in the spring’s source area have commonly been adopted. It helps to reduce the human interference in the water source. The local people and water users group are involved in tree plantation near spring source with an idea to attract water. Plants such as Kaizal tree, Kabra, Lampati and Banana plant are commonly seen in the study area. The Lampati tree is also very good for water conservation. Unfortunately, the banana tree actually extracts lot of water from the soil instead (L. Coulson, 2010). 3.3.2. Devithaan or Sacred Groves Other important local practice is Devithaan or sacred grove to prevent human interference in the source area. It helps in preventing spring from pollution because they are considered holy sites. Additionally, it also prevents water from biological contamination and keeps water clean for potable use. While, these practices enable to protect the immediate area near the springs; do nothing to protect the actual recharge areas (L. Coulson, 2010). Such kind of practices needs to be done in taking much larger catchment area. 3.3.3. Rooftop Water Harvesting Rain is the ultimate source that feeds all these sources. Rainwater is collected from roofs or other impermeable surfaces and is stored for non-domestic purposes, especially, during scarcity condition. The collected water can be used for non-potable such as irrigation, cleaning utensils, toilet flushing etc. It can also be used for drinking purposes, if properly treated. In the upper belt of the area, the rain water harvesting is very common among the households. The altitude effect is seen in the rainfall pattern as such the upper part receives little more rainfall than lower part area. The roof of the house is well channelized with the help of locally available bamboo or rubber pipe to make rainwater flow into the tanks.

National Seminar on Management of Natural Resources for Sustainable Development: Challenges and Opportunities
112
Plate I: Rooftop Rainwater Harvesting in the Study Area
Plate II: Preservation of Springs (Devithaan) as Sacred Groves
3.3.4. Rainwater Harvesting and Spring-shed Development This rainwater has environmental advantage and purity over other water alternatives (H.P Singh et al., 2011). The rainwater harvesting not only helps to conserve water but it also saves energy which is required to operate a centralized water system designed to treat and pump water. It also lessens soil erosion and flash floods caused by run-off, as some rainwater is captured and stored. Most importantly, rainwater harvesting is useful and significant in recharging aquifers. One such example is spring-shed development under Dhara Vikas, a government sponsored programme. The whole mechanism for spring-shed development is based on geohydrology techniques understanding the local geology, ground-water dynamics, climatic conditions and the spring discharge and its characteristics. With considering these parameters, recharge area of spring will be identified and appropriate techniques will be adopted such as trenches, pit dams, drains etc. (see Plate III). When it rains, the surface run-off water drains into trenches, gets stored, gets infiltrated and recharges the underground aquifers. The ultimate result of such practices is the augmentation of spring discharge even in dry periods and to make springs perennial. The spring-shed development under Dhara Vikas showed a promising result.

Conservation and Management of Water Resources: A Case study of Duga, Sikkim Himalaya
113
Source: Dhara Vikas Report. Plate III: Spring-shed Development at Teen-dharey Source, Duga done under Dhara Vikas
4. Conclusion The local people perceive that the reason for the water scarcity (decrease in spring discharge) is due to the change in agricultural practices; deforestation, developmental activities (roads, buildings), growing population etc. A desirable public awareness for water conservation and management has been seen in the area which is very important in prudent water utilization. The high dependence of springs on local precipitation has been found thereby indicating that main source of springs for recharge is rainfall and so are the water management practices, which highly rely on rainwater. Roof rainwater harvesting is commonly adopted in the area to cope with water shortage. Devithaan or sacred grove is another important local practice to preserve springs. Plantation and fencing has been done in most of the springs which in turn help to attract water and reduces the human interference in the spring site. However, such practice is restricted to discharge area only as such embracement of broader spring catchment area would results in better conservation. Rainwater harvesting for spring-shed development has been seen as a promising method for water conservation and management, which not only focuses on scientific inputs but also encourages the local knowledge. Spring-shed development also helps to lessen the soil erosion, flash floods thereby capturing the surface run-off. 5. Recommendations The present situation demands new solutions since the traditional knowledge-based techniques used to manage water resource are no longer adequate. The amalgamation of both scientific and traditional techniques will help better to cope with water problem and the area also demands for well-equipped scientific research such as environmental isotopes studies. Acknowledgement This is a working paper under the project funded by Board of Research in Nuclear Science (BRNS), Govt. of India. I would like to acknowledge the core head. Special thanks to Manoj Chettri, BAC Duga for endless support during field work. I am very much grateful to RMDD, Govt. of Sikkim for field support and extra guidance.

National Seminar on Management of Natural Resources for Sustainable Development: Challenges and Opportunities
114
References Alison, M. Anders, Gerard, H. Roe, Bernard, Hallet, David, R. Montgomery, Noah, J. Finnegan and Jaakko, Putkonen (2006), “Spatial Patterns of Precipitation and Topography in the Himalaya”, Geological Society of America,. Daniel, Viviroli, Rolf, Weingartner and Bruno, Messerli (2003), “Assessing the Hydrological Significance of the World’s Mountains”, BioOne, pp. 32–40. Fetter, C.W. (2001), Applied Hydrogeology. United States of America: Merrill Publishing Company. ICIMOD, Mirjam Macchi (2010), Climate Change Impact and Vulnerability. International Centre for Integrated Mountain Development GPO Box 3226, Kathmandu, Nepal, June. Joshi, G.C.S Negi and Varun (1996), “Geohydrology of Springs in a Mountain Watershed: The Need for Problem Solving Research”, Current Science. Joshi, G.C.S Negi and Varun (2002), “Drinking Water Issues and Development of Spring Sanctuaries in a Mountain Watershed in the Indian Himalaya”, Mountain Research and Development. Joshi, G.C.S Negi and Varun (2004), Rainfall and Spring Discharge Pattern in Two Small Drainage Catchment in the Western Himalayan Mountain, India, (Kluwer Academic Publisher). Joshi, Girish C.S Negi and Varun (2004), Rainfall and Spring Discharge Pattern in Two Small Drainage Catchment in the Western Himalayan Mountain, India. Kluwer Acaademic Publisher. Khadse, G.K., Talkhande, A.V., Kelkar, P.S. and Labhasetwar, P.K. (2011), “Conservation, Development and Management of Water Resources”, International Journal of Water Resources and Arid Environments, pp. 193–199. Laura, Coulson, Khan, Azim and Sharma (2010), Spring Development in Sikkim. Mays, Larry W. (2011), Ground and Surface Water Hydrology, United States of America: Don Fowley,. Rawat, Ajay S. and Sah, Reetesh (2006), Traditional Knowledge of Water Management in Kumaon Himalaya, Vol. 10(3). Sandeep, Tambe, Ghanashyam, Kharel, Arrawatia, M.L., Kulkarni, Himanshu, Kaustubh, Mahamuni, and Ganeriwala, Anil K. (2012), “Reviving Dying Springs: Climate Change Adaptation Experiments From the Sikkim Himalaya.” BioOne, pp. 62–72. Sati, Manvendra Nayal and Mukesh (2007), Geo-Hydrological Studies for Augmentation of Spring Discharge in the Western Himalaya, G.B. Pant Institute of Himalayan Environment & Development,. Singh, H.P., Sharma, M.R., Hasan, Quamural and Hasan, Naved (2011), “Narrowing the Demand and Supply Gap through Rooftop water Harvesting—A Case Study of Kutlehar Area in Shiwalik Hills of lower Himalaya,” International Journal on Emerging Technologies, pp. 103–108. Upasani, Himanshu Kulkarni and Devdutt (2010), Geohydrology of Springs, Advanced Center for Water Resources Development and Management, September.

115
15 Participatory Water Projects Bringing in Unequal Burden: Women’s Experiences from Kerala
Lekha D. Bhat Department of Social Work,
Central University of Mizoram, Aizawl, Mizoram, India E-mail: [email protected]
1. Introduction In India, women operate from a societal structure that is marked by remarkable inequality, gendered division of labour and responsibilities. Ensuring access to natural resources could considerably bring down their burden; amongst this, water as a natural resource plays an important role. It becomes solely women’s responsibility to ensure availability of adequate quantity and quality of water, failure of which would bring in additional responsibilities like fetching water, caring for the water-borne disease affected family members etc. In the neo-liberal paradigm, when the State is withdrawing from its social welfare responsibilities like providing water supply and primarily making it private and community responsibility, its implications have more profound, intense and adverse impact on women’s lives. This paper, holding such a perspective, takes the example of Jalanidhi Water Project of Kerala and analyzes how the community-based water project brings in additional tensions and problems to women’s lives per se. Women play a central role in management, storage and conservation of water. Lives of women are differently influenced by the availability of clean water than men because ensuring domestic water availability is primarily women’s responsibility and need. Yet, gendered nature of water policy and interventions is less studied by scholars. Similarly the sociological literature does not recognize gender inequalities beyond women’s role in the level of domestic water collection, their efforts of ensuring adequate quantity of water for household. There is a need to study State’s water schemes and programmes through a gender lens so as to understand how such projects increases women’s burdens and responsibilities. 2. A Dignified Existence of Life: Role of Water The human right to water is founded on the concept of human dignity (Jeffords and Shah, 2013). Consuming water is necessary for survival and the person who is denied this right, is denied a dignified human existence. Over one billion people lack access to safe and clean water and out of which more than 80% live in rural areas (WHO, 2004). Some of the reasons for drinking water crisis are as follows: 1. Insufficient and decaying infrastructure for water delivery, especially in rural areas. 2. Insufficient funding and capacity for maintenance and expansion of water supply systems. 3. Pollution of traditional water resources. 4. Reduced access and depletion of available water resources (Langford, 2005).

National Seminar on Management of Natural Resources for Sustainable Development: Challenges and Opportunities
116
Access to clean drinking water is the fundamental human right, denial of which has profound impacts on other human rights like health, well-being etc.. The United Nations Millennium Development Goals aim to halve, by 2015, the proportion of the population in the world without sustainable access to safe drinking water and basic sanitation. Various international conventions like, the Convention on the Elimination of All Forms of Discrimination against Women, the Convention on the Rights of the Child and the Convention on Persons with Disabilities have recognized access to water as a human right. In conventions like International Covenant on Economic, Social and Cultural Rights, the right to water is not explicitly mentioned; but it is part of many other rights like right to health etc. (Irujo, 2007). In September 2010, the UN resolution explicitly recognized the human right to water and sanitation (Jeffords and Shah, 2013). Various countries’ constitutions and judicial mechanisms also uphold the right to water as a fundamental right. In Indian scenario, though the Constitution has not explicitly listed out the right to water as a fundamental right, the courts have interpreted that the fundamental Right to Life in its widest interpretation also covers right to water (Mehta v. Union of India 2004). The right to water has been recognized by the Supreme Court of India for the past two decades, thus giving it an uncontested basis (Cullet, 2013). In response to drinking water crisis, various approaches have emerged which are in various ways congruent with the international conventions. The main approaches can be summarized as follows: (Langford, 2005). 1. Commodity Approach: Since late 1980s this approach emerged which considered the use of economic tools and market to ensure water supply. According to this approach, water should be priced and water delivery should be opened for markets. 2. Public Approach: This approach argues that water should be strictly under the control of the governments. Public must be involved in decision-making and water resources should be under the ownership of the State. 3. Community/ Local Approach: This approach highlights the role of local communities, local governments and non-governmental organizations in water supply. Sustainable management of water, indigenous methods of water conservation and inexpensive methods of water supply are given emphasis. 4. Social/ Human Rights Approach: This approach is partly consistent with the public and community approaches, but there are some differences. It emphasizes that human dignity comes first, and that universal access to sufficient water for basic needs is an absolute and non-negotiable priority. Ensuring access to water is primarily responsibility of the State. States are responsible for respecting, protecting, and fulfilling all human rights, including the right of water. International bodies like WHO, World Bank etc., have mentioned about the daily water requirement of each person and the State is obligated to respect, protect and meet this requirement. Gorsboth (2005) mentions that the State has to take concrete steps so as to ensure safety, accessibility and affordability of water to all. State can respect and ensure the right to water only to the extent that it has financial and physical resources. With the advent of neo-liberal policies, there are changes in the State policies towards water. For example, water law in India has been developing in recent years on the basis of an understanding of water as an economic good, including with regard to drinking water (Cullet 2013). Roy (2013) mentions that rather than a public good, water is a rival economic good and it has created class divide. Contrary to this, Cullet (2013) observes that there are intense anti-privatization debates around the theme water. While there has been an increasing body of literature arguing that the right to water is compatible with various forms of privatization

Participatory Water Projects Bringing in Unequal Burden: Women’s Experiences from Kerala
117
or commercialization, this is not sufficient to close the debate in favour of privatization and commercialization. There is a need to see what long term impacts does the community projects/ private initiatives leaves create in the lives of the people, especially women. 3. Jalanidhi Project in Kerala—New Approach to Shed Out the
State Responsibility Jalanidhi means water source. The project is funded by the World Bank and is implemented by the Government of Kerala. This is a participatory rural water supply and sanitation project and it has initiated, a paradigm shift in the water policies viz. shifting from supply driven model to demand and participation driven model of water supply. Apart from ensuring water supply, other important components of this project are sanitation, recharge of ground-water and strengthening of women’s self-help groups. The funding of the project follows the uniform pattern across different districts that, 75% of the cost of water supply is funded by the Jalanidhi, 10% is funded by the local governments (Gram Panchayats) and rest 15% has to be mobilized by the concerned community. A State level autonomous organization called Kerala Rural Water Supply and Sanitation Agency was established and each Gram Panchayat is having a support organization whose main responsibility is providing technical assistance. The main principles that guide this project can be summarized as follows: 1. Demand Driven Approach: The project was implemented in the areas where beneficiaries are willing to take up responsibility and are willing to share 15% of the total cost and are willing to pay maintenance and other costs that may incur in future. 2. Cost Recovery: The community is responsible to meet 100% recurring/ maintenance expenditure so that there is no need to have further government funding. 3. Women Development: The project involved women of the concerned communities; they are also advised to form ’Thrift and Saving Groups’ so as to meet recurring/ maintenance related expenditure that may incur upon them in future. 4. Community Involvement: This was to promote community based approach to meet the water needs. They were fully responsible for providing contract of the work, keeping accounts etc. The project is designed as a demand-responsive project with a community driven development approach which is at the core of its implementation. Initially, the project was implemented in four districts of Kerala which forms a geographical continuum viz. Thrissur, Palakkad, Malapuram and Kozhikode. These four districts were selected on the basis of water shortage, poor quality of available water, large proportion of poor, disadvantage and marginalized population. 4. Methodology and the Context of the Research The study has used two tools for data collection: Semi-structured Interview Schedule and Focus-Group Discussion. The data collection period was two months and later it was followed up by a second visit to the field to seek clarifications from the respondents. This qualitative study was undertaken to understand the linkages between water access, health outcomes and burden this brings upon women of this community. The sample covered women who are aged 18 years and above. All the interviews and FGDs were conducted in native language-Malayalam. The Focus Group Discussions were tape-recorded and later translated to English.

National Seminar on Management of Natural Resources for Sustainable Development: Challenges and Opportunities
118
Data were analyzed via a two-tiered process following the model given by Miles and Huberman (1994). Initially, a first-level coding was conducted by reading over the interview and group discussion transcripts; key themes were identified. The key themes related to water and gender was given emphasis and in the second round these transcripts were repeatedly read. The results were then written up thematically. The study was conducted in two Gram Panchayats of Mallapuram and Kozhikode districts. In the first stage, these two districts were selected because they represent the backward districts of Kerala and women of these districts are less empowered and gender parity indicators are poor leaving women in an unfavourable situation. In the second stage, two Panchayats were selected, viz. Muthedam Gram Panchayat of Mallapuram District and Narikuni Gram Panchayat of Kozhikode district. Villagers settled in this area during 1930s and land was given to each family by the State Government. Land is not very fertile here and it limits the agricultural activities. The main source of income is labouring outside the village while a considerable men and women of the village are unemployed. Employed women are mostly in informal sector. Five beneficiary groups (BG) from each Gram Panchayat were selected randomly and these beneficiaries formed the study population. 5. Study Findings There was severe drinking water crisis in these two Gram Panchayats; even after the implementation of the project, the respondents complained that water is not available in summer and water is not available for the houses which are located in the hills. Inadequate water source creates problems in meeting the requirement of water. All the respondents agreed that water availability has increased; but regularity, quality and affordability remain crucial issues. People in the lower areas are misusing water and this is creating problem for women who are living in the hills because they have to fetch water from other houses. Source of water identified was inadequate to meet the demand. The initial cost that each beneficiary house invested varies from Rs 3500 to Rs. 18000. Women of the area reported that, the authorities and the government officials showed initial enthusiasm which later was not sustained. In the initial stages, the response of the men of the community was supportive and enthusiastic; but later the response was not very positive. This has created negative impact on the women’s lives because both, the government officials and men of the community, argue that they provided initial support and the scheme was implemented properly; sustaining it is considered as the responsibility of the women of the community. In such a manner, the government as well as the men of the community washes off their hands and the burden falls upon women. This is also reflecting the patriarchal attitude of the society which links domestic water with women. Frequent breakdown of machinery led to the improper and irregular functioning of the project, which in turn ensured irregular water supply to the community. Women of the community report that, they had to meet authorities and do the liaison work but still there was no positive support and guidance provided. Poor maintenance of the scheme creates problem because water supply is irregular; so women can not solely depend up on the scheme for water requirements. Lack of co-ordination between beneficiaries, government authorities and support organization has created problems in the functioning and sustainability of the project. Frequent breakdown of the machinery and low quality pipes resulted in failure in water supply. Even in these communities, all households are not selected for the scheme; only those households which can pay initial amount (cost sharing) and are willing to pay monthly maintenance amount were selected for the scheme. The poorest of the poor are unable to pay the beneficiary share of 15% as stipulated in the project and it is seen that such people are kept away from the benefit of project. Some women of the poorest households availed loans to pay the initial

Participatory Water Projects Bringing in Unequal Burden: Women’s Experiences from Kerala
119
cost, so that they can be part of the project. Now women are finding it difficult to repay the loan and water availability is also not regular. This exclusionary nature of the project ensured that the poor and marginalized households are still not having access to drinking water and their human right to water remains violated. Women of these households have to fetch water; since they are minority in numbers, their demands and voices are unheard by the government authorities. To meet the operational and maintenance cost of the project, monthly subscription at the rate of Rs. 60 to Rs. 150 was collected from the beneficiaries on the basis of the capacity of water tank. But due to lack of coordination, lack of training etc., records are not maintained properly. The record maintenance and day-to-day functioning of the scheme is the responsibility of the women of the community. The women who are devoting their time and energy for such services are not paid any remuneration and their services are not recognized by the community; in other words, women are expected to render their services voluntarily; this brings in additional responsibilities in their lives. Women were not involved in the initial decision-making and planning of the project. Identification of the area for water supply, identification/ development of the water source, contracting of building materials etc., was much of political decision rather than democratic participatory decision. In the group meetings called for the discussions, men’s voices were heard while women’s voices and priorities were neglected. Women reported that domestic water supply being women’s responsibility, it was unacceptable for them that they were not involved in the planning and financial aspects of the project. During the initial phase, when cost involved was high, majority of the decisions were taken by men of the community and the finance was also handled preferably by a male treasurer. After the completion of project, when the finance involved is nominal, the responsibility is handed over to women, including the treasurer post. Similarly, women’s access to information related to the project, finance etc. was also limited. The authorities conducted major discussions with the male folk of the community and tried to convince them about the need, sustainability and benefits of the project. In this sense, women faced discriminatory attitude. During formulation of the project, issues such as the distance to water source, the impact of rising water tariffs on the household’s ability to send their children to school or to buy food, the amount of water needed to care for sick family members, or the impact of inconsistent water supply, all of which have gender-specific impacts on women, were not considered. After completion of the project, it is left to the beneficiary groups for operation and maintenance. A good number of the beneficiaries are BPL families and their income status and educational status are not up to the level to handle the operation and maintenance effectively for a long period. Women of such communities are asked to take over the responsibility and this creates a lot of stress and insecurity within the women, as far as water is concerned. Other aspects of the project like water recharge programme etc., did not succeed in the area. Programme component like rainwater harvesting, compost pit etc. did not catch people’s attention. These elements were included in the project so as to increase participation of the community people. These elements are not covered properly and this would, in turn, affect the sustainability of the project. Women of the community reported that in the initial stages of the project, they got time to do other works because water availability was ensured. Later, the availability of water decreased and women had to again come back to the domestic activity of fetching water. Similarly, women of the group are responsible for day-to-day functioning of the project wherein one woman is selected for one month duration to operate the pump, clean the tank, do other maintenance and liaison works; during this period their livelihood options remain compromised.
National Seminar on Management of Natural Resources for Sustainable Development: Challenges and Opportunities
120
Quality of water is also another issue that women spoke about. Women complained that the quality of constructing materials and pipes were poor; proper training about chlorine usage was provided to men volunteers and they were not willing to take up that responsibility. This in turn compromises quality of water and in some cases health issues at community level were reported. Taking care of the sick, cleaning of the tank, ensuring chlorinated water supply in turn became women’s responsibility and this increased the burden. Initially, when water was available and running water was available in the tap, personal hygiene had improved; whereas, when the water availability came down all the water-borne diseases have increased in the community. The community’s sanitation facilities have improved and it has positive impact on health and environment. Women initially found the project very helpful as it facilitated their involvement in other income-generating activities. But after a few months, when the water availability and sustainability of the project became an issue, their time was again diverted mainly to fetch water and energy is channelized to find out means to sustain and revive the project. More water connections were provided at a later stage (decision mainly taken by the men of the community) and it exceeded the capacity of the project. This has created a situation where women are again overburdened with tasks related to water collection. In some beneficiary groups higher amount is charged from the households which exceed the prescribed water usage. This, in turn, creates a class divide amongst the members of the community and water is considered as a commodity which can be sold to people who have the ability to pay. Similarly, financial aspects of the project are handled by APL family member, preferably a man. Cleaning of the tank, minor repairs etc., are the responsibilities of BPL family, preferably women. This shows the continuum and hierarchy in which responsibilities are arranged and assigned within the community. 6. Discussions and Conclusion Right to water, minimal conditions of human existence, well-being and health are closely interlinked. The convention like International Covenant on Economic, Social and Cultural Rights while interpreting who must have access to water has clearly mentioned that it includes marginalized/ disadvantage groups including women (Irujo, 2007). The policymakers, with the help of the power access create water policies that are exclusionary in nature and promote class and gender divide. Although privatization of water services continues to be pushed by donors such as the World Bank, the available information shows that privatization of water services are not increasing access to water for poor women (Brown, 2010). Lack of implementation of the right to water has a disproportionate impact on women because they are ‘the ones who generally have to fill in when the state abdicates its . . . social service responsibilities’ (Yamin 2005, p. 1233). Study by Ahlers (2000) shows that when water management and distribution is led by the neo-liberal agenda, the notion of efficiency overshadows other goals including social equity. Ahlers (2000) argues that the introduction of market mechanisms in the water sector perpetuates and legitimizes unequal gender access to water. Bennett (2005) argues that the concepts of community participation and devolution of power has not necessarily ensured equal involvement and participation of all members. So, the goal of democratic water management still remains an aloof vision. There is evidence that the World Bank appears willing to provide funding for promoting privatization, but not in helping governments conduct a proper public debate on solving water delivery problems (Langford, 2005). Mudege and

Participatory Water Projects Bringing in Unequal Burden: Women’s Experiences from Kerala
121
Zulu (2011) while analyzing experiences from Africa, mentions that issue are not only related to water scarcity; but it is more about unequal distribution and marginalization of certain people. Gender sensitive provision of water services is very important because providing this service in a gender-sensitive manner would have profound impact on the social development of the community. Access to water is a critical component in advancing the human rights of women. When access is denied and potable drinking water is not available, it is the violation of principle of universal access to water. When the State fails to ensure sufficient quantity and quality of water, the burden falls on women at the expense of their job opportunities, livelihood and health. Increasing women’s access to safe, sufficient and affordable water requires that the State recognizes the inherent shortcomings of applying a community model approach to such a fundamental and critical human right as water. References Ahlers, R. (2000), “Gender Relations in Irrigation Districts in Me´xico,” In: Gender and Water Management in Latin
America, ed. Cecilia Tortajada, 203–216. New Delhi, India: Oxford University Press. Bennett, V., Davila-Poblete, S. and Rico, M.N, eds. (2005), Opposing Currents: The Politics of Water and Gender in Latin America, Pittsburgh, PA, University of Pittsburgh Press. Brown, R. (2010), “Unequal Burden: Water Privatisation and Women's Human Rights in Tanzania”, Gender & Development, Vol. 18(1), pp. 59–67. Cullet, P. (2013), “Right to Water in India–plugging Conceptual and Practical Gaps”, The International Journal of Human Rights, Vol. 17(1), pp. 56–78. Gorsboth, M. (2005), Identifying and Addressing Violations of the Human Right to Water, Heidelberg, Germany: FoodFirst International Action Network and Bread for the World. Irujo, A.E. (2007), “The Right to Water”, International Journal of Water Resources Development, Vol. 23(2), pp. 267–283. Jeffords, C. and Shah, F. (2013), “On the Natural and Economic Difficulties to Fulfilling the Human Right to Water Within a Neoclassical Economics Framework”, Review of Social Economy, Vol. 71(1), pp. 65–92. Langford, M. (2005), “The United Nations Concept of Water as a Human Right: A New Paradigm for OldProblems?”, International Journal of Water Resources Development, Vol. 21(2), pp. 273–282.
Mehta, M.C. (2004), v. Union of India, 12 SCC118. Miles, M.B. and Huberman, A.M. (1994), Qualitative Data Analysis: An Expanded Sourcebook. Thousand Oaks, CA: Sage. Mudege, N.N. and Zulu, E.M. (2011), “Discourses of Illegality and Exclusion: When Water Access Matters”, Global Public Health: An International Journal for Research, Policy and Practice, Vol. 6(3), pp. 221–233. Roy, D. (2013), “Negotiating Marginalities: Right to Water in Delhi”, Urban Water Journal, Vol. 10(2), pp. 97–104. WHO (2004), Guidelines for Drinking Water Quality, Recommendations, Geneva, Switzerland: World Health Organization. Yamin, A.E. (2005), ‘The Future in the Mirror: Incorporating Strategies for the Defense and Promotion of Economic, socIal and Cultural Rights into the Mainstream Human Rights Agenda”, Human Rights Quarterly, Vol. 27, pp. 1200 1244.

122
16 Studies of Rhododendron arboreum Sm.: Its Distribution and Conservation in Mizoram, India
B. Malsawmkima, David C. Vanlalfakawma, U.K. Sahoo and V.P. Khanduri
Department of Forestry, Mizoram University, Aizawl, Mizoram E-mail: [email protected] In 1737 Carl Linnaeus described the genus Rhododendron which belongs to Ericaceae family in his book Genera Plantarum. The word Rhododendron was derived from two Greek words rhodon (rose) and dendron (tree) meaning ‘rose tree’. Between 1848 and 1850, Joseph Hooker’s gathered and described 34 new species in his monograph entitled Rhododendron of Sikkim Himalaya. Since then, many researchers and explorers had added to the list, and currently about 1025 species in the world (Chamberlain et al., 1996) and 121 taxa have been recorded from India, out of which 117 (98%) taxa are distributed in north-east India (Mao, 2010). Out of 117 taxa recorded from north-east India, Mizoram contributed 3.42% i.e. 4 taxa (Sawmliana, 2003; Mao, 2010; Sekar et al., 2010). The most abundant taxa is Rododendron arboreum Sm. Rhododendron (Chhawkhlei in Mizo) has a huge influence among the Mizo society in the history of its beauty which was written in many folk and traditional songs. Rhododendron arboreum is Nepal’s national flower and is depicted on its coat of arms (de Milleville, 2002). In India, it is the state flower of Nagaland and state tree of Uttarakhand (Kant, 2004; Joshi and Sharma, 2005). For this paper, extensive field surveys were conducted in different parts of Mizoram. This species is present in only three districts out of eight districts of the State, mostly in the eastern side. Out of 12 location occurrence verified, Champhai district has the highest (83.33%) occurrence, Lawngtlai district and Saiha district has (8.33%) each respectively. In these study areas, this species exhibit in habit range of distribution from the altitude 1300m–2157m. The major threats to rhododendrons are deforestation and unsustainable extraction for firewood and other domestic use by local people.
1. Materials and Methods For the documentation of the distribution and study of the Rhododendron arboreum Sm in Mizoram, study was conducted based on literature consulted in different published scientific papers, field studies with photograph during flowering season and examination of herbarium collection. Study was conducted in all the 8 districts of Mizoram with altitude above 800m above sea level. The plants collected from study area consisted of almost all parts so that they can be easily recognized and able to provide maximum information. Beside this, information related to collected plants was also gathered by personal communications with the inhabitants of the nearby villages. 2. Plant Description
Rhododendron arboreum Sm is one of the most stately and impressive rhododendron species. It is extremely variable in stature, hardiness, flower colour and leaf characteristics; reaching heights of more than 20m or more. Trunk is branched, crooked or gnarled with a reddish brown, soft and rough bark, exfoliating in thin flakes. The leaf is thick, stiff, leathery dark glossy green covered on

Studies of Rhododendron arboreum Sm.: Its Distribution and Conservation in Mizoram, India
123
the under surface with a thin layer of indumentum ranging in colour from silver to fawn to deep cinnamon, elegant oblong-lanceolate, 10 cm–17 cm long and 3 cm –5 cm wide. Crowded towards the ends of branches, petioles are covered with white scales when young. The flowers range in colour from a deep scarlet to red. Bearing sometimes more than 20 blossoms in a single truss, this rhododendron is a spectacular sight when in full bloom. The bright red forms of this rhododendron are generally found at the lower elevations. All of the flowers don’t open at once; instead they open in succession from December to March. If the first blooms get damaged by frost, there are still flower buds which aren’t damaged. It bears insect-pollinated hermaphrodite flowers. Fruit is capsulate, oblong, curved, longitudinally ribbed, up to 3.8 cm long and 1.25 cm wide. Seeds are minute, dark brown, compressed, oblong. Seed capsules ripen from August through March depending on altitude.
Fig. 1: Full Bloom Flower Fig. 2: Fruits Fully Developed
Fig. 3: Mature Fruits Dehiscence of Rhododendron arboreum Sm
2.1 Uses Flowers are sour-sweet and are eaten as pickles, although excess may cause intoxication. A sub-acidic jelly or preserve is made from the petals. The fresh flowers are also used as medicine in the treatment of hill diarrhoea, dysentery and dyspepsia. Sometimes the dried flowers are eaten after frying with ghee to check dysentery (Bhattacharjee, 1998). In hilly areas, the flowers are used in the preparation of jams, jellies and local brew. The fresh and dried corolla, are also taken to remove fish bones that get stuck in the gullet (Pradhan & Lachungpa, 1990). The wood is used as fuel and for making charcoal. Sapwood and heartwood are used for tool handles, boxes and posts and is suitable for plywood. 2.2 Results The genus Rhododendron is a relatively primitive group of flowering plants that have flourished for almost 100 million years in the temperate zones of the northern hemisphere (de Milleville, 2002). Towards the equator, it is mainly distributed at higher altitudes, and it is reported that some species have significant ecological and economic importance (Mao et al., 2001). Rhododendron arboreum Sm is found in many vegetation types, and sometimes forms almost pure forest in restricted areas. It is common in the eastern side of the study areas in association with Quercus and Pinus species. It thrives best on moist loam although it is also found on moist rocky ground. Although it develops better in the open, it can withstand shading and strong wind.
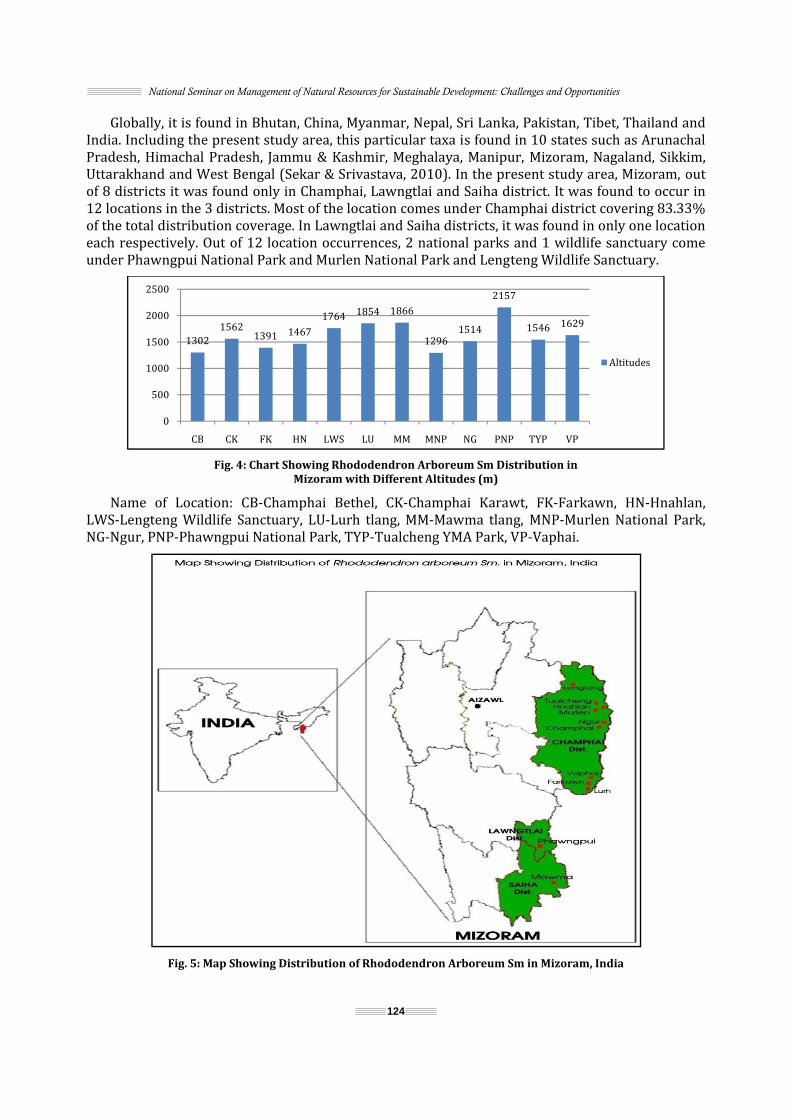
National Seminar on Management of Natural Resources for Sustainable Development: Challenges and Opportunities
124
Globally, it is found in Bhutan, China, Myanmar, Nepal, Sri Lanka, Pakistan, Tibet, Thailand and India. Including the present study area, this particular taxa is found in 10 states such as Arunachal Pradesh, Himachal Pradesh, Jammu & Kashmir, Meghalaya, Manipur, Mizoram, Nagaland, Sikkim, Uttarakhand and West Bengal (Sekar & Srivastava, 2010). In the present study area, Mizoram, out of 8 districts it was found only in Champhai, Lawngtlai and Saiha district. It was found to occur in 12 locations in the 3 districts. Most of the location comes under Champhai district covering 83.33% of the total distribution coverage. In Lawngtlai and Saiha districts, it was found in only one location each respectively. Out of 12 location occurrences, 2 national parks and 1 wildlife sanctuary come under Phawngpui National Park and Murlen National Park and Lengteng Wildlife Sanctuary.
Fig. 4: Chart Showing Rhododendron Arboreum Sm Distribution in Mizoram with Different Altitudes (m) Name of Location: CB-Champhai Bethel, CK-Champhai Karawt, FK-Farkawn, HN-Hnahlan, LWS-Lengteng Wildlife Sanctuary, LU-Lurh tlang, MM-Mawma tlang, MNP-Murlen National Park, NG-Ngur, PNP-Phawngpui National Park, TYP-Tualcheng YMA Park, VP-Vaphai.
Fig. 5: Map Showing Distribution of Rhododendron Arboreum Sm in Mizoram, India
1302 1562 1391 1467 1764 1854 18661296 1514
21571546 1629
05001000150020002500
CB CK FK HN LWS LU MM MNP NG PNP TYP VP
Altitudes
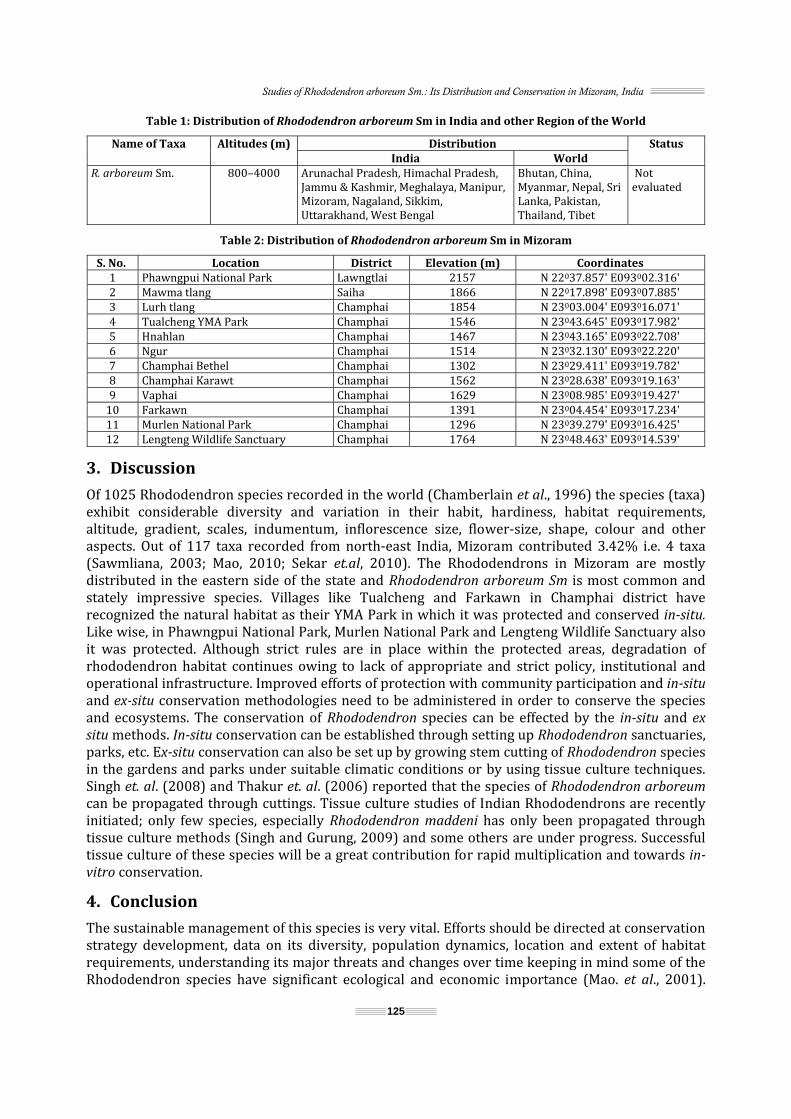
Studies of Rhododendron arboreum Sm.: Its Distribution and Conservation in Mizoram, India
125
Table 1: Distribution of Rhododendron arboreum Sm in India and other Region of the World
Name of Taxa Altitudes (m) Distribution StatusIndia World
R. arboreum Sm. 800–4000 Arunachal Pradesh, Himachal Pradesh, Jammu & Kashmir, Meghalaya, Manipur, Mizoram, Nagaland, Sikkim, Uttarakhand, West Bengal Bhutan, China, Myanmar, Nepal, Sri Lanka, Pakistan, Thailand, Tibet
Not evaluated Table 2: Distribution of Rhododendron arboreum Sm in Mizoram
S. No. Location District Elevation (m) Coordinates 1 Phawngpui National Park Lawngtlai 2157 N 22037.857' E093002.316'2 Mawma tlang Saiha 1866 N 22017.898' E093007.885'3 Lurh tlang Champhai 1854 N 23003.004' E093016.071'4 Tualcheng YMA Park Champhai 1546 N 23043.645' E093017.982'5 Hnahlan Champhai 1467 N 23043.165' E093022.708'6 Ngur Champhai 1514 N 23032.130' E093022.220'7 Champhai Bethel Champhai 1302 N 23029.411' E093019.782'8 Champhai Karawt Champhai 1562 N 23028.638' E093019.163'9 Vaphai Champhai 1629 N 23008.985' E093019.427'10 Farkawn Champhai 1391 N 23004.454' E093017.234'11 Murlen National Park Champhai 1296 N 23039.279' E093016.425'12 Lengteng Wildlife Sanctuary Champhai 1764 N 23048.463' E093014.539'3. Discussion Of 1025 Rhododendron species recorded in the world (Chamberlain et al., 1996) the species (taxa) exhibit considerable diversity and variation in their habit, hardiness, habitat requirements, altitude, gradient, scales, indumentum, inflorescence size, flower-size, shape, colour and other aspects. Out of 117 taxa recorded from north-east India, Mizoram contributed 3.42% i.e. 4 taxa (Sawmliana, 2003; Mao, 2010; Sekar et.al, 2010). The Rhododendrons in Mizoram are mostly distributed in the eastern side of the state and Rhododendron arboreum Sm is most common and stately impressive species. Villages like Tualcheng and Farkawn in Champhai district have recognized the natural habitat as their YMA Park in which it was protected and conserved in-situ. Like wise, in Phawngpui National Park, Murlen National Park and Lengteng Wildlife Sanctuary also it was protected. Although strict rules are in place within the protected areas, degradation of rhododendron habitat continues owing to lack of appropriate and strict policy, institutional and operational infrastructure. Improved efforts of protection with community participation and in-situ and ex-situ conservation methodologies need to be administered in order to conserve the species and ecosystems. The conservation of Rhododendron species can be effected by the in-situ and ex situ methods. In-situ conservation can be established through setting up Rhododendron sanctuaries, parks, etc. Ex-situ conservation can also be set up by growing stem cutting of Rhododendron species in the gardens and parks under suitable climatic conditions or by using tissue culture techniques. Singh et. al. (2008) and Thakur et. al. (2006) reported that the species of Rhododendron arboreum can be propagated through cuttings. Tissue culture studies of Indian Rhododendrons are recently initiated; only few species, especially Rhododendron maddeni has only been propagated through tissue culture methods (Singh and Gurung, 2009) and some others are under progress. Successful tissue culture of these species will be a great contribution for rapid multiplication and towards in-vitro conservation. 4. Conclusion The sustainable management of this species is very vital. Efforts should be directed at conservation strategy development, data on its diversity, population dynamics, location and extent of habitat requirements, understanding its major threats and changes over time keeping in mind some of the Rhododendron species have significant ecological and economic importance (Mao. et al., 2001).

National Seminar on Management of Natural Resources for Sustainable Development: Challenges and Opportunities
126
The success of conservation programme depends on the awareness of local people. It is imperative to educate the local inhabitants about the wealth of Rhododendrons and importance towards the conservation of biodiversity. 5. References Bhattacharjee, S.K. (1998), Handbook of Medicinal Plants. Pointer Publishers, Jaipur. Biswas, K. and Chopra, R.N. (1982), Common Medicinal Plants of Darjeeling and the Sikkim Himalayas. Periodical Experts Book Agency, Delhi. Chamberlain, D.F., Hyam, R., Argent, G., Fairweather, G. and Walter, K.S. (1996), The Genus Rhododendron: Its Classification
& Synonymy, Royal Botanic Garden, Edinburgh. de Milleville, R. (2002), The Rhododendrons of Nepal. Himal Books, Katmandu, Nepal, p. 136. Jackson, J.K. (1994), Manual of Afforestation in Nepal, Forest Research and Survey Centre Kathmandu, Nepal, Vol. 2. Joshi, A.P. and Sharma, N. (2005), “Flower Power. Rhododendron is a Health Freak’s Delight”, Science and Environment Fortnightly, Down to Earth, Vol. 14(3), p. 52. Mao, A.A., Singh, K.P. and Hajra, P.K. (2001), “Rhododendrons”. In: Singh, N.P. and Singh, D.K. (eds.), Floristic Diversity and Conservation Strategies in India: Angiosperms (Selected Groups), Economic and Ethnobotany, Kolkata, Botanical Survey of India, Vol. IV, pp. 2167–2202. Moa, A.A. (2010), “The genus Rhododendron in North-east India”, Botanica Orientalis: Journal of Plant Science, Vol. 7, pp. 26–34. Nayar, M.P., Ramamurthy, K. and Agarwal, V.S. (1994), “Economic Plants of India”, Botanical Survey of India, Kolkata. Vol. 2, pp. 225–226. Orwa, C., Mutua, A., Kindt, R., Jamnadass, R. and Simons, A. (2009), Agroforestry Database: A Tree Reference and Selection Guide Version 4.0. Pradhan, U.C. and Lachungpa, S.T. (1990), Sikkim-Himalayan Rhododendrons, Primulaceae Books, Kalimpong. Sawmliana, M. (2003), The Book of Mizoram Plants, First ed. Lois Bet, Chandmari, Aizawl, p. 153. Sekar, K.C. and Srivastava, S.K. (2010), “Rhododendrons in Indian Himalayan Region: Diversity and Conservation”, American Journal of Plant Sciences, Vol. 1, pp. 131–137. Singh, K.K. and Gurung, B. (2009), “in vitro Propagation of R. Maddeni Hook. F. An Endangered Rhododendron Species of Sikkim Himalaya”, Notulae Botanicae Horti Agrobotanici Cluj-Napoca, Vol. 37, No. 1, pp. 79–83. Singh, K.K., Kumar, S. and Shanti, R. (2008), “Raising Planting Materials of Sikkim Himalayan Rhododendron through Vegetative Propagation Using Air-Wet Technique”, Journal of American Rhododendron Society, Vol. 62, pp. 136–138. Thakur, P., Sharma, Y.D., Kashyap, B. and Thakur, A. (2006), “Vegetative Propagation of Native Ornamentals of Himachal Pradesh in India”, Abstract of XXVII International Horticultural Congress—IHC2006, Himachal Pradesh.
127
17 Forest Resources and Santals: A Micro-Level Conceptual Overview on Birbhum District, West Bengal
Prakash Ray Department of Geography,
Syamsundar College, Burdwan, West Bengal, India E-mail: [email protected]
1. Introduction The concept of resource is economic and anthropocentric. Everything available on earth are resources, some are utilized and some will be utilized in future. The very concept, ‘resource’ is dynamic and depends on human capacity to exploit it. But the forest resource as perceived by Santal tribe is more than resource of economic exploitation. From time immemorial, forest has sustained Santals by offering everything it has. The cultural ecology of Santal tribe states their profound mutual relationship with forest and forested landscape. The main objectives of this paper is to highlight the traditional dependence of Santals on forest and the nature of such dependence at present in selected villages in Birbhum district. 2. Methodology and Materials During the month of November, the present author visited three Santal dominated villages in forested landscape (Raspur forest beat) of Md. Bazar block of Birbhum district: Amgachi-Fulbagan, Tulusibona and Udaydhihi. The present author interacted with the villagers, visited forest area on several occasions to find out the present state of forest dependence of Santals and their current perceptions about forests. Selected books related to Santals, forest resources, Birbhum district etc. have also been surveyed to know the traditional relation between forest and Santals. 3. The Nature of Traditional Dependence on Forest of Santals Traditionally, Santals are deeply attached to forest; the dependence is multifarious: forested landscapes provide healthy and culturally suited settlement area for Santals. Generally, Santals set up their village in high place near a forest (Baskey, 2002). It is rightly observed by Amitabha Sarkar and Samira Dasgupta in the preface of their book, Ethno-Ecology of Indian Tribes—Tribal culture flourishes in the specific ecological niche. Forested landscape helps Santals’ cultural ecology. Forest supplies food in form of fruits, tuber, flower and leaves etc., especially, during the time of drought and famine. The jungle, indeed, is their unfailing friend. It supplies them everything that the lowland Hindus have not. Noble timber, brilliant dyes, gums, bee’s wax, vegetables drugs, charms, charcoal and skins of wild animals—a little world of barbaric wealth, to be had for the taking (Hunter, 1868). Forest provides grazing land and fodder. Grass-covered area near or within the forest, acts as a grazing land for the livestock reared by Santals. That is why, the domestic animals of Santal community are normally healthy. Forest supplies medicinal herbs for illness and diseases. Santals have a rich traditional knowledge of medicinal plants derived from forest. They have medicinal plants to almost every single physical illness. Forest is the sole source of fuel-wood to Santali village community. They choose specific plants for this purpose without over-exploiting the forest.
National Seminar on Management of Natural Resources for Sustainable Development: Challenges and Opportunities
128
Forest acts as a basis of religio-cultural beliefs and activities. Santals have forest deities whom they called Bir Bonga (The God of Forest).Their goddess Jaher Era resides in sacred groves outside the village, called Jaher Than. The concept of creator (Thakur Jiu) in the mind of the modern Santal appears to be that of a kind of Bird (O’Malley, 1910). ’In an early stage of the marriage ceremony, both bride and bridegroom separately go through the form of marriage to a mahua tree (Bassia Latifolia) (O’Malley, 1910). Table 1: Totems of Santali Clans Clearly Depicts a Forest Relation
Clan TotemHansda DuckKisku SeagullMurmu NilgaiMandi Merda GrassHembrom BetelnutSoren Great BearBaske Fermented RiceBesra HawkChonre ChammelionSource: Dhirendra Nath Baskey (2002) Forest acts as a play field of hunting festivities. It provides ample fauna to carry out hunting to its true spirit. Santals hunt birds and small animals for this purpose. Forest supplies raw material for house building and domestic requirements. Palm leaf mats and rope-cots are found in every house. The cot is used when guests or relatives come. Bamboo items like basket, strainer or thresher are found in every house (Baskey, 2002). Forest provides resources for cash income: ‘Santals earn their living by farming and collecting forest resources. Forest resources are important means of Santal living. At the time of adversity they run the house by collecting and selling fruits of the forest. Besides, they sell Sal leaves and Kendu leaves and buy the commodities (Baskey, 2002). Making Sal-leaves-plates is an everyday chore of Santali women in every household of Santal villages. The top canopy in the forest area was represented predominantly by Sal (Shorea robusta). This tree is intimately connected with the Santal religious sentiment. The close association of Sal with Santal social culture has been reflected through many of their folk songs and tales; whenever a problem arises in Santal community, they inform their fellow mates to assemble through the circulation of Gira (five leaves of Sal branches. They use the leaves in their daily livelihood but never cut the trees unless compelled to. To the Santalsm trees are animate objects. The conception of ecological balance was inherent within them. What is important to remember is that in those days when there was no Western medicine, the Santals procured their own medicines from forest. They inherited a rich tradition of tribal medicines. Jungle Mahals had reserved for her sons rich medicinal plants. They were exploited as indigenous drugs i.e. Vasaka, Kalmegh, Siuli, Sarpagandha, Kantikari etc. All these plants were used not only by Santals, but also formed ingredients in Ayurved and Hakimi medicines. All these things led to a natural system of conservancy. Through religion, folklore and tradition, the Santals drew a protection ring round the forests and it is for nothing’ (Sen, 2013). In Santali folk songs, folk music, myths, riddles, proverbs, legend, folktales, there is a mention of numerous forest flora and fauna e.g. peacock, scorpion, snakes, bush of thorns, parrot, owl, jackal, plum tree, kingfisher, dove, quail, mountain grass etc. This reveals the intricate relation between forest and Santali way of life. So, it is quite clear from the above discussion that how important and how significant forest and forested landscape is to the life of Santals. Their culture, society, livelihood, festivities, and spirituality, everything is intricately connected and related to natural forest environment from time immemorial. They are rightly called Vanavasi (forest dwellers) or
Aranya putra (son of the forest).
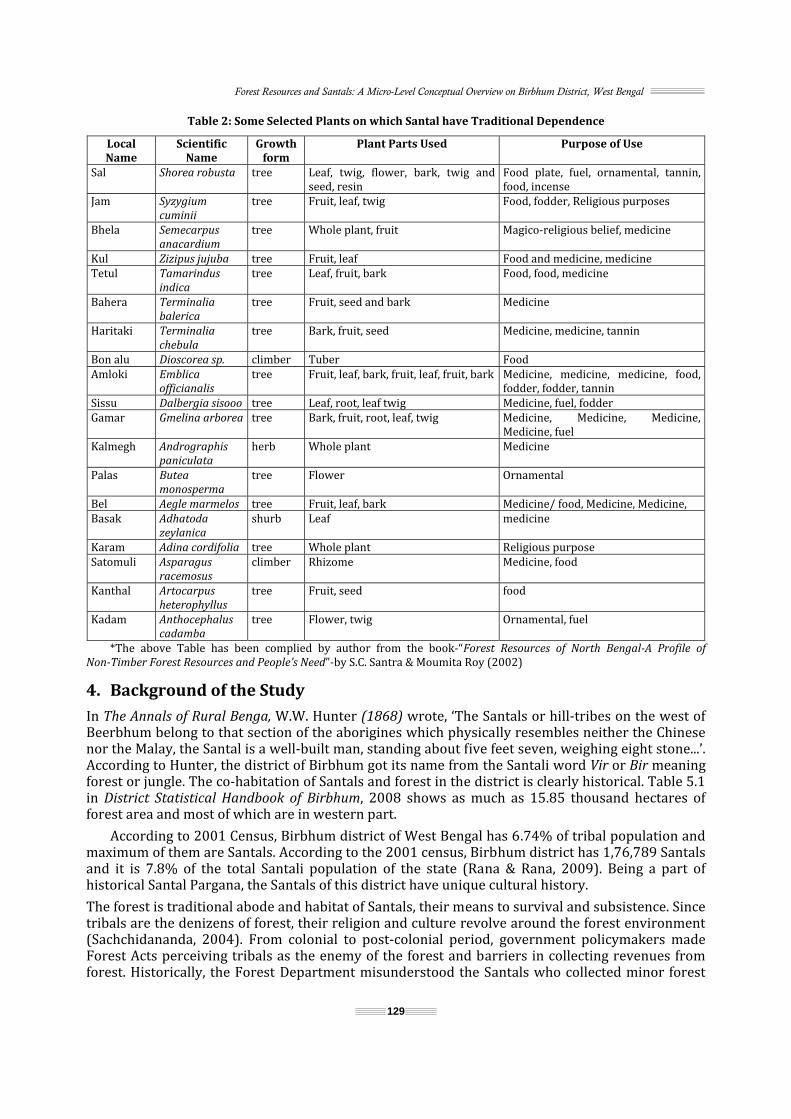
Forest Resources and Santals: A Micro-Level Conceptual Overview on Birbhum District, West Bengal
129
Table 2: Some Selected Plants on which Santal have Traditional Dependence
Local Name
Scientific Name
Growth form
Plant Parts Used Purpose of Use Sal Shorea robusta tree Leaf, twig, flower, bark, twig and seed, resin Food plate, fuel, ornamental, tannin, food, incense Jam Syzygium cuminii
tree Fruit, leaf, twig Food, fodder, Religious purposes Bhela Semecarpus anacardium
tree Whole plant, fruit Magico-religious belief, medicineKul Zizipus jujuba tree Fruit, leaf Food and medicine, medicine Tetul Tamarindus indica
tree Leaf, fruit, bark Food, food, medicine Bahera Terminalia balerica
tree Fruit, seed and bark Medicine Haritaki Terminalia chebula
tree Bark, fruit, seed Medicine, medicine, tannin Bon alu Dioscorea sp. climber Tuber FoodAmloki Emblica officianalis
tree Fruit, leaf, bark, fruit, leaf, fruit, bark Medicine, medicine, medicine, food, fodder, fodder, tannin Sissu Dalbergia sisooo tree Leaf, root, leaf twig Medicine, fuel, fodder Gamar Gmelina arborea tree Bark, fruit, root, leaf, twig Medicine, Medicine, Medicine, Medicine, fuel Kalmegh Andrographis paniculata
herb Whole plant MedicinePalas Butea monosperma
tree Flower Ornamental Bel Aegle marmelos tree Fruit, leaf, bark Medicine/ food, Medicine, Medicine, Basak Adhatoda zeylanica
shurb Leaf medicine Karam Adina cordifolia tree Whole plant Religious purpose Satomuli Asparagus racemosus
climber Rhizome Medicine, food Kanthal Artocarpus heterophyllus
tree Fruit, seed foodKadam Anthocephaluscadamba
tree Flower, twig Ornamental, fuel *The above Table has been complied by author from the book-“Forest Resources of North Bengal-A Profile of Non-Timber Forest Resources and People’s Need”-by S.C. Santra & Moumita Roy (2002) 4. Background of the Study In The Annals of Rural Benga, W.W. Hunter (1868) wrote, ‘The Santals or hill-tribes on the west of Beerbhum belong to that section of the aborigines which physically resembles neither the Chinese nor the Malay, the Santal is a well-built man, standing about five feet seven, weighing eight stone...’. According to Hunter, the district of Birbhum got its name from the Santali word Vir or Bir meaning forest or jungle. The co-habitation of Santals and forest in the district is clearly historical. Table 5.1 in District Statistical Handbook of Birbhum, 2008 shows as much as 15.85 thousand hectares of forest area and most of which are in western part. According to 2001 Census, Birbhum district of West Bengal has 6.74% of tribal population and maximum of them are Santals. According to the 2001 census, Birbhum district has 1,76,789 Santals and it is 7.8% of the total Santali population of the state (Rana & Rana, 2009). Being a part of historical Santal Pargana, the Santals of this district have unique cultural history. The forest is traditional abode and habitat of Santals, their means to survival and subsistence. Since tribals are the denizens of forest, their religion and culture revolve around the forest environment (Sachchidananda, 2004). From colonial to post-colonial period, government policymakers made Forest Acts perceiving tribals as the enemy of the forest and barriers in collecting revenues from forest. Historically, the Forest Department misunderstood the Santals who collected minor forest
National Seminar on Management of Natural Resources for Sustainable Development: Challenges and Opportunities
130
products sustainably and preserved forest in indigenous way. Either Santals have been restricted, or harassed, for collecting forest products. This is direct intervention in the forested landscape by Forest Department in the name of forest protection. In past, non-tribal moneylender, jamindar, traders etc. had also occupied tribal lands in various means. Later, intervention of development activities, non-traditional employment opportunities, agricultural expansion, uncertainties of market economy etc. have changed the local resource base and overall perceptions of Santals and ultimately the dependency on forest got disturbed. 5. Author’s Inferences Based on Field Observations The dependency on forest was much higher in past. The tribes were highly dependent on forests for food, fodder, house building materials, medicines, fuel etc. But at present, the dependency on forest resources has become limited to collection of fuel woods and leaves, collection of sal leaves for makings leaf plates and collection of kendu leaves. The dependency on forest for house building materials, medicines, food is very much selective, limited and occasional. This is due to the availability and accessibility of durable house building materials as well accessibility and reliability on modern medicines and availability of agriculture based foods. Also, it has been observed from the field that the dependency on forest depended on the geographical location of the Santali village. Villages situated beside and inside the forest, far away from towns have high level of dependency on forests than the villages that are near to town and far away from forests. But the dependency on forests rather on some selected trees is visible in every Santal villages as some trees are integral to Santali religio-cultural life. The perception regarding forest has also changed. These changes are as follows: a. The younger generations of Santals who frequently visit to town or have some sort of education consider forest dependency as primitiveness. b. The older people who have grown being attached with forests, think forest area, forest diversity, forest density etc. have deteriorated and the present day dependency is less than their past. c. The Santali women, who have to visit forests for fuel wood collection on a daily basis, expressed their concerns about gradual decrease in traditional quality fuel woods. This situation gradually compels them to cut immature vegetation and forces them to go deep into the forest. Adding to their hardships, it consumes time and energy. It also damages forests. The prevailing problems identified by the author are as follows: a. Shortage of adequate number of proper trees/ shrubs for collection of firewood, collection of sal leaves compels Santals to cut tender and premature branches and trees. This affects the forest health and forest quality negatively. b. Devoid of traditional knowledge, the non-tribals overexploit and make commercial use of forest resources. During field survey, present author have been complained about this problem frequently by Santal people. c. Indigenous Sal trees are not easy to afforest, that is why Forest Department afforest Eucalyuptus and Akasmoni. This type of afforestation does not help increase in natural forests and to meet tribal needs. Instead, it deteriorates forest quality and diversity, stop generation of undergrowth. With Eucalyuptus and Akasmoni, the Santals have no religio-cultural affinity like Sal and Mauha trees. d. Forest guards do not enter deep into the forest. That is why forested area seen from distance seems dense but in reality the density is much lower. The deep forest area is very much vulnerable.

Forest Resources and Santals: A Micro-Level Conceptual Overview on Birbhum District, West Bengal
131
6. Conclusion and Suggestions The forest dependency of Santals is quite prevalent in the villages surveyed. But this dependency is gradually restricted to limited trees and for selected purposes. This remaining dependency still highly depends on a few inter-related questions: How do Santals and non-tribes sustainably utilize forest resources? How does forest survive with its natural quality and health? And how efficiently the Forest Department manages forest in the futures to come? Suggestions regarding forest resource management are as follows: 1. Indigenous trees have to be planted by Forest Department in consultation with the Santals. 2. Special focus should be given by Forest Department to monitor and maintain forest density, forest diversity and forest health. 3. Non-tribes have to be restricted from overexploitation of forest resources. 4. Plant species highly utilized by tribes have to be given special importance through regeneration, restoration, reforestation and management. 5. Promotion of Santali handicrafts and material-art based on non-timber forest produce has to be given special importance with small-scale industrial outlook. 6. Non-tribes and present generation Santals should be made aware of sustainable use of forest resources by government campaigning. 7. Forest surveillance and protection by the Forest Department, Joint Forest Management Committees have to be strengthened to stop the prevailing nexus of illegal felling of trees as soon as possible. This illegal felling of trees may be called as ‘Dark-silent deforestation’ because it happens at night very ‘silently’. References Baskey, D.N. (2002), The Tribes of West Bengal. Kolkata: Subarnarekha. Census of India (2001), Report on West Bengal. Government of West Bengal (2010), Bureau of Applied Economics & Statistics District Statistical Handbook 2008, Birbhum, Bureau of Applied Economics & Statistics. Hunter, W.W. (1868), The Annals of Rural Bengal. London: Smith, Elder and Co, Reprint Govt. of West Bengal, 1996. O’Malley, L.S.S. (1910), Santal Parganas, Bengal District Gazetteers. The Bengal Secretariat Book Depot., Calcutta, Reprint, Govt. of West Bengal, 1999. Rana, S. and Rana, K. (2009), Paschimbange dalit o adibasi.Kolkata.Camp. Sachchidananda (2004), Man, Forest and the State in Middle India, New Delhi. Serials Publicitions. Santra, S.C. and Roy, M. (2002), Forest Resources of North Bengal: A Profile of Non-Timber Forest Resources and People’s
Need, Delhi. Daya Publishing House. Sarkar, A. and Dasgupta, S. (2000), Ethno-Ecology of Indian Tribes. Jaipur and New Delhi. Rawat Publications. Sen, S. (2013), The Santals of Jungle-Mahals, Through the Ages, Kolkata Ashadeep.

132
18 Status of Muga Culture and Technology Adoption in Assam
Ranuma Das¹, B.N. Choudhary2, M. Sankar3, J. Mahanta4 and K. Giridhar¹ ¹Central Muga Eri Research & Training Institute,
Central Silk Board, Lahdoigarh, Jorhat, Assam 2Research, Extension Centre, Aizawl, Mizoram
3Regional Sericultural Research Station, Central Silk Board, Jorhat, Assam 4Central Silk Board, Bengaluru, Karnataka
E-mail: [email protected]
1. Present Status of Muga Culture in Assam Commercial muga silkworm crop is mostly raised in upper Brahmaputra valley of Assam and the seed crop in lower Assam and foothills of Meghalaya. However, a shift in muga silkworm rearing for commercial crops from upper Assam to lower Assam particularly to Goalpara and Kokrajhar district of Assam has taken place in the last few years due to extensive tea cultivation and oil exploration in upper Assam areas. Production trend of muga raw silk and its productivity status in Assam is given below: Table 1: Production of Muga Raw Silk in Assam
Year Muga Raw Silk (MT) Year Muga Raw Silk (MT) 2003–04 105 2008–09 118 2004–05 110 2009–10 105 2005–06 110 2010–11 124 2006–07 115 2011–12 126 2007–08 117 2012–13 129 Table 2: Production Status of Muga Culture in Assam
S. No. Particulars Status 1 Families engaged in muga culture (lakh nos) 0.30 2 Women participation (%) 65.0 3 Area under muga food plantation (ha) 9927 4 Av. rearing capacity/ ha/ yr (dfls) 1650 5 Dfls: Cocoon (Average) 1:45 6 Av. Cocoon production/ ha/ yr (nos) 75000–80000 7 Cocoon requirement/ kg yarn (nos) 4500–5000 8 Raw silk production (kg/ ha/ yr) 15–16 9 Silk recovery (%) 40–45 10 Rearing capacity/ family/ yr (dfls) 400–500 There has been marginal increase in muga raw silk production from 117 MT during 2007–08 to 129 MT during 2012–13 against the targeted production of 160 MT by the end of the year. This gap in production is attributed to various factors like climatic changes, outbreak of diseases, inadequacy of seed supply and technology adoption etc.
Status of Muga Culture and Technology Adoption in Assam
133
2. Analysis of Assam with Regard to the Prospect of Muga Culture
2.1 Strength 1. Traditional muga silkworm rearing, reeling and weaving. 2. Availability of Som (muga food plant) in field and on boundaries of the houses which can be converted into systematic plantation. 3. Support from Department of Sericulture and NGOs. 4. Easy accessibility. 5. Freedom of land use by the muga rearer. 2.2 Weakness 1. Poor economy of the farmers 2. Use of primitive devices of rearing, spinning, reeling and weaving. 3. Illiteracy. 4. Lack of awareness and initiatives. 2.3 Opportunities 1. Group concept and availability of ITK. 2. Availability of skilled manpower. 3. Involvement of all the members of the family. 4. Priority sector. 5. NGOs interventions. 6. Felicitations by State and Central Sericulture departments. 2.4 Threat 1. Marketing of cocoons/ silk. 2. Interference of middleman for price fixation of seed cocoons, raw silk and silk products. 3. Power supply. 4. Grazing by domestic cattle and wild animals. 5. Natural calamities. 3. Technologies in Vogue To increase the level of adoption of improved technologies, Central Muga Eri Research & Training Institute, Lahdoigarh, Jorhat, Assam is supporting the muga farmers in major districts of Assam. 3.1.1. Early Stage Rearing Technology for Muga Silkworm Muga rearers are supported/ assisted technically with rearing tools (rearing net) for chawki worms, since scientific rearing method of young age silkworm is a prerequisite for successful crop. 3.1.2. Integrated Control of Stem Borer in Muga Food Plant Farmers are trained to control stem borer in muga food plants, som/ soalu.
National Seminar on Management of Natural Resources for Sustainable Development: Challenges and Opportunities
134
3.1.3. Use of Lahdoi against Muscardine Farmers are made aware about the disease and control measures. 3.1.4. Biological Control of Uzifly in Muga Culture Farmers are encouraged for the technology on biological control of uzifly through release of local hyperparasitoids, viz Nezolynx thymus and Exorista philippinensis.
3.1.5. Mother Moth Examination for Control of Disease Farmers are encouraged to ensure good crop and better harvest through disease free layings. 3.1.6. Use of Improved Mountage (Bamboo Mountage) for Better Cocooning Using of bamboo mountage are emphasized in cocooning over traditional jail for better result. 3.1.7. Improvised Reeling Machine An improved reeling machine (BANI) devised as substitute of traditional Bhir or Bhowri are advocated. A chemical formulation, ‘MUGA SILKPLUS’ has been developed to increase raw silk recovery. 3.1.8. Farmers Training Farmers are trained through farmers training programme, beneficiaries empowerment programme under CDP, ISDS training programmes on improved technologies. Under Capsule Training Programme the technical staffs are deputed in Research & Training Institutes to update their knowledge and skill. Central Muga Eri Research & Training Institute, Lahdoigarh, Jorhat Assam assisting the muga rearers by supplying Som seedlings under Extension Communication Programme. 4. Problem Faced by Muga Industry in Assam In spite of increase in the productivity level, there exists a considerable gap between the yield realized at the farmers’ field and the production potential. This has remained as bottleneck for the development of muga culture. This gap can be bridged with the large scale adoption of recommended package of practices through effective extension and communication approach. The following factors can be summarized for such gap in yield in muga culture. 4.1 Socio-Economic Factor Most of the farmers practicing muga culture in Assam are very poor, by and large practiced on scattered homestead plantation in a limited scale. Leaf yield of primary muga host plant ‘Som’ at farmer’s level is about 16 MT–18 MT per hectare per year against potential productivity of 22–24 MT. The yield gap is mainly due to non-adherence to the recommended package of practices by the farmers either due to strong inclination towards traditional method of cultivation or high cost of inputs. 4.2 Situational Factor Muga culture being a complete outdoor practice, the possibility of using prophylactic measures to control disease is difficult. Due to outdoor nature of rearing, the crops are not always assured due to outbreak of diseases, environmental rigours, feed quality etc. Out of the 5–6 broods of rearing in a year, the commercial muga crops fall in favourable period while all the other crops fall during the period of extremities of temperature, humidity, rainfall, etc. the Aghenua crop which is pre-seed crop for ‘Chotua’ seed crop falls during December–January. Low temperature prevailing during this season emanated to lengthening of larval duration and outbreak of fungal diseases.

Status of Muga Culture and Technology Adoption in Assam
135
Mainly, Muscardine leading to heavy larval mortality causing low rate of seed multiplication for ‘Chotua’ seed crop and subsequent multiplication for ‘Jethua’ commercial crop. Similarly, seed multiplication rate during pre seed and seed crops, i.e. ‘Aherua’ and Bhodia for ‘Jethua’ commercial crop is very low as there two crops also fall during unfavourable seasons characterized by high temperature, high humidity and high rainfall. High temperature associated with high humidity favours higher incidence of bacterial diseases causing substantial crop loss. 4.3 Organizational Factor Seed organization in muga is weekly integrated, the supply of seed in time in required quantity is often uncertain. More than 90% of requirement of muga seeds is produced by the rearers themselves without adopting scientific process of seed preparation. Inadequate supply of muga commercial seed often hinders the productivity. On the other hand, pre-seed and seed crop rearing of muga silkworm, which provide the source of seed cocoons for commercial use, fall in unfavourable seasons hindering the rate of multiplication of seed cocoons. 5. Marketing Problem In Assam, the major silk business operations are being handled by the middleman and exploitation prevails, though efforts are being initiated to regulate the market mechanism in muga culture, muga-business is still in the clutch of a few middlemen who control the whole business. As a result, producers’ share in selling price of the final product gets reduced and the farming community as a whole becomes demotivated day-by-day. 6. Suggestive Approach In Assam, the transfer of technology is rather slow. Though the farmers have understood the need for good harvest, but they are still reluctant to follow the package of practices outlined for successful crop. Transfer of technology needs to be considered seriously. References Annual Report (2001), Regional Sericultural Research Station, Rowriah, Jorhat, Assam, pp. 36–37. Annual Report (2005), Regional secultural Research Station, Rowriah, Jorhat, Assam, pp. 42–43. Annual Report (2009), Central Muga Eri Research & Training Institute, Central Silk Board, Lahdoigarh, Jorhat, Assam, p. 33. Annual Report (2010), CMER & TI, Central Silk Board, Lahdoigarh, Jorhat, Assam. Annual Report (2010), Central Silk Board, Bangalore, p. 54. Annual Report (2011), CMER & TI, Central Silk Board, Lahdoigarh, Jorhat, Assam. Chakravorty, R. (2004), “Diversity of Muga and Eri Sericulture and its Prospects in Himalayan States”, Proceedings of the
National Workshop on Potential and Strategies for Sustainable Development of Vanya Silks in the Himalayan States”, Nov. 8–9, pp. 36–37.0 Rajan, R.K. and Hazarika, U. (2012), “Constraints in Muga Culture–Strategies and Research Programmes Undertaken at CMER&TI, Lahdoigarh”, Proceeding of the National Seminar on Recent Trends in Research & Development in Muga Culture–ideas to Action”, May, Vol. (3–4), pp. 7–8.

136
19 Pisciculture Oriented Agriculture in the Ziro Valley
Modang Reena and Anku Nani Dept. of Geography,
W.R. Govt. College, Deomali E-mail: [email protected], [email protected]
1. Introduction The Ziro Valley lies at an altitude of 1572 metres and stands at 1564 metres. The valley is situated in the central part of Arunachal Pradesh, which is bordered by Upper Subansiri district in the north-east, East Kameng in the west, Tibet and China in the north and Assam valley in the southeast. Physiography of this region is characterized by Himalayan mountain system. The exact topographic feature of this valley is that, it is surrounded by the hills and ranges in all directions and in the middle of the valley a small river Kiile flows from the north to south which along with its tributaries supplies sufficient water for rice cultivation. The valley, with salubrious climate situated at the altitude of 1572 metres from the sea level is the home of Apatanis, a tribal community of Arunachal Pradesh. The Intermontanne Valley, is popularly known as Apatani or Ziro Valley. The valley harbours many varieties of world’s rare flora and fauna belonging to high altitude species and those are accounted to this valley as the hotspot for late. The undisturbed verdure vegetation and perennial water resource of the valley has also sheltered many varieties of avian and aquatic fauna. The undisturbed verdure vegetation and valley. The aquatic fauna are edible to the Apatanis and thus they harvest them in time and season with the help of indigenous device. Apatani had brilliantly adopted a successful method of paddy cum pisciculture during 1965–66 whilst world is experimenting this type of culture. It is said that Apatanis are the first to have the know-how of paddy-cum-fish culture in our country. However, history speaks that Japan is the first country to have started this type of culture in 1844 A.D. The plot utilized for rice cum fish culture is mainly based on organic fertilization with a variety of animal excreta such as poultry dropping, wastes of plant husks, ashes from household burnt and remain of burnt straws after the harvest is over. 2. Background The Apatanis belong to the Tibeto-Mongoloid stock. As far as the myth of the Apatanis is concerned, ‘Abotani’ was the first ancestor of the Apatanis, who first transformed into perfect shape of human being on earth. He multiplied not only human being but also the creature of the earth. They migrated to the magnificent valley from northern areas beyond Khru and Kiime rivers. Earlier, the inhabitants of this valley were named as ‘Onka miri’, ‘Anka miri’, ‘Apatanang’ etc by early visitor of this valley. In 1944–45, Dr. Heimendrop called them as, ‘Apatani’ from then onwards the Apatanis have been named as Apatani. It is a mark of regard or affection, which can be used against any name.
Pisciculture Oriented Agriculture in the Ziro Valley
137
Again, there is a mystery as to origin of the name ‘ziro’. The mythological story reveals that there was a tribe those who are inhabited in old zero district and this tribe has been turned out of this valley. Consequently the name of the place was given as ziro. A number of academicians and scholars have made written effort to present original homeland of the Arunachali Tani tribe in their own way but the non-availability of the archaeological sources and other written documents have rendered them insignificant. However, there may be some truth about the migration of the non-Tani group of people of Arunachal who follow Buddhism and other religions, because they have their own written scripts and other evidences. Among them, the presumption of Dr. J. Nath (1988) and Dr. Dolley (1985) is somewhat relevant in the case of Tani tribes’ origin and migration. Dr. Nath presumes, on the basis of the Donyi-Polo religion of Adis and Bonpo religion of pre-Buddhist Tibetans. He stated that the Buddhist religion was introduced in Tibet in the seventeenth century A.D. and Tani tribe migrated towards present Arunachal in the beginning of the 8th century A.D. But there are some doubts about its authenticity because if it’s true, then Tani tribe must have at least lightest influence of the Buddhist culture, custom, philosophy, etc as non-Tani group of Arunachal have today. But there are neither least references to Tani tribe mythology nor of any similarity with them. This presumption for the period of migration is too early for them. Thus, Nath’ presumption may not be true for the Tani tribe migration. However, it is true that they migrated via Tibet. Dr. Dolley’s assumption is based on the migration of the Mongoloid tribe of India and the tribes of the neighbouring countries and not particularly on the migration of the Tani tribe of Arunachal Pradesh who inhabited the central belt of the present territories of Arunachal Pradesh. It is true in anthrop-metrical description because the physical feature of the present Tani tribe are more similar to the south-western people of China and Mongolian tribe than to the other tribes of the neighbouring countries of Iindia. The development and preservation of material culture such as adoption of agricultural measures, dwelling system and religious beliefs of the Tani tribe, especially Apatanis, are basic characteristics of the late Neolithic culture. Thus, the Tani people of Arunachal Pradesh might have migrated there after acquisition of knowledge of such brilliant method of agricultural adoption and other practices from the civilization of China and Mongolian tribes, which had flourished in Yangtze Kiang and Hwang Ho river valleys via Tibet before the Christian era. Without knowing their myth and tradition, no one can presume about the original home of Apatanis and other Tani people because there are no other written scripts and archaeological sources of information. In fact, the myth and legend of Apatani are very important because they throw light on every aspect of their life, origin and migration. The Apatanis are agriculturist. They practice permanent type of cultivation. The Apatanis flat valley has enabled the inhabitant to develop their irrigated agricultural field. So, early Apatanis did not want to leave this fertile valley and thus they settled themselves permanently over this piece of land for years to come as they felt secured and prosperous, though the twin danger of epidemics and devastating fire co-existed. Apatanis are well built, fair in complexion and medium to tall stature. The Apatanis lived in a fairly large village, compact and permanent. An Apatani family is patriarchal. Earlier, Apatanis had prominent tattoo mark on the face. However, the system of tattooing is being discouraged by the younger generation and has been abolished. Regarding social stratification, the tradition of the Apatani society is stratified as ‘Gyuchi‘ and ‘Gyuttti’.Here, the non-Apatani scholar may believe that this stratification of Apatani is closely related to Indian caste system of the early Hindus. Of course, the marital relation between them is not encouraged. This has been discouraged because on account of existence of separate religious ceremony altars for these two separate clan in every village. Except this, there is no difference between them in the society. They share every opportunity equally, whether it is political,
National Seminar on Management of Natural Resources for Sustainable Development: Challenges and Opportunities
138
economic, cultural or religious. Hence, there is no question of untouchability in the Apatani society unlike early Hindu society in Apatani society; the cross-cousin marriage is not approved. The Apatanis treat the wife of elder brother as second mother and wife of the younger brother as his own sister. Hence, cross-cousin marriage is totally unknown in the Apatani valley. 3. Objectives 1. To study the historical background of the development of pisciculture. 2. To analyze the relationship of geographical condition and development of pisciculture. 3. To make a comparative study of economic condition of the people who participate in the pisciculture with that of others. 4. To study the nature and extent of problems related to breeding, production and marketing of fishes. 5. To study steps taken by the govt and local bodies in the development of pisciculture. 6. To give suggestions for the development of pisciculture in the area. 4. Methodology The paper is based on primary and secondary sources. Secondary data was mainly obtained from data published from the Department of Agriculture, Government of Arunachal Pradesh. Fishery statistics is obtained from the Department of Fishery, Government of Arunachal Pradesh. Base map was developed from the topographical map of the area. Ten farmers from each selected villages were requested to fill up the questionnaire among which some were still practising paddy -cum-fish culture. Collected data were classified, tabulated and statistically cultured. 5. Pisciculture as Aneconomic Background As mentioned earlier, fish is one of the most important diets of Apatanis and it is also significant economic component for development with a view of raising the economic status of the Apatanis and it is also significant economic component for development with a view of raising the economic status of the Apatanis. This area has taken up various economically viable and labour generating fishery income under integrated rural development programme (IRDP). One such scheme was constructed for domestic fish pond on 50% subsidy basis. It can be said safely that there is no better scheme than that of fish culture for fulfilling the objectives of the tribal people as such: 1. Among the general measures of development, it has significance, in its scope, nature and quantum of economic benefit to the tribal community. 2. Creates a permanent income stream and substantial opportunities of employment for them. 3. Fish farming system is more or less renewable and requires very low input charging. The area offers scope for development in fishery and Apatani people are now increasingly coming forward to take up fishery as subsidiary occupation. 6. Institutional Setup The institution is an independent department with the Director of Fishery in the state. At district level, the district, the District Fishery Development Officer is assisted by two Fishery Officers, six Extension Officers, eleven Fishery Demonstrators, seven staff and five supporting staff.

Pisciculture Oriented Agriculture in the Ziro Valley
139
The main objectives of the fishery development programmes initiated by the governmentt for the area are: 1. Enhancing production and productivity of the people. 2. Improving socio-economic condition of the local people. 3. Generation of income and creation of opportunities for self-employment. The fishery programmes started in this area with a few five year plans. Now the fisheries activities have increased manifold with the enhancement of outlays. The subsidy oriented programmes for the fish farmers are paddy-cum-fish culture, the farmer’s secure direct benefit based on an average market rate of Rs. 80 per kg. Beside this, the government has implemented various schemes through Department of Fisheries to improve pisciculture activities in this area that are given below: 1. For pond culture through payment of 50% subsidy against construction cost. 2. To supply fish seed, feed to the villagers on 50% subsidy rate. 3. Establishment of fish nursery so as to supply fish seed to the local people. 4. Implementation of paddy-cum-fish culture programmes, especially, in this area as a unique programme. 5. Improvement of natural water areas like lakes for pisciculture purpose. 7. Cost Benifit Analysis of One Hectare Area of
Paddy Cum Fish Culture Table 1(a)
S. No. INVESTMENT Annual Operation Cost1 Denudation of paddy field (Canal or trench, strengthening Of bunds. Provision of switch gate) Rs 5,0002 Paddy cultivation (from sowing to harvesting) Rs 50003 Fish culture, cost of 1000 fingerlings@Rs1000 Per 1000fingerlings Say investment (1+2+3) Rs 1000Rs 5000+5000+1000=Rs 11000 Table 2(b)
S. No. Income1 Sale of 150 kg fish @ Rs 200 per kg. 200×200 = Rs 40,000 2 Sale of 1,000kg paddy @ 30 per kg. Rs30×10,000 = Rs 30,000 Total income 40,000+30,000 = Rs 70,000 Table 3
Net SurplusTotal Income Total Investment Total Rs 70,000 Rs 11000 = Rs 59,000
Source: Data collected by the investigator 8. Input and Output Ratio of Fish and Paddy The Apatani people of this area are getting benefit through double cropping i.e. paddy-cum-fish simultaneously in the same plot and in same period of time without any supplementary addition. An overview of the present pace of pisciculture development has revealed that pisciculture can play a dominant role in the enhancement towards the growth of the region as well as the state if sufficient development facilities are provided in near future.

National Seminar on Management of Natural Resources for Sustainable Development: Challenges and Opportunities
140
Table 4
S. No Item Input Output Net Surplus1 FISH 1000 40,000 39,0002 PADDY 1000 30,000 29,000 TOTAL 2000 70,000 68,000Sources: Data collected by the investigators
9. Conclusion 1. Cultivation of crops for higher economic return within the climatic and ecological limitations of the area can be achieved by restructuring the cropping pattern. 2. Urgent attention should be given to develop infrastructure inputs for agricultural products like marketing, processing unit, storage facilities, co-operative etc. 3. Development of infrastructures facilities inside the village block should be provided to the proper linkage with the regional transport. 4. Modernization and mechanization of agriculture is not yet produced in this area. They are practising age-old method of cultivation without using any animal power. So, extensive research work is necessary to find out how far the concept of modernization is applicable within this valley area, taking its topographical and other related technological dimensions into consideration. For instance, special attention can be given for the introduction of high yielding variety seeds in accordance with the agro-climatic condition which is not yet a popularized practice among the Apatanis. 5. In order to facilitate such improved agricultural input, the Departmentt of Agriculture under Govt. of Arunachal Pradesh should take special measures to generate among the villager through adequate demonstration as well as integrated programme. 6. Development of forest and pastures are essential not only from economic point of view but also for restoring and maintaining the ecological balance of the area. For example, reckless felling of trees is one o the major problems of the area in recent years, which caused a large scale destruction of valuable forest for commercial purposes. So, proper attention should be given to minimize the felling of trees; otherwise, it will bring disastrous consequences for the community itself. So, mass awareness campaign is essential where Apatani elite can play a pivotal role. 7. The area is lagging behind in the agro-based industries. So, an attempt to develop the forest based industries may be viable alternative to strengthen the economic base of the people of this valley. This may also help to curb down the unhealthy trend of timber export outside this region. 8. There should be an organized system for marketing of fish by introducing fishery cooperatives. 9. Proper coordination between centrally sponsored schemes i.e. Fish Farming Development Agencies (FFDA) with research organizations of the state, state fishery development organisations are important in order to upgrade the technical knowledge of the people involved in such groups. 10. FFDA need to intensify their effort to maintain seed bank to meet the demand of the fish seed. Establishment of more number of hatcheries will go a long way in providing adequate quantities of seed.

Pisciculture Oriented Agriculture in the Ziro Valley
141
11. Pond culture is not much organized as paddy-cum-fish culture in this area and therefore, it is a seasonal source of income for the Apatanis. So, proper encouragement should be given to them for pisciculture so that they can get benefit from fishery throughout the year. 12. Apatani valley is industrially backward area. For the development of medium and large scale industries, road transport as well as market facilities should be provided. Thier traditional household industries should be encouraged and help them to market their product in a well organized way. 13. Some people use chemical substances like bleaching powder which is most discouraging in the field of pisciculture practices, which results in the death of valuable food organisms of aquatic environment. Act need to be enforced to stop such unwanted practices of fishing, for increasing food production in a sustainable manner, conservation of aquatic life, biodiversity is necessary prerequisite.

142
20 Jhummias Innovations for Land Degradation Control and Sustainable Agriculture in Sakei Lui Sub-Watershed
R. Zonunsanga1, Ch. Udaya Bhaskara Rao2 and P. Rinawma2
1UGC-Academic Staff College, Mizoram University, Mizoram 2Dept. of Geography & Resource Management, Mizoram University, Mizoram
E-mail: [email protected]
1. Introduction The quality of air and water resources either directly or indirectly depends upon the ways of man manages the land resources. Land supports biotic and abiotic resources that determine the input of oxygen–carbon dioxide exchange in the environment and also the rate of infiltration, ground-water recharge, run-off, interception and further more siltation and contamination of water resources. Land resources may be, therefore, undoubtedly prioritized for first hand conservation to bring about sustainable development. Such conservation measures should be based on the intensity of soil erosion which is regarded as the main attributor and the first order category amongst the land degradation problem (Hitzhusen, 1993). The contemporary world where the ‘fittest survives’ has accompanied a situation where men, including the jhummias, are compelled to look for innovations for their survival from the global competitions and to relieve pressure on available land for culture. The jhumming system, therefore, regardless of its many negative aspects, has undergone certain changes and innovations which allow the cultivation of the same jhum plots for a considerable period without shifting, unlike the present system. Such improvements, coming with soil erosion control, could become among the best sustainable measures for, they are highly adaptable to the cultures, traditions, economy and inbuilt technology of the tribal farmers within the highly fragile ecosystem of the north-eastern Himalayas. This, however, does not mean that the improved shifting cultivation system should dominate the others but should simply be carried out because other alternative farming systems could not be well-adapted to the jhummias despite the great efforts undertaken by agencies and governments. 2. Methods and Materials Soil erosion being the root-cause of land degradations, estimations of soil loss in the study area have been performed through integration of different thematic data in the GIS environment. The data include rainfall erosivity, soil erodibility, slope length and steepness, land use and vegetation/ canopy cover and, anthropogenic management practices which were derived from the Survey of India topo sheets, satellite imagery, soil map and meteorological data coupled with intensive field investigations. The Revised Universal Soil Loss Equation (Renard, et.al. 1994) with minor modifications has been applied to quantify the metrological loss of soil within the study area. Special attention has been given to comparative assessment of the conventional shifting cultivation system and the improved one in regard to their basic soil composition and long term sustainability.

Jhummias Innovations for land Degradation Control and Sustainable Agriculture in Sakei Lui Sub-Watershed
143
Fig. 1: Location Map of Sakei Lui Sub-Watershed The task of soil loss estimation has been performed within the area between 92⁰25’–92⁰ 30’ east longitudes and 24⁰ 05’–24⁰ 10’ north latitudes, in a small sub-watershed of River Sakeilui having an area of 45 sq. km. areasin the north-western part of Mizoram (Fig. 1).
3. Erosion-Induced Land Degradation The rate of soil erosion in hilly terrain is highly associated and determined by the protective services of plants and trees and also the influence of forces on varying degree of gravitation towards run-off velocity. Areas under the erosion intensity of 10–20 tons/ha/yr are seen on the slope with comparatively lesser degree of slope gradients with thick forest cover (Table 1). Moderately degraded lands with the soil loss rate of 20–80 tons/ha/yr are found to be associated with the nearly levelled lands where jhumming and wet rice cultivations are practiced resulting to sheet and splash erosion caused by heavy precipitation during storms. It is observed that these are also distributed along the steep slopes within the degraded forests. The severely eroded lands with intensity higher than 80 tons/ha/yr clearly showed the ill-effects of conventional jhumming system. These intensity zones are concentrated on higher degree slope gradients where jhumming is practiced.

National Seminar on Management of Natural Resources for Sustainable Development: Challenges and Opportunities
144
Fig. 2: Soil Erosion Intensity Zones of Sakeilui Sub-Watershed
Table 1: Soil Loss Intensity Distribution
Soil Loss Intensity (ton/ha/yr) Area Coverage (ha) Area Coverage (%)00–20 1700 37.36 20–80 2375 52.20 80 Above 400 8.79 Built Up 75 1.65 Total 4550 100.00 4. Tribals’ Innovations in Jhumming Awareness on the prevailing global environmental problem has brought about the search for more sustainable means of land culture even amongst the jhummias. This new mindset, inculcated to the farmers along with their contemporary competitive minds resulted to the innovations of more environmental-friendly measures which are at the easy disposal to the economically backward farmers. The new system, being the outcome of evolution, the measures is highly adaptable, acceptable and applicable to the tribal livelihood. Even though very simple in actions, the new structure showed and proved the primary cause of problems arising from the conventional jhumming. The new improved system consists of soil erosion conservation to tackle the processes of soil nutrient loss, acidification and reduction of soil moisture-holding capacity. This includes the construction of simple contouring across the slopes at regular interval, using bamboos, branches of trees or remnant structures of the burnt jhum. Besides, trees with large canopy are left at various spots without cutting or burning. These two simple measures are capable of reducing run-off velocity and the kinetic impact of raindrops to cause rain-splash on the soil surface cover.

Jhummias Innovations for land Degradation Control and Sustainable Agriculture in Sakei Lui Sub-Watershed
145
In general, the conventional jhumming system in the area could not be repeated in the same plot for more than 2 (two) consecutive years. The yearly decrease in the soil nutrients content and productivity (Table 2) clearly depicts the nature of jhumming as ‘necessary evil’. However, the improved system of jhumming, carried out with innovations of the jhummias, proved its sustainability even after four consecutive years and is still likely to continue. Table 2:Year-wise Comparison of Soil Composition from Two Jhum Plots Soil Composition Simple Jhumming Improved Jhumming
1ST YEAR pH 5.90 6.00 N (kg ha⁻¹) 599 572 P (kg ha⁻¹) 1.91 4.28 K (kg ha⁻¹) 150 259 OM (g kg⁻¹) 9.19 9.15 Productivity (Rs. ha⁻¹yr⁻¹) 42,000 55,000
2ND YEAR pH 5.79 5.93 N (kg ha⁻¹) 573 568 P (kg ha⁻¹) 3.48 6.10 K (kg ha⁻¹) 125 299 OM (g kg⁻¹) 8.07 8.89 Productivity (Rs. ha⁻¹ yr⁻¹) 28,500 53,500
3RD YEAR pH 5.71 5.87 N (kg ha⁻¹) 537 551 P (kg ha⁻¹) 2.74 5.29 K (kg ha⁻¹) 134 248 OM (g kg⁻¹) 7.67 8.96 Productivity (Rs. ha⁻¹ yr⁻¹) (Abandoned) 54,700
4TH YEAR pH NA 5.81 N (kg ha⁻¹) NA 546 P (kg ha⁻¹) NA 5.36 K (kg ha⁻¹) NA 232 OM (g kg⁻¹) NA 8.87 Productivity (Rs. ha⁻¹ yr⁻¹) (Abandoned) 54,500
5. Conclusion Jhumming cultivation has been para-phrased as ‘Necessary Evil’ because of its shifting nature. It is to be noted that the system of jhumming alone has nothing to do towards land degradation as long as the farming practice is done within the same plot. Compulsion to shift the cropping land has arisen due to loss of soil nutrient resulting to low productivity. The rapid loss of soil, once checked, brings the overall changes in the system that innovations made by the jhummias towards soil conservation proved their sustenance for agricultural development. References Hitzhusen, H. (1993), “Integration of GIS and USLE for Soil Loss Estimation in Himalayan Watershed”, A.H. Sheik’s, Recent
Research in Science and Technology, Vol. 3(3), pp. 51–57. Renard, K.G. and Freidmund, J.R. (1994), “Using Monthly Precipitation Data to Estimate the R-factor in the RUSLE”, Journal of Hydrology, Vol. 157, pp. 287–306.
146
21 Joint Forest Management and Women Access to Non-Timber Forest Product in East Sikkim
Karma Detsen and Ongmu Bhutia Department of Geography,
North-Eastern Hill University, Shillong, Meghalaya E-mail: [email protected]
1. Introduction Forests are of great importance to the human beings and play a significant role in improving human welfare. However, the growing population puts pressure and leads to overexploitation of forest resources, which is why the sustainability of forests is under serious threat. To conserve forests and to maintain its sustainability, in 1988 the Government of India announced the National Forest Policy and in 1990 introduced the Joint Forest Management (JFM) which includes the process of decentralization of the management of forests of the country with involvement of local communities for sustainability. The local people’s attitudes towards forests and its related programme are influenced by different factors, like class distribution, caste and gender etc. Gender role in JFM is a matter of concern where women are sidelined and kept in the background of management process and the regulations on traditional rights to access forest resources have adverse impact on the livelihood of women, particularly of tribes and other forest-dwellers and those staying in forest fringes and are dependent on forests for livelihood. Whereas men are interested in commercial forestry, women are more interested in the management strategies which ensure welfare and wellbeing of their families. The National Forest Policy of 1988 clearly mentions that women should be involved in achieving JFM policy goals but women groups did not witness any major change in their favour. These policy limitations and social barrier relegate the women position in JFM and exclude them from decision-making. Sikkim being a highly forested state where forest constitutes 82.31% of state’s geographical area, Join Forest Management Committees (JFMC) is actively functioning in all the villages. In Sikkim, JFM was enacted on 26 June 1998 under Notification No. 202/F to constitute forest protection committees for forest management of reserved forests, Khasmahal, and Gorucharan (common grazing land). These were later renamed JFMCs in 2006 with the aim of involving local people residing around, or in the vicinity of forests, for better conservation of forests. Due to large area occupied by forests in terms of land use, the state alone cannot effectively manage the forest and active cooperation of local people is essential. In Sikkim, compared with other mainstream states, women play a significant role in both social and cultural affairs, but Sikkim being a deeply entrenched patriarchal society, women’s rights on land ownership have remained a matter of concern. Gender discrimination forces rural women to depend largely on NTFPs, i.e., common property resources. Sikkimese women play a vital role in ensuring welfare of their family. 2. Physical Setting of Study Area Sikkim, a landlocked state of the Indian union, is located in the Eastern Himalaya, sharing an international border with China in the north, Nepal in the west and Bhutan in the east. The state is connected with the rest of the country through a narrow corridor, bordering the state of West Bengal on its southern part. Geographically, entire state comprises of hilly and rugged terrain supporting large proportion of land under forest cover.

Joint Forest Management and Women Access to Non Timber Forest Product in East Sikkim
147
Table 1: Forest Type in Sikkim
Geographical Area Reserved Forest Protected Forest Total Forest Area Percentage of State Geographical Area 7096 5452 389 5841 82.31
Source: Forest Survey of India, 2011 States cover an area of 7069 sq. km of which the recorded forest area is 5841 sq. km which constitutes 82.31% of the state’s geographical area and under the administrative control of Forest Department. The state’s total population is 607688 (according to 2011 Census) of which large proportion of population resides in the rural areas and is heavily dependent on the forest to run their livelihood. Legally, forest area has been classified into reserved forest and protected forest which constitutes 93.34% and 6.66% of the total forest area. Table 2: District-wise Forest Cover in Sikkim (Area in sq. km)
District Geographical Area
Very DenseForest
Moderate Dense Forest
Open Forest
Total Percentage of Geographical
Area East 954 162 411 126 699 73.27North 4226 135 890 292 1317 31.16South 750 93 371 107 571 76.13West 1166 110 489 173 772 66.21Total 7096 500 2126 698 3359 47.34Source: Forest Survey of India, 2011 According to Forest Survey of India, 2011, the total forest cover of the state was 3359 sq. km, which was 47.34% of the state’s geographical areaas aginst 43.95% in 1993. The area under the very dense forest is 500 sq. km; moderate dense forest is 2126 sq. km and open forest is 698 sq. km. Among the type of forest cover, state has high moderate dense forest and district-wise north district has large cover of forest (1317 sq. km) mainly covered by moderate dense forest and open forest, east district has high dense forest.
Table 3: Areas under Forest Cover in East District of Sikkim (in sq. km) Reserved Forest 55581.63 Protected Forest 6370.37 Unnotified Forest 3538Total 65490Source: IIFM, 2009 The total forest area of the East Sikkim Forest Division is 65490 sq. km. Among the forest cover type, East district has high reserved forest (55581.63 sq. km). The division lies at 88˚26’26’’ to 88˚54’25’’ longitude and 27˚8’2.88’’ to 27˚25’32.28’’ latitude with varying altitude from 300 metres to 4500 metres. The forest types are sub-tropical forest, temperate forest, alpine forest, sub-alpine and alpine scrub (IIFM, 2009). The division comprises of three sub-divisions: Gangtok, Pakyong and Rongli.
3. JFMC and Rural Women In Sikkim, Joint Forest Management Committee (JFMC) was enacted on 26 June 1998 under Notification No. 202/ F. JFM is the process of decentralization with involvement of local communities for sustainable management of forests. JFM has done a lot of work on plantation, checking of landslides, and other forest-related activities which benefitted the local people involved in it. Apart from that, JFM has also focussed on tourism sectors which contribute to development of the village and generate employment to the local people. The committee is also constructing footpaths, checking landslides and funding Self Help Group (SHG) in order to encourage rural women to develop financially. Besides this, the government has adopted forest related programmes such as State Green Mission and Ten Minutes to Earth. In this context, it must

National Seminar on Management of Natural Resources for Sustainable Development: Challenges and Opportunities
148
be said that the government has a great role to play in bringing awareness among the people. But unfortunately, despite the wide acceptability of the Joint Forest Management in the state of Sikkim there are several problems regarding the functionalities of JFM which is highly male-centric. National Forest Policy of 1988 provides for the participation of women in JFM and according to JFM circular of February 2002, there should be 50% of women in each JFM Committee. Tables showing the Numbers of Families include in JFMC in the District of Sikkim: Table 4: (2008–2009)
District No. of Female Population No. of Male Population Total East 6768 8918 15686West 6697 8969 15666North 839 3591 4430South 39945 43931 83876Source: Forests, Environment and Wildlife Management Department The total participation of people in JFMC is highest in South District (837866 people) followed by East District (15686 people), West District (15666 people) and North District (4430 people). The women population in South District JFMC is highest (39945) and minimum in North District (839).
Table 5: (2010–2011)
District No. of Female Population No. of Male Population Total East 6779 9165 15944 West 6738 8984 15722 North 842 3588 4430 South 39949 43849 83798 Source: Forests, Environment and Wildlife Management Department People participation is highest in South District (83798) followed by East District (15944), West District (15722) and North District (4430). The female population under JFMC is highest in South District (43849) and lowest in North District (842). The total number of families and female population participating under JFMC is highest in South District followed by East District, West District and North District.
4. Livelihood Structure of Rural Women Sikkim being a forested state, the rural women, particularly in the forest fringes largely depend on forest resources for their means of livelihood. Women being the primary user of forest resources, the effect of the forest degradation have negative impact on livelihood of rural women. Rural women, therefore, greatly value and support the forest conservation. Gender discrimination forces rural women to depend largely on forest and other common property resources to meet the household needs and fulfill their role of ensuring the welfare of the family (Oyerinde et al., 2010). 4.1 Social Status of Women in Sikkim: Issue of Concern In Sikkim, women enjoy a significant position in both social and culture affairs. Such general statement is given on account of women of Sikkim though underneath existed the patriarchal form of society. Being a patriarchal form of society, Sikkim has deeply rooted gender bias which is culturally engraved in the society. Traditionally, women status was dependent on roles assigned to them by men who considered them as unproductive, and therefore, only men have right the control over the output resources. At present, with the touch of modernity and development, the socio-economic status of women is measured through indicators such as income, education, occupation and skills.

SourceIn Sik46.76%, respectivin literacy4.2 ImpNTFPs nosocially mwomen weconomicDasguptaare unemforest resWater Firewood Fodder Wild EdiblMedical PlTimber The rdaily livefirewoodtimber asbut also rconservatThe hinterest itheir liveways in w
Womfollowed which m
Grap
e: https:// censkkim, the li60.41% anvely. Both, thy rate, thereortance of ot only repremost marginwho gathercally, or usea et al., 2006mployed andsources for mles lants respondentses. Among t, fodder, ws the last prreflects that tion. household rin terms of elihood, whewhich forest
men in the by selling makes wome
Join
ph Showing thsusindia.gov.interacy rate nd 76.43% he female ane remains a sf NTFPs to Resent the sonalized peop forest proe them for 6; Awono et d actively inmeeting the
Table 6: R
s are asked the six foreswild edibles, iority. This women areresponsibiliaccessing rereas men ts are impor
Tabl
Sadhu Gaonpurpose, men a source
050
100
Lite
racy
Rat
eate
nt Forest Managem
he Literacy Ran/ 2011_prov_rof female and for thend male litesharp differRural Womource of incople who are toduct, procefamily const al., 2010). Involved in basic needsRating of the P
to rank thest products,medical plranking note more involties carriedesources almerely focutant to womle 7: PurposeHousTo seMediAny on village mmedical purpe of food s
1981 19Y
ment and Women
149
ate of Male anresults/ prov_din the yeare male it weracy rate haence betwemen ome but alsothe main acess them ansumption (MIn the villaghousehold s of their fam
Products Imp
e product ac, majority rlants and tit only showsved in subsid by men aso varies. Wus on the comen group, is
behind the Cosehold consumellical purposeothersmainly depepose and otsecurity in
991 2001YearYear
Access to Non Tim
nd Female Popdata_products_ 1981, 199was 43.95%ave increaseen female ano the basic dtor in NTFPnd either sMarshall et ge (Sadhu Gawork. Thesmily. ortant to Rur
ccording to ranked wateimber. All ts the importistence activand women Women prefommercial s very differollection of Nmptionnd on NTFthers. NTFPtheir famil
2011
mber Forest Produ
pulation of Sik_sikkim.html 1, 2001 and%, 65.70%, ed Even thond male litedomestic neP attraction, sell them toal,. 2003; Haon), all these women a
ral Women 123456the importaer in the firthe women tance of provities and grvaries, thefer the resopurpose (Brent than wh
TFPs
FPs for houPs provide bly. Among t
Male Female
uct in East Sikkim
kkim d 2011 was76.04% andough there iracy rate. eds and it ismost of theo support tHasalkar et e women resare heavily
ance to themrst place folrespondenoduct to rurreatly value erefore, theiurces whichenjaman, 2hat is for me
usehold conbasic domesthe respon
s 22.20%, d 87.30% s increase s often the e time, it is the family
al., 2004; spondents relied on
m in their llowed by ts ranked ral women the forest ir area of h enhance 010). The en.
nsumption stic needs dents, six

National Seminar on Management of Natural Resources for Sustainable Development: Challenges and Opportunities
150
respondents not only engage themselves in household chores but also support the family economically by adopting the vendorship during market days (weekend days). The women mention that it is not an easy task to carry out vendorship as they have to face many problems in market and also at home. The items which they sell in the local market collected from the forest are fern, mushroom, wild fruits, herbs, wild vegetables etc. Remaining non-women vendor they sell the collected NTFPs to middle women as they are unaware of the vending process in market and support very less amount of NTFPs items, which has high demand in the market. NTFPs play an important role in empowering women in family and society but JFMC framework and procedures restricted women’s traditional rights on access to NTFPs in the forest area. JFMC allowed the collection of minor forest products but permission to enter the forests and collect forest resources has to be taken from the Forest Department. 5. Study Area There are total 907 villages in Sikkim and 275 villages in East district of Sikkim. At present, there are total 155 JFMC and each JFMC is formed consisting of one or more Gram Panchayat ward with varying number of villages. Dalapchan JFMC falls under the Dalapchan Gram Panchayat ward, Rongli sub-division, East district of Sikkim. Dalapchan JFMC consists of seven villages: Mangkhim Gaon, Sadhu Gaon, Dara Gaon, Sawa Gaon, Chandanay, Mandir Gaon and Rashin Gaon. Out of these villages, Sadhu Gaon is chosen for the proposed study as it is located near to the reserved forest area. 6. Database and Methodology The study is based on both, primary and secondary data. The primary data was generated from household surveys using interview schedules (semi-structured and open-ended interviews). The method used to collect primary data is both purposive sampling system and stratified random sampling technique. The purposive sampling frame contained only women who are member of JFMC and stratified random sampling was used for other village women dependent on forests, taking income as a strata. The sample size of 45 households was chosen to conduct the study. Focus group discussion was conducted among the village women. Focus group discussion and household survey method mainly focussed to know the gender role in JFMC, women perception towards JFMCs and the importance of NTFPs for livelihood of rural women. The data obtained from the secondary sources, such as government report, published and unpublished data of government, internet and article to investigate the women participation in JFMC and to see the possible factors affecting the livelihood of rural women. 7. Results, Discussion and Conclusion Sikkim as one of the greenest state, has achieved an immense success regarding the conservation and protection of forest as valuable resources. In the past two decades, Sikkim has become the only state to have increased its forest cover and has the highest recorded forest area in the country (Aug 18th, 2013, The Times of India). The state government has aimed to bring the entire 907 village under JFMC control. Rural women depend largely on forest resources, majority of women collect NTFPs for means of livelihood and some of them also generate income by selling NTFPs in the local market. According to the circular of February 2002, at least 50% of women should be in each JFM Committee; considering this circular, the number of women in JFMC has been increased from 20 members to 25 members in Sikkim. Though the percentage has been increased but still institution is biased towards the male members. In Dalapchan JFMC, the total member is 64 out of which only 19 are women member, the men have outnumbered the women; therefore, all the decision-making process remains with male members and women are sidelined in the decision-making process. All the 45 women respondents felt that access to forest and forest resources, restriction has become

Joint Forest Management and Women Access to Non Timber Forest Product in East Sikkim
151
more and strict where women have to ask for permission from the Forest Department to enter the forests and collect NTFP. Rural women are unaware of the procedures and paper work for permission to collect NTFPs and due to their lack of confidence and shy nature, institutions undermine the women’s traditional rights on access to NTFPs. Level of education among the respondent is very low where majority has attained only primary level of education. The women respondents showed the interest in becoming a member of JFMC and state that gender and class play important roles in becoming the member of JFMC and in decision-making process in the committee. Although JFM programme has been regarded as an innovative way of decentralization in terms of the forest management, which gives due respect to the locals in the decision-making processes making them stakeholders, however, the question of acceptability and adaptability is a matter of concern as most of them are yet to understand the conceptual framework and socio-economic implications of JFM. To make JFMC more effective, efficient and sustainable, its ‘male-centric’ nature should be dismantled. JFM programme will get complete success if it could empower those groups which depend on the forest to make a living. Therefore, JFM scheme and policy should focus on village women and understand their intimate relation with forest. Their confidence has to be gained by providing them their traditional rights over the forest resources maintaining sustainability and empowering them in JFMC as a decision-maker. More number of women should encourage through conducting awareness programme and during meeting at feasible time and distance. NGOs and media can act as a bridge between the rural women and JFMC by bringing awareness amongst women regarding the aims and scope of JFM and equally highlighting the grievances and plight of rural women. JFMC should develop the strategies to achieve the goals of gender equality by making women’s merits visible. 8. Glossary 1. Khasmal: In Khasmal forest type land, people have the right to collect firewood and minor products but it is only possible with permission from the Forest Department. 2. Gorucharan: In Gorucharan forest type land, people have right to graze and collect fodder. 3. Self Help Group: A group organized by village women through which they generate income by taking up manual activities. References Awono, A., Ndoye, O. and and Preece, L. (2010), “Empowering Women’s Capacity for Improved Livelihoods in Non-Timber Forest Product Trade in Cameroon”, International Journal of Social Forestry, Vol. 3(2), pp. 151–163. Benjamin, A.E. (2010), “Women in Community Forestry Organisation: An Empirical Study in Thailand”, Scandinavian
Journal of Forest Research, Vol. 25(S9), pp. 62–68. Dasgupta, T., Roy, A. K. and Chattopadhyay, R.N. (2006), “Gender Justice in the Frame of Joint Forest Management in Indian Context: A Case-Study from Nayagram Block of West Midnapore”, West Bengal Anthropologist, Vol. 8(3), pp. 161–166. Hasalkar, S. and Jadhav, V. (2004), “Role of Women in the Use of Non-Timber Forest Produce: A Review”, J. Soc. Science., Vol. 8(3), pp. 203–206. India State of Forest Report, (2011), [Online] Available from: www.fsi.org.in/cover_2011/sikkim.pdf [Accessed 23rd October] Marshall, E. and Newton, A.C. (2003), “Non-Timber Products in the Community Of El Terrero, Sierra De Manantlan Biosphere Reserve, Mexico: Is Their Use Sustainable?”, Economic Botany, Vol. 57(2), pp. 262–278. Oyerinde, O.V. and Ajayi, M.A. (2012), “Rural Women’s Access to Forest Resources and its Impact on Household Food Security in Ondo State, Nigeria”, Agenda: Empowering Women for Gender Equity, Vol. 24(86), pp. 135–145. Singh, K., Mali, K.P., Kotwal, P.C. and Omprakash, M.D. (2009), Research Project, Forest Resource Valuation and Accounting: An Exploratory study in the State of Sikkim. Indian Institute of Forest Managment, Bhopal, [online] Avaliable from: www.iifm.ac.in/ sfmindia/ pdf/ Sikkim_FRA_report.pdf [Accessed 23rd October]. Singh, N.M. (2004), “Women and Community Forests in Orissa: Rights and Management”, In: Sumi Krishna (eds). Livelihood and Gender: Equity in Community Resources Management, Sage Publication, pp. 306–322.
152
22 Development and Environment: North-East India Chapter
Yumnam Premananda Singh Govt. Mizoram Law College, Aizawl
E-mail: [email protected]
1. Introduction The importance of the environment is universally acknowledged. The International Court of Justice (1996, p. 226) rightly acknowledged that, ‘the environment is not an abstraction but represents the living space, the quality of life and the very health of human beings, including generations unborn.’ Two of the most pressing problems confronting the international community at the present time are those of development and of the protection and improvement of the human environment. Development provides the capacity to sustain nature’s life support systems, but can also threaten them, in turn, setting back development. International efforts for the protection and preservation of the global environment started with the convening of the Stockholm Conference on Human Environment in 1972. After ten years of this journey, UNGA adopted a landmark resolution entitled: the World Charter for Nature and Principles of Sustainable Development, in 1982. The journey from the Stockholm Conference to Rio Summit in 1992 to Rio+20 led to the recognition that all human beings are entitled to a healthy and productive life in harmony with nature. Peace, freedom, development, and environment remain universal aspirations today, and it has been increasingly acknowledged that they are closely interlinked. It was this recognition that was responsible for the enactment of various environmental laws in India and Constitutional Amendments which are designed not only to preserve and protect environment, but also to prevent environmental pollution. In the enforcement of these laws, the Indian judiciary has played a seminal role and used public interest litigation as a convenient tool to create an organic body of environmental jurisprudence in the country. 2. Methods and Materials The researcher adopted collaborative legal research methodology; in particular, its doctrinal and empirical components. In order to undertake this academic exercise, the researcher formulated research problems concerning area of fundamental importance of conflicting interest of development and environment, by applying case study and analytical legal method of thought process after brief review of literature in the field. Primary sources like case law, legal documents, conference proceedings and secondary sources like commentary by authoritative experts and juristic writings are used in the process. And finally, generalization and interpretation of the study by tools of legal reasoning through induction, deduction and analogy comes into play. 3. Result and Discussion A brief commentary on the result of this academic exercise suffices as separate headings and sub-headings and analytical discussion of the matter.
Development and Environment: North-East India Chapter
153
4. Development Since the dawn of civilization, man has tried to excel itself by conquering nature. He has done so, either for his development, or for the sake of enjoyment. In this process, he has affected his surroundings very badly. Stark (1989) has viewed that international law of development (ILD) has not yet reached the stage where it can be set down as a substantial body of binding rules, conferring specific rights upon developing states and imposing duties on developed countries. The development represents in a point of fact a key objective of the New International Economic Order. The definition of ‘development’ presents inseperable difficulties by reason of the range of operations encompassed. This largely explains the lack of acceptance of the view that there is a ‘right to development’ which can be characterized as a human right in the strict sense. The Report of UN Committee for Development (1970), rightly noted that, ‘It cannot be over-emphasized what development implies for the developing countries is not simply an increase in productive capacity but major transformations of their social and economic structures’, and that ‘the ultimate purpose of the development is to provide opportunities for a better life to all sections of the population’, and to achieve this, it would be necessary in developing countries to eliminate inequalities in the distribution of income and wealth, and mass poverty and social injustice, including the disparities between regions and groups, while there would have to be arrangements for new employment opportunities, greater supplies of food and more nourishing food, and better education and health facilities. On a different level, there should be international co-operative measures to establish, strengthen, and promote scientific research and technological activities which have a bearing upon the expansion and modernization of the economies of the developing countries. The Committee recognized that ‘at the present state of knowledge, the intricate links permeating the process of development are not all amenable to quantification on the basis of a common framework’. Ten years later, the Report of the Independent Commission on International Developmental Issues (1980) dealt with the matter under the heading ‘What Does Development Mean?’, stating that ‘the focus has to be not on machines or institutions but on people’, and added: ‘One must avoid the persistent confusion of growth with development, and we strongly emphasize that the prime objective of development is to lead to self-fulfillment and creative partnership in the use of a nation’s productive forces and its full human potential.’ On this line, the Rio Declaration affirms that human beings are ‘at the centre of concerns for (sustainable) development. They are entitled to a healthy and productive life in harmony with nature’. In addition to this line of thought, ten objectives, which may be regarded as standards of development, were also proposed in the Report of the Commission on International Development (1969) established by the President of the World Bank Group. Discussion on the matter is out of this paper. The World Development Report (2012), World Development Indicators (2013) and Human Development Report (2013) published by the World Bank and United Nations Development Programme are also beyond the scope of this paper. In fact, man has developed but only at the cost of his environment, the effect of which is looming large on his head. Development without the concern for the environment can not only be short term development but also threaten them, in turn, setting back development. Development should be in harmony and in rhythm with environment and precaution should be taken that least damage is caused to our environment. Development and better life is the natural instinct of man. So, the traditional concept that development and environment are opposed to each other is no longer acceptable. The ‘sustainable development’ is answer to this question. It is defined by Brandtland Report (1987) as ‘Development that meets the needs of the present without compromising the ability of the future generations to meet their own needs.”

National Seminar on Management of Natural Resources for Sustainable Development: Challenges and Opportunities
154
4.1 Sustainable Development: Development and Environment Humanity has not progressed on the road to sustainability as far as hoped in 1992 at Rio. Natural resources such as forests, sea bed, etc. are not the fruits of the labour of present generation and thus, these resources can only be exploited with adequate consideration of the ‘rights of the future generations’. It is very difficult, if not impossible, to give the precise meaning of the expression, ‘Sustainable Development (SD). SD as propounded at Rio Conference (1992), contains within it two key concepts: a. The concept of ‘needs’, in particular the essential needs of the world’s poor to which overriding priority should be given; and b. The idea of limitation imposed by the state of technology and social organization on the environment’s ability to meet present and future needs. The concept of SD incorporates the idea of guaranteeing the needs of future generations against the exploitation by the present generation. For development, the present generation is exploiting all natural resources, renewable as well as non-renewable, without having regard for the future generation, without caring for the outcome of the developmental activities, is against the ideals of sustainable development. It needs an integrated consideration of economic and ecological development factors. SD, therefore, may be accepted to be a target with the help of which individuals, organizations and states are to assess the impact of human action on the environment and the resource base, i.e., if the project examined complies with the goal of SD, then it is okay, but if not, then it must be abandoned. This approach may be good as a political concept, but its effectiveness as a legal consequence appears to be doubtful. Moreover, the concept of intergenerational equity and responsibility may be accepted as a ‘progressive’ step but it is difficult to precisely limit as to how much is required for the present generation and how much for future generations. On the basis of Brandtland Report (entitled Our Common Future, 1987) and other international documents prepared at Rio, the following have been accepted to be the contents of SD: 1. Intergenerational equity. 2. Use and conservation of natural resources. 3. Environmental protection. 4. The precautionary principle. 5. The polluter pays principle. 6. Obligation to assist and co-operation. 7. Eradication of poverty. 8. Financial assistance to the developing countries. These principles may help to some extent in striking a balance between development on one hand, protection and preservation of environment on the other. However, as a legal content, it may not offer a precise limit. It is difficult to say that up to this limit development is good and beneficial but beyond this, it is bad and not in the interest of the living being. But, the concept of SD brought together universal aspirations of peace, freedom, development and environment. Strong interdependencies are now recognized among the economic, social and environmental dimensions of SD (UN Department of Economic and Social Affairs, 2013).
Development and Environment: North-East India Chapter
155
The Millennium Development Goals Report (2013) also calls for integrating principles of environmental sustainability into country policies and programmes and reversing environmental losses. Whether the world continues to sustain itself, depends largely on properly managing its natural resources. In the same line, Post-Rio to Post–2015 (UNEP, 2012) also asserts that the full and proper integration of the development agenda and the environment agenda is essentially sustainable development. Hence, as foreseen by the Brundtland report over 25 years ago, many of our problems are common: no party can solve them in isolation from the others. Therefore, common action is needed (UN Department of Economic and Social Affairs, 2012) to bring sustainable development. Moreover, the protection of the environment and social and economic development are fundamental to sustainable development. 4.2 Established Norms of International Environmental Law and
Sustainable Development Law Norms are general legal principles that are widely accepted by civilized nations. The leading established norms of International Environmental Law (IEL) as enumerated in Stockholm Declaration (1972), the World Charter for Nature (1982), Rio Declaration on Environment and Development (1992), Johannesburg Declaration on Sustainable Development (2002) and reaffirmed in Rio+20 (2012) are summarized as: 1. States have, in accordance with Charter of the UN and the principles of International Law, the sovereign right to exploit their own resources pursuant to their own environmental policies, and the responsibility to ensure that activities within their jurisdiction or control do not cause damage to the environment of other States or areas beyond the limits of national jurisdiction. 2. The duty of a State to notify and consult with other State in case there is possibility to damage the environment of other State by its activities. 3. States are expected to monitor and assess specific environmental conditions. 4. All citizens have a right to a decent and healthful environment. 5. The polluter pays and precautionary principles. 6. Environmental impact assessment. 7. To invite the input of NGOs. 8. Principle of sustainable development. 9. Inter-generational equity. 10. The common heritage of mankind. 11. Common but different responsibility. Sustainable Development Law (SDL), in the international context, broadly refers to ‘a corpus of international principles and treaties, which address the areas of intersection between international economic law, international environmental law and international social law, aiming towards development that can last (Segger and Khalfan, 2004). The notion of integration or interrelationship is the crux of SDL and in the words of McGoldrick (1996), it makes the boundaries between environmental law, human rights law and economic law increasingly redundant. The development of the principles of SDL run parallel to the several global policy making processes associated with sustainable development, beginning with the Stockholm Declaration (1972) and still an organic law. Rio Declaration (1992) and Agenda 21 considered as the ‘blueprint of action

National Seminar on Management of Natural Resources for Sustainable Development: Challenges and Opportunities
156
for sustainable development’ placed a priority on ‘development of international law on sustainable development, giving special attention to the delicate balance between environmental and developmental concerns. Post-Rio, the 1995 Report of the Expert Group Meeting on Identification of Principles of International Law for Sustainable Development (ILSD) (prepared by the Division for Sustainable Development for the Commission on Sustainable Development) came out with 19 principles and concepts of ILSD divided into 5 groups: principles of interrelationship and integration; principles and concepts relating to environment and development; principles and concepts of international cooperation; principles of participation, decision-making and transparency; and principles and concepts of dispute avoidance and resolution procedures, monitoring and compliance. An important contribution to this crystallization process of emerging SDL, the Delhi Declaration of 2002 recognized seven key principles of the ILSD (which were subsequently reaffirmed and recognized at the 2002 World Summit on SD), which includes: • Duty of States to ensure sustainable use of natural resources; • Equity and the eradication of poverty; • Precautionary approach to human health, natural resources and ecosystem; • Public participation and access to information and justice; • Good governance; • Principle of common, but differentiated obligations; and • Integration and interrelationship, in particular in relation to human rights and social, economic and environmental objectives. With regard to the legal validity of the above principles of international law, several are not yet recognized as binding rules of customary international law. Many academics notably Goepel (2010), and Segger (2004) have viewed that SDL can be best seen as an emerging area of IEL or international law in its own right as well as a type of norm, which facilitates and requires a balance and reconciliation between conflicting legal norms relating to environmental protection, social justice and economic growth. Johannesburg Declaration (2002) also reiterated these interdependent and mutually reinforcing pillars of sustainable development—economic development, social development and environmental protection—a collective responsibility to advance and strengthen at the local, national, regional and global levels. The review of the Rio Principles shows that many of the principles have been transformed into further international laws or national instruments, but have not necessarily filtered down into meaningful action in practice.
4.3 Environmental Impact Assessment (EIA) EIA is an effort to anticipate measure and weigh the socio-economic and bio-physical changes that may result from a proposed project. It assists decision-makers in considering the proposed project’s environmental costs and benefits. Where the benefits sufficiently exceed the costs, the project can be viewed as environmentally justified, otherwise not. It is widely accepted norm of international environmental law. Typically, such an assessment balances economic benefits with environmental costs. 4.4 Environmental Jurisprudence vis-à-vis Sustainable Development in India India also accepted most of the international norms on International Environmental Law as mandated by Constitution of India.

Development and Environment: North-East India Chapter
157
The Indian Constitution is amongst the few in the world that contains specific provisions on environmental protection. The judicial interpretation has strengthened the Constitutional mandate. Notable amongst the fundamental norms recognized by the courts as summed up by Divan and Rosencrany (2001) are: 1. Every person enjoys the right to a wholesome environment, which is a facet of the right to life guaranteed under Article 21 of the Constitution. 2. Enforcement agencies are under an obligation to strictly enforce environmental laws. 3. Government agencies may not plead non-availability of funds, inadequacy of staff or other insufficiencies to justify the non-performance of their obligations under environmental laws. 4. The ‘polluter pays’ principle which is a part of the basic environmental law of the land requires that a polluter bear the remedial or clean up costs as well as the amounts payable to compensate the victims of pollution. 5. The ‘precautionary principle’ requires government authorities to anticipate, prevent and attack the causes of environmental pollution. This principle also imposes the onus of proof on the developer, or industrialist, to show that his or her action is environmentally benign. 6. Government developmental agencies charged with decision-making ought to give due regard to ecological factors including, (a) the environmental policy of the Central and State government; (b) the sustainable development and utilization of natural resources; and (c) the obligation of the present generation to preserve natural resources and pass on to future generations as environment as intact as the one we inherited from the previous generation. 7. Stringent action ought to be taken against contumacious defaulters and persons who carry on industrial or development activity for profit, without regard to environmental laws. 8. The power conferred under an environmental statute may be exercised only to advance environmental protection and not for a purpose that would defeat the object of the law. 9. The State is the trustee of all natural resources which are by nature meant for public use and enjoyment. The public at large is the beneficiary of the sea-shore, running waters, air, forests and ecologically fragile lands. The National Environmental Policy (2006) articulates the spirit of ‘sustainable development’; it states that only such development is sustainable, which respects ecological constraints and the imperatives of social justice. Sustainable development concerns in the sense of enhancement of human wellbeing, broadly conceived, are a recurring theme in India’s development philosophy (TERI, 2011). In the discourse of development and environment in India, we cannot skip the two well-known judgments of the Supreme Court. The one was Narmada case (2000), wherein the majority judgment held that EIA Notification is ‘clearly prospective’, and is not applicable to the clearance of 1987 as in the present case and accordingly held: ‘There are different facets of environment and if in respect of a few of them adequate data was not available it does not mean that the decision taken to grant environmental clearance is vitiated. The clearance required further studies to be undertaken and we are satisfied that this has been and is being done …. Care for environment is an on-going process and the system in place would ensure that ameliorative steps are taken to counter the adverse effects, if any, on the environment with the construction of the dam.”

National Seminar on Management of Natural Resources for Sustainable Development: Challenges and Opportunities
158
The majority, therefore, directed that the construction of the dam would continue and allowed raising the height above 90 metres subject to certain conditions. Leelakrishnan (2005) has viewed that it seems that the majority gave less importance to the problems of submersion when it probed how the project could strike a balance between developmental needs and environmental values. They bestowed full faith in the anticipated rehabilitation and found that the project had in-built safeguards and it satisfied the goal of sustainable development. The dissenting judge had a different view on the issue of environmental assessment. Even in 1987, it was found necessary by the Government of India to rigorously assess the environmental impact of river valley projects. The notes prepared by the ministries indicated that requisite data for EIA were not available when the clearance was given, and that what had been done was not adequate, and several matters were still at preliminary stages. The judge noted that the order of environmental clearance had sought certain details from project authorities in respect of several matters such as rehabilitation, catchment area treatment, compensatory afforestation, command area development, and survey on flora and fauna. The judge gave a powerful dissenting observation and the present author also respectfully concurs with the observation: The adverse impact on the environment can have disastrous consequences for this generation and generations to come … This Court cannot place its seal of approval on so vast an undertaking as the Project without first ensuring that those best fitted to do so have had the opportunity of gathering all necessary data on the environmental clearance to the Project can be given, and, if it can, what environmental safeguard measures have to be adopted, and their cost. The other was the majority judgment of Justices S. Ravindra Babu and G.P. Mathu (2:1) in Tehri case (1992) while arguing for striking a balance between ecology and development said that ‘right to development’ was an integral part of human rights. Since the construction of a dam or a mega project was an attempt to achieve the goal of wholesome development, such works could be treated as integral components of development, they said. In short, the majority judgment endorsed what had been held in Narmada case that the questions as to whether to have an infrastructural project or not, the type of project to be undertaken and how it is to be executed are part of the policy-making process and the courts are ill-equipped to adjudicate on them. But the courts have the duty to see to it that in the undertaking of such a decision, no law is violated and people’s fundamental rights as guaranteed under the Constitution are not violated, the judgment noted. More interestingly, many important and far-reaching consequential aspect of environment has been highlighted by Justice D.M. Dharmadhikari in his dissenting judgment. He pointed out that according to the ‘precautionary principle’, the government cannot be allowed to claim scientific uncertainty of 3-D Non-Linear Analysis to avoid taking effective measures to prevent environmental degradation. He further noted that “….…when natural resources are exploited in a big way for big projects by the State………..social conflicts arise as a natural adverse consequence ……when such social conflicts arise between the poor and more needy on one side and the rich or affluent or less needy on the other, prior attention has to be paid to the former group which is financially and politically weak.” He also added that in order to avoid mistakes in the resettlement and rehabilitation of people ousted by similar projects in past, the construction of the Tehri dam should not be allowed to proceed and leave the ousters high and dry. Man living in the hills and valleys is dependent for survival, on natural resources. To remove him and rehabilitate him in the plains is taking a fish from the river and putting it into an artificial reservoir, or an aquarium, where it might survive but can never be happy. (SC, 2004, p. 897).

Development and Environment: North-East India Chapter
159
Thus, Supreme Court clears the Tehri dam project by a split verdict but environmental consideration is sidelined and belittled and dissenting judgment was sounder concerning many aspect of sustainable development as a whole. 4.5 Environment versus Development and Environment and
Development in North-East India (NE) The problem of environment in undertaking development projects is also true for the NE region which comprises of the eight Himalayan provinces which includes Assam, Arunachal Pradesh, Nagaland, Manipur, Meghalaya, Mizoram, Sikkim and Tripura and perhaps more vulnerable in the field of environmental governance is concerned. NE is known for its biological and cultural diversity and the unique Bramaputra and Barak river systems. The region is rich in biodiversity and is home to important populations of wild species, such as the rhino, elephant, tiger, wild water buffalo, pigmy hog, brow-antlered deer, and the Gangetic river dolphin. Three out of 34 global biodiversity hotspots cover parts of India: Himalaya, Indo-Burma, and Western Ghats, and Sri Lanka. Two out of these three, Himalaya and Indo-Burma, cover extensive portions of the NE (Singh et al, 2009). In just 8% of the country’s geographical area, the region also houses 21% of the important bird areas identified as per international criteria by the Bombay Natural History Society and Birdlife International. The region is home to a rich diversity of indigenous people [over 220 classified as tribes, ethnic or backward classes (OHCHR, 2013)], with a substantial portion of the population dependent on natural resource-based livelihoods. This diversity of communities comes with unique socio-cultural, agro-ecological, and landholding systems (such as different forms of community control over forests in various parts of the region). Over the last decades, these communities asserted their identities as ‘indigenous people’. The NE has been identified as India’s ‘future powerhouse’ by Central Electricity Authority (2001) and at least 168 large hydroelectric projects with a total installation capacity of 63,328 MW are proposed for the region. Arunachal Pradesh and Sikkim are at the forefront in the initiative to sign multiple memoranda of understanding/ agreement with power developers. Vagholikar (2011) mentioned that till October 2010, the Government of Arunachal Pradesh had allotted 132 projects to companies in the private and public sectors for a total installed capacity of 40,140.5 MW. The government and the proponents of large dams in the region paint a win–win picture in this global biodiversity hotspots, ecologically and geologically fragile, seismically active and culturally sensitive, inhabited by indigenous peoples region: the biggest ‘development’ intervention —exploiting the country’s largest perennial water system to produce plentiful power for the nation; economic benefits for northeastern state governments through export of power to other parts of the country, and comparatively little direct displacement of local communities as compared to elsewhere in the country. Some selected case study of development projects in the region which threatens environment and international concerns in the touchstone of global norm of IEL and SDL are discussed below: 4.6 Tipaimukh Dam in Manipur Tipaimukh Dam is a proposed embankment dam on the river Barak in Manipur. The purpose of the dam is flood control and hydroelectric power generation. The project has led to controversy between India and Bangladesh over water rights as well as controversy with Manipuri people to be relocated by the reservoir (Globalvoice, 2013). The dam will be 390 metre long and 162.8 metre high, across the Barak River. The dam's crest elevation will be at an altitude of about 180 metre above mean sea level with a maximum reservoir level of 178 metre. The dam was originally designed to contain flood waters in the lower Barak valley but hydropower generation was later incorporated into the project with an installation capacity of 1500 MW (Wikipedia, 2013).

National Seminar on Management of Natural Resources for Sustainable Development: Challenges and Opportunities
160
Bangladeshi experts have said that the massive dam will disrupt the seasonal rhythm of the river and have an adverse effect on downstream agriculture and fisheries (The Daily Star, 2009). The Tipaimukh area lies in an ecologically sensitive and topographically fragile region. It falls under one of the most seismically volatile regions on the planet. The Tipaimukh project has been accorded statutory clearances despite consistent stiff objections by the indigenous peoples in the States of Manipur, Assam and Mizoram. A large number of Zeliangrong and Hmar people will be displaced permanently, and the environmental destruction envisaged is of international concerns. 4.7 Loktak Lake and Loktak Multipurpose Project in Manipur Loktak Lake, the largest freshwater lake in NE India, also called the only Floating lake in the world due to the floating phumdis (heterogeneous mass of vegetation, soil, and organic matters at various stages of decomposition) on it, is located near Moirang in Manipur (Wikipedia, 2013). This ancient lake plays an important role in the economy of Manipur, a source of livelihood for the rural fishermen who live in the surrounding areas and on phumdis which includes 55 rural and urban hamlets around the lake havning a population of about 100,000 people. A rich biodiversity with habitat heterogeneity has been recorded during a scientific survey carried out between January 2000 and December 2002 in different habitat patches of the lake (Wikipedia, 2013). The lake’s rich biological diversity comprises of 233 species of aquatic macrophytes, 116 species of birds including 21 species of migratory waterfowl (most migrating from different parts of the northern hemisphere beyond the Himalayas), 425 species of animals (249 vertebrates and 176 invertebrates) including rare animals such as the Indian python, sambhar and barking deer. Keibul Lamjao National Park is the natural habitat of one of the most endangered deer, the Brow-antlered deer which was once thought to be extinct, which was declared a national park only to preserve and conserve this species of Eld’s Deer. The Loktak Multipurpose Project provides hydropower, irrigation and water supply benefits but has attracted adverse criticism for the drastic alteration caused by the project to the hydrological regime of the Loktak Lake and associated wetlands. The Loktak Hydropower Project on the Imphal River, with the Loktak Lake forming the head waters to provide regulated storage for power generation, was built in 1983 as a multipurpose project with power generation of 105 MW for power supply to north-eastern States of India except Sikkim and lift irrigation to an area of 23,000 ha (57,000 acres) in the Manipur valley. The downstream Loktak Power Project in cascade to utilize the regulated releases from the upper project for further power generation of 90 MW is proposed to be taken up for joint implementation by NHPC and the Government of Manipur (Wikipedia, 2013). The Loktak Lake and its precincts have faced serious problems due to loss of vegetal cover in the catchment area. The degradation of the catchment area has occurred. Deforestation and shifting cultivation in the catchment areas have accelerated the process of soil erosion resulting in the lake’s shrinkage due to siltation. The annual silt flow into the lake is estimated to be 336,325 tons. The construction of Ithai barrage and maintaining constant water level at full reservoir level (FRL) has led to: (a) changes in hydrological regime thereby affecting ecological processes and functions of the wetland, (b) inundation of agricultural lands and displacement of people from flooded lands, and (c) loss of fish population and diversity. The thickness of phumdis and the major food plants has decreased in the Keibul Lamjao National Park thereby threatening the survival of Sangai deer and interference in the migration of
Development and Environment: North-East India Chapter
161
fishes from Chindwin–Irrawady River system of Myanmar resulting in changes in the species composition. Phumdis becoming thinner, the hoofs of the limbs of Sangai get stuck in the marsh and results in their drowning. Gajananda and Sundari (2008) have a view that human activity has led to severe pressure on the lake ecosystem. The avifauna recorded in different habitats of the lake is reported to be drastically declining (Wikipedia, 2013). Livelihood of people dependent on the sale of edible fruit and rhizome of lotus plant products and Euryale ferox (thanging) has suffered due to steep decline in the growth of these plant species. Today, Loktak Lake is at the highest level of eutrophication and the only brow-antlered deer is at the verge of extinction (Gajananda, 2008). The commission of the project has also led to submergence of an estimated 83,450 hectares of agricultural land and at least 30,000 indigenous persons were affected without proper resettlement and rehabilitation (OHCHR, 20011). Considering the ecological status and its biodiversity values, the lake was initially designated as a wetland of international importance under the Ramsar Convention on March 23, 1990. But the lake was designated by the Ramsar Convention under the Montreux Record on June 16, 1993 for the reason that: ‘A record of Ramsar sites where changes in ecological character have occurred, are occurring or are likely to occur.’ (Ramsar, 2011). 4.8 Tista River, Rangit Dam and Other Proposed Projects in Sikkim The Teesta River or Tista which originates from Tsolamu Lake in North Sikkim is said to be the lifeline of Sikkim, flowing for almost the entire length of the state and carving out verdant Himalayan temperate and tropical river valleys. The river then forms the border between Sikkim and West Bengal before joining the Brahmaputra as a tributary in Bangladesh. The total length of the river is 309 km (192 mi), (Bisht and Chandra, 2010, p. 19) draining an area of 12,540 km², before a large part of this was situated in Nepal. But after the Sugauli Treaty it was acceded to British India. Teesta River flowing across the length of Sikkim is fed by melting mountain snow and rain and meets Rangeet River at the border between Sikkim and West Bengal. Through its course, the Teesta River has carved out ravines and gorges in Sikkim meandering through the hills with the hill station of Kalimpong lying just off the river. Variegated vegetation can be seen along this route. At lower elevations, tropical deciduous trees and shrubs cover the surrounding hills; alpine vegetation is seen at the upper altitudes. The river is flanked by white sand which is used by the construction industry in the region. Large boulders in and around the waters make it ideal for rafting enthusiasts. Rangit Dam, (45 m/ 148 ft high concrete gravity structure of 100 m/ 33ft length) which forms the headwork of the Rangit Hydroelectric Power Project Stage III, is a run-of-the-river power project on the Ranjit River, a major tributary of the Tista River in the South Sikkim district of Sikkim. The project's construction was completed in 1999 and it became fully functional since 2000. The project was built at a cost of Rs 4922.6 million (Rs 492.26 crores). (en.wikipedia.org, 2013) The average annual power generation from the project is 340 GWh with firm power of 29 MW (Kaushish and Naidu, 2002). The dam is located at a distance of 130 kms (81 mi) from Siliguri and 70 kms (43 mi) from Gangtok. The dam is located downstream of the confluence of Rathong Chu and Rangit rivers near the legship town and the powerhouse of the project is located near Sagbari village. This power project was the third stage of the five-stage cascade development conceived on the main stem of the Rangit River, and was the first to be built in the series of Rangit Stage I to IV initially conceived by the Central Water Commission. Three other projects on the Rangit River planned and under development are the Rangit Stage II (60 MW capacity), Rangit Stage IV (120 MW capacity) and Jorethong HEP (96 MW); the last two projects are now under construction (Wikipedia, 2013).

National Seminar on Management of Natural Resources for Sustainable Development: Challenges and Opportunities
162
In river valley reservoir projects, the gravity of the siltation problem induced due to catchment degradation is serious and needs to be suitably addressed. 4.8.1. Proposed Dams India has proposed a series of dams within the Teesta river system that should produce some 50,000 MW of electricity within the next 10 years. With some of the largest sediment loads, the creation of a reservoir will lead to an increased pressure on an active fault area. There are concerns that the building of these dams may lead to river-induced seismicity. Despite such worries, the construction of the dams had started. Links are suspected between the dam construction and the deadly 2011 earthquake in Sikkim (The Hindustan Times, 2010). Large scale sand and stone mining is posing great threat to Teesta. 4.8.2. Climate and Tectonics of Teesta River The Teesta River has preserved good imprints of climatic and tectonics along its valleys and catchments. Ingocha (2007) has suggested that climate change, particularly on a millennial to multi-millennial scale, during late-quaternary had a strong system-wide influence on sediment production, transport and deposition in the Teesta river system. Mukul (2000) and Mukul (2007) also proved that the southern part of the frontal wedge near the foothill zone is tectonically active along with the formation of NKT, SKT and MFT structures within the sub-Himalaya in the Teesta basin. The interrelationship between climate, erosion, deposition and tectonic activities is not properly understood to date. However, it appears as Ingocha (2007) suggested that major alluviation and incision events could be ascribed to the factors associated with climatic processes such as strengthening or weakening of monsoonal precipitation and related fluvial discharge. Tectonic activity affects sediment fluxes and is responsible for the insetting of younger terraces/ fanlobes into the older terraces/ fanlobes. During seismic events, landslide activity along the slopes of river valleys influences sediment delivery into the valleys, causing the effects of tectonics to be intricately coupled with that of climate. It has been observed by renowned river expert Rudra (HT, 2013) that ‘The whole concept is unrealistic. What’s more, once the 23 hydro-power projects start operating by 2013-end, the flow of water would further reduce during the daytime and affect irrigation downstream. Plus, the river biodiversity, water table and its ecological flow would go for a toss.’ Around 15 lakh people in Jalpaiguri live on the banks of the Teesta. Fall in the water table would affect the life of people, the ecology of the river and irrigation. ‘Plus, many fish will go extinct and birds will stop migrating. People will be displaced and agriculture will be destroyed.’ 4.9 Subansiri Lower Dam in Arunachal Pradesh The Subansiri Lower Dam, officially named Lower Subansiri Hydroelectric Power Project (LSHEP), is an under-construction gravity dam on the Subansiri River in north-eastern India. It is located 2.3 km (1.4 mi) upstream of Gerukamukh village in Lower Subansiri District on the border of Assam and Arunachal Pradesh states. Described as a run-of-the-river power station by NHPC Limited, the dam is expected to supply a 2,000 MW power station with water when completed (NHPC, 2011). The project has experienced several problems during construction, to include landslides, re-design and opposition. It is expected to get completed in 2014. It is notable that, if completed as planned, it will be the largest hydroelectric project in India (The Times of India, 2012). As of November 2011, the dam reached an elevation of 138 m (453 ft), just below the spillway elevation of 145 m (476 ft). It is estimated that concreting work to reach the final elevation of 210 m (690 ft) will be completed by February 2014 (Wikipedia, 2013).

Development and Environment: North-East India Chapter
163
Some environmental impacts unique to very large dams will result from completion of the Subansiri Project, both upstream and downstream of the dam site. Vinding (2004) has observed that these impacts will include ecosystem damage and loss of land. The reservoir of the Subansiri Project will submerge a 47 km length of the Subansiri River and destroy 37.5–40 square km (14.5–15 sq mi) which includes Himalayan sub-tropical pine forests, Himalayan sub-tropical broadleaf forests, part of the Tale Valley Wildlife Sanctuary, an elephant corridor and some subsistence agriculture fields. Thirty eight families will be displaced if the dam is completed, according to official data (NHPC, 2011). 4.10 Upper Siang Hydroelectric Project in Arunachal Pradesh The Upper Siang Hydroelectric Project consists of the construction of several hydroelectric power dams in the Upper Siang district of Arunachal Pradesh. Construction work on the project was commenced by the NHPC in April 2009 and various hydro dams will be constructed in phases over a span of 15–20 years (Wikipedia, 2013) The main dam is being constructed across river Siang, a tributary of river Brahmaputra and upon completion, the dam reservoir will hold 10 billion cubic metres of water. The hydropower project at Siang will alone generate between 10,000 to 12,000 MW, making it the largest hydroelectric dam in South Asia. The government of Arunachal Pradesh signed deals with various Indian power companies to develop hydro projects. A total of 42 schemes are planned to generate electricity in excess of 27,000 MW with the Upper Siang project being one of them (Wikipedia, 2013). Same environmental impacts and probable consequences of social and anthropological conflicts arise from this project as well. In 2010, a student body appealed to India’s Environment Ministry to scrap various hydroelectric projects (including Siang project) in Assam and Arunachal Pradesh due to potential adverse environmental impact. However, the Ministry remarked that though the projects will not be cancelled, necessary precautions will be undertaken to ensure minimal environmental impact. 5. Conclusion In India it is seemed that development is considered more important than environment and judicial interpretation are also non-uniform and confusing. The quantum of investment in the project is invariably considered as the basis on which EIA is made in India and there is no clear-cut standard of balance between development and environment in India. The correct balance between development and environmental is now one of the main challenges facing the international community in its development and environment discourse and it reflects the competing interest inherent in the matter. It also raises the issue as to how far one takes into account the legacy for future generations of activities conducted at the present time or currently planned. Coming to NE, unfortunately, most detailed downstream studies are only prescribed as post-clearance studies as was done in the environmental clearance granted to the 15,00 MW Tipaimukh Multipurpose project in October 2008 and in the 1,750 MW Demwe Lower project on the Rohit river in February 2010. This clearly indicates that the projects are being treated as a fait accompli and the clearance processes as a formality. Currently, environmental laws do not make it mandatory to have an advance cumulative impact assessment of projects in a river basin. One of the major arguments put forward to argue for large hydroelectric projects in the NE, is that there is relatively ‘small displacement’ by submergence as compared to that in other parts of the country and therefore, these projects are benign. But a careful perusal of the ground situation indicates that displacement, particularly of livelihoods and rights, is grossly underestimated. NE is home to small populations of culturally sensitive indigenous communities. Therefore, direct and

National Seminar on Management of Natural Resources for Sustainable Development: Challenges and Opportunities
164
indirect displacement is high if looked at in the perspective of the local population (as opposed to the population of the country). For example, the entire population of the Idu Mishmi tribe in Arunachal Pradesh is around 9500 and at least 17 large hydro projects have been planned in their home, the Dibang Valley and displacement may be same percent. Further, concerns being expressed in NE are not restricted to the issue of displacement. The over-900 days satyagraha in Sikkim by affected indigenous communities from 2007–2009 focussed on the impacts of hydro projects on Dzonzu, the holy land and reserve of the Lepcha tribe. The protest has also received the support of the Buddhist monk community in Sikkim, as a sacred landscape stands to be desecrated. Such protests are not merely on grounds of displacement but that the region’s cultural and ethnic traditions are rooted in the river Teesta and its environs. A major concern in the NE is the influx of large labour populations from outside the region in areas inhabited by vulnerable indigenous communities. For example, 17 large projects in the Dibang Valley in Arunachal Pradesh will bring in outside labour, upwards of 150,000 people, for long periods, as these have long gestation projects. We are concerned about the demographic changes and other socio-cultural impacts associated with this, as the Idu Mishmis are only 9500 in number. The development policies are in glaring contradiction to the constitutional and legal protection particularly rights of indigenous peoples. In case of Manipur, most of the development projects are destructive, unsustainable such as the construction of Loktak Multipurpose Hydroelectric Project, Mapithel Dam and Tipaimukh Dam and these were commissioned/ purposed without the free, prior and informed consent of the people of Manipur and proper EIA. The political economy of hydropower development in the region may not allow all the social and environmental issues of grave concerns to be fully addressed in the current environmental framework, hence relying on these ‘clearances’ as certificates of viability of these projects may pose serious risks to investments in the long term, as evident from major protests in the region against projects which have already got a green signal (for example, issue of Hydropower Sustainability Assessment Protocol). The UN Committee on Elimination of Racial Discrimination has also urged the government of India not to construct Tipaimukh Dam in its concluding observation of the seventieth session from February 19 to March 9, 207 and in its special communications made on August 15, 2008; March 13, 2009 and September 23, 2009. In the aftermath of Uttarakhand disaster, Das (2013), renowned environmental expert, rightly noted that ‘geologically and seismologically, the region is a time bomb of disaster. It’s continuously ticking. Through large-scale dam construction and developmental activities, we are only accelerating the bomb, pushing the region towards an Uttarakhand like disaster.’ We cannot lose the sight that poverty eradication, changing consumption and production patterns and protecting and managing the natural resources base for economic and social development in India, in general, and NE in particular, are overarching objectives and essential requirements for sustainable development in the region. Last but not the least, government of India should as a minimum recognition of distinct indigenous peoples in India, integrate the provisions of the UN Declaration on the Rights of Indigenous Peoples into state policy and legislation; ratify ILO Convention No. 169 concerning Indigenous and Tribal Peoples in Independent Countries, and Proper Appreciation of the Scheduled Tribes and Other Traditional Forest Dwellers (Recognition of Forests Rights) Act, 2006. Existing state practice must conform to internationally recognized norms particularly IEL in general and SDL in particular in the NE region for durable and long term perspective development agenda. Those proposed development projects, if it is proved that environmental cost is far exceeding the benefits, then such projects must be abandoned for better common future for present and future generations.

Development and Environment: North-East India Chapter
165
References Bisht and Chandra, R. (2001), International Encyclopedia of Himalayas, Vol. 5, Mittal. New Delhi. Daily Star (2009), Daily Star. Available at: http://www.thedailystar.net/magazine/2009/07/04/followup.htm. (Accessed 4 November 2013) Dans Groups ((2009), DANS Group. Available at: http://dansenergy.com/jorethang-contentpage,htm (Accessed 4 November 2013) Das, P.J. (2013), The North East is a Ticking Time Bomb of Disaster: Expert, the Sangai Express, 22 June, p. 5. Divan and Rosencranz (2009), Environmental Law and Policy in India, New Delhi: Oxford. Gajananda, Kh. and Sundari, Chanu Th. (2013), Fate of Loktak Lake, E-PAO Blog, 3 November 2013. Available at: http://www.e-pao.net/epSubPageExtracto.src=education.Scientific_Papers.fate_of _loktal_lake (Accessed 4 Nov. 2013) Gajendra, Kh. (2011), Dam or No Dam–Tipaimukh Dam, Word Press.com Blog, 14 February. Available at: http://polehim.wordpress.com/article/dam-or-no-dam-3ar81gewyc4cv-7/ (Accessed 4 November 2013) Gopel, M. (2010), “Formulating Future Just Policies: Applying the Delhi Sustainable Development Law Principles”, Sustainability, Vol. 2(6), pp. 1694–1718. Hindustan Times (2011), ‘Sikkim Quake may have been Induced by Dams Across Teesta’, Hindustan Times, 21 September. Available from http://www.hindustantimes.com/India-news/WestBengal/Sikkim-quake-may-have-been-induced-by-dams-acoss-Teesta/Article-748547.aspx [4 November 2013] Hindustan Times (2013), “Teesta Project is Unrealistic, River Experts Tell Mamata”, Hindustan Times, 19 February. Available from http://www.hindustantimes.com/india-news/westbengal/teesta-project-is-unrealistic-river-experts-tell-mamata/article-1013782.aspx [4November 2013] India, Central Electricity Authority (2001), Preliminary Ranking Study of Brahmaputra Basin., Central Electricity Authority, New Delhi. India. Ministry of Environment and Forestry (2011), Sustainable Development in India: Stocktaking in the run up to Rio+20, New Delhi: Energy and Resources Institute (TERI). Available at: http://www.uncsd2012.org/content/document/Sust_Dev_Stocktaking.pdf (Accessed 5 Nov. 2013) Ingocha, L.M. (2007), “Climatic Imprints in Quaternary Valley Fill Deposits of the Middle Teesta Valley, Sikkim Himalaya”, Quaternary International, Vol. 159, pp. 32–46. International Court of Justice (ICJ), Legality of the Threat or Use of Nuclear Weapons, Advisory Opinion, ICJ Reports 1996, p. 226. International Labour Organization (2013), ILO. Available at: http://www.ilo.org/images/empent/static/coop/pdf/Conv107.pdf (Accessed 4 November 2013) Jal Power Corporation Ltd. (2009), Jal Power Corporation Ltd. Available at: htpp://www.jpcl.co.in/project.htm (Accessed 4 November 2013). Kaushish, S.P. and Naidu, B.S.K. (2002), Silting Problems in Hydropower Plants, Taylor & Francis. pp. 9–19. Leelakrishnan, P. (2005), Environmental Law in India, LexisNexis. New Delhi. McGoldrick, D. (1996), “Sustainable Development and Human Rights: An Integrated Conception”, International and Comparative Law Quarterly, Vol. 45, pp. 796–818. Mukul, M. (2000), “The Geometry and Kinematics of the main Boundary Thrust and Related Neotectonics in the Darjeeling Himalayan Fold-and-thrust Belt, West Bengal”, Journal of Structural Geology, Vol. 22(9), pp. 1261–1283. Mukul, M., Jaiswal, M. and Singhvi, A.K. (2007), “Timing of Recent Out-of-sequence Active Deformation in the Frontal Himalayan Wedge: Insights from the Darjeeling Sub-Himalaya, India”, Journal of Structural Geology, Vol. 35(11), pp. 999–1002.
Narmada Bachao Andolan v. Union of India, AIR 2000 SC 3751. NHPC India (2009), NHPC. ‘Features NHPC’. Available at: http://www.nhpindia.com/Projects/English/Scripts/Project_Features_aspx?Vid=167 (Accessed 12 June 2013) NHPC India (2011), NHPC India. ‘Welcome to Subanisiri’. Available at: http://nhpcindia.com/Projects/english/Scripts/Prj-Introduction.aspx?Vid=23 (Accessed 4 November 2013) NHPC Ltd. (2012), NHPC Ltd. ‘Welcome to Ranjit Power Station’. Available at: http://www.nhpcindid.com/Projects/English/Scripts/Prj_Features.aspx?Vid=11 (Accessed 4 November 2013) Ramsar (2011), Ramsar. Available at: http://www.ramsar.org/cda/en/ramsar-documnets-montreux-record/main/ramsar/1-31-118^20972_4000_0_#remove (Accessed 4 November 2013) Rezwan (2009), Bangladesh, India: No to Tipaimukh Dam. Available at: http://globalvoicesonline.org/2009/05/27/Bangladesh-india-no-to-tipaimukh-dam/ (Accessed 4 November 2013) Segger, C.M.C. and Khalfan, A. (2004), Sustainable Development Law: Principles, Practices and Prospects, Oxford: Oxford University Press. Shaw, M.N. (1997), International Law. Cambridge: Cambridge University Press. Singh, E.J., Singh, N.K. Sh. and Singh, N.R. (2009), “Biodiversity Conservation and Natural Resources in North East India–with Special Reference to Manipur”, NeBIO, Vol. 1(1), pp. 42–47.
National Seminar on Management of Natural Resources for Sustainable Development: Challenges and Opportunities
166
South Asia Network on Dams, River and People (2004), ‘Lower Subansiri: NHPC had to Pay Rs 3 B for Forestland’, Dams, Rivers & People (SANDRP). Available from: http://sandrp.in/drp/oct_nov_deco4.pdf [4 November 2013] Stark, J.G. (1989), Introduction to International Law. Kent: Butterworth. Tehri Bandh Virodh Sangarsh Samiti v. State of Uttar Pradesh, (1992) 1 SCC 44 (Supp) Times of India (2012), ‘‘Construction of Subansiri Dam not to be Stopped”, Times of India, Guwahati, 16 February. Available from http://articles.timesofindia.indiatimes.com/2012-02-16/guwahati/31066360-1-Subansiri-dam-lower-subansiri-nhpc-officials [4 November 2013] United Nations (1973), Report of the United Nations Conference on the Human Environment, Stockholm. Switzerland: UN Publication. Available at: http://www.un-documents.net/aconf48–14r1.pdf (Accessed 4 Nov.2013) United Nations (1987), Report of the World Commission on Environment and Development: Our Common Future. New York: UN Publication. Available at: http://www.un-documents.net/our-common-future.pdf (Accessed 4 Nov. 2013). United Nations (1992), The Rio Declaration on Environment and Development. Available at: http://www.unesco.org/education/nfsunesco/pdf/RIO_E.PDF (Accessed 4 Nov.2013) United Nations (1992). ‘UN Sustainable Development: United Nations Conference on Environment and Development-
AGENDA 21’. New York: Division for Sustainable Development. Available at: http://sustainabledevelopment.un.org/content/documents/Agenda21.pdf (Accessed 4 Nov. 2013) United Nations (2002), Report of the World Summit on Sustainable Development, Johannesburg. New York: UN Publication. Available at: http://www.un.org/jsummit/html/documents/summit_docs/131302_wssd_report_reissued.pdf (Accessed 5 Nov.2013) United Nations (2012), RIO + 20: The Future we want-United Nations Conference on Sustainable Development, Rio de Janeiro New York: UN Publication. Available at: http://www.uncsd2012.org/content/documents/774futurewewant_english.pdf (Accessed 5 Nov.2013) United Nations (2013), The Millennium Development Goals Report, New York: UN Publication. Available at: http://www.un.org/millenniumgoals/pdf/report-2013/mdg-report-2013-english.pdf (Accessed 5 Nov.2013) United Nations. Department of Economic and Social Affairs (2012), Back to Our Common Future: Sustainable Development in the 21st century (SD21) Project–Summary for Policymakers. New York: Division for Sustainable Development. Available at: http://sustainabledevelopment.un.org/content/documents/UN-DESA_Back_Common_Future_En.pdf (Accessed 5 Nov. 2013) United Nations. Department of Economic and Social Affairs (2013), Global Sustainable Development Report–Executive Summary: Building the Common Future We Want. New York: Division for Sustainable Development. Available at: http://sustainabledevelopment.un.org/content/documents/975GSDR Executive Summary.pdf (Accessed 4 November 2013). United Nations. General Assembly (1970) Resolution 2626 (XXV): International Development Strategy for the Second UN Development Decade (A/8124 and Add.1). New York: UN Publication. Available at: http://daccess-adds-ny-un.org/doc/RESOLUTION/GEN/NRO/348/IMG/NR034891.pdf?Ope (Accessed 5 November 2013). United Nations. General Assembly (2012), Resolution 66/288: The Future, We Want. New York: UN Publication. Available at http://www.un.org/ga/search/view_doc.asp?symbol=A/RES/66/288 & Lang=E (Accessed 5 Nov. 2013). United Nations. OHCHR (2011), India: Status of Human Rights in Manipur NE Region: Submitted by CSCHR in Manipur and UN’. Available at http://lib.ohchr.org/HRBodies/UPR/Documents/Session13/IN/JS13_UPR_IND_S13_2012_JointSubmission13_.pdf (Accessed 30 June 2013) United Nations. UN Development Programme (2013), Summary Human Development Report 2013-the Rise of the South: Human Progress in a Diverse World’. New York: UN Publication. Available at: http://www.un.org/en/media/HDR2013_EN_Summary.pdf (Accessed 5 Nov. 2013) United Nations. United Nations Environment Programme (2012), ‘Post–Rio to Post–2015 Background Paper: the post-2015 development agenda and the Sustainable Development Goals (SDGs)’. New York: UNEP. Available at: http://unep.org/civil-society/Portals/24105/documents/NYconsultation/SDGs.pdf (Accessed 5 Nov. 2013) Vagholikar, N. (2011), Dams and Environmental Governance in North-east India. In: IDFC. India Infrastructure Report 2011-Water: Policy and Performance for Sustainable Development. New Delhi: Oxford. Available from www.idfc.com/pdf/report/IIR-2011.pdf [Accessed 30 June 2013) Wikipedia (2013), Loktak Lake. Wikipedia. Available at: http://en.wikipedia.org/wiki/Loktak_Lake. (Accessed 30 June 2013) Wikipedia (2013), Wikipedia. Available at http://en.wikipedia.org/wiki/Tipaimukh_Dam (Accessed 8 Nov. 2013) Wikipedia (2013), Wikipedia. Available at:http://en.wikipedia.org/wiki/Upper-Siang-Hydroelectric-Project (Accessed 4 November 2013) World Bank (2011), World Development Reports 2012. Washington DC: World Bank/IBRD. Available at http://sitesources.worldbank.org/INTWD2012/Resources/7778105-1299699968583/778621-1315936222006/Complete-Report.pdf (Accessed 5 Nov. 2013) World Bank (2013) ‘World Development Indicators 2013’. Washington DC: World Bank/IBRD. Available at http://databank.worldbank.org/data/download/WDI-2013-EBOOK.pdf (Accessed 5 Nov. 2013) WWF India (2013), WWF India. Available at: http://www.wwfindia.org/about_wwf/what_we_do/freshwater_wetlands/our/ramsar_sites/loktak_lake_cfm (Accessed 30 June 2013)

167
23 Betel Vine (Piper betel L.): The Neglected Green Gold Claims Livelihood and Health Security in Rural India
Ranjan Kumar Kar1, Poly Saha2, Kalidas Upadhyaya3 and Sanjay Kumar Mohanty4
1Krishi Vigyan Kendra (OUAT, Bhubaneswar), Odisha 2Technology Transfer Station, OUAT, Bhubaneswar, Odisha
3Department of Forestry, School of Earth Sciences and NRM, Mizoram University, Aizawl, Mizoram E-mail: [email protected]
1. Introduction Indian agriculture has marched a long way of 10,000 years and achieved a spectacular position within a couple of years. i.e., green revolution and food security, livelihood of two-third of the population, employing highest workforce, sharing 21% of GDP, feeding largest number of industries and ranked to be second foodgrain producer of the world. Nonetheless, to maintain its pace, sustainable agriculture protecting food security, rural employment and environmental sustainability using the tools of resources’ conservation and biodiversity protection seems to be highly pertinent during the present changing context. The vast arable land (1,269,219 km2, i.e., 56.78% of its geographical area) coupled with rich diversities of natural resources of this nation are subjected to threat of inhabitation, urbanization and vagaries of nature. Ironically, it seems imperative to manage these bountiful resources using its huge manpower which it has been endowed with. ‘Livelihood’ of a family or a society consists of its strength or vulnerability to survive through the assets it possesses and the activities members are engaged with to meet a good standard of living mitigating prevailing risks (Swift, 1989). Betelvine. since time immemorial, intruded into Indian tradition, mastication, therapeutics, trade, land use system and employment and income of sizeable population. Betelvine (Piper betle L) leaf called ‘pan’ (derived of the Sanskrit word ‘pan’ meaning leaf) in Hindi and Bengali, ‘Tambula’ in Sanskrit, ‘Villayadela’ in Kannada, ‘Vettilakkoti’ in Malyalam, ‘Vettilai’ in Tamil, ‘Tamalapaku’ in Telugu, ‘Videch-pan’ in Marathi, ‘Nagarbel’ in Gujarati, ‘Pana’ in Odia, ‘Kuhva’ in Mizo and ‘Kwai’ in Khasi. In foreign languages, it is known as ‘Tanbol’ in Arabic and ‘Burg-e-Tanbol’ in Persian. It is a shed loving, dioecious, perennial, evergreen vine of Malaysian origin (as per De Cando) climbing on trees or other support materials through its adventitious roots (Saha and Azam, 2004; Nath et al. 2003; Guha and Jain, 1997). It is a popular mastication usually chewed with sliced betelnut and lime and popular in India, Pakisthan, Bangladesh, Nepal, Myanmar, Sri Lanka, Malayasia and Indonesia (Samanta, 1994 and Jana, 1996; Sharma, et al., 1996). Pan has been mentioned in Vedas, Ramayana, Mahabharata, Mahavansha, etc. (about 3000 BC) and noted by Marcopolo (1295 AD) about its chewing by people in south India. Serving and chewing of pan were considered as fine art during Akbar’s regime. Offering the ‘bida’ of betel vine signifies mutual love and friendship. It is integral part of any Hindu religious ceremony, marriage and is offered after meal during any Indian social get-together. Betelvine is a very important cash crop chiefly cultivated in India followed by Bangladesh, Sri Lanka, Burma, China, East Indies, Vietnam
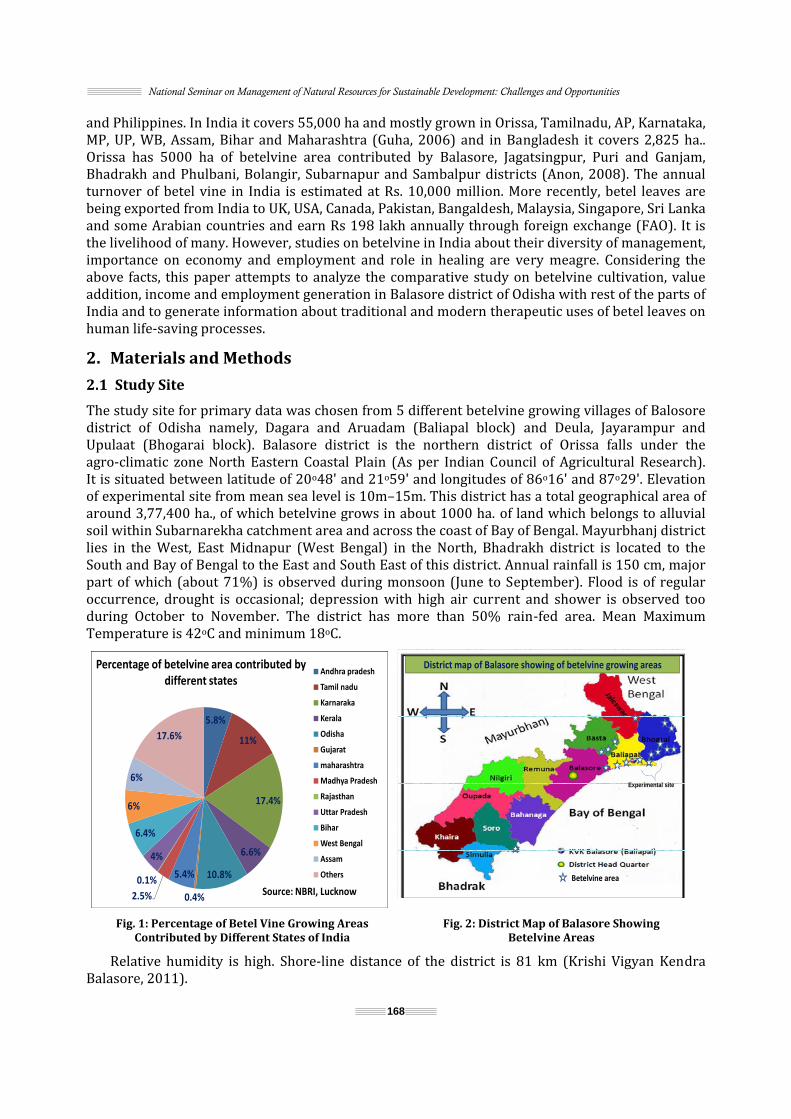
National Seminar on Management of Natural Resources for Sustainable Development: Challenges and Opportunities
168
and Philippines. In India it covers 55,000 ha and mostly grown in Orissa, Tamilnadu, AP, Karnataka, MP, UP, WB, Assam, Bihar and Maharashtra (Guha, 2006) and in Bangladesh it covers 2,825 ha.. Orissa has 5000 ha of betelvine area contributed by Balasore, Jagatsingpur, Puri and Ganjam, Bhadrakh and Phulbani, Bolangir, Subarnapur and Sambalpur districts (Anon, 2008). The annual turnover of betel vine in India is estimated at Rs. 10,000 million. More recently, betel leaves are being exported from India to UK, USA, Canada, Pakistan, Bangaldesh, Malaysia, Singapore, Sri Lanka and some Arabian countries and earn Rs 198 lakh annually through foreign exchange (FAO). It is the livelihood of many. However, studies on betelvine in India about their diversity of management, importance on economy and employment and role in healing are very meagre. Considering the above facts, this paper attempts to analyze the comparative study on betelvine cultivation, value addition, income and employment generation in Balasore district of Odisha with rest of the parts of India and to generate information about traditional and modern therapeutic uses of betel leaves on human life-saving processes. 2. Materials and Methods
2.1 Study Site The study site for primary data was chosen from 5 different betelvine growing villages of Balosore district of Odisha namely, Dagara and Aruadam (Baliapal block) and Deula, Jayarampur and Upulaat (Bhogarai block). Balasore district is the northern district of Orissa falls under the agro-climatic zone North Eastern Coastal Plain (As per Indian Council of Agricultural Research). It is situated between latitude of 20o48' and 21o59' and longitudes of 86o16' and 87o29'. Elevation of experimental site from mean sea level is 10m–15m. This district has a total geographical area of around 3,77,400 ha., of which betelvine grows in about 1000 ha. of land which belongs to alluvial soil within Subarnarekha catchment area and across the coast of Bay of Bengal. Mayurbhanj district lies in the West, East Midnapur (West Bengal) in the North, Bhadrakh district is located to the South and Bay of Bengal to the East and South East of this district. Annual rainfall is 150 cm, major part of which (about 71%) is observed during monsoon (June to September). Flood is of regular occurrence, drought is occasional; depression with high air current and shower is observed too during October to November. The district has more than 50% rain-fed area. Mean Maximum Temperature is 42oC and minimum 18oC. 5.8%
11%
17.4%
6.6%
10.8%
0.4%
5.4%
2.5%0.1%
4%
6.4%
6%
6%
17.6%
Percentage of betelvine area contributed by different states
Andhra pradesh
Tamil nadu
Karnaraka
Kerala
Odisha
Gujarat
maharashtra
Madhya Pradesh
Rajasthan
Uttar Pradesh
Bihar
West Bengal
Assam
Others
Source: NBRI, LucknowBetelvine area
v
Experimental site
District map of Balasore showing of betelvine growing areas
Fig. 1: Percentage of Betel Vine Growing Areas
Contributed by Different States of India Fig. 2: District Map of Balasore Showing
Betelvine Areas Relative humidity is high. Shore-line distance of the district is 81 km (Krishi Vigyan Kendra Balasore, 2011).

Betel Vine (Piper betel L.) the Neglected Green Gold Claims livelihood and Health Security in Rural India
169
The district has 6 agro-ecological zones of which study area belongs to irrigated alluvial zone. Soil of the study sites has uniform pH of 6.5 to 7.5. Sex ratio of district is 953 female per 1000 male, as per land holdings marginal farmers 56.6%, medium farmers 34.8% and large farmers 8.6%; they cultivate 2,50,000 ha. of area (66% of geographical area), cropping intensity is 154% with major irrigation source, ground-water, which is available at 6 m to 10 m depth in the study site, unlike western hillock (Nilagiri sanctuary area) of the district where ground-water is rarely accessible. Major crop is rice followed by ground nut, betelvine plays important part of their livelihood. Betelvine cultivation throughout the district is managed through baraj (betelvine shed) made.
Fig. 3:Removing Old Leaves from Khadi Plantation
Fig. 4: Khadi Sticks Processed and Ready for Dispopal Upon main scaffolding by bamboo, vines grown through trailing on dead stem of Ikada locally called khadi which a typical grass of height 1.5 m–2 m and sometimes beyond, favours to grow mostly low-lying areas with clay soil and possesses drought-bearing tendency too. Juna grass, another cultivated grass is used to tie the vines with khadi stakes. Each baraj of size 10 to 20 cents (each cent is 40 m x 40m i.e., 1/100th part of an acre). Almost every household of the study area was having 2-3 baraj. The study was conducted through regular observation during the year 2010 to 2013.
2.2 Methods The primary source of information was recorded from the study sites through experimentation, field visits, interviews with farming communities, continuous monitoring and focus group discussion. On the other hand, the secondary sources of information which have been collected from government surveys, reports, scribes, research papers, and books relevant to the topic and compiled together for presentation. 3. Results and Discussion
3.1 Varieties There is diversity of varieties of betelvines in Odisha, the usual one is ‘Bangla’ which is areawise popularized as 'Godi Bangla'. 'Naua Bangla', 'Bhainchigodi'. 'Jagannati', ‘Balipan’, ‘Chandrakana’, 'Birikoli', etc. Some other varieties namely, ‘Kapoori’, ‘Meetha’, 'Sanchi', and 'Alupatria' are grown as local, 'Kala Mahata' and 'Dhoba Mahata', choosing inland areas of state, 'Bilhari' a scented variety, ‘Gundi’, ‘Rasi’ and ‘Bada’ are popular in Hijilicut. However, popular variety(ies) of Bihar is ‘Magahi’ (compared to ‘Deshi’, ‘Calcuttia,’ ‘Kapoori’ and ‘Semehi.’), Andhra Pradesh ‘Tellaku’ and ‘Karapaku’ (Bangla’s synonym), Kerala is 'Venmony Vettila', Sri Lanka is ‘Kalu Bulath’ (a large leaved one) and Malaysia are ‘Sirih India’, ‘Sirih Melayu’, ‘Sirih Cina’ and ‘Sirih Udang’. Two
National Seminar on Management of Natural Resources for Sustainable Development: Challenges and Opportunities
170
promising varieties developed by scientists are ‘Utkala Sudama’ (OUAT scientists) and ‘SGM.BV.2’ (TNAU scientists) (The Hindu, Nov. 04, 2004). Within the study site, farmers were marked to grow ‘Bangla’ which is called in Bhograi block as ‘Birkuli’ and in Baliapal block as ‘Balipan’. Some introduction has been made by way of ‘Utkala Sudama’ which enabled better disease resistance and leaf size. 3.2 Habitat Betelvine grows better in moist, tropical forest conditions with shade, high humidity and soil moisture rich and well-drained (Arora and Kumar, 1980). Warm and humid regions in the tropics and most of the major growing areas adopt the baraj system (closed type of cultivation). Some areas including Andhra Pradesh, Tamil Nadu, Mizoram Meghalaya, Ganjam (Odisha), and part of Assam and Tripura and part of Bangladesh (Haider, et al., 2013) adopt open system where betelvine grows on the host trees Sesbania grandiflora, Leucocephala glauca or Areca catechu. Rest of the betelvine areas in India follow baraj system. Within Balasore district (study area) and East and West Midnapur districts (West Bengal) all the baraj are made of bamboo, Ikada/ khadi (Andropogon muricatus) stem (for trailer) and leaves (for thatching), juna grass (Koeleria macrantha) and metal wires in other parts baraj given trailers bamboo or jute sticks (Bihar). Farmers in study sites to avoid threat of waterlogging constructed baraj at 3 m–5 m height by adding soil where baraj is constructed with thatched wall and roof and bamboo scaffoldings straight and criss-crossed for anchorage. It has durability of 5 years from the year of erection. 3.3 Planting Materials Selection Betelvine is propagated through stem cuttings. Within the study area, farmers generally select 3-years old disease-free healthy vines for preparing stock. Medium-aged, soft, green and fresh vines are selected for making cutting; a cutting develops into a matured vine after it survives following planting. Cutting is called as a sett. Each sett (stem cutting) during planting usually of 2–3 leaves (3 leaved if apex part collected, 2 if from other part and 1 leaved exceptional when leaf cost is very high), 1–2 nodes and 20 cm–30 cm length (Tamil Nadu has criteria of 6–7 nodes and 30 cm–45 cm length each sett). 3.4 Technique of Planting Planting time is Phalgun (February), before Car festival (June–July) and Kartik (Octover–November) in study site. Among these, last one is very usual, followed by 1st and then 2nd one, same trend is followed in West Bengal; but Andhra Pradesh prefers September–October, North Bihar June–August as that of Bangladesh;, South Bihar February–March and Tamil Nadu March–May then August–October. There are two ways of planting setts (vine cuttings): (a) Single row planting: within each row at every point one trailer hosts one vine only, farmer passing by row finds one side with vine (typical in Bhograi block) other side free,(b) double row spacing-at every point. 2 trailers, one facing the row other faces next row, each hosts one vine, farmer passing by row has choice to harvest left and right plants (typical in Baliapal block). Spacing in single row planting: line-to-line distance kept 18’’–22’’and in double row planting spacing 27”–30” and vine–to-vine distance kept 6” to 9” in both cases. However, in Tamil Nadu row-to-row kept 40” and vine to vine 7”. Present study was made with single row of planting as it is usual. Plant density or setts (stem cuttings) in single row spacing is 1,40,000 to 1,50,000/ ha i.e., 6,000 setts/ 10 decimile. 3.5 Agronomic Practices In addition to the practices enlisted in the table, farmers in experimental site apply FYM 25 tonnes/ ha. during soil dressing before planting, fertilizers added/ year is 150:100:50 NPK kg/ ha (Urea, DAP and MOP) at 45 days’ interval from the 60th day after planting, is quite similar with Tamil Nadu; conversely, Andhra Pradesh applies the doses 200:100:100kg (Ammonium Sulphate, SSP

and MOPand must& PSB @(NAA 50(Uda type3 monthsWhenare left. LIndian mand Aswinbecomes minimizeleaves artranspirawave. Hebaraj systevery 3 (agasti) lo3.6 PlanThe serioincludingRhizoctonparasiticacapsici anAmong thand storMeloidogFor co1% bordeinterval @Sulfex @waterlogg1g/ 10 litapplied aalternate following
Fig
) (Anon, 20tard oilcake @ 2kg/ acre)0 ppm+BAe), staking ms interval. n each vine oLowering dmonths. Thesnna–Kartik harvestablee wage, bulkre left in thation loss wnce, the hartem is develmonths intowering tak
nt Protectioous diseaseg Phytophthonia, Pythiuma and Phytond bacteriahe pathogenage conditivine arenariontrolling fueux mixture@10g/ litre @ 3g/ lit. atged conditiot.sprayed baat last ploughwith 4–5 lg its incubati
. 5: An Outer V
Betel Vine (Piper 11) and Bihadded @ 2q), incubatedA 5ppm+ Gmaterial withoccupies aboes not affese are Phalg(Novembere per vine pk harvestinge vine whicwhile winterrvesting takloped, the viterval. Convkes place at 9on Measurs in betelviora parasiti
m and Scleroophthora paal leaf spot ns, Phytophtions (Chatoia. Study siteungal disease at fortnighof water, det 15–20 daon and oil caacterinol @hing, neem lines of vinion in shade
View of Betelv
betel L.) the Neglehar gives dosq/acre/yeard with FYM GA3 50 ph fertilizer @out 20 leaveect the leaf
gun (Febuarr). Some peoper week. Tg is done quch is also br more left kes place revine persists versely, in a9 months ines ine are foo
ica var. pipeotium rolfsii almivora, leaand stem rthora sp. peropadyay anes reported ses, clean cuht interval, festruction ofays intervalake applicat2g/ lit at 15cake promoes, applied e for 21 days
vine Baraj
ected Green Gold C
171
ses 100:100r. KVK suggeat 1:10 ratppm) in w@ 80:60:40 es from whiproductionry), Baisakhople harvestThis is fasteuarterly. Duased on sea(7–8) to avverse, more for more than open synterval and vt rot syndr
erina, PhytopSace and foaf spot and rot caused rhaps ranksd Maity, 1almost all dultivation is followed by f infected pl to controltion, drench5 days interoted replacinthorough ms.
Claims livelihood 0:150 kg/ haested them ttio, vermi-cowinter and kg/ ha NPKich 12 leaven rate. The s
h (April-Mayt every weeker in rainy uring bulk hason; in sumvoid winter harvest in shan 30 yearsstem i.e. hovine persistsrome produphthora nicoliage diseasstem anthrby Xanthoms first in its 967). Prevadiseases andfollowed. SpTrichodermlant part by l diseases. hed 1% bordrval. For neng mustard mixture of 3
Fig. 6: InnerT
and Health Securia., neem cakto add biofeompost, pladevelop K. Baraj lowees are pluckeseason for ly), Ashadha k from eachand slow inharvesting qmmer leavedesiccationsummer ands; however, nosted with s upto 3 to 5uced by a notianae var ses like leafracnose caumonas campdestructivealent nemad nematodespray of 0.5%
ma viridae apburying or bFor bacterideux mixturmatode 12-cake, marig3 kg T. viri
r View of a BaTralling on Ika
ity in Rural Indiake (only rainertilizers (Azant growth hgood qualiering is carred and aboulowering is (August–Seh vine. Mostln winter. Inquarterly mes left (5–6)n of vine dud less in winneedful is loSesbania g5 years.
number of p parasitica f rot by Physed by Collpestries pv. ness under atode of bes. % and drencpplication aburning andial diseasese with Plant-15 kg/ acregold each linidae with 5
araj with Vineada
ny season) zotobacter hormones ity Ikada ried out at ut 8 leaves based on eptember) ly one leaf n order to mostly 5–8 ) to avoid ue to cold nter. Once owering at randiflora pathogens species of
ytophthora etorichum betlicola. both field etelvine is
ched (soil) at monthly d spraying s, avoided tomycin@ e Furadon ne planted 0 kg FYM
e

National Seminar on Management of Natural Resources for Sustainable Development: Challenges and Opportunities
172
3.7 Harvesting As per thumb rule, weekly one leaf becomes harvestable per vine. But, in practice about 20% underestimation is considered while estimating for a baraj in view of some malformation or weak or infestation of vines. So, per week, out of 1,50,000 vines, a total of 1,20,000 leaves, thus, annually (52 weeks) it reaches altogether 62,40,000 i.e. between 60 to 65 lakhs (season-wise rise and fall is there, but average altogether remains unchanged) and good scientific practices can lead to exceed it up to 70 lakhs too. Yield depends on no. of primary vine, spacing which are less in baraj (density is more in ikada based baraj, least in open system), cultural practice and variety. FAO has recommended planting of 1.0 to 1.2 lakh cuttings/ ha in baraj and 40,000 to 75,000 cuttings/ ha in open system and production potential of 100 to 130 lakhs leave/ ha/ annum. However, Tamil Nadu found its highest yield of 48.81 lakhs/ ha. 3.8 Value Addition of Betelvine Leaves One of the best Value Addition is steaming which is made to decolourize betel leaves. Steaming is a farmers’ innovation followed by farmers of the study sites as age-old tradition. It is carried out to increase shelf life, taste, colour, transit, attraction and marketability of leaves and simultaneously reduce pungency and residual toxicity effects. Mostly decolourizing of pan without adding any bleaching agent is good for health, breaking toxic chemicals, it has high demand in metropolis and overseas. It is a way of utilization of surplus produce against the consumption in local market which increases the market price 2 to 4 times. Mastication is form of value addition where edible materials like arecanut, lime, sugar, pepppermint, cardamom, clove, etc. are mixed together prior chewing. Extracting oil is for adding values of out of leaves. From ancient times of Ayurveda betelvine Oil is known for its medicinal properties and appreciated for antiseptic and aphrodisiac nature. Extracted from the leaves of the betel creeper, this oil is used in making mouth fresheners, paan masala, betel flavoured candies, etc. This oil is also used for healing various ailments such as headache, arthritis and joint pain. Under the strict surveillance of our professionals, it is hygienically processed and packed in secure packaging. Such useful properties of the oil indicates a promising industrial future for it as a raw material for manufacturing skin emollients, tooth-paste, tooth-powders, paan masala, perfumes, room fresheners, soaps, face creams, antiseptic creams and lotions, deodorants, cold drinks, chocolates, incense sticks, appetizers, carminative mixtures, digestive agents, tonics, medicines, etc. Betel leaf oil may also be used as an industrial raw material for manufacturing medicine, perfumes, tonics and food additives. It also contain anti-carcinogens showing promise for manufacturing of a blood cancer drug (Guha, 2006). 3.9 Cash Flow Table 1 shows cost/ 10 decimile is Rs. 33,696/ in study site. FAO has given average cost/ 10 decimile in 2011 as Rs. 26,000 and net income $145.5/ 10 decimile (Guha, 2006). Betel vine cultivation generates a gross income of @ Rs. 0.20/ piece of leaf, i.e., Rs. 10/ kada (50 in number) Rs. 12,48,000 i.e. 12 lakhs to Rs. 13 lakhs/ ha out of 62,40,000 leaves. This may be increased to Rs. 14 lakhs due to adoption of good scientific practices. Out of the gross profit, net profit is much proportionately less but the amount is too high compared to any other agri-enterprise. Gross cost is 65%–70% of gross profit and net profit is 30%–35% which may be increased to 36%–38% due to adoption of scientific practices. So, net profit is Rs. 4,05,600 (gross cost of Rs. 8,42,400) i.e., ranging between Rs.3,90,000 (gross cost of Rs. 8,10,000) to Rs. 4,22,500 (gross cost of Rs. 8,77,500) and may be increased to Rs. 5,18,000 (gross cost Rs. 8,82,000). In contrary to Table 1 gross cost of Rs. 842400 and gross return of Rs. 12,48,000 using Ikada stake, in Bihar the gross cost per hectare was Rs. 96,664 and gross return Rs. 151945 using bamboo and jute stakes. Steaming is an art of value addition which generates (in study area) a net income per bhatta daily Rs. 3,597 (by investing Rs. 4,323) and monthly income of Rs. 1,07,910 employing operator. This can be diverted to an agri-based industry by running simultaneously more than one bhatta.

Betel Vine (Piper betel L.) the Neglected Green Gold Claims livelihood and Health Security in Rural India
173
Table 1: Cost of Cultivation of Betelvine Observed in Study Site (Baraj with Staking Khadi or Ikada to Host Vines) (Project Area 10 cents (1 cent = 40.468 m2) then converted to 1ha per year) Sl. No. Component A. Input Quantity Needed for
10 Cent Baraj Cost of Materials for 10 Cent (Rs.)
Cost for 1 ha Baraj (Rs.)
A. Critical Input 1 FYM 1 tonne 600 150002 Planting Material 3000 6000 1500003 Hormone 200 gm 246 61504 Mustard Cake/ neem cake 20 kg 600 150005 Fertilizers (NPK)@15 `/ Kg 40 kg 600 150006 Mud 750 CFT 750 187507 Irrigation (materials) 2000 500008 Plant Protection 1000 250009 Bamboo 20 1400 3500010 GI wire 10 kg 600 1500011 Chhai @ Rs. 200/ bundle 5 bundle 1000 2500012 Inkad @ Rs. 1000/ kahan 3 kahan 3000 7500013 Tying material 200 500014 Side wall (thata) @200/ thata 5 thata 1000 2500015 Miscellaneous 1200 3000016 Total 20196 50490017 B. Labour @250/MD 18 Land Preparation 12MD o 3000 7500019 Planting 4 MD 1 1000 2500020 Construction/repair of Baraj 6 MD 1 1500 3750021 Vine tying 5 MD 4 1250 3125022 Application of oilcake/Fertilizers 3 MD 1 750 1875023 Lowering of baraj 6 MD 1 1500 3750024 Application of PP chemicals 3 MD o 750 1875025 Irrigation 5 MD 2 1250 3125026 Harvesting and onsite processing 10 MD 4 2500 6250027 Total 54 MD 2 13500 337500 Grand Total 33696 842400(Involvement of women: 0 = no, 1 = satisfactory, 2 = good, 3 = very good, 4 = Excellent)
3.10 Employment by Betel Vine Sectors Within the study site, for a 10 cent baraj, 54 people are mandatory with the scope of their further engagement. Thus, 1 ha baraj can accommodate 54 x 25 = 1350 mandays; 1000 hectares of baraj within Balasore district accommodates a total of 1350 x 1000 = 13,50,000 mandays of wages. Wages engagement in Bihar shown per hectare to be 833 out of which family labour 511 and hired labour 322. i.e. 61.35% and 38.65% respectively. Within the study site, proportion of family labourer and hired labourer are 59% and 41%, respectively. Apart from cultivation, steaming provides daily engagement of 18 people per bhatta, so 10 bhatta can provide full time income to 180 people, besides natural fibre like cotton saree/ jute, paddy straw properly, utilization of automobiles engaging rural youths for transportation and trade which, by far, increased through value addition. Only district Balasore, Odisha has 70 bhattas which could accommodate 1260 people daily. 4,00,000–5,00,000 families livelihood in India is dependent on betelvine cultivation (Guha, 2006) and 20,00,000 million families employed in cultivation, trading and commerce (Anon, 2006). Besides, this sector provides huge scope for cultivation of bamboo for reinforcement (Bambusa vulgaris) and artisans work (Bambusa nutans and Bambusa longipathus) mostly landless poor of the district, Ikada/ khadi (Andropogon muricatus) for baraj surface structure and trailer, agasti (Sesbania grandiflora) and arecanut (Areca catechu) as live host to harbour gachh pan (betelvine creeping on tree), juna grass (Koeleria macrantha) for tying vine with trailer, all needful

National Seminar on Management of Natural Resources for Sustainable Development: Challenges and Opportunities
174
for baraj construction. Further, arecanut, coriander (Coriandrum sativum), khair (Acacia catechu), keoda (Pandanus sp.), clove, saffron, cardamom, pepper mint (Mentha piperita), coconut (Cocos nucifera) and rarely tobacco (Nicotiana tobaccum), sugarcane (Saccharum officinarum) etc. are also used for value addition during mastication. This provides scope for income generation, additional employment and indeed encourage for biodiversity conservation. 3.11 Engagement of Rural Women As betelvine is a perennial crop, generally grown in baraj, once vine establishes, it generates return throughout the year and beyond. So, in addition to their usual household responsibilities, women comfortably manage routine activity of baraj like their male counterpart. Within the study site, women shared 21% of wages while men 79%. However, in Bihar, this was observed to be 14% and 86%, respectively. In Deula, one of the study site where all the 3 women self-help group undertook betelvine cultivation with the support from District Rural Development Authority, Balasore. Women generally perform better in vine planting, irrigation, inter-culturing, harvesting and processing and also grading during steaming process. 3.12 Commercial Importance (Export Potential) Betel leaves are in great demand in several countries of the world where it is either not grown at all or the demand exceeds the local supply. Consequently, leaves worth about Rs 20 million are exported to the countries like Bahrain, Canada, European countries like Great Britain, Hong Kong, Italy, Kuwait, South East Asian countries like Nepal, Pakistan, Gulf countries like Saudi Arab and many other European countries out of India whose total turnover from the leaves is 10,000 million in 2006 (Anon, 2006). Pakistan is the biggest importer of Indian betel. 3.13 Betelvine for Health Security The medicinal properties of pan were recognized during 600 AD when Ayurvedic system of medicine came into practice. Pan chewing is considered as a good and cheap source of dietary calcium, acid neutralizer, blood purifier, rich source of vitamin B and C, carotene, and other elements, good for throat and removes viscosity, removes bad smell of mouth, good for the respiration and checks bronchitis, cough and cold (Chopra et al, 1958). The oldest authentic Ayurvedic therapy books describe betel vine, honey and Tulsi as nectar (Amrit). Juice becomes useful to add with some Ayurvedic medicines; it acts as antiseptic and checks bleeding from wound and makes faster healing, cures ears pus. It is grandmother’s remedies, prescribed as traditional medicine, by experienced, older members of the family. The essential oil and extracts of the leaves possess activity against several gram-positive and gram-negative bacteria and also identified antifungal activity. The leaves are reputed to possess laxative and anti-helminthic properties. The betel leaf extract are found to inhibit 13 bacteria and 3 fungi (CSIR, 1969). The leaf oil has been found to possess antiseptic properties. A gargle having of either juice or oil from the leaves mixed in warm water or inhalation of betel leaf oil vapour has been recommended in the treatment of diphtheria. Betel leaf is traditionally known to be useful for the treatment of various diseases like bad breath, boils and abscesses, conjunctivitis, constipation, headache, hysteria, itches, mastitis, mastoiditis, leucorrhoea, otorrhoea, ringworm, swelling of gum, rheumatism, abrasion, cuts and injuries etc as folk medicine while the root is known for its female contraceptive effects. Essential oil contained in the leaves possesses antibacterial, anti protozoan and anti fungal properties. Therefore, the oil kills or inhibits growth of dreadful bacteria causing typhoid, cholera, tuberculosis etc.

Betel Vine (Piper betel L.) the Neglected Green Gold Claims livelihood and Health Security in Rural India
175
The leaves have also been used in Indian system of medicine and health. A phenolic compound hydroxyl-cavicol with anti carcinogenic property has also been identified in betel leaves. Fresh juice of betel leaves is also used in ayurvedic preparation. A type of wild betel (Piper sarmentosum) leaf is used in cooking purpose (Betel Wikipedia the free Encyclopedia, 2013). In contrary, as described in the Ayurvedic texts, it weakens teeth, impairs health and deadens the taste buds of the tongue, WHO speaks pan with lime and arecanut regular chewing to be mild and further adding tobacco makes it more carcinogenic. However, as per Einsiedlen, Switzerland (1943), ‘Everything is poisonous, and nothing is not poisonous; only the dose makes a thing poisonous.’ It is believed that moderate dose of pan without tobacco not merely innocuous but that it may even be conducive to good health (Anon, 2006). 3.14 Usual Constraints Faced by Betelvine Growers Major loss faced by the growers are due to nature’s disturbances, lack of promising planting materials, high wage rate, chemicals rate, encroachment of gutka in betel market, disease proliferation like vine rot or Collectotrichum rot (khad pacha), nematode infestation, etc., habitat loss causing scarcity of raw materials for baraj, stunted leaf growth in winter, poor lustre and keeping quality of leaves on account of imbalanced chemical addition and unavailability of good staking materials. 4. Conclusion If merely transportation and marketing facilities including the export channels were developed adequately then the revenue generated by this leafy crop would easily exceed that generated by any major crop of the country even with the present level of traditional agronomic practices. In fact, the revenue generated by the crop may be further magnified by many folds if the agronomic and health-friendly packages are scientifically explored. There is a high wastage of leaves during storage and transportation. The losses due to spoilage range between 35%–75%. Moreover, the surplus leaves if not disposed off properly, may cause environmental pollution and health hazard. Wastage of the leaves may be minimized by bleaching the leaves for further value addition and also by extraction of essential oil for pharmaceutical and cosmetic purposes. There seems more scientific researches needful to prove its health-effect where it has scope and where limitation without blindly adhering to the darker side which may otherwise deprive livelihood of crores of people. References Anon (2006), Economics of Production and Marketing of betelvine in Bihar. Directorate of Agriculture Department of Bihar, Patna, Bihar 2006, p. 80. Anon (2008), Manual of Agriculture Production Technology, Kharif 2008. Directorate of Agriculture and Food Production of Orissa, Bhubaneswar. 2008. Bhubaneswar, p. 209. Anon (2011), Report on betelvine Cultivation in Andhra Pradesh. National Information Centre of Andhra Pradesh and Directorate of Horticulture of Andhra Pradesh, Hyderabad-63, Andhra Pradesh, p. 15. Betel-Wikipedia (2013), TheBetel(Online).http://betel%20-%.20Wikipedia,%20the%10free: 20encyclopedia.htm. Chattopadhyay, S.B. and Maity, S. (1967), Diseases of Betelvine and Spices, ICAR, New Delhi. Chopra, R.N., Nayar, S.L. and Chopra, I.C. (1958), Glossary of Indian Medicinal Plants, CSIR, New Delhi, p. 194. CSIR (1969), “The Wealth of India”, Council of Scientific and Industrial Research, CSIR, New Delhi, Vol. 8, pp. 84–94. Guha, P. (2006), “Betel Leaf: The Religious Green Gold of India”, Journal of Human Ecology, Vol. 19(2), pp. 87–93. Guha., P. and Jain, P.K. (1997), Status Report on Production, Processing and Marketing of Betel Leaf (Piper Betel L.). Agricultural and Food Engineering Department, IIT, Kharagpur, India. Haider, M.R., Khair, A., Rehman, M.M. and Alam, M.K. (2013), “Indegenous Management Practices of Betel leaf (Piper betle L.) Cultivation by Khasia Community in Bangladesh”, Journal of Traditional Knowledge, Vol. 12(2), pp. 231–239.
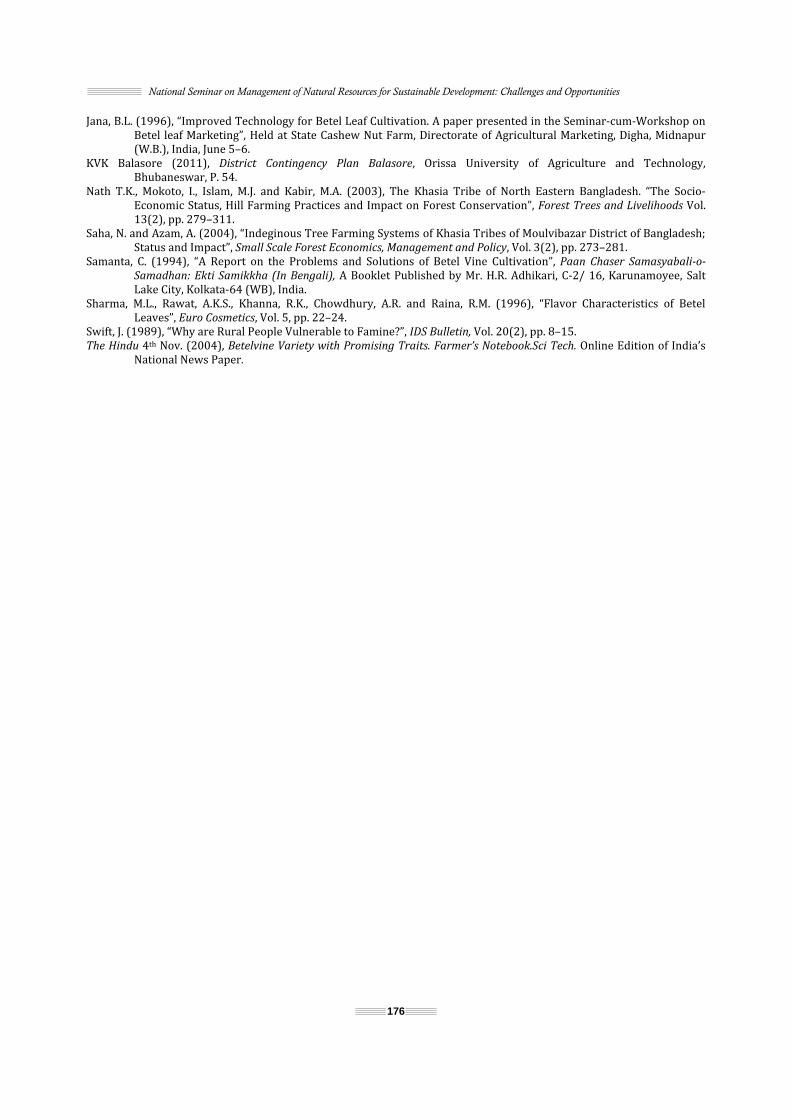
National Seminar on Management of Natural Resources for Sustainable Development: Challenges and Opportunities
176
Jana, B.L. (1996), “Improved Technology for Betel Leaf Cultivation. A paper presented in the Seminar-cum-Workshop on Betel leaf Marketing”, Held at State Cashew Nut Farm, Directorate of Agricultural Marketing, Digha, Midnapur (W.B.), India, June 5–6. KVK Balasore (2011), District Contingency Plan Balasore, Orissa University of Agriculture and Technology, Bhubaneswar, P. 54. Nath T.K., Mokoto, I., Islam, M.J. and Kabir, M.A. (2003), The Khasia Tribe of North Eastern Bangladesh. “The Socio-Economic Status, Hill Farming Practices and Impact on Forest Conservation”, Forest Trees and Livelihoods Vol. 13(2), pp. 279–311. Saha, N. and Azam, A. (2004), “Indeginous Tree Farming Systems of Khasia Tribes of Moulvibazar District of Bangladesh; Status and Impact”, Small Scale Forest Economics, Management and Policy, Vol. 3(2), pp. 273–281. Samanta, C. (1994), “A Report on the Problems and Solutions of Betel Vine Cultivation”, Paan Chaser Samasyabali-o-Samadhan: Ekti Samikkha (In Bengali), A Booklet Published by Mr. H.R. Adhikari, C-2/ 16, Karunamoyee, Salt Lake City, Kolkata-64 (WB), India. Sharma, M.L., Rawat, A.K.S., Khanna, R.K., Chowdhury, A.R. and Raina, R.M. (1996), “Flavor Characteristics of Betel Leaves”, Euro Cosmetics, Vol. 5, pp. 22–24. Swift, J. (1989), “Why are Rural People Vulnerable to Famine?”, IDS Bulletin, Vol. 20(2), pp. 8–15.
The Hindu 4th Nov. (2004), Betelvine Variety with Promising Traits. Farmer’s Notebook.Sci Tech. Online Edition of India’s National News Paper.

177
24 Phytosociological Analysis of Woody Vegetation in Tropical Forest of Manipur
Gurumayum Sanahal Sharma1, P.S. Yadava2 and Angom Sarjubala Devi
1Department of Life Sciences, Manipur University 2Department of Environmental Sciences, Mizoram University
E-mail: [email protected]
1. Introduction Tropical forests occupy 7% of the earth’s area (Myer’s 1984). In India, they occupy 84% of the total forest cover (6,37,293 km2), which is about 19.39% of the total geographical area (State Forest Report 1999). Quantitative floristic inventories provide necessary context for planning and interpreting long term ecological research (Phillips et al., 2003). Further, studies of long term dynamics in forests threatened by human activities are particularly valuable (Fashing et al. 2004). A thorough understanding of the dynamics of the forest can help to increase the productivity, the main species composition, to limit financial inputs and to develop prescription for silviculture operations (Oliver and Larson 1990; Bhat et al., 2000). It is the human, who interferes with the forest vegetation mostly by cutting for shifting cultivation and for using wood as fuel etc. (Supriya 2002). Phytosociological study of woody species of Dipterocarpus forest in North-East India is lacking. Therefore, the present study has been undertaken to assess the vegetation analysis of woody species of Dipterocarpus dominated forest as well as quantitative analysis and distribution of tropical forest in Manipur. The quantitative characters such as density, frequency, abundance, A/F ratio, basal cover and important value index (IVI) of woody species were studied. 2. Materials and Methods
2.1 Description of Study Site Haolenphai dipterocarpous forest which is located at 23o13’ N latitude and 94o17’ E longitude at an altitude of 261 m above mean sea level along the Indo-Myanmar border at Chandel district of Manipur is about 112 km from Imphal (Fig. 1). The forest is dominated by Dipterocarpus tuberculatus and co-dominated by Melanorrhoea usitata. The forest is subject to heavy biotic disturbances i.e. logging and fire. The area experiences monsoon climate with warm moist summer and cool dry winter. Air temperature reaches a maximum of 36.9oC (June) and a minimum of 19.2oC (January). Soil characteristics of the study area is sandy loam in texture and acidic in nature. Sample collection of the soil as well as recording of climatic data was conducted for 12 months (July 2012 to July 2013). The vegetation analysis was carried out during the month of November 2012. A total of 10 quadrates of 10X10 m2 were laid randomly in the forest site to study the quantitative characters such as density, frequency, abundance, A/F ratio and Important Value Index (IVI). Thus, all the individual species were enumerated in each quadrate and their girth class was measured. The phytosociological characters such as density, frequency and abundance were determined as per the method given by Curtis and Mclntosh (1950). Diameter at breast height (DBH) (at 1.37m from the ground) of all the tress with >10 cm in each quadrate were measured and recorded individually per species.

National Seminar on Management of Natural Resources for Sustainable Development: Challenges and Opportunities
178
Fig. 1: Map of Manipur Showing the Study Area The IVI for the tree species was determined as the sum of relative density, relative frequency and relative dominance (Curtis 1959). The ratio of abundance to frequency for different species was determined for eliciting the distribution patterns. This ratio may indicate regular (<0.025), random (0.25 to 0.05) and contagious (>0.05) distribution (Curtis & Cottom 1956). 3. Results and Discussion A total of eight woody species were recorded from the present study site. Highest value of density, frequency and IVI was recorded in Dipterocarpus tuberculatus (Diptercarpaceae) followed by Melanorrhoea usitata (Anacardiaceae) while minimum value of density, frequency and IVI was recorded in Lagerstroemia vilosa (Fabaceae) in the forest site. The phytosociological values of different woody plant species are given in Table 1. Density (stems ha-1) and basal area (m2ha-1) of woody species in the forest site were 2340 stems ha-1 and 33.54 m2ha-1 respectively which is quite higher than the values reported in dry tropical forest in Thailand between 554 and 789 (Visaratana et al., 1986), of Sal dominated forest of Doon valley as 312–2156 (Negi et al., 2002). But the observed values are lower than the values reported in undisturbed (5452 stems ha-1), mildly disturbed (5014 stems ha-1) and moderately disturbed (3656 m2h-1) tropical wet evergreen forest. The basal area in the present study also shows a higher value than the values reported from dry tropical forest communities in Vindhyan region between 6.58 and 13.21 m2h-1 (Jha and Singh, 1990 and between 3.84 and 10.36 m2h-1 (Singh and Singh, 1991). Basal cover of the present study is comparable with 17 to 40 m2h-1 for dry tropical forests and 20 to 75 m2h-1 for wet forest (Murphy and Lugo, 1986).
Table 1: Phytosociological Values of Different Plant Species in the Forest Site
Name of the species Density (100m2) Frequency(%)
Abundance(100m2)
A/F Basal cover m2h-1
IVI
Dipterocarpus tuberculatus 17.2 100 17.20 0.172 7.16 121.17Melanorrhoeau sitata 3.2 80 4.00 0.050 5.55 51.28Wendlandiag labrata 0.5 30 1.67 0.055 5.22 30.37Lagestroemia vilosa 0.2 20 1.00 0.050 5.36 22.10Dalbergia stipulata 0.2 20 1.00 0.050 1.31 10.03Lithocarpus dealbata 0.2 40 1.25 0.031 2.52 20.18Emblica officinalis 0.3 20 1.50 0.075 1.37 10.63Elaeo carpus 1.3 70 1.85 0.026 5.02 46.88

Phytosociological Analysis of Woody Vegetation in Tropical Forest of Manipur
179
3.1 Distribution Status In the present study, most of the species exhibited contagious distribution patterns. Contagious distribution pattern is common under natural conditions (Odum, 1971). Similar distribution pattern was reported in the forest vegetation by several workers (Ralhan et al. 1982 and Supriya 2002). 4. Conclusion The present study indicates its dominance among the inhabited tree species in the forest site. Not only its dominance than other tree species it also shows higher basal cover area. As the number of girth class in the D. tuberculatus is more than other species studied, the tree shows higher survivability than other species studied despite logging and surface fire. This trend is followed by M. usitata and very less by L. vilosa. The present study also shows how the interaction took place between the tree species in the study area. D. tuberculatus is under pressure of heavy logging for its timber export but still it shows higher productivity as well as recruitment naturally. Further study will focus about the effect of climate on the phenology, productivity, and rate of carbon fixation in the study site. References Bhat, D.M., Naik, M.B., Patagar, S.G., Hedge, G.T., Kanade, Y.G. and Hedge, G.N. (2000), “Forest Dynamics in Tropical Rain Forest of Uttara Kanada District in Western Ghat, India”, Current Science, Vol. 79, pp. 975–985. Curtis, J.T. and McIntosh, R.P. (1950), “The Interrelations of Certain Analytic and Synthetic Phytosociological Characters”,
Ecology, Vol. 31, pp. 434–455. Curtis, J.T. and Cottom G. (1956), Plant Ecology Work Book. Laboratory Field Reference Manual. Burgess Publishing, Minnesota Co. Curtis, J.T. (1959), The Vegetation of Wisconsin, An Ordination of Plant Communities, University Wisconsin Press, Madison. Wisconsin. Devi, L.S. (2002), ‘Plant Biodiversity, Biomass and Nutrient Dynamics of Dipterocarpus Forest of Manipur, India’. Ph.D. Thesis Submitted in Life Sc. Dept., Manipur University, India. Fashing, P.J., Forrestrel, A. C., Scully and Cords M. (2004), “Long-term Tree Population Dynamics and their Implications for the Conservation of the Kakamega Forest, Kenya”, Biodiversity and Conservation, Vol. 13, pp. 753–771. Jha, C.S. and Singh J.S. (1990), “Composition and Dynamics of Dry tropical Forest in Relation to Soil Texture”, J. Veg. Sci., Vol. 1, pp. 609–614. Murphy, P.G. and Lugo, A.E. (1986), “Ecology of Tropical Dry Forest”, Annual Review of Ecology and Systematics, Vol. 17, pp. 67–88. Myers N. (1984), The primary source: Tropical Forests and Our Future. W.W. Norton, New York. Negi J. D., Shah S.D., Kukreti P.M., Negi H.S., Basera, Kamboj S.K. and Chauhan P.S. (2002), “An Ecological Assessment of Sal Mortality in Uttaranchal” Analysis of Forestry, Vol. 10, 193–203 Odum, E.P. (1971. Fundamentals of Ecology. W.B. Saunders (ed.), pp. Philadelphia. p. 574. Oliver, C.D. and Larson, B.C. (1990), Forest Stand Dynamics, McGraw-Hill Inc., New York. Phillips, O.L., Martinez R.V., Vargas P.N., Monteagudo A.L., Zans M.C., Sanchez W.G., Cruz A.P., Timana M., Yli-Halla and Rose, S. (2003), “Efficient Plot-based floristic Assessment of Tropical Forests”, Journal Of Tropical Ecology, Vol. 19, pp. 629–645. Ralhan, P.K., Saxena A.K. and Singh, J.S. (1982), “Analysis of Forest Vegetation at and Around Nainital in Kumaon Himalaya”, The Proceeding, Indian National Science Academy, Vol. 348, pp. 121–137. Singh, L. and Singh, J.S. (1991), “Species Structure, Dry Matter Dynamics and Carbon of a Dry Tropical Forest in India”, Analysis of Botany, Vol. 68, pp. 263–273. State of Forest Report (1999), Forest Survey of India. Minister of Environment and Forests, Dehra Dun, India. Visaratana, T., Pitprecha, K., Kiratiprayoon, S., Kampan, T. and Higuchi, K. (1986), Structural Characteristics and Species Composition of dry Dipterocarpus Forest (Dipetrocarpus Tuberculatus Roxb. Community Type) at Salakphra Wildlife Sanctuary. Technical Paper No. 10 Forest Ecology Section, FRD (Thailand).

180
25 Role of Plant Resources in the Abatement of Air Pollution: An Eco-Sustainable Approach
Lalita L.S. Panda and Prabhat Kumar Rai Department of Environmental Science,
Mizoram University, Aizawl, Mizoram, India
1. Introduction Plant biodiversity offers an ecosustanable mitigation approach for air pollution abatement particularly in context of partculate matters. Atmospheric particulate matter is a mixture of diverse elements. Fine particulate matter is of great concern including dust and smoke as they are respirable, resulting in detrimental effect on human health and vegetation. There is no mechanical or chemical device, which can completely check the emission of pollutants at the source. Once the pollutants are released to the atmosphere, only the plants are the hope, which can mop up the pollutants by adsorbing and metabolizing them from the atmosphere. Therefore, the plant’s role in the air pollution abatement has been increasingly recognized in recent years. In urban environment trees play an important role in improving air quality by taking up gases and particles (Woo and Je, 2006). Plants also act as scavengers for many air-borne particulates in the atmosphere (Joshi and Swami, 2009). Plants act as a sink or even as living filters to minimize air pollutant by developing characteristic response and symptoms. Roadside vegetation particularly trees, shrubs and intense hedge can help significantly in reducing the adverse effect of gaseous and particulate pollutants (Ahmed et al., 2009). The ability of each plant species to absorb and adsorb pollutants by their foliar surface varies greatly and depends on several biochemicals, physiological and morphological characteristics (Singh and Verma, 2007, Seyyednjads et al., 2011). The variation in the biochemical parameters in the leaves was used as an indicator of air pollution for early diagnosis of stress or as a marker for physiological damage prior to the onset of visible injury symptoms (Mandal and Mukherji, 2000; Agrawal, 2005; Joshi and Swami, 2007; Tripathi et al., 2009). Categorization of plants as sensitive or tolerant was determined by the level of these parameters in plants. Response of plants towards air pollution is being assessed by APTI (Chauhan, 2010). The APTI is used to rank plant species in their order of tolerance to air pollution. Plants show different susceptibility to different pollutants. Sensitive species are an early indicator of pollution and the tolerant species help in reducing the overall pollution load (Subrahmanyam et al., 1985; Nrusimha et al., 2005). The goal of this study was to develop a gradation of air pollution tolerance as well as sensitivity that can be applied broadly in the selection of species in urban planting and in abatement of particulate pollution. 2. Materials and Methods Present work was performed in Aizawl, Mizoram, North East India (21⁰58’–21⁰85’ N and 90⁰30’–90⁰60’E), the capital city of the state located 1132 metre above sea level (ASL). The study area comes under Indo Burma hotspot region. The altitude in Aizawl district varies from 800 to 1200 metre ASL. The climate of the area is typically monsoonal. The annual average rainfall is amounting to ca 2350 mm. This area experienced with distinct seasons. The ambient air temperature normally ranged from 20⁰C to 30⁰C in summer and 11⁰C to 21⁰C in winter (Laltlanchhuanga, 2006).

Role of Plant Resources in the Abatement of Air Pollution: An Eco-Sustainable Approach
181
Fig. 1: Location of Study Area: Aizawl (Mizoram), North-East India Six roadside plant species (in triplicate) growing commonly in traffic areas of Aizawl city were selected for the study. The selected plants were collected from sites with similar light, water and soil condition. The duration chosen for sampling was in winter during December 15th (2011) to January 20th (2012). Mature leaf samples (twelve leaves from each plant species) were collected from the lower branches at a height of 2–4 m from the ground level in polythene bag and stored at 20˚C for further analysis. The Air Pollution Tolerance Index (APTI) was determined by calculating various biochemical parameters such as leaf extracts pH (Singh and Rao, 1983), relative water content (Sen and Bhandari, 1978), total chlorophyll (Arnon, 1949), ascorbic acid (Keller and Schwager, 1977). The APTI was given by APTI = {[A (T + P) + R] / 10}, where A is the ascorbic acid in mg/g; T is the total chlorophyll in mg/g; P is pH of leaf sample; and R is relative water content in mg/g. calculated using the formula given by Singh and Rao (1983). 3. Results and Discussion The biochemical characteristics and the APTI was calculated for six plants species grown along the road side of Aizawl, Mizoram and the results were demonstrated in Table 1. Plants that are constantly exposed to environment pollutants absorb, accumulate and integrate these pollutants into their system and depending on their sensitivity level; they show visible changes including alteration in the biochemical processes or accumulation of certain metabolites (Agbaire and Esiefarienrhe, 2009). Chlorophyll content of plant signifies its photosynthetic activity as well as the growth and development of biomass. The chlorophyll content of plant varies from species-to-species and also with the pollution level. In the present study, the total chlorophyll content was found to be highest in Ficus bengalensis (6.60) may be due to its tolerant nature as it maintained its chlorophyll content even under polluted environment and least in Artocarpus heterophyllus (1.81) might be due to its sensitive nature towards high pollution level. Higher chlorophyll content in plant might favours tolerance to pollutant (Beg et al., 1990; Jyothi and Jaya, 2010). Depletion in chlorophyll causes a

National Seminar on Management of Natural Resources for Sustainable Development: Challenges and Opportunities
182
decrease in productivity of plant and exhibit poor vigour, therefore plant maintaining their chlorophyll even under polluted environment are said to be tolerant ones (Singh and Verma, 2007). Whereas a considerable loss in total chlorophyll in the leaves of plant exposed to pollution stress support the argument that the chloroplast is the site of attack by air pollutants. It also varies with the tolerance as well as sensitivity of the plant species, i.e., higher the sensitive nature of the plant species, lower the chlorophyll content. The highest ascorbic acid content of 8.23mg/g was recorded in Ficus bengalensis and lowest 2.29mg/g in Artocarpus heterophyllus. Ascorbic acid, a natural antioxidant has been shown to play an important role in pollution tolerance (Joshi and swami 2007; Lima et al., 2000; Arora et al., 2002). The increased level of ascorbic acid was reported to attribute in the defence mechanism of the respective plant (Tripathi and Gautam, 2007; Cheng et al., 2007). Increased level of ascorbic acid in leaves will increase air pollution tolerance in these plant (Chaudhury and Rao, 1977) whereas lower ascorbic acid content in the leaves of other plant species studied, which supported the sensitive nature of these plants towards pollutants particularly automobile exhaust. In the present study the leaf pH value are higher than 6.0 in all species, except Artocarpus heterophyllus (4.35). pH is a biochemical parameter that acts as an indicator for sensitivity to air pollution (Joshi and Bora, 2011, Scholz and Rick, 1997). A pH on the higher side gives tolerance to plant against air pollution (Agrawal, 1988). It was also reported that in the presence of an acidic pollutant, the leaf pH is lowered and plants with lower pH were more susceptible while those with pH around 7 were more tolerant (Singh and Verma, 2007). The RWC was found lowest with Artocarpus heterophyllus (62.16) and highest with Mangifera indica (82.44). Relative water content expressed the balance of plant water uptake and release (Jones 1994). Relative water content is the water present in plants which help to maintain its physiological balance under stress condition caused by pollution when the transpiration rates are high. High water content within plant body helps to maintain its physiological balance under stress condition. It also serves as an indicator of drought resistance in plants (Dedio, 1975; Seyyednjad et al., 2011). Reduction in RWC of plant species is due to impact of pollutant on transpiration rate in leaves (Swami, 2004).
Table 1: Biochemical Parameters and Air Pollution Tolerance Index of the Selected Plants
Plant Species pH Relative Water Content (%) Total Chlorophyll(mg-1g)
Ascorbic Acid (mg-1g)
APTI
Ficus bengalensis 7.23 70.9 6.60 8.23 18.47Mangifera indica 6.01 82.44 6.12 8.12 18.09Psidium guajava 6.12 76.61 5.58 7.22 16.10Ficus religiosa 7.12 74.45 5.80 7.45 17.07Lagerstroemia speciosa 6.51 79.62 3.22 4.32 12.16Artocarpus heterophyllus 4.35 62.16 1.81 2.29 7.62Among the plant species studied, Ficus bengalensis recorded the highest APTI value (18.47) while Artocarpus heterophyllus possessed lowest APTI value (7.62). APTI determination for plants is an important parameter for future plantation, since plants have the ability to serve as quantitative and qualitative indices of pollution control (Jyothi and Jaya, 2010). The biochemical parameters such as ascorbic acid, total chlorophyll, relative water content and pH play an important role in APTI determination. Therefore, all these biochemical parameters constitute APTI in totality. Ficus bengalensis with high APTI value to be termed as tolerant among other species whereas plants species such as Artocarpus heterophyllus showed lowest APTI value was termed as sensitive plant and to be treated as bio indicator of pollution.

Role of Plant Resources in the Abatement of Air Pollution: An Eco-Sustainable Approach
183
4. Conclusion Present study concludes that Lagerstroemia speciosa and Artocarpus heterophyllus can be used as bio-monitors for air pollution whereas Ficus bengalensis and Mangifera indica the tolerant among them can be effectively used in the air pollution remediation and hence Green Belt plantation. Acknowledgement The authors would like to thank the Department of Science and Technology (DST) and Department of Biotechnology (DBT), for providing financial assistance in the form of research project (vide project no. SR/FTP/ES-83/2009 and BT/PR-11889/BCE/08/730/2009, respectively). Thanks are also extended to Dr. Umesh Sharma and Dr. Onkar Nath Tiwari for their useful discussion and cooperation in this work. References Agarwal, A.L. (1988), “Air Pollution Control Studies and Impact Assessment of Stack and Fugitive Emissions from CCI Akaltara Cement Factory”, Report (NEERI), Nagpur, India. Agbaire, P.O. and Esiefarienrhe, E. (2009), “Air pollution Tolerance Indices (APTI) of Some Plants Around Otorogun Gas Plant in Delta State, Nigeria”, J Appl Sci Environ Manage, Vol. 13(1), pp. 11–14. Agrawal, M. (2005), “Effects of Air Pollution on Agriculture: An Issue of National Concern”, National Academy of Science
Letter, Vol. 23(3–4), pp. 93–106. Ahmed, S., Fazal, S., Valleem, E.E., Khan, I.Z., Sarwar, G. and Iqbal, Z. (2009), “Evaluation of Ecological Aspect of Roadside Vegetation around Havalian City using Multivariate Techniques”, Pak.5.Bot, Vol. 41(1), pp. 53–60. Arnon, D.I. (1949), “Coenzyme in Isolated Chloroplast”, Polyphenol Oxidase in Beta vulgaris. Plant Physiology, Vol. 24, pp. 1–15. Arora, A., Sairam, R.K. and Srivastava, G.C. (2002), “Oxidative Stress and Antioxidative System in Plants”, Curr Sci., Vol. 82(10), pp. 1227–1238. Beg, M.U., Farooq, M.H., Bhargava, S.K., Kidwai, M.M. and Lal, M.M. (1990), “Performance of Trees Around a Thermal Power Station”, Environ. Ecol., Vol. 8, pp. 791–797. Chaudhary, C.S. and Rao, D.N. (1977), “A Study of Some Factors in Plants Controlling their Susceptibility to SO2 Pollution”, Proceedings of Indian National Science Academy, Vol. 43, pp. 236–241. Chauhan, A. (2010), “Photosynthetic Pigment Changes in Some Selected Trees Induced by Automobile Exhaust in Dehradun”, Journal of New York Sciences, Vol. 3(2), pp. 45–51. Cheng, F.Y., Burkey, K.O., Robinson, J.M. and Booker, F.L. (2007), “Leaf Extracellular Environ. Ascorbate in Relation to O3 Tolerance of Two Soyabean Cultivars”, Environ Pollut, Vol. 150, pp. 355–362. Dedio, W. (1975), “Water Relations in wheat Leaves as Screening Test for Drought Resistance”, Canadian Journal of Plant Science, Vol. 55, pp. 369–378. Jones, H.G. (1994), Plants and Microclimate, 2nd Ed. Cambridge University. Joshi, N. and Bora, M. (2011), “Impact of Air Quality on Physiological Attributes of Certain Plants”, Report and Opinion, Vol. 3(2), pp. 42–47. Joshi, P.C. and Swami, A. (2007), “Physiological Responses of Some Tree Species under Roadside Automobile Pollution Stress Around City of Haridwar, India”, Environmentalist, Vol. 27, pp. 365–374. Joshi, P.C. and Swami, A. (2009), “Air Pollution Induced Changes in the Photosynthetic Pigment of Selected Plant Species”, J Environ Boil, Vol. 30(2), pp. 295–298. Jyothi, J.S. and Jaya, D.S. (2010), “Evaluation of Air Pollution Tolerance Index of Selected Plant Species Along Roadsides in Thiruvananthapuram, Kerala”, J. of Environ. Biology, Vol. 31, pp. 379–386. Keller, T. and Schwager, H. (1977), “Air Pollution and Ascorbic acid”, European J. Forest Pathol, Vol. 7, pp. 338–350. Laltlanchhuang, S.K. (2006), “Studies of the Impact of Disturbance on Secondary Productivity of Forest Ecosystem with Special Reference to Surface, Sub-surface Litter Insect and other Non insect Groups”, M.Sc. Dissertation. Mizoram University. Lima, J.S. Fernandes, E.B. and Fawcett, W.N. (2000), “Mangifera Indica and Phaseolus Vulgaris in the Bioindicator of Air Pollution in Bahia, Brazil”, Ecotoxicol Environ. Safety, Vol. 46(3), pp. 275–278. Mandal, M. and Mukherji, S. (2000), “Changes in Chlorophyll Context, Chlorophyllase Activity, Hill Reaction, Photosynthetic CO2 Uptake, Sugar and Starch Contents in fi ve Dicotyledonous Plants Exposed to Automobile Exhaust Pollution”, J. Environ. Biol, Vol. 21, pp. 37–41. Nrusimha, T., Suresh Kumar, K. and Srinivas, N. (2005), “Air Pollution Tolerance Index of Tree Species Growing in Industrial and Traffic Areas of Visakhapatnam. Indian”, J. Env. Protection, Vol. 25, pp. 1057–1060. Scholz, F. and Reck, S. (1977), “Effects of Acid on Forest Trees as Measured by Titration in vitro Inheritance in Buffering Capacity in Picea abies”, Water Air Soil Pollution, Vol. 8, pp. 41–45.

National Seminar on Management of Natural Resources for Sustainable Development: Challenges and Opportunities
184
Sen, D.N. and Bhandari, M.C. (1978), “Ecological and Water Relation to Two Citrullus spp.”, In: Althawadi, A.M. (Ed.). Indian Arid Zone. Environ Physiol Ecol Plants., pp. 203–228. Seyyednejad, S.M., Niknejad, M. and Koochak, H. (2011), “A Review of some Different Effects of Air Pollution on Plants”, Research Journal of Environmental Sciences, Vol. 5(4), pp. 302–309. Singh and Verma (2007), “Phytoremediation of Air Pollutants: A Review”, In: Environmental Bioremediation Technology, Singh, S.N. and Tripathi, R.D. (Eds.), Springer, Berlin Heidelberg, Vol. 1, pp. 293–314. Singh, S.K. and Rao, D.N. (1983), “Evaluation of the Plants for their Tolerance to Air Pollution”, Proc. Symp on Air Pollution Control Held, at IIT, Delhi, pp. 218–224. Subrahmanyam, G.V., Rao, D.N., Varshney, C.K. and Biswas, D.K. (Ed) (1985), Air Pollution and Plants: A State of the Art Report, Ministry of Environment and Forests, pp 146–171. Swami, A., Bhatt, D. and Joshi P.C. (2004), “Effect of Automobile Pollution on Sal (Shorea Robusta) and Rohini (Mallotus Phillipensis) at Asarori Dehradun”, Himalayan Journal of Environment Zoology, Vol. 8(1), pp. 57–61. Tripathi, A., Tiwari, P.B. and Singh, M. (2009), “Assessment of Air Pollution Tolerance Index of Some Trees in Moradabad City, India”, J. Environ. Biol., Vol. 30(4), pp. 545–550. Tripathi, A.K. and Gautam, M. (2007), “Biochemical Parameters of Plants as Indicators of Air Pollution”, J. Environ. Biol., Vol. 28(1), pp. 127–132. Woo, S.Y. and Je., S.M. (2006), “Photosynthetic Rates and Antioxidant Enzyme Activity of Platanus Occidentalis Growing under Two Levels of air Pollution Along the Streets of Seoul”, J. Plant Biol., Vol. 49, pp. 315–319.

185
26 Morphometric Analysis and Land Use Mapping of Sathaiyar River Basin in Sirumalai Hill Dindigul District, using Remote Sensing and GIS
Mayavan N. and Sundaram A.
Department of Future Studies, School of Energy, Environment and Natural Resources,
Madurai Kamaraj University, Madurai E-mail: [email protected]
1. Introduction Drainage basin should be the study area for the better understanding of hydrologic system. About 70% of the population in India is dependent on agriculture, directly or indirectly. Drainage basin may be defined as the area which contributes water to particular channel or set of channels. Morphometric is defined as the measurement of the shape. The arrangement of streams and density and shape of the drainage basin are considered under morphometry. Land use mean a man made activity for the land. Land is very important natural resources because it provides all sorts of food to human beings. Now-a-days, population has increased, so men have been converting natural land to land use areas. In India, we have different land use classes; they use nine classifications. USGS and NRSA have their own classification methods where different hierarchical levels are consider. The present study area, Sathaiyar river basin, is a part of Western Ghats. Since the study area is hilly terrain, only level II classification has been used. Hence, this paper tries to bring out the characteristics and relationship among these two dimensions. Remote sensing and GIS and GPS have effective tools to overcome most of the problems of land water resources planning and management, the account of conventional methods of data process. The main objective of this study, using remote sensing and GIS is to compute basin morphometric characteristics for various parameters. 2. Physiography of the Study Area The investigated area is enclosed between latitudes 10o07’N–10o18’ N longitude and 77o55’ E-78o12’ E longitude, covering an area of 125 sq. km falling in Survey of India (SOI) toposheet 1:50000 scale, geologically the area under study is occupied by charnokite rock. The area is well represented by the structural hills and alluvial plains forming soil cover of silt clay, loamy and alluvium. Sathaiyar is one of the major rivers in Sirumalai Hill Which is about 1400 m above the mean sea level and has a total area of 288 sq. km and there are 312 streams. The slope of the area is >45 o. Nearly 50% of the area is covered by the dense forest. Therefore, it is very clear that only small pockets of settlements are there.

National Seminar on Management of Natural Resources for Sustainable Development: Challenges and Opportunities
186
3. Materials and Methods
3.1 Objectives The main objectives of the study are: • To study the morphometric characteristics of the basin. • To assess the land use in the Sathaiyar watershed. • To identify the distribution of land use and which is the most predominant in the watershed. • To identify the inter-relationship among the morphometry and land use.
3.2 Database For the present study, the following database and techniques are used: • Survey of India Toposheets on 1:50000 scale. • LISS IV image. • Ground truth verification. • Relevant literatures.

Morphometric Analysis and Land Use Mapping of Sathaiyar River Basin in Sirumalai Hill Dindigul District
187
3.3 Software Used
• Arc GIS 9.3. • ERDAS Imagine 8.5.
4. Results and Discussion
4.1 Morphmetric Characteristics of the Basin The characteristic of the basin is drainage texture, frequency and pattern. These are important for drainage analysis. The entire networks are having very small drainage channels. Morphometric analysis is computed for various parameters such as perimeter, area of the basin, stream order, bifurcation ratio and stream frequency. 5. Drainage Pattern The drainage pattern is differing from hilly terrain to plain areas. The present study area has Dendritic drainage pattern system. The sub-watershed of the Sathaiyar basin has flow of water only during the monsoon season. The perimeter of the sathaiyar basin is 33.07sq. km. 6. Stream Order In the drainage basin analysis, the first step is to determine the stream orders. In the present study the channel segment of the drainage basin was ranked according to Strahler’s stream ordering system. According to Strahler (1964), the smallest fingertip tributaries are designated as order 1 where two first order channels join to form the order 2; where two second order channels join, the third order channels are formed; and so forth. The trunk stream through which all discharge of water and sediment passes is therefore the stream segment of highest order of the sixth order

National Seminar on Management of Natural Resources for Sustainable Development: Challenges and Opportunities
188
drainage basin (Figure). The total number of streams is 312 where the first order stream is 321, 2nd order stream is 59, 3rd order stream is 14, 4th order stream is 3, and one is indicating 5th order stream. Table 1: Sathaiyar Basin
S. No. Stream Order Number of Streams Bifurgation Ratio 1 I 321 5.4 2 II 59 4.21 3 III 14 4.66 4 IV 3 3 5 V 1 0 Total 398 3.46 7. Bifurcation Ratio The term ‘bifurcation ratio’ is used to express the ratio of the number of streams in any given order to the number of streams in next higher order (Schumn, 1956). Bifurcation ratio varies from 2.00 in the flat or rolling plain and the range is 3.0 to 5.00 for the basin in which the geologic structures do not distort the drainage pattern (Strahler, 1964). Strahler (1957) demonstrate that bifurcation ratio shows a small range variation for different regions or different environment dominates. The mean bifurcation ratio value is 3.46. 8. Drainage Density Drainage density is an important factor of linear scale landforms elements in stream eroded topography and it was introduced by Hortan (1945). It is the ratio of total channel segment length accumulated for all orders within a basin to the basin area, which is expressed in terms of mi/sq mi or km/sq. km. The drainage density of the study area is 3.29 km/ss.km indicating moderate drainage density. It is suggested that moderate drainage density is governed by the factors such as rock types, run-off intensity, and soil type and infiltration capacity. 9. Texture Ratio Texture ratio is an important factor in the drainage morphometric analysis which is depending on the underlying lithology, infiltration capacity and relief aspect of the terrain. In the present study, the texture ratio of the basin is 12.03 and it is categorized as high in nature. 10. Land Use The knowledge of land use and land cover is important for many planning and management activities as it is considered as an essential element for modeling and understanding the earth feature system. The term ‘land use’ relates to the human activity or economic function associated with a specific piece of land, while the term ‘land cover’ relates to the type of feature present on the surface of the earth (Lillesand and Kiefer, 2000). Classification of land use has been attempted by many agencies. In the USA, a particular system of land use classification is fallowed which identifies hierarchical orders or levels. In India, traditional land use classification has 9 types. After development of Remote Sensing technology, NRSA has come with its own system of land use classification which also has some similarities with the USGS system. In the present study, area is comparatively micro area and based on the existing condition for the following six land use types are considered: 1. Dense forest. 2. Mixed forest. 3. Plantation.

Morphometric Analysis and Land Use Mapping of Sathaiyar River Basin in Sirumalai Hill Dindigul District
189
4. Scrubland. 5. Sand with gravel. 6. Barren land. Table 2: Sathaiyar Basin–Land Use 2006
S. No. Land Use Area (in sq. km) Area (in %)1 Deciduous forest 49 17.25 2 Mixed forest 97 34.15 3 Plantation 11 3.87 4 Scrub land 87 30.63 5 Sand gravel 28 9.85 6 Barren land 12 4.22 Total 284

National Seminar on Management of Natural Resources for Sustainable Development: Challenges and Opportunities
190
11. Deciduous Forest Forest is an important natural resource but recently area under forest is declining both due to human interference and also natural cause like climatic change. In watershed, the origin of the stream is usually found in the reserved forests, or high altitude areas. In southern side it is covered with deciduous forests occupied by 17.25%. Most of the deciduous forests is present in reserve forest area. Mixed forest is present in eastern side and it’s covered by 97sq. km. In this area, manmade activities are very less. 12. Plantation Plantation is an important agriculture as well as economy-based activity. It’s covered in 11 sq. km. In the study area, banana and coffee are major plantations in the watershed. A small amount of jackfruit plantation is also spread over the region. 13. Scrub Land Scrub land is not suitable for cultivation. It is only used for grazing purpose. Scrub land covering the area is 87 sq. km. It is spread in south region of the watershed and some area is spread in northern side. 14. Sand Gravel Sand and gravel deposits are accumulated between the bank of tributaries and the foot hill. Its area extent was 28 sq. km. Barren land is not suitable for plantation. Its extent of barren land is 12 sq. km.

Morphometric Analysis and Land Use Mapping of Sathaiyar River Basin in Sirumalai Hill Dindigul District
191
15. Conclusion To conclude the following are the salient interferences made from the study: • The study area is a fifth order river basin with a moderate drainage texture and moderate drainage density. • Bifurcation ratio for the basin is found to be high in 1st, 3rd and 2nd order streams and the average bifurcation ratio value of the basin is 3.46. • The drainage density is 3.29 km/sq. km2 and this value indicates low drainage frequency of the study area. • More than 50% of the study area is covered with deciduous forest and mixed forest. • Some of them are first order stream, but it has deciduous forest and scrub land. These need to be converted from present land use to fores,t which will reduce the upstream erosion. • Nearby, the higher order streams, i.e. above 4th order, plantation land use is dominant.
References Agarwal, C.S. (1998), “Study of Drainage Pattern through Aerial Data Naugarh Area of Varanasi District, U.P.”, Journal Indian Soc. Remote Sensing, Vol. 26, pp. 169–175. ArcGIS (2004), GIS Software, Version 9.0, Environmental Systems Reserch Institute (ESRI), New York. Biswas, S., Sudhakar, S. and Desai, V.R. (1999), “Prioritization of Subwatersheds Based on Morphometric Analysis of Drainage Basin Remote Sensing and GIS Approach”, Journal Indian Soc. Remote Sensing, Vol. 27, pp. 155–166. Chinnamani, S. and Sakthivadivel, R. (1981), An Integrated Study of Hydrology of the Bhavani Basin–Part I, Natural Resources, Centre for Water Resources, Anna University, Madras, p. 150. Horton, R.E. (1945), “Erosional Development of Streams and Their Drainage Basins: A Hydro Physical Approach to Quantitative Morphology”, Bulletin of Geological Society of America, Vol. 56, pp. 276–370. Rao, Nageswara K. (2010), “Morphometric Analysis of Gostani River Basin in Andhra Pradesh State, India Using Spatial Information Technology”, Journal of Geomatics and Geosciences, Vol. 1, p. 2. Schumn, S.A. (1956), “Evaluation of Drainage Systems and Slopes in Badlands at Perth Amboys New Jersy”, Bulletin of Geological Society of America, Vol. 67, pp. 597–646. Strahler, A.N. (1957), “Quantitative Analysis of Watershed Geomorphology”, Transactions American Geophysical Union, Vol. 38, pp. 913–920. Strahler, A.N. (1964), Quantitative Geomorphology of Drainage Basins and Channel Networks in Handbook of Applied Hydrology, McGraw Hill Book Company, New York, Section 4II. Strahler, A.N. and Strahler, A.H., A Text Book of Physical Geography, John Wiley & Sons, New York.

192
27 Wetland Resources of Northeast India: A Case Study of the Loktak Lake, Manipur, India
Mayanglambam Muni Singh and Prabhat Kumar Rai Department of Environmental Science, Mizoram University, Aizawl, Mizoram, India
1. Introduction Fresh water resouces are extremely relevant for the sustainable development of people in present Anthopocene era. Wetland resouces of a region are inextricably linked with the sustainable development of the particular region. The total wetland area is estimated to be around 8,558,000 sq. km. which is about 6.4% of the total area of the earth. India has 2167 recorded natural wetlands, covering an area of 1.5 million hectares. Further, there are 65,254 artificial wetlands, spread over an area of 0.25 million hactares (Kumar, 1999). Now-a-days, wetlands are fast declining and rapidly deteriorating ecosystems in the world. People around the world will have to make concerted effort for the abatement towards degradation of the lakes. Fresh water habitats are of much importance to mankind but they occupy a relatively small portion of the earth’s surface as compared to the marine and terrestrial habitats (Santra, 2001). The Ramsar Conference of 1971 adopted a convention on wetlands and made recommendations for the conservation of wetlands including Loktak Lake, Manipur (Kumar and Bohra, 2005). The last few decades act have been very critical in the degradation of Loktak Lake, due to the agricultural activities expansion. The rivers which drain directly in the lake bring a heavy load of agricultural chemicals, as well as domestic waste, from different sources of the Imphal city into the lake water, and contribute significantly to water quality deterioration of the lake and if it is not taken into consideration, then it may result in eutrophication of the lake. As a result, there is an enormous increase in the unwanted plants production leading to the increase of ‘Phoomdi’. The lake is also gradually silting and the pollution of its water is increasing day-by-day due to those activities which lead to shrinkage of the lake (Roy, 1992). A vast array of research works have been done on physico-chemical characteristics of water (Rajesh et al., 2002, Jayaraman et al., 2003, Sharma and Gupta, 2004; Rajasekar et al., 2005; Sridhar et al., 2006; Anilakurmary et al., 2007; Prabu et al., 2008; Raja et al., 2008; Pradhan et al., 2009; Srivastava et al., 2009; Damotharan et al., 2010; Prasanna and Ranjan, 2010). Seasonal investigations of the physico-chemical parameters and phytoplankton were performed in order to examine the ecological condition of lake ecosystems and the quality of water used for drinking in Lake Celije, Serbia (Andjelkovic et al., 2010). Physicochemical and vegetation structure of the 16 lakes in Drawienski National Park (DNP) have been investigated (Piotrowicz et al., 2006). Water quality investigation and phytoplankton survey of Loweswater, Cumbria was also performed (Bennion et al., 2000). Periodic investigations of freshwater bodies were carried out by various workers to determine the water quality status of the water body in the regulated water bodies of Egypt (Ali et al., 1995), in freshwater lakes of Chennai city (Chennakrishnan et al., 2008), in Oksoipat lake, Manipur (Devi, 2008), in Awangsoipat lake, Manipur (Geetabali and Sharma, 2008), in Kharungpat Lake, Manipur (Singh et al., 2010), in Devarajan lake, Tamil Nadu (Jayakumar et al., 2009), in Sharanabasaveshwara lake, Karnataka (Rajashekar and Vijaykumar, 2009) and in Budha Pushkar lake, Rajasthan (Sharma et al., 2009).

Wetland Resources of Northeast India: A Case Study of the Loktak Lake, Manipur, India
193
Present study has been undertaken to study the deteriorating water quality status of the lake that affects the life around and environment of the lake with its content. From the study, future effect of water pollution can be controlled by taking up various measures for its abatement and sustainable development. It will also make an important contribution to the biodiversity conservation of the lake. 2. Materials and Method
2.1 Study Site The research work was done in Loktak Lake, which is located at Bishnupur district of Manipur and is the largest natural freshwater lake in north-east India. Its size is approximately 26,600 hactares. The lake is rich in biodiversity and considered to be the lifeline of Manipur valley and has been recognized as a Wetland of International Importance (Ramsar site no. 463, declared on 23th March, 1990) which was added in the Montreux Record on the 16 June 1993. The Loktak lake lies between the latitude of 24°25’–24°42’N and longitude of 93°46’–93°55’E.
Fig. 1: Map Showing the Study Site
2.2 Sampling A total of four sampling sites i.e Site I (Loktak Nambul vicinity), Site II (Loktak Nambol vicinity), Site III (Loktak Yangoi vicinity) and Site IV (Loktak proper) were selected (in triplicates) for analysis of various physico-chemical characteristics of the water. Water sampling was performed in rainy season (August and September, 2013). Samplings were done in the morning at between 6:30 to 9:30 and the samples were immediately transported to the laboratory and determined there. Wide mouth bottles were used to collect samples for the analysis. Tag/labels for each batch and samples were given for easy identification. The analysis of water carried out by using ‘Standards Methods’ (APHA, 2005). Eight water quality parameters, i.e., temperature, pH, dissolved oxygen, biological oxygen demand, acidity, alkalinity, chloride and hardness were studied. The temperature was measured by digital thermometer and is expressed in degree celsius, pH value was determined by Hanna digital pH-metre, Dissolved Oxygen and Biological Oxygen Demand (BOD) by Winkler Titrimetric method, Alkalinity by using Potentiometric titration method, Chloride content was measured by using Mohr’s argentiometric method and Total Hardness by using EDTA titration method.
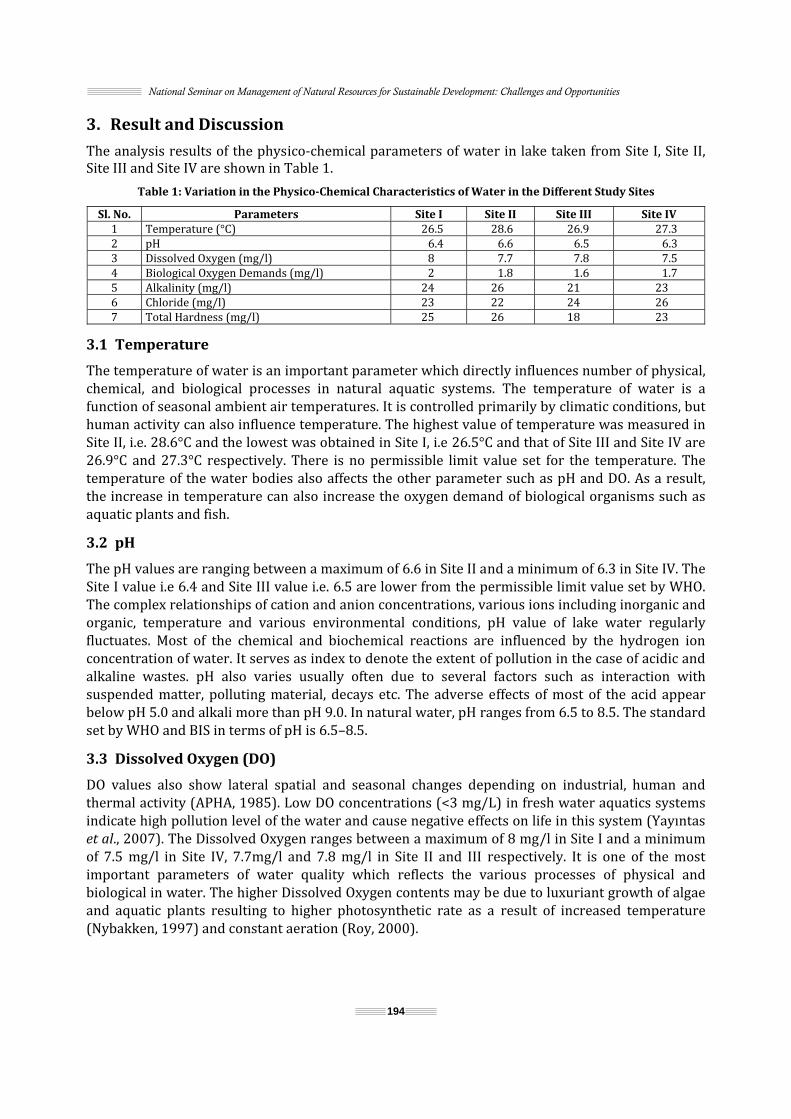
National Seminar on Management of Natural Resources for Sustainable Development: Challenges and Opportunities
194
3. Result and Discussion The analysis results of the physico-chemical parameters of water in lake taken from Site I, Site II, Site III and Site IV are shown in Table 1. Table 1: Variation in the Physico-Chemical Characteristics of Water in the Different Study Sites
Sl. No. Parameters Site I Site II Site III Site IV1 Temperature (°C) 26.5 28.6 26.9 27.32 pH 6.4 6.6 6.5 6.33 Dissolved Oxygen (mg/l) 8 7.7 7.8 7.54 Biological Oxygen Demands (mg/l) 2 1.8 1.6 1.75 Alkalinity (mg/l) 24 26 21 236 Chloride (mg/l) 23 22 24 267 Total Hardness (mg/l) 25 26 18 233.1 Temperature The temperature of water is an important parameter which directly influences number of physical, chemical, and biological processes in natural aquatic systems. The temperature of water is a function of seasonal ambient air temperatures. It is controlled primarily by climatic conditions, but human activity can also influence temperature. The highest value of temperature was measured in Site II, i.e. 28.6°C and the lowest was obtained in Site I, i.e 26.5°C and that of Site III and Site IV are 26.9°C and 27.3°C respectively. There is no permissible limit value set for the temperature. The temperature of the water bodies also affects the other parameter such as pH and DO. As a result, the increase in temperature can also increase the oxygen demand of biological organisms such as aquatic plants and fish. 3.2 pH The pH values are ranging between a maximum of 6.6 in Site II and a minimum of 6.3 in Site IV. The Site I value i.e 6.4 and Site III value i.e. 6.5 are lower from the permissible limit value set by WHO. The complex relationships of cation and anion concentrations, various ions including inorganic and organic, temperature and various environmental conditions, pH value of lake water regularly fluctuates. Most of the chemical and biochemical reactions are influenced by the hydrogen ion concentration of water. It serves as index to denote the extent of pollution in the case of acidic and alkaline wastes. pH also varies usually often due to several factors such as interaction with suspended matter, polluting material, decays etc. The adverse effects of most of the acid appear below pH 5.0 and alkali more than pH 9.0. In natural water, pH ranges from 6.5 to 8.5. The standard set by WHO and BIS in terms of pH is 6.5–8.5. 3.3 Dissolved Oxygen (DO) DO values also show lateral spatial and seasonal changes depending on industrial, human and thermal activity (APHA, 1985). Low DO concentrations (<3 mg/L) in fresh water aquatics systems indicate high pollution level of the water and cause negative effects on life in this system (Yayıntas et al., 2007). The Dissolved Oxygen ranges between a maximum of 8 mg/l in Site I and a minimum of 7.5 mg/l in Site IV, 7.7mg/l and 7.8 mg/l in Site II and III respectively. It is one of the most important parameters of water quality which reflects the various processes of physical and biological in water. The higher Dissolved Oxygen contents may be due to luxuriant growth of algae and aquatic plants resulting to higher photosynthetic rate as a result of increased temperature (Nybakken, 1997) and constant aeration (Roy, 2000).
Wetland Resources of Northeast India: A Case Study of the Loktak Lake, Manipur, India
195
3.4 Biological Oxygen Demand (BOD) BOD is the most important parameter of water quality. The BOD ranges from a maximum of 2 mg/l in Site I and minimum of 1.6 mg/l in Site III, for Site II and Site IV, 1.8 mg/l and 1.7 mg/l respectively. The high BOD of the Site I is due to the polluted NambulRiver and also from the domestic waste from the local areas including the residence in the lake itself.The enormous growth of aquatic plants may leads to high BOD of the site. High value of BOD during rainy season might be due to organic loads along the runoff from the catchment area of the lake (Raiand Raleng, 2011).Permissible limit set by WHO is 6 mg/l 3.5 Alkalinity The acid neutralizing capacity of water is known as alkalinity. The value of alkalinity in the study sites ranges from a maximum of 26 mg/l in Site II and 21 mg/l in Site III. For Site I and Site IV, 24 mg/l and 23 mg/l respectively. Total alkalinity indicates the quantity of base present in water i.e. bicarbonates, carbonates, phosphates, hydroxides, etc.The ranges indicate that the water may present a very few amounts of those compounds. Therefore the sample is within the limits as prescribed by WHO and BIS i.e. 200–600 mg/l and 200 mg/l respectively. Water with low alkalinity having a pH range of 6.3 to 7.3 are low in production and support phytoplankton which have low acid and low alkaline adaptation. 3.6 Chloride Chloride is one of the important water parameters and it is found in nature in the form of salts of sodium, potassium and calcium. The Chloride ranges from a maximum of 26 mg/l in Site IV and a minimum of 22 mg/l in Site II. For Site I and Site III, the value obtained were 23 gm/l and 24 mg/l. The water is under permissible value of WHO and BIS i.e. 200–600 mg/land 250 mg/l respectively. Chlorides in water are the indicators of large amount of non-point source pollution by pesticides, grease, oil, metals and other toxic materials (Khare and Jadhav, 2008). Such type of polluting material may be drained into the lake by the Nambul river passing through many localities of the Imphal city, as it is the only river which passes through the middle of the market area. Most of the market waste dumping is found in this river. 3.7 Total Hardness Total hardness is defined as ‘the sum of Ca2+ and Mg2+ concentrations expressed as calcium carbonate in mgL-1 or ppm.’ Calcium hardness is due to Ca2+ only and magnesium hardness is due to Mg2+ (De, 2003; Chhatwal et al., 2003). Total hardness ranges in between a maximum of 26 mg/l in Site II, 25mg/l in Site I, 23mg/l in Site IV and a minimum of 18 mg/l in Site III. Calcium and Magnesium are the principal cations causing hardness. However, other cations such as Strontium, Iron and Manganese also contribute to the Hardness. The amount of hardness indicates less concentration, so there may be less presence of calcium and magnesium in the water bodies. The permissible value set by BIS is 200 mg/l. 4. Conclusion From the study, it can be concluded that the water quality parameters of the lake are under the permissible limit set by the WHO. The reason may be due to dilution with rain water as the study was done during the rainy season. Still, the values of the physico-chemical parameters obtained in the present study sites indicate a slightly polluted status of the lake. This is mainly due to increased agricultural activities being carried out by the people living in the vicinity of the lake along with rapid draining of the domestic waste and the rivers containing polluting material attributing to the deterioration of the water quality of this freshwater lake. The further study of the parameters on other seasons may be required to conclude the exact status of the water quality of the lake.

National Seminar on Management of Natural Resources for Sustainable Development: Challenges and Opportunities
196
Acknowledgement The authors would like to thank the Department of Science and Technology (DST), for providing financial assistance in the form of research project (SR/FTP/ES-83/2009). Thanks are also extended to Dr. Umesh Sharma for his useful cooperation in this work. References Ali, M.M., Hamad, A.M., Springuel, I.V. and Murphy, K.J. (1995), “Environmental Factors Affecting Submerged Macrophyte Communities in Regulated Water Bodies in Egypt”, Hydrobiology, Vol. 133(1), pp. 107–128. Andjelkovic, A.M., Nikolic, D. and Andelkovic, M. (2010), “Investigation Ecological Condition and Water Quality of Lake Celije”, Euroinvent, Vol. 1, pp. 88–93. Anilakumary, K.S., Abdul, A.P.K. and Natrajan, P. (2007), “Water Quality of the Adimalathma Estuary Southwest East Coast of India”, Journal of Marine Biological Association of India, Vol. 49, pp. 1–6. APHA (1985), Standard Methods for the Examination of Water and Wastewater, 15th Edition, New York. APHA (2005), Standard Methods for the Examination of Water and Wastewater, 21st Edition as Prescribed by American Public Health Association, American Water Works Association and Water Environment Federation, Washington, D.C. Bennion, H., Appleby, P., Boyle, J., Carvalho, L., Luckes, S. and Henderson, A. (2000), Water Quality Investigation of
Loweswater, Cumbria, Final Report to the Environment Agency, Environmental Change Research Centre, University College London. Chennakrishnan, C., Sptephen, A., Manju, T. and Raveen, R. (2008), “Water Quality Status of Three Vulnerable Freshwater Lakes of Suburban Chennai”, Indian Journal of Environment and Ecoplanning, Vol. 15(3), pp. 591–596. Chhatwal, G.R., Katyal, T., Mohan, K., Mehra, M.C., Satake, M. and Nagahiro, T. (2003), Environmental Water Pollution and its Control, Anmol Publications Pvt. Ltd., New Delhi. Damotharan, P., Permal, N.V. and Perumal, P. (2010), “Seasonal Variation of Physicochemical Characteristics of Point Calimere Coastal Waters (South East Coast of India)”, Middle-East Journal of Scientific Research, Vol. 6(4), pp. 333–339. De, A.K. (2003), Environmental Chemistry, 5th Edition, New Age International Publishers, New Delhi. Devi, S.U. (2008), Ecological Analysis of the Macrophytes in Oksoipatlake (Bishnupur), Manipur, Ph.D Thesis, Manipur University, Manipur. Geetabali, L. and Sharma, B.M. (2008), “Study on the Physico-chemical Characteristic of Water Sampels of AWANGSOIPAT Lake, Bishnupur”, In Frontier Botanist, Special Volume Published by the Botanical Society of Manipur, Imphal, pp. 22–24. Jayakumar, P., Jothivel, N., Thimmappa, A. and Paul, V.I. (2009), “Physicochemical Characterisation of a Lentic Water Body from Tamil Nadu with Special Reference to its Pollution Status”, The Ecoscan, Vol. 3(1&2), pp. 59–64. Jayaraman, P.R., Ganga, D.T. and Vasudevan, N.T. (2003), “Water Quality Studies on Karamana River, Thiruvananthapuram District, South Kerala, India”, Pollution Research, Vol. 22(1), pp. 89–100. Khare, K.C. and Jadhav, M.S. (2008), “Water Quality Assessment of Katraj Lake, Pune (Maharastra, India): A Case Study”, In: Sengupta, M. and Dalwani, R. (ed), The 12th World Lake Conference, pp. 292–299. Kumar, A. and Bohra, C. (2005), “Waning Wetlands: A Need for its Conservation”, In: (ed.) Kumar, Arvind, Ecological Studies New Horizons, Daya Publishing House, Delhi, pp. 1–11. Kumar, A.B. (1999), “Our Vanishing Wetlands”, In: Science Reporter, December, pp. 9–15. Manual of Specifications for Drinking Water, BIS: 10500-1983, New Delhi. Nybakken, J.W. (1997), Marine Biology: An Ecological Approach, Addison-wesley Educational Publishers, New York. Piotrowicz, R., Kraska, M.P., Klimaszyk, S. and Joniak, H.T. (2006), “Vegetation Richness and Nutrient Loads in 16 Lakes of Drawieński National Park (Northern Poland)”, Polish Journal of Environmental Studies, Vol. 15(3), pp. 467–478. Prabu, V.A., Rajkumar, M. and Perumal, P. (2008), “Seasonal Variations in Physic-chemical Characteristics of Pichavaram Mangroves, Southeast Coast of India”, Journal of Environmental Biology, Vol. 29(6), pp. 945–950. Pradhan, U.K., Shirodkar, P.V. and Sahu, B.K. (2009), “Physico-chemical Evaluation of its Seasonal Changes using Chemometric Techniques”, Current Science, Vol. 96(9), pp. 1203–1209. Prasanna, M. and Ranjan, P.C. (2010), “Physico-chemical Properties of Water Collected from Dhamra Estuary”, International Journal of Environmental Science, Vol. 1(3), pp. 334–342. Rai, S.C. and Raleng, A. (2011), “Ecological Studies of Wetland Ecosystem in Manipur Valley from Management Perspectives”, Ecosystems Biodiversity, Ph.D Oscar Grillo (Ed.), ISBN: 978-956-307-417-7. Raja, P., Amarnath, A.M., Elangovan, R. and Palanivel, M. (2008), “Evaluation of Physical and Chemical Parameters of River Kaveri, Tiruchirappalli, Tamil Nadu, India”, Journal of Environmental Biology, Vol. 29(5), pp. 765–768. Rajashekhar, M. and Vijaykumar, K. (2009), “Heavy Metals Concentration and Hydro-chemistry of Freshwater lAke, Gulbarga District, Karnataka, India, The Ecoscan., Vol. 3(1&2), pp. 65–67.

Wetland Resources of Northeast India: A Case Study of the Loktak Lake, Manipur, India
197
Rajesh, K.M., Gowda, G. and Mendon, M.R. (2002), “Primary Productivity of the Brackishwater Impoundments along Nethravathi Estuary, Mangalore in Relation to Some Physico-chemical Parameters”, Fish Technology, Vol. 39, pp. 85–87. Roy, D.R. (1992), “Case Study of Loktak Lake of Manipur”, In: K.J.S. Chatrath (ed), Wetlands of India, Ashish Publishing House, New Delhi, p. 200. Roy, P.N. (2000), “Studies on Hydrological Status of a Stream in Santal Parganus (South Bihar) with Special Reference to Pollution”, Indian journal of Environment and Ecoplanning, Vol. 3(1), pp. 127–135. Santra, S.C. (2001), Environmental Science, New Central Book Agency (P) Ltd. Kolkata. Sharma, K.C., Chauhan, C.S., Charan, P.D. and Mudita, Nag (2009), “Water Quality and Restoration Practices of Lake Budha Pushkar—A Threatened Water Body of Ajmer, Rajasthan”, The Ecoscan., Vol. 3(1&2), pp. 53–58. Sharma, M.R. and Gupta, A.B. (2004), “Seasonal Variation of Physico-Chemical Parameters of Hathli Stream in Outer Himalayas”, Pollution Research, Vol. 23(2), pp. 265–270. Singh K.K., Sharma, B.M. and Usha, Kh. (2010), “Ecology of Kharungpat Lake, Thoubal, Manipur, India: Part-I Water Quality Status”, The Ecosan., Vol. 4(2&3), pp. 241–245. Sridhar, R., Thangaradjou, T., Senthil Kumar, S. and Kannan, L. (2006), “Water Quality and Phytoplankton Characteristics in the Palk Bay, Southeast Coast of India”, Journal of Environmental Biology, Vol. 27, pp. 561–566. Srivastava, N., Harit, G. and Srivastava, R. (2009), “A Study of Physico-chemical Characteristics of Lakes Around Jaipur, India”, Journal of Environmental Biology, Vol. 30(5), pp. 889–894. WHO (2004), Guidelines for Drinking Water Quality, Vol. I, 3rd Edition, Geneva, Switzerland. Yayintas, O.T, Yilmaz, S., Turkoglu, M., Colakoglu, F.A. and Cakir, F. (2007), “Seasonal Variation of some Heavy Metal Pollution with Environmental and Microbiological Parameters in Sub-basin Kocabas Stream (Biga, Canakkale, Turkey) by ICP-AES”, Environmental Monitoring Assessment, Vol. 134, pp. 321–331.

198
28 Status of Western Hoolock Gibbon Hoolock hoolock in Longai Reserve Forest of Southern Assam and Issues Related to its Conservation
Pallab Deb1, Prabhat Kumar Rai1 and P.C. Bhattacharjee2 1Department of Environmental Science, Mizoram University, Aizawl, Mizoram, India
2Department of Zoology, Gauhati University, Assam, India
1. Introduction Wild life reources are extremely precious and inextricable component of biodiversity, particularly in north-east India. The Hoolock gibbon (Hoolock hoolock) also commonly known as ‘White Browed Gibbon’ is the only ape found in the Indian subcontinent. The north-east region supports the entire gibbon population in India. Gibbon, amazingly displays agility in swinging through the trees and make loud calls. Weatern hoolock gibbons are exclusively distributed across the seven north-eastern states of Assam, Arunachal Pradesh, Tripura, Meghalaya, Manipur, Nagaland and Mizoram. Population of gibbon is declining rapidly in its entire distribution range of north-east India as well as its global distribution range (Kumar et al., 2013). The debilitating threats include habitat destruction and fragmentation as a result of agricultural expansion, shifting cultivation, establishment of tea gardens, coffee estates, logging, developmental projects, hunting and poaching for food, traditional medicine, body parts, pet collection and illegal trade (Choudhury, 1990; 1991; 1996; Srivastava, 1999; Ahmed 2001; Malone et al., 2002; Solanki & Chutia, 2004; Das et al., 2006; Walker et al., 2007). Although forest destruction is a global phenomenon, its rate within the distribution range of this species is very high due to rapid population growth. Being a completely forest canopy dependent, frugivorous, brachiator and territorial species, the effects of forest destruction and fragmentation on this species is severe (Das et al., 2003). The population of Hoolock hoolock in the wild has declined by more than 90% over the past three decades due to numerous anthropogenic threats (Walker et al., 2007). In this article, we describe the status and conservation issues of western hoolock gibbon in Longai Reserve Forest of southern Assam. 2. Material and Method
2.1 Study Area Southern Assam, popularly known as ‘Barak Valley’ is consists of three districts (Cachar, Karimganj and Hailakandi). Karimganj District is located in the southern tip of Assam—a state in the north-eastern corner of India. Total area of the district is 1809 sq. km. which comprises of varied geographical features like agricultural plains, shallow wetlands, hilly terrains and forests. Total forest cover in the district is more than 54 thousand hectares i.e. about 30% of the total geographical area is covered by forest. The geographical location of Karimganj district is between longitudes 92015’ and 92035’ East and latitudes 24015’ and 25055 north. The different reserve forests of Karimganj district are: Longai R.F. (15,139 ha), Badshahi Tilla R.F. (7513 ha), Duhalia R.F. (3479 ha), Patheria R.F. (7647 ha), Tilvum R.F. (1849 ha), Shingla R.F. (12,430 ha). The study was conducted in the Longai Reserve Forest to know the population status of Western hoolock gibbon. The selected study area is located in the southern tip of Karimganj district which is bounded on the south by Mizoram and on the west by Tripura.

Status of Western Hoolock Gibbon Hoolock Hoolock in Longai Reserve Forest of Southern Assam and Issues Related
199
2.2 Methods The present population status of Hoolock hoolock was carried out at 11 specific localities in Longai Reserve Forest from June 2012 to October 2012 based on the information gathered from the literature, forest department and local inhabitants. The population was estimated by a modified line transect method (Burnham et al., 1980; NRC, 1981) and direct count method in different forest types. The line transects were laid in a stratified random manner to cover all selected areas in the reserve forest. Two observers walked slowly, covering a distance of between 10 km and 15 km per day between 0600 hrs to 1630 hrs, or until sunset. While sighting the presence of gibbon by direct or indirect methods, such as calls, branch shaking and sounds associated with locomotion and feeding, observers recorded the exact count of each group size, composition, sex and exact location with GPS. During the survey period, evidence of anthropogenic disturbances (threats of Hoolock gibbon) inside the reserve forest was also recorded. Age and sex compositions of Hoolock hoolock were classified into two major age categories, adult and immature; these were further sub-divided into four sub-categories: adult, sub-adult, juvenile and infant, based on morphological differences as described by Gupta et al., (2005). 2.3 Result and Discussion Population survey was mostly conducted in the buffer zone areas of the reserved forest except for a few areas of the core zone. They occur in all the different tree associations and were observed at elevation from 92 ft to 223 ft. The majority of the groups were sighted at an elevation of 196 ft. Eighty-five km of transects were laid and surveyed for the presence of Hoolock hoolock in 11

National Seminar on Management of Natural Resources for Sustainable Development: Challenges and Opportunities
200
localities in Longai Reserve Forest. Out of these, from 5 localities a total of 7 groups were recorded (Table1). A total of 22 individuals were recorded in the 7 groups during population estimation. The group size and composition of the population surveyed in different localities are presented in Table 1. The average group size was estimated to be at 3.1 individuals, ranging from 2 to 4 individuals. The estimated adult sex ratio was 1:1. Table 1: Total Number of Groups and Individuals with Age–Sex Composition Recorded from
Five Surveyed Areas in Longai Reserve Forest
GPS Locations
Adults Immature Total Individuals
Mode of Sighting of Groups Total Group
Average Group Size M F SAD JUV INF Direct
(Visual) Indirect(Song) N24024.887’ E92019.551’ 03 03 - 01 02 09 03 - 03 3.00N24025.326’ E92019.362’ 01 01 - 01 - 03 01 - 01 3.00N24024.994’ E92019.596’ 01 01 - - - 02 - 01 01 2.00N24025.070’ E92019.557’ 01 01 01 - 01 04 01 - 01 4.00N24024.900’ E92019.555’ 01 01 - 01 01 04 01 - 01 4.00Total 07 07 01 03 04 22 06 01 07 3.14 M-Male, F-Female, SAD-Sub-adult, JUV-Juvenile, INF-Infants. The gibbon sightings in Longai Reserve Forest were recorded from 0600 hrs until the end of sunset. The most number of groups were sighted after sunrise between 0600 hrs to 0800 hrs. No gibbon sightings were recorded between 1100 hrs to 1400 hrs. Hoolock gibbons are found in various parts of Barak Valley in Assam (Choudhury, 2004; Duttagupta et al., 2010; Das et al., 2003; Das et al., 2011; Deb et al., 2010–11; Islam et al., 2013). In southern part of Assam, Hoolock gibbon are found in Barail Protected Reserve Forest, North Cachar Hills Reserve Forest, Innerline Reserve Forest, Barail Reserve Forest, Katakhal Reserve Forest, Longai Reserve Forest (Das et al., 2003). The status of Hoolock gibbons in southern part of Assam is not conclusively known. There are only mentions of their presence or absence from reserve forests. There is no quantitative information on the population estimation of Hoolock hoolock based on systematic studies in Longai Reserve Forest. The main anthropogenic activities which caused the threats in the survival of Hoolock gibbon inside the reserved forest area were observed during the survey were deforestation, expansion of agriculture, encroachment, tea gardens, paan jhum, livestock grazing, timber logging and hunting. The economic status of local people affects the gibbon population and its habitat directly and indirectly and this has become a major concern for gibbon conservation. Local people use forest resources and land for extracting fuel-wood, housing materials, medicinal plants, wild vegetables and for agricultural activities. This results in forest fragmentation and degradation in the form of canopy gaps and food paucity in both quantity and quality. This makes Hoolock gibbons particularly vulnerable to hunting and predation. In addition, authorities have no real power to curtail illegal forest use.
3. Conservation The Hoolock gibbon has a broad geographic distribution across tropical and subtropical forest habitat of north-east India. Population of gibbon is declining rapidly in its entire distribution range of north-east India as well as its global distribution range (Kumar et al., 2013). Hoolock gibbons are protected by law in India. But it is unfortunate that their conservation has not been taken up seriously till date. Hoolock hoolock is listed by the IUCN Red List of Threatened Species as ‘Endangered’. The species was listed on Schedule-I, the highest schedule on the Indian Wildlife (Protection) Act in 1972 and also in Appendix-I of CITES. The Western Hoolock Gibbon was

Status of Western Hoolock Gibbon Hoolock Hoolock in Longai Reserve Forest of Southern Assam and Issues Related
201
designated as one of the top threatened gibbon taxa of the world in a resolution taken in the gibbon symposium of the congress of the International Primatological Society at Beijing in 2002. Western hoolock gibbon is also included in the list of 25 most endangered primate species of world (Walker et al., 2009). There are various conservation efforts for hoolock gibbon but the species is still not out of danger. Large-scale habitat destruction continues throughout the entire distribution range of the species in India. The government of India has yet to consider seriously the conservation issues affecting the hoolock gibbon and other primate species. Even today, India does not have a national-level agenda for the country’s only ape species (Chetry & Chetry, 2011). For conservation of Hoolock gibbon in the wild needs a detailed strategy action plan for future conservations. Das et al., (2011) already identified ten priority conservation areas or forest complexes which have the greatest potential for long term conservation of western Hoolock gibbon in Assam. Similar identification of priority forest complexes is required in other north-eastern states. All the states of north-east India have a huge conservation scope but despite of having conservation scope Hoolock gibbon is facing enormous anthropogenic pressure ranging from habitat loss, encroachment, fragmentation and hunting throughout the entire distribution range making the species extremely vulnerable. 4. Conclusion The interdependence of hoolock gibbon and the local people on common forest resources for their basic requirements is the main cause for concern in Longai Reserve Forest. Also lack of awareness among local communities and lack of confidence towards forest department are big challenges. For conservation of this species, the government should start a Hoolock Gibbon Project throughout the entire distribution range of the species to determine the present distribution, population status and evaluate different kinds of threats. It will give a baseline information to formulate area specific action plan. We need to provide alternative livelihood to the people settling in and around the Protected Areas, Reserve Forest, Protected Forest etc. Community Education Programme for local people and encourage the local community to participate in the management process. We hope that Hoolock gibbon shall continue their loud songs in the jungle of north-east India in the coming years without any disturbances. Acknowledgement We would like to thank University Grants Commission (UGC) for supporting our work. We dedicate this study to all the primatologists for providing valuable literatures on Western hoolock gibbon. References Ahmed, A. (2001), “Illegal Trade and Utilization of Primates in India”, In: Gupta, A.K. (ed.) Non-human Primates of India,
ENVIS Bulletin: Wildlife and Protected Area, Vol. 1(1), pp. 177–184. Burnham, K.P., Anderson, D.R. and Laake, J.L. (1980), “Estimate of Density from Line Transect Sampling of Biological Populations”, Wildlife Monograph, Vol. 72, The Wildlife Society, Washington D.C. Chetry, D. and Chetry, R. (2011), “Hoolock Gibbon Conservation in India”, May 2011, Gibbon Journal Nr., Vol. 6, pp. 7–12. Choudhury, A.U. (1990), “Population Dynamics of Hoolock Gibbons (Hylobates Hoolock) in Assam, India”, American Journal of Primatology, Vol. 20, pp. 37–41. Choudhury, A.U. (1991), “Ecology of the Hoolock Gibbon (Hylobates Hoolock) a Lesser Ape in the Tropical Forests of Northeastern India”, Journal of Tropical Ecology, Vol. 7, pp. 147–153. Choudhury, A.U. (1996), “A Survey of Hoolock Gibbon (Hylobates Hoolock) in Southern Assam, India”, Primate Report, Vol. 44, pp. 77–85. Choudhury, A.U. (2004), “Vanishing Habitat Threatens Phayre’s Leaf Monkey”, The Rhino Foundation, NE India Newsletter, Vol. 6, pp. 32–33. Das, J., Biswas, J. Bhattacharjee, P.C. and Mohnot, S.M. (2006), “First Distribution Records of the Eastern Hoolock Gibbon (Hoolock Hoolock Leuconedys) from India, Zoos’ Print Journal, Vol. 21(7), pp. 2316–2320. Das, J., Biswas, J. Das, N. Molur, S. and Bagley, F. (2011), “Strategic Plan for Western Hoolock Gibbon Conservation in Assam, India”, Gibbon Journal, Gibbon Conservation Alliance, Zurich, Switzerland, Vol. 6, pp. 30–33.

National Seminar on Management of Natural Resources for Sustainable Development: Challenges and Opportunities
202
Das, J., Feeroz, M.M. Islam, M.A. Biswas, J. Bujarborua, P. Chetry, D. Medhi, R. and Bose, J. (2003), “Distribution of Hoolock Gibbon (Bunopithecus Hoolock) in India and Bangladesh”, Zoos’ Print Journal, Vol. 18(1), pp. 969–976. Dattagupta, S., Gupta, A. and Ghose, M. (2010), “Non-Timber Forest Products of the Inner Line Reserve Forest, Cachar, Assam, India: Dependency and Usage Pattern of Forest-dwellers”, Assam University Journal of Science & Technology: Biological and Environmental Sciences, Vol. 6, No. 1, pp. 21–27. Deb, M., Roychoudhury, S. and Bhattacharjee, P.C. (2010–11), “Hoolock Gibbon: An Endangered Ape of Northeast India and its Conservation”, Biotech, An Annual Journal of Dept. of Biotechnology, Vol. 3(1), pp. 21–25. Gupta, A.K., Sharma, N. Dasgupta, S. Chakrabarty, D. and Hazarika, R. (2005), “Conservation of Hoolock Gibbon (Bunopithecus Hoolock) in Northeast India”, ENVIS: Wildlife and Protected Areas, Vol. 8, pp. 1–26. Islam, M., Choudhury, P. and Bhattacharjee, P.C. (2013), “Preliminary Study on Population Status and Activity Budgeting of Western Hoolock Gibbon (Hoolock Hoolock) in the Inner-Line Reserved Forest of Barak Valley, Assam, India”, International Journal of Scientific and Research Publications, Vol. 3(3). Kumar, A., Devi, A. Gupta, A.K. and Sarma, K. (2013), “Population, Behavioural Ecology and Conservation of Hoolock Gibbon in Northeast India”, Rare Animals of India, pp. 242–266. Malone, N., Purnama, A.R., Wedana, M. and Fuentes, A. (2002), “Assessment of the Sale of Primate at Indonesian Bird Markets”, Asian Primate, Vol. 8(1–2), pp. 7–11. Mittermeier, R.A., Ratsimbazafy, J., Rylands, A.B., Williamson, L., Oates, J.F., Mbora, D., Ganzhorn, J.U., Rodriguez-Luna, E., Palacios, E., Heymann, E.W., Kierulff, M.C.M., Yongcheng, L., Supriatna, J., Roos, C., Walker, S. and Aguiar, J.M., “In: Primates in Peril: The World’s 25 Most Endangered Primates 2006–2008”, Primate Conservation, Vol. 22, pp. 1–40. NRC (1981), Techniques for the Study of Primate Population Ecology, (National Research Council, National Academy Press, Washington, D.C., p. 227. Solanki, G.S. and Chutia, P. (2004), “Ethno Zoological and Socio-cultural aspects of Monpas of Arunachal Pradesh”, Journal of Human Ecology, Vol. 15(4), pp. 251–254. Srivastava, A. (1999), Primates of Northeast India, Megadiversity Press, Bikaner, p. 207. Walker, S., Molur, S. and Brockelman, W.Y. (2007), Western Hoolock Gibbon, Hoolock hoolock (Harlan, 1831). p. 18. Walker, S., Molur, S., Brockelman, W.Y. Das, J. Islam, A. Geissmann, T. and Peng-Fei, F. (2009), “Western Hoolock Gibbon Hoolock Hoolock (Harlan, 1831)”, In: Mittermeier RA et al., Eds. Primates in Peril: The World’s 25 Most Endangered Primates 2008–2010, IUCN/SSC Primate Specialist Group (PSG), International Primatological Society (IPS) and Conservation International (CI), Arlington, VA, pp. 62–64.

203
29 Forest Dependent Livelihood in Relation to Socio-Economic Status of the Khasi Tribe of Meghalaya: A Case Study of Three Villages
V.P. Khanduri1, Dafiralin Lyngdoh2 and K.S. Kumar2
1Uttarakhand University of Horticulture and Forestry, Ranichauri, Tehri Garhwal, Uttarakhand, India
2Department of Forestry, Mizoram University, Aizawl, India E-mail: [email protected]
1. Introduction Meghalaya, the hilly state in the north-eastern region, located between 25o02’ to 26o06’ north-latitude and 89o48’ to 92o50’ east longitudes. North-eastern hill people are blessed with rich natural resources and high level of traditional knowledge. The tribal communities who lived in and around the close proximity of tropical forest have developed locality specific indigenous livelihood strategies based on their ethnic knowledge. Traditional livelihood pattern evolved and change with time. During the last century, human induced key driving forces such as land use land cover change, market led process, global warming, change in soil biogeochemistry, forest degradation, loss of biodiversity (Vitousek, 1994), which in-turn, changed the livelihood pattern and influenced its direction of evolution, particularly in tropical mountainous region and forest-dwelling communities. Forest and tree cover of India is estimated to be 78.2 million ha, representing 23.8% of the geographical area of the country (ISFR, 2011). The level of growing stock in India’s forest for 2011 is around 58.46 m3 per ha of forest area (ISFR, 2011) is too below than the global average of 130.7 m3/ha (FAO, 2010), which clearly exemplifies degraded condition of Indian forest. Around 40% of the Indian forest are in degraded and understocked state (Aggarwal et al., 2009). Several factors are attributed to tropical forest loss and degradation, such as increase in human population that is critically dependent on forest for their livelihood (FSI, 2011; Davidar et al., 2010), expansion of agriculture and shifting cultivation, over-exploitation of forest resources further than its carrying capacity, due demand and supply gap (Aggarwal et al., 2009), forest fires, over-grazing and illegal felling (FSI, 2011). Tropical forest plays a vital role in carbon cycle and supports high species diversity. Disappearance of tropical forest cover negatively impacts the livelihood of dependent people. Forest dwelling and dependent people’s livelihood is highly inseparably associated with forest ecosystem. Forest-dependent community depends on variety of forest resources such as timber, food in the form of edible fruits, roots, tubers, leafy vegetables, mushrooms and wild animals, fodder, fuel wood, bamboos and other important non-timber forest produces which can potentially damage the forest, if harvested and exploited unscientifically (Davidar et al., 2010). Therefore, there is a need of evolving the mechanisms for sustainable livelihood development for village farming and forest dwelling community that requires proper understanding of dependency on natural forest resources, their utilization pattern and efficiencies of each component of this system. Some field-based studies indicate harvest and utilization pattern of forest produces for livelihood generation, which has negatively affected the local forest and forest

National Seminar on Management of Natural Resources for Sustainable Development: Challenges and Opportunities
204
resources (Davidar et al., 2010; Mishra et al., 2008; Arjunan et al., 2005; Sagar and Singh, 2004; Silori and Mishra, 2001). Several workers attempted to study the various components viz., agroecosystem (Reddy, 1981; Pandey and Singh, 1984; Bhullar and Mittal, 1990; Singh et. al., 1997; Maikhuri et. al., 2001; Nautiyal et al., 2003b), forest ecosystem (Martin and Nautiyal, 1993); animal husbandry (Maikhuri 1992, Nautiyal et al., 2003a) or total village ecosystem together (Maikhuri 1996; Maikhuri and Ramakrishnan, 1991; Kumar and Ramakrishnan, 1990). As reported in some of these studies, the rural village ecosystems are undergoing a rapid change due to the changing environmental, socio- cultural-political situations and market driven economic factors. The socio-economic study is important as it is used to aware the community, including residents, policy makers, academicians and local officials to assess the impact and magnitude of current activity and practices that can be utilized for the proposed developmental programme on community’s social and economic status. 2. Methods
2.1 Study Site Description The study was carried out on three villages, viz. Mawkynjoin village, Mawliehbah-Mawnar village and Tiehbah village under West Khasi Hills District of Meghalaya state of India. These villages are about 90 km from Shillong, the state capital and are situated between 1300 and 1400 masl (Table 1). Locations of the villages are shown in Fig. 1. The area, population, density and sex ratio of West Khasi Hills District is presented in Table 2.

Forest Dependent Livelihood in Relation to Socio-Economic Status of the Khasi Tribe of Meghalaya: A Case Study of Three Villages
205
The study conducted in all the aforesaid three villages includes ethnography, socio-economic status and dependency of the villages on the forests for livelihood. Equal representation was given to each village and a total of 60% families were selected and interviewed randomly. A participatory rapid appraisal approach was used to fill up the questionnaires. Structured, semi-structured and pre-tested questionnaires designed by Agricultural Finance Corporation India Ltd. were used. However, slight modification was made on the basis of the information gathered, and discussion with the headman of the particular villages. Questionnaires were designed for canvassing socio-economic features of those villages, since questionnaires are the important source for collecting data and to get the detailed information of the particular villages studied. Household survey was also conducted in those villages because household surveys provide a rich source of information at the household level. The settlements of each of the aforesaid villages were surveyed one-by-one. The settlements with largest population were first attempted. Survey is made which is responsible for data collection, as well as to canvass the ‘Household Schedule’ for capturing ethnography, socio-economic information of each households and the dependency of the villagers on the forest for their livelihood. The survey was done during February and March in the year 2008. The head of each household of selected families was interviewed while filing the questionnaires. The data collected for the study included general information about each household such as literacy level, family size, landholding, number of animals per family, source of income, occupation, sources of energy, extraction of non-timber forest products, etc. After data collection, the studied variables and attributes were analyzed. For knowing the pressure on a particular forest tree species, the preference of the villagers for various purposes, viz. fuel-wood, fodder, agricultural implements, household articles and other uses was asked and 10 points were given for each use. All points were combined to give a final ranking to the species and subsequently the order of preference for all trees was placed in descending manner. Availability of fuel wood resources within the village and distance of forests utilized for collection were annexed while walking through the village and interactions with inhabitants. The per capita fuel wood consumption was calculated as: Quantity consumed daily per household Daily per head consumption of fuel wood = No. of persons in that household
3. Results and Discussion Table 1: Demographic Profile of 3 Khasi Villages of West Khasi Hills District
S. No. Parameters Villages Mawkynjoin
Village Mawliehbah-
Mawnar Village TiehbahVillage 1 Altitude of the villages 1450 1325 14002 No. of households 60 40 333 Total Population 360 265 2544 Average Family Size (persons/ family) 6 6.6 7.75 Male 195 124 1286 Female 165 141 1267 Sex Ratio 846 1137 9848 Literacy LevelBelow 5th Class 40% 44.67% 51.18%Between 5th to 10th Class 35.12% 34% 33.07%Above 10th Class 2.92% 8.12% 1.57%Uneducated 21.95% 13.19% 14.17%
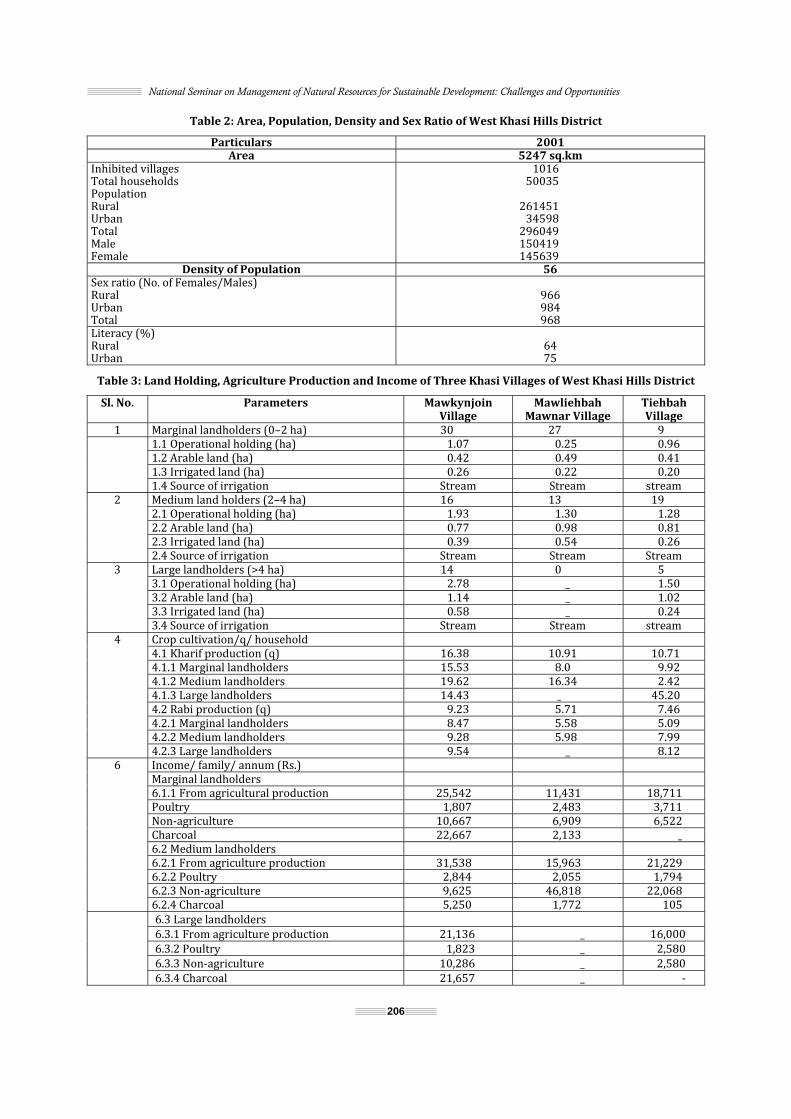
National Seminar on Management of Natural Resources for Sustainable Development: Challenges and Opportunities
206
Table 2: Area, Population, Density and Sex Ratio of West Khasi Hills District
Particulars 2001 Area 5247 sq.km Inhibited villages Total households Population Rural Urban Total Male Female
101650035 261451 34598 296049 150419 145639Density of Population 56Sex ratio (No. of Females/Males) Rural Urban Total 966 984 968 Literacy (%) Rural Urban 64 75
Table 3: Land Holding, Agriculture Production and Income of Three Khasi Villages of West Khasi Hills District
Sl. No. Parameters MawkynjoinVillage
Mawliehbah Mawnar Village
TiehbahVillage 1 Marginal landholders (0–2 ha) 30 27 9 1.1 Operational holding (ha) 1.07 0.25 0.961.2 Arable land (ha) 0.42 0.49 0.411.3 Irrigated land (ha) 0.26 0.22 0.201.4 Source of irrigation Stream Stream stream2 Medium land holders (2–4 ha) 16 13 192.1 Operational holding (ha) 1.93 1.30 1.282.2 Arable land (ha) 0.77 0.98 0.812.3 Irrigated land (ha) 0.39 0.54 0.262.4 Source of irrigation Stream Stream Stream3 Large landholders (>4 ha) 14 0 53.1 Operational holding (ha) 2.78 _ 1.503.2 Arable land (ha) 1.14 _ 1.023.3 Irrigated land (ha) 0.58 _ 0.243.4 Source of irrigation Stream Stream stream4 Crop cultivation/q/ household 4.1 Kharif production (q) 16.38 10.91 10.714.1.1 Marginal landholders 15.53 8.0 9.924.1.2 Medium landholders 19.62 16.34 2.424.1.3 Large landholders 14.43 _ 45.204.2 Rabi production (q) 9.23 5.71 7.464.2.1 Marginal landholders 8.47 5.58 5.094.2.2 Medium landholders 9.28 5.98 7.994.2.3 Large landholders 9.54 _ 8.126 Income/ family/ annum (Rs.) Marginal landholders 6.1.1 From agricultural production 25,542 11,431 18,711Poultry 1,807 2,483 3,711Non-agriculture 10,667 6,909 6,522Charcoal 22,667 2,133 _6.2 Medium landholders 6.2.1 From agriculture production 31,538 15,963 21,2296.2.2 Poultry 2,844 2,055 1,7946.2.3 Non-agriculture 9,625 46,818 22,0686.2.4 Charcoal 5,250 1,772 105 6.3 Large landholders 6.3.1 From agriculture production 21,136 _ 16,0006.3.2 Poultry 1,823 _ 2,5806.3.3 Non-agriculture 10,286 _ 2,5806.3.4 Charcoal 21,657 _ -

Forest Dependent Livelihood in Relation to Socio-Economic Status of the Khasi Tribe of Meghalaya: A Case Study of Three Villages
207
Table 4: Livestock Population of Three Khasi Villages of West Khasi Hills District
S. No. Parameters Mawkynjoin Village
Mawliehbah-Mawnar Village
Tiehbah Village 1 Total livestock population 1068 875 5342 Average No. of Animals/ Household 17.8 22.9 16.153 Total livestock attributes of the villagesCows 88 123 90Pigs 10 37 43Poultry 958 696 382Goats/ Sheep 4 19 17Buffaloes 4 - 2Horses 4 - -
Table 5: Energy Consumption Patterns of Three Khasi Villages
S. No. Parameters Mawkynjoin Village
Mawliehbah-Mawnar Village
Tiehbah Village1 Fuel wood consumed kg/head/day Summer 2.7 2.4 3.8Winter 2.8 2.6 4.02 Fuel wood consumed/ household/ day (kg) Summer 18.6 19.08 29.39Winter 19.06 20.48 30.963 Fuel wood consumed/ household/ month (kg) Summer 558 572.4 881.7Winter 572 614.4 928.84 Fuel wood consumed/ household/ annum (quintals: q) Summer 66.96 68.68 105.80Winter 68.64 73.72 111.455 Fuel wood consumed/ village/ day (kg) Summer 1116 763.2 969.9Winter 1144 819.2 1021.76 Fuel wood consumed/ village/ month(Qt) Summer 334.8 228.9 290.9Winter 343.2 245.7 306.57 Kerosene consumed/ household/ month(L) 5.82 3.92 4.388 Kerosene consumed/ household/ annum(L) 69.84 47.04 52.569 Distance travelled for fuel-wood collection (km) 3 2 2 10 Time to reach and return from fuelwood source (hrs) One hour Half hour Half hourTable 6: Reported Fuel-wood Consumption Patterns for Different Locations
S. No. Location Per Capita Consumption (Kg/Day/Capita)
Source 1 Garhwal Himalaya 0.63–1.38 Bijalwan, 2007 2 West Himalayan region 1.26–1.95 Mishra et al., 19883 West Himalayan region 2.77–3.36 I.C.F.R.E., 2000 4 West Himalayan region 1.54–1.66 Khanduri et al., 20025 West Himalayan region 1.9–3.6 Moench, 1989 6 Nanda Devi Biosphere Reserve, Western Himalaya 3.43–4.59 Silori, 2004 7 Garhwal Himalaya 0.76–1.21 Saksena et al., 19958 North-east Himalaya (Arunachal Pradesh) 3.1–10.4 Maikhuri, 1991 9 North-east Himalaya (Meghalaya) 3.90–5.81 Bhatt and Sachan, 200410 North-east Himalaya (Meghalaya) 2.4–4.0 Present study

National Seminar on Management of Natural Resources for Sustainable Development: Challenges and Opportunities
208
Table 7: Forest Cover and Dependence on Firewood
Name of the State Percentage of Households using Firewood for Cooking1
Percentage of Total Geographical Area of the State
Under Forest Cover2 Chhattisgarh 80.8 41.8 Tripura 80.5 76.07 Meghalaya 79 77.02 Nagaland 77.9 80.33 Assam 72.1 35.28 Arunachal Pradesh 68.7 80.50 Madhya Pradesh 66.4 25.21 Manipur 65.7 76.54 Sources: 1Census of India 2011; 2India State of Forest Report 2011
Table 8: Ranking of Forest Tree Species on the Basis of Preference for Various Uses by the Villagers and their Utility Values in Three Villages of West Khasi Hills District
S. No. Botanical names Local Name Family Utility Values Ranking1 Schima wallichi Dieng ngan Theaceae FW, Ch, HA, AI, BL,T 12 Pinus kesiya Dieng kseh Pinaceae FW, AI, T, HA, BL 23 Quercus griffithii Dieng sning Fagaceae F,FW, AI, T, Ch 34 Betula cylindrostachys Dieng ling Betulaceae F, FW, AI, T, Ch 45 Taxus baccata Dieng blei Taxaceae FW, T, AI 56 Salix psilostigma Dieng wah Salicaceae FW, T, AI, Ch 67 Myrica esculenta Soh phi Myricaceae F, FW, Fr 78 M. nagi Soh liia Myricaceae F, FW, Fr 79 Castonopsis kurzii Sohot Fagaceae FW, F, Ch, Fr 710 Pyrus pashia Sohjhur Rosaceae F, FW, Fr 7Abbreviations F = Fodder FW = Fuel wood AI = Agriculture implements HA = Household Articles T = Timber Ch = Charcoal BL = Bedding Material for livestock Fr = Fruits Ranking is based on the combined points given for availability and various uses of the trees viz., fuel wood, fodder, agricultural implements, household articles and miscellaneous.
4. Ethnographic Observations Khasi hills of Meghalaya were mostly inhabited by khasi tribes. Khasi tribe has matrilineal social organization i.e. they trace their lineage from women. They generally speak Monkhmer and are localized in the hills of East and West Khasi Hill districts and Jantia Hill district. The Khasi tribe is an assemblage of Jaintia, Pnar, Lyngam, Bhoi, War and Khyrium territorial groups of sub-tribe. Ka ktien Sohra (Sohra is the khasi name of Cherrapunjee) is the customary dialect has their origin from Cherrapunjee dialect. Main staple food of Khasi people is rice in boiled form taken with vegetables, fish, meat, pork, beef and eggs. Other subsidiary staple foods are maize, millets, yam and tapioca. Khasi love to chew areca nut with betel leaves. Khasi people do not plough the land during agricultural activity,
Forest Dependent Livelihood in Relation to Socio-Economic Status of the Khasi Tribe of Meghalaya: A Case Study of Three Villages
209
mainstay agricultural system is slash and burn agriculture locally known as repshyrti in Khasi. Khasi people traditionally manage the soil during cultivation, which helps in soil fertility management. Apart from jhum cultivation they practice wet land rice cultivation locally called as pynthor or hali, high grass land (ka rilum or phlang) and traditional homestead garden which play vital role in food security. 5. Socio-Economic Observations Rural village economy of Khasi tribe is intrinsically associated with the forest ecosystem. Rural communities depend on forest resources for subsistence to cash income generation. Subsistence level livelihood dependencies on forest such as fruits and wild fruits, nuts, tubers,mushrooms, leafy vegetables are of immense values for food and nutritional security during drought and harvest period. Fodder is an important source of animal feeds for cattle, often generated in homestead garden or collected from nearby forest. Therefore, conversion of fodder in animal meat is an important source of proteins in die for rural people. Rural people fetch cash income from marketable forest produce either directly or by processing it such as fuel wood, charcoal wood and its conversion to charcoal, grasses and fodder material. Bamboos, canes, broomstick and timbers derived from forest forms important material for house constructions, fencing materials, raw material for local artisans for traditional crafts such as traditional hats and baskets and furniture. Orchids, cactus, flowers collected and harvested from forest has socio-economic and aesthetic values to communities. Potable water from forests is considered is an important resource from forest by Khasi community. Henceforth, timber and minor forest produce from forest has ecological, socio-cultural and economical values plays a very important role in rural Khasi people life. Apart from the general description of the Khasi Tribes, the demographic profile of the three villages revealed that the Mawkynjoin village is largest in population and has lowest sex ratio as compared to other two villages. The literacy rate of the three villages is varied from 78 to 87% (Table 1). 6. Annual Income It was observed from the study that the annual income of different families varied greatly from family to family. The marginal land holders of the Mawkynjoin village earn their maximum income (42%) from agricultural production, followed by charcoal production (37%), non-agriculture (18%) and from poultry (3%). Almost similar trend is followed by medium and large land holders of this village. The total annual income per family of Mawliehbah-mawnar village in marginal and medium land holders was Rs. 22,956 and Rs. 66608, respectively. But the majority of income comes from agriculture production in marginal land holders, whereas, medium land holders gets maximum income from non-agriculture viz. Business/trade, Government servant/services, priesthood and others, etc., which account 70% of the total income. There is no large land holder on this village. Only marginal land holders engaged on charcoal production, from which they earn only 9% of the total income. The structure of income of the marginal, medium and large land holders of Tiehbah village revealed that agriculture production exhibits major source of income, which account 65%, 38% and 72% of the total income respectively (Table 3). The result revealed that only Mawkynjoin villagers are engaged for the charcoal production for their livelihood support. However, other two villages are not practicing this process for commercial purpose but they produce charcoal for their own energy consumption. The average annual income of Mawkynjoin, Mawliehbah-mawnar and Tiehbah villages is Rs. 16, 4,842/-, Rs 89564/- and Rs. 95300/- per family, respectively. Primary occupation of the villagers is agriculture. Charcoal is another important source of income of Mawkynjoin village as well timber. Labour employment was the second source of income of the villagers; most of the farming houses

National Seminar on Management of Natural Resources for Sustainable Development: Challenges and Opportunities
210
have livestock as third line of production to complement household consumption and income as well. Analyzing the annual incomes from all sources it was observed that wage labour is contributing about 30% in the total annual income of households, followed by income from small business/ trade (20%). Service class household is contributing 22.8%, followed by income for other source (20.2%) that includes professions like driver, tailor, electrician, household women worker, contractor etc. Though number of people practicing agriculture is more than service class but share of contribution in total annual income is very low. 6.1 Livestock and Fodder Consumption Agriculture almost everywhere in the tribal people is by and large based on livestock. The communities in mountains are fully dependent on the natural resources, livestock and traditional agriculture. So, agriculture is a socio-economic symbiosis of crops, livestock, production and man power. In this type of system, beside man, livestock play a crucial role to strengthen the economy and the development. The livestock supplement the income and are considered to constitute capital asset. They also provide wool, meat, milk, skin, etc. and are of immense economic value to the farmers. In addition, livestock provide gainful employment to a large section of population throughout the year. Common livestock domesticated by Khasi people are cattle, buffalo, sheep, goat, pig, horses, ponies and poultry. The most common feature of this livestock system is that they are the component of their way of life and socio-cultural system. The major fodder resources are the crop residues, leaves from trees, ground flora on the forest areas and dried grasses; moreover, forest is the major source of leaf fodder. The total livestock population for the villages is estimated as maximum 1068 for Mawkynjoin, followed by Mawliehbah-mawnar and Tiehbah villages having 875 and 534 populations, respectively. The average number of livestock available per family varies from minimum 16 for Tiehbah to maximum 23 for Mawliehbah-mawnar village (Table 4). Most of the livestock is of local breed. The available livestocks are cows, pigs, goats, sheeps, buffaloes and poultry. Poultry population is higher in all the villages reflecting better economic return from its flesh in the market. As per the live stock census report (2003), the maximum livestock population in west Khasi hills district is poultry, which accounts for 59% of the total livestock population. In the present study, poultry rearing exhibits 80% of the total livestock population, which is higher than the reported value. Most of the livestock are open grazed and only sometimes animal are fed on their shed. Almost all the animals graze on the forest land, which too was causing harm to the ground flora and regeneration of dominant tree species in the area. Uncontrolled grazing and over-stocking of livestock prevent regeneration of the tree cover to some extent (FAO, 1974; Kumar and Shahabuddin, 2005) even though the negative impact of land use in the Himalaya may be overstated (Ives, 2006). But there is no scientific evidence to show that traditional practices of grazing always cause loss to biodiversity and ecosystem functioning (Gabriel et. al., 1998; Ward et. al., 1998, 2000). Quantity of animals varied according to economic and social conditions of the villages. Direct relationship between land, average family size, income, average number of animals per family and fodder consumption was also noticed. 6.2 Pattern of Energy Consumption
6.2.1. Charcoal Making–Means of Livelihood of Khasi People in Meghalaya Forests in Meghalaya are being denuded everyday; charcoal burning has been a source of income and one of the survival strategies adopted by majority of Khasi people of Meghalaya. More than 85% rural population of Meghalaya depends largely on firewood/ charcoal production as the livelihood option as well as source of energy. Yet, the charcoal is sold for meagre amount (Rs.75– Rs. 100 per bag of 35 kg while in Shillong a bag fetches between Rs. 150– Rs. 200). Meghalaya

Forest Dependent Livelihood in Relation to Socio-Economic Status of the Khasi Tribe of Meghalaya: A Case Study of Three Villages
211
consumes an estimated 24,915 tons of charcoal per year, generating around Rs. 90 million/ year as compared to 172 tons of charcoal worth of Rs. 0.6 million 10 years ago. The deforestation of the forest is proceeding at a rate of 19,932 ha/ year. If this alarming trend prevails, in another 45 years, Meghalaya is bound to become a mountain desert (Madhavan, 2005). There is a ban on felling of trees in forests as per the Supreme Court’s judgment on December 12, 1996 and charcoal is considered as a minor forest product. Further, on 8 March 1997, the Supreme Court in its order clarified that there is no ban on charcoal production. The advantage of this loophole has led to deforestation for charcoal production. The fragile economy of Meghalaya, mainly agricultural and forest-based, is also a non-industrial state with no alternative employment opportunities for the rural population, which led to compel poor people to generate income from natural resources. Therefore, making and selling charcoal became a viable livelihood option by marginalized and poor people living in the forest area. Charcoal production is also one of the major livelihood alternatives of every household of Mawkynjoin village. They make 3 sacks of charcoal (105 kg) and get Rs. 50 per bag amounting to Rs. 150 in a day. But the income is only in winters from October to March. The work for the selling of charcoal includes cutting trees, making pits, producing charcoal and loading it into the trucks. In West Khasi Hills, approximately 2,37,2816 persons are employed directly or indirectly in the production of charcoal. According to District Council Report, 24,915 tons of charcoal was consumed in 2003–2004 with the value of Rs. 99.66 million. Madhavan (2005) reported that 63 metric tons of charcoal is transported from Umjarain, a small village in West Khasi Hills Districts, to Shillong and Byrnihat. The production of one metric ton of charcoal needs about 8 m3 of wood which indicates merciless deforestation of forest at the rate of 50.4 ha/ week. Use of alternative fuel instead of charcoal needs to be implemented, however, it will be difficult to enforce because it requires a change in the mindset of the consumers or the government should promote the farmers to raise plantations for making charcoal. 6.2.2. Fuel-Wood Consumption Collecting fuel-wood is one of the most important work of the people of Mawkynjoin village which consumes much of the time of villagers, who spend at least half hours every day to reach fuel-wood source and similar for return. Villagers of this village travel 3 km for the collection of fuel wood every day; 100% families use wood as the chief source of fuel for cooking and room heating. This village has no electricity connection; in spite they are using solar energy for lighting, almost each and every household has solar light. Villagers extract wood round the year for cooking and other purposes. Approximately about 80% of the fuel-wood was collected from the forests and rest is collected from private land. The total annual fuel-wood consumption/ household/ annum in this village is 66.96 Quintals/ family/ year during summer and season and 68.64 quintal/ family/ year during winter season. Villagers also used kerosene for lighting the lamps and the total kerosene consumed/ household/ annum was 69.84 Liters. The wood load extracted from the forests generally consisted of branches of species like Schima wallichi, Pinus kesiya, Taxus baccata, Myrica esculenta, Pyrus pashia, etc. Major pressure due to fuel-wood extraction was on the forests situated within the range of village. The villagers of Mawliehbah-mawnar village also depend mainly on collecting of fuel-wood from the forests, for collecting their fuel-wood they have to spend at least one and half hour to reach and return back from fuel-wood source. The villagers of this village have to travel around 2 km to the forest to collect their fuel-wood. This village relies mainly on fuel-wood for cooking, despite having electricity connections, none of the families in the village used electricity for cooking and room-heating due to low voltage and irregular supply. The per capita consumption of fuel-wood during summer and winter season is 2.4 and 2.6 kg/head/day, respectively. The total annual fuel-wood consumption per household/annum in this village was 68.68 q in summer season and 73.72 q/ household/annum in winter season. The kerosene consumed/household/annum were 47.04 litres (Table 5).

National Seminar on Management of Natural Resources for Sustainable Development: Challenges and Opportunities
212
Half of the households of Tiehbah village have electricity connection while others depend on kerosene for lighting their lamps, but for cooking purposes they use only fuel-wood. For collecting of fuel-wood the villagers of this village have to spend around half-an-hour to reach the place where they collect their fuel-wood for nearly about one hour. The per capita consumption of fuel-wood was 3.8 and 4.0 kg/head/day during summer and winter seasons, respectively. The total annual fuel-wood consumption/household in this village were 105.80 quintal/family/annum during summer and 111.456 quintal/ family/year during winter seasons. Total kerosene consumed/household/annum was 52.56 litres. Fuel-wood is the most common energy source in rural third world population (Allen et. al., 1988). In India, where almost 75% of the total population lives in rural areas, dependency on natural resources is common since most of the biomass needs are made from surrounding vegetation (Ranjitsingh, 1979; Bowonder et. al., 1987; Kothari et al. 1989). The easy availability of wood makes it one of the most popular sources of fuel-wood for cooking as well as other household and non-agriculture needs in the rural area (Chakravarti 1985; Monga and Lakhanpal 1988;). The potential fuel-wood extraction from the forest differs from village-to-village due to many reasons viz. distance of forest from the village, irregular distribution of forests, economic condition of the household and availability of other source of energy. Maikhuri (1991) recorded 3.1 kg–10.4 kg/day/capita of wood consumption for the tribal community of Arunachal Pradesh of north-eastern Himalaya (Table 6). According to Bhatt and Sachan (2004), the fuel-wood consumption is highest to Khasi community (5.81 kg/capita/day), followed by the Garo (5.32 kg/capita/day) and Jaintia (3.90kg/capita/day), irrespective of their socio-economic status. The per capita consumption of fuel-wood in the present study is 2.4 to 4.0 kg/capita/day, which is lower than the reported range for Khasi community. The reported value for fuel-wood consumption from different parts of India oscillated between 0.63 and 4.59 kg/capita/day. Meghalaya is the third state in respect of the households using firewood for cooking, Chhattisgarh secured first place where 80.8% households use firewood for cooking (Table 6). 6.2.3. Wild Tree Species Preferred by Villagers for Various Purposes All of the studied villages, viz. Mawkynjoin village, Mawliehbah-mawnar village and Tiehbah village have almost the same composition of tree species, therefore, their uses are more-or-less same. Villagers of these 3 villages use the wild tree species along with agro-forestry tree species to fulfill their various needs. In all 3 villages, a total of 10 tree species were found to be utilized mostly by the villagers from the forests. The species, viz. Pinus kesiya, Quercus griffithii, Betula cylindrostachys, Pyrus pashia, Myrica esculenta, M. nagi, Taxus baccata, Salix psilostigma, Castonopsis kurzii are used. These were widely preferred by the villagers, which was being used for fuel-wood, fodder, agricultural appliances, household articles and variety of other purposes and was easily accessible. The pressure on these tree species by the villagers was very high. The ranking of these tree species is given on Table. 8 and their ranking are based on the point given on the basis of various uses, availability and utility values. Although Khasi pine blacken the cooking pots and paint of houses but still it was being readily used as fuel-wood due to its easy availability and burning properties. 7. Conclusion The critical analysis of different parameters of the study reveals that the peoples of all the three villages had good socio-economic status as compared to other tribes of India. Despite this, they still rely on forests for their livelihood in terms of extraction of fuel-wood, production of charcoal, fodder consumption and collection of various minor forest produce. This is exerting pressure on forest wealth of the region. Agriculture production and mixed farming is common in all the villages. About half of the villages are still practicing shifting ‘Jhum’ cultivation apart from settled agriculture. Paddy is the major crop grown by the natives, followed by potato, maize, millet, turmeric and chillies. The average annual production of different crops as a whole varied from
Forest Dependent Livelihood in Relation to Socio-Economic Status of the Khasi Tribe of Meghalaya: A Case Study of Three Villages
213
16.62 quintals/family to 25.61 quintals/family. Whereas, the average annual income and expenditure in different families ranged from Rs 89,000 to Rs 1, 65,000/ family/annum and Rs 54,267 to Rs 68059/family/annum, respectively, which clearly indicates the rich economic condition of the villagers. It is interesting to point out that none of the families in all the three villages have LPG connections as an alternate source of energy consumption, although they were using kerosene but only for lighting the lamp. There is no electricity connection in Mawkynjoin village and almost each household has solar system for lighting. The other two villages, i.e. Mawliehbah-mawnar and Tiehbah villages are connected by electricity but poor voltage and irregular current supply is the problem for people. Due to this ignorance by the government, the whole energy consumption for cooking, room and water heating is fulfilled by fuel-wood. Therefore, the per capita consumption of fuel-wood is comparatively high as compared to other parts of India. The government should pay more attention for the development of rural tribal areas particularly in terms of the introduction of electricity, which might reduce the fuel-wood consumption pattern, as have been reported in some studied (White et al., 1997; Davis, 1998; Vermeulin et al., 2000). The socio-economic development is influenced by the effectiveness of its environment management system, progress of area, increase in populations and changes in the land use pattern is processed as the time passes, and the balance between various ecosystems and its dweller disturbed. However, the trend toward forest degradation and deforestation has reversed as the economic development progressed, as observed in developed countries. Improvement of environment management system must be needed so that renewable resources, such as forests, are maintained in perpetuity for the health of the region and country as well. Tribal people dependency on forests for their livelihood has an adverse impact on biodiversity, natural regeneration and biomass production due to degradation and loss of forests. Degradation causes due to over-extraction of forest, faulty management of forest resources and forest land encroachment. Therefore, conservation of forests is required, as they are rich natural resources. Hence, forests should be given priority consideration for sustainable development. Thus, is through community awareness and participation in different rural areas is one of the means to maintain forests. Forest management undertaken by the government and the society can be strengthened through community awareness. To meet the present needs of the people, forests must be preserved and make them extend till their future generation and so on. Acknowledgement Authors are thankful to Head of Department, Forestry, Mizoram University for providing necessary facilities for the study. References Aggarwal, A., Paul, V. and Das, S. (2009), “Forest Resources: Degradation, Livelihoods and Climate Change”, pp. 91–108, In Datt, D. and. Nischal, S. (eds.), Looking Back to Change Track, New Delhi, TERI, p. 219. Allen, J.A., Piemental, D.P. and Lasoie, J.P. (1988), “Fuel Wood Production and Use in Rural Swaziland: A Case Study of Two Communities”, Forest Ecology and Management, Vol. 25, pp. 239–254. Arjunan, M., Puyravaud, J. and Davidar, P. (2005), “The Impact of Resource Collection by Local Communities on the Dry Forests of the Kalakad–Mundanthurai Tiger Reserve”, Tropical Ecology, Vol. 46, pp. 135–144. Bhatt, B.P. and Sachan, M.S. (2004), “Firewood Consumption Pattern of Different Tribal Communities in Northeast India”,
Energy Policy, Vol. 32, pp. 1–6. Bhullar, B.S. and Mittal, J.P. (1990), “Energy Requirements for Wheat Production in a Selected Village of Punjab”, Journal of Rural Technology, Vol. 2, pp. 9–22. Bijalwan, A. (2007), Productivity and Feasibility Analysis of Tradition al Agroforestry Systems through Land Use Pattern in Mid-hill Situations of Garhwal Himalaya, [D.Phil Thesis], H.N.B. Garhwal University, Srinagar Garhwal, Uttarakhand, India, p. 92.

National Seminar on Management of Natural Resources for Sustainable Development: Challenges and Opportunities
214
Bowonder, B., Prasad, S.S.R. and Unni, N.V.M. (1987), “Deforestation Around Urban Centres in India”, Environmental Conservation, Vol. 14, pp. 23–28. Chakravarti, R. (1985), “Some Observation on Fuel Wood Forestry in India”, Journal of Tropical Forestry, Vol. 1, pp. 1–17. Davidar, P., Sahoo, S., Mammen, P.C., Acharya, P., Puyravaud, J.P., Arjunan, M., Garrigues, J.P. and Roessingh, K. (2010), “Assessing the Extent and Causes of Forest Degradation in India: Where do we Stand?”, Biological Conservation, Vol. 43(12), pp. 2937–2944. Davis, M. (1998), “Rural Household Energy Consumption: The Effects of Access to Electricity-evidence from South Africa”, Energy Policy, Vol. 26, pp. 207–217. FAO (2010), Global Forest Resource Assessment (2010), FAO Forestry Paper 163 Rome, FAO, p. 34.
FAO [Food and Agriculture Organization] (1974), Working Paper on Livestock Production, Kathmandu, Nepal, FAO. Forest Survey of India (2011), India State of Forest Report, New Delhi: Ministry of Environment and Forests, Government of India, p. 286. Gabriel, O., Cibilis, A., Borrelli, P. and Humano, G. (1998), “Stable States in Relation to Grazing in Patagoina: A 10 Year Experimental Trial”, Journal of Arid Environment, Vol. 40, pp. 113–131. ICFRE [Indian Council of Forestry Research & Education] (2000) Baseline and Socio-economic Impact Studies. In: Technical Report on Himalaya Eco-rehabilitation Project, Indian Council of Forestry Research & Education, Dehradun, p. 107. Ives, J.D. (2006), Himalayan Perceptions: Environmental Change and the Wellbeing of Mountain Peoples, 2nd edition, Kathmandu Nepal, HimAAS [Himalayan Association for Advancement of Science]. Khanduri, V. P., Sharma, C.M., Ghildiyal, S.K. and Puspwan, K.S. (2002), “Forest Composition in Relation to Socio-economic Status of People at Three High altitudinal Villages of a Part of Garhwal Himalayas”, Indian Forester, Vol. 128(12), pp. 1335–1345. Kumar, A. and Ramakrishnan, P.S. (1990), “Energy Flow through an Apatani Village Ecosystem of Arunachal Predesh in Northeast India”, Human Ecology, Vol. 16, pp. 315–35. Kumar, R. and Shahabuddin, G. (2005), “Effects of Biomass Extraction on Vegetation Structure, Diversity and Composition of Forest in Sariska Tiger Reserve, India”, Environmental Conservation, Vol. 32, pp. 248–259. Madhavan, P. (2005), “Do we have Enough Forests for Peoples’ Need?”, Eastern Panorama, Vol. 14(4), pp. 9–14. Maikhuri, R.K. (1992), “Ecoenergetic Analysis of Animal Husbandry in Traditional Societies of India”, Energy, Vol. 17, pp. 291–296. Maikhuri, R.K. (1996), “Ecoenergetic Analysis of Village Ecosystem of Different Traditional Societies of Northeast India”, Energy, Vol. 21, pp. 1287–1297. Maikhuri, R.K. and Ramakrishnan, P.S. (1991), “Comparative Analysis of the Village Ecosystem Function of Different Tribes Living in Arunachal Pradesh in Northeastern India”, Agricultural Systems, Vol. 35, pp. 292–299. Maikhuri, R.K., Nautiyal, S. Rao, K.S. and Saxena, K.G. (2001a), “Conservation Policy–people Conflicts: A Case Study from Nanda Devi Biosphere Reserve (a World Heritage Site), India”, Forest Policy and Economics, Vol. 2, pp. 357–367. Martin, P.J. and Nautiyal, J.C. (1993), “Population Supporting Capacity in the Central Himalaya”, In: D.K. Khurana and P.K. Khosla (eds.), Agroforestry for Rural Needs, Indian Society of Tree Scientists, Solan, India, pp. 439–462. Mishra, N.M., Mahendra, A.K. and Ansari, M.Y. (1988), “Pilot Survey of Fuel Consumption in Rural Areas”, Indian Forester, Vol. 114(1), pp. 57–62. Mishra, P.C., Tripathy, P.K., Behera, N. and Mishra, K. (2008), “Socioeconomic and Socio-ecological Study of Sambalpur Forest Division, Orissa”, Journal of Human Ecology, Vol. 23(2), pp. 135–146. Moench, M. (1989), “Forest Degradation and the Structure of Biomass Utilization in a Himalayan Foothills Village”, Environmental Conservation, Vol. 16, pp. 132–147. Monga, P. and Lakhanpal, T.N. (1988), Rural Energy Alternative in the Hilly Areas, Today and Tomorrow’s Printers and Publishers, New Delhi, p. 213. Nautiyal, S., Maikhuri, R.K., Rao, K.S., Semwal, R.L. and Saxena, K.G. (2003b), “Agroecosystem Function AROUND a Himalayan Biosphere Reserve”, Journal of Environmental Systems, Vol. 29, pp. 71–100. Nautiyal, S., Rao, K.S., Maikhuri, R.K. and Saxena, K.G. (2003a), “Transhuman Pastoralism in the Nanda Devi Biosphere Reserve, India: A Case Study in the Buffer Zone”, Mountain Research and Development, Vol. 23, pp. 255–262. Pandey, U. and Singh, J.S. (1984), “Energy Flow Relationship between Agro and Forest Ecosystems in Central Himalaya”, Environmental Conservation, Vol. 11, pp. 45–53. Ranjithsingh, M.R. (1979), “Forest Destruction in Asia and South Pacific”, Ambio, Vol. 8, pp. 192–201. Reddy, A.K.N. (1981), “An Indian Village Agricultural Ecosystem-Case Study of Ungra Village”, Biomass, Vol. 1, pp. 77–88. Sagar, R. and Singh, J.S. (2004), “Local Plant Species Depletion in a Tropical Deciduous Forest of Northern India”, Environmental Conservation, Vol. 31, pp. 55–62. Saksena, S., Prasad, R. and Joshi, V. (1995), “Time Allocation and Fuel Usage in three Villages of the Garhwal Himalaya, India”, Mountain Research and Development, Vol. 15, pp. 57–67. Silori, C.S. (2004), “Fuel Wood Collection and Consumption Pattern in the Buffer Zone of Nanda Devi Biosphere Reserve, Western Himalaya, India”, Indian Forester, Vol. 130(10), pp. 1186–1200. Silori, C.S. and Mishra, B.K. (2001), “Assessment of Livestock Grazing Pressure in and Around the Elephant Corridors in Mudumalai Wildlife Sanctuary, South India”, Biodiversity and Conservation, Vol. 10, pp. 2181–2195.

Forest Dependent Livelihood in Relation to Socio-Economic Status of the Khasi Tribe of Meghalaya: A Case Study of Three Villages
215
Singh, G.S., Rao, K.S. and Saxena, K.G. (1997), “Energy and Economic Efficiency of the Mountain Farming System: A Case Study in the North-western Himalaya”, Journal of Sustainable Agriculture, Vol. 9, pp. 25–49. Vermeulen, S.J., Campbell, B.M. and Mangono, J.J. (2000), “Shifting Patterns of Fuel and Wood Use by Households in Rural Zimbabwe”, Energy and Environment, Vol. 11, pp. 233–254. Vitousek, M.P. (1994), “Beyond Global Warming: Ecology and Global Warming”, Ecology, Vol. 75(7), pp. 1861–1877. Ward, D., Ngairorue, B.T., Apollus, A. and Tjiveze, H. (2000), “Perceptions and Realities of Land Degradation in Arid Otimbingiwe, Namibia”, Journal of Arid Environment, Vol. 45, pp. 337–356. Ward, D., Ngairorue, B.T., Kathena, J., Samuels, R. and Ofran, Y. (1998), “Land Degradation is not a Necessary Outcome of Communal Pastoralism in arid Namibia”, Journal of Arid Environment, Vol. 40, pp. 357– 371. White, C., Bank, L., Jones, S. and Mehlwana, M. (1997), “Restricted Electricity use among Poor Urban Households”, Development Southern Africa, Vol. 14, pp. 413–430.

216
30 The Water Availability and Management in Context of Emerging Water Scarcity Problem in Jhabua District of Madhya Pradesh: A Temporal Prespective
Rekha Verma Department of Geography, Govt. PG College, Mhou, Indore, MP
1. Introduction Scarcity of surface water and lowering of water table is now an established fact in India. The water footprint shows the extent of water use in relation to consumption of people. The river which used to flow in March and April 20 years ago are dry from October itself. Due to overuse of ground- water sources, the water table has gone down drastically. A sample survey of 200 tubewells of 06 blocks of Jhabua was conducted by Ground-water Survey Dept. 1992 has revealed the fact that out of the total sample wells, 56% are dry and all the rest of these have been brought in ground-water level ranging from 3 to 10 metres. 2. Objective Present work is based on the studies at household level. The main objectives are:
• What was the status of water availability in the area. • To analyze the type of water uses at that particular time of work. • The present availability and mode of utilization of water. • To analyze in detail how far privatization of water and misuse in domestic and agricultural consumption have contributed to the problem of water scarcity.
3. Methodology
3.1 Unit of Study Jhabua district will be the area of study where village will be the unit, which comprises of 6 blocks. This district mainly consists of tribal population. Total area of Jhabua is 2901.92 sq. km which has 803 villages. These villages mainly got the water by seasonal Nalas and hand pumps. Water level is so low. Therefore, this area is facing water scarcity problem. 3.2 Method Sample has been drawn by random method from blocks. A total of 5% villages have been selected, from those villages 15% households were taken as sample.

The Water Availability and Management in Context of Emerging Water Scarcity Problem in Jhabua District
217
3.2.1. Past Status of Water Availability
Source %Well 69River 13.5Nala 17.53.2.2. Distance to Get Water at that Time
Distance (KM) %0.5 11.801 471.5 4.602 21.3More than 2 15.3Villages are distributed into Falia, one village has 10 to 12 Falias and these are scattered in 1 to 3 kilometres diameter. There are one or two wells in the village so people had to cover the distance 1 to 2 kilometres; river also passes from one side of village, so the other side of village had to come to river for water, therefore they had to cover the 3 kilometres of distance. 3.2.3. Present Status of Water Availability
Source %Hand pump 94.9 Well 4.9 Tu be well 0.2 30 years ago, 69% people were getting water from well, although at present only 4.9% people are depends on well and other sources like river and Nala are now totally transferred to hand pump. 95% people getting water from hand pumps, which are near by the house. So the distance is also minimize it’s remain only ½ to 1 kilometres, Only 16% people are getting water from 1 to 2 kilometres distance. Therefore, we may say that at present, time and labour both are saved. Mode of the utilization of water is for: 1. Drinking water. 2. For Household work–Cleaning house and washing utensils etc. 3. For human activity–washing clothes, sanitation, bathing etc. 4. For other work–like irrigation, for cattle. 3.2.4. Mode of Utilization of Water
Water (Lt.) Drinking Household Work Human Activity Other Work
Past Present Past Present Past Present Past Present10 - - 23.6 - 25.6 - 17.31 9.4015 - - 8 8 6.5 - - -20 41.7 27.7 45 22.1 53.1 14.77 8.59 8.9925 20.5 25.5 12.8 25.2 8.8 38.49 - 0.5430 29.7 29.10 7.2 12.8 5.9 11.28 - -35 1.6 3.72 - - - - - -40 6.6 13.95 3.4 23.6 - 18.26 23.08 -45 - - - - - - - 8.5850 - - - 8.3 - 17.20 25.12 21.2560 - - - - - - 2.31 5.9980 - - - - - - - 15.5390 - - - - - - - 2.59100 - - - - - - 23.59 27.13

National Seminar on Management of Natural Resources for Sustainable Development: Challenges and Opportunities
218
Utility of water is important. It gives the impact of use, misuse and overuse of water. In the families, utilization of water is for drinking, household work, like cleaning the house, washing utensils etc., human activity like bathing, washing clothes, sanitation purpose etc, and other work like cattle feeding, irrigation, plantation etc. Drinking is the main use of water because without water, human beings cannot survive, in past 20 litre water/ family was the maximum use, it was for 41.7% ,and 35 litte use/family was least, which was for 1.6%. Average use for drinking per family was 25 to 30 litre water, but at present the consumption for drinking has increased to 35 to 40 litre/ family. Average use of 30 litre is remaining same, although 20 litre is remaining up to 27.7% which was 41.7% in the past. Household purpose is important for every family—in the past, and average use of 20 litre water in household activity was 45% and 25% families were using only 10 litre water for this purpose. Consumption of 40 litre use was minimum which only 3.4% families were using. At present, 20 to 25 litre water is being used by 22 to 25% families which is the average use. Maximum 50 litre is using by 8.3% families which was not used in the past; now-a-days 23.6% families are using 40 litre which is seven times more than the past. Human activity is a regular activity, every human being is bound to use water for this purpose, in past period 53% people were using 20 litre water for this activity;, 25.6% were using 10 litres, 30 litre was maximum, used by 5.3% families. At present, consumption for this purpose has increased; 38.5% families are using 25 litre water, 18.3% are using 40 litre and maximum 50 litre water is being used by 17.2% families. Now-a-dasy minimum use is 20 litre by 14.77% families. Only 11.3% families are using 30 litre water, which was the maximum use in the past period. Other activities are also important; for this purpose, 40 to 50 litre water was average use which was for 48.2% population, 60 litre was used by 2.3% and 100 litre was used by 23.6% families. Lowest was 10 litre used by 17.3% families. At present, cattle population has increased and green earth is in demand. Therefore, the water consumption has increased; now 10 litre is being used by only 9.4% families and 100 litre is being used by 27.13% families; 50 litre is being used by only 21.2% families. So, we may say that the consumption of water has increased in all the activities; therefore, we conclude that water scarcity is due to overuse and misuse of water. It is not a natural phenomenon. It is manmade problem and can be tackled on the societal level. It is not only due to deforestation and decrease in rainfall. We cannot count that these are major factors for scarcity of water in the area.

219
31 Magnetic Properties of Tree Leaves and Their Significance in Atmospheric Particulate Pollution in Aizawl City, Mizoram
Biku Moni Chutia, Prabhat Kumar Rai and S.K. Patil Department of Environmental Science,
Mizoram University, Aizawl, Mizoram, India
1. Introduction Plant resources offer an eco-sustainable way of bio-monitoring air pollution with special reference to particulate matters. Atmospheric particulate matter (PM) is one of the most problematic air pollutants in view of their adverse impacts on human health. There is a strong correlation between PM and respiratory health damage (Schwartz, 1996; Pope et al., 2002; Knutsen et al., 2004; Knox, 2006; Yin et al., 2013). Many studies highlight the importance of particulates with an aerodynamic diameter of less than 10 µm (PM10), which, due to their small size, can penetrate deep into the human lung and cause respiratory illness (Le Tertre et al., 2002; Janssen et al., 2005; Jerrett et al., 2005). Alongside PM10 are further grain size divisions of PM2.5 and PM0.1 (2.5 µm and 0.1 µm, respectively, again relative to their aerodynamic diameters). These fine and ultrafine particulates have higher burdens of toxicity as they become coated with heavy metals and chemicals, which, when inhaled, can get absorbed into the body and may target specific organs (Morawska and Zhang, 2002; Englert, 2004; Power et al., 2009). Urban anthropogenic PM contains certain heavy metal which will be toxic to human health (Harrison and Jones, 1995; Huhn et al., 1995). In view of the above-mentioned deleterious impacts of particulate matter, it is quite obvious to investigate the feasible and eco-sustainable green technologies. Although, there are many conventional (physical and chemical) devices for assessment of air pollution, however, plant systems allow the direct assessment of the air stressors particularly in context of magnetic particles (Maher et al., 2010). Biological monitors are organisms that provide quantitative information on some aspects of the environment, such as how much of a pollutant is present. In this regard, the air-cleansing capacity of urban trees presents an alternative approach to foster an integrated approach to the sustainable management of urban ecosystem. Moreover, in urban area higher plants are mostly suitable for monitoring dust pollution as lichens and mosses are often missing (Faiz et al., 2009). Plants are good indicators of air pollution. Tree leaves were proved to be good collector of PM (Moreno et al., 2003; Urbat et al., 2004; Yin et al., 2013; Rai, 2013). Vegetation naturally cleanses the atmosphere by absorbing some particulate matter and gases through plant leaves, as they are continuously exposed to the surrounding atmosphere and is therefore the main receptor of particulate pollutants. It has been demonstrated that magnetic measurement is an important means in particulate pollution study through plant leaves. Bio-monitoring of particulate pollution through magnetic properties of plant leaves is a reliable, rapid and inexpensive alternative to conventional atmospheric pollution monitoring (Walden et al., 1999; Power et al., 2009). This has promoted its suitability for aiding bio-monitoring of air quality (Maher and Matzka, 1999; Moreno et al., 2003; Urbat et al., 2004). The magnetic properties of tree leaves as proxy in monitoring and mapping of PM pollution have drawn increasing attention (Zhang et al., 2006).
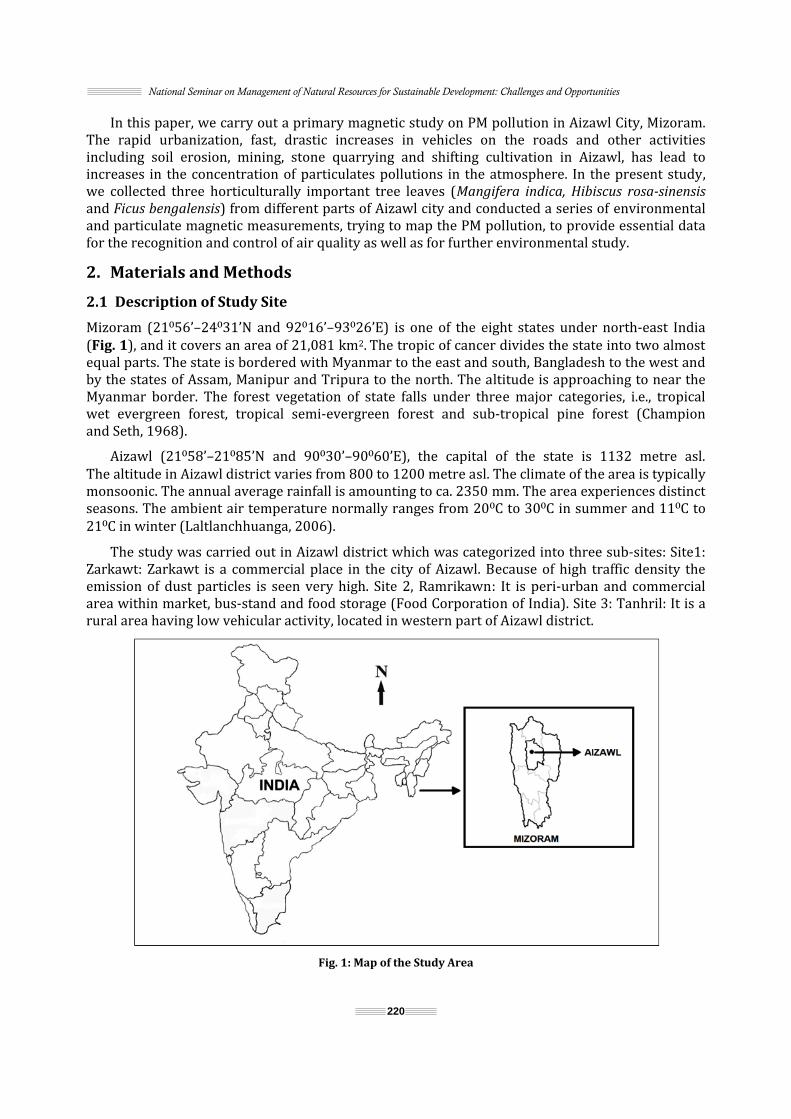
National Seminar on Management of Natural Resources for Sustainable Development: Challenges and Opportunities
220
In this paper, we carry out a primary magnetic study on PM pollution in Aizawl City, Mizoram. The rapid urbanization, fast, drastic increases in vehicles on the roads and other activities including soil erosion, mining, stone quarrying and shifting cultivation in Aizawl, has lead to increases in the concentration of particulates pollutions in the atmosphere. In the present study, we collected three horticulturally important tree leaves (Mangifera indica, Hibiscus rosa-sinensis and Ficus bengalensis) from different parts of Aizawl city and conducted a series of environmental and particulate magnetic measurements, trying to map the PM pollution, to provide essential data for the recognition and control of air quality as well as for further environmental study. 2. Materials and Methods
2.1 Description of Study Site Mizoram (21⁰56’–24⁰31’N and 92⁰16’–93⁰26’E) is one of the eight states under north-east India (Fig. 1), and it covers an area of 21,081 km2. The tropic of cancer divides the state into two almost equal parts. The state is bordered with Myanmar to the east and south, Bangladesh to the west and by the states of Assam, Manipur and Tripura to the north. The altitude is approaching to near the Myanmar border. The forest vegetation of state falls under three major categories, i.e., tropical wet evergreen forest, tropical semi-evergreen forest and sub-tropical pine forest (Champion and Seth, 1968). Aizawl (21⁰58’–21⁰85’N and 90⁰30’–90⁰60’E), the capital of the state is 1132 metre asl. The altitude in Aizawl district varies from 800 to 1200 metre asl. The climate of the area is typically monsoonic. The annual average rainfall is amounting to ca. 2350 mm. The area experiences distinct seasons. The ambient air temperature normally ranges from 20⁰C to 30⁰C in summer and 11⁰C to 21⁰C in winter (Laltlanchhuanga, 2006). The study was carried out in Aizawl district which was categorized into three sub-sites: Site1: Zarkawt: Zarkawt is a commercial place in the city of Aizawl. Because of high traffic density the emission of dust particles is seen very high. Site 2, Ramrikawn: It is peri-urban and commercial area within market, bus-stand and food storage (Food Corporation of India). Site 3: Tanhril: It is a rural area having low vehicular activity, located in western part of Aizawl district.
Fig. 1: Map of the Study Area

Magnetic Properties of Tree Leaves and Their Significance in Atmospheric Particulate Pollution in Aizawl City, Mizoram
221
2.2 Sample Collection Sampling was conducted during the months of January, February, March and April 2012. Tree leaves were collected from three species on dry sunny days. The recorded plants were Mangifera indica, Hibiscus rosa-sinensis and Ficus bengalensis. These three plants samples were selected for the study because of their availability and commonness. At each site, 5 leaves of similar size were collected from the tree on the side nearest to the road at a height of approximately 2 m to avoid possible contamination from ground splash. The leaves were dried at 350C and recorded the dried weight; samples were prepared for magnetic analysis, which involved packing the dried leaves into 10cc plastic sample pots (Walden, 1999). 2.3 Magnetic Parameters The magnetic parameters such as Magnetic Susceptibility (χ), Anhysteretic Remanent Magnetisation (ARM) and Saturation Isothermal Remanent Magnetisation (SIRM) were carried out at K.S. Krishnan Geomagnetic Research Lab of Indian Institute of Geomagnetism, Allahabad, India. The magnetic susceptibility reflects the total composition of the dust deposited on the leaves, with a prevailing contribution from ferromagnetic minerals, which have much higher susceptibility values than paramagnetic and diamagnetic minerals, such as, clay or quartz (Maher and Thompson, 1999; Evans and Heller, 2003). A Bartington (Oxford, England) MS2B dual frequency susceptibility meter was used (Dearing, 1999) and measurements were taken. ARM indicates the magnetic concentration and is also sensitive to the presence of fine grains~ 0.04–1 µm (Thompson and Oldfield, 1986). Thus, falling within the respirable size range of PM2.5 and having the potential to have a high burden of toxicity (Power et al., 2009). ARM was induced in samples using a Molspin (Newcastle-upon-Tyne, England) A.F. Demagnetizer, whereby a DC biasing field is generated in the presence of an alternating field, which peaks at 100 milli-Tesla (mT). The nature of this magnetic field magnetizes the fine magnetic grains and the amount of magnetization retained within the sample (remanence) when removed from the field was measured using a Molspin1A magnetometer. The samples were then demagnetized to remove this induced field in preparation for the subsequent magnetic analysis (Walden, 1999). SIRM indicates the total concentration of magnetic grains (Evans and Heller, 2003) and can be used as a proxy of particulate matter concentration (Muxworthy et al., 2003). SIRM involves measuring the magnetic remanence of samples once removed from an induced field. Using a Molspin Pulse Magnetiser, a saturation isothermal remanent magnetization (SIRM) of 800 mT in the forward field was induced in the samples. At this high magnetization, all magnetic grains within the sample become magnetized (Power et al., 2009). The ratio of IRM-300 and SIRM was defined as the S-ratio (King and Channell, 1991). The S-ratio mainly reflects the relative proportion of anti-ferromagnetic to ferromagnetic minerals in a sample. A ratio close to 1.0 reflects almost pure magnetite while ratios of<0.8 indicate the presence of some anti-ferromagnetic minerals, generally goethite or haematite (Thompson, 1986). 2.4 Statistical Analysis Correlation coefficient values were calculated at each site using SPSS software (SPSS Inc., version 10.0). 3. Results and Discussion The ambient PM concentrations were recorded highest at Zarkawt, followed by Ramrikawn, while lowest values were recorded for Tanhril area. The average magnetic data collected throughout the 4-month sampling period is presented in Tables 1, 2 and 3 respectively for all three tree leaves (Mangifera indica, Hibiscus rosa-sinensis and Ficus bengalensis).

National Seminar on Management of Natural Resources for Sustainable Development: Challenges and Opportunities
222
In Zarkawt, the magnetic susceptibility (χ), ARM and SIRM values were 38.21± 0.42 (10–7 m3 kg1), 23.10 ± 0.31 (10-5 Am2 kg-1) and 265.21 ± 0.61 (10-5 Am2 kg-1) respectively for Mangifera indica. For Hibiscus rosa-sinensis magnetic susceptibility (χ) value was 37.09 ± 0.81 (10–7 m3 kg-1), ARM value was 8.24 ± 0.31 (10-5 Am2 kg-1) and SIRM value was 203.70 ± 0.52 (10-5 Am2 kg-1). And the magnetic susceptibility (χ), ARM and SIRM values were 44.78 ± 0.15 (10–7 m3 kg-1), 40.74 ± 0.49 (10-5 Am2 kg-1) and 292.62 ± 0.77 (10-5 Am2 kg-1) respectively for Ficus bengalensis. In Tanhril, it was found that the magnetic susceptibility (χ) value of Mangifera indica is 26.81 ± 0.25 (10-7 m3 kg-1), ARM is 4.46 ± 0.23 (10-5 Am2 kg-1) and SIRM is 153.11 ± 0.27 (10-5 Am2 kg-1). Similarly Hibiscus rosa-sinensis has got the value of 28.59 ± 0.39 (10-7 m3 kg-1) for magnetic susceptibility (χ), 4.48 ± 0.29 (10-5 Am2 kg-1) for ARM and 153.21 ± 0.31(10-5 Am2 kg-1) for SIRM. And the magnetic susceptibility (χ), ARM and SIRM values were 29.01 ± 0.38 (10–7 m3 kg-1), 5.09 ± 0.73 (10-5 Am2 kg-1) and 153.83 ± 0.34 (10-5 Am2 kg-1) respectively for Ficus bengalensis. In Ramrikawn, the magnetic susceptibility (χ), ARM and SIRM values were 34.62± 0.29 (10–7 m3 kg-1), 9.53 ± 0.38 (10-5 Am2 kg-1) and 273.41 ± 0.63 (10-5 Am2 kg-1) respectively for Mangifera indica. For Hibiscus rosa-sinensis magnetic susceptibility (χ) value was 33.87 ± 0.54 (10–7 m3 kg-1), ARM value was 8.19 ± 0.41 (10-5 Am2 kg-1) and SIRM value was 201.42 ± 0.26 (10-5 Am2 kg1). And the magnetic susceptibility (χ), ARM and SIRM values were 39.19 ± 0.42 (10–7 m3 kg-1), 12.76 ± 0.29 (10-5 Am2 kg-1) and 266.11 ± 0.61 (10-5 Am2 kg-1) respectively for Ficus bengalensis.
Table 1: Statistics of Magnetic Properties (Mean and Standard Deviation) of Mangifera indica Leaf
Site Χ
(10–7 m3 kg-1)
ARM
(10–5 Am2 kg-1)
SIRM
(10–5 Am2 kg-1)
ARM/χ
(102Am-1)
SIRM/χ
(102Am-1)
S-ratio
Zarkawt 38.21± 0.42 23.10± 0.31 265.21± 0.61 0.60 6.94 0.95 Tanhril 26.81± 0.25 4.46 ± 0.23 153.11± 0.27 0.16 5.71 0.96 Ramrikawn 34.62± 0.29 9.53± 0.38 273.41± 0.63 0.27 7.89 0.95 Table 2: Statistics of Magnetic Properties (Mean and Standard Deviation) of Hibiscus Rosa-sinensis Leaf
Site Χ
(10–7 m3 kg-1)
ARM
(10–5 Am2 kg-1)
SIRM
(10–5 Am2 kg-1)
ARM/χ
(102Am-1)
SIRM/χ
(102Am-1)
S-ratio
Zarkawt 37.09± 0.81 8.24± 0.31 203.70± 0.52 0.22 5.49 0.95 Tanhril 28.59± 0.39 4.48± 0.29 153.21± 0.31 0.15 5.35 0.96 Ramrikawn 33.87± 0.54 8.19± 0.41 201.42± 0.26 0.24 5.94 0.95 Table 3: Statistics of Magnetic Properties (Mean and Standard Deviation) of Ficus bengalensis leaf
Site χ
(10–7 m3 kg-1)
ARM
(10–5 Am2 kg-1)
SIRM
(10–5 Am2 kg-1)
ARM/χ
(102Am-1)
SIRM/χ
(102Am-1)
S-ratio
Zarkawt 44.78± 0.15 40.74± 0.49 292.62± 0.77 0.90 6.53 0.95 Tanhril 29.01± 0.38 5.09 ± 0.73 153.83± 0.34 0.17 5.30 0.96 Ramrikawn 39.19± 0.42 12.76± 0.29 266.11± 0.61 0.32 6.79 0.95

Magnetic Properties of Tree Leaves and Their Significance in Atmospheric Particulate Pollution in Aizawl City, Mizoram
223
Fig. 2: Correlation Analysis of Magnetic Susceptibility (χ) and Anhysteretic Remanent Magnetization
(ARM) of Mangifera indica Leaf
Fig. 3: Correlation Analysis of Magnetic Susceptibility (χ) and Saturation Isothermal Remanent
Magnetization (SIRM) of Mangifera indica Leaf
Fig. 4: Correlation Analysis of Magnetic Susceptibility (χ) and Anhysteretic Remanent
Magnetization (ARM) of Hibiscus Rosa-sinensis Leaf
Fig. 5: Correlation Analysis of Magnetic Susceptibility (χ) and Saturation Isothermal Remanent
Magnetization (SIRM) of Hibiscus Rosa-sinensis Leaf
Fig. 6: Correlation Analysis of Magnetic Susceptibility (χ) and Anhysteretic Remanent Magnetization (ARM)
of Ficus bengalensis Leaf
Fig.7: Correlation Analysis of Magnetic Susceptibility (χ) and Saturation Isothermal Remanent
Magnetization (SIRM) of Ficus bengalensis Leaf
y = 1.475x - 36.64R² = 0.796
0
5
10
15
20
25
0 20 40 60
AR
M (1
0–5A
m2
kg-1
)
χ (10–7 m3 kg-1)
y = 10.73x - 125.9R² = 0.866
0
50
100
150
200
250
300
0 20 40 60χ (10–7 m3 kg-1)
SIR
M (1
0–5A
m2
kg-1
)
y = 0.468x - 8.559R² = 0.867
0123456789
10
0 20 40χ (10–7 m3 kg-1)
AR
M (1
0–5A
m2
kg-1
)
y = 6.180x - 18.30R² = 0.856
0
50
100
150
200
250
0 10 20 30 40χ (10–7 m3 kg-1)
SIR
M (1
0–5A
m2
kg-1
)
y = 2.077x - 58.69R² = 0.783
05
1015202530354045
0 20 40 60
AR
M (1
0–5A
m2
kg-1
)
χ (10–7 m3 kg-1)
y = 9.072x - 104.1R² = 0.969
050
100150200250300350
0 20 40 60χ (10–7 m3 kg-1)
SIR
M (1
0–5A
m2
kg-1
)

National Seminar on Management of Natural Resources for Sustainable Development: Challenges and Opportunities
224
The high dispersion degrees of susceptibility and remanant magnetism mainly result from the sampling sites in different functional areas. Samples collected in the rural area show low susceptibility and remanant magnetism, where tree leaves sampled in city and peri-urban areas show higher values. The correlation of magnetic susceptibility with ARM and SIRM are significant (Fig. 2 to 7). The relatively high correlation indicate that the magnetic minerals with paramagnetism and superparamagnetism contribute slightly to the magnetism of tree leaves, and the major contributor is ferro(i)magnetic minerals (Yu et al., 1995: Sun et al., 1996). The values of ARM/χ and SIRM/χ can reflect the grain size of magnetic minerals (Thompson and Oldfield, 1986; Evans and Heler, 2003). From the study, it was observed that ARM/χ and SIRM/χ values are low at all study sites (Table 1, 2 and 3). Low values of ARM/χ and SIRM/χ indicate relatively large grain size magnetic particles in leaf samples (Yin et al., 2013). S-ratio of all three leaf samples ranges from 0.95 to 0.96 (Table 1, 2 and 3) which means that these leaf samples are dominated by ‘soft’ magnetic minerals with a low coercive force, but a minor part of ‘hard’ magnetic minerals with a relatively high coercive force also exists (Robinson, 1986). From the findings recorded in Tables 1, 2 and 3 we can infer the magnetic values for all three species display similar trends, with Zarkawt representing highest, while Tanhril area representing the lowest concentration data. Further, results indicates that Zarkawt and Ramrikawn experiences the highest deposition of magnetic grains, originating from PM. χ, ARM and SIRM values were high for Ficus bengalensis when compared with Mangifera indica and Hibiscus rosa-sinensis. The average magnetic concentration data (Table 1, 2 and 3) demonstrates that the accumulation of PM on tree leaves varies across the three locations. The results suggest that Zarkawt and Ramrikawn experiences the heaviest loads of particulates in comparison to the low-depositions site Tanhril area. This suggests that localized conditions like environmental, metrological or anthropogenic may be influencing or disturbing particulate deposition or it may reflect differences in the ability of leaf species to capture particulates (Power et al., 2009). Zarkawt recorded the highest values of magnetic parameters which may be attributed to heavy vehicles load (due to city area) compared with Ramrikawn (peri-urban) and Tanhril area (rural area). 4. Conclusion Biomonitoring of atmospheric particulate matter using magnetic properties of tree leaves is a useful approach to delineate primary anthropogenic airborne particulate pollution, which leads to the deterioration of ambient air quality and causes adverse effects to human health. According to our preliminary results from the study on tree leaves in Aizawl city, we can conclude that: (1) Magnetic properties of tree leaves change significantly in different functional areas. Overall all values of magnetic parameters (χ, ARM and SIRM) decline in the following sequence: city area > peri-urban area > rural area. Magnetic concentration data suggest that the deposition of PM on tree leaves varies due to different traffic behaviour between sites and due to other activities like soil erosion, mining and stone quarrying etc. (2) The magnetic properties of tree leaves in Aizawl city revealed that the magnetic fraction of dust is dominated by multi-domain magnetite-like ferromagnetic particles. (3) Magnetic survey of tree leaves is recommended as an inexpensive tool i.e. tree leaves are easy to collect and measure. The magnetic analysis of dust loadings on tree leaves provides an alternative proxy method to conventional air pollution monitoring. Acknowledgement The authors would like to thank the Department of Biotechnology (DBT) and Department of Science and Technology (DST), for providing financial assistance in the form of research project (vide project no. BT/PR-11889/BCE/08/730/2009 and SR/FTP/ES-83/2009, respectively). Thanks are also extended to Dr. Onkar Nath Tiwari, Dr. Umesh Sharma and Dr. S.K. Patil for their useful discussion and cooperation in this work.

Magnetic Properties of Tree Leaves and Their Significance in Atmospheric Particulate Pollution in Aizawl City, Mizoram
225
References Champion, H. and Seth, S.K. (1968), A Revised Survey of Forest Types of India, Government of India Press, Delhi. Dearing, J. (1999), “Magnetic Susceptibility”, In Walden, J., Oldfield, F. and Smith, J.P. (Eds.), Environmental Magnetism: A Practical Guide. Technical Guide, Cambridge, England: Quaternary Research Association. No. 6, pp. 35–62. Englert, N. (2004), “Fine Particles and Human Health-A Review of Epidemiological Studies”, Toxicology Letters, Vol. 149, pp. 235–242. Evans, M.E. and Heller, F. (2003), Environmental Magnetism: Principles and Applications of Enviromagnetics (International Geophysics). London: Academic Press. Elsevier, p. 299. Faiz, Y., Tufail, M., Javed, M.T., Chaudhry, M.M. and Siddique, N. (2009), “Road Dust Pollution of Cd, Cu, Ni, Pb and Zn along Islamabad Expressway, Pakistan”, Microchemical Journal, Vol. 92, pp. 186–192. Harrison, R.M. and Jones, M. (1995), “The Chemical Composition of Airborne Particles in the UK Atmosphere”, Science of the Total Environment, Vol. 168(3), pp. 195–214. Huhn, G., Schulz, H., Staerk, H.J., Toelle, R. and Scheuermann, G. (1995), “Evaluation of Regional Heavy Metal Deposition by Multivariate Analysis of Element Contents in Pine Tree Barks”, Water, Air, and Soil Pollution, Vol. 84(3–4), pp. 367–383. Janssen, N.A.H., Lanki, T., Hoek, G., Vallius, M., de Hartog, J.J. and Van Grieken, R. (2005), “Associations between AMBIENT, Personal and Indoor Exposure to Fine Particulate Matter Constituents in Dutch and Finnish Panels of Cardiovascular Patients”, Occupational and Environmental Medicine, Vol. 62, pp. 868–877. Jerrett, M., Buzzelli, M., Burnett, R.T. and DeLuca, P.F. (2005), “Particulate Air Pollution, Social Confounders and Mortality in Small Areas of an Industrial City”, Social Science and Medicine, Vol. 60, pp. 2845–2863. King, J.W. and Channell, J.E.T. (1991), “Sedimentary Magnetism, Environmental Magnetism and Magnetostratigraphy”, Reviews of Geophysics, Vol. 29, pp. 358–370. Knox, E.G. (2006), “Roads, Railways and Childhood Cancers”, Journal of Epidemiology and Community Health, Vol. 60(2), pp. 136–141. Knutsen, S., Shavlik, D., Chen, L.H., Beeson, W.L., Ghamsary, M. and Petersen, F. (2004), “The Association between Ambient Particulate air Pollution Levels and Risk of Cardiopulmonary and All-cause Mortality during 22 Years Follow-up of a Non-smoking Cohort”, Epidemiology, Vol. 15(4), p. 45. Laltlanchhuang, S.K. (2006), “Studies of the Impact of Disturbance on Secondary Productivity of Forest Ecosystem with Special Reference to Surface, Sub-surface Litter Insect and Other non-insect Groups”, M.Sc. dissertation. Mizoram University. Le Tertre, A., Medina, S., Samoli, E., Forsberg, B., Michelozzi, P. and Boumghar, A. (2002), “Short-term Effects of Particulate Air Pollution on Cardiovascular Diseases in Eight European Cities”, Journal of Epidemiology and Community Health, Vol. 56, pp. 773–779. Maher, B.A. and Matzka, J. (1999), “Magnetic Biomonitoring of Roadside Tree Leaves, Identification of Spatial and Temporal Variation in Vehicle Derived Particulates”, Atmospheric Environment, Vol. 33, pp. 4565–4569. Maher, B.A. and Thompson, R. (1999), Quaternary, Climates, Environments and Magnetism. Cambride University Press, p. 390. Maher, B.A., Mitchell, R. and Kinnersley, R. (2010), “High-resolution Magnetic Biomonitoring: A Quantitative Surrogate for Particulate Pollution”, CLIMAQS Workshop ‘Local Air Quality and its Interactions with Vegetation’. Morawska, L. and Zhang, J. (2002), “Combustion Sources of Particles 1. Health Relevance and Source Signatures”, Chemosphere, Vol. 49, pp. 1045–1058. Moreno, E., Sagnotti, L., Dinares-Turell, J., Winkler, A. and Cascella, A. (2003), “Biomonitoring of Traffic Air Pollution in Rome using Magnetic Properties of Tree Leaves”, Atmospheric Environment, Vol. 37, pp. 2967–2977. Muxworthy, A.R., Matzka, J., Davila, A.F. and Petersen, N. (2003), “Magnetic Signature of Daily Sampled Urban Atmospheric Particles”, Atmospheric Environment, Vol. 37, pp. 4163–4169. Pope, III. C.A., Burnett, R.T., Thun, M.J., Calle, E.E., Krewski, D., Ito, K. and Thurston, G.D. (2002), “Lung Cancer, Cardiopulmonary Mortality and Long-term Exposure to Fine Particulate Air Pollution”, Journal of American Medical Association, Vol. 287(9), pp. 1132–1141. Power, A.L., Worsley, A.T. and Booth, C. (2009), “Magneto-biomonitoring of Intra-urban Spatial Variations of Particulate Matter using Tree Leaves”, Environ Geochem Health, Vol. 31, pp. 315–325. Rai, P.K. (2013), “Environmental Magnetic Studies of Particulates with Special Reference to Biomagnetic Monitoring using Roadside Plant Leaves”, Atmospheric Environment, Vol. 72, pp. 113–129. Robinson, S.G. (1986), “The Late Pleistocene Palaeoclimatic Record of North Atlantic Deep-sea Sediments Revealed by Mineral-Magnetic Measurements”, Physics of the Earth and Planetary Interiors, Vol. 42 (1–2), pp. 22–47. Schwartz, J. (1996), “Air pollution and Hospital Admissions for Respiratory Disease”, Epidemiology, Vol. 7(1), pp. 20–28. Sun, Z., Hu, S. and Ma, X. (1996), “A Rock-magnetic Study of Recent Lake Sediments and its Palaeoenvironmental Implication”, Acta Geophysica Sinica, Vol. 39(2), pp. 178–187. Thompson, R. (1986), “Modelling Magnetization Data using SIMPLEX”, Phys. Earth Planet. Inter, Vol. 42, pp. 113–127. Thompson, R. and Oldfield, F. (1986) Environmental magnetism. Allen and Unwin, London, p. 227. Urbat, M., Lehndorff, E. and Schwark, L. (2004), “Biomonitoring of Air Quality in Cologne Conurbation using Pine Needles as a Passive Sampler”, Part I: Magnetic Properties”, Atmospheric Environment, Vol. 38, pp. 3781–3792. Walden, J. (1999), “Sample Collection and Preparation”, In J. Walden, F. Oldfield and J.P. Smith (Eds.), Environmental Magnetism: A Practical Guide, Cambridge, England: Quaternary Research Association. No. 6, pp. 26–34. Yin, G., Hu., S., Cao, L., Roesler, W. and Appel, E. (2013), “Magnetic Properties of Tree Leaves and their Significance in Atmospheric particle Pollution in Linfen City, China”, Chinese Geographical Science, Vol. 23(1), pp. 59–72. Yu, L., Xu, Y. and Zhang, W. (1995), “Magnetic Measurement on Lake Sediment and its Environmental Application”, Progress in Geophysics, Vol. 10(1), pp. 11–22. Zhang, C.X., Huang, B.C., Li, Z.Y. and Liu, H. (2006), “Magnetic Properties of Highroad-Side Pine Tree Leaves in Beijing and their Environmental Significance”, Chinese Science Bulletin, Vol. 51(24), pp. 3041–3052.

226
32 Integrated Impact on Urpod Beel of Goalpara District, Assam
Sarma Brindaban
Department of Geography, Deomornoi Degree College, Darrang, Assam
E-mail: [email protected]
1. Introduction Wetlands have been identified as one of the most important natural resources associated with the distribution of human settlements from the dawn of human civilization. Wetlands are shallow water bodies with abundance of water in static or dynamic, maintaining natural biodiversity which may include lakes, estuaries, mangroves, flood plain etc. with a distinct and separate ecosystem for the aquatic and terrestrial areas. According to the International Union for the Conservation of Nature (IUCN), wetlands can be defined as, ‘all the submerged or water saturated lands, natural or manmade, inland or coastal, permanent or temporary, static or dynamic, vegetated or non-vegetated which necessarily have a land–water interface are defined as wetlands.’ Besides providing drinking water as well as raising crops in paddy field, wetlands have been helping to man in various ways like controlling food, ground-water, improvement of biological diversity and generating employment through pisciculture etc. These unique water-bodies known as wetland which supports their own ecosystems are threatened with lots of pressure which are mainly biotic and abiotic in nature, resulting in loss of biodiversity. Biotic pressure results in uncontrolled siltation and proliferation of aquatic and other weeds like water hyacinth and consequent loss and destruction of habitat which reduce food and fish availability and resultant decline in the number of migratory birds visiting the area. Thus, the concern for conservation of wetlands which encompasses diversely unique and heterogeneous assemblage of the habitats is of utmost significance. The Government of India has acknowledged the importance of protection of such water-bodies and thus framed the Wetland Conservation Programme in the year of 1985–1986, in consultation with state government concerned to control degradation and shrinkage of such water-bodies due to siltation, weed infestation and encroachment and the consequent decline in biodiversity. The United Nations Charter of 1945 marked the beginning of modern international human rights law, whereas the Stockholm Declaration of 1972 is generally seen as the starting point of a right based approach to environmental protection. This declaration formulated several principles including that, ‘Men have the fundamental right to freedom, equality and adequate condition of life, in an environment of a quality that permits a life of dignity and well-being, and he bears a solemn responsibility to protect and improve the environment for present and future generation.’ 2. Geographic Setting of the Study Area Urpod beel, situated at a distance of half km from Agia in Goalpara District of Assam, is the largest beel in lower Assam and has been incorporated in Asian Wetland Directory Scot (1988). The study area is a part of Balijana and Matia revenue circle which is situated between 26005’05“ N to 26006’45“ N latitude and 90037’45“ E to 90038’50“ E longitude, covering an area of 649.37 hac.

Integrated Impact on Urpod Beel of Goalpara District, Assam
227
Surrounded by Brahmaputra river in north and East Garo Hills in South Jinari river in the east and Agia hills in the west. The wetland area is surrounded by NH-37 in the south-west and north and passes along the wetland with L-shape in the south-west corner. The beel is surrounded by the villages, Agia, Kalpani , Chamaguri, Garo Kuta etc. On the eastern side of the wetland, it is surrounded by paddy field of the villages like Moijunga, Goroimari, Kurowa Bhasa etc.
Fig. 1: Location Map of Urpod Beel and its Neighbouring Area Urpod beel is connected by small drain with another beel located nearby it, known as Patkata beel, River Jinjiram originates from Urpod beel at its south and flows westward and meets at Brahmaputra. It acts as an inlet of the beel. Another river Jinari, also known as Balbala, after originating from Garo Hills of Meghalaya in the southern side passes by the side of the Urpod beel to the north and north-east direction and meets at Brahmaputra. 3. Objectives of the Study 1. To know about the changes taking place in wetland ecosystem. 2. To examine the natural and anthropogenic causes responsible for degradation of wetland. 3. To find out the development potentialities of the wetland. 4. To examine the nature of human interference in the study area. 4. Database and Methodology The present paper attempts to discuss and analyze some of the issues related to the causes and consequences and the environmental changes that are threat to ecological diversity of the Urpod beel. The primary data are collected from the field and secondary data are obtained from various government and non-government sources from time-to=time and relevant publications. The study deals around with the environmental change in the area in local context. It also makes an attempt to identify the root cause leading to change in wetland and human-right also. And the study also attempts to identify the natural and anthropogenentic causes behind the loss of ecosystem and bio-diversity in the study area. It also provides suggestion to remedial measure of protected wetland ecosystem and bio-diversity.

National Seminar on Management of Natural Resources for Sustainable Development: Challenges and Opportunities
228
5. Challenges to Wetland Environment Urpod beel enriched a variety of floral and faunal species which increase its importance as a biodiversity area. The fauna consist of variety of fishes and other aquatic animals which are valuable. The beel falls on traditional corridor for elephant population residing in Meghalaya and comes to the plains of Goalpara district during winter. The beel acts as a winter passage for the elephant. It is found that earlier, the elephants visited the area frequently rather than once in winter may be due to scarcity of food in west Garo hills of Meghalaya. Different local fish species are found in the Urpod beel. The most momentous part of the study in Urpod beel was the bird diversity of the area and their associated habitats. The habitat of Urpod beel supports different species of water birds. More than sixty (60) species of water birds visit the area in winter season. Some of the globally threatened bird species such as White Backed Vulture, White Bellied Heron, Adjustant Stroke and some other common birds like Little Grebe, Purple Heron, Open Billed Stork, Greylag Gresse, Spot Bill Duck, Mallard, Gadwall, Red Crested Poachard, Pintail, Oriental Darter, Marsh Harrier, Indian Purple Moorhen, Red-Wattled Lapwing, White Breasted Kingfisher, Grey Wagtail etc., which are quite common in the beel. The most significant species found there is the identification of a variety of ducks. A variety of migratory birds also are found in this region. So far, no detailed survey has been undertaken to determine the floral and faunal biodiversity of the beel area. The migratory birds generally come from the other parts of India and abroad during winter season to feed upon the abundant fishes in the beel. But the rate of migratory birds has decreased due to decrease of fish in the beel. 6. Degradation of Wetland Environment The wetland eco-system, though highly efficient, is very fragile and easily disturbed by human interference. Toxic substances produced as a result of human activities may run off with water to be accumulated in the wetlands. This will poison the water and kill living organisms. Agricultural practice on the banks as well as the shallower parts of wetlands and cattle rearing produce not only siltation, but also makes the water murky. This results in decreased available sunlight for the micro-flora, thereby diminishing the bio-productivity of the wetland. Extensive fishing methods too kill, or generally damage the micro-flora resulting in poorer crop in the next year encouraging man to indulge in more intensive fishing which leads to the destruction at the wetland ecosystem within a remarkably short time. Major causes of degradation of wetland environment are manmade and natural. Manmade causes are encroachment, overfishing, bird hunting, ecological degradation and developmental works by government, natural causes of degradation of wetland environment are siltation, draught and flood.
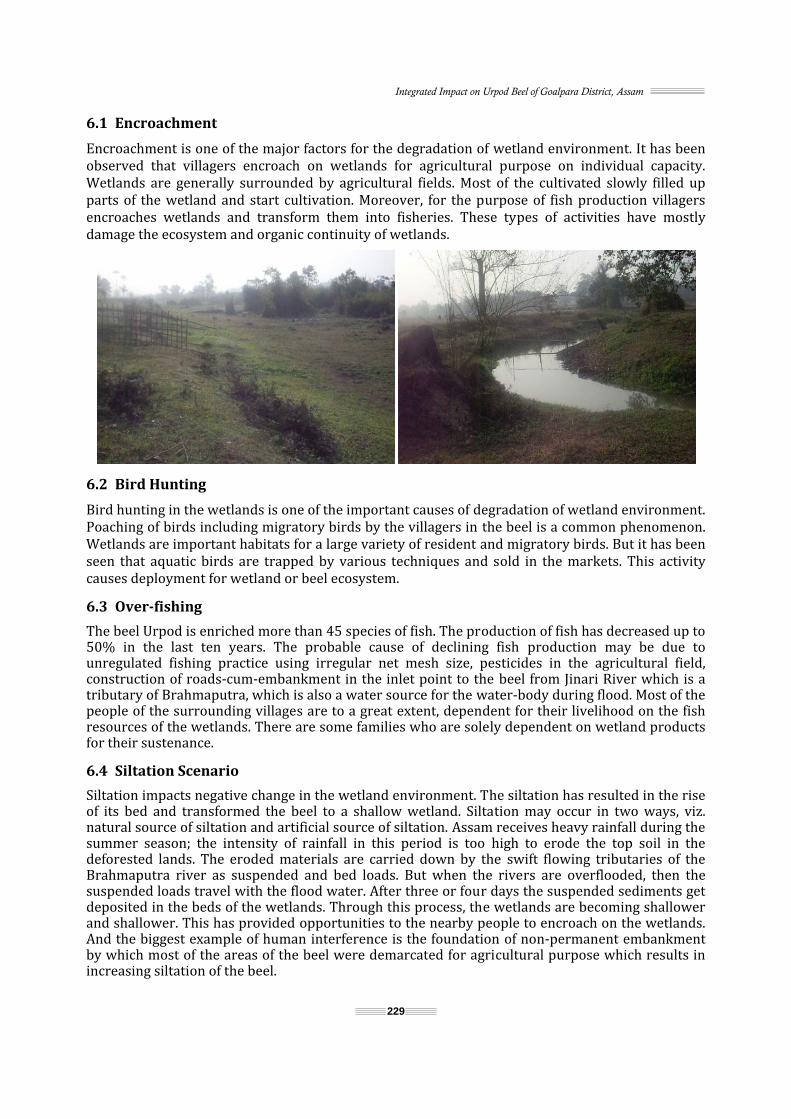
Integrated Impact on Urpod Beel of Goalpara District, Assam
229
6.1 Encroachment Encroachment is one of the major factors for the degradation of wetland environment. It has been observed that villagers encroach on wetlands for agricultural purpose on individual capacity. Wetlands are generally surrounded by agricultural fields. Most of the cultivated slowly filled up parts of the wetland and start cultivation. Moreover, for the purpose of fish production villagers encroaches wetlands and transform them into fisheries. These types of activities have mostly damage the ecosystem and organic continuity of wetlands.
6.2 Bird Hunting Bird hunting in the wetlands is one of the important causes of degradation of wetland environment. Poaching of birds including migratory birds by the villagers in the beel is a common phenomenon. Wetlands are important habitats for a large variety of resident and migratory birds. But it has been seen that aquatic birds are trapped by various techniques and sold in the markets. This activity causes deployment for wetland or beel ecosystem. 6.3 Over-fishing The beel Urpod is enriched more than 45 species of fish. The production of fish has decreased up to 50% in the last ten years. The probable cause of declining fish production may be due to unregulated fishing practice using irregular net mesh size, pesticides in the agricultural field, construction of roads-cum-embankment in the inlet point to the beel from Jinari River which is a tributary of Brahmaputra, which is also a water source for the water-body during flood. Most of the people of the surrounding villages are to a great extent, dependent for their livelihood on the fish resources of the wetlands. There are some families who are solely dependent on wetland products for their sustenance. 6.4 Siltation Scenario Siltation impacts negative change in the wetland environment. The siltation has resulted in the rise of its bed and transformed the beel to a shallow wetland. Siltation may occur in two ways, viz. natural source of siltation and artificial source of siltation. Assam receives heavy rainfall during the summer season; the intensity of rainfall in this period is too high to erode the top soil in the deforested lands. The eroded materials are carried down by the swift flowing tributaries of the Brahmaputra river as suspended and bed loads. But when the rivers are overflooded, then the suspended loads travel with the flood water. After three or four days the suspended sediments get deposited in the beds of the wetlands. Through this process, the wetlands are becoming shallower and shallower. This has provided opportunities to the nearby people to encroach on the wetlands. And the biggest example of human interference is the foundation of non-permanent embankment by which most of the areas of the beel were demarcated for agricultural purpose which results in increasing siltation of the beel.
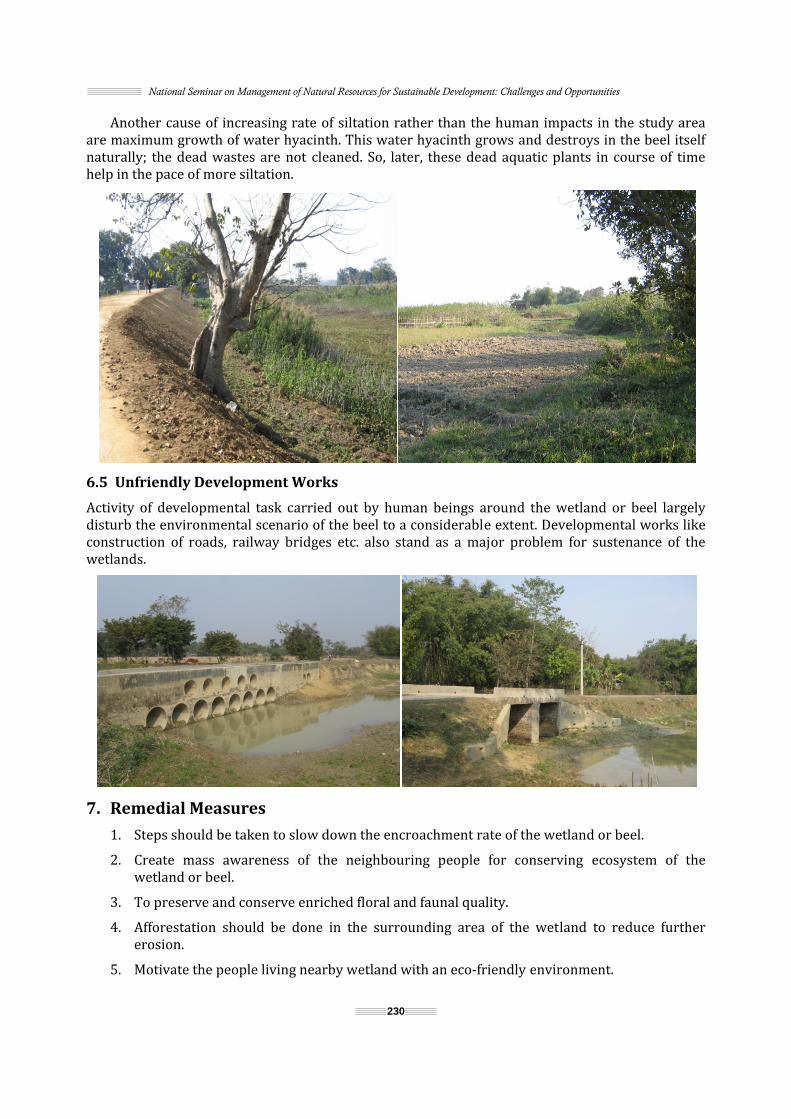
National Seminar on Management of Natural Resources for Sustainable Development: Challenges and Opportunities
230
Another cause of increasing rate of siltation rather than the human impacts in the study area are maximum growth of water hyacinth. This water hyacinth grows and destroys in the beel itself naturally; the dead wastes are not cleaned. So, later, these dead aquatic plants in course of time help in the pace of more siltation.
6.5 Unfriendly Development Works Activity of developmental task carried out by human beings around the wetland or beel largely disturb the environmental scenario of the beel to a considerable extent. Developmental works like construction of roads, railway bridges etc. also stand as a major problem for sustenance of the wetlands.
7. Remedial Measures 1. Steps should be taken to slow down the encroachment rate of the wetland or beel. 2. Create mass awareness of the neighbouring people for conserving ecosystem of the wetland or beel. 3. To preserve and conserve enriched floral and faunal quality. 4. Afforestation should be done in the surrounding area of the wetland to reduce further erosion. 5. Motivate the people living nearby wetland with an eco-friendly environment.

Integrated Impact on Urpod Beel of Goalpara District, Assam
231
8. Conclusion Environmental right is a civil right. In addition to changing the way, plan for future, need to inculcate the concept that every citizen has a right to safe and healthy environment. People must understand that they own the environment and that they have right to clean environment. The community of living being is affected when somebody damages the environment. Good environmental policy is identical to good economic policy, almost one hundred percent of the time. Destruction of environmental ecosystem impacts on medical, agriculture, and culture etc. That is particularly true for our country because this country has a great connection to nature, greater than any of the major industrialized countries. References Baruah, P. and Goswami, D.C. (1997), Status of Wetland of Assam—A Study using Remote Sensing Techniques, Guwahati. Bhagabati, A.K., Kar, B.K. and Bora, A.K. (2007), Geography of Assam, Rajesh Publications, New Delhi. Bhattacharyya, N.N. (2005), North East India, Rajesh Publication, New Delhi. Sharma, P. and Goswami, D.C. (1995), Geo-Environmental Studies of Selected Beels (Wetlands), Indian Geomorphology and
Resource Mnagement, Ed-S.R. Jog, Jawahar Nagar, Jaipur, India, Vol. II. Taher, M. and Ahmed, P. (2007), Geography of North East India, Mani Manik Prakash, Guwahati. http://www.globalresponse.org/gra.php?i=1/08 Protect Wetland Bird Paradise/India, [n.d].

232
33 The Effect of Disaster in Agriculture of Uttarakhand Hills with Special Reference to 16–18 June 2013
M.S. Negi1 and S.P. Sati2 1Department of Geography
HNB Garhwal University, Srinagar Garhwal, Uttarakhand 2Department of Geology,
HNB Garhwal University, Srinagar Garhwal, Uttarakhand E-mail: [email protected] Uttarakhand is located between 28°43’–31°27’ N latitudes and 77°34’–81°02’ E longitudes. The river Tons separates the state from Himachal Pradesh in the north-west, whereas river Kali separates it from Nepal in the east. In the north, it is separated by an international boundary between India and China. Foot-hills in the south are bound by Uttar Pradesh. The region, being situated centrally in the long sweep of the Himalaya, forms a transitional zone between the per-humid eastern and the dry to sub-humid western Himalaya. Uttarakhand became the 27th state of the Republic of India on 9 November 2000. The state, being its most of the part in the Himalaya, is a multi-hazard prone region of India. The main hazards are earthquake, flash flood, cloudburst, landslides. drought and forest fires. In the event of June 2013, a multi-day cloudburst centred on the North Indian state of Uttarakhand caused devastating floods and landslides in the country’s worst natural disaster. Parts of Himachal Pradesh, Haryana, Delhi and Uttar Pradesh in India, some regions of Western Nepal, and some parts of Western Tibet also experienced heavy rainfall, but over 95% of the casualties occurred only in Uttarakhand. Destruction of bridges and roads left about 100,000 pilgrims and tourists trapped in the valleys leading to complete destruction of three of the four Hindu Chota Char Dham pilgrimage sites. The Indian Air Force, the Army and paramilitary troops evacuated more than 110,000 people from the flood ravaged area. From 14 to 17 June 2013, the Indian state of Uttarakhand and adjoining area received heavy rainfall, which was about 375% more than the benchmark rainfall during a normal monsoon. This caused the melting of Chorabari Glacier at the height of 3800 metres, and eruption of the Mandakini river which led to heavy floods near Gobindghat, Kedar Dham, Rudraprayag district, Uttarakhand, Himachal Pradesh and Western Nepal, and acute rainfall in other nearby regions of Delhi, Haryana, Uttar Pradesh and some parts of Tibet. The upper Himalayan territories of Himachal Pradesh and Uttarakhand are full of forests and snow-covered mountains and thus remain relatively inaccessible. They are home to several major and historic Hindu and Sikh pilgrimage sites, besides several tourist spots and trekking trails. Heavy rainfall for four consecutive days as well as melting snow aggravated the floods. Warnings by the India Meteorological Department predicting heavy rains were not given wide publicity beforehand, causing thousands of people to be caught unawares, resulting in huge loss of life and property. In the city of Dehra Dun, capital of Uttarakhand, this was the wettest June day for over five decades.
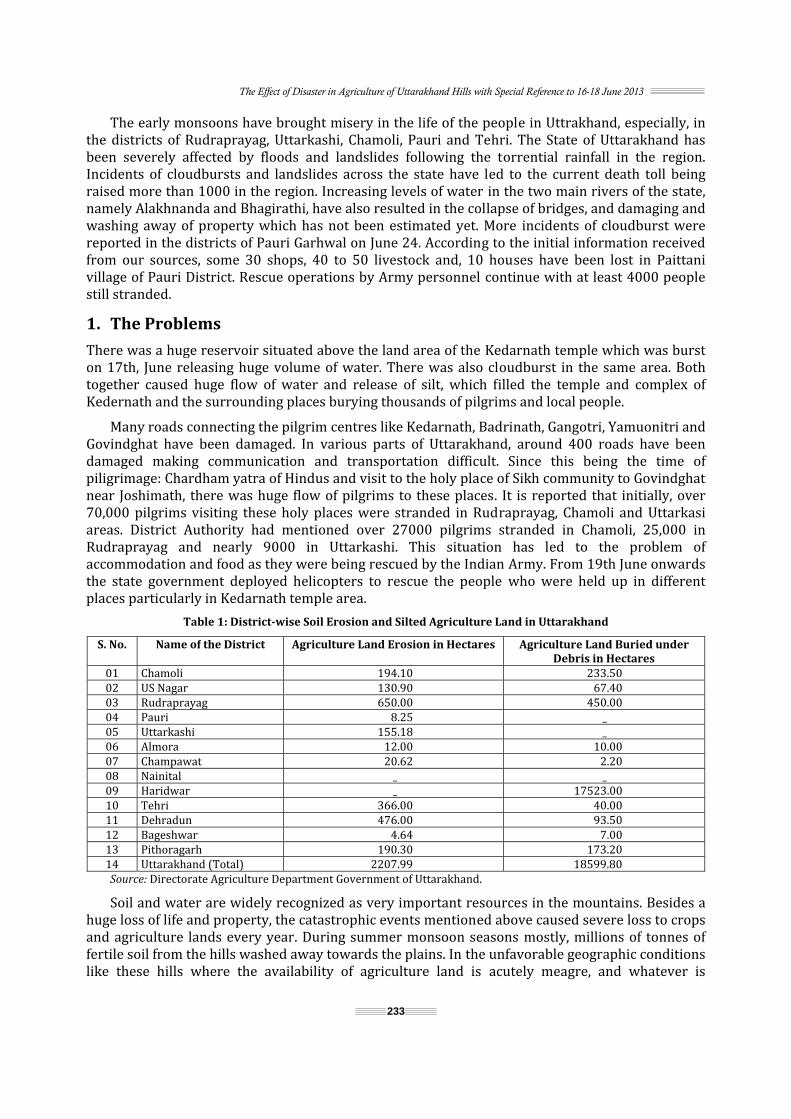
The Effect of Disaster in Agriculture of Uttarakhand Hills with Special Reference to 16-18 June 2013
233
The early monsoons have brought misery in the life of the people in Uttrakhand, especially, in the districts of Rudraprayag, Uttarkashi, Chamoli, Pauri and Tehri. The State of Uttarakhand has been severely affected by floods and landslides following the torrential rainfall in the region. Incidents of cloudbursts and landslides across the state have led to the current death toll being raised more than 1000 in the region. Increasing levels of water in the two main rivers of the state, namely Alakhnanda and Bhagirathi, have also resulted in the collapse of bridges, and damaging and washing away of property which has not been estimated yet. More incidents of cloudburst were reported in the districts of Pauri Garhwal on June 24. According to the initial information received from our sources, some 30 shops, 40 to 50 livestock and, 10 houses have been lost in Paittani village of Pauri District. Rescue operations by Army personnel continue with at least 4000 people still stranded. 1. The Problems There was a huge reservoir situated above the land area of the Kedarnath temple which was burst on 17th, June releasing huge volume of water. There was also cloudburst in the same area. Both together caused huge flow of water and release of silt, which filled the temple and complex of Kedernath and the surrounding places burying thousands of pilgrims and local people. Many roads connecting the pilgrim centres like Kedarnath, Badrinath, Gangotri, Yamuonitri and Govindghat have been damaged. In various parts of Uttarakhand, around 400 roads have been damaged making communication and transportation difficult. Since this being the time of piligrimage: Chardham yatra of Hindus and visit to the holy place of Sikh community to Govindghat near Joshimath, there was huge flow of pilgrims to these places. It is reported that initially, over 70,000 pilgrims visiting these holy places were stranded in Rudraprayag, Chamoli and Uttarkasi areas. District Authority had mentioned over 27000 pilgrims stranded in Chamoli, 25,000 in Rudraprayag and nearly 9000 in Uttarkashi. This situation has led to the problem of accommodation and food as they were being rescued by the Indian Army. From 19th June onwards the state government deployed helicopters to rescue the people who were held up in different places particularly in Kedarnath temple area.
Table 1: District-wise Soil Erosion and Silted Agriculture Land in Uttarakhand
S. No. Name of the District Agriculture Land Erosion in Hectares Agriculture Land Buried underDebris in Hectares 01 Chamoli 194.10 233.50 02 US Nagar 130.90 67.40 03 Rudraprayag 650.00 450.00 04 Pauri 8.25 _ 05 Uttarkashi 155.18 _ 06 Almora 12.00 10.00 07 Champawat 20.62 2.20 08 Nainital _ _ 09 Haridwar _ 17523.00 10 Tehri 366.00 40.00 11 Dehradun 476.00 93.50 12 Bageshwar 4.64 7.00 13 Pithoragarh 190.30 173.20 14 Uttarakhand (Total) 2207.99 18599.80
Source: Directorate Agriculture Department Government of Uttarakhand. Soil and water are widely recognized as very important resources in the mountains. Besides a huge loss of life and property, the catastrophic events mentioned above caused severe loss to crops and agriculture lands every year. During summer monsoon seasons mostly, millions of tonnes of fertile soil from the hills washed away towards the plains. In the unfavorable geographic conditions like these hills where the availability of agriculture land is acutely meagre, and whatever is

National Seminar on Management of Natural Resources for Sustainable Development: Challenges and Opportunities
234
available that too though is quite fertile and with good irrigation facilities but is at the lower reaches i.e. at the banks of the rivers, hence quite vulnerable to soil erosion. In the recent catastrophe of 16–18 June 2013, for example at per hectare of land, about one thousand tones of fertile soil is washed away from the Kedar Valley, also known as Mandakini Valley after the river draining in the region (Ref) while average soil loss per hectare in Uttarakhand is less than 25 tons per year. It is further noticeable that this average is already 15 tonnes more than the national average. According to an estimate made by scientists of Central Soil and Water Conservation Research and Training Institute, if some urgent remedial measures are not made, the recovery of this much loss of soil cannot happen in next 1000 years. As it is a known fact, the loss of soil is in a real sense a loss of possibility of life. Table 2: Sediment Load in the Rivers Due to Soil Erosion
Date Soil Load/Lit of River Water 14 June 2013 0.462mg15 June 2013 1.280mg16June 2013 18.896mgSource: Central soil and water conservation research and training institute The fact remains that besides the harms of soil loss; the soil load in the rivers is seriously harmful for the aquatic flora and fauna. The most baffling fact about the hills of Uttarakhand state is that already there is a serious crisis of cultivable land and this event of flashflood magnified the crisis manifold. It is further noticeable that though in Haridwar district, human casuality in the present event of flash-flood has not been reported so far but the loss of fertile soil has been much more and highest in Uttarakhand. In the months of June–July crops of Kharif and Jayad are grown hence the loss of these crops has been maximum whereas in the plains like Haridwar region the maximum loss occurred to sugarcane. Animal husbandry is another occupation in the hills besides agriculture. Thousands of cattle population viz. mules, horses, cows, ox, bulls, buffalos, sheep, goats etc. are either killed or seriously injured in the calamity, which cause serious occupational loss to the people. For example, in the Kedar valley itself, approximately 2400 cattle population is in form of unclaimed and thousands are missing. Besides the loss discussed above, a large number of irrigation canals are also damaged, which further causes severe hindrance in the agricultural practices. According to an estimate, about 1976 smaller and larger canals are damaged with a loss of Rs. 210 crore approximately. This indicates that the hindrance to agricultural practices even in the available land will also be considerably in years to come. In another district which is severely affected with the calamity is Uttarkashi. The upper belt of the district, right from Sukki-Harsil-Mukhua, Dharali, area where apple, rajma and potato are grown in thousands of hectare land is severely affected causing serious loss of bread and butter. The loss has been multifaceted, i.e. loss of crops, field, and transportation because of damage to the motor roads and footpaths. According to an estimation made for Hersil region, about 5000 metric tons of apple and 3000 metric tons of potato are grown in about 365 hectares; most of the part of the crops was destroyed either due to heavy rains or due to lack of transportation means. Off-seasonal vegetable production has been another way of income developed in last few years in the region. Due to damage to the roads due to recent calamity, these crops are either destroyed in fields itself or on the way to market, which in one hand caused a net monitory loss to the farmers while on the another hand it caused a multifold increase of prices in the market.

The Effect of Disaster in Agriculture of Uttarakhand Hills with Special Reference to 16-18 June 2013
235
2. Possible Remedial Measures 1. Most of the irrigated and fertile land lies in the banks of the major rivers or streams which are quite vulnerable to erosion. Realizing the fact, it is advisable to consider other options of occupation like, animal husbandry, horticultural practices on the upper reaches etc. 2. Massive programmes should be launched applying civil engineering and bio-engineering means to protect vulnerable areas for soil erosion i.e./river banks unstable slopes etc. 3. It is observed that proper drainage system of an area can reduce the risk of land sliding and soil erosion up to 40%. It is therefore advisable to ensure proper drainage in the hills. 4. In recent researches, a grass Vetiveria zizanoides (locally known as khus-khus) is found very useful in preventing land erosion. It is therefore recommended that the grafting and plantation of this grass should be massively promoted in the region. 5. Jute technique developed by Central Soil and Water Conservation Research Institute was found quite effective in soil conservation in the hills. The technique is equally useful in conserving the fertility of the soil. It is, therefore, recommended that this technique should be applied as much as possible in the region. References Banerjee, L. (2007), Effect of Flood on Agricultural Wages in Bangladesh: An Empirical Analysis World Development, Central Soil and Water Conservation Research and Training Institute, Directorate of Agriculture Department, Government of Uttrakhand. Disaster Mitigation and Management Center Dehradun. Johannes, Sauer (2011), Natural Disaster and Agricultural Individual Risk Preferences towards Flooding. Sivakumar, M.V.K., Impact of Natural Disaster in Agriculture on Overview, W.M.O. Geneva, Switzerland.

236
34 Altered Environments: Land Use Land Cover Change Due to Construction of Teesta Low Dam Project IV at Kalijhora, West Bengal
Phu Doma Lama, S.K. Bandooni and Laishram Mirana Devi
Shaheed Bhagat Singh (EVE) College, University of Delhi, New Delhi
E-mail: [email protected], [email protected]
1. Introduction Possiblism and determinist schools of thought have long argued about man–environment relationship. The study of this relationship and its complexities has become even more relevant in the context of drastic environmental changes including climate change and disasters. It must be noted that it is not only the natural environment but other living beings and their related livelihoods that get affected by these changes. Modification, or, in other words, altercation of immediate environments to serve human needs has been part and parcel of demographic and technological changes. The environment offers provisioning services: food, water, timber and fibre; regulating services such as protection against floods diseases; cultural service, aesthetic and spiritual; supporting services: soil formation, nutrient recycling and photosynthesis. (Ecosystems and Human Well-being Synthesis, 2005:9). The pace and extent of these environmental changes have advanced rapidly and in turn threaten the ecosystem services and in turn affecting human lives intertwined with these services. A very notable example of such changes is the dam-building processes in the wake of hydroelectricity production. Dam building processes in Indian context have largely been criticized on the grounds of environmental destruction and livelihood loss. Rampur dam of Himachal Pradesh, Tehri dam of Uttrakhand, Sindhol Hydroproject in Orissa, National Hydropower Project in Sikkim and others are a few examples where local communities have been up in arms against the construction of dams. (SANDRP, 2011). The study area discussed in the paper provides a glimpse of impact of such changes on ecosystem services in a fragile environment. The first part of the paper gives a brief introduction of the area under study; the second part provides a description of the land use land cover changes of the time period 2004–2013. Figures and tables have been utilized to exhibit changes along with maps. The paper ends with concluding remarks. 2. Study Area The objective of this paper is to assess the extent of land use land cover changes brought in by the construction of the dam to exemplify the altercation of environment to suit human needs even in a fragile geology. Two time periods were taken for this study, i.e. 2004 and 2013.

Altered Environments: Land Use Land Cover Change Due to Construction of Teesta Low Dam
237
3. Methodology
Field survey was also conducted for the study during which informal interviews were done.
Fig. 1: Location Map The watershed area under study is surrounded by Sittong forest in the west, Panbu forest in the east, Sivok hill forest, Gola forest in south and Barasit Tong Khasmahal and Rolak Khasmahal in the North (Google map 12/9/2013). The village most affected in this area due to construction of the Teesta low dam IV is Kalijhora. Kalijhora is a village in Darjeeling district of West Bengal. It is located along highway 31 A. Kalijhora was earlier known as ‘Kalitar’ when it was sparsely located and had no electricity supply. Geographically, it lies at an altitude of 300 m. It is 28 km from Siliguri, Bagdogra being the closest airport and New Jalpaiguri closest railway station. It is known for its picnic spots and camping activity. In terms of flora and fauna, Kalijora lies within the Kurseong Forest Division in Darjeeling district. This area is part of the eastern Himalayas where altitude plays a major role in influence vegetation type (Chaudhary, 1993). There are mainly four types of forests found: Mature Sal type,
Satellite Imagery Image Processing Arc Gis
Erdas Google Earth/ Cadastral Map Toposheet
Analysis
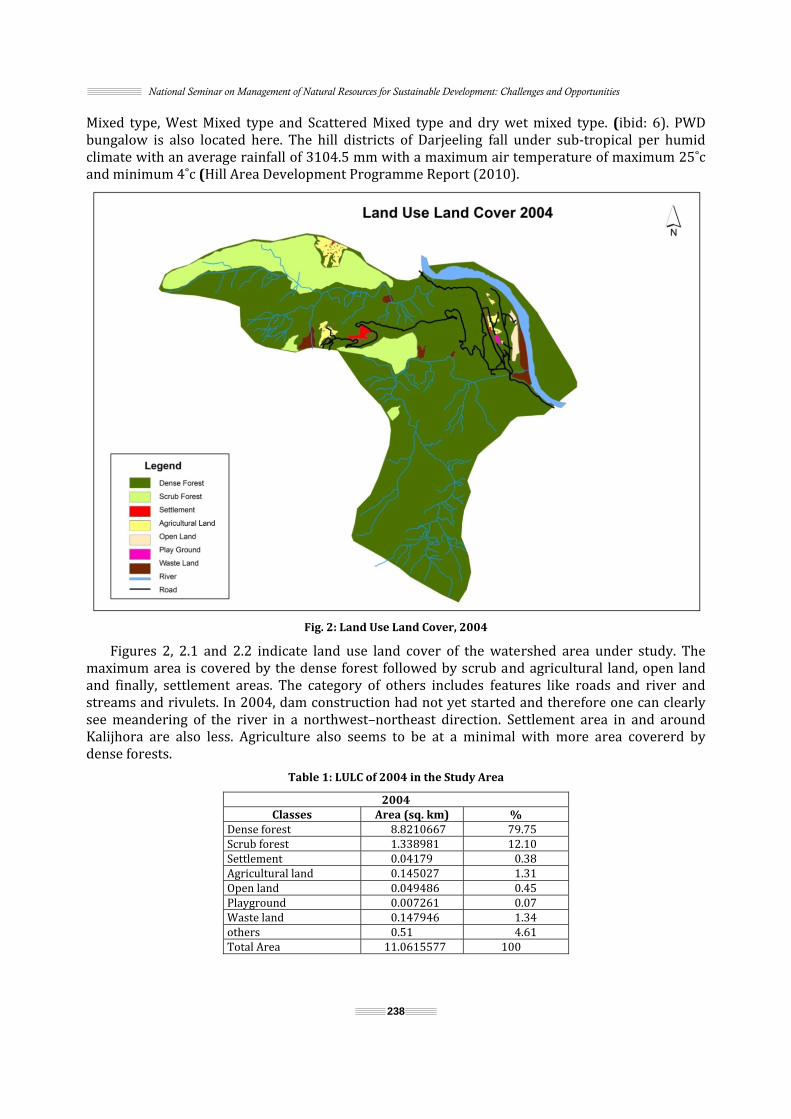
National Seminar on Management of Natural Resources for Sustainable Development: Challenges and Opportunities
238
Mixed type, West Mixed type and Scattered Mixed type and dry wet mixed type. (ibid: 6). PWD bungalow is also located here. The hill districts of Darjeeling fall under sub-tropical per humid climate with an average rainfall of 3104.5 mm with a maximum air temperature of maximum 25˚c and minimum 4˚c (Hill Area Development Programme Report (2010).
Fig. 2: Land Use Land Cover, 2004 Figures 2, 2.1 and 2.2 indicate land use land cover of the watershed area under study. The maximum area is covered by the dense forest followed by scrub and agricultural land, open land and finally, settlement areas. The category of others includes features like roads and river and streams and rivulets. In 2004, dam construction had not yet started and therefore one can clearly see meandering of the river in a northwest–northeast direction. Settlement area in and around Kalijhora are also less. Agriculture also seems to be at a minimal with more area covererd by dense forests. Table 1: LULC of 2004 in the Study Area
2004Classes Area (sq. km) %Dense forest 8.8210667 79.75Scrub forest 1.338981 12.10Settlement 0.04179 0.38Agricultural land 0.145027 1.31Open land 0.049486 0.45Playground 0.007261 0.07Waste land 0.147946 1.34others 0.51 4.61Total Area 11.0615577 100

Figurforest duhigh in thas areas Kmeanderithe river.res 3, 3.1 ande to human he figures. TKalijhora aning of the r
Altered
d 3.2 indicatactivities thThere has bend areas aroiver in its l
d Environments: L
Fig. 3: Lan
Fig. 4: Lante land use lhat includeseen completound it for tower half h
Land Use Land Co
239
nd Use Land C
nd Use Land Cland cover is agriculturete carving outhe construchas been shi
over Change Due t
over, 2004
over, 2013 ndicate thate and allied ut of forest ction of the ifted more l
to Construction of
t there has bactivities. Tarea (PanbuTeesta Lowleft side to
f Teesta Low Dam
been expandhe density ou Forest arew Valley damsituate the
ding scrub of roads is ea) as well m site. The dam near

Forest Scrub ForeSettlementAgriculturOpen LandPlay GrounWaste LanOthers Total
Forest Scrub ForeSettlementAgriculturOpen LandPlay GrounWaste LanOthers Total
National Semina
Classes est t re d nd nd
Classes est t re d nd nd
17%1%1%
ar on Managemen
Tab
Table
5%% 0%2%
nt of Natural Resou
ble 2: LULC of
Fig. 5: Lan
e 3: Comparis
200479.7512.100.381.310.450.071.344.61100
8%
urces for Sustainab
240
f 2013 in the A
2013Area (sq. km)7.31.90.530.180.070.010.20.8711.06
nd Use Land C
son of LULC be
ble Development:
Area under St
)
over, 2013
etween 2004–
201366.0017.184.791.630.630.091.817.87100
6
Challenges and Op
tudy
–2013
66%
pportunities
% 66.00362 17.17902 4.792043 1.627486 0.632911 0.090416 1.808318 7.866184 100
Change of -17.2441.981160.5224.4240.0028.5735.0770.71
ForestScrub ForestSettlementAgricultureOpen Land Play GroundWaste LandOthers
Rate4 8 2 2 0 7 7 1
t
d
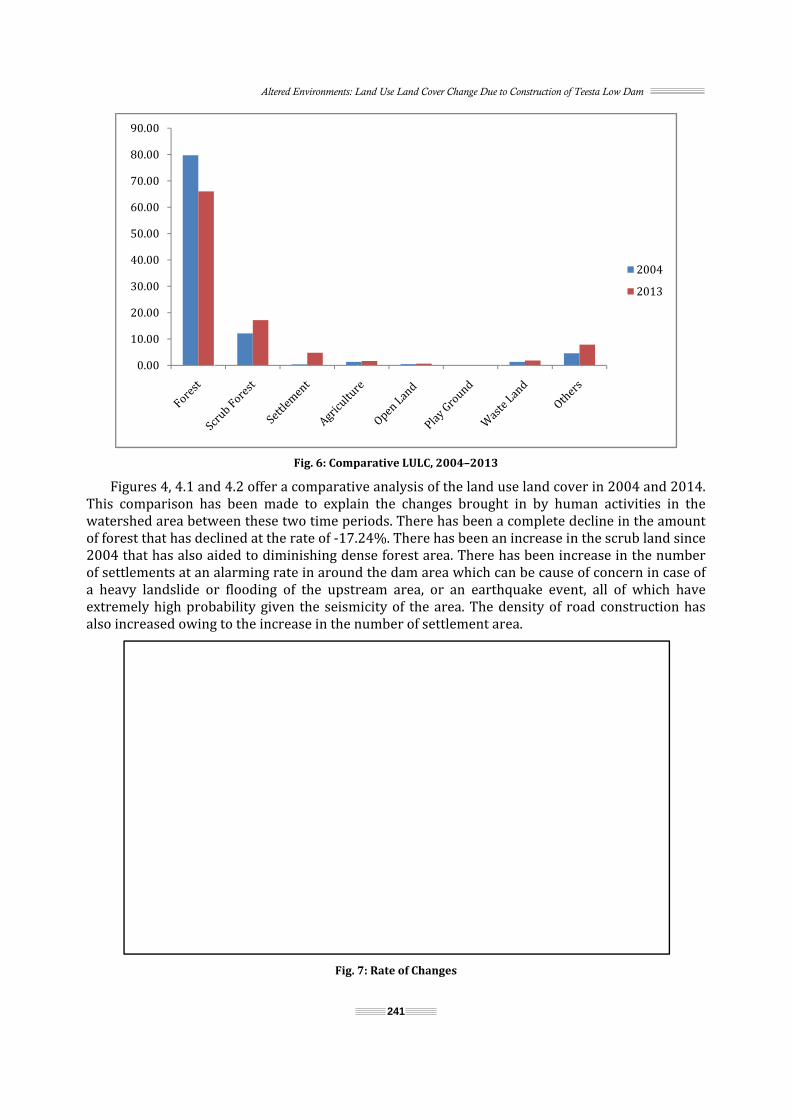
FigurThis comwatersheof forest t2004 thaof settlema heavy lextremelyalso incre
0102030405060708090
res 4, 4.1 andmparison haed area betwthat has dect has also aments at an alandslide ory high probeased owing
.00.00.00.00.00.00.00.00.00.00 Altered
d 4.2 offer as been madween these tclined at theided to dimalarming rar flooding obability giveg to the incre
d Environments: L
Fig. 6: Compa comparativde to explatwo time pe rate of -17.minishing dente in aroundof the upstrn the seismease in the n
Fig.
Land Use Land Co
241
parative LULCve analysis oin the chanriods. There24%. Therense forest ad the dam aream area,micity of thenumber of s
7: Rate of Cha
over Change Due t
C, 2004–2013of the land unges broughe has been ae has been anarea. There hrea which cor an earth area. The dettlement ar
anges
to Construction of
use land covht in by huma complete dn increase inhas been incan be causehquake evendensity of rrea.
f Teesta Low Dam
ver in 2004 man activitdecline in thn the scrub crease in the of concern nt, all of wroad constru
22
and 2014. ties in the he amount land since he number in case of hich have uction has
004013
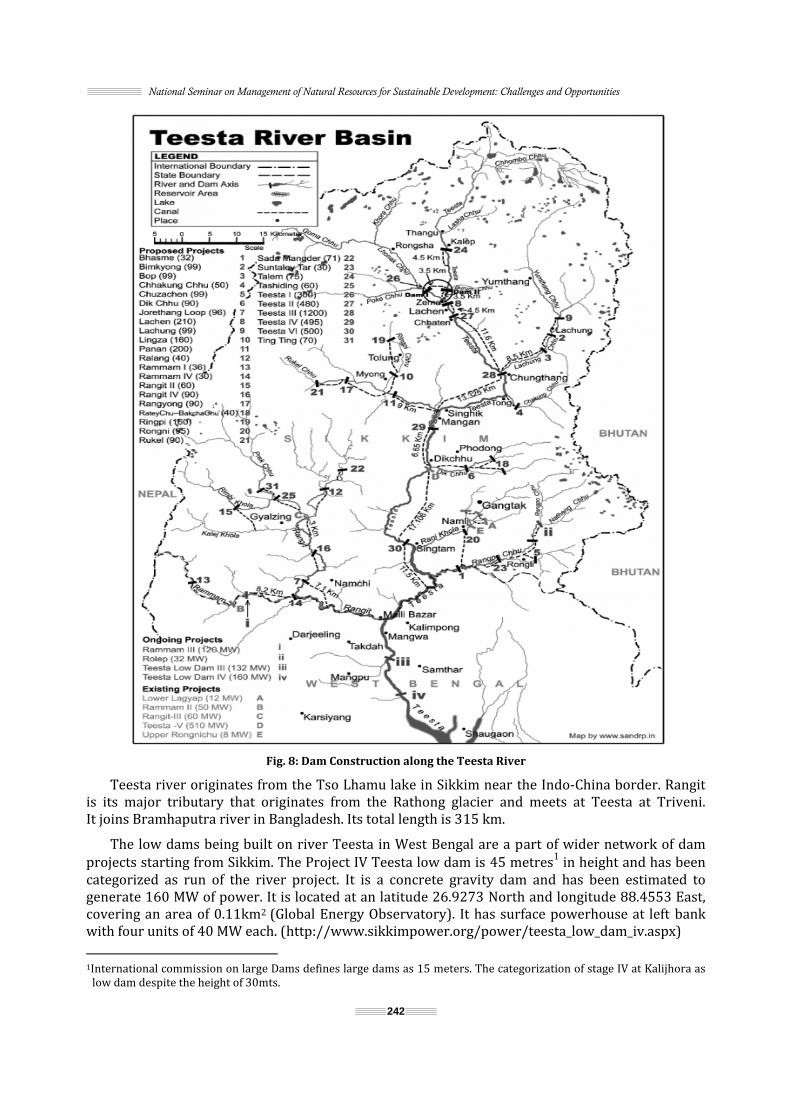
National Seminar on Management of Natural Resources for Sustainable Development: Challenges and Opportunities
242
Fig. 8: Dam Construction along the Teesta River Teesta river originates from the Tso Lhamu lake in Sikkim near the Indo-China border. Rangit is its major tributary that originates from the Rathong glacier and meets at Teesta at Triveni. It joins Bramhaputra river in Bangladesh. Its total length is 315 km. The low dams being built on river Teesta in West Bengal are a part of wider network of dam projects starting from Sikkim. The Project IV Teesta low dam is 45 metres1 in height and has been categorized as run of the river project. It is a concrete gravity dam and has been estimated to generate 160 MW of power. It is located at an latitude 26.9273 North and longitude 88.4553 East, covering an area of 0.11km2 (Global Energy Observatory). It has surface powerhouse at left bank with four units of 40 MW each. (http://www.sikkimpower.org/power/teesta_low_dam_iv.aspx) 1International commission on large Dams defines large dams as 15 meters. The categorization of stage IV at Kalijhora as low dam despite the height of 30mts.

Altered Environments: Land Use Land Cover Change Due to Construction of Teesta Low Dam
243
Construction of dams on river Teesta has not only been opposed on the grounds of displacement but also environmental unsoundness. It is an area prone to earthquakes and landslides. The construction of dam is expected to increase the seismicity of the fragile area, recurrence of landslides and floods due to upstream activities in Sikkim (The Times of India 2002, The Hindustan Times 2011). The building of reservoirs on upper reaches and the huge sediment load of the mighty Teesta has the potential of activating faults and cause river induced seismicity (Sharma, 2013). A Committee on Landslides had stated that no construction should take place along river Teesta, as it is seismically vulnerable zone. Geological Survey of India Report on the dams indicates accelerated soil erosion and events as well as damage to the Highway 31A. Wave of protests against the construction as well as the Environmental Impact Assessment Report of the project was made by Kalijhora Jankalyan Manch. NHPC was accused of manipulating the environmental reports so as to surpass environmental clearances. According to the letter issued by Teesta Sangharsh Samiti, EIA Report showed only 11 families in Kalijhora Bazaar as project affected whereas in the catchment areas there are approximately 12700 families residing on the right bank of Teesta that would be affected by the dam. Despite these protests, Teesta Low Dam Project IV was awarded environmental clearance by the Ministry of Environment and Forest in 2004. Already, the construction of dam has resulted in the removal of the picnic spot of Kalijhora that generated much income to the families of Kalijhora during seasons. Apart from this, supply of clean drinking water is a doubtful and the issue has been raised by village residents. The village receives only one hour of water supply by the NHPC in the morning and evening. Tussle between NHPC and the builders has resulted in halt of the ongoing work leaving locals unemployed who were formerly employed on a temporary basis at the work site. Among all workers which is approximately 95 only 2 were provided with permanent jobs by NHPC. The construction of dam, therefore, has resulted in huge income loss for the residents and jobs under extremely precarious conditions. 4. Conclusion It is clear from the above study that the environmental threat of dam construction poses the potential of destroying ecosystem services beyond repair. The process has already started with complete carving out of hill sides and the amount of erosion that it has caused. Therefore, it is essential to have a complete and detailed environmental assessment before construction of such dams. The pros and cons of the construction of such dams must not be pitted against economic growth but rather human wellbeing. After all the modifications of the environment is being done to meet human necessities. However, when such human necessities turn into greed human induced disaster is bound to occur. References Chaudhary, A.B. (1993), Forest Plants of Eastern India, Ashish Publishing House. Mukul, Malay (2007), “Timing of Recent out of Sequence Active Deformation of in the Frontal Himalayan Wedge: Insights from Darjeeling Sub Himalaya”, Geology, Vol. 35, pp. 999–1002. Reid, Walter V. (2005), Ecosystem and Human Well Being, Island Press. Report of the Evaluation Study on Hill Area Development Programme in Assam and West Bengal, 2010, Government of India. Sharma, Arunayan (2002), “Teesta Dam: A Recipe for Disaster”, April 17, Down to Earth. Sikkim Earthquake May have been Induced by Multiple Dams Across Teesta, September 21, 2011, Hindustan Times. “Teesta Dams and Sikkim Earth Quake, September 2011”, South Asia Network on Dams, Rivers and People, Vol. 9, Issue 8–9. Teesta Hydel Power Concern, April 17 2002, Times of India. http://globalenergyobservatory.org/
244
35 Morphometric and Hypsometric Analysis of Sairang Sub-basin for Natural Resources Management
Fuzal Ahmed and K. Srinivasa Rao Department of Geology, Mizoram University, Aizawl, Mizoram
E-mail: *[email protected]
1. Introduction Natural resources like land and water resources are normally reducing due to rapid increase in population, industrialization and urbanization; therefore, the optimal utilization of the resource is prerequisite for sustainable development. Natural resources management has acquired much significance for planned development of land and water resources and to arrest land degradation process to preserve environmental and ecological balance (Chakraborti, 2003). Remote sensing and GIS are effectively used techniques for integrated land and water resources development at grassroots level to address specific natural resources management issues (Diwakar and Mayya, 2010). To prepare a comprehensive land and water resources management plan, it becomes necessary to understand the topography, hydrological characters, erosional status and drainage pattern of the area. Drainage basins, catchments and watersheds are the fundamental units for land and water resources management, identified as planning units for administrative purposes to conserve natural resources (Moore et. al., 1994; Honore, 1999). Basin morphometry is a means of numerically analyzing or mathematically quantifying various aspects of drainage channel and its characteristics that can be measured for comparison which includes the number, length, drainage density and bifurcation of rivers as well as shape, area, relief and slope of the basin (Nag and Lahiri, 2011). Morphometric analysis of river basins and sub-basins in different parts of the globe have been studied using conventional methods made by Horton (1932, 1945), Smith (1950), Strahler (1952, 1964), Miller (1953), Schumm (1956) and Melton (1958). The hydrological response of a river basin can be interrelated with the physiographic characteristics of the drainage basin, such as size, shape, slope, drainage density and length of the streams etc. (Chorley, 1969; Gregory and Walling, 1973). The morphometric analysis of the study area have been carried out through the measurement of linear, areal and relief features of the drainage basin, which provides valuable information regarding the river characteristics, regional topography, drainage pattern, basin geometry, nature of bedrock, groundwater potential zones and landform features. The morphometric analysis of drainage basins or watersheds are also found to be a significant study in the groundwater development (Sreedevi et. al., 2005, 2009; Mishra et. al., 2011), watershed management and prioritization for soil and water conservation (Biswas et. al., 1999; Vittala et. al., 2008; Javed et. al., 2009), soil conservation (Thakkar and Dhiman, 2007), soil erosion (Bagyaraj and Gurugnanam, 2011), natural hazard management (Pankaj and Kumar, 2009; Chen and Yu, 2011) and land and water resources management (Tideman, 1996; Khan, 1999; Saxena and Prasad, 2008; Patel et. al., 2012). Integration of GIS and remote sensing data thereby provides an efficient method in investigation of morphometric parameters, geomorphic processes, hydrological characteristics and landform features for resource evaluation, analysis and management at river basin level. A proper understanding of the drainage characteristics is necessary for the evaluation of land and water resources so that appropriate development activities can be taken up on a sustainable basis.
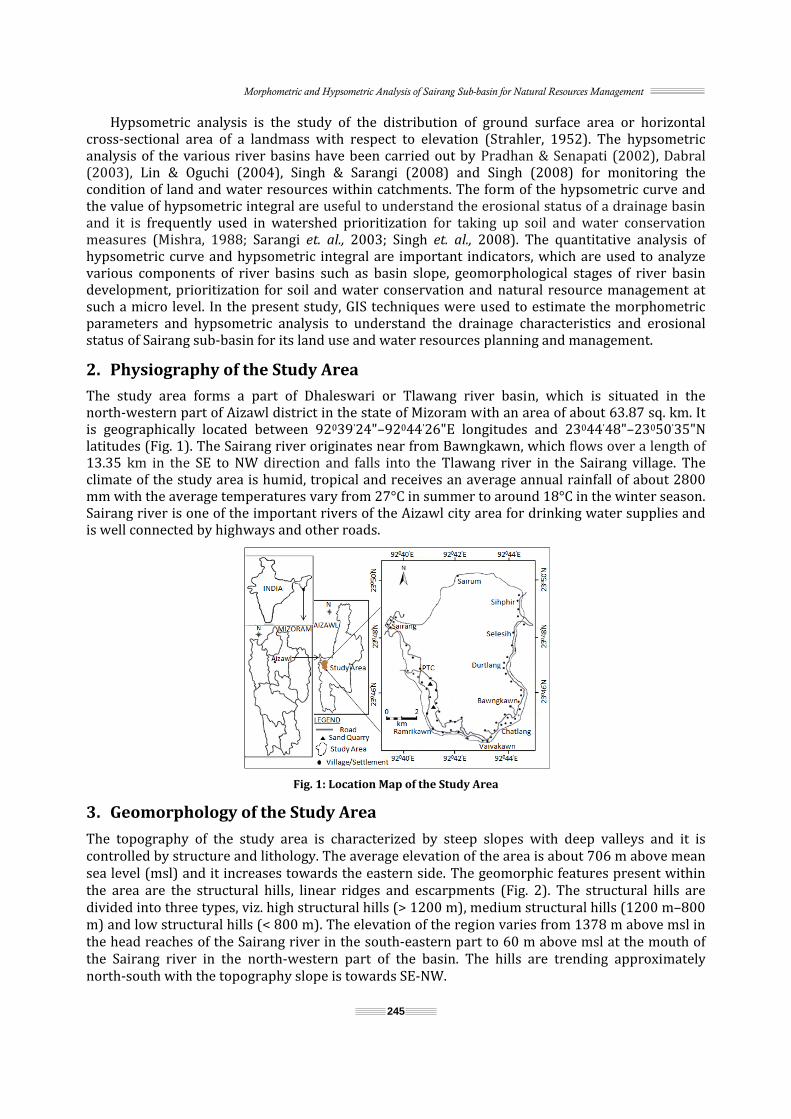
Morphometric and Hypsometric Analysis of Sairang Sub-basin for Natural Resources Management
245
Hypsometric analysis is the study of the distribution of ground surface area or horizontal cross-sectional area of a landmass with respect to elevation (Strahler, 1952). The hypsometric analysis of the various river basins have been carried out by Pradhan & Senapati (2002), Dabral (2003), Lin & Oguchi (2004), Singh & Sarangi (2008) and Singh (2008) for monitoring the condition of land and water resources within catchments. The form of the hypsometric curve and the value of hypsometric integral are useful to understand the erosional status of a drainage basin and it is frequently used in watershed prioritization for taking up soil and water conservation measures (Mishra, 1988; Sarangi et. al., 2003; Singh et. al., 2008). The quantitative analysis of hypsometric curve and hypsometric integral are important indicators, which are used to analyze various components of river basins such as basin slope, geomorphological stages of river basin development, prioritization for soil and water conservation and natural resource management at such a micro level. In the present study, GIS techniques were used to estimate the morphometric parameters and hypsometric analysis to understand the drainage characteristics and erosional status of Sairang sub-basin for its land use and water resources planning and management. 2. Physiography of the Study Area The study area forms a part of Dhaleswari or Tlawang river basin, which is situated in the north-western part of Aizawl district in the state of Mizoram with an area of about 63.87 sq. km. It is geographically located between 92039'24"–92044'26"E longitudes and 23044'48"–23050'35"N latitudes (Fig. 1). The Sairang river originates near from Bawngkawn, which flows over a length of 13.35 km in the SE to NW direction and falls into the Tlawang river in the Sairang village. The climate of the study area is humid, tropical and receives an average annual rainfall of about 2800 mm with the average temperatures vary from 27°C in summer to around 18°C in the winter season. Sairang river is one of the important rivers of the Aizawl city area for drinking water supplies and is well connected by highways and other roads.
Fig. 1: Location Map of the Study Area
3. Geomorphology of the Study Area The topography of the study area is characterized by steep slopes with deep valleys and it is controlled by structure and lithology. The average elevation of the area is about 706 m above mean sea level (msl) and it increases towards the eastern side. The geomorphic features present within the area are the structural hills, linear ridges and escarpments (Fig. 2). The structural hills are divided into three types, viz. high structural hills (> 1200 m), medium structural hills (1200 m–800 m) and low structural hills (< 800 m). The elevation of the region varies from 1378 m above msl in the head reaches of the Sairang river in the south-eastern part to 60 m above msl at the mouth of the Sairang river in the north-western part of the basin. The hills are trending approximately north-south with the topography slope is towards SE-NW.

National Seminar on Management of Natural Resources for Sustainable Development: Challenges and Opportunities
246
Fig. 2: Geomorphological Map of the Study Area
Fig. 3: Geological Map of the Area
4. Geology of the Area Geologically, the study area belongs to the Middle-Upper Bhuban Formations (Surma Group) of Lower to Middle Miocene age (Fig. 3). The rock types exposed in the area are siltstone-shale alteration, sandstone-siltstone alteration, thinly laminated shale-sandstone alteration, sandstone-shale alteration, thickly bedded sandstone, silty sandstone, massive yellow and grey sandstone, sandstone with thin shaly intercalation, sandstone with thin shale partings and splintery shales. The sandstones are grey to brown and yellowish in colour, fine to medium grained, occasionally massive compact, micaceous, relatively hard with cementing material of varying composition, viz. calcareous, siliceous and ferruginous. The shales and siltstones are also grey to brown in colour, fine to medium grained and micaceous (Tiwari et. al., 2007). 5. Drainage Patterns of the Study Area The drainage patterns of basin area have been observed as mainly trellis patterns which are characterized by elongated streams flowing parallel or sub-parallel to the major stream indicating that the topographical features are dipping and folded sedimentary rocks with highly jointed (Fig. 4).

Morphometric and Hypsometric Analysis of Sairang Sub-basin for Natural Resources Management
247
Fig. 4: Drainage Map of the Study Area
6. Methodology Survey of India toposheets No. 84A/9 and 84A/10 on 1:50,000 scale have been used for detailed study of the area. The drainage networks were delineated and digitized using ERDAS Imagine-9.1 and ArcGIS-9.1 softwares and the order was given to each stream according to Strahler (1964) stream ordering system. In this ordering system, streams with no tributaries are defined as first-order, when two first-order streams join to form a second-order stream and so on. The data extraction and analysis was carried out in GIS environment. The various morphometric parameters such as linear, areal and relief features were evaluated based on formula suggested by Horton (1932 & 1945), Miller (1953), Strahler (1956, 1957 & 1964), Melton (1957), Schumm (1956) and Faniran (1968). The hypsometric curve and hypsometric integral were estimated using Strahler (1952) and Pike & Wilson (1971) standard methods. 7. Results and Discussion The quantitative morphometric analysis of the river basin requires measurements of linear, areal and relief features of the basin area. The hypsometric analysis was carried out in the form of hypsometric curve and hypsometric integral, which are discussed below. 7.1 Linear Features of the Drainage Network Linear features include stream order, stream number, stream length, mean stream length, bifurcation ratio and their results are summarized in Table 1.
Table 1: Linear Features of Sairang Sub-basin
Stream Order (u)
Stream Number
(Nu)
Stream Length (Lu)
km
Log of Streams
Number Log (Nu)
Log of Stream
Lengths Log (Lu)
Mean Stream Length
(Lms) km
Bifurcation Ratio (Rb)
Mean Bifurcation Ratio (Rbm) 1st 226 137.25 2.36 2.14 0.61 4.61
4.17 2nd 49 38.18 1.69 1.59 0.78 4.08 3rd 12 17.45 1.07 1.25 1.46 6.00 4th 2 18.32 0.31 1.26 9.17 2.00 5th 1 2.15 0 0.34 2.15 - Total 290 213.35 - - - -

National Seminar on Management of Natural Resources for Sustainable Development: Challenges and Opportunities
248
7.1.1. Stream Order The first step in drainage basin analysis is stream ordering, which expresses as the hierarchal relationship between the single stream segments within a drainage network. In the present study, ranking of streams has been carried out based on the method proposed by Strahler (1964). Stream order of the whole river basin is of fifth order (Fig. 4). The total number of 290 streams were identified in the study area out of which 226 belong to 1st order, 49 are of 2nd order, 12 are of 3rd order, 2 are of 4th order and 1 is of 5th order. It reveals that the first order streams are highest in number and it is decreasing as the stream order is increasing (Table 1). 7.1.2. Stream Number The order-wise total number of stream segment is known as the stream number (Nu). Horton (1945) laws of stream numbers states that the number of stream segments of each order forms an inverse geometric sequence with plotted against order. Most drainage networks show a linear relationship with small deviation from a straight line. The plotting of logarithm of number of streams against stream order gives a straight line (Fig. 5a). This means that the number of streams usually decreases as the stream order increases
Fig. 5(a): Regression of Logarithms of Stream Numbers Versus Streams Order
Fig. 5(b): Regression of Logarithms of Streams Length Versus Streams Order
7.1.3. Stream Length It is the total length of streams in a particular order, known as stream length (Lu). The stream length has been measured based on the law proposed by Horton (1945) Table 1. Plot of the logarithm of stream length versus stream order showed the linear pattern (Fig. 5b), it seems to be in geometric progression and agree with Horton’s law of stream length and it is also observed that the total length of stream decreases with increasing order of stream. 7.1.4. Mean Stream Length The mean stream length (Lsm) of a channel is a dimensional property revealing the characteristic size of components of a drainage network and its contributing basin surfaces (Strahler, 1964). It has been calculated by dividing the total stream length of order ‘u’ and number of streams of segment of order ‘u’ i.e. Lms = Lu/Nu, where Lu = total stream length of order ‘u’ and Nu = total number of stream segments of order ‘u’. It is observed from Table 1 that Lsm varies from 0.60 to 9.16 km. The Lsm of a given order is greater than that of the next lower order and less than that of the next higher order but it is not so in Sairang sub-basin which might be due to variations in slope and topography.

Morphometric and Hypsometric Analysis of Sairang Sub-basin for Natural Resources Management
249
7.1.5. Bifurcation Ratio Bifurcation ratio (Rb) is used to express the ratio of the number of streams of any given order to the number of stream segments of the higher order (Strahler, 1964) and is a dimensionless property of the drainage basin supposed to be controlled by drainage density, lithological characteristics, stream entrance angles, basin shapes and basin areas etc. (Singh, 1998). Therefore, it is expressed as: Rb = Nu/ Nu+1 where, Nu is the total number of stream segments of order u and Nu+1 is the number of streams of the next higher order. Lower bifurcation ratio value indicates less structural disturbance and the drainage patterns have not been distorted (Nag, 1998) and higher bifurcation ratio is the result of large variation in frequencies between successive orders and indicates a mature topography (Sreedevi et al., 2005). The mean bifurcation ratio (Rbm) may be defined as the average of bifurcation ratios of all order. The computed value of bifurcation ratio for the study area ranges from 2.00 to 6.00 and its mean bifurcation ratio is 4.17 (Table 1) which indicates that the geological structures are less disturbing the drainage pattern. 7.2 Areal Features of the Channel System The areal features of the drainage basin such as drainage density, channel frequency, infiltration number, drainage texture, form factor, circulatory ratio, elongation ratio and length of overland flow have been calculated and are discussed in detail.
Table 2: Areal Features of Sairang Sub-basin
Areal-Parameters Formula Reference Result Basin area A Schumm (1956) 63.87 sq. kmBasin perimeter P Schumm (1956) 35.17 kmBasin length Lb Schumm (1956) 10.70 kmDrainage density Dd = Lu/ A Horton (1932) 3.35 km/sq. kmChannel frequency Fs = Nu/ A Horton (1932) 4.57 streams/sq. kmInfiltration number If = Dd * Fs Faniran (1968) 15.31 Drainage texture Dt = Nu/ P Horton (1945) 8.29 per kmForm factor Ff = A/ Lb2 Horton (1932) 0.56 Circularity ratio Rc = 4 πA/ P2 Miller (1953) 0.65 Elongation ratio Re = 2(A/π)0.5/ Lb Schumm (1956) 0.83 Length of overland flow Lo = 1/ 2Dd Horton (1945) 0.15 km
7.2.1. Drainage Density Horton (1932) has introduced the drainage density (Dd) into American hydrologic literature as an expression to indicate the closeness of spacing of channels, thus providing a quantitative measure of the mean length of river network for the whole basin and it is defined as the ratio of total length of streams of all orders per drainage area, which is expressed in terms of km/ sq. km. It is calculated by using the formula Dd = Lu/A, where Lu is the total length of all streams and A is the basin area. Low drainage density is more likely represent the regions with resistant like area with permeable sub-soil material under dense vegetative cover where relief is low and high drainage density is favoured in areas of weak and impermeable subsurface materials, sparse vegetation and mountainous relief (Nag, 1998). Sairang sub-basin possess high drainage density i.e. 3.35 km/ sq. km which reveals that the nature of subsurface strata is less permeable material, sparse vegetative cover and moderate to high relief. 7.2.2. Channel Frequency Horton in 1932 introduced channel frequency or stream frequency (Fs) as the ratio of total number of stream segments of all orders to the basin area. Its lower value indicates low surface run-off, permeable sub-surface material and low relief whereas higher values are related to resistant sub-surface material, low penetration capacity of the bedrock with high relief conditions of the area. The study area has a stream frequency of 4.57 streams per sq. km, which exhibit positive

National Seminar on Management of Natural Resources for Sustainable Development: Challenges and Opportunities
250
correlation with the drainage density value of the area indicating the increase in stream population with respect to increase in drainage density and this high value of Fs also revealing the high relief, impermeable sub-surface material and low infiltration capacity of the area. 7.2.3. Infiltration Number Infiltration number of a drainage basin is defined as the product of drainage density and stream frequency of the basin. It is influenced by the geological material, slope, soil texture underneath and vegetation cover above the surface causing obstruction to flow of surface water (Singh, 2006). Higher value of infiltration number indicates the lower infiltration with high surface run-off of the region and vice versa. The study area has an infiltration number of 15.31 which is high value indicating high run-off and low infiltration capacity of the area. 7.2.4. Drainage Texture Drainage texture is the total number of stream segments of all orders per perimeter of that area (Horton, 1945). The drainage texture depends upon a number of natural factors such as climate, rainfall, vegetation, lithology, soil type, infiltration capacity, relief and stage of development (Smith, 1950). According to Smith (1950) classification, drainage density is divided into five different textures i.e. less than 2, indicates very coarse, between 2 and 4 is coarse, between 4 and 6 is moderate, between 6 and 8 is fine and greater than 8 is very fine drainage texture. The drainage texture value obtained for Sairang sub-basin is 8.29 km-1, which falls under fine to very fine drainage texture. 7.2.5. Form Factor The form factor may be defined as the ratio of basin area to the square of the basin length (Horton, 1932). Basins of low form factor are elongated and have flatter peak flows for longer duration, while the basins with high form factors are circular and have high peak flows for shorter duration (Das and Mukherjee, 2005). In present case, value of form factor obtained for the study area is 0.56, which indicates less elongated shape of the basin and suggesting flatter peak flow for longer duration. 7.2.6. Circularity Ratio Miller (1953) defined a dimensionless circularity ratio (Rc) as the ratio of basin area to the area of circle having the same circumference as the perimeter of the basin. It is influenced by the length and frequency of streams, geological structures, land use/ land cover, climate, relief and slope of the basin (Chopra et. al., 2005). The circulatory ratio calculated for the Sairang sub-basin is 0.65, represent less circular in shape and is characterized by high to moderate relief, and drainage system is structurally controlled. 7.2.7. Elongation Ratio Elongation ratio is the ratio between the diameter of the circle of the same area as the drainage basin and the maximum basin length (Schumm, 1956) and it is expressed as: Re = 2(A/π)0.5/ Lb where, A is the area of the basin, π value is 3.14 and Lb is the maximum basin length. It is a very significant index in basin shape determination which helps to give an idea about the hydrological character of a drainage basin. A circular basin is more efficient in run-off discharge than an elongated basin (Singh and Singh, 1997). The value of elongated ratio (Re) is varied between 0.60 and 1.0 associated with a wide variety of climate and geology. Values close to 1.0 are the typical regions of very low relief, whereas values ranging between 0.6 and 0.8 are usually associated with high relief and steep ground slopes (Strahler, 1964). These values can be grouped into three categories, viz. (a) circular basin (>0.9), (b) oval basin (0.9 to 0.8) and (c) elongated basin (<0.7). The higher value of Re generally indicates more circular is the shape and lower value is associated with an elongated basin. The value of Re in the study area was found to be 0.83 indicating less circular or oval shape with high relief and steep slopes of the terrain.

Morphometric and Hypsometric Analysis of Sairang Sub-basin for Natural Resources Management
251
7.2.8. Length of Overland Flow According to Horton (1945), length of overland flow (Lo) is the length of the longest drainage path that water takes before it gets concentrated and is approximately equal to half of drainage density. It is one of the most important independent variables affecting hydrologic and physiographic development of drainage basin (Horton 1945). The length of overland flow is calculated by multiplying drainage density (Dd) by ½ i.e. Lo = 1/ 2Dd. The computed value of Lo of the study area is 0.15 km indicative of high relief and lower length of sheet flow. 7.3 Relief Features of Sairang Sub-basin The relief features determined basin relief, relief ratio, relative relief and ruggedness number which are represented below Table 3.
7.3.1. Basin Relief It is an important factor in understanding the denudational characteristics (the denudational landforms are formed as a result of active processes of weathering, mass wasting and erosion caused by different exogenetic geomorphic agents such as water, glaciers, wind etc., the landforms formed by the agents of denudation are identified as pediments, pediplains etc.) of the basin (Sreedevi et. al., 2009). The difference in elevation between the highest point of a basin (Z) and the lowest point on the valley floor (z) is called basin relief (Strahler, 1957). The maximum height of the whole sub-basin is 1378 m and the lowest is 60 m. Therefore, the relief of the basin is 1318 m which suggests low infiltration and high run-off conditions of the study area due to the presence of steep slope. Table 3: Relief Features of Sairang Sub-basin
Relief-Parameters Formula Reference ResultBasin relief (H) H = (Z-z ) Strahler (1957) 1318 mRelief ratio (Rh) Rh = H / Lb Schumm (1956) 0.12Relative relief (Rhp) Rhp = H * 100/P Melton (1957) 3.75Ruggedness number (Rn) Rn= Dd * ( H/1000) Strahler (1957) 4.387.3.2. Relief Ratio Relief ratio (Rh) is the dimensionless height-length ratio equal to the tangent of the angle formed by two planes intersecting at the mouth of the basin; one representing the horizontal, the other passing through the highest point of the basin (Schumm, 1963). It measures the overall steepness of a drainage basin and is an indicator of intensity of erosion processes operating on the slopes of the basin (Chopra et. al., 2005). Relief ratio normally increases with decreasing drainage area and size of a given drainage basin (Gottschalk, 1964) and it is computed by using the formula: Rh = H/Lb, where H is the basin relief and Lb is the maximum basin length. In the present study, Rh value is 0.12 characterizing the high relief and steep slopes of the terrain. 7.3.3. Relative Relief The relative relief is the ratio of basin relief (H) to the basin perimeter (P) and it is calculated according to Melton’s (1957) formula: Rhp = (H*100)/P. Its value indicates the steepness of the drainage basin from source to mouth. The relative relief of the Sairang sub-basin is 3.75, indicating high relative relief with steep slopes. 7.3.4. Ruggedness Number Ruggedness number (Rn) is the product of basin relief (H) and drainage density (Dd), where both parameters are in the same unit (Strahler, 1957). Basin having low ruggedness value infers less prone to soil erosion and the high ruggedness value of the basin implies highly susceptible to

National Seminar on Management of Natural Resources for Sustainable Development: Challenges and Opportunities
252
erosion with structural complexity of the terrain. For the Sairang sub-basin, the ruggedness number value was found to be 4.38, which reflects the structural complexity of the terrain with high susceptibility to erosion.
Fig. 6: Longitudinal Profile of Sarirang River
7.4 Longitudinal Profile of Sairang River The longitudinal profile is an erosional curve which indicates the surface history, terrain characteristics and various stages of valley development from source to mouth. The present morphology of the main and tributary stream is the result of different geomorphic processes with varying intensity. The profile of Sairang river (Fig. 6) shows sudden drop from its source at elevation 1020 m up to 380 m within a short distance of 2.3 km and joins with the main river after flowing at a distance of 9.7 km, showing three phases of cycle in its journey. The river Sairang also shows three major breaks in slope, one at 375 m and another two at the level of 280 m and 70 m with the concave upward section of the profile, indicating the mature stage of geomorphic development. 7.5 Hypsometric (Curve and Integral) Analysis The hypsometry curve describes the distribution of elevations across an area of land, from one drainage basin to the entire planet and it has been used to differentiate between erosional landforms at different stages during their evolution (Keller and Pinter, 1966; Schumm, 1956). According to Strahler (1952) topography produced by stream channel erosion and associated processes of weathering, mass-movement, and sheet run-off is extremely complex, both in the geometry of the forms themselves and in the inter-relations of the process which produce the forms. Hypsometric curves and integrals can be interpreted in terms of degree of basin dissection and relative landform age: Convex-up curves with high integrals are typical for youthful stage, undisseceted (disequilibrium stage) landscapes; smooth, S-shaped curves crossing the centre of the diagram characterize mature (equilibrium stage) landscapes and concave-up with low integrals typify old and deeply dissected landscapes (Strahler, 1952).
Table 4: Hypsometric Data of Sairang Sub-basin
Sl. No. Altitude Range (m) Area (a) km2 Height (h) m h/ H a/ A1 1200 4.38 1140 1.00 0.052 1000–1200 7.25 940 0.83 0.113 800–1200 15.62 740 0.65 0.244 600–1200 32.43 540 0.48 0.505 400–1200 54.27 340 0.30 0.856 200–1200 61.52 140 0.13 0.977 60–1200 63.87 0 0.00 1.00Where, H = 1140 m and A = 63.87 km2

Morphometric and Hypsometric Analysis of Sairang Sub-basin for Natural Resources Management
253
7.5.1. Plotting of Percentage Hypsometric Curve The percentage hypsometric curve is a ratio of relative height and relative area with respect to the total height and the total area of a drainage basin. These curves help to understand the area–height relationship, nature and character of the river basin. It has been estimated with the help of following ratios: 1. Relative height or h/H; where 'h' is the highest elevation between each pair of contours above the base and 'H' is the total basin height, represented on the ordinate; and 2. Relative area or a/A; where 'a' is the area enclosed by a pair of contours and 'A ' is the total basin area which is represented on the abscissa. The value of (a/A) is in a range from 1.0–0.0 in inverse series to the relative height ratio. The data obtained for hypsometric curve are shown in Table 4 and it was graphically expressed in Fig. 7.
Fig. 7: Hypsometric Curve of Sairang Sub-basin
7.5.2. Estimation of Hypsometric Integral (HI) Integration of the hypsometric curve gives the hypsometric integral (HI), which is equivalent to the elevation-relief ratio (E) and is calculated according to Pike and Wilson (1971) formula. It is expressed as: E ~ HI = (E mean-E min) / (E max-E min) Where, E mean is the mean elevation, E min and E max are the minimum and maximum elevations within the river basin. A.N. Strahler (1952) has classified the three threshold values for hypsometric integral, each representing the distinctive stages of the geomorphic cycle: 1. The inequilibrium or young stage if the HI ≥ 0.60 2. The equilibrium or mature stage if 0.35 ≤ HI ≤ 0.60 and 3. The monadnock or old stage if HI ≤ 0.35. In the young or inequilibrium stage, the river basin is highly susceptible to erosion and is under development. The equilibrium stage is the mature stage of river basin development i.e., the development has attained steady state condition; the monadnock or old stage, in which the river basin is fully stabilized.
National Seminar on Management of Natural Resources for Sustainable Development: Challenges and Opportunities
254
Table 5: Estimation of Hypsometric Integral of Sairang Sub-basin
Mean Elevation (E mean) m
Maximum Elevation (E max) m
Minimum Elevation(E min) m
Hypsometric Integral (HI) 706 1378 60 0.49 From the Fig. 7, it was observed that the hypsometric curve for the Sairang sub-basin is an S-shape pattern indicating a mature stage of landscape development with moderately eroded regions. The hypsometric integral value of Sairang sub-basin is 0.49 (Table 5) which indicates that the basin has just entered into middle maturity stage from the early maturity stage and 49% of rock masses still exist in the basin. Thus, the potential energy of the river basin is more due to high run-off with faster rate of erosion.
8. Conclusion The quantitative analysis of morphometric parameters and hypsometric integral are found to be an important study in river basin evaluation, watershed prioritization for soil and water conservation and natural resources management. Geologically, the study area belongs to the Middle-Upper Bhuban Formations of Lower to Middle Miocene age. Drainage pattern of the study area shows trellis in nature with 5th order drainage and the variation in mean stream length might be due to changes in slope and topography. Plots of the logarithm of number of streams, streams length versus stream order shows the linear relationship with small deviation from a straight line indicates that the terrain is characterized by lithologic and topographic variation. The mean value of bifurcation ratio in the basin implies that the geological structures are less disturbing the drainage pattern. The high value of drainage density, channel frequency and infiltration number reveals that the region is composed of impermeable sub-surface materials having sparse vegetation and high relief causing higher surface run-off and a higher level of degree of dissection with very fine drainage texture. The computed value of form factor, circularity and elongation ratio suggests that the study area has less circular in shape and flatter peak flow for longer duration. The analyzed relief parameters of the area is indicating high relief, steep slopes, high run-off and structural complexity of the terrain highly susceptible to erosion. The results of hypsometric analysis for Sairang sub-basin indicate the early mature stage of landscape development with moderately eroded regions. This analysis will help to take appropriate measures to conserve land and water resources in the river basin. Acknowledgement The authors are grateful to Head, Department of Geology, Mizoram University, Aizawl for providing necessary facilities to carry out the work. The financial support from the UGC Division, Government of India, in the form of Senior Research Fellowship is thankfully acknowledged by Fuzal Ahmed. References Bagyaraj, M. and Gurugnanam, B. (2011), “Significance of Morphometry Studies, Soil Characteristics, Erosion Phenomena and Landform Processes using Remote Sensing and GIS for Kodaikanal Hills, a Global Biodiversity Hotspot in Western Ghats, Dindigul District, Tamil Nadu, South India”, Res. Jour. Environ. Earth Sci., Vol. 3(3), pp. 221–233. Biswas, S., Sudhakar, S. and Desai, V.R. (1999), “Prioritisation of Sub Watersheds Based on Morphometric Analysis of Drainage Basin: A Remote Sensing and GIS Approach”, Jour. Ind. Soc. Remote Sensing, Vol. 27(3), pp. 155–166. Chakraborti, A.K. (2003), “Watershed Prioritization—A Case Study in Salauli Watershed of Zuari River Basin, Goa. ISRO”,
National Natural Resources Management Systems Bull., pp. 42–44. Chen, C.Y. and Yu, F.C. (2011), “Morphometric Analysis of Debris Flows and their Source Areas using GIS”, Geomorphology, Vol. 129, pp. 387–397. Chopra, R., Dhiman, R.D. and Sharma, P.K. (2005), “Morphometric Analysis of Sub-watersheds in Gurdaspur District, Punjab using Remote Sensing and GIS Techniques”, Jour. Ind. Soc. Remote Sensing, Vol. 33(4), pp. 531–539. Chorley, R.J. (1969), Introduction to Fluvial Processes, Methuen, UK, pp. 30–52. Dabral, P.P. (2003), “Hypsometric Analysis of Dikrong River Basin of Arunachal Pradesh”, Jour. Soil Water Conserv, Vol. 2, pp. 97–100.

Morphometric and Hypsometric Analysis of Sairang Sub-basin for Natural Resources Management
255
Das, A.K. and Mukherjee, S. (2005), “Drainage Morphometry using Satellite Data and GIS in Raigad District, Maharashtra”, Jour. Geol. Soc. Ind., Vol. 65, pp. 577–586. Diwakar, P.G. and Mayya, S.G. (2010), “ICT and Geomatics as Process Tools for Community Centric Watershed Development”, Jour. of Geomatics, Vol. 4(1), p. 25. Faniran, A. (1968), “The Index of Drainage Intensity—A Provisional New Drainage Factor”, Aus. Jour. of Sci., Vol. 31, pp. 328–330. Gottschalk, L.C. (1964), Reservoir Sedimentation in Handbook of Applied Hydrology, New York, Mc. Graw Hill Book Company, Section 7–1. Gregory, K.J. and Walling, D.E. (1973), Drainage Basin form and Process: A Geomorphological Approach, Edward Arnold, London, pp. 37–92. Honore, G. (1999), “Our Land, Ourselves—A Guide to Watershed Management in India”, Government of India, New Delhi, p. 238. Horton, R.E. (1932), “Drainage basin Characteristics”, Tran. Amer. Union, Vol. 31, pp. 350–361. Horton, R.E. (1945), “Erosional Development of Streams and their Drainage Basins: Hydrophysical Approach to Quantitative Morphology”, Geol. Soc. Amer. Bull., Vol. 56(3), p. 275–370. Javed, A., Khanday, M.Y. and Ahmed, R. (2009), “Prioritization of Sub-watersheds based on Morphometric and Land Use Analysis using Remote Sensing and GIS Techniques”, Jour. Ind. Soc. Remote Sensing, Vol. 37, pp. 261–274. Keller, E.A. and Pinter, N. (1996), Active Tectonics: Earthquakes Uplift and Landscapes. Prentice Hall, New Jersey, p. 122. Khan, M.A. (1999), “Water Balance and Hydrochemistry of Precipitation Components in Forested Ecosystem in the Arid zone of Rajasthan, India”, Hydrological Sci. Jour., Vol. 44, pp. 149–161. Lin, Z. and Oguchi, T. (2004), “Drainage Density, Slope Angle and Relative Basin Position in Japanese bare Lands from High Resolution DEMs”, Geomorphology, Vol. 63(3–4), pp. 159–173. Melton, M.A. (1957), An Analysis of the Relations among Elements of Climate, Surface Properties and Geomorphology, Project NR 389042, Tech. Rep. 11, Columbia University. Melton, M.A. (1958), Geometric Properties of Mature Drainage Systems and their Representation in an E4 Phase Space, Vol., 66, pp. 35–56. Miller, V.C. (1953), A Quantitative Geomorphic Study of Drainage Basin Characteristics on the Clinch Mountain Area, Virgina and Tennessee, Proj. NR 389–402, Tech Rep 3, Columbia University, Department of Geology, ONR, New York. Mishra, A., Dubey, D.P. and Tiwari, R.N. (2011), “Morphometric Analysis of Tons Basin, Rewa district, Madhya Pradesh, based on Watershed Approach”, Earth Sci. Ind., Vol. 4, pp. 171–180. Mishra, N. (1988), “Hypsometric Integral-a Basis for Determining the Erosion Status and Priority Number of Ungauged Watershed”, Jour. Soil Water Conserv., Vol. 32, pp. 38–45. Moore, I.D., Grayson, R.B. and Ladson, A.R. (1994), “Digital Terrain Modelling”, In a Review of Hydrological, Geomorphological and Biological Applications (eds Beven, K. J. and More, I. D.), Wiley, Chichester, Vol. 7(31), p. 249. Nag, S.K. (1998), “Morphometric Analysis using Remote Sensing Techniques in the Chaka Sub-basin, Purulia District, West Bengal”, Vol. 26 (1&2), pp. 69–76. Nag, S.K. and Lahiri, A. (2011), “Morphometric Analysis of Dwarakeswar Watershed, Bankura District, West Bengal, India, using Spatial Information Technology”, Inter. Jour. of Water Resour. and Environ. Engg., Vol. 3(10), pp. 212–219. Pankaj, A. and Kumar, P. (2009), “GIS-based Morphometric Analysis of Five Major Sub-watersheds of Song River, Dehradun district, Uttarakhand with Special Reference to Landslide Incidences”, Jour. Ind. Soc. Remote Sensing, Vol. 37(1), pp. 157–166. Patel, D.P., Dholakia, M., Naresh, N. and Srivastava, P.K. (2012), “Water Harvesting Structure Positioning by using Geo-visualization Concept and Prioritization of Mini-watersheds through Morphometric Analysis in the Lower Tapi Basin”, Jour. Ind. Soc. Remote Sensing, Vol. 40(2), pp. 299–312. Pike, R.J. and Wilson, S.E. (1971), “Elevation–relief Ratio, Hypsometric Integral and Geomorphic Area–altitude Analysis”, Geol. Soc. Amer. Bull., Vol. 82, pp. 1079–1084. Pradhan, K. and Senapati, P.C. (2002), “Hypsometric Analysis of Some Selected Watersheds of Hirakund Catchment”, Jour. Soil Water Conserv., Vol. 30, pp. 183–185. Sarangi, A., Madramooto, C.A. and Enright, P. (2003), “Development of user Interface in ArcGIS for Estimation of Watershed Geomorphology”, The Canadian Society for Engineering in Agricultural, Food, and Biological Systems. CSAE/SCGR 2003, Meeting Montréal, Québec, July, pp. 6–9. Saxena, P.R. and Prasad, N.S.R. (2008), “Integrated Land and Water Resources Conservation and Management–Development Plan using Remote Sensing and GIS of Chenvella Sub-watershed”, R.R. district, Andhra Pradesh, India. The International Archives of the Photogrammetry, Remote Sensing and Spatial Information Sciences, Vol. XXXVII, Part B8, Beijing, pp. 729–732. Schumm, S.A. (1956), “Evolution of Drainage Systems and Slopes in Badland at Perth Amboy, New Jersey, Geol. Soc. Amer. Bull., Vol. 67, pp. 597–646. Schumm, S.A. (1963), “Sinuocity of Alluvial Rivers on Great Plains”, Geol. Soc. Amer. Bull., Vol. 74, pp. 1089–1100. Singh, O. and Sarangi, A. (2008), “Hypsometric Analysis of the Lesser Himalayan Watershed using Geographical Information System”, Ind. Jour. Soil Conserv., Vol. 36(3), pp. 148–154.
National Seminar on Management of Natural Resources for Sustainable Development: Challenges and Opportunities
256
Singh, O., Sarangi, A. and Sharma, M.C. (2008), “Hypsometric Integral Estimation Methods and its Relevance on Erosion Status of North-western Lesser Himalayan Watersheds”, Water Resour. Mgt., Vol. 22, pp. 1545–1560. Singh, S. and Singh, M.C. (1997), “Morphometric Analysis of Kanhar River Basin”, National Geographical Jour. of Ind., Vol. 43(1), pp. 31–43. Singh, S.R. (2006), “A Drainage Morphological Approach for Water Resources Development of the Sur Catchment, Vidarbha Region”, Jour. Ind. Soc. Remote Sensing, Vol. 34(1), pp. 79–88. Singh, Savindra (1998), Geomorphology, Prayag Pustak Bhavan, Allahabad, p. 362. Singh, T. (2008), “Hypsometric Analysis of Watersheds Developed on Actively Deforming Mohand Anticlinal Ridge, NW Himalaya”, Geocarto Inter., Vol. 23(6), pp. 417–427. Smith, K.G. (1950), “Standards for Grading Textures of Erosional Topography”, Amer. Jour. Sci., Vol. 248, pp. 655–668. Sreedevi, P.D., Owais, S., Khan, H. and Ahmed, S. (2009), “Morphometric Analysis of a Watershed of South India using SRTM Data and GIS”, Jour. Geol. Soc. Ind., Vol. 73, pp. 543–552. Sreedevi, P.D., Subrahmanyam, K. and Ahmed, S. (2005), “The Significance of Morphometric Analysis for Obtaining Groundwater Potential Zones in a Structurally Controlled Terrain”, Environ. Geol., Vol. 47, pp. 412–420. Strahler, A.N. (1952), “Dynamic Basis of Geomorphology”, Geol. Soc. Amer. Bull., Vol. 63, pp. 923–938. Strahler, A.N. (1952), “Hypsometric (Area-altitude) Analysis of Erosional Topography”, Geol. Soc. Amer. Bull., Vol. 63, pp. 1117–1141. Strahler, A.N. (1956), “Quantative Slope Analysis”, Geol. Soc. Amer. Bull., Vol. 67, pp. 571–576. Strahler, A.N. (1957), “Quantitative Analysis of Watershed Geomorphology”, Trans. Amer. Geophys. Union, Vol. 38, pp. 913–920. Strahler, A.N. (1964), “Quantitative Geomorphology of Drainage Basins and Channel Networks”, In: VT Chow (ed.), Handbook of Applied Hydrology. McGraw Hill Book Comp., New York, Section 4–11. Thakkar, A.K. and Dhiman, S. (2007), “Morphometric Analysis and Prioritization of Miniwatersheds in Mohr Watershed, Gujarat using Remote Sensing and GIS Techniques”, Jour. Ind. Soc. Remote Sensing, Vol. 35(4), pp. 313–321. Tideman, E.M. (1996) Watershed management, guidelines for Indian conditions. Omega Scientific, New Delhi, 372. Tiwari, R.P., Malsawama, J., Sangode, S.J. and Arora, B.R. (2007), “Magnetostratigraphy of a Part of Middle Bhuban Sequence (Surma Group), Aizawl, Mizoram”, Jour. Geol. Soc. Ind., Vol. 70 (4), pp. 667–674. Vittala, S.S., Govindaiah, S. and Honne Gowda, H. (2008), “Prioritization of Sub-watersheds for Sustainable Development and Management of Natural Resources: An Integrated Approach using Remote Sensing”, GIS and Socio-economic Data. Curr. Sci., Vol. 65(3), pp. 345–354.
257
36 Application of TiO2 and Dye Coated TiO2 Thin Films for Solar Energy Conversion for Sustainable Alternative Energy Source
S. Rai1 and P.J. Dihingia2 1Laser and Photonics Laboratory, Department of Physics,
Mizoram University, Aizawl 2Department of Physics, Dibrugarh University, Assam
E-mail: [email protected]
1. Introduction Many nano-structured materials are now being investigated for their potential applications in photovoltaic (PV), electro-optical and sensor devices [1–2]. In recent years, there is an increasing interest to find sustainable alternative energy (SAE) sources due to the heightening cost of fossil fuels and detrimental effects of global climate change. Conversion of optical energy into electrical energy is known as photovoltaic effect. PV cells have received significant advantage due to limitless influx of photons from the sun. Solar cell, which converts the sun light directly into electricity, at present furnish the most important long duration power supply for satellites and space vehicles. Recently, research and pollution development of low-cost, flat panel solar cells, thin film devices, concentrator systems, and many innovative concepts have increased. The first solar cells were developed by Chapin et al. in 1954 using a diffused silicon P-N junction. Subsequently, the cadmium-sulphide solar cell was developed by Raynolds et al in 1954. More than 95% of the solar cells in production are silicon based. Primary requirement for material to be used as solar cell is a bandgap matching material for the solar spectrum with high mobality and lifetime for charge carriers. To date, solar cells have been made of many other semiconductors, using various device configurations and employing single crystal and amorphous thin film structures. To this end, nanostructured layers in thin film solar cells offer three important advantages. First, due to multiple reflections, the effective optical path for absorption is much larger than the actual film thickness. Second, light generated electrons and holes need to travel over a much shorter path and thus recombination losses are greatly reduced. Third, the energy gap of the various layers can be tailored to the desired design value by varying the size of the nanoparticles. This allows more design flexibility in the absorber and windows layers in the solar cells. 2. Experimental TiO2 films were prepared by mixing 1.6 ml of titanium isopropoxide (Qualigens Fine Chemical) with 7 ml of isopropanol (Qualigens Fine Chemical) and 1.4 ml of acetic acid (Qualigens Fine Chemical) under strong stirring at room temperature. Separately, Rh B dye (Exciton Co.) was mixed in a mixture of 5 ml of isopropanol and 5 ml of acetic acid. Subsequently, both solutions were mixed under vigorous agitation at environmental temperature. By this procedure, TiO2 sol doped with RhB dye at different concentration is obtained. Then the films were deposited by means of dip coating on clean substrates. All these operations were performed at room temperature. Absorption spectra of dye (RhB) doped TiO2 thin films were obtained using SINCO PD-UV-VIS (S-3100) spectrophotometer over the wavelength range of 190 to 1200 nm. Photoluminescence (PL) spectra of the dye doped TiO2 thin films were obtained using iHR 320 imaging Spectrometer (Horiba JobinYvon).

National Seminar on Management of Natural Resources for Sustainable Development: Challenges and Opportunities
258
3. Result and Discussion
3.1 Photoconductive Properties of Copper (Cu)-doped TiO2 Film Photoconductivity is, in general, property of semiconducting solids and consists in the change of resistance of a semiconducting material when radiation is incident upon it. The resistivity of the materials decreases when irradiated. Obviously, these materials have dark-resistance and low irradiated resistance. However, in semiconductors, relatively small photon energies are capable of creating electron-hole pairs internally, and thus increasing the carrier concentrations and conductivity of the material. In order to study the role of the photoconductive properties of Cu-doped TiO2 film effects on the surface of glass substrate, the present work represents the optical and photoconductive properties of 0.1 M Cu-doped TiO2 film annealed at different temperatures. The absorption spectra of a 0.1 M Cu-doped TiO2 film annealed at different temperatures are shown in Fig. 1. The film was prepared on a plane glass substrate by sol-gel dip-coating method. At 100oC, the absorption spectrum shows a primary edge near 350 nm (3.546 eV), which corresponds to the characteristic absorption edge of TiO2 [1]. With increase in temperature from 100o-400oC, this absorption edge is observed to shift towards higher wavelength region (350nm–380 nm). For this temperature range, the energy corresponding to the absorption edge lies within 3.546–3.266 eV approximately. But, the band gap of bulk anatase TiO2 lies within 3.1–3.2 eV. Thus, for the film annealed at 100oC, much higher energy is needed to excite an electron from the valence band (VB) to the conduction band (CB) of TiO2. This can only be provided with using UV (ultraviolet) excitations below 350 nm. A broad band extending from 500 nm–600 nm is also seen in the absorption spectrum of the Cu-doped TiO2 film annealed at 100oC. This band should not be confused with the absorption band obtained in case of undoped TiO2 film annealed at 700oC, where it appeared only due to the formation of defects associated with oxygen vacancies that originated from the reduction of TiO2 [2] after annealing at 700oC.
Fig. 1: The UV-Vis Absorption Spectra of 0.1 M Cu-doped TiO2 Film Annealed at Different Temperatures The band between 500–600 nm can be explained with the help of surface plasmon resonance (SPR) absorption of metal nanoparticles. The surface plasmon resonance (SPR) is the collective oscillation of valence electrons in a solid, in response to the electrical field of the light radiation [3]. The resonance condition is established when the frequency of the photons matches the natural frequency of the surface (valence) electrons oscillating against the restoring force of the positive nuclei. In fact, the optical properties of metal nanostructures in the visible region are dominated by the surface plasmon (SP) absorption [4]. It has been reported that Cu nanoparticles show an SPR band in the 573–600 nm range [5]. Also, some studies show that the SPR band of Cu may appear even at 562 nm [6], while some others have reported that it may lie between 560–582 nm also [7]. The position of the SPR band is dependent on certain parameters such as solvent used in the synthesis, capping agent, etc [5].

Application of TiO2 and Dye Coated TiO2 Thin Films for Solar Energy Conversion for Sustainable Alternative Energy Source
259
Now, the obtained band between 500 nm–600 nm can be easily assigned as due to the SPR absorption band of Cu. The increase in bandwidth of the SPR may be related to the decrease in size of the nanoparticles (NPs). The observed SPR band indicates that Cu-NPs have been formed in the TiO2 matrix [8] and it strongly depends on the dielectric constant of the TiO2 matrix [8]. Though the film at 100oC exhibits a diffused absorption band in the visible region, yet it is difficult to obtain good I-V characteristics of such a film under visible light conditions since photo-generation of electron-hole pairs does not take place in TiO2 below 350oC [1]. The SPR band of Cu seems to get red-shifted with increase in annealing temperature. At 400oC, this band becomes prominent and centred at 582 nm. There is also a small band centred at 404 nm, which is due to the defect states introduced in the TiO2 lattice due to annealing. Since the SPR is a collective oscillation of conduction electrons in response to an electromagnetic radiation, therefore, it should facilitate the I-V measurements to be done on the Cu-doped film annealed at 400oC. This is because at this temperature, the collective oscillation of conduction electrons includes the photo-generated electrons from TiO2 besides those coming from Cu and it will be relatively easy to get a measurable current in an external circuit using this film sample (during I-V measurements).
Fig. 2: I-V Characteristics on a TCO–coated Glass I-V characteristics of a 0.01 M Cu-doped TiO2 film prepared on a TCO-coated glass and annealed at 400oC is shown in Fig. 2. On the other hand, the increase of current under white light illumination is much sharper than that of dark current. It increases from 0–22.8 µA with increase in voltage from 0–500 V. This steep rise of current is due to the combined effect of photo-generation of electrons from TiO2 and collective oscillation of conduction electrons provided by copper (SPR) in response to the illumination provided. This current also drops suddenly to 11 µA at 550 V and again increases linearly with voltage due to a similar reason stated already above. But this time, it is interesting to note that the semiconductor material (between the inner probes) got burned out at a higher voltage than that at dark. This again may be due to the increase in electrical resistance caused by the SPR. All the above measurements for the I-V characteristic were done at relatively high voltages, since very small currents could be obtained at low voltages. This may be again due the formation of oxides of copper on the film (under atmospheric conditions), which interferes with the flow of electrons. Now, when the absorption spectrum of an undoped and a Cu-doped TiO2 film (both annealed at 400oC) are compared (Figure 3), then it is seen that the primary absorption edge of TiO2 in the case of undoped TiO2 film appears near 350 nm (3.546 eV approximately) whereas, it appears at 373 nm (3.327 eV approximately) in the case of Cu-doped TiO2 film.

National Seminar on Management of Natural Resources for Sustainable Development: Challenges and Opportunities
260
Fig. 3: Comparison of UV-Vis Absorption Spectrum of Undoped and Cu-doped TiO2 Film (Annealed at 400oC) The particle size corresponding to the absorption edge of undoped TiO2 film has been determined using effective mass approximation (EMA) model [12], which is 2.13 nm in diameter approximately. Similarly, the particle size corresponding to the absorption edge of Cu-TiO2 is 3 nm in diameter approximately. In these calculations, the band-gap of bulk anatase TiO2 was taken as 3.1 eV. Also, the values of electron effective mass (me*) and hole effective mass (mh*) were taken as 10me and 0.8me respectively [13], where me is the mass of a free electron. It is inferred that doping has increased the particle size of TiO2 even at the same temperature. But given the same doping concentration, the particle size of TiO2 increases with temperature as is evident from the shifting of the absorption edge from 350 nm–380 nm (Fig. 1).
3.2 Light Harvesting by Dye Coated Nanocrystalline TiO2 The dye-sensitized solar cells (DSC) provide a mechanically and economically credible alternative concept to present day p-n junction photovoltaic devices. Light is absorbed by a sensitizer, which is anchored to the surface of a wide band semiconductor. Charge separation takes place at the interface via photo-induced electron injection from the dye into the conduction band of the solid. Carriers are transported in the conduction band of the semiconductor to the charge collector. The use of sensitizers having a broad band absorption band in conjunction with oxide films of nanocrystalline morphology permits to harvesting a large fraction of sunlight. Figure 4 (a) and 4(b) show the transmission spectra and absorption spectra of the TiO2 films co-doped with Rh B dye. From Fig. 4(b) it is observed that with increase in the concentrations of dye, the intensity of the absorption peak increased and shifted towards blue, which appears at 2.42, 2.57 and 2.59 eV for concentration 0.01%, 0.02% and 0.05% respectively and is attributed to Rh B and along the absorption peak a shoulder like feature is appeared at 2.45 eV for dye concentration 0.02% and 0.05% which is attributed due to dimer formation of Rh B [9]. A low intense absorption peak appeared at 3.2 eV which is attributed to TiO2 absorption. From Figure 4(b) it is also observed that the absorption band of TiO2 seems to be saturated at the Rh B concentration 0.05% which is due to the formation of Rh B radical, since Rh B absorbed at the surface of TiO2 gives up one electron to the conduction band [10, 11].

Application of TiO2 and Dye Coated TiO2 Thin Films for Solar Energy Conversion for Sustainable Alternative Energy Source
261
300 400 500 600 700 800 900 10000
20
40
60
80
100
(b)
(c)(a)
Tran
smiss
ion
(%)
Wavelength (nm)
1.6 2.0 2.4 2.8 3.2 3.60.0
0.1
0.2
0.3
0.4
0.5
0.6
0.7
0.8
0.9
1.0
(c)
(b)
(a)Abs
orpt
ion
(a.u
)
Energy (eV)
Fig. 4(a): Transmission Spectra of Rh B Doped TiO2 Thin Films
Fig. 4(b): Absorption Spectra of Rh B Doped TiO2 Thin Films In a direct transition semiconductor, the absorption coefficient ‘α’ and the optical energy band gap (Eg) are related by, ℎ = ℎ − where ℎ is the incident photon energy, ‘Eg’ represents the energy bandgap and ‘B’ is characteristics parameter. Then Eg is determined by the extrapolation method. The optical band gaps, Eg of the present films (a), (b) and (c) are 3.37 eV, 3.62 eV and 3.69 eV respectively (Fig. 5). From Fig. 4 (a) we can see that the transmission edges of the Rh B doped TiO2 thin films are sharp and the increase in band gap can be attributed to the improvement in crystalinity. From Fig. 5, it is observed that the fluorescence peaks appeared at 2.32 eV, 2.308 eV and 2.268 eV when the dye concentrations were 0.01% M, 0.02% M and 0.05% M respectively and the peaks showed red shift as the concentration of Rh B increased. The shifting of peaks was found to be 0.04 eV and 0.052 eV for dye concentration of 0.02% and 0.05% with respect to dye concentration 0.01%. The wavelength of the peak output (0.05% of Rh B) in the present case showed a red shift of 12.62 nm in comparison to 0.01% of Rh B dye. The increase of full wave half maxima (FWHM) with increase of dye concentration (for 0.01% FWHM is 43 nm, for 0.02% it is 45 nm and for 0.05% FWHM is 52 nm) showed the broadening of emission peak. This is consistent with increased re-absorption and subsequent re-emission longer wavelengths [12]
Fig. 5: Shows the (αhν)2 Versus Photon TiO2 Energy (hν) Fig. 6: Pl Spectra of Rh B Doped Thin Films
1.5 2.0 2.5 3.0 3.50.0
5.0x10⁶
1.0x10⁷
1.5x10⁷
2.0x10⁷
2.5x10⁷
(b)
(c)(a)
(αhν
)2 cm
-2eV
2
hν (eV)
2.0 2.1 2.2 2.3 2.4 2.5 2.60
500000
1000000
1500000
2000000
(b)
(a)
(c)
Inte
nsity
(a.u
)
Energy (eV)
National Seminar on Management of Natural Resources for Sustainable Development: Challenges and Opportunities
262
4. Conclusion Nano-crystalline Cu TiO2 films were deposited in glass substrates and characterized. The result shows particle size of 2.13 nm and blue shit in the absorption with an effective band gap of 3,327 eV. This opens the possibility of using nano-crystalline Cu-TiO2 as a widow layer in a Cu-TiO2 homo-junction solar cell. This can be used in nanostructures solar cell configuration where the pores are filled with a p-type absorber material. Due to nanostructures character of the absorber, the transport pat for the light generated electrons in the absorber is reduced. At the same time, the optical path for the photon absorption is increased due to multiple reflections. Acknowledgement This work was financially supported by SERB research project No. SR/52/LOP-0039/2010, SERB References Dang, T.M.D., Le, T.T.T., Fribourg-Blanc, E. and Dang, M.C. (2011), Adv. Nat. Sci.: Nanosci. Nanotechnol, Vol. 2, p. 15009. Duan, X., Niu, C., Sahi, V., Chen, J., Parce, J.W., Empedocles, S. and Goldman, J. (2003), Nature, Vol. 425, pp. 274–278. González, A.E. Jiménez, S. and Santiago, Gelover, Semicond, Science Technology, 22, 709 (2007). Gupta, P. and Ramrakhiani, M. (2009), Open Nanosci. J., Vol. 3, p. 15. Iordache, D.A., Sterian, P.E. and Tunaru, I. (2013), Adv. High Energy Phys., Vol. 1. Klar, T., Perner, M., Grosse, S., Plessen, G. Von, Spirkl, W. and Feldmann, J. (1998), Phys. Rev. Lett., Vol. 80, p. 4249. Kuznetsov, V.N. and Serpone, N. (2006), J. Phys. Chem. B, Vol. 110, p. 25203. O’Dwyer, J.J. (1973), Theory of Electrical Conduction and Breakdown in Solid Dielectrics (Monographs on the Physics and
Chemistry of Materials), Oxford University Press, Oxford, Sangpour, P., Hashemi, F. and Moshfegh, A.Z. (2010), J. Phys. Chem. C, Vol. 114, p. 13955. Usman, S., Ibrahim, N.A., Shameli, K., Zainuddin, N., Md., W. and Yunus, Z.W. (2012), Molecules, Vol. 17, p. 14928. Vorob’ev, G.A. and Nesmelov, N.S. (1979), So. Phys. J., Vol. 22, p. 70. Weng, Y.X., Wang, Y.Q., Asbury, J.B., Ghosh, H.N. and Lian, T. (2000), J. Phys. Chem. B, Vol. 104, p. 93. Whitesides, G.M. and Bartosz, Grzybowski (2002), Science, Vol. 295, pp. 2418–2421. Yeshchenko, O.A., Dmitruk, I.M., Dmytruk, A.M. and Alexeenko, A.A. (2007), Mater. Sci. Eng. B, Vol. 137, p. 247. Zhang, J.Z. (2009), Optical Properties and Spectroscopy of Nanomaterials, World Scientific, Singapore.

263
37 Impact of Sandstone Quarry on Water Quality of Tlawng River in Aizawl District, Mizoram, North-East India
B.P. Mishra and G. Premeshowri Devi Department of Environmental Science, Mizoram University,
Aizawl, Mizoram, India E-mail: [email protected]/ [email protected]
1. Introduction The quarry is the common practices carried out to extract natural resources, usually rocks found on, or below the land surface. Rocks quarrying and stone crushing are the global phenomenon and have been the cause of concern everywhere in the world including the advanced countries. Some of the stones extracted are sandstone, limestone, marble, ironstone, slate, granite, rock salt and phosphate rock. In the crushed stone industry, granite, limestone, sandstone or basaltic rocks are crushed for used principally as concrete aggregate or rock-stone. Sandstone quarry has been used for construction industry, road, building etc. The global consumption of natural stone is too high due to its extensive use in developing countries owing to rapid infrastructural growth which results into supply scarcity. Thus, the sandstone quarry plays a vital role in the nation’s economy by providing essentials materials and employments opportunities. Global production of natural stones exceeded 100 million tons in 2006. India produced 19 million tons (second only to China). The value of stone, sand and gravel exports from India rose from US$ 281,615,000 to USD$ 475,661,000 between 2001 and 2005 (International Trade Centre, 2008). India accounts for about 27% of the total natural stone production of the World (Indian Committee of the Netherland, 2005). The natural stone quarry in India is carried out predominantly by small scale, artisanal mines. A report on small scale mining in India estimated that about 98% of the minor mineral mines, including sandstone, operating were small scale (Chakravorty, 2001). These were responsible for approximately 90% of the total mineral extracted and around 42% of the total value of produced material. The sandstone quarry causes adverse effects on the various segments of the environment (Okafor, 2006). Quarry operation though provides economic significance but the effect they cause to the environment could be harmful. This happens when the mining activity causes pollution to the nearby water-bodies in which it is being carried out. The main cause of this are used oils, fuels and waste metals due to mining and transportation machinery, which get split and are dumped on the soil around the quarry site without being treated (Kirk and Morgan,1984). Several efforts have been made on effects on mining on water, and rehabilitation of abandoned mine areas (Cairns, 1988; Dasgupta et al. 2002; Down and Stocks, 1977; Kopittke et al., 2004; Morrell et al., 2003; Mulligan 2003; Lopez and Stoertz, 2001; Shueck et al., 1996; Swer and Singh, 2003 and 2004).
National Seminar on Management of Natural Resources for Sustainable Development: Challenges and Opportunities
264
The impact of mining on environment reported by the Rajasthan Pollution Control Board (RPCB, 2007) includes land degradation, depletion of forest and loss of biodiversity, soil contamination, air pollution, surface and groundwater pollution, noise and vibrations, deterioration of natural drainage system. Hydrological impacts of mining pertaining to the water table and catchment area have been studied by Bhadra et al. (2007), Ibarra and de lasHeras (2005). La-Touche (1891) was one of the pioneer worker in Mizoram, and reported that the rocks are comprised of monotonous sequences of shale and sandstone. There is lack of mineral deposits of economic importance. Ralte (2012) studied the heavy minerals of Tipam sandstone near Bheuhchang village in Kolasib district and reported that the Tipam sandstone has a complex provenance comprising of high grade metamorphic source as well as igneous and sedimentary sources. The sandstone quarry is prevalent in the state of Mizoram and is meant for improvement economic condition of rural people and also to make available the building material. The drainage from sandstone quarry areas leads to discharge huge amount of dust particles into water-bodies situated in catchment areas. Unplanned and non-scientific open-cast mining has adverse effects on quality of river water in catchment areas, which has become a challenge for ecologists and environmentalists of the region. It is evident that the rural people settled near the bank of rivers in sandstone mining areas are badly affected due to direct use of river water without any treatment. Keeping in view the importance of the water for life, the present study is planned with an aim to assess the impact of sandstone quarry on water quality of Tlawng river (the longest river in Aizawl) and an important source of drinking water. The outcome of the study will be a potential tool for formulating appropriate conservation strategy. 2. Material and Methods
2.1 Description of Study Site Mizoram is interspersed with numerous rivers such as Tlawng (Dhaleshwari), Tiak, Chhimtuipui, Khawthlangtuipui, Tuirial and Tuichawng rivers having length more than 100 km. The river Tlawng is the longest river (185 km) and is situated in the northern parts of state, flowing northwards like other rivers in this part. Aizawl (21⁰58’–21⁰85’ N and 90⁰30’–90⁰60’ E), the capital of the state, is 1132 metre asl. The altitude in Aizawl district varies from 800 to 1200 metre asl. The climate of the area is typically monsoonic. The annual average rainfall is amounting to 2350 mm. The area experiences distinct seasons. The ambient air temperature normally ranges from 20 to 30⁰C in summer and 11⁰ to 21⁰C in winter (Laltlanchhuanga, 2006). The district stands on a high ridge, fringed in the east by sylvan valley of river Tlawng. The Tlawng river passes through the Aizawl district and it flanks the eastern side of Aizawl city. It rises at a general altitude of 800 feet in an area having coordinate and flows towards north Mizoram and joins the Barak river in Assam. The gradient of river Tlawng is steep at some places. The catchment of river is quite vast and is covered with forest where sandstone mining is prevalent. 2.2 Selection of Study Sites A total of four sampling sites were selected along river Tlawng, nearby two villages namely Sairang and Shimmui, to study water quality of Tlawng river. Of these, three stations were selected in mining areas with different age of mining. The fourth station was selected in unmined area representing control site or reference site to assess impact of sandstone quarry on water quality of Tlawng river, by comparing results obtained from other sites (sandstone mine affected areas). The study sites are presented in Map 1, and denoted A, B, C and D for the undisturbed (no mining operation), mildly disturbed (abandoned mine area- mining 10 years back)), moderately disturbed (abandoned mine area-mining 5 years back) and heavily disturbed (mining operation continued) sites, respectively. The description of study sites is as follows:

2.3 DeteWater sa(June to Sphysico-cExaminatdissolvedtemperat3. ResuThe findabbreviatfor mode3.1 TemThe wateand cheminvestigat22.2°C (dtemperatand 25.9°(dry seasrespectiv
Imp
erminationamples wereSeptember) chemical chtion of Watd oxygen (ture was meults and Dings of thetions used forately distu
mperature er temperatumical charation, the wdry season) ture was 22.°C ± 0.5 (weson) and 25vely.
pact of Sandstone Q
n of Water e collected and dry seaharacteristicter and WaDO), biocheeasured in °CDiscussione present inor study siterbed site an
ure is very acteristics owater tempeat highly d.2°C ± 0.3 (dt season); 25.5°C ± 0.5
Quarry on Water
Map 1: Locat
Quality from selectason (Octobcs. The mestewater (Aemical oxyC, and on then nvestigationes are UND fnd HD for higimportant wof a river aerature wasdisturbed andry season) a2.3°C ± 0.2 (wet season
Quality of Tlawng
265
tion Map of Sa
ted study siber to Januaethods as APHA, 1995gen demane spot usingn can be sufor undisturghly disturbwater qualitare directlys maximum nd moderatand 25.9°C ±(dry seasonn) at highly
griver in Aizawl D
ampling Sites
ites at montary) during 2described 5)’ were adond (BOD) ag thermometummarized rbed site, MIbed site. ty attribute.y affected bas 25.9°C tely disturbe± 0.2 (wet sen) and 25.6°Cy, moderatel
District, Mizoram,
thly interva2012–13, foin the ‘Staopted for aand total hter. and discusID for mildly
. Many of thby temperat(wet seasoed sites, reseason); 22.2C ± 0.4 (wetly, mildly an
North East India
als in the wor analysis oandard metanalysis of whardness. Tssed as folly disturbed he physical, ture. Duringon) and minspectively. T2°C ± 0.2 (drt season); 22nd undistur
wet season of selected thods for water pH, The water lows. The site, MOD biological g present nimum as The mean ry season) 2.2°C ± 0.2 rbed sites,
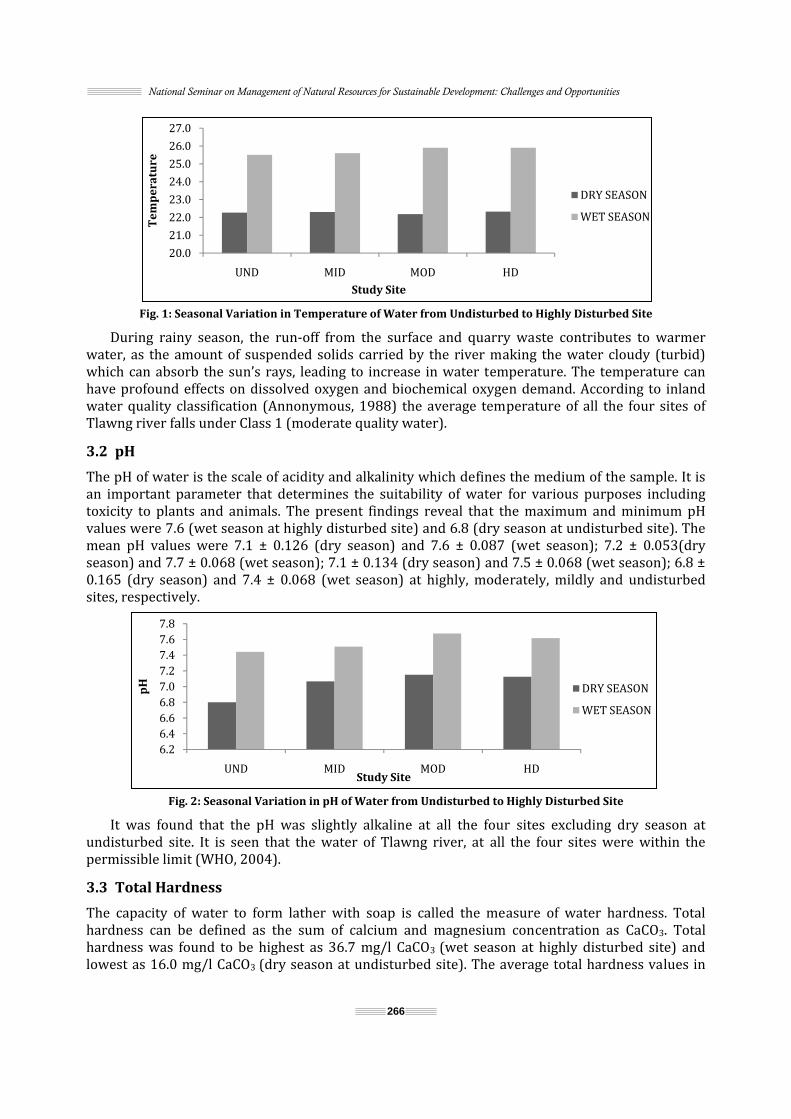
National Seminar on Management of Natural Resources for Sustainable Development: Challenges and Opportunities
266
Fig. 1: Seasonal Variation in Temperature of Water from Undisturbed to Highly Disturbed Site During rainy season, the run-off from the surface and quarry waste contributes to warmer water, as the amount of suspended solids carried by the river making the water cloudy (turbid) which can absorb the sun’s rays, leading to increase in water temperature. The temperature can have profound effects on dissolved oxygen and biochemical oxygen demand. According to inland water quality classification (Annonymous, 1988) the average temperature of all the four sites of Tlawng river falls under Class 1 (moderate quality water). 3.2 pH The pH of water is the scale of acidity and alkalinity which defines the medium of the sample. It is an important parameter that determines the suitability of water for various purposes including toxicity to plants and animals. The present findings reveal that the maximum and minimum pH values were 7.6 (wet season at highly disturbed site) and 6.8 (dry season at undisturbed site). The mean pH values were 7.1 ± 0.126 (dry season) and 7.6 ± 0.087 (wet season); 7.2 ± 0.053(dry season) and 7.7 ± 0.068 (wet season); 7.1 ± 0.134 (dry season) and 7.5 ± 0.068 (wet season); 6.8 ± 0.165 (dry season) and 7.4 ± 0.068 (wet season) at highly, moderately, mildly and undisturbed sites, respectively.
Fig. 2: Seasonal Variation in pH of Water from Undisturbed to Highly Disturbed Site It was found that the pH was slightly alkaline at all the four sites excluding dry season at undisturbed site. It is seen that the water of Tlawng river, at all the four sites were within the permissible limit (WHO, 2004). 3.3 Total Hardness The capacity of water to form lather with soap is called the measure of water hardness. Total hardness can be defined as the sum of calcium and magnesium concentration as CaCO3. Total hardness was found to be highest as 36.7 mg/l CaCO3 (wet season at highly disturbed site) and lowest as 16.0 mg/l CaCO3 (dry season at undisturbed site). The average total hardness values in
20.021.022.023.024.025.026.027.0
UND MID MOD HD
Tem
per
atu
re
Study Site
DRY SEASONWET SEASON
6.26.46.66.87.07.27.47.67.8
UND MID MOD HD
pH
Study Site
DRY SEASONWET SEASON

Impact of Sandstone Quarry on Water Quality of Tlawngriver in Aizawl District, Mizoram, North East India
267
dry and wet seasons were 22.3 mg/l CaCO3 ± 2.309 and 36.7 mg/l CaCO3± 4.528; 20.7 mg/l CaCO3 ±2.309 and 35.3 mg/l CaCO3 ± 4.391; 18.3 mg/l CaCO3 ± 2.732 and 23.1 mg/l CaCO3± 2.162; 16.0 mg/l CaCO3 ± 3.105 and 22.6 mg/l CaCO3 ± 2.732 at highly, moderately, mildly and undisturbed sites, respectively.
Fig. 3: Seasonal Variation in Total Hardness of Water from Undisturbed to Highly Disturbed Site The hardness values were found to be slightly higher during wet season which may be due to discharge of pollutants from quarry area though surface run-off. The total hardness values were within the permissible limit prescribed by WHO (500 mg/l CaCO3). 3.4 Dissolved Oxygen Dissolved oxygen is perhaps the most important limiting factor in aquatic ecosystem because most organisms other than anaerobic microbes perish rapidly when oxygen levels in water fall to zero. Therefore, determination of dissolved oxygen signifies the status of DO balance in water which in turn reflecting the health of an ecosystem. The dissolved oxygen content was maximum as 7.9 (dry season at undisturbed site) and minimum as 5.8 (wet season at highly disturbed site). The average DO contents in dry and wet seasons were 6.2 mg/l ± 0.117 and 5.8 mg/l ± 0.1;6.3 mg/l ± 0.081 and 6.1 mg/l ± 0.106; 6.2 mg/l ± 0.117 and 6.4 mg/l ± 0.068; 7.9 mg/l ± 0.127 and 7.5 mg/l ± 0.143 at highly, moderately, mildly and undisturbed sites, respectively. Higher concentration of DO during winter (dry) season may be due to slow rate of decomposition of organic wastes present in water and less pollution stress from surface run-off carrying quarry waste.
Fig. 4: Seasonal Variation in Dissolved Oxygen Content of Water from Undisturbed to Highly Disturbed Site
3.5 Biochemical Oxygen Demand (BOD) The Biochemical Oxygen Demand represents the amount of oxygen required for the microbial decomposition of the organic matter present in the water. It is used in monitoring water quality and biodegradation of waste materials which is designed to determine how much oxygen
0.05.010.015.020.025.030.035.040.0
UND MID MOD HD
Tot
al H
ard
nes
s
Study Site
DRY SEASONWET SEASON
0.01.02.03.04.05.06.07.08.09.0
UND MID MOD HD
D O
Study Site
DRY SEASONWET SEASON

National Seminar on Management of Natural Resources for Sustainable Development: Challenges and Opportunities
268
microorganisms consume during oxidation/ decomposition of the organic matter. The highest and lowest BOD values were 1.1 mg/l (winter season at highly disturbed site) and 0.9 mg/l (dry season at undisturbed site). The average BOD values were 1.0 mg/l± 0.052 and 1.1 mg/l ± 0.11; 0.9 mg/l ± 0.018 and 1.1 mg/l ± 0.126; 0.9 mg/l ± 0.066 and 1.0 mg/l ± 0.015; 0.9 mg/l ± 0.014 and 1.0 mg/l ± 0.013 at highly, moderately, mildly and undisturbed sites in dry and wet seasons, respectively.
Fig. 5: Seasonal Variation in Biological Oxygen Demand of Water from Undisturbed to Highly Disturbed Site The BOD values were higher during wet season due to high discharge of organic matter into the river from surface run-off which is followed by high rate of decomposition of organic matter present in water. This results in depletion of DO content of water. The BOD content at all the sites and seasons was within the permissible limit prescribed by WHO (3.0 mg/l). The results obtained during the present investigation suggest that extraction of sandstone in the catchment area badly affected the water quality of the Tlawng river. However, the values were within the permissible limit as given by the various scientific agencies like, CPCB, ISI, USPH, WHO. The findings are in conformity with the work of Mishra (2008), Mishra and Lalhruaizeli (2009), Lalchhingpuii et al. (2011) and Lalparmawii and Mishra (2010 and 2012). 4. Conclusion The findings of the present investigation reveal that the water quality attributes are within the permissible limit prescribed by various scientific agencies. But, sandstone mining leads to siltation and resulting into nuisance in the aquatic environment making ecosystem unsound. The sandstone mining also makes the river water alkaline, and traces of pollutants cannot be ignored. It is well-known fact that the rural people use river water directly for drinking purpose without any treatment. The long term consumption of such water may lead to different types of illnesses and diseases in human beings. Finally, it is recommended that the water needs proper treatment before use for drinking purpose. Acknowledgement The authors are grateful to the Ministry of Environment and Forests, New Delhi for financial assistance in the form Research Project, and to the Department of Science and Technology, New Delhi for support to the student under the DST-INSPIRE Fellowship. References APHA (2005), Standard Methods for the Examination of water and Wastewater, 21st Edition as Prescribed by American Public Health Association, American Water Works Association and Water Environment Federation, Washington, D.C. Bhadra, B.K., Gupta, A.K., Sharma, J.R. and Choudhary, B.R. (2007), Miningactivity and its Impact on the Environment: Study
from Makrana Marble and Jodhpur. Cairns, J. Jr. (1988), Rehabilitating Damaged Ecosystems, Vol. 1, CRC Prop, Boca Ratan, FL.
0.90.91.01.01.11.11.2
UND MID MOD HD
BO
D
Study Site
DRYSEASONWET SEASON
Impact of Sandstone Quarry on Water Quality of Tlawngriver in Aizawl District, Mizoram, North East India
269
Chakravorty, S.L. (2001), Artisanal and Small-scale Mining in India, International Institute for Environment and Development, p. 78. Dasgupta S., Tiwari B.K. and Tripathi, R.S. (2002), “Coal Mining in Jaintia Hills, Meghalaya: An Ecological Perspective, In: Pasaj, P.M. and Sharma, A.S., (eds), Jaintia hills, A Meghalaya Tribe: Its Environment, Land and People, Reliance Publishing House, New Delhi, pp. 121–128. Down, C.G. and Stocks, J. (1977), “Environmental Impact of Mining”, Applied Science, Publishers Ltd. London. Ibarra, J.M.N. and De Las Heras, M.M. (2005), “Open-cast Mining Reclamation”, In Forest Restoration in landscapes: Beyond Planting Trees. (Eds) Mansourian, S., Vallauri, D. and Dudley, N. Springer, New York. Kershaw, K.A. 1973, Quantitative and Dynamic Plant Ecology, Edward Arnold Ltd., London. ICN (2005) Budhpura ‘Ground Zero’ Sandstone Quarrying in India. India Committee of the Netherlands. http://www.indianet.nl/english.html. Accessed 05/05/2008. ITC (2008) International Trade Centre. http://www.intracen.org/tradstat/sitc3-3d/ep273.htm, accessed 29/11/2008. Kirk and Morgan (1984), “A New Global Rivers Database for Remote Sensing Programme Studying Climatically-sentitive Large Rivers”, Journal of Great Rivers Research, Vol. 21(3), pp. 307–318. Kopittke, G., Mulligan, D., Grigg, A. and Kirsch, B. (2004), “Development of Reconstructed Soils and Vegetation Communities at a Central Queensland Coal Mine: Preliminary Investigation of Twelve Years of Monitoring”, Proceedings of the Super Soil Conference, Sydney, p. 8. La Touche, T.H.D. (1891), Records Geological Survey of India, Vol. 24, Part 2. Lalchhingpuii, Lalparmawii S., Lalramnghinglova, H. and Mishra, B.P. (2011), “Assessment of the Water Quality of Tlawng River in Aizawl, Mizoram”, Science Vision, Vol. 11(2), pp. 72–76. Lalparmawii, S. and Mishra, B.P. (2010), “Hydro Energy in Mizoram: An Environmental Perspective”, In; National Conference on Renewable Energy for Development of Under-developed Regions with Particular Reference to NE India (NCRE2010), Organized Jointly by NECRD, Guwahati & Department of Energy, Tezpur University, at Tezpur, Assam. pp. 1–5. Lalparmawii, S. and Mishra, B.P. (2012), “Seasonal Variation in Water Quality of Tuirialriver in Vicinity of the Hydel Project in Mizoram”, Science Vision, Vol. 12(4), pp. 159–163. Laltlanchhuang, S.K. (2006), Studies of the Impact of Disturbance on Secondary Productivity of Forest Ecosystem with Special Reference to Surface, Sub-surface Litter Insect and other Non-insect Groups. M.Sc. Dissertation, Mizoram University. Lopez, D.L. and Stoertz, M.W. (2001), “Chemical and Physical Control on Waste Discharged from Abandoned Underground Coal mine”, Geological Society of London, Vol. 1(1), pp. 51–60. Mishra, B.P. (2008), “Water Pollution and Food Contamination in Relation to health Hazards: Food Safety as a Global Challenge”, Pollution Research, Vol. 27(3), pp. 395–400. Mishra, B.P. and Lalhruaizeli (2009), “Status of Quality of Spring Water in Western Part of Aizawl City, Mizoram”, Ecology, Environment & Conservation, Vol. 1, pp. 159–165. Morrel, W.J., Bolan, N., Gregg, P.E.H. and Stewart, R.B. (2003), “An Assessment of the re-Vegetation Potential of Acidic Basemental Tailing using Metal-tolerant Grass Species and Lime”, In: R. Naidu, V.V.S.R. Gupta, S, Rogers, R.S. Kookana, N.S. Bolan and D.C. Adriana (eds.), Bioavailability, Toxicity and Risk Relationships in Ecosystems, Science Publishers, Inc. Enfied USA, pp. 271–289. Mulligan, D. (2003), “Coal Development and Environment in Australia: Developing Sustainable Rehabilitation Strategies through Research”, Proceedings International Forum 2003-Coal Resources Development and Environment Harmony, Japan. New Energy and Industrial Technology Development Organization (NEDO) and Japan Coal Energy Centre (JCOAL), pp. 41–54. Okafor, F.C. (2006), “Rural Development and the Environmental Degradation versus Protection”, In P.O. Sada and T. Odemerho (ed.), Environmental Issues and Management in Nigerian Development, pp. 150–163. Ralte, V.Z. (2012), “Heavy Mineral Analysis of Tipam Sandstone near Buhchang Village, Kolasib District, Mizoram, India”, Sci. Vis., Vol. 12(1), pp. 22–31. RPCB (2007), Rajasthan State Pollution Control Board. State of the environment report for Rajasthan: 2007. http://rpcb.nic.in/. Last accessed 04/05/2008 Shueck, J., Mike, D.M., Barry, S. and Mike, S. (1996), “Water Quality Improvements Resulting from FBC ash Grouting of Buried Piles of Pyritic Materials on a Surface Coal Mine”, Proceedings of seventeenth Annual west Virginia Surface Mine Drainage Task Force Symposium, Morgantown WV, pp. 1–A. Swer, S. and Singh, O.P. (2003), “Coal Mining Impacting Water Quality and Aquatic Biodiversity in Jaintia District of Meghalaya”, ENVIS Bulletin: Himalayan Ecol., Vol. 11, pp. 26–33. Swer, S. and Singh, O.P. (2004), “Status of Water Quality in Coal Mining Area of Meghalaya”, In: Sinha, I.N., Ghose, M.K. and Singh, G. (eds.), Proceedings of the National Seminar on Environment Engineering with Special Emphasis on Mining Environment (NSSME), Journal of the Institution of Public Health Engineers, India, pp. 173–181. WHO (1993), Health Guideline for Drinking Water Quality, Technical Report Series 778, World Health Organization, Geneva, Switzerland.

270
38 Potential of Rain Water Harvesting
Prashant Thote1, L. Mathew2 and D.P.S. Rathoure2 1Gyanodaya Vidya Mandir, Narsingarh
2S.R.K.I. College, Firozabad
1. Introduction Water is quite important for the survival of all forms of life on this earth. It cannot be denied that greater part of our earth is covered by oceans. But ocean water is salty and we cannot use it either for drinking, or for irrigation of our fields. Hence, we depend upon fresh water which is limited in supply. So, we must be very careful in using it. When the scarcity of water is looming large on the whole humanity, especially, on India, it becomes our duty to conserve water resources at all costs. The need of the hour is to conserve and manage our water resources, to safeguard ourselves from health hazards, to ensure food security continuation of our livelihoods and productive activities and also to prevent duration of our natural ecosystems. Over-exploitation and mismanagement of water resources will impoverish this resource and cause ecological crisis that may have profound impact on our lives. Multipurpose projects launched after independence, with their integrated water resource approach, were thought of as the vehicle that would lead the nation to development and progress. Jawaharlal Nehru proudly proclaimed the dams as the ‘temples of modern India’. Multipurpose projects, or large dams, have many advantages of their own, but recently there have been many demonstrations against building big dams in different parts of the country. India has large water resources but they are not fully and properly utilized. Much of our water goes waste and we are in a position to use only one-third of our river water. In such circumstances, rain water harvesting system is a viable alternative both socio-economically and environmentally. 2. Meaning Rain water harvesting involves capturing rain where it falls, and making the optimum use it. Rain is the first form of water in the hydrological cycle, and hence, it is a primary source of water for us. Rivers, lakes and ground water are all the secondary sources of water. Rain is the ultimate source that feeds all these secondary sources of water. The most common practice of rain water harvesting is roof-top water harvesting. In this practice, roof-top water is collected by using a PVC pipe, water is filtered by using sand and bricks. Underground pipe takes water to sump for immediate usage. Then excess water from the sump is taken to the well and recharges the underground. Some of the successful states in this practice are Shillong in Meghalaya, Mysore in Karnataka to meet their water needs. Tamil Nadu is the first and only state in India which has made roof-top rain water harvesting structure compulsory to all the houses across the state. Water conservation has become the need of the day. Rain water harvesting is the best way to solve the problem of water crisis.
Potential of Rain Water Harvesting
271
3. Goals of Water Conservation The goals of water conservation efforts include as follows: 3.1.1. Sustainability To ensure availability for future generations, the withdrawal of fresh water from an ecosystem should not exceed its natural replacement rate. 3.1.2. Energy Conservation Water pumping, delivery, and wastewater treatment facilities consume a significant amount of energy. In some regions of the world, over 15% of total electricity consumption is devoted to water management. 3.1.3. Habitat Conservation Minimizing human water use helps to preserve fresh water habitats for local wildlife and migrating water flow, as well as reducing the need to build new dams and other water diversion infrastructures. Water harvesting is the activity of direct collection of rain water, which can be stored for direct use or can be recharged into the ground-water. As water harvesting is a traditional method, it has been used for millennia in most dry lands of the world. 4. Methods of Rain Water Harvesting Rain water is stored for direct use in above ground, or underground sumps/overhead tanks and used directly for flushing, gardening, washing etc. Recharged to ground through recharge pits, dug wells, bore wells, soak pits, recharges trenches etc. 5. Review of Literature
5.1 Studies Conducted Across the World 1. United Nations Environment Programme (Mati et al. 2006) conducted a study to determine if RWH technologies can be mapped at continental and counting scales. The project identified four major commonly adaptable RWH technologies. They were: Roof top RWH, Surface run-off collection from open surfaces into pans/ponds. 2. Mondal and Singh (2004) conducted a study of unconfined aquifer response in terms of rise in water level due to precipitation. Cross-correlation of rise in water level and precipitation is established. 3. Udda Meri (2006) used feed-forward neural network models to train the back percolation algorithm to forecast monthly and quarterly time-series water levels at a well that taps into the deeper. 4. In Germany, a study performed by Herr ann and Schmida (2008) reported that rain water harvesting can promote significant water saving in residences in different countries. Ghayoumiah et al (2006) paid special attention to artificial ground water recharge in water resource management in arid and semi-arid region. 6. Rain Water Harvesting Studies in India 1. Deepak Khara et al. (2004) have reviewed the impact assessment of RWH on ground water quality at Indore and Dewas, India. The impact assessment of roof top improves the quality and quantity of ground water.

National Seminar on Management of Natural Resources for Sustainable Development: Challenges and Opportunities
272
2. Ravi kumar et al. (2003) describes the roof top rain water harvesting in Chennai Airport using GIS. They explain the estimation of surface run-off using SCs method and design of rain water harvesting structures in Chennai Airport Terminal buildings. 3. Singh and Thapaliyal (1991) assessed the impact of watershed programme on rain-fed agriculture in Jhansi district of Uttar Pradesh. A shift in the area from pulses to cereals and from cereals to pulses was observed in Rabi and Kharif seasons respectively. Rain water harvesting is also one of the practices recommended by UNCCD to combat desertification. Following are the benefits of RWH System: 1. Rain water is a comparatively clean and totally free source of water. 2. It lowers the water supply cost. 3. It can supplement other sources of water supply such as ground-water, or municipal water connection. 4. It can provide an excellent backup source of water for emergencies. 5. It is good for laundry use as rain water is soft and lowers the need for detergents. 6.1 Need for Rain Water Harvesting As water is becoming scarce, it is the need of the hour to attain self-sufficiency to fulfill the water needs. Ground water is depleting day-by-day and water harvesting becomes very urgent. Due to the consumption of polluted water arise health hazards. So, water harvesting is very necessary. In the context of agricultural production in African dry lands, soil and water conservation practices such as a rain water harvesting provide an opportunity to stabilize agricultural landscapes in semi-arid regions and to make them more productive and more resilient towards climate change (Wallace, 2000;Lal, 2001). It is no denying that sustaining and recharging the ground-water along with judicious use of the limited fresh water resources is the need of the hour. If sufficient measures are not taken up immediately, we will face a crisis which will be detrimental to the very survival of mankind. Efficient management of water resources and education about judicious utilization of water resources along with measures of harnessing, and maintaining the quality of water and water bodies has to be taken up on war footing.
Fig. 1: Rain Water Harvesting System Schematic
Potential of Rain Water Harvesting
273
7. Objectives of the Study The rain water harvesting structures were installed at all quarters of the residential colony, school, recreational club, hospital and administrative block of the project. For the impact of rain water harvesting on ground water quality, the following steps are to be followed: 1. The ground water quality analysis data at pre-installation period of the rain water harvesting structures. 2. To collect the ground water samples in the post-monsoon period covering the entire campus area in order to analyze the impact of rain water harvesting on ground water quality. 3. Collection of ground water samples after few months to know the changes in the ground water quality since the post-monsoon times. 4. Comparative study of quality of all the three ground water quality test results, in order to ascertain the overall impact of rain water harvesting on ground water quality of the campus area. 8. Methodology To achieve the main objectives of the study, following methodology has been adopted: 1. Ground water Quality Test Results of February 2012 are arranged and analyzed. 2. Ground water samples were collected in the month of November, 2012 (Post-Monsoon period) and analyzed. 3. Ground water samples were collected in the month of April 2013, in order to know the changes in the ground water quality since the rain water recharge. 4. All the three ground water quality test results of the study area was compiled and comparative study was done to reveal the overall impact of rain water harvesting on ground water quality of the industrial township campus. 5. Analysis of rain water sample and ground water sample of the campus in order to check the impact of rain water harvesting. 6. Study of the impact of rain water harvesting on ground water quality potential of the township. Man plans most artificial recharge projects for specific purpose of saving, or storing fresh water for subsequent use. Among these projects, some may serve the dual purpose of eliminating objectionable amounts of water at the land surfaces and, at the same time putting this water into reserve for eventual extraction. Two hydraulic effects are generated by artificial recharge as a result of the head, which is applied in the recharge area and the mass of the water, which is introduced into the aquifer through the recharge area, the piezometric effect and the volumetric effect. The piezometric effect results in a rise in the piezometric surface in the unconfined aquifers and/or a rise of the artisan pressure in the confined aquifers. The piezometric effect is related to three main factors. First, it is related to factors which create a damping effect is related to shape of the piezometric surface to the geological and hydraulic boundaries of the aquifer and to the type of location of the recharging device. Secondly, it is related to quotient T/C (T=transmissivity coefficient; C=replenishment coefficient which is equivalent of storage coefficient). Thirdly, it is related to the artificial recharge yield and the duration of operation. Other factors, such as capillary forces, water temperature and presence of air bubbles in the aquifers also have an impact on the piezomtric effect. The volumetric

National Seminar on Management of Natural Resources for Sustainable Development: Challenges and Opportunities
274
effect is related to specific yield, replenishment coefficient, the transmissivity coefficient and the boundary coefficient model studies that were checked through field experiments have demonstrated that the bulk of the recharge water move according to the two systems of flow. One results in a spreading out effect, with a speed related to the recharge flow, the other in the sliding effect, with a speed related to ground water flow. 9. Rain Water Harvesting and Ground Water Quality The rain water harvesting is done primarily for the qualitative improvement, irrespective of its methods, whether collecting rain water n ponds or reservoirs for future use or by recharging the rain water to the ground water aquifers through bore hole drilled for the purpose, apart from the qualitative improvement of ground water as a result of dilution of certain chemical constituents and dissolved solids. This qualitative improvement of ground water is of utmost importance because where there is saline ground water or the chemical constituents are more than the desirable or maximum permissible limits, the rain water recharging the aquifers dilutes it to make it useful for drinking and other proposes, very often. The urbanization, agricultural development, and discharges of municipal and industrial residues into the water resources significantly alter its characteristics. The prevailing climatic conditions, topography, geological formations and use and abuse of this vital resource have significant affect on the characteristic of the water, because of which its quality varies with locations. The term ‘water quality criteria’ may be defined as the scientific data evaluated to derive recommendations for characteristics of water for specific use. The quality analysis conducted on the ground water samples collected during the month of February 2012, in the post-monsoon period in the month of November 2012 and in April 2013 reveals this truth of qualitative improvement of ground water through rain water recharge to the aquifers. 9.1 Sampling and Analysis of Ground Water The ground water quality monitoring studies were undertaken during the months of February 2012, November 2012 and April 2013. As the water systems are heterogeneous to varying degrees in space and time, the water samples were collected from tube wells and injection wells located at Guest House Colony, Senior Block and Administrative Block, covering the entire campus area. All the ground water samples were preserved in the field itself and transported to the laboratory for water quality testing. 10. Qualitative Impact of Rain Water Harvesting The ground water quality of industrial township has been tested in the month of February 2012 by collecting 5 ground water samples from the existing tube wells. Table 1 shows the parameters considered for the test and their results.
Table 1: Ground Water Quality Analysis (February 2012)
S. No. Parameters Values 1 pH 7.2–8.4 2 Total Hardness 228–650 mg/l 3 Nitrate 3.8–125 mg/l 4 Chloride 118–625 mg/l 5 Sulphate 87–227 mg/l 6 Flouride 0.8 –1.0 mg/l 7 TDS 369–680 mg/l

Potential of Rain Water Harvesting
275
Table 2: Comparative Ground Water Quality Analysis
S. No. Constituents Range of Water Quality Parameter Tested Desirable Limits
Maximum Permissible
Limits
February 2011
November 2011
April 2013
1 pH 6.5–8.5 6.5–9.5 7.2–8.3 6.9–6.9 7.0–7.92 Total Hardness (mg/L) 300 600 240–548 160–435 208–5953 Nitrate (NO₃) (mg/L) 45 100 3.5–44 5.4–30 6.5–454 Chloride (mg/L 250 1000 86–118 78–235 91–2485 Sulphate (SO₄) (mg/l) 200 400 70–160 50–175 65–1956 Fluoride (F) (mg/L) 1.0 1.5 0.2–0.4 01.–0.6 0.36–0.87 Total Dissolved Solid (mg/L) 500 2000 360–1250 327–1024 342–1144The concentrations of various parameters at the entire study area are shown in Table 1. Later on, ground water samples were taken twice during the months of November 2011 (05 samples) and April 2012 (05 samples) from the existing tube wells and injection wells at the campus for the comparative analysis of the ground water quality before and after rain water recharging. From the account of analysis of ground water quality, it is evident that the significant reduction in concentration of different chemical constituents is the result of dilution of these substances by the rain water, which is pure and has the pH 5.3. Again, these chemical constituents attain slightly higher concentration level due to the withdrawal of ground water and the dispersal of the localized recharged water to the downstream areas. 11. Rainfall during the Year 2011 and Impact on Ground Water Quality The south-west monsoon of 2011 was marked by near-normal rainfall over the country distributed equitably over both space and time. In Barisingarh, the rainfall recorded during 2011 was 758 mm, higher than the average annual rainfall of about 620.0 mm. This 136.0 mm increase in rainfall resulted in the greater than the normal recharge. The rain water potential of the campus area, i.e., amount of rain water recharge to the aquifer during the year 2011 was 42% more than the average potential. Hence, it had a bearing on the ground water quality. As a result, the pH and other chemical constituents have shown the substantial decrease in their concentration by the dilution through the rain water and after a few months (in April 2012), the slight increase was recorded in the concentration as depicted in the comparative ground water quality test data in Table 2. 12. Conclusion Water harvesting involves capturing rain where it falls and making use of the rain water where it falls. Rain is the first form of water in the hydrological cycle, hence, it is a primary source for us. Rivers, lakes and ground water are all secondary sources. Water harvesting involves the understanding of the value of rain and to make optimum use of rain water at the place where it falls. For water harvesting, various techniques and methods may be adopted; the first method is to capture run-off from roof top. The second way is to capture run-off water from local catchment area. The third way is to capture seasonal flood water from local streams. The fourth is to conserve water through watershed management. It simply means that the collected water should be kept clean by not allowing any polluting activities from where the water has been collected. Thus, water harnessed may prove to be very useful in times of need. It can serve many purposes. In the present study area, industrial township first and second method of water harvesting is done. Our results are in line with Mohd. Saleem et al. (2013), it may provide little insight that rain water harvesting in buildings in colonies may have positive impact on quality of water in addition to its regular benefits of water storage.

National Seminar on Management of Natural Resources for Sustainable Development: Challenges and Opportunities
276
Our ancestors were wise enough to harvest the rain water in a number of ways. They harvested the rain water directly from the roof tops and then stored it in tanks built in their courtyard, or in the artificial wells dug in the community lands. They also harvested rain water in open tanks, or village pools by fetching water that could be used both for drinking and irrigation purpose. We should follow the footstep of the ancestors and conserve and preserve rain water. Our average may have an easy access to about 340 hectare of land which can accommodate an average of 3.5 billion litres of water. What a relief to the villagers in the times of need, especially, when the rain fails and drought like situation stares at their faces. We also focus on other research activities such as herbal water purification, and fluoride removal by soil. The rain water harvesting structures were installed at various places at the study area at 20 metres depth. The other dimensions of ponds and injection wells are varying as per the designs and cross-sections enclosed. It is said, while going for the installation of rain water harvesting structures at study that the declining trend of the ground water level will occur if the rain water harvesting system will not be adopted. There was the mention of the improvement in ground water quality of the area. This paper is an effort to analyze the impact of rain water harvesting at the study area, qualitatively. The ground water samples collected analyzed in the months of February 2012, November 2012 and April 2013. These data were analyzed and compared to know the analyses reveals a very interesting figure as for as the ground water quality improvement is concerned and approves the claim of quality improvement. Therefore, in the light of the present work, analysis and interpretations, it can be concluded that the rain water recharge improves the quality of ground water and its quality depends upon the amount of rain water recharged and the environment of rain water collection and recharging.
Fig. 2: Comparative Hydrogen Ion Concentrations (pH) Fig. 3: Comparative Total Hardness
Fig. 4: Comparative Nitrate Concentrations Fig. 5: Comparative Chloride Concentration

Potential of Rain Water Harvesting
277
Fig. 6: Comparative Sulphate Concentration Fig. 7: Comparative Fluoride Concentration
Fig. 8: Comparative Total Dissolved Solids (TDS) Concentration
13. Recommendations 1. Rain water harvesting structures should be made compulsory to all the houses to ensure water security. 2. Legal provisions should be there to punish the defaulters while constructing houses. 3. Harvesting of rain water must be made compulsory, especially, in the coastal areas so that it can reduce the chances of over-flooding the coastal areas. 4. Compulsory rain water harvesting in the rural and urban areas will lower the water supply cost. 5. Seminars and workshops should be conducted at the rural and urban level so that people will be more aware of the rain water harvesting before monsoon rains. 6. Children should be taught about the importance of water, its conservation and preservation at the home, school and college levels. 7. Like Tamil Nadu, the roof top rain water harvesting structures should be compulsory to all the houses across the country.
National Seminar on Management of Natural Resources for Sustainable Development: Challenges and Opportunities
278
References A.P.H.A. (1995), Standard Methods of Analysis of Water and Waste Water, American Public Association U.S.A. 19th Edition. Baweja, B.K. and Karanth, K.R. (1980), Groundwater Recharge Estimation in India, Tech. Sr. H. Bull 2, Central Groundwater Board. BIS, Guidelines for the Quality of Irrigation Water, Indian Standard Institution, New Delhi. 1986. BIS, Indian Standard Specification for Drinking Water IS: 10500, Indian Standard Institution, New Delhi, 1983. Central Ground Status of Groundwater Quality Including Pollution Aspects Water Board, India, Central Ground Water Board, Ministry of Water Recourses, Govt. of India, New Delhi, 1997. Central Ground Treatment Techniques for Safe Drinking Water, Central Water Board, Ground Water Board, Ministry of Water Recourses, Govt. of India New Delhi, 1998. I.C.M.R. (1975), Manual of Standards of Quality for Drinking Water, Indian Council of Medical Research, New Delhi. Saleem, Mohd., Ahmed, Muqeem, Mahmood, Gauhar and Rizvi, S.A.M. (2012), “Analysis of Roundwater Quality Improvement using Rainwater Harvesting: A Case Study of Jamia Millia Islamia International”, Journal of Modern Engineering Research (IJMER), Vol. 2, Issue 5, pp. 3912–3916. WHO (1996), Guidelines for Drinking Water Second Edition, Vol. 1&2, World Health Organization, Geneva,

279
39 Tragedy of the Commons Revisited: Governance and Management of Natural Resources in Mizoram
Benjamin L. Saitluanga Department of Geography & RM, Mizoram University, Aizawl
E-mail: [email protected]
1. Introduction Management of natural resources is a key issue in both developed and developing countries. Overexploitation of natural resources due to increasing population and unsustainable consumerism, and for livelihood and affluence, calls for efficient management of natural resources. Natural resource management deals with the interaction between human and natural environment in which there are three important interrelated themes viz. conservation, livelihoods, and sustainability (Perreault, 2009). Analysis of the inter-relationship of these three concepts, in turn, raises questions of use, management and governance of natural resources. Thus, natural resource management emphasizes the control or direction of resource development while the later represents the actual exploitation or use of a resource during the transformation of ‘neutral stuff’ into a commodity or service to serve human needs and aspirations (Mitchell, 1979). The concept, therefore, takes into account not only control but also judicious use of natural resources to serve the needs of local users. Natural resources comprise of both renewable and non-renewable resources. Although natural resources are finite physical substances, they do not exist outside of human valuation or use, and are, therefore, social construct. According to Zimmerman (1951, p. 15), ‘[R]esources are not, but they become. They are not static but expand and contract in response to human wants and human actions.’ Zimmerman’s subjective, dynamic and functional interpretation of resource maintains that ‘attributes of nature are no more than ‘neutral stuff’ until man is able to perceive their presence, their capacity to satisfy human wants and to device means to utilize them’ (Mitchell, 1979). In other words, resource can be said to be dynamic, to grow and contract, to be valued and devalued or to be created and destroyed (Roberts and Emel, 1992). Throughout the world, natural resources like forests and other natural resources have been managed for several centuries as common property regimes by communities all around the globe (McKean and Ostrom, 1995). In India, traditional system of management of forest land and associated resources had existed in different forms in many parts of the country. A very large part of the country’s natural resources was common property until the introduction of ‘reserved’ and ‘protected’ forests in the closing years of the 19th century (NSSO, 1998). Presently, rural population in India have legal right to access only on some specific categories of land like ‘pasture and grazing lands’ and ‘village forests’, which are under the jurisdiction of the village or village panchayat. In the pre-colonial period, all village lands in Mizoram were community lands from which resources were extracted freely by the common people. The post-Independence period has witnessed transfer of ownership of land from the community to state government. Natural resources which were once belonging to the communities have become owned and managed by either individuals, or the state government. The transfer of ownership of lands, therefore, has

National Seminar on Management of Natural Resources for Sustainable Development: Challenges and Opportunities
280
resulted in exclusion of poorer section of the local people from access to, and management of, common pool resources. The livelihood of many people in rural areas, therefore, has been neglected due to emphasis on conservation practices and privatization of community land. The main objective of the present paper is to evaluate the relevance of ‘commons’ as resource management system among the hill tribes of Mizoram in north-east India through revisiting the well-known theory of the ‘tragedy of the commons’. The first section examines the concepts of ‘commons’ and ‘tragedy of the commons’. The second section is analysis of the extent and pattern of utilization of ‘commons’ in Mizoram. The third section examines the systems of governance and management of ‘commons’ in Mizoram followed by a section that deals with critical analysis on the linkages between the ‘commons’ and uneven development. The last section tries to give arguments on the relevance of commons as resource management system in the context of Mizoram. 2. The ‘Tragedy of the Commons’ The term ‘commons’ may refer to common pool resources which are those resources where the rights to exploit a resource are held by persons in common with others or non-exclusive resources to which the rights of use are distributed among a number of owners. Common pool resources are therefore public goods with finite, or subtractive benefits (Wade, 1987) which are potentially subject to congestion, depletion, or degradation, i.e. use which is pushed beyond the limits of sustainable yields (Blomquist and Ostrom, 1985). Another term, ‘common property resources’, on the other hand, subsumes the existence of property regimes or organizational systems circumscribing the nature of rights and responsibilities existing within the group with respect to the resources. Therefore, ‘[C]ommons are resources or other assets that members of a group of people have direct access to and some degree of control by virtue of their membership in a community, without such relationships necessarily being mediated through the legal and economic structures of states or formal markets’ (McCarthy, 2009, p. 498). Introduced in 1968 by Gareth Hardin, a population biologist, the ‘tragedy of the commons’ is a central theoretical model, for the analysis of natural resource problems (Roberts and Emel, 1992). It is the dominant framework within which social scientists portray environmental and resource issues and, as a neo-Malthusian concept, the tragedy of the commons posited that natural resources around the globe were finite and that infinite population growth upon a finite resource base was impossible; therefore, continued growth of the total human population would necessarily result, sooner or later, in a population that exceeded the global environment’s ability to support it (Godwin and Shepard, 1979). To understand the concept vividly, Hardin (1968) asked readers to imagine a pasture, a free resource on which many commoners or herdsmen had unlimited rights to graze cows. In such a scenario, each herdsman, as a rational human being, had strong economic incentives to overgraze, because they captured all of the economic gain from each additional cow that they brought to graze on the common—a right for which they paid nothing—but they bore only a fractional cost of the ecological damage and declining productivity caused by that additional cow. Since all users of the common had the same incentives, the result would be that each would bring more and more cows to graze on the common pasture until it was entirely destroyed, leaving both the resource and its users ruined. 3. Extent and Utilization of Common Pool Resources in Mizoram Common pool resources in Mizoram may include: 1. Village land and forests. 2. Streams, rivulets, and rivers.

Tragedy of the Commons Revisited: Governance and Management of Natural Resources in Mizoram
281
3. Village settlement area. 4. Village ponds, roads, footpaths and burial ground. 5. Public open ground. These village common resources are collectively owned by the local community and managed by local village councilsIn the absence of updated data, the present study relies on the data collected by the National Sample Survey Organization (NSSO) during January to June, 1998 commonly known as the NSSO 54th Round. According to NSSO (1998), Mizoram has the distinction of holding the largest area of CPR land per household in India with 4.37 hactare (ha.) per household while the country’s average was 0.31 ha. only. On the other hand, it was estimated that the extent of private property was very low with 0.36 ha. per household in comparison to the country’s average of 0.84 ha. per household. States lying below Mizoram in incidence of private properties were Kerala, W. Bengal and Tripura and Tamil Nadu. Table 1: Estimates of Consumption and Collection of Fuel-wood in Different States
State % of HH using Fuel-wood
54th Round (1998)
% of HH Reporting Collection
Avg. Qty. of Firewood Collected (54th Round)
(1998)
Avg. Qty. of Firewood Consumed (50th Round)
(1993–94) Arunachal Pradesh 85 82 5448 3786 Assam 60 44 614 1411 Manipur 75 40 1157 1635 Meghalaya 93 86 2558 2282 Mizoram 98 97 6688 1532 Nagaland 98 67 2972 2816 Sikkim 69 53 1805 1832 Tripura 51 31 427 1417 India 62 45 500 1015 Source: NSSO (1998) As shown in Table 1, the high value of average quantity of firewood collected indicated the high incidence of dependence on common pool resources in Mizoram. In fact, the quantity of firewood collected was exceptionally high in comparison to other states. Data were collected during 30 days preceding the date of survey while the survey was taken out during January to June, 1998 where most of the rural population collected firewood from burnt Jhum fields. On the other hand, the average quantity of firewood consumed was not high in comparison to other states. This implies that all the collected firewood were not consumed by household but may either be stored for future consumption or sold in the market. Interestingly, most of the fuel-wood i.e., 928 per 1000 were collected from village common land while no firewood or chip was reported to be collected from government forest. Apart from fuel-wood, CPRs were utilized for collecting water for drinking purpose, fodder, fruits, edible roots, tubers, honey, medicinal herbs, fish, leaves, weeds, grass and bamboos. Excluding water and fodder, the estimated value of these forest products collected during the previous year was Rs. 112 million in 1998 (NSSO, 1998). CPRs are also utilized for hunting and catching wild animals, birds and aquatic resources like fishes and crustaceans. It may be noted that these resources were plenty in the past as hunting and fishing were done judiciously. However, these wild resources were overexploited as a result of increasing contact with more civilized lowland people, increasing population, higher technology and introduction of market. Now-a-days, conservation measures have been taken up and population of wild animals and fishes have recovered gradually.
4. Governance and Management of Natural Resources in Mizoram In a traditional Mizo society, land belonged to the chiefs while commoners have free access to every pockets of land except the Jhum field allotted to a particular household for a particular year.
National Seminar on Management of Natural Resources for Sustainable Development: Challenges and Opportunities
282
Selection of site and size of Jhum field was done in accordance with the social status and size of family respectively. In such a simple society surviving on a harsh environment, large-scale production or exploitation of resources was not possible. Population was low and resources were abundant and there was a favourable symbiotic relationship between human and the environment. After the Independence of India, chieftainship was abolished and control and ownership of land was transferred to the State. Village Councils were constituted in each village to administer the villages on behalf of the government. They have the right to allocate land for residential purpose, Jhuming and other agricultural practices. However, large portions of land in various areas have been protected and reserved by the state government for conservation and protective measures. Presently, there are four categories or classes of land in Mizoram. The first is ‘protected forest reserve’ in which the state government exercises full control. Agricultural operations are prohibited on such land. The second is called ‘village safety reserve forests’ which is reserved for protection of villages from wild fires usually occurring at the time of burning Jhum fields or reserve constituted in the interest of health and water supply. No one is allowed to utilize village safety reserve forests for any purpose. The third category is village council owned and managed ‘village supply reserve forests’ in which the Village Councils, in accordance to Lushai Hills District (Jhumming) Regulation, 1954 and Mizoram Forest Act, 1955, have the power to distribute land for shifting cultivation. The fourth category is ‘unclassed forest’ which may be regarded as the natural forests beyond the purview of legal protection and remain untouched because of locational disadvantages and non-negotiable terrain (Thangchungnunga, 1997). However, it has been observed that these unclassed forests have been cleared for shifting cultivation due to scarcity of land. Thus, they may be considered as community land although they are officially termed ‘unclassed government forest’. Moreover, shifting cultivation frequently takes place within the government forest area too (Thangchungnunga, 1997). With the introduction of monetized economy and democratic institution, people started to acquire formerly community lands located at nearby settlement and river valleys for cultivation of plantation crops. Then, they claim ownership of land and obtain garden pass or periodic Patta. In the absence of stringent land laws, large tracts of community lands became private properties. It has been observed that almost all lands along major roads and agriculturally good flat lands are private properties. It appears that there will be an increasing tendency of concentration of land holding at the hands of the relatively fewer wealthy people as they see the commons as spaces that can be legitimately colonized. The privatization of formerly common lands and the elimination of traditional use rights through construction of hedges, walls and boundaries have created tensions and problems among the commoners as they were cut off from any direct access to the land. On the other hand, it increases the assets directly owned by nascent agrarian capitalists, it may be described as the starting point of capitalism or in Marxian terminology, a process of ‘primitive accumulation’, meaning processes of accumulation that logically has to precede capitalist accumulation (Marx, 1967). 5. Commons’ and Uneven Development According to Hardin, free resources would be overexploited to the point of ruination, leaving all of those who depended upon it devastated, if not managed properly through either privatization or strong state control. Hardin’s conjecture of putting all users to become devastated, however, could be argued that in some cases, differential access to and utilization of resources due to differences in capital investment may favour the richer section of the users. Overexploitation of resources may occur when more powerful individuals determined to extract more resources.
Tragedy of the Commons Revisited: Governance and Management of Natural Resources in Mizoram
283
Increasing social inequality at various scales has led to the need of inclusion of the concept of uneven development in the resource management analysis. Derived from the analysis of the dynamics of capitalist systems (Smith, 1984), the concept of uneven development provides a more encompassing and more fundamental basis for understanding resource appraisal and its implications for resource problem definition (Roberts and Emel, 1992). According to them, while Zimmermann’s analysis of resource as cultural appraisal failed to locate the driving forces behind resource dynamics in the social relations of capitalist production, the Marxist analysis provides insight into how capitalism would revolutionize and organize the social construction of resources. From Marxian perspective, unexploited and unknown resources have been relentlessly searched with the help of increasing technology and capital investment to meet the necessity of production and accumulation under the regime of capital. It has been observed that in many parts of Mizoram, more wealthy owners of land constructed lakes and ponds for fisheries and recreational centres at the upper part of rivers and streams which led to reduction of volume of water in the lower reaches. Many users in the lower profile of rivers are, therefore, devoid of formerly common resources. In the absence of any state government intervention through laws and regulations, resources which were formerly belonging to the common people or common property resources became privatized. Once the commons were turned into individual lots, they ceased to be commons and became exposed to commercial transactions (Maringanti et al., 2012). In the end, ‘tragedy of the commons’ happened as a result of increasing technology and capital investment by private entrepreneurs. The ambivalent concept of sustainable development is also curbing the access of natural resources in relatively less developed regions. Since the fundamental premise of mainstream conception on sustainable development is based on linkages between poverty and environmental degradation, governments around the globe emphasize on conservation of resources and protection of environment to tackle poverty. Although the intention of sustainable development is considered as development that includes issue of distributional equity (Reed, 1997), it is argued that through the push for sustainable development, First World elites are launching an eco-imperialism that is far more insidious than any form of colonialism (Louw, 2002). Poorer people at poorer places are still depending on forest products which, however, have been protected from access by the local population. As a matter of fact, short-term survival rather than the sustainable management of natural capital (soil, water, and genetic diversity) is often the priority of people living in absolute poverty (Carney, 1998). Therefore, it has been argued that the notion of sustainable development promotes the status quo, i.e., global economic activities that exploits the environment and dispossess the poor of access to resources (The Ecologist, 1993; Chatterjee and Finger, 1994). Therefore, the concept of sustainable development has to be redefined in the local context that sustainability does not only encompass aggressive conservationism and protectionism but also judicious use of resources for livelihood and equitable development. 6. Commons’ as Resource Management System In many parts of the world, the ‘commons’ have lost relevance due to increasing population, privatization and declaration of forest reserves for conservation practices. The customary practices of ecological stewardship had been widely erased and communities were fragmented and incapable of looking after the commons (Maringanti et. al., 2012). Decline of decentralized natural resource management implies less access of resources by the rural poor people and exclusion of traditional managers of natural resources in the management and decision-making processes. The needs of the common people for livelihood and sustenance have been grossly neglected due to reduction of commons through privatization and reservation for conservation practices. Privatization was an alien language for the local Mizo people and till today, many people are against the increasing tendency of privatization of land. This is clearly indicated by the pressure on the government to bring out land laws like Land Ceiling Act. The state, on the other hand, has been acting as a generous keeper of land for those who have applied for both agricultural and residential Land Settlement Certificate (LSC) and other periodic Patta.

National Seminar on Management of Natural Resources for Sustainable Development: Challenges and Opportunities
284
To some scholars, a commons is actually an effective management system. Hardin’s recommendation on management of CPRs by privatization, or by centralized control by state, has been questioned. They pointed out that Hardin’s thesis regarding the inevitable degradation of common resources was easily falsifiable empirically (McCarthy, 2009). Scholars have documented instances of resources that have been used sustainably by people for centuries, without ever triggering a tragedy of the commons (Ostrom, 1990; Ostrom et. al. 2002). It has also been argued that neither privatization nor state control would necessarily result in long term sustainability of the ‘commons’ (Ostrom, 1990; Feeny et. al., 1990). Instead, it has been suggested that community participation and effective monitoring system could make commons likely to succeed (Ostrom, 1990). In case of Mizoram, traditional forest management system like ‘safety forest’ which encircles the village for about one-to-one and half kilometers could be found in many villages. Although the creation of Village ‘Safety Forest’ is provided by the Mizo District (Forest) Act, 1955, the Mizo villagers were, even in the primitive period, in the habit of keeping reserved forest land adjoining to the entire perimeter of the village (Thangchungnunga,1997). These safety forests and other community lands have been managed by the village councils with the help of community organizations like Young Mizo Association (YMA), the organization in which every Mizo man and women except dependent populations are members. The successful continuation of community management of common lands reflects the needs of natural resources by the Mizo community for their livelihood and sustenance. Shifting cultivation represents another important resource management system apart from its better known characteristics as a source of livelihood. Although new land use policies, conservation practices and policies, shortage of land, low productivity, increase in off-farm employment and diversification of agricultural activities have accelerated the demise of shifting cultivation in many tropical and sub-tropical countries (Schmook et al. 2013; Castella et. al., 2013; Adams et al., 2013), it is still widespread in many parts of the world (Heinimannet al.2013; Groganet al., 2013). Many rural households in Mizoram are still depending upon shifting cultivation for livelihood. Jhum fields are community lands which are leased out and cleared with the help of fire for cultivation of rice and other secondary crops. Shifting cultivation may be considered as a part of natural resource management system developed by indigenous population as it does not include exploitation of resources up to critical level but helps in management of ecosystem diversity (Lewis, 1989). 7. Conclusion Natural resources are the sources of livelihood for majority of poorer people in less developed countries. Natural resource management, therefore, is an important issue as it relates to livelihood, conservation and sustainable development. Common pool resources like land and its natural resources have been utilized by common people for livelihood and sustenance for centuries without any disturbance and imposition. With the introduction of market economy, the ownership of common resources has been gradually transferred to individual and to the state. These two processes of acquisition of resources from the common people, suggested as forms of resource management by Hardin, do not necessarily help in the management of resources as projected. Privatization provides the owner a free role to exploit resources within the walls of his/ her boundaries. State government control of natural resources through creations of reserve forests and protected forests alienated the rural people as they are restricted from what they consider free resource belonging to them, thereby, encourage encroachment and poaching in violation of laws.

Tragedy of the Commons Revisited: Governance and Management of Natural Resources in Mizoram
285
Common pool resources are still important for livelihood among poorer rural population in Mizoram. Despite increasing privatization and state government control, Mizoram has the largest area of common pool resources per household. Although there are certain instances where common resources have been highly exploited and conservation practices have to be taken out, the Mizo as a community has effective management system of common resources like identification and demarcation of ‘safety forest’ nearby settlement area. Moreover, the use of natural resources including the highly criticized ‘Jhumming’ has not resulted in the ruination of resources or ‘tragedy of the commons’ after centuries. Absence of ownership did not result in excessive utilization and extraction of resources, which, however may have happened when common resources like rivers and streams are converted into lakes and ponds by individuals. Therefore, thinking in terms of conservation of resources, livelihoods of the people, and sustainability of ecosystem, it may be argued that with better management system in the form of community participation and surveillance, the ‘commons’ are still relevant among the Mizo tribes in north-east India. References Adams, C., Munari, L.C., Van Vliet, N., Murrieta, R.S.S., Piperata, B.A., Futemma, C., Pedroso Jr., N.N., Taqueda, C.S., Crevelaro, M.A. and Spressola-Prado, V.L. (2012), “Diversifying Incomes and Losing Landscape Complexity in Quilombola Shifting Cultivation Communities of the Atlantic Rainforest (Brazil)”, Human Ecology, 10.1007/ s10745-012-9529-9. Blomquist, W. and Ostrom, E. (1985), “Institutional Capacity and the Resolution of a Commons Dilemma”, Policy Studies
Review, Vol. 5(2), pp. 383–393. Castella, J.C., Lestrelin, G., Hett, C., Bourgoin, J., Fitriana, Y.R., Heinimann, A. and Pfund, J.L. (2012), “Effects of Landscape Segregation on Livelihood Vulnerability: Moving from Extensive Shifting Cultivation to Rotational Agriculture and Natural Forests in Northern Laos”, Human Ecology, DOI: 10.1007/ s10745-012-9538-8. Chatterjee, Pratap and Matthias, Finger (1994), The Earth Brokers Power, Politics and World Development. London: Routledge. Feeny, D, Berkes, F., McCay, B.J. and Acheson, J.M. (1990), “The Tragedy of the Commons: Twenty-Two Years Later”, Human Ecology, Vol. 18, No. 1, 1990, pp. 1–19. Godwin, R. K. and Shepard, W.B. (1979), “Forcing Squares, Triangles and Ellipses into a Circu Lar Paradigm: The Use of the Commons Dilemma in Examining the Allocation of Common Resources”, Western Political Quarterly, Vol. 32, pp. 265–277. Grogan, K., Birch-Thomsen, T. and Lyimo, J. (2013), “Transition of Shifting Cultivation and its Impact on People’s Livelihoods in the Miombo Woodlands of Northern Zambia and South-western”. Hardin, G. (1968) “The Tragedy of the Commons”, Science, Vol. 162, pp. 1243–48 Heinimann, A., Hett, C., Hurni, K., Messerli, P., Epprecht, M., Jørgensen, L. and Breu, T. (2013), “Socio-economic Perspectives on Shifting Cultivation Landscapes in Northern Laos”, Human Ecology, DOI: 10.1007/ s10745-013-9564-1. Louw, L. (2002), “Environmentalism and Sustainable Development: A Developing Country Perspective”, Julian L. Simon Memorial Lecture, February 6, 2002, http://www.libertyindia.org/events/simon_lecture_feb02.pdf. Mackinder, H. (1887), “On the Scope and Methods of Geography”, Proceedings of the Royal Geographical Society, Vol. 9, pp. 141–60. Marston, R. (2006), “Geography: The Original Integrated Environmental Science”, Presidential Plenary Address to the Association of American Geographers, 8 March, Chicago. Marx, K. (1967): Capital, Volume I, International Publishers, New York. McCarthy, J., (2009), “Commons”, in: N. Castree, D. Demeritt, D. Liverman and B. Rhoads (eds.) A Companion to Environmental Geography, 2009, Wiley-Blackwell, pp. 498–514. McKean, M.A. and Ostrom, E. (1995), “Common Property Regimes in the Forest, Just A Relic from the Past, FAO, Rome, Unasylva, Vol. 46(180), pp. 3–14. Mitchell, B. (1979), Geography and Resource Analysis, Longmans, New York. NSSO (1998), Common Property Resources in India, National Sample Survey Organisation Department of Statistics and Programme Implementation Government of India. Ostrom, E. (1990), Governing the Commons: The Evolution of Institutions for Collective Action, Cambridge University Press, Cambridge. Ostrom, Elinor, Thomas, Dietz, Nives, Dolsak, Paul, C. Stern, Susan, Sonich and Elke, U. Weber (2002), The Drama of the Commons, National Academies Press, Washington DC. Perreault, T. (2009), “Environment and Development”, in: N. Castree, D. Demeritt, D. Liverman and B. Rhoads (Eds.) A Companion to Environmental Geography, 2009, Wiley-Blackwell, pp. 442–460.

National Seminar on Management of Natural Resources for Sustainable Development: Challenges and Opportunities
286
Roberts, R.S. and Emel, J. (1992), “Uneven Development and the Tragedy of the Commons: Competing Images for Nature-Society Analysis”, Economic Geography, Vol. 68, No. 3 (Jul.), pp. 249–271. Schmook, B., Van Vliet, N., Radel, C., Manzón-Che, M. Dej. and McCandless, S. (2013), “Persistence of Swidden Cultivation in the Face of Globalization: A Case Study from Communities in Calakmul, Mexico”, Human Ecology, DOI: 10.1007/ s10745-012-9557-5. Smith, N. (1984), Uneven Development: Nature, Capital, and the Production of Space. Oxford: Basil Blackwell. Thangchungnunga (1997), “The Land Tenure System: An Analysis”, in: L.K. Jha (ed.), Natural Resource Management: Mizoram, APH Publishing House, New Delhi, pp. 41–72. The Ecologist (1993), Whose Common Future? Reclaiming the Commons, Philadelphia: New Society Publishers Wade, R. (1987), “The Management of Common Property Resources: Collective Action as an Alternative to Privatization or State Regulation”, Cambridge Journal of Economics, Vol. 11, pp. 95–106. Zimmermann, E. (1951), World Resources and Industries, Rev. ed. New York: Harper & Row.
287
40 Water Resource Management in Hilly Terrain with Special Reference to Kolasib District, Mizoram
Vinod K. Bharati1 and Shiva Kumar2
1Department of Chemistry, Govt. Kolasib College, Mizoram 2Department of Geology, Mizoram University Aizawl, Mizoram
E-mail: [email protected], [email protected]
1. Introduction Water sources particularly good enough to be for domestic usage are persistently under stress. There are several reasons including manmade activities viz. high population density in a region, decreasing free land for sub-surface recharge and encroachment to the river channels. Moreover, it has been observed that the melting of glaciers is being increased and in this way more and more water is expected in our river channels. Heavy rains on hilly terrain also feed the river channels quickly and conspicuously. The moment our river channels become more accommodative to welcome increased natural quota of additional water without being flooded it will on one hand enhance the recharge of groundwater and also ease the immediate consumptions in the densely populated regions on the other. In hilly terrain, water aquifers are rather discrete in nature than to be consistent. The water resource management along with the assurance of its suitability for drinking and domestic uses is to be understood. To achieve the objective, studies were conducted in the city of Aizawl, the capital of Mizoram as a case (Fig. 1). Aizawl was ranked second fastest growing city next to Guwahati among NE India by 1991 Census. Further, the processes of rapid urbanization continued and put Aizawl city at top in 2001 Census. These facts themselves are indicative of the difficulties in meeting the requirements of potable water supply in the city. Different plans for Aizawl city have been prepared from time-to-time to maintain a consistency in the supply of potable water. The supply of water in the city through the government agency PHED is possible by lifting it from Tlawng river flowing in western vicinity. Water seepages locally known as tuikhur (Fig. 2) play an important role as supplementary source in meeting the daily needs of water required for domestic uses. Hand pumps are available in almost all the localities in the city region. Depending upon the availability of water reserve in the aquifers the services may or may not be available in the dry seasons. Ground water aquifers are in fact located in the rocks only which are folded, faulted and heavily jointed. 2. Geology of the Area The state of Mizoram is located in the south-eastern corner of the north-eastern India bordered to the east by Myanmar and to the south by Bangladesh. Plain land of Bangladesh is sharply converting into beautifully elongated north-south trending anticlinal hills and synclinal valleys, draped by luxuriant forest. The rocks of Mizoram i.e. Bhuban formation of Surma Group consists of sandstone, siltstone, shale dominantly. The major features of these sedimentary rocks are lack of

National Seminar on Management of Natural Resources for Sustainable Development: Challenges and Opportunities
288
bedding planes. The bedding planes are the planes which distinguishes one type of rock from the other. The contact between sandstone and shale types of rocks is in fact gradational. Therefore, sandstone and shale are not present as separate identities, instead they are merged together even at microscopic level.
Fig. 1: Location of the Area Water keeping capacities of sandstone and shale are different. Sandstone of the area are of different types as far as their hardness and compactness is concerned, while shale on the other hand is found to be porous but rarely permeable. The minerals which are dominating in sandstone are quartz, feldspars–orthoclase, microcline and albite and minerals which are dominating the shale include illite, montimorillonite and kaolinite. The potable water in city of Aizawl is coming from the surface of the nearby rivers; therefore, it seems mandatory to have some discussion on the rock types vis-à-vis their chemistry. 3. Materials and Methods Water samples were collected in polythene bags that had been thoroughly washed with acidic water and rinsed twice with distilled water. The polythene bags were closed tightly to avoid any spillage during transportation. Samples were analyzed for various physical, chemical and bacteriological parameters following standard methods (APHA, 1998). pH, electrical conductivity (EC) and total dissolved solids (TDS) were measured by portable pH meter, EC meter and TDS meter ((Eutech, Oakton) respectively in situ itself. Turbidity of the samples was determined by a Nepheloturbiditymeter (Systronics Digital Nepheloturbiditymeter-132) in NTU using hydrazine sulphate and hexamethylene tetramene as standards. Total alkalinity (TA) was determined by titration with a standard solution of a strong acid indicated by means of colour, whereas, the determination of total hardness (TH) was done by EDTA titration. Chloride was estimated by volumetric titration of neutral or slightly alkaline sample against silver nitrate solution using potassium chromate as an indicator. Fluoride contents in drinking water samples were determined using expandable Ion-Analyzer Model EA 940 with fluoride ion selective electrode (Orion Ion Selective Electrode Model 96–09) at IIT Mumbai. The determination of nitrate concentration in the

Water Resource Management in Hilly Terrain with Special Reference to Kolasib District, Mizoram
289
samples was done by ultraviolet spectrophotometric method. Estimation of sulphate ions was done by turbidimetric method. Calcium and Magnesium were estimated by the EDTA titrimetric method. All other metals and heavy metals were measured on ICP-AES (Horiba Jobin Vyon ULTIMA-2) at IIT Mumbai. The multiple tube fermentation technique was used to enumerate positive presumption and confirmed coliform test. 4. Result and Discussion In order to explore the probable mechanism of physical and chemical weathering processes, chemical analysis of water and that of aquifer rocks are taken into account. Table 1 (a,b,c) exhibits physical, chemical and bacteriological characteristics of tuikhur (Fig. 3) water analyzed in 2008 (Kumar et. al 2010; Bharati, 2011). Analysis of sandstone and shale which are the host rocks of potable water sources has been presented in Table 2 (a, b). The data consists of major and minor elements in the form of oxide percentages. Trace and rare earth elements are in elemental form and occurrence is measured in parts per million.
Table 1(a): Physico-chemical Parameters of Tuikhur Water Pre-Monsoon 2008
Micro Water Shed
Samples Location pH EC TDS Turb TA THwater Shed I KT-27 Kawnpui–Azl rd I 7.2 183 129 0.6 40.75 48.5KT-26 Kawnpui–Azl rd I 7.2 142 90 0.9 40.6 43.65KT-25 Kawnpui–police st 7.1 145 93 1 38.5 53.35KT-28 Kawnpui–PWD 7.3 80 52 0.7 42.5 48.5KT-29 Kawnpui–Mualvum rd 7.5 190 131 1 48.5 43.65KT-32 Kawnpui– Hortoki III 7.1 194 130 0.9 38.65 53.35KT-31 Kawnpui – Hortoki II 7.1 85 53 1 37.25 58.2KT-30 Kawnpui – Hortoki I 7.5 220 154 0.9 48.65 58.2Water shed II KT-24 Bualpui BSNL 7.4 182 129 0.9 46.5 63.05KT-23 Bualpui - below FCI 7.3 138 90 0.9 43.15 67.9KT-22 Thingdawl pump st 7.2 130 84 0.8 41.5 67.9KT-21 Thingdawl-Agri Park 7.1 150 96 0.7 39.7 58.2Water shed IV KT-14 Klb-ICAR complex 7.3 160 107 0.7 43 47.86KT-11 Klb-Diakkawn ground 7 155 105 0.6 34.3 58.2KT-13 Klb-Diakkawn- Azl rd II 7.1 115 72 0.8 37.62 53.35KT-12 Klb, Diakkawn- Azl rd I 6.8 150 103 0.7 32.25 49KT-16 Klb, Forest veng 7.3 120 82 0.9 43 63.05KT-15 Klb, Project veng 7.1 180 125 1 37.62 58.2KT-3 Klb-old UPC church 7.3 140 90 0.7 43 53.35KT-1 Klb-Convent rd 7 150 92 0.7 34.75 63.05KT-2 Klb, St. John’s school 6.8 128 85 0.7 32.25 58.2KT-4 Klb- Venglai P/S-III 7.4 138 85 0.7 46.5 48.5Water Shed VI KT-5 Klb-Banglakawn 7.1 142 90 0.8 37.25 53.35KT-6 Klb-electric veng 7.4 200 145 0.9 46 63.05KT-7 Klb, police st 7.5 88 54 1 48.37 48.5KT-9 Klb-Saidan -II 7.1 112 71 0.9 37.62 62.96KT-8 Klb- Saidan-I 7.3 125 85 0.9 41 43.65KT-10 Klb-petrol pump 7.2 150 102 1.1 41.6 63.05KT-17 Klb-Rengtekawn-I 7.1 208 147 1.1 38.5 62.93KT-18 Klb-Rengtekawn-II 6.8 110 70 1 32.25 50.12Water Shed VII KT-19 Bilkhawthlir-BSNL 7 145 95 0.9 36.5 53.35KT-20 Bilkhawthlir-Post Off 7 225 158 0.8 36.5 53.35Mean 7.18 149.38 99.81 0.85 40.19 55.36Min 6.8 80 52 0.6 32.25 43.65Max 7.5 225 158 1.1 48.65 67.9

National Seminar on Management of Natural Resources for Sustainable Development: Challenges and Opportunities
290
Table 1(b)
Micro Water Shed
Samples Location Na K Fe Ca Mg Cd Zn Cr Mn Ni
Cu
Co Pb As Water Shed I KT-27 Kawnpui–Azl rd I 8.53 1.8 0.03 15.56 2.34 0.03 0.04 0 0 * * * 0.014 *KT-26 Kawnpui–Azl rd I 8.67 1.8 0.02 11.67 3.52 0.03 0.05 0 0 * * * 0.015 *KT-25 Kawnpui–police st 9.8 1.98 0.02 11.67 5.88 0.03 0.06 0 0 * * * 0.015 *KT-28 Kawnpui–PWD 10.08 1.72 0.02 13.61 3.52 0.03 0.03 0 0.03 * * * 0.012 *KT-29 Kawnpui–Mualvum rd 11.36 2.48 0.03 11.67 3.52 0.03 0.04 0 0 * * * 0.011 *KT-32 Kawnpui–Hortoki III 13.98 1.98 0.33 11.67 5.88 0.03 0.04 0 0.03 * * * 0.012 *KT-31 Kawnpui–Hortoki II 13.9 1.98 0.01 15.56 4.7 0.03 0.04 0 0.03 * * * 0.09 *KT-30 Kawnpui–Hortoki I 14.55 2.01 0.32 13.61 5.88 0.03 0.06 0 0.03 * * * 0.09 *Water Shed II KT-24 Bualpui BSNL 12.62 2.39 0.03 9.72 9.42 0.03 0.04 0 0 * * * 0.011 *KT-23 Bualpui-below FCI 10.41 1.86 0.02 13.61 8.24 0.03 0.03 0 0 * * * 0.08 *KT-22 Thingdawl pump st 11.48 2.5 0.03 15.56 7.05 0.03 0.03 0 0 * * * 0.08 *KT-21 Thingdawl-Agri Park 7.3 1.41 0.03 15.56 4.7 0.03 0.03 0 0 * * * 0.011 *Water Shed IV
KT-14 Klb-ICAR complex 10.86 2.14 0.04 9.72 5.73 0.03 0.02 0 0 * * * 0.01 *KT-11 Klb-Diakkawn ground 8.05 0.91 0.02 15.56 4.7 0.03 0.02 0 0 * * * 0.08 *KT-13 Klb-Diakkawn-Azl rd II 6.42 0.6 0.03 11.67 5.87 0.03 0.03 0 0 * * * 0.015 *KT-12 Klb, Diakkawn-Azl rd I 6.25 0.52 0.03 11.05 5.2 0.03 0.02 0 0 * * * 0.09 *KT-16 Klb, Forest veng 10.08 1.97 0.03 15.55 5.88 0.03 0.02 0 0 * * * 0.011 *KT-15 Klb, Project veng 10.5 2.08 0.03 7.78 9.42 0.03 0.03 0 0.02 * * * 0.01 *KT-3 Klb-old UPC church 7.5 0.72 0.02 13.61 4.7 0.03 0.02 0 0 * * * 0.015 *KT-1 Klb-Convent rd 4.3 0.61 0.02 15.56 8.23 0.03 0.02 0 0 * * * 0.08 *KT-2 Klb, St. John’s school 4.86 0.63 0.02 7.78 9.42 0.03 0.02 0 0 * * * 0.09 *KT-4 Klb- Venglai P/S-III 6.85 0.48 0.02 11.67 5.88 0.03 0.03 0 0.03 * * * 0.09 *Water Shed VI KT-5 Klb-Banglakawn 11.42 1.75 0.03 9.72 7.06 0.03 0.04 0 0 * * * 0.09 *
Table 1(b) (Contd.)…
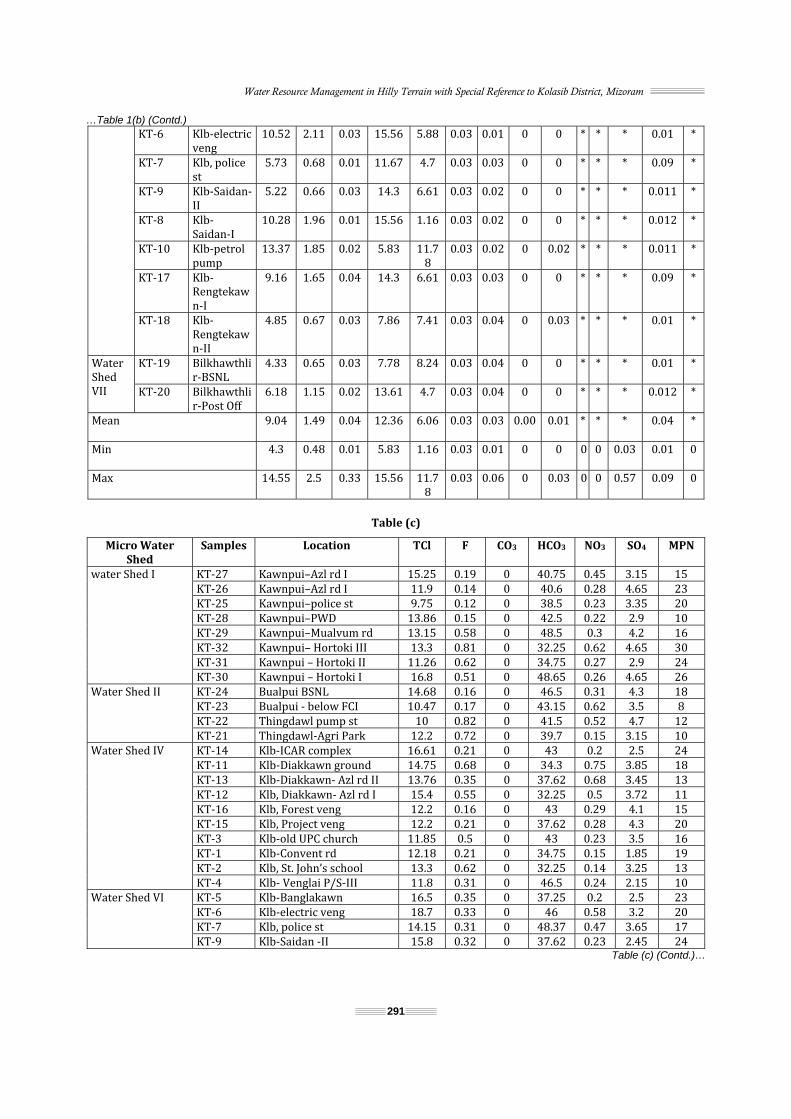
Water Resource Management in Hilly Terrain with Special Reference to Kolasib District, Mizoram
291
…Table 1(b) (Contd.) KT-6 Klb-electric veng 10.52 2.11 0.03 15.56 5.88 0.03 0.01 0 0 * * * 0.01 *KT-7 Klb, police st 5.73 0.68 0.01 11.67 4.7 0.03 0.03 0 0 * * * 0.09 *KT-9 Klb-Saidan-II 5.22 0.66 0.03 14.3 6.61 0.03 0.02 0 0 * * * 0.011 *KT-8 Klb- Saidan-I 10.28 1.96 0.01 15.56 1.16 0.03 0.02 0 0 * * * 0.012 *KT-10 Klb-petrol pump 13.37 1.85 0.02 5.83 11.78 0.03 0.02 0 0.02 * * * 0.011 *KT-17 Klb-Rengtekawn-I 9.16 1.65 0.04 14.3 6.61 0.03 0.03 0 0 * * * 0.09 *KT-18 Klb-Rengtekawn-II 4.85 0.67 0.03 7.86 7.41 0.03 0.04 0 0.03 * * * 0.01 *
Water Shed VII KT-19 Bilkhawthlir-BSNL 4.33 0.65 0.03 7.78 8.24 0.03 0.04 0 0 * * * 0.01 *KT-20 Bilkhawthlir-Post Off 6.18 1.15 0.02 13.61 4.7 0.03 0.04 0 0 * * * 0.012 *Mean 9.04 1.49 0.04 12.36 6.06 0.03 0.03 0.00 0.01 * * * 0.04 *Min 4.3 0.48 0.01 5.83 1.16 0.03 0.01 0 0 0 0 0.03 0.01 0Max 14.55 2.5 0.33 15.56 11.78 0.03 0.06 0 0.03 0 0 0.57 0.09 0Table (c)
Micro Water Shed
Samples Location TCl F CO3 HCO3 NO3 SO4 MPNwater Shed I KT-27 Kawnpui–Azl rd I 15.25 0.19 0 40.75 0.45 3.15 15KT-26 Kawnpui–Azl rd I 11.9 0.14 0 40.6 0.28 4.65 23KT-25 Kawnpui–police st 9.75 0.12 0 38.5 0.23 3.35 20KT-28 Kawnpui–PWD 13.86 0.15 0 42.5 0.22 2.9 10KT-29 Kawnpui–Mualvum rd 13.15 0.58 0 48.5 0.3 4.2 16KT-32 Kawnpui– Hortoki III 13.3 0.81 0 32.25 0.62 4.65 30KT-31 Kawnpui – Hortoki II 11.26 0.62 0 34.75 0.27 2.9 24KT-30 Kawnpui – Hortoki I 16.8 0.51 0 48.65 0.26 4.65 26Water Shed II KT-24 Bualpui BSNL 14.68 0.16 0 46.5 0.31 4.3 18KT-23 Bualpui - below FCI 10.47 0.17 0 43.15 0.62 3.5 8KT-22 Thingdawl pump st 10 0.82 0 41.5 0.52 4.7 12KT-21 Thingdawl-Agri Park 12.2 0.72 0 39.7 0.15 3.15 10Water Shed IV KT-14 Klb-ICAR complex 16.61 0.21 0 43 0.2 2.5 24KT-11 Klb-Diakkawn ground 14.75 0.68 0 34.3 0.75 3.85 18KT-13 Klb-Diakkawn- Azl rd II 13.76 0.35 0 37.62 0.68 3.45 13KT-12 Klb, Diakkawn- Azl rd I 15.4 0.55 0 32.25 0.5 3.72 11KT-16 Klb, Forest veng 12.2 0.16 0 43 0.29 4.1 15KT-15 Klb, Project veng 12.2 0.21 0 37.62 0.28 4.3 20KT-3 Klb-old UPC church 11.85 0.5 0 43 0.23 3.5 16KT-1 Klb-Convent rd 12.18 0.21 0 34.75 0.15 1.85 19KT-2 Klb, St. John’s school 13.3 0.62 0 32.25 0.14 3.25 13KT-4 Klb- Venglai P/S-III 11.8 0.31 0 46.5 0.24 2.15 10Water Shed VI KT-5 Klb-Banglakawn 16.5 0.35 0 37.25 0.2 2.5 23KT-6 Klb-electric veng 18.7 0.33 0 46 0.58 3.2 20KT-7 Klb, police st 14.15 0.31 0 48.37 0.47 3.65 17KT-9 Klb-Saidan -II 15.8 0.32 0 37.62 0.23 2.45 24Table (c) (Contd.)…

National Seminar on Management of Natural Resources for Sustainable Development: Challenges and Opportunities
292
…Table (c) (Contd.) KT-8 Klb- Saidan-I 15 0.52 0 41 0.22 3.6 23KT-10 Klb-petrol pump 14.05 0.32 0 41.6 0.21 2.85 30KT-17 Klb-Rengtekawn-I 17.7 0.15 0 38.5 0.68 2.15 29KT-18 Klb-Rengtekawn-II 13.5 0.61 0 32.25 0.21 3.2 25Water Shed VII KT-19 Bilkhawthlir-BSNL 12.35 0.6 0 36.5 0.18 4.75 26KT-20 Bilkhawthlir-Post Off 13.72 0.62 0 36.5 0.2 3.25 18Mean 13.69 0.40 0.00 39.91 0.34 3.45 18.94Min 9.75 0.12 0 32.25 0.14 1.85 8Max 18.7 0.82 0 48.65 0.75 4.75 30Table 2(a): Chemical Analysis of Lower and Middle Bhuban Rocks Major & Minor Oxides (in %)
Oxides in % Tage. M/313 M/371A M/422A M/474A M/624BRock Type Sandstone Silty Sandstone Brown Sandstone Shale Shale
Locality Chand-Chalt Champui Champui Champui CompanySiO2 68.35 64.32 72.56 71.83 59.46TiO2 0.69 0.68 0.67 0.61 0.81Al2O3 15.38 16.76 13.72 13.54 20.30Fe2O3 5.65 6.38 3.84 4.62 6.07FeO - - - - - CaO 0.33 0.31 0.21 0.45 0.27MgO 1.54 2.00 1.23 1.79 1.98MnO 0.038 0.152 0.033 0.088 0.039Na2O 1.54 1.22 1.15 1.91 1.05K2O 2.48 3.10 2.18 2.26 3.66P2O5 0.105 0.100 0.098 0.101 0.103Total 96.08 95.03 95.69 97.21 93.75LOI % 4.59 5.1 3.44 3.81 6.27Table 2(b)
Element (in ppm)
M/313 M/371A M/422A M/474A M/624BSc 12 12 8 7 14Co 14 19 8 15 18Ni 37 48 32 41 72Cu 25 29 19 23 38Zn 80 100 254 74 113Ga 18.2 20.5 13.4 13.6 27.8Pb 18.1 27.1 29.8 17.8 29.7Th 15.8 14.6 14.0 9.8 21.5Rb 108.3 139.3 78.8 91.3 180.7U 3.5 3.6 3.5 1.9 2.9Sr 79 84 65 96 95Y 34.1 32.7 35.3 21.9 38.9Zr 238 212 413 178 230Nb 15.7 13.9 12.2 11.1 17.3Ba 373 527 343 337 352Cr 103 249 197 188 223V 89 133 87 87 90The entire water shed is covered by thin to thick vegetation and as such the surface area of exposed rock is very less. The rocks are mainly exposed along the streams, road sections, on jhum patches and on valley slopes. Since the rocks are structurally disturbed and geologically young, these are weak and are prone to deep weathering giving rise to silty and clayey soils. Fluoride concentration in the samples varies from 0.10 to 0.82 mg/l whereas the recommended value of fluoride concentration in potable water is 0.50–1.50 mg/l (ISI, 1991 & WHO, 2008). Most of the samples have less fluoride than the recommended level. Fluoride in drinking water can originate from the fluoride bearing minerals such as fluorspar, fluorite, cryolite,

Water Resource Management in Hilly Terrain with Special Reference to Kolasib District, Mizoram
293
fluorapatite and hydroxylapatite (Meenakshi et al, 2004). The low level of fluoride in water samples may be attributed to the lack of fluoride bearing minerals in the strata through which water is filtering. Calcium is the most abundant cation in the drinking water samples of the study area. Its concentration ranges from 5.83 to 15.68 mg/l in KT water. All these values are well within the desirable limit of 75 mg/l (ISI, 1991).
Fig. 2: Photograph of Tuikhur, where Vegetation and the Condition of Rocks are Visible
Fig. 3: Photograph of Tuikhur not in Good Condition, Water Flowing in the Neighbouring Area can also be Observed along with the Vegetation The trace metals in water behave in a typical manner. No single mechanism is sufficient to explain the process that are undergoing in the water. Trace metals like Fe, Mn, Cu, Zn, Co, Ni etc are very important for the proper functioning of the biological system and their deficiency or excess in the human system can lead a number of disorders. Other trace metals like Pb, As, Hg etc are not only biologically non-essential but definitely toxic. The potential toxic metal elements such as Cr, Pb, Cu, Zn etc are identified to cause health hazards in animals. Trace elements are generally present in small concentration in natural water system. Their occurrence in ground water and surface water can be due to natural sources such as dissolution of naturally occurring minerals containing trace elements in the soil zone or the aquifer material or to human activities such as mining, fuels, smelting of ores and improper disposal of industrial wastes (Jinwal et al, 2009). The concentration of Ni, Cu, Co and As is below the limit of detection in all the samples; whereas, the content of other metals and heavy metals is also very low. Such low contents of heavy metals in both types of potable waters i.e. surface water (supply water through PHED) and the sub-surface

National Seminar on Management of Natural Resources for Sustainable Development: Challenges and Opportunities
294
water (Tuikhur water) is not in agreement with the potable waters of the neighbouring states of Manipur, South Assam, Tripura (Banerjee et al., 2011) and neighbouring country Bangladesh (Smith et al., 2000). The low amounts of heavy metals may be attributed by pronounced adsorption phenomenon in area under study. The area is dominated by shale which consists of clay minerals having phyllosilicate structure providing enormous space as structural voids, where metals ions of large ionic size can be accommodated by replacing OH-, K+ … ions. In the present study, the alkaline earths exceed alkalis and weak acids exceed strong acids respectively that are the total hydrochemistry of the area under study is dominated by alkaline earths and weak acids. The weathering process entails the interaction of an aqueous solution (and/ or gas) with rock material to produce a solution of different composition from the reactant one, a residue of insoluble solids of the initial rock, and other solids that are secondary mineral phases. The weathering medium transports the products and in so doing fractionates the material into accumulations of differing sediments and natural waters. Here, the chemical weathering, i.e. considering the solubility and stability of some of the principal rock-forming minerals and their weathering reactions under different pH, redox potential conditions takes place. Minerals may be dissolved in the active aqueous reactant phase either by simple congruent dissolution reactions such as:
Or by an incongruent one such as:
In these two examples, the aqueous reactant phase is shown as pure water. Often, it is the soil water or ground water that is the active weathering agents and frequently these are mildly acidic from uptake of CO2 produced via the respiration of organisms. Rain water is also mildly acidic (pH ≈ 5-6) as it dissolves some atmospheric CO2 to give a weak carbonic acid solution. Stream and river waters vary slightly in pH but often are close to neutral. Further the soil pH conditions of Mizoram are slightly alkaline. The important rock forming mineral in sandstone and even in shale is quartz. Therefore solubility of quartz will be taken as an example. The relevlant equilibrium constants (Stumm and Morgan, 1970) are as follows:
These equilibria allow the calculation of the solubility either of quartz or amorphous silica as a function of pH. For amorphous silica shows that at pH less than 8 the solubility is constant (at10-2.7M) with decreasing pH, while it rises rapidly at higher pH values. The equilibrium constant for reaction-1 indicates that the solubility of quartz is an order of magnitude lower than that of amoprphous silica.
SiO2 + 2H2O H4SiO4Quartz silicic acid MgCO3 + 2H2O Mg(OH)2 + HCO 3 + H+.magnesite brucite
SiO2 + 2H2O H4SiO4 log K = -3.7(25®C),quartz Silicic acid SiO2 + 2H2O H4SiO4 log K = -2.7, amorphous silica H4SiO4 H3SiO4 + H+ log K= -9.46.
Water Resource Management in Hilly Terrain with Special Reference to Kolasib District, Mizoram
295
Similarly, feldspars also albite Na-feldspar and otheroclase and microcline K-feldspar give rise to the formation of clay minerals only kolinite in following manner: a. Feldspar hydrolysis by exchange at the mineral surface, of H+ for K+ followed by, b. The development of gibbsite as an intermediate product, which in turn is followed by, c. Development of kaolinite. These additional clay minerals produced from the weathering of sandstone increases the quantity of clay minerals already present in the field. These extra clay minerals provide extra surface area for adsorption of heavy metals including toxic elements. Moreover, as these minerals are having high porosity, low permeability lowers the total availability of water in the aquifers. The weathering of rocks is both a mechanical and a chemical process. Rarely does the weathering process reach equilibrium as the systems are nearly always open, mixing is incomplete and changes in the variables are usually rapid, compared with the weathering rates. 5. Conclusion These special types of rock sequences in the area provides drastically purer quality of potable water sources in contrast to the potable water sources in all neighbouring states/countries like Manipur, Tripura, Bangladesh and Assam. Thereby, the availability of water in these regions becomes relatively difficult. Services of hand pumps are not possible in all the desired locations in view of the facts that aquifers are not commonly available. Supply of the enough potable water to all the locations of the expanding city has also constraints. Since the quality of all the sources of potable water, viz., hand pump, tuikhur and supply water (river water) are good enough to be used for domestic uses, the gap between demand and supply of water to the citizens can be optimized by the combination of these three sources. References Banerjee, S., Das, B., Umlong, I.M., Devi, R.R., Kalita, H., Saikia, L.B., Borah, K., Raul, P.K. and Singh, L. (2011), “Heavy Metal Contaminants of Underground Water in Indo Bangla Border Districts of Tripura, India”, Int. J. Chem. Tech. Res., Vol. 3(1), pp. 516–522. Bharati, V.K. (2011), Geochemical Characteristics of Potable water in and Around Kolasib Town, Ph.D. Thesis (Unpub.), Mizoram University, p. 158. ISI (1991), Indian Standard Specification for Drinking Water, ISI, New Delhi. Jinwal, A., Dixit, S. and Malik, S. (2009), “Some Trace Elements Investigation in Ground Water of Bhopal and Sehore District in Madhya Pradesh, India”, J. Appl. Sci. Environ, Manage., Vol. 13(4), pp. 47–50. Kumar, S., Bharati, V.K., Singh, K.B. and Singh, T.N. (2010), “Quality Assessment of Potable Water in the Town of Kolasib, Mizoram (India)”, Enivron Earth Sc., Vol. 61, pp. 115–121. Meenakshi, V.K., Garg, K., Renuka and Malik, A. (2004), “Groundwater Quality in Some Villages in Haryana, India: Focus on Fluoride and Fluorosis”, J. Hazardous Material, Vol. 106B, pp. 85–97. Smith, A.H., Lingas, E.O. and Rahman, M. (2000), “Contamination of Drinking Water by Arsenic in Bangladesh: A Public Health Emergency”, Bull. WHO, Vol. 78(9), pp. 1093–1103. Stumm, W. and Morgan, J.J. (1970), Aquatic Chemistry: An Introduction Emphasizing Chemical Equilibria in Natural Waters, Wiley, p. 583. WHO (2008), Guideline for Drinking Water Quality, 3rd Edn., WHO, Geneva.

296
41 Sustainable Utilization of Natural Resources for Poverty Reduction: A Case for the Indian Central Himalayan Region
Vishwambhar Prasad Sati Department of Geography and Resource Management,
School of Earth Sciences, Mizoram University, Aizawl, India
E-mail: [email protected]
1. Introduction The Indian Central Himalayan Region (ICHR) is the home for plenty of natural resources—land, water and forest. It is one of the 12th mega biodiversity hotspots in the world. Diversity in these natural resources is tremendously high in all altitudinal zones from the river valleys (< 500 m) to the highland alpine pastures (> 3000 m). Further, rich agro-biodiversity manifests a way to cultivation of all types of crops—cereals, pulses, oilseeds, vegetables and fruits. In terms of agricultural resource, it is the major source of livelihood and about 70% of the total populace is engaged in practicing agriculture (Sati, 2004). Mode of growing crops is traditional and about 80% agriculture is rain-fed as the terrain does not permit to commence modern agriculture. Except in the valleys, where irrigation facilities are enormous, the entire region is characterized by the dominance of subsistence crops. Over the time, due to high growth rate of population and comparatively low production and per ha yield, an acute situation of food scarcity arose. This led to the large-scale emigration. However, abundance of natural resources in the forms of water, forest and suitable geo-environmental conditions has potentials to reduce poverty and enhance livelihoods. Economically viable forests with high diversity and density are found in all altitudinal zones—the valleys, the mid-altitudes, and the highlands. Pine forests in the valley regions, oak in the mid and high altitudes, coniferous in the highlands and alpine meadows in the highly elevated region, below snow lines, present rich biodiversity (Sati, 2006). Besides, non-timber forest products (NTFPs) are vital and they have the potential to enhance livelihood and augment employment. Water is the most abundant resource moreover, it is largely unused. This paper examines the sustainable utilization of natural resources for livelihood enhancement and poverty reduction in the ICHR. Data were collected from the primary and secondary sources. A structured questionnaire was constructed for the collection of primary data; the stakeholders—marginal farmers, community people, extension workers and officials of the related departments were consulted and interviewed. Secondary data were gathered from the published and unpublished records of government departments such as the Census of India, District Statistical Diaries and forests manuals. Case study of 16 villages of the Kewer Gadhera Sub-watershed (KGSW) of the Pindar River Basin (PRB) was carried out and participatory approach through rapid field visit of these villages was adopted.
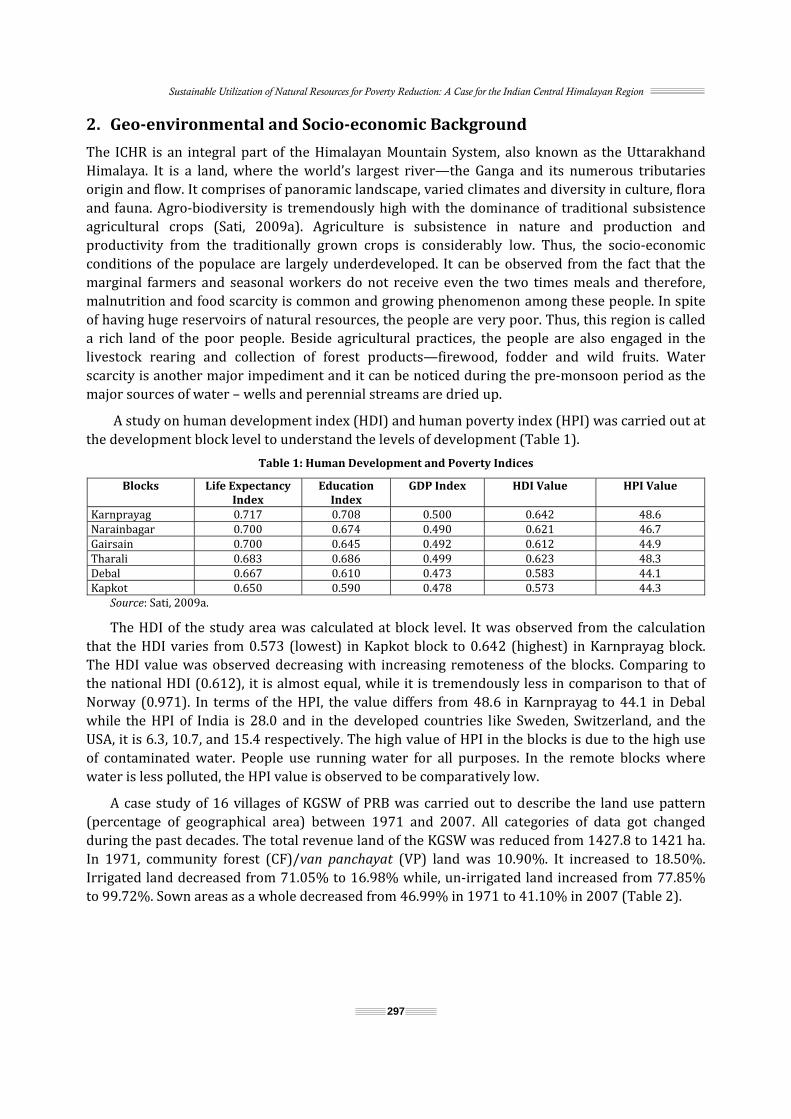
Sustainable Utilization of Natural Resources for Poverty Reduction: A Case for the Indian Central Himalayan Region
297
2. Geo-environmental and Socio-economic Background The ICHR is an integral part of the Himalayan Mountain System, also known as the Uttarakhand Himalaya. It is a land, where the world’s largest river—the Ganga and its numerous tributaries origin and flow. It comprises of panoramic landscape, varied climates and diversity in culture, flora and fauna. Agro-biodiversity is tremendously high with the dominance of traditional subsistence agricultural crops (Sati, 2009a). Agriculture is subsistence in nature and production and productivity from the traditionally grown crops is considerably low. Thus, the socio-economic conditions of the populace are largely underdeveloped. It can be observed from the fact that the marginal farmers and seasonal workers do not receive even the two times meals and therefore, malnutrition and food scarcity is common and growing phenomenon among these people. In spite of having huge reservoirs of natural resources, the people are very poor. Thus, this region is called a rich land of the poor people. Beside agricultural practices, the people are also engaged in the livestock rearing and collection of forest products—firewood, fodder and wild fruits. Water scarcity is another major impediment and it can be noticed during the pre-monsoon period as the major sources of water – wells and perennial streams are dried up. A study on human development index (HDI) and human poverty index (HPI) was carried out at the development block level to understand the levels of development (Table 1). Table 1: Human Development and Poverty Indices
Blocks Life Expectancy Index
Education Index
GDP Index HDI Value HPI ValueKarnprayag 0.717 0.708 0.500 0.642 48.6Narainbagar 0.700 0.674 0.490 0.621 46.7Gairsain 0.700 0.645 0.492 0.612 44.9Tharali 0.683 0.686 0.499 0.623 48.3Debal 0.667 0.610 0.473 0.583 44.1Kapkot 0.650 0.590 0.478 0.573 44.3Source: Sati, 2009a. The HDI of the study area was calculated at block level. It was observed from the calculation that the HDI varies from 0.573 (lowest) in Kapkot block to 0.642 (highest) in Karnprayag block. The HDI value was observed decreasing with increasing remoteness of the blocks. Comparing to the national HDI (0.612), it is almost equal, while it is tremendously less in comparison to that of Norway (0.971). In terms of the HPI, the value differs from 48.6 in Karnprayag to 44.1 in Debal while the HPI of India is 28.0 and in the developed countries like Sweden, Switzerland, and the USA, it is 6.3, 10.7, and 15.4 respectively. The high value of HPI in the blocks is due to the high use of contaminated water. People use running water for all purposes. In the remote blocks where water is less polluted, the HPI value is observed to be comparatively low. A case study of 16 villages of KGSW of PRB was carried out to describe the land use pattern (percentage of geographical area) between 1971 and 2007. All categories of data got changed during the past decades. The total revenue land of the KGSW was reduced from 1427.8 to 1421 ha. In 1971, community forest (CF)/van panchayat (VP) land was 10.90%. It increased to 18.50%. Irrigated land decreased from 71.05% to 16.98% while, un-irrigated land increased from 77.85% to 99.72%. Sown areas as a whole decreased from 46.99% in 1971 to 41.10% in 2007 (Table 2).

National Seminar on Management of Natural Resources for Sustainable Development: Challenges and Opportunities
298
Table 2: Land Use Pattern between 1971 and 2007 (Percentage of Geographical Area)
Village Name
Total Area (ha) CF1 Sown Area Others2
Irrigated Un-irrigated Total 1971 2007 1971 2007 1971 2007 1971 2007 1971 2007 1971 2007Ali 11.5 11.1 3.471 52.25 - 2.27 100 97.72 38.26 39.63 58.26 8.10Bedula 71.6 71 6.00 31.54 - 2.77 100 97.22 34.63 35.49 59.35 32.95Bhagoti 100 104.5 1.4 2.48 - - 100 100 40 62.00 58.6 35.509Bhawadi 47.5 45.4 2.52 - - - 100 100 38.73 40.30 58.73 59.69Bunga 112 129.4 10.71 53.01 - - 100 100 35.71 34.15 53.57 12.82Chirona 26.8 27 48.50 72.96 - - 100 100 18.65 18.88 32.83 8.14Gadseer 156 171.6 2.56 4.37 - - 100 100 41.02 38.05 56.41 57.57Jhijodi 204 162 19.60 6.60 - - 100 100 22.54 44.62 57.84 48.76Kaub 231.6 228.6 8.72 21.74 - - 100 100 40.15 41.95 51.12 36.30Keshpur 50 25.5 - - - - 100 100 48 28.23 52 100Kewer 32 31.1 3.75 - 4.39 - 95.60 100 56.87 57.55 39.37 42.44Kimoli 242 247.9 16.61 18.79 66.66 - 33.33 100 100 35.45 -8.34 45.74Leguna 14 19 14.28 36.84 - 11.94 100 88.40 57.14 36.31 28.57 26.84Naini 22.8 22.6 25.43 25.22 - - 100 100 40.35 37.16 34.21 37.61Ratni 37.6 37.8 - 4.49 - - 100 100 50 50.79 50 44.70Swan 56.4 58.3 7.092 16.80 - - 100 100 53.19 53.85 39.71 29.33Total 1427 1421 10.9 18.5 71.0 16.9 77.8 99.7 46.9 41.1 42.1 40.3
Source: Sati, 2009b. 1. CF, also called VP found around the villages. 2. Other category of land includes land under fruit plants, barren land, community grassland, and cultivable wasteland. The households in each village have categorized into four groups according to their work types and sources of income. The major source of income is from the remittances; therefore, the economy of the region has a nomenclature ‘money order economy’. The households, who are working in the agricultural fields, are very poor and they constitute large population. Table 3 shows the village-wise income from the various sources of livelihoods. Income from farming, business, government services, and daily wages were found to be the most important constituents of the household income. Among them, agriculture is the major source of household income as about 70% population is engaged in this practice. Table 3: Sources of Income from Different Activities
Villages Sources of IncomeAgriculture Daily
Wages Jobs Artisans Business Pension Animal
Husbandry* NTPF
Collection Ali 15.0 2.0 60.0 5.0 2.0 14.0 2.0 NilBedula 40.0 7.0 20.0 3.0 3.0 8.0 12.0 7.0Bhagoti 31.0 5.0 30.0 3.0 7.0 13.0 7.0 NilBhawadi 30.0 7.0 26.0 4.0 11.0 11.0 10.0 NilBunga 40.0 13.0 9.0 7.0 1.0 4.0 14.0 12.0Chirona 38.0 10.0 15.0 Nil Nil 7.0 15.0 9.0Gadseer 38.0 15.0 10.0 7.0 2.0 5.0 13.0 10.0Jhijodi 45.0 10.0 8.0 8.0 Nil 4.0 13.0 12.0Kaub 32.0 2.0 35.0 5.0 4.0 8.0 8.0 6.0Keshpur 23.0 8.0 50.0 Nil 2.0 15.0 3.0 NilKewer 28.0 6.0 27.0 5.0 13.0 12.0 9.0 NilKimoli 34.0 12.0 12.0 12.0 2.0 4.0 12.0 12.0Leguna 35.0 10.0 30.0 Nil 3.0 9.0 11.0 2.0Naini 25.0 7.0 32.0 6.0 4.0 7.0 10.0 9.0Ratni 24.0 9.0 35.0 6.0 6.0 11.0 9.0 NilSwan 35.0 15.0 15.0 13.0 2.0 2.0 9.0 9.0Source: Sati, 2009c. *Animal husbandry includes pack animals which are used to transport goods from the service centers to the upland villages
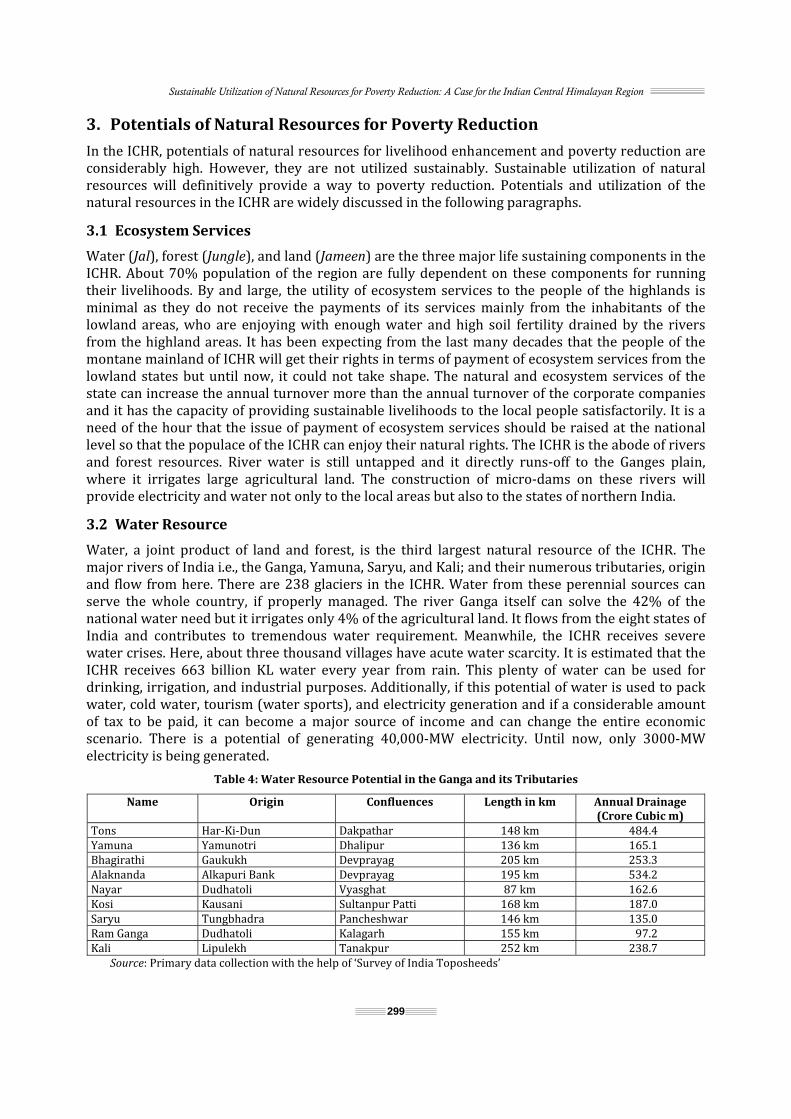
Sustainable Utilization of Natural Resources for Poverty Reduction: A Case for the Indian Central Himalayan Region
299
3. Potentials of Natural Resources for Poverty Reduction In the ICHR, potentials of natural resources for livelihood enhancement and poverty reduction are considerably high. However, they are not utilized sustainably. Sustainable utilization of natural resources will definitively provide a way to poverty reduction. Potentials and utilization of the natural resources in the ICHR are widely discussed in the following paragraphs. 3.1 Ecosystem Services Water (Jal), forest (Jungle), and land (Jameen) are the three major life sustaining components in the ICHR. About 70% population of the region are fully dependent on these components for running their livelihoods. By and large, the utility of ecosystem services to the people of the highlands is minimal as they do not receive the payments of its services mainly from the inhabitants of the lowland areas, who are enjoying with enough water and high soil fertility drained by the rivers from the highland areas. It has been expecting from the last many decades that the people of the montane mainland of ICHR will get their rights in terms of payment of ecosystem services from the lowland states but until now, it could not take shape. The natural and ecosystem services of the state can increase the annual turnover more than the annual turnover of the corporate companies and it has the capacity of providing sustainable livelihoods to the local people satisfactorily. It is a need of the hour that the issue of payment of ecosystem services should be raised at the national level so that the populace of the ICHR can enjoy their natural rights. The ICHR is the abode of rivers and forest resources. River water is still untapped and it directly runs-off to the Ganges plain, where it irrigates large agricultural land. The construction of micro-dams on these rivers will provide electricity and water not only to the local areas but also to the states of northern India. 3.2 Water Resource Water, a joint product of land and forest, is the third largest natural resource of the ICHR. The major rivers of India i.e., the Ganga, Yamuna, Saryu, and Kali; and their numerous tributaries, origin and flow from here. There are 238 glaciers in the ICHR. Water from these perennial sources can serve the whole country, if properly managed. The river Ganga itself can solve the 42% of the national water need but it irrigates only 4% of the agricultural land. It flows from the eight states of India and contributes to tremendous water requirement. Meanwhile, the ICHR receives severe water crises. Here, about three thousand villages have acute water scarcity. It is estimated that the ICHR receives 663 billion KL water every year from rain. This plenty of water can be used for drinking, irrigation, and industrial purposes. Additionally, if this potential of water is used to pack water, cold water, tourism (water sports), and electricity generation and if a considerable amount of tax to be paid, it can become a major source of income and can change the entire economic scenario. There is a potential of generating 40,000-MW electricity. Until now, only 3000-MW electricity is being generated.
Table 4: Water Resource Potential in the Ganga and its Tributaries
Name Origin Confluences Length in km Annual Drainage (Crore Cubic m) Tons Har-Ki-Dun Dakpathar 148 km 484.4Yamuna Yamunotri Dhalipur 136 km 165.1Bhagirathi Gaukukh Devprayag 205 km 253.3Alaknanda Alkapuri Bank Devprayag 195 km 534.2Nayar Dudhatoli Vyasghat 87 km 162.6Kosi Kausani Sultanpur Patti 168 km 187.0Saryu Tungbhadra Pancheshwar 146 km 135.0Ram Ganga Dudhatoli Kalagarh 155 km 97.2Kali Lipulekh Tanakpur 252 km 238.7
Source: Primary data collection with the help of ‘Survey of India Toposheeds’

National Seminar on Management of Natural Resources for Sustainable Development: Challenges and Opportunities
300
Fig. 1: The Alaknanda River Flowing in its Middle Catchment with Huge Water Potential (Left) and Land and Forest Resources in the Upper Catchment of the Alaknanda Basin. Photo by: The Author
3.3 Forest Resource The ICHR is endowed with plenty of forests and wildlife. Forest distribution ranges from the sub-tropical to the alpine pastures with high biodiversity. There are 2300 guldars, 240 tigers, 1350 elephants, 250 kasturi mrigs, 10800 sambhars, 10500 kakads, 5000 giddhas, 53000 cheetals and 400 bird’s species found in twelve national parks and wildlife sanctuaries. The Valley of Flowers, Asan Barrage, Nanda Devi, Gangotri, Raja Ji and Corbett National Parks are the main areas for generating income. The revenue from the forest was Rs. 9150 lakh during 2001–02 and in 2007–08, it was 20316 lakh. The attitude of the previous governments and colonial rulers towards forest conservation and utilization of its products was anti-people. Currently, the forest department is on the similar pathway. Local people have been raising the issues of their rights to utilize forest products and conserve them and agitating against the Forest Act (FA) for many years. The FA is the main hindrance to the construction of national highways, power lines, irrigation, and drinking water projects and even to the establishment of schools and colleges. Around 200 development projects are pending due to the FA. On the other hand, the local people are unable to utilize ecosystem services—timber, fodder, and other forest products. From forestation to prevention of fire, the forest department has been a failure in ensuring local people’s participation. The ICHR has the privilege of having Worlds’ top research institutes such as the Wild Life Institute, the Forest Research Institute, the Forest Survey of India, the Botanical Survey of India, the Zoological Survey of India, the Wadia Institute of Himalayan Geology, the Survey of India, the GBP Institute of Himalayan Environment, and Development, the Indian Institute of Petroleum and the Oil and Natural Gas Commission. But, these institutes could not assist to the livelihood enhancement of the local people, mostly because of lack of coordination among them. Forest fire is a major manmade disaster. In the month of May 2009, there were about 1400 incidences of forest fire. These incidences had greater intensity than the historical forest fire of 1921 and 1995. Forest fire spread across about 3000 ha land, killed eight people, and injured two dozen people. Due to the Wild Life Act (WLA), people killed by wild animals have also increased manifolds. About 200 people died and more than 500 people were injured in the last nine years. 3.4 Land Resource Land management is a crucial issue in the ICHR. Only 8% land is cultivable with high population pressure. The cultivable land is also used for many other activities. There were inter-relationships among land, forest, and the people during pre-Independence period. The local people were fully dependent on land, animal, and forest. Forest products were the major source of livelihood. At this point of time, agricultural land was around 20%. The first FA came into being with classification of forests in 1863. This led to inaccessibility of forest to the local people and put peasants into severe

Sustainable Utilization of Natural Resources for Poverty Reduction: A Case for the Indian Central Himalayan Region
301
trouble. In 1923, another FA came into force. Some amendments were made after rigorous opposition of the local people. Until Independence, the mounntain people squeezed out to rehabilitate in the productive areas of Doon, Dwar, Tarai, and Bhabar. This was further accelerated by the UP Jamidari Emancipation Act of 1966. Under this Act, community land was converted into forest land. As a result of this, agricultural land could not get any support for extension. The government announced for the increase of agricultural land upto 20% but it could not do so. Shrinking agriculture land and mounting population pressure put agricultural land unproductive. It resulted in a large-scale emigration of the populace to the other parts of India. 4. Conclusion: Problems and Prospects Poverty and malnutrition is a growing and an acute problem in the ICHR. About 60% population is still living below poverty line. Abundance of natural resources could not enhance livelihoods of the poor rural people as they are underutilized. The populace of the region is struggling for the two times meal. The vulnerability and fragility of landscape and high intensity and frequency of atmospheric hazards further accentuates the occurrence of natural catastrophe. Notwithstanding, the region has high potentials to cope with the food scarcity and malnutrition provided the use of natural resources are sustainable. Some outlines about how to use the potentials of natural resources are given here to frame policy measures for the sustainable livelihoods and poverty reduction. 4.1 Utilizing Agro-Biodiversity Potentials The ICHR is an agro-biodiversity hotspot. The traditional system of cultivating ‘Barahnaja’ (literally, '12 seeds') together in cropped land is a centuries-old practice: a cropping pattern involving 12 or more food crops grown in ‘synergetic’ combinations (Singh and Tulachan, 2002). This is practiced under a ‘Sar system’ of crop rotation that characterises the cropping pattern together with a vertical distribution of crops—in valley regions, mid-altitudes and highlands—and supports the maintenance of agro-biodiversity (Sati, 2009b). Three quarters of the people in the region depend on this system for their livelihoods. The traditional agricultural systems are the reservoirs of many crops and cultivars, most of which are still little known to mainstream societies and are better adapted than modern agricultural systems to environmental and social conditions (Altieri, 1995; Ramakrishnan and Saxena, 1996). Recently, changes in the cropping pattern have taken place as ‘Barahnaja’ has decreased, particularly in the mid-slopes and low-lying areas. These central Himalayan farmers grow about 100 varieties of paddy (rice), 170 varieties of kidney beans, eight varieties of wheat, four varieties of barley and about a dozen varieties of pulses and oil seeds each year (Zardhari, 2000). Singh and Raghuvanshi (2012) observed that cultivating traditional cereal crops are one of the potential approaches for improving household food security in the ICHR. Cereals, pulses, vegetable and oilseeds are grown in mixed in the same piece of land as a measure to ensure food security. In the Uttarakhand Himalaya, a total of 97 agricultural crops including 11 horticultural crops have been grown by farming communities since time memorial (Mehta, et al., 2010). The diversification of agriculture towards non-food-grain and high value commodities is inevitable, because these commodities have potential of income augmentation, employment generation, poverty alleviation and export promotion (Von Braun, 1995; Pingali & Rosegrant, 1995; Jha, 1996; Chand, 1996; Vyas, 1996; Delgado & Siamwalla, 1999; Ryan & Spencer, 2001 & Joshi et al., 2004b). 4.2 Utilizing the Potentials of Non-Timber Forest Products As discussed, forest and forest products play a vital role in running livelihood of the populace in the ICHR and almost all the rural population is directly involved in collection of forest products to run

National Seminar on Management of Natural Resources for Sustainable Development: Challenges and Opportunities
302
their livelihood. Still, there are many forest areas and forest products unexplored and unutilized, respectively. Sustainable use of timber and non-timber forest products will lead to poverty reduction. 4.3 Harnessing Hydropower and Eco-Tourism Potentials Availability of water, suitability of landscape, panoramic view of the mighty Himalaya in the forms of snow-clad mountain peaks, alpine meadows, dense forest covers in the highlands and mid-altitudes, and river valleys comprises of cascades, waterfall, gorges and ‘V’ shaped valleys, and presence of national parks, wildlife sanctuaries and bird sanctuaries manifest to sustainable harnessing of hydropower and development of eco-tourism, respectively. The pilgrimage tourism has been in practice here for the centuries (Sati, 2013). There are world famous pilgrimages located and they are the centres of worship and belief. Proper development of hydropower projects and eco-tourism will simultaneously reduce poverty and enhance livelihood. Himalaya mountain regulates the climatic conditions. Forest sequestrates carbon. Since the ICHR has abundance of forests, it can assist to reduce carbon from the atmosphere. The issues of Jal, Jungle and Jameen should be raised at the state and national levels and its services should be provided to the sustenance of the local people. FA and WLA should be amended. Rights should be given to the local people to run their livelihood from forest and its products. In all activity, participation of the local people should be ensured. Taxes should be imposed on water run-offs to the plain region. Eco-tourism and cultivating medicinal plants with involvement of the local people will enhance livelihoods. Unless agricultural practices attend an impressive base for the livelihood sustainability, emigration will continue. There is a vital need to reframe the policies and to rethink about the agricultural development. Either the per capita land should be increased or the optimum utilization of the arable land should be ensured using scientific innovations. References Altieri, M.A. (1995), “Agro-ecology Puts Synergy to Work to Create Selfsustaining Agroecosystem”, Ceres FAO Review, Vol. 154 to Vol 27, pp. 15–23. Chand, Ramesh (1996), “Diversification through High-value Crops in Western Himalayan Region: Evidence from Himachal Pradesh”, Indian Journal of Agricultural Economics, Vol. 41(4), pp. 652–663. Delgado, C.L. and Siamwalla, A. (1999), “Rural Economy and Farm Income Diversification in Developing Countries, in Food Security, Diversification and Resource Management: Refocusing the Role of Agriculture (eds.), pp. 126–143. Jha, D. (1996), “Rapporteur’s Report on Diversification of Agriculture and Food Security in the Context of New Economic Policy”, Indian Journal of Agricultural Economics, Vol. 51(4), pp. 829–832. Joshi, P.K., Gulati, A. Birthal, P.S. and Rao, P. Parthasarthy (2004), Agricultural Diversification and Vertical Integraion in
India: Will Smallholders Participate? MTID, International Food Policy Research Institute, Washington, DC. (Memio). Mehta, P.S., Negi, K.S. and Ojha, S.N. (2010), “Native Plant Genetic Resources and Traditional Foods of Uttarakhand Himalaya for Sustainable Food Security and Lielihood”, Indian Journal of Natural Products and Resources, Vol. 1(1), pp. 89–96. Pingali, P.L. and Rosegrant, M.W. (1995 a&b), “Agricultural Commercialization and Diversification: Processes and Policies”, Food Policy, Vol. (3), pp. 171–186. Ramakrishnan, P.S. and Saxena, K.G. (1996), “Managing Biodiversity for Sustainable Development in the Himalaya”, In Ramakrishnan, P.S., Purohit, A.N., Saxena, K.G., Rao, K.S. and Maikhuri, R.K. ed. (1996), Conservation and Management of Biological Resources in Himalaya, IBH, Oxford, pp. 5–26. Ryan, J.G. and Spencer, D.C. (2001), Future Challenges and Opportunities for Agricultural R&D in the Semi-Arid Tropics, Patancheru, 502-324, Andhra Pradesh, India: International Crops Research Institute for the Semi-Arid Tropics. Sati, V.P. (2004), “Systems of Agricultural Farming in the Uttaranchal Himalaya, India”, Journal of Mountain Science, Vol. 2, No. 1, pp.76–85, www.imde.ac.cn/journal Sati, V.P. (2006), “Forest Resource Management in Mountain Regions: A Case for the Pindar Basin of Uttaranchal Himalaya”, Lyonia: A Journal of Ecology and Application, Vol. 11(1), pp. 75–84. www.lyonia.org Sati, V.P. (2009 a&b), “Conservation of Agro-Biodiversity through Traditionally Cultivating ‘Barahnaja’ in the Garhwal Himalaya”, MF Bulletin, Vol. IX, Issue 2, July 2009. www.mtnforum.org

Sustainable Utilization of Natural Resources for Poverty Reduction: A Case for the Indian Central Himalayan Region
303
Sati, V.P. (2009 a, b, c & d), The Alaknanda Basin (Uttarakhand Himalaya): A Study on Enhancing and Diversifying Livelihood Options in an Ecologically Fragile Mountain Terrain, Mountain Forum Online Library. http://www.mtnforum.org/rs/ol/browse.cfm?tp=vd&docid=4537 Sati, V.P. (2013), “Tourism Practices and Approaches for its Development in the Uttarakhand Himalaya, India”, Journal of Tourism Challenges and Trends, Vol. 6 (1), pp. 97–112. Singh, Pragya and Raghuvanshi, R.S. (2012), “Finger Millet for Food and Nutritional Security”, African Journal of Food Science, Vol. 6(4), pp. 77–84. Singh, V. and Tulachan, P.M. (2002), “Marginal Farming in Mountain Areas”, Asian Agri-History, Vol. 6, No. 3, pp. 269–280. Von Braun, Joachim (1995), “Agricultural Commercialisation: Impacts on Income and Nutrition and Implications for Policy", Food Policy, Vol. 20(3), pp. 187–20 Vyas, V.S. (1996), “Diversification in Agriculture: Concept, Rationale and Approaches”, Indian Journal of Agricultural Economics, Vol. 51(4). Zardhari, V. (2000), “Barahnaja-twelve Food Grains: Traditional Mixed Farming System”, Leisa India, Vol. 2, No. 3, p. 25.

304
42 Information System Approach for Integrated Natural Resource Management, Learning and Practices in Nauguda Gad, Uttarakhand
S.K. Bandooni1, Vijendra Kumar Pandey2 and Kaushal Kumar Sharma3 1 Dept. of Geography, SBS (E) College, University of Delhi, Delhi 2Centre for the Study of Regional Development, JNU, New Delhi
3Dept. of Geography, KM College, University of Delhi, Delhi
1. Introduction Natural resources management and its sustainability has been a thrust area among the research community since the 1950s. However, the actual expression in scope, complexity and effectiveness of themes is a research agenda and the research strategies on natural resources management, has evolved in watershed approach, vision, mission and goals as integrated method. Natural resources such as forest, agroforestry, soil and water management are the main elements of the eco-regional concept to strengthen natural resources management and partnerships of stakeholders across the system. The strategic planning had to pay attention to elaborating the nature of the future challenge of sustainability natural resource, agriculture production, food security with its use and management of natural resources. It requires the strategic and applied research effort to address the challenge. However, there has been a growing consensus that an effective way to control natural resource degradation and the long-term sustainability of agriculture and rural communities can be achieved through integrated planning and management (Zhao, 2004). Watershed management options provide a framework for integrating knowledge and perspectives of social and natural sciences into planning, policy and decision-making. Among these options, land use planning plays an important role, since it not only influences environmental processes but also the livelihood pattern. Land use planning and management at the watershed level is a multi-objective resource management issue because it deals with human activities within the watershed that are motivated by multiple and often conflicting objectives and constraints, such as farm economic development, soil and water resource conservation, forest conservation and drinking water supply (Prato et al., 1995; Fulcher et al., 1996). It is often considered that a broad public participation is essential for sustainable watershed management, which is recognized in a wide range of policy statements, academic papers, and activist programmes world-wide (Perkins P.E.; 2011). Land use planning is an important element of the integrated watershed management approach. It not only influences the environmental processes such as soil erosion, sediment and nutrient concentrations in streams, quality of surface and ground water in a watershed, but also affects social and economic development in that region (Honghai, and Altinakar; 2011). In this regard, information system approach has been used as a comprehensive tool to analyze natural resources as well as implementation of policy framework. Remote sensing techniques provide standardized methods for quantitative analysis of landscape at various scales and thus can be used in order to characterize and optimize the selection of water-harvesting sites and to

Information System Approach for Integrated Natural Resource Management, Learning and Practices in Nauguda Gad, Uttarakhand
305
improve watershed management (Gosain and Sandhya, 2004). The integration of remote sensing data and GIS for hydrological characterization and modelling is particularly important for improving the spatial and temporal resolution of satellite images (Gangodagamage and Clarke, 2001; Mbilinyi et al., 2007), which allows for better understanding and representation of the hydrological processes in the landscape (Korkalainen et al., 2007). Identification of potential sites for water harvesting is a prerequisite for improving watershed management. The main objective of this work is to identify and optimize the potential water-harvesting sites in Naugada gad watershed based on the characterization of surface landscape conditions using DEM and remote sensing techniques. There has been growing emphasis on the need to conserve and sustainable management of our natural resources. The concept of natural resources management (NRM) recognizes the need for a more conscious effort towards judicious and sustainable management of natural resources (Kumar, et al. 2008). It also recognizes that natural resources are inter-related to one another within a defined ecological system, and therefore, needs to be managed in an integrated environment (Pandey, et al.; 2006). This has given rise to the concept of Integrated Natural Resources Management (INRM), which needs to take a holistic approach in utilization of natural resources, and to be conscious of the interactions among the different components of the resource base. In a given ecosystem, stocks of natural resources (sometimes referred to as natural capital) exist and yield useful flows of services and amenities at different spatial and temporal scales. Consequently, the management of natural capital has impacts on a range of stakeholders, from farmers to communities, to international concerns (Srivastava, et al., 2008). Examples of flows of services and amenities (i.e., ecological functions useful to mankind) associated with stocks of natural capital include nutrient cycling, water cycling and carbon sequestration (Pandey, et al.; 2006). All of these are elements that need to be addressed in the context of INRM. The key elements of INRM and the complexity of interactions within it are biodiversity, soil and water, with people at the centre. Within the component of biodiversity are plants, animals and micro-organisms (e.g. soil microbes). The soil biodiversity component also needs to be analyzed in relation to soil structure, fertility, and other factors (Yang, et al.; 2009). A central dimension in INRM is the way in which the natural resources interact within and among themselves, and how their management and interaction relates to the people and livelihood in the watershed (Lohani, et al.; 2002). Redundancy of the agriculture in hilly environment faces huge challenges. Moreover, per capita food consumption needs to increase adequately to feed the people living in the watershed. In this regard, green revolution has been widely credited with agricultural development in the plain region of the country. The research component of the green revolution was largely based on the genetic improvement of a few crops to enhance their productivity and improve their resistance to pests and diseases. This has largely gains confined to areas of high agricultural potential, and they often benefitted the more prosperous farmers. In many cases, this research yielded large production gains at the expense of soil degradation, water, biodiversity, and non-cultivated land (Sayer and Campbell, 2001). A second green revolution is now needed, particularly for development of high yielding variety (HYV) seeds suitable to fragile environment. However, the situation today is dramatically different from when the first green revolution began and different research and development approaches are required. In contrast to the old, top-bottom approach or ways of working, in which international agricultural research centers (IARCs) see themselves as the main sources of agricultural innovations that are transferred to national agricultural research and extension systems (NARES) and downward to farmers, are no longer valid (Biggs, 1990; Clark, 1995). There is now a much more sophisticated understanding of how rural development occurs, which recognizes that innovation has multiple sources and results from the action of a broad network.
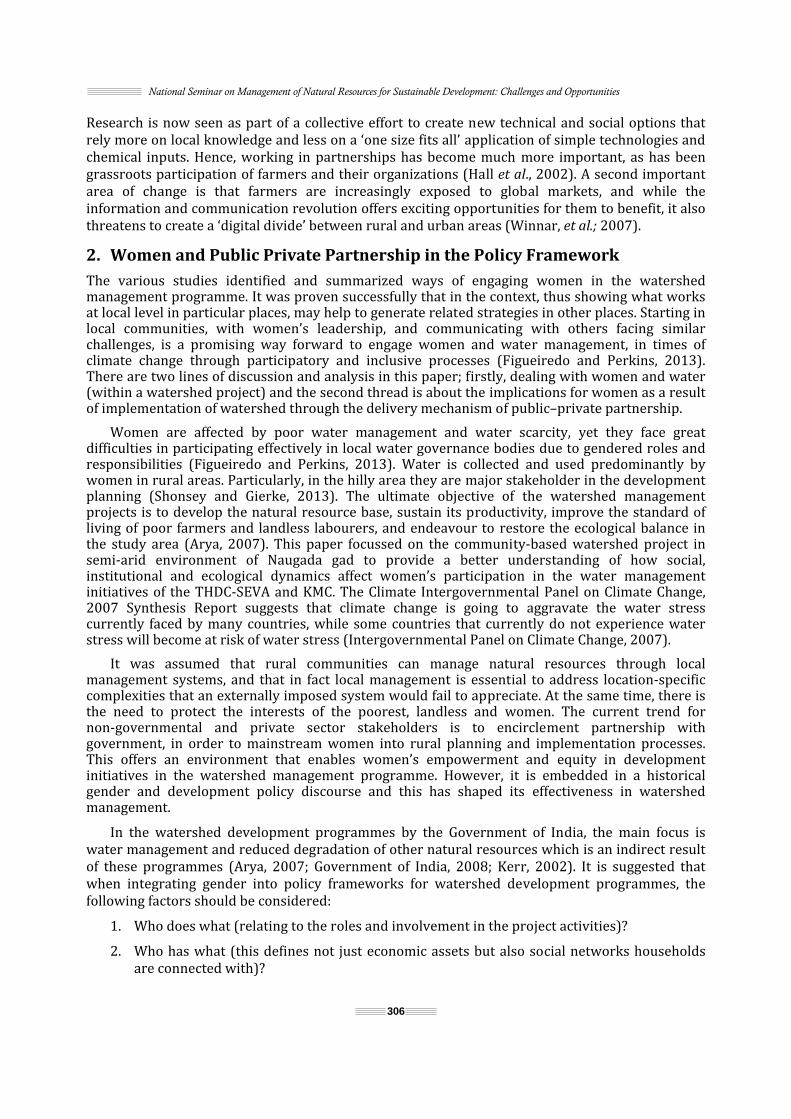
National Seminar on Management of Natural Resources for Sustainable Development: Challenges and Opportunities
306
Research is now seen as part of a collective effort to create new technical and social options that rely more on local knowledge and less on a ‘one size fits all’ application of simple technologies and chemical inputs. Hence, working in partnerships has become much more important, as has been grassroots participation of farmers and their organizations (Hall et al., 2002). A second important area of change is that farmers are increasingly exposed to global markets, and while the information and communication revolution offers exciting opportunities for them to benefit, it also threatens to create a ‘digital divide’ between rural and urban areas (Winnar, et al.; 2007). 2. Women and Public Private Partnership in the Policy Framework The various studies identified and summarized ways of engaging women in the watershed management programme. It was proven successfully that in the context, thus showing what works at local level in particular places, may help to generate related strategies in other places. Starting in local communities, with women’s leadership, and communicating with others facing similar challenges, is a promising way forward to engage women and water management, in times of climate change through participatory and inclusive processes (Figueiredo and Perkins, 2013). There are two lines of discussion and analysis in this paper; firstly, dealing with women and water (within a watershed project) and the second thread is about the implications for women as a result of implementation of watershed through the delivery mechanism of public–private partnership. Women are affected by poor water management and water scarcity, yet they face great difficulties in participating effectively in local water governance bodies due to gendered roles and responsibilities (Figueiredo and Perkins, 2013). Water is collected and used predominantly by women in rural areas. Particularly, in the hilly area they are major stakeholder in the development planning (Shonsey and Gierke, 2013). The ultimate objective of the watershed management projects is to develop the natural resource base, sustain its productivity, improve the standard of living of poor farmers and landless labourers, and endeavour to restore the ecological balance in the study area (Arya, 2007). This paper focussed on the community-based watershed project in semi-arid environment of Naugada gad to provide a better understanding of how social, institutional and ecological dynamics affect women’s participation in the water management initiatives of the THDC-SEVA and KMC. The Climate Intergovernmental Panel on Climate Change, 2007 Synthesis Report suggests that climate change is going to aggravate the water stress currently faced by many countries, while some countries that currently do not experience water stress will become at risk of water stress (Intergovernmental Panel on Climate Change, 2007). It was assumed that rural communities can manage natural resources through local management systems, and that in fact local management is essential to address location-specific complexities that an externally imposed system would fail to appreciate. At the same time, there is the need to protect the interests of the poorest, landless and women. The current trend for non-governmental and private sector stakeholders is to encirclement partnership with government, in order to mainstream women into rural planning and implementation processes. This offers an environment that enables women’s empowerment and equity in development initiatives in the watershed management programme. However, it is embedded in a historical gender and development policy discourse and this has shaped its effectiveness in watershed management. In the watershed development programmes by the Government of India, the main focus is water management and reduced degradation of other natural resources which is an indirect result of these programmes (Arya, 2007; Government of India, 2008; Kerr, 2002). It is suggested that when integrating gender into policy frameworks for watershed development programmes, the following factors should be considered: 1. Who does what (relating to the roles and involvement in the project activities)? 2. Who has what (this defines not just economic assets but also social networks households are connected with)?

Information System Approach for Integrated Natural Resource Management, Learning and Practices in Nauguda Gad, Uttarakhand
307
3. What influences arrangements related to resource access and control (what are the livelihoods related practices and factors that define hierarchies and dynamics in the project area)? There is a major debate in gender and governance that has shaped the conceptual understanding of water resource management. In particular, the focus has been on how these debates frame empowerment through project implementation, by defining the factors that hinder or encourage women’s participation. 3. The Study Area The Nauguda gad watershed is located in the Pratapnagar tehsil of district Tehri Garhwal in Uttarakhand state. Geographically, it is situated between 30°32′36″ N to 30°37′52″ N latitude and 78°25′58″ E to 78°31′15″ E longitude. The geographical area of Nauguda gad watershed is 45.445 km2. Nauguda gad is a tributary of Jalkur gad which makes confluence with Tehri reservoir.
Fig. 1 The watershed is a part of Tehri Reservoir affected area; so rehabitation and development process is initiated by Tehri Hydro-Dam Corporation (THDC-SEVA) under Corporate Social Responsibility (CSR) Programme with Department of Geography, Kirori Mal College (KMC), University of Delhi. The project was implemented by KMC with IT & technological solutions for the development of the region. KMC has conducted a complete baseline survey of the area to understand the socio-economic condition of the area and to find out problems and prospects. 4. Objective of the Study The present study has focus to understand the regional process of development with watershed management approach in the fragile environment. The major objective was to create awareness among the community to judicious use of the natural resources. Some broad objectives are: a. To assess the natural resource base of the area and prepare a potential resource base of the Naugada gad watershed. b. To evaluate the indigenous knowledge of techniques in the agriculture and livelihood management, and c. Assessment of the technological and institutional input provided by the THDC-SEVA and KMC, imitative for the integrated sustainable development of the area.

National Seminar on Management of Natural Resources for Sustainable Development: Challenges and Opportunities
308
5. Methodology A multi-disciplinary methodological approach was used, with quantitative and qualitative analysis of data from focused group discussion (FGD), semi-structured interviews (SSI) with men and women participants and non-participants, and key stakeholders in the public and private institutions. The quantitative approach of data collection was used for household mapping of the sample group, while qualitative approaches were used to understand data collected through Focused Group Discussions (FGDs) and SSI for the dynamics of rural development policy implementation. To capture potentially different social dynamics, five villages across the watershed project were selected to represent: 1. The upper, middle and lower reaches of the watershed project, 2. Small, medium and large villages, and 3. A spread of backward castes, scheduled castes. The classification of village size and caste was completed in consultation with the project implementing agency KMC. Detailed profiling of these villages was completed using socio-economic, religious and caste demographic information from village administration and baseline surveys conducted prior to watershed implementation. For setup and calibration of the SWAT model, spatial and hydrometeorological data of the Naugada gad were required. Spatial data used for model setup included the digital elevation model (DEM) from the Shuttle Radar Topography Mission (SRTM) data, a drainage network constructed from a spatial layer obtained from the topographic maps. These spatial inputs were spatially corrected and aligned to each other based on the Ladsat-7 satellite image, which was also used to identify cultivated areas. Rainfall data such as daily minimum/ maximum temperatures, as well as river and spring flow data were obtained to understand the climatic regime of the area. A complete GIS solution is prepared such as Physiography, Aspect, Slope, Drainage, Soil, Geomorphology and land use/ land cover data of the watershed. These data were integrated with socio-economic and demographic data for development planning implemented in the area. 6. Physiographic Analysis Physiographic analysis of the watershed has been done using ArcGIS software from topographic map; contour and spot height. Digital elevation model is prepared and area under different elevation range has been categorized to understand the physiographic constraints of the watershed into the development process. It was found that around 52% area lies in the medium elevation range and its height varies between 1450 m –2050 m, 30% area covered by medium high and 12% area under high elevation categories that is 2350m. Hence, very little area falls under low elevation category, less than 5% area which is below 1450 m above mean sea level. This shows that most of the area has high elevation variation that makes the area difficult for agriculture activities.
Table 1: Area under the Different Elevation Range in the Nauguda Gad Watershed
S. No. Elevation Range (m) Category Area (sq. km.) % Area1 < 1450 Low Elevation 1.88 4.132 1450–1750 Medium 8.17 17.973 1750–2050 15.7 34.534 2050–2350 Medium High 13.97 30.725 2350–2650 High 5.24 11.526 > 2650 Very High 0.51 1.12Total 45.47 100.00Slope inclination is one of the crucial physical attributes which influences development practices. Wentworth method is used to calculate the slope in the Nauguda watershed. It was measured that less than 3% area comes under slope inclination < 5°, mostly the watershed is

Informatcovered bfollowed inclined s
AspecParticularvegetatioby north-13%, wes
Fig
tion System Approby moderatby moderatslope inclina
ct is sun facrly, in the hon. Approxim-east and sost facing 11%
g. 3: Physiogra
oach for Integratedtely inclinedte high inclation area co
Fig. 2: Slcing slope dhilly areas, imately arounouth-east b% and other
aphic Map of N
d Natural Resourced slope cateined slope overed by 2
lope Distributdirection; itit plays a vend 28% areoth coveredr slope direc
Nauguda Gad
e Management, Le
309
egory 15°–2categories w%.
tion in the Nat is the meaery crucial ra is coveredd around 18ction covere
earning and Practi25° which cwhich is app
uguda Gad Wasure of sunrole for cultd by east fac8% area. Soed less than
Fig. 4: As
ices in Nauguda Gcovers arouproximately
Watershed nshine hourtivation pracing slope, suouth-facing 1% area.
spect Map of N
Gad, Uttarakhandund 42% of y 37%, and
rs, receivedactices and ubsequentlyarea covere
Nauguda Gad
d f the area, very high
in a day. growth of y followed ed around

7. LandLand usedated 1stEarth Satused in oarea. Thclassificat
National Semina
Fig. 5: Slope
d Use/ Lane map of thet June, 2010tellite imagrder to get te analysis tion method
ar on Managemen
e Map of Naug
nd Cover e area is pr, obtained frery. Pixel bthe accuratewas perfod.
Fig. 7: Lan
nt of Natural Resou
guda Gad
repared usinrom http//gby pixel come land use mormed usin
d Use/ Land C
urces for Sustainab
310
Fig
ng Landsat glovis.usgs.gmparison anmap of the arng Erdas Im
Coverdistribu
ble Development:
g. 6: Land Use
ETM+ satelgov. Furthernd principalrea particulamagine 9.2
ution of the Na
Challenges and Op
/ Land Cover
llite imagerr, it is also cll componenarly for the a2 software
auguda Gad
pportunities
Map of Naugu
y Path 146 lassified usint analysis magriculture athrough s
uda Gad
Row 039 ng Google method is and forest upervised

Information System Approach for Integrated Natural Resource Management, Learning and Practices in Nauguda Gad, Uttarakhand
311
Nauguda gad watershed is mostly covered by forest area. Forest area covers around the 30% of the total geographical area, sparse forest cover 21% and agriculture land covers around 20%, wasteland 18%, grassland 8% and settlement covers less than 1% of the total area of the watershed. Forest, mainly covers the upper part of the watershed, which is high elevation range and slanting surface, east and south east facing slope. There are also some degraded lands due to unavailability of moisture. Agriculture land particularly confined to the valley and spur, and also to some extent to moderate to high inclined slope as terrace farming in the watershed. 8. Socio-Economic Analysis The study area was spread over 27 villages of Nauguda gad watershed and two micro watersheds. Population of the area is 12907 persons out of which 6753 are male and 6753 females. The average sex ratio of the watershed is 911 females per 1000 males. Schedule caste population constitutes 12.38% of the total population of the area. In terms of the literacy, the area is very backward. The average literacy rate of the area is 42% in which male literacy is approximately 69.39% and female literacy in comparison male is to very poor 22.73%.
Table 2: Demographic Profile of Villages in the Nauguda Gad
Sr. No. Village Area (km2)
No Household
Total Population
Total Male
Total Female
Population Under Age 6
Male <6
Female <6
Population SC
Population ST 1 Saundi 133 106 730 329 401 148 72 76 106 0 2 Silora 67 40 234 109 125 49 25 24 8 0 3 Deen Gaon 215 172 1126 545 581 249 130 119 169 0 4 Ghadiyal Gaon 78 89 569 282 287 83 43 40 91 0 5 Mukhem 152 188 1146 543 603 197 107 90 42 0 6 Herwal Gaon 100 82 454 228 226 66 32 34 8 0 7 Mukhmal Gaon 76 160 894 457 437 167 87 80 68 0 8 Ghorpur 34 27 166 74 92 33 13 20 0 0 9 Pokhari 67 90 542 268 274 98 46 52 307 0 10 Khurmola 95 49 352 159 193 71 32 39 24 0 11 Sadargaon 138 56 325 170 155 44 24 20 0 0 12 Dangi 19 34 210 93 117 36 14 22 0 0 13 Uniyal Gaon 97 98 544 269 275 90 43 47 106 0 14 Garhwan Gaon 118 81 439 209 230 85 39 46 89 0 15 Khamakhal 65 58 286 120 166 64 32 32 0 0 16 Kudiyal Gaon 41 39 266 135 131 66 41 25 7 0 17 Mastari 27 25 168 82 86 38 20 18 0 0 18 Raika 88 125 787 372 415 153 69 84 111 0 19 Mahar Gaon 51 63 355 167 188 70 34 36 6 0 20 Sirwani 33 30 145 58 87 32 17 15 1 0 21 Moliya 92 69 352 160 192 48 21 27 211 0 22 Baldogi 61 60 302 143 159 58 33 25 78 0 23 Panar Gaon 87 33 232 122 110 34 18 16 5 0 24 Budkot 60 38 232 110 122 45 27 18 46 0 25 Kandiyal Gaon 141 314 1744 799 945 304 151 153 105 0 26 Cheniyali Sera 15 25 142 65 77 30 18 12 4 0 27 Dhangar Gaon 45 30 165 86 79 22 11 11 6 0 Total 2196 2181 12907 6154 6753 2380 1199 1181 1598 0

National Seminar on Management of Natural Resources for Sustainable Development: Challenges and Opportunities
312
Table 3: Literacy Status and Fragmentation of Work Participation Ratios of Villages in the Nauguda Gad
Sr. No. Village Sex Ratio
% of Literate
Population
% of Male Literate
% of Female Literate
Total Working
Population
% of Total Working
Population
% of Total Working
Male
% of Total Working Female
Marginal Working
Population
Marginal Working
Male
Marginal Working Female 1 Saundi 820 46 70.52 26 312 43 39.82 45.14 217 81 136 2 Silora 872 37 69.72 8.80 77 33 50.46 17.60 28 7 21 3 Deen Gaon 938 28 51.56 5.85 585 52 50.46 53.36 257 121 136 4 Ghadiyal Gaon 983 42 65.96 17.77 196 34 38.65 30.31 78 4 74 5 Mukhem 900 49 74.03 25.70 389 34 36.65 31.51 16 5 11 6 Herwal Gaon 1009 45 78.95 11.50 216 48 43.42 51.77 82 3 79 7 Mukhmal Gaon 1046 43 68.49 16.48 205 23 44.42 0.46 0 0 0 8 Ghorpur 804 34 70.27 5.43 45 27 50.00 8.70 13 5 8 9 Pokhari 978 42 69.78 14.60 287 53 51.12 54.74 136 14 122 10 Khurmola 824 41 65.41 21.24 112 32 46.54 19.69 41 10 31 11 Sadargaon 1097 61 82.94 36.13 133 41 28.24 54.84 56 5 51 12 Dangi 795 40 59.14 23.93 42 20 44.09 0.85 0 0 0 13 Uniyal Gaon 978 47 73.98 20.00 291 53 49.07 57.82 233 74 159 14 Garhwan Gaon 909 37 54.55 20.43 106 24 43.06 6.96 0 0 0 15 Khamakhal 723 52 71.67 37.95 120 42 33.33 48.19 22 5 17 16 Kudiyal Gaon 1031 46 67.41 23.66 135 51 46.67 54.96 76 10 66 17 Mastari 953 50 69.51 31.40 84 50 47.56 52.33 44 5 39 18 Raika 896 48 71.77 26.02 403 51 48.12 53.98 139 24 115 19 Mahar Gaon 888 41 70.66 13.83 180 51 40.12 60.11 165 53 112 20 Sirwani 667 50 68.97 36.78 67 46 36.21 52.87 22 4 18 21 Moliya 833 44 65.00 26.04 75 21 38.13 7.29 17 14 3 22 Baldogi 899 43 65.03 23.90 119 39 35.66 42.77 3 0 3 23 Panar Gaon 1109 65 82.79 45.45 102 44 40.98 47.27 49 6 43 24 Budkot 902 43 60.91 27.05 69 30 32.73 27.05 3 1 2 25 Kandiyal Gaon 846 51 76.22 30.58 826 47 39.67 53.86 307 37 270 26 Cheniyali Sera 844 59 69.23 50.65 51 36 24.62 45.45 45 13 32 27 Dhangar Gaon 1089 57 81.40 30.38 78 47 43.02 51.90 46 5 41 Total 911 42 69.39 22.73 5305 41 42.36 39.95 2095 506 1589 The ratio of working population gives more clear pictures to the socio-economic status of the watershed. Main working population in the watershed is 41% of the total populations, out of which male working population is 42%, and female constitutes 40% of the total workforce. But, the ratio of the marginal workers clearly shows that female are partly involved in the primary sector activities. The total population of marginal workers is 2095 person out of which 1589 are females, which is around 2/3rd of the total marginal workers. It shows that female are mostly involved in the household activates, cultivation and animal husbandry which generates lesser income.
9. Agriculture and Allied Activities Agriculture is the main source of livelihood of people living in the watershed. Around 65% households are dependent on the agriculture and allied activities in the area. This includes cultivation, animal husbandry, goatry, sheep rearing, agro-forestry etc. The major crop of the area is paddy during the Kharif season. Other crops such as corn, jowar and vegetables are cultivated for local use. During the Rabi season wheat, mustard, pea, gram, potato and vegetables are grown.

Information System Approach for Integrated Natural Resource Management, Learning and Practices in Nauguda Gad, Uttarakhand
313
Fig. 8: Panoramic View of Nauguda Gad Watershed. The Picture Shows the Wheat Crops in the Field Cultivated in the Valley and Spurs. It also Shows Sparse Forest, Degraded Land and Dense Forest in the Background
10. Natural Resource Potential and Development Initiatives In the present study using the spatial analysis technique, inventories of natural resource is prepared in GIS environment. On the basis of the various parameters, natural resource region is prepared for the sustainable development of the watershed using modern technologies with synergy to indigenous knowledge and practices for overall development of the Nauguda gad watershed. Both scientific and local knowledge has been combined to the optimum use of available resource, either it is cultivation or livelihood activities, animal husbandry or micro-enterprises in the area. Mass awareness and community participation in the development planning processes has been generated in the area to involve the local communities to prioritise the means of development. Multiple rounds of village meetings, focused groups discussion, SWAT analysis and need based planning methodologies were adopted to prepare sectoral plans for the rural communities. It was ensured that each villagers should benefit by the schemes through active participation. Hence, it was decided by panel of experts and villagers that sectoral approach should be followed to implement the development practices. Agriculture, animal husbandry, horticulture, handicrafts, micro-enterprises sectors are identified as the major area for the development. Mainly, five major sectors were identified in the area. These are: a. Water resource management. b. Land and forest management. c. Agriculture and allied activities. d. Livelihood management, and e. Skill development and micro-enterprises.
National Seminar on Management of Natural Resources for Sustainable Development: Challenges and Opportunities
314
Nauguda gad is a perennial river as it is fed by snowfall received on the upper reaches, rainfall and springs. The area faces water scarcity during the summer months, There was also problem to the drinking water in the village situated on the upper side of slopes. However, hydrological analysis was carried out and small check dams, water harvesting structures were suggested for the water conservation in the area. It has become very viable for both drinking water and irrigation. Involving the different stakeholders, a mass awareness was created in the area for the water conservation. The upper reaches of the watershed is covered by dense forest. But middle and lower part of the watershed has barren slopes or degraded forest cover due to encroachment on forest land and by cattle herding. In those areas, a community plantation scheme is promoted and its user right is also given to the Village Panchayat. This scheme has also given a good result. Plants and seeds of different species are distributed to increase the green cover of the watershed. The objective of the scheme is to check the soil erosion by the individual and community plantation of trees and development of pastures on the barren land. It will help to control land degradation and provides fodder for animal husbandry.
As it was discussed above that during the preparatory phase, workshops and trainings were organized for the farmers to make them aware about the modern farming practices, high yielding verities seed, use of fertilizers, pesticide and insecticides and their linkages to the market. HYV seeds of paddy, mustard, pea, tomato, brinjal, chilly, cabbage etc. being distributed by the resource centres among the farmers. They have also given demonstration for cultivation and use of fertilizer to maximize their farm produce. The approach has given very good result. During the second year of project implementation, more number of farmers associated to the resource centre (Deengoan). Nauguda gad watershed has a lot of potential to off-season vegetables, medicinal and aromatic plants. So, it was promoted among the farmers to increase their revenue as these produce are sold on the high price. So it has given very impressive results in the area.

Information System Approach for Integrated Natural Resource Management, Learning and Practices in Nauguda Gad, Uttarakhand
315
Villagers are also encouraged to form self-help groups (SHG) to provide each other support for the livelihood management such as dairy, goat rearing, sheep rearing, bee keeping, small handicrafts work etc. Seed money was given from the centre to each SHG as loan to develop the livelihood activities in the villages. It was also seen that the watershed was deprived of the progress in the IT and communication sector in the country, due its remote location. The villagers are unaware about the IT revolution. So, it was decided to develop an IT Centre at Deengaon village in the area and Sub-center at Budkot village. This Centre was mainly focussed to provide free computer education to school-going children in the class of primary and middle schools. It was a huge success. This has also benefitted the community as the children discuss the use and application of computers in our life. Stitching and weaving training is also provided to the women to make them to learn a source of livelihood. In the micro-enterprise development of gharat as floor mill is re-initiated. This is also helpful to protect environment and generate electricity. Small flour mill, spices grinder, carpenter, missionary work training is given to the SHG to make them self-reliant. 11. Conclusion It is the need of time to integrate remote sensing and GIS techniques for optimum use of natural resources and prioritization of INRM approach. There are many good reasons to develop even-better participatory processes. These processes must be locally appropriate and specific in their details; they must involve all stakeholders of the community concerned with the outcome or decision; they must consider long-term political and ecological implications; they must grapple with the difficult issues of scale, jurisdictions, time-frame and scientific uncertainty. The paper has highlighted the importance of women participation in the development planning and implementation of a watershed level. So, it has major focus on the involvement of stakeholders and their potential impact as a radical tool for education, empowerment and voice for previously-marginalized people. It is very much possible for public participation processes to serve as a conservation of natural resources and development of society in the fragile environment. The more inclusive is the welcoming and effective expression of new voices within public participation processes, the more radical is this potential. This is not because popularly-driven decisions and outcomes must be, or always are radical, but rather, because truly including a broad spectrum of public viewpoints in political and environmental decision-making it inherently and fundamentally radical. As academics, activists, and people are concerned about improving public policy, we must continually seek out the best, fairest, most effective and widest-ranging ways in which this can be done using watershed approach. Acknowledgement The authors would like to thank THDC-SEVA for financial support and KMC technological inputs and administrative support to implement the project work. The authors would also like to thank various stakeholders involved in the project and critical evaluation. This work is based on the Nauguda gad watershed management project. References Arya, L.S. (2007), “Women and Watershed Development in India: Issues and Strategies”, Indian Journal of Gender Studies, Vol. 14, p. 199. Biggs, S.D. (1990), “A Multiple Source Model of Innovation of Agricultural Research and Technology Promotion”, World
Development, Vol. 18(11), pp. 1481–1499. Campbell, B., Sayer, J.A., Frost, P., Vermeulen, S., Ruiz-Perez, M., Cunningham, A. and Ravi, P. (2001), “Assessing the Performance of Natural Resource Systems”, Conservation Ecology, Vol. 5(2), p. 22. [Online] http://www.consecol.org/vol5/iss2/art22/index.html
National Seminar on Management of Natural Resources for Sustainable Development: Challenges and Opportunities
316
Campbell, B.M., Gunarso, P., Kartawinata, K., Levang, P., Rhee, S., Sheil, D., Sist, P. and Wollenberg, E. (2003), “Empowering Forest Dwellers and Managing Forests more Sustainably in the Landscapes of Borneo”, In: Research towards Integrated Natural Resources Management. Harwood, R.R. and Kassam, A.H. Eds. CGIAR, Rome 2003. Clark, N. (1995), “Interactive Nature of Knowledge Systems: Some Implications for the Third World”, Science and Policy, Vol. 22, pp. 249–258. Figueiredo, P. and Perkins, E.P. (2013), “Women and Water manAgement In times of Climate Change: Participatory and Inclusive Processes”, Journal of Cleaner Production, Vol. 60, pp. 188–194. Fulcher, C., Prato, T. and Zhou, Y. (1996), “Watershed Management Decision Support System”, Published in Proceedings of Watershed, p. 96, Moving ahead Together Technical Conference and Exposition, Baltimore, Maryland. Gangodagamage, C. and Clarke, A.C. (2001), “Hydrological Modeling using Remote Sensing and GIS”, In: Twenty second Asian Conference on Remote Sensing, Singapore, 5–9 November, 2001. Gosain, K. and Sandhya, R. (2004), “GIS Based Technologies for Watershed Management”, Current Science, Vol. 87(7), pp. 948–953. Hall, A.J., Rasheed Suliaman V., Clark, N.G. and Yoganand, B. (2002), “From Measuring Impact to Learning Institutional Lessons: An Innovation Systems Perspective on Improving the management of International Agricultural Research”, Agricultural Systems, Vol. 78, pp. 213–241. Honghai, Qi and Mustafa, S. Altinakar (2011), “A Conceptual Framework of Agricultural Land use plAnning with BMP for Integrated Watershed Management”, Journal of Environmental Management, Vol. 92, pp. 149–155. Kahinda, M.J., Boroto, R.J. and Taigbenu, A.E. (2005), Developing an Integrated Water Resources Management and Rainwater Harvesting System in South Africa. In: 12th SANCIAHS Symposium, Midrand, 5–7 September. Kapoor, Ilan (2001), “Towards Participatory Environmental Management?”, Journal of Environmental Management, Vol. 63, pp. 269–279. Korkalainen, H.J., Lauren, A.M. and Kokkonen, T.S. (2007), “A GIS-based Analysis of Catchment Properties within a Drumlin Field”, Borel Environment Research, Vol. 12, pp. 489–500. Kothari, Uma (2001), Power, Knowledge and Social Control in Participatory Development. In: Cooke, Bill, Uma, Kothari (Eds.), Participation: The New Tyranny, Zed Books, London. Kumar, M.G., Agarwal, A.K. and Rameshwar, B. (2008), “Delineation of Potential Sites for Water Harvesting Structures using Remote seNsing and GIS”, Journal of the Indian Society of Remote Sensing, Vol. 36, pp. 323–334. Lohani, Vinod, Kibler, David F. and Chanat, Feffery (2002), “Constructing a Problem Solving Environment Tool for Hydrologic Assessment of Land use Change”, Journal of American Water Resources Association, Vol. 38(2), pp. 439–452. Mahmoud, M.I., Gupta, H.V. and Rajagopal, S. (2011), “Scenario Development for Water Resources Planning and Watershed Management: Methodology and Semi-arid Region Case Study”, Environ. Modell. Softw., Vol. 26, pp. 873–885. Mbilinyi, B.P., Tumbo, S.D., Mahoo, H.F.M. and Mkiramwinyi, F.O. (2007), “GIS Based Decision Support System for Identifying Potential Sites for Rainwater Harvesting”, Physics and Chemistry of the Earth, Vol. 32, pp. 1074–1081. Notter, B., Hurni, A., Wiesmann, U. and Ngana, J.O. (2013), “Evaluating Watershed Service Availability under Future Management and Climate Change Scenarios in the Pangani Basin”, Physics and Chemistry of the Earth, Vol. 61–62, pp. 1–11. Pandey, V.K., Panda, S.N., Raghuwanshi, N.S. and Sudhakar, S. (2006), “Delineation and Parametrization of Banikdih Watershed using Remote Sensing and Avawat Model”, Journal of Indian Society of Remote Sensing, Vol. 34, pp. 144–152. Patricia, E. (Ellie) Perkins (2011), “Public Participation in Watershed Management: International Practices for Inclusiveness”, Physics and Chemistry of the Earth, Vol. 36, pp. 204–212. Perkins, Patricia E. (2001), “Discourse-Based Valuation and Ecological Economics”, Paper Presented at the Conference of the Canadian Society for EcologicalEconomics (CANSEE), McGill University, Montreal, Canada, August 23–25. Prato, T., Fulcher, C. and Feng, X. (1995), Decision Support System for Total Watershed Management, In: Steele, Kenneth (Ed.), Animal Waste and the Land & Water Interface. Lewis Publishers, New York. Ramakrishnan, D., Durga Rao, K.H.V. and Tiwari, K.C. (2008), “Delineation of Potential Sites for Water Harvesting Structures through Remote Sensing and GIS Techniques: A Case Study of Kali watershed, Gujarat, India”, Geocarto International, Vol. 23 (2), pp. 95–108. Sayer, J. and Campbell, B.M. (2001), “Research to Integrate Productivity Enhancement, Environmental Protection, and Human Development”, Conservation Ecology, Vol. 15(2): [online] URL: http://www.consecol.org/vol5/iss2/art1 Sekar, I. and Randhir, T.O. (2007), “Spatial Assessment of Conjunctive Water Harvesting Potential in Watershed Systems”, Journal of Hydrology, Vol. 334, pp. 39–52. Srinivasa, S., Govindaiah, S. and Honne, H.G. (2008), “Prioritization of Sub-watersheds for Sustainable Development and Management of Natural Resources: An Integrated Approach using Remote Sensing, GIS and Socio-economic Data”, Current Science, Vol. 95(3), p. 10. Srivastava, P., Hamlett, J.M., Robillard, P.D. and Day, R.L. (2002), “Watershed Optimization of Best Management Practices using Ann AGNPS and a Genetic Algorithm”, Water Resources Research, Vol. 38(3), pp. 1–14. Sun, Alexander (2013), “Enabling Collaborative Decision-making in Watershed Management using Cloud-computing Services”, Environmental Modelling & Software, Vol. 41, pp. 93–97.

Information System Approach for Integrated Natural Resource Management, Learning and Practices in Nauguda Gad, Uttarakhand
317
Verma, S., Verma, R., Singh, A. and Naik, N. (2012), “Web-based GIS and Desktop Open Source GIS Software: An Emerging Innovative Approach for Water Resources Management”, In: Wyld, D.C., Zizka, J., Nagamalai, D. (Eds.), Advances in Computer Science, Engineering & Applications, Springer, Heidelberg, pp. 1061–1074. Winnaar, G., Jewitt, W. and Horan, M. (2007), “A GIS based Approach for Identifying Potential Runoff Harvesting Sites in the Thukela River Basin, South Africa”, Physics and Chemistry of the Earth, Vol. 32, pp. 1058–1067. Yang, Q., Meng, F.R., Zhao, Z., Chow, T.L., Benoy, G., Rees, H.W. and Bourque, C.P.A. (2009), “Assessing the Impacts of flow Diversion Terraces on Stream Water and Sediment Yields at a Watershed Level using SWAT Model”, Agr. Ecosyst. Environ., Vol. 132, pp. 23–31. Zeyad, Makhamreh (2011), “Using Remote Sensing Approach and Surface Landscape Conditions for Optimization of Watershed Management in Mediterranean regions”, Physics and Chemistry of the Earth, Vol. 36, pp. 213–220. Zhao, X. (2004), A Spatial-temporal Optimization Approach to Watershed Management: AMD Treatment in the Cheat River Watershed, WV, Ph.D. Dissertation, West Virginia University, Morgantown, WV.
318
Author Index
Ahmed, Fuzal, 244 Akhtar, Nazneen, 100 Bandooni, S.K., 236, 304 Bharati, Vinod K., 287 Bhat, Lekha D., 115 Bhattacharjee, P.C., 198 Bhutia, Ongmu, 146 Bhuyan, Gajen, 31 Borah, Annesha, 100 Brindaban, Sarma, 226 Choudhary, B.N., 132 Chutia, Biku Moni, 219 Das, Niranjan, 54 Das, Ranuma, 132 Deb, Pallab, 198 Detsen, Karma, 146 Devi, Angom Sarjubala, 177 Devi, G. Premeshowri, 263 Devi, Laishram Mirana, 236 Dihingia, P.J., 257 Giridhar, K., 132 Ismail, Md., 31 Joshi, Y.G., 6 Kar, Ranjan Kumar, 167 Kate, A.M., 64 Khanduri, V.P., 122, 198 Kumar, K.S., 203 Kumar, Shiva, 287 Lalchamreia, H., 86 Lalnunmawia, F., 71 Lalramnghinglova, H., 23 Lalremruata, J., 16 Lama, Phu Doma, 236 Laskar, Ranjana, 92 Lyngdoh, Dafiralin, 203 Mahanta, J., 132 Malsawmkima, B., 122 Mathew, L., 270 Mayavan, N., 185 Mishra, B.P., 263 Mohanty, Sanjay Kumar, 167
Mukhopadhyay, Malay, 1 Mustaquim, Md., 23 Nani, Anku, 136 Nath, Bharat Chandra, 16 Negi, M.S., 232 Pachuau, Rintluanga, 86 Pagar, S.D., 54 Panda, Lalita L.S., 177 Pandey, Vijendra Kumar, 304 Patil, S.K., 219 Rai, Basanti, 108 Rai, Prabhat Kumar, 180, 192, 198, 219 Rai, S., 257 Rao, Ch. Udaya Bhaskara, 142 Rao, K. Srinivasa, 244 Rathoure, D.P.S., 270 Ray, Prakash, 127 Reena, Modang, 136 Rinawma, P., 142 Roy, Saswati, 1, 77 Saha, Poly, 167 Sahoo, U.K., 16, 122 Saitluanga, Benjamin L., 279 Sankar, M., 132 Sati, S.P., 232 Sati, Vishwambhar Prasad, 296 Sharma, Gurumayum Sanahal, 177 Sharma, Kaushal Kumar, 304 Singh, Amrita, 92 Singh, Mayanglambam Muni, 192 Singh, Yumnam Premananda, 152 Sundaram, A., 185 Suryawanshi, D.S., 54 Syiemlieh, H.J., 43 Thote, Prashant, 270 Upadhyaya, Kalidas, 167 Vanlalfakawma, David C., 122 Verma, Rekha, 216 Yadava, P.S., 177 Zonunsanga, R., 142 Zothanzama, John, 71

ISBN 93-82880-95-X