Scale Aquaculture Fish Production in Zambia by Thelma Namonje ...
33
Assessing the Profitability of Small -Scale Aquaculture Fish Production in Zambia by Thelma Namonje-Kapembwa and Paul Samboko Working Paper 123 September 2017 Indaba Agricultural Policy Research Institute (IAPRI) Lusaka, Zambia Downloadable at: http://www.iapri.org.zm/
-
Upload
khangminh22 -
Category
Documents
-
view
2 -
download
0
Transcript of Scale Aquaculture Fish Production in Zambia by Thelma Namonje ...

Assessing the Profitability of Small -Scale Aquaculture Fish
Production in Zambia
by
Thelma Namonje-Kapembwa and Paul Samboko
Working Paper 123
September 2017
Indaba Agricultural Policy Research Institute (IAPRI) Lusaka, Zambia Downloadable at: http://www.iapri.org.zm/

ii
Assessing the Profitability of Small -Scale Aquaculture Fish Production
in Zambia
by
Thelma Namonje-Kapembwa and Paul Samboko
Working Paper No. 123
September 2017
Indaba Agricultural Policy Research Institute (IAPRI)
26a Middleway, Kabulonga,
Lusaka, Zambia
Namonje-Kapembwa and Samboko are Research Associates with Indaba Agricultural Policy
Research Institute.

iii
ACKNOWLEDGMENTS
The Indaba Agricultural Policy Research Institute is a non-profit company limited by guarantee
and collaboratively works with public and private stakeholders. IAPRI exists to carry out
agricultural policy research and outreach, serving the agricultural sector in Zambia so as to
contribute to sustainable pro-poor agricultural development.
We wish to acknowledge the financial and substantive support of the Swedish International
Development Agency and the United States Agency for International Development (USAID)
in Lusaka. We further would like to acknowledge the technical and capacity building support
from Michigan State University and its researchers and Patricia Jonnes for formatting and
editorial assistance.
Any views expressed or remaining errors are solely the responsibility of the authors.
Comments and questions should be directed to:
The Executive Director
Indaba Agricultural Policy Research Institute,
26A Middleway, Kabulonga,
Lusaka.
Telephone +260 211 261194
Telefax +260 211 261199
Email: [email protected]

iv
INDABA AGRICULTURAL POLICY RESEARCH INSTITUTE
TEAM MEMBERS
The Zambia-based IAPRI research team comprises of Antony Chapoto, Brian Chisanga,
Munguzwe Hichaambwa, Chance Kabaghe, Mulako Kabisa, Stephen Kabwe, Auckland
Kuteya, Henry Machina, Rhoda Mofya-Mukuka, Olipa Zulu-Mbata, Thelma Namonje-
Kapembwa, Hambulo Ngoma, Paul Samboko, Mitelo Subakanya, and Ballard Zulu. Michigan
State University-based researchers associated with IAPRI are Eric Crawford, Steven
Haggblade, Thomas S. Jayne, Nicole Mason, Melinda Smale, and David Tschirley.

v
EXECUTIVE SUMMARY
The fisheries industry in Zambia has gained recognition as an important sector in terms of its
contribution to food, nutritional security, and employment creation. The sector is comprised
of both the capture and aquaculture fisheries with the former contributing approximately 80%
of the total fish produced. Evidence shows that as income rises people tend to move away
from consumption of starchy foods towards animal proteins. In addition, a study by
Musumali et al. (2009) show that fish and fish products account for more than 20% of animal
protein intake and provide essential micronutrients to the majority of Zambia’s population1.
Further, in the low-income countries with water and fisheries resources, fish is an important
source of livelihood, income and food for the rural poor and by far the most frequently
consumed animal-source protein (Thilsted et al. 2014).
Aquaculture is one sector that can contribute to reducing food insecurity and it is the world’s
fastest growing source of animal protein (Hishamunda and Ridler 2006). Aquaculture
production not only increases food supply but also provides employment income that can be
used to purchase other necessities for home consumption. Hence, its potential as a source of
livelihood among smallholder farmers is key but evidence on the profitability of the
enterprise to this group remains absent. Though the sector is relatively small in Zambia, it can
have substantial local impacts and its growing importance, therefore, merits study.
The overall objective of the study was to assess the profitability of small-scale aquaculture
production in selected areas in Zambia. To achieve this objective, the study addressed the
following research questions:
i) What is total investment cost in aquaculture production at a small-scale level?
ii) What is the profitability of small-Scale aquaculture investment in Zambia?
iii) What are some of the constraints faced by aquaculture fish farmer?
The data used in this study was collected through a structured questionnaire that was
administered to a sample of 100 small-scale fish farmers in Kitwe, Luanshya, Kalulushi,
Mkushi, Kabwe, and Chongwe districts. Data collected through the formal the questionnaire
was supplemented with focus group discussions from the selected districts. The analysis
combined descriptive statistics, enterprise budgets, and financial analysis tools. The
profitability of the aquaculture venture was determined using the indicators of investment
returns including, net present value (NPV), internal rate of return (IRR) and benefit-cost ratio
(BCR).
The following were the key findings:
1. Over 80% of the ponds owned by small-scale fish farmers are earthen type with less
than 5% made of concrete. The average size of the ponds is 502m2 with an average
production of 475 kilograms (kgs) per cycle.
2. The estimated initial start-up cost for 500m2 (0.05ha) pond for fish farming is
approximately 24,750 ZMW, this is inclusive of the cost of constructing the pond,
setting up the water supply, stocking of fingerlings, feed and other operational costs.
3. Over the useful life of the ponds (approximately 10 years), the estimated NPV was
17,524.13 ZMW and the IRR was 42.38% measured at the discount rate of 15%. The
positive NPV implies that the aquaculture enterprise is feasible and profitable for
small-scale fish farmers.
1 At global level, fish accounts for 17% of the animal protein intake and in some countries, it exceeds 50%
(FAO 2014).
vi
4. The projected cash flow is sufficient to repay the invested capital and provide returns
on the capital. The BCR was estimated to be 1.2 at the 15% discount rate and since
BCR is greater than one it further confirms that fish farming is a profitable and viable
enterprise.
5. The results also show that aquaculture production was very sensitive to changes in the
price of fish. For instance, a 10% reduction in the price of fish resulted in a 59%
decrease in the estimated NPV holding other factors constant. While a 20% increase
in the loan interest rate only showed a 4% decline in the NPV ceteris paribus.
6. The main constraints identified by the farmers included animal and bird predators,
high cost of feed, lack of capital (finances), non-availability of fingerlings, the
inconsistent supply of water as well as limited access to extension services.
Studies have shown that Zambia has potential to increase its aquaculture production levels,
however, small-scale farmers are faced with many constraints and based on the study findings
the following are some of the recommendations:
i) Increasing farmer’s access to credit from micro-finance banks and commercial banks
is necessary to ensure aquaculture development in Zambia. Hence, there is need for
public-private partnership agreements to establish credit schemes for small-scale fish
farmers.
ii) Farmers need to be encouraged to adopt the integrated Livestock-Crop-Fisheries
production system as a way of reducing costs associated with fish feed. The animal
droppings, maize, and soybean can be used in formulating feed for fish. This,
however, requires training the farmers in best farm practices that ensure sustainable
growth of the aquaculture sector.
iii) There is need for government to invest more in the extension services especially for
the fisheries and livestock sector. More funds should be allocated to the ministry for
operational purposes as well as for improving staffing at district levels.
iv) In addition, it was observed that the facilities for fingerling production in various
districts are available but not operational due to lack of funds. There is need to
increase production of fingerlings for the fish farmers within the districts to help
minimize the cost of sourcing fingerlings outside the provinces where they are
located. Lastly, there is need to fast track the operationalization of the aquaculture
and fisheries fund in order to stimulate fish production especially for aquaculture that
requires a significant amount of resources to be invested in.

vii
TABLE OF CONTENTS
ACKNOWLEDGMENTS ....................................................................................................... iii
INDABA AGRICULTURAL POLICY RESEARCH INSTITUTE TEAM MEMBERS ...... iv
EXECUTIVE SUMMARY ....................................................................................................... v
LIST OF TABLES ................................................................................................................. viii
ACRONYMS ............................................................................................................................ ix
1. INTRODUCTION ................................................................................................................. 1
2. OVERVIEW OF FISHERIES SECTOR IN ZAMBIA ......................................................... 3
3. DATA AND METHODS ...................................................................................................... 4
3.1. Data ................................................................................................................................. 4
3.2. Methods .......................................................................................................................... 4
3.2.1. Basic Production Assumptions ................................................................................ 5
4. RESULTS .............................................................................................................................. 7
4.1. Social-Economic Characteristics of Fish Farmers .......................................................... 7
4.1.1. Individual Characteristics ........................................................................................ 7
4.1.2. Economic Indicators ................................................................................................ 8
5. PROFITABILITY ANALYSIS ........................................................................................... 10
5.1. Cost of Investing in Aquaculture Farming ................................................................... 10
5.2. Is Aquaculture Investment Profitable? ......................................................................... 10
5.2.1. NPV and IRR ......................................................................................................... 10
5.2.2. Benefit-Cost Ratio (BCR) ...................................................................................... 12
5.2.3. Gross Margins Estimations .................................................................................... 13
5.3. Sensitivity Analysis ...................................................................................................... 14
6. CONSTRAINTS IN FISH FARMING ................................................................................ 15
6.1. Fish Predators and Cost of Feed ................................................................................... 15
6.2. Limited Supply of Water and Lack of Capital .............................................................. 15
6.3. Availability of Fingerlings ............................................................................................ 15
6.4. Lack of Management and Technical Skill .................................................................... 16
6.5. Transport and Labor Cost ............................................................................................. 16
7. CONCLUSION AND RECOMMENDATIONS ................................................................ 17
APPENDIX .............................................................................................................................. 19
APPENDIX 1 ........................................................................................................................... 20
APPENDIX 2 ........................................................................................................................... 21
APPENDIX 3 ........................................................................................................................... 22
REFERENCES ...................................................................................................................... 23

viii
LIST OF TABLES
TABLE PAGE
1. Distribution of the Sampled Households ............................................................................... 4
2. Characteristics of Aquaculture Fish Farmers ......................................................................... 7 3. Size of Ponds by Facility Type .............................................................................................. 9 4. Initial Investment Costs and Financing................................................................................ 10 5. Calculation of Benefit-Cost Ratio (BCR) ............................................................................ 13 6. Gross Margins for Fish by Pond Size .................................................................................. 13
7. Sensitivity Analysis ............................................................................................................. 14 A.1. Projected 10-Year Operational Expenses and Cash Inflows ........................................... 20
A 2. Calculation of NPV and Economic Rate of Return by Interpolation ............................... 21 A.3. Cost of Constructing the Ponds by Size and Type ........................................................... 22
LIST OF FIGURES
FIGURE PAGE
1. Fish Production Trend from Capture and Aquaculture Fisheries (2006-2016) ..................... 3 2. Aquaculture Facilities Used by Farmers ................................................................................ 8 3. Estimated Present Values at Various Discount Factors ....................................................... 11
4. Constraints to Fish Farming ................................................................................................. 12

ix
ACRONYMS
BCR Benefit Cost Ratio
CSO Central Statistics Office
DOF Department of Fisheries
DR Discount Rates
FAO Food and Agricultural Organization
FGDs Focus Group Discussions
GM Gross Margins
ha
IAPRI
hectare
Indaba Agricultural Policy Research Institute
IRR Internal Rate of Return
kg Kilograms
NPV Net Present Value
ZMW Zambian Kwacha

1
1. INTRODUCTION
Rapid urbanization, growing population coupled with sustained income growth has led to
changes in the consumption patterns in most developing countries. Evidence shows that as
income increases people tend to move away from consumption of starchy foods towards
animal proteins. A recent issue on the state of world fisheries and aquaculture by the Food
and Agricultural Organization (FAO), show that fish accounts for about 17% of the global
population’s intake of animal protein and in some countries, it exceeds 50% (FAO 2014). In
Zambia for instance, fish and fish products account for more than 20% of animal protein
intake and provide essential micronutrients to the majority of the population (Musumali et al.
2009). Further, in low-income countries with water and fisheries resources, fish is an
important source of livelihood, income and food for the rural poor and by far the most
frequently consumed animal-source protein (Thilsted et al. 2014). And as the human
population continues to grow worldwide, the demand for fish and fish products is expected to
increase. However, in the recent years, capture2 fisheries production has leveled off while
aquaculture3 has continued to show sustained growth (FAO 2006, 2010, 2014). Therefore, the
growing demand for fish can be met by increased production from aquaculture.
The Department of Fisheries (DoF) in Zambia estimates the average annual fish production to
be at 75,000 mt and 20,000 mt for capture and aquaculture fisheries respectively. It is also
estimated that the fisheries sector contributes about 0.4% to the GDP (CSO 2010). This
relatively small contribution at a macro level often masks the significant contributions of fish
production in the rural economy and the nutrition security of the Zambian population. The
sector provides income for 1,000,000 people who earn their income directly as fishers or fish
farmers or indirectly as traders, processors and other service providers along the value chain
(Musumali et al. 2009). However, the current fish consumption per capita in Zambia is still
low compared to the global consumption (10.3 kg per capita compared to 19.2 kg per capita).
At the current consumption4 and production levels, there is a deficit of 35,000 mt, which is
often met through importation of fish from various countries. Zambia’s fish imports have
since increased from 25% to 35% over the years (DOF 2016).
However, despite the well-known benefits of fish production, there are no empirical studies
that have been conducted in Zambia to evaluate the profitability of the aquaculture
production, especially for the small-scale fish farmers. This study determined the profitabiilty
of small-scale investment in aquaculture production by addressing the following research
questions:
i) What is the total investment cost in aquaculture production at a small-scale level?
ii) Is it profitable to invest in aquaculture production at a small-Scale level?
iii) What are some of the constraints faced by aquaculture fish farmer?
By increasing production from aquaculture, it will also drive demand for feed thereby
increasing more opportunities in other segments of the value chain. The government of
Zambia has shown keen interest in improving the fisheries industry and the key findings from
this study present evidence-based information to the policy makers, key stakeholders such as
the Department of fisheries, world fish, aquaculture association, and individual firms. The
2Capture fisheries involves the harvesting of fish from naturally occurring water bodies such as rivers and lakes. 3 Aquaculture fisheries refers to the fish farming. 4 130,000 mt vs 95,000 mt

2
rest of the paper is organized as follows: Section 2 gives an overview of the fisheries sector in
Zambia; Section 3 shows the data and methods used in this study, section 4 and 5 presents the
results both from the descriptive statistics and profitability analysis. Section 6 highlights the
constraints in fish farming. Lastly, section 7 presents the conclusion and recommendations
based on the study findings.
3
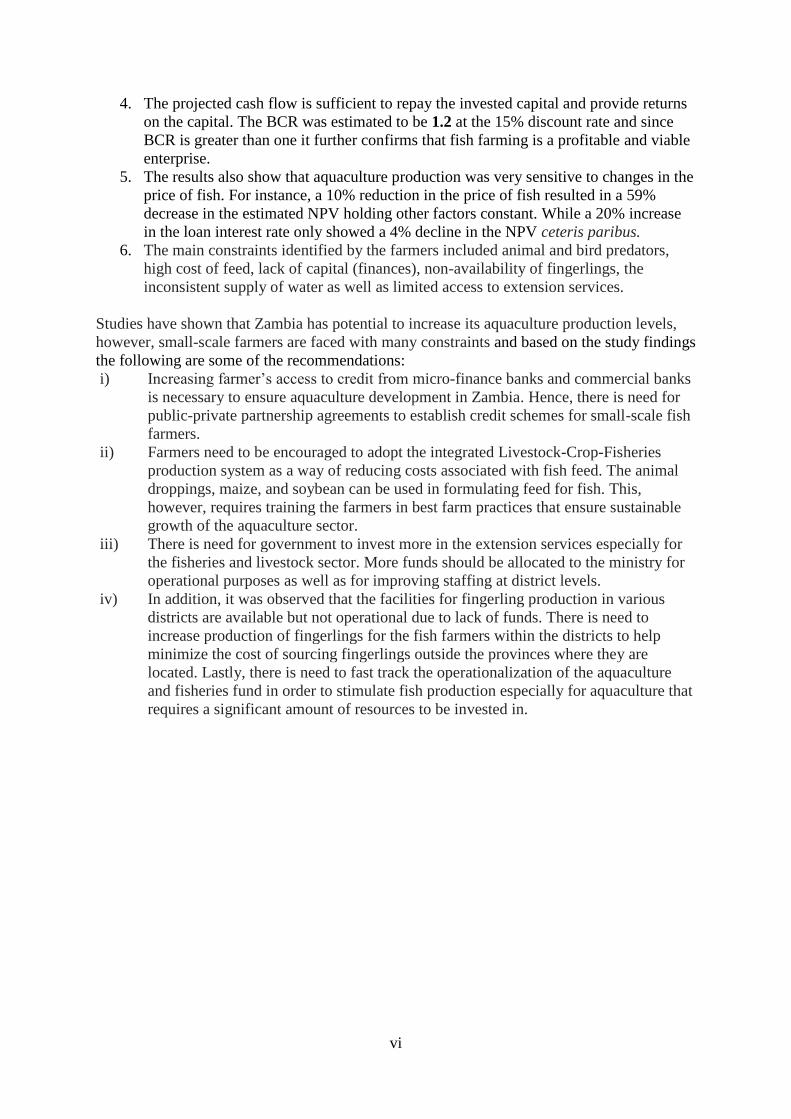
2. OVERVIEW OF FISHERIES SECTOR IN ZAMBIA
The Zambia’s fishing industry is slowly gaining recognition as an important sector in the
contribution to food and nutritional security as well as employment creation. The sector is
comprised of both the capture and aquaculture fisheries with the former contributing most of
the total fish produced. Fish production from capture fisheries like other countries has been
fluctuating over years while for the aquaculture fisheries there has been an increase in the
production levels since 2004. Figure 1 shows the production trend for both aquaculture and
capture fisheries from 2006 to 2016.
It has been observed that the estimated annual production from capture fisheries is unlikely to
increase from the current average of 75,000 mt due to the use of destructive methods coupled
with increased number of fishers (Shula and Mofya-Mukuka 2015). With the rapidly
increasing consumption of high-value protein foods derived from livestock and fish, the fish
supply deficit is bound to increase unless the production from aquaculture or imports can be
increased to offset the deficit. This shortfall, therefore, presents a host of new development
opportunities for the small- and medium-scale farmers in the suitable areas to invest in the
aquaculture production to significantly contribute to fish consumption, reducing rural poverty
and unemployment. In Zambia, tilapia and catfish are the main types of fish that have been
adapted to grow in the cage or pond system and there has been an increase in the awareness
of the potential for aquaculture to contribute to domestic fish production.
There is need for the both the public and private sector to invest in aquaculture production to
address the growing demand for fish and create employment. Evidence from various studies
indicate that a pragmatic business approach focusing on small and medium-scale private
enterprises would produce more benefits for more people than centrally planned and
government-led development projects.
Figure 1. Fish Production Trend from Capture and Aquaculture Fisheries (2006-2016)
Source: Department of Fisheries 2017.
0
5000
10000
15000
20000
25000
30000
35000
0
10000
20000
30000
40000
50000
60000
70000
80000
90000
2006 2007 2008 2009 2010 2011 2012 2013 2014 2015 2016
Aq
ua
cult
ure
Fis
h P
rod
uct
ion
(to
ns)
Ca
ptu
re F
ish
Pro
du
ctio
n (
ton
s)
Capture Fisheries Aquaculture Fisheries
4
3. DATA AND METHODS
3.1. DATA
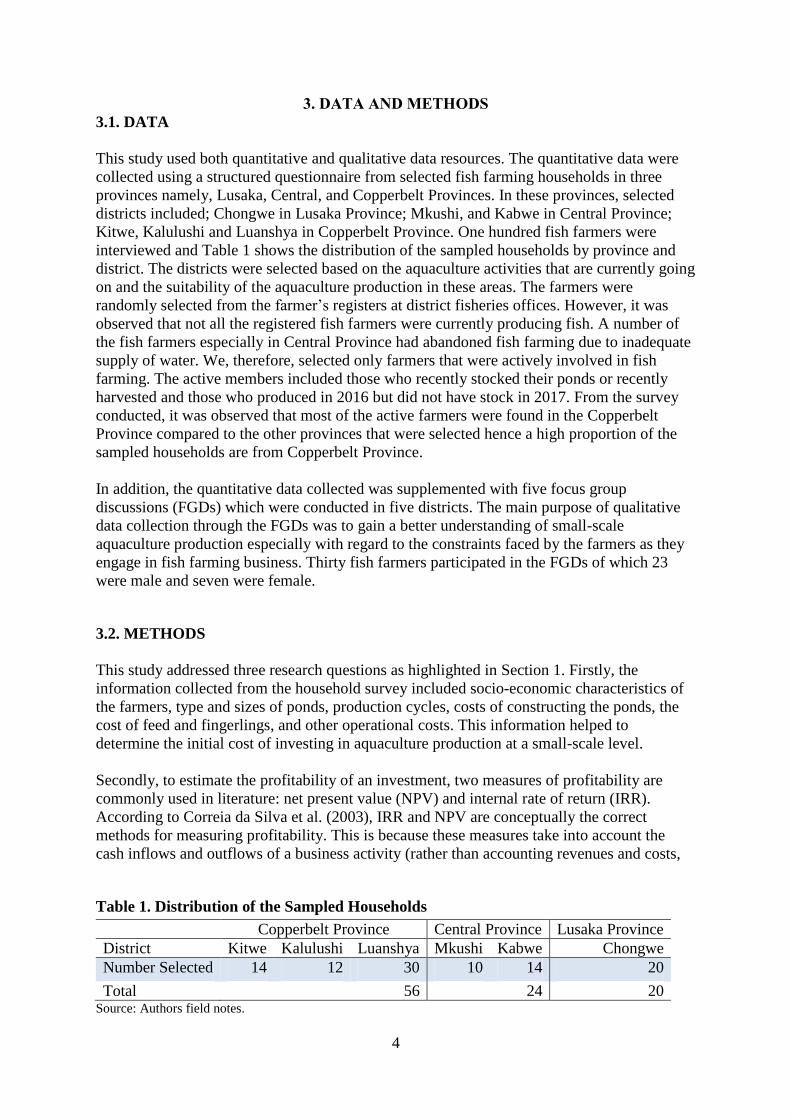
This study used both quantitative and qualitative data resources. The quantitative data were
collected using a structured questionnaire from selected fish farming households in three
provinces namely, Lusaka, Central, and Copperbelt Provinces. In these provinces, selected
districts included; Chongwe in Lusaka Province; Mkushi, and Kabwe in Central Province;
Kitwe, Kalulushi and Luanshya in Copperbelt Province. One hundred fish farmers were
interviewed and Table 1 shows the distribution of the sampled households by province and
district. The districts were selected based on the aquaculture activities that are currently going
on and the suitability of the aquaculture production in these areas. The farmers were
randomly selected from the farmer’s registers at district fisheries offices. However, it was
observed that not all the registered fish farmers were currently producing fish. A number of
the fish farmers especially in Central Province had abandoned fish farming due to inadequate
supply of water. We, therefore, selected only farmers that were actively involved in fish
farming. The active members included those who recently stocked their ponds or recently
harvested and those who produced in 2016 but did not have stock in 2017. From the survey
conducted, it was observed that most of the active farmers were found in the Copperbelt
Province compared to the other provinces that were selected hence a high proportion of the
sampled households are from Copperbelt Province.
In addition, the quantitative data collected was supplemented with five focus group
discussions (FGDs) which were conducted in five districts. The main purpose of qualitative
data collection through the FGDs was to gain a better understanding of small-scale
aquaculture production especially with regard to the constraints faced by the farmers as they
engage in fish farming business. Thirty fish farmers participated in the FGDs of which 23
were male and seven were female.
3.2. METHODS
This study addressed three research questions as highlighted in Section 1. Firstly, the
information collected from the household survey included socio-economic characteristics of
the farmers, type and sizes of ponds, production cycles, costs of constructing the ponds, the
cost of feed and fingerlings, and other operational costs. This information helped to
determine the initial cost of investing in aquaculture production at a small-scale level.
Secondly, to estimate the profitability of an investment, two measures of profitability are
commonly used in literature: net present value (NPV) and internal rate of return (IRR).
According to Correia da Silva et al. (2003), IRR and NPV are conceptually the correct
methods for measuring profitability. This is because these measures take into account the
cash inflows and outflows of a business activity (rather than accounting revenues and costs,
Table 1. Distribution of the Sampled Households
Copperbelt Province Central Province Lusaka Province
District Kitwe Kalulushi Luanshya Mkushi Kabwe Chongwe
Number Selected 14 12 30 10 14 20
Total 56 24 20 Source: Authors field notes.
5
which include accruals and non-cash items). These measures apply discounting to the cash
flows and incorporates the economic concept of the time value of money. Profitability was be
analyzed using Excel financial analysis tools.
Other studies that have looked at the profitability of fish farming have also estimated NPV and
IRR though using other tools. For instance, Okechi (2004) and Salia and Jensson (2008)
estimated NPV and IRR using a profitability model which is simply a simulation model of
initial investment and subsequent operation (Jensson 2006). IRR is also referred to as the
discount rate that causes the net present value of future cash flows from the investment to equal
zero. To determine the NPV and IRR of a small-scale aquaculture investment, the following
assumptions were made for this study.
3.2.1. Basic Production Assumptions
One homestead Earthen Pond to be constructed (500m2)
Fish survival rate 90% for a complete cycle
Harvest size of fish 200g
Stocking rate 5 fish/m2
Production period 6 months (one cycle)
Price of fish K23/kg
Initial Financing of investment
o Commercial Loan 70% of total Investment cost
o Working Capital 30% of total Investment cost
o Loan repayment period 4 years
o Bank Interest Rate 12.5%
Depreciation of the ponds estimated using the straight-line method
Salvage value of the pond taken to be zero
Expected life span of the homestead earthen ponds taken to be 10 years
Cost of fingerlings used average price as reported by the farmers
Cost of constructing the ponds used average price as reported by the farmer (see
Appendix )
Constant annual production and cash flow assumed
Estimated period 10 years.
Given the above assumptions, the equations of estimating NPV and IRR are as follows:
𝑁𝑃𝑉 = ∑𝐶𝐹𝑡
(1 + 𝑖)𝑡
𝑛
𝑡=0
(1)
CFt = Cash flow in year t and
i = Discounting Factor
IRR is derived by extrapolating two net present values that have been calculated using two
random Discount Rates (DR) as shown in the equation below.
IRR = Lower DR + Difference between two DR ∗ (NPV at lower DR)/(Absolute Difference between the NPV ) (2)

6
In addition to estimating NPV and IRR, the study also estimated Benefit Cost Ratio (BCR),
which measures the viability of a business venture. BCR is estimated as shown in equation 3
BCR =∑
Bn(1 + r)n
ni=1
∑Cn
(1 + r)nni=1
=Discounted Revenues
Discounted Costs (3)
Further, it should be noted that when estimating the cash flows for an investment there are
fixed costs are associated with the long-term operation of the fish farming business such as
depreciation of the ponds. In this study, depreciation was estimated using a straight-line
method that involves allocation of an even rate of depreciation every year over the useful life
of an asset. The formula for straight-line depreciation is given as:
Pond Depreciation = (Asset Cost − Salvage Value (Residual Value)
Expected useful life) (4)
Where asset cost here represent the cost of constructing the pond, salvage value is the value
of a fixed asset post the useful life and in this study, we assume the salvage value of the pond
is zero. Useful life, on the other hand, is the period over which the fixed asset is considered to
be productive and in this study, the expected useful life is 10 years.
Thirdly, the study estimated the expected gross margins from the aquaculture business
venture. Gross margin analysis has been used frequently in studies to determine the
profitability of aquaculture production enterprise (Hyuha et al. 2011; Issa et al. 2014;
Akegbejo-Samsons and Adeoye 2012). Using the primary data collected, we created
enterprise budgets for each pond category based on the size. The enterprise budgets provide
estimates of specific inputs and outflows associated with aquaculture production system. The
estimated margins are based on an already established fish farming business. The estimated
gross margins takes the form
Gross Margin (GM) = Total Revenue − Total variable Costs (5)

7
4. RESULTS
4.1. Social-Economic Characteristics of Fish Farmers
Table 2 shows the socio-economic characteristics of the fish farmers in the three provinces.
4.1.1. Individual Characteristics
The individual characteristics evaluated include age, gender, and education level of the fish
farmers. Results in Table 2 shows that the average age and education level of the fish farmers
is 53 years old and 12 years of formal education respectively. The results are similar in the
three provinces and the test of difference in means shows no significance for the two
variables. Similar findings were reported for the aquaculture baseline study that the average
age of the fish farmers in Copperbelt and Northwestern Province was 52 years and the study
also indicated that most of the fish farmers had attained senior secondary school education
(Mwango et al. 2016). The implications of this finding is that majority of the people engaged
in fish farming are over the age of 40 years and this to some extent shows the limited
participation of youths in fish farming.
Further, results show that majority of the fish farming households are headed by men with
very few households been headed by women. This, however, does not imply low
participation of women in fish farming. Findings from the focus group discussions reveal that
women are actively involved in fish farming. For instance, some farmer cooperatives
indicated that women are actively involved in the construction of ponds and marketing of
fish.
Table 2. Characteristics of Aquaculture Fish Farmers
Variables Mean Copperbelt
Province
Central
Province
Lusaka
Province
Level of
Significance
Number of Observations 100 56 24 20
Age of farmer (yr.) 53 53 54 51
Education level (yr.) 12 11 13 13
Gender of farmer
(Male=1)%
92%
89%
100%
89%
Household Size (number) 5 6 6 5 *
Use of Hired Labor (%) 56% 60% 46% 58%
Value of Assets for
Fishing (ZMW)
10,105
7,319
11,238
16,329
Production Cycle
(#Months)
6.18
6.07
6.28
5.9
Number of Ponds Owned 3 2 3 2
Quantity of fish produced
in cycle (Kg)
475
725
359
342
**
Income from Fish (ZMW) 17,663.14 21,226.34 10,489.12 15,940.56 **
Income from other
activities (ZMW)
61,836.73
21,880.54
77,351.74
160,821.10
*** Source: Authors calculations from IAPRI 2017.
Note; T-test between provinces *, **, *** shows significant differences at 10%, 5% and 1%

8
In Chongwe district for example, the aquaculture program for the youths comprises of 18
females out of the 30 members participating in the program. The participants in the FGDs
noted that they engage youths and women so that they take care of the business especially
marketing of fish is entrusted to women in most of the areas visited.
4.1.2. Economic Indicators
There are some key things to note from the results presented in Table 2 that give general
economic characteristics of fish farmers. Firstly, the average length of the production cycle
(from stocking to harvesting) is six months for most of the farms surveyed in all the
provinces. This implies that farmers can produce fish twice in a year provided they have the
resources to do so. Secondly, the average quantity produced by the farmers is 475 kg per
cycle with Copperbelt recording the highest (725 kgs) while Lusaka had the least average
quantity produced (342 kgs). Thirdly, the income earned from fish farming also varied across
the three provinces with the average of 17,663.14 Zambian Kwacha (ZMW) and Copperbelt
recording the highest amount earned. The test of difference in means for both the quantity of
fish produced and income earned shows that the results are statistically significant at 5%.
Fourth, with regard to labor, on average 56% of the fish farmers use hired labor with
Copperbelt and Lusaka Province recording the highest percentage of fish farmers that use
hired labor. Lastly, the results indicate that fish farmers are also actively involved in other
economic activities to generate household income. The economic activities included crop
production, formal wage employment as well as other off-farm activities in a year.
Comparing the three provinces, fish farmers in Lusaka had the highest average income earned
from other economic activities and the results are statistically significant at 1%.
Figure 2 shows the type of aquaculture facilities that are used by the fish farmers and results
indicate that majority of the farmers utilize earthen ponds (85%)About 12% of ponds were
earthen ponds with dam liners and less than 5% were concrete ponds. Similarly, the baseline
study by Mwango et al. (2016) show that over 90% of the farmers utilize earthen ponds
compared concrete ponds. However, the aquaculture studies in Nigeria show that a majority
Figure 2. Aquaculture Facilities Used by Farmers
Source: Authors compilation from IAPRI 2017.
3%
85%
12%
Concrete Pond
Earthen Ponds
Earthen Ponds with Dam Liners

9
of the small-scale fish farmers utilize concrete ponds compared to earthen ones (Issa et al.
2014; Akegbejo-Samsons and Adeoye 2012). The choice of the type of facility to use by the
fish farmers is dependant on a number of factors such as water availability and soil type, as
well as costs associated with constructing and maintaining the ponds.
Further, results in Table 3 show the different sizes of ponds that farmers own by the facility
type. The result indicates that the average size of ponds is about 502m2 and most of the ponds
are between 150m2 and 500m2 followed by those that are less than 150m2. The third highest
category of pond sizes is between 500m2 and 700m2 and only 19 out of the 255 ponds were
more than 1000m2.
Table 3. Size of Ponds by Facility Type
Pond Size
Category
Type of Ponds
All types of
Ponds
(Count total)
Concrete Pond Earthen Ponds Earthen with
Plastics
Average
Size of
Ponds
Count Count Count
<150 m2 (64) 2 57 5 109m2
150 to 500 m2 (85) 4 57 24 327m2
500 to 700 m2 (62) 0 60 2 590m2
700 to 1000 m2 (25) 2 23 0 860m2
>1000 m2 (19) 0 19 0 1932m2
Total 255 8 216 31 502m2
Source: Authors compilation from IAPRI 2017.

10
5. PROFITABILITY ANALYSIS
5.1. Cost of Investing in Aquaculture Farming
In order for a farmer to venture into fish farming business, one needs to know the costs
associated with starting up fish farming and the required capital (money) to invest. The
investment may include obtaining land, buildings, ponds and other start-up costs. In this
study, however, we assume the farmer already has land available at his/her homestead hence
our study does not include the cost of obtaining land. Other studies that have looked at the
profitability of aquaculture production have included the cost of buying land and building
other farm structures besides the fish ponds (Okechi 2004; Salia and Jensson 2008). The
initial investment costs for constructing a 500m2 earthen pond are presented in Table 4. The
costs include setting up the ponds, cost of water pump and pipes, and other fishing
equipment. In the initial investment cost, we include a 4% contingency. Financing of the
investment is assumed to be paid by equity, which is approximately 30% of the total capital
and a one-time loan accounting for 70% of the total investment costs and other start-up costs.
In this study, we also assume the repayment period of the loan is four years with a one-year
grace period in the first year of setting up the business and an interest rate of 12.5%. The total
investment cost and other start-up cost is estimated to be 24,000 ZMW of which 12,500
ZMW is for constructing the pond, setting up the water supply and other fishing equipment.
5.2. Is Aquaculture Investment Profitable?
5.2.1. NPV and IRR
To answer this research question we estimated the profitability and viability of aquaculture
production using net present value, benefit-cost ratio as well as the internal rate of return.
Based on the data collected for this study and other past studies on aquaculture production in
Zambia (Mwango et al. 2016; Shula and Mofya-Mukuka 2015), we made production
assumptions as presented in Section 3.2.1. to estimate the profitability of aquaculture
production. Table 8 in the Appendix shows the projected 10-year operational costs and cash
inflows. It should be noted that the total costs (cash outflow) in the first year include the
Table 4. Initial Investment Costs and Financing
Initial Investment ZMW
Construction of Pond (500m2) 3,500.00
Water Pump and Pipes 7,000.00
All other Fishing Equipment 1,500.00
Contingencies (4%) 504.00
Total Investment 12,504.00
Other start-up costs* 11,894.00
Total Costs in Year 1 24,398.00
Financing
1. Loan Drawn
2. Equity
17,000.00
7,400.00
Total Financing 24,400.00
Source: Authors Calculations using aquaculture survey data from DOF 2017.
* Note; Refer to Table 5 on the operation costs.

11
initial investment costs. Further, in estimating the operational costs we include fixed costs
and variable costs. Fixed costs are associated with the long-term operation of the fish farming
business such as repayment of borrowed money and depreciation.5
NPV is the most commonly used measure for evaluating the profitability of an investment
and it indicates how much value an investment adds to the business. Results in Table 9 in the
appendix show that the estimated net present values (NPV) at 20%, 15%, and 10% discount
rates and results show that NPV is positive. For the purposes of this study, the discount rate
used is 15%. Using this rate NPV at the end of 10 years of business operation was found to be
17,524.136 ZMW. A positive NPV implies that the aquaculture business venture is feasible
and profitable. Figure 4 shows the estimated NPVs over the 10-year period and the results
show that NPV is sensitive to the choice of discount rate used.
Evaluating costs and benefits of an investment involves an important step of choosing a
discount rate. According to Kossova and Sheluntcova (2015), the discount rate allows for
comparison of social benefit and costs that might arise at different time points and the value
of the discount rate has a significant impact on the present value of a project/investment. For
instance at 20% discount rate the estimated NPV is 12,829.98 ZMW compared to 17,524.136
ZMW and 24,292.31 ZMW at 15% and 10% respectively. The decision to accept or reject an
investment can be affected by the discount rate used. For example, an overestimated rate
might lead to the rejection of a worthwhile project/investment and conversely, an
underestimated rate might cause acceptance of a long-term investment/projects with distant
benefits (Kossova and Sheluntcova 2015). Though there is no clear guide on the choice of the
discount rate to use, Treasury Guidance (2003) suggests that for very long-term
investments/projects (over 30 years) a lower discount rate should be used.
Figure 3. Estimated Present Values at Various Discount Factors
Source: Authors Calculations using aquaculture survey data from DOF 2017.
5
Depreciation of the pond =𝟑,𝟓𝟎𝟎
𝟏𝟎= 350
-5000.00
-4000.00
-3000.00
-2000.00
-1000.00
0.00
1000.00
2000.00
3000.00
4000.00
5000.00
6000.00
1 2 3 4 5 6 7 8 9 10
Pre
sen
t V
alu
es
Operational Year
DR (20%) DR (15%) DR (10%)

12
Figure 4. Constraints to Fish Farming
Source: Authors Calculations using aquaculture survey data from DOF 2017.
After estimating the NPV, we estimated the IRR, which is simply the rate of return that is
expected to be derived from an investment considering the amount and timing of the
associated cash flows. For this study, we use 10% and 20% as the discount rates for
estimating IRR and the estimated IRR6 is 42.38%. The IRR of 42.38% suggests that the
proposed investment in aquaculture production will generate an average annual rate of return
equal to 42.48% over the life of the project. Since the estimated IRR is positive and above 0,
it implies that the investment in aquaculture production is profitable and is a worthwhile
investment.
5.2.2. Benefit-Cost Ratio (BCR)
In addition to the NPV and IRR, another measure used to determine if the investment is
profitable and viable is the Benefit Cost Ratio (BCR). BCR has been used in past studies to
evaluate the viability of fish farming (Emokaro 2010; Olaoye et al. 2012; Akegbejo-Samsons
and Adeoye 2012). The benefit-cost ratio measures how effective the revenues cover the cost
of an enterprise. Using the 15% discount rate (DR), Table 5 shows the discounted benefits
(revenues) and costs.
BCR =Discounted Revenues
Discounted Costs =
103,888.51
86,364.37= 1.2 (6)
The estimated benefit-cost ratio is 1.2, which is greater than 1, and this indicates profitability
of small-scale fish farming in the study areas. The estimate of 1.2 indicates that at 15%
discount rate, the gross revenue covers the total cost 1.2 times. Fish farming is, therefore, a
viable business in the study areas.
6 IRR=10+10*(24,292.31/11,462.34)=42.38%
10%
26%
7%
13%
24%
13%
8%
0% 5% 10% 15% 20% 25% 30%
Availabilit of Fingerlings
Feed is Expensive
Lack of extension
Limited Finances
Predators birds and animals
Water Shortage
Labor and Transport
Frequency
Ch
all
en
ge
s in
Fis
h F
arm
ing

13
Table 5. Calculation of Benefit-Cost Ratio (BCR)
Year Total Revenue Total Costs DR (15%) Discounted Revenues Discounted Costs
1 20,700.00 24,748.00 0.870 18,000.00 21,520.00
2 20,700.00 17,900.00 0.756 15,652.17 13,534.97
3 20,700.00 17,900.00 0.658 13,610.59 11,769.54
4 20,700.00 17,900.00 0.572 11,835.29 10,234.38
5 20,700.00 17,900.00 0.497 10,291.56 8,899.46
6 20,700.00 12,244.00 0.432 8,949.18 5,293.42
7 20,700.00 12,244.00 0.376 7,781.90 4,602.97
8 20,700.00 12,244.00 0.327 6,766.87 4,002.59
9 20,700.00 12,244.00 0.284 5,884.23 3,480.51
10 20,700.00 12,244.00 0.247 5,116.72 3,026.53
103,888.51 86,364.37
Source: Authors.
Table 6. Gross Margins for Fish by Pond Size
Average Size
Pond (544m2)
<150 m2 150-500m2 500-700 700-1000
Production Cycle (Months) 6 6 6 6 6
Variable Costs
Average Fingerlings
Stocked
2,348 1,144.00 2,094.00 3,066.00 4,006.00
Cost per Fingerlings 0.58 0.62 0.57 0.53 0.4
Cost of Fingerlings 1,361.84 709.28 1,193.58 1,624.98 1,602.40
Cost of Feed 1,521.00 1,258.63 1,670.00 1,843.00 2,000.00
Labour Cost 1,800.00 1,800.00 1,800.00 1,800.00 1,800.00
Cost of Manure 202 247.57 125.99 294.54 341.3
Transport Cost 185 158 181 202 204
Total Cost 5,069.84 4,173.48 4,970.57 5,764.52 5,947.70
Fish Sold in one Cycle
(Kg)
981 637.2 587.83 1,207.29 1,226.28
Price per kg 22 20 22 23 22
Revenue 21,582.00 12,744.00 12,932.26 27,767.67 26,978.16
Gross Margins (GM) 16,512.16 8,570.52 7,961.69 22,003.15 21,030.46
Net Profit Margin (%) 77% 67% 62% 79% 78%
Source: Authors Calculations using aquaculture survey data from DOF 2017.
5.2.3. Gross Margins Estimations
This section presents the estimated gross margins based on the costs and revenue information
collected from 100 farmers in the districts surveyed. The gross margins are estimated based
on the pond size categories as well as on the overall average size ponds. Table 6 shows the
variables used to estimate the gross margins, which include the cost of fingerlings, cost of
feed, labor, and transportation costs. The production cycle is estimated at six months based
on the responses from the farmers.

14
The analysis of gross margins presented in Table 6 is positive indicating that fish farming
enterprise is profitable and can contribute to household incomes. The gross margins, however
vary across the different sizes of the ponds from 7,961.60 ZMW to 22,003.15 ZMW. The
averagely sized ponds of 544m2 generate approximately 21,582 ZMW per production cycle
and the estimated gross margin is 16,512 ZMW. For the purposes of gross margins
calculations, we used the average cost of hired labor for all the fish farmers interviewed in
this study. The number of hired workers ranged from zero to four persons per farm and the
average labor cost is per production cycle estimated to be six months. Table 6 reveals that the
cost of labor, feed, and fingerlings accounted for the large proportion of the cost of fish
farming in the study area. The high cost of feed was cited by the farmers that participated in
the focus group discussions as one of the challenges faced by fish farmers. Similarly, studies
that have looked at profitability of aquaculture production in Kenya, Nigeria, and Uganda
have also indicated that the cost of feed and fingerlings are important factors that affect the
economic potential of fish farming (Hyuha et al. 2011; Issa et al. 2014; Okechi 2004; Olaoye
et al. 2012; Akegbejo-Samsons and Adeoye 2012). Further, the net profit margin percentages
for all the categories of ponds show that fish farming in the selected areas is a profitable
business venture.
5.3. Sensitivity Analysis
Since prices of commodities are constantly changing, a sensitivity analysis was performed to
this study to analyze the risk of establishing an aquaculture business in the selected areas. The
sensitive analysis will not only help to check the robustness of our findings that aquaculture
production has positive returns but will also help to highlight some potential interventions in
case of the changes. Table 7 shows the sensitivity analysis by computing the NPV, IRR, and
BCR with the best and worst case scenarios. The pessimistic scenarios show the effect of a
decrease in the price of fish by 10% and an increase in the loan interest rate by 20%. The
optimistic scenario, on the other hand, shows the effect of an increase in the price of fish by
10% and a decrease in the loan interest rate by 20%. The four scenarios are performed
separately to see the effect in changing one variable at a time. The results highlighted in
Table 7 shows that the profitability of aquaculture production is more sensitive to changes in
the price of fish compared to the changes in the loan interest rate. For instance, a 10%
decrease in the price of fish reduces NPV from 17,524.136 ZMW to 7,135.28 ZMW while
IRR reduces from 42.38% to 31.19%.
Table 7. Sensitivity Analysis
Profitability
Variable
Pessimistic
Price of fish
reduces by 10%
(20.3ZMW/Kg)
Optimistic
Price of fish
increases by 10%
(25.3 ZMW/Kg)
Pessimistic
Interest rate
increases by 20%
(to 15%)
Optimistic
Interest rate
reduces by 20%
(to 10%)
NPV 7,135.28 27,912.99 16,783.06 18,251.53
IRR 31.19 47.75 41.67 43.06
BCR 1.08 1.32 1.19 1.21
Source: Authors Calculations using aquaculture survey data from DOF 2017.

15
6. CONSTRAINTS IN FISH FARMING
The third objective of this study was to identify the constraints to fish farming among the
small-scale fish farmers in Zambia. Both in the structured questionnaire and the focus group
discussions, the participants (respondents) were asked to highlight the three main constraints
they face in fish farming. From the results presented in Figure 4, predators (this includes
birds, snakes, and wild animals) and the high cost of feed were identified to be the most
serious constraints to fish farming.
6.1. Fish Predators and Cost of Feed
During the FGDs, participants mentioned that commercial feed for fish is expensive hence,
some of the farmers resort to using alternative feed that has very little effect on the growth of
fish. In some cases, farmers mentioned that they use maize bran and vegetables such as
cabbage to feed their fish.
The issue of predators was mentioned to have a negative impact on the quantity of fish that
farmers eventually harvest thereby reducing the income that can be generated from fish. The
issues of high cost of feed and predators have also been highlighted in other studies as factors
affecting the profitability of fish farming (Hyuha et al. 2011; Olaoye et al. 2012; Ugwumba
and Chukwuji 2010; Ume et al. 2016). Further, Ume et al. (2016) indicate that due to high
costs and often unavailability of fish feed, it makes fish farming unproductive as resource
poor farmers tend to stop feeding their fish when the prices of feed are high and resume only
when they can afford the cost.
6.2. Limited Supply of Water and Lack of Capital
The other constraints include shortage of water and limited capital to finance the aquaculture
business venture. The majority of the farmers visited depend on ground water for their
fishing; this poses a challenge to fish production especially in the hot season as well as during
drought years or when the rainfall is very low. One participant indicated that she was forced
to construct a pond on a colleague’s farm that is very far from her place due to shortage of
water. In Central Province, the situation on the ground is that most fish farmers have
abandoned the practice due to water shortage as most ponds have dried up. One way to
address this is investing in water pumps that can continuously pump water into the ponds.
Investment in aquaculture production can be capital intensive especially for the resource-poor
farmers and participants from the FGDs indicated that the cost of constructing the ponds and
initial costs of feed, setting up water is usually high. However, they also indicated that once
they started harvesting they were able to generate enough revenue to cover the cost.
Therefore, access to credit for the small-scale farmers is vital in purchasing productive inputs
and hiring labor to increase their productivity. The level of productivity by small-scale
farmers is dependent on their access to productive resources, which is often determined by
the availability of finances (credit).
6.3. Availability of Fingerlings
Further, some farmers especially those in Central Province indicated that availability of good
quality fingerlings was another challenge they faced in their fish farming business. They

16
bemoaned that they have to travel either to Copperbelt or Lusaka Province to purchase
fingerlings. This was contributing to the high cost of doing business due to high transport
costs.
6.4. Lack of Management and Technical Skill
It was also noted that most of the fish farmers only had one-time training in fish farming.
They indicated that lack of management skills and technical knowledge of fish farming was
prevalent among the fish farmers. Lack of site selection and design skills was also a
challenge. One respondent gave an example of his colleague that built a pond only to stop
afterward as the walls of the pond started cracking due to constructing the ponds near the
trees. The participants during the FGDs indicated that they were only visited by extension
officers from the fisheries department when they started the cooperatives and there have
never been follow-ups on how they are performing in fish farming.
6.5. Transport and Labor Cost
Lastly, some farmers indicated that non-availability of transport and high cost of labor was a
challenge that they faced in fish farming. In some areas, farmers indicated that due to non-
availability of transport they end up selling their fish within the community, which usually
fetches low prices. For households that are using hired labor, the farmers highlighted that
labor was expensive and also as presented in the gross margins and profitability analysis in
the earlier sections, labor costs are higher. However, the issue of the high cost of labor did not
come out very strong from the participants this may be due to the composition of participants
in the FGDs as some farmers may be depending on family labor as opposed to hired labor.
Recall that Table 2 shows that about 44% of the fish farmers only depend on family labor
hence the high cost of labor is coming from the 56% that are using hired labor for their fish
operations.

17
7. CONCLUSION AND RECOMMENDATIONS
The objective of this study was to assess the probability of small-scale investment in
aquaculture production and to identify the constraints faced by the small-scale fish farmers in
the study areas. The study utilized primary data collected through a structured questionnaire
that was supplemented with focus group discussions with individual fish farmers and
members of cooperatives. To address these objectives, the study utilized both descriptive
analysis and financial analysis tools using the data collected through the field survey that was
administered to 100 farmers, as well as the qualitative information from the FGDs.
The following were the findings that emerged from the study:
Firstly, in terms of social-economic characteristics, the average age of the fish farmers from
the surveyed areas was 53 years old with 12 years of formal education. It was observed that
over 80% of the ponds owned by the fish farmers are earthen type of ponds with less than 5%
concrete type of ponds. The average size of ponds is 502m2 and the average quantity of fish
produced in one cycle is 475 kgs. The production cycle for the majority of the farmers is 6
months. The descriptive results further revealed that about 56% of the fish farmers used hired
labor with Copperbelt Province recording the highest percentage of farmers that utilize hired
labor.
Secondly, this study estimated that a farmer would require approximately 24,750 ZMW as
start-up capital for constructing the pond, setting up the water supply, stocking up fingerlings,
and purchasing other inputs. The operation costs, however, tend to reduce in the following
year. An insight into the economic feasibility of the fish farm operations was gained using the
financial analysis tools and it was useful in determining the feasibility of the enterprise. The
indicators of investment returns estimated include Gross Margins, NPV, IRR, and BCR. The
results from the profitability analysis show positive net revenue, Net Present Value and
Internal Rate of Return. The Benefit Cost Ratio is also greater than one implying that
investment in aquaculture production is profitable and viable business venture. The
profitability analysis is based on the assumption that one 500m2 (0.05ha) pond for a small-
scale fish farm can produce at least 900 kgs of fish per year. The assumption of the
production figures is based on the survey findings. The results reveal that over the useful life
of the ponds, which is assumed to be 10 years, the estimated NPV is 17,524.13 ZMW and the
IRR is 42.38% measured at the discount rate of 15%. The positive NPV implies that the
aquaculture enterprise is feasible and profitable. The projected cash flow is sufficient to repay
the invested capital and provide returns on the capital.
The BCR was estimated to be 1.2 at the 15% discount rate and since BCR is greater than one
it further confirms that fish farming is a profitable and viable enterprise. The profitability
analysis was further subjected to a sensitivity analysis and the results show that aquaculture
production was very sensitive to changes in the price of fish. For instance, a 10% reduction in
the price of fish resulted in a 59% decrease in the estimated NPV holding other factors
constant. While a 20% increase in the loan interest rate only showed a 4% decline in the NPV
ceteris paribus. The findings of this study compare favorably with other studies that have
shown that fish farming is viable and profitable even at a small-scale.
Thirdly, the study identified some of the constraints and challenges that fish farmers face.
The main constraints include the animal and bird predators, high cost of feed, lack of capital
(finances), non-availability of fingerlings, and the inconsistent supply of water as well as
limited access to extension services. These factors have negative implications on the

18
profitability of the fish farming enterprise. For instance, farmers complained of limited
knowledge in the management of their fish and this has resulted in the low production levels.
The limited knowledge in fish management often results in underfeeding/overfeeding the fish
and poor water management. Consequently, this affects the size of fish harvested, which
ultimately determines the price of fish.
Based on the study findings, investment in aquaculture production is very profitable and
viable for the small-scale farmers to generate income besides crop production. Studies have
shown that Zambia has potential to increase its aquaculture production levels; however,
small-scale farmers are faced with many constraints of which access to credit is among the
top challenges. This study, therefore, recommends that the government in partnership with
private companies (financial lending institutions) should establish credit schemes for fish
farmers. Increasing farmer’s access to credit from microfinance banks and commercial banks
is necessary to ensure aquaculture development in Zambia.
To address the issue of high cost of feed, farmers should learn how to formulate quality feeds
from the own grown crops that that can be used as feed ingredients. Farmers can adopt the
integrated Livestock-Crop-Fisheries production system as a way of reducing costs associated
with the fish feed. The animal droppings, maize, and soybean can be used in formulating feed
for fish. This, however, requires training the farmers in best farm practices that ensure
sustainable growth of the aquaculture sector. Hence, there is need for government to invest
more in the extension services especially for the fisheries and livestock sector.
Lastly, to address the issue of non-availability of fingerlings in selected areas, the
government through the department of fisheries should operationalize the existing
aquaculture facilities in various provinces. It was observed that the facilities for fingerling
production in various districts are available but not operational due to lack of funds. There is
need to increase production of fingerlings for the fish farmers within the districts to help
minimize the cost of sourcing fingerlings outside the provinces where they are located. There
is need to operationalize the aquaculture and fisheries fund in order to stimulate fish
production especially for aquaculture that requires a significant amount of resources to be
invested in.

19
APPENDIX

20
APPENDIX 1
Table A.1. Projected 10-Year Operational Expenses and Cash Inflows
Year 1 2 3 4 5 6 7 8 9 10
Cash Inflow
Sales (kg/year) 900.00 900.00 900.00 900.00 900.00 900.00 900.00 900.00 900.00 900.00
Price (ZMW/Kg)
23.00
23.00
23.00
23.00
23.00
23.00
23.00
23.00
23.00
23.00
Revenue
20,700.00
20,700.00
20,700.00
20,700.00
20,700.00
20,700.00
20,700.00
20,700.00
20,700.00
20,700.00
Annual Operating Costs
Variable Costs
Cost of Fingerlings 1,600.00 1,600.00 1,600.00 1,600.00 1,600.00 1,600.00 1,600.00 1,600.00 1,600.00 1,600.00
Feed Cost 3,700.00 3,700.00 3,700.00 3,700.00 3,700.00 3,700.00 3,700.00 3,700.00 3,700.00 3,700.00
Transport Cost 400.00 400.00 400.00 400.00 400.00 400.00 400.00 400.00 400.00 400.00
Cost of Manure 404.00 404.00 404.00 404.00 404.00 404.00 404.00 404.00 404.00 404.00
Maintenance works 600.00 600.00 600.00 600.00 600.00 600.00 600.00 600.00 600.00 600.00
Labor Cost 5,190.00 5,190.00 5,190.00 5,190.00 5,190.00 5,190.00 5,190.00 5,190.00 5,190.00 5,190.00
Total Operational Costs 11,894.00 11,894.00 11,894.00 11,894.00 11,894.00 11,894.00 11,894.00 11,894.00 11,894.00 11,894.00
Fixed Costs
Pond Depreciation 350 350 350 350 350 350 350 350 350 350
Loan Repayment 0 5,656.00 5,656.00 5,656.00 5,656.00
Total Cash Outflow 24,748.00 17,900.00 17,900.00 17,900.00 17,900.00 12,244.00 12,244.00 12,244.00 12,244.00 12,244.00
Source: Authors Calculations using aquaculture survey data from DOF 2017.

21
APPENDIX 2
Table A 2. Calculation of NPV and Economic Rate of Return by Interpolation
Year Total
Revenue
Total
Costs
Incremental
benefit
Discount
Factor at
20%
Present
Value at 20%
Discount
Factor at
15%
Present Value
at 15%
Discount
Factor at
10%
Present
Value at
10%
1 20,700.00 24,748.00 (4,048.00) 0.83 (3,373.33) 0.870 (3,520.000) 0.91 (3,680.00)
2 20,700.00 17,900.00 2,800.00 0.69 1,944.44 0.756 2,117.202 0.83 2,314.05
3 20,700.00 17,900.00 2,800.00 0.58 1,620.37 0.658 1,841.045 0.75 2,103.68
4 20,700.00 17,900.00 2,800.00 0.48 1,350.31 0.572 1,600.909 0.68 1,912.44
5 20,700.00 17,900.00 2,800.00 0.40 1,125.26 0.497 1,392.095 0.62 1,738.58
6 20,700.00 12,244.00 8,456.00 0.33 2,831.90 0.432 3,655.762 0.56 4,773.19
7 20,700.00 12,244.00 8,456.00 0.28 2,359.91 0.376 3,178.924 0.51 4,339.27
8 20,700.00 12,244.00 8,456.00 0.23 1,966.60 0.327 2,764.281 0.47 3,944.79
9 20,700.00 12,244.00 8,456.00 0.19 1,638.83 0.284 2,403.723 0.42 3,586.17
10 20,700.00 12,244.00 8,456.00 0.16 1,365.69 0.247 2,090.194 0.39 3,260.15
NPVs 12,829.98 17,524.136 24,292.31
Source: Authors Calculations using aquaculture survey data from DOF 2017.

22
APPENDIX 3
Table A.3. Cost of Constructing the Ponds by Size and Type
Source: Authors.
Size of Pond
Type of Ponds
Concrete Pond Earthen Ponds Earthen with plastics
Cost of Construction
(ZMK)?
Cost of Construction
(ZMK)?
Cost of Construction
(ZMK)?
Mean Mean Mean
<150 13,750 2,239 2,824
150 to 500 7,375 2,181 3,646
500 to 700 * 4,317 7,500
700 to 1000 10,500 4,913 *
>1000 * 7,447 *

23
REFERENCES
Akegbejo-Samsons, Y. and D. Adeoye. 2012. Measuring Profitability in Small Scale
Aquaculture Enterprises in South West Nigeria. Presented at the 16th IIFET Conference,
July 16-20, 2012. Dar es Salaam, Tanzania.
Correia da Silva, Luis, Gunnar Niels, Swee Chua, Leonie Bell … and Rupert Booth. 2003.
Assessing Profitability in Competition Policy Analysis. Economic Discussion Paper No.
6. Prepared for the Office of Fair Trading by OXERA. London, UK. Retrieved from
http://www.oxera.com/Oxera/media/Oxera/downloads/reports/OFT-Assessing-
profitability.pdf?ext=.pdf.
CSO. 2010. Central Statistical Office Summary Report Gross Domestic Product 2010
Benchmark Estimates. Lusaka: CSO.
Department of Fisheries (DOF). 2017. Department of Fisheries 2016 Annual Report.
Chilanga, Zambia: Government of Zambia, Department of Fisheries.
Emokaro, C., P. Enkunwe, and A. Achile. 2010. Profitability and Viability of Catfish
Farming in Kogi State, Nigeria. Research Journal of Agriculture and Biological
Sciences 6.3: 215–219. Retrieved June 20, 2017 from
https://www.aensiweb.net/AENSIWEB/rjabs/rjabs/2010/215-219.pdf.
FAO. 2006. The State of World Fisheries and Aquaculture. Aquaculture.
http://www.fao.org/docrep/013/i1820e/i1820e.pdf.
FAO. 2010. The State of World Fisheries and Aquaculture. Food and Agriculture
Organization of the United Nations (Vol. 2010). Rome, Italy: FAO.
http://www.fao.org/docrep/013/i1820e/i1820e.pdf
FAO. 2014. The State of World Fisheries and Aquaculture. Food and Agriculture
Oraganization of the United Nations (Vol. 2014). Rome, Italy: FAO. Retrieved on
September 10, 2017 from http://41.77.4.165:6510/www.fao.org/3/a-i3720e.pdf.
Hishamunda, N. and N.B. Ridler. 2006. Farming Fish for Profits: A Small Step Towards
Food Security in Sub-Saharan Africa. Food Policy 31.5: 401–414.
http://doi.org/10.1016/j.foodpol.2005.12.004.
Hyuha, T.S., J.O. Bukenya, J. Twinamasiko, and J. Molnar. 2011. Profitability Analysis of
Small Scale Aquaculture Enterprises in Central Uganda. International Journal of
Fisheries and Aquaculture 3.15: 271–278. http://doi.org/10.5897/IJFA11.069.
Indaba Agricultural Policy Research Institute (IAPRI). 2017. Aquaculture Fisheries Survey
Data. Lusaka, Zambia: IAPRI.
Issa, F.O., M.O. Abdulazeez, D.M. Kezi, J.S. Dare, and R. Umar. 2014. Profitability Analysis
of Small-scale Catfish Farming in Kaduna State, Nigeria. Journal of Agricultural
Extension and Rural Development 6.8: 267–273.
http://doi.org/10.5897/JAERD2013.0570
Jensson, P. 2006. Profitability Assessment Model. Reykjavik, Iceland. Retrieved on May 3,
2017 from www.hi.is/~pall/verkefni/UNU/Profitability-Paper.doc.
Kossova, T. and M. Sheluntcova. 2015. Evaluating Performance of Public Sector Projects in
Russia: The Choice of a Social Discount Rate. International Journal of Project
Management 34.3: 403–411. http://doi.org/10.1016/j.ijproman.2015.11.005
24
Musumali, M., S. Heck, S. Husken, and M. Wishart. 2009. Fisheries in Zambia: An
Undervalued Contributor to Poverty Reduction. World Bank Policy Brief 1913.
Washington, DC: The WorldFish Center/The World Bank.
https://www.worldfishcenter.org/content/fisheries-zambia-undervalued-contributor-
poverty-reduction
Mwango, J., A.S. Kefi, E.C. Manda, M. Chijoka, and N. Chimba. 2016. Status of
Aquaculture in the Copperbelt and North-Western Provinces of Zambia. Chilanga,
Zambia: Department of Fisheries.
Okechi, J.K. 2004. Profitability Assessment: A Case Study of African Catfish (Clarias
Gariepinus) Farming in the Lae Victoria Basin, Kenya. Final Project. Kisumu, Kenya:
Kisumu Research Centre. http://innri.unuftp.is/Proj04/OkechiPRF04.pdf.
Olaoye, O., F.O. George, W. Abdul, O. Adelaja, S. Ashley-Dejo, and A. Salako. 2012.
Profitability and Viability of Fish Farming Enterprises Using Government Credit
Agency Loan in Ogun State of Nigeria. Nigeria Journal of Fisheries 9.1: 460-463.
Salia, A.M.J. and P. Jensson. 2008. Economic Analysis of Small-Scale Tilapia Aquaculture
in Mozambique. Final Project. Maputo: Institute Nacional de Desenvolvimento de
Aquacultura (INAQUA).
Shula, A.K. and R. Mofya-Mukuka. 2015. The Fisheries Sector in Zambia: Status,
Management, and Challenges. Indaba Agricultural Policy Research Institute Technical
Paper No. 3. Lusaka, Zambia: IAPRI. Retrieved on September 9, 2017 from
http://www.iapri.org.zm/images/TechnicalPapers/TP_3.pdf.
Thilsted, S.H., D. James, J. Toppe, K. Iddya, and R. Subasinghe. 2014. Maximizing the
Contribution of Fish to Human Nutrition. Second International Conference on Nutrition:
Better Nutrition Better Lives, 19-21 November. Rome, Italy.
http://41.77.4.165:6510/www.fao.org/3/a-i3963e.pdf
Treasury Guidance. 2003. The Green Book: Appraisal and Evaluation in Central
Government. Evaluation. London: Government of the United Kingdom.
https://www.gov.uk/government/publications/the-green-book-appraisal-and-evaluation-
in-central-governent
Ugwumba, C.O. and C. Chukwuji. 2010. The Economics of Catfish Production in Anambra
State, Nigeria: A Profit Function Approach. Agriculture and Social Sciences 6.4: 105–
109. Retrieved on June 21, 2017 from
http://www.fspublishers.org/published_papers/71507_..pdf.
Ume, S.I., L.A. Ebeniro, C.D. Ochiaka, and F.O. Uche. 2016. Economics Analysis of Catfish
Production in Anambra State, Nigeria. International Journal of Environment,
Agriculture and Biotechnology 1.3: 476–481. Retrieved on June 21, 2017 from
http://dx.doi.org/10.22161/ijaers/3.10.25.