Satisfying the changing needs of our customers - Centrica
226
Annual Report and Accounts 2016 Satisfying the changing needs of our customers
-
Upload
khangminh22 -
Category
Documents
-
view
0 -
download
0
Transcript of Satisfying the changing needs of our customers - Centrica

Annual Report and Accounts 2016
Satisfying the changing needs of our customers

We are an energy and services company.
Everything we do is focused on satisfying the changing needs of our customers.
Group Highlights
GROUP FINANCIAL SUMMARY (Year ended 31 December)
Group revenue Adjusted operating profit Adjusted earnings Adjusted basic earnings per share (EPS)
£27.1bn £1,515m £895m 16.8p2015: £28.0bn
▼ 3%
2015: £1,459m
▲ 4%
2015: £863m
▲ 4%
2015: 17.2p
▼ 2%
Adjusted operating cash flow
Group net debt Return on average capital employed (ROACE)
Growth revenue
£2,686m £3,473m 16% £194m2015: £2,253m
▲ 19%
2015: £4,747m
▼ 27%
2015: 12%
▲ 4ppt
2015: £114m
▲ 70%
Statutory operating profit/(loss)
Statutory profit/(loss) for the year attributable to shareholders
Net exceptional items after taxation included in statutory profit/(loss)
Basic earnings per share
£2,486m £1,672m £27m 31.4p2015: £(857)m
● nm
2015: £(747)m
● nm
2015: £(1,846)m
● nm
2015: (14.9)p
● nm
GROUP KEY OPERATIONAL PERFORMANCE INDICATORS
Total customer account holdings – Home
Total customer account holdings – Business
Total customer gas consumption (mmth)
Total customer electricity consumption (GWh)
26,196 1,348 12,022 144,8102015: 27,069
▼ 3%
*year end, ‘000s
2015: 1,396
▼ 3%
*year end, ‘000s
2015: 12,177
▼ 1%
2015: 151,595
▼ 4%
Direct Group headcount1 Total recordable injury frequency rate
1 Direct Group headcount excludes contractors, agency and outsourced staff. 2015 has been restated to include North America DE&P.
36,494 0.982015: 39,389
▼ 7%
*year end
2015: 1.10
▼ 11%
*per 200,000 hours worked
GOOD FINANCIAL PERFORMANCE
▲ 4%
Adjusted operating profit and adjusted earnings both up 4%.
▲19%
Adjusted operating cash flow up 19% to £2,686 million, including £357 million working capital inflow in UK Business.
14%
Underlying adjusted operating cash flow growth was 14%, in excess of the Group’s 3–5% per annum long-term target.
INVESTING IN NEW TECHNOLOGIES AND CAPABILITIES
Enhanced ‘Internet of Things’ platform, data science and analytics, and digital capability.
527,000
527,000 Connected Home hubs installed; now selling Hive products in North America.
Centrica builds a pioneering local energy market in Cornwall.
SAFETY
Safety, compliance and conduct remains our top strategic priority. The Group’s total recordable injury frequency rate reduced by 11% compared to 2015. However there were two Tier 1 process safety incidents across the Group during the year, up from one last year. Improving our performance in this area remains a key focus.
Iain Conn Group Chief Executive“We delivered our key objectives including improved safety performance, better customer service, and more innovative offerings and solutions, while repositioning the portfolio, building capability and driving significant cost savings.”
At a Glance
RESHAPING OUR PORTFOLIO IN LINE WITH STRATEGY
ENER-G Cogen and Neas Energy acquisitions add significant capabilities in distributed generation and asset management.
Completed exit from wind power with GLID and Lincs wind farm sales and announced exit from Trinidad and Tobago.
CUSTOMER DELIVERY MATERIALLY IMPROVED
Investment in customer service and digital capability resulted in UK Energy Supply & Services complaints down 31% and higher net promoter scores across all geographies in 2016.
Launch of innovative new product offers for both Centrica Consumer and Centrica Business customers.
FOCUS ON CASH FLOW, CAPITAL DISCIPLINE AND NET DEBT REDUCTION
£2bn
Adjusted operating cash flow expected to exceed £2 billion in 2017.
COST EFFICIENCY PROGRAMME
£384m
We made strong progress with our £750 million per annum efficiency cost programme delivering £384 million of savings in 2016.
BALANCE SHEET SIGNIFICANTLY STRENGTHENED
▼ 27%
Net debt down 27% to £3.5 billion.
▲ 112%
Net assets up 112% to £2,844 million with the share placement and current year profits offsetting the movement in the pension deficit.
Unless otherwise stated, all references to operating profit or loss, taxation, cash flow, earnings and earnings per share throughout the Strategic Report are adjusted figures, reconciled to their statutory equivalents in the Group Financial Review on pages 52 to 55. See also notes 2, 4 and 10 to the Financial Statements on pages 113 and 114, 118 to 123 and 132, for further details of these adjusted performance measures. In addition see pages 219 and 220 for an explanation and reconciliation of other adjusted performance measures used within this document.
Centrica plc Annual Report and Accounts 2016 1
Strategic Report2 Our Businesses4 Chairman’s Statement6 Group Chief Executive’s
Statement10 Focused on Innovating
to Satisfy the Changing Needs of our Customers
12 Focused on Pioneering a New Energy Future
14 Focused on Cutting Energy Costs and Carbon Emissions
16 Our Business Model18 Key Performance Indicators20 Focused on Peace of Mind
for our Customers22 Focused on Engaging
with our Customers24 Responsible Business
Update31 Our View on Taxation32 Focused on Training the
Employees of the Future34 Focused on Training
our Employees36 Business Review52 Group Financial Review56 Our Principal Risks and
Uncertainties
Governance66 Board of Directors68 Senior Executives69 Directors’ and Corporate
Governance Report83 Remuneration Report100 Independent Auditors’ Report
Financial Statements108 Group Income Statement109 Group Statement of
Comprehensive Income109 Group Statement of
Changes in Equity110 Group Balance Sheet111 Group Cash Flow Statement112 Notes to the
Financial Statements190 Company Financial
Statements192 Notes to the Company
Financial Statements201 Gas and Liquids
Reserves (Unaudited)202 Five Year Summary
(Unaudited)203 Ofgem Consolidated
Segmental Statement
Shareholder Information216 Managing Your Shares219 Additional Information
– Explanatory NotesIBC Glossary
CONTENTS
Responsible Business UpdateRead more on page 24
Group Financial ReviewRead more on page 52
Remuneration ReportRead more on page 83
Business ModelRead more on pages 16 and 17
GovernanceRead more on page 65
Principal RisksRead more on page 56
Energy Supply & ServicesRead more on pages 36 to 39
Exploration & ProductionRead more on pages 46 and 47
Central Power GenerationRead more on pages 48 and 49
Centrica StorageRead more on pages 50 and 51
Distributed Energy & PowerRead more on pages 42 and 43
Energy Marketing & TradingRead more on pages 44 and 45
Great companies meet a need that is valued by customers and society. Read more in the Chairman’s Statement on page 4
Smarter energyRead more on pages 20 and 21
Connected HomeRead more on pages 40 and 41
GOVERNANCEFINANCIAL STATEMENTS
SHAREHOLDER INFORMATION
2
STRATEGIC REPORT OUR BUSINESSES
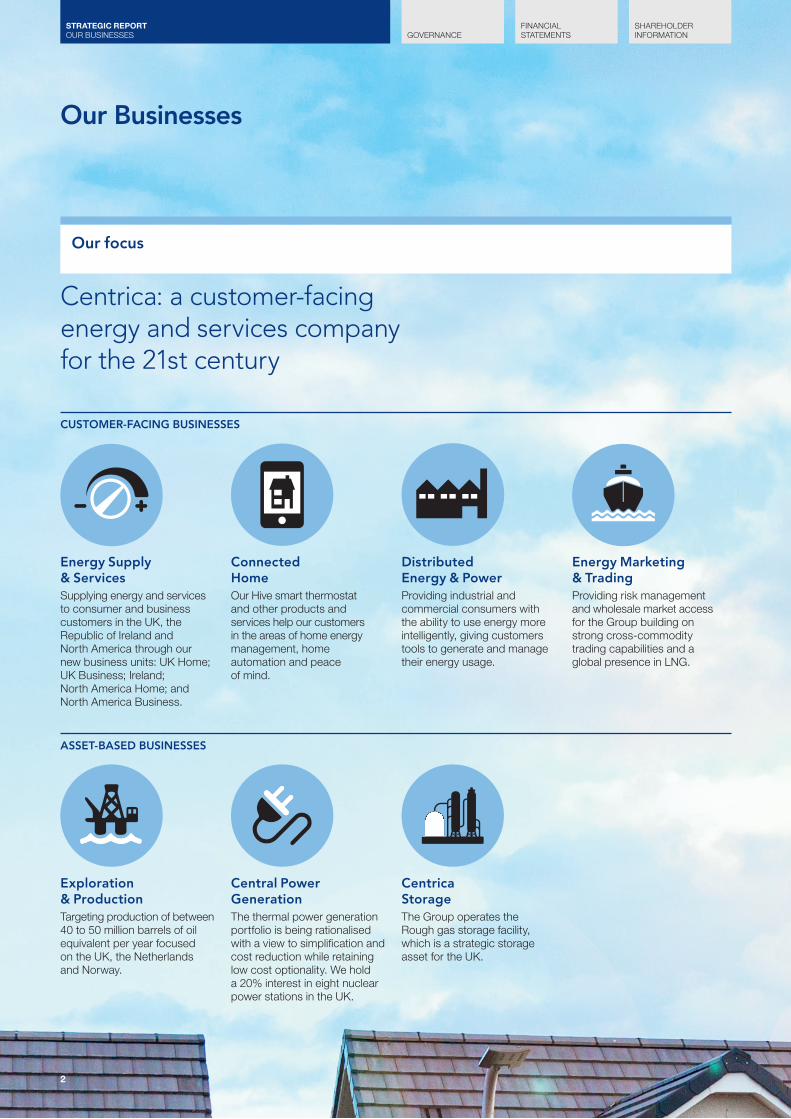
Our Businesses
Centrica: a customer-facing energy and services company for the 21st century
Our focus
CUSTOMER-FACING BUSINESSES
ASSET-BASED BUSINESSES
Energy Supply & ServicesSupplying energy and services to consumer and business customers in the UK, the Republic of Ireland and North America through our new business units: UK Home; UK Business; Ireland; North America Home; and North America Business.
Connected HomeOur Hive smart thermostat and other products and services help our customers in the areas of home energy management, home automation and peace of mind.
Distributed Energy & PowerProviding industrial and commercial consumers with the ability to use energy more intelligently, giving customers tools to generate and manage their energy usage.
Energy Marketing & TradingProviding risk management and wholesale market access for the Group building on strong cross-commodity trading capabilities and a global presence in LNG.
Centrica StorageThe Group operates the Rough gas storage facility, which is a strategic storage asset for the UK.
Exploration & ProductionTargeting production of between 40 to 50 million barrels of oil equivalent per year focused on the UK, the Netherlands and Norway.
Central Power GenerationThe thermal power generation portfolio is being rationalised with a view to simplification and cost reduction while retaining low cost optionality. We hold a 20% interest in eight nuclear power stations in the UK.
Centrica plc Annual Report and Accounts 2016 3
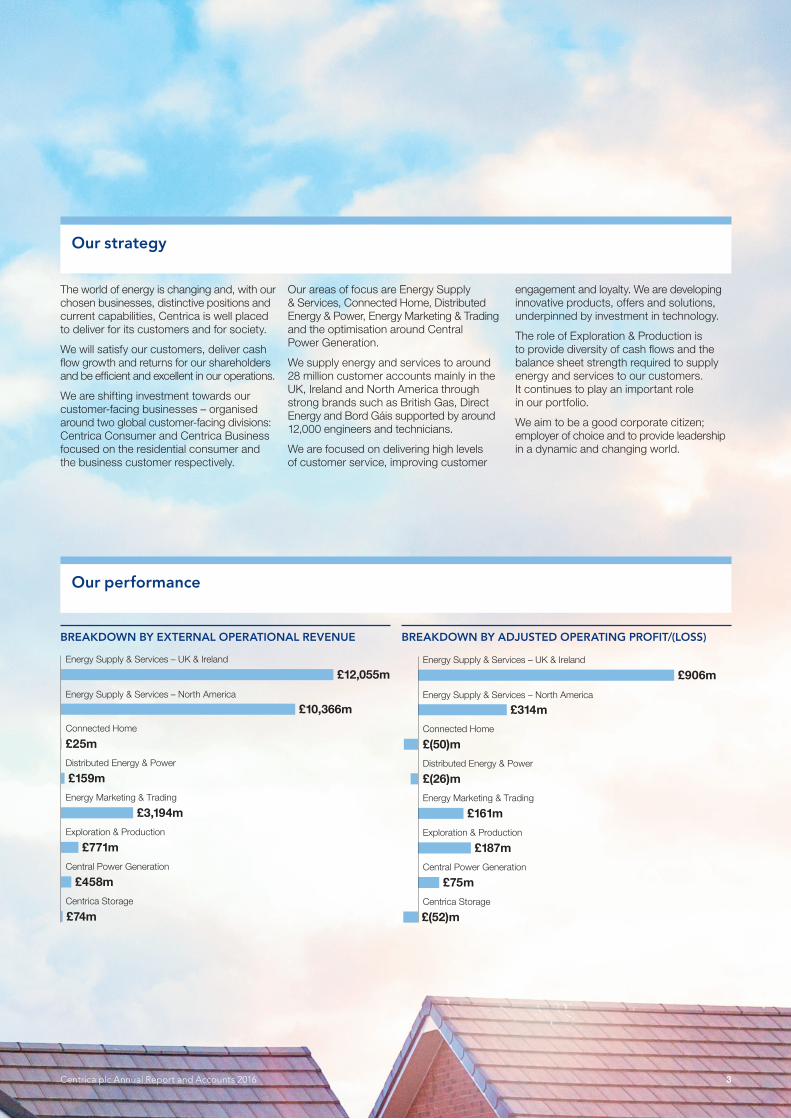
BREAKDOWN BY EXTERNAL OPERATIONAL REVENUE
Energy Supply & Services – UK & Ireland
Energy Supply & Services – North America
Connected Home
Distributed Energy & Power
Energy Marketing & Trading
Central Power Generation
Centrica Storage
£12,055m
£10,366m
£25m
£159m
£3,194m
£771m
£458m
£74m
Exploration & Production
BREAKDOWN BY ADJUSTED OPERATING PROFIT/(LOSS)
£906m
£314m
£(50)m
£(26)m
£161m
£187m
£75m
£(52)m
Energy Supply & Services – UK & Ireland
Energy Supply & Services – North America
Connected Home
Distributed Energy & Power
Energy Marketing & Trading
Central Power Generation
Centrica Storage
Exploration & Production
Our performance
BREAKDOWN BY EXTERNAL OPERATIONAL REVENUE BREAKDOWN BY ADJUSTED OPERATING PROFIT/(LOSS)
The world of energy is changing and, with our chosen businesses, distinctive positions and current capabilities, Centrica is well placed to deliver for its customers and for society.
We will satisfy our customers, deliver cash flow growth and returns for our shareholders and be efficient and excellent in our operations.
We are shifting investment towards our customer-facing businesses – organised around two global customer-facing divisions: Centrica Consumer and Centrica Business focused on the residential consumer and the business customer respectively.
Our areas of focus are Energy Supply & Services, Connected Home, Distributed Energy & Power, Energy Marketing & Trading and the optimisation around Central Power Generation.
We supply energy and services to around 28 million customer accounts mainly in the UK, Ireland and North America through strong brands such as British Gas, Direct Energy and Bord Gáis supported by around 12,000 engineers and technicians.
We are focused on delivering high levels of customer service, improving customer
engagement and loyalty. We are developing innovative products, offers and solutions, underpinned by investment in technology.
The role of Exploration & Production is to provide diversity of cash flows and the balance sheet strength required to supply energy and services to our customers. It continues to play an important role in our portfolio.
We aim to be a good corporate citizen; employer of choice and to provide leadership in a dynamic and changing world.
Our strategy

4
GOVERNANCEFINANCIAL STATEMENTS
SHAREHOLDER INFORMATION
STRATEGIC REPORT CHAIRMAN’S STATEMENT
2016 was an extremely challenging year in which Centrica met or beat its targets whilst, importantly, underpinning discipline throughout the organisation on key matters of safety, ethics and compliance.
The impact has been broad with financial delivery, organisational transformation, process efficiency, cash flow and strategic implementation all showing distinct progress. The business re-orientation has been very radical with a particular emphasis on finding ways to enable our people and technology to better understand and serve the changing energy needs of our customers on both sides of the Atlantic.
This process of reshaping Centrica has not been easy or comfortable for our own people and I would like to pay tribute to and thank everyone for their hard work and resilience during the year. Throughout this process, Iain Conn has shown firm, imaginative and decisive leadership. He has chosen his senior team wisely and led them intelligently. They too deserve credit for their performance.
Despite the improvement in our financial position, we took the decision not to resume a progressive dividend policy at this stage. This was a finely weighted judgement. But, in these uncertain times, we would rather err on the side of prudence as further work still needs to be done on strengthening the balance sheet and returning the business to growth.
Our growth plans are clearly shaped with the shift in investment intensity from the resource businesses towards the customer, supporting a focus on building our growth businesses such as Distributed Energy & Power, Connected Home, and Energy Marketing & Trading. We are committed to investing in these businesses, positioning ourselves to compete successfully in a fast-moving, attractive and aggressive environment. We continuously ask ourselves the question ‘What will it take to be a winner?’ in this new world, and always seek to act to improve our probability of success by adapting our capabilities, technologies and governance as required.
We made strides in 2016, but we are far from satisfied. Our objective is not simply a return to profitable growth for the benefit of our investors, important though that is. Rather we are driven by an over-arching aspiration to become a truly great company.
What does that require, in our view?
Great companies meet a need that is valued by customers and society. And, in doing so, they benefit their shareholders as well as wider stakeholders, including employees,
suppliers, partners and communities. And, the most important stakeholder of them all, our customers for whom our clear, resurrected purpose is unequivocally in service; a purpose that seeks to bring a contemporary relevance to a set of values rooted in our 205-year history. And, in that purpose, we are making progress.
Great companies are places where people worry more about what is not working than what is.
Customer complaints are down. But your Board and executive leadership regard any complaint as one too many. Efficiency has improved. But we have suffered a decline in employee engagement. Affordability has improved. But our customers live in a world where incomes continue to be squeezed. And so, we are more consumed by how far we still have to travel than by the distance travelled thus far.
Great companies are places where people think like owners and entrepreneurs, staying viscerally and intellectually connected with the dynamics of their businesses and the forces that shape the operating context of those businesses. And that context, today, is not easy. Business and wealth creation are terms of disparagement. Many reputations have been damaged by the actions of a few. And the positive impacts of globalisation, new technologies and creative investment have been drowned out by the concomitant growth of social inequality.
Chairman’s Statement
“Reshaping Centrica has not been easy or comfortable for our own people and I would like to pay tribute to and thank everyone for their hard work and resilience during the year.”Rick HaythornthwaiteChairman

Centrica plc Annual Report and Accounts 2016 5
This poor opinion of business is bad for us, for the UK economy and for prosperity in general. So, we are acutely aware that we not only need to reconnect with our customers. We also need to forge a new partnership with government and our other stakeholders, based on mutual understanding and a willingness to work together.
That is why we welcome the Green Papers on Industrial Strategy and Governance recently published by the UK Government. Government has the power to create a constructive context in which businesses can make the investments which the nation needs.
In the end though, it is businesses, through everyday contact with their customers, which can make the biggest and most immediate impact. The source of real economic and social change is at a local, community level. And that is where companies can be very valuable facilitators of change for the better in people’s lives.
Our engineers and technicians visit thousands of customers every week. They are trusted on an individual level to enter people’s homes and meet an immediate need, as well as assessing their overall energy requirements.
Our Hattersley call centre on the outskirts of Manchester specialises in helping hundreds of indebted customers every day to manage their energy bills. Last year the proportion of our customers in debt fell and, among them, the proportion on an agreed repayment plan is well above the industry average.
These are just two examples of how we as a business connect with communities and individuals to effect change on the ground. We are close to the real issues and we can make a difference. And we know that we should do more.
It is in these relationships that trust is born, nurtured and thrives.
And great businesses must be built on a foundation of trust, a quality that is in short supply today.
We are very intent on rebuilding trust in our company and sector.
This requires not only an emotional and physical investment in our relationship with our customers and society but also the addressing of the prevalent impression that UK governance in general is failing, an impression that will render any such investment worthless if untreated.
In fact, there is a strong case to be made that the UK has the best corporate governance framework in the world.
The answer to any breakdowns in UK governance lies not in further embellishment of that framework but in promoting better compliance and a collective commitment to resolve some of the more intractable and sensitive issues over time.
Foremost amongst those issues is executive remuneration, often the lightning rod for criticism of boards. We are making progress over time. Long term executive pay trends are shifting towards more simplicity, lower differentials and internal succession in preference to expensive ‘star signings’ from outside. The responsibility lies with chairs and boards of directors to manage the balance between addressing this perniciously divisive problem and avoiding the unintended consequences that precipitous change, though perhaps politically popular in the short-term, may carry in terms of weakened capabilities and competitiveness. More regulation is unlikely to provide the answer.
In respect of compliance, your Board is continuously seeking ways in which we might better comply with and apply the Code. That must always start with recruiting the best possible directors whose track record speaks to their credentials, wisdom and professional approach. The quality of a board ultimately flows from the sum of these attributes; perhaps the setting and policing of standards in this key determinant of good governance holds the key to improving global standards rather than further embellishment of the Code.
We have worked to enhance our governance structures and processes throughout the year. Full details of this activity is set out in the Governance section on pages 65 to 82, but it is the ongoing, deliberate refreshing of your Centrica Board that holds the key.
During the year, we reviewed the succession plans in place for the Board and the Executive. We identified digital, retail, North America and financial services as areas of business experience and expertise where the recruitment of new Board members could complement the strengths of our existing Board. We also paid heed to the public concerns about the extent to which the voices of customers and employees were being heard in the boardroom, bolstering our agendas and approaches were necessary.
There were several changes to composition of the Board. In June, Stephen Hester was appointed as a Director of the company and, in October, he succeeded Ian Meakins as Senior Independent Director. Stephen has wide-ranging commercial experience, particularly in customer-facing businesses.
In addition, he brings a broad understanding of financial services, together with a deep knowledge of operating within highly regulated businesses. I would like to thank Ian for the great contribution he has made in his six years’ service on the Board.
Scott Wheway joined the Board in May. Scott has a wealth of experience as a senior customer-facing business leader with a mix of deep retail and consumer expertise. He is also a seasoned remuneration committee chair and will assume that role for Centrica following the 2017 AGM. Joan Gillman was appointed as a Non-Executive Director in October. Joan is former executive vice president of Time Warner Cable, the second largest cable company in the United States, and has wide experience in media, communications and the shaping of network technology strategies. Scott and Joan are both valuable additions to the Board and are already making their contributions felt.
During 2016, the Centrica leadership did a great deal to put in place the diverse teams, structure and technology required to underpin our growth and give us a competitive advantage in our chosen markets. Centrica has moved a long way in 12 months. We may have ‘What does it take to be great?’ as a constant challenge but equally we never lose sight of the question ‘What do we have to do to make a difference now and make this future possible?’ It is thanks to this healthy combination of aspiration and practical application amongst our executive team that your Board looks to the future with growing confidence.
Rick HaythornthwaiteChairman23 February 2017
“In the end though, it is businesses, through everyday contact with their customers, which can make the biggest and most immediate impact.”
6
GOVERNANCEFINANCIAL STATEMENTS
SHAREHOLDER INFORMATION
STRATEGIC REPORT GROUP CHIEF EXECUTIVE’S STATEMENT
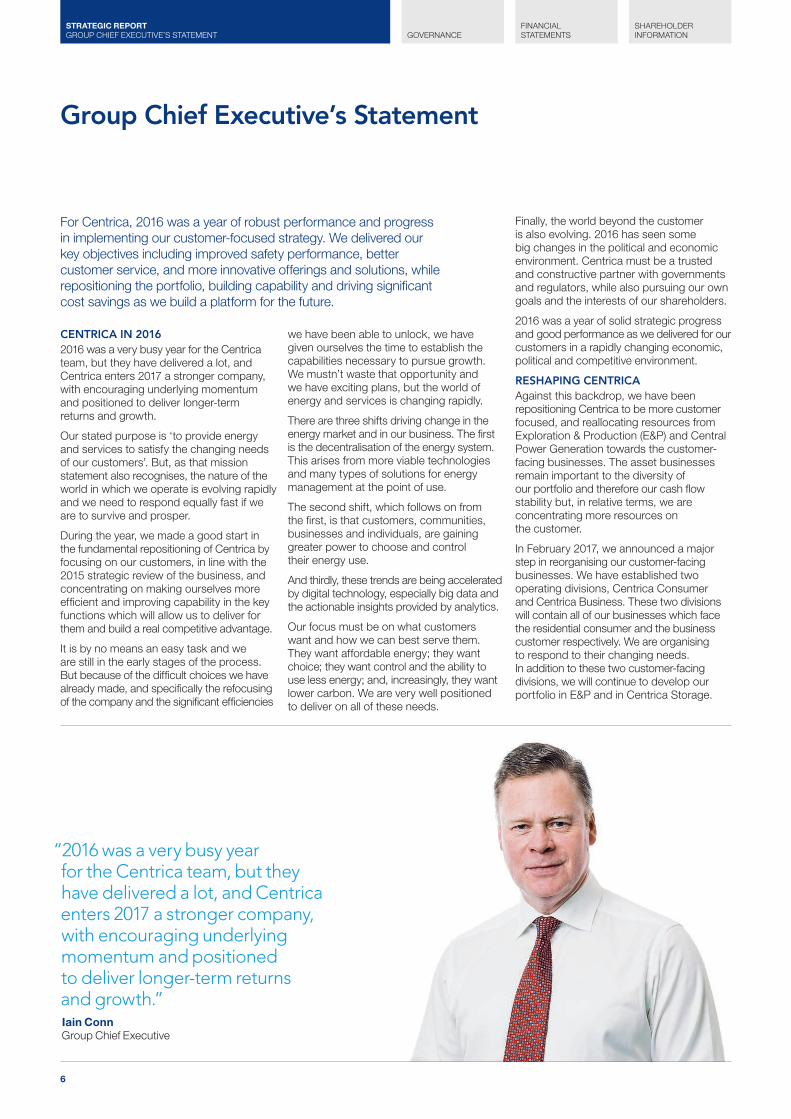
CENTRICA IN 20162016 was a very busy year for the Centrica team, but they have delivered a lot, and Centrica enters 2017 a stronger company, with encouraging underlying momentum and positioned to deliver longer-term returns and growth.
Our stated purpose is ‘to provide energy and services to satisfy the changing needs of our customers’. But, as that mission statement also recognises, the nature of the world in which we operate is evolving rapidly and we need to respond equally fast if we are to survive and prosper.
During the year, we made a good start in the fundamental repositioning of Centrica by focusing on our customers, in line with the 2015 strategic review of the business, and concentrating on making ourselves more efficient and improving capability in the key functions which will allow us to deliver for them and build a real competitive advantage.
It is by no means an easy task and we are still in the early stages of the process. But because of the difficult choices we have already made, and specifically the refocusing of the company and the significant efficiencies
we have been able to unlock, we have given ourselves the time to establish the capabilities necessary to pursue growth. We mustn’t waste that opportunity and we have exciting plans, but the world of energy and services is changing rapidly.
There are three shifts driving change in the energy market and in our business. The first is the decentralisation of the energy system. This arises from more viable technologies and many types of solutions for energy management at the point of use.
The second shift, which follows on from the first, is that customers, communities, businesses and individuals, are gaining greater power to choose and control their energy use.
And thirdly, these trends are being accelerated by digital technology, especially big data and the actionable insights provided by analytics.
Our focus must be on what customers want and how we can best serve them. They want affordable energy; they want choice; they want control and the ability to use less energy; and, increasingly, they want lower carbon. We are very well positioned to deliver on all of these needs.
Finally, the world beyond the customer is also evolving. 2016 has seen some big changes in the political and economic environment. Centrica must be a trusted and constructive partner with governments and regulators, while also pursuing our own goals and the interests of our shareholders.
2016 was a year of solid strategic progress and good performance as we delivered for our customers in a rapidly changing economic, political and competitive environment.
RESHAPING CENTRICAAgainst this backdrop, we have been repositioning Centrica to be more customer focused, and reallocating resources from Exploration & Production (E&P) and Central Power Generation towards the customer-facing businesses. The asset businesses remain important to the diversity of our portfolio and therefore our cash flow stability but, in relative terms, we are concentrating more resources on the customer.
In February 2017, we announced a major step in reorganising our customer-facing businesses. We have established two operating divisions, Centrica Consumer and Centrica Business. These two divisions will contain all of our businesses which face the residential consumer and the business customer respectively. We are organising to respond to their changing needs. In addition to these two customer-facing divisions, we will continue to develop our portfolio in E&P and in Centrica Storage.
For Centrica, 2016 was a year of robust performance and progress in implementing our customer-focused strategy. We delivered our key objectives including improved safety performance, better customer service, and more innovative offerings and solutions, while repositioning the portfolio, building capability and driving significant cost savings as we build a platform for the future.
“2016 was a very busy year for the Centrica team, but they have delivered a lot, and Centrica enters 2017 a stronger company, with encouraging underlying momentum and positioned to deliver longer-term returns and growth.”Iain ConnGroup Chief Executive
Group Chief Executive’s Statement

Centrica plc Annual Report and Accounts 2016 7
If we are to grow the business and enter new markets, we need to get our basic level of effectiveness right. So, we have tackled duplications and inefficiencies and we will continue the journey to simplify and standardise how Centrica works. Altogether, our reorganisation programme has so far required a direct like-for-like headcount reduction of around 3,000.
I recognise the significant challenges faced by colleagues over the last two years. The Centrica team has performed very well in extremely difficult circumstances. But we are now more resilient and adaptable to the external environment and all the internal changes we have made are aligned to achieving the purpose and strategic goals of the Group. We are now in a much stronger position to deliver for our customers, deliver for our shareholders and ultimately deliver for our own employees.
SAFETYAs we reposition the business, our overriding priority remains safety, compliance and conduct. If we don’t get this right, we won’t be able to execute all our other plans. Last year we saw a big improvement in customer safety, with the number of incidents falling by a quarter. Recordable and lost time injury frequency rates among our own people also fell. Sadly, however, one of our partner engineers was in a road accident in which they tragically died. One incident like this is one too many. We continue to focus on building safety capability with our people through effective communication and training. We also pay close attention to compliance and the relationships with all our regulators.
SERVING OUR CUSTOMERSWe must ensure we satisfy our customers and deliver operational excellence every day. To this end, we are investing £50 million in improving customer service, we have taken on more call centre advisers and we have increased the number of their training days. We try to make sure that our customers can always speak to someone who truly understands their needs.
Our continued focus and investment in customer service has resulted in higher net promoter scores and significantly lower complaint levels across our UK, Ireland and North America customer-facing businesses.
We aim to be clear and competitive on bills and pricing. We committed to freeze our standard tariff, one of the cheapest on the market, for the entire Winter 2016/17 period. We have since extended this freeze until August 2017 just as other providers
are putting their prices up. Bord Gáis Energy also cut household gas and electricity costs by 2.5% and 5% respectively, making it the only supplier in Ireland to have reduced prices three times since February 2015.
HUMAN CAPABILITYCentrica will only grow and prosper if we have the right people and invest in human capability across the company. Regrettably, but understandably in the light of our restructuring, we suffered a decline in employee engagement last year. We’re committed to change that and foster an engaged, diverse and inclusive workforce which will help us to better understand the changing needs of our customers.
We pay at least the Living Wage to all our UK employees and we continue to train thousands of British Gas engineers and apprentices every year. We are also diversifying our talent pool through the Movement to Work scheme which helps young, unemployed people secure the skills they need for the workplace. Since 2014, we have provided 700 training placements, of which 60% gained permanent employment. As a whole, along with our partner organisations, Movement to Work has trained over 50,000 people and 54% of them have secured some form of employment in the workplace.
In 2016, we launched Spectrum, our Lesbian, Gay, Bi-Sexual & Transgender Plus (LGBT+) employee network which, together with our networks for women, carers and parents, provides a vital source of support for our people and ensures we listen and get feedback on how we can be more inclusive as an organisation.
Despite all of the organisational change, across the Group we have been focusing on building capability and ensuring we have the processes and tools to compete and serve our customers for the long-term.
You can read more about our people and some of their stories on pages 32 to 35 of the Annual Report.
TECHNOLOGY & INNOVATIONReshaping the business is not simply about efficiency and structure, it is also about building new capabilities for the future. And here we laid some strong foundations in 2016.
We are working hard to understand what our customers want and to develop new technology and services to provide it. We are pioneers of the Connected Home. In the UK, we have over half a million users
“We must ensure we satisfy our customers and deliver operational excellence every day. To this end, we are investing £50 million in improving customer service, we have taken on more call centre advisers and we have increased the number of their training days. We try to make sure that our customers can always speak to someone who truly understands their needs.”
2016
2017
Key Events in 2016
8
GOVERNANCEFINANCIAL STATEMENTS
SHAREHOLDER INFORMATION
STRATEGIC REPORT GROUP CHIEF EXECUTIVE’S STATEMENT
Group Chief Executive’s Statement continued
of our Hive connected hub. Hive customers can now use voice control, through Amazon’s Alexa Voice Service, and Hive products are also being sold in North America.
Our customers are seeing tangible benefits. Our HomeEnergy FreeTime tariff for smart meter customers provides free electricity 9.00am – 5.00pm on a Saturday or Sunday, which can save an estimated £60 per year. And our Boiler IQ offering provides early warning of faults with heating or hot water.
Our Distributed Energy & Power (DE&P) business has been boosted by a first full year’s contribution from Panoramic Power, a leading provider of wireless, device-level management solutions, which is helping our business customers to take control of their energy by giving them the tools to monitor, operate and optimise their own assets. Distributed energy is growing, altering the traditional supply model, and increasingly consumers are becoming ‘prosumers’, generating their own energy.
We have made strategic, value-creating additions to our technological capability. Last year we acquired Flowgem, which specialises in water leak detection; Neas Energy, a leading Danish provider of energy management and optimisation services for decentralised and renewable assets; and ENER-G Cogen, an established supplier and operator of Combined Heat & Power.
This year we will start a pioneering £19 million trial in Cornwall, which will see the creation of a virtual marketplace to buy and sell energy locally and the installation of new technology in over 150 homes and businesses. You can read more about it in one of our Case Studies on pages 12 and 13 of this Annual Report.
Innovation is a key driver of growth. That is why we have announced the formation of a new unit, Centrica Innovations (CI), to focus our efforts in this area and act as an incubator and accelerator of new ventures. The team will be small, agile and outward looking, drawing on experience from our own businesses, other companies, start-ups and entrepreneurs.
We plan to invest £20 million a year over the next five years (2017 to 2021) (up to £100 million in total) in CI. Our existing Ignite £10 million social enterprise investment fund will become part of the new CI unit.
Find out more about some of our ground-breaking products and services in the Technology & Innovation section on pages 10 and 11 of the Annual Report.
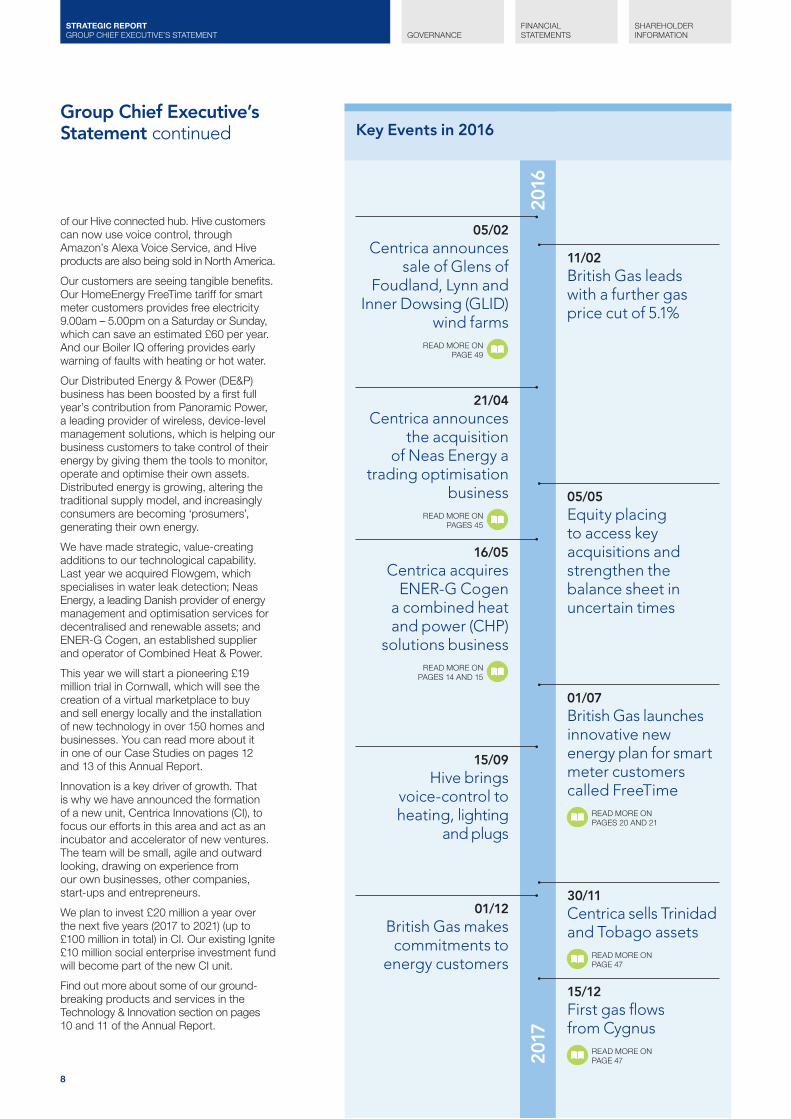
11/02British Gas leads with a further gas price cut of 5.1%
05/05Equity placing to access key acquisitions and strengthen the balance sheet in uncertain times
01/07British Gas launches innovative new energy plan for smart meter customers called FreeTime
READ MORE ON PAGES 20 AND 21
30/11Centrica sells Trinidad and Tobago assets
READ MORE ON PAGE 47
15/12First gas flows from Cygnus
READ MORE ON PAGE 47
21/04 Centrica announces
the acquisition of Neas Energy a
trading optimisation business
READ MORE ON
PAGES 45
16/05 Centrica acquires
ENER-G Cogen a combined heat and power (CHP)
solutions business READ MORE ON
PAGES 14 AND 15
05/02 Centrica announces
sale of Glens of Foudland, Lynn and
Inner Dowsing (GLID) wind farms
READ MORE ON
PAGE 49
15/09 Hive brings
voice-control to heating, lighting
and plugs
01/12 British Gas makes commitments to
energy customers
Centrica plc Annual Report and Accounts 2016 9
As far as the UK’s withdrawal from the EU is concerned, many details of the implementation process remain unclear. Extricating ourselves from all the European treaties is a task of immense complexity. But I hope that, despite the difficulties ahead, the UK will find a pragmatic way to deal with the issues, and Centrica is well-positioned to manage any market impacts.
Our focus continues to be understanding what the result means for energy and other business regulations. As the UK is now a major energy importer, what happens in the European energy market will ultimately affect the price consumers in the UK pay for their energy. We will continue to engage with the UK Government and the European Commission as they move towards a resolution.
A strong and open trading relationship with the US is vital if we are to continue to prosper as a nation and a business. Free trade is fundamental to global prosperity and to the efficient functioning of international markets. It is important for the UK and the US to maintain transatlantic alignment on markets and regulation, so as to minimise distortions and to safeguard the access which businesses need.
US climate change policy is now in a state of flux. In the UK, we continue to support the Government’s policy aims of decarbonisation, security of supply and affordability. We are not a passive partner. In fact, our focus on customers, in providing them with more insight and more tools with which to use less energy and to have more choice to produce, store and save it, means we are a major enabler of the response to climate change.
We welcome the publication of the UK Government’s industrial strategy. This represents a unique opportunity to forge a new partnership between businesses and the Government; a partnership where the Government focuses on creating the conditions for businesses of all sizes to grow and flourish across the UK; and where businesses invest to upgrade our economy for a post-Brexit world.
But the Government must also take the lead in tackling one of the major burdens on the UK economy: productivity. The UK lags US and German labour productivity by 30 percentage points, France by over 25 and Italy by nine. To tackle this, we need to upgrade our economy by investing in infrastructure, jobs, skills and technology. We intend to play our part at Centrica.
2016 brought greater clarity on the regulatory front, with the Competition and Markets Authority (CMA) publishing the final report
on its investigation into the UK energy market and the UK Government confirming reforms to the UK Capacity Market.
We have supported the CMA investigation throughout the process, even when we disagreed with some of its conclusions, and we are now actively implementing its remedies. Changes to Retail Market Reform rules, especially the increase in the number of tariffs we can offer, will also allow us to provide more choice for our UK Home customers.
The proposed reforms to the UK Capacity Market will bring on more generating capacity earlier than planned and improve the return to investors. Three of our new distributed energy projects and the replant of our Kings Lynn A power station all cleared the capacity market auction in December, in addition to our existing Langage, Humber and Brigg gas-fired power stations and the UK nuclear fleet.
OUTLOOKCentrica made significant progress and delivered robust performance in 2016. We delivered our key objectives while repositioning the portfolio, improving capability and driving significant cost synergies as we build a platform for the future.
Looking ahead, we are confident that the trends we have identified are the right ones and our response ensures we are well positioned to compete and deliver for our customers. We will place increasing emphasis on developing and delivering new products and services for our customers and turn our eyes more to growth in a complex world.
We will continue to concentrate on:
• High standards of safety, compliance and conduct;
• Customer satisfaction and operational excellence;
• Cash flow growth and strategic momentum;• Cost efficiency and simplification; and• People and building capability.
We will continue to strengthen the company and to pay an attractive level of dividends to our shareholders.
Through all of this, we will be able to deliver for our customers, for our employees, and for our shareholders.
Iain ConnGroup Chief Executive23 February 2017
PERFORMANCEOperationally, against a background of weak commodity prices, 2016 marked a distinct improvement on the previous year. In a highly competitive market we delivered new customer offers in energy supply and services and were very focused on improving our service levels. Home energy accounts in the UK were broadly flat in the second half, UK Business continued to deliver strong capital inflows, and North America Energy Supply & Services recovered well from a warm first half of the year.
We made progress in reducing the scale of our asset businesses and in simplifying the portfolio. We have now completed our exit from wind power generation, while in E&P we announced the divestment of our Trinidad and Tobago assets. We are targeting the sale of our Canadian E&P assets this year.
In 2016 the Group’s financial performance was robust. Adjusted operating profit and earnings were both up 4%, with adjusted earnings per share of 16.8p. Adjusted operating cash flow was up 19% to £2.7 billion, significantly in excess of our 3–5% per annum target from 2015 to 2020 and providing strong underpinnings to that objective. Correcting for one-off working capital inflows and for changes in commodity prices between years, underlying adjusted operating cash flow growth was 14%.
We delivered savings of £384 million as part of the Group’s cost efficiency programme, which aims to save £750 million a year by 2020. Organic capital investment came in below the £1 billion limit we set, at around £850 million.
Our net debt was 27% lower at the end of 2016, coming in at £3.47 billion, reflecting a strong cash focus and capital discipline. We have strengthened our balance sheet, and our own sources and uses of cash continue to be more than balanced.
RESPONDING TO CHANGING TIMES2016 was the year which upset political orthodoxies on both sides of the Atlantic. As an international business, Centrica is not a passive spectator of these events. They affect us and we must manage through them, making an active response to changing and complex issues.
The UK referendum vote in June to leave the European Union and the outcome of the United States Presidential election in November have added to the uncertainties faced by businesses. However, we believe the direct impact on Centrica and Direct Energy specifically of these events is limited in the short term.
10
GOVERNANCEFINANCIAL STATEMENTS
SHAREHOLDER INFORMATION
STRATEGIC REPORT TECHNOLOGY AND INNOVATION
We see the home as a focal point of technology-enabled services where a wide range of providers from different sectors are competing to integrate devices, service and data into a customer-oriented ecosystem.
Big data and technology advancements and innovation also have the potential to radically change the way that businesses interact with energy. They can use sophisticated, granular data to understand how to run their machines more efficiently, saving both money and energy.
This is why our focus on technology and innovation is so important. The rapid pace of change and growing digital disruption in the global energy sector are altering the way we work.
BUILDING TECHNICAL CAPABILITY TO ACHIEVE COMPETITIVE ADVANTAGEWe can only achieve competitive advantage by developing and delivering new technology-based products, offerings and solutions to residential and business customers at a competitive cost.
We have set up Centrica Innovations, a new venture to ensure Centrica identifies opportunities and is aligned to new technology that will benefit our customers. We will invest up to £20 million a year over the next five years in start-ups – up to £100 million in total – giving us access to technology and entrepreneurial resources.
We will have people scanning key technology hubs around the world – in Seattle, Houston, London, Cambridge and Tel Aviv – putting us at the forefront of the latest innovations and integrating learnings within the Group.
Centrica Innovations will also support existing in-house ventures, such as Local Heroes, our digital on-demand services proposition. It will act as an incubator for external ventures which are not yet at a maturity level for investment and require different types of support, for example, business expertise, mentoring or product piloting.
Our existing Technology & Engineering (T&E) function, established in January 2016, further strengthens our capability in this area by acting as a catalyst for innovation.
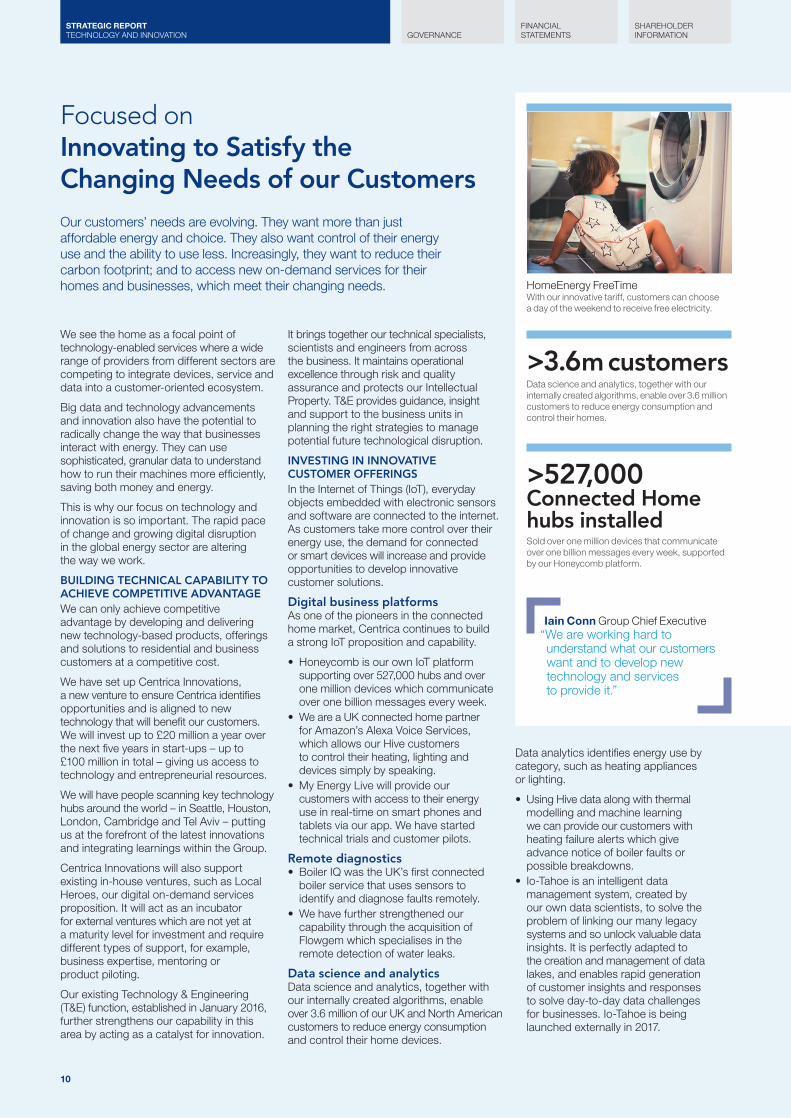
Our customers’ needs are evolving. They want more than just affordable energy and choice. They also want control of their energy use and the ability to use less. Increasingly, they want to reduce their carbon footprint; and to access new on-demand services for their homes and businesses, which meet their changing needs.
Focused on Innovating to Satisfy the Changing Needs of our Customers
It brings together our technical specialists, scientists and engineers from across the business. It maintains operational excellence through risk and quality assurance and protects our Intellectual Property. T&E provides guidance, insight and support to the business units in planning the right strategies to manage potential future technological disruption.
INVESTING IN INNOVATIVE CUSTOMER OFFERINGSIn the Internet of Things (IoT), everyday objects embedded with electronic sensors and software are connected to the internet. As customers take more control over their energy use, the demand for connected or smart devices will increase and provide opportunities to develop innovative customer solutions.
Digital business platformsAs one of the pioneers in the connected home market, Centrica continues to build a strong IoT proposition and capability.
• Honeycomb is our own IoT platform supporting over 527,000 hubs and over one million devices which communicate over one billion messages every week.
• We are a UK connected home partner for Amazon’s Alexa Voice Services, which allows our Hive customers to control their heating, lighting and devices simply by speaking.
• My Energy Live will provide our customers with access to their energy use in real-time on smart phones and tablets via our app. We have started technical trials and customer pilots.
Remote diagnostics• Boiler IQ was the UK’s first connected
boiler service that uses sensors to identify and diagnose faults remotely.
• We have further strengthened our capability through the acquisition of Flowgem which specialises in the remote detection of water leaks.
Data science and analyticsData science and analytics, together with our internally created algorithms, enable over 3.6 million of our UK and North American customers to reduce energy consumption and control their home devices.
Data analytics identifies energy use by category, such as heating appliances or lighting.
• Using Hive data along with thermal modelling and machine learning we can provide our customers with heating failure alerts which give advance notice of boiler faults or possible breakdowns.
• Io-Tahoe is an intelligent data management system, created by our own data scientists, to solve the problem of linking our many legacy systems and so unlock valuable data insights. It is perfectly adapted to the creation and management of data lakes, and enables rapid generation of customer insights and responses to solve day-to-day data challenges for businesses. Io-Tahoe is being launched externally in 2017.
HomeEnergy FreeTimeWith our innovative tariff, customers can choose a day of the weekend to receive free electricity.
>527,000 Connected Home hubs installedSold over one million devices that communicate over one billion messages every week, supported by our Honeycomb platform.
>3.6mcustomersData science and analytics, together with our internally created algorithms, enable over 3.6 million customers to reduce energy consumption and control their homes.
Iain Conn Group Chief Executive“We are working hard to understand what our customers want and to develop new technology and services to provide it.”

Centrica plc Annual Report and Accounts 2016 11
Smart metering• Time-of-use tariffs create dynamic
and flexible time-based energy pricing for our smart customers. HomeEnergy FreeTime is one of the first time-of-use tariffs giving customers one free day of electricity use every weekend.
• We have improved payment channels for our smart prepayment customers. The introduction of interactive voice response, app vending, online top ups and phone payments now provide our smart prepayment customers with additional payment options.
• Our smart customers are able to switch from credit to prepayment methods without a physical meter exchange.
Digital servicesAs part of our focus on transforming the digital customer experience, we have launched Local Heroes, a technology platform for on-demand home services. Customers are able to book one-off home repairs online and benefit from services delivered by local traders and backed by a British Gas guarantee.
INNOVATING AND DEVELOPING FUTURE ENERGY SYSTEMSAdvanced machine learning algorithms analyse energy consumption data collected by Panoramic Power’s wireless and self-powered sensors. This insight allows business-to-business customers to improve significantly their energy and operational efficiency.
The acquisition of Neas Energy was a valuable addition to our Energy Marketing & Trading (EM&T) business. Its renewable energy trading and Virtual Power Plant (VPP) platform allows commercial and industrial customers to connect and aggregate their energy loads and resources, and provides grid services in decentralised electricity markets.
In 2016, we signed a funding agreement to develop a pioneering local energy market in Cornwall. Once complete, participants will use the latest smart technologies to connect to a virtual marketplace allowing them to sell their flexible energy capacity both to the grid and the wholesale energy market.
SEE THE CORNWALL PROJECT CASE STUDY ON PAGE 12
Hive + Amazon EchoGives our Hive customers the ability to control home heating, lights and plugs though the Amazon Alexa voice assistant.
Internet of ThingsBuilding deep technology capability in the home IoT space.
Home services on-demandBook one-off home repairs online.
Boiler IQHelps keeps homes running smoothly with the UK’s first connected home boiler.
My energy liveProvides our customers with access to their energy use in real-time via our app.
Innovative remote leak detectionUses technology to remotely detect water leaks.

12
GOVERNANCEFINANCIAL STATEMENTS
SHAREHOLDER INFORMATION
STRATEGIC REPORT FOCUSED ON PIONEERING A NEW ENERGY FUTURE
Focused on Pioneering a New Energy Future
We’re bringing this to life in the UK with our ground-breaking local energy market trial in Cornwall, testing a new world of flexible demand, generation and storage, and rewarding customers for being more responsive in how and when they use their energy.
Working with partners, the £19 million programme is being funded in part by a £13 million grant from the European Regional Development Fund. The three-year trial will see the installation of new technology, including battery storage and combined heat and power (CHP), in over 150 homes and businesses. Participants will then use the very latest smart technology to connect to a ‘virtual marketplace’ where they will sell their flexible energy capacity to both the electricity grid and the wholesale energy market.
The trial will test a variety of technologies across different users so we can learn how the platform will work in a wide range of
circumstances. We would anticipate that homeowners would typically be looking for us to automate the process as much as possible, while a business might need or want more control.
For example, we might offer a homeowner a new micro-CHP unit that allows them to generate their own energy. We could then automate the process so the unit fires up at peak times of demand on the network and therefore relieves pressure on the grid. Providing this service could secure the householder a payment, resulting in lower energy bills.
On the other hand, a business owner might combine their existing on-site generation such as a back-up generator with a new energy storage unit and choose to make the decision themselves about whether to export any excess energy to the grid and make some money, or store it for use on-site at a later time.
Cornwall has been at the forefront of moves to harness renewable generation. But that has created challenges for the local grid.
Our ambition is to explore how battery storage, together with flexible demand and generation, can reduce pressure on the UK’s electricity grid, avoid expensive network upgrades and support future carbon reduction.
We believe this is a unique opportunity for us to work together with local businesses and homes to open up new avenues which will give consumers more control of their energy, both here in the UK and potentially around the world.
TO FIND OUT MORE GO TO CENTRICA.COM/CORNWALL
Building a local energy market to put homes and businesses in controlCentrica is investing more than £1.2 billion globally to pioneer a new energy future for homes and businesses that will be smarter, greener and cheaper.

Centrica plc Annual Report and Accounts 2016 13
Control Use Save
GOVERNANCEFINANCIAL STATEMENTS
SHAREHOLDER INFORMATION
14
STRATEGIC REPORT FOCUSED ON CUTTING ENERGY COSTS AND CARBON EMISSIONS
Focused on Cutting Energy Costs and Carbon Emissions
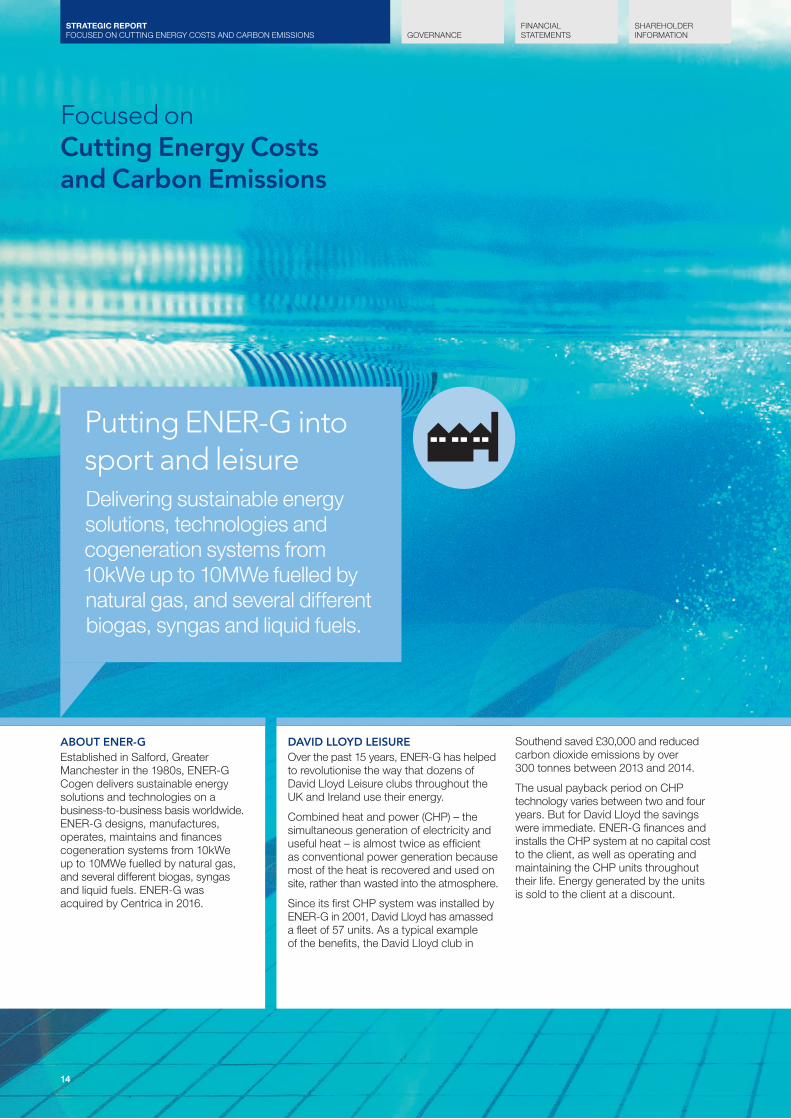
ABOUT ENER-GEstablished in Salford, Greater Manchester in the 1980s, ENER-G Cogen delivers sustainable energy solutions and technologies on a business-to-business basis worldwide. ENER-G designs, manufactures, operates, maintains and finances cogeneration systems from 10kWe up to 10MWe fuelled by natural gas, and several different biogas, syngas and liquid fuels. ENER-G was acquired by Centrica in 2016.
DAVID LLOYD LEISUREOver the past 15 years, ENER-G has helped to revolutionise the way that dozens of David Lloyd Leisure clubs throughout the UK and Ireland use their energy.
Combined heat and power (CHP) – the simultaneous generation of electricity and useful heat – is almost twice as efficient as conventional power generation because most of the heat is recovered and used on site, rather than wasted into the atmosphere.
Since its first CHP system was installed by ENER-G in 2001, David Lloyd has amassed a fleet of 57 units. As a typical example of the benefits, the David Lloyd club in
Southend saved £30,000 and reduced carbon dioxide emissions by over 300 tonnes between 2013 and 2014.
The usual payback period on CHP technology varies between two and four years. But for David Lloyd the savings were immediate. ENER-G finances and installs the CHP system at no capital cost to the client, as well as operating and maintaining the CHP units throughout their life. Energy generated by the units is sold to the client at a discount.
Putting ENER-G into sport and leisureDelivering sustainable energy solutions, technologies and cogeneration systems from 10kWe up to 10MWe fuelled by natural gas, and several different biogas, syngas and liquid fuels.

Centrica plc Annual Report and Accounts 2016 15
Control Use Save
NEWCASTLE UNITED FOOTBALL CLUBIn 2012, Newcastle United was the first football club in the world to become ‘carbon positive’, offsetting more carbon than it emits, and was awarded the prestigious Carbon Trust Standard.
By generating its own low carbon supply of power and heat using an ENER-G CHP system, the club is now reducing its carbon dioxide emissions by a further 390 tonnes per year. This equates to the environmental benefit of removing 130 cars from the road, or the carbon that would be offset by 320 acres of forest, which would cover the area of approximately 160 football pitches.
Installation of the CHP unit was challenging. There were spacing constraints within the existing plant room, which is eight storeys within the fabric of the actual stadium, so ENER-G had to deliver the CHP system in three sections and rebuild it on site.
In partnership with ENER-G, the club has adopted a range of innovative efficiency measures, including boiler optimisation, burner management, lighting upgrades, boreholes for natural pitch irrigation, smart building and energy monitoring and controls, as well as encouraging behavioural changes among the operational staff.
16
GOVERNANCEFINANCIAL STATEMENTS
SHAREHOLDER INFORMATION
STRATEGIC REPORT OUR BUSINESS MODEL
Our Business Model
Focused on our business model
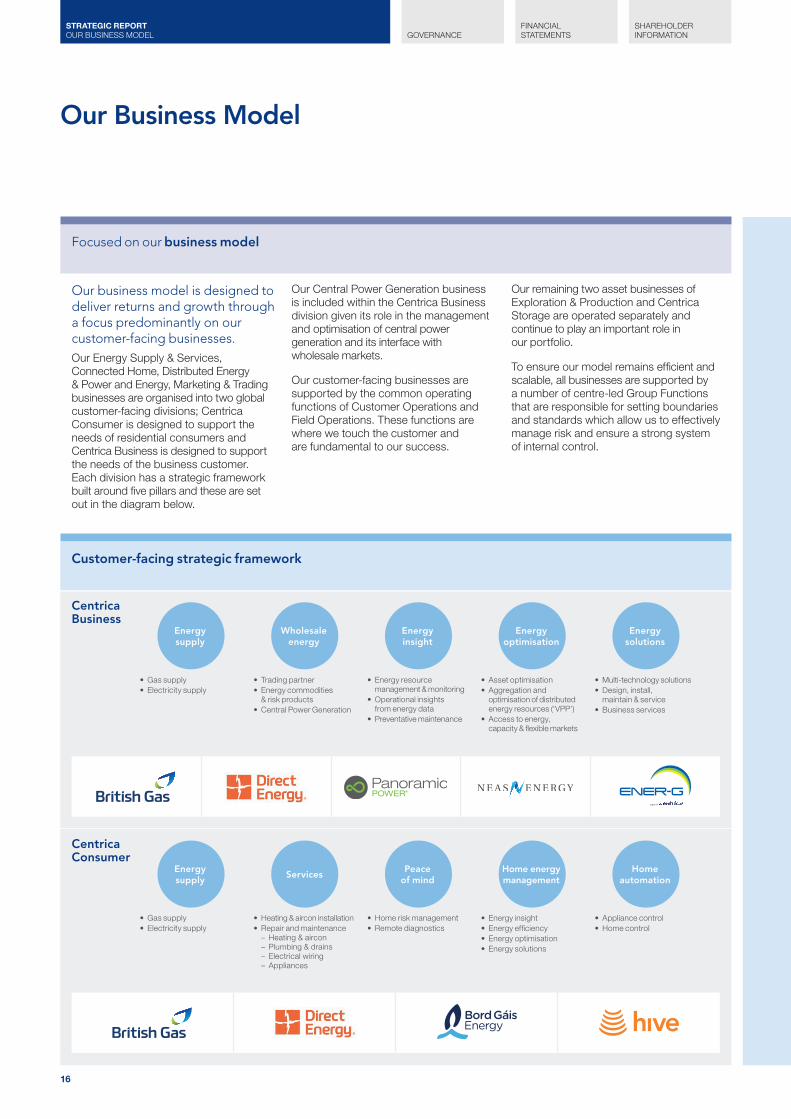
Our business model is designed to deliver returns and growth through a focus predominantly on our customer-facing businesses.Our Energy Supply & Services, Connected Home, Distributed Energy & Power and Energy, Marketing & Trading businesses are organised into two global customer-facing divisions; Centrica Consumer is designed to support the needs of residential consumers and Centrica Business is designed to support the needs of the business customer. Each division has a strategic framework built around five pillars and these are set out in the diagram below.
Our Central Power Generation business is included within the Centrica Business division given its role in the management and optimisation of central power generation and its interface with wholesale markets.
Our customer-facing businesses are supported by the common operating functions of Customer Operations and Field Operations. These functions are where we touch the customer and are fundamental to our success.
Our remaining two asset businesses of Exploration & Production and Centrica Storage are operated separately and continue to play an important role in our portfolio.
To ensure our model remains efficient and scalable, all businesses are supported by a number of centre-led Group Functions that are responsible for setting boundaries and standards which allow us to effectively manage risk and ensure a strong system of internal control.
Customer-facing strategic framework
Centrica Consumer
Centrica Business
Wholesale energy
Energy insight
Energy optimisation
Home automation
Energy supply
• Gas supply• Electricity supply
• Gas supply• Electricity supply
• Energy resource management & monitoring
• Operational insights from energy data
• Preventative maintenance
• Home risk management• Remote diagnostics
• Trading partner• Energy commodities
& risk products• Central Power Generation
• Heating & aircon installation• Repair and maintenance
– Heating & aircon– Plumbing & drains– Electrical wiring– Appliances
• Asset optimisation• Aggregation and
optimisation of distributed energy resources (‘VPP’)
• Access to energy, capacity & flexible markets
• Energy insight• Energy efficiency• Energy optimisation• Energy solutions
• Multi-technology solutions• Design, install,
maintain & service• Business services
• Appliance control• Home control
Energy supply
Energy solutions
Peace of mind
Home energy management
Services
Centrica plc Annual Report and Accounts 2016 17
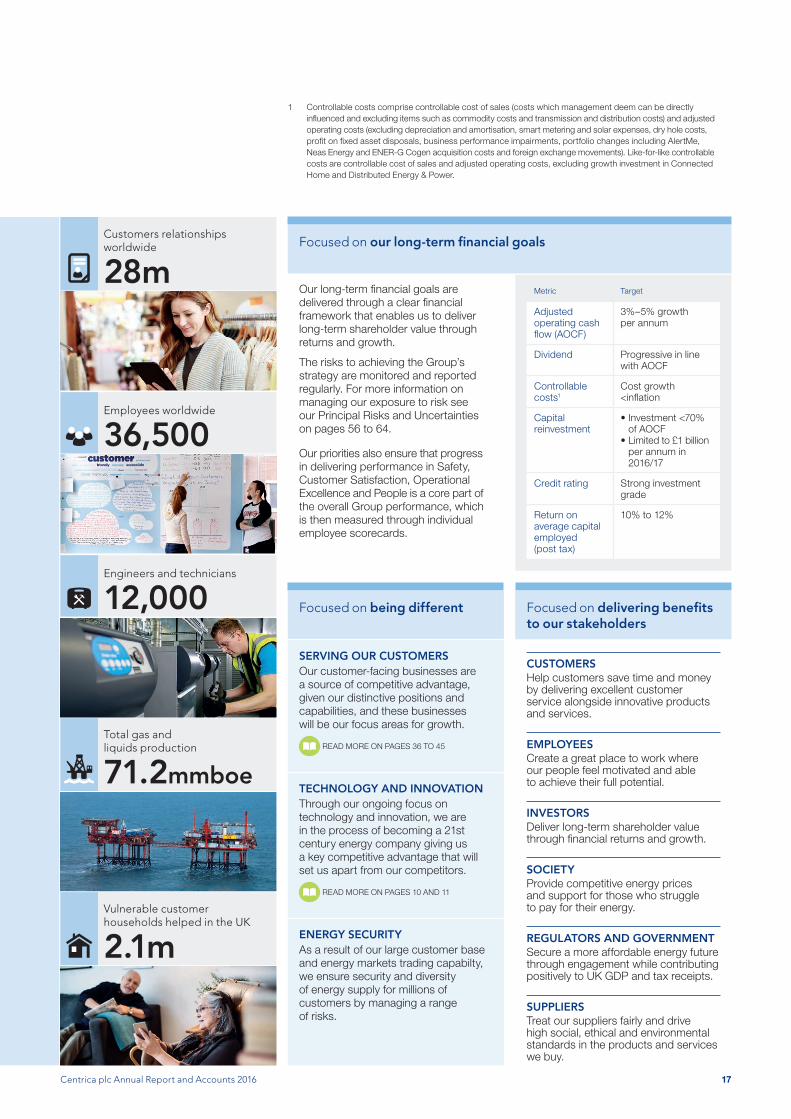
Our long-term financial goals are delivered through a clear financial framework that enables us to deliver long-term shareholder value through returns and growth.
The risks to achieving the Group’s strategy are monitored and reported regularly. For more information on managing our exposure to risk see our Principal Risks and Uncertainties on pages 56 to 64.
Our priorities also ensure that progress in delivering performance in Safety, Customer Satisfaction, Operational Excellence and People is a core part of the overall Group performance, which is then measured through individual employee scorecards.
Metric Target
Adjusted operating cash flow (AOCF)
3%–5% growth per annum
Dividend Progressive in line with AOCF
Controllable costs1
Cost growth <inflation
Capital reinvestment
• Investment <70% of AOCF
• Limited to £1 billion per annum in 2016/17
Credit rating Strong investment grade
Return on average capital employed (post tax)
10% to 12%
Focused on our long-term financial goals
Focused on being different Focused on delivering benefits to our stakeholders
CUSTOMERSHelp customers save time and money by delivering excellent customer service alongside innovative products and services.
EMPLOYEESCreate a great place to work where our people feel motivated and able to achieve their full potential.
INVESTORSDeliver long-term shareholder value through financial returns and growth.
SOCIETYProvide competitive energy prices and support for those who struggle to pay for their energy.
REGULATORS AND GOVERNMENTSecure a more affordable energy future through engagement while contributing positively to UK GDP and tax receipts.
SUPPLIERSTreat our suppliers fairly and drive high social, ethical and environmental standards in the products and services we buy.
SERVING OUR CUSTOMERSOur customer-facing businesses are a source of competitive advantage, given our distinctive positions and capabilities, and these businesses will be our focus areas for growth.
READ MORE ON PAGES 36 TO 45
TECHNOLOGY AND INNOVATIONThrough our ongoing focus on technology and innovation, we are in the process of becoming a 21st century energy company giving us a key competitive advantage that will set us apart from our competitors.
READ MORE ON PAGES 10 AND 11
ENERGY SECURITYAs a result of our large customer base and energy markets trading capabilty, we ensure security and diversity of energy supply for millions of customers by managing a range of risks.
1 Controllable costs comprise controllable cost of sales (costs which management deem can be directly influenced and excluding items such as commodity costs and transmission and distribution costs) and adjusted operating costs (excluding depreciation and amortisation, smart metering and solar expenses, dry hole costs, profit on fixed asset disposals, business performance impairments, portfolio changes including AlertMe, Neas Energy and ENER-G Cogen acquisition costs and foreign exchange movements). Like-for-like controllable costs are controllable cost of sales and adjusted operating costs, excluding growth investment in Connected Home and Distributed Energy & Power.
Customers relationships worldwide
28m
Employees worldwide
36,500
Engineers and technicians
12,000
Total gas and liquids production
71.2mmboe
Vulnerable customer households helped in the UK
2.1m

18
GOVERNANCEFINANCIAL STATEMENTS
SHAREHOLDER INFORMATION
STRATEGIC REPORT KEY PERFORMANCE INDICATORS
2014 18.0p
2015 17.2p
2016 16.8p
60
80
100
120
140
2013 2014 2015 2016
Centrica return indexFTSE 100 return indexSource: Inbucon
2014 £1,657m
2015 £1,459m
2016 £1,515m
2014 £2,201m
2015 £2,253m
2016 £2,686m
Financial KPIs
Key Performance Indicators We monitor our performance by measuring and tracking key performance indicators (KPIs).
Operating profit is one of our fundamental financial priorities. For remuneration purposes, operating profit is adjusted to a post-tax basis and by a charge on capital to set the economic profit performance targets.
Adjusted operating profit was up 4%, driven by good performance in the customer-facing businesses and favourable foreign exchange moves and cost efficiencies.
Adjusted operating cash flow is our key measure of financial performance and is the financial metric for the short-term incentive plan for our Executive Directors.
In 2016, adjusted operating cash flow was up 19% to £2.69 billion.
Link to reward
Long-term incentive
Adjusted operating profit
£1,515m▲ 4%
Link to reward
Short-term incentive
Adjusted operating cash flow
£2,686m▲ 19%
Adjusted operating profitAdjusted operating cash flow
The Board believes that TSR is a valuable KPI to assess the Company’s performance in the delivery of shareholder value.
Centrica underperformed the FTSE 100 return index over the three-year period ending in 2016 by 44%.
EPS is an industry standard determining corporate profitability for shareholders. EPS is adjusted to better reflect the performance of the business.
Reflecting a higher number of shares in issue due to the effects of the scrip dividend and the 7% equity placing in May 2016, adjusted basic EPS was down 2%.
Link to reward
Short and long-term incentive
TSR indices (unaudited)
Link to reward
Long-term incentive
Adjusted EPS
16.8p▼ 2%
Total shareholder return (TSR)Adjusted basic earnings per share (EPS)
Cash flow growth and strategic momentum
Cost efficiency and simplification
Safety, compliance and conduct
Customer satisfaction and operational excellence
People and building capability
OUR FIVE PRIORITIES
Centrica plc Annual Report and Accounts 2016 19
2014 4.79
2015 4.84
2016 4.31
+31
2015 -19
2016
2015 +20
2016
-16
2015 -7
2016 UK & Ireland
North America
UK & Ireland3
North America
2015 N/A
2016 +32
+4
+31
2015 -19
2016
2015 +20
2016
-16
2015 -7
2016 UK & Ireland
North America
UK & Ireland3
North America
2015 N/A
2016 +32
+4
2014 0.28
2015 0.34
2016 0.30
2014
2015 1
2016 2
0
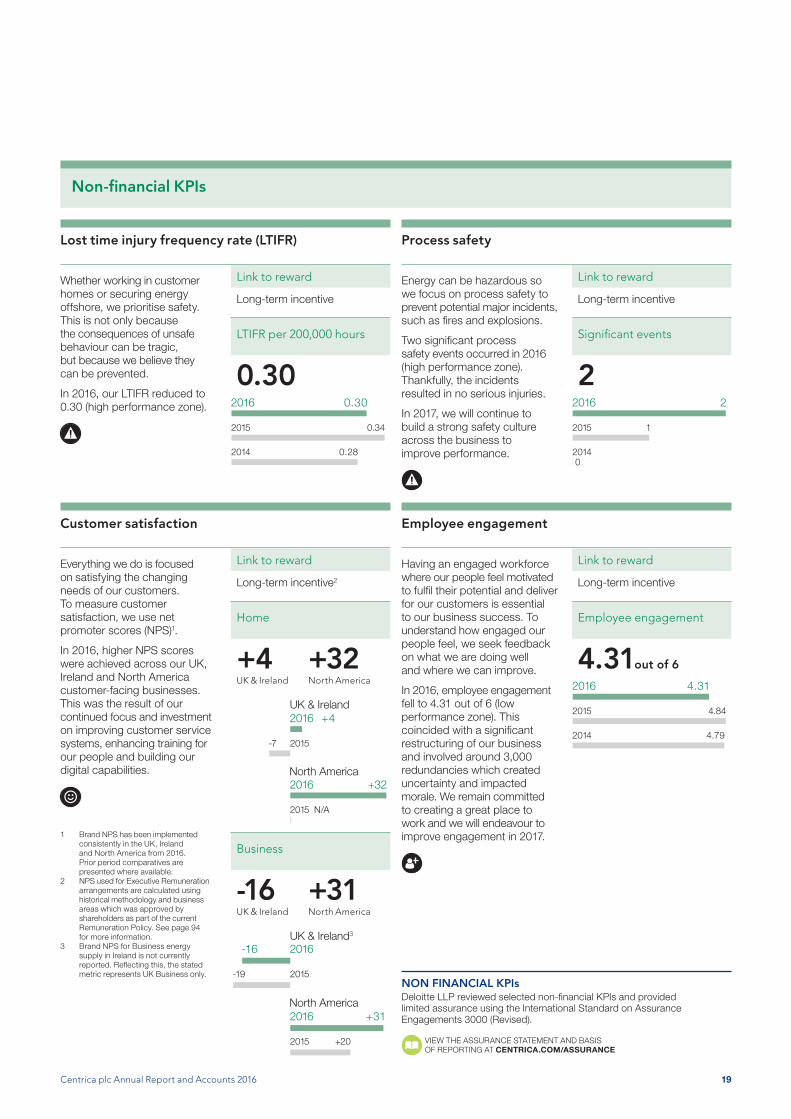
Non-financial KPIs
Whether working in customer homes or securing energy offshore, we prioritise safety. This is not only because the consequences of unsafe behaviour can be tragic, but because we believe they can be prevented.
In 2016, our LTIFR reduced to 0.30 (high performance zone).
Energy can be hazardous so we focus on process safety to prevent potential major incidents, such as fires and explosions.
Two significant process safety events occurred in 2016 (high performance zone). Thankfully, the incidents resulted in no serious injuries.
In 2017, we will continue to build a strong safety culture across the business to improve performance.
Link to reward
Long-term incentive
LTIFR per 200,000 hours
0.30
Link to reward
Long-term incentive
Significant events
2
Lost time injury frequency rate (LTIFR)
Having an engaged workforce where our people feel motivated to fulfil their potential and deliver for our customers is essential to our business success. To understand how engaged our people feel, we seek feedback on what we are doing well and where we can improve.
In 2016, employee engagement fell to 4.31 out of 6 (low performance zone). This coincided with a significant restructuring of our business and involved around 3,000 redundancies which created uncertainty and impacted morale. We remain committed to creating a great place to work and we will endeavour to improve engagement in 2017.
Link to reward
Long-term incentive
Employee engagement
4.31 out of 6
Employee engagement
Process safety
Everything we do is focused on satisfying the changing needs of our customers. To measure customer satisfaction, we use net promoter scores (NPS)1.
In 2016, higher NPS scores were achieved across our UK, Ireland and North America customer-facing businesses. This was the result of our continued focus and investment on improving customer service systems, enhancing training for our people and building our digital capabilities.
Link to reward
Long-term incentive2
Home
+4 +32UK & Ireland North America
Business
-16 +31UK & Ireland North America
Customer satisfaction
1 Brand NPS has been implemented consistently in the UK, Ireland and North America from 2016. Prior period comparatives are presented where available.
2 NPS used for Executive Remuneration arrangements are calculated using historical methodology and business areas which was approved by shareholders as part of the current Remuneration Policy. See page 94 for more information.
3 Brand NPS for Business energy supply in Ireland is not currently reported. Reflecting this, the stated metric represents UK Business only.
NON FINANCIAL KPIsDeloitte LLP reviewed selected non-financial KPIs and provided limited assurance using the International Standard on Assurance Engagements 3000 (Revised).
VIEW THE ASSURANCE STATEMENT AND BASIS OF REPORTING AT CENTRICA.COM/ASSURANCE

20
GOVERNANCEFINANCIAL STATEMENTS
SHAREHOLDER INFORMATION
STRATEGIC REPORT FOCUSED ON PEACE OF MIND FOR OUR CUSTOMERS
Focused on Peace of Mind for our Customers
“I would say I was quite relaxed before I got a smart meter. Lights left on and telly on for background noise. I was really bad. I just wouldn’t think about it because I didn’t realize. Then panic when the bill came in.
The problem was the gas meter is outside the house and I couldn’t find the key to do that. The electric meter inside the house is quite high up. I could get my steps out to do it and then I’d have trouble reading it. After calculating it, I’d spend all day and then forget the standing charge. It was a bit hit or miss and not very successful.
I hoped the smart meter would guide me on whether I was wasting money, which it has. To be honest, I didn’t think it’d be as good as it is.
The smart meter is really easy to use, even for me as a pensioner! Everything is included in your daily charge, so you don’t get hit with unexpected costs.
Pauline, London
“I love it. It sounds silly, but it’s changed my life.I live in Greenwich in South East London. I’m a pensioner and I live alone. I’m 67 now. I live in a two-bedroom house, and there’s also my dog.”
“I hoped the smart meter would guide me on whether I was wasting money, which it has. To be honest, I didn’t think it’d be as good as it is.”

Centrica plc Annual Report and Accounts 2016 21
Control RelaxSave
The main thing is that it gives me peace of mind that everything is okay in the house. I do worry about gas leaks etc. living on my own, but I feel much more confident now that I have the smart meter.
On a number of occasions, I’ve gone out the house and left something burning on the gas. Because I’ve got the smart meter, I just glance at that and you can always tell if something is left on. It gives me real peace of mind. I think that’s the best way to put it, if that doesn’t sound too silly.
It is so easy to use. You literally press a button, and it comes to the day that you’re on. Then you press next, and you’ll get what you used the day before. Next for what you’ve used all week. Press it again and you’ll get the monthly total. Everything’s there so clear.
I know exactly what I’m spending each day. Instead of worrying about the bill, I know what I’m spending. I can budget my money better. I don’t feel that I’ve got to hang on to money, just in case. I can spend my money more worthlessly I think!
I’ve made tons of changes, almost too many to list! I’ve turned the thermostat down, I cook two meals at once, I turn the oven off early, loads of things.
I turn off the lights when I leave the room, which I never did. They were always on. I switch off all appliances on the wall. I switch off the cooker clock, because I think, ‘I have a clock, so I don’t need that’.’ I know it’s silly little things. I keep my fridge and freezer full.
I got an email about HomeEnergy Free Time which I responded to, and then a phone call back. It was all very straightforward and easy.
I chose Sunday because I usually spend them on my own anyway. The minute it gets to 9 am, the total showing how much I’m using shuts off on the smart meter. It stays at that right until 5 pm. The dials still go round, but the actual money doesn’t alter.
It makes me feel marvellous. I can check it and say, ‘Oh, look at all that I’m saving’. The only thing that moves is the gas. It’s made me get organized. I wouldn’t do things on set days unless I knew I’ve got free days. It means I feel more relaxed as I get everything done on a Sunday. I don’t feel guilty about leaving the washing until then so I can enjoy my week.
I do all my washing on a Sunday. I save my washing up all week. Then iron it all. So, everything’s done on a Sunday. I vacuum the house while the washing’s doing. And, I make sure everything that needs charging up is fully charged. My time is completely filled.”
“It is so easy to use. You literally press a button, and it comes to the day that you’re on. Then you press next, and you’ll get what you used the day before. Next for what you’ve used all week. Press it again and you’ll get the monthly total. Everything’s there so clear.”

GOVERNANCEFINANCIAL STATEMENTS
SHAREHOLDER INFORMATION
22
STRATEGIC REPORT FOCUSED ON ENGAGING WITH OUR CUSTOMERS
Control Send Save
Focused on Engaging with our Customers
Jonathan Morgan
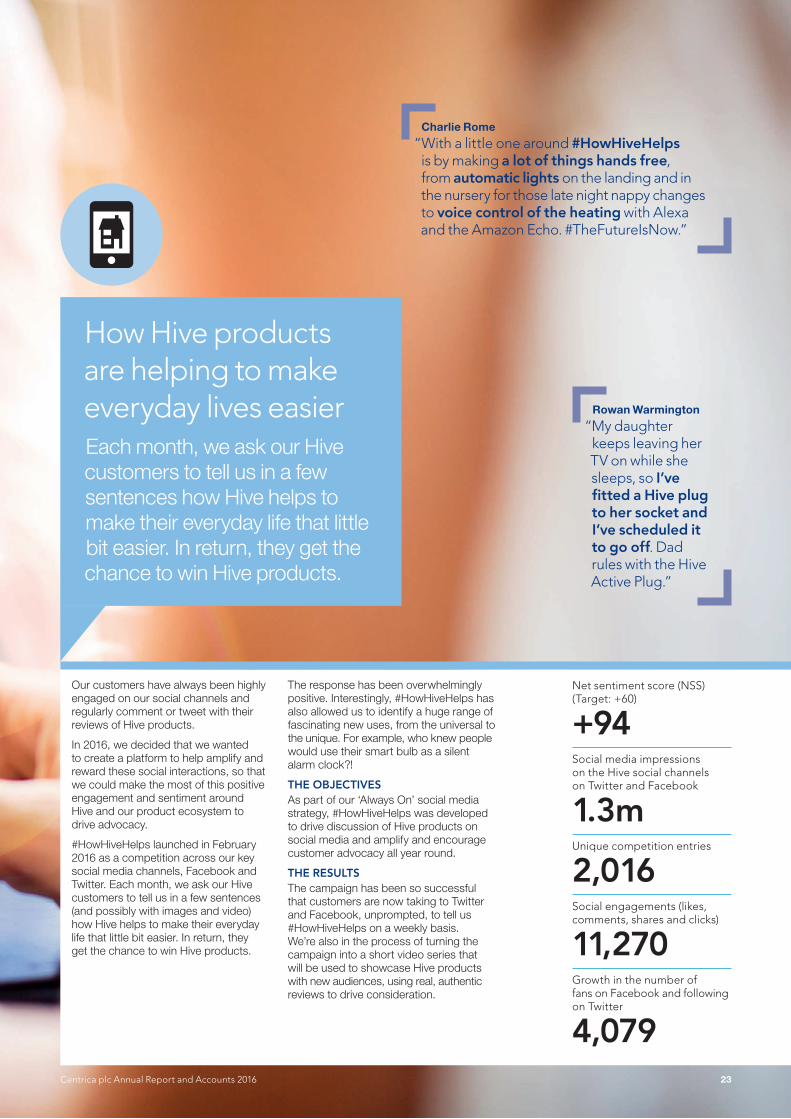
“I use the Hive Active Light™ bulb as an alarm. Comes on low light and increases brightness every ten minutes until full power using the four schedule points so a nice gradual wake up call!”
Centrica plc Annual Report and Accounts 2016 23
Our customers have always been highly engaged on our social channels and regularly comment or tweet with their reviews of Hive products.
In 2016, we decided that we wanted to create a platform to help amplify and reward these social interactions, so that we could make the most of this positive engagement and sentiment around Hive and our product ecosystem to drive advocacy.
#HowHiveHelps launched in February 2016 as a competition across our key social media channels, Facebook and Twitter. Each month, we ask our Hive customers to tell us in a few sentences (and possibly with images and video) how Hive helps to make their everyday life that little bit easier. In return, they get the chance to win Hive products.
How Hive products are helping to make everyday lives easierEach month, we ask our Hive customers to tell us in a few sentences how Hive helps to make their everyday life that little bit easier. In return, they get the chance to win Hive products.
The response has been overwhelmingly positive. Interestingly, #HowHiveHelps has also allowed us to identify a huge range of fascinating new uses, from the universal to the unique. For example, who knew people would use their smart bulb as a silent alarm clock?!
THE OBJECTIVESAs part of our ‘Always On’ social media strategy, #HowHiveHelps was developed to drive discussion of Hive products on social media and amplify and encourage customer advocacy all year round.
THE RESULTSThe campaign has been so successful that customers are now taking to Twitter and Facebook, unprompted, to tell us #HowHiveHelps on a weekly basis. We’re also in the process of turning the campaign into a short video series that will be used to showcase Hive products with new audiences, using real, authentic reviews to drive consideration.
Net sentiment score (NSS) (Target: +60)
+94Social media impressions on the Hive social channels on Twitter and Facebook
1.3mUnique competition entries
2,016Social engagements (likes, comments, shares and clicks)
11,270Growth in the number of fans on Facebook and following on Twitter
4,079
Charlie Rome
“With a little one around #HowHiveHelps is by making a lot of things hands free, from automatic lights on the landing and in the nursery for those late night nappy changes to voice control of the heating with Alexa and the Amazon Echo. #TheFutureIsNow.”
Rowan Warmington
“My daughter keeps leaving her TV on while she sleeps, so I’ve fitted a Hive plug to her socket and I’ve scheduled it to go off. Dad rules with the Hive Active Plug.”

24
GOVERNANCEFINANCIAL STATEMENTS
SHAREHOLDER INFORMATION
STRATEGIC REPORT RESPONSIBLE BUSINESS UPDATE
Responsible Business Update
OUR FOCUS ON BEING A RESPONSIBLE BUSINESS MEANS:
Prioritising safety
Operating ethically
Helping customers save time and money
Helping those in need
Being a responsible employer
Reducing carbon emissions
This approach not only helps us satisfy the changing needs of our customers, but enables us to realise our goals to become a trusted corporate citizen, an employer of choice and a 21st century energy provider.
EXPLORE MORE ABOUT HOW WE ARE BEING A RESPONSIBLE BUSINESS AT CENTRICA.COM/RESPONSIBILITY

Centrica plc Annual Report and Accounts 2016 25
Operating ethically
In pursuit of the highest operational standards, we have created a new Ethics & Compliance function and an Ethics & Compliance sub-committee of the Centrica Executive Committee, which is chaired by our Group Chief Executive. This will enable us to ensure ethics and compliance are managed in the right way across the business and embedded as a natural part of how we do business.
To support this, we are defining a new company-wide Code of Conduct that will provide a strong moral compass and bind us together in common pursuit of our strategy and purpose. Our Code will be launched in 2017, alongside a new set of supporting values.
We also uphold ethical, social and environmental standards in the products and services we buy.
In 2016, we assessed 73 suppliers on these issues, resulting in an average supplier sustainability risk score of 57 (low risk). This is better than the multi-industry average of 42 (medium risk)1 and is an improvement on our 2015 score of 54 (low risk). If suppliers receive a medium or high risk rating, we work with them to improve performance.
Modern Slavery ActAs part of the UK’s Modern Slavery Act, we have taken action to assess risks relating to forced labour in our business and supply chain. We take the issue very seriously and our commitment will be published in a Modern Slavery Act Statement in 2017.
We are committed to conducting our business in an ethical and compliant manner, ensuring we respect the rights and dignity of all people.
1 EcoVadis, 2016. A score near 100 is low risk.
Prioritising safety
We have a responsibility to keep our people and customers safe which is why safety remains our top priority.
Employee safetyRegrettably, one of our contractor engineers was involved in a road accident that led to their death. Two significant process safety events also occurred and resulted in no serious injuries, up from one event in 2015. The events related to the uncontrolled release of gas. We have subsequently implemented more robust inspections, maintenance routines and operating procedures.
Total recordable injury frequency rate improved to 0.98 per 200,000 hours worked
▼ 11%Lost time injury frequency rate also improved to 0.30 per 200,000 hours worked
▼ 12%In 2017, our focus will continue on building safety capability across the business to keep our people and customers safe through leadership training and communication.
Customer safetyIn 2016, we introduced improved working practices to reduce risk for customers.
35 customer incidents occurred
▼ 24%

26
GOVERNANCEFINANCIAL STATEMENTS
SHAREHOLDER INFORMATION
STRATEGIC REPORT RESPONSIBLE BUSINESS UPDATE
We want to make our customers’ lives easier by improving our service and giving them greater control over their energy, while keeping bills as low as possible.
Helping customers save time and money
PROVIDING EXCELLENT CUSTOMER SERVICEWe are focused on delivering an excellent service that makes our customers’ lives easier. Over time, this will improve customer satisfaction and make our customers want to stay with us for longer.
Towards this in UK Home, we have:
• Committed £50 million to advance customer service during 2015–17.
• Improved call scripts and increased training days by 24% since 2013.
• Enhanced ‘homemove’ processes and conducted pro-active re-assessments of direct debit payments.
Despite these improvements, challenges in resourcing were experienced as a result of our business restructuring while collective switching put pressure on operational systems.
After tackling issues associated with the implementation of a new customer service system in UK Business, our bill accuracy, call waiting times and speed of resolution, now surpass prior performance. The £40 million upgrade, which combined more than 100 outdated legacy systems into one, was extremely complex. Following investigations by Ofgem into the impact of the transition to the new IT system on business customers, and into the roll-out of advanced meters for certain categories of business customers, we have agreed to pay £14 million in total in redress distributed across affected micro-business customers, the charity Money Advice Trust, which provides a business debt line service to help customers in need, and to fund energy efficiency advice and related activities through the Carbon Trust.
In North America Home, we provided additional training for call centre agents. We also introduced a new call-routing system which enables calls from customers to reach agents with the right expertise, enhancing the resolution of queries.
Meanwhile, in Ireland, customer service levels improved and complaints decreased.
British Gas was one of only two major British suppliers to cut prices three times in two years on its standard tariff, leading to a
▼ 14%cumulative reduction in household gas prices alongside energy bill savings for average dual fuel customers of
▼ £175UK Home profit margin after tax has remained roughly the same over the last five years
~5%
BUSINESS REVIEWFrom customer accounts to complaints, explore our service performance in detail.
READ MORE ON PAGES 36 TO 41
Customer satisfactionTo measure customer satisfaction, we use net promoter scores (NPS).1
In UK & Ireland Business2, NPS increased
▲ -16(2015: -19)
In North America Business, NPS improved
▲ +31(2015: +20)
In UK & Ireland Home, NPS improved
▲ +4(2015: -7)
In North America Home, NPS was
+32(2015: n/a)
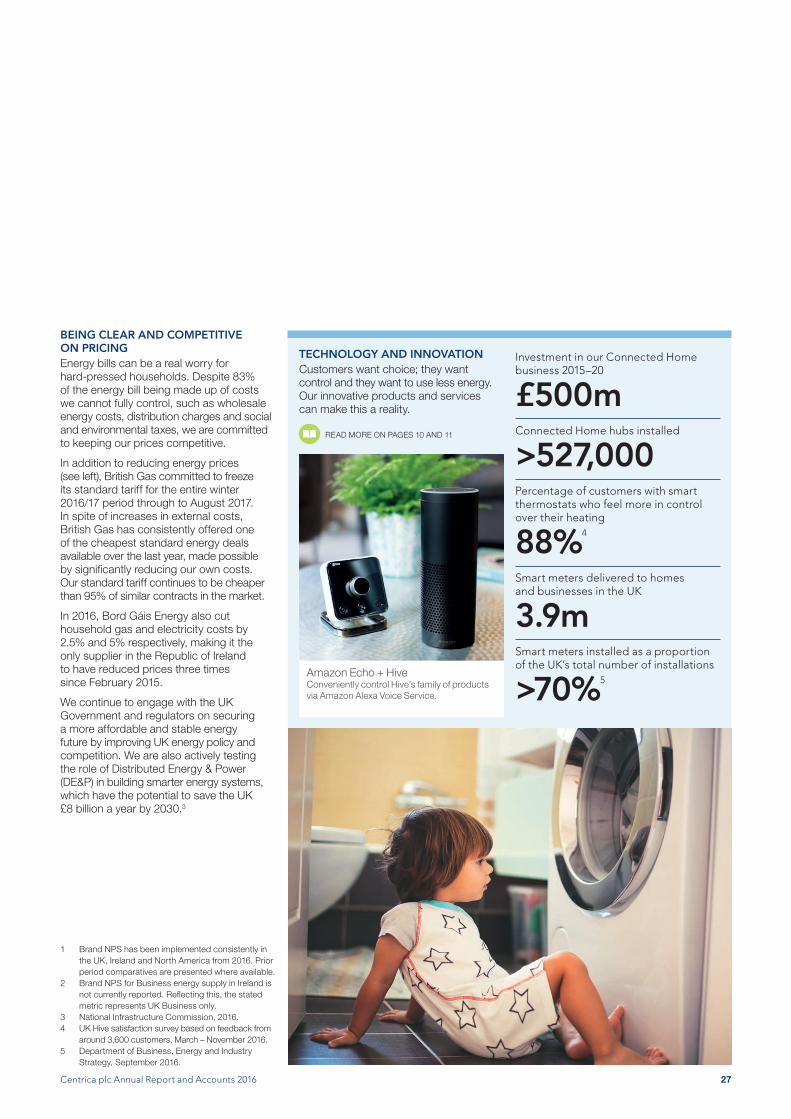
Centrica plc Annual Report and Accounts 2016 27
1 Brand NPS has been implemented consistently in the UK, Ireland and North America from 2016. Prior period comparatives are presented where available.
2 Brand NPS for Business energy supply in Ireland is not currently reported. Reflecting this, the stated metric represents UK Business only.
3 National Infrastructure Commission, 2016.4 UK Hive satisfaction survey based on feedback from
around 3,600 customers, March – November 2016.5 Department of Business, Energy and Industry
Strategy, September 2016.
BEING CLEAR AND COMPETITIVE ON PRICINGEnergy bills can be a real worry for hard-pressed households. Despite 83% of the energy bill being made up of costs we cannot fully control, such as wholesale energy costs, distribution charges and social and environmental taxes, we are committed to keeping our prices competitive.
In addition to reducing energy prices (see left), British Gas committed to freeze its standard tariff for the entire winter 2016/17 period through to August 2017. In spite of increases in external costs, British Gas has consistently offered one of the cheapest standard energy deals available over the last year, made possible by significantly reducing our own costs. Our standard tariff continues to be cheaper than 95% of similar contracts in the market.
In 2016, Bord Gáis Energy also cut household gas and electricity costs by 2.5% and 5% respectively, making it the only supplier in the Republic of Ireland to have reduced prices three times since February 2015.
We continue to engage with the UK Government and regulators on securing a more affordable and stable energy future by improving UK energy policy and competition. We are also actively testing the role of Distributed Energy & Power (DE&P) in building smarter energy systems, which have the potential to save the UK £8 billion a year by 2030.3
Investment in our Connected Home business 2015–20
£500mConnected Home hubs installed
>527,000Percentage of customers with smart thermostats who feel more in control over their heating
88%4
Smart meters delivered to homes and businesses in the UK
3.9mSmart meters installed as a proportion of the UK’s total number of installations
>70%5
TECHNOLOGY AND INNOVATIONCustomers want choice; they want control and they want to use less energy. Our innovative products and services can make this a reality.
READ MORE ON PAGES 10 AND 11
Amazon Echo + HiveConveniently control Hive’s family of products via Amazon Alexa Voice Service.
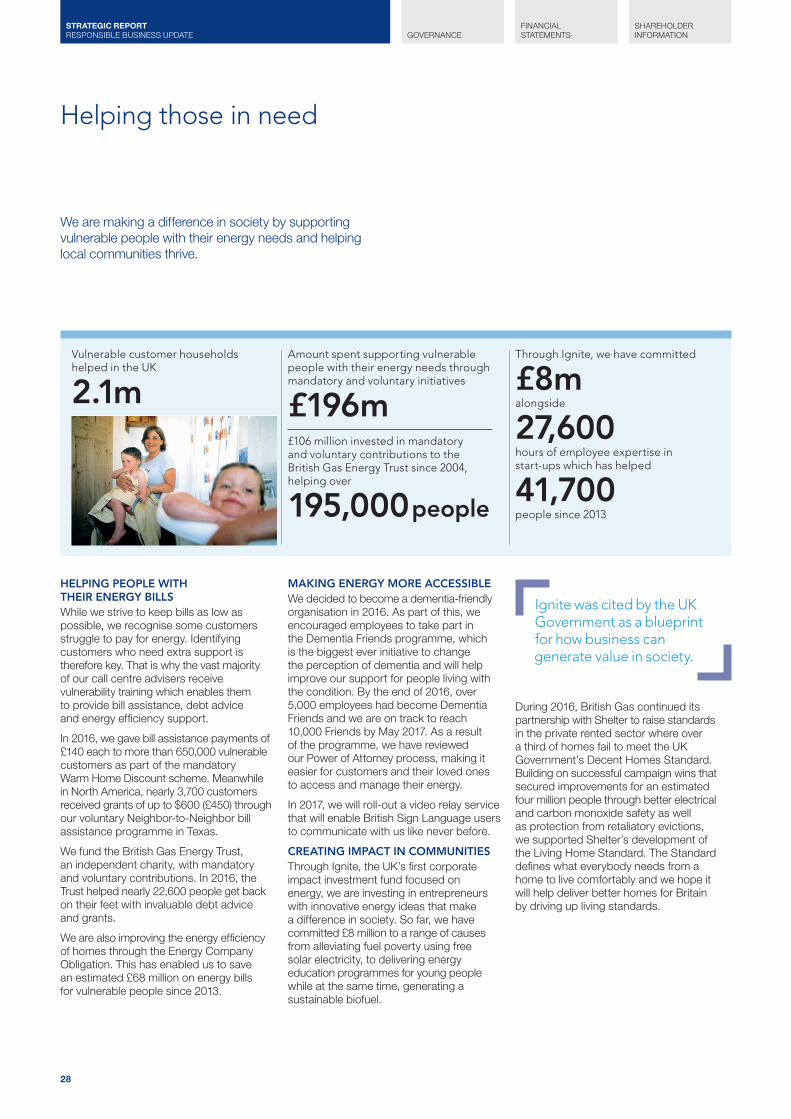
28
GOVERNANCEFINANCIAL STATEMENTS
SHAREHOLDER INFORMATION
STRATEGIC REPORT RESPONSIBLE BUSINESS UPDATE
Vulnerable customer households helped in the UK
2.1mAmount spent supporting vulnerable people with their energy needs through mandatory and voluntary initiatives
£196m£106 million invested in mandatory and voluntary contributions to the British Gas Energy Trust since 2004, helping over
195,000 people
We are making a difference in society by supporting vulnerable people with their energy needs and helping local communities thrive.
Through Ignite, we have committed
£8malongside
27,600hours of employee expertise in start-ups which has helped
41,700people since 2013
Helping those in need
Ignite was cited by the UK Government as a blueprint for how business can generate value in society.
HELPING PEOPLE WITH THEIR ENERGY BILLSWhile we strive to keep bills as low as possible, we recognise some customers struggle to pay for energy. Identifying customers who need extra support is therefore key. That is why the vast majority of our call centre advisers receive vulnerability training which enables them to provide bill assistance, debt advice and energy efficiency support.
In 2016, we gave bill assistance payments of £140 each to more than 650,000 vulnerable customers as part of the mandatory Warm Home Discount scheme. Meanwhile in North America, nearly 3,700 customers received grants of up to $600 (£450) through our voluntary Neighbor-to-Neighbor bill assistance programme in Texas.
We fund the British Gas Energy Trust, an independent charity, with mandatory and voluntary contributions. In 2016, the Trust helped nearly 22,600 people get back on their feet with invaluable debt advice and grants.
We are also improving the energy efficiency of homes through the Energy Company Obligation. This has enabled us to save an estimated £68 million on energy bills for vulnerable people since 2013.
MAKING ENERGY MORE ACCESSIBLEWe decided to become a dementia-friendly organisation in 2016. As part of this, we encouraged employees to take part in the Dementia Friends programme, which is the biggest ever initiative to change the perception of dementia and will help improve our support for people living with the condition. By the end of 2016, over 5,000 employees had become Dementia Friends and we are on track to reach 10,000 Friends by May 2017. As a result of the programme, we have reviewed our Power of Attorney process, making it easier for customers and their loved ones to access and manage their energy.
In 2017, we will roll-out a video relay service that will enable British Sign Language users to communicate with us like never before.
CREATING IMPACT IN COMMUNITIESThrough Ignite, the UK’s first corporate impact investment fund focused on energy, we are investing in entrepreneurs with innovative energy ideas that make a difference in society. So far, we have committed £8 million to a range of causes from alleviating fuel poverty using free solar electricity, to delivering energy education programmes for young people while at the same time, generating a sustainable biofuel.
During 2016, British Gas continued its partnership with Shelter to raise standards in the private rented sector where over a third of homes fail to meet the UK Government’s Decent Homes Standard. Building on successful campaign wins that secured improvements for an estimated four million people through better electrical and carbon monoxide safety as well as protection from retaliatory evictions, we supported Shelter’s development of the Living Home Standard. The Standard defines what everybody needs from a home to live comfortably and we hope it will help deliver better homes for Britain by driving up living standards.
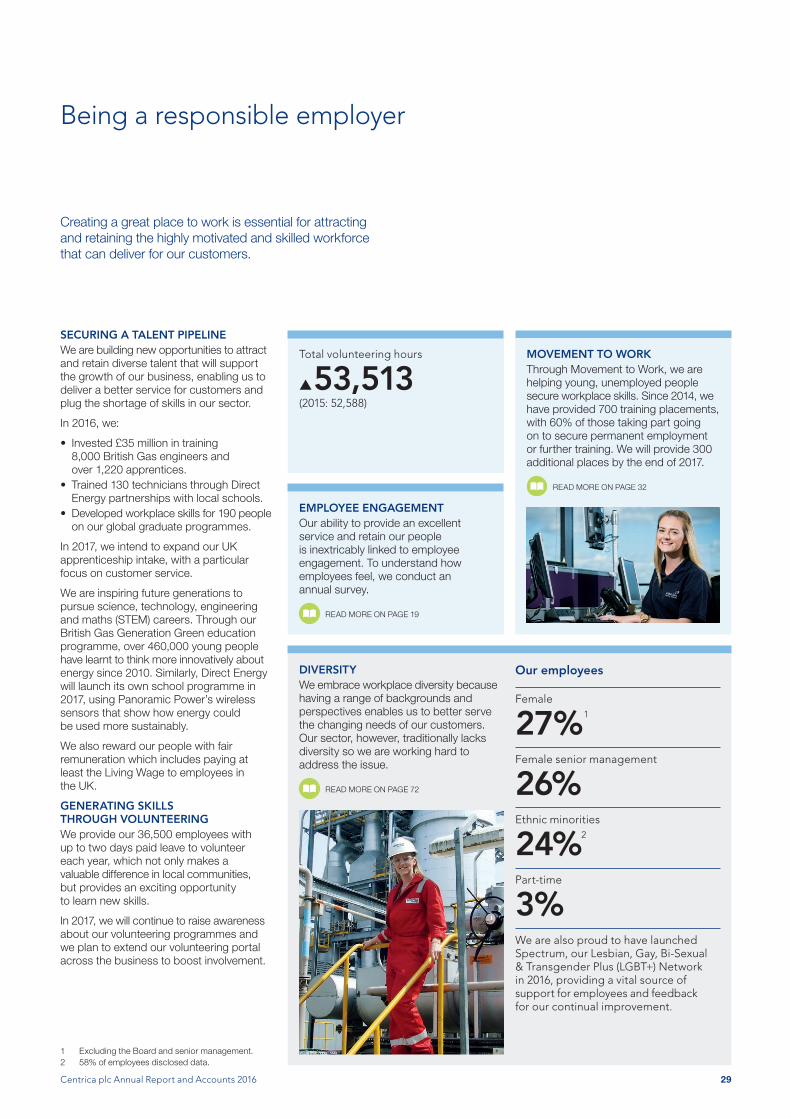
Centrica plc Annual Report and Accounts 2016 29
MOVEMENT TO WORKThrough Movement to Work, we are helping young, unemployed people secure workplace skills. Since 2014, we have provided 700 training placements, with 60% of those taking part going on to secure permanent employment or further training. We will provide 300 additional places by the end of 2017.
READ MORE ON PAGE 32
EMPLOYEE ENGAGEMENTOur ability to provide an excellent service and retain our people is inextricably linked to employee engagement. To understand how employees feel, we conduct an annual survey.
READ MORE ON PAGE 19
Total volunteering hours
▲53,513(2015: 52,588)
DIVERSITYWe embrace workplace diversity because having a range of backgrounds and perspectives enables us to better serve the changing needs of our customers. Our sector, however, traditionally lacks diversity so we are working hard to address the issue.
READ MORE ON PAGE 72
Our employees
Female
27%1
Female senior management
26%Ethnic minorities
24%2
Part-time
3%We are also proud to have launched Spectrum, our Lesbian, Gay, Bi-Sexual & Transgender Plus (LGBT+) Network in 2016, providing a vital source of support for employees and feedback for our continual improvement.
SECURING A TALENT PIPELINEWe are building new opportunities to attract and retain diverse talent that will support the growth of our business, enabling us to deliver a better service for customers and plug the shortage of skills in our sector.
In 2016, we:
• Invested £35 million in training 8,000 British Gas engineers and over 1,220 apprentices.
• Trained 130 technicians through Direct Energy partnerships with local schools.
• Developed workplace skills for 190 people on our global graduate programmes.
In 2017, we intend to expand our UK apprenticeship intake, with a particular focus on customer service.
We are inspiring future generations to pursue science, technology, engineering and maths (STEM) careers. Through our British Gas Generation Green education programme, over 460,000 young people have learnt to think more innovatively about energy since 2010. Similarly, Direct Energy will launch its own school programme in 2017, using Panoramic Power’s wireless sensors that show how energy could be used more sustainably.
We also reward our people with fair remuneration which includes paying at least the Living Wage to employees in the UK.
GENERATING SKILLS THROUGH VOLUNTEERINGWe provide our 36,500 employees with up to two days paid leave to volunteer each year, which not only makes a valuable difference in local communities, but provides an exciting opportunity to learn new skills.
In 2017, we will continue to raise awareness about our volunteering programmes and we plan to extend our volunteering portal across the business to boost involvement.
Being a responsible employer
Creating a great place to work is essential for attracting and retaining the highly motivated and skilled workforce that can deliver for our customers.
1 Excluding the Board and senior management.2 58% of employees disclosed data.
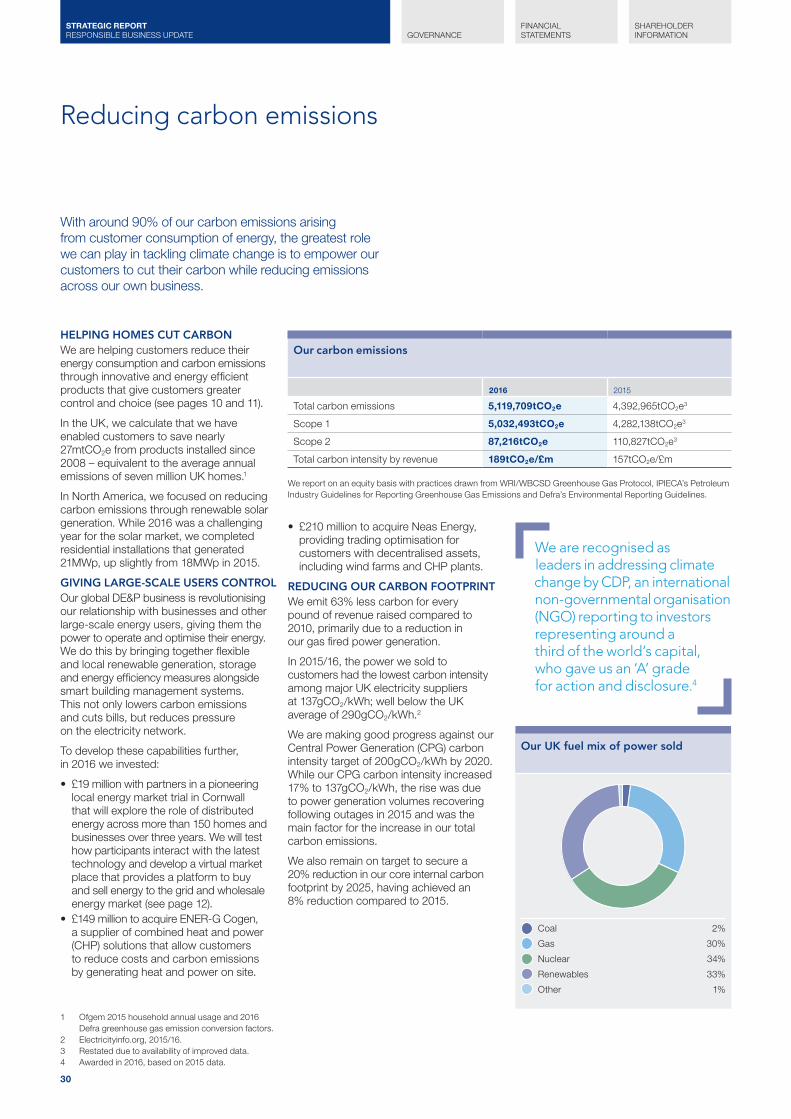
30
GOVERNANCEFINANCIAL STATEMENTS
SHAREHOLDER INFORMATION
STRATEGIC REPORT RESPONSIBLE BUSINESS UPDATE
Our UK fuel mix of power sold
Coal 2%
Gas 30%
Nuclear 34%
Renewables 33%
Other 1%
Reducing carbon emissions
HELPING HOMES CUT CARBONWe are helping customers reduce their energy consumption and carbon emissions through innovative and energy efficient products that give customers greater control and choice (see pages 10 and 11).
In the UK, we calculate that we have enabled customers to save nearly 27mtCO2e from products installed since 2008 – equivalent to the average annual emissions of seven million UK homes.1
In North America, we focused on reducing carbon emissions through renewable solar generation. While 2016 was a challenging year for the solar market, we completed residential installations that generated 21MWp, up slightly from 18MWp in 2015.
GIVING LARGE-SCALE USERS CONTROLOur global DE&P business is revolutionising our relationship with businesses and other large-scale energy users, giving them the power to operate and optimise their energy. We do this by bringing together flexible and local renewable generation, storage and energy efficiency measures alongside smart building management systems. This not only lowers carbon emissions and cuts bills, but reduces pressure on the electricity network.
To develop these capabilities further, in 2016 we invested:
• £19 million with partners in a pioneering local energy market trial in Cornwall that will explore the role of distributed energy across more than 150 homes and businesses over three years. We will test how participants interact with the latest technology and develop a virtual market place that provides a platform to buy and sell energy to the grid and wholesale energy market (see page 12).
• £149 million to acquire ENER-G Cogen, a supplier of combined heat and power (CHP) solutions that allow customers to reduce costs and carbon emissions by generating heat and power on site.
With around 90% of our carbon emissions arising from customer consumption of energy, the greatest role we can play in tackling climate change is to empower our customers to cut their carbon while reducing emissions across our own business.
• £210 million to acquire Neas Energy, providing trading optimisation for customers with decentralised assets, including wind farms and CHP plants.
REDUCING OUR CARBON FOOTPRINTWe emit 63% less carbon for every pound of revenue raised compared to 2010, primarily due to a reduction in our gas fired power generation.
In 2015/16, the power we sold to customers had the lowest carbon intensity among major UK electricity suppliers at 137gCO2/kWh; well below the UK average of 290gCO2/kWh.2
We are making good progress against our Central Power Generation (CPG) carbon intensity target of 200gCO2/kWh by 2020. While our CPG carbon intensity increased 17% to 137gCO2/kWh, the rise was due to power generation volumes recovering following outages in 2015 and was the main factor for the increase in our total carbon emissions.
We also remain on target to secure a 20% reduction in our core internal carbon footprint by 2025, having achieved an 8% reduction compared to 2015.
Our carbon emissions
2016 2015
Total carbon emissions 5,119,709tCO2e 4,392,965tCO2e3
Scope 1 5,032,493tCO2e 4,282,138tCO2e3
Scope 2 87,216tCO2e 110,827tCO2e3
Total carbon intensity by revenue 189tCO2e/£m 157tCO2e/£m
We report on an equity basis with practices drawn from WRI/WBCSD Greenhouse Gas Protocol, IPIECA’s Petroleum Industry Guidelines for Reporting Greenhouse Gas Emissions and Defra’s Environmental Reporting Guidelines.
We are recognised as leaders in addressing climate change by CDP, an international non-governmental organisation (NGO) reporting to investors representing around a third of the world’s capital, who gave us an ‘A’ grade for action and disclosure.4
1 Ofgem 2015 household annual usage and 2016 Defra greenhouse gas emission conversion factors.
2 Electricityinfo.org, 2015/16.3 Restated due to availability of improved data.4 Awarded in 2016, based on 2015 data.

Centrica plc Annual Report and Accounts 2016 31
OUR VIEW ON TAXATION
Tax charge v. cash tax by region2016 £m
300 350200150100 250500-50-100-150
UK
Mainland Europe
North America
185(152)
33
Deferred tax charge
Current tax charge
Net tax charge
Cash tax paid/(received)
77
168207
102
25232
28427
39
Breakdown of UK tax charge £m
150100500-50-100-150
Total UK tax charge
Deferred taxes
Tax credits due from other periods
2016 taxes to be repaid in 201754
2015 taxes paid in 2016
PRT refund from prior periods
Taxes paid in 2016
152
(12)
77
35
(185)
33
Payments made on account in the early part of 2016 are expected to be repayable in 2017 as a consequence of mark to market movements in the latter part of 2016.
Our View on Taxation
OUR APPROACHWherever we do business in the world we take great care to ensure we fully comply with all of our obligations to pay or collect taxes and to meet local reporting and disclosure requirements.
We fully disclose information on ownership, transactions and financing structures to the relevant tax authorities. Our cross-border tax reporting reflects the underlying commercial reality of our business.
We ensure that income and costs, including costs of financing operations, are appropriately recognised on a fair and sustainable basis across all countries where the Group has a business presence. We understand that this is not an exact science and we engage openly with tax authorities to explain our approach.
TAXES PAID IN THE UKWe maintain a transparent and constructive relationship with Her Majesty’s Revenue & Customs (HMRC) in the UK. This includes regular, open dialogue on issues of significance to HMRC and Centrica. Our relationship with fiscal authorities in other countries where we do business is conducted on the same principles.
We carefully manage the tax risks and costs inherent in every commercial transaction, in the same way as any other cost. However, we do not enter into artificial arrangements in order to avoid taxation nor to defeat the stated purpose of tax legislation.
We actively engage in consultation with government on tax policy where we believe we are in a position as a Group to provide valuable commercial insight.
TAXES PAID OUTSIDE THE UKOutside the UK the Group’s businesses are subject to corporate income tax rates in excess of the UK Corporation Tax Rate (see below).
Our Group Tax Strategy, a more detailed explanation of the way the Group’s tax liability is calculated and the timing of cash payments is provided on our website at centrica.com/responsibletax.
The Group takes its obligations to pay and collect the correct amount of tax very seriously. Responsibility for tax governance and strategy lies with the Group Chief Financial Officer, with the oversight of the Board and the Audit Committee.
Statutory tax rates on profits
Group activities %
UK supply of energy and services 20
UK oil and gas production 40
Norway oil and gas production 78
Netherlands oil and gas production 50
United States supply of energy and services 35
Canada supply of energy and services and oil and gas production 26
Denmark energy services 22
Republic of Ireland supply of energy and services 12.5
As at December 2016.
FURTHER INFORMATION ON THE TAX CHARGE IS SET OUT IN NOTE 9

GOVERNANCEFINANCIAL STATEMENTS
SHAREHOLDER INFORMATION
32
STRATEGIC REPORT FOCUSED ON TRAINING THE EMPLOYEES OF THE FUTURE
Focused on Training the Employees of the Future
Over the last three years, Centrica has supported 700 young people who were not in education or employment by providing training and work placements. 90% of those who took part said that their confidence and understanding of the work place increased and that they now felt ready to find a role. 60% of those taking part have gone on to secure a permanent job or further training as a result. We have pledged to do even more in 2017 by providing a further 300 work places, and to integrate support for ‘Movement to Work’ more closely into our successful apprenticeship scheme.
Aimee had been out of work for six months and was struggling to find a job, sapping her self-confidence.
“For months, I would visit my local job centre really regularly, but struggled to find anything. Applying for jobs and being turned down for interviews made life very hard and I struggled with my self-confidence. When you’re unemployed, people look down on you. All you need is for someone to give you a chance.”
Her job centre adviser suggested applying for a British Gas apprenticeship through the ‘Movement to Work’ scheme. British Gas’ parent company Centrica is proud to be part of this industry-wide initiative, working with other leading organisations, including M&S, Starbucks, BT, Unilever, Accenture and BAE Systems, to tackle youth unemployment in the UK.
After completing the ‘Movement to Work’ eight week pre-employment training, Aimee was accepted onto the British Gas apprenticeship scheme, which she completed in July 2015. She now has a permanent, full-time Customer Service Adviser role with British Gas. It’s an uplifting story that Centrica hopes will inspire more young people.
FOR MORE INFORMATION ABOUT MOVEMENT TO WORK, VISIT: MOVEMENTTOWORK.COM
TO LEARN ABOUT CENTRICA’S APPRENTICESHIP SCHEME, AND TO APPLY, VISIT: CENTRICA.COM/CAREERS/APPRENTICE-TRAINEES/ABOUT- APPRENTICES-TRAINEES
Finding a way into work through an apprenticeship schemeCentrica is proud to be part of Movement to Work, an industry-wide initiative, working with other leading organisations,to tackle youth unemployment in the UK.
AIMEE HEARNCustomer Service Adviser, British Gas

Centrica plc Annual Report and Accounts 2016 33
Learn Develop Engage

34
GOVERNANCEFINANCIAL STATEMENTS
SHAREHOLDER INFORMATION
STRATEGIC REPORT FOCUSED ON TRAINING OUR EMPLOYEES
“I really am a people person and learning about helping customers every day and some of the responses from them are what the job is about, it makes you feel good about yourself knowing you can help others”.
Focused on Training our Employees
Rewarding careers serving our customersBefore joining British Gas, Ryannie, 16, was at school and volunteered at a school for children with disabilities. She had always thought about staying on in education but wasn’t sure what her options were.
Focused on Training our Employees
Rewarding careers serving our customersBefore joining British Gas, Ryannie, 16, was at school and volunteered at a school for children with disabilities. She had always thought about staying on in education but wasn’t sure what her options were.
“I really am a people person and learning about helping customers every day and some of the responses from them are what the job is about, it makes you feel good about yourself knowing you can help others”.
Ryannie had done a few weeks of casual work and knew that she wanted more for her education and career, but wasn’t sure what that was.
“If I’m honest I was going to go to university to be a physiotherapist, but the more I thought about it, the more I knew that university wasn’t really for me. Even though I had no idea what it was like being an apprentice in a contact centre, it’s been one of the best things I’ve done, as I can earn money whilst studying. I also feel like I have a career.”
Ryannie said, “I really am a people person and learning about helping customers every day and some of the responses from them are what the job is about, it makes you feel good about yourself knowing you can help others”.
“I applied for the apprenticeship because I think it is exciting to be a part of something completely different from what I thought I wanted to do. Now I’ve been here for a few months it’s definitely the opportunity for me as I can develop and help customers. I can also make a career in customer service.”
Ryannie’s team are one of the top performing teams in Edinburgh and are making a key difference to the Centrica service business by driving customer satisfaction scores and regulatory adherence.
The new Customer Service Trailblazer Apprenticeship has been created by leading service employers, including British Gas, to ensure we meet and exceed the needs of UK customers, learners and employers, both now and in the future.

Centrica plc Annual Report and Accounts 2016 35
Learn DevelopEngage
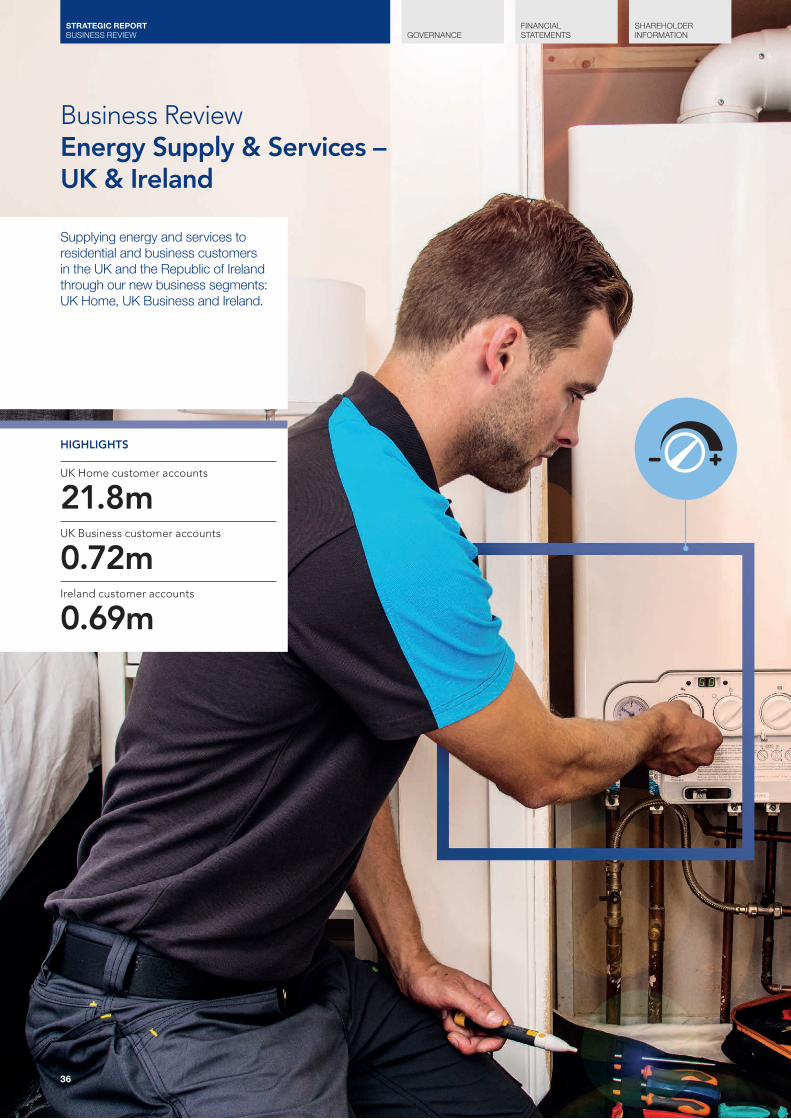
GOVERNANCEFINANCIAL STATEMENTS
SHAREHOLDER INFORMATION
36
STRATEGIC REPORT BUSINESS REVIEW
Business Review Energy Supply & Services – UK & Ireland
Supplying energy and services to residential and business customers in the UK and the Republic of Ireland through our new business segments: UK Home, UK Business and Ireland.
HIGHLIGHTS
UK Home customer accounts
21.8mUK Business customer accounts
0.72mIreland customer accounts
0.69m
1 Based on NPS relating to residential customer satisfaction.
Centrica plc Annual Report and Accounts 2016 37
ENERGY SUPPLY & SERVICES – UK & IRELANDWe made good progress in implementing our customer-facing strategy in the UK and Ireland during 2016. We have established a new customer-centric operating model as we reposition the business beyond energy supply, enabling us to broaden and deepen the relationship with the customer in their home. Our strategy recognises customers are more empowered, with increased demand for technology-enabled service and integrated devices. Against this backdrop, we are focused on improving customer satisfaction, enhancing our range of innovative products and solutions, and delivering cost efficiencies.
Our efficiency programme enables us to prioritise our resources to defend and grow our core energy and services activities and invest in new growth opportunities. During the year we restructured our UK energy and services businesses to create two new business units, UK Home and UK Business, and two operating functions, Customer Operations and Field Operations. This has enabled us to realise scale benefits from common processes and develop a segmented customer approach and targeted propositions. We have now consolidated operations into fewer sites and streamlined our sales channels and services product lines and reflecting this, direct like-for-like headcount reduced by nearly 3,000 during 2016. This resulted in redundancy costs, which contributed towards the Group’s £228 million exceptional restructuring costs, the majority of which were incurred in UK Home. In addition, we made changes to pension terms with our employees, with the vast majority voting to accept the proposals. These actions, combined with a focus on discretionary expenditure and a normalisation of UK Business costs, meant total like-for-like controllable costs fell by 7% compared to 2015 while our cost per UK home customer fell by 1%.
UK HOMEAgainst a competitive backdrop, excellent customer service is a core requisite for retaining and winning new customers. During the year we took actions to improve employee training, pro-actively re-assessed direct debit payments, implemented a more customer friendly ‘moving home’ process and improved call scripts. This all led to lower complaints in both energy supply and services, and Brand NPS improved by 10 points to move into positive territory at +3. Engineer NPS remains high at +69.
The number of energy supply customer account holdings reduced by 409,000 or 3% in 2016 including the impact of a significant roll-off of long-term fixed price contracts in H1 2016. However, it was broadly flat in H2 2016, despite higher market churn rates, reflecting the launch of new competitively priced customer offers and British Gas having one of the lowest standard variable tariff prices in the market following a 5% reduction in our residential gas tariff in March. The number of services product holdings fell by 3% in 2016, reflecting the ongoing market trend for customers using on-demand and home emergency services, although the rate of loss was much reduced in the second half with targeted offers helping improve customer retention. We have developed a technology-led on-demand proposition, Local Heroes, which leverages our engineer base as well as providing access to local tradesmen backed by a British Gas guarantee. Across both energy and services, a greater focus on and understanding of customer preferences and more sophisticated customer segmentation is enabling us to develop more targeted offers as we focus increasingly on customer value.
We continue to lead the industry in the smart meter roll-out, having installed 3.3 million to date. Smart meters will bring significant benefits to customers, with an end to estimated bills and a greater ability to monitor and reduce consumption helping improve customer engagement. Utilising smart meter technology, we launched our ‘HomeEnergy FreeTime’ tariff in June, offering free electricity to customers on either a Saturday or Sunday.
UK Home adjusted operating profit fell 8% to £810 million, which includes energy supply operating profit of £553 million, down 11%. This reduction in energy supply profitability reflects a changing product mix and lower customer account holdings partially offset by efficiency benefits. However, adjusted operating cash flow increased significantly due to strong working capital management.
UK BUSINESSUK Business returned to profitability in 2016 following an operating loss in 2015, with billing issues associated with the migration of customer accounts and associated data on to a new billing and CRM system from multiple legacy systems now fully resolved. Billing accuracy and timeliness are now significantly better than under the old systems, and as a result, complaints fell by around a quarter
compared to 2015 and operating costs returned to pre-implementation levels. Following investigations by Ofgem into the impact of the transition to a new IT system on business customers, and into the roll-out of advanced meters for certain categories of business customers, we have agreed to pay £14 million in total in redress distributed across affected micro-business customers, the charity Money Advice Trust, which provides a business debt line service to help customers in need, and to fund energy efficiency advice and related activities through the Carbon Trust.
Collecting customer debt resulting from the billing issues was a key area of focus throughout the year and, as a result, adjusted operating cash flow was £418 million compared to a cash outflow of £132 million in 2015. Customer account holdings fell by 6% in 2016, as we focused on rebuilding our reputation in the UK business market and our retention activities on higher value SME customers. UK Business also continues to support the DE&P business in the development of energy insights and solutions for our customers.
IRELANDOur Irish business, Bord Gáis Energy, delivered a strong result in 2016. Customer service levels improved with complaints down reflecting investment in customer agent training and Brand NPS increasing to +20.1 We also delivered 4% growth in customer accounts, which reflected our competitive pricing position resulting from a reduction in gas and electricity prices for customers in Q4 of 2016.
Adjusted operating profit and adjusted operating cash flow were significantly higher than in 2015, with H2 2016 profit higher than H2 2015 including a strong operational performance in energy supply and generation and trading.
Energy supply complaints down
▼ 31%UK Home brand NPS up
▲ 10 points
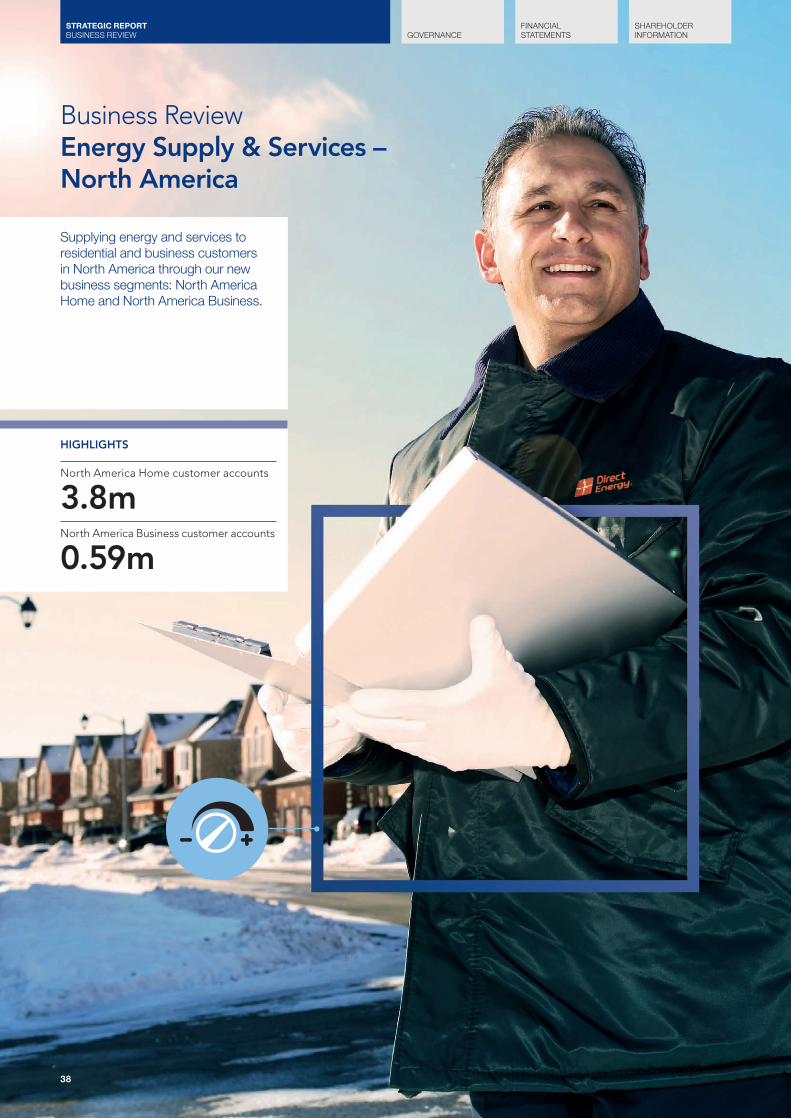
GOVERNANCEFINANCIAL STATEMENTS
SHAREHOLDER INFORMATION
38
STRATEGIC REPORT BUSINESS REVIEW
Business Review Energy Supply & Services – North America
Supplying energy and services to residential and business customers in North America through our new business segments: North America Home and North America Business.
HIGHLIGHTS
North America Home customer accounts
3.8mNorth America Business customer accounts
0.59m
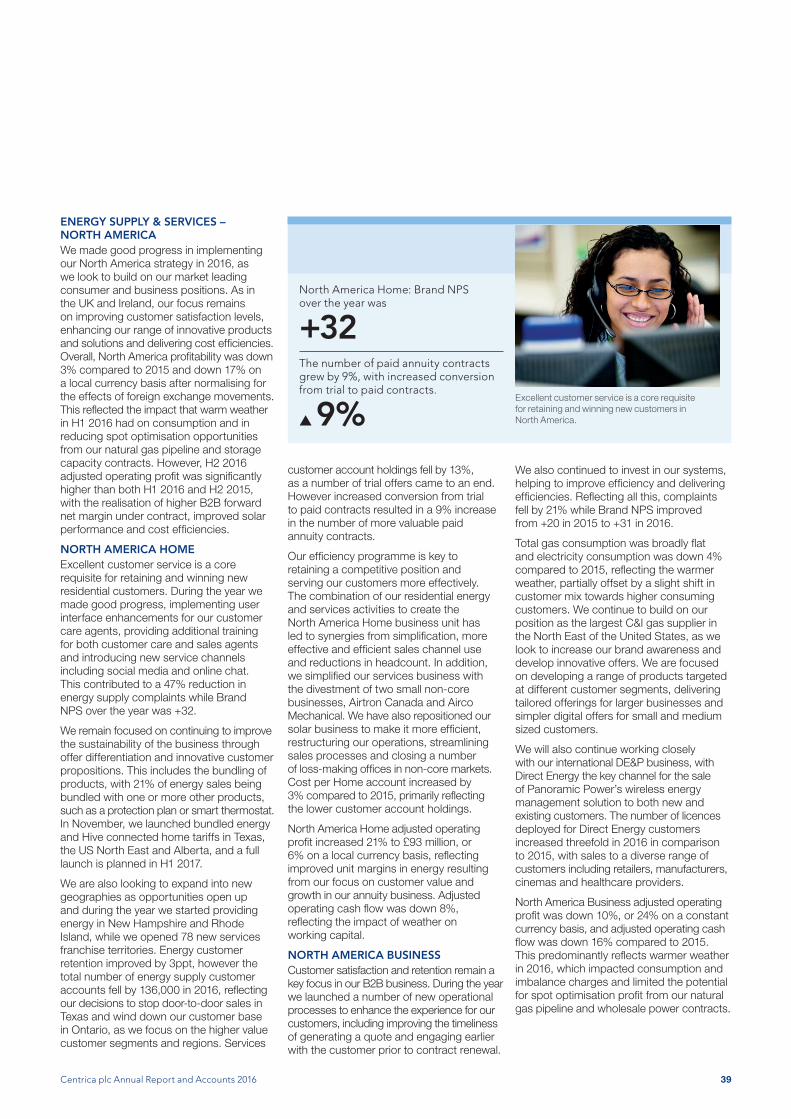
Centrica plc Annual Report and Accounts 2016 39
ENERGY SUPPLY & SERVICES – NORTH AMERICAWe made good progress in implementing our North America strategy in 2016, as we look to build on our market leading consumer and business positions. As in the UK and Ireland, our focus remains on improving customer satisfaction levels, enhancing our range of innovative products and solutions and delivering cost efficiencies. Overall, North America profitability was down 3% compared to 2015 and down 17% on a local currency basis after normalising for the effects of foreign exchange movements. This reflected the impact that warm weather in H1 2016 had on consumption and in reducing spot optimisation opportunities from our natural gas pipeline and storage capacity contracts. However, H2 2016 adjusted operating profit was significantly higher than both H1 2016 and H2 2015, with the realisation of higher B2B forward net margin under contract, improved solar performance and cost efficiencies.
NORTH AMERICA HOMEExcellent customer service is a core requisite for retaining and winning new residential customers. During the year we made good progress, implementing user interface enhancements for our customer care agents, providing additional training for both customer care and sales agents and introducing new service channels including social media and online chat. This contributed to a 47% reduction in energy supply complaints while Brand NPS over the year was +32.
We remain focused on continuing to improve the sustainability of the business through offer differentiation and innovative customer propositions. This includes the bundling of products, with 21% of energy sales being bundled with one or more other products, such as a protection plan or smart thermostat. In November, we launched bundled energy and Hive connected home tariffs in Texas, the US North East and Alberta, and a full launch is planned in H1 2017.
We are also looking to expand into new geographies as opportunities open up and during the year we started providing energy in New Hampshire and Rhode Island, while we opened 78 new services franchise territories. Energy customer retention improved by 3ppt, however the total number of energy supply customer accounts fell by 136,000 in 2016, reflecting our decisions to stop door-to-door sales in Texas and wind down our customer base in Ontario, as we focus on the higher value customer segments and regions. Services
customer account holdings fell by 13%, as a number of trial offers came to an end. However increased conversion from trial to paid contracts resulted in a 9% increase in the number of more valuable paid annuity contracts.
Our efficiency programme is key to retaining a competitive position and serving our customers more effectively. The combination of our residential energy and services activities to create the North America Home business unit has led to synergies from simplification, more effective and efficient sales channel use and reductions in headcount. In addition, we simplified our services business with the divestment of two small non-core businesses, Airtron Canada and Airco Mechanical. We have also repositioned our solar business to make it more efficient, restructuring our operations, streamlining sales processes and closing a number of loss-making offices in non-core markets. Cost per Home account increased by 3% compared to 2015, primarily reflecting the lower customer account holdings.
North America Home adjusted operating profit increased 21% to £93 million, or 6% on a local currency basis, reflecting improved unit margins in energy resulting from our focus on customer value and growth in our annuity business. Adjusted operating cash flow was down 8%, reflecting the impact of weather on working capital.
NORTH AMERICA BUSINESSCustomer satisfaction and retention remain a key focus in our B2B business. During the year we launched a number of new operational processes to enhance the experience for our customers, including improving the timeliness of generating a quote and engaging earlier with the customer prior to contract renewal.
Excellent customer service is a core requisite for retaining and winning new customers in North America.
North America Home: Brand NPS over the year was
+32The number of paid annuity contracts grew by 9%, with increased conversion from trial to paid contracts.
▲ 9%We also continued to invest in our systems, helping to improve efficiency and delivering efficiencies. Reflecting all this, complaints fell by 21% while Brand NPS improved from +20 in 2015 to +31 in 2016.
Total gas consumption was broadly flat and electricity consumption was down 4% compared to 2015, reflecting the warmer weather, partially offset by a slight shift in customer mix towards higher consuming customers. We continue to build on our position as the largest C&I gas supplier in the North East of the United States, as we look to increase our brand awareness and develop innovative offers. We are focused on developing a range of products targeted at different customer segments, delivering tailored offerings for larger businesses and simpler digital offers for small and medium sized customers.
We will also continue working closely with our international DE&P business, with Direct Energy the key channel for the sale of Panoramic Power’s wireless energy management solution to both new and existing customers. The number of licences deployed for Direct Energy customers increased threefold in 2016 in comparison to 2015, with sales to a diverse range of customers including retailers, manufacturers, cinemas and healthcare providers.
North America Business adjusted operating profit was down 10%, or 24% on a constant currency basis, and adjusted operating cash flow was down 16% compared to 2015. This predominantly reflects warmer weather in 2016, which impacted consumption and imbalance charges and limited the potential for spot optimisation profit from our natural gas pipeline and wholesale power contracts.

GOVERNANCEFINANCIAL STATEMENTS
SHAREHOLDER INFORMATION
40
STRATEGIC REPORT BUSINESS REVIEW
Business Review Connected Home
HIGHLIGHTS
Cumulative hubs installed
527,000New products launched
5
In Connected Home, our Hive smart thermostat and other services help our customers manage their energy use in the UK, the Republic of Ireland, Canada and the United States. We plan to build a global business providing new and innovative solutions for consumers across the world.
READ MORE ON PAGES 22 AND 23
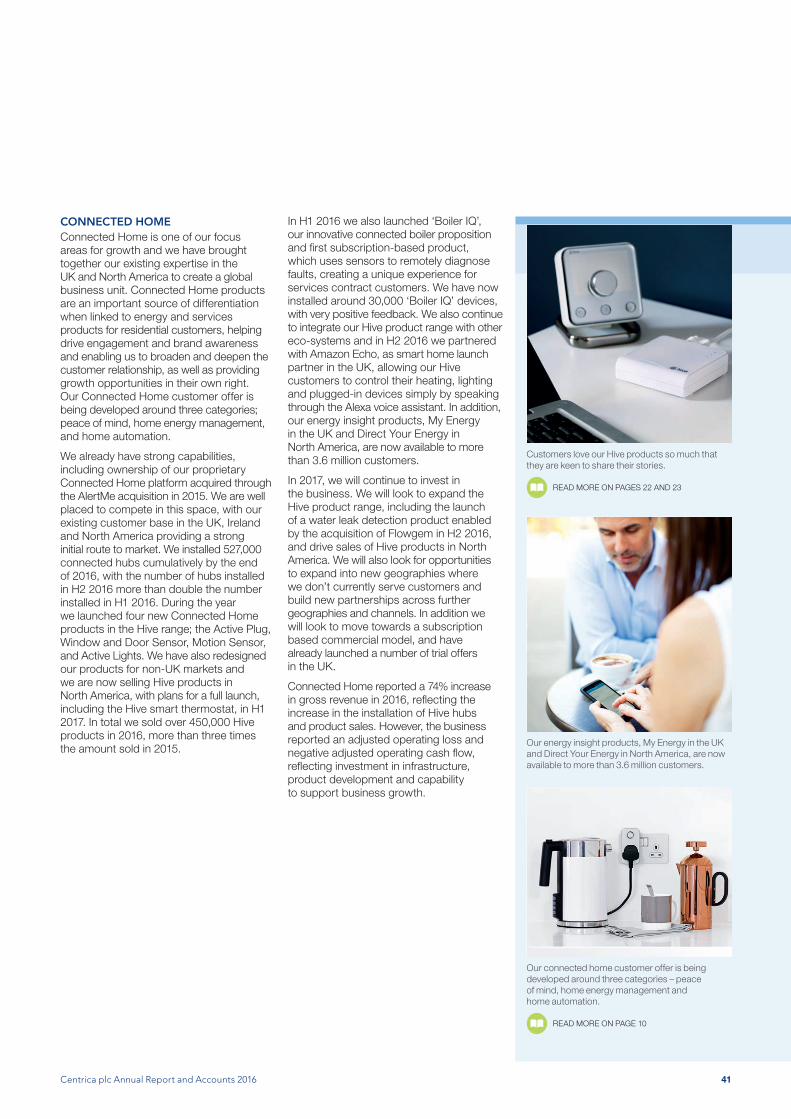
Centrica plc Annual Report and Accounts 2016 41
Customers love our Hive products so much that they are keen to share their stories.
READ MORE ON PAGES 22 AND 23
CONNECTED HOMEConnected Home is one of our focus areas for growth and we have brought together our existing expertise in the UK and North America to create a global business unit. Connected Home products are an important source of differentiation when linked to energy and services products for residential customers, helping drive engagement and brand awareness and enabling us to broaden and deepen the customer relationship, as well as providing growth opportunities in their own right. Our Connected Home customer offer is being developed around three categories; peace of mind, home energy management, and home automation.
We already have strong capabilities, including ownership of our proprietary Connected Home platform acquired through the AlertMe acquisition in 2015. We are well placed to compete in this space, with our existing customer base in the UK, Ireland and North America providing a strong initial route to market. We installed 527,000 connected hubs cumulatively by the end of 2016, with the number of hubs installed in H2 2016 more than double the number installed in H1 2016. During the year we launched four new Connected Home products in the Hive range; the Active Plug, Window and Door Sensor, Motion Sensor, and Active Lights. We have also redesigned our products for non-UK markets and we are now selling Hive products in North America, with plans for a full launch, including the Hive smart thermostat, in H1 2017. In total we sold over 450,000 Hive products in 2016, more than three times the amount sold in 2015.
In H1 2016 we also launched ‘Boiler IQ’, our innovative connected boiler proposition and first subscription-based product, which uses sensors to remotely diagnose faults, creating a unique experience for services contract customers. We have now installed around 30,000 ‘Boiler IQ’ devices, with very positive feedback. We also continue to integrate our Hive product range with other eco-systems and in H2 2016 we partnered with Amazon Echo, as smart home launch partner in the UK, allowing our Hive customers to control their heating, lighting and plugged-in devices simply by speaking through the Alexa voice assistant. In addition, our energy insight products, My Energy in the UK and Direct Your Energy in North America, are now available to more than 3.6 million customers.
In 2017, we will continue to invest in the business. We will look to expand the Hive product range, including the launch of a water leak detection product enabled by the acquisition of Flowgem in H2 2016, and drive sales of Hive products in North America. We will also look for opportunities to expand into new geographies where we don’t currently serve customers and build new partnerships across further geographies and channels. In addition we will look to move towards a subscription based commercial model, and have already launched a number of trial offers in the UK.
Connected Home reported a 74% increase in gross revenue in 2016, reflecting the increase in the installation of Hive hubs and product sales. However, the business reported an adjusted operating loss and negative adjusted operating cash flow, reflecting investment in infrastructure, product development and capability to support business growth.
Our energy insight products, My Energy in the UK and Direct Your Energy in North America, are now available to more than 3.6 million customers.
Our connected home customer offer is being developed around three categories – peace of mind, home energy management and home automation.
READ MORE ON PAGE 10
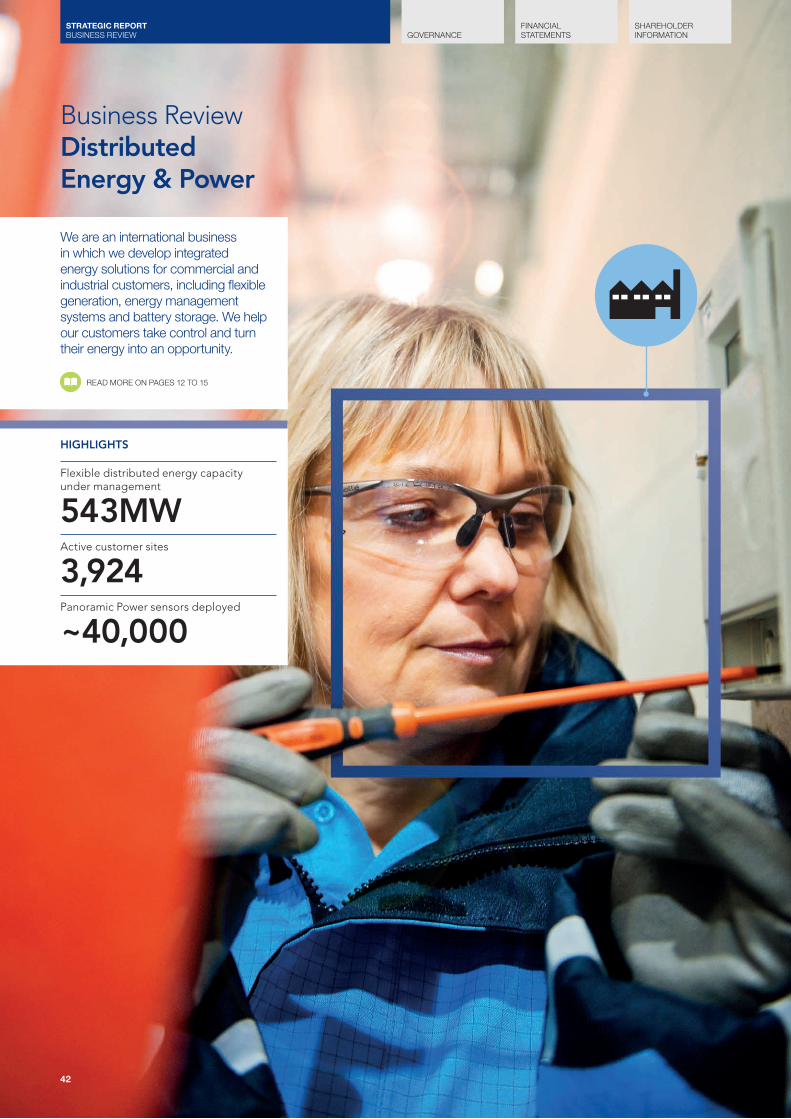
GOVERNANCEFINANCIAL STATEMENTS
SHAREHOLDER INFORMATION
42
STRATEGIC REPORT BUSINESS REVIEW
HIGHLIGHTS
Flexible distributed energy capacity under management
543MWActive customer sites
3,924Panoramic Power sensors deployed
~40,000
Business Review Distributed Energy & Power
We are an international business in which we develop integrated energy solutions for commercial and industrial customers, including flexible generation, energy management systems and battery storage. We help our customers take control and turn their energy into an opportunity.
READ MORE ON PAGES 12 TO 15
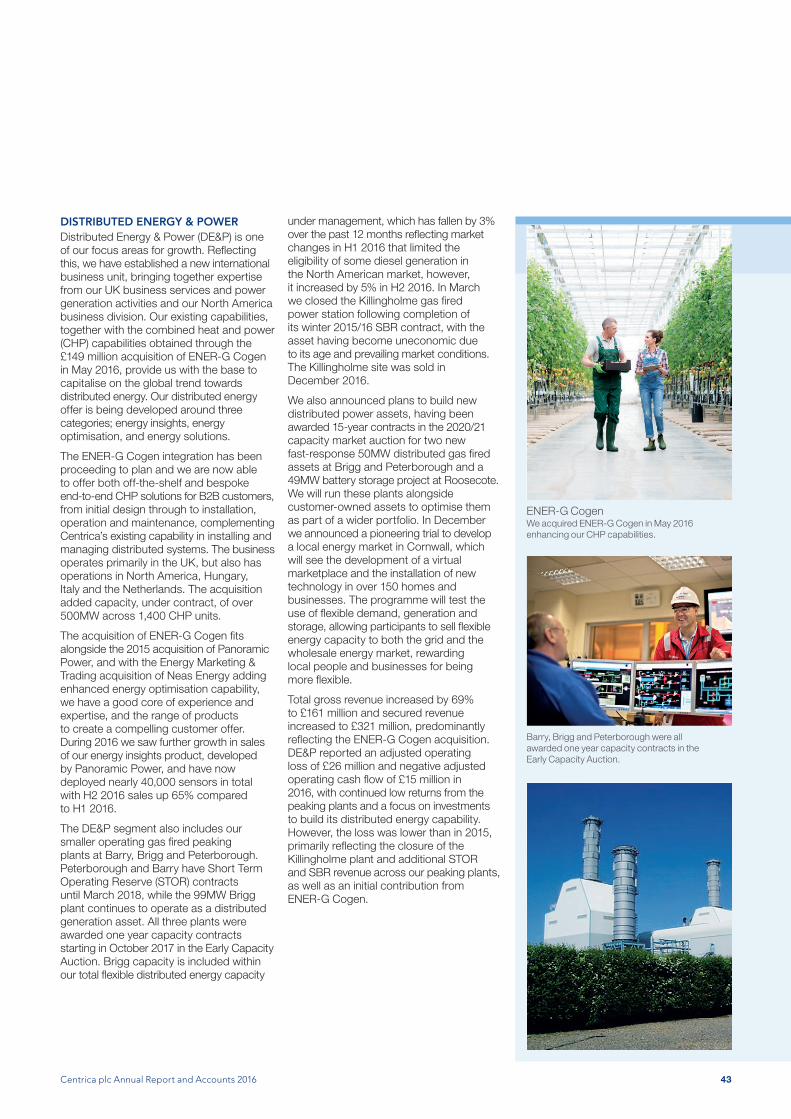
Centrica plc Annual Report and Accounts 2016 43
DISTRIBUTED ENERGY & POWERDistributed Energy & Power (DE&P) is one of our focus areas for growth. Reflecting this, we have established a new international business unit, bringing together expertise from our UK business services and power generation activities and our North America business division. Our existing capabilities, together with the combined heat and power (CHP) capabilities obtained through the £149 million acquisition of ENER-G Cogen in May 2016, provide us with the base to capitalise on the global trend towards distributed energy. Our distributed energy offer is being developed around three categories; energy insights, energy optimisation, and energy solutions.
The ENER-G Cogen integration has been proceeding to plan and we are now able to offer both off-the-shelf and bespoke end-to-end CHP solutions for B2B customers, from initial design through to installation, operation and maintenance, complementing Centrica’s existing capability in installing and managing distributed systems. The business operates primarily in the UK, but also has operations in North America, Hungary, Italy and the Netherlands. The acquisition added capacity, under contract, of over 500MW across 1,400 CHP units.
The acquisition of ENER-G Cogen fits alongside the 2015 acquisition of Panoramic Power, and with the Energy Marketing & Trading acquisition of Neas Energy adding enhanced energy optimisation capability, we have a good core of experience and expertise, and the range of products to create a compelling customer offer. During 2016 we saw further growth in sales of our energy insights product, developed by Panoramic Power, and have now deployed nearly 40,000 sensors in total with H2 2016 sales up 65% compared to H1 2016.
The DE&P segment also includes our smaller operating gas fired peaking plants at Barry, Brigg and Peterborough. Peterborough and Barry have Short Term Operating Reserve (STOR) contracts until March 2018, while the 99MW Brigg plant continues to operate as a distributed generation asset. All three plants were awarded one year capacity contracts starting in October 2017 in the Early Capacity Auction. Brigg capacity is included within our total flexible distributed energy capacity
under management, which has fallen by 3% over the past 12 months reflecting market changes in H1 2016 that limited the eligibility of some diesel generation in the North American market, however, it increased by 5% in H2 2016. In March we closed the Killingholme gas fired power station following completion of its winter 2015/16 SBR contract, with the asset having become uneconomic due to its age and prevailing market conditions. The Killingholme site was sold in December 2016.
We also announced plans to build new distributed power assets, having been awarded 15-year contracts in the 2020/21 capacity market auction for two new fast-response 50MW distributed gas fired assets at Brigg and Peterborough and a 49MW battery storage project at Roosecote. We will run these plants alongside customer-owned assets to optimise them as part of a wider portfolio. In December we announced a pioneering trial to develop a local energy market in Cornwall, which will see the development of a virtual marketplace and the installation of new technology in over 150 homes and businesses. The programme will test the use of flexible demand, generation and storage, allowing participants to sell flexible energy capacity to both the grid and the wholesale energy market, rewarding local people and businesses for being more flexible.
Total gross revenue increased by 69% to £161 million and secured revenue increased to £321 million, predominantly reflecting the ENER-G Cogen acquisition. DE&P reported an adjusted operating loss of £26 million and negative adjusted operating cash flow of £15 million in 2016, with continued low returns from the peaking plants and a focus on investments to build its distributed energy capability. However, the loss was lower than in 2015, primarily reflecting the closure of the Killingholme plant and additional STOR and SBR revenue across our peaking plants, as well as an initial contribution from ENER-G Cogen.
ENER-G CogenWe acquired ENER-G Cogen in May 2016 enhancing our CHP capabilities.
Barry, Brigg and Peterborough were all awarded one year capacity contracts in the Early Capacity Auction.

44
GOVERNANCEFINANCIAL STATEMENTS
SHAREHOLDER INFORMATION
STRATEGIC REPORT BUSINESS REVIEW
HIGHLIGHTS
Adjusted operating profit
▲ £161mNeas Energy serves customers with installed capacity of approximately
8,600MW
Business Review Energy Marketing & Trading
Operating in UK and European energy markets, we provide risk management and wholesale market access for customers and across the Group. We have a strengthening global presence in LNG.
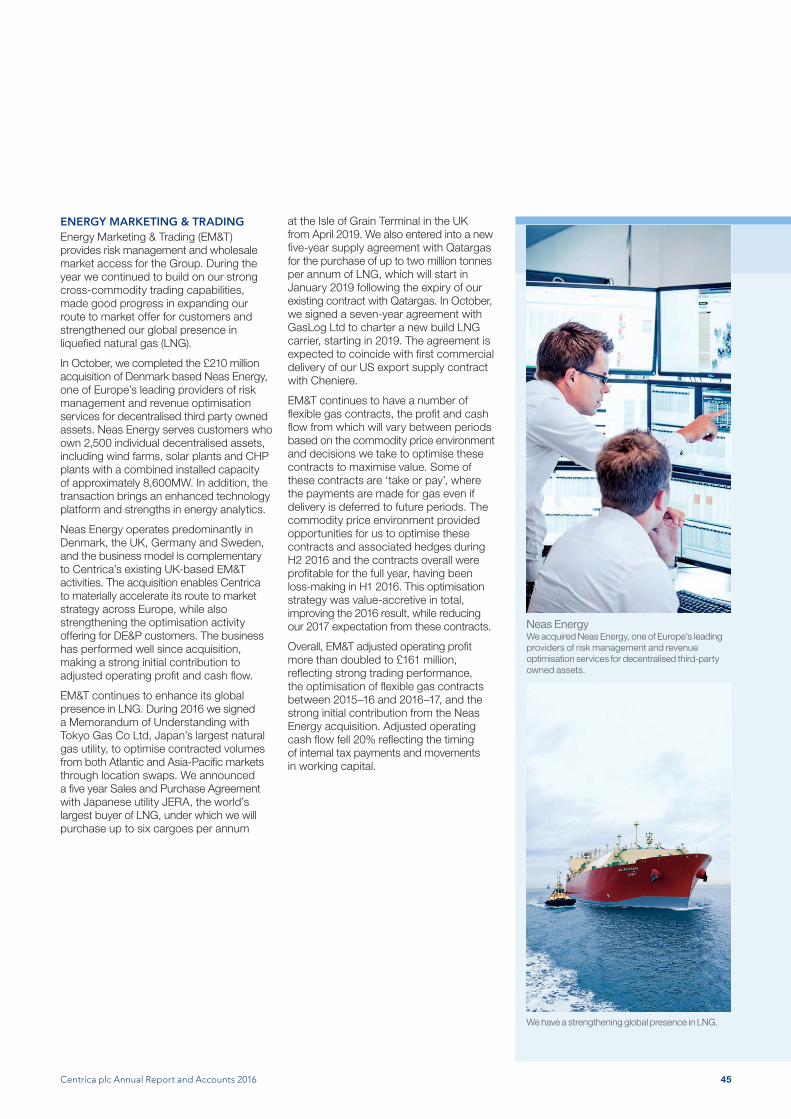
Centrica plc Annual Report and Accounts 2016 45
ENERGY MARKETING & TRADINGEnergy Marketing & Trading (EM&T) provides risk management and wholesale market access for the Group. During the year we continued to build on our strong cross-commodity trading capabilities, made good progress in expanding our route to market offer for customers and strengthened our global presence in liquefied natural gas (LNG).
In October, we completed the £210 million acquisition of Denmark based Neas Energy, one of Europe’s leading providers of risk management and revenue optimisation services for decentralised third party owned assets. Neas Energy serves customers who own 2,500 individual decentralised assets, including wind farms, solar plants and CHP plants with a combined installed capacity of approximately 8,600MW. In addition, the transaction brings an enhanced technology platform and strengths in energy analytics.
Neas Energy operates predominantly in Denmark, the UK, Germany and Sweden, and the business model is complementary to Centrica’s existing UK-based EM&T activities. The acquisition enables Centrica to materially accelerate its route to market strategy across Europe, while also strengthening the optimisation activity offering for DE&P customers. The business has performed well since acquisition, making a strong initial contribution to adjusted operating profit and cash flow.
EM&T continues to enhance its global presence in LNG. During 2016 we signed a Memorandum of Understanding with Tokyo Gas Co Ltd, Japan’s largest natural gas utility, to optimise contracted volumes from both Atlantic and Asia-Pacific markets through location swaps. We announced a five year Sales and Purchase Agreement with Japanese utility JERA, the world’s largest buyer of LNG, under which we will purchase up to six cargoes per annum
at the Isle of Grain Terminal in the UK from April 2019. We also entered into a new five-year supply agreement with Qatargas for the purchase of up to two million tonnes per annum of LNG, which will start in January 2019 following the expiry of our existing contract with Qatargas. In October, we signed a seven-year agreement with GasLog Ltd to charter a new build LNG carrier, starting in 2019. The agreement is expected to coincide with first commercial delivery of our US export supply contract with Cheniere.
EM&T continues to have a number of flexible gas contracts, the profit and cash flow from which will vary between periods based on the commodity price environment and decisions we take to optimise these contracts to maximise value. Some of these contracts are ‘take or pay’, where the payments are made for gas even if delivery is deferred to future periods. The commodity price environment provided opportunities for us to optimise these contracts and associated hedges during H2 2016 and the contracts overall were profitable for the full year, having been loss-making in H1 2016. This optimisation strategy was value-accretive in total, improving the 2016 result, while reducing our 2017 expectation from these contracts.
Overall, EM&T adjusted operating profit more than doubled to £161 million, reflecting strong trading performance, the optimisation of flexible gas contracts between 2015–16 and 2016–17, and the strong initial contribution from the Neas Energy acquisition. Adjusted operating cash flow fell 20% reflecting the timing of internal tax payments and movements in working capital.
Neas EnergyWe acquired Neas Energy, one of Europe’s leading providers of risk management and revenue optimisation services for decentralised third-party owned assets.
We have a strengthening global presence in LNG.
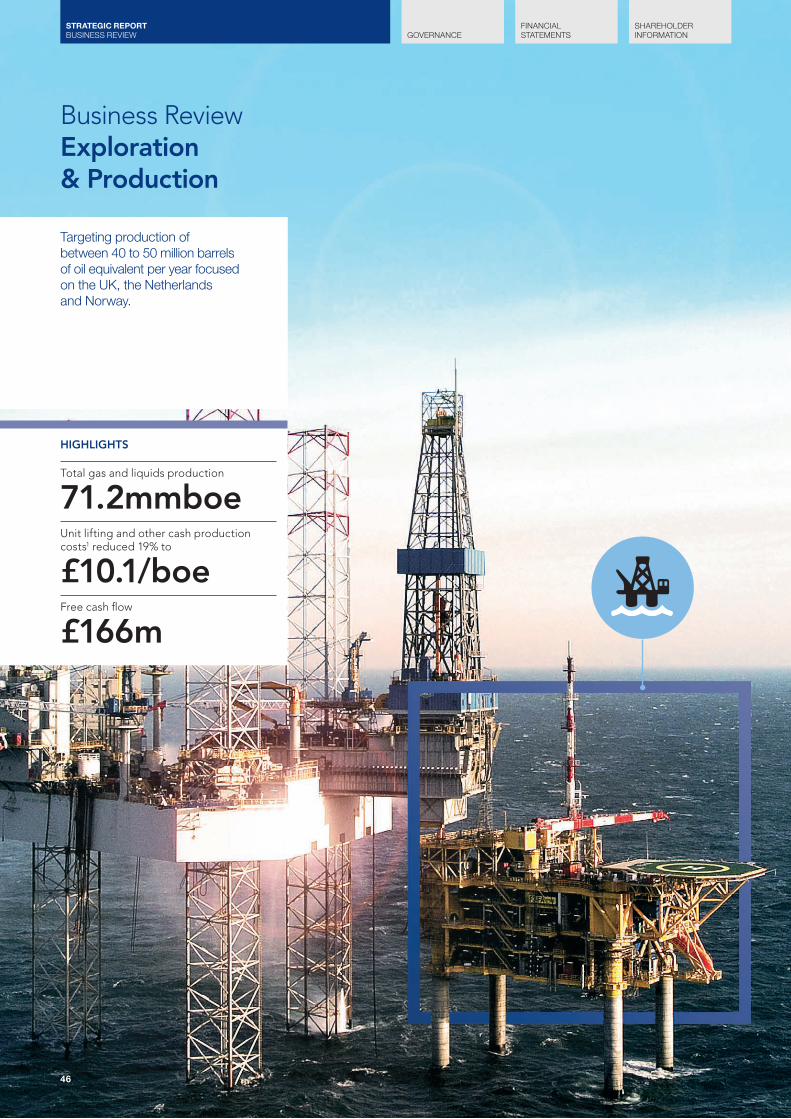
GOVERNANCEFINANCIAL STATEMENTS
SHAREHOLDER INFORMATION
46
STRATEGIC REPORT BUSINESS REVIEW
HIGHLIGHTS
Total gas and liquids production
71.2mmboeUnit lifting and other cash production costs1 reduced 19% to
£10.1/boeFree cash flow
£166m
Business Review Exploration & Production
Targeting production of between 40 to 50 million barrels of oil equivalent per year focused on the UK, the Netherlands and Norway.
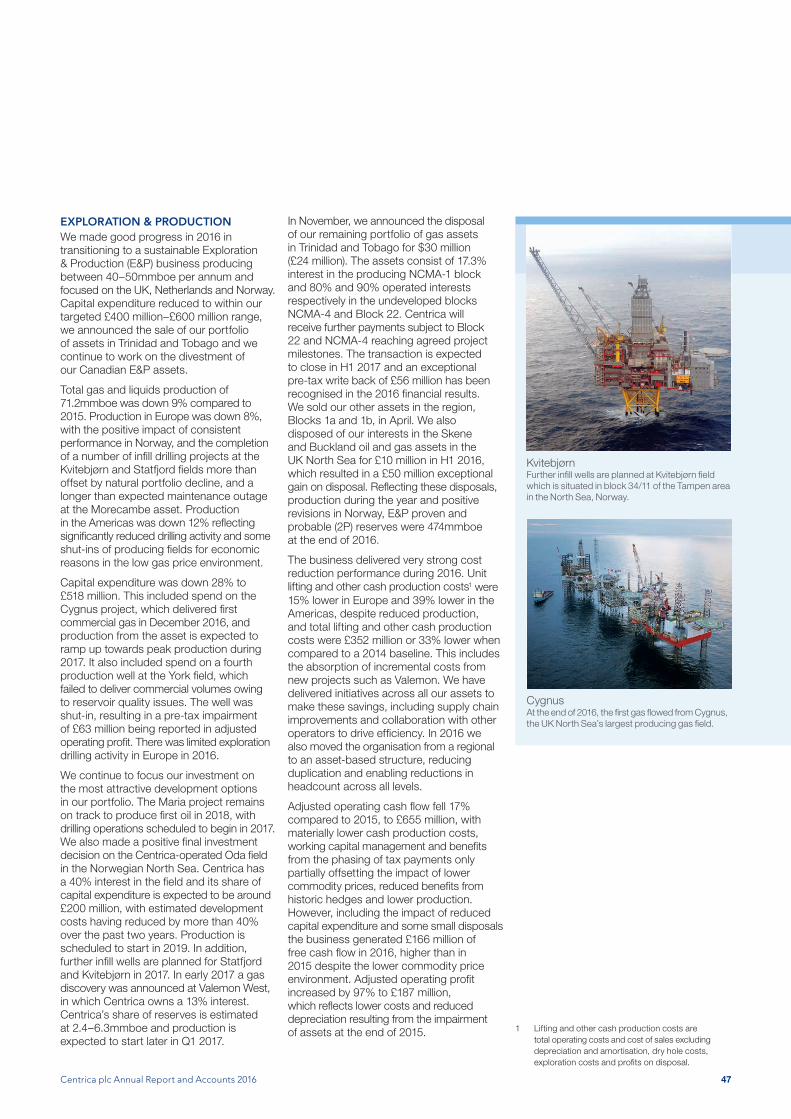
1 Lifting and other cash production costs are total operating costs and cost of sales excluding depreciation and amortisation, dry hole costs, exploration costs and profits on disposal.
Centrica plc Annual Report and Accounts 2016 47
KvitebjørnFurther infill wells are planned at Kvitebjørn field which is situated in block 34/11 of the Tampen area in the North Sea, Norway.
EXPLORATION & PRODUCTIONWe made good progress in 2016 in transitioning to a sustainable Exploration & Production (E&P) business producing between 40–50mmboe per annum and focused on the UK, Netherlands and Norway. Capital expenditure reduced to within our targeted £400 million–£600 million range, we announced the sale of our portfolio of assets in Trinidad and Tobago and we continue to work on the divestment of our Canadian E&P assets.
Total gas and liquids production of 71.2mmboe was down 9% compared to 2015. Production in Europe was down 8%, with the positive impact of consistent performance in Norway, and the completion of a number of infill drilling projects at the Kvitebjørn and Statfjord fields more than offset by natural portfolio decline, and a longer than expected maintenance outage at the Morecambe asset. Production in the Americas was down 12% reflecting significantly reduced drilling activity and some shut-ins of producing fields for economic reasons in the low gas price environment.
Capital expenditure was down 28% to £518 million. This included spend on the Cygnus project, which delivered first commercial gas in December 2016, and production from the asset is expected to ramp up towards peak production during 2017. It also included spend on a fourth production well at the York field, which failed to deliver commercial volumes owing to reservoir quality issues. The well was shut-in, resulting in a pre-tax impairment of £63 million being reported in adjusted operating profit. There was limited exploration drilling activity in Europe in 2016.
We continue to focus our investment on the most attractive development options in our portfolio. The Maria project remains on track to produce first oil in 2018, with drilling operations scheduled to begin in 2017. We also made a positive final investment decision on the Centrica-operated Oda field in the Norwegian North Sea. Centrica has a 40% interest in the field and its share of capital expenditure is expected to be around £200 million, with estimated development costs having reduced by more than 40% over the past two years. Production is scheduled to start in 2019. In addition, further infill wells are planned for Statfjord and Kvitebjørn in 2017. In early 2017 a gas discovery was announced at Valemon West, in which Centrica owns a 13% interest. Centrica’s share of reserves is estimated at 2.4–6.3mmboe and production is expected to start later in Q1 2017.
In November, we announced the disposal of our remaining portfolio of gas assets in Trinidad and Tobago for $30 million (£24 million). The assets consist of 17.3% interest in the producing NCMA-1 block and 80% and 90% operated interests respectively in the undeveloped blocks NCMA-4 and Block 22. Centrica will receive further payments subject to Block 22 and NCMA-4 reaching agreed project milestones. The transaction is expected to close in H1 2017 and an exceptional pre-tax write back of £56 million has been recognised in the 2016 financial results. We sold our other assets in the region, Blocks 1a and 1b, in April. We also disposed of our interests in the Skene and Buckland oil and gas assets in the UK North Sea for £10 million in H1 2016, which resulted in a £50 million exceptional gain on disposal. Reflecting these disposals, production during the year and positive revisions in Norway, E&P proven and probable (2P) reserves were 474mmboe at the end of 2016.
The business delivered very strong cost reduction performance during 2016. Unit lifting and other cash production costs1 were 15% lower in Europe and 39% lower in the Americas, despite reduced production, and total lifting and other cash production costs were £352 million or 33% lower when compared to a 2014 baseline. This includes the absorption of incremental costs from new projects such as Valemon. We have delivered initiatives across all our assets to make these savings, including supply chain improvements and collaboration with other operators to drive efficiency. In 2016 we also moved the organisation from a regional to an asset-based structure, reducing duplication and enabling reductions in headcount across all levels.
Adjusted operating cash flow fell 17% compared to 2015, to £655 million, with materially lower cash production costs, working capital management and benefits from the phasing of tax payments only partially offsetting the impact of lower commodity prices, reduced benefits from historic hedges and lower production. However, including the impact of reduced capital expenditure and some small disposals the business generated £166 million of free cash flow in 2016, higher than in 2015 despite the lower commodity price environment. Adjusted operating profit increased by 97% to £187 million, which reflects lower costs and reduced depreciation resulting from the impairment of assets at the end of 2015.
CygnusAt the end of 2016, the first gas flowed from Cygnus, the UK North Sea’s largest producing gas field.
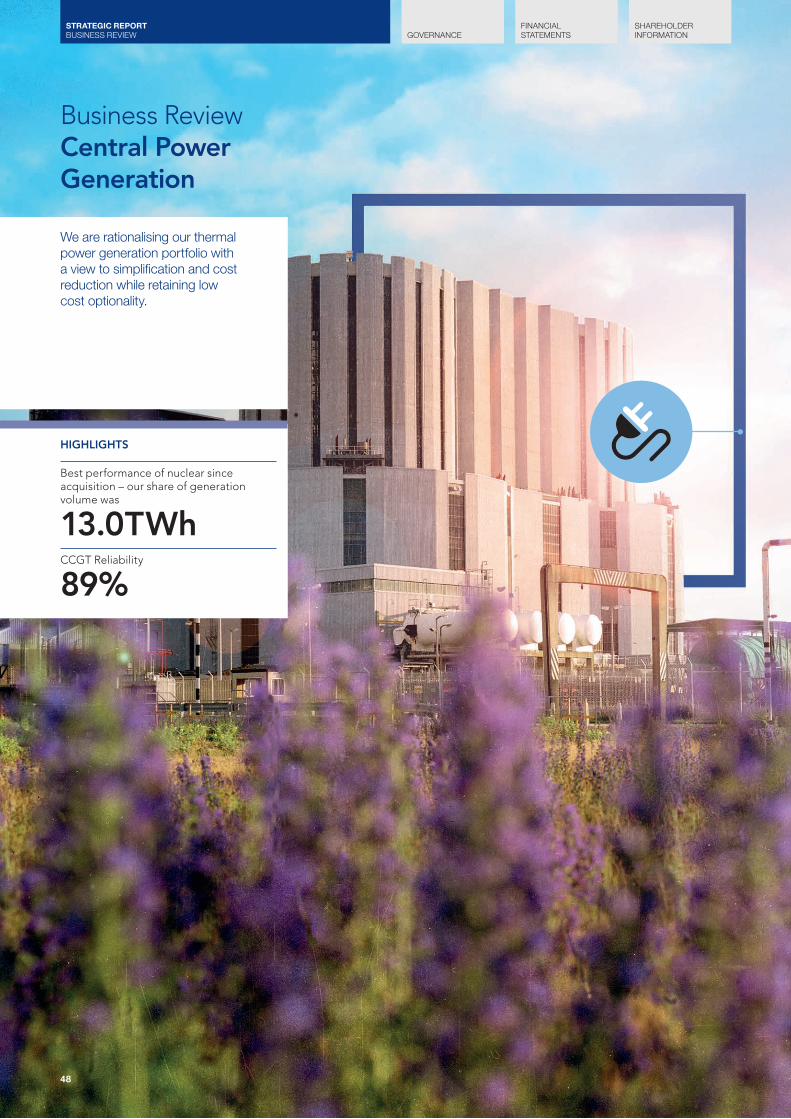
GOVERNANCEFINANCIAL STATEMENTS
SHAREHOLDER INFORMATION
48
STRATEGIC REPORT BUSINESS REVIEW
HIGHLIGHTS
Best performance of nuclear since acquisition – our share of generation volume was
13.0 TWhCCGT Reliability
89%
Business Review Central Power Generation
We are rationalising our thermal power generation portfolio with a view to simplification and cost reduction while retaining low cost optionality.
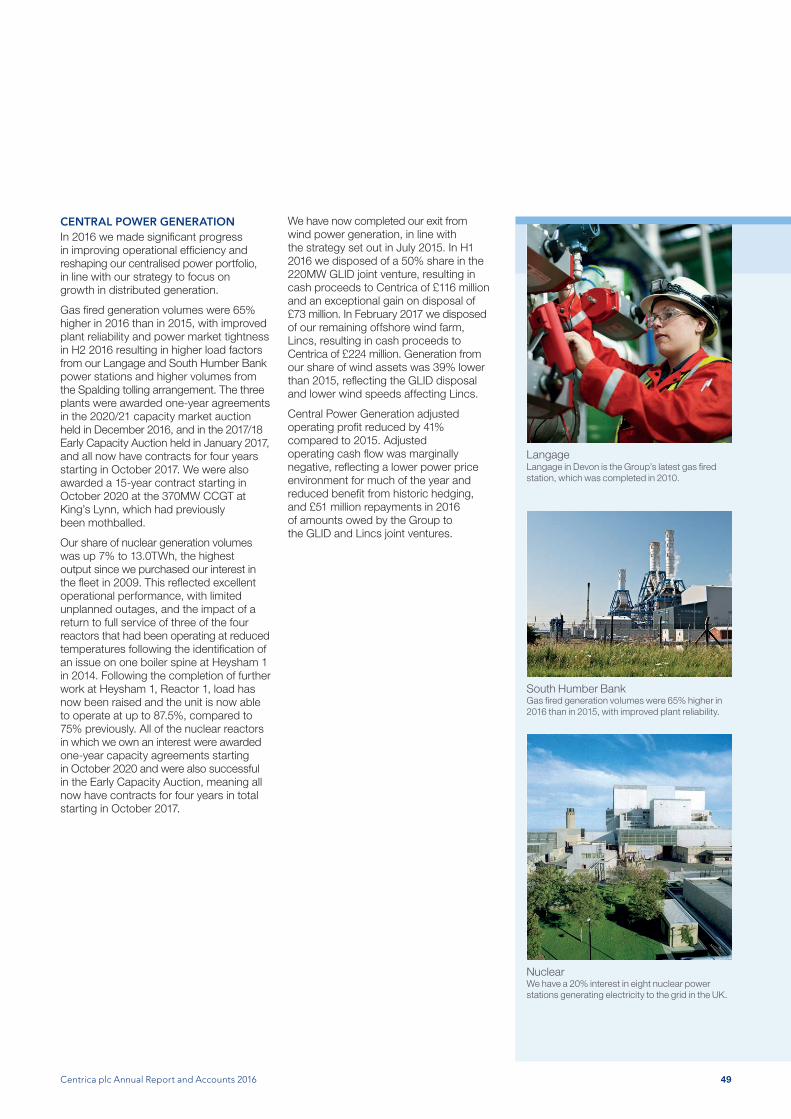
Centrica plc Annual Report and Accounts 2016 49
South Humber BankGas fired generation volumes were 65% higher in 2016 than in 2015, with improved plant reliability.
NuclearWe have a 20% interest in eight nuclear power stations generating electricity to the grid in the UK.
CENTRAL POWER GENERATIONIn 2016 we made significant progress in improving operational efficiency and reshaping our centralised power portfolio, in line with our strategy to focus on growth in distributed generation.
Gas fired generation volumes were 65% higher in 2016 than in 2015, with improved plant reliability and power market tightness in H2 2016 resulting in higher load factors from our Langage and South Humber Bank power stations and higher volumes from the Spalding tolling arrangement. The three plants were awarded one-year agreements in the 2020/21 capacity market auction held in December 2016, and in the 2017/18 Early Capacity Auction held in January 2017, and all now have contracts for four years starting in October 2017. We were also awarded a 15-year contract starting in October 2020 at the 370MW CCGT at King’s Lynn, which had previously been mothballed.
Our share of nuclear generation volumes was up 7% to 13.0TWh, the highest output since we purchased our interest in the fleet in 2009. This reflected excellent operational performance, with limited unplanned outages, and the impact of a return to full service of three of the four reactors that had been operating at reduced temperatures following the identification of an issue on one boiler spine at Heysham 1 in 2014. Following the completion of further work at Heysham 1, Reactor 1, load has now been raised and the unit is now able to operate at up to 87.5%, compared to 75% previously. All of the nuclear reactors in which we own an interest were awarded one-year capacity agreements starting in October 2020 and were also successful in the Early Capacity Auction, meaning all now have contracts for four years in total starting in October 2017.
We have now completed our exit from wind power generation, in line with the strategy set out in July 2015. In H1 2016 we disposed of a 50% share in the 220MW GLID joint venture, resulting in cash proceeds to Centrica of £116 million and an exceptional gain on disposal of £73 million. In February 2017 we disposed of our remaining offshore wind farm, Lincs, resulting in cash proceeds to Centrica of £224 million. Generation from our share of wind assets was 39% lower than 2015, reflecting the GLID disposal and lower wind speeds affecting Lincs.
Central Power Generation adjusted operating profit reduced by 41% compared to 2015. Adjusted operating cash flow was marginally negative, reflecting a lower power price environment for much of the year and reduced benefit from historic hedging, and £51 million repayments in 2016 of amounts owed by the Group to the GLID and Lincs joint ventures.
LangageLangage in Devon is the Group’s latest gas fired station, which was completed in 2010.

GOVERNANCEFINANCIAL STATEMENTS
SHAREHOLDER INFORMATION
50
STRATEGIC REPORT BUSINESS REVIEW
HIGHLIGHTS
Limited stock in Rough for the first part of 2016 was
33–36TWh
Business Review Centrica Storage
The Group operates the Rough gas storage facility, which is a strategic storage asset for the UK.
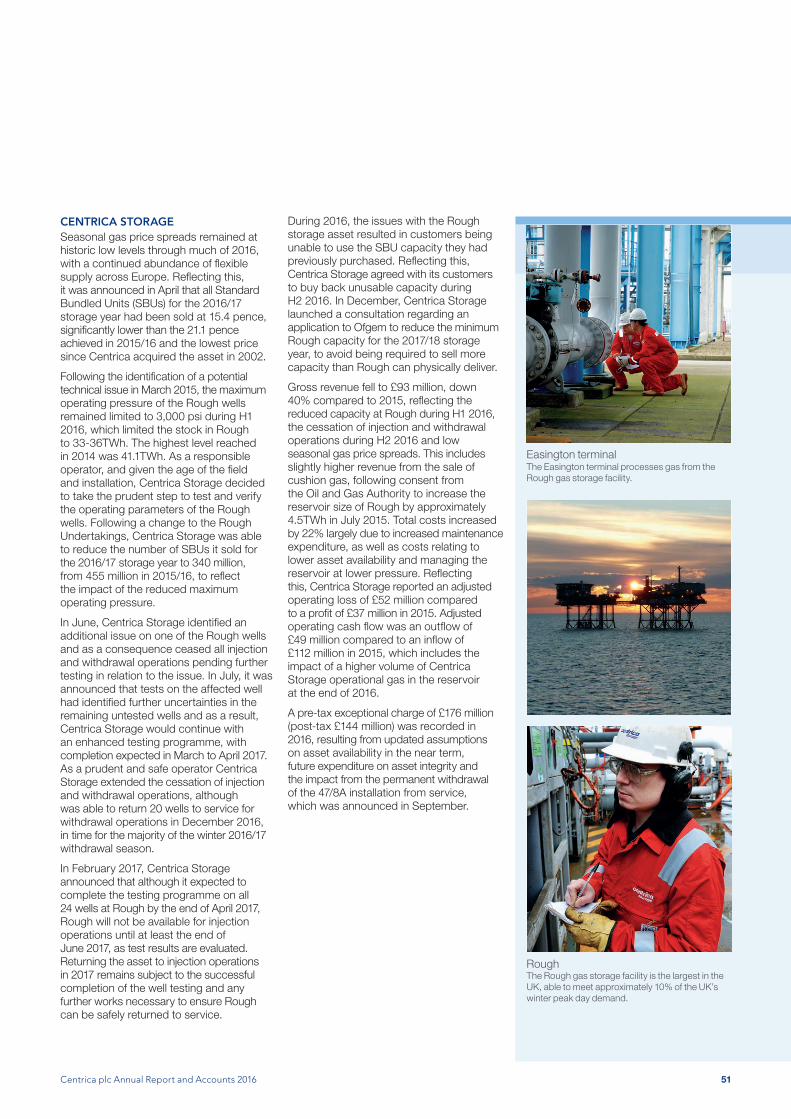
Centrica plc Annual Report and Accounts 2016 51
CENTRICA STORAGESeasonal gas price spreads remained at historic low levels through much of 2016, with a continued abundance of flexible supply across Europe. Reflecting this, it was announced in April that all Standard Bundled Units (SBUs) for the 2016/17 storage year had been sold at 15.4 pence, significantly lower than the 21.1 pence achieved in 2015/16 and the lowest price since Centrica acquired the asset in 2002.
Following the identification of a potential technical issue in March 2015, the maximum operating pressure of the Rough wells remained limited to 3,000 psi during H1 2016, which limited the stock in Rough to 33-36TWh. The highest level reached in 2014 was 41.1TWh. As a responsible operator, and given the age of the field and installation, Centrica Storage decided to take the prudent step to test and verify the operating parameters of the Rough wells. Following a change to the Rough Undertakings, Centrica Storage was able to reduce the number of SBUs it sold for the 2016/17 storage year to 340 million, from 455 million in 2015/16, to reflect the impact of the reduced maximum operating pressure.
In June, Centrica Storage identified an additional issue on one of the Rough wells and as a consequence ceased all injection and withdrawal operations pending further testing in relation to the issue. In July, it was announced that tests on the affected well had identified further uncertainties in the remaining untested wells and as a result, Centrica Storage would continue with an enhanced testing programme, with completion expected in March to April 2017. As a prudent and safe operator Centrica Storage extended the cessation of injection and withdrawal operations, although was able to return 20 wells to service for withdrawal operations in December 2016, in time for the majority of the winter 2016/17 withdrawal season.
In February 2017, Centrica Storage announced that although it expected to complete the testing programme on all 24 wells at Rough by the end of April 2017, Rough will not be available for injection operations until at least the end of June 2017, as test results are evaluated. Returning the asset to injection operations in 2017 remains subject to the successful completion of the well testing and any further works necessary to ensure Rough can be safely returned to service.
During 2016, the issues with the Rough storage asset resulted in customers being unable to use the SBU capacity they had previously purchased. Reflecting this, Centrica Storage agreed with its customers to buy back unusable capacity during H2 2016. In December, Centrica Storage launched a consultation regarding an application to Ofgem to reduce the minimum Rough capacity for the 2017/18 storage year, to avoid being required to sell more capacity than Rough can physically deliver.
Gross revenue fell to £93 million, down 40% compared to 2015, reflecting the reduced capacity at Rough during H1 2016, the cessation of injection and withdrawal operations during H2 2016 and low seasonal gas price spreads. This includes slightly higher revenue from the sale of cushion gas, following consent from the Oil and Gas Authority to increase the reservoir size of Rough by approximately 4.5TWh in July 2015. Total costs increased by 22% largely due to increased maintenance expenditure, as well as costs relating to lower asset availability and managing the reservoir at lower pressure. Reflecting this, Centrica Storage reported an adjusted operating loss of £52 million compared to a profit of £37 million in 2015. Adjusted operating cash flow was an outflow of £49 million compared to an inflow of £112 million in 2015, which includes the impact of a higher volume of Centrica Storage operational gas in the reservoir at the end of 2016.
A pre-tax exceptional charge of £176 million (post-tax £144 million) was recorded in 2016, resulting from updated assumptions on asset availability in the near term, future expenditure on asset integrity and the impact from the permanent withdrawal of the 47/8A installation from service, which was announced in September.
Easington terminalThe Easington terminal processes gas from the Rough gas storage facility.
RoughThe Rough gas storage facility is the largest in the UK, able to meet approximately 10% of the UK’s winter peak day demand.

52
GOVERNANCEFINANCIAL STATEMENTS
SHAREHOLDER INFORMATION
STRATEGIC REPORT GROUP FINANCIAL REVIEW
Group Financial Review
Profit for the year increased to £885 million and after adjusting for losses attributable to non-controlling interests, adjusted earnings increased by 4% to £895 million.
GROUP REVENUEGroup revenue fell 3% to £27.1 billion (2015: £28.0 billion). This primarily reflects the impact of lower commodity prices on tariffs in UK and North America energy supply and on achieved prices in Exploration & Production (E&P) and Energy Marketing & Trading (EM&T), lower consumption due to warmer weather in North America and reduced account holdings.
OPERATING PROFITFrom 1 January 2016 new reporting segments are in place. 2015 comparatives have been restated accordingly. Within the statement, reference is made to a number of different profit measures, as shown on page 53.
Total adjusted operating profit increased 4% to £1,515 million. Profit from customer-facing businesses increased by 9%, with strong EM&T performance, a return to profitability in UK Business, favourable foreign exchange moves and cost efficiencies more than offsetting the impact of lower account holdings. Combined profitability from the asset businesses – E&P, Central Power Generation (CPG) and Centrica Storage (CSL) – was lower, with cost efficiencies only partially offsetting the impact of lower commodity prices on E&P and CPG and lower CSL profitability due to asset availability and low spreads.
GROUP FINANCE CHARGE AND TAXNet finance costs increased to £300 million (2015: £279 million), predominantly reflecting a higher interest cost on bonds following the issuance of £1 billion equivalent of hybrid securities in April 2015 and lower interest income following the disposal of Lincs wind farm debt in 2015.
Business performance taxation on profit was broadly flat at £282 million (2015: £286 million) and after taking account of tax on joint ventures and associates, the adjusted tax charge was £298 million (2015: £294 million). The resultant adjusted tax rate for the Group was 25% (2015: 26%). An effective tax rate calculation is shown on page 53.
The low UK adjusted effective tax rate is due principally to upstream losses being taxed at a rate higher than the UK standard rate, together with the impact of a 1% reduction to that standard rate.
GROUP EARNINGS AND DIVIDENDProfit for the year increased to £885 million (2015: £833 million) and after adjusting for losses attributable to non-controlling interests, adjusted earnings increased by 4% to £895 million (2015: £863 million). Adjusted basic EPS fell 2% to 16.8 pence (2015: 17.2 pence) reflecting a higher number of shares in issue due to the effects of the 7% equity placing in May and the scrip dividend.
The statutory profit attributable to shareholders for the period was £1,672 million (2015: loss of £747 million). The reconciling items between Group profit for the period from business performance and statutory profit are related to exceptional items and certain re-measurements. The difference compared to 2015 is principally due to a £27 million net exceptional credit (2015: charge of £1,846 million) and a higher net gain from certain re-measurements of £750 million (2015: £129 million). The Group reported a statutory basic EPS of 31.4 pence (2015: loss of 14.9 pence).
In addition to the interim dividend of 3.6 pence per share, the proposed final dividend is 8.4 pence giving a total full year dividend of 12.0 pence (2015: 12.0 pence).
Group revenue
£27.1bn2015: £28.0bn
▼ 3%
Adjusted operating profit
£1,515m2015: £1,459m
▲ 4%
Adjusted basic earnings per share (EPS)
16.8p2015: 17.2p
▼ 2%
Statutory operating profit/(loss)
£2,486m2015: £(857)m
● nm
Full year dividend per share
12.0p2015: 12.0p
0%
Basic earnings per share
31.4p2015: (14.9p)
● nm
Adjusted effective tax rate
25%2015: 26%
▼ 1ppt
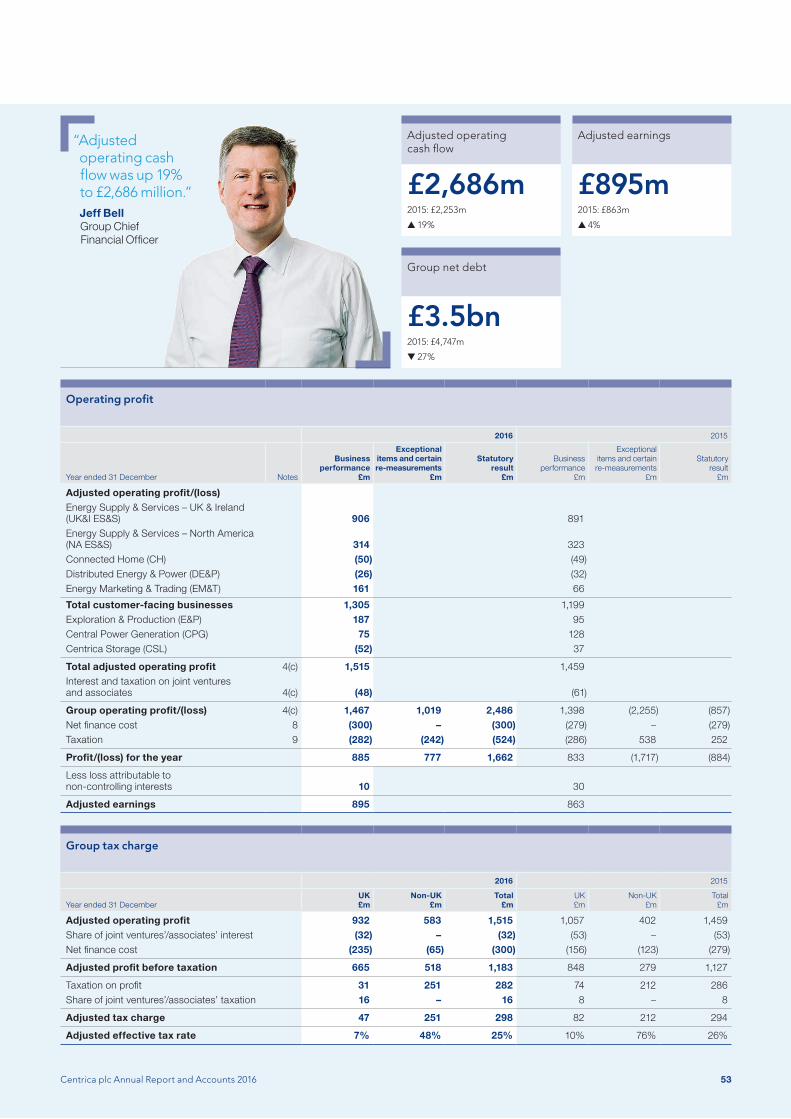
Centrica plc Annual Report and Accounts 2016 53
Operating profit
2016 2015
Year ended 31 December Notes
Businessperformance
£m
Exceptionalitems and certainre-measurements
£m
Statutoryresult
£m
Businessperformance
£m
Exceptionalitems and certainre-measurements
£m
Statutoryresult
£m
Adjusted operating profit/(loss)Energy Supply & Services – UK & Ireland (UK&I ES&S) 906 891Energy Supply & Services – North America (NA ES&S) 314 323Connected Home (CH) (50) (49)Distributed Energy & Power (DE&P) (26) (32)Energy Marketing & Trading (EM&T) 161 66
Total customer-facing businesses 1,305 1,199Exploration & Production (E&P) 187 95Central Power Generation (CPG) 75 128Centrica Storage (CSL) (52) 37
Total adjusted operating profit 4(c) 1,515 1,459Interest and taxation on joint ventures and associates 4(c) (48) (61)
Group operating profit/(loss) 4(c) 1,467 1,019 2,486 1,398 (2,255) (857)Net finance cost 8 (300) – (300) (279) – (279)Taxation 9 (282) (242) (524) (286) 538 252
Profit/(loss) for the year 885 777 1,662 833 (1,717) (884)
Less loss attributable to non-controlling interests 10 30
Adjusted earnings 895 863
Group tax charge
2016 2015
Year ended 31 DecemberUK£m
Non-UK£m
Total£m
UK£m
Non-UK£m
Total£m
Adjusted operating profit 932 583 1,515 1,057 402 1,459Share of joint ventures’/associates’ interest (32) – (32) (53) – (53)Net finance cost (235) (65) (300) (156) (123) (279)
Adjusted profit before taxation 665 518 1,183 848 279 1,127
Taxation on profit 31 251 282 74 212 286Share of joint ventures’/associates’ taxation 16 – 16 8 – 8
Adjusted tax charge 47 251 298 82 212 294
Adjusted effective tax rate 7% 48% 25% 10% 76% 26%
Adjusted operating cash flow
Adjusted earnings
£2,686m £895m2015: £2,253m
▲ 19%
2015: £863m
▲ 4%
Group net debt
£3.5bn2015: £4,747m
▼ 27%
“Adjusted operating cash flow was up 19% to £2,686 million.”Jeff BellGroup Chief Financial Officer
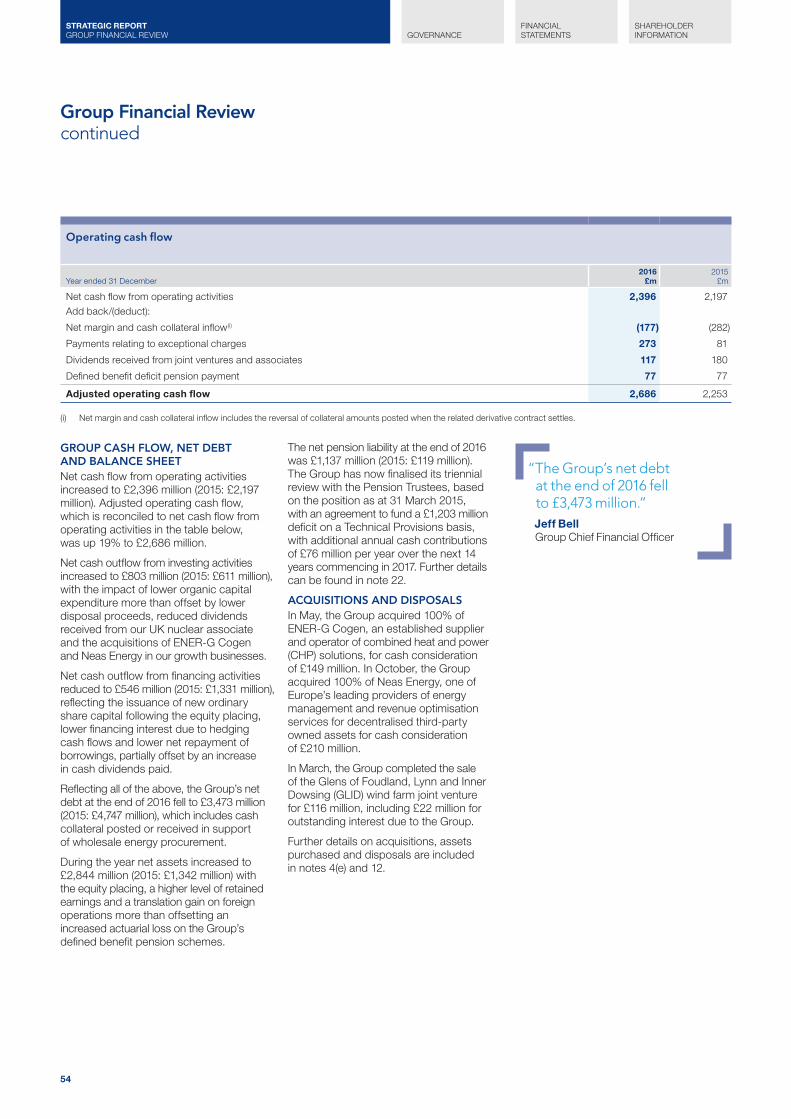
54
GOVERNANCEFINANCIAL STATEMENTS
SHAREHOLDER INFORMATION
STRATEGIC REPORT GROUP FINANCIAL REVIEW
Group Financial Reviewcontinued
GROUP CASH FLOW, NET DEBT AND BALANCE SHEETNet cash flow from operating activities increased to £2,396 million (2015: £2,197 million). Adjusted operating cash flow, which is reconciled to net cash flow from operating activities in the table below, was up 19% to £2,686 million.
Net cash outflow from investing activities increased to £803 million (2015: £611 million), with the impact of lower organic capital expenditure more than offset by lower disposal proceeds, reduced dividends received from our UK nuclear associate and the acquisitions of ENER-G Cogen and Neas Energy in our growth businesses.
Net cash outflow from financing activities reduced to £546 million (2015: £1,331 million), reflecting the issuance of new ordinary share capital following the equity placing, lower financing interest due to hedging cash flows and lower net repayment of borrowings, partially offset by an increase in cash dividends paid.
Reflecting all of the above, the Group’s net debt at the end of 2016 fell to £3,473 million (2015: £4,747 million), which includes cash collateral posted or received in support of wholesale energy procurement.
During the year net assets increased to £2,844 million (2015: £1,342 million) with the equity placing, a higher level of retained earnings and a translation gain on foreign operations more than offsetting an increased actuarial loss on the Group’s defined benefit pension schemes.
The net pension liability at the end of 2016 was £1,137 million (2015: £119 million). The Group has now finalised its triennial review with the Pension Trustees, based on the position as at 31 March 2015, with an agreement to fund a £1,203 million deficit on a Technical Provisions basis, with additional annual cash contributions of £76 million per year over the next 14 years commencing in 2017. Further details can be found in note 22.
ACQUISITIONS AND DISPOSALSIn May, the Group acquired 100% of ENER-G Cogen, an established supplier and operator of combined heat and power (CHP) solutions, for cash consideration of £149 million. In October, the Group acquired 100% of Neas Energy, one of Europe’s leading providers of energy management and revenue optimisation services for decentralised third-party owned assets for cash consideration of £210 million.
In March, the Group completed the sale of the Glens of Foudland, Lynn and Inner Dowsing (GLID) wind farm joint venture for £116 million, including £22 million for outstanding interest due to the Group.
Further details on acquisitions, assets purchased and disposals are included in notes 4(e) and 12.
“ The Group’s net debt at the end of 2016 fell to £3,473 million.”Jeff BellGroup Chief Financial Officer
Operating cash flow
Year ended 31 December2016
£m2015
£m
Net cash flow from operating activities 2,396 2,197Add back/(deduct):
Net margin and cash collateral inflow (i) (177) (282)
Payments relating to exceptional charges 273 81
Dividends received from joint ventures and associates 117 180
Defined benefit deficit pension payment 77 77
Adjusted operating cash flow 2,686 2,253
(i) Net margin and cash collateral inflow includes the reversal of collateral amounts posted when the related derivative contract settles.

Centrica plc Annual Report and Accounts 2016 55
EXCEPTIONAL ITEMSA net exceptional pre-tax charge of £11 million was recognised during the period (2015: £2,358 million).
As a result of the implementation of a salary cap on pensionable pay for the Centrica Pension Plan final salary scheme, the Group recognised a past service credit of £78 million. It also recognised a £53 million net credit on onerous power procurement contracts, with a reduction in onerous provisions relating to its UK gas fired power station tolling contract and its US wind power procurement arrangements partially offset by an additional charge following termination of the Group’s Dutch gas fired power station tolling contract. The Group recognised a £228 million charge relating to restructuring associated with implementing the Group’s new operating model.
The Group recognised a £73 million gain on disposal of the GLID wind farm joint venture, a £50 million gain on disposal of the Skene and Buckland oil and gas assets and a £22 million loss on disposal of two non-core businesses, Airtron Canada and Airco Mechanical, in North America.
The Group also recognised a £135 million write back on some E&P assets, reflecting increases in reserves, cost savings, revisions to decommissioning estimates and the agreed sale proceeds for its Trinidad and Tobago gas assets. A £26 million write back was also recognised on the Group’s Kings Lynn CCGT, primarily reflecting the 15-year capacity market contract awarded in December 2016. It also recognised a £176 million impairment on its UK gas storage facility, Rough, in H1 2016 reflecting updated assumptions on asset availability in the near term and the permanent withdrawal of its 47/8A installation from service.
Taxation on these charges generated a credit of £9 million (2015: £477 million) and combined with a £29 million credit related to a decrease in upstream UK tax rates, total net exceptional items after tax generated a credit of £27 million (2015: £1,846 million net exceptional charge). Further details can be found in note 7.
CERTAIN RE-MEASUREMENTSThe Group enters into a number of forward energy trades to protect and optimise the value of its underlying production, generation, storage and transportation assets (and similar capacity or off-take contracts), as well as to meet the future needs of our customers. A number of these arrangements are considered to be derivative financial instruments and are required to be fair-valued under IAS 39. The Group has shown the fair value adjustments on these commodity derivative trades separately as certain re-measurements, as they do not reflect the underlying performance of the business because they are economically related to our upstream assets, capacity/off-take contracts or downstream demand, which are typically not fair valued. The operating profit in the statutory results includes a net pre-tax gain of £1,030 million (2015: £103 million) relating to these re-measurements. The Group recognises the realised gains and losses on these contracts in business performance when the underlying transaction occurs. The profits arising from the physical purchase and sale of commodities during the year, which reflect the prices in the underlying contracts, are not impacted by these re-measurements. See note 7 for further details.
EVENTS AFTER THE BALANCE SHEET DATEOn 13 January 2017, Centrica announced the sale of its 50% share in the Lincs wind farm for net cash proceeds of £224 million. The transaction completed on 17 February 2017.
On 16 February 2017, Centrica Storage announced that following further well tests at the Rough gas storage field, injection services cannot currently be offered for the 2017/18 storage year. Analysis of the testing programme is expected to be completed by 30 June 2017.
Further details of events after the balance sheet date are described in note 26.
ACCOUNTING POLICIESUK listed companies are required to comply with the European regulation to report consolidated financial statements in conformity with International Financial Reporting Standards (IFRS) as adopted by the European Union. The Group’s specific accounting measures, including changes of accounting presentation and selected key sources of estimation uncertainty, are explained in notes 1, 2 and 3.
RISKS AND CAPITAL MANAGEMENTThe Group’s principal risks and uncertainties are set out on pages 56 to 64. Details of how the Group has managed financial risks such as liquidity and credit risk are set out in note S3. Details on the Group’s capital management processes are provided under sources of finance in note 24(a).

GOVERNANCEFINANCIAL STATEMENTS
SHAREHOLDER INFORMATION
56
STRATEGIC REPORT OUR PRINCIPAL RISKS AND UNCERTAINTIES
Our Principal Risks and Uncertainties
LINKS TO STRATEGYIn line with our strategy we are concentrating more investment on our customer-facing businesses organised into the two global customer-facing divisions of Centrica Consumer and Centrica Business. We are focused on delivering high levels of customer service, improving customer engagement and loyalty, and developing innovative products, offers and solutions for both residential and business customers, underpinned by investment in technology. Our asset businesses of Exploration and Production and Centrica Storage continue to play an important role in our portfolio providing cash flow diversity and balance sheet strength.
Our activities for near-term implementation and delivery of our strategy are framed around the five priorities below. These priorities are a lens through which we assess our risks and discussions around risk appetite. Each priority has associated risks, which are managed as part of our overall system of risk management and internal control.
Managing our risks and uncertainties is key to achieving our priorities.
Cash flow growth and strategic momentum
Cost efficiency and simplification
Safety, compliance and conduct
Customer satisfaction and operational excellence
People and building capability
Our five priorities

Centrica plc Annual Report and Accounts 2016 57
MANAGING THE RISKS TO THE DELIVERY OF OUR PRIORITIESRisk management is fundamental to the way the Group is governed and managed. Our system of risk management and internal control comprises the following elements that are assessed for effectiveness annually:
• Business Principles: sets our expected behaviours across the organisation.
• Enterprise Risk Framework: incorporates the principal risks within the Group Risk Universe, as outlined below.
• Board and Committees’ governance: committees are structured to be aligned with the Principal Risks identified, as outlined below.
• Executive management oversight: establishing appropriate executive processes to ensure appropriate planning and performance management.
• Operational management accountability and certification: represents the first line accountability for the risk and control environment.
• Delegations of Authority: structure within which accountability is delegated through the organisation in accordance with identified risk appetite.
• Management systems: the detailed Policies, Standards and Procedures establishing the requirement for process level controls that are monitored throughout the organisation.
• Assurance providers: second and third line assurance provided to ensure that Policies, Standards and Procedures are being followed and that risks are being mitigated in line with risk appetite.
The Group’s strategic review in 2015 and its implementation in 2016 highlighted emerging risks and provided an opportunity to simplify and standardise how significant risks are managed. We have identified the differing nature of our risks including:
• Risks that require standards where our tolerance for error is generally very low. This will include Health, Safety, Environment and Security, Legal and Regulatory Compliance, Financial Processing and Reporting, Information Systems and Data Security, and Ethical and Behavioural Standards. For these risks there will be management systems providing clearly prescribed standards with ring-fenced functional monitoring and assurance.
• Risks where judgement is required within a range of acceptable outcomes in order to deliver our priorities. This includes areas where we need to take a certain level of risk such as in commodity trading and our investment in the growth areas of the business.
• Risks resulting from external factors where we have limited influence over their occurrence, but can influence the impact on our business through our actions.
ASSESSING OUR PRINCIPAL RISKS IN 2016As in previous years we identified and assessed our risks within the categories of Principal Risk overleaf to ensure appropriate mitigating activities. During 2016 the risks that were prioritised for leadership attention, and those that had most significant impact in our assessment of the future viability of the organisation, particularly related to:
• ensuring we deliver a safe and compliant operating environment in all respects;
• our strategic transformation and its impact on our people;
• the changing political environment, and the potential for further intervention, including Brexit;
• the evolving regulatory requirements, particularly the outcome of the Competition and Markets Authority (CMA) investigation;
• ongoing volatility in the commodity market with its impact on pricing; and
• our commitment to our growth businesses and excellence in customer service.
We align our assessment of the extent of risk we wish to take with our priorities and express our risk appetite in relation to these priorities. For example, in relation to ensuring we have a safe and compliant operating environment our appetite is very low, whereas we are prepared to take risks in relation to delivering our growth objectives.
The Principal Risks, and their related components, are allocated oversight through the Board and its Committees as indicated overleaf. The table also provides an indication of the risk mitigation strategy for each risk category, reflecting our appetite for risk, and our view on changes in the risk climate compared with 2015.
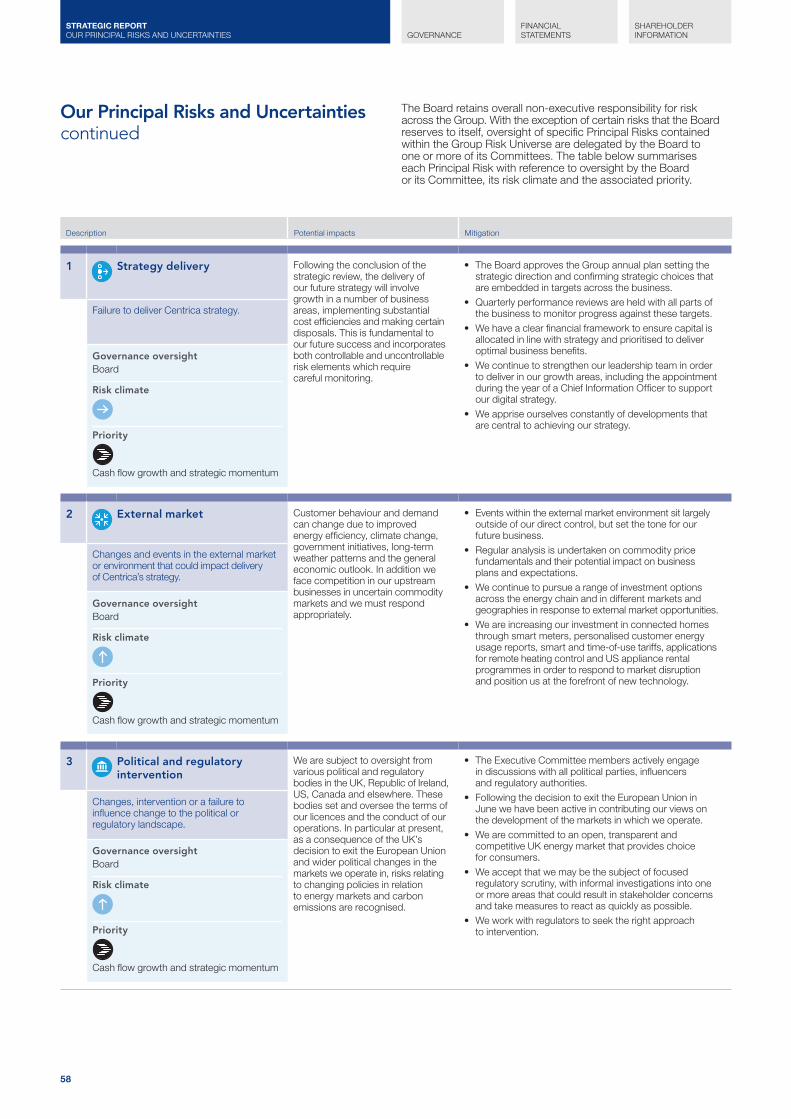
58
GOVERNANCEFINANCIAL STATEMENTS
SHAREHOLDER INFORMATION
STRATEGIC REPORT OUR PRINCIPAL RISKS AND UNCERTAINTIES
Our Principal Risks and Uncertaintiescontinued
Description Potential impacts Mitigation
1 Strategy delivery Following the conclusion of the strategic review, the delivery of our future strategy will involve growth in a number of business areas, implementing substantial cost efficiencies and making certain disposals. This is fundamental to our future success and incorporates both controllable and uncontrollable risk elements which require careful monitoring.
• The Board approves the Group annual plan setting the strategic direction and confirming strategic choices that are embedded in targets across the business.
• Quarterly performance reviews are held with all parts of the business to monitor progress against these targets.
• We have a clear financial framework to ensure capital is allocated in line with strategy and prioritised to deliver optimal business benefits.
• We continue to strengthen our leadership team in order to deliver in our growth areas, including the appointment during the year of a Chief Information Officer to support our digital strategy.
• We apprise ourselves constantly of developments that are central to achieving our strategy.
Failure to deliver Centrica strategy.
Governance oversightBoard
Risk climate
Priority
Cash flow growth and strategic momentum
2 External market Customer behaviour and demand can change due to improved energy efficiency, climate change, government initiatives, long-term weather patterns and the general economic outlook. In addition we face competition in our upstream businesses in uncertain commodity markets and we must respond appropriately.
• Events within the external market environment sit largely outside of our direct control, but set the tone for our future business.
• Regular analysis is undertaken on commodity price fundamentals and their potential impact on business plans and expectations.
• We continue to pursue a range of investment options across the energy chain and in different markets and geographies in response to external market opportunities.
• We are increasing our investment in connected homes through smart meters, personalised customer energy usage reports, smart and time-of-use tariffs, applications for remote heating control and US appliance rental programmes in order to respond to market disruption and position us at the forefront of new technology.
Changes and events in the external market or environment that could impact delivery of Centrica’s strategy.
Governance oversightBoard
Risk climate
Priority
Cash flow growth and strategic momentum
3 Political and regulatory intervention
We are subject to oversight from various political and regulatory bodies in the UK, Republic of Ireland, US, Canada and elsewhere. These bodies set and oversee the terms of our licences and the conduct of our operations. In particular at present, as a consequence of the UK’s decision to exit the European Union and wider political changes in the markets we operate in, risks relating to changing policies in relation to energy markets and carbon emissions are recognised.
• The Executive Committee members actively engage in discussions with all political parties, influencers and regulatory authorities.
• Following the decision to exit the European Union in June we have been active in contributing our views on the development of the markets in which we operate.
• We are committed to an open, transparent and competitive UK energy market that provides choice for consumers.
• We accept that we may be the subject of focused regulatory scrutiny, with informal investigations into one or more areas that could result in stakeholder concerns and take measures to react as quickly as possible.
• We work with regulators to seek the right approach to intervention.
Changes, intervention or a failure to influence change to the political or regulatory landscape.
Governance oversightBoard
Risk climate
Priority
Cash flow growth and strategic momentum
The Board retains overall non-executive responsibility for risk across the Group. With the exception of certain risks that the Board reserves to itself, oversight of specific Principal Risks contained within the Group Risk Universe are delegated by the Board to one or more of its Committees. The table below summarises each Principal Risk with reference to oversight by the Board or its Committee, its risk climate and the associated priority.

Centrica plc Annual Report and Accounts 2016 59
Description Potential impacts Mitigation
4 Brand, trust and reputation Our primary focus is to serve our customers and satisfy their changing needs in all of the markets we operate in. We also actively manage our brands and reputation, in order to protect and develop our competitive position amongst a wide range of stakeholders.
• During the year a review of our brand positioning has been undertaken to ensure that this is aligned with our priorities.
• The primary mechanism by which we review changes in our brand position is through NPS and other metrics as described on page 19.
• We are focused on providing affordable energy and excellent service to deliver a fair, simplified and transparent offering to all of our consumers.
• We engage with NGOs, consumer and customer groups, political parties, regulators, charities and other stakeholders to identify solutions to help reduce bills and improve trust in the industry.
Competitive positioning and protection of the Centrica and subsidiary brands.
Governance oversightBoard
Risk climate
Priority
Customer satisfaction and operational excellence
5 Business planning, forecasting and performance
We prioritise how we use our resources based on our business plans and forecasts. Failure to accurately plan and forecast taking into account the changing business environment could result in suboptimal decisions and failure to realise anticipated benefits.
• 2016 was the first full year of planning using a refreshed approach designed to underpin the delivery of the priorities.
• Group functions have adopted standardised planning processes in support of the business priorities, driving improved discussion and integration.
• Quarterly performance review meetings involving the Executive Committee enable the discussion of plans and forecasts with revisions identified as necessary.
• Constructive challenge is provided across each level of the business to ensure that the key assumptions remain robust and appropriate.
Business planning, forecasting, risk management and achievement of anticipated benefits.
Governance oversightBoard
Risk climate
Priority
Cash flow growth and strategic momentum
6 Customer service The delivery of high quality customer service is central to our business strategy. With the entry of new competitors to the market, customers are increasingly likely to switch supplier if they face an unacceptable customer experience. Remaining at the forefront of digital developments and innovating to provide choice and control for our customers is critical.
• Great customer outcomes are at the heart of our strategy and their requirements shape our processes and interactions.
• Our risk appetite reflects the need to be innovative and to invest appropriately to deliver new products and service to our customers.
• We are wholly focused on providing affordable energy and excellent service, working to deliver a fair, simplified and transparent offering to consumers and protecting the most vulnerable, fuel-poor households through initiatives to improve energy efficiency or with financial advice and aid.
• We continue to invest in connected home solutions and the development of digital platforms.
• We have a sustained programme of simplification including the use of mobile apps, online service and breakdown bookings, and electronic billing.
• Where we experience issues we invest to put them right, including making substantial improvements in our UK Business environment during 2016.
Failure to provide good quality customer service through the customer lifecycle.
Governance oversightBoard
Risk climate
Priority
Customer satisfaction and operational excellence
Risk climate
Unchanged Increased Reduced in some parts of the business, but unchanged in others
Overall unchanged, but differing drivers

60
GOVERNANCEFINANCIAL STATEMENTS
SHAREHOLDER INFORMATION
STRATEGIC REPORT OUR PRINCIPAL RISKS AND UNCERTAINTIES
Our Principal Risks and Uncertaintiescontinued
Description Potential impacts Mitigation
7 People The attraction, retention, development and motivation of our people and leaders are critical factors in the successful execution of our strategy. In addition, we require the right behaviours from our leaders and employees to deliver our business strategy in accordance with our values and Business Principles.
• We have an established People Committee that has overseen the people related challenges inherent in our transformation programme.
• We continue to evolve a clearly defined people strategy based on culture and engagement, equality and wellbeing, talent development, training and reward and recognition.
• Our Business Principles are currently under review to ensure they drive the right behaviours across our organisation, with a view to launching our new Code of Conduct in 2017.
• We regularly review organisational capability in critical business areas, reward strategies for key skills, talent management, and learning and development programmes through external benchmarking.
• We engage with trade unions on restructuring and issues that could impact terms and conditions with clear and open processes to promote an environment of trust and honesty.
• Feedback from our annual employee engagement survey is acted upon by leadership teams.
Attraction, retention, and succession of the right people with the right skills in the right role at the right time.
Governance oversightBoard and Safety, Health, Environment, Security and Ethics Committee
Risk climate
Priority
People and building capability
8 Change management The successful delivery of business change is fundamental to our future success, and includes organisational, cultural and technical transformation. At the same time, we must continue to focus on maintaining our systems of internal control throughout.
• Fortnightly transformation Steering Group meetings are attended by the Executive Committee.
• Change activity is managed through a structured network of programme offices providing oversight and governance at the appropriate level.
• We have established a dedicated change capability at Group and business unit level to ensure benefits realisation, prioritisation of efforts and share best practice.
• Our people capability has continued to be developed through 2016 to ensure we have the right skills to deliver our future plans.
• We have a clear controls transition framework underpinning our system of internal control.
Execution of change programmes and business restructuring.
Governance oversightBoard
Risk climate
Priority
Cost efficiency and simplification
9 Asset development, availability and performance
Failure to invest in the maintenance and development of our assets could result in underperformance, assets being out of service or significant safety issues, particularly given the aging nature of a number of our assets. Operational integrity is critical to be able to deliver performance in line with the strategic objectives.
• Capital allocation and investment decisions governed through the Investment Committee with the decision right remaining with the Group Chief Executive.
• Group-wide minimum standards applied to all assets, whether operated or non-operated, in order to have confidence in their integrity.
• Issues related to the integrity of our assets are responded to quickly, resulting in a number of unplanned shut downs during 2016 to ensure that appropriate investigations could be undertaken and remediation performed.
• The leadership teams in our asset-based businesses have been refreshed to ensure that there is appropriate experience to provide oversight of this critical area.
Investment, development and integrity of operated and non-operated assets.
Governance oversightBoard
Risk climate
Priority
Customer satisfaction and operational excellence

Centrica plc Annual Report and Accounts 2016 61
Description Potential impacts Mitigation
10 Sourcing and supplier management
Our business operations rely on products and services provided through third parties, including outsourced activities, infrastructure and operating responsibility for some assets. We rely on these parties to comply with not only contractual terms, but also legal, regulatory and ethical business requirements.
• All suppliers are required to sign up to our ‘Ethical Procurement’ policies and procedures.
• Financial health, risk and anti-bribery and corruption due diligence and monitoring is implemented in supplier selection and contract renewal processes.
• Joint venture audits are conducted in relation to third party operation of critical assets.
• We review the ethical conduct of our suppliers and are currently implementing a programme of supplier visits to provide additional assurance over practices employed.
• We appointed a new Chief Procurement Officer in 2016 and are implementing a programme of activities to ensure consistent Group-wide practices are implemented in line with our policies.
Dependency on, and management of, third parties to deliver the products and services for which they are contracted to the agreed time, cost and quality.
Governance oversightBoard and Safety, Health, Environment, Security and Ethics Committee
Risk climate
Priority
Customer satisfaction and operational excellence
11 Health, safety, environment and security (HSES)
Our operations have the potential to result in personal or environmental harm, or operational loss. Significant HSES events could also have regulatory, legal, financial and reputational impacts that would adversely affect some or all of our brands and businesses.
• HSES remains our highest priority with a continued focus across all our assets and operations.
• We undertake regular reviews and have thorough assurance processes in place in relation to these risks, with reporting to the HSES Committee on a monthly basis and full discussion of all issues arising.
• Third line of defence responsibility for HSES has been transferred into Internal Audit to ensure appropriate objectivity and reinforce our assurance provision.
• We have strengthened our controls through the development of the HSES management system, focusing on areas including process safety, driving and working at heights.
• We continue to invest in training to ensure we maintain safe operating practices, including HSES leadership programmes.
• Security intelligence and operating procedures, as well as crisis management and business continuity plans are regularly evaluated and tested.
HSES hazards and regulations associated with Centrica’s operations.
Governance oversightBoard and Safety, Health, Environment, Security and Ethics Committee
Risk climate
Priority
Safety, compliance and conduct
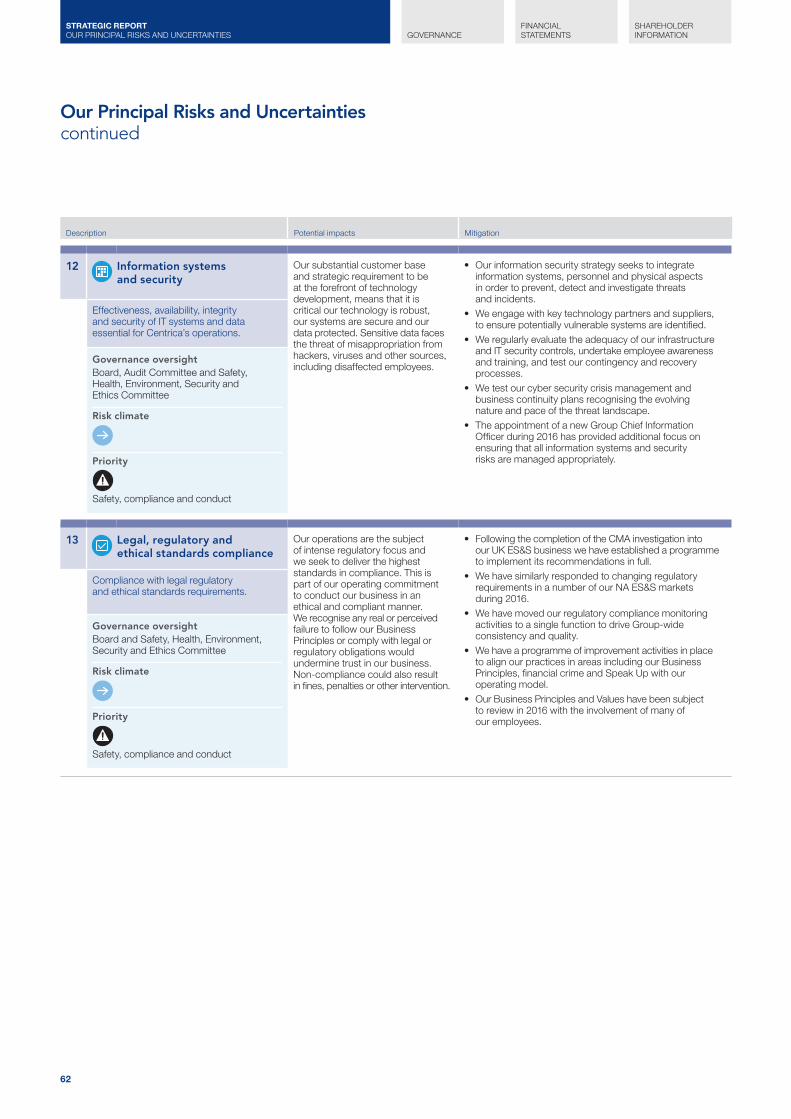
62
GOVERNANCEFINANCIAL STATEMENTS
SHAREHOLDER INFORMATION
STRATEGIC REPORT OUR PRINCIPAL RISKS AND UNCERTAINTIES
Our Principal Risks and Uncertaintiescontinued
Description Potential impacts Mitigation
12 Information systems and security
Our substantial customer base and strategic requirement to be at the forefront of technology development, means that it is critical our technology is robust, our systems are secure and our data protected. Sensitive data faces the threat of misappropriation from hackers, viruses and other sources, including disaffected employees.
• Our information security strategy seeks to integrate information systems, personnel and physical aspects in order to prevent, detect and investigate threats and incidents.
• We engage with key technology partners and suppliers, to ensure potentially vulnerable systems are identified.
• We regularly evaluate the adequacy of our infrastructure and IT security controls, undertake employee awareness and training, and test our contingency and recovery processes.
• We test our cyber security crisis management and business continuity plans recognising the evolving nature and pace of the threat landscape.
• The appointment of a new Group Chief Information Officer during 2016 has provided additional focus on ensuring that all information systems and security risks are managed appropriately.
Effectiveness, availability, integrity and security of IT systems and data essential for Centrica’s operations.
Governance oversightBoard, Audit Committee and Safety, Health, Environment, Security and Ethics Committee
Risk climate
Priority
Safety, compliance and conduct
13 Legal, regulatory and ethical standards compliance
Our operations are the subject of intense regulatory focus and we seek to deliver the highest standards in compliance. This is part of our operating commitment to conduct our business in an ethical and compliant manner. We recognise any real or perceived failure to follow our Business Principles or comply with legal or regulatory obligations would undermine trust in our business. Non-compliance could also result in fines, penalties or other intervention.
• Following the completion of the CMA investigation into our UK ES&S business we have established a programme to implement its recommendations in full.
• We have similarly responded to changing regulatory requirements in a number of our NA ES&S markets during 2016.
• We have moved our regulatory compliance monitoring activities to a single function to drive Group-wide consistency and quality.
• We have a programme of improvement activities in place to align our practices in areas including our Business Principles, financial crime and Speak Up with our operating model.
• Our Business Principles and Values have been subject to review in 2016 with the involvement of many of our employees.
Compliance with legal regulatory and ethical standards requirements.
Governance oversightBoard and Safety, Health, Environment, Security and Ethics Committee
Risk climate
Priority
Safety, compliance and conduct

Centrica plc Annual Report and Accounts 2016 63
Description Potential impacts Mitigation
14 Financial market Our financial performance and price competitiveness is dependent upon our ability to manage exposure to wholesale commodity prices for gas, oil, coal, carbon and power, interest rates for our long term borrowing, fluctuations in various foreign currencies, and environmental factors.
• The Audit Committee regularly assesses the effectiveness of control mechanisms within EM&T.
• Following a review undertaken during the year, weekly meetings have been introduced within EM&T involving our specialist financial risk team and operational management.
• The Group Financial Risk Management Committee meets monthly to review Group financial exposures and assess compliance with risk limits.
• We have an active hedging programme to mitigate exposure to commodity and financial market volatility, which has enabled British Gas to freeze prices on the standard tariff until August 2017.
• As we move into new trading arrangements, including expanding our LNG business and as a result of the acquisition of Neas Energy, we are focused on ensuring that our financial risk policies remain appropriate to the risks we face.
• We are investing in our systems to further automate our control environment.
Exposure to market movements, including commodity prices and volumes, inflation, interest rates and currency fluctuations.
Governance oversightBoard and Audit Committee
Risk climate
Priority
Cash flow growth and strategic momentum
15 Balance sheet strength and credit position
Certain events and activities have a direct impact on our credit ratings and liquidity which could increase the cost of, and access to, financing. In a changing external environmental we need to be able to respond to macro-economic or political influences. In particular, the lower interest rate adversely impacts our pension liabilities.
• We assess available resources on a monthly basis and this analysis underpins our going concern assumption and viability analysis as described on page 64.
• Significant committed facilities are maintained with sufficient cash held on deposit to meet fluctuations as they arise.
• Our private placement, (see note 25), has strengthened our balance sheet.
• Counterparty exposures are restricted by setting credit limits for each counterparty, where possible with reference to published credit ratings.
• Wholesale credit risks associated with commodity trading and treasury positions are managed in accordance with Group policy.
• We continue to seek to repair the pension deficit and have responded with a number of actions implemented during 2016 (see note 22).
• We consider accounting assumptions impacting on our balance sheet carefully, including decommissioning and impairment, as described on page 76.
Group balance sheet management and credit position.
Governance oversightBoard and Audit Committee
Risk climate
Priority
Cash flow growth and strategic momentum

64
GOVERNANCEFINANCIAL STATEMENTS
SHAREHOLDER INFORMATION
STRATEGIC REPORT OUR PRINCIPAL RISKS AND UNCERTAINTIES
Our Principal Risks and Uncertaintiescontinued
Description Potential impacts Mitigation
16 Financial processing and reporting
We must be able to maintain robust financial systems to produce accurate financial statements underpinned by appropriate accounting judgements and the right information to support optimal business decisions. Our obligation includes maintaining processes to avoid misstatement through fraud or error so that the confidence of our customers, investors and regulators is not undermined and they can rely on available information.
• The Audit Committee reviews carefully our compliance with our internal policies and external requirements.
• As described above, we maintain a robust control framework with a focus on our financial controls and management self-assessment compliance.
• Our dedicated Group Controls function monitors our critical financial risks and mitigating controls and reports to the Financial Risk, Assurance and Controls Committee quarterly.
• We maintain an effective working relationship with our external auditors, listening to their advice and recommendations, and they rely on our internal assurance and monitoring activities where appropriate.
Accuracy and completeness of internal and external financial information.
Governance oversightBoard and Audit Committee
Risk climate
Priority
Safety, compliance and conduct
VIABILITY STATEMENTIn accordance with provisions C.2.1 and C.2.2 of the 2014 UK Corporate Governance Code, the Directors have assessed the prospects for the Group over a longer time period than that required in adopting the going concern basis of accounting.
In making this assessment the Directors have taken into account: the liquidity analysis performed in relation to the Group’s net debt and available credit facilities; the current business performance, Group annual plan for 2017 and strategic plan for the years beyond this; consideration of potential risks and uncertainties in the delivery of the strategic plan through a number of potential scenarios and events; and available mitigating actions.
The Board has reviewed the timeframe over which it makes this assessment and considers three years to be the appropriate timeframe for consideration. The factors taken into account in determining the time period include: the alignment of this assessment with the period over which we perform liquidity analysis for the purpose of monitoring credit metrics; the short term nature of some of our more significant risks, such as the potential for disruption in our customer-facing markets and volatility related to the current political and economic environment; and the increasing uncertainty inherent in estimations beyond this time period. Three years balances the shorter term planning horizons in our customer-facing businesses, with the longer term requirements of our more asset based businesses.
The Directors carry out a robust risk assessment of the Principal Risks outlined on pages 58 to 64. In making this assessment consideration of the potential severe, but plausible, impact has been made where the realisation of those risks is considered more than remote, taking into account the effectiveness of our systems of risk management and internal control. The potential impact is based on known consequences, historical evidence and similar events observed in the market. The consequences have been combined into a number of scenarios and events that have been compared with the available headroom based on our liquidity analysis. We have considered available mitigating actions such as the potential disposal of assets, additional restrictions and limits on capital investment and further cost reduction opportunities in making this assessment.
Whilst the Group has a strong position in its chosen markets, with strong brands, a highly skilled customer-facing workforce and reliable operations, there are a number of risks that could have a significant impact on the financial performance of the Group. The risks that we considered, through a number of scenarios, to be of most significance in making the assessment of viability included:
• the potential for regulatory or political intervention resulting in a significant impact on our customer margins and retention;
• our inability to respond to disruption in the market and grow our businesses as indicated in our strategic plan;
• risks associated with keeping our people and our customers safe, incorporating potential adverse consequences of breaches in regulatory compliance obligations;
• challenges relating to the security of our systems and keeping our data safe, including cyber-security;
• the impact of a loss of containment in our upstream assets; and
• a sustained significant adverse movement in commodity prices.
In making this assessment we have taken the worst case assumptions, including all significant adverse events on the above scenarios, and determined their potential impact on the available sources of liquidity and net debt throughout the period.
Based on the conclusions of this assessment, the Directors confirm that they have a reasonable expectation that the Group will continue to operate and meet its liabilities, as they fall due, over a period of at least three years.

Governance
Centrica plc Annual Report and Accounts 2016 65
GOVERNANCE
The ultimate objective of corporate governance is to promote good decision-making and effective stewardship of the Company to ensure its sustainable success.
66 Board of Directors
68 Senior Executives
69 Directors’ and Corporate Governance Report
83 Remuneration Report
100 Independent Auditors’ Report

66
STRATEGIC REPORT
FINANCIAL STATEMENTS
SHAREHOLDER INFORMATION
GOVERNANCE BOARD OF DIRECTORS
Board of DirectorsFull biographies can be found at centrica.com
RICK HAYTHORNTHWAITEChairmanRick joined the Board as a Non-Executive Director on 14 October 2013. He was appointed Chairman of the Board on 1 January 2014 and is Chairman of the Nominations Committee.Skills and experienceRick has a wealth of knowledge in the energy industry and has significant board experience, both as an executive and non-executive. He led the rescue of Invensys from 2001 to 2005 and the defence, turnaround and subsequent sale of Blue Circle Industries from 1997 to 2001. He has served on the boards of Network Rail as chairman and Cookson, Lafarge, ICI and Land Securities as a non-executive director.External appointmentsChairman of the global board of MasterCard Incorporated, QIO Technologies and Arc International.
IAIN CONNGroup Chief ExecutiveIain was appointed Group Chief Executive on 1 January 2015 and is Chairman of the Disclosure Committee.Skills and experienceIain possesses a deep understanding of the energy sector built up over a lifetime in the industry and has demonstrated strong commitment to customers, safety and technology. Iain was previously BP’s chief executive, downstream (BP’s refining and marketing division) a position he held for seven years. Iain was a board member of BP for 10 years from 2004 and had previously held a number of senior roles throughout BP including in trading, exploration and production, and the management of corporate functions such as safety, marketing, technology and human resources.External appointmentsNon-executive director of BT Group plc.
JEFF BELLGroup Chief Financial OfficerJeff was appointed Group Chief Financial Officer and joined the Board on 1 August 2015.Skills and experienceJeff has a broad range of finance experience. He joined the Group’s Direct Energy business in Toronto in 2002 where he held various senior finance positions before moving to the Company’s head office in 2008 to support the Group Chief Executive and to lead the Group Strategy team. In 2011 he was appointed Director of Corporate Finance. Prior to Centrica, Jeff worked in Toronto for both KPMG, where he qualified as a chartered accountant, and the Boston Consulting Group.
MARGHERITA DELLA VALLENon-Executive DirectorMargherita joined the Board on 1 January 2011 and is Chairman of the Audit Committee.Skills and experienceMargherita brings considerable corporate finance and accounting experience and she has a sound background in marketing. She was chief financial officer for Vodafone’s European region from April 2007 to October 2010 and chief financial officer of Vodafone Italy from 2004 to 2007. Previously she worked for Omnitel Pronto Italia in Italy and held various consumer marketing positions in business analytics and customer base management prior to moving to finance.External appointmentsDeputy Group CFO of Vodafone Group plc, a member of HM Treasury’s Financial Management Review Board of HM Government and a trustee of the Vodafone Foundation.
RICK HAYTHORNTHWAITE
IAIN CONN
JEFF BELL
C N D D
MARGHERITA DELLA VALLE
JOAN GILLMAN
MARK HANAFIN
A N R S N S
STEPHEN HESTER
MARK HODGES
LESLEY KNOX
A N A N R
CARLOS PASCUAL
STEVE PUSEY
SCOTT WHEWAY
N R S A N S N R S
C Chairman of the Board
A Audit Committee
D Disclosure Committee
N Nominations Committee
R Remuneration Committee
S Safety, Health, Environment, Security & Ethics Committee
Denotes Committee Chairman
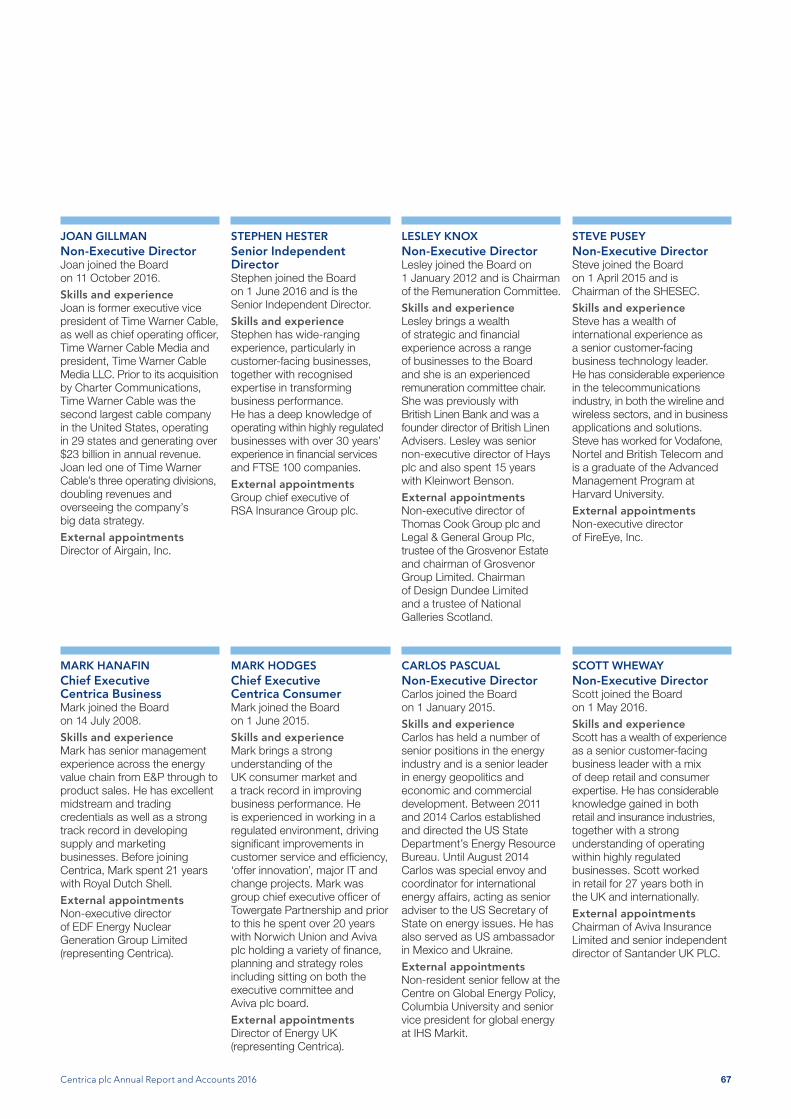
Centrica plc Annual Report and Accounts 2016 67
JOAN GILLMANNon-Executive DirectorJoan joined the Board on 11 October 2016.Skills and experienceJoan is former executive vice president of Time Warner Cable, as well as chief operating officer, Time Warner Cable Media and president, Time Warner Cable Media LLC. Prior to its acquisition by Charter Communications, Time Warner Cable was the second largest cable company in the United States, operating in 29 states and generating over $23 billion in annual revenue. Joan led one of Time Warner Cable’s three operating divisions, doubling revenues and overseeing the company’s big data strategy.External appointmentsDirector of Airgain, Inc.
MARK HANAFINChief Executive Centrica BusinessMark joined the Board on 14 July 2008.Skills and experienceMark has senior management experience across the energy value chain from E&P through to product sales. He has excellent midstream and trading credentials as well as a strong track record in developing supply and marketing businesses. Before joining Centrica, Mark spent 21 years with Royal Dutch Shell.External appointmentsNon-executive director of EDF Energy Nuclear Generation Group Limited (representing Centrica).
STEPHEN HESTERSenior Independent DirectorStephen joined the Board on 1 June 2016 and is the Senior Independent Director.Skills and experienceStephen has wide-ranging experience, particularly in customer-facing businesses, together with recognised expertise in transforming business performance. He has a deep knowledge of operating within highly regulated businesses with over 30 years’ experience in financial services and FTSE 100 companies.External appointmentsGroup chief executive of RSA Insurance Group plc.
MARK HODGESChief Executive Centrica ConsumerMark joined the Board on 1 June 2015.Skills and experienceMark brings a strong understanding of the UK consumer market and a track record in improving business performance. He is experienced in working in a regulated environment, driving significant improvements in customer service and efficiency, ‘offer innovation’, major IT and change projects. Mark was group chief executive officer of Towergate Partnership and prior to this he spent over 20 years with Norwich Union and Aviva plc holding a variety of finance, planning and strategy roles including sitting on both the executive committee and Aviva plc board. External appointmentsDirector of Energy UK (representing Centrica).
LESLEY KNOXNon-Executive DirectorLesley joined the Board on 1 January 2012 and is Chairman of the Remuneration Committee.Skills and experienceLesley brings a wealth of strategic and financial experience across a range of businesses to the Board and she is an experienced remuneration committee chair. She was previously with British Linen Bank and was a founder director of British Linen Advisers. Lesley was senior non-executive director of Hays plc and also spent 15 years with Kleinwort Benson.External appointmentsNon-executive director of Thomas Cook Group plc and Legal & General Group Plc, trustee of the Grosvenor Estate and chairman of Grosvenor Group Limited. Chairman of Design Dundee Limited and a trustee of National Galleries Scotland.
CARLOS PASCUALNon-Executive DirectorCarlos joined the Board on 1 January 2015.Skills and experienceCarlos has held a number of senior positions in the energy industry and is a senior leader in energy geopolitics and economic and commercial development. Between 2011 and 2014 Carlos established and directed the US State Department’s Energy Resource Bureau. Until August 2014 Carlos was special envoy and coordinator for international energy affairs, acting as senior adviser to the US Secretary of State on energy issues. He has also served as US ambassador in Mexico and Ukraine.External appointmentsNon-resident senior fellow at the Centre on Global Energy Policy, Columbia University and senior vice president for global energy at IHS Markit.
STEVE PUSEYNon-Executive DirectorSteve joined the Board on 1 April 2015 and is Chairman of the SHESEC.Skills and experienceSteve has a wealth of international experience as a senior customer-facing business technology leader. He has considerable experience in the telecommunications industry, in both the wireline and wireless sectors, and in business applications and solutions. Steve has worked for Vodafone, Nortel and British Telecom and is a graduate of the Advanced Management Program at Harvard University.External appointmentsNon-executive director of FireEye, Inc.
SCOTT WHEWAYNon-Executive DirectorScott joined the Board on 1 May 2016.Skills and experienceScott has a wealth of experience as a senior customer-facing business leader with a mix of deep retail and consumer expertise. He has considerable knowledge gained in both retail and insurance industries, together with a strong understanding of operating within highly regulated businesses. Scott worked in retail for 27 years both in the UK and internationally.External appointmentsChairman of Aviva Insurance Limited and senior independent director of Santander UK PLC.

68
STRATEGIC REPORT
FINANCIAL STATEMENTS
SHAREHOLDER INFORMATION
GOVERNANCE SENIOR EXECUTIVES
CHARLES CAMERON
CHRIS COX
GRANT DAWSON
JILL SHEDDEN, MBE
MIKE YOUNG
D
Senior ExecutivesFull biographies can be found at centrica.com
CHARLES CAMERONDirector of Technology & EngineeringCharles was appointed Director of Technology & Engineering on 1 January 2016.Skills and experienceCharles has extensive technology and engineering experience and has held corporate roles in marketing, planning and M&A. Before joining Centrica he was head of technology, downstream at BP plc and was a member of the downstream executive team.Prior to his time at BP, Charles spent 23 years with the French Institute of Petroleum and their catalyst, technology licensing and engineering service business, Axens.
CHRIS COXManaging Director, Exploration & ProductionChris was appointed Managing Director, Exploration & Production on 1 February 2016.Skills and experienceChris has extensive experience in global oil and gas upstream activities. Since 2006 and prior to his appointment with Centrica, he held a number of senior roles at BG Group plc and was latterly the executive vice president, BG Advance and a member of the group executive team. Prior to his time at BG Group plc, Chris was with Amerada Hess and Chevron Corporation.
GRANT DAWSONGroup General Counsel & Company SecretaryGrant was appointed Group General Counsel & Company Secretary in February 1997.Skills and experienceGrant joined British Gas plc in October 1996 and has been Group General Counsel & Company Secretary of Centrica plc since the demerger of British Gas plc on 17 February 1997. He was called to the Bar in 1982 and has spent most of his career in industry, joining the legal department of Racal Electronics plc in 1984 and then STC plc as legal adviser in 1986 until they were taken over in 1991 by Northern Telecom Limited. Between 1991 and 1996, he was the associate general counsel for Nortel in Europe, Africa and the Middle East.
MIKE YOUNGGroup Chief Information OfficerMike was appointed Group Chief Information Officer on 1 November 2016.Skills and experienceMike brings a wealth of experience in managing global IS functions in partnership with customer-facing units, and using big data and digital technologies to drive revenue growth and improve the customer experience. Before joining Centrica he was group chief information officer with the media and digital marketing company Dentsu Aegis Network.
JILL SHEDDEN, MBEGroup HR DirectorJill was appointed Group Director, Human Resources on 1 July 2011.Skills and experienceJill joined British Gas plc as a graduate in 1988 and has since held a wide range of roles across the Group. Prior to her appointment as Group HR Director Jill was HR Director in British Gas Business and British Gas Energy. In the 2017 New Year’s Honours list Jill was awarded an MBE for ‘services to women and equality’ in recognition of her work with, amongst other organisations, the Women’s Business Council.
D Disclosure Committee

Centrica plc Annual Report and Accounts 2016 69
DIRECTORS’ AND CORPORATE GOVERNANCE REPORT
Directors’ and Corporate Governance Report
Dear Shareholder
I am pleased to confirm that your Company has fully complied with the principles and provisions of the UK Governance Code throughout the year and the following pages set out in detail how we have done so.
Important as this is, however, good corporate governance is about much more than compliance. The structures, processes and policies described in this report are just the tools we use. The ultimate objective of corporate governance is to promote good decision-making and effective stewardship of the Company to ensure its sustainable success.
It is important to remember that the now familiar features of the governance landscape such as separation of responsibility at the top of companies, independent and diverse boards, committees with clear responsibility for key areas and transparency in reporting are but means to an end; preventing unhealthy concentrations of power, avoiding groupthink, ensuring decisions are based upon informed and wide-ranging discussions and are implemented effectively. Most importantly, good governance also depends upon the Board setting the tone from the top; the values and behaviours that protect and promote the long term success of the Company.
It is disappointing therefore that corporate governance has been in the news again in 2016 for all the wrong reasons, reflecting the failures of a few, exceptional companies, rather than the good practice of the many. The Corporate Governance Reform Green Paper was prompted largely by these failures. We have submitted a response to the consultation and stand ready to work with Government and regulators towards meaningful improvements, where possible. It is crucial, however, that better regulation does not simply mean more regulation and that, vitally, any reform retains the comply or explain principle that has been the foundation of the very significant improvements in corporate governance in the UK over the past two decades.
This Directors’ and Corporate Governance Report describes how we are approaching these important issues within Centrica and I hope shareholders will find it interesting and informative.
Rick HaythornthwaiteChairman23 February 2017
“ It is crucial, however, that better regulation does not simply mean more regulation and that, vitally, any reform retains the comply or explain principle that has been the foundation of the very significant improvements in corporate governance in the UK over the past two decades.”Rick HaythornthwaiteChairman

70
STRATEGIC REPORT
FINANCIAL STATEMENTS
SHAREHOLDER INFORMATION
GOVERNANCE DIRECTORS’ AND CORPORATE GOVERNANCE REPORT
Directors’ and Corporate Governance Reportcontinued
CORPORATE GOVERNANCEThe Board believes that effective corporate governance provides an essential foundation for the long-term success of the Company. This report sets out the key elements of our corporate governance arrangements, including how we have sought to apply the principles and provisions of the UK Governance Code (the Code). The Board confirms that, up to the date of this report, it fully complied with the Code.
THE BOARDThe Board is responsible for promoting the overall success of the Company. In doing so, it delegates certain responsibilities to Board Committees and executive management. Details of the Board Committees and their activities during the year are set out on pages 74 to 79. The Board delegates authority to the Group Chief Executive for the execution of strategy and the day-to-day management of the Group. The Board oversees, guides and challenges executive management in the execution of these activities.
There are certain key responsibilities that the Board does not delegate and which are reserved for its consideration. The full Schedule of Matters Reserved is available on our website, but key features include:
• the development of strategy and major policies;• approving the annual operating plan, Financial Statements
and major acquisitions and disposals;• approving interim dividend payments and recommending
final dividend payments; and• the appointment and removal of Directors and the
Company Secretary.
For more information on our strategy and operating model see page 16 and for more information on our technology and innovation developments see pages 10 and 11.
Board meetingsThe Board holds regular scheduled meetings throughout the year. In 2016, the Board met 9 times. Further information on topics considered by the Board in 2016 are detailed on page 73.
DirectorsWe have sought to ensure we have an appropriate mix of diversity and skills on our Board to ensure constructive debate and thoughtful decision-making. In addition, we believe it is helpful to maintain a blend within the Non-Executive group where some are in full-time executive employment and others are pursuing a non-executive portfolio career path.
At present, there are a total of 12 Directors, of whom four are Executive and eight, including the Chairman, are Non-Executive.
All of our Non-Executive Directors are considered to be independent and free from any business interest which could materially interfere with the exercise of their judgement. In addition, the Board is satisfied that each Non-Executive Director is able to dedicate the necessary amount of time to the Company’s affairs. Our Non-Executive Directors are members of various committees of the Board, which are the Audit, the Nominations, the Remuneration and the Safety, Health, Environment, Security & Ethics Committees.
During the year the Non-Executive Directors, including the Chairman, met frequently without management present. In addition, the Senior Independent Director met with the Non-Executive Directors in the absence of the Chairman to appraise the Chairman’s performance.
The Directors have full access to the advice and services of the Group General Counsel & Company Secretary, who is responsible for advising the Board, through the Chairman, on corporate governance matters. They are also able to seek independent professional advice at the Company’s expense in respect of their duties.
The Board has agreed that each Director shall stand for reappointment at each Annual General Meeting (AGM).
Details of the Directors of the Company are set out with their biographies on pages 66 and 67. Information on remuneration and share interests are set out in the Remuneration Report on pages 83 to 99. Details relating to Directors’ service contracts or letters of appointment, in the case of Non-Executive Directors, are set out in the remuneration policy that was approved by shareholders on 27 April 2015. The full remuneration policy can be found on our website.
Copies of the Executive Directors’ service contracts and letters of appointment for the Non-Executive Directors are available for inspection by shareholders at each AGM and during normal business hours at the Company’s registered office.
In line with best practice, the roles of our Chairman and Group Chief Executive are separate, formalised in writing and have been approved by the Board. A summary of these and other roles is shown in the table opposite.

Centrica plc Annual Report and Accounts 2016 71
Balance of Non-Executive and Executive Directors
Executive 33.3%
Non-Executive 66.6%
Board composition and roles
Chairman Rick Haythornthwaite Responsible for the leadership and management of the Board. In doing so, he is responsible for promoting high ethical standards, ensuring the effective contribution of all Directors and, with support from the Group General Counsel & Company Secretary, best practice in corporate governance.
Group Chief Executive Iain Conn Responsible for the executive leadership and day-to-day management of the Company, to ensure the delivery of the strategy agreed by the Board.
Group Chief Financial Officer
Jeff Bell Responsible for providing strategic financial leadership of the Company and day-to-day management of the finance function.
Independent Non-Executive Directors
Margherita Della Valle, Joan Gillman, Stephen Hester, Lesley Knox, Carlos Pascual, Steve Pusey, Scott Wheway
Responsible for contributing sound judgement and objectivity to the Board’s deliberations and overall decision-making process, providing constructive challenge and monitoring the Executive Directors’ delivery of the strategy within the Board’s risk and governance structure.
Senior Independent Director
Stephen Hester Acts as a sounding board for the Chairman and serves as a trusted intermediary for the other Directors, as well as shareholders, as required.
Group Executive Directors
Mark Hanafin, Mark Hodges Responsible for executive leadership and day-to-day management of relevant business units in support of the Group Chief Executive and the delivery of the strategy agreed by the Board.
The internal evaluation was conducted in December 2016, via online questionnaires and interviews with the Chairman. The Senior Independent Director, Stephen Hester, conducted the evaluation of the Chairman’s performance through a series of individual discussions with Directors and senior executives.
The results of the evaluation exercises were reviewed by the Board and Committees in February 2017. Overall, the Board was considered to be performing well, with high scores recorded across the range of performance measures. In terms of enhancements, Directors identified some common areas where more information and discussion would be beneficial; in particular, in relation to the Group’s new growth markets and to competitor benchmarking. In both areas, Directors felt the need for more attention reflected the rapid developments in those markets and in the competitive landscape rather than a significant gap in the Board’s agenda. Opportunities to review these topics in depth have been built into the 2017 Board programme.
Balance and independence of the BoardThe Board considers the balance of skills, knowledge, experience and independence to ensure the Board and Committees effectively discharge their duties and responsibilities. As part of its annual review of corporate governance, the Board considered the independence of each Non-Executive Director, other than the Chairman, against the criteria in the Code and determined that each Non-Executive Director remained independent.
RecruitmentA rigorous process is followed for the appointment of each new Director to the Board, which is led by the Chairman.
The Nominations Committee used the services of executive search agents to assist in the search for Non-Executive Directors. The agents engaged during 2016 were JCA Group and Heidrick & Struggles.
The Committee considered the candidates against an objective criteria, having due regard for the benefits of Board diversity.
None of the executive search agents listed above provide any other services to the Company.
AppointmentsDuring the year under review, there were a number of changes to the Board.
Joan Gillman, Stephen Hester and Scott Wheway were appointed as Directors of the Company with effect from 11 October 2016, 1 June 2016 and 1 May 2016 respectively.
As announced in July 2016, Stephen Hester succeeded Ian Meakins to become the Company’s Senior Independent Director with effect from 1 October 2016.
Mike Linn and Ian Meakins resigned as Directors of the Company with effect from 18 April and 1 October 2016, respectively.
Board evaluationIn accordance with the Code, we conduct an annual evaluation of Board performance, which is facilitated by an independent third party at least once every three years. As reported last year, we considered conducting the third party evaluation during 2016, a year earlier than required by the Code. On reflection however, with three new Directors appointed in 2016 and the newly established Committee structure still bedding in, we felt it would be more valuable to have the third party evaluation in the second half of 2017.
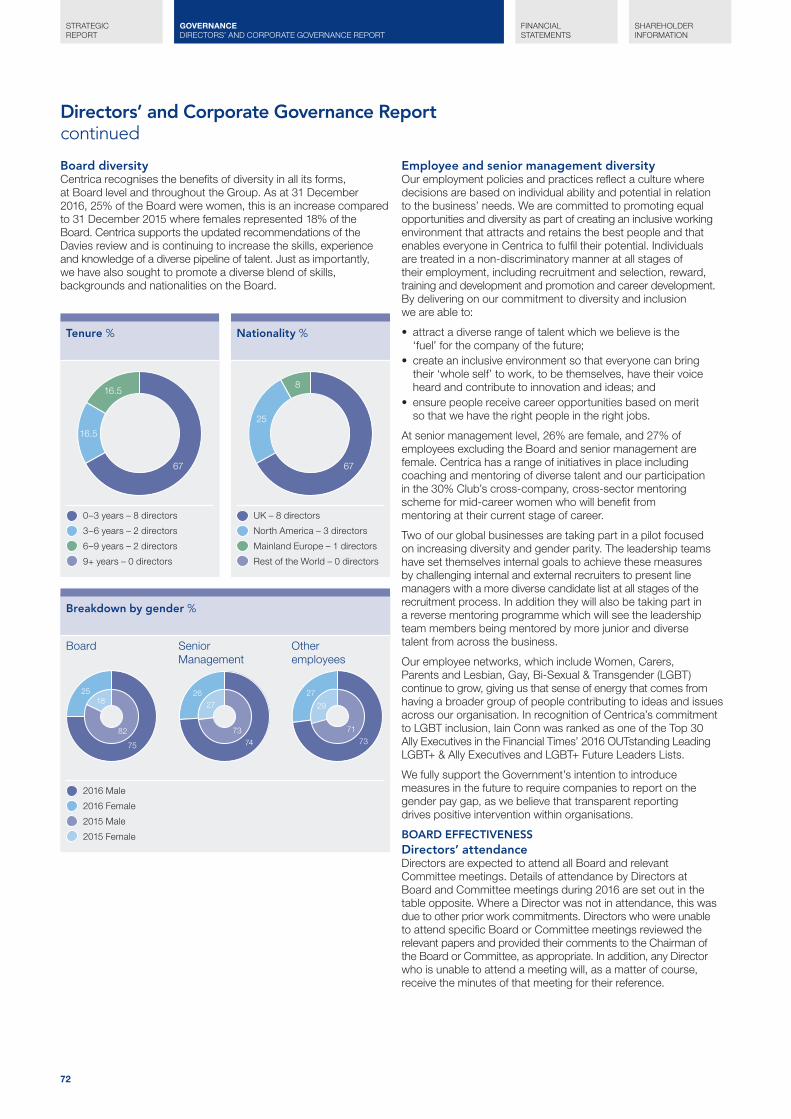
72
STRATEGIC REPORT
FINANCIAL STATEMENTS
SHAREHOLDER INFORMATION
GOVERNANCE DIRECTORS’ AND CORPORATE GOVERNANCE REPORT
Breakdown by gender %
2016 Male
2016 Female
2015 Male
2015 Female
Board Senior Management
Other employees
25
75
18
82
26
74
73
27
27
73
71
29
Tenure %
67
16.5
16.5
0–3 years – 8 directors
3–6 years – 2 directors
6–9 years – 2 directors
9+ years – 0 directors
Nationality %
67
25
8
UK – 8 directors
North America – 3 directors
Mainland Europe – 1 directors
Rest of the World – 0 directors
Board diversityCentrica recognises the benefits of diversity in all its forms, at Board level and throughout the Group. As at 31 December 2016, 25% of the Board were women, this is an increase compared to 31 December 2015 where females represented 18% of the Board. Centrica supports the updated recommendations of the Davies review and is continuing to increase the skills, experience and knowledge of a diverse pipeline of talent. Just as importantly, we have also sought to promote a diverse blend of skills, backgrounds and nationalities on the Board.
Employee and senior management diversityOur employment policies and practices reflect a culture where decisions are based on individual ability and potential in relation to the business’ needs. We are committed to promoting equal opportunities and diversity as part of creating an inclusive working environment that attracts and retains the best people and that enables everyone in Centrica to fulfil their potential. Individuals are treated in a non-discriminatory manner at all stages of their employment, including recruitment and selection, reward, training and development and promotion and career development. By delivering on our commitment to diversity and inclusion we are able to:
• attract a diverse range of talent which we believe is the ‘fuel’ for the company of the future;
• create an inclusive environment so that everyone can bring their ‘whole self’ to work, to be themselves, have their voice heard and contribute to innovation and ideas; and
• ensure people receive career opportunities based on merit so that we have the right people in the right jobs.
At senior management level, 26% are female, and 27% of employees excluding the Board and senior management are female. Centrica has a range of initiatives in place including coaching and mentoring of diverse talent and our participation in the 30% Club’s cross-company, cross-sector mentoring scheme for mid-career women who will benefit from mentoring at their current stage of career.
Two of our global businesses are taking part in a pilot focused on increasing diversity and gender parity. The leadership teams have set themselves internal goals to achieve these measures by challenging internal and external recruiters to present line managers with a more diverse candidate list at all stages of the recruitment process. In addition they will also be taking part in a reverse mentoring programme which will see the leadership team members being mentored by more junior and diverse talent from across the business.
Our employee networks, which include Women, Carers, Parents and Lesbian, Gay, Bi-Sexual & Transgender (LGBT) continue to grow, giving us that sense of energy that comes from having a broader group of people contributing to ideas and issues across our organisation. In recognition of Centrica’s commitment to LGBT inclusion, Iain Conn was ranked as one of the Top 30 Ally Executives in the Financial Times’ 2016 OUTstanding Leading LGBT+ & Ally Executives and LGBT+ Future Leaders Lists.
We fully support the Government’s intention to introduce measures in the future to require companies to report on the gender pay gap, as we believe that transparent reporting drives positive intervention within organisations.
BOARD EFFECTIVENESSDirectors’ attendanceDirectors are expected to attend all Board and relevant Committee meetings. Details of attendance by Directors at Board and Committee meetings during 2016 are set out in the table opposite. Where a Director was not in attendance, this was due to other prior work commitments. Directors who were unable to attend specific Board or Committee meetings reviewed the relevant papers and provided their comments to the Chairman of the Board or Committee, as appropriate. In addition, any Director who is unable to attend a meeting will, as a matter of course, receive the minutes of that meeting for their reference.
Directors’ and Corporate Governance Reportcontinued
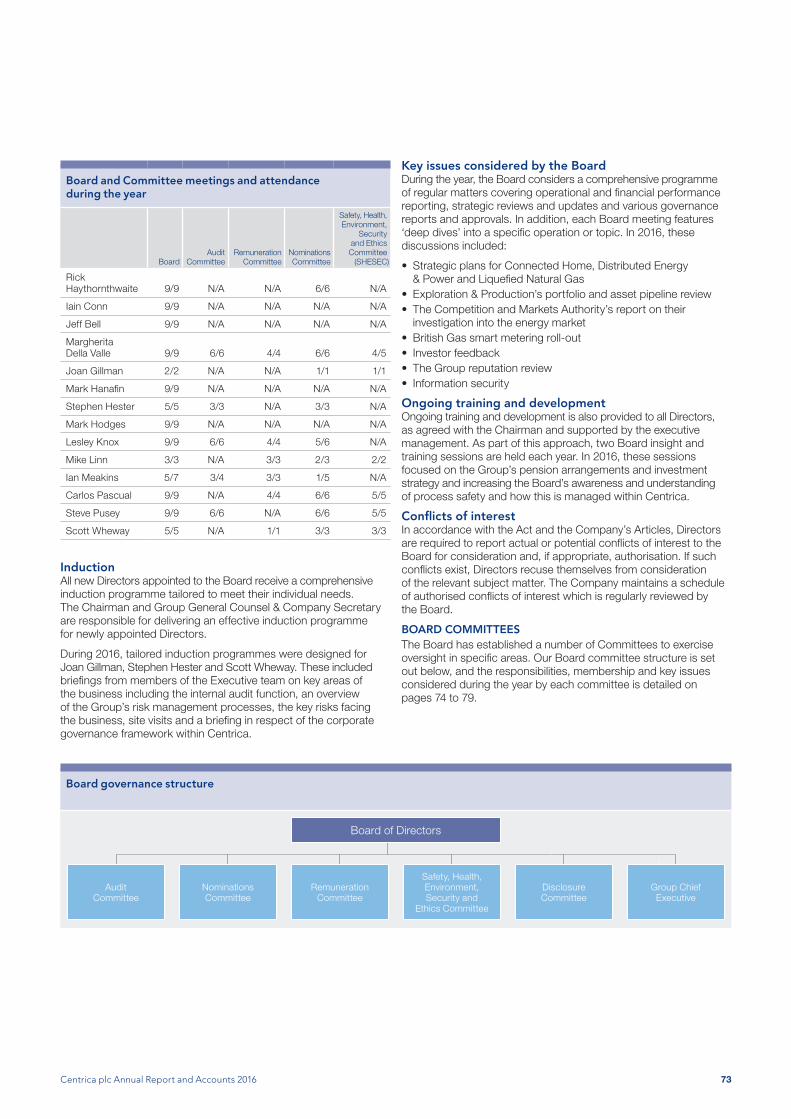
Centrica plc Annual Report and Accounts 2016 73
InductionAll new Directors appointed to the Board receive a comprehensive induction programme tailored to meet their individual needs. The Chairman and Group General Counsel & Company Secretary are responsible for delivering an effective induction programme for newly appointed Directors.
During 2016, tailored induction programmes were designed for Joan Gillman, Stephen Hester and Scott Wheway. These included briefings from members of the Executive team on key areas of the business including the internal audit function, an overview of the Group’s risk management processes, the key risks facing the business, site visits and a briefing in respect of the corporate governance framework within Centrica.
Key issues considered by the BoardDuring the year, the Board considers a comprehensive programme of regular matters covering operational and financial performance reporting, strategic reviews and updates and various governance reports and approvals. In addition, each Board meeting features ‘deep dives’ into a specific operation or topic. In 2016, these discussions included:
• Strategic plans for Connected Home, Distributed Energy & Power and Liquefied Natural Gas
• Exploration & Production’s portfolio and asset pipeline review • The Competition and Markets Authority’s report on their
investigation into the energy market• British Gas smart metering roll-out• Investor feedback• The Group reputation review• Information security
Ongoing training and developmentOngoing training and development is also provided to all Directors, as agreed with the Chairman and supported by the executive management. As part of this approach, two Board insight and training sessions are held each year. In 2016, these sessions focused on the Group’s pension arrangements and investment strategy and increasing the Board’s awareness and understanding of process safety and how this is managed within Centrica.
Conflicts of interestIn accordance with the Act and the Company’s Articles, Directors are required to report actual or potential conflicts of interest to the Board for consideration and, if appropriate, authorisation. If such conflicts exist, Directors recuse themselves from consideration of the relevant subject matter. The Company maintains a schedule of authorised conflicts of interest which is regularly reviewed by the Board.
BOARD COMMITTEESThe Board has established a number of Committees to exercise oversight in specific areas. Our Board committee structure is set out below, and the responsibilities, membership and key issues considered during the year by each committee is detailed on pages 74 to 79.
Board and Committee meetings and attendance during the year
BoardAudit
CommitteeRemuneration
CommitteeNominationsCommittee
Safety, Health,Environment,
Securityand Ethics
Committee(SHESEC)
Rick Haythornthwaite 9/9 N/A N/A 6/6 N/A
Iain Conn 9/9 N/A N/A N/A N/A
Jeff Bell 9/9 N/A N/A N/A N/A
Margherita Della Valle 9/9 6/6 4/4 6/6 4/5
Joan Gillman 2/2 N/A N/A 1/1 1/1
Mark Hanafin 9/9 N/A N/A N/A N/A
Stephen Hester 5/5 3/3 N/A 3/3 N/A
Mark Hodges 9/9 N/A N/A N/A N/A
Lesley Knox 9/9 6/6 4/4 5/6 N/A
Mike Linn 3/3 N/A 3/3 2/3 2/2
Ian Meakins 5/7 3/4 3/3 1/5 N/A
Carlos Pascual 9/9 N/A 4/4 6/6 5/5
Steve Pusey 9/9 6/6 N/A 6/6 5/5
Scott Wheway 5/5 N/A 1/1 3/3 3/3
Board governance structure
Board of Directors
AuditCommittee
NominationsCommittee
Remuneration Committee
Safety, Health, Environment, Security and
Ethics Committee
DisclosureCommittee
Group Chief Executive
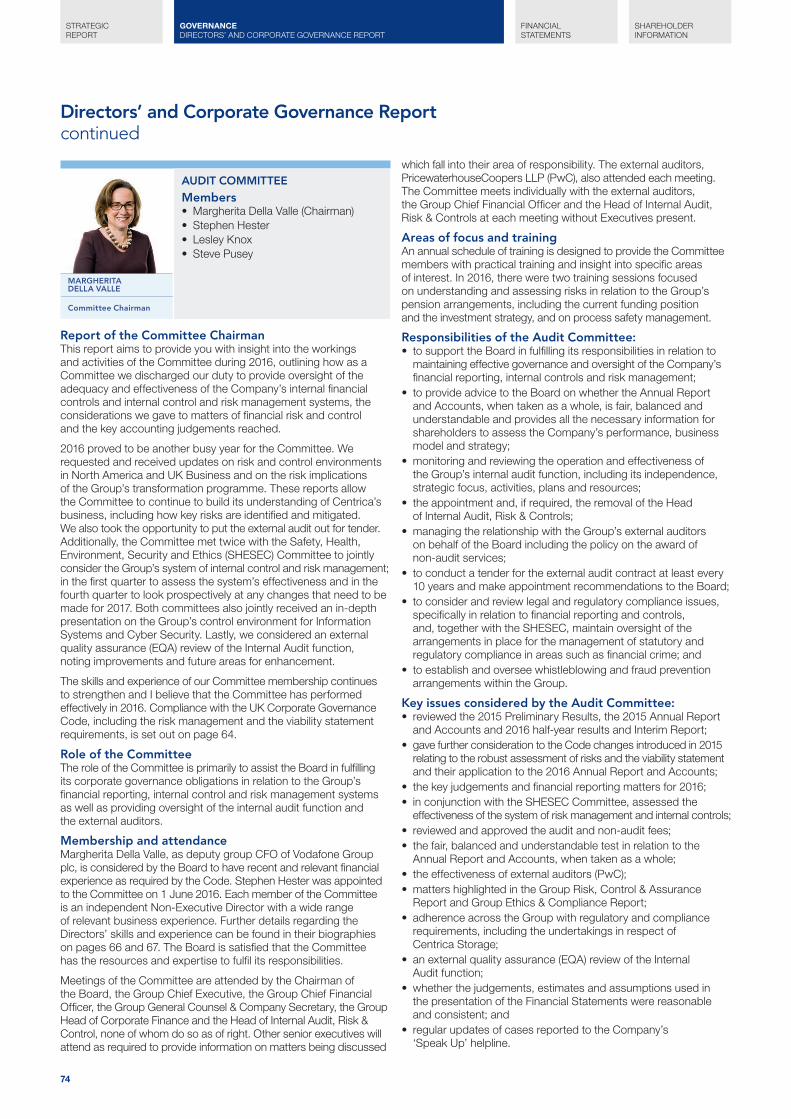
74
STRATEGIC REPORT
FINANCIAL STATEMENTS
SHAREHOLDER INFORMATION
GOVERNANCE DIRECTORS’ AND CORPORATE GOVERNANCE REPORT
MARGHERITA DELLA VALLE
Committee Chairman
Directors’ and Corporate Governance Reportcontinued
AUDIT COMMITTEE
Members• Margherita Della Valle (Chairman)• Stephen Hester• Lesley Knox• Steve Pusey
Report of the Committee ChairmanThis report aims to provide you with insight into the workings and activities of the Committee during 2016, outlining how as a Committee we discharged our duty to provide oversight of the adequacy and effectiveness of the Company’s internal financial controls and internal control and risk management systems, the considerations we gave to matters of financial risk and control and the key accounting judgements reached.
2016 proved to be another busy year for the Committee. We requested and received updates on risk and control environments in North America and UK Business and on the risk implications of the Group’s transformation programme. These reports allow the Committee to continue to build its understanding of Centrica’s business, including how key risks are identified and mitigated. We also took the opportunity to put the external audit out for tender. Additionally, the Committee met twice with the Safety, Health, Environment, Security and Ethics (SHESEC) Committee to jointly consider the Group’s system of internal control and risk management; in the first quarter to assess the system’s effectiveness and in the fourth quarter to look prospectively at any changes that need to be made for 2017. Both committees also jointly received an in-depth presentation on the Group’s control environment for Information Systems and Cyber Security. Lastly, we considered an external quality assurance (EQA) review of the Internal Audit function, noting improvements and future areas for enhancement.
The skills and experience of our Committee membership continues to strengthen and I believe that the Committee has performed effectively in 2016. Compliance with the UK Corporate Governance Code, including the risk management and the viability statement requirements, is set out on page 64.
Role of the CommitteeThe role of the Committee is primarily to assist the Board in fulfilling its corporate governance obligations in relation to the Group’s financial reporting, internal control and risk management systems as well as providing oversight of the internal audit function and the external auditors.
Membership and attendanceMargherita Della Valle, as deputy group CFO of Vodafone Group plc, is considered by the Board to have recent and relevant financial experience as required by the Code. Stephen Hester was appointed to the Committee on 1 June 2016. Each member of the Committee is an independent Non-Executive Director with a wide range of relevant business experience. Further details regarding the Directors’ skills and experience can be found in their biographies on pages 66 and 67. The Board is satisfied that the Committee has the resources and expertise to fulfil its responsibilities.
Meetings of the Committee are attended by the Chairman of the Board, the Group Chief Executive, the Group Chief Financial Officer, the Group General Counsel & Company Secretary, the Group Head of Corporate Finance and the Head of Internal Audit, Risk & Control, none of whom do so as of right. Other senior executives will attend as required to provide information on matters being discussed
which fall into their area of responsibility. The external auditors, PricewaterhouseCoopers LLP (PwC), also attended each meeting. The Committee meets individually with the external auditors, the Group Chief Financial Officer and the Head of Internal Audit, Risk & Controls at each meeting without Executives present.
Areas of focus and trainingAn annual schedule of training is designed to provide the Committee members with practical training and insight into specific areas of interest. In 2016, there were two training sessions focused on understanding and assessing risks in relation to the Group’s pension arrangements, including the current funding position and the investment strategy, and on process safety management.
Responsibilities of the Audit Committee:• to support the Board in fulfilling its responsibilities in relation to
maintaining effective governance and oversight of the Company’s financial reporting, internal controls and risk management;
• to provide advice to the Board on whether the Annual Report and Accounts, when taken as a whole, is fair, balanced and understandable and provides all the necessary information for shareholders to assess the Company’s performance, business model and strategy;
• monitoring and reviewing the operation and effectiveness of the Group’s internal audit function, including its independence, strategic focus, activities, plans and resources;
• the appointment and, if required, the removal of the Head of Internal Audit, Risk & Controls;
• managing the relationship with the Group’s external auditors on behalf of the Board including the policy on the award of non-audit services;
• to conduct a tender for the external audit contract at least every 10 years and make appointment recommendations to the Board;
• to consider and review legal and regulatory compliance issues, specifically in relation to financial reporting and controls, and, together with the SHESEC, maintain oversight of the arrangements in place for the management of statutory and regulatory compliance in areas such as financial crime; and
• to establish and oversee whistleblowing and fraud prevention arrangements within the Group.
Key issues considered by the Audit Committee:• reviewed the 2015 Preliminary Results, the 2015 Annual Report
and Accounts and 2016 half-year results and Interim Report;• gave further consideration to the Code changes introduced in 2015
relating to the robust assessment of risks and the viability statement and their application to the 2016 Annual Report and Accounts;
• the key judgements and financial reporting matters for 2016;• in conjunction with the SHESEC Committee, assessed the
effectiveness of the system of risk management and internal controls;• reviewed and approved the audit and non-audit fees;• the fair, balanced and understandable test in relation to the
Annual Report and Accounts, when taken as a whole;• the effectiveness of external auditors (PwC);• matters highlighted in the Group Risk, Control & Assurance
Report and Group Ethics & Compliance Report;• adherence across the Group with regulatory and compliance
requirements, including the undertakings in respect of Centrica Storage;
• an external quality assurance (EQA) review of the Internal Audit function;
• whether the judgements, estimates and assumptions used in the presentation of the Financial Statements were reasonable and consistent; and
• regular updates of cases reported to the Company’s ‘Speak Up’ helpline.

Centrica plc Annual Report and Accounts 2016 75
Risk management and internal controlsInternal auditThe Committee is responsible for monitoring and reviewing the operation and effectiveness of the Group’s internal audit function, including its independence, strategic focus, activities, plans and resources. The appointment and removal of the Head of Internal Audit is also a matter for the Committee.
The Committee approved the Group’s annual Internal Audit plan which was primarily risk-based focusing on the assurance of core processes. As part of its consideration of the plan, the Committee reviewed staffing levels and qualifications to ensure these were appropriate and adequate for the delivery of the plan. To provide the Committee with insight into the performance of the internal audit function relative to similar functions in other organisations, an external quality assurance (EQA) review of the Internal Audit function was undertaken.
During the year, the Committee received regular reports summarising the findings from the Group’s internal audit function’s work and action plans to resolve any highlighted areas. The Committee monitored the progress of the most significant action plans to ensure these were completed satisfactorily.
The Board’s Review of the system of risk management and internal controlsEach year, an extensive process of self-certification operates throughout the Group whereby the effectiveness of internal controls and compliance with the Group’s Business Principles and policies are assessed. Self-certification is completed both at the half year and full year. The results of the annual process, together with the conclusions of the internal reviews by internal audit, inform the annual assessment of the effectiveness of the systems of risk management and internal controls performed by the Audit Committee and the SHESEC Committee in 2016.
External auditorsThe Committee manages the relationship with the Group’s external auditors on behalf of the Board. The Committee considers annually the scope, fee, performance and independence of the external auditors as well as whether a formal tender process is required.
The Board considers it of prime importance that the external auditors remain independent and objective and as a safeguard against this being compromised, the Committee implemented and monitors a policy on the independence of external auditors. This policy details the process for the appointment of the external auditors, the tendering policy, the provision of non-audit services, the setting of audit fees and the rotation of audit partner and staff. There are no contractual or similar obligations restricting the Group’s choice of external auditors.
Effectiveness and independence of the external auditorsTo assess the effectiveness and independence of the external auditors, the Committee carried out an assessment of PwC. This included a review of the report issued by the audit quality review team regarding PwC and an internal questionnaire completed by Committee members and relevant members of management on their views of PwC’s performance. The questionnaire covered a review of the audit partner and team, the audit scope and approach, audit plan execution, auditor independence and objectivity and robustness of the challenge of management. The feedback received was reviewed by management and reported to the Committee and the Board.
In addition, to ensure the independence of the external auditors and in accordance with International Standards on Auditing (UK & Ireland) 260 and Ethical Statement 1 issued by the Accounting Practices Board and as a matter of best practice, PwC have confirmed their independence as auditors of the Company, in a letter addressed to the Directors. Together
with PwC’s confirmation and report on their approach to audit quality and transparency, the Committee concluded that PwC demonstrated appropriate qualifications and expertise and remained independent of the Group and that the audit process was effective.
Non-audit feesIn order to preserve the independence of the external auditor, the Committee is responsible for the policy on the award of non-audit services to the external auditors. A copy of this policy is available on our website. The current cap on non-audit work is £2.75 million, which is assessed annually for appropriateness against external guidance and regulation. The award of non-audit work, within permitted categories, is subject to pre-clearance by the Committee, should the fees in a given year exceed a specified threshold. All significant non-audit work is tendered and where PwC or Deloitte LLP were appointed, it was considered that their skills and experience made them the most appropriate supplier of the work. Significant engagements undertaken during 2016 included audit-related assurance services and advice on corporate finance support for acquisitions and disposals. On a quarterly basis, the Committee is provided with reports of all non-audit assignments awarded to the external auditors and a full breakdown of non-audit fees incurred. A summary of fees paid to the external auditors is set out in note S9 to the Financial Statements.
Appointment of the external auditorsPwC have been the external auditor of the Group since the demerger of Centrica in 1997. In 2016, the Committee led a formal audit tender process. The Board and PwC mutually agreed that PwC, having regard to the length of their tenure, would not participate in the formal tender process. The conclusion of the tender process was a firm recommendation to appoint Deloitte LLP as the Company’s auditor for the financial year commencing 1 January 2017. The Board has accepted and endorsed this recommendation, which is subject to shareholder approval at the Annual General Meeting scheduled for 8 May 2017.
Audit informationEach of the Directors who held office at the date of approval of the Annual Report and Accounts confirms that, so far as they are aware, there is no relevant audit information of which PwC are unaware and that they have taken all steps that they ought to have taken as Directors to make themselves aware of any relevant audit information and to establish that PwC are aware of that information.
EXTERNAL AUDITOR TRANSITION
Following a rigorous selection process Deloitte LLP was selected as the Group’s external auditor for the financial year commencing from 1 January 2017. Shareholders will be asked to confirm their appointment at the 2017 AGM.
The Committee, together with management, spent significant time drawing up the assessment criteria to select the successful audit firm. The audit tender process involved three firms who each submitted their proposals for the audit. Each of the firms’ engagement teams met with Centrica management teams across the Group and feedback from these meetings was provided to the Committee to inform the decision-making process. Additionally, the firms each presented to the Committee, which allowed the Committee to assess the prospective auditors’ capabilities and their proposed audit approach, in terms of the strength of the lead partners and their leadership team, expertise, industry experience and audit quality, as well as independence. The Board approved the Committee’s recommendation to appoint Deloitte LLP due to their extensive experience, particularly in a listed environment, their audit quality and audit service quality ratings, and their knowledge and experience of energy and utilities industries and large-scale transformation programmes.
76
STRATEGIC REPORT
FINANCIAL STATEMENTS
SHAREHOLDER INFORMATION
GOVERNANCE DIRECTORS’ AND CORPORATE GOVERNANCE REPORT
Directors’ and Corporate Governance Reportcontinued
Key judgements and financial reporting matters in 2016 Audit Committee reviews and conclusions
IMPAIRMENT OF GOODWILL, UPSTREAM GAS AND OIL ASSETS, POWER GENERATION ASSETS AND STORAGE FACILITY ASSETS
The Group makes judgements and estimates in considering whether the carrying amounts of its assets are recoverable. These judgements include primarily the achievement of Board approved business plans, long-term projected cash flows, generation and production levels (including reserve estimates) and macroeconomic assumptions such as the growth and discount rates and long-term commodity and capacity market auction prices used in the valuation process. In the forecasts, where forward market prices are not available, prices are determined based on internal model inputs.
The Committee reviewed management reports detailing the carrying and recoverable value of the assets and the key judgements and estimates used. At the year end it concluded exceptional pre-tax impairment write-backs of Exploration & Production gas and oil assets and reductions to decommissioning provisions of £135 million relating to the UK, Dutch and Norwegian gas and oil assets (£79 million) and Trinidad and Tobago gas assets (£56 million) were required, primarily due to increased reserves, cost savings, decommissioning reductions and, in the case of Trinidad and Tobago, based on the proceeds agreed for the sale of these assets. In addition to routine and immaterial impairments recorded in business performance, predominantly in E&P, the Committee reviewed the recoverable value of the York field and concluded a pre-tax impairment of £63 million was required following reservoir quality issues concerning the fourth production well which was recorded in business performance.
Following the award of a 15 year capacity contract to the previously mothballed combined cycle gas turbine power station at Kings Lynn the Committee concluded an exceptional pre-tax impairment write-back of £26 million.
At the half year, the Committee had reviewed the recoverable value of the UK gas storage assets and, following updated assumptions on asset availability in the near term and future expenditure on asset integrity, had agreed an exceptional pre-tax impairment of £176 million. The Committee has reviewed the updated assumptions of the recoverable value of the UK gas storage assets and have concluded no adjustment to this impairment is required.
There is uncertainty associated with the disposal process of the Group’s Canadian oil and gas assets and significant judgement was required in determining the recoverable amount of the assets, with a range of possible outcomes. The Committee reviewed this and the recoverable amount of all other significant balance sheet assets, and concluded their carrying values were appropriate.
The external auditors held discussions with the Committee on the key judgements and assumptions used in the impairment tests and provided their own analytical report. Further detail on impairments arising, and the assumptions used in determining the recoverable amounts, is provided in notes 7 and S2 on pages 126 to 128 and 163 to 165.
PRESENTATION OF CERTAIN RE-MEASUREMENTS AND EXCEPTIONAL ITEMS
The Group reflects its underlying financial results in the business performance column of the Group Income Statement. To be able to provide this clearly and with consistent presentation, the effects of certain re-measurements of financial instruments and exceptional items are reported separately in a different column in the Group Income Statement.
In prior years the Committee received training on the classification of exceptional items and certain re-measurements on the face of the income statement. This year the Committee asked management to present its policy for classification of items as certain re-measurements and exceptional items. The Committee reviewed the policy along with management reports detailing the judgements regarding the appropriate presentation of items as certain re-measurements and exceptional items. The Committee considered the size, nature and incidence of these items and concluded that separate disclosure of these items was appropriate in the Financial Statements.
Exceptional items include the E&P asset impairment write-backs in the UK, Netherlands, Norway, and Trinidad and Tobago, impairment write-back of the Group’s UK gas fired power station asset at Kings Lynn, impairment of its UK gas storage assets, net release of/provisions for onerous power procurement contracts, restructuring costs related to the strategic review announced in 2015, pension past service credits associated with a change to the Centrica Pension Plan, net gains on disposal of businesses and assets and changes to E&P tax rates. Further detail is provided in note 7 on pages 126 to 128.

Centrica plc Annual Report and Accounts 2016 77
Key judgements and financial reporting matters in 2016 Audit Committee reviews and conclusions
DOWNSTREAM REVENUE RECOGNITION
The Group’s revenue for energy supply activities includes an estimate of energy supplied to customers between the date of the last meter reading and an estimated year-end meter reading. It is estimated through the billing systems, using historical consumption patterns, on a customer by customer basis, taking into account weather patterns, load forecasts and the differences between actual meter readings being returned and system estimates. An assessment is also made of any factors that are likely to materially affect the ultimate economic benefits which will flow to the Group, including bill cancellation and re-bill rates. To the extent that the economic benefits are not expected to flow to the Group, revenue is not recognised.
The Committee has reviewed and held discussions with the external auditors on the level of provisions made during the year. The implementation of a new billing system in UK Business in 2014 meant that the determination of the appropriate level of bad debt provisions last year required more judgement than in previous years.
During 2016, improvements in billing performance, levels of cancellations/errors and complaints backlog have continued. The review of bad debt provisioning has continued to require more judgement. The Committee has reviewed management reports detailing these judgements and have concluded the level of provision is adequate. Further detail of accrued energy income and provision for credit loss is provided in note 17 on pages 142 and 143.
DETERMINATION OF LONG-TERM COMMODITY PRICES
Long-term commodity price forecasts are derived using valuation techniques based on available external data. A significant number of judgements and assumptions are used in deriving future commodity curves. These forecasts are benchmarked against other third party forecasts and are approved by the Group’s Executive Committee. The long-term commodity price forecasts are used in determining the fair values of derivative financial instruments in North America and Europe. They are also a key input in the Group’s impairment valuation testing.
The Committee reviewed management reports detailing the key developments during the year and a summary of price changes and drivers. The Committee also reviewed the proposed valuation commodity curves versus those of external third parties. The external auditors also provided detailed reporting and held discussions with the Committee on the potential impact of changes in the commodity curves. More detail on the assumptions used in determining fair valuations is provided in note S6 on pages 176 to 178. Sensitivities of the asset impairment tests to changes in price forecasts are provided in note 7 on pages 127 and 128.
BUSINESS COMBINATIONS
During the year, the Group acquired Ener-G Cogen’s CHP business and Neas Energy’s energy management services and trading business. Business combinations require a fair value exercise to be undertaken to allocate purchase price (cost) to the fair value of the acquired identifiable assets, liabilities, contingent liabilities and goodwill. As a result of the nature of fair value assessments in the energy industry, this purchase price allocation exercise requires subjective judgements based on a wide range of complex variables at a point in time. Specifically for these acquisitions, judgement is required in valuing the customer relationship assets.
The Committee reviewed management reports detailing the valuations and key judgements and estimates. The Committee also approved the disclosures in note 12. The external auditors also provided detailed reporting and held discussions with the Committee on the key judgements and assumptions used. Further details on business combinations are set out in note 12 on pages 133 to 135.
PENSIONS
The cost, assets and liabilities associated with providing benefits under defined benefit schemes is determined separately for each of the Group’s schemes. Judgement is required in setting the key assumptions used for the actuarial valuation which determines the ultimate cost of providing post-employment benefits, especially given the length of the Group’s expected liabilities.
The Committee reviewed and approved the key assumptions and disclosures in the Financial Statements. Independent actuaries were consulted on the appropriateness of the assumptions and discussions were held with the external auditors. Further details on pensions are set out in note 22 on pages 147 to 151.
GOING CONCERN AND LIQUIDITY RISK
The Group experiences significant movements in its liquidity position due primarily to the seasonal nature of its business and margin cash. To mitigate this risk the Group holds cash on deposit and maintains significant committed facilities. The Group regularly prepares an assessment detailing these available resources to support the going concern assumption in preparing the Financial Statements.
The Committee reviewed management’s funding forecasts and sensitivity analysis and the impact of various possible adverse events including significant commodity price movements and credit rating downgrades. The external auditors also provided detailed reporting and held discussions with the Committee. Following the review, the Committee recommended to the Board the adoption of the going concern statement in the Annual Report and Accounts 2016. Further details on sources of finance are set out in note 24 on pages 153 to 156 and in the Going Concern section of the Directors’ and Corporate Governance Report, on page 82.
OFGEM CONSOLIDATED SEGMENTAL STATEMENT
The Group is required to prepare an annual regulatory statement (Consolidated Segmental Statement (CSS)) for Ofgem which breaks down its licensed activities for the financial year into a generation, domestic and non-domestic, and electricity and gas result. The CSS is reconciled to our externally reported IFRS Annual Report and Accounts. The Group publishes the CSS at the same time as our full year Annual Report and Accounts and the CSS is independently audited. In preparing the CSS, judgement is required in the allocation of non-specific costs between domestic and non-domestic and electricity and gas and the distinction between licensed and non-licensed activities.
The Committee reviewed the Ofgem CSS and the key judgements and disclosures made in its preparation. The external auditor also provided a detailed report and held discussions with the Committee. The full CSS and the independent audit opinion approved by the Committee for publication are set out on pages 203 to 215.
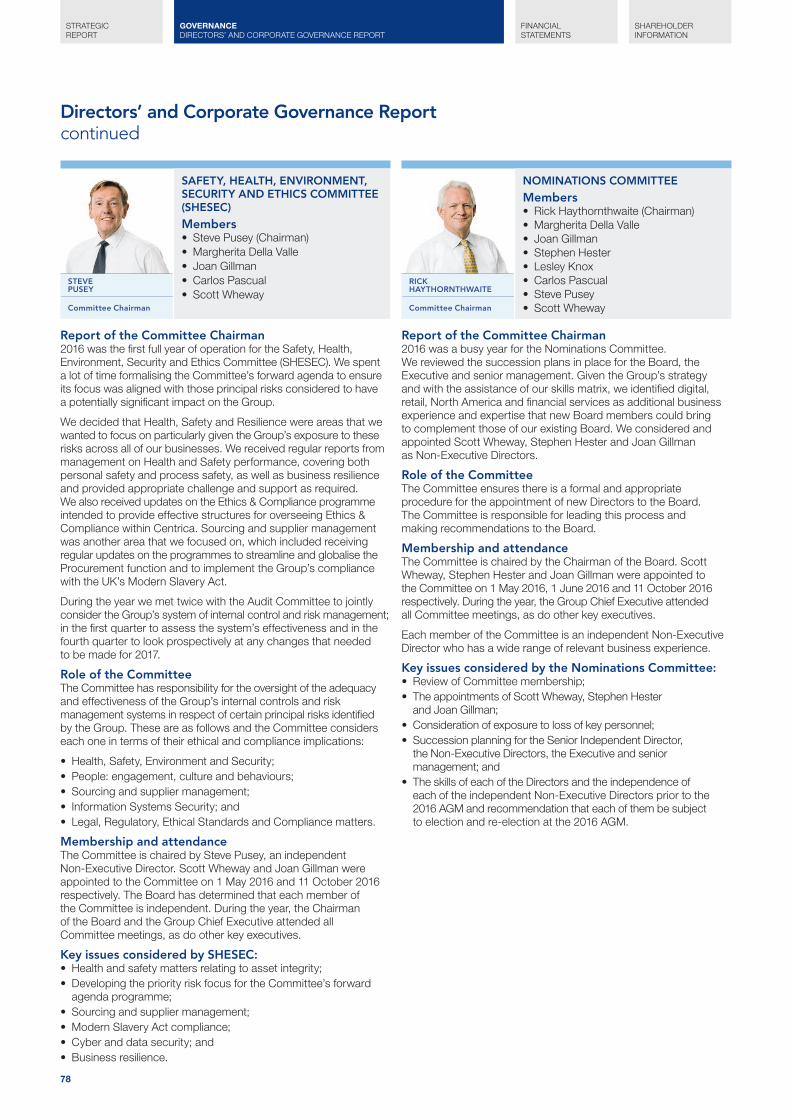
78
STRATEGIC REPORT
FINANCIAL STATEMENTS
SHAREHOLDER INFORMATION
GOVERNANCE DIRECTORS’ AND CORPORATE GOVERNANCE REPORT
Directors’ and Corporate Governance Reportcontinued
Report of the Committee Chairman2016 was the first full year of operation for the Safety, Health, Environment, Security and Ethics Committee (SHESEC). We spent a lot of time formalising the Committee’s forward agenda to ensure its focus was aligned with those principal risks considered to have a potentially significant impact on the Group.
We decided that Health, Safety and Resilience were areas that we wanted to focus on particularly given the Group’s exposure to these risks across all of our businesses. We received regular reports from management on Health and Safety performance, covering both personal safety and process safety, as well as business resilience and provided appropriate challenge and support as required. We also received updates on the Ethics & Compliance programme intended to provide effective structures for overseeing Ethics & Compliance within Centrica. Sourcing and supplier management was another area that we focused on, which included receiving regular updates on the programmes to streamline and globalise the Procurement function and to implement the Group’s compliance with the UK’s Modern Slavery Act.
During the year we met twice with the Audit Committee to jointly consider the Group’s system of internal control and risk management; in the first quarter to assess the system’s effectiveness and in the fourth quarter to look prospectively at any changes that needed to be made for 2017.
Role of the CommitteeThe Committee has responsibility for the oversight of the adequacy and effectiveness of the Group’s internal controls and risk management systems in respect of certain principal risks identified by the Group. These are as follows and the Committee considers each one in terms of their ethical and compliance implications:
• Health, Safety, Environment and Security;• People: engagement, culture and behaviours;• Sourcing and supplier management;• Information Systems Security; and• Legal, Regulatory, Ethical Standards and Compliance matters.
Membership and attendanceThe Committee is chaired by Steve Pusey, an independent Non-Executive Director. Scott Wheway and Joan Gillman were appointed to the Committee on 1 May 2016 and 11 October 2016 respectively. The Board has determined that each member of the Committee is independent. During the year, the Chairman of the Board and the Group Chief Executive attended all Committee meetings, as do other key executives.
Key issues considered by SHESEC:• Health and safety matters relating to asset integrity;• Developing the priority risk focus for the Committee’s forward
agenda programme;• Sourcing and supplier management;• Modern Slavery Act compliance;• Cyber and data security; and• Business resilience.
Report of the Committee Chairman2016 was a busy year for the Nominations Committee. We reviewed the succession plans in place for the Board, the Executive and senior management. Given the Group’s strategy and with the assistance of our skills matrix, we identified digital, retail, North America and financial services as additional business experience and expertise that new Board members could bring to complement those of our existing Board. We considered and appointed Scott Wheway, Stephen Hester and Joan Gillman as Non-Executive Directors.
Role of the CommitteeThe Committee ensures there is a formal and appropriate procedure for the appointment of new Directors to the Board. The Committee is responsible for leading this process and making recommendations to the Board.
Membership and attendanceThe Committee is chaired by the Chairman of the Board. Scott Wheway, Stephen Hester and Joan Gillman were appointed to the Committee on 1 May 2016, 1 June 2016 and 11 October 2016 respectively. During the year, the Group Chief Executive attended all Committee meetings, as do other key executives.
Each member of the Committee is an independent Non-Executive Director who has a wide range of relevant business experience.
Key issues considered by the Nominations Committee:• Review of Committee membership;• The appointments of Scott Wheway, Stephen Hester
and Joan Gillman;• Consideration of exposure to loss of key personnel;• Succession planning for the Senior Independent Director,
the Non-Executive Directors, the Executive and senior management; and
• The skills of each of the Directors and the independence of each of the independent Non-Executive Directors prior to the 2016 AGM and recommendation that each of them be subject to election and re-election at the 2016 AGM.
STEVE PUSEY
Committee Chairman
RICK HAYTHORNTHWAITE
Committee Chairman
SAFETY, HEALTH, ENVIRONMENT, SECURITY AND ETHICS COMMITTEE (SHESEC)
Members• Steve Pusey (Chairman)• Margherita Della Valle• Joan Gillman• Carlos Pascual• Scott Wheway
NOMINATIONS COMMITTEE
Members• Rick Haythornthwaite (Chairman)• Margherita Della Valle• Joan Gillman• Stephen Hester• Lesley Knox• Carlos Pascual• Steve Pusey• Scott Wheway
Centrica plc Annual Report and Accounts 2016 79
Set out below is an overview of the Remuneration Committee including its role and membership during 2016. The full Remuneration Report can be found on page 83 which contains our statutory remuneration disclosures as well as more detail on the main areas of focus for the Committee during the year.
Role of the CommitteeThe role of the Committee is to determine and make recommendations to the Board on the Company’s framework and policy for the remuneration of the Chairman of the Board, the Company’s Executive Directors and other senior executives.
Membership and attendanceThe Committee is chaired by Lesley Knox, an independent Non-Executive Director. Scott Wheway was appointed to the Committee on 1 May 2016. Each member of the Committee is independent. No Director is involved in the determination of, or votes on, any matters relating to his or her own remuneration. Meetings of the Committee are attended by the Chairman of the Board, the Group Chief Executive, the Group General Counsel & Company Secretary, the Group HR Director and the Deputy Group HR Director & Group Head of Reward.
Responsibilities of the Remuneration Committee:• Determine total individual remuneration packages and terms and
conditions for the Executive Directors and Executive Committee;• Approve the design of, and determine targets for, any performance
related pay schemes for the Executive Directors and the Executive Committee and approve the total annual and long-term incentive plan payments;
• Review the design of all share incentive plans for approval by the Board and the Company’s shareholders; and
• Prepare and recommend to the Board for approval each year a report on remuneration policy and a separate report on the implementation of the policy in the last financial year.
Key issues considered by the Remuneration Committee:• The approval of the individual strategic objectives and the
financial targets for the short and long-term incentive awards granted in 2016 to Executive Directors and Executive Committee members;
• Review of base pay for Executive Directors and Executive Committee members;
• The approval of the terms of appointment for two new Executive Committee members;
• Developments and trends in executive remuneration with the independent external remuneration committee adviser; and
• Evaluation of the achievement against the objectives set for the vesting of the second tranche of the Group Chief Executive’s recruitment award.
Role of the CommitteeThe Disclosure Committee is responsible for the implementation and monitoring of systems and controls in respect of the management and disclosure of inside information and for ensuring that regulatory announcements, shareholder circulars, prospectuses and other documents issued by the Company comply with applicable legal or regulatory requirements.
Membership and attendanceThe Committee is chaired by Iain Conn, the Group Chief Executive.
Responsibilities of the Disclosure Committee:• Review the preliminary results announcement, the half-year
results and the trading statements;• Consideration of the release of regulatory and
industry announcements;• Review announcements regarding key management changes; and• Consideration of announcements in respect of specific projects.
Key issues considered by the Disclosure Committee:• The proposed final dividend and the final preliminary
results announcement;• The trading updates and approval of the final draft of the
announcements; • The interim dividend and the announcement in respect of
the interim results for the six months to 30 June 2016; and• The changes implemented by the EU Market Abuse Regulations
and the impact of these changes on the Company’s share dealing code.
LESLEY KNOX
Committee Chairman
IAIN CONN
Committee Chairman
REMUNERATION COMMITTEE
Members• Lesley Knox (Chairman)• Margherita Della Valle• Carlos Pascual• Scott Wheway
DISCLOSURE COMMITTEE
Members• Iain Conn (Chairman)• Jeff Bell• Grant Dawson

80
STRATEGIC REPORT
FINANCIAL STATEMENTS
SHAREHOLDER INFORMATION
GOVERNANCE DIRECTORS’ AND CORPORATE GOVERNANCE REPORT
OTHER STATUTORY INFORMATIONThe Directors submit their Annual Report and Accounts for Centrica plc, together with the consolidated Financial Statements of the Centrica group of companies, for the year ended 31 December 2016. The directors’ report required under the Companies Act 2006 (the Act) comprises this Directors’ and Corporate Governance Report, the Remuneration Report and the Responsible Business section for disclosure of our greenhouse gas emissions in the Strategic Report.
The management report required under Disclosure and Transparency Rule 4.1.5R comprises the Strategic Report, (which includes the risks relating to our business), Shareholder Information and details of acquisitions and disposals made by the Group during the year in note 12. This Directors’ and Corporate Governance Report fulfills the requirements of the corporate governance statement required under Disclosure & Transparency Rule 7.2.1.
Future developmentsA description of future developments can be found in the Strategic Report. A description of the Group’s exposure and management of risks is provided in the Strategic Report on pages 56 to 64.
Results and dividendsThe Group’s results and performance summary for the year are set out on page 3. Dividends paid and proposed are set out in note 11 to the Financial Statements on page 133.
Financial instrumentsFull details of the Group’s financial instruments can be found in notes 19, S3 and S6 on pages 143 and 144, 169 to 173 and 176 to 178 respectively.
Articles of Association (Articles)The Company’s Articles were adopted at the 2010 AGM and were amended at the 2016 AGM. They may only be amended by a special resolution of the Shareholders.
DirectorsThe names of the Directors who held office during the year are set out on pages 66 and 67, with the exception of Mike Linn and Ian Meakins who retired from the Board on 18 April 2016 and 1 October 2016 respectively.
Details of the authority, role and powers of Directors are set out within this Directors’ and Corporate Governance Report.
Directors’ indemnities and insuranceIn accordance with the Articles, the Company has granted a deed of indemnity, to the extent permitted by law, to Directors and members of the Executive Committee. Qualifying third-party indemnity provisions (as defined by section 234 of the Act) were in force during the year ended 31 December 2016 and remain in force. The Company also maintains directors’ and officers’ liability insurance for its Directors and officers.
Employment policiesEmployee involvementWe remain committed to employee involvement throughout the business. Employees are kept well informed of the performance and strategy of the Group through personal briefings, regular meetings, email and broadcasts by the Group Chief Executive and members of the Board at key points in the year.
The Company’s all-employee share schemes are a long-established and successful part of our total reward package, encouraging and supporting employee share ownership. In the UK we offer both Sharesave, HMRC’s Save as You Earn Scheme, and the Share Incentive Plan (SIP) with good levels of take-up across the Group. Currently, 57% of eligible UK employees participate in Sharesave and 35% of eligible UK employees participate in the SIP. Details of both schemes are set out in the Remuneration Report on page 89.
Equal opportunitiesThe Group is committed to an active equal opportunities policy from recruitment and selection, through training and development, performance reviews and promotion to retirement. It is our policy to promote an environment free from discrimination, harassment and victimisation, where everyone receives equal treatment regardless of gender, colour, ethnic or national origin, disability, age, marital status, sexual orientation or religion. All decisions relating to employment practices will be objective, free from bias and based solely upon work criteria and individual merit.
READ MORE ON PAGE 72
Employees with disabilitiesIt is our policy that people with disabilities should have full and fair consideration for all vacancies. During the year, we continued to demonstrate our commitment to interviewing those people with disabilities who fulfil the minimum criteria, and endeavour to retain employees in the workforce if they become disabled during employment.
Human rightsAs an international company we have a responsibility and are committed to uphold and protect the human rights of individuals working for us in the communities and societies where we operate. We take steps to ensure that our people working in countries with a high risk to human rights are safeguarded, as set out in our Business Principles and Human Rights Policy. We also recognise the opportunity we have to contribute positively to global efforts to ensure human rights are understood and observed.
Political donationsCentrica’s political donations policy states that Centrica operates on a politically neutral basis. No political donations were made by the Group for political purposes during the year. However, in accordance with the United States Federal Election Campaign Act, a Political Action Committee (PAC) called Direct Energy Employee Political Action Committee (DEEPAC) was formed to facilitate voluntary political contributions by its US employees. DEEPAC is controlled by neither Centrica nor Direct Energy but instead by a governing board of individual employee members of DEEPAC on a voluntary basis. Direct Energy, as authorised by law, has provided limited administrative support to DEEPAC. DEEPAC has been organised to provide a vehicle to dispense voluntary contributions from eligible employees. Participation in DEEPAC is entirely voluntary for eligible employees, and political donations from DEEPAC are determined by a governing board of DEEPAC members. In 2016, contributions to DEEPAC by employees amounted to $78,624, and DEEPAC made 54 political donations totalling $29,000.
Relations with shareholdersThe Board recognises and values the importance of maintaining an effective investor relations and communication programme. The Board is proactive in obtaining an understanding of shareholder views on a number of key matters affecting the Group and receives formal investor feedback regularly.
In 2016, Centrica’s shareholder engagement programme included:
• formal presentations for the announcement of the Group’s 2015 preliminary and 2016 interim results;
• meetings between the Group Chief Executive and Group Chief Financial Officer and the Company’s major shareholders during the year;
• the Chairman of the Remuneration Committee meeting with a number of the Company’s major shareholders during the year to discuss the Company’s remuneration arrangements;
Directors’ and Corporate Governance Reportcontinued
Centrica plc Annual Report and Accounts 2016 81
• the Chairman and Senior Independent Director meeting with major institutional shareholders in order to gain a first-hand understanding of their concerns and key issues and provide regular updates of these to the Board; and
• a meeting with our largest investors and leading proxy advisers to provide insight into the key focus and considerations of the Board and its Committees and a better understanding of the governance measures operating across the business.
The Company’s AGM provides all shareholders with the opportunity to develop further their understanding of the Company. Shareholders can ask questions of the full Board on the matters put to the meeting, including the Annual Report and Accounts and the running of the Company generally. The Company intends to send the Notice of AGM and any related papers to shareholders at least 20 working days before the meeting. All Directors, including Committee Chairmen, are in attendance at the AGM to take questions.
At the AGM, the Chairman and the Group Chief Executive present a review of the Group’s business. A poll is conducted on each resolution at all Company general meetings. All shareholders have the opportunity to cast their votes in respect of proposed resolutions by proxy, either electronically or by post. Following the AGM, the voting results for each resolution are published and are available on our website.
Stephen Hester, the Senior Independent Director, is available to shareholders if they have concerns that contact through the normal channels has failed to resolve.
Our website contains up-to-date information for shareholders and other interested parties including annual reports, shareholder circulars, share price information, news releases, presentations to the investment community and information on shareholder services.
Material shareholdingsAt 31 December 2016, Centrica had received notification of the following material shareholdings pursuant to the Disclosure & Transparency Rules:
31 December 2016
% of sharecapital*
BlackRock, Inc. 5.88
Schroders Investment Management Limited 5.72
Newton Investment Management Limited 5.02
Schroders plc 5.00
Invesco Limited 4.95
Aberdeen Asset Managers Limited 4.91
* Percentages are shown as a percentage of the Company’s issued share capital when the Company was notified of the change in holding.
As at 23 February 2017, there were no changes in the details shown in the above table.
Share capitalThe Company has a single share class which is divided into ordinary shares of 614/81 pence each. The Company was authorised at the 2016 AGM to allot up to 1,690,057,192 ordinary shares as permitted by the Act. A renewal of this authority will be proposed at the 2017 AGM. The Company’s issued share capital as at 31 December 2016, together with details of shares issued during the year, is set out in note 25 to the Financial Statements.
Rights attaching to sharesEach ordinary share of the Company carries one vote. Further information on the voting and other rights of shareholders is set out in the Articles and in explanatory notes which accompany notices of general meetings, all of which are available on our website.
Repurchase of sharesAs permitted by the Articles, the Company obtained shareholder authority at the 2016 AGM to purchase its own shares up to a maximum of 507,017,158 ordinary shares. No shares were purchased under this authority in 2016.
As at 31 December 2016, 50,833,460 shares were held as treasury shares. These shares held in treasury represent 0.93% of the Company’s issued share capital. Dividends are waived in respect of shares held in the treasury share account.
Issued share capitalIn May 2016 the Company conducted an equity placing of 350,000,000 ordinary shares of 614/81 pence each at a price of 200.00 pence per share, a discount of 13.5%, to raise a total of £700 million before expenses (£694 million net of expenses). The proceeds from the equity placing allowed the acceleration of the Group’s customer-facing strategy through two attractive and prioritised acquisitions, ENER-G Cogen and Neas Energy, and also allowed the Group to further lower its level of net debt in an uncertain external environment, reducing pressure on the Group’s targeted strong investment grade credit ratings.
Shares held in employee benefit trustsThe Centrica plc Employee Benefit Trust (EBT) is used to purchase shares on behalf of the Company for the benefit of employees, in connection with the Deferred and Matching Share Scheme, the Restricted Share Scheme and the On Track Incentive Plan. The Centrica plc Share Incentive Plan Trust (SIP Trust) is used to purchase shares on behalf of the Company for the benefit of employees, in connection with the SIP. Both the Trustees of the EBT and the SIP, in accordance with best practice, have agreed not to vote any unallocated shares held in the EBT or SIP at any general meeting and dividends are waived in respect of these shares. In respect of allocated shares in both the EBT and the SIP Trust, the Trustees shall vote in accordance with participants’ instructions. In the absence of any instruction, the Trustees shall not vote.
Significant agreements – change of controlThere are a number of agreements to which the Company is party that take effect, alter or terminate upon a change of control of the Company following a takeover bid. The significant agreement of this kind relates to 2009, when Centrica entered into certain transactions with EDF Group in relation to an investment in the former British Energy Group, which owned and operated a fleet of nuclear power stations in the UK. The transactions include rights for EDF Group and Centrica to offtake power from these nuclear power stations. As part of the arrangements, on a change of control of Centrica, the Group loses its right to participate on the boards of the companies in which it has invested. Furthermore, where the acquirer is not located in certain specified countries, EDF Group is able to require Centrica to sell out its investments to EDF Group.
Related party transactionsRelated party transactions are set out in note S8 to the Financial Statements.
Events after the balance sheet dateEvents after the balance sheet date are disclosed in note 26 to the Financial Statements.
82
STRATEGIC REPORT
FINANCIAL STATEMENTS
SHAREHOLDER INFORMATION
GOVERNANCE DIRECTORS’ AND CORPORATE GOVERNANCE REPORT
Disclosures required under Listing Rule 9.8.4RThe Company is required to disclose certain information under Listing Rule 9.8.4R in the Directors’ Report or advise where such relevant information is contained. All such disclosures are included in this Directors and Corporate Governance report, other than the following sections of the Annual Report and Accounts 2016.
InformationLocation in Annual Report Page(s)
Directors’ compensation Remuneration Report 83 to 99
Capitalised interest (borrowing costs) Financial Statements 129, note 8
Details of long-term incentive schemes Remuneration Report 84
Going concernAccounting standards require that Directors satisfy themselves that it is reasonable for them to conclude whether it is appropriate to prepare the financial statements on a going concern basis. The Group’s business activities, together with factors that are likely to affect its future development and position, are set out in the Group Chief Executive’s statement on pages 6 to 9 and the Business Reviews on pages 36 to 51. After making enquiries, the Board has a reasonable expectation that the parent company and the Group as a whole have adequate resources to continue in operational existence for the foreseeable future. For this reason, the Board continues to adopt the going concern basis in preparing the Financial Statements. Further details of the Group’s liquidity position are provided in notes 24 and S3 to the Financial Statements.
Directors’ responsibilities statementThe Directors, who are named on pages 66 and 67, are responsible for preparing the Annual Report, the Remuneration Report, the Strategic Report and the Financial Statements in accordance with applicable law and regulations.
Company law requires the Directors to prepare Financial Statements for each financial year. Accordingly, the Directors have prepared the Group Financial Statements in accordance with International Financial Reporting Standards (IFRS) as adopted by the European Union (EU) and have elected to prepare the Company Financial Statements in accordance with United Kingdom Generally Accepted Accounting Practice including FRS 101 ‘Reduced Disclosure Framework’ (United Kingdom Accounting Standards and applicable law). Under company law, the Directors must not approve the Financial Statements unless they are satisfied that they give a true and fair view of the state of affairs of the Group and the Company and of the profit or loss of the Group for that period. In preparing these Financial Statements, the Directors are required to:
• select suitable accounting policies and then apply them consistently;
• make judgements and accounting estimates that are reasonable and prudent;
• state whether IFRS as adopted by the EU and applicable UK Accounting Standards have been followed, subject to any material departures disclosed and explained in the Group and Company Financial Statements respectively; and
• prepare the Financial Statements on the going concern basis unless it is inappropriate to presume that the Company will continue in business.
The Directors are responsible for keeping adequate accounting records that are sufficient to show and explain the Company’s transactions and disclose with reasonable accuracy at any time the financial position of the Company and the Group and enable them to ensure that the Financial Statements and the Remuneration Report comply with the Act and, as regards the Group Financial Statements, Article 4 of the IAS Regulation. They are also responsible for safeguarding the assets of the Company and the Group and hence for taking reasonable steps for the prevention and detection of fraud and other irregularities.
Furthermore, the Directors are responsible for the maintenance and integrity of the Company’s website. Legislation in the UK governing the preparation and dissemination of Financial Statements may differ from legislation in other jurisdictions.
The Directors consider that the Annual Report and Accounts 2016, when taken as a whole, is fair, balanced and understandable and provides the information necessary for shareholders to assess the Group’s performance, business model and strategy.
Each of the Directors confirm that to the best of their knowledge:
• the Group Financial Statements, which have been prepared in accordance with IFRS as adopted by the EU, give a true and fair view of the assets, liabilities, financial position and profit or loss of the Group;
• the Strategic Report contained on pages 2 to 64 together with the Directors’ and Corporate Governance Report on pages 65 to 99, includes a fair review of the development and performance of the business and the position of the Group, together with a description of the principal risks and uncertainties that it faces;
• as outlined on page 75, there is no relevant audit information of which PwC are unaware; and
• they have taken all the steps that they ought to have taken as a Director in order to make themselves aware of any relevant audit information and to establish that the Company’s auditors are aware of that information.
By order of the Board
Grant DawsonGroup General Counsel & Company Secretary23 February 2017
Directors’ and Corporate Governance Reportcontinued
Centrica plc Annual Report and Accounts 2016 83
REMUNERATION REPORT
On behalf of the Board, I am pleased to present the Remuneration Committee’s report for 2016.
OVERVIEWDuring 2016 we operated our Policy, approved by shareholders in April 2015, for the second of the intended three-year period. We were pleased to receive votes in support of our 2015 Implementation Report from over 85% of our shareholders notwithstanding some expressed concerns about the one-off recruitment awards granted to Iain Conn. The awards were granted as compensation for the forfeiture of unvested long-term incentive plan awards from his previous employer and were a critical part of securing his employment in the face of significant competition for his services. Set out in detail on page 95 of this report is the Committee’s assessment of Iain’s performance against the targets that were set in respect of the second and final tranche of shares.
PERFORMANCE FOR THE YEARThe Board believes that the Executive Team has successfully repositioned the strategy, organisation and priorities of the Group. The Board established targets for the year, the achievement of which would enable delivery of the strategy over the medium term, in the knowledge that these would be very stretching for the Group as a whole and successful achievement would require exceptional leadership.
I am able to report that all targets have been achieved or exceeded and the pace of change has resulted in greater progress along the transformation journey than the Board could have reasonably expected. A summary of the individual assessment of each Executive Director against the demanding personal objectives that were set for the year is set out on page 93 of this report.
Following the plan for 2016 being set towards the end of 2015, average commodity prices have fallen by 15% – 30%, driven by lower demand in Asia, US shale gas resilience, natural gas oversupply and continued high production by OPEC member states. Whilst some of this price fall has been offset through planned hedging, the impact on the Group was significant. However, underlying performance, which is a key consideration in assessing Group operating cash flow growth, was very strong. The key drivers were above plan delivery in the transformation and efficiency programme across the Group somewhat offsetting gross margin pressures, most notably in UK Energy Supply & Services, Exploration & Production, Energy Marketing & Trading gross margin generation in trading and the gas asset book, and significant improvements in working capital management.
In reaching a view on financial performance, the Committee satisfied itself that working capital recovery was not the driver of out-performance and the benefit of foreign exchange as the pound sterling weakened over the year was more than offset by the commodity price impact. The Committee considered management behaviour including non-financial metrics. Safety outputs missed stretching objectives but personal and customer safety improved materially versus 2015 and process safety was stable. Employee engagement scores from a full survey taken during the most material organisational change period fell back, particularly in the areas of greatest change. The Committee also considered the communications and investor reaction to the equity placing and post-placing developments. Having considered all of these factors, overall the Committee concluded that financial performance as reported was a fair reflection of management performance in the year.
For past performance over the three-year performance period ending with 2016, the Group Economic Profit target applying in both long-term incentive plans operated under the previously approved policy (the Long Term Incentive Scheme and the Deferred and Matching Share Scheme) was not met, therefore there will be no vesting in 2017 and all of the awards made in April 2014 will be forfeit.
TOTAL REMUNERATIONAs there were a number of Executive Directors appointed part way through the prior year and 2016 has seen very strong in-year performance, this Implementation Report will include materially increased total remuneration figures when compared to the prior year figures. The Committee is satisfied that the remuneration determined for each Executive is appropriate in the context of the approved Policy and the significant in-year performance delivered.
LOOKING FORWARDIn preparation for presentation of a remuneration policy to shareholders at the AGM in 2018 the Committee plans to fully review executive remuneration during the forthcoming year taking into consideration the strategic direction of the Group, appropriate ongoing alignment with that strategy and the continuing development of all stakeholders’ views regarding executive pay. The Committee expects to consult with major shareholders on any proposals in the latter months of the year.
Lesley KnoxChairman of the Remuneration Committee23 February 2017
“ The Board believes that the Executive Team has successfully repositioned the strategy, organisation and priorities of the Group.”Lesley KnoxChairman of the Remuneration Committee
Remuneration Report

84
STRATEGIC REPORT
FINANCIAL STATEMENTS
SHAREHOLDER INFORMATION
GOVERNANCE REMUNERATION SUMMARY FOR 2016
Iain Conn
Adjusted operating cash flow
Strategic objectives
75
125104
60
Jeff Bell
Adjusted operating cash flow
Strategic objectives
50125
104
7550
Mark Hanafin
Adjusted operating cash flow
Strategic objectives
125104
75
Mark Hodges
Adjusted operating cash flow
Strategic objectives
75
125104
70
Jeff Bell
Group EP
EPS
Non-financial KPIs
23
1913
58
Mark Hanafin
Group EP
EPS
Non-financial KPIs
28
2417
48
Long-term incentive outcome
SHORT-TERM AND LONG-TERM INCENTIVE PERFORMANCE 2016The charts below set out the measures and their weighting (inner circle) and the performance achieved against the maximum (outer circle) for both the short-term (Annual Incentive Plan) and long-term (Long Term Incentive Scheme and Deferred and Matching Share Scheme) incentive arrangements operated during the year.
Short-term incentive targetsGroup financial performance – adjusted operating cash flow of £2,610 million was required for target achievement and £2,741 million for maximum. The threshold level was £2,349 million.
Individual strategic objectives – achievement against strategic objectives aligned to the Group’s strategic priorities, measured in line with the Group’s performance management process.
Short-term incentive outcomeFigures in the charts below represent percentage of base salary for each Executive Director. Achievement against individual strategic objectives is set out on page 93.
Long-term incentive targets
For the Long Term Incentive Scheme (LTIS) and the Deferred and Matching Share Scheme (DMSS), performance against Group Economic Profit (EP), Adjusted Earnings per Share (EPS) and non-financial KPIs was measured over a three-year period ending with 2016. In addition, a positive or negative TSR multiplier is applied to any vesting outcome under the LTIS.
The EP and EPS performance targets have not been achieved. Performance against the non-financial KPI dashboard across the three-year period was strong, however, as a result of the EP target not being met, the non-financial KPI portion of the LTIS award will not vest.
Neither of the long-term incentive plans ending with the 2016 performance year will vest and therefore there will be no payout in 2017. Full details of the performance outcomes are set out on page 94.
Remuneration Summary for 2016

Centrica plc Annual Report and Accounts 2016 85
2016 %
1219
3633
To staff
To government
To shareholders
Investing activities
To Directors
0.08
2015 %
922
3534
0.05
To staff
To government
To shareholders
Investing activities
To Directors
0 1,000 2,000 3,000
£000
4,000 5,000 6,000 7,000
Minimumtotal pay
OpportunityIainConn
JeffBell
MarkHanafin
MarkHodges
2016 Actual(i)
2015 Actual
Opportunity
2016 Actual
2015 Actual(ii)
2015 Actual
2015 Actual(iii)
Opportunity
2016 Actual
Opportunity
2016 ActualFixed remunerationShort-term incentiveRecruitment award
Minimum total pay On-target total pay Maximum total pay
Minimumtotal pay On-target total pay Maximum total pay
On-target total pay Maximum total pay
Minimumtotal pay On-target total pay Maximum total pay
MAXIMUM TOTAL REMUNERATION OPPORTUNITY AND TOTAL REMUNERATION RECEIVED IN 2016The chart below sets out the total remuneration received for the year for each Executive Director on the Board during 2016, prepared on the same basis as the single figure for total remuneration table set out on page 92. In addition, for comparison purposes, the chart provides an indication of minimum, on-target and maximum total remuneration opportunity, prepared on the same basis.
(i) Achievement against the performance conditions set for the final tranche of the recruitment award is disclosed on page 95.(ii) Jeff Bell was appointed to the Board on 1 August 2015. His 2015 remuneration therefore represents 42% of a full year.(iii) Mark Hodges was appointed to the Board on 1 June 2015. His 2015 remuneration therefore represents 58% of a full year.
2016 CASH FLOW DISTRIBUTION TO STAKEHOLDERSThe Committee monitors the relationship between the Directors’ total remuneration and cash outflows to other stakeholders. As demonstrated by the chart, the Directors’ aggregate total remuneration for the year equates to 0.08% (2015: 0.05%) of the Group’s operating cash flow.

86
STRATEGIC REPORT
FINANCIAL STATEMENTS
SHAREHOLDER INFORMATION
GOVERNANCE REMUNERATION POLICY
Fixed remuneration
Short-termincentive
Long-termincentive
Cash Shares
10% 20% 30% 40% 50% 60% 70% 80% 90% 100%0%
Remuneration Policy
Set out over the following pages is a summary of the Remuneration Policy that was approved by shareholders on 27 April 2015. The full Remuneration Policy can be found at centrica.com.
EXECUTIVE DIRECTORS’ REMUNERATIONThe Committee believes that the remuneration arrangements are completely aligned with the Executives’ underlying commitment to act in the best interests of sustainable shareholder value creation, whilst ensuring behaviours remain consistent with the governance and values of the business.
Key objectives of reward frameworkThe Policy aims to deliver a remuneration package:
• to attract and retain high calibre Executives in a challenging and competitive business environment;
• that delivers an appropriate balance between fixed and variable compensation for each Executive;
• that places a strong emphasis on performance, both the short term and long term;
• strongly aligned to the achievement of strategic objectives and the delivery of sustainable value to shareholders; and
• that seeks to avoid creating excessive risks in the achievement of performance targets.
Reward frameworkThe core design of the total remuneration framework for Executives ensures that a substantial portion of the maximum opportunity is dependent upon performance as indicated in the chart below. Total remuneration comprises fixed pay and variable performance related pay, which is further divided into short-term incentive (with a one-year performance period) and long-term incentive (with a three-year performance period).
Short-term incentives relate to awards under the Annual Incentive Plan (AIP) which is described on page 87. Long-term incentives relate to awards under the Long Term Incentive Plan (LTIP) which is described on page 88.
KPIs have been selected that align with our purpose: to deliver energy and services to satisfy the changing needs of our customers, and also support our long-term financial goals. In addition, our underlying principles of operating safely and with an engaged workforce are included.
The KPIs, set out in detail on pages 18 and 19, influence the design and underpin the selection of performance criteria used within the incentive arrangements as demonstrated in the KPIs and incentives table below. If overall performance is not deemed satisfactory, the award for any year may be reduced or forfeited, at the discretion of the Committee.
In addition, Executives are subject to a minimum shareholding guideline. Under the LTIP there are mandatory holding periods of three to five years from grant or award date, to provide further alignment with the returns to our shareholders.
Remuneration principles• the potential maximum remuneration that Executives could
receive is a key consideration when agreeing the level of base pay and the performance related elements of the remuneration package;
• the Committee takes account of, and is sensitive to, shareholder views, market changes, skills availability, competitive pressure and/or the economic climate when considering Executive remuneration. In so doing, the Committee follows similar principles that apply when remuneration is considered for all other employees within the Group; and
• benchmarking against UK cross-industry comparator organisations of similar size and complexity is used to assist the Committee in evaluating market movement and the relative competitive position of Executive remuneration to ensure that packages offered support the attraction and retention of high calibre individuals.
KPIs and incentives
KPI Incentive link
Adjusted operating cash flow (AOCF) AIP primary financial measure
Adjusted operating profit LTIP EP three-year measure
Adjusted basic earnings per share (EPS) LTIP EPS growth measure
Total shareholder return (TSR) AIP deferred share investment and minimum shareholding requirement
Lost time injury frequency rate (LTIFR) LTIP non-financial KPI dashboard
Process safety LTIP non-financial KPI dashboard
Customer satisfaction LTIP non-financial KPI dashboard
Employee engagement LTIP non-financial KPI dashboard

Centrica plc Annual Report and Accounts 2016 87
AIP timeline
Year 5Year 4Year 3Award date Year 1 Year 2
Performance period
Performance period Period subject to malus/clawback
Period subject to clawback
Period subject to malus Period subject to clawback
50% awarded in shares 2/3 of shares released 1/3 of shares released
50% paid in cash
Remuneration Policy tableThe table below sets out the Remuneration Policy that was approved at the AGM on 27 April 2015 and applies to Executives.
Purpose and link to strategy
Operation and clawback Maximum opportunity Performance measures
BASE PAY/SALARY
Reflects the scope and responsibility of the role and the skills and experience of the individual.
Salaries are set at a level sufficient to allow the Company to compete for international talent and to recruit, motivate and retain individuals of the correct calibre to execute our strategy.
Base salaries are reviewed annually, taking account of performance, market conditions and pay in the Group as a whole. Changes are usually effective from 1 April each year.
This is consistent with the previously approved policy.
Ordinarily, base salary increases in percentage terms will be in line with increases awarded to other employees of the Group.
Increases may be made above this level to take account of individual circumstances such as a change in responsibility, progression in the role or a significant increase in the scale or size of the role.
The base salary for an Executive will not exceed £1 million per annum.
This is consistent with the previously approved policy.
Not applicable.
SHORT-TERM INCENTIVE PLAN
Designed to reward the delivery of key strategic priorities for the year.
These priorities position the Group for strong short-term financial performance, in service of longer-term strategic goals.
The AIP, together with the LTIP, replaces the previous Annual Incentive Scheme (AIS), Deferred and Matching Share Scheme (DMSS) and Long Term Incentive Scheme (LTIS).
The AIP is designed to incentivise and reward the achievement of demanding financial and individual strategically aligned performance objectives.
Following measurement of the performance outcome, half of the AIP award is paid in cash. The other half is required to be deferred into shares, two-thirds of which are released after three years and the remaining third after four years. Dividends are payable on the shares during the restricted period.
If overall business performance is not deemed satisfactory, an individual’s AIP payment for the year may be reduced or forfeited, at the discretion of the Committee.
Malus and clawback apply to the cash and share awards (see policy table notes on page 90).
Maximum of 200% of base salary.
Half the maximum is payable for on-target performance. The minimum award is 0%.
The maximum was 180% of base salary under the previously approved policy.
The 20% of base salary increase in maximum opportunity is offset by the 80% of base salary reduction in maximum long-term incentive opportunity and longer deferral periods.
Up to 75% of base salary based on individual strategic objectives aligned to the Group’s strategic priorities, with the remainder based on adjusted operating cash flow.
Assessed over one financial year.
Up to 72% of base salary was based on individual strategic objectives under the previously approved policy.

88
STRATEGIC REPORT
FINANCIAL STATEMENTS
SHAREHOLDER INFORMATION
GOVERNANCE REMUNERATION POLICY
LTIP timeline
Year 5Year 4Year 3Award date Year 1 Year 2
Period subject to clawbackPeriod subject to malus
Two-year holding period
Performance tested and award vests Shares releasedAward granted
Three-year performance period
Remuneration Policycontinued
Purpose and link to strategy
Operation and clawback Maximum opportunity Performance measures
LONG-TERM INCENTIVE PLAN
Assists with Executive retention and incentivises an appropriate balance between short-term performance and long-term value creation for shareholders.
Encourages sustainable high performance.
Provides a direct link between remuneration and KPIs, reinforcing the desire for sustainable high performance over the long term.
The LTIP simplifies the previous long-term incentive arrangements which were delivered under two separate schemes.
LTIP awards are granted to Executives each year based on a percentage of base salary at the point of award. Shares vest at the end of a three-year performance period, depending on the achievement against the Company performance targets, but are not released until the fifth anniversary of the award date.
LTIP awards are usually delivered as conditional shares which vest at the end of the three-year performance period. Awards may also be granted as nil-cost options with a seven-year exercise period. It is a requirement of the LTIP that the net shares are held for a further two years following the vesting date. Malus applies to the shares during the three-year performance period and clawback applies to the shares during the two-year retention period (see policy table notes on page 90).
Dividend equivalents are calculated at the end of the performance period on any conditional LTIP share awards or nil-cost options. Dividend equivalents are paid as additional shares or as cash.
If overall performance is not deemed satisfactory, the award for any year may be reduced or forfeited, at the discretion of the Committee.
Maximum of 300% of base salary plus dividend equivalents. The minimum vesting level is 0%.
The maximum was 380% of base salary plus dividend equivalents under the previously approved policy.
One-third based on EPS over the three-year performance period.
One-third based on absolute aggregate EP over the three-year performance period.
One-third based on non-financial KPI dashboard.
Where performance falls between stated points, vesting is calculated on a straight-line basis.
The weighting to non-financial KPIs has marginally increased from 30% to 33.3% compared with the long-term incentive arrangements in the previously approved policy.
This reflects the Committee’s view of the appropriate balance between financial and non-financial measures at two-thirds/one-third respectively.
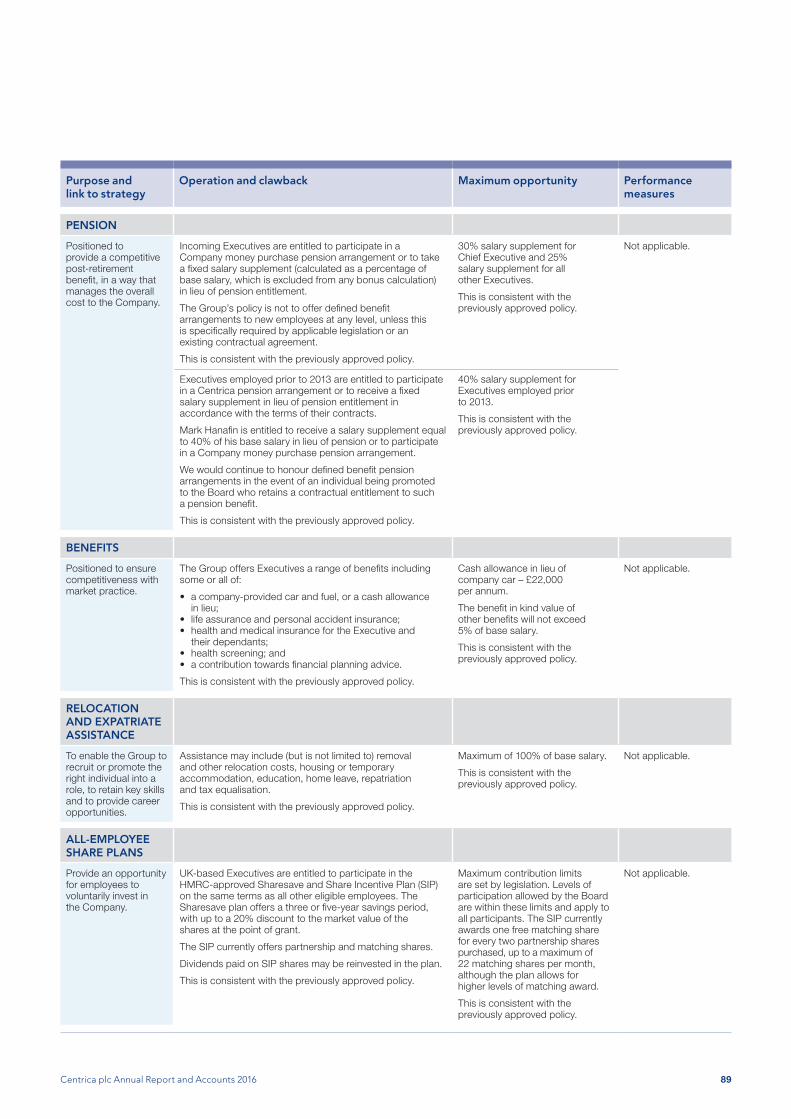
Centrica plc Annual Report and Accounts 2016 89
Purpose and link to strategy
Operation and clawback Maximum opportunity Performance measures
PENSION
Positioned to provide a competitive post-retirement benefit, in a way that manages the overall cost to the Company.
Incoming Executives are entitled to participate in a Company money purchase pension arrangement or to take a fixed salary supplement (calculated as a percentage of base salary, which is excluded from any bonus calculation) in lieu of pension entitlement.
The Group’s policy is not to offer defined benefit arrangements to new employees at any level, unless this is specifically required by applicable legislation or an existing contractual agreement.
This is consistent with the previously approved policy.
30% salary supplement for Chief Executive and 25% salary supplement for all other Executives.
This is consistent with the previously approved policy.
Not applicable.
Executives employed prior to 2013 are entitled to participate in a Centrica pension arrangement or to receive a fixed salary supplement in lieu of pension entitlement in accordance with the terms of their contracts.
Mark Hanafin is entitled to receive a salary supplement equal to 40% of his base salary in lieu of pension or to participate in a Company money purchase pension arrangement.
We would continue to honour defined benefit pension arrangements in the event of an individual being promoted to the Board who retains a contractual entitlement to such a pension benefit.
This is consistent with the previously approved policy.
40% salary supplement for Executives employed prior to 2013.
This is consistent with the previously approved policy.
BENEFITS
Positioned to ensure competitiveness with market practice.
The Group offers Executives a range of benefits including some or all of:
• a company-provided car and fuel, or a cash allowance in lieu;
• life assurance and personal accident insurance;• health and medical insurance for the Executive and
their dependants;• health screening; and• a contribution towards financial planning advice.
This is consistent with the previously approved policy.
Cash allowance in lieu of company car – £22,000 per annum.
The benefit in kind value of other benefits will not exceed 5% of base salary.
This is consistent with the previously approved policy.
Not applicable.
RELOCATION AND EXPATRIATE ASSISTANCE
To enable the Group to recruit or promote the right individual into a role, to retain key skills and to provide career opportunities.
Assistance may include (but is not limited to) removal and other relocation costs, housing or temporary accommodation, education, home leave, repatriation and tax equalisation.
This is consistent with the previously approved policy.
Maximum of 100% of base salary.
This is consistent with the previously approved policy.
Not applicable.
ALL-EMPLOYEE SHARE PLANS
Provide an opportunity for employees to voluntarily invest in the Company.
UK-based Executives are entitled to participate in the HMRC-approved Sharesave and Share Incentive Plan (SIP) on the same terms as all other eligible employees. The Sharesave plan offers a three or five-year savings period, with up to a 20% discount to the market value of the shares at the point of grant.
The SIP currently offers partnership and matching shares.
Dividends paid on SIP shares may be reinvested in the plan.
This is consistent with the previously approved policy.
Maximum contribution limits are set by legislation. Levels of participation allowed by the Board are within these limits and apply to all participants. The SIP currently awards one free matching share for every two partnership shares purchased, up to a maximum of 22 matching shares per month, although the plan allows for higher levels of matching award.
This is consistent with the previously approved policy.
Not applicable.
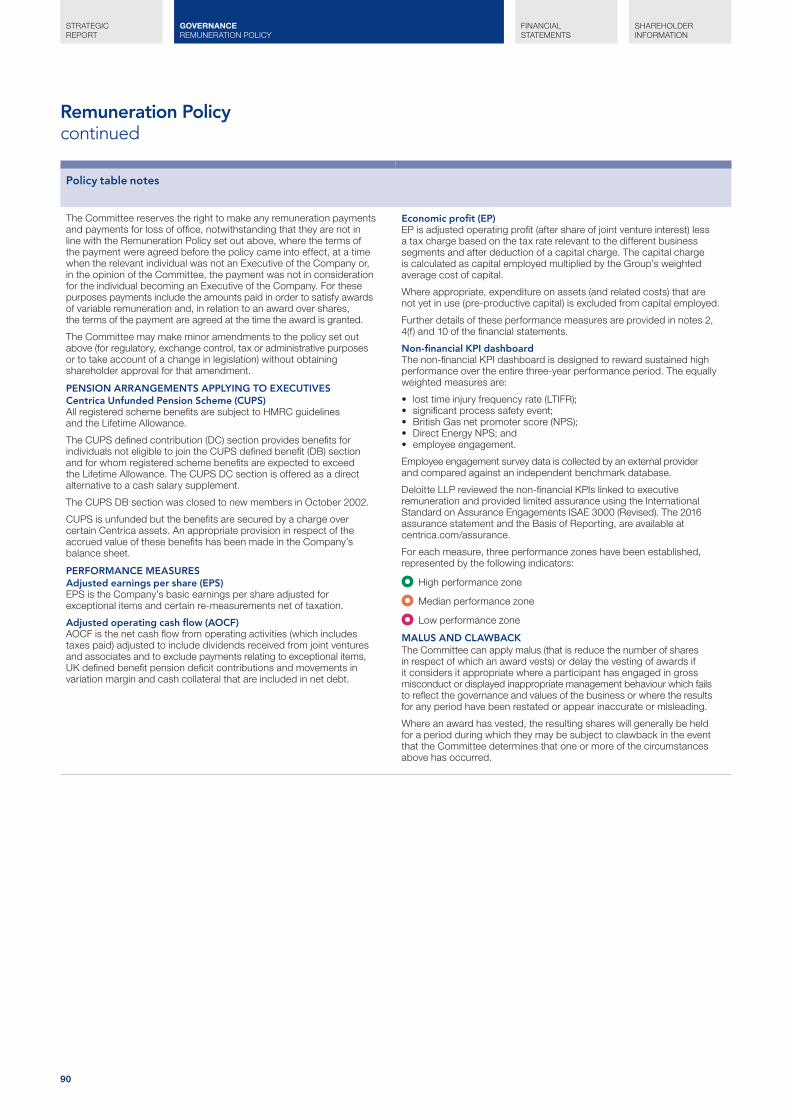
90
STRATEGIC REPORT
FINANCIAL STATEMENTS
SHAREHOLDER INFORMATION
GOVERNANCE REMUNERATION POLICY
Remuneration Policycontinued
Policy table notes
The Committee reserves the right to make any remuneration payments and payments for loss of office, notwithstanding that they are not in line with the Remuneration Policy set out above, where the terms of the payment were agreed before the policy came into effect, at a time when the relevant individual was not an Executive of the Company or, in the opinion of the Committee, the payment was not in consideration for the individual becoming an Executive of the Company. For these purposes payments include the amounts paid in order to satisfy awards of variable remuneration and, in relation to an award over shares, the terms of the payment are agreed at the time the award is granted.
The Committee may make minor amendments to the policy set out above (for regulatory, exchange control, tax or administrative purposes or to take account of a change in legislation) without obtaining shareholder approval for that amendment.
PENSION ARRANGEMENTS APPLYING TO EXECUTIVESCentrica Unfunded Pension Scheme (CUPS)All registered scheme benefits are subject to HMRC guidelines and the Lifetime Allowance.
The CUPS defined contribution (DC) section provides benefits for individuals not eligible to join the CUPS defined benefit (DB) section and for whom registered scheme benefits are expected to exceed the Lifetime Allowance. The CUPS DC section is offered as a direct alternative to a cash salary supplement.
The CUPS DB section was closed to new members in October 2002.
CUPS is unfunded but the benefits are secured by a charge over certain Centrica assets. An appropriate provision in respect of the accrued value of these benefits has been made in the Company’s balance sheet.
PERFORMANCE MEASURESAdjusted earnings per share (EPS)EPS is the Company’s basic earnings per share adjusted for exceptional items and certain re-measurements net of taxation.
Adjusted operating cash flow (AOCF)AOCF is the net cash flow from operating activities (which includes taxes paid) adjusted to include dividends received from joint ventures and associates and to exclude payments relating to exceptional items, UK defined benefit pension deficit contributions and movements in variation margin and cash collateral that are included in net debt.
Economic profit (EP)EP is adjusted operating profit (after share of joint venture interest) less a tax charge based on the tax rate relevant to the different business segments and after deduction of a capital charge. The capital charge is calculated as capital employed multiplied by the Group’s weighted average cost of capital.
Where appropriate, expenditure on assets (and related costs) that are not yet in use (pre-productive capital) is excluded from capital employed.
Further details of these performance measures are provided in notes 2, 4(f) and 10 of the financial statements.
Non-financial KPI dashboardThe non-financial KPI dashboard is designed to reward sustained high performance over the entire three-year performance period. The equally weighted measures are:
• lost time injury frequency rate (LTIFR);• significant process safety event;• British Gas net promoter score (NPS);• Direct Energy NPS; and• employee engagement.
Employee engagement survey data is collected by an external provider and compared against an independent benchmark database.
Deloitte LLP reviewed the non-financial KPIs linked to executive remuneration and provided limited assurance using the International Standard on Assurance Engagements ISAE 3000 (Revised). The 2016 assurance statement and the Basis of Reporting, are available at centrica.com/assurance.
For each measure, three performance zones have been established, represented by the following indicators:
High performance zone
Median performance zone
Low performance zone
MALUS AND CLAWBACKThe Committee can apply malus (that is reduce the number of shares in respect of which an award vests) or delay the vesting of awards if it considers it appropriate where a participant has engaged in gross misconduct or displayed inappropriate management behaviour which fails to reflect the governance and values of the business or where the results for any period have been restated or appear inaccurate or misleading.
Where an award has vested, the resulting shares will generally be held for a period during which they may be subject to clawback in the event that the Committee determines that one or more of the circumstances above has occurred.
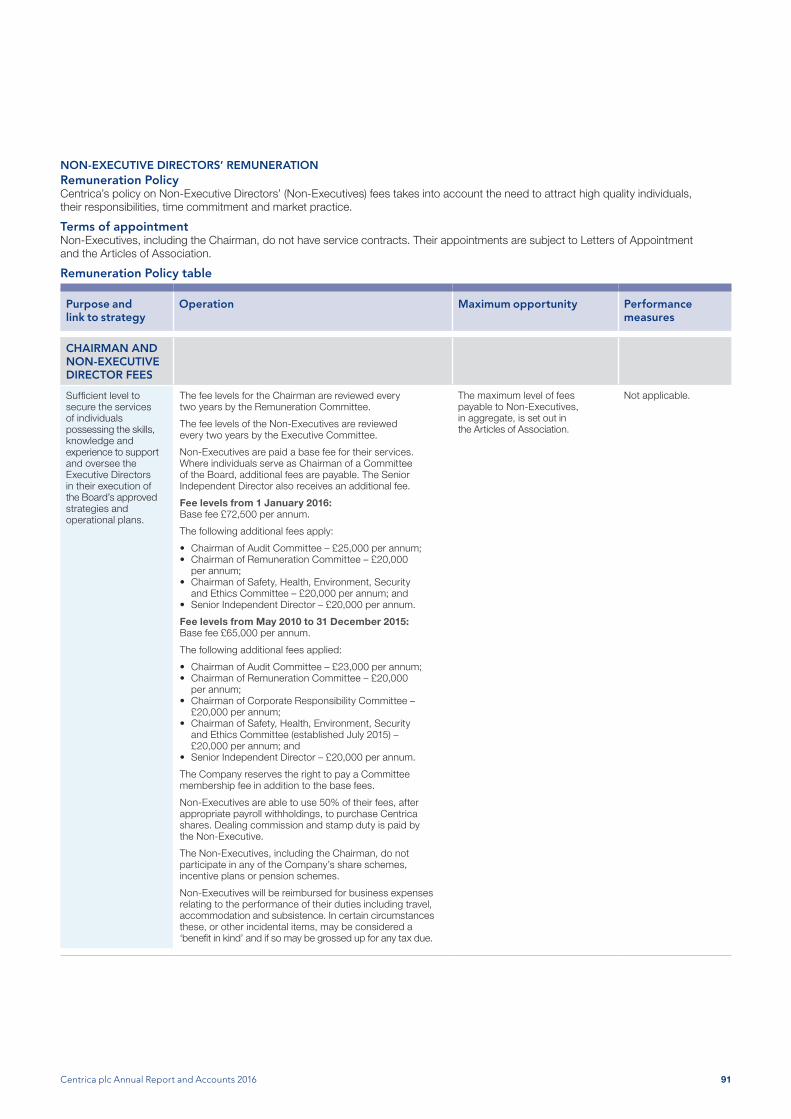
Centrica plc Annual Report and Accounts 2016 91
NON-EXECUTIVE DIRECTORS’ REMUNERATIONRemuneration PolicyCentrica’s policy on Non-Executive Directors’ (Non-Executives) fees takes into account the need to attract high quality individuals, their responsibilities, time commitment and market practice.
Terms of appointmentNon-Executives, including the Chairman, do not have service contracts. Their appointments are subject to Letters of Appointment and the Articles of Association.
Remuneration Policy table
Purpose and link to strategy
Operation Maximum opportunity Performance measures
CHAIRMAN AND NON-EXECUTIVE DIRECTOR FEES
Sufficient level to secure the services of individuals possessing the skills, knowledge and experience to support and oversee the Executive Directors in their execution of the Board’s approved strategies and operational plans.
The fee levels for the Chairman are reviewed every two years by the Remuneration Committee.
The fee levels of the Non-Executives are reviewed every two years by the Executive Committee.
Non-Executives are paid a base fee for their services. Where individuals serve as Chairman of a Committee of the Board, additional fees are payable. The Senior Independent Director also receives an additional fee.
Fee levels from 1 January 2016:Base fee £72,500 per annum.
The following additional fees apply:
• Chairman of Audit Committee – £25,000 per annum;• Chairman of Remuneration Committee – £20,000
per annum;• Chairman of Safety, Health, Environment, Security
and Ethics Committee – £20,000 per annum; and• Senior Independent Director – £20,000 per annum.
Fee levels from May 2010 to 31 December 2015:Base fee £65,000 per annum.
The following additional fees applied:
• Chairman of Audit Committee – £23,000 per annum;• Chairman of Remuneration Committee – £20,000
per annum;• Chairman of Corporate Responsibility Committee –
£20,000 per annum;• Chairman of Safety, Health, Environment, Security
and Ethics Committee (established July 2015) – £20,000 per annum; and
• Senior Independent Director – £20,000 per annum.
The Company reserves the right to pay a Committee membership fee in addition to the base fees.
Non-Executives are able to use 50% of their fees, after appropriate payroll withholdings, to purchase Centrica shares. Dealing commission and stamp duty is paid by the Non-Executive.
The Non-Executives, including the Chairman, do not participate in any of the Company’s share schemes, incentive plans or pension schemes.
Non-Executives will be reimbursed for business expenses relating to the performance of their duties including travel, accommodation and subsistence. In certain circumstances these, or other incidental items, may be considered a ‘benefit in kind’ and if so may be grossed up for any tax due.
The maximum level of fees payable to Non-Executives, in aggregate, is set out in the Articles of Association.
Not applicable.
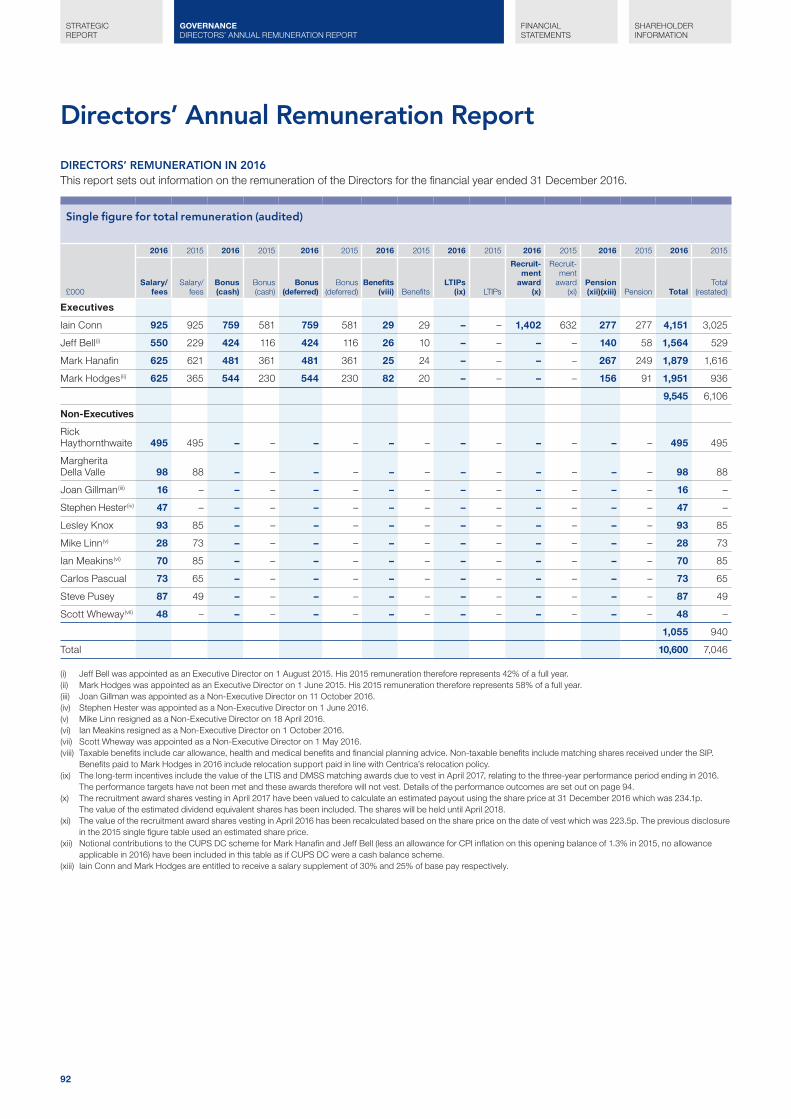
92
STRATEGIC REPORT
FINANCIAL STATEMENTS
SHAREHOLDER INFORMATION
GOVERNANCE DIRECTORS’ ANNUAL REMUNERATION REPORT
Directors’ Annual Remuneration Report
DIRECTORS’ REMUNERATION IN 2016This report sets out information on the remuneration of the Directors for the financial year ended 31 December 2016.
Single figure for total remuneration (audited)
£000
2016 2015 2016 2015 2016 2015 2016 2015 2016 2015 2016 2015 2016 2015 2016 2015
Salary/fees
Salary/fees
Bonus(cash)
Bonus(cash)
Bonus(deferred)
Bonus(deferred)
Benefits (viii) Benefits
LTIPs (ix) LTIPs
Recruit-ment
award (x)
Recruit-ment
award (xi)
Pension (xii)(xiii) Pension Total
Total(restated)
Executives
Iain Conn 925 925 759 581 759 581 29 29 – – 1,402 632 277 277 4,151 3,025
Jeff Bell (i) 550 229 424 116 424 116 26 10 – – – – 140 58 1,564 529
Mark Hanafin 625 621 481 361 481 361 25 24 – – – – 267 249 1,879 1,616
Mark Hodges (ii) 625 365 544 230 544 230 82 20 – – – – 156 91 1,951 936
9,545 6,106
Non-Executives
Rick Haythornthwaite 495 495 – – – – – – – – – – – – 495 495
Margherita Della Valle 98 88 – – – – – – – – – – – – 98 88
Joan Gillman (iii) 16 – – – – – – – – – – – – – 16 –
Stephen Hester (iv) 47 – – – – – – – – – – – – – 47 –
Lesley Knox 93 85 – – – – – – – – – – – – 93 85
Mike Linn (v) 28 73 – – – – – – – – – – – – 28 73
Ian Meakins (vi) 70 85 – – – – – – – – – – – – 70 85
Carlos Pascual 73 65 – – – – – – – – – – – – 73 65
Steve Pusey 87 49 – – – – – – – – – – – – 87 49
Scott Wheway (vii) 48 – – – – – – – – – – – – – 48 –
1,055 940
Total 10,600 7,046
(i) Jeff Bell was appointed as an Executive Director on 1 August 2015. His 2015 remuneration therefore represents 42% of a full year.(ii) Mark Hodges was appointed as an Executive Director on 1 June 2015. His 2015 remuneration therefore represents 58% of a full year.(iii) Joan Gillman was appointed as a Non-Executive Director on 11 October 2016.(iv) Stephen Hester was appointed as a Non-Executive Director on 1 June 2016.(v) Mike Linn resigned as a Non-Executive Director on 18 April 2016.(vi) Ian Meakins resigned as a Non-Executive Director on 1 October 2016.(vii) Scott Wheway was appointed as a Non-Executive Director on 1 May 2016.(viii) Taxable benefits include car allowance, health and medical benefits and financial planning advice. Non-taxable benefits include matching shares received under the SIP.
Benefits paid to Mark Hodges in 2016 include relocation support paid in line with Centrica’s relocation policy.(ix) The long-term incentives include the value of the LTIS and DMSS matching awards due to vest in April 2017, relating to the three-year performance period ending in 2016.
The performance targets have not been met and these awards therefore will not vest. Details of the performance outcomes are set out on page 94.(x) The recruitment award shares vesting in April 2017 have been valued to calculate an estimated payout using the share price at 31 December 2016 which was 234.1p.
The value of the estimated dividend equivalent shares has been included. The shares will be held until April 2018.(xi) The value of the recruitment award shares vesting in April 2016 has been recalculated based on the share price on the date of vest which was 223.5p. The previous disclosure
in the 2015 single figure table used an estimated share price.(xii) Notional contributions to the CUPS DC scheme for Mark Hanafin and Jeff Bell (less an allowance for CPI inflation on this opening balance of 1.3% in 2015, no allowance
applicable in 2016) have been included in this table as if CUPS DC were a cash balance scheme.(xiii) Iain Conn and Mark Hodges are entitled to receive a salary supplement of 30% and 25% of base pay respectively.
Centrica plc Annual Report and Accounts 2016 93
Base salary/feesBase salaries for Executives were reviewed on 1 April 2016 and were not increased. The salaries will be reviewed during the course of 2017 as part of the normal annual cycle.
Base fees for Non-Executives were reviewed in November 2015 and were increased on 1 January 2016 from £65,000 to £72,500 per annum. The additional fee for the Chairman of the Audit Committee was also increased from £23,000 to £25,000 per annum. The increases were in line with the Remuneration Policy. Prior to this increase, Non-Executives’ fees had been at the same level since 2010.
Bonus – Annual Incentive Plan (AIP)The financial performance targets for the 2016 AIP are set out in the Remuneration Summary. The charts on page 84 under short-term incentive outcomes indicate the extent of achievement for each Executive receiving a payment relating to 2016, for each component of the AIP.
Performance against individual strategic objectives in 2016In line with the Group’s annual performance management process, each Executive had a set of stretching individual objectives aligned to the Group’s strategic priorities, for 2016. Set out below is the Committee’s assessment of the achievement against these objectives for each Executive.
Iain ConnIain Conn delivered an outstanding performance, laying the agreed strategic foundation for growth at a pace and to an extent that far exceeded the stretching expectations of the Board while ensuring that all financial outputs were met or exceeded in a year when commodity prices continued to be a strong drag on cash flows.
Iain has established a strong leadership tone in matters of safety, ethics, compliance and management discipline with a commensurate improvement in the performance potential, resilience and risk profile of Centrica. This underpinned delivery of very strong momentum in the drive for greater efficiency resulting in greater than planned cost reductions and the leeway to follow differentiated strategies in the customer-facing businesses.
Under his guidance, material progress has been made in repositioning the portfolio with a focus on creating a future pathway for Exploration & Production and the establishment of strong momentum in the new customer-facing business units. The repositioning required shifts in organisation, capabilities, systems, processes and culture of a scale that required very considerable skill, diligence and imagination to achieve. Although employee engagement suffered modestly during this difficult period of change, personnel safety levels, customer satisfaction and complaints levels all started to strongly move in the right direction.
Iain is proving to be a very strong CEO, well suited to the challenges faced by Centrica in terms of its need to adapt rapidly to deliver profitable growth in a significantly changed strategic context while establishing a reputation as a company that is fully in tune with the expectation of its stakeholders and society at large.
Jeff BellJeff Bell played a key role in delivering against the financial targets and accelerating the realisation of the group cost efficiency targets. Along with the improvements in the debt position, and working capital recovery, he also engaged proactively with the rating agencies with the result that strong investment grade credit ratings were maintained.
He led a tightening up of core finance management processes and improved the capability of the Finance function through a number of critical senior appointments. Jeff has made real progress in implementing and leading new performance management and review processes, with added functional quarterly performance
reviews, new KPIs for internal and external use, a new Group Performance Report and improved quality of management information generally.
Through his leadership of the Centrica Pensions Committee the triennial pensions valuation process reached a successful conclusion within the proposed boundary conditions.
Overall, Jeff has grown confidently into his role as Chief Financial Officer and exceeded expectations in what was a very challenging year.
Mark HanafinMark Hanafin expertly guided the successful establishment of the new global Distributed Energy & Power business and ensured a strong set-up for the future with some excellent hires and the acquisition of ENER-G Cogen.
Energy Marketing & Trading beat its plan by some margin. The new organisation following a smooth relocation is working well, and material growth was delivered through the Neas Energy acquisition and the expansion of the LNG book.
Mark showed skilled handling of strategic disposals and acquisitions. As well as the two key acquisitions, both wind farms and Trinidad and Tobago have been successfully divested, with Canada also on track for sale.
Mark’s overall portfolio exceeded its cash flow targets. This was particularly impressive in Exploration & Production which experienced the most challenging environment in 20 years.
He ensured that cost efficiency targets were met or exceeded. There was excellent progress in reducing E&P lifting and other cash production costs.
Strong safety standards were maintained and significant progress was made in tightening discipline, improving reporting and developing capability.
Overall, Mark made significant progress in reshaping the business in line with the Group Operating Model against a difficult market backdrop.
Mark HodgesMark Hodges has more than delivered on all fronts, managing by far the largest change agenda in the Group’s history, delivering excellent financial outcomes, building capability and changing the organisation, behaviours and mind-set. His leadership style has been pragmatic, Group-minded and delivery-oriented.
Mark has effectively grasped the challenges and helped to ensure an enhanced customer experience at reduced cost, with significant efficiencies delivered and customer outcomes improved materially, with complaints down 31% in UK Home and 22% in UK Business.
A new business-to-consumer participation strategy was agreed with clear pathways established for the growth of Hive and our wider technological capability. Downstream profits were maintained during delivery of the cost efficiency programme, despite a reduction in customer holdings and gross margin compression.
He showed strong leadership in the drive towards an incident free workplace, with employee injury frequency rates and customer injuries both declining significantly.
Under Mark’s direction, Connected Home has been successfully established as a rapidly growing global business unit with a NPS of +65 for customers with multi-connected products. Overall, Mark has exceeded the financial plan for his portfolio in a challenging environment, as well as building a constructive relationship with our regulators and reinforcing British Gas as a responsible market participant.
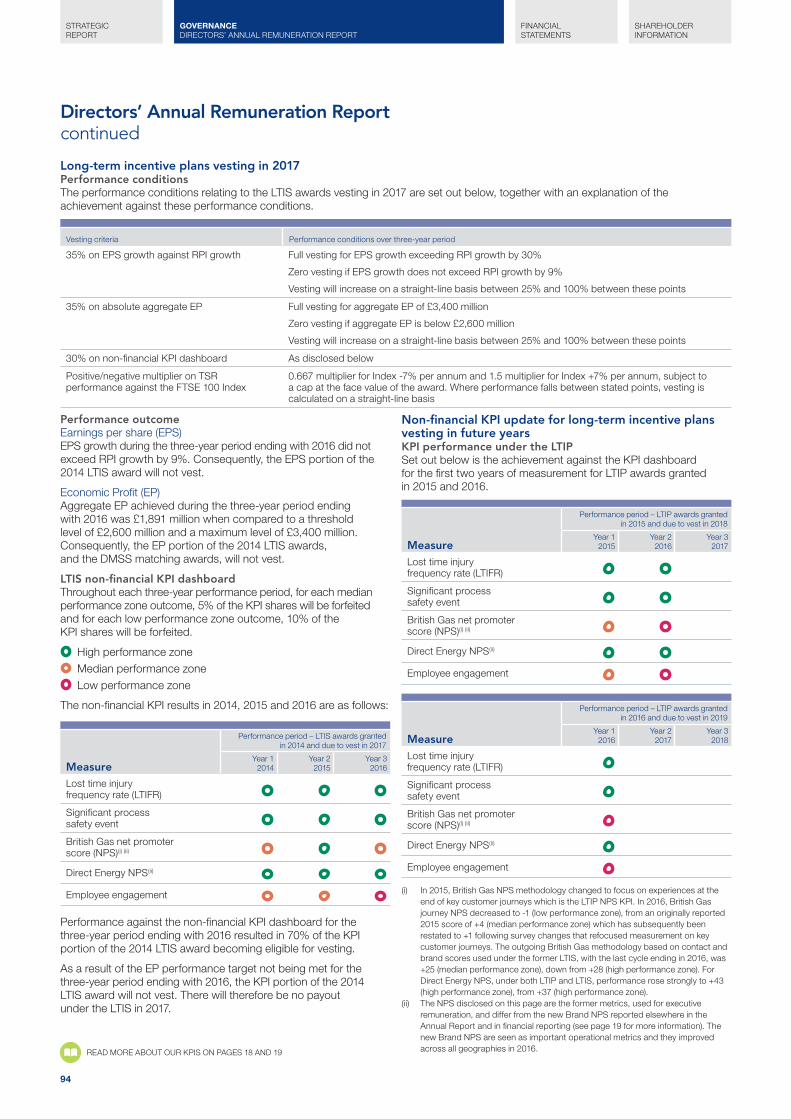
94
STRATEGIC REPORT
FINANCIAL STATEMENTS
SHAREHOLDER INFORMATION
GOVERNANCE DIRECTORS’ ANNUAL REMUNERATION REPORT
Directors’ Annual Remuneration Reportcontinued
Performance outcomeEarnings per share (EPS)EPS growth during the three-year period ending with 2016 did not exceed RPI growth by 9%. Consequently, the EPS portion of the 2014 LTIS award will not vest.
Economic Profit (EP)Aggregate EP achieved during the three-year period ending with 2016 was £1,891 million when compared to a threshold level of £2,600 million and a maximum level of £3,400 million. Consequently, the EP portion of the 2014 LTIS awards, and the DMSS matching awards, will not vest.
LTIS non-financial KPI dashboardThroughout each three-year performance period, for each median performance zone outcome, 5% of the KPI shares will be forfeited and for each low performance zone outcome, 10% of the KPI shares will be forfeited.
High performance zone Median performance zone Low performance zone
The non-financial KPI results in 2014, 2015 and 2016 are as follows:
Measure
Performance period – LTIS awards grantedin 2014 and due to vest in 2017
Year 12014
Year 22015
Year 32016
Lost time injury frequency rate (LTIFR)
Significant process safety event
British Gas net promoter score (NPS)(i) (ii)
Direct Energy NPS(ii)
Employee engagement
Performance against the non-financial KPI dashboard for the three-year period ending with 2016 resulted in 70% of the KPI portion of the 2014 LTIS award becoming eligible for vesting.
As a result of the EP performance target not being met for the three-year period ending with 2016, the KPI portion of the 2014 LTIS award will not vest. There will therefore be no payout under the LTIS in 2017.
Non-financial KPI update for long-term incentive plans vesting in future yearsKPI performance under the LTIPSet out below is the achievement against the KPI dashboard for the first two years of measurement for LTIP awards granted in 2015 and 2016.
Measure
Performance period – LTIP awards grantedin 2015 and due to vest in 2018
Year 12015
Year 22016
Year 32017
Lost time injury frequency rate (LTIFR)
Significant process safety event
British Gas net promoter score (NPS)(i) (ii)
Direct Energy NPS(ii)
Employee engagement
Measure
Performance period – LTIP awards grantedin 2016 and due to vest in 2019
Year 12016
Year 22017
Year 32018
Lost time injury frequency rate (LTIFR)
Significant process safety event
British Gas net promoter score (NPS)(i) (ii)
Direct Energy NPS(ii)
Employee engagement
(i) In 2015, British Gas NPS methodology changed to focus on experiences at the end of key customer journeys which is the LTIP NPS KPI. In 2016, British Gas journey NPS decreased to -1 (low performance zone), from an originally reported 2015 score of +4 (median performance zone) which has subsequently been restated to +1 following survey changes that refocused measurement on key customer journeys. The outgoing British Gas methodology based on contact and brand scores used under the former LTIS, with the last cycle ending in 2016, was +25 (median performance zone), down from +28 (high performance zone). For Direct Energy NPS, under both LTIP and LTIS, performance rose strongly to +43 (high performance zone), from +37 (high performance zone).
(ii) The NPS disclosed on this page are the former metrics, used for executive remuneration, and differ from the new Brand NPS reported elsewhere in the Annual Report and in financial reporting (see page 19 for more information). The new Brand NPS are seen as important operational metrics and they improved across all geographies in 2016.READ MORE ABOUT OUR KPIS ON PAGES 18 AND 19
Long-term incentive plans vesting in 2017Performance conditionsThe performance conditions relating to the LTIS awards vesting in 2017 are set out below, together with an explanation of the achievement against these performance conditions.
Vesting criteria Performance conditions over three-year period
35% on EPS growth against RPI growth Full vesting for EPS growth exceeding RPI growth by 30%
Zero vesting if EPS growth does not exceed RPI growth by 9%
Vesting will increase on a straight-line basis between 25% and 100% between these points
35% on absolute aggregate EP Full vesting for aggregate EP of £3,400 million
Zero vesting if aggregate EP is below £2,600 million
Vesting will increase on a straight-line basis between 25% and 100% between these points
30% on non-financial KPI dashboard As disclosed below
Positive/negative multiplier on TSR performance against the FTSE 100 Index
0.667 multiplier for Index -7% per annum and 1.5 multiplier for Index +7% per annum, subject to a cap at the face value of the award. Where performance falls between stated points, vesting is calculated on a straight-line basis
Centrica plc Annual Report and Accounts 2016 95
Group Chief Executive recruitment award granted in 2015In accordance with the Company’s approved recruitment policy and as previously announced, the Committee agreed to provide compensation to Iain Conn for the forfeiture of existing unvested long-term incentive awards in the form of conditional Centrica shares.
Two awards of conditional shares were granted to Iain Conn in April 2015 (see below), the first with a face value equal to £925,000 vesting on the first anniversary of the award date and the second with a face value equal to £1,850,000 vesting on the second anniversary of the award date and released in April 2018.
First award – 282,634 shares vested in April 2016
Second award – 718,223 shares due to vest April 2017, subject to performance achievement
In accordance with the minimum shareholding guidelines, any shares released (following the sale of sufficient shares to cover the income tax and National Insurance contributions due on vesting) will be held until his shareholding is above the minimum guideline for Executives.
The vesting of both awards is subject to the achievement of personal strategic objectives. Three-quarters of each award will vest if the Committee is satisfied that Iain Conn’s performance, in relation to the objectives set, has at least matched the expectations of the Board. Each award may vest in full if the Committee considers his performance to have significantly exceeded expectations. If the Committee considers his performance to have been below expectations, the shares will not vest and the award will be forfeit.
In reviewing Iain Conn’s performance, the Committee stated that it would consider progress against the following objectives:
• strategy: to establish a sustainable growth strategy for Centrica that is attractive to and earns the support of all key stakeholders (expected by end Q3 2015);
• organisational structure: to consider organisational structure, processes, systems, culture and costs and effect any change deemed appropriate (expected by end Q4 2015);
• capability: to ensure that all the capabilities crucial to the success of the growth strategy have robust development plans that can be delivered at a pace commensurate with competitive demands (expected by end Q2 2016); and
• reputation: to build relationships with society necessary to achieve a demonstrable improvement in the external belief in Centrica as a consumer-centric company, UK national leader, influential in Europe and North America and a responsible market participant (expected by end Q4 2016).
These measures are in addition to but complement the objectives set in respect of the AIP.
Performance achievementAs previously explained, the Committee made a two-part award as part of the CEO recruitment process in order to secure the appointment of the Board’s strongly favoured candidate. The Committee considered carefully investor feedback on the use of subjective criteria in respect of these awards. After reflection the Committee believes that in this case they have served their purpose as intended. However, although Iain Conn’s performance since his appointment has surpassed expectations, we have determined the vesting level in deference to the external sensitivity to the making of such awards and total remuneration for the year.
Under Iain’s leadership, a new organisational model was developed for the whole Group, including the move to three new global growth business units and more centralised functions. He has led the recruitment of a number of key individuals and overall capability
was materially repositioned during the year to drive the new Group strategy. Improved succession plans have also been put in place.
Gaps in capability in the areas of Technology & Engineering, Group Marketing, and Ethics and Compliance were identified and these functions established. The need to establish a Group Information Systems (IS) function with digital capability was identified, resulting in centralisation of IS.
In the business unit that will now be known as the Centrica Consumer division British Gas has been completely reorganised, the largest restructuring since Centrica was incorporated in 1997, and significant efficiency, cultural and capability changes have been identified and delivered, all heavily influenced by Iain’s focus on satisfying the changing needs of the customer and founded on a new common operating model. A new leadership structure was established and new senior hires made. Connected Home was established as a global business unit and capability built for the technology pipeline and business development including the successful acquisition of Flowgem.
The business unit that will now be known as the Centrica Business division has also seen fundamental redesign, with the establishment of Distributed Energy & Power and reshaping of Energy Marketing & Trading. With direction from Iain, targeted strategic acquisitions were pursued and secured, including Panoramic Power, ENER-G Cogen and Neas Energy.
Iain established a new reputation framework during the year, which was reviewed by the Board. Quarterly standardised reputation measurement was put in place with the Reputation Institute, and the Group now has a clear Corporate Affairs Engagement Plan to drive reputation.
There has been a demonstrable improvement in the external belief in Centrica as a consumer-centric company as evidenced by higher net promoter scores, significant interest in partnering from high profile competitors and the ability to attract talent in customer-focused areas.
Engagement with the UK Government, regulators and opinion formers has been very proactive and Iain has personally participated through bilateral meetings, speeches, blogs on subjects such as energy policy, the EU, Brexit and industrial strategy, all of this is building Centrica’s reputation as a leading, serious, professional and forward-thinking company.
Under Iain’s guidance, we continue to develop an open and constructive relationship with our key regulators. The two-year CMA investigation into the UK energy market was handled with huge effort and expertise, underlining the Group’s role as a responsible market participant.
In the energy supply business, our shift in pricing stance and focus on improved customer service has resulted in a material reduction in complaints and NPS results at or exceeding plan. Iain has also driven an increased focus on our work with vulnerable customers and our apprenticeship and recruitment schemes.
Investors are supportive of the Group strategy. Communication regarding the equity placing was not as well managed as it should have been but feedback from investors suggests that they remain positive about the Group’s direction and progress.
In light of these achievements, the Committee is satisfied that Iain Conn has met the expectations of the Board as set out in the objectives and as a result 75% (the “on-target” level) of the second and final tranche of the recruitment award will vest. The shares will vest in April 2017 and will be released in April 2018. The estimated value of the shares due to vest, including dividend equivalents, has been included in the single figure table on page 92.
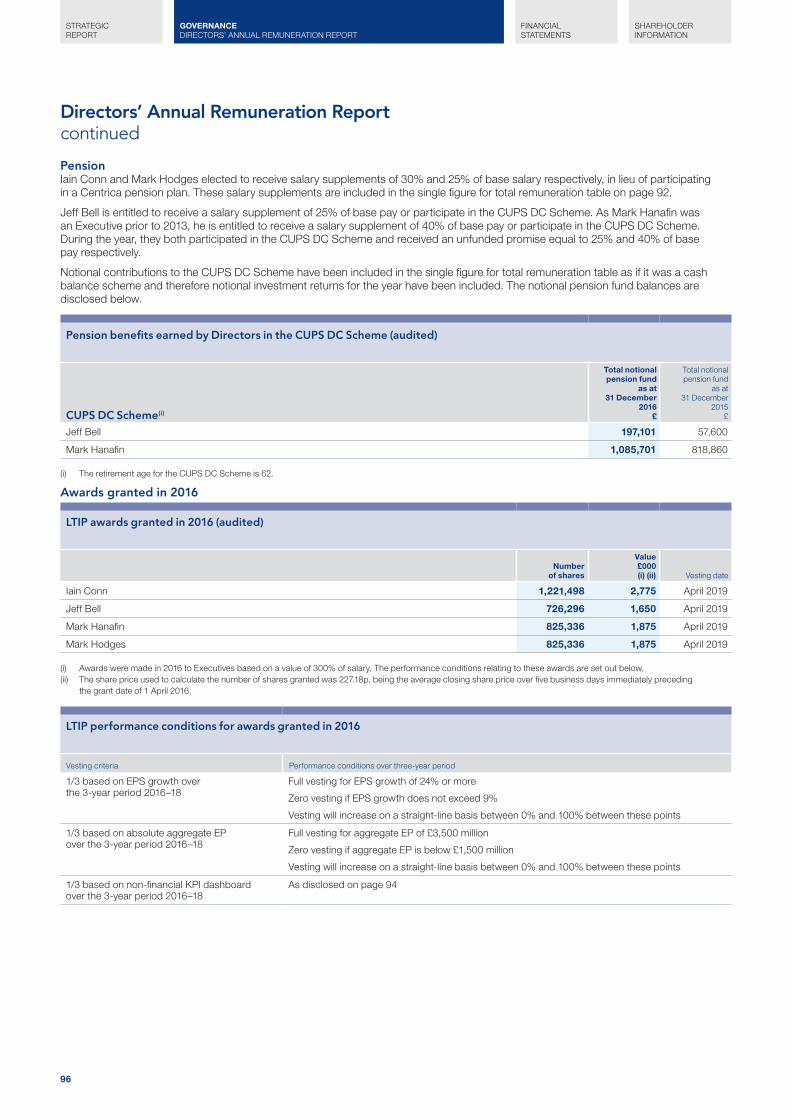
96
STRATEGIC REPORT
FINANCIAL STATEMENTS
SHAREHOLDER INFORMATION
GOVERNANCE DIRECTORS’ ANNUAL REMUNERATION REPORT
Directors’ Annual Remuneration Reportcontinued
PensionIain Conn and Mark Hodges elected to receive salary supplements of 30% and 25% of base salary respectively, in lieu of participating in a Centrica pension plan. These salary supplements are included in the single figure for total remuneration table on page 92.
Jeff Bell is entitled to receive a salary supplement of 25% of base pay or participate in the CUPS DC Scheme. As Mark Hanafin was an Executive prior to 2013, he is entitled to receive a salary supplement of 40% of base pay or participate in the CUPS DC Scheme. During the year, they both participated in the CUPS DC Scheme and received an unfunded promise equal to 25% and 40% of base pay respectively.
Notional contributions to the CUPS DC Scheme have been included in the single figure for total remuneration table as if it was a cash balance scheme and therefore notional investment returns for the year have been included. The notional pension fund balances are disclosed below.
Pension benefits earned by Directors in the CUPS DC Scheme (audited)
CUPS DC Scheme(i)
Total notionalpension fund
as at31 December
2016£
Total notionalpension fund
as at31 December
2015£
Jeff Bell 197,101 57,600
Mark Hanafin 1,085,701 818,860
(i) The retirement age for the CUPS DC Scheme is 62.
Awards granted in 2016
LTIP awards granted in 2016 (audited)
Numberof shares
Value£000(i) (ii) Vesting date
Iain Conn 1,221,498 2,775 April 2019
Jeff Bell 726,296 1,650 April 2019
Mark Hanafin 825,336 1,875 April 2019
Mark Hodges 825,336 1,875 April 2019
(i) Awards were made in 2016 to Executives based on a value of 300% of salary. The performance conditions relating to these awards are set out below.(ii) The share price used to calculate the number of shares granted was 227.18p, being the average closing share price over five business days immediately preceding
the grant date of 1 April 2016.
LTIP performance conditions for awards granted in 2016
Vesting criteria Performance conditions over three-year period
1/3 based on EPS growth over the 3-year period 2016–18
Full vesting for EPS growth of 24% or more
Zero vesting if EPS growth does not exceed 9%
Vesting will increase on a straight-line basis between 0% and 100% between these points
1/3 based on absolute aggregate EP over the 3-year period 2016–18
Full vesting for aggregate EP of £3,500 million
Zero vesting if aggregate EP is below £1,500 million
Vesting will increase on a straight-line basis between 0% and 100% between these points
1/3 based on non-financial KPI dashboard over the 3-year period 2016–18
As disclosed on page 94

Centrica plc Annual Report and Accounts 2016 97
LTIP timeline
ReleaseAward
Vesting of shares based on performance2016 2017 2018
Performance period
2016 2019 2020
Holding period
2021
Directors’ interests in shares (number of shares) (audited)The table below shows the interests in the ordinary shares of the Company of the Directors on the Board at the end of the year together with the minimum shareholding guideline for the Executives, which is 200% of salary, and the achievement against the guideline.
Also included to provide full disclosure (but not included as part of the minimum shareholder guideline calculation) are details of shares owned by the Executives that are subject to continued service, unvested share awards that are subject to company performance conditions and fully vested unexercised nil-cost share options.
Executives have a period of five years from appointment to the Board, or any material change in the minimum shareholding requirement, to meet the guideline.
Sharesowned
outright as at31 December
2015 (i)
Sharesowned
outright as at31 December
2016 (i)
Minimumshareholding
guideline(% of salary)
Achievementas at
31 December2016
(% of salary)
Shares owned(subject tocontinued
service) as at31 December
2016 (ii)
Unvested shareawards subject
to companyperformance
conditions(incl awards
granted in2016) as at
31 December2016
(iii)
Fully vestedunexercised
optionsas at
31 December2016
Executives
Iain Conn(iv) 140,812 663,219 200 168 – 2,882,733 –
Jeff Bell(v) 87,910 238,416 200 101 209,962 1,333,898 –
Mark Hanafin(vi) 363,863 518,550 200 194 99,992 2,293,203 215,261
Mark Hodges(vii) 320 125,817 200 47 374 1,462,506 –
Non-Executives
Rick Haythornthwaite 33,476 34,721 – – – – –
Margherita Della Valle 24,653 37,308 – – – – –
Joan Gillman – – – – – – –
Stephen Hester – 20,700 – – – – –
Lesley Knox 14,427 15,076 – – – – –
Carlos Pascual – – – – – – –
Steve Pusey 21,570 35,151 – – – – –
Scott Wheway – 10,187 – – – – –
(i) These shares are owned outright by the Director or a connected person and they are not subject to continued service or performance conditions. They include shares purchased in April 2016 with deferred Annual Incentive Plan (AIP) funds which have mandatory holding periods of 3 and 4 years.
(ii) Shares owned subject to continued service are DMSS deferred awards, SIP matching shares that have not yet been held for the 3 year holding period and for Jeff Bell, shares that were awarded in 2014 and 2015 under the Share Award Scheme and the On Track Incentive Plan, before he was appointed to the Board.
(iii) Shares and options that are subject to the achievement of long-term performance conditions are the awards granted under the LTIS in 2014, matching awards granted under the DMSS in 2014 and 2015, recruitment awards granted to Iain Conn, and include all awards granted in 2016 which are disclosed elsewhere in this Remuneration Report.
(iv) Shares owned outright include 100,000 shares purchased directly by Iain Conn during the year. Following the release and allotment of shares in April 2017, it is estimated that Iain Conn will hold shares with a value equal to 330% of salary.
(v) Following the release and allotment of shares in April 2017, it is estimated that Jeff Bell will hold shares with a value equal to 207% of salary.(vi) Following the release and allotment of shares in April 2017, it is estimated that Mark Hanafin will hold shares with a value equal to 281% of salary.(vii) Following the allotment of shares in April 2017, it is estimated that Mark Hodges will hold shares with a value equal to 134% of salary.
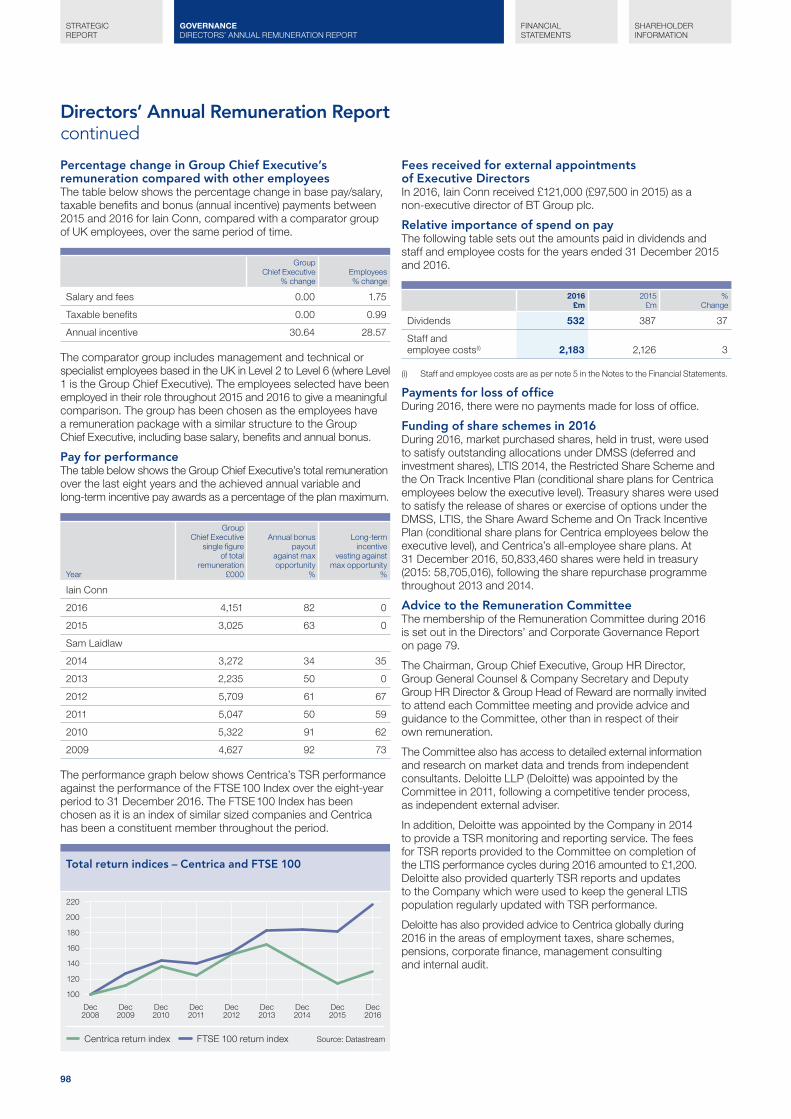
98
STRATEGIC REPORT
FINANCIAL STATEMENTS
SHAREHOLDER INFORMATION
GOVERNANCE DIRECTORS’ ANNUAL REMUNERATION REPORT
Directors’ Annual Remuneration Reportcontinued
Percentage change in Group Chief Executive’s remuneration compared with other employeesThe table below shows the percentage change in base pay/salary, taxable benefits and bonus (annual incentive) payments between 2015 and 2016 for Iain Conn, compared with a comparator group of UK employees, over the same period of time.
GroupChief Executive
% changeEmployees% change
Salary and fees 0.00 1.75
Taxable benefits 0.00 0.99
Annual incentive 30.64 28.57
The comparator group includes management and technical or specialist employees based in the UK in Level 2 to Level 6 (where Level 1 is the Group Chief Executive). The employees selected have been employed in their role throughout 2015 and 2016 to give a meaningful comparison. The group has been chosen as the employees have a remuneration package with a similar structure to the Group Chief Executive, including base salary, benefits and annual bonus.
Pay for performanceThe table below shows the Group Chief Executive’s total remuneration over the last eight years and the achieved annual variable and long-term incentive pay awards as a percentage of the plan maximum.
Year
GroupChief Executive
single figureof total
remuneration£000
Annual bonuspayout
against maxopportunity
%
Long-termincentive
vesting againstmax opportunity
%
Iain Conn
2016 4,151 82 0
2015 3,025 63 0
Sam Laidlaw
2014 3,272 34 35
2013 2,235 50 0
2012 5,709 61 67
2011 5,047 50 59
2010 5,322 91 62
2009 4,627 92 73
The performance graph below shows Centrica’s TSR performance against the performance of the FTSE 100 Index over the eight-year period to 31 December 2016. The FTSE 100 Index has been chosen as it is an index of similar sized companies and Centrica has been a constituent member throughout the period.
Total return indices – Centrica and FTSE 100
Dec2015
Dec2014
Dec2013
Dec2012
Dec2011
Dec2010
Dec2009
Dec2008
Dec2016
100
220
200
180
160
140
120
Source: DatastreamCentrica return index FTSE 100 return index
Fees received for external appointments of Executive DirectorsIn 2016, Iain Conn received £121,000 (£97,500 in 2015) as a non-executive director of BT Group plc.
Relative importance of spend on payThe following table sets out the amounts paid in dividends and staff and employee costs for the years ended 31 December 2015 and 2016.
2016£m
2015£m
%Change
Dividends 532 387 37
Staff and employee costs(i) 2,183 2,126 3
(i) Staff and employee costs are as per note 5 in the Notes to the Financial Statements.
Payments for loss of officeDuring 2016, there were no payments made for loss of office.
Funding of share schemes in 2016During 2016, market purchased shares, held in trust, were used to satisfy outstanding allocations under DMSS (deferred and investment shares), LTIS 2014, the Restricted Share Scheme and the On Track Incentive Plan (conditional share plans for Centrica employees below the executive level). Treasury shares were used to satisfy the release of shares or exercise of options under the DMSS, LTIS, the Share Award Scheme and On Track Incentive Plan (conditional share plans for Centrica employees below the executive level), and Centrica’s all-employee share plans. At 31 December 2016, 50,833,460 shares were held in treasury (2015: 58,705,016), following the share repurchase programme throughout 2013 and 2014.
Advice to the Remuneration CommitteeThe membership of the Remuneration Committee during 2016 is set out in the Directors’ and Corporate Governance Report on page 79.
The Chairman, Group Chief Executive, Group HR Director, Group General Counsel & Company Secretary and Deputy Group HR Director & Group Head of Reward are normally invited to attend each Committee meeting and provide advice and guidance to the Committee, other than in respect of their own remuneration.
The Committee also has access to detailed external information and research on market data and trends from independent consultants. Deloitte LLP (Deloitte) was appointed by the Committee in 2011, following a competitive tender process, as independent external adviser.
In addition, Deloitte was appointed by the Company in 2014 to provide a TSR monitoring and reporting service. The fees for TSR reports provided to the Committee on completion of the LTIS performance cycles during 2016 amounted to £1,200. Deloitte also provided quarterly TSR reports and updates to the Company which were used to keep the general LTIS population regularly updated with TSR performance.
Deloitte has also provided advice to Centrica globally during 2016 in the areas of employment taxes, share schemes, pensions, corporate finance, management consulting and internal audit.

Centrica plc Annual Report and Accounts 2016 99
During the year, Centrica announced its intention to tender for the audit contract in the second half of 2016. To avoid any independence restrictions, the Committee appointed New Bridge Street consultants, part of Aon Consulting Ltd (Aon), in March 2016 on an interim basis to provide training and insight as well as independent advice to the Committee until the outcome of the audit tender was announced.
The fees for the advice including preparation for and attendance at Committee meetings amounted to £16,200.
Aon has also provided advice and services to Centrica globally during 2016 in the areas of payroll and workforce administration as well as system and process implementation.
The Committee will consider the appointment of a permanent independent external adviser during the course of 2017.
The Committee takes into account the Remuneration Consultants Group’s Code of Conduct when dealing with its advisers. The Committee is satisfied that the advice it received during the year was objective and independent and that the provision of any other services by Deloitte and Aon in no way compromises their independence.
2016 VOTINGAt the AGM held on 18 April 2016, shareholders approved the Directors’ Annual Remuneration Report for the year ended 31 December 2015. Below are the results in respect of the resolution, which required a simple majority (of 50%) of the votes cast to be in favour in order for the resolution to be passed:
Directors’ Remuneration Report
Votes for % Votes against %
3,082,860,058 85.49 523,100,568 14.51
70,713,647 votes were withheld.
A full schedule in respect of shareholder voting on the above and all resolutions at the 2016 AGM is available at centrica.com.
IMPLEMENTATION IN THE NEXT FINANCIAL YEARNo changes to the Policy are anticipated in 2017. Awards will be granted in line with the limits set out in the Policy table. Performance measures and targets for the short and long-term incentive plans align with the Group’s strategy and therefore will remain unchanged.
Adjusted operating cash flow targets are considered commercially sensitive until the year end and will therefore be disclosed retrospectively in the Remuneration Report for the year in question.
Base salaries for Executives will be reviewed during the course of 2017 as part of the normal annual cycle taking account of performance, market conditions and pay in the Group as a whole. No changes to pensions or benefits are anticipated.
CHANGES SINCE 1 JANUARY 2017Share Incentive Plan (SIP)During the period from 1 January 2017 to 23 February 2017, Mark Hanafin and Mark Hodges both acquired 174 shares and Iain Conn acquired 88 shares through the SIP.
The Remuneration Report has been approved by the Board of Directors and signed on its behalf.
Grant DawsonGroup General Counsel & Company Secretary23 February 2017
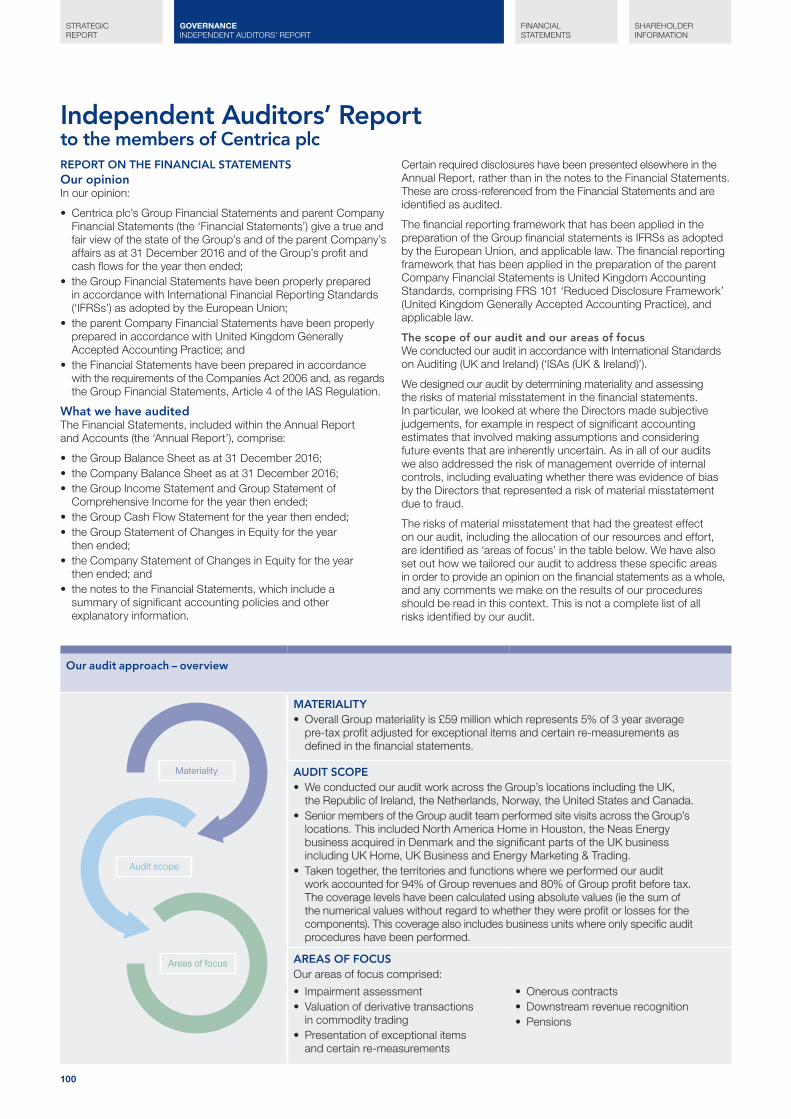
100
STRATEGIC REPORT
FINANCIAL STATEMENTS
SHAREHOLDER INFORMATION
GOVERNANCE INDEPENDENT AUDITORS’ REPORT
REPORT ON THE FINANCIAL STATEMENTSOur opinionIn our opinion:
• Centrica plc’s Group Financial Statements and parent Company Financial Statements (the ‘Financial Statements’) give a true and fair view of the state of the Group’s and of the parent Company’s affairs as at 31 December 2016 and of the Group’s profit and cash flows for the year then ended;
• the Group Financial Statements have been properly prepared in accordance with International Financial Reporting Standards (‘IFRSs’) as adopted by the European Union;
• the parent Company Financial Statements have been properly prepared in accordance with United Kingdom Generally Accepted Accounting Practice; and
• the Financial Statements have been prepared in accordance with the requirements of the Companies Act 2006 and, as regards the Group Financial Statements, Article 4 of the IAS Regulation.
What we have auditedThe Financial Statements, included within the Annual Report and Accounts (the ‘Annual Report’), comprise:
• the Group Balance Sheet as at 31 December 2016;• the Company Balance Sheet as at 31 December 2016;• the Group Income Statement and Group Statement of
Comprehensive Income for the year then ended;• the Group Cash Flow Statement for the year then ended;• the Group Statement of Changes in Equity for the year
then ended;• the Company Statement of Changes in Equity for the year
then ended; and• the notes to the Financial Statements, which include a
summary of significant accounting policies and other explanatory information.
Certain required disclosures have been presented elsewhere in the Annual Report, rather than in the notes to the Financial Statements. These are cross-referenced from the Financial Statements and are identified as audited.
The financial reporting framework that has been applied in the preparation of the Group financial statements is IFRSs as adopted by the European Union, and applicable law. The financial reporting framework that has been applied in the preparation of the parent Company Financial Statements is United Kingdom Accounting Standards, comprising FRS 101 ‘Reduced Disclosure Framework’ (United Kingdom Generally Accepted Accounting Practice), and applicable law.
The scope of our audit and our areas of focusWe conducted our audit in accordance with International Standards on Auditing (UK and Ireland) (‘ISAs (UK & Ireland)’).
We designed our audit by determining materiality and assessing the risks of material misstatement in the financial statements. In particular, we looked at where the Directors made subjective judgements, for example in respect of significant accounting estimates that involved making assumptions and considering future events that are inherently uncertain. As in all of our audits we also addressed the risk of management override of internal controls, including evaluating whether there was evidence of bias by the Directors that represented a risk of material misstatement due to fraud.
The risks of material misstatement that had the greatest effect on our audit, including the allocation of our resources and effort, are identified as ‘areas of focus’ in the table below. We have also set out how we tailored our audit to address these specific areas in order to provide an opinion on the financial statements as a whole, and any comments we make on the results of our procedures should be read in this context. This is not a complete list of all risks identified by our audit.
Our audit approach – overview
MATERIALITY• Overall Group materiality is £59 million which represents 5% of 3 year average
pre-tax profit adjusted for exceptional items and certain re-measurements as defined in the financial statements.
AUDIT SCOPE• We conducted our audit work across the Group’s locations including the UK,
the Republic of Ireland, the Netherlands, Norway, the United States and Canada.• Senior members of the Group audit team performed site visits across the Group’s
locations. This included North America Home in Houston, the Neas Energy business acquired in Denmark and the significant parts of the UK business including UK Home, UK Business and Energy Marketing & Trading.
• Taken together, the territories and functions where we performed our audit work accounted for 94% of Group revenues and 80% of Group profit before tax. The coverage levels have been calculated using absolute values (ie the sum of the numerical values without regard to whether they were profit or losses for the components). This coverage also includes business units where only specific audit procedures have been performed.
AREAS OF FOCUSOur areas of focus comprised:
• Impairment assessment• Valuation of derivative transactions
in commodity trading• Presentation of exceptional items
and certain re-measurements
• Onerous contracts• Downstream revenue recognition• Pensions
Areas of focus
Audit scope
Materiality
Independent Auditors’ Reportto the members of Centrica plc
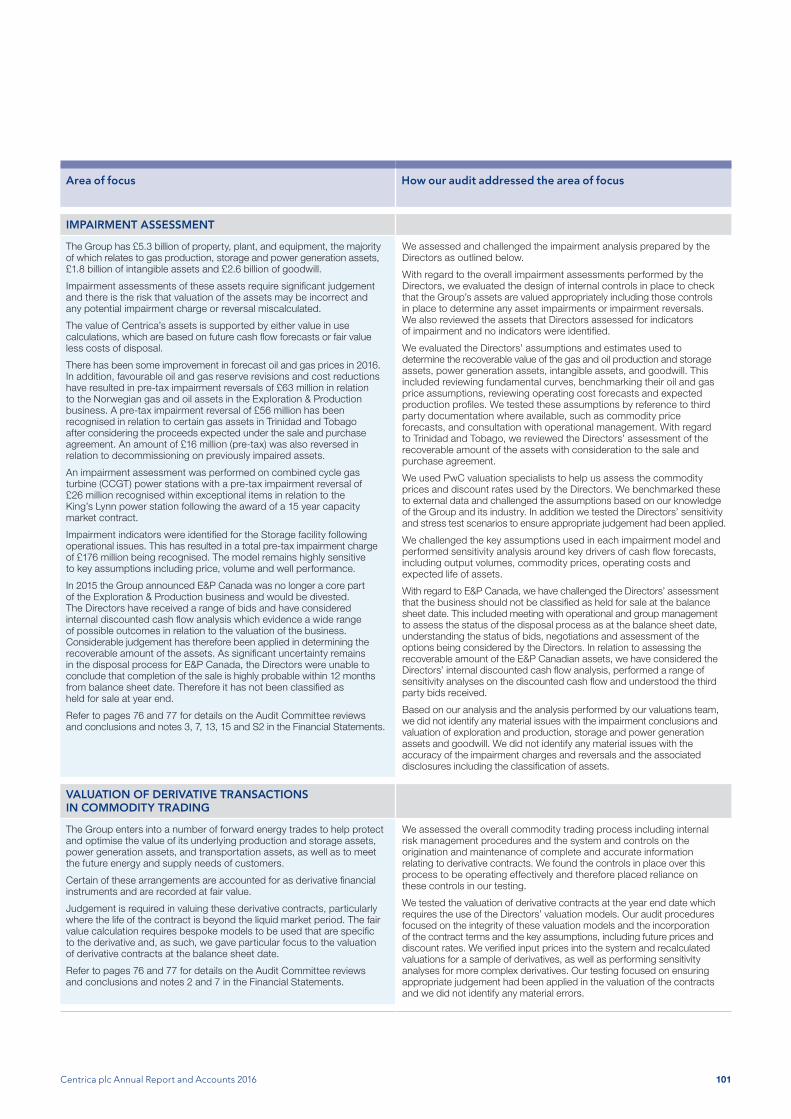
Centrica plc Annual Report and Accounts 2016 101
Area of focus How our audit addressed the area of focus
IMPAIRMENT ASSESSMENT
The Group has £5.3 billion of property, plant, and equipment, the majority of which relates to gas production, storage and power generation assets, £1.8 billion of intangible assets and £2.6 billion of goodwill.
Impairment assessments of these assets require significant judgement and there is the risk that valuation of the assets may be incorrect and any potential impairment charge or reversal miscalculated.
The value of Centrica’s assets is supported by either value in use calculations, which are based on future cash flow forecasts or fair value less costs of disposal.
There has been some improvement in forecast oil and gas prices in 2016. In addition, favourable oil and gas reserve revisions and cost reductions have resulted in pre-tax impairment reversals of £63 million in relation to the Norwegian gas and oil assets in the Exploration & Production business. A pre-tax impairment reversal of £56 million has been recognised in relation to certain gas assets in Trinidad and Tobago after considering the proceeds expected under the sale and purchase agreement. An amount of £16 million (pre-tax) was also reversed in relation to decommissioning on previously impaired assets.
An impairment assessment was performed on combined cycle gas turbine (CCGT) power stations with a pre-tax impairment reversal of £26 million recognised within exceptional items in relation to the King’s Lynn power station following the award of a 15 year capacity market contract.
Impairment indicators were identified for the Storage facility following operational issues. This has resulted in a total pre-tax impairment charge of £176 million being recognised. The model remains highly sensitive to key assumptions including price, volume and well performance.
In 2015 the Group announced E&P Canada was no longer a core part of the Exploration & Production business and would be divested. The Directors have received a range of bids and have considered internal discounted cash flow analysis which evidence a wide range of possible outcomes in relation to the valuation of the business. Considerable judgement has therefore been applied in determining the recoverable amount of the assets. As significant uncertainty remains in the disposal process for E&P Canada, the Directors were unable to conclude that completion of the sale is highly probable within 12 months from balance sheet date. Therefore it has not been classified as held for sale at year end.
Refer to pages 76 and 77 for details on the Audit Committee reviews and conclusions and notes 3, 7, 13, 15 and S2 in the Financial Statements.
We assessed and challenged the impairment analysis prepared by the Directors as outlined below.
With regard to the overall impairment assessments performed by the Directors, we evaluated the design of internal controls in place to check that the Group’s assets are valued appropriately including those controls in place to determine any asset impairments or impairment reversals. We also reviewed the assets that Directors assessed for indicators of impairment and no indicators were identified.
We evaluated the Directors’ assumptions and estimates used to determine the recoverable value of the gas and oil production and storage assets, power generation assets, intangible assets, and goodwill. This included reviewing fundamental curves, benchmarking their oil and gas price assumptions, reviewing operating cost forecasts and expected production profiles. We tested these assumptions by reference to third party documentation where available, such as commodity price forecasts, and consultation with operational management. With regard to Trinidad and Tobago, we reviewed the Directors’ assessment of the recoverable amount of the assets with consideration to the sale and purchase agreement.
We used PwC valuation specialists to help us assess the commodity prices and discount rates used by the Directors. We benchmarked these to external data and challenged the assumptions based on our knowledge of the Group and its industry. In addition we tested the Directors’ sensitivity and stress test scenarios to ensure appropriate judgement had been applied.
We challenged the key assumptions used in each impairment model and performed sensitivity analysis around key drivers of cash flow forecasts, including output volumes, commodity prices, operating costs and expected life of assets.
With regard to E&P Canada, we have challenged the Directors’ assessment that the business should not be classified as held for sale at the balance sheet date. This included meeting with operational and group management to assess the status of the disposal process as at the balance sheet date, understanding the status of bids, negotiations and assessment of the options being considered by the Directors. In relation to assessing the recoverable amount of the E&P Canadian assets, we have considered the Directors’ internal discounted cash flow analysis, performed a range of sensitivity analyses on the discounted cash flow and understood the third party bids received.
Based on our analysis and the analysis performed by our valuations team, we did not identify any material issues with the impairment conclusions and valuation of exploration and production, storage and power generation assets and goodwill. We did not identify any material issues with the accuracy of the impairment charges and reversals and the associated disclosures including the classification of assets.
VALUATION OF DERIVATIVE TRANSACTIONS IN COMMODITY TRADING
The Group enters into a number of forward energy trades to help protect and optimise the value of its underlying production and storage assets, power generation assets, and transportation assets, as well as to meet the future energy and supply needs of customers.
Certain of these arrangements are accounted for as derivative financial instruments and are recorded at fair value.
Judgement is required in valuing these derivative contracts, particularly where the life of the contract is beyond the liquid market period. The fair value calculation requires bespoke models to be used that are specific to the derivative and, as such, we gave particular focus to the valuation of derivative contracts at the balance sheet date.
Refer to pages 76 and 77 for details on the Audit Committee reviews and conclusions and notes 2 and 7 in the Financial Statements.
We assessed the overall commodity trading process including internal risk management procedures and the system and controls on the origination and maintenance of complete and accurate information relating to derivative contracts. We found the controls in place over this process to be operating effectively and therefore placed reliance on these controls in our testing.
We tested the valuation of derivative contracts at the year end date which requires the use of the Directors’ valuation models. Our audit procedures focused on the integrity of these valuation models and the incorporation of the contract terms and the key assumptions, including future prices and discount rates. We verified input prices into the system and recalculated valuations for a sample of derivatives, as well as performing sensitivity analyses for more complex derivatives. Our testing focused on ensuring appropriate judgement had been applied in the valuation of the contracts and we did not identify any material errors.
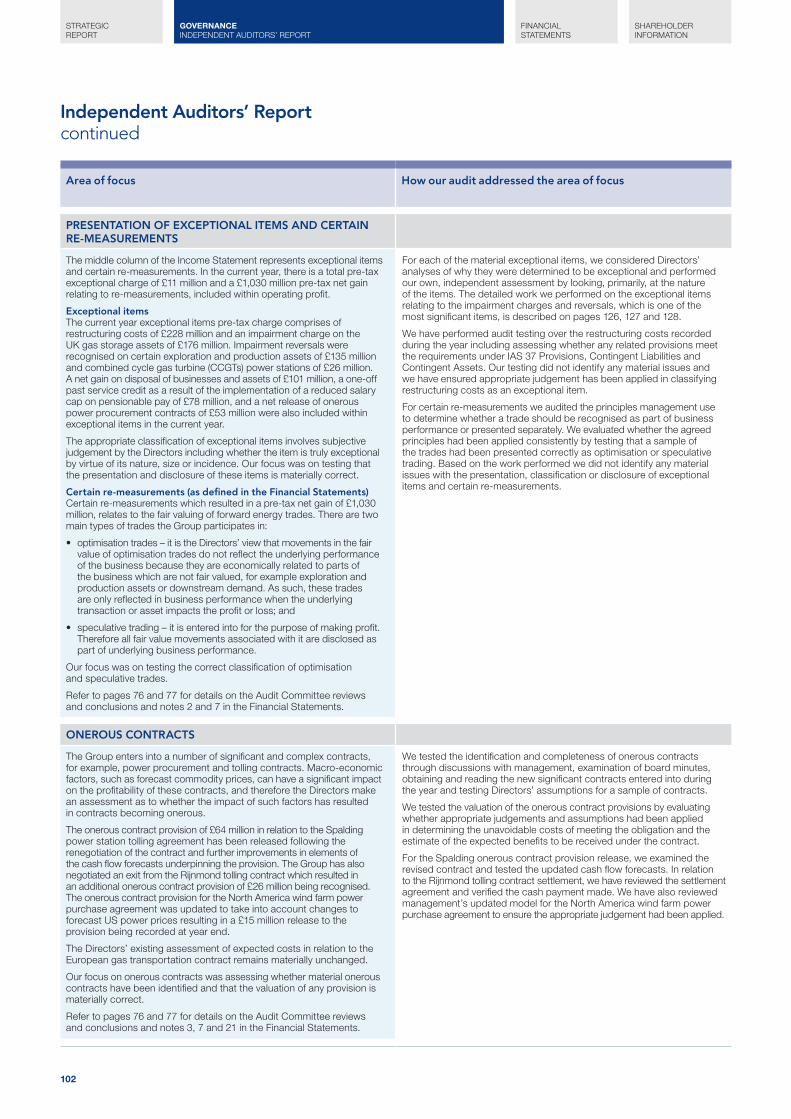
102
STRATEGIC REPORT
FINANCIAL STATEMENTS
SHAREHOLDER INFORMATION
GOVERNANCE INDEPENDENT AUDITORS’ REPORT
Independent Auditors’ Reportcontinued
Area of focus How our audit addressed the area of focus
PRESENTATION OF EXCEPTIONAL ITEMS AND CERTAIN RE-MEASUREMENTS
The middle column of the Income Statement represents exceptional items and certain re-measurements. In the current year, there is a total pre-tax exceptional charge of £11 million and a £1,030 million pre-tax net gain relating to re-measurements, included within operating profit.
Exceptional itemsThe current year exceptional items pre-tax charge comprises of restructuring costs of £228 million and an impairment charge on the UK gas storage assets of £176 million. Impairment reversals were recognised on certain exploration and production assets of £135 million and combined cycle gas turbine (CCGTs) power stations of £26 million. A net gain on disposal of businesses and assets of £101 million, a one-off past service credit as a result of the implementation of a reduced salary cap on pensionable pay of £78 million, and a net release of onerous power procurement contracts of £53 million were also included within exceptional items in the current year.
The appropriate classification of exceptional items involves subjective judgement by the Directors including whether the item is truly exceptional by virtue of its nature, size or incidence. Our focus was on testing that the presentation and disclosure of these items is materially correct.
Certain re-measurements (as defined in the Financial Statements)Certain re-measurements which resulted in a pre-tax net gain of £1,030 million, relates to the fair valuing of forward energy trades. There are two main types of trades the Group participates in:
• optimisation trades – it is the Directors’ view that movements in the fair value of optimisation trades do not reflect the underlying performance of the business because they are economically related to parts of the business which are not fair valued, for example exploration and production assets or downstream demand. As such, these trades are only reflected in business performance when the underlying transaction or asset impacts the profit or loss; and
• speculative trading – it is entered into for the purpose of making profit. Therefore all fair value movements associated with it are disclosed as part of underlying business performance.
Our focus was on testing the correct classification of optimisation and speculative trades.
Refer to pages 76 and 77 for details on the Audit Committee reviews and conclusions and notes 2 and 7 in the Financial Statements.
For each of the material exceptional items, we considered Directors’ analyses of why they were determined to be exceptional and performed our own, independent assessment by looking, primarily, at the nature of the items. The detailed work we performed on the exceptional items relating to the impairment charges and reversals, which is one of the most significant items, is described on pages 126, 127 and 128.
We have performed audit testing over the restructuring costs recorded during the year including assessing whether any related provisions meet the requirements under IAS 37 Provisions, Contingent Liabilities and Contingent Assets. Our testing did not identify any material issues and we have ensured appropriate judgement has been applied in classifying restructuring costs as an exceptional item.
For certain re-measurements we audited the principles management use to determine whether a trade should be recognised as part of business performance or presented separately. We evaluated whether the agreed principles had been applied consistently by testing that a sample of the trades had been presented correctly as optimisation or speculative trading. Based on the work performed we did not identify any material issues with the presentation, classification or disclosure of exceptional items and certain re-measurements.
ONEROUS CONTRACTS
The Group enters into a number of significant and complex contracts, for example, power procurement and tolling contracts. Macro-economic factors, such as forecast commodity prices, can have a significant impact on the profitability of these contracts, and therefore the Directors make an assessment as to whether the impact of such factors has resulted in contracts becoming onerous.
The onerous contract provision of £64 million in relation to the Spalding power station tolling agreement has been released following the renegotiation of the contract and further improvements in elements of the cash flow forecasts underpinning the provision. The Group has also negotiated an exit from the Rijnmond tolling contract which resulted in an additional onerous contract provision of £26 million being recognised. The onerous contract provision for the North America wind farm power purchase agreement was updated to take into account changes to forecast US power prices resulting in a £15 million release to the provision being recorded at year end.
The Directors’ existing assessment of expected costs in relation to the European gas transportation contract remains materially unchanged.
Our focus on onerous contracts was assessing whether material onerous contracts have been identified and that the valuation of any provision is materially correct.
Refer to pages 76 and 77 for details on the Audit Committee reviews and conclusions and notes 3, 7 and 21 in the Financial Statements.
We tested the identification and completeness of onerous contracts through discussions with management, examination of board minutes, obtaining and reading the new significant contracts entered into during the year and testing Directors’ assumptions for a sample of contracts.
We tested the valuation of the onerous contract provisions by evaluating whether appropriate judgements and assumptions had been applied in determining the unavoidable costs of meeting the obligation and the estimate of the expected benefits to be received under the contract.
For the Spalding onerous contract provision release, we examined the revised contract and tested the updated cash flow forecasts. In relation to the Rijnmond tolling contract settlement, we have reviewed the settlement agreement and verified the cash payment made. We have also reviewed management’s updated model for the North America wind farm power purchase agreement to ensure the appropriate judgement had been applied.
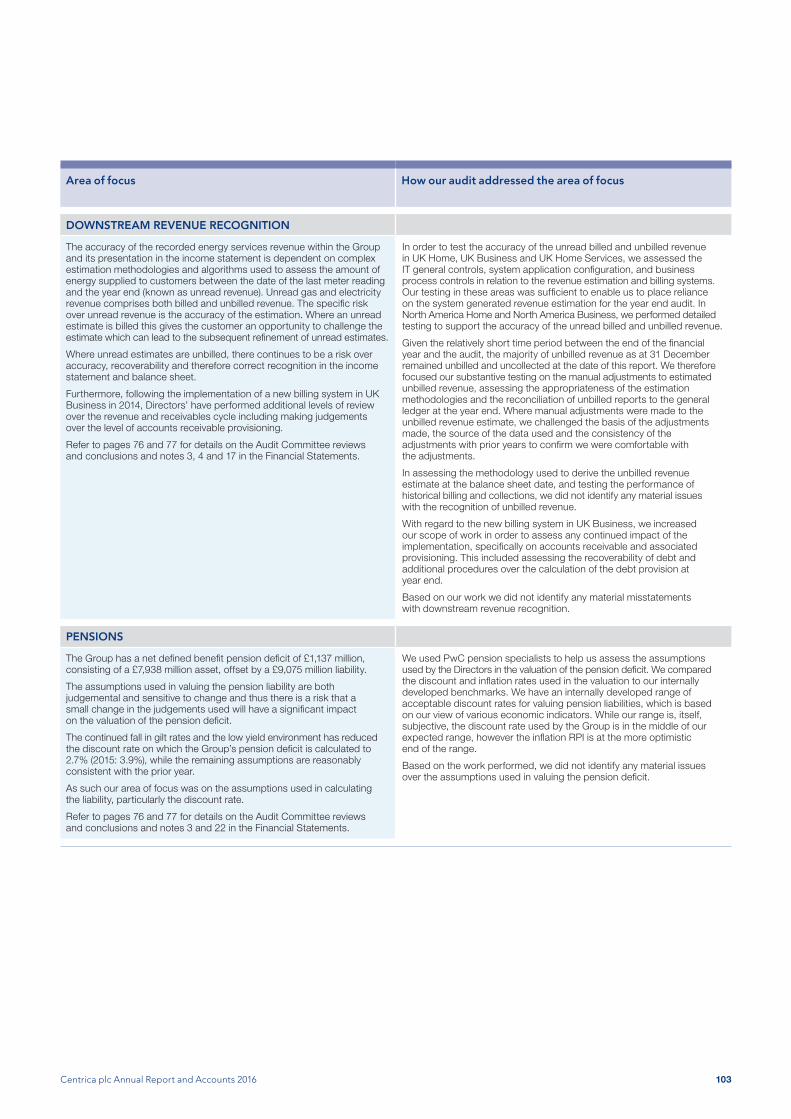
Centrica plc Annual Report and Accounts 2016 103
Area of focus How our audit addressed the area of focus
DOWNSTREAM REVENUE RECOGNITION
The accuracy of the recorded energy services revenue within the Group and its presentation in the income statement is dependent on complex estimation methodologies and algorithms used to assess the amount of energy supplied to customers between the date of the last meter reading and the year end (known as unread revenue). Unread gas and electricity revenue comprises both billed and unbilled revenue. The specific risk over unread revenue is the accuracy of the estimation. Where an unread estimate is billed this gives the customer an opportunity to challenge the estimate which can lead to the subsequent refinement of unread estimates.
Where unread estimates are unbilled, there continues to be a risk over accuracy, recoverability and therefore correct recognition in the income statement and balance sheet.
Furthermore, following the implementation of a new billing system in UK Business in 2014, Directors’ have performed additional levels of review over the revenue and receivables cycle including making judgements over the level of accounts receivable provisioning.
Refer to pages 76 and 77 for details on the Audit Committee reviews and conclusions and notes 3, 4 and 17 in the Financial Statements.
In order to test the accuracy of the unread billed and unbilled revenue in UK Home, UK Business and UK Home Services, we assessed the IT general controls, system application configuration, and business process controls in relation to the revenue estimation and billing systems. Our testing in these areas was sufficient to enable us to place reliance on the system generated revenue estimation for the year end audit. In North America Home and North America Business, we performed detailed testing to support the accuracy of the unread billed and unbilled revenue.
Given the relatively short time period between the end of the financial year and the audit, the majority of unbilled revenue as at 31 December remained unbilled and uncollected at the date of this report. We therefore focused our substantive testing on the manual adjustments to estimated unbilled revenue, assessing the appropriateness of the estimation methodologies and the reconciliation of unbilled reports to the general ledger at the year end. Where manual adjustments were made to the unbilled revenue estimate, we challenged the basis of the adjustments made, the source of the data used and the consistency of the adjustments with prior years to confirm we were comfortable with the adjustments.
In assessing the methodology used to derive the unbilled revenue estimate at the balance sheet date, and testing the performance of historical billing and collections, we did not identify any material issues with the recognition of unbilled revenue.
With regard to the new billing system in UK Business, we increased our scope of work in order to assess any continued impact of the implementation, specifically on accounts receivable and associated provisioning. This included assessing the recoverability of debt and additional procedures over the calculation of the debt provision at year end.
Based on our work we did not identify any material misstatements with downstream revenue recognition.
PENSIONS
The Group has a net defined benefit pension deficit of £1,137 million, consisting of a £7,938 million asset, offset by a £9,075 million liability.
The assumptions used in valuing the pension liability are both judgemental and sensitive to change and thus there is a risk that a small change in the judgements used will have a significant impact on the valuation of the pension deficit.
The continued fall in gilt rates and the low yield environment has reduced the discount rate on which the Group’s pension deficit is calculated to 2.7% (2015: 3.9%), while the remaining assumptions are reasonably consistent with the prior year.
As such our area of focus was on the assumptions used in calculating the liability, particularly the discount rate.
Refer to pages 76 and 77 for details on the Audit Committee reviews and conclusions and notes 3 and 22 in the Financial Statements.
We used PwC pension specialists to help us assess the assumptions used by the Directors in the valuation of the pension deficit. We compared the discount and inflation rates used in the valuation to our internally developed benchmarks. We have an internally developed range of acceptable discount rates for valuing pension liabilities, which is based on our view of various economic indicators. While our range is, itself, subjective, the discount rate used by the Group is in the middle of our expected range, however the inflation RPI is at the more optimistic end of the range.
Based on the work performed, we did not identify any material issues over the assumptions used in valuing the pension deficit.

104
STRATEGIC REPORT
FINANCIAL STATEMENTS
SHAREHOLDER INFORMATION
GOVERNANCE INDEPENDENT AUDITORS’ REPORT
Independent Auditors’ Reportcontinued
How we tailored the audit scopeWe tailored the scope of our audit to ensure that we performed enough work to be able to give an opinion on the financial statements as a whole, taking into account the geographic structure of the Group, the accounting processes and controls, and the industry in which the Group operates.
The Group is made up of the following business lines: UK Home, UK Business, Ireland, North America Home, North America Business, Connected Home, Distributed Energy & Power, Energy Marketing & Trading, Exploration & Production, Central Power Generation and Centrica Storage. The Group Financial Statements are a consolidation of these business lines and comprise the Group’s operating businesses and centralised functions.
Accordingly, based on size and risk characteristics, we performed a full scope audit of the financial information for the following business units: UK Home, UK Business, North America Home, North America Business, Exploration & Production, Energy Marketing & Trading and elements of Central Power Generation.
Where the work was performed by component auditors, we determined the level of involvement we needed to have in the audit work at those business units to conclude whether sufficient appropriate audit evidence had been obtained as a basis for our opinion on the Group Financial Statements as a whole.
Across the Group, the Group team involvement comprised of site visits, conference calls, review of component auditor work papers, attendance at component audit clearance meetings and other forms of communication as considered necessary. Members of the Group team are also directly involved in the component audits of UK Home, UK Business, Energy Marketing & Trading and Central Power Generation. In addition, senior members of the Group audit team performed a number of site visits throughout the year including to North America Home in Houston and the Neas Energy business in Denmark.
Taken together, the business units where we performed our audit work accounted for 94% of Group revenues and 80% of Group profit before tax. The coverage levels have been calculated using absolute values (ie the sum of the numerical values without regard to whether they were profit or losses for the components). This coverage also includes business units where only specific audit procedures have been performed.
MaterialityThe scope of our audit was influenced by our application of materiality. We set certain quantitative thresholds for materiality. These, together with qualitative considerations, helped us to determine the scope of our audit and the nature, timing and extent of our audit procedures on the individual financial statement line items and disclosures and in evaluating the effect of misstatements, both individually and on the Financial Statements as a whole.
Based on our professional judgement, we determined materiality for the Financial Statements as a whole as follows:
OVERALL GROUP MATERIALITY
£59 million (2015: £78 million).
HOW WE DETERMINED IT
5% of 3 year average pre-tax profit adjusted for exceptional items and certain re-measurements (rounded down) as defined in the Financial Statements.
RATIONALE FOR BENCHMARK APPLIED
The Group materiality benchmark has been calculated as 5% of profit from continuing operations, adjusted to exclude the effect of volatility on underlying performance from disclosed exceptional items and certain re-measurements. These items have impacted the income statement to a quantitatively material degree and are not considered to form part of the underlying results of the Group. To eliminate further volatility in trading performance, a 3 year average on the same benchmark was used in calculating the overall materiality.
COMPONENT MATERIALITY
For each component in our audit scope, we allocated a materiality that is less than our overall Group materiality. The range of materiality allocated across components was between £10 million and £50 million. Certain components were audited to a local statutory audit materiality that was also less than our overall Group materiality.
We agreed with the Audit Committee that we would report to them misstatements identified during our audit above £5 million (2015: £10 million) as well as misstatements below that amount that, in our view, warranted reporting for qualitative reasons.
Going concernUnder the Listing Rules we are required to review the Directors’ Statement, set out on page 82, in relation to going concern. We have nothing to report having performed our review.
Under ISAs (UK & Ireland) we are required to report to you if we have anything material to add or to draw attention to in relation to the Directors’ Statement about whether they considered it appropriate to adopt the going concern basis in preparing the Financial Statements. We have nothing material to add or to draw attention to.
As noted in the Directors’ Statement, the Directors have concluded that it is appropriate to adopt the going concern basis in preparing the Financial Statements. The going concern basis presumes that the Group and parent company have adequate resources to remain in operation, and that the Directors intend them to do so, for at least one year from the date the Financial Statements were signed. As part of our audit we have concluded that the Directors’ use of the going concern basis is appropriate. However, because not all future events or conditions can be predicted, these statements are not a guarantee as to the Group’s and parent Company’s ability to continue as a going concern.
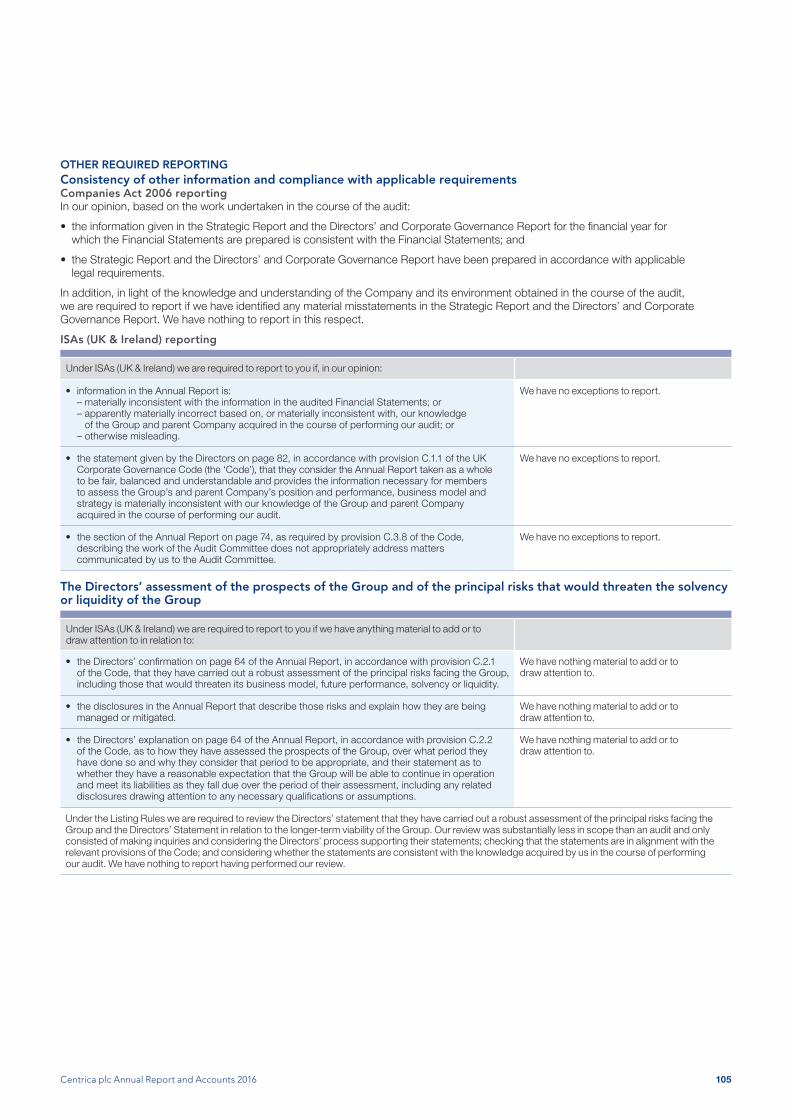
Centrica plc Annual Report and Accounts 2016 105
OTHER REQUIRED REPORTINGConsistency of other information and compliance with applicable requirementsCompanies Act 2006 reportingIn our opinion, based on the work undertaken in the course of the audit:
• the information given in the Strategic Report and the Directors’ and Corporate Governance Report for the financial year for which the Financial Statements are prepared is consistent with the Financial Statements; and
• the Strategic Report and the Directors’ and Corporate Governance Report have been prepared in accordance with applicable legal requirements.
In addition, in light of the knowledge and understanding of the Company and its environment obtained in the course of the audit, we are required to report if we have identified any material misstatements in the Strategic Report and the Directors’ and Corporate Governance Report. We have nothing to report in this respect.
ISAs (UK & Ireland) reporting
Under ISAs (UK & Ireland) we are required to report to you if, in our opinion:
• information in the Annual Report is: – materially inconsistent with the information in the audited Financial Statements; or– apparently materially incorrect based on, or materially inconsistent with, our knowledge
of the Group and parent Company acquired in the course of performing our audit; or– otherwise misleading.
We have no exceptions to report.
• the statement given by the Directors on page 82, in accordance with provision C.1.1 of the UK Corporate Governance Code (the ‘Code’), that they consider the Annual Report taken as a whole to be fair, balanced and understandable and provides the information necessary for members to assess the Group’s and parent Company’s position and performance, business model and strategy is materially inconsistent with our knowledge of the Group and parent Company acquired in the course of performing our audit.
We have no exceptions to report.
• the section of the Annual Report on page 74, as required by provision C.3.8 of the Code, describing the work of the Audit Committee does not appropriately address matters communicated by us to the Audit Committee.
We have no exceptions to report.
The Directors’ assessment of the prospects of the Group and of the principal risks that would threaten the solvency or liquidity of the Group
Under ISAs (UK & Ireland) we are required to report to you if we have anything material to add or to draw attention to in relation to:
• the Directors’ confirmation on page 64 of the Annual Report, in accordance with provision C.2.1 of the Code, that they have carried out a robust assessment of the principal risks facing the Group, including those that would threaten its business model, future performance, solvency or liquidity.
We have nothing material to add or to draw attention to.
• the disclosures in the Annual Report that describe those risks and explain how they are being managed or mitigated.
We have nothing material to add or to draw attention to.
• the Directors’ explanation on page 64 of the Annual Report, in accordance with provision C.2.2 of the Code, as to how they have assessed the prospects of the Group, over what period they have done so and why they consider that period to be appropriate, and their statement as to whether they have a reasonable expectation that the Group will be able to continue in operation and meet its liabilities as they fall due over the period of their assessment, including any related disclosures drawing attention to any necessary qualifications or assumptions.
We have nothing material to add or to draw attention to.
Under the Listing Rules we are required to review the Directors’ statement that they have carried out a robust assessment of the principal risks facing the Group and the Directors’ Statement in relation to the longer-term viability of the Group. Our review was substantially less in scope than an audit and only consisted of making inquiries and considering the Directors’ process supporting their statements; checking that the statements are in alignment with the relevant provisions of the Code; and considering whether the statements are consistent with the knowledge acquired by us in the course of performing our audit. We have nothing to report having performed our review.
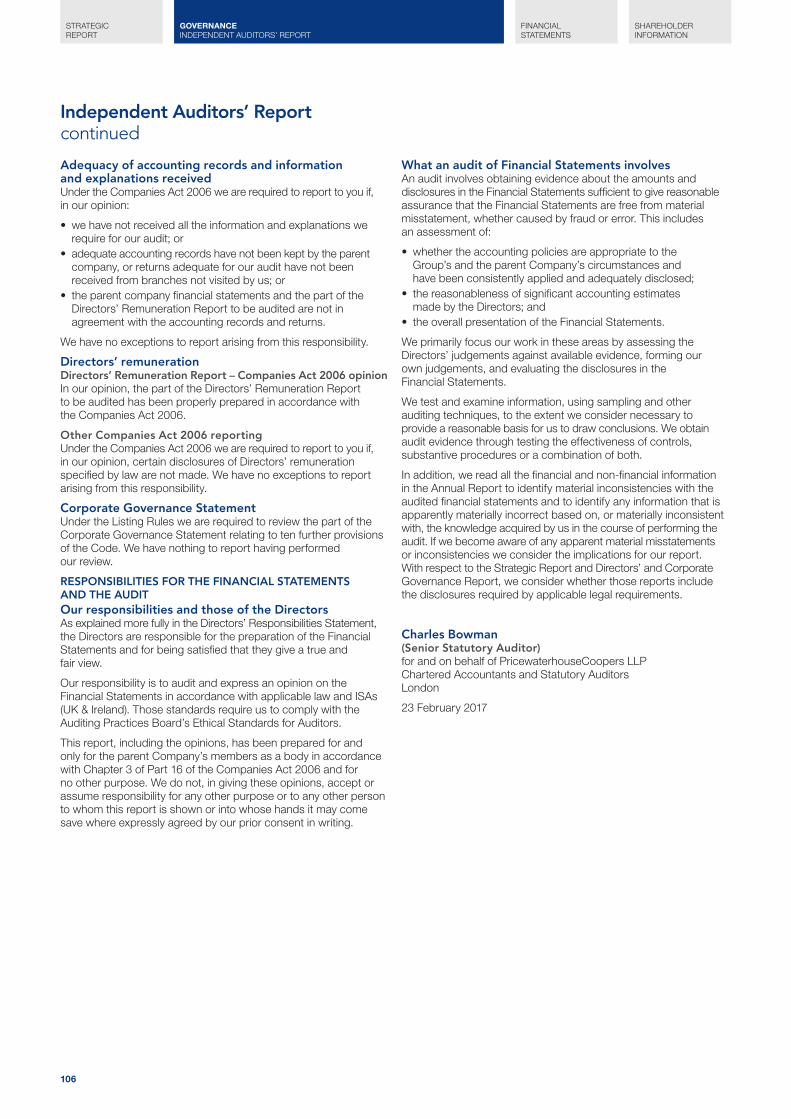
106
STRATEGIC REPORT
FINANCIAL STATEMENTS
SHAREHOLDER INFORMATION
GOVERNANCE INDEPENDENT AUDITORS’ REPORT
Independent Auditors’ Reportcontinued
Adequacy of accounting records and information and explanations receivedUnder the Companies Act 2006 we are required to report to you if, in our opinion:
• we have not received all the information and explanations we require for our audit; or
• adequate accounting records have not been kept by the parent company, or returns adequate for our audit have not been received from branches not visited by us; or
• the parent company financial statements and the part of the Directors’ Remuneration Report to be audited are not in agreement with the accounting records and returns.
We have no exceptions to report arising from this responsibility.
Directors’ remunerationDirectors’ Remuneration Report – Companies Act 2006 opinionIn our opinion, the part of the Directors’ Remuneration Report to be audited has been properly prepared in accordance with the Companies Act 2006.
Other Companies Act 2006 reportingUnder the Companies Act 2006 we are required to report to you if, in our opinion, certain disclosures of Directors’ remuneration specified by law are not made. We have no exceptions to report arising from this responsibility.
Corporate Governance StatementUnder the Listing Rules we are required to review the part of the Corporate Governance Statement relating to ten further provisions of the Code. We have nothing to report having performed our review.
RESPONSIBILITIES FOR THE FINANCIAL STATEMENTS AND THE AUDITOur responsibilities and those of the DirectorsAs explained more fully in the Directors’ Responsibilities Statement, the Directors are responsible for the preparation of the Financial Statements and for being satisfied that they give a true and fair view.
Our responsibility is to audit and express an opinion on the Financial Statements in accordance with applicable law and ISAs (UK & Ireland). Those standards require us to comply with the Auditing Practices Board’s Ethical Standards for Auditors.
This report, including the opinions, has been prepared for and only for the parent Company’s members as a body in accordance with Chapter 3 of Part 16 of the Companies Act 2006 and for no other purpose. We do not, in giving these opinions, accept or assume responsibility for any other purpose or to any other person to whom this report is shown or into whose hands it may come save where expressly agreed by our prior consent in writing.
What an audit of Financial Statements involvesAn audit involves obtaining evidence about the amounts and disclosures in the Financial Statements sufficient to give reasonable assurance that the Financial Statements are free from material misstatement, whether caused by fraud or error. This includes an assessment of:
• whether the accounting policies are appropriate to the Group’s and the parent Company’s circumstances and have been consistently applied and adequately disclosed;
• the reasonableness of significant accounting estimates made by the Directors; and
• the overall presentation of the Financial Statements.
We primarily focus our work in these areas by assessing the Directors’ judgements against available evidence, forming our own judgements, and evaluating the disclosures in the Financial Statements.
We test and examine information, using sampling and other auditing techniques, to the extent we consider necessary to provide a reasonable basis for us to draw conclusions. We obtain audit evidence through testing the effectiveness of controls, substantive procedures or a combination of both.
In addition, we read all the financial and non-financial information in the Annual Report to identify material inconsistencies with the audited financial statements and to identify any information that is apparently materially incorrect based on, or materially inconsistent with, the knowledge acquired by us in the course of performing the audit. If we become aware of any apparent material misstatements or inconsistencies we consider the implications for our report. With respect to the Strategic Report and Directors’ and Corporate Governance Report, we consider whether those reports include the disclosures required by applicable legal requirements.
Charles Bowman(Senior Statutory Auditor)for and on behalf of PricewaterhouseCoopers LLP Chartered Accountants and Statutory Auditors London
23 February 2017
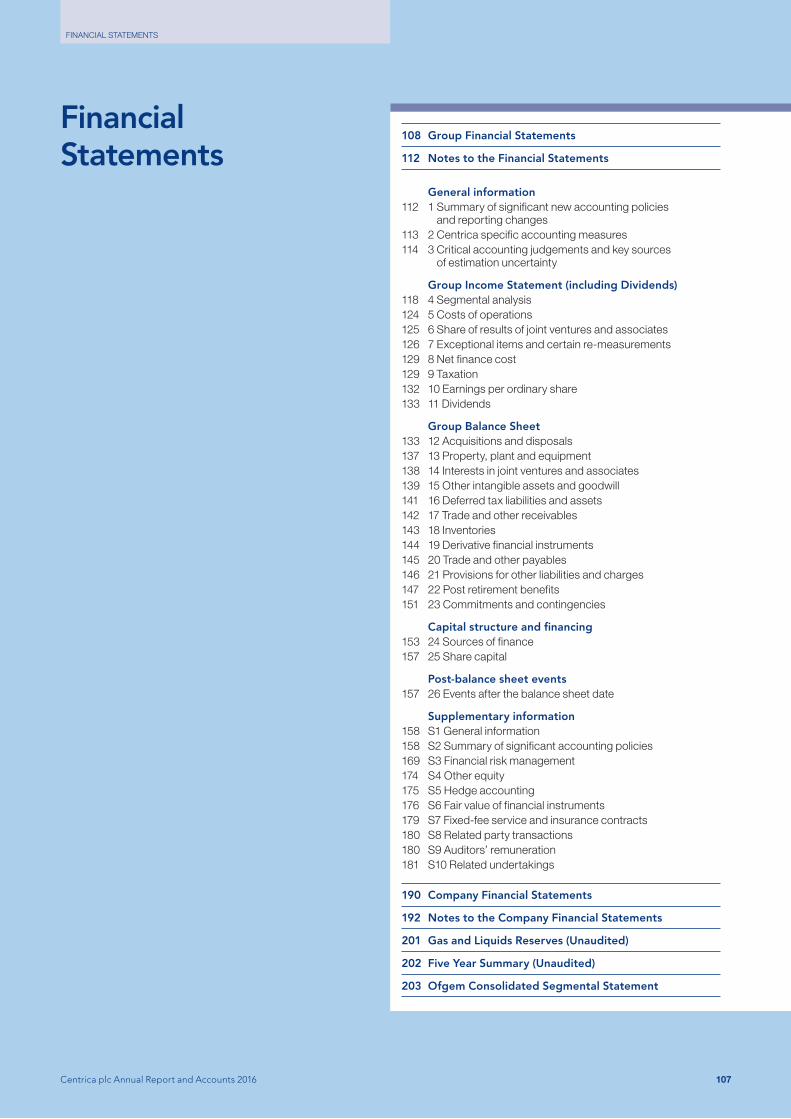
Centrica plc Annual Report and Accounts 2016 107
FINANCIAL STATEMENTS
108 Group Financial Statements
112 Notes to the Financial Statements
General information112 1 Summary of significant new accounting policies
and reporting changes113 2 Centrica specific accounting measures114 3 Critical accounting judgements and key sources
of estimation uncertainty
Group Income Statement (including Dividends)118 4 Segmental analysis124 5 Costs of operations125 6 Share of results of joint ventures and associates126 7 Exceptional items and certain re-measurements129 8 Net finance cost129 9 Taxation132 10 Earnings per ordinary share133 11 Dividends
Group Balance Sheet133 12 Acquisitions and disposals137 13 Property, plant and equipment138 14 Interests in joint ventures and associates139 15 Other intangible assets and goodwill141 16 Deferred tax liabilities and assets142 17 Trade and other receivables143 18 Inventories144 19 Derivative financial instruments145 20 Trade and other payables146 21 Provisions for other liabilities and charges147 22 Post retirement benefits151 23 Commitments and contingencies
Capital structure and financing153 24 Sources of finance157 25 Share capital
Post-balance sheet events157 26 Events after the balance sheet date
Supplementary information158 S1 General information158 S2 Summary of significant accounting policies169 S3 Financial risk management174 S4 Other equity175 S5 Hedge accounting176 S6 Fair value of financial instruments179 S7 Fixed-fee service and insurance contracts180 S8 Related party transactions180 S9 Auditors’ remuneration181 S10 Related undertakings
190 Company Financial Statements
192 Notes to the Company Financial Statements
201 Gas and Liquids Reserves (Unaudited)
202 Five Year Summary (Unaudited)
203 Ofgem Consolidated Segmental Statement
Financial Statements

Group Income Statement
108
2016 2015
Year ended 31 December Notes
Business performance
£m
Exceptional items and certain re-measurements
£m
Results for the year
£m
Business performance
£m
Exceptional items and certain re-measurements
£m
Results for the year
£m
Group revenue 4(b) 27,102 – 27,102 27,971 – 27,971 Cost of sales before exceptional items and certain re-measurements 5 (22,711) – (22,711) (23,734) – (23,734) Re-measurement of energy contracts 7 – 1,058 1,058 – 116 116
Cost of sales 5 (22,711) 1,058 (21,653) (23,734) 116 (23,618) Gross profit 4,391 1,058 5,449 4,237 116 4,353
Operating costs before exceptional items 5 (3,054) – (3,054) (3,039) – (3,039) Exceptional items – restructuring costs 7 – (228) (228) – – – Exceptional items – impairments 7 – (176) (176) – (2,284) (2,284) Exceptional items – impairment write-backs 7 – 161 161 – 16 16 Exceptional items – net gain on disposal 7 – 101 101 – – – Exceptional items – other 7 – 131 131 – (90) (90)
Operating costs 5 (3,054) (11) (3,065) (3,039) (2,358) (5,397) Share of profits/(losses) of joint ventures and associates, net of interest and taxation 6, 7 130 (28) 102 200 (13) 187 Group operating profit/(loss) 4(c) 1,467 1,019 2,486 1,398 (2,255) (857)
Financing costs 8 (337) – (337) (334) – (334) Investment income 8 37 – 37 55 – 55
Net finance cost (300) – (300) (279) – (279) Profit/(loss) before taxation 1,167 1,019 2,186 1,119 (2,255) (1,136) Taxation on profit/(loss) 7, 9 (282) (242) (524) (286) 538 252 Profit/(loss) for the year 885 777 1,662 833 (1,717) (884) Attributable to:
Owners of the parent 895 777 1,672 863 (1,610) (747) Non-controlling interests (10) – (10) (30) (107) (137)
Earnings per ordinary share Pence Pence
Basic 10 31.4 (14.9) Diluted 10 31.2 (14.9)
Interim dividend paid per ordinary share 11 3.60 3.57 Final dividend proposed per ordinary share 11 8.40 8.43
The notes on pages 112 to 189 form part of these Financial Statements.
108
STRATEGIC REPORT GOVERNANCE
SHAREHOLDER INFORMATIONFINANCIAL STATEMENTS
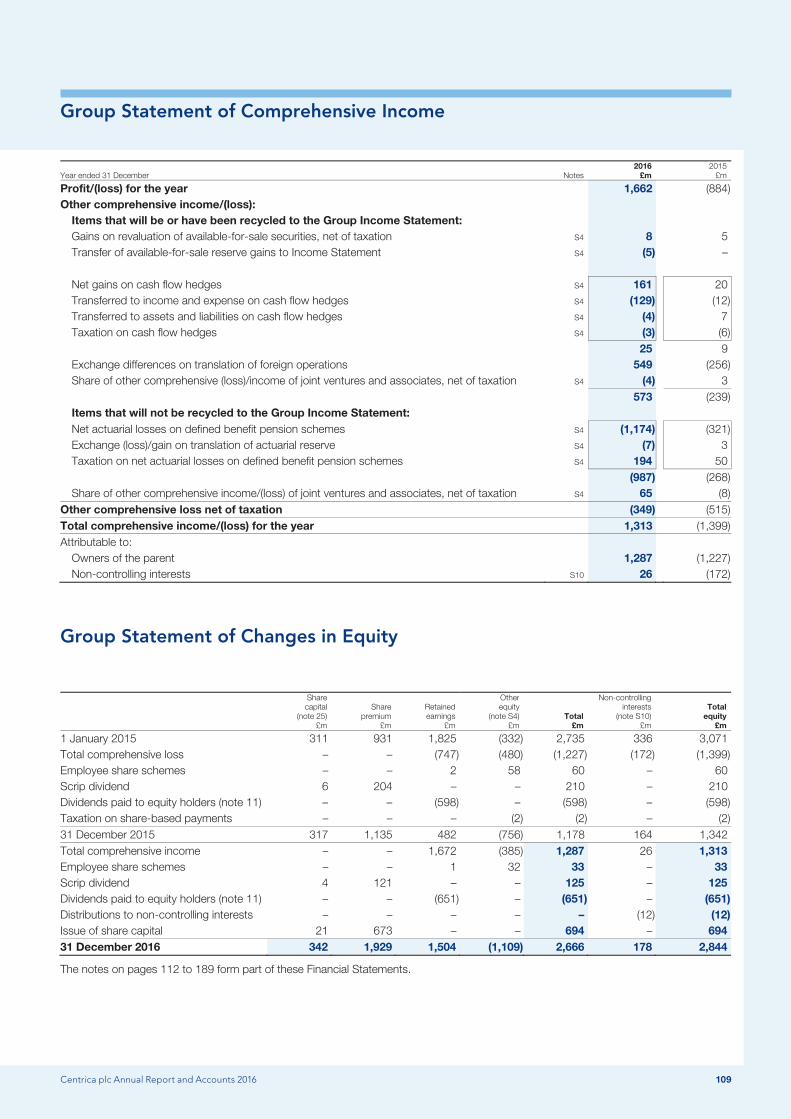
Group Statement of Comprehensive Income
Centrica plc Annual Report and Accounts 2016 109
Year ended 31 December Notes 2016
£m 2015
£m
Profit/(loss) for the year 1,662 (884) Other comprehensive income/(loss):
Items that will be or have been recycled to the Group Income Statement: Gains on revaluation of available-for-sale securities, net of taxation S4 8 5 Transfer of available-for-sale reserve gains to Income Statement S4 (5) – Net gains on cash flow hedges S4 161 20 Transferred to income and expense on cash flow hedges S4 (129) (12) Transferred to assets and liabilities on cash flow hedges S4 (4) 7 Taxation on cash flow hedges S4 (3) (6) 25 9 Exchange differences on translation of foreign operations 549 (256) Share of other comprehensive (loss)/income of joint ventures and associates, net of taxation S4 (4) 3 573 (239) Items that will not be recycled to the Group Income Statement: Net actuarial losses on defined benefit pension schemes S4 (1,174) (321) Exchange (loss)/gain on translation of actuarial reserve S4 (7) 3 Taxation on net actuarial losses on defined benefit pension schemes S4 194 50 (987) (268) Share of other comprehensive income/(loss) of joint ventures and associates, net of taxation S4 65 (8)
Other comprehensive loss net of taxation (349) (515) Total comprehensive income/(loss) for the year 1,313 (1,399) Attributable to:
Owners of the parent 1,287 (1,227) Non-controlling interests S10 26 (172)
Group Statement of Changes in Equity
Share capital
(note 25) £m
Share premium
£m
Retained earnings
£m
Other equity
(note S4) £m
Total £m
Non-controlling interests
(note S10) £m
Total equity
£m
1 January 2015 311 931 1,825 (332) 2,735 336 3,071 Total comprehensive loss – – (747) (480) (1,227) (172) (1,399) Employee share schemes – – 2 58 60 – 60 Scrip dividend 6 204 – – 210 – 210 Dividends paid to equity holders (note 11) – – (598) – (598) – (598) Taxation on share-based payments – – – (2) (2) – (2) 31 December 2015 317 1,135 482 (756) 1,178 164 1,342 Total comprehensive income – – 1,672 (385) 1,287 26 1,313 Employee share schemes – – 1 32 33 – 33 Scrip dividend 4 121 – – 125 – 125 Dividends paid to equity holders (note 11) – – (651) – (651) – (651) Distributions to non-controlling interests – – – – – (12) (12) Issue of share capital 21 673 – – 694 – 694 31 December 2016 342 1,929 1,504 (1,109) 2,666 178 2,844
The notes on pages 112 to 189 form part of these Financial Statements.
Centrica plc Annual Report and Accounts 2016 109
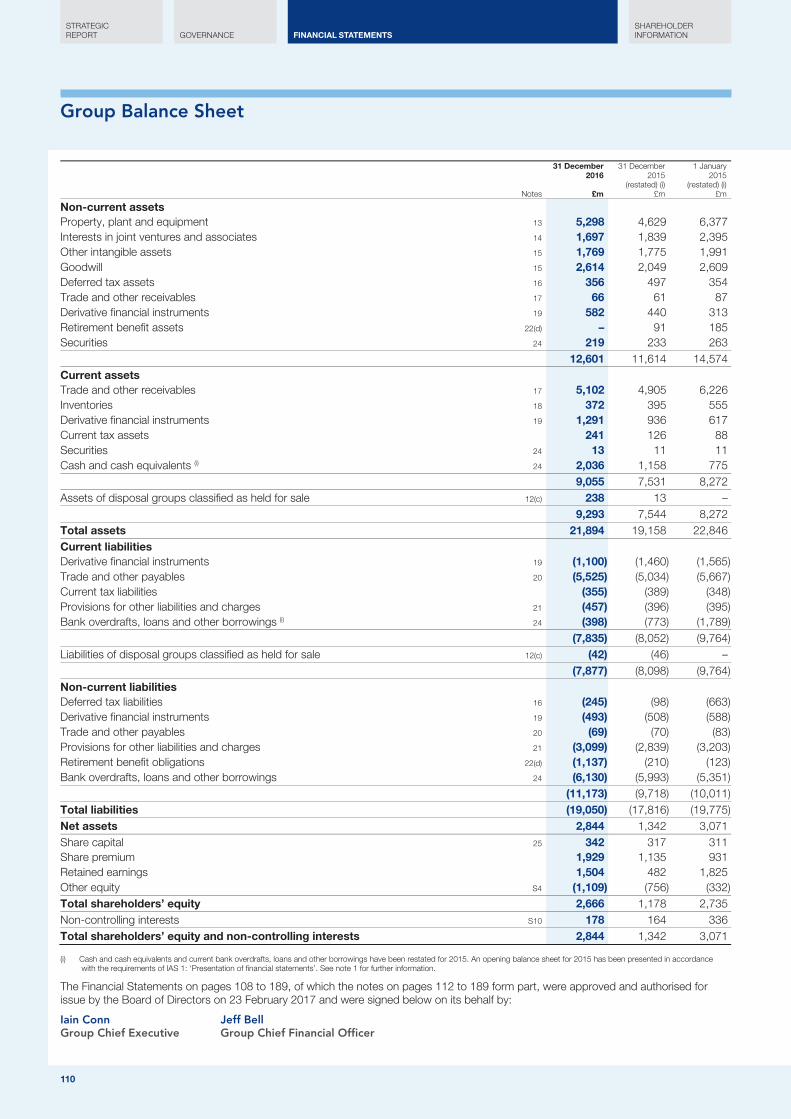
Group Balance Sheet
110
Notes
31 December 2016
£m
31 December 2015
(restated) (i) £m
1 January 2015
(restated) (i) £m
Non-current assets Property, plant and equipment 13 5,298 4,629 6,377 Interests in joint ventures and associates 14 1,697 1,839 2,395 Other intangible assets 15 1,769 1,775 1,991 Goodwill 15 2,614 2,049 2,609 Deferred tax assets 16 356 497 354 Trade and other receivables 17 66 61 87 Derivative financial instruments 19 582 440 313 Retirement benefit assets 22(d) – 91 185 Securities 24 219 233 263 12,601 11,614 14,574 Current assets Trade and other receivables 17 5,102 4,905 6,226 Inventories 18 372 395 555 Derivative financial instruments 19 1,291 936 617 Current tax assets 241 126 88 Securities 24 13 11 11 Cash and cash equivalents (i) 24 2,036 1,158 775 9,055 7,531 8,272 Assets of disposal groups classified as held for sale 12(c) 238 13 – 9,293 7,544 8,272 Total assets 21,894 19,158 22,846 Current liabilities Derivative financial instruments 19 (1,100) (1,460) (1,565) Trade and other payables 20 (5,525) (5,034) (5,667) Current tax liabilities (355) (389) (348) Provisions for other liabilities and charges 21 (457) (396) (395) Bank overdrafts, loans and other borrowings (i) 24 (398) (773) (1,789) (7,835) (8,052) (9,764) Liabilities of disposal groups classified as held for sale 12(c) (42) (46) – (7,877) (8,098) (9,764) Non-current liabilities Deferred tax liabilities 16 (245) (98) (663) Derivative financial instruments 19 (493) (508) (588) Trade and other payables 20 (69) (70) (83) Provisions for other liabilities and charges 21 (3,099) (2,839) (3,203) Retirement benefit obligations 22(d) (1,137) (210) (123) Bank overdrafts, loans and other borrowings 24 (6,130) (5,993) (5,351) (11,173) (9,718) (10,011) Total liabilities (19,050) (17,816) (19,775) Net assets 2,844 1,342 3,071 Share capital 25 342 317 311 Share premium 1,929 1,135 931 Retained earnings 1,504 482 1,825 Other equity S4 (1,109) (756) (332) Total shareholders’ equity 2,666 1,178 2,735 Non-controlling interests S10 178 164 336 Total shareholders’ equity and non-controlling interests 2,844 1,342 3,071
Cash and cash equivalents and current bank overdrafts, loans and other borrowings have been restated for 2015. An opening balance sheet for 2015 has been presented in accordance (i) with the requirements of IAS 1: ‘Presentation of financial statements’. See note 1 for further information.
The Financial Statements on pages 108 to 189, of which the notes on pages 112 to 189 form part, were approved and authorised for issue by the Board of Directors on 23 February 2017 and were signed below on its behalf by:
Iain Conn Jeff Bell Group Chief Executive Group Chief Financial Officer
110
STRATEGIC REPORT GOVERNANCE
SHAREHOLDER INFORMATIONFINANCIAL STATEMENTS

Group Cash Flow Statement
Centrica plc Annual Report and Accounts 2016 111
Year ended 31 December Notes 2016
£m 2015
£m
Group operating profit/(loss) including share of results of joint ventures and associates 2,486 (857) Less share of profit of joint ventures and associates, net of interest and taxation 6 (102) (187) Group operating profit/(loss) before share of results of joint ventures and associates 2,384 (1,044) Add back/(deduct):
Depreciation, amortisation, write-downs and impairments 1,068 3,482 Profit on disposals (126) (14) Decrease in provisions (32) (2) Defined benefit pension service cost and contributions (179) (131) Employee share scheme costs 46 45 Unrealised gains arising from re-measurement of energy contracts (737) (12)
Operating cash flows before movements in working capital 2,424 2,324 Decrease in inventories 90 138 Decrease in trade and other receivables 221 769 Increase/(decrease) in trade and other payables 140 (604) Operating cash flows before payments relating to taxes, interest and exceptional charges 2,875 2,627 Taxes paid 9(d) (206) (349) Payments relating to exceptional charges (273) (81) Net cash flow from operating activities 2,396 2,197 Purchase of businesses, net of cash acquired (335) (79) Sale of businesses 35 8 Purchase of property, plant and equipment and intangible assets 4(e) (829) (970) Sale of property, plant and equipment and intangible assets 13 9 Investments in joint ventures and associates (17) (13) Dividends received from joint ventures and associates 14(a) 117 180 Repayments of loans to, and disposal of investments in, joint ventures and associates 94 190 Interest received 91 38 Sale of securities 24(c) 28 26 Net cash flow from investing activities (803) (611) Issue and surrender of ordinary share capital, including issue for share awards 694 28 Payments for own shares S4 (17) (11) Distribution to non-controlling interests (10) – Financing interest paid (204) (311) Repayment of borrowings and finance leases 24(c) (477) (1,650) Cash received from borrowings, net of linked deposit 24(c) – 1,000 Equity dividends paid (532) (387) Net cash flow from financing activities (546) (1,331) Net increase in cash and cash equivalents 1,047 255 Cash and cash equivalents including overdrafts at 1 January 860 621 Effect of foreign exchange rate changes 53 (16) Cash and cash equivalents including overdrafts at 31 December 1,960 860 Included in the following line of the Group Balance Sheet:
Cash and cash equivalents 24(c) 2,036 1,158 Overdrafts included within current bank overdrafts, loans and other borrowings 24(c) (76) (298)
The notes on pages 112 to 189 form part of these Financial Statements.
Centrica plc Annual Report and Accounts 2016 111
Notes to the Financial Statements
112
Notes to the Financial Statements provide additional information required by statute, accounting standards or Listing Rules to explain a particular feature of the consolidated Financial Statements. The notes to these Financial Statements focus on areas that are key to understanding our business. Additional information that we are required to disclose by accounting standards or regulation is disclosed in the Supplementary Information (notes S1 to S10). In addition, for clarity, each note begins with a simple introduction outlining its purpose.
1. SUMMARY OF SIGNIFICANT NEW ACCOUNTING POLICIES AND REPORTING CHANGES
This section details new accounting standards, amendments to standards and interpretations, whether these are effective in 2016 or later years, and if and how these are expected to impact the financial position and performance of the Group.
The principal accounting policies applied in the preparation of these consolidated Financial Statements are set out below and in the Supplementary Information (note S2). Unless otherwise stated, these policies have been consistently applied to the years presented.
(a) Basis of preparation The consolidated Financial Statements have been prepared in accordance with International Financial Reporting Standards (IFRS) adopted by the European Union (EU) and therefore comply with Article 4 of the EU IAS Regulation and the Companies Act 2006.
The consolidated Financial Statements have been prepared on the historical cost basis except for derivative financial instruments, available-for-sale financial assets, financial instruments designated at fair value through profit or loss on initial recognition, and the assets of the Group’s defined benefit pension schemes that have been measured at fair value and the liabilities of the Group’s defined benefit pension schemes that have been measured using the projected unit credit valuation method. The carrying values of recognised assets and liabilities that are hedged items in fair value hedges, and are otherwise carried at cost, are adjusted to record changes in the fair values attributable to the risks that are being hedged.
The preparation of financial statements in conformity with IFRS, as adopted by the EU, requires the use of certain critical accounting estimates. It requires management to exercise its judgement in the process of applying the Group’s accounting policies. The areas involving a higher degree of judgement or complexity and areas where assumptions and estimates are significant to the consolidated Financial Statements are described in notes 2 and 3.
(b) Standards, amendments and interpretations effective or adopted in 2016 From 1 January 2016, the following standards and amendments are effective in the consolidated Group Financial Statements. Their first time adoption does not have a material impact on the consolidated Group Financial Statements:
● Amendment to IAS 1: ‘Presentation of financial statements’ related to the disclosure initiative;
● Amendment to IAS 16: ‘Property, plant and equipment’ and IAS 38: ‘Intangible assets’ related to the clarification of acceptable methods of depreciation and amortisation;
● Amendment to IAS 19: ‘Employee benefits’ related to employee contributions to defined benefit plans;
● ‘Annual Improvement Project 2010-2012’; and ● ‘Annual Improvement Project 2012-2014’.
From 1 January 2016, an amendment to IFRS 11: ‘Joint arrangements’ on the acquisitions of interests in joint operations is effective. This amendment clarifies that an acquisition of a joint operation that meets the definition of a business is accounted for in accordance with IFRS 3: ‘Business combinations’. This will lead to a change to the Group’s current accounting policy for this type of acquisition. However, the amendment is only applicable prospectively for acquisitions on or after 1 January 2016 and therefore the accounting for acquisitions prior to this date has not been restated. As these accounting requirements apply to non-recurring transactions whose size may vary, the Group cannot quantify the impact that the amendment to this standard will have in the future.
(c) Standards and amendments that are issued but not yet applied by the Group The Group has not yet applied the following standards and amendments as these are not yet effective in the consolidated Group Financial Statements, although they have been endorsed by the EU and will be effective from 1 January 2018:
● IFRS 9: ‘Financial instruments’; and ● IFRS 15: ‘Revenue from contracts with customers’.
Management has established and progressed separate projects to oversee the implementation of both standards but a detailed and complete quantitative assessment of the impact upon transition has not been finalised yet.
Management’s preliminary assessment of the impact of IFRS 9 was that it would not have a material impact on the Group’s consolidated Financial Statements. The more detailed reviews performed by the business in 2016 have continued to corroborate this initial assessment. To date, given the nature of the Group’s financial instruments held and/or issued, limited changes to the classification and measurement of financial instruments have been identified. Initial reviews have been performed across the business to determine the impact of the change from the incurred credit loss model to the expected credit loss model for impairment. Further work is required in selected areas but to date, no significant changes have been identified. The impact of the hedge accounting requirements of the standard, with certain exceptions, will be applied prospectively from 1 January 2018. Whilst the requirements for hedge accounting are simplified in IFRS 9, the Group does not expect to hedge account significantly more items because hedging strategies for the Group’s commodity exposure are portfolio based and dynamic in nature. Therefore, they may still not be eligible for hedge accounting and even if they were, this would still require an excessive administrative burden. Hence, with some limited exceptions, the majority of the Group’s derivative financial instrument fair value movements are expected to remain classified as certain re-measurements in the Group Income Statement and separately reported, as detailed in note 2. Further work will be conducted in 2017 to complete the outstanding reviews and update the assessment for new financial instruments entered into by the Group in 2017.
In relation to IFRS 15, management has made significant progress in the assessment of the impact of the new standard on the Group. During 2016, the Group’s business units have continued to review the contractual arrangements that comprise their current revenue streams to determine how IFRS 15 will impact the recognition and disclosure of revenues from these arrangements. The work performed to date has identified that, for the majority of the Group’s revenue, the application of IFRS 15 will have no impact on the current revenue recognition under IAS 18: ‘Revenue’.
112
STRATEGIC REPORT GOVERNANCE
SHAREHOLDER INFORMATION
FINANCIAL STATEMENTS NOTES TO THE FINANCIAL STATEMENTS
Notes to the Financial Statements
Centrica plc Annual Report and Accounts 2016 113
1. SUMMARY OF SIGNIFICANT NEW ACCOUNTING POLICIES AND REPORTING CHANGES The principal reasons for this are:
● the majority of Energy Supply revenue relates to open-ended customer contracts with no minimum quantities whereby the Energy Supply business delivers the amount of energy required by customers on demand. Under IFRS 15, it has been concluded that the Supply business only has an enforceable right to bill for consumption once the customer begins to consume energy;
● a portion of our Energy Services revenue is from fixed-fee service contracts, which are within the scope of IFRS 4: ‘Insurance contracts’ and consequently is not in the scope of IFRS 15. Revenue from these contracts will be separately identified from revenue in the scope of IFRS 15; and
● the majority of the production from our upstream assets (for example Exploration & Production gas producing fields, Central Power Generation gas fired power stations and sales of power from the Group’s associate investment in Nuclear) is transferred to the Group’s Energy Marketing & Trading segment and is sold in the market using trades in the scope of IAS 39: ‘Financial instruments: recognition and measurement’. These transactions are therefore outside the scope of IFRS 15. Revenue from these contracts will also be separately identified from revenue in the scope of IFRS 15.
The revenue streams where differences have been identified to date are not significant. Further work is still required in 2017 to complete the reviews of certain revenue streams, for example for the recently acquired Neas Energy business and a number of less material revenue streams. Additionally, as the business develops new product offerings, the IFRS 15 implications of these will also need to be reviewed.
Separately, there will be changes to the amounts deferred on the balance sheet related to costs to obtain contracts under IFRS 15 when compared to the current treatment. The exact change in the amount deferred has yet to be formally quantified but is in the process of being assessed.
The necessary processes to capture all of the adjustments and additional disclosures required under IFRS 15 will be put into place during 2017.
The following standards and amendments are not yet effective in the consolidated Group Financial Statements and have not yet been endorsed by the EU:
● Amendment to IAS 7: ‘Statement of cash flows’ related to the disclosure initiative. Effective from 1 January 2017;
● Amendment to IAS 12: ‘Income taxes’. Effective from 1 January 2017;
● Amendment to IFRS 2: ‘Classification and measurement of share-based payment transactions’. Effective from 1 January 2018;
● Amendment to IFRS 15: ‘Revenue from contracts with customers’ clarifications. Effective from 1 January 2018;
● IFRS 16: ‘Leases’. Effective from 1 January 2019; ● ‘Annual Improvement Project 2014-2016’. Effective from
1 January 2017 and 1 January 2018 depending on amendments to different standards; and
● IFRIC Interpretation 22: ‘Foreign currency transactions and advance consideration’. Effective from 1 January 2018.
Management does not anticipate that the application of the amendments to IAS 7, IAS 12, IFRS 2, IFRIC 22 and the ‘Annual Improvement Project 2014-2016’ will have a material impact on the amounts reported and disclosed. The clarification of IFRS 15 has been considered as part of the wider IFRS 15 project.
The implementation of IFRS 16, which was issued in January 2016, is likely to have a significant impact on the Group’s future consolidated Financial Statements as all leases will be recognised on the balance sheet (with the exception of short-term and immaterial leases). A project has been established to oversee the implementation of this standard. Initial assessments of the impact of the standard are ongoing. The majority of the implementation work will take place in 2017 and therefore it has not been practicable at this stage to quantify the full effect it will have on the Group’s consolidated Financial Statements upon transition.
(d) Restatements In March 2016, the IFRS Interpretations Committee issued an agenda decision regarding the treatment of offsetting and cash-pooling arrangements in accordance with IAS 32: ‘Financial instruments: presentation’. This provided additional guidance on when bank overdrafts in cash-pooling arrangements would meet the requirement for offsetting in accordance with IAS 32. Following this additional guidance, the Group has reviewed its cash-pooling arrangements and has revised its presentation of bank overdrafts on the Group Balance Sheet and now shows £76 million of bank overdrafts within current bank overdrafts, bank loans and other borrowings. Comparatives at 31 December 2015 have been restated by £298 million. The impact on the 2015 opening balance sheet was £154 million, and a third balance sheet has been presented on the Group Balance Sheet in accordance with IAS 1.
Following the conclusion of the strategic review in 2015, new reporting segments have been established reflecting the implementation of the Group’s new structure. The new segmental structure and the new adjusted operating cash flow measures are consistent with the internal reporting to, and regular review by, the Group’s Executive Committee (which is the entity’s Chief Operating Decision Maker as defined by IFRS 8: ‘Operating segments’) for the purposes of evaluating segmental performance and allocating resources. In accordance with IFRS 8, the segmental analysis disclosures in note 4 have been restated accordingly. Additionally, the goodwill allocation to cash generating units has been amended following the change in the segmental structure, reflecting the level at which goodwill is monitored for internal management purposes. See note 15(b).
2. CENTRICA SPECIFIC ACCOUNTING MEASURES
This section sets out the Group’s specific accounting measures applied in the preparation of the consolidated Financial Statements. These measures enable the users of the accounts to understand the Group’s underlying and statutory business performance separately.
(a) Use of adjusted performance measures The Directors believe that reporting adjusted profit, adjusted earnings per share and adjusted operating cash flow provides additional useful information on business performance and underlying trends. These measures are used for internal performance purposes. The adjusted measures in this report are not defined terms under IFRS and may not be comparable with similarly titled measures reported by other companies.
The measure of operating profit used by management to evaluate segment performance is adjusted operating profit. Adjusted operating profit is defined as operating profit before:
● exceptional items; and ● certain re-measurements;
but including:
● the Group’s share of results from joint ventures and associates before interest and taxation.
Centrica plc Annual Report and Accounts 2016 113
Notes to the Financial Statements
114
2. CENTRICA SPECIFIC ACCOUNTING MEASURES Note 4 contains analysis of adjusted operating profit by segment and a reconciliation of adjusted operating profit to operating profit after exceptional items and certain re-measurements. Note 4 also details an analysis of adjusted operating profit after taxation by segment and a reconciliation to the statutory results for the year. Adjusted operating profit after taxation is defined as segment operating profit after taxation, before exceptional items and certain re-measurements. This includes the operating results of equity-accounted interests, net of associated taxation, before interest and associated taxation.
Adjusted earnings is defined as earnings before:
● exceptional items net of taxation; and ● certain re-measurements net of taxation.
A reconciliation of earnings is provided in note 10.
Adjusted operating cash flow is used by management to assess the cash generating abilities of each segment. Adjusted operating cash flow is defined as net cash flow from operating activities before:
● payments relating to exceptional items; ● deficit reduction payments made to the UK defined benefit
pension schemes via Centrica’s Scottish Limited Partnership entities; and
● movements in variation margin and cash collateral that are included in net debt;
but including:
● dividends received from joint ventures and associates.
Payments related to exceptional items are excluded since the Directors do not consider these to represent underlying business performance. Deficit reduction payments and movements in variation margin and cash collateral are excluded since the Directors do not consider these to represent the operating cash flows generated by underlying business performance in the current year, since they are predominantly triggered by wider market factors and, in the case of variation margin and cash collateral, this represents a timing difference. Dividends received from joint ventures and associates are considered by the Directors to represent operating cash flows generated by the Group’s operations that are structured in this manner.
(b) Exceptional items and certain re-measurements The Group reflects its underlying financial results in the ‘business performance’ column of the Group Income Statement. To be able to provide readers with this clear and consistent presentation, the effects of ‘certain re-measurements’ of financial instruments, and ‘exceptional items’, are reported in a different column in the Group Income Statement.
The Group is an integrated energy business. This means that it utilises its knowledge and experience across the gas and power (and related commodity) value chains to make profits across the core markets in which it operates. As part of this strategy, the Group enters into a number of forward energy trades to protect and optimise the value of its underlying production, generation, storage and transportation assets (and similar capacity or off-take contracts), as well as to meet the future needs of our customers (downstream demand). These trades are designed to reduce the risk of holding such assets, contracts or downstream demand and are subject to strict risk limits and controls.
Primarily because some of these trades include terms that permit net settlement (they are prohibited from being designated as ‘own use’), the rules within IAS 39 require them to be individually fair valued. Fair value movements on these commodity derivative trades do not reflect the underlying performance of the business because
they are economically related to our upstream assets, capacity/off-take contracts or downstream demand, which are typically not fair valued. Therefore, these certain re-measurements are reported separately and are subsequently reflected in business performance when the underlying transaction or asset impacts profit or loss.
The arrangements discussed above and reflected as certain re-measurements are all managed separately from proprietary energy trading activities where trades are entered into speculatively for the purpose of making profits in their own right. These proprietary trades are included in the business performance column (in the results before certain re-measurements).
Exceptional items are those items that, in the judgement of the Directors, need to be disclosed separately by virtue of their nature, size or incidence. Again, to ensure the business performance column reflects the underlying results of the Group, these exceptional items are also reported in a separate column in the Group Income Statement. Items that may be considered exceptional in nature include disposals of businesses or significant assets, business restructurings, significant onerous contract charges and asset write-downs/impairments.
3. CRITICAL ACCOUNTING JUDGEMENTS AND KEY SOURCES OF ESTIMATION UNCERTAINTY
This section sets out the key areas of judgement and estimation that have the most significant effect on the amounts recognised in the consolidated Financial Statements.
(a) Critical judgements in applying the Group’s accounting policies Such key judgements include the following:
● the presentation of selected items as exceptional (see notes 2 and 7);
● the use of adjusted profit, adjusted earnings per share and adjusted operating cash flow measures (see notes 2, 4 and 10); and
● the classification of energy procurement contracts as derivative financial instruments and presentation as certain re-measurements (see notes 2, 7 and 19).
In addition, management has made the following key judgements in applying the Group’s accounting policies that have the most significant effect on the consolidated Group Financial Statements.
Wind farm disposals In prior years, the profits and losses arising on disposals of equity interests in wind farms were recognised within the business performance column of the Group Income Statement as part of the Central Power Generation segment. These divestments were in line with the Group’s established wind farm strategy to realise value, share risk and reduce our capital requirements as individual projects developed, which involved bringing in partners at an appropriate stage or full disposal.
In July 2015, the Group announced its intention to exit its 245MW portfolio of wind assets. During the current period, the Group disposed of its investment in GLID Wind Farms TopCo Limited (GLID), which owns Glens of Foudland, Lynn and Inner Dowsing wind farms, as part of this strategy (see note 12). The profit on disposal of £73 million has been classified as an exceptional item in the Group Income Statement since the Directors judge the exit from the wind business to be non-recurring in nature and distinct from the Group’s established wind farm strategy. The disposal of Lincs Wind Farm Limited announced on 13 January 2017 will be treated in the same way in 2017.
114
STRATEGIC REPORT GOVERNANCE
SHAREHOLDER INFORMATION
FINANCIAL STATEMENTS NOTES TO THE FINANCIAL STATEMENTS
Notes to the Financial Statements
Centrica plc Annual Report and Accounts 2016 115
3. CRITICAL ACCOUNTING JUDGEMENTS AND KEY SOURCES OF ESTIMATION UNCERTAINTY Leases – third-party power station tolling arrangements The Group had two long-term power station tolling contracts that were considered leases during 2016: (i) Spalding in the UK and (ii) Rijnmond in the Netherlands (although the Rijnmond tolling agreement was terminated with effect from 1 July 2016). The arrangements provided Centrica with the right to nominate 100% of the plant capacity for the duration of the contracts in return for a mix of capacity payments and operating payments based on plant availability.
The Spalding contract runs until 2021 and Centrica holds an option to extend the tolling arrangement for a further eight years, exercisable by 30 September 2020. If extended, Centrica is granted an option to purchase the station at the end of this further period. Management has determined that the arrangement should be accounted for as a finance lease, as the lease term was judged to be substantially all of the economic life of the power station and the present value of the minimum lease payments at the inception date of the arrangement amounted to substantially all of the fair value of the power station at that time. In May 2016, a number of revisions to this tolling arrangement were agreed; however this has not changed the accounting assessment of the contract as a finance lease.
Details of the interest charges, finance lease asset and finance lease payable are included in notes 8, 13 and 24 respectively.
Prior to its termination, the Rijnmond contract ran until 2030 and Centrica did not have the right to extend the agreement or any option to purchase the plant. Management had determined that the arrangement should be accounted for as an operating lease, as the lease term was not judged to be substantially all of the economic life of the power station and the present value of the minimum lease payments at the inception date of the arrangement did not amount to substantially all of the fair value of the power station at that time. See note 7 for further details of the impact of the termination of the contract.
Business combinations and asset acquisitions Classification of an acquisition as a business combination or an asset acquisition depends on whether the assets acquired constitute a business, which can be a complex judgement. Whether an acquisition is classified as a business combination or asset acquisition can have a significant impact on the entries made on and after acquisition.
Business combinations and acquisitions of associates and joint ventures require a fair value exercise to be undertaken to allocate the purchase price (cost) to the fair value of the acquired identifiable assets, liabilities, contingent liabilities and goodwill.
As a result of the nature of fair value assessments in the energy industry, this purchase price allocation exercise requires subjective judgements based on a wide range of complex variables at a point in time. Management uses all available information to make the fair value determinations.
During the year the Group has made two significant acquisitions: ENER-G Cogen and Neas Energy. These acquisitions have been accounted for as business combinations as set out in note 12(a).
Consolidation of the CQ Energy Canada Partnership The Suncor upstream acquisition in 2013 involved the formation of the CQ Energy Canada Partnership (CQECP) to acquire Suncor Energy’s North American gas and oil assets. CQECP is owned and funded by the Group and Qatar Petroleum International (QPI) on a 60:40 basis. The partnership provides the Group with the ability to control the business plan and budgets and consequently the general operation of the assets. Accordingly, this arrangement has been assessed under IFRS 10: ‘Consolidated financial statements’
and the conclusion has been reached that the Group has power over the relevant activities of CQECP. This entity has been fully consolidated into the Group’s Financial Statements and QPI’s ownership share is represented as a non-controlling interest.
Disposal groups classified as held for sale The Canadian Exploration & Production business, which is subject to a sale process, was not considered to meet the conditions under IFRS 5: ‘Non-current assets held for sale and discontinued operations’ to be classified as held for sale at the balance sheet date. Although plans to sell the business had been announced and negotiations with buyers had commenced, significant uncertainty remained such that it was not considered highly probable at the balance sheet date that any sale would be completed within one year.
On 13 January 2017, the Group announced an agreement to sell its remaining wind farm interest, Lincs Wind Farm Limited, with completion occurring on 17 February 2017. The investment in the wind farm and associated shareholder loan have been classified as a disposal group held for sale at the year end, since a sale was judged to be highly probable at that date, which was subsequently confirmed by the announcement.
The Group’s Exploration & Production assets in Trinidad and Tobago have also been classified as a disposal group held for sale following an announcement on 30 November 2016 of the sale. See note 12(c) for further details.
Uncertain taxation provisions The Group operates internationally in territories with different and complex tax codes.
Management exercises judgement in relation to the level of provision required for uncertain tax outcomes. There are a number of tax positions not yet agreed with the tax authorities where different interpretations of legislation and commercial arrangements could lead to a range of outcomes. Judgements are made for each position having regard to the particular circumstances and advice obtained.
Management also exercises judgement in assessing the availability of suitable future taxable profits to support deferred tax asset recognition. Further details of the Group’s tax position are provided in notes 9 and 16.
Energy Company Obligation The Energy Company Obligation (ECO) order requires UK-licensed energy suppliers to improve the energy efficiency of domestic households from 1 January 2013. Targets are set in proportion to the size of historic customer bases. ECO phase 1 had a delivery date of 31 March 2015. ECO phase 2 must be delivered by 31 March 2017. The Group continues to judge that it is not legally obligated by this order until 31 March 2017 for ECO phase 2. Accordingly, the costs of delivery are recognised as incurred, when cash is spent or unilateral commitments made, resulting in obligations that cannot be avoided.
In prior periods, the Group had entered into a number of contractual arrangements and commitments, and issued a public statement to underline its commitment to deliver a specific proportion of the ECO requirements. Consequently, the Group’s result had included the costs of these contractual arrangements and commitment obligations.
Metering contracts The Department of Energy and Climate Change (DECC) has modified the UK gas and electricity supply licences requiring all domestic premises to be fitted with compliant smart meters for measuring energy consumption by 31 December 2020. The Group has a number of existing rental contracts for non-compliant meters
Centrica plc Annual Report and Accounts 2016 115

Notes to the Financial Statements
116
3. CRITICAL ACCOUNTING JUDGEMENTS AND KEY SOURCES OF ESTIMATION UNCERTAINTY that include penalty charges if these meters are removed from use before the end of their deemed useful lives. The Group considers that these contracts are not onerous until the meters have been physically removed from use and, therefore, only recognises a provision for penalty charges at this point.
In 2015, as part of the smart meter roll-out, the Group renewed meter rental arrangements with third-parties. The Group assessed that these are not leases because it does not have the right to physically or operationally control the smart meters and other parties also take a significant amount of the output from the assets.
(b) Key sources of estimation uncertainty Revenue recognition – unread gas and electricity meters Revenue for energy supply activities includes an assessment of energy supplied to customers between the date of the last meter reading and the year end (unread). Unread gas and electricity comprises both billed and unbilled revenue. It is estimated through the billing systems, using historical consumption patterns, on a customer by customer basis, taking into account weather patterns, load forecasts and the differences between actual meter reads being returned and system estimates. Actual meter reads continue to be compared to system estimates between the balance sheet date and the finalisation of the accounts.
An assessment is also made of any factors that are likely to materially affect the ultimate economic benefits that will flow to the Group, including bill cancellation and re-bill rates. To the extent that the economic benefits are not expected to flow to the Group, the value of that revenue is not recognised. The judgements applied, and the assumptions underpinning these judgements, are considered to be appropriate. However, a change in these assumptions would have an impact on the amount of revenue recognised.
Industry reconciliation process – cost of sales Industry reconciliation procedures are required as differences arise between the estimated quantity of gas and electricity the Group deems to have supplied and billed customers, and the estimated quantity industry system operators deem the individual suppliers, including the Group, to have supplied to customers. The difference in deemed supply is referred to as imbalance. The reconciliation procedures can result in either a higher or a lower value of industry deemed supply than has been estimated as being supplied to customers by the Group, but in practice tends to result in a higher value of industry deemed supply. The Group reviews the difference to ascertain whether there is evidence that its estimate of amounts supplied to customers is inaccurate or whether the difference arises from other causes. The Group’s share of the resulting imbalance is included within commodity costs charged to cost of sales. Management estimates the level of recovery of imbalance that will be achieved either through subsequent customer billing or through developing industry settlement procedures.
Decommissioning costs The estimated cost of decommissioning at the end of the producing lives of gas and oil fields (including storage facility assets) is reviewed periodically and is based on reserves, price levels and technology at the balance sheet date. Provision is made for the estimated cost of decommissioning at the balance sheet date. The payment dates of total expected future decommissioning costs are uncertain and dependent on the lives of the facilities, but are currently anticipated to be incurred until 2066, with the majority of the costs expected to be paid between 2020 and 2040.
Significant judgements and estimates are also made about the costs of decommissioning nuclear power stations and the costs of waste management and spent fuel. These estimates impact the carrying value of our Nuclear investment. Various arrangements and indemnities are in place with the Secretary of State with respect to these costs, as explained in note S2.
Gas and liquids reserves The volume of proven and probable (2P) gas and liquids reserves is an estimate that affects the unit of production method of depreciating producing gas and liquids PP&E as well as being a significant estimate affecting decommissioning and impairment calculations. The factors impacting gas and liquids estimates, the process for estimating reserve quantities and reserve recognition is described on page 201.
The impact of a change in estimated 2P reserves is dealt with prospectively by depreciating the remaining book value of producing assets over the expected future production. If 2P reserves estimates are revised downwards, earnings could be affected by higher depreciation expense or an immediate write-down (impairment) of the asset’s book value.
Determination of fair values – energy derivatives Fair values of energy derivatives are estimated by reference in part to published price quotations in active markets and in part by using valuation techniques. More detail on the assumptions used in determining fair valuations of energy derivatives is provided in note S6 and of the sensitivities to these assumptions in note S3.
Impairment of long-lived assets The Group has several material long-lived assets, which are assessed or tested for impairment at each reporting date in accordance with the Group’s accounting policy as described in note 7. The Group makes judgements and estimates in considering whether the carrying amounts of these assets or cash generating units (CGUs) are recoverable. The key assets that are subjected to impairment tests are upstream gas and oil assets, power generation assets, storage facility assets, Nuclear investment (20% economic interest accounted for as an investment in associate) and goodwill.
Exploration & Production gas and oil assets The recoverable amount of the Group’s gas and oil assets is determined by discounting the post-tax cash flows expected to be generated by the assets over their lives taking into account those assumptions that market participants would take into account when assessing fair value. The cash flows are derived from projected production profiles of each field, based predominantly on expected 2P reserves and take into account forward prices for gas and liquids over the relevant period. Where forward market prices are not available, prices are determined based on internal model inputs.
Considering the uncertainty with the disposal process of the Group’s Canadian gas and oil assets, significant judgement was required in determining the recoverable amount of the assets and a range of possible outcomes exist. The recoverable amount is particularly sensitive to the price assumptions made in the impairment calculations and the outcome of the disposal process.
Further details of the assumptions used in determining the recoverable amounts and the impairment reversals booked during the year and sensitivity to the assumptions are provided in note 7.
116
STRATEGIC REPORT GOVERNANCE
SHAREHOLDER INFORMATION
FINANCIAL STATEMENTS NOTES TO THE FINANCIAL STATEMENTS
Notes to the Financial Statements
Centrica plc Annual Report and Accounts 2016 117
3. CRITICAL ACCOUNTING JUDGEMENTS AND KEY SOURCES OF ESTIMATION UNCERTAINTY Power generation assets The recoverable amount of the Group’s power generation assets is calculated by discounting the pre-tax cash flows expected to be generated by the assets and is dependent on views of forecast power generation and forecast power, gas, carbon and capacity prices (where applicable) and the timing and extent of capital expenditure. Where forward market prices are not available, prices are determined based on internal model inputs. Further details of the impairment reversals booked during the year are provided in note 7.
Storage facility assets The recoverable amount of our operational storage facilities is calculated by discounting the post-tax cash flows expected to be generated by the assets based on predictions of seasonal gas price spreads and shorter-term price volatilities and the value from extracting cushion gas at the end of the field life less any related capital and operating expenditure. Further details of the impairments booked during the year and sensitivity to the assumptions are provided in note 7.
Nuclear investment The recoverable amount of the Nuclear investment is based on the value of the existing UK nuclear fleet operated by EDF. The existing fleet value is calculated by discounting post-tax cash flows derived from the stations based on forecast power generation and power prices, whilst taking account of planned outages and the possibility of life extensions. Further details of the methodology and sensitivity to the assumptions are provided in note 7.
Goodwill Goodwill does not generate independent cash flows and accordingly is allocated at inception to specific CGUs or groups of CGUs for impairment testing purposes. The recoverable amounts of these CGUs are derived from estimates of future cash flows (as described in the asset classes above) and hence the goodwill impairment tests are also subject to these key estimates. The results of these tests may then be verified by reference to external market valuation data.
Further details on the assumptions used in determining the recoverable amounts are provided in notes 7 and S2. Sensitivity to the assumptions is also found in note 7.
Credit provisions for trade and other receivables The methodology for determining provisions for credit losses on trade and other receivables and the level of such provision is set out in note 17. Although the provisions recognised are considered appropriate, the use of different assumptions or changes in economic conditions could lead to movements in the provisions and therefore impact the Group Income Statement.
Following issues arising from the implementation of a new billing system in UK Business in 2014, management has exercised additional judgement regarding the appropriate level of provision for these trade receivables. Changes in these judgements could also lead to movements in the provisions and therefore impact the Group Income Statement. Within UK Business, the volume of gross billed debt outstanding fell to £612 million at the year end compared to £894 million for the prior year. Within this, the balance of debt greater than 12 months old increased to £242 million from £221 million with an appropriate bad debt provision maintained. Cash collected has exceeded billed revenue during the year by 8%.
Pensions and other post employment benefits The cost of providing benefits under defined benefit schemes is determined separately for each of the Group’s schemes under the projected unit credit actuarial valuation method. Actuarial gains and losses are recognised in full in the period in which they occur. The key assumptions used for the actuarial valuation are based on the Group’s best estimate of the variables that will determine the ultimate cost of providing post employment benefits. Further details, including sensitivities to these assumptions, are provided in note 22.
Provisions for onerous contracts The Group has entered into a number of commodity procurement and capacity contracts related to specific assets in the ordinary course of its business. Where the unavoidable costs of meeting the obligations under these contracts exceed the associated expected future net benefits, an onerous contract provision is recognised. The calculation of these provisions will involve the use of estimates. The key onerous provisions are as follows:
Spalding power station onerous contract provision The onerous provision is calculated by taking the unavoidable costs that will be incurred under the contract, excluding those that are treated as minimum lease payments and included within the Group’s finance lease liability, deducting any estimated revenues. Further details of the release of the provision in 2016 are provided in note 7.
European gas transportation capacity contracts The onerous provision is calculated using capacity costs incurred under the contracts, less any predicted income. The provision calculation assumes that contracts for capacity in continental Europe are onerous but those that enable gas to be transported directly back into the UK may be necessary to achieve security of supply in the future. Therefore, no provision has been recognised relating to these latter contracts.
Direct Energy wind farm power purchase agreements The onerous nature of the power purchase agreements is measured using estimates relating to wind forecasts, forward curves for energy prices, balancing costs and renewable energy certificates. Further details of the release of the provision during the year are provided in note 7.
Centrica plc Annual Report and Accounts 2016 117
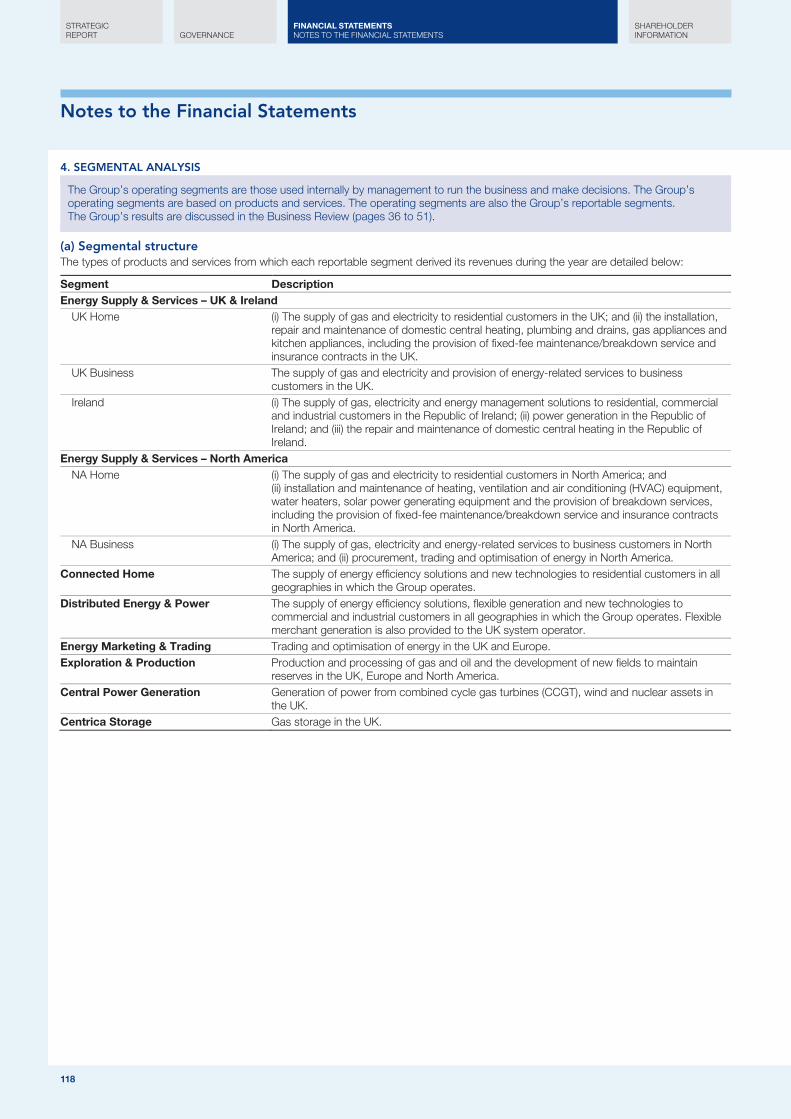
Notes to the Financial Statements
118
4. SEGMENTAL ANALYSIS
The Group’s operating segments are those used internally by management to run the business and make decisions. The Group’s operating segments are based on products and services. The operating segments are also the Group’s reportable segments. The Group’s results are discussed in the Business Review (pages 36 to 51).
(a) Segmental structure The types of products and services from which each reportable segment derived its revenues during the year are detailed below:
Segment Description Energy Supply & Services – UK & Ireland
UK Home (i) The supply of gas and electricity to residential customers in the UK; and (ii) the installation, repair and maintenance of domestic central heating, plumbing and drains, gas appliances and kitchen appliances, including the provision of fixed-fee maintenance/breakdown service and insurance contracts in the UK.
UK Business The supply of gas and electricity and provision of energy-related services to business customers in the UK.
Ireland (i) The supply of gas, electricity and energy management solutions to residential, commercial and industrial customers in the Republic of Ireland; (ii) power generation in the Republic of Ireland; and (iii) the repair and maintenance of domestic central heating in the Republic of Ireland.
Energy Supply & Services – North America NA Home (i) The supply of gas and electricity to residential customers in North America; and
(ii) installation and maintenance of heating, ventilation and air conditioning (HVAC) equipment, water heaters, solar power generating equipment and the provision of breakdown services, including the provision of fixed-fee maintenance/breakdown service and insurance contracts in North America.
NA Business (i) The supply of gas, electricity and energy-related services to business customers in North America; and (ii) procurement, trading and optimisation of energy in North America.
Connected Home The supply of energy efficiency solutions and new technologies to residential customers in all geographies in which the Group operates.
Distributed Energy & Power The supply of energy efficiency solutions, flexible generation and new technologies to commercial and industrial customers in all geographies in which the Group operates. Flexible merchant generation is also provided to the UK system operator.
Energy Marketing & Trading Trading and optimisation of energy in the UK and Europe. Exploration & Production Production and processing of gas and oil and the development of new fields to maintain
reserves in the UK, Europe and North America. Central Power Generation Generation of power from combined cycle gas turbines (CCGT), wind and nuclear assets in
the UK. Centrica Storage Gas storage in the UK.
118
STRATEGIC REPORT GOVERNANCE
SHAREHOLDER INFORMATION
FINANCIAL STATEMENTS NOTES TO THE FINANCIAL STATEMENTS

Notes to the Financial Statements
Centrica plc Annual Report and Accounts 2016 119
4. SEGMENTAL ANALYSIS (b) Revenue
Gross segment revenue represents revenue generated from the sale of products and services to both third parties and to other reportable segments of the Group. Group revenue reflects only the sale of products and services to third parties.
2016 2015
Year ended 31 December
Gross segment revenue
£m
Less inter-segment
revenue
£m
Group revenue
£m
Gross segment revenue
(restated) (i) £m
Less inter-segment
revenue (restated) (i)
£m
Group revenue
(restated) (i) £m
Energy Supply & Services – UK & Ireland UK Home 9,252 (8) 9,244 9,822 – 9,822 UK Business 2,031 (1) 2,030 2,389 (2) 2,387 Ireland 781 – 781 733 – 733
12,064 (9) 12,055 12,944 (2) 12,942 Energy Supply & Services – North America
NA Home 2,702 – 2,702 2,655 – 2,655 NA Business 7,664 – 7,664 7,932 – 7,932
10,366 – 10,366 10,587 – 10,587 Connected Home 33 (8) 25 19 (4) 15 Distributed Energy & Power 161 (2) 159 95 (3) 92 Energy Marketing & Trading 3,282 (88) 3,194 3,101 (144) 2,957 Exploration & Production 1,642 (871) 771 2,035 (1,206) 829 Central Power Generation 667 (209) 458 668 (225) 443 Centrica Storage 93 (19) 74 156 (50) 106 28,308 (1,206) 27,102 29,605 (1,634) 27,971
The Group does not monitor and manage performance by geographic territory, but we provide below an analysis of revenue and certain non-current assets by geography.
Revenue
(based on location of customer) Non-current assets
(based on location of assets) (ii)
Year ended 31 December 2016
£m 2015
£m 2016
£m 2015
£m
UK 14,459 15,654 6,445 6,281 North America 10,502 10,728 3,281 2,827 Norway 370 297 1,299 1,005 Rest of the world 1,771 1,292 353 179 27,102 27,971 11,378 10,292
Segmental revenue has been restated in the new reporting segments. See note 1 for further information. (i) Non-current assets include goodwill, other intangible assets, PP&E and interests in joint ventures and associates. (ii)
Centrica plc Annual Report and Accounts 2016 119
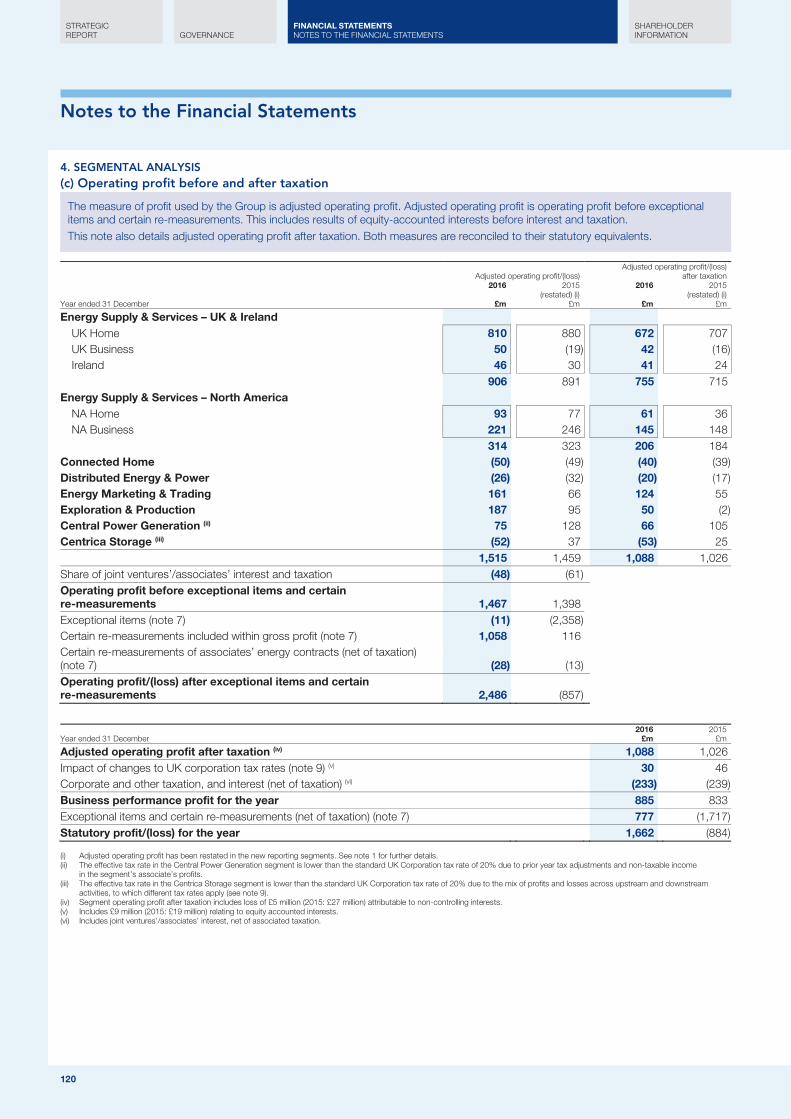
Notes to the Financial Statements
120
4. SEGMENTAL ANALYSIS (c) Operating profit before and after taxation
The measure of profit used by the Group is adjusted operating profit. Adjusted operating profit is operating profit before exceptional items and certain re-measurements. This includes results of equity-accounted interests before interest and taxation. This note also details adjusted operating profit after taxation. Both measures are reconciled to their statutory equivalents.
Adjusted operating profit/(loss) Adjusted operating profit/(loss)
after taxation
Year ended 31 December
2016
£m
2015 (restated) (i)
£m
2016
£m
2015 (restated) (i)
£m
Energy Supply & Services – UK & Ireland UK Home 810 880 672 707 UK Business 50 (19) 42 (16) Ireland 46 30 41 24
906 891 755 715 Energy Supply & Services – North America
NA Home 93 77 61 36 NA Business 221 246 145 148
314 323 206 184 Connected Home (50) (49) (40) (39) Distributed Energy & Power (26) (32) (20) (17) Energy Marketing & Trading 161 66 124 55 Exploration & Production 187 95 50 (2) Central Power Generation (ii) 75 128 66 105 Centrica Storage (iii) (52) 37 (53) 25 1,515 1,459 1,088 1,026 Share of joint ventures’/associates’ interest and taxation (48) (61) Operating profit before exceptional items and certain re-measurements 1,467 1,398 Exceptional items (note 7) (11) (2,358) Certain re-measurements included within gross profit (note 7) 1,058 116 Certain re-measurements of associates’ energy contracts (net of taxation) (note 7) (28) (13) Operating profit/(loss) after exceptional items and certain re-measurements 2,486 (857)
Year ended 31 December 2016
£m 2015
£m
Adjusted operating profit after taxation (iv) 1,088 1,026 Impact of changes to UK corporation tax rates (note 9) (v) 30 46 Corporate and other taxation, and interest (net of taxation) (vi) (233) (239) Business performance profit for the year 885 833 Exceptional items and certain re-measurements (net of taxation) (note 7) 777 (1,717) Statutory profit/(loss) for the year 1,662 (884)
Adjusted operating profit has been restated in the new reporting segments. See note 1 for further details. (i) The effective tax rate in the Central Power Generation segment is lower than the standard UK Corporation tax rate of 20% due to prior year tax adjustments and non-taxable income (ii)
in the segment’s associate’s profits. The effective tax rate in the Centrica Storage segment is lower than the standard UK Corporation tax rate of 20% due to the mix of profits and losses across upstream and downstream (iii)
activities, to which different tax rates apply (see note 9). Segment operating profit after taxation includes loss of £5 million (2015: £27 million) attributable to non-controlling interests. (iv) Includes £9 million (2015: £19 million) relating to equity accounted interests. (v) Includes joint ventures’/associates’ interest, net of associated taxation. (vi)
120
STRATEGIC REPORT GOVERNANCE
SHAREHOLDER INFORMATION
FINANCIAL STATEMENTS NOTES TO THE FINANCIAL STATEMENTS

Notes to the Financial Statements
Centrica plc Annual Report and Accounts 2016 121
4. SEGMENTAL ANALYSIS (d) Included within adjusted operating profit
Presented below are certain items included within adjusted operating profit, including further details of impairments of property, plant and equipment and write-downs relating to exploration and evaluation assets.
Share of results of joint ventures and associates
before interest and taxation Depreciation and impairments of
property, plant and equipment Amortisation, write-downs and
impairments of intangibles
Year ended 31 December
2016
£m
2015 (restated) (i)
£m
2016
£m
2015 (restated) (i)
£m
2016
£m
2015 (restated) (i)
£m
Energy Supply & Services – UK & Ireland UK Home – (1) (51) (52) (111) (90) UK Business – – (2) (2) (11) (10) Ireland – – (2) (1) (9) (6)
– (1) (55) (55) (131) (106) Energy Supply & Services – North America
NA Home – – (6) (5) (49) (42) NA Business – – (2) (1) (39) (47)
– – (8) (6) (88) (89) Connected Home – – – – (6) (2) Distributed Energy & Power – – (6) (2) (9) (1) Energy Marketing & Trading – – – – (11) (16) Exploration & Production – – (578) (753) (25) (77) Central Power Generation 178 262 (27) (33) – – Centrica Storage – – (36) (33) (1) (1) Other (ii) – – (27) (11) (17) (13) 178 261 (737) (893) (288) (305)
The share of results of joint ventures and associates, the depreciation and impairments of property, plant and equipment and the amortisation, write-downs and impairments of intangibles (i)have been restated in the new reporting segments. See note 1 for further information.
The Other segment includes corporate functions, subsequently recharged. (ii)
Impairment of property, plant and equipment During 2016, an £86 million impairment charge (2015: £4 million) was recognised in the Exploration & Production segment; a £3 million impairment write-back (2015: £3 million impairment charge) was recognised in the Central Power Generation segment and a £1 million impairment charge (2015: nil) was recognised in the Distributed Energy & Power segment, all within business performance.
Write-downs and impairments of intangible assets During 2016, £19 million of write-downs (2015: £71 million) relating to exploration and evaluation assets were recognised in the Exploration & Production segment and a £1 million impairment (2015: nil) of application software was recognised in the Ireland segment, both within business performance.
Centrica plc Annual Report and Accounts 2016 121
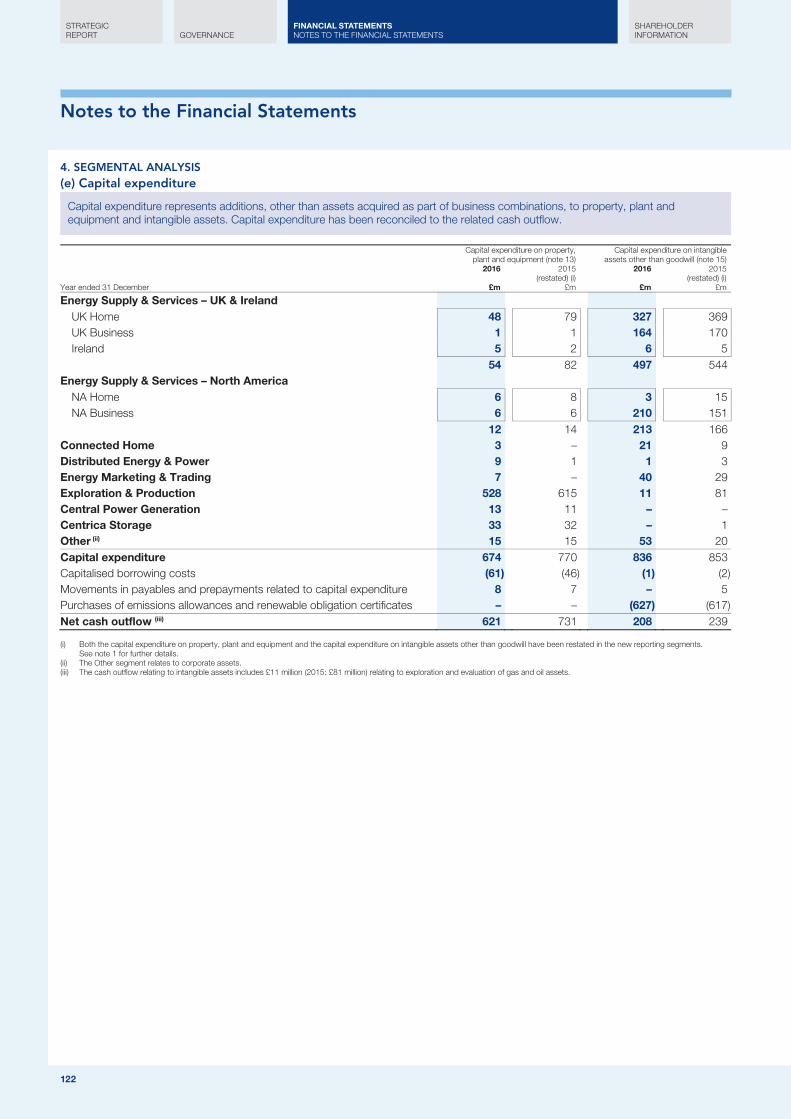
Notes to the Financial Statements
122
4. SEGMENTAL ANALYSIS (e) Capital expenditure
Capital expenditure represents additions, other than assets acquired as part of business combinations, to property, plant and equipment and intangible assets. Capital expenditure has been reconciled to the related cash outflow.
Capital expenditure on property,
plant and equipment (note 13) Capital expenditure on intangible
assets other than goodwill (note 15)
Year ended 31 December
2016
£m
2015 (restated) (i)
£m
2016
£m
2015 (restated) (i)
£m
Energy Supply & Services – UK & Ireland UK Home 48 79 327 369 UK Business 1 1 164 170 Ireland 5 2 6 5
54 82 497 544 Energy Supply & Services – North America
NA Home 6 8 3 15 NA Business 6 6 210 151
12 14 213 166 Connected Home 3 – 21 9 Distributed Energy & Power 9 1 1 3 Energy Marketing & Trading 7 – 40 29 Exploration & Production 528 615 11 81 Central Power Generation 13 11 – – Centrica Storage 33 32 – 1 Other (ii) 15 15 53 20 Capital expenditure 674 770 836 853 Capitalised borrowing costs (61) (46) (1) (2) Movements in payables and prepayments related to capital expenditure 8 7 – 5 Purchases of emissions allowances and renewable obligation certificates – – (627) (617) Net cash outflow (iii) 621 731 208 239
Both the capital expenditure on property, plant and equipment and the capital expenditure on intangible assets other than goodwill have been restated in the new reporting segments. (i)See note 1 for further details.
The Other segment relates to corporate assets. (ii) The cash outflow relating to intangible assets includes £11 million (2015: £81 million) relating to exploration and evaluation of gas and oil assets. (iii)
122
STRATEGIC REPORT GOVERNANCE
SHAREHOLDER INFORMATION
FINANCIAL STATEMENTS NOTES TO THE FINANCIAL STATEMENTS
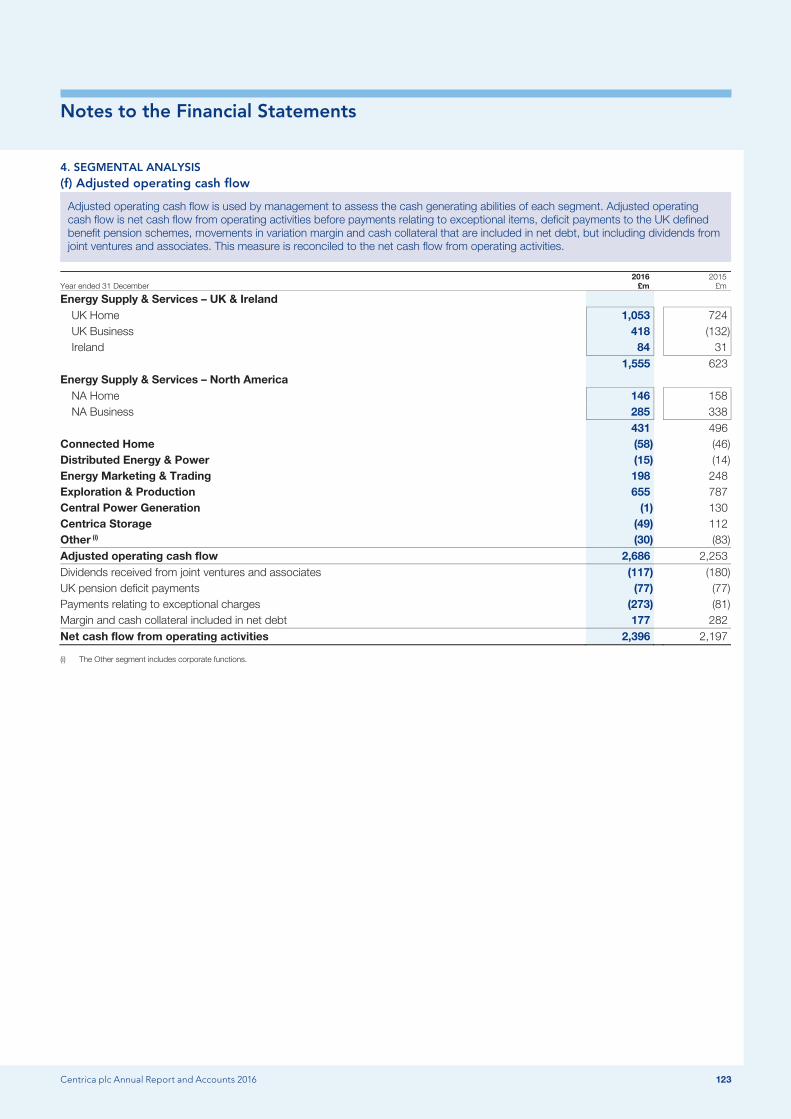
Notes to the Financial Statements
Centrica plc Annual Report and Accounts 2016 123
4. SEGMENTAL ANALYSIS (f) Adjusted operating cash flow
Adjusted operating cash flow is used by management to assess the cash generating abilities of each segment. Adjusted operating cash flow is net cash flow from operating activities before payments relating to exceptional items, deficit payments to the UK defined benefit pension schemes, movements in variation margin and cash collateral that are included in net debt, but including dividends from joint ventures and associates. This measure is reconciled to the net cash flow from operating activities.
Year ended 31 December 2016
£m 2015
£m
Energy Supply & Services – UK & Ireland UK Home 1,053 724 UK Business 418 (132) Ireland 84 31
1,555 623 Energy Supply & Services – North America
NA Home 146 158 NA Business 285 338
431 496 Connected Home (58) (46) Distributed Energy & Power (15) (14) Energy Marketing & Trading 198 248 Exploration & Production 655 787 Central Power Generation (1) 130 Centrica Storage (49) 112 Other (i) (30) (83) Adjusted operating cash flow 2,686 2,253 Dividends received from joint ventures and associates (117) (180) UK pension deficit payments (77) (77) Payments relating to exceptional charges (273) (81) Margin and cash collateral included in net debt 177 282 Net cash flow from operating activities 2,396 2,197
The Other segment includes corporate functions. (i)
Centrica plc Annual Report and Accounts 2016 123

Notes to the Financial Statements
124
5. COSTS OF OPERATIONS
This section details the types of costs the Group incurs and the number of employees in each of our operations.
(a) Analysis of costs by nature 2016 2015
Year ended 31 December
Cost of sales
£m
Operating costs
£m
Total costs
£m
Cost of sales
£m
Operating costs
£m
Total costs
£m
Transportation, distribution and metering costs (4,990) – (4,990) (4,737) – (4,737) Commodity costs (14,355) – (14,355) (15,239) – (15,239) Depreciation, amortisation, impairments and write-downs (580) (448) (1,028) (841) (357) (1,198) Employee costs (787) (1,363) (2,150) (761) (1,310) (2,071) Impairment of trade receivables (note 17) – (182) (182) – (259) (259) Other direct costs (1,999) (1,061) (3,060) (2,156) (1,113) (3,269)
Total costs before exceptional items and certain re-measurements (22,711) (3,054) (25,765)
(23,734)
(3,039)
(26,773)
Exceptional items and certain re-measurements (note 7) 1,058 (11) 1,047 116 (2,358) (2,242) Total costs (21,653) (3,065) (24,718) (23,618) (5,397) (29,015)
(b) Employee costs (i)
Year ended 31 December 2016
£m 2015
£m
Wages and salaries (1,792) (1,768) Social security costs (160) (155) Pension and other post employment benefits costs (185) (158) Share scheme costs (note S4) (46) (45) (2,183) (2,126) Capitalised employee costs 33 55 Employee costs recognised in the Group Income Statement (2,150) (2,071)
Details of Directors’ remuneration, share-based payments and pension entitlements in the Remuneration Report on pages 83 to 99 form part of these Financial Statements. (i)Details of the remuneration of key management personnel are given in note S8.
(c) Average number of employees during the year
Year ended 31 December
2016
Number
2015 (restated) (i) (ii)
Number
Energy Supply & Services – UK & Ireland 29,041 29,536 Energy Supply & Services – North America 5,999 6,166 Connected Home 280 197 Distributed Energy & Power (iii) 844 659 Energy Marketing & Trading (iv) 289 245 Exploration & Production 1,242 1,491 Central Power Generation 256 310 Centrica Storage 327 294 38,278 38,898
Average number of employees during 2015 has been restated in the new reporting segments. See note 1 for further details. (i) Average number of employees during 2015 has been restated due to the availability of improved data. (ii) Includes ENER-G Cogen employees from the date of acquisition. The average number of employees of ENER-G Cogen from the date of acquisition to the end of 2016 is 375. (iii) Includes Neas Energy employees from the date of acquisition. The average number of employees of Neas Energy from the date of acquisition to the end of 2016 is 262. (iv)
124
STRATEGIC REPORT GOVERNANCE
SHAREHOLDER INFORMATION
FINANCIAL STATEMENTS NOTES TO THE FINANCIAL STATEMENTS
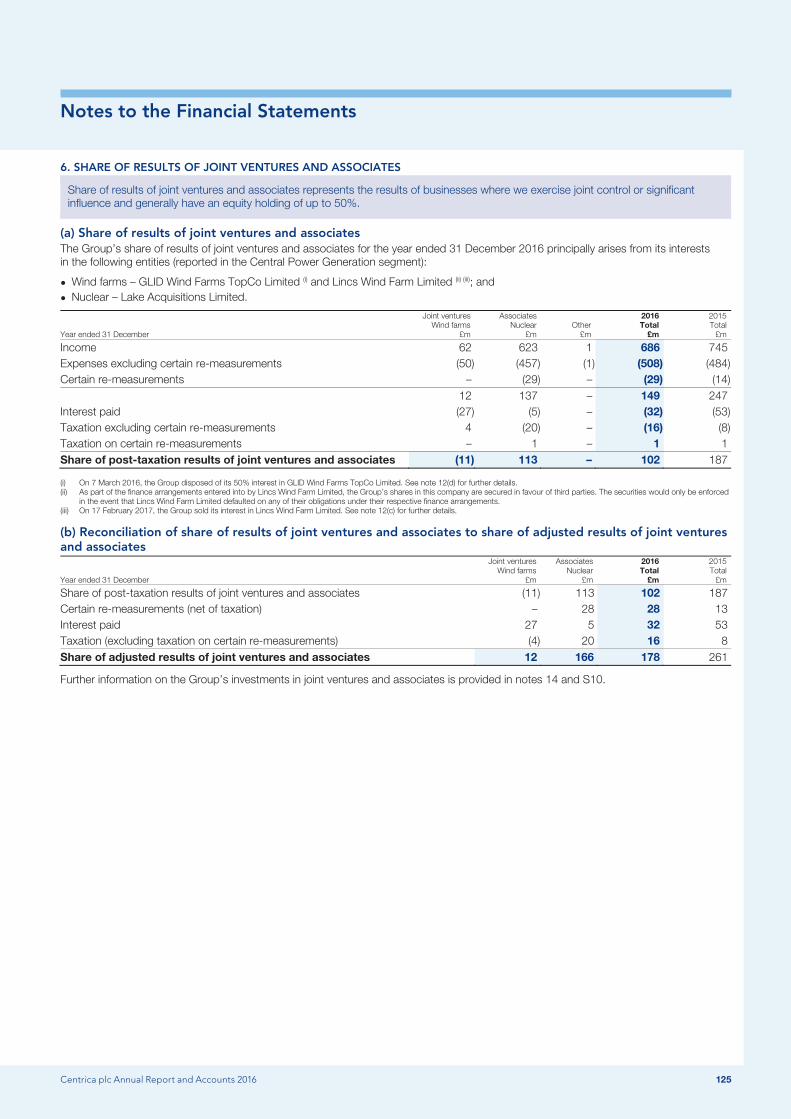
Notes to the Financial Statements
Centrica plc Annual Report and Accounts 2016 125
6. SHARE OF RESULTS OF JOINT VENTURES AND ASSOCIATES
Share of results of joint ventures and associates represents the results of businesses where we exercise joint control or significant influence and generally have an equity holding of up to 50%.
(a) Share of results of joint ventures and associates The Group’s share of results of joint ventures and associates for the year ended 31 December 2016 principally arises from its interests in the following entities (reported in the Central Power Generation segment):
● Wind farms – GLID Wind Farms TopCo Limited (i) and Lincs Wind Farm Limited (ii) (iii); and ● Nuclear – Lake Acquisitions Limited.
Year ended 31 December
Joint ventures Wind farms
£m
Associates Nuclear
£m Other
£m
2016 Total
£m
2015 Total £m
Income 62 623 1 686 745 Expenses excluding certain re-measurements (50) (457) (1) (508) (484) Certain re-measurements – (29) – (29) (14) 12 137 – 149 247 Interest paid (27) (5) – (32) (53) Taxation excluding certain re-measurements 4 (20) – (16) (8) Taxation on certain re-measurements – 1 – 1 1 Share of post-taxation results of joint ventures and associates (11) 113 – 102 187
On 7 March 2016, the Group disposed of its 50% interest in GLID Wind Farms TopCo Limited. See note 12(d) for further details. (i) As part of the finance arrangements entered into by Lincs Wind Farm Limited, the Group’s shares in this company are secured in favour of third parties. The securities would only be enforced (ii)
in the event that Lincs Wind Farm Limited defaulted on any of their obligations under their respective finance arrangements. On 17 February 2017, the Group sold its interest in Lincs Wind Farm Limited. See note 12(c) for further details. (iii)
(b) Reconciliation of share of results of joint ventures and associates to share of adjusted results of joint ventures and associates
Year ended 31 December
Joint ventures Wind farms
£m
Associates Nuclear
£m
2016 Total
£m
2015 Total £m
Share of post-taxation results of joint ventures and associates (11) 113 102 187 Certain re-measurements (net of taxation) – 28 28 13 Interest paid 27 5 32 53 Taxation (excluding taxation on certain re-measurements) (4) 20 16 8 Share of adjusted results of joint ventures and associates 12 166 178 261
Further information on the Group’s investments in joint ventures and associates is provided in notes 14 and S10.
Centrica plc Annual Report and Accounts 2016 125
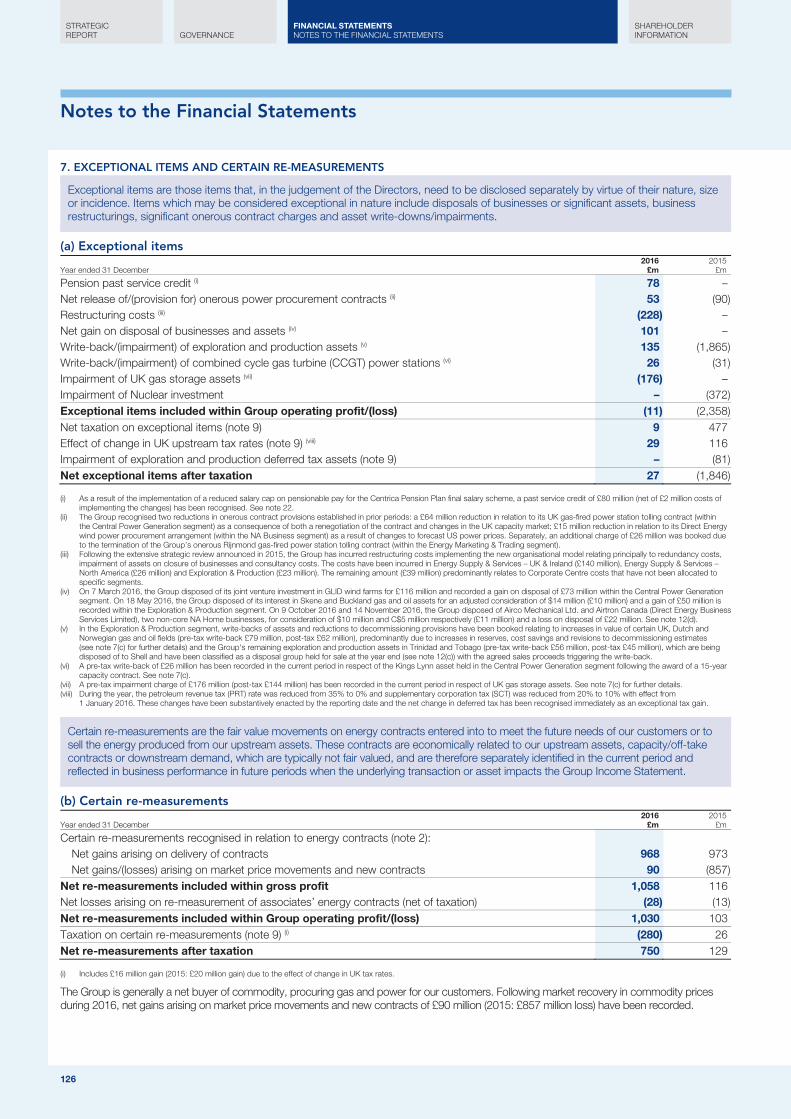
Notes to the Financial Statements
126
7. EXCEPTIONAL ITEMS AND CERTAIN RE-MEASUREMENTS
Exceptional items are those items that, in the judgement of the Directors, need to be disclosed separately by virtue of their nature, size or incidence. Items which may be considered exceptional in nature include disposals of businesses or significant assets, business restructurings, significant onerous contract charges and asset write-downs/impairments.
(a) Exceptional items
Year ended 31 December 2016
£m 2015
£m
Pension past service credit (i) 78 – Net release of/(provision for) onerous power procurement contracts (ii) 53 (90) Restructuring costs (iii) (228) – Net gain on disposal of businesses and assets (iv) 101 – Write-back/(impairment) of exploration and production assets (v) 135 (1,865) Write-back/(impairment) of combined cycle gas turbine (CCGT) power stations (vi) 26 (31) Impairment of UK gas storage assets (vii) (176) – Impairment of Nuclear investment – (372) Exceptional items included within Group operating profit/(loss) (11) (2,358) Net taxation on exceptional items (note 9) 9 477 Effect of change in UK upstream tax rates (note 9) (viii) 29 116 Impairment of exploration and production deferred tax assets (note 9) – (81) Net exceptional items after taxation 27 (1,846)
As a result of the implementation of a reduced salary cap on pensionable pay for the Centrica Pension Plan final salary scheme, a past service credit of £80 million (net of £2 million costs of (i)implementing the changes) has been recognised. See note 22.
The Group recognised two reductions in onerous contract provisions established in prior periods: a £64 million reduction in relation to its UK gas-fired power station tolling contract (within (ii)the Central Power Generation segment) as a consequence of both a renegotiation of the contract and changes in the UK capacity market; £15 million reduction in relation to its Direct Energy wind power procurement arrangement (within the NA Business segment) as a result of changes to forecast US power prices. Separately, an additional charge of £26 million was booked due to the termination of the Group’s onerous Rijnmond gas-fired power station tolling contract (within the Energy Marketing & Trading segment).
Following the extensive strategic review announced in 2015, the Group has incurred restructuring costs implementing the new organisational model relating principally to redundancy costs, (iii)impairment of assets on closure of businesses and consultancy costs. The costs have been incurred in Energy Supply & Services – UK & Ireland (£140 million), Energy Supply & Services – North America (£26 million) and Exploration & Production (£23 million). The remaining amount (£39 million) predominantly relates to Corporate Centre costs that have not been allocated to specific segments.
On 7 March 2016, the Group disposed of its joint venture investment in GLID wind farms for £116 million and recorded a gain on disposal of £73 million within the Central Power Generation (iv)segment. On 18 May 2016, the Group disposed of its interest in Skene and Buckland gas and oil assets for an adjusted consideration of $14 million (£10 million) and a gain of £50 million is recorded within the Exploration & Production segment. On 9 October 2016 and 14 November 2016, the Group disposed of Airco Mechanical Ltd. and Airtron Canada (Direct Energy Business Services Limited), two non-core NA Home businesses, for consideration of $10 million and C$5 million respectively (£11 million) and a loss on disposal of £22 million. See note 12(d).
In the Exploration & Production segment, write-backs of assets and reductions to decommissioning provisions have been booked relating to increases in value of certain UK, Dutch and (v)Norwegian gas and oil fields (pre-tax write-back £79 million, post-tax £62 million), predominantly due to increases in reserves, cost savings and revisions to decommissioning estimates (see note 7(c) for further details) and the Group's remaining exploration and production assets in Trinidad and Tobago (pre-tax write-back £56 million, post-tax £45 million), which are being disposed of to Shell and have been classified as a disposal group held for sale at the year end (see note 12(c)) with the agreed sales proceeds triggering the write-back.
A pre-tax write-back of £26 million has been recorded in the current period in respect of the Kings Lynn asset held in the Central Power Generation segment following the award of a 15-year (vi)capacity contract. See note 7(c).
A pre-tax impairment charge of £176 million (post-tax £144 million) has been recorded in the current period in respect of UK gas storage assets. See note 7(c) for further details. (vii) During the year, the petroleum revenue tax (PRT) rate was reduced from 35% to 0% and supplementary corporation tax (SCT) was reduced from 20% to 10% with effect from (viii)
1 January 2016. These changes have been substantively enacted by the reporting date and the net change in deferred tax has been recognised immediately as an exceptional tax gain.
Certain re-measurements are the fair value movements on energy contracts entered into to meet the future needs of our customers or to sell the energy produced from our upstream assets. These contracts are economically related to our upstream assets, capacity/off-take contracts or downstream demand, which are typically not fair valued, and are therefore separately identified in the current period and reflected in business performance in future periods when the underlying transaction or asset impacts the Group Income Statement.
(b) Certain re-measurements
Year ended 31 December 2016
£m 2015
£m
Certain re-measurements recognised in relation to energy contracts (note 2): Net gains arising on delivery of contracts 968 973 Net gains/(losses) arising on market price movements and new contracts 90 (857)
Net re-measurements included within gross profit 1,058 116 Net losses arising on re-measurement of associates’ energy contracts (net of taxation) (28) (13) Net re-measurements included within Group operating profit/(loss) 1,030 103 Taxation on certain re-measurements (note 9) (i) (280) 26 Net re-measurements after taxation 750 129
Includes £16 million gain (2015: £20 million gain) due to the effect of change in UK tax rates. (i)
The Group is generally a net buyer of commodity, procuring gas and power for our customers. Following market recovery in commodity prices during 2016, net gains arising on market price movements and new contracts of £90 million (2015: £857 million loss) have been recorded.
126
STRATEGIC REPORT GOVERNANCE
SHAREHOLDER INFORMATION
FINANCIAL STATEMENTS NOTES TO THE FINANCIAL STATEMENTS

Notes to the Financial Statements
Centrica plc Annual Report and Accounts 2016 127
7. EXCEPTIONAL ITEMS AND CERTAIN RE-MEASUREMENTS (c) Impairment accounting policy, process and sensitivities The Group tests the carrying amounts of goodwill, PP&E and intangible assets (with the exception of exploration assets – see note S2) for impairment annually, or more frequently if events or changes in circumstances indicate that the recoverable amounts may be lower than their carrying amounts. Interests in joint ventures and associates and exploration assets are reviewed annually for indicators of impairment and tested for impairment where such an indicator arises. Where an asset does not generate cash flows that are independent from other assets, the Group estimates the recoverable amount of the CGU to which the asset belongs. The recoverable amount is the higher of value in use (VIU) and fair value less costs of disposal (FVLCD).
At inception, goodwill is allocated to each of the Group’s CGUs or groups of CGUs that expect to benefit from the business combination in which the goodwill arose. If the recoverable amount of an asset (or CGU) is estimated to be less than its carrying amount, the carrying amount of the asset (or CGU) is reduced to its recoverable amount. Any impairment is expensed immediately in the Group Income Statement. Any CGU impairment loss is allocated first to reduce the carrying amount of any goodwill allocated to the CGU and then to the other assets of the unit pro rata on the basis of the carrying amount of each asset in the unit.
VIU calculations have been used to determine recoverable amounts for all CGUs that include goodwill and indefinite-lived intangible asset balances with the exception of the impairment tests for the Exploration & Production gas and oil CGUs, where FVLCD has been used. This methodology is deemed to be more appropriate for these CGUs as it is based on the post-tax cash flows arising from the underlying assets and is consistent with the approach taken by management to evaluate the economic value of the underlying assets. Subsequently, the specific, underlying Exploration & Production gas and oil PP&E assets and, in addition, the Group’s associate investment in Nuclear and the Storage PP&E assets have also used the FVLCD impairment methodology. UK power generation assets have used the VIU impairment methodology. Further details of the approach and assumptions used in the VIU calculations are provided in note S2.
FVLCD discount rate and cash flow assumptions Exploration & Production – gas and oil production A write-back of £135 million (2015: impairment £1,865 million) has been recorded within exceptional items for exploration and production assets including £16 million of reductions to decommissioning provisions. For those assets subject to the impairment write-back, the associated recoverable amounts (net of decommissioning costs) of £756 million are categorised within Level 3 of the fair value hierarchy. FVLCD is determined by discounting the post-tax cash flows expected to be generated by the gas and oil production and development assets, net of associated selling costs, taking into account those assumptions that market participants would use in estimating fair value. Post-tax cash flows are derived from projected production profiles of each field, taking into account forward prices for gas and liquids over the relevant period. Where forward market prices are not available (that is outside the active period for each commodity), prices are determined based on internal model inputs. Note S6 provides additional detail on the active period of each of the commodity markets in which the Group operates. The date of cessation of production depends on the interaction of a number of variables, such as the recoverable quantities of hydrocarbons, production costs, the contractual duration of the licence area and the selling price of the gas and liquids produced. As each field has specific reservoir characteristics and economic circumstances, the post-tax cash flows for each field are computed using individual economic models. Post-tax cash flows used in the FVLCD calculation for the first five years are based on the Group’s Board-approved business plans and, thereafter, are based on long-term production and cash flow forecasts, which management believes reflects the assumptions of a market participant.
The future post-tax cash flows are discounted using a post-tax nominal discount rate of 9% (2015: 9%) to determine the FVLCD. The discount rate and inflation rate used in the FVLCD calculation are determined in the same manner as the rates used in the VIU calculations described in note S2, with the exception of the adjustment required to determine an equivalent pre-tax discount rate.
The valuation of Exploration & Production goodwill is particularly sensitive to the price assumptions made in the impairment calculations. To illustrate this, the price assumptions for gas and oil have been varied by +/–10%. Changes in price generate different production profiles and in some cases the date that an asset ceases production. This has been considered in the sensitivity analysis. Otherwise, all other operating costs, life of field capital expenditure and abandonment expenditure assumptions remain unchanged. For exploration and production assets, an increase in gas and oil prices of 10% would potentially reverse £89 million (2015: £327 million) of previous post-tax impairment charges of the underlying exploration and production assets. A reduction of 10% would potentially give rise to further post-tax impairments of the underlying exploration and production assets of £166 million (2015: £245 million) but no further post-tax impairment of goodwill (2015: £238 million) due to headroom arising in the year. The Canada and Trinidad and Tobago exploration and production assets are the subject of disposal processes and therefore have been excluded from the current year sensitivities. In the case of the Canadian E&P assets, the outcome of the disposal process could result in a range of possible outcomes, including the disposal of the entire Canadian E&P business (either to a sole buyer or multiple buyers), or of the assets being retained. The recoverable amount of the Canadian assets is therefore subject to uncertainty. In determining an appropriate recoverable amount the external bids have been considered together with discounted post-tax cash flows expected to be generated by the assets over their lives. This assessment supports the asset carrying values and accordingly no impairment has been booked. The net assets within the CQ Energy Canada Partnership are included in note S10. A 10% increase/decrease in gas and oil prices would increase/decrease the recoverable amounts of these net assets by £207 million/£208 million respectively. Commodity prices and the outcome of the current disposal process are the main determinants in the value of these assets.
Centrica plc Annual Report and Accounts 2016 127
Notes to the Financial Statements
128
7. EXCEPTIONAL ITEMS AND CERTAIN RE-MEASUREMENTS
Central Power Generation – Nuclear No impairment charge has been recorded (2015: £372 million) for the Group’s associate investment in Nuclear. FVLCD is determined by discounting the post-tax cash flows expected to be generated by the investment, net of associated selling costs, taking into account those assumptions that market participants would use in estimating fair value. Post-tax cash flows are derived from projected production profiles of the underlying nuclear power stations, planned and unplanned outage assumptions, operating cost assumptions and forward prices for power and forecast capacity market auction prices. Where forward market prices are not available (that is outside the active period for each commodity), prices are determined based on internal model inputs. Note S6 provides additional detail of the active period of each of the commodity markets in which the Group operates. Post-tax cash flows used in the FVLCD calculations for the first five years are based on the Group’s Board-approved business plans and thereafter are based on long-term production and cash flow forecasts.
The future post-tax cash flows are discounted using a post-tax nominal discount rate of 8% (2015: 8%) to determine the FVLCD. The discount rate and inflation rate used in the FVLCD calculation are determined in the same manner as the rates used in the VIU calculations described in note S2, with the exception of the adjustment required to determine an equivalent pre-tax discount rate.
The valuation of the Group’s investment in Nuclear, which is categorised within Level 3 of the fair value hierarchy, is particularly sensitive to assumptions/variations in the power price. To illustrate this, sensitivities were performed at the year end to vary the power price assumptions in the Group’s internal valuation model by +/–10%. An increase in power prices of 10%, assuming all other assumptions remain constant, would result in a reversal of previous impairments of £444 million (2015: £453 million). A reduction of 10% would give rise to a further impairment charge of £461 million (2015: £436 million).
Storage The recoverable amount of the Group’s operational storage facilities is calculated on a FVLCD basis by discounting the post-tax cash flows expected to be generated by the assets. Such estimates are based on predictions of seasonal gas price spreads, shorter-term price volatilities and the value from extracting cushion gas at the end of the field life less any related capital and operating expenditure that a typical market participant might use to assess value. Where forward market prices are not available (that is outside the active period for each commodity), prices are determined based on internal model inputs. Note S6 provides additional detail on the active period of each of the commodity markets in which the Group operates. The future post-tax cash flows are discounted using a post-tax nominal discount rate of 7.5% (2015: 7.5%) to determine FVLCD. For further details of the calculation of the discount rate and inflation rates used, see note S2.
A pre-tax impairment charge of £176 million (post-tax £144 million) has been recorded within exceptional items in the current period. This has resulted from the decision to decommission the 8A platform and from updated assumptions on asset availability in the near-term and future asset expenditure.
The impairment test remains particularly sensitive to assumptions/variations in seasonal gas price spreads and to the resolution of the limitation of the maximum operating pressure of the storage asset. To illustrate the impact of price on the impairment analysis, sensitivities were performed to vary the gas spreads by +/-10%. An increase in gas spreads of 10%, assuming all other assumptions remain constant, would lead to a potential post-tax impairment write-back of £66 million. A reduction of 10% would give rise to a further post-tax impairment of £80 million.
The valuation of the recoverable amount of the operational storage facilities is categorised within Level 3 of the fair value hierarchy. A change in the assumptions of the timing and extent of the return to maximum operating pressure could also significantly impact the impairment calculation and could result in a further impairment in certain adverse scenarios. Furthermore, the Group is considering the strategic options open to Centrica Storage to determine its long term future. Following the impairment charge recorded in the period, the current value of the Group’s gas storage fixed assets is £417 million (£112 million, net of the decommissioning provision and deferred tax).
VIU discount rate and cash flow assumptions Central Power Generation – CCGT power stations An impairment write-back of £26 million has been recorded within exceptional items for the Kings Lynn power station following the award of a 15-year capacity contract. In 2015, a £31 million impairment charge was recognised in relation to the segment’s Spalding finance leased UK gas-fired power station.
The recoverable amount was determined using VIU calculations, with future cash flows discounted using a pre-tax nominal discount rate of 7.4% (2015: 7.4%). Cash inflows were based on forecast production profiles, forward prices for power, gas and carbon and forecast capacity market auction prices. Where forward market prices were not available (that is outside the active period for each commodity), prices were determined based on internal model inputs. Cash outflows for operating and capital expenditure were based, for the first five years, on the Group’s Board-approved business plans and thereafter are based on long-term production and cash flow forecasts.
The impairment write-back has been adjusted for depreciation that would have occurred had no impairment loss been recognised in prior years.
128
STRATEGIC REPORT GOVERNANCE
SHAREHOLDER INFORMATION
FINANCIAL STATEMENTS NOTES TO THE FINANCIAL STATEMENTS
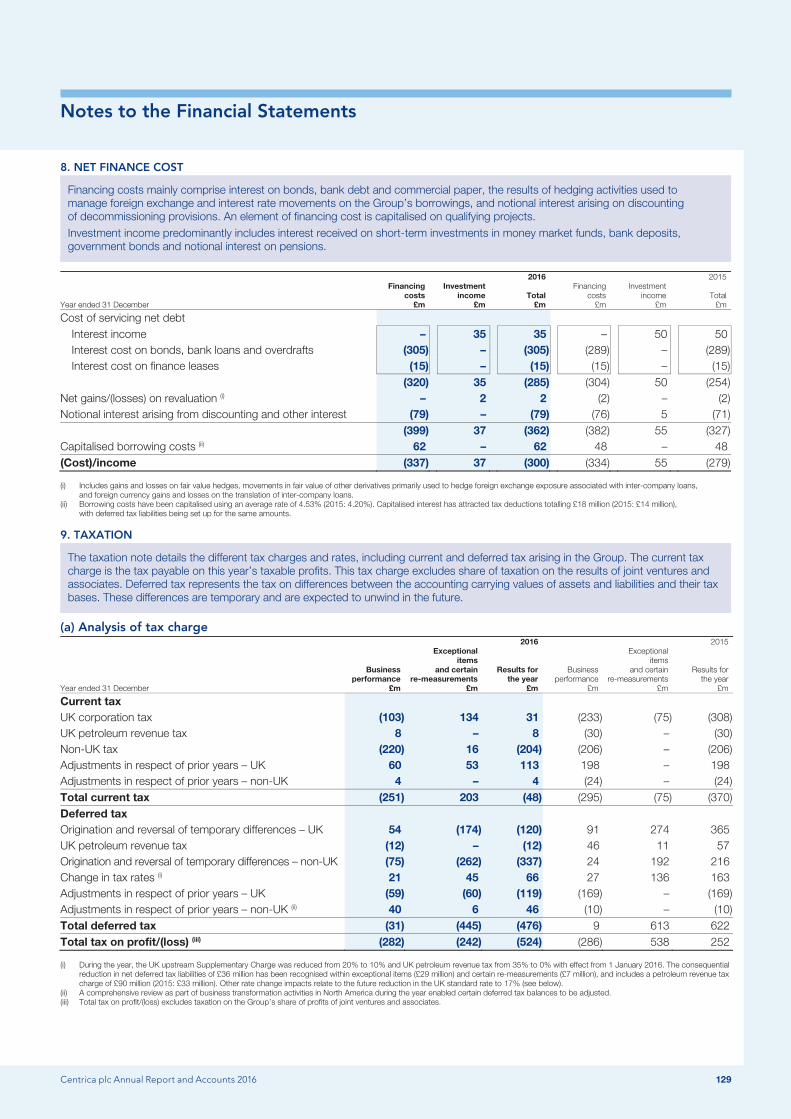
Notes to the Financial Statements
Centrica plc Annual Report and Accounts 2016 129
8. NET FINANCE COST
Financing costs mainly comprise interest on bonds, bank debt and commercial paper, the results of hedging activities used to manage foreign exchange and interest rate movements on the Group’s borrowings, and notional interest arising on discounting of decommissioning provisions. An element of financing cost is capitalised on qualifying projects. Investment income predominantly includes interest received on short-term investments in money market funds, bank deposits, government bonds and notional interest on pensions.
2016 2015
Year ended 31 December
Financing costs
£m
Investment income
£m Total
£m
Financing costs
£m
Investment income
£m Total
£m
Cost of servicing net debt Interest income – 35 35 – 50 50 Interest cost on bonds, bank loans and overdrafts (305) – (305) (289) – (289) Interest cost on finance leases (15) – (15) (15) – (15)
(320) 35 (285) (304) 50 (254) Net gains/(losses) on revaluation (i) – 2 2 (2) – (2) Notional interest arising from discounting and other interest (79) – (79) (76) 5 (71) (399) 37 (362) (382) 55 (327) Capitalised borrowing costs (ii) 62 – 62 48 – 48 (Cost)/income (337) 37 (300) (334) 55 (279)
Includes gains and losses on fair value hedges, movements in fair value of other derivatives primarily used to hedge foreign exchange exposure associated with inter-company loans, (i)and foreign currency gains and losses on the translation of inter-company loans.
Borrowing costs have been capitalised using an average rate of 4.53% (2015: 4.20%). Capitalised interest has attracted tax deductions totalling £18 million (2015: £14 million), (ii)with deferred tax liabilities being set up for the same amounts.
9. TAXATION
The taxation note details the different tax charges and rates, including current and deferred tax arising in the Group. The current tax charge is the tax payable on this year’s taxable profits. This tax charge excludes share of taxation on the results of joint ventures and associates. Deferred tax represents the tax on differences between the accounting carrying values of assets and liabilities and their tax bases. These differences are temporary and are expected to unwind in the future.
(a) Analysis of tax charge 2016 2015
Year ended 31 December
Business performance
£m
Exceptional items
and certain re-measurements
£m
Results for the year
£m
Business performance
£m
Exceptional items
and certain re-measurements
£m
Results for the year
£m
Current tax UK corporation tax (103) 134 31 (233) (75) (308) UK petroleum revenue tax 8 – 8 (30) – (30) Non-UK tax (220) 16 (204) (206) – (206) Adjustments in respect of prior years – UK 60 53 113 198 – 198 Adjustments in respect of prior years – non-UK 4 – 4 (24) – (24) Total current tax (251) 203 (48) (295) (75) (370) Deferred tax Origination and reversal of temporary differences – UK 54 (174) (120) 91 274 365 UK petroleum revenue tax (12) – (12) 46 11 57 Origination and reversal of temporary differences – non-UK (75) (262) (337) 24 192 216 Change in tax rates (i) 21 45 66 27 136 163 Adjustments in respect of prior years – UK (59) (60) (119) (169) – (169) Adjustments in respect of prior years – non-UK (ii) 40 6 46 (10) – (10) Total deferred tax (31) (445) (476) 9 613 622 Total tax on profit/(loss) (iii) (282) (242) (524) (286) 538 252
During the year, the UK upstream Supplementary Charge was reduced from 20% to 10% and UK petroleum revenue tax from 35% to 0% with effect from 1 January 2016. The consequential (i)reduction in net deferred tax liabilities of £36 million has been recognised within exceptional items (£29 million) and certain re-measurements (£7 million), and includes a petroleum revenue tax charge of £90 million (2015: £33 million). Other rate change impacts relate to the future reduction in the UK standard rate to 17% (see below).
A comprehensive review as part of business transformation activities in North America during the year enabled certain deferred tax balances to be adjusted. (ii) Total tax on profit/(loss) excludes taxation on the Group’s share of profits of joint ventures and associates. (iii)
Centrica plc Annual Report and Accounts 2016 129
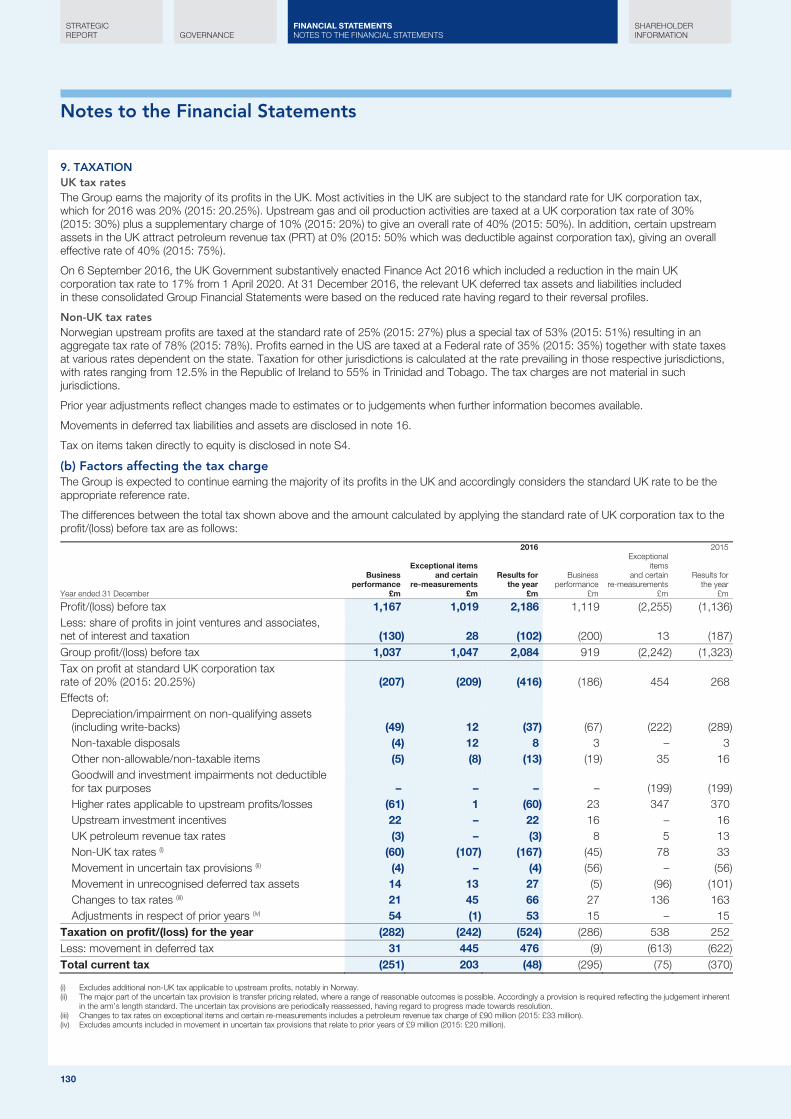
Notes to the Financial Statements
130
9. TAXATION UK tax rates The Group earns the majority of its profits in the UK. Most activities in the UK are subject to the standard rate for UK corporation tax, which for 2016 was 20% (2015: 20.25%). Upstream gas and oil production activities are taxed at a UK corporation tax rate of 30% (2015: 30%) plus a supplementary charge of 10% (2015: 20%) to give an overall rate of 40% (2015: 50%). In addition, certain upstream assets in the UK attract petroleum revenue tax (PRT) at 0% (2015: 50% which was deductible against corporation tax), giving an overall effective rate of 40% (2015: 75%).
On 6 September 2016, the UK Government substantively enacted Finance Act 2016 which included a reduction in the main UK corporation tax rate to 17% from 1 April 2020. At 31 December 2016, the relevant UK deferred tax assets and liabilities included in these consolidated Group Financial Statements were based on the reduced rate having regard to their reversal profiles.
Non-UK tax rates Norwegian upstream profits are taxed at the standard rate of 25% (2015: 27%) plus a special tax of 53% (2015: 51%) resulting in an aggregate tax rate of 78% (2015: 78%). Profits earned in the US are taxed at a Federal rate of 35% (2015: 35%) together with state taxes at various rates dependent on the state. Taxation for other jurisdictions is calculated at the rate prevailing in those respective jurisdictions, with rates ranging from 12.5% in the Republic of Ireland to 55% in Trinidad and Tobago. The tax charges are not material in such jurisdictions.
Prior year adjustments reflect changes made to estimates or to judgements when further information becomes available.
Movements in deferred tax liabilities and assets are disclosed in note 16.
Tax on items taken directly to equity is disclosed in note S4.
(b) Factors affecting the tax charge The Group is expected to continue earning the majority of its profits in the UK and accordingly considers the standard UK rate to be the appropriate reference rate.
The differences between the total tax shown above and the amount calculated by applying the standard rate of UK corporation tax to the profit/(loss) before tax are as follows:
2016 2015
Year ended 31 December
Business performance
£m
Exceptional items and certain
re-measurements £m
Results for the year
£m
Business performance
£m
Exceptional items
and certain re-measurements
£m
Results for the year
£m
Profit/(loss) before tax 1,167 1,019 2,186 1,119 (2,255) (1,136) Less: share of profits in joint ventures and associates, net of interest and taxation (130) 28 (102) (200) 13 (187) Group profit/(loss) before tax 1,037 1,047 2,084 919 (2,242) (1,323) Tax on profit at standard UK corporation tax rate of 20% (2015: 20.25%) (207) (209) (416) (186) 454 268 Effects of:
Depreciation/impairment on non-qualifying assets (including write-backs) (49) 12 (37) (67) (222) (289) Non-taxable disposals (4) 12 8 3 – 3 Other non-allowable/non-taxable items (5) (8) (13) (19) 35 16 Goodwill and investment impairments not deductible for tax purposes – – – – (199) (199) Higher rates applicable to upstream profits/losses (61) 1 (60) 23 347 370 Upstream investment incentives 22 – 22 16 – 16 UK petroleum revenue tax rates (3) – (3) 8 5 13 Non-UK tax rates (i) (60) (107) (167) (45) 78 33 Movement in uncertain tax provisions (ii) (4) – (4) (56) – (56) Movement in unrecognised deferred tax assets 14 13 27 (5) (96) (101) Changes to tax rates (iii) 21 45 66 27 136 163 Adjustments in respect of prior years (iv) 54 (1) 53 15 – 15
Taxation on profit/(loss) for the year (282) (242) (524) (286) 538 252 Less: movement in deferred tax 31 445 476 (9) (613) (622) Total current tax (251) 203 (48) (295) (75) (370)
Excludes additional non-UK tax applicable to upstream profits, notably in Norway. (i) The major part of the uncertain tax provision is transfer pricing related, where a range of reasonable outcomes is possible. Accordingly a provision is required reflecting the judgement inherent (ii)
in the arm’s length standard. The uncertain tax provisions are periodically reassessed, having regard to progress made towards resolution. Changes to tax rates on exceptional items and certain re-measurements includes a petroleum revenue tax charge of £90 million (2015: £33 million). (iii) Excludes amounts included in movement in uncertain tax provisions that relate to prior years of £9 million (2015: £20 million). (iv)
130
STRATEGIC REPORT GOVERNANCE
SHAREHOLDER INFORMATION
FINANCIAL STATEMENTS NOTES TO THE FINANCIAL STATEMENTS

Notes to the Financial Statements
Centrica plc Annual Report and Accounts 2016 131
9. TAXATION (c) Factors that may affect future tax charges The Group’s effective tax rates are impacted by changes to the mix of activities and production across the territories in which it operates. Effective tax rates may also fluctuate where profits and losses cannot be offset for tax purposes, such as in the UK where there is generally no offset between upstream gas and oil and downstream results. Losses realised in one territory cannot be offset against profits in another.
The Group’s UK profits earned away from gas and oil production will benefit from reduced rates of corporation tax in 2017 and beyond (19% from 1 April 2017 and 17% from 1 April 2020).
Profits from gas and oil production in the UK continue to be taxed at rates above the UK statutory rate (40% verses 20%). PRT is now set at 0% but may still give rise to historic refunds from the carry-back of excess reliefs (for example, from decommissioning).
Income earned in territories outside the UK, notably in the US and Norway, is generally subject to higher effective rates of tax than the current UK statutory rate.
Globally, tax reform has significant potential to change tax charges, particularly in relation to the OECD’s Base Erosion and Profit Shifting (‘BEPS’) project, which has widespread support. Based on current proposals, the Group does not expect its tax position to be impacted materially.
Local tax laws and rates are subject to change, which may have a significant impact on the Group’s future tax charges. In particular, the US presidential election may lead to substantial tax reforms.
In the medium term, the Group’s effective tax rate is expected to remain above the UK statutory rate, reflecting a continued upward trend in profits earned outside the UK.
(d) Relationship between current tax charge and taxes paid
Year ended 31 December UK £m
Non-UK £m
2016 £m
UK £m
Non-UK £m
2015 £m
Current tax charge: Corporation tax (144) 200 56 110 230 340 Petroleum revenue tax (8) – (8) 30 – 30
(152) 200 48 140 230 370 Taxes paid:
Corporation tax 89 129 218 130 228 358 Petroleum revenue tax (12) – (12) (9) – (9)
77 129 206 121 228 349
Differences between current tax charged and taxes paid arose principally due to the following factors:
● Corporation tax payments are generally made by instalment, based on estimated taxable profits, or the prior period’s profits. Payments are made on account and the final liability is settled as the tax return is filed. Fluctuations in profits from year to year, one-off items and mark-to-market movements within the year may therefore give rise to divergence between the charge for the year and the taxes paid. Early payments on account can result in overpayments for a given year. These are included as tax assets, to be refunded in a subsequent period; and
● PRT payments were based on income realised in the preceding period, with subsequent adjustments to reflect actual profits. Following the reduction in the PRT rate to 0% from 1 January 2016, PRT tax cash is expected to reflect refunds, but on a less predictable basis.
Centrica plc Annual Report and Accounts 2016 131

Notes to the Financial Statements
132
10. EARNINGS PER ORDINARY SHARE
Earnings per share (EPS) is the amount of profit or loss attributable to each share. Basic EPS is the amount of profit or loss for the year divided by the weighted average number of shares in issue during the year. Diluted EPS includes the impact of outstanding share options.
Basic profit per ordinary share has been calculated by dividing the profit attributable to equity holders of the Company for the year of £1,672 million (2015: £747 million loss) by the weighted average number of ordinary shares in issue during the year of 5,318 million (2015: 5,011 million). The number of shares excludes 61 million ordinary shares (2015: 72 million), being the weighted average number of the Company’s own shares held in the employee share trust and treasury shares purchased by the Group as part of the share repurchase programme.
The Directors believe that the presentation of adjusted basic earnings per ordinary share, being the basic earnings per ordinary share adjusted for certain re-measurements and exceptional items assists with understanding the underlying performance of the Group, as explained in note 2.
In May 2016, 350 million new ordinary shares were issued at 200.0 pence per share which represented approximately 7% of the issued ordinary share capital prior to the placing.
In addition to basic and adjusted basic earnings per ordinary share, information is presented for diluted and adjusted diluted earnings per ordinary share. Under this presentation, no adjustments are made to the reported profit/(loss) for either 2016 or 2015, however, the weighted average number of shares used as the denominator is adjusted for potentially dilutive ordinary shares.
Weighted average number of shares
Year ended 31 December
2016 Million shares
2015 Million shares
Weighted average number of shares – basic 5,318 5,011 Dilutive impact of share-based payment schemes (i) 43 38 Weighted average number of shares – diluted 5,361 5,049
The dilutive impact of share-based payment schemes is included in the calculation of diluted EPS, unless it has the effect of increasing the profit or decreasing the loss attributable to each (i)share. Therefore, these shares are excluded from the calculation of basic diluted EPS in 2015.
Basic to adjusted basic earnings per share reconciliation 2016 2015
Year ended 31 December £m Pence per
ordinary share £m Pence per
ordinary share
Profit/(loss) – basic 1,672 31.4 (747) (14.9) Net exceptional items after taxation (notes 2 and 7) (i) (27) (0.5) 1,739 34.7 Certain re-measurement gains after taxation (notes 2 and 7) (750) (14.1) (129) (2.6) Earnings – adjusted basic (i) 895 16.8 863 17.2
Profit/(loss) – diluted 1,672 31.2 (747) (14.9)
Earnings – adjusted diluted (i) 895 16.7 863 17.1
Net exceptional profit after taxation of £27 million (2015: £1,846 million loss) is reduced by nil (2015: £107 million) for the purpose of calculating adjusted basic and adjusted diluted EPS. (i)The adjustment reflects the share of net exceptional items attributable to non-controlling interests.
132
STRATEGIC REPORT GOVERNANCE
SHAREHOLDER INFORMATION
FINANCIAL STATEMENTS NOTES TO THE FINANCIAL STATEMENTS
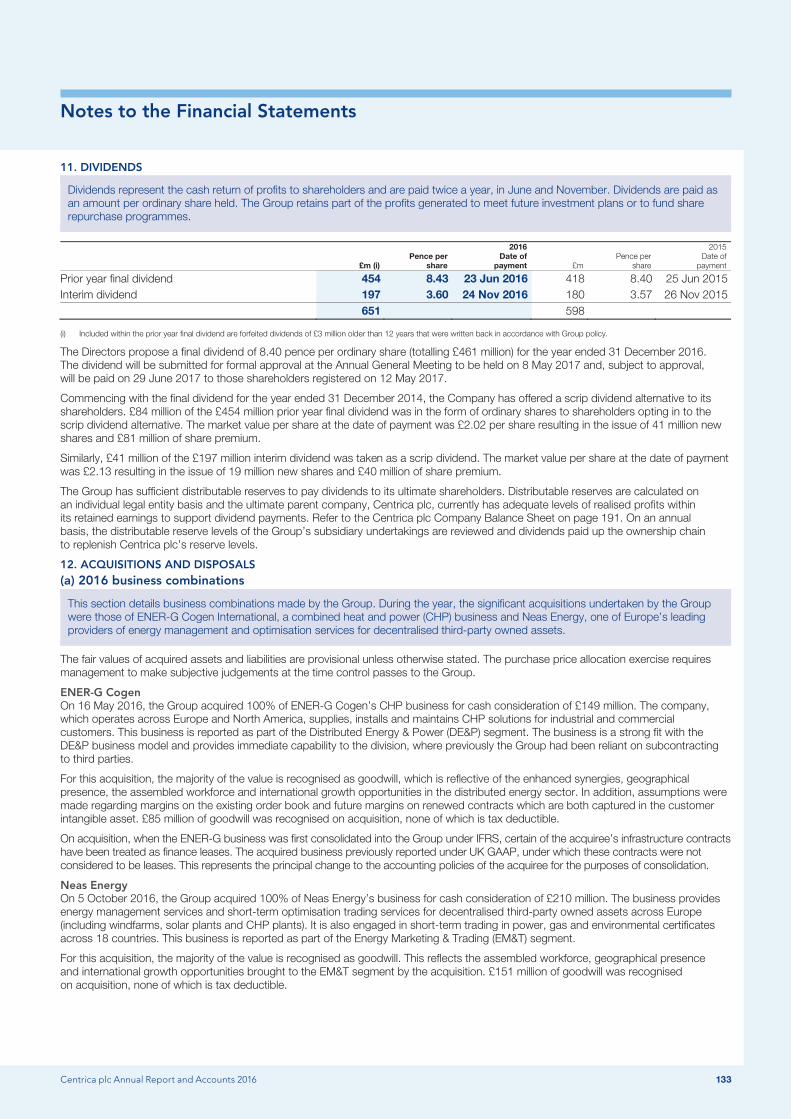
Notes to the Financial Statements
Centrica plc Annual Report and Accounts 2016 133
11. DIVIDENDS
Dividends represent the cash return of profits to shareholders and are paid twice a year, in June and November. Dividends are paid as an amount per ordinary share held. The Group retains part of the profits generated to meet future investment plans or to fund share repurchase programmes.
2016 2015
£m (i) Pence per
share Date of
payment £m Pence per
share Date of
payment
Prior year final dividend 454 8.43 23 Jun 2016 418 8.40 25 Jun 2015 Interim dividend 197 3.60 24 Nov 2016 180 3.57 26 Nov 2015 651 598
Included within the prior year final dividend are forfeited dividends of £3 million older than 12 years that were written back in accordance with Group policy. (i)
The Directors propose a final dividend of 8.40 pence per ordinary share (totalling £461 million) for the year ended 31 December 2016. The dividend will be submitted for formal approval at the Annual General Meeting to be held on 8 May 2017 and, subject to approval, will be paid on 29 June 2017 to those shareholders registered on 12 May 2017.
Commencing with the final dividend for the year ended 31 December 2014, the Company has offered a scrip dividend alternative to its shareholders. £84 million of the £454 million prior year final dividend was in the form of ordinary shares to shareholders opting in to the scrip dividend alternative. The market value per share at the date of payment was £2.02 per share resulting in the issue of 41 million new shares and £81 million of share premium.
Similarly, £41 million of the £197 million interim dividend was taken as a scrip dividend. The market value per share at the date of payment was £2.13 resulting in the issue of 19 million new shares and £40 million of share premium.
The Group has sufficient distributable reserves to pay dividends to its ultimate shareholders. Distributable reserves are calculated on an individual legal entity basis and the ultimate parent company, Centrica plc, currently has adequate levels of realised profits within its retained earnings to support dividend payments. Refer to the Centrica plc Company Balance Sheet on page 191. On an annual basis, the distributable reserve levels of the Group’s subsidiary undertakings are reviewed and dividends paid up the ownership chain to replenish Centrica plc’s reserve levels.
12. ACQUISITIONS AND DISPOSALS (a) 2016 business combinations
This section details business combinations made by the Group. During the year, the significant acquisitions undertaken by the Group were those of ENER-G Cogen International, a combined heat and power (CHP) business and Neas Energy, one of Europe’s leading providers of energy management and optimisation services for decentralised third-party owned assets.
The fair values of acquired assets and liabilities are provisional unless otherwise stated. The purchase price allocation exercise requires management to make subjective judgements at the time control passes to the Group.
ENER-G Cogen On 16 May 2016, the Group acquired 100% of ENER-G Cogen’s CHP business for cash consideration of £149 million. The company, which operates across Europe and North America, supplies, installs and maintains CHP solutions for industrial and commercial customers. This business is reported as part of the Distributed Energy & Power (DE&P) segment. The business is a strong fit with the DE&P business model and provides immediate capability to the division, where previously the Group had been reliant on subcontracting to third parties.
For this acquisition, the majority of the value is recognised as goodwill, which is reflective of the enhanced synergies, geographical presence, the assembled workforce and international growth opportunities in the distributed energy sector. In addition, assumptions were made regarding margins on the existing order book and future margins on renewed contracts which are both captured in the customer intangible asset. £85 million of goodwill was recognised on acquisition, none of which is tax deductible.
On acquisition, when the ENER-G business was first consolidated into the Group under IFRS, certain of the acquiree’s infrastructure contracts have been treated as finance leases. The acquired business previously reported under UK GAAP, under which these contracts were not considered to be leases. This represents the principal change to the accounting policies of the acquiree for the purposes of consolidation.
Neas Energy On 5 October 2016, the Group acquired 100% of Neas Energy’s business for cash consideration of £210 million. The business provides energy management services and short-term optimisation trading services for decentralised third-party owned assets across Europe (including windfarms, solar plants and CHP plants). It is also engaged in short-term trading in power, gas and environmental certificates across 18 countries. This business is reported as part of the Energy Marketing & Trading (EM&T) segment.
For this acquisition, the majority of the value is recognised as goodwill. This reflects the assembled workforce, geographical presence and international growth opportunities brought to the EM&T segment by the acquisition. £151 million of goodwill was recognised on acquisition, none of which is tax deductible.
Centrica plc Annual Report and Accounts 2016 133

Notes to the Financial Statements
134
12. ACQUISITIONS AND DISPOSALS Flowgem On 25 August 2016, the Group acquired 100% of Flowgem Limited for cash consideration of £13 million and contingent consideration with a fair value of £5 million. This UK-based business has developed an early stage technology to remotely detect water leaks, which enhances the Group’s connectivity offering in the UK and North America, adding new capabilities to the Hive product portfolio and complementing the Group’s home services offering. This business will be reported as part of the Connected Home segment. £13 million of goodwill was recognised on acquisition, none of which is tax deductible.
Other acquisitions in the period were immaterial and resulted in no goodwill being recognised.
Provisional fair value of the identifiable acquired assets and liabilities
ENER-G Cogen (i)
£m Neas Energy
£m Flowgem
£m
Total
£m
Balance Sheet items Intangible assets 30 45 5 80 Property, plant and equipment 28 1 – 29 Other non-current assets 15 1 – 16 Current assets (including £37 million of cash and cash equivalents) 43 168 1 212 Current liabilities (35) (149) (1) (185) Non-current liabilities (17) (7) – (24) Net identifiable assets 64 59 5 128 Goodwill 85 151 13 249 Net assets acquired 149 210 18 377 Consideration comprises:
Cash consideration 149 210 13 372 Contingent consideration (ii) – – 5 5
Total consideration 149 210 18 377 Income Statement items Revenue recognised since the acquisition date in the Group Income Statement (iii) 69 714 – 783 Profit/(loss) since the acquisition date in the Group Income Statement (iii) 2 13 (1) 14
Subsequent to the provisional fair values reported in the 2016 condensed interim Financial Statements, the fair values of ENER-G’s assets and liabilities have been updated in accordance (i)with the provisions of IFRS 3. In addition to other immaterial adjustments, a reclassification of £10 million between finance lease receivables and deferred revenue was made to reflect a revised allocation of future cash receipts between finance lease receivables and associated service contracts. The net impact of all opening balance sheet adjustments on goodwill is a £1 million reduction.
Contingent consideration is stated at fair value at the reporting date and is classified as other payables (Level 3 in terms of fair value hierarchy). Fair value is based on a set of key assumptions (ii)which take into consideration the probability of meeting sale volumes targets between 2017 and 2020. Future developments may require further revisions to the estimates. The maximum consideration to be paid to the vendor amounts to £17 million.
Revenue and profits/losses from business performance between the acquisition date and the balance sheet date, exclude exceptional items and certain re-measurements. (iii)
Acquisition-related costs have been charged to ‘operating costs before exceptional items’ in the Group Income Statement for an aggregated amount of £4 million.
Pro forma information The pro forma consolidated results of the Group, assuming the acquisitions had been made at the beginning of the year, would show revenue of £28,474 million (compared to reported revenue of £27,102 million) and profit after taxation before exceptional items and certain re-measurements of £886 million (compared to reported profit after taxation of £885 million). This pro forma information includes the revenue and profits/losses made by the acquired businesses between the beginning of the financial year and the date of the acquisition, without accounting policy alignments and/or the impact of the fair value uplifts resulting from purchase accounting considerations. This pro forma aggregated information is not necessarily indicative of the results of the combined Group that would have occurred had the acquisitions actually been made at the beginning of the year presented, or indicative of the future results of the combined Group.
134
STRATEGIC REPORT GOVERNANCE
SHAREHOLDER INFORMATION
FINANCIAL STATEMENTS NOTES TO THE FINANCIAL STATEMENTS

Notes to the Financial Statements
Centrica plc Annual Report and Accounts 2016 135
12. ACQUISITIONS AND DISPOSALS (b) 2015 business combinations – measurement period adjustments During the year, there have been no material updates to the fair value of assets and liabilities recognised for businesses acquired in 2015. Goodwill in respect of these acquisitions increased by £1 million.
(c) Assets and liabilities of disposal groups classified as held for sale
Assets and associated liabilities that are expected to be recovered principally through a sale have been classified as held for sale and are presented separately on the face of the Group Balance Sheet.
On 30 November 2016, the Group agreed to sell its entire portfolio of gas assets in Trinidad and Tobago to Shell Exploration and Production for initial consideration of $30 million (£24 million). The assets to be disposed of consist of a 17.3% interest in the producing NCMA-1 block and 80% and 90% operated interests respectively in the undeveloped blocks NCMA-4 and Block 22. In addition to the initial consideration, the Group will receive further consideration subject to Block 22 and NCMA-4 reaching agreed milestones. The transaction is subject to government and partners’ approval and is expected to close in the first half of 2017.
As detailed in note 7, prior to classification of these assets as held for sale, previously recognised impairments were reversed, giving rise to an exceptional pre-tax income statement credit of £56 million (£45 million post-tax).
These interests are currently shown in the Exploration & Production segment.
On 13 January 2017, as a consequence of the Group’s strategy to reduce its exposure on wind power generation assets, the Group agreed to sell its remaining 50% interest in Lincs Wind Farm Limited (‘Lincs’) for net proceeds of £224 million, of which £113 million relates to a shareholder loan. The counterparties to this transaction are UK Green Investment Bank plc and Green Investment Bank Offshore Wind Fund. The transaction completed on 17 February 2017. During the course of a 12-month transition period post-completion, Centrica will provide operations maintenance support to the buyers. The Group’s interest in Lincs is currently shown in the Central Power Generation segment.
Trinidad and Tobago gas assets
£m
Lincs Wind Farm
£m
Total
£m
Non-current assets (other than interests in joint ventures) 66 117 183 Interests in joint ventures – 55 55 Assets of disposal groups classified as held for sale 66 172 238 Non-current liabilities (42) – (42) Liabilities of disposal groups classified as held for sale (42) – (42) Net assets of disposal groups classified as held for sale 24 172 196
None of the above disposal groups are material enough to be shown as discontinued operations on the face of the Group Income Statement as they do not represent a separate major line of business or geographical area of operations.
Centrica plc Annual Report and Accounts 2016 135
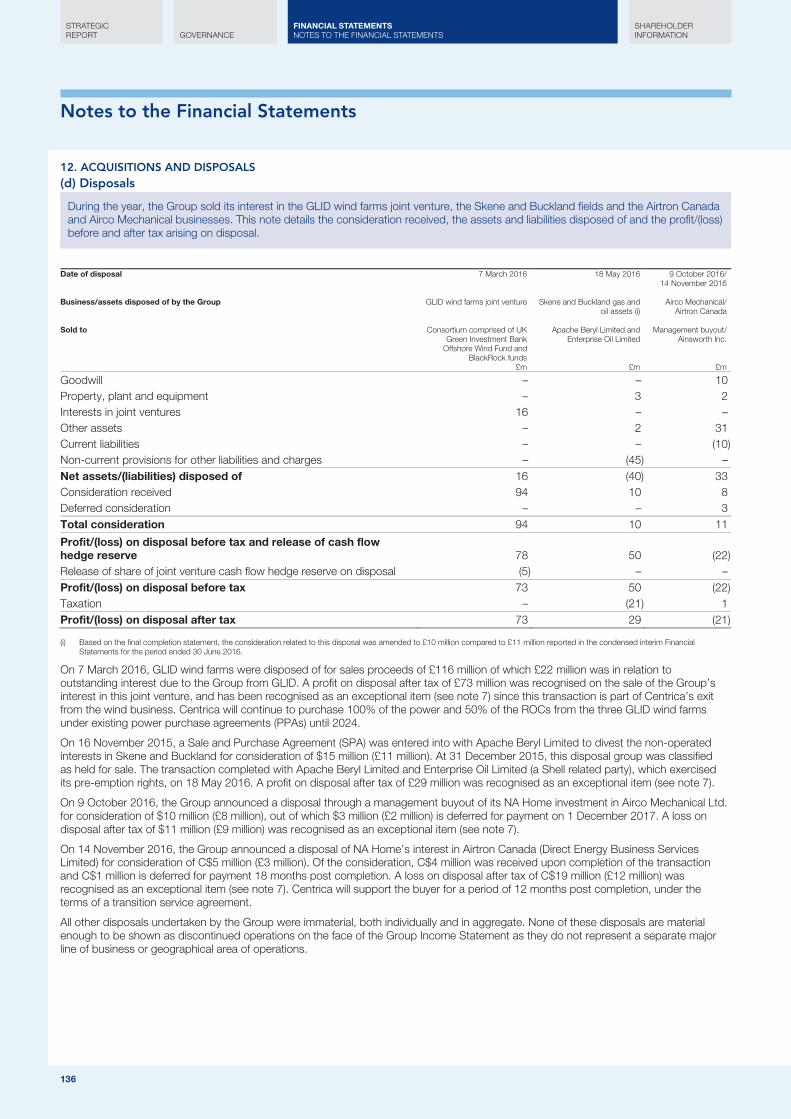
Notes to the Financial Statements
136
12. ACQUISITIONS AND DISPOSALS (d) Disposals
During the year, the Group sold its interest in the GLID wind farms joint venture, the Skene and Buckland fields and the Airtron Canada and Airco Mechanical businesses. This note details the consideration received, the assets and liabilities disposed of and the profit/(loss) before and after tax arising on disposal.
Date of disposal
7 March 2016
18 May 2016 9 October 2016/ 14 November 2016
Business/assets disposed of by the Group
GLID wind farms joint venture
Skene and Buckland gas and oil assets (i)
Airco Mechanical/ Airtron Canada
Sold to
Consortium comprised of UK
Green Investment Bank Offshore Wind Fund and
BlackRock funds
Apache Beryl Limited and Enterprise Oil Limited
Management buyout/ Ainsworth Inc.
£m £m £m
Goodwill – – 10 Property, plant and equipment – 3 2 Interests in joint ventures 16 – – Other assets – 2 31 Current liabilities – – (10) Non-current provisions for other liabilities and charges – (45) – Net assets/(liabilities) disposed of 16 (40) 33 Consideration received 94 10 8 Deferred consideration – – 3 Total consideration 94 10 11
Profit/(loss) on disposal before tax and release of cash flow hedge reserve 78
50 (22)
Release of share of joint venture cash flow hedge reserve on disposal (5) – – Profit/(loss) on disposal before tax 73 50 (22) Taxation – (21) 1 Profit/(loss) on disposal after tax 73 29 (21)
Based on the final completion statement, the consideration related to this disposal was amended to £10 million compared to £11 million reported in the condensed interim Financial (i)Statements for the period ended 30 June 2016.
On 7 March 2016, GLID wind farms were disposed of for sales proceeds of £116 million of which £22 million was in relation to outstanding interest due to the Group from GLID. A profit on disposal after tax of £73 million was recognised on the sale of the Group’s interest in this joint venture, and has been recognised as an exceptional item (see note 7) since this transaction is part of Centrica’s exit from the wind business. Centrica will continue to purchase 100% of the power and 50% of the ROCs from the three GLID wind farms under existing power purchase agreements (PPAs) until 2024.
On 16 November 2015, a Sale and Purchase Agreement (SPA) was entered into with Apache Beryl Limited to divest the non-operated interests in Skene and Buckland for consideration of $15 million (£11 million). At 31 December 2015, this disposal group was classified as held for sale. The transaction completed with Apache Beryl Limited and Enterprise Oil Limited (a Shell related party), which exercised its pre-emption rights, on 18 May 2016. A profit on disposal after tax of £29 million was recognised as an exceptional item (see note 7).
On 9 October 2016, the Group announced a disposal through a management buyout of its NA Home investment in Airco Mechanical Ltd. for consideration of $10 million (£8 million), out of which $3 million (£2 million) is deferred for payment on 1 December 2017. A loss on disposal after tax of $11 million (£9 million) was recognised as an exceptional item (see note 7).
On 14 November 2016, the Group announced a disposal of NA Home’s interest in Airtron Canada (Direct Energy Business Services Limited) for consideration of C$5 million (£3 million). Of the consideration, C$4 million was received upon completion of the transaction and C$1 million is deferred for payment 18 months post completion. A loss on disposal after tax of C$19 million (£12 million) was recognised as an exceptional item (see note 7). Centrica will support the buyer for a period of 12 months post completion, under the terms of a transition service agreement.
All other disposals undertaken by the Group were immaterial, both individually and in aggregate. None of these disposals are material enough to be shown as discontinued operations on the face of the Group Income Statement as they do not represent a separate major line of business or geographical area of operations.
136
STRATEGIC REPORT GOVERNANCE
SHAREHOLDER INFORMATION
FINANCIAL STATEMENTS NOTES TO THE FINANCIAL STATEMENTS

Notes to the Financial Statements
Centrica plc Annual Report and Accounts 2016 137
13. PROPERTY, PLANT AND EQUIPMENT
PP&E includes significant investment in power stations, gas production and gas storage assets. Once operational, all assets are depreciated over their useful economic lives.
(a) Carrying amounts 2016 2015
Land and buildings
£m
Plant, equipment
and vehicles £m
Power generation
£m
Gas production
and storage £m
Total £m
Land and buildings
£m
Plant, equipment
and vehicles £m
Power generation
£m
Gas production
and storage £m
Total £m
Cost 1 January 30 602 2,070 14,944 17,646 29 633 2,061 15,158 17,881 Additions and capitalised borrowing costs (note 4(e)) – 90 23 561 674 1 115 12 642 770 Acquisitions – 1 28 – 29 – – – – – Disposals/retirements (i) – (89) (259) (18) (366) – (142) – (27) (169) Transfers (ii) – – – 98 98 – – – 32 32 Transfers to disposal groups held for sale – – (4) (315) (319) – – – (204) (204) Decommissioning liability revisions and additions (note 21) (iii) – 22 – 279 301 – – (1) (192) (193) Exchange adjustments 1 39 9 1,022 1,071 – (4) (2) (465) (471) 31 December 31 665 1,867 16,571 19,134 30 602 2,070 14,944 17,646 Accumulated depreciation and impairment 1 January 16 262 1,704 11,035 13,017 15 330 1,639 9,520 11,504 Charge for the year 1 93 36 523 653 1 76 31 778 886 Impairments – – (28) 139 111 – – 34 1,139 1,173 Disposals/retirements (i) – (79) (258) (11) (348) – (139) – (21) (160) Transfers to disposal groups held for sale – – – (249) (249) – – – (201) (201) Exchange adjustments – 22 – 630 652 – (5) – (180) (185) 31 December 17 298 1,454 12,067 13,836 16 262 1,704 11,035 13,017 NBV at 31 December 14 367 413 4,504 5,298 14 340 366 3,909 4,629
Included within plant, equipment and vehicles disposals are £8 million (2015: £133 million) of gross assets which have been retired and have a net book value of zero. (i) Transfers from other balance sheet accounts includes £98 million (2015: £32 million) from intangible assets for exploration licences where the field is now being developed. (ii) Includes £22 million revision to dilapidations provisions on UK properties. (iii)
(b) Assets in the course of construction included in above carrying amounts
31 December 2016
£m 2015
£m
Plant, equipment and vehicles 55 53 Gas production and storage 505 1,245 Power generation 7 –
Centrica plc Annual Report and Accounts 2016 137
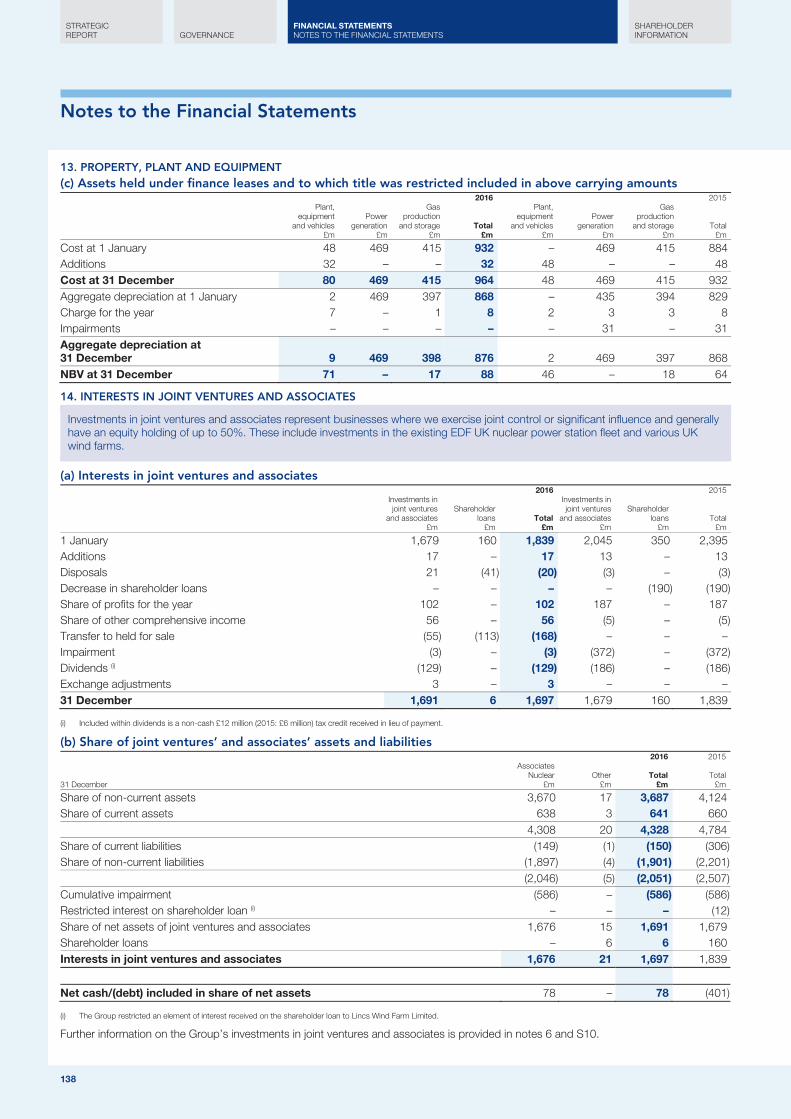
Notes to the Financial Statements
138
13. PROPERTY, PLANT AND EQUIPMENT (c) Assets held under finance leases and to which title was restricted included in above carrying amounts
2016 2015
Plant, equipment
and vehicles £m
Power generation
£m
Gas production
and storage £m
Total £m
Plant, equipment
and vehicles £m
Power generation
£m
Gas production
and storage £m
Total £m
Cost at 1 January 48 469 415 932 – 469 415 884 Additions 32 – – 32 48 – – 48 Cost at 31 December 80 469 415 964 48 469 415 932 Aggregate depreciation at 1 January 2 469 397 868 – 435 394 829 Charge for the year 7 – 1 8 2 3 3 8 Impairments – – – – – 31 – 31 Aggregate depreciation at 31 December 9 469 398 876 2 469 397 868 NBV at 31 December 71 – 17 88 46 – 18 64
14. INTERESTS IN JOINT VENTURES AND ASSOCIATES
Investments in joint ventures and associates represent businesses where we exercise joint control or significant influence and generally have an equity holding of up to 50%. These include investments in the existing EDF UK nuclear power station fleet and various UK wind farms.
(a) Interests in joint ventures and associates 2016 2015
Investments in joint ventures
and associates £m
Shareholder loans
£m Total
£m
Investments in joint ventures
and associates £m
Shareholder loans
£m Total
£m
1 January 1,679 160 1,839 2,045 350 2,395 Additions 17 – 17 13 – 13 Disposals 21 (41) (20) (3) – (3) Decrease in shareholder loans – – – – (190) (190) Share of profits for the year 102 – 102 187 – 187 Share of other comprehensive income 56 – 56 (5) – (5) Transfer to held for sale (55) (113) (168) – – – Impairment (3) – (3) (372) – (372) Dividends (i) (129) – (129) (186) – (186) Exchange adjustments 3 – 3 – – – 31 December 1,691 6 1,697 1,679 160 1,839
Included within dividends is a non-cash £12 million (2015: £6 million) tax credit received in lieu of payment. (i)
(b) Share of joint ventures’ and associates’ assets and liabilities 2016 2015
31 December
Associates Nuclear
£m Other
£m Total
£m Total
£m
Share of non-current assets 3,670 17 3,687 4,124 Share of current assets 638 3 641 660 4,308 20 4,328 4,784 Share of current liabilities (149) (1) (150) (306) Share of non-current liabilities (1,897) (4) (1,901) (2,201) (2,046) (5) (2,051) (2,507) Cumulative impairment (586) – (586) (586) Restricted interest on shareholder loan (i) – – – (12) Share of net assets of joint ventures and associates 1,676 15 1,691 1,679 Shareholder loans – 6 6 160 Interests in joint ventures and associates 1,676 21 1,697 1,839
Net cash/(debt) included in share of net assets 78 – 78 (401)
The Group restricted an element of interest received on the shareholder loan to Lincs Wind Farm Limited. (i)
Further information on the Group’s investments in joint ventures and associates is provided in notes 6 and S10.
138
STRATEGIC REPORT GOVERNANCE
SHAREHOLDER INFORMATION
FINANCIAL STATEMENTS NOTES TO THE FINANCIAL STATEMENTS

Notes to the Financial Statements
Centrica plc Annual Report and Accounts 2016 139
15. OTHER INTANGIBLE ASSETS AND GOODWILL
The Group Balance Sheet contains significant intangible assets. Goodwill, customer relationships and brands arise when we acquire a business. Goodwill is attributable to enhanced geographical presence, cost savings, synergies, growth opportunities, the assembled workforce and technical goodwill from items such as deferred tax. Goodwill is not amortised but is assessed for recoverability each year. The Group uses European Union Allowances (EUAs) and Renewable Obligation Certificates (ROCs) to satisfy its related obligations. Upstream exploration and evaluation expenditure is capitalised as an intangible asset until development of the asset commences, at which point it is transferred to PP&E or is deemed not commercially viable and is written down.
(a) Carrying amounts 2016 2015
Customer relation-
ships and
brands (i) £m
Application software
(ii) (iii) £m
EUAs and
ROCs £m
Exploration and
evaluation expenditure
£m Goodwill
£m Total
£m
Customer relation-
ships and
brands £m
Application software
(ii) £m
EUAs and
ROCs £m
Exploration and
evaluation expenditure
£m Goodwill
£m Total
£m
Cost 1 January 683 1,380 299 485 2,778 5,625 654 1,505 260 562 2,736 5,717 Additions and capitalised borrowing costs (note 4(e)) – 196 629 11 – 836 2 153 617 81 – 853 Acquisitions 48 13 19 – 250 330 – 32 2 – 71 105 Disposals/retirements and surrenders (iv) (34) (75) (664) – (10) (783) – (307) (585) (3) – (895) Write-downs – – – (19) – (19) – – – (71) – (71) Transfers (v) – – – (98) (88) (186) – – – (32) – (32) Exchange adjustments 107 67 28 46 391 639 27 (3) 5 (52) (29) (52) 31 December 804 1,581 311 425 3,321 6,442 683 1,380 299 485 2,778 5,625 Accumulated amortisation 1 January 387 524 2 159 729 1,801 297 669 2 22 127 1,117 Amortisation 73 195 – – – 268 73 161 – – – 234 Impairments – 14 – – – 14 – – – 137 609 746 Disposals/retirements and surrenders (iv) (34) (71) – – – (105) – (298) – – – (298) Transfers (v) – – – – (88) (88) – – – – – – Exchange adjustments 70 33 – – 66 169 17 (8) – – (7) 2 31 December 496 695 2 159 707 2,059 387 524 2 159 729 1,801 NBV at 31 December 308 886 309 266 2,614 4,383 296 856 297 326 2,049 3,824
The remaining amortisation period of material customer relationship assets is around five years. (i) Application software includes assets under construction with a cost of £229 million (2015: £193 million). (ii) The remaining amortisation period of material application software assets is between six and 10 years. (iii) Included within disposals/retirements and surrenders are £86 million (2015: £286 million) of gross assets that have been retired and have a net book value of zero. (iv) Transfers to other balance sheet accounts, including £98 million to PP&E and £88 million to assets held for sale in respect of fully impaired goodwill relating to Trinidad and Tobago. (v)
Centrica plc Annual Report and Accounts 2016 139

Notes to the Financial Statements
140
15. OTHER INTANGIBLE ASSETS AND GOODWILL (b) Carrying amount of goodwill and intangible assets with indefinite useful lives allocated to CGUs Goodwill acquired through business combinations, and indefinite-lived intangible assets, have been allocated for impairment testing purposes to individual CGUs or groups of CGUs, each representing the lowest level within the Group at which the goodwill or indefinite-lived intangible asset is monitored for internal management purposes.
2016 2015
31 December
Principal acquisitions to which goodwill and intangibles with indefinite useful lives relate
Carrying amount of
goodwill £m
Carrying amount of
indefinite-lived intangible assets (i)
£m Total
£m
Carrying amount of
goodwill (restated) (ii)
£m
Carrying amount of
indefinite-lived intangible
assets (restated) (i) (ii)
£m
Total (restated) (ii)
£m
CGUs Energy Supply & Services – UK & Ireland:
UK Home AlertMe/Dyno-Rod 63 57 120 63 57 120 UK Business Enron Direct/Electricity Direct 181 – 181 181 – 181 Ireland Bord Gáis Energy 15 – 15 13 – 13
Energy Supply & Services – North America:
NA Home
Direct Energy/ATCO/ CPL/WTU/FCP/Bounce/ Residential Services Group/ Clockwork/Astrum Solar 1,105 16 1,121 925 13 938
NA Business
Direct Energy/ATCO/Strategic Energy/FCP/HEM 565 – 565 471 – 471
Connected Home AlertMe/Flowgem 31 – 31 18 – 18 Distributed Energy & Power ENER-G, Panoramic Power 119 – 119 28 – 28 Energy Marketing & Trading Neas Energy 145 – 145 – – – Exploration & Production:
UK/Norway/Netherlands Newfield/Heimdal/Venture 390 – 390 350 – 350 2,614 73 2,687 2,049 70 2,119
The indefinite-lived assets mainly relate to the Mr Sparky and Benjamin Franklin brands acquired as part of the Clockwork business combination, and the Dyno-Rod brand. (i) The goodwill and indefinite-lived assets have been restated in the new reporting segments. See note 1 for further details. (ii)
140
STRATEGIC REPORT GOVERNANCE
SHAREHOLDER INFORMATION
FINANCIAL STATEMENTS NOTES TO THE FINANCIAL STATEMENTS
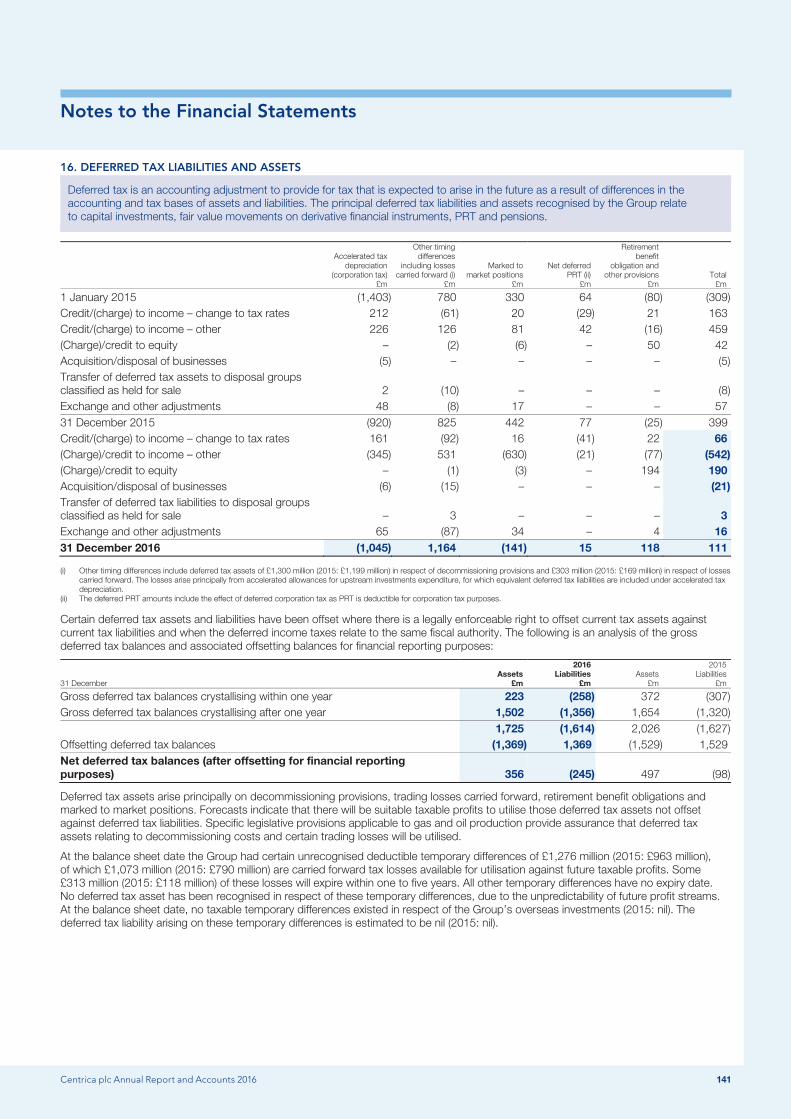
Notes to the Financial Statements
Centrica plc Annual Report and Accounts 2016 141
16. DEFERRED TAX LIABILITIES AND ASSETS
Deferred tax is an accounting adjustment to provide for tax that is expected to arise in the future as a result of differences in the accounting and tax bases of assets and liabilities. The principal deferred tax liabilities and assets recognised by the Group relate to capital investments, fair value movements on derivative financial instruments, PRT and pensions.
Accelerated tax depreciation
(corporation tax) £m
Other timing differences
including losses carried forward (i)
£m
Marked to market positions
£m
Net deferred PRT (ii)
£m
Retirement benefit
obligation and other provisions
£m Total
£m
1 January 2015 (1,403) 780 330 64 (80) (309) Credit/(charge) to income – change to tax rates 212 (61) 20 (29) 21 163 Credit/(charge) to income – other 226 126 81 42 (16) 459 (Charge)/credit to equity – (2) (6) – 50 42 Acquisition/disposal of businesses (5) – – – – (5) Transfer of deferred tax assets to disposal groups classified as held for sale 2 (10) – – – (8) Exchange and other adjustments 48 (8) 17 – – 57 31 December 2015 (920) 825 442 77 (25) 399 Credit/(charge) to income – change to tax rates 161 (92) 16 (41) 22 66 (Charge)/credit to income – other (345) 531 (630) (21) (77) (542) (Charge)/credit to equity – (1) (3) – 194 190 Acquisition/disposal of businesses (6) (15) – – – (21) Transfer of deferred tax liabilities to disposal groups classified as held for sale – 3 – – – 3 Exchange and other adjustments 65 (87) 34 – 4 16 31 December 2016 (1,045) 1,164 (141) 15 118 111
Other timing differences include deferred tax assets of £1,300 million (2015: £1,199 million) in respect of decommissioning provisions and £303 million (2015: £169 million) in respect of losses (i)carried forward. The losses arise principally from accelerated allowances for upstream investments expenditure, for which equivalent deferred tax liabilities are included under accelerated tax depreciation.
The deferred PRT amounts include the effect of deferred corporation tax as PRT is deductible for corporation tax purposes. (ii)
Certain deferred tax assets and liabilities have been offset where there is a legally enforceable right to offset current tax assets against current tax liabilities and when the deferred income taxes relate to the same fiscal authority. The following is an analysis of the gross deferred tax balances and associated offsetting balances for financial reporting purposes:
31 December Assets
£m
2016 Liabilities
£m Assets
£m
2015 Liabilities
£m
Gross deferred tax balances crystallising within one year 223 (258) 372 (307) Gross deferred tax balances crystallising after one year 1,502 (1,356) 1,654 (1,320) 1,725 (1,614) 2,026 (1,627) Offsetting deferred tax balances (1,369) 1,369 (1,529) 1,529 Net deferred tax balances (after offsetting for financial reporting purposes) 356 (245) 497 (98)
Deferred tax assets arise principally on decommissioning provisions, trading losses carried forward, retirement benefit obligations and marked to market positions. Forecasts indicate that there will be suitable taxable profits to utilise those deferred tax assets not offset against deferred tax liabilities. Specific legislative provisions applicable to gas and oil production provide assurance that deferred tax assets relating to decommissioning costs and certain trading losses will be utilised.
At the balance sheet date the Group had certain unrecognised deductible temporary differences of £1,276 million (2015: £963 million), of which £1,073 million (2015: £790 million) are carried forward tax losses available for utilisation against future taxable profits. Some £313 million (2015: £118 million) of these losses will expire within one to five years. All other temporary differences have no expiry date. No deferred tax asset has been recognised in respect of these temporary differences, due to the unpredictability of future profit streams. At the balance sheet date, no taxable temporary differences existed in respect of the Group’s overseas investments (2015: nil). The deferred tax liability arising on these temporary differences is estimated to be nil (2015: nil).
Centrica plc Annual Report and Accounts 2016 141

Notes to the Financial Statements
142
17. TRADE AND OTHER RECEIVABLES
Trade and other receivables include accrued income, and are amounts owed by our customers for goods we have delivered or services we have provided. These balances are valued net of expected irrecoverable debts. Other receivables include payments made in advance to our suppliers.
31 December Current
£m
2016 Non-current
£m Current
£m
2015 Non-current
£m
Financial assets: Trade receivables 2,305 – 2,493 – Accrued energy income 2,394 – 1,925 – Other accrued income 123 – 127 – Cash collateral posted (note 24(c)) 307 – 216 – Other receivables (including loans) 231 41 338 25
5,360 41 5,099 25 Less: provision for credit losses (697) – (694) – 4,663 41 4,405 25 Non-financial assets: prepayments and other receivables 439 25 500 36 5,102 66 4,905 61
Trade and other receivables include financial assets representing the contractual right to receive cash or other financial assets from residential customers, business customers and treasury, trading and energy procurement counterparties as follows:
31 December Current
£m
2016 Non-current
£m Current
£m
2015 Non-current
£m
Financial assets by class: Residential customers 1,690 8 1,562 7 Business customers 2,429 32 2,496 12 Treasury, trading and energy procurement counterparties 1,241 1 1,041 6
5,360 41 5,099 25 Less: provision for credit losses (697) – (694) – 4,663 41 4,405 25
Receivables from residential and business customers are generally considered to be fully performing until such time as the payment that is due remains outstanding past the contractual due date. Contractual due dates range from falling due upon receipt to falling due in 30 days from receipt. Receivables from residential customers are generally reviewed for impairment on an individual basis once a customer discontinues their relationship with the Group.
Current financial assets within trade and other receivables net of provision for credit losses on an undiscounted basis 31 December
2016 £m
2015 £m
Balances that are not past due 3,342 2,790 Balances that are past due but not considered to be individually impaired 1,279 1,576 Balances with customers that are considered to be individually impaired 42 39 4,663 4,405
An ageing of the carrying value of trade and other receivables that are past due that are not considered to be individually impaired is as follows:
Financial assets within trade and other receivables on an undiscounted basis 31 December
2016 £m
2015 £m
Days past due: Less than 30 days 703 745 30 to 89 days 224 366
Less than 90 days 927 1,111 90 to 182 days 125 225 183 to 365 days 144 163 Greater than 365 days 83 77 1,279 1,576
142
STRATEGIC REPORT GOVERNANCE
SHAREHOLDER INFORMATION
FINANCIAL STATEMENTS NOTES TO THE FINANCIAL STATEMENTS
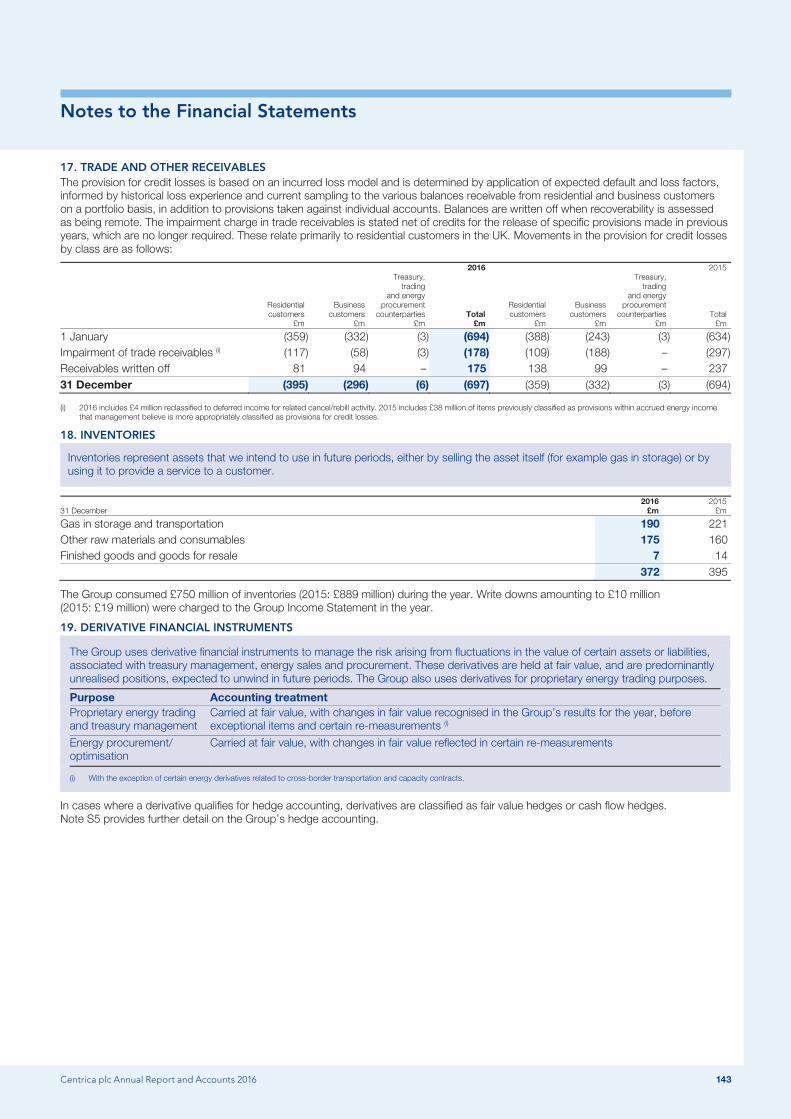
Notes to the Financial Statements
Centrica plc Annual Report and Accounts 2016 143
17. TRADE AND OTHER RECEIVABLES The provision for credit losses is based on an incurred loss model and is determined by application of expected default and loss factors, informed by historical loss experience and current sampling to the various balances receivable from residential and business customers on a portfolio basis, in addition to provisions taken against individual accounts. Balances are written off when recoverability is assessed as being remote. The impairment charge in trade receivables is stated net of credits for the release of specific provisions made in previous years, which are no longer required. These relate primarily to residential customers in the UK. Movements in the provision for credit losses by class are as follows:
2016 2015
Residential customers
£m
Business customers
£m
Treasury, trading
and energy procurement
counterparties £m
Total £m
Residential customers
£m
Business customers
£m
Treasury, trading
and energy procurement
counterparties £m
Total £m
1 January (359) (332) (3) (694) (388) (243) (3) (634) Impairment of trade receivables (i) (117) (58) (3) (178) (109) (188) – (297) Receivables written off 81 94 – 175 138 99 – 237 31 December (395) (296) (6) (697) (359) (332) (3) (694)
2016 includes £4 million reclassified to deferred income for related cancel/rebill activity. 2015 includes £38 million of items previously classified as provisions within accrued energy income (i)that management believe is more appropriately classified as provisions for credit losses.
18. INVENTORIES
Inventories represent assets that we intend to use in future periods, either by selling the asset itself (for example gas in storage) or by using it to provide a service to a customer.
31 December 2016
£m 2015
£m
Gas in storage and transportation 190 221 Other raw materials and consumables 175 160 Finished goods and goods for resale 7 14 372 395
The Group consumed £750 million of inventories (2015: £889 million) during the year. Write downs amounting to £10 million (2015: £19 million) were charged to the Group Income Statement in the year.
19. DERIVATIVE FINANCIAL INSTRUMENTS
The Group uses derivative financial instruments to manage the risk arising from fluctuations in the value of certain assets or liabilities, associated with treasury management, energy sales and procurement. These derivatives are held at fair value, and are predominantly unrealised positions, expected to unwind in future periods. The Group also uses derivatives for proprietary energy trading purposes.
Purpose Accounting treatment
Proprietary energy trading and treasury management
Carried at fair value, with changes in fair value recognised in the Group’s results for the year, before exceptional items and certain re-measurements (i)
Energy procurement/ optimisation
Carried at fair value, with changes in fair value reflected in certain re-measurements
(i) With the exception of certain energy derivatives related to cross-border transportation and capacity contracts.
In cases where a derivative qualifies for hedge accounting, derivatives are classified as fair value hedges or cash flow hedges. Note S5 provides further detail on the Group’s hedge accounting.
Centrica plc Annual Report and Accounts 2016 143

Notes to the Financial Statements
144
19. DERIVATIVE FINANCIAL INSTRUMENTS The carrying values of derivative financial instruments by product type for accounting purposes are as follows:
31 December Assets
£m
2016 Liabilities
£m Assets
£m
2015 Liabilities
£m
Derivative financial instruments – held for trading under IAS 39: Energy derivatives – for procurement/optimisation 1,420 (1,360) 1,038 (1,782) Energy derivatives – for proprietary trading 33 (92) 99 (1) Interest rate derivatives (i) – (30) – (25) Foreign exchange derivatives (i) 93 (103) 68 (89)
Energy derivative contracts designated at fair value through profit or loss 18 – 14 – Derivative financial instruments in hedge accounting relationships:
Interest rate derivatives (i) 158 (6) 129 (3) Foreign exchange derivatives (i) 151 (2) 28 (68)
Total derivative financial instruments 1,873 (1,593) 1,376 (1,968) Included within:
Derivative financial instruments – current 1,291 (1,100) 936 (1,460) Derivative financial instruments – non-current 582 (493) 440 (508)
Included within these categories are £291 million (2015: £82 million) of derivatives used to hedge movements in net debt. See note 24(c). (i)
The contracts included within energy derivatives are subject to a wide range of detailed specific terms but comprise the following general components, analysed on a net carrying value basis:
31 December 2016
£m 2015
£m
Short-term forward market purchases and sales of gas and electricity: UK and Europe (165) 119 North America (59) (470)
Structured gas purchase contracts 296 (263) Structured gas sales contracts (10) – Structured power purchase contracts (45) (54) Other 2 36 Net total 19 (632)
Net (losses)/gains on derivative financial instruments due to re-measurement
31 December
Income Statement
£m
2016
Equity £m
Income Statement
£m
2015
Equity £m
Financial assets and liabilities measured at fair value: Derivative financial instruments – held for proprietary energy trading (89) – 36 – Derivative financial instruments – held for trading under IAS 39 1,040 – 148 – Energy contracts designated at fair value through profit or loss (2) – 10 – Derivative financial instruments in hedge accounting relationships 25 185 (29) 28
974 185 165 28
144
STRATEGIC REPORT GOVERNANCE
SHAREHOLDER INFORMATION
FINANCIAL STATEMENTS NOTES TO THE FINANCIAL STATEMENTS
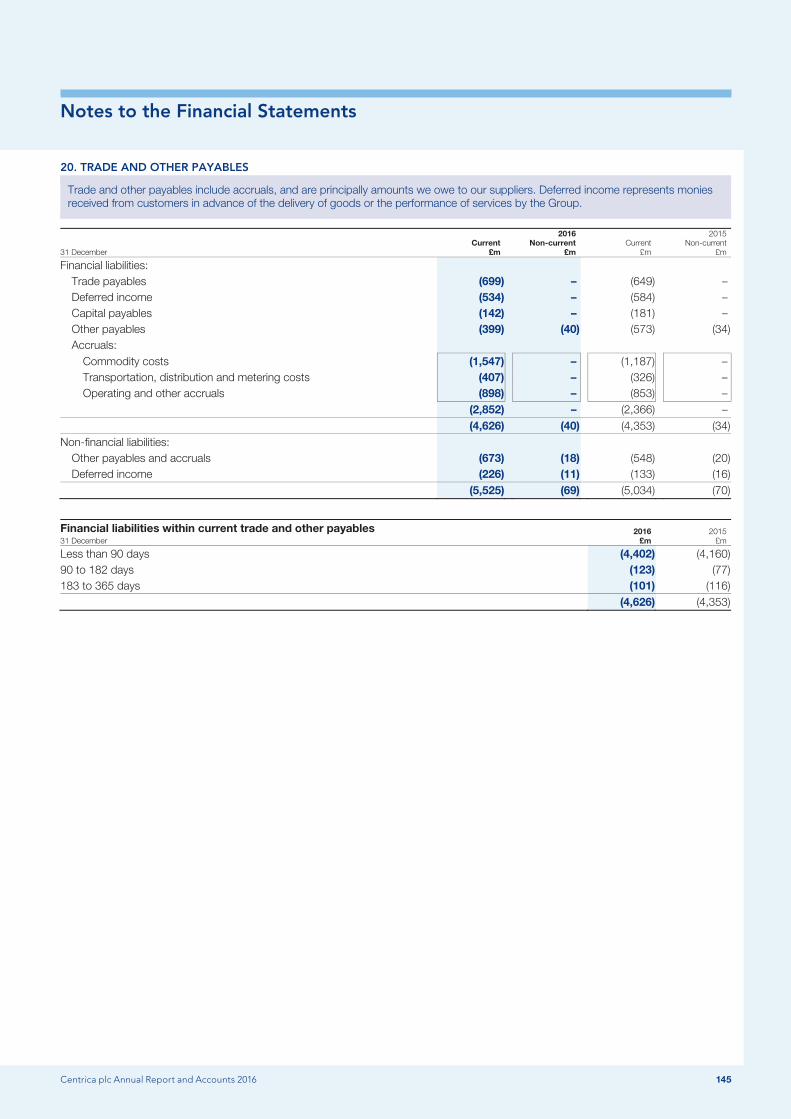
Notes to the Financial Statements
Centrica plc Annual Report and Accounts 2016 145
20. TRADE AND OTHER PAYABLES
Trade and other payables include accruals, and are principally amounts we owe to our suppliers. Deferred income represents monies received from customers in advance of the delivery of goods or the performance of services by the Group.
31 December Current
£m
2016 Non-current
£m Current
£m
2015 Non-current
£m
Financial liabilities: Trade payables (699) – (649) – Deferred income (534) – (584) – Capital payables (142) – (181) – Other payables (399) (40) (573) (34) Accruals:
Commodity costs (1,547) – (1,187) – Transportation, distribution and metering costs (407) – (326) – Operating and other accruals (898) – (853) –
(2,852) – (2,366) – (4,626) (40) (4,353) (34) Non-financial liabilities:
Other payables and accruals (673) (18) (548) (20) Deferred income (226) (11) (133) (16)
(5,525) (69) (5,034) (70)
Financial liabilities within current trade and other payables 31 December
2016 £m
2015 £m
Less than 90 days (4,402) (4,160) 90 to 182 days (123) (77) 183 to 365 days (101) (116) (4,626) (4,353)
Centrica plc Annual Report and Accounts 2016 145
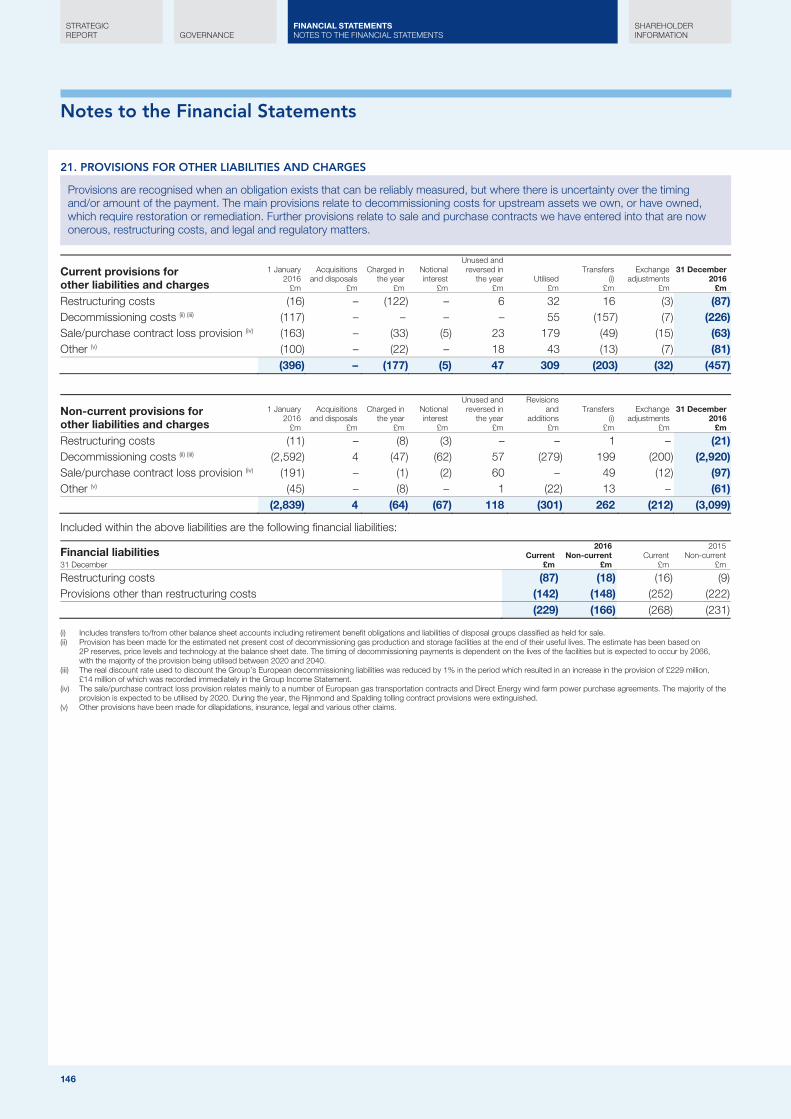
Notes to the Financial Statements
146
21. PROVISIONS FOR OTHER LIABILITIES AND CHARGES
Provisions are recognised when an obligation exists that can be reliably measured, but where there is uncertainty over the timing and/or amount of the payment. The main provisions relate to decommissioning costs for upstream assets we own, or have owned, which require restoration or remediation. Further provisions relate to sale and purchase contracts we have entered into that are now onerous, restructuring costs, and legal and regulatory matters.
Current provisions for other liabilities and charges
1 January 2016
£m
Acquisitions and disposals
£m
Charged in the year
£m
Notional interest
£m
Unused and reversed in
the year £m
Utilised £m
Transfers (i)
£m
Exchange adjustments
£m
31 December 2016
£m
Restructuring costs (16) – (122) – 6 32 16 (3) (87) Decommissioning costs (ii) (iii) (117) – – – – 55 (157) (7) (226) Sale/purchase contract loss provision (iv) (163) – (33) (5) 23 179 (49) (15) (63) Other (v) (100) – (22) – 18 43 (13) (7) (81) (396) – (177) (5) 47 309 (203) (32) (457)
Non-current provisions for other liabilities and charges
1 January 2016
£m
Acquisitions and disposals
£m
Charged in the year
£m
Notional interest
£m
Unused and reversed in
the year £m
Revisions and
additions £m
Transfers (i)
£m
Exchange adjustments
£m
31 December 2016
£m
Restructuring costs (11) – (8) (3) – – 1 – (21) Decommissioning costs (ii) (iii) (2,592) 4 (47) (62) 57 (279) 199 (200) (2,920) Sale/purchase contract loss provision (iv) (191) – (1) (2) 60 – 49 (12) (97) Other (v) (45) – (8) – 1 (22) 13 – (61) (2,839) 4 (64) (67) 118 (301) 262 (212) (3,099)
Included within the above liabilities are the following financial liabilities:
Financial liabilities 31 December
Current £m
2016 Non-current
£m Current
£m
2015 Non-current
£m
Restructuring costs (87) (18) (16) (9) Provisions other than restructuring costs (142) (148) (252) (222) (229) (166) (268) (231)
Includes transfers to/from other balance sheet accounts including retirement benefit obligations and liabilities of disposal groups classified as held for sale. (i) Provision has been made for the estimated net present cost of decommissioning gas production and storage facilities at the end of their useful lives. The estimate has been based on (ii)
2P reserves, price levels and technology at the balance sheet date. The timing of decommissioning payments is dependent on the lives of the facilities but is expected to occur by 2066, with the majority of the provision being utilised between 2020 and 2040.
The real discount rate used to discount the Group’s European decommissioning liabilities was reduced by 1% in the period which resulted in an increase in the provision of £229 million, (iii)£14 million of which was recorded immediately in the Group Income Statement.
The sale/purchase contract loss provision relates mainly to a number of European gas transportation contracts and Direct Energy wind farm power purchase agreements. The majority of the (iv)provision is expected to be utilised by 2020. During the year, the Rijnmond and Spalding tolling contract provisions were extinguished.
Other provisions have been made for dilapidations, insurance, legal and various other claims. (v)
146
STRATEGIC REPORT GOVERNANCE
SHAREHOLDER INFORMATION
FINANCIAL STATEMENTS NOTES TO THE FINANCIAL STATEMENTS
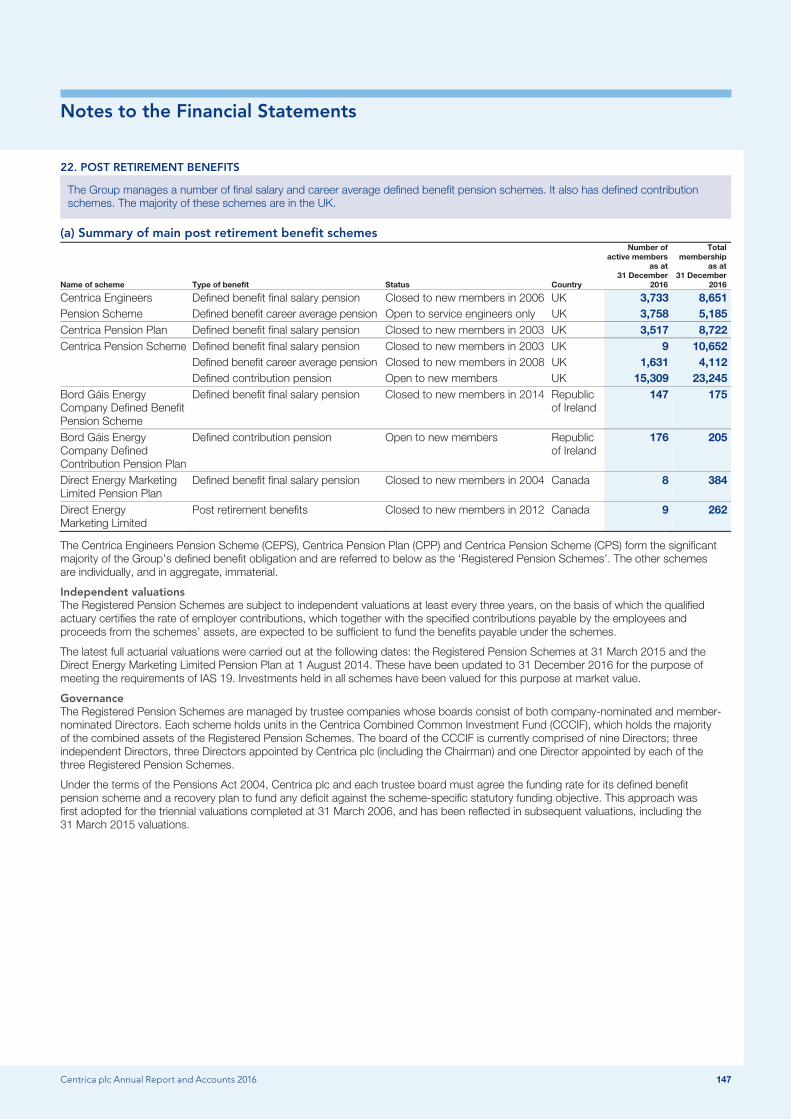
Notes to the Financial Statements
Centrica plc Annual Report and Accounts 2016 147
22. POST RETIREMENT BENEFITS
The Group manages a number of final salary and career average defined benefit pension schemes. It also has defined contribution schemes. The majority of these schemes are in the UK.
(a) Summary of main post retirement benefit schemes
Name of scheme Type of benefit Status Country
Number of active members
as at 31 December
2016
Total membership
as at 31 December
2016
Centrica Engineers Defined benefit final salary pension Closed to new members in 2006 UK 3,733 8,651 Pension Scheme Defined benefit career average pension Open to service engineers only UK 3,758 5,185 Centrica Pension Plan Defined benefit final salary pension Closed to new members in 2003 UK 3,517 8,722 Centrica Pension Scheme Defined benefit final salary pension Closed to new members in 2003 UK 9 10,652 Defined benefit career average pension Closed to new members in 2008 UK 1,631 4,112 Defined contribution pension Open to new members UK 15,309 23,245 Bord Gáis Energy Company Defined Benefit Pension Scheme
Defined benefit final salary pension Closed to new members in 2014 Republic of Ireland
147 175
Bord Gáis Energy Company Defined Contribution Pension Plan
Defined contribution pension Open to new members Republic of Ireland
176 205
Direct Energy Marketing Limited Pension Plan
Defined benefit final salary pension Closed to new members in 2004 Canada 8 384
Direct Energy Marketing Limited
Post retirement benefits Closed to new members in 2012 Canada 9 262
The Centrica Engineers Pension Scheme (CEPS), Centrica Pension Plan (CPP) and Centrica Pension Scheme (CPS) form the significant majority of the Group’s defined benefit obligation and are referred to below as the ‘Registered Pension Schemes’. The other schemes are individually, and in aggregate, immaterial.
Independent valuations The Registered Pension Schemes are subject to independent valuations at least every three years, on the basis of which the qualified actuary certifies the rate of employer contributions, which together with the specified contributions payable by the employees and proceeds from the schemes’ assets, are expected to be sufficient to fund the benefits payable under the schemes.
The latest full actuarial valuations were carried out at the following dates: the Registered Pension Schemes at 31 March 2015 and the Direct Energy Marketing Limited Pension Plan at 1 August 2014. These have been updated to 31 December 2016 for the purpose of meeting the requirements of IAS 19. Investments held in all schemes have been valued for this purpose at market value.
Governance The Registered Pension Schemes are managed by trustee companies whose boards consist of both company-nominated and member-nominated Directors. Each scheme holds units in the Centrica Combined Common Investment Fund (CCCIF), which holds the majority of the combined assets of the Registered Pension Schemes. The board of the CCCIF is currently comprised of nine Directors; three independent Directors, three Directors appointed by Centrica plc (including the Chairman) and one Director appointed by each of the three Registered Pension Schemes.
Under the terms of the Pensions Act 2004, Centrica plc and each trustee board must agree the funding rate for its defined benefit pension scheme and a recovery plan to fund any deficit against the scheme-specific statutory funding objective. This approach was first adopted for the triennial valuations completed at 31 March 2006, and has been reflected in subsequent valuations, including the 31 March 2015 valuations.
Centrica plc Annual Report and Accounts 2016 147

Notes to the Financial Statements
148
22. POST RETIREMENT BENEFITS (b) Risks The Registered Pension Schemes expose the Group to the following risks:
Asset volatility The pension liabilities are calculated using a discount rate set with reference to AA corporate bond yields; if the growth in plan assets is lower than this, this will create an actuarial loss within other equity. The CCCIF is responsible for managing the assets of each scheme in line with the liability-related investment objectives that have been set by the trustees of the schemes, and invests in a diversified portfolio of assets. The schemes are relatively young in nature (the schemes opened in 1997 on the formation of Centrica plc on demerger from BG plc (formerly British Gas plc), and only took on liabilities in respect of active employees). Therefore, the CCCIF holds a significant proportion of return-seeking assets; such assets are generally expected to provide a higher return than corporate bonds, but result in greater exposure to volatility and risk in the short term. The investment objectives are to achieve a target return above a return based on a portfolio of gilts, subject to a maximum volatility ceiling. If there have been advantageous asset movements relative to liabilities above a set threshold, then de-risking is undertaken, and as a consequence the return target and maximum volatility ceiling are reduced.
Interest rate A decrease in the bond interest rate will increase the net present value of the pension liabilities. The relative immaturity of the schemes means that the duration of the liabilities is longer than average for typical UK pension schemes, resulting in a relatively higher exposure to interest rate risk.
Inflation Pensions in deferment, pensions in payment and pensions accrued under the career average schemes increase in line with the Retail Price Index (RPI) and the Consumer Price Index (CPI). Therefore scheme liabilities will increase if inflation is higher than assumed, although in some cases caps are in place to limit the impact of significant movements in inflation. Furthermore, a pension increase exchange (PIE) option implemented in 2015 is available to future retirees, which gives the choice to receive a higher initial pension in return for giving up certain future increases linked to RPI, again limiting the impact of significant movements in inflation.
Longevity The majority of the schemes’ obligations are to provide benefits for the life of scheme members and their surviving spouses; therefore increases in life expectancy will result in an increase in the pension liabilities. The relative immaturity of the schemes means that there is comparatively little observable mortality data to assess the rates of mortality experienced by the schemes, and means that the schemes’ liabilities will be paid over a long period of time, making it particularly difficult to predict the life expectancy of the current membership. Furthermore, pension payments are subject to inflationary increases, resulting in a higher sensitivity to changes in life expectancy.
Salary Pension liabilities are calculated by reference to the future salaries of active members, and hence salary rises in excess of assumed increases will increase scheme liabilities. During 2011, changes were introduced to the final salary sections of CEPS and CPP such that annual increases in pensionable pay are capped to 2%, resulting in a reduction in salary risk. During 2016, a salary cap on pensionable pay for the CPP and CPS career average schemes was implemented. Both the 2011 and 2016 changes result in a reduction in salary risk.
Foreign exchange Certain of the assets held by the CCCIF are denominated in foreign currencies, and hence their values are subject to exchange rate risk.
The CCCIF has long-term hedging programmes in place to manage interest rate, inflation and foreign exchange risks.
The table below analyses the total liabilities of the Registered Pension Schemes, calculated in accordance with accounting principles, by type of liability, as at 31 December 2016.
Total liabilities of the Registered Pension Schemes 31 December
2016 %
Actives – final salary – capped 27 Actives – final salary – uncapped and crystallised benefits 5 Actives – career average 7 Deferred pensioners 31 Pensioners 30 100
148
STRATEGIC REPORT GOVERNANCE
SHAREHOLDER INFORMATION
FINANCIAL STATEMENTS NOTES TO THE FINANCIAL STATEMENTS
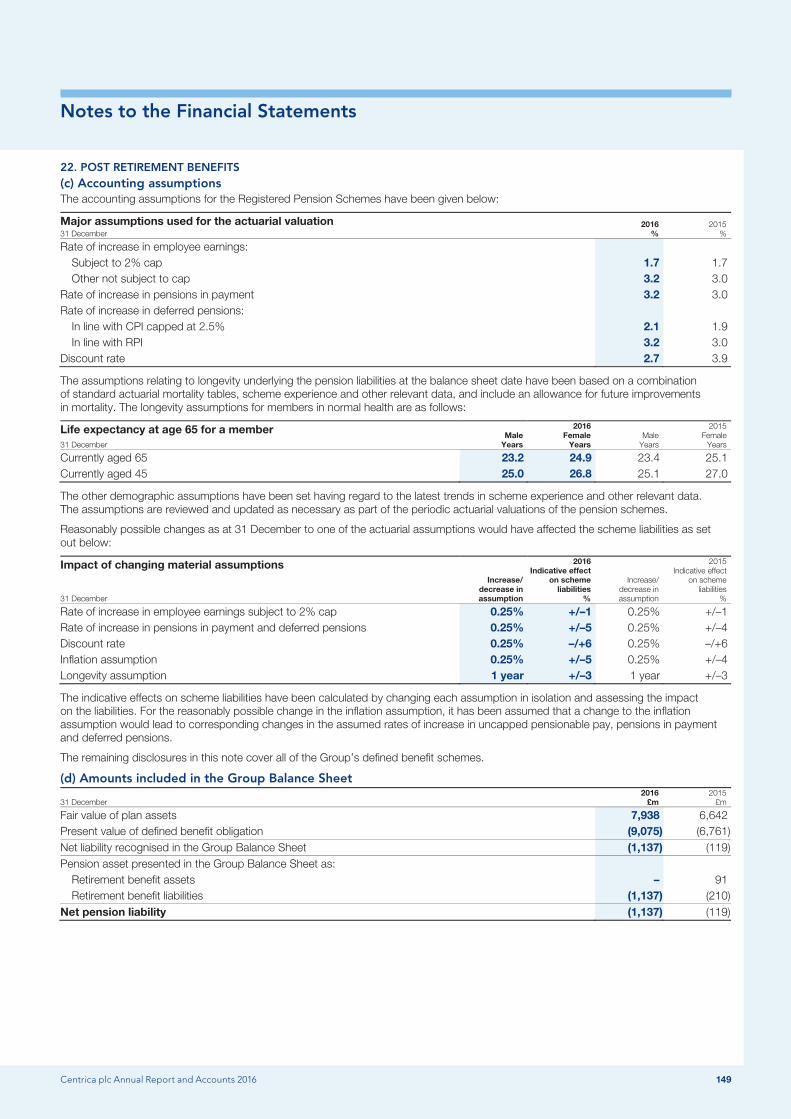
Notes to the Financial Statements
Centrica plc Annual Report and Accounts 2016 149
22. POST RETIREMENT BENEFITS (c) Accounting assumptions The accounting assumptions for the Registered Pension Schemes have been given below:
Major assumptions used for the actuarial valuation 2016 %
2015 % 31 December
Rate of increase in employee earnings: Subject to 2% cap 1.7 1.7 Other not subject to cap 3.2 3.0
Rate of increase in pensions in payment 3.2 3.0 Rate of increase in deferred pensions:
In line with CPI capped at 2.5% 2.1 1.9 In line with RPI 3.2 3.0
Discount rate 2.7 3.9
The assumptions relating to longevity underlying the pension liabilities at the balance sheet date have been based on a combination of standard actuarial mortality tables, scheme experience and other relevant data, and include an allowance for future improvements in mortality. The longevity assumptions for members in normal health are as follows:
Life expectancy at age 65 for a member Male
Years
2016 Female Years
Male Years
2015 Female Years 31 December
Currently aged 65 23.2 24.9 23.4 25.1 Currently aged 45 25.0 26.8 25.1 27.0
The other demographic assumptions have been set having regard to the latest trends in scheme experience and other relevant data. The assumptions are reviewed and updated as necessary as part of the periodic actuarial valuations of the pension schemes.
Reasonably possible changes as at 31 December to one of the actuarial assumptions would have affected the scheme liabilities as set out below:
Impact of changing material assumptions Increase/
decrease in assumption
2016 Indicative effect
on scheme liabilities
%
Increase/ decrease in assumption
2015 Indicative effect
on scheme liabilities
% 31 December
Rate of increase in employee earnings subject to 2% cap 0.25% +/–1 0.25% +/–1 Rate of increase in pensions in payment and deferred pensions 0.25% +/–5 0.25% +/–4 Discount rate 0.25% –/+6 0.25% –/+6 Inflation assumption 0.25% +/–5 0.25% +/–4 Longevity assumption 1 year +/–3 1 year +/–3
The indicative effects on scheme liabilities have been calculated by changing each assumption in isolation and assessing the impact on the liabilities. For the reasonably possible change in the inflation assumption, it has been assumed that a change to the inflation assumption would lead to corresponding changes in the assumed rates of increase in uncapped pensionable pay, pensions in payment and deferred pensions.
The remaining disclosures in this note cover all of the Group’s defined benefit schemes.
(d) Amounts included in the Group Balance Sheet
31 December 2016
£m 2015
£m
Fair value of plan assets 7,938 6,642 Present value of defined benefit obligation (9,075) (6,761) Net liability recognised in the Group Balance Sheet (1,137) (119) Pension asset presented in the Group Balance Sheet as:
Retirement benefit assets – 91 Retirement benefit liabilities (1,137) (210)
Net pension liability (1,137) (119)
Centrica plc Annual Report and Accounts 2016 149

Notes to the Financial Statements
150
22. POST RETIREMENT BENEFITS (e) Movement in the year
Pension liabilities
£m
2016 Pension
assets £m
Pension liabilities
£m
2015 Pension assets
£m
1 January (6,761) 6,642 (6,382) 6,444 Items included in the Group Income Statement:
Current service cost (118) – (129) – Contributions by employer in respect of employee salary sacrifice arrangements (i) (23) – (24) – Total current service cost (141) – (153) – Past service credit 80 – 38 – Interest (expense)/income (265) 258 (248) 253
Items included in the Group Statement of Comprehensive Income: Returns on plan assets, excluding interest income – 994 – (126) Actuarial gain/(loss) from changes to demographic assumptions 93 – (24) – Actuarial (loss)/gain from changes in financial assumptions (2,361) – 5 – Actuarial gain/(loss) from experience adjustments 100 – (176) – Exchange adjustments (13) 6 8 (5)
Items included in the Group Cash Flow Statement: Employer contributions – 225 – 224 Contributions by employer in respect of employee salary sacrifice arrangements (i) – 23 – 24
Other movements: Plan participants’ contributions (1) 1 (1) 1 Benefits paid from schemes 202 (202) 170 (170) Acquisition/disposal of businesses – – 3 (3) Settlement 9 (9) – – Transfers from provisions for other liabilities and charges (17) – (1) –
31 December (9,075) 7,938 (6,761) 6,642
A salary sacrifice arrangement was introduced on 1 April 2013 for pension scheme members. The contributions paid via the salary sacrifice arrangement have been treated as employer (i)contributions, and included within current service cost, with a corresponding reduction in salary costs.
In addition to current service cost on the Group’s defined benefit pension schemes, the Group also charged £44 million (2015: £43 million) to operating profit in respect of defined contribution pension schemes. This included contributions of £13 million (2015: £13 million) paid via a salary sacrifice arrangement.
(f) Pension scheme assets The market values of plan assets were:
31 December Quoted
£m Unquoted
£m
2016 Total
£m Quoted
£m Unquoted
£m
2015 Total
£m
Equities 1,991 307 2,298 1,884 219 2,103 Diversified asset funds 50 – 50 47 – 47 Corporate bonds 1,294 – 1,294 1,732 – 1,732 High-yield debt 309 1,296 1,605 167 781 948 Liability matching assets 1,241 844 2,085 874 556 1,430 Property – 323 323 – 318 318 Cash pending investment 283 – 283 64 – 64 5,168 2,770 7,938 4,768 1,874 6,642
Included within equities are £1 million (2015: £1 million) of ordinary shares of Centrica plc via pooled funds that include a benchmark allocation to UK equities. Included within corporate bonds are £1 million (2015: £2 million) of bonds issued by Centrica plc held within pooled funds over which the CCCIF has no ability to direct investment decisions. Apart from the investment in the Scottish Limited Partnerships which form part of the asset-backed contribution arrangements described in note 22(g), no direct investments are made in securities issued by Centrica plc or any of its subsidiaries or property leased to or owned by Centrica plc or any of its subsidiaries.
Included within the Group Balance Sheet within non-current securities are £85 million (2015: £76 million) of investments, held in trust on behalf of the Group, as security in respect of the Centrica Unfunded Pension Scheme. Of the pension scheme liabilities above, £62 million (2015: £50 million) relate to this scheme. More information on the Centrica Unfunded Pension Scheme is included in the Remuneration Report on pages 83 to 99.
150
STRATEGIC REPORT GOVERNANCE
SHAREHOLDER INFORMATION
FINANCIAL STATEMENTS NOTES TO THE FINANCIAL STATEMENTS
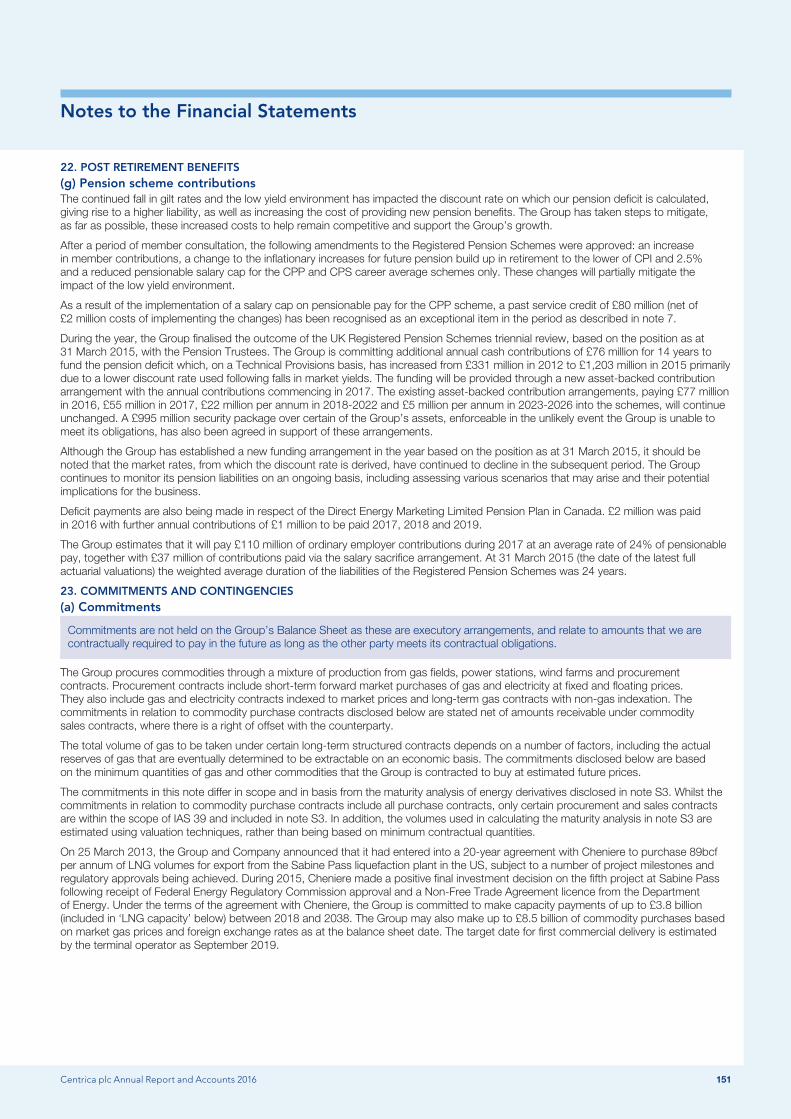
Notes to the Financial Statements
Centrica plc Annual Report and Accounts 2016 151
22. POST RETIREMENT BENEFITS (g) Pension scheme contributions The continued fall in gilt rates and the low yield environment has impacted the discount rate on which our pension deficit is calculated, giving rise to a higher liability, as well as increasing the cost of providing new pension benefits. The Group has taken steps to mitigate, as far as possible, these increased costs to help remain competitive and support the Group’s growth.
After a period of member consultation, the following amendments to the Registered Pension Schemes were approved: an increase in member contributions, a change to the inflationary increases for future pension build up in retirement to the lower of CPI and 2.5% and a reduced pensionable salary cap for the CPP and CPS career average schemes only. These changes will partially mitigate the impact of the low yield environment.
As a result of the implementation of a salary cap on pensionable pay for the CPP scheme, a past service credit of £80 million (net of £2 million costs of implementing the changes) has been recognised as an exceptional item in the period as described in note 7.
During the year, the Group finalised the outcome of the UK Registered Pension Schemes triennial review, based on the position as at 31 March 2015, with the Pension Trustees. The Group is committing additional annual cash contributions of £76 million for 14 years to fund the pension deficit which, on a Technical Provisions basis, has increased from £331 million in 2012 to £1,203 million in 2015 primarily due to a lower discount rate used following falls in market yields. The funding will be provided through a new asset-backed contribution arrangement with the annual contributions commencing in 2017. The existing asset-backed contribution arrangements, paying £77 million in 2016, £55 million in 2017, £22 million per annum in 2018-2022 and £5 million per annum in 2023-2026 into the schemes, will continue unchanged. A £995 million security package over certain of the Group’s assets, enforceable in the unlikely event the Group is unable to meet its obligations, has also been agreed in support of these arrangements.
Although the Group has established a new funding arrangement in the year based on the position as at 31 March 2015, it should be noted that the market rates, from which the discount rate is derived, have continued to decline in the subsequent period. The Group continues to monitor its pension liabilities on an ongoing basis, including assessing various scenarios that may arise and their potential implications for the business.
Deficit payments are also being made in respect of the Direct Energy Marketing Limited Pension Plan in Canada. £2 million was paid in 2016 with further annual contributions of £1 million to be paid 2017, 2018 and 2019.
The Group estimates that it will pay £110 million of ordinary employer contributions during 2017 at an average rate of 24% of pensionable pay, together with £37 million of contributions paid via the salary sacrifice arrangement. At 31 March 2015 (the date of the latest full actuarial valuations) the weighted average duration of the liabilities of the Registered Pension Schemes was 24 years.
23. COMMITMENTS AND CONTINGENCIES (a) Commitments
Commitments are not held on the Group’s Balance Sheet as these are executory arrangements, and relate to amounts that we are contractually required to pay in the future as long as the other party meets its contractual obligations.
The Group procures commodities through a mixture of production from gas fields, power stations, wind farms and procurement contracts. Procurement contracts include short-term forward market purchases of gas and electricity at fixed and floating prices. They also include gas and electricity contracts indexed to market prices and long-term gas contracts with non-gas indexation. The commitments in relation to commodity purchase contracts disclosed below are stated net of amounts receivable under commodity sales contracts, where there is a right of offset with the counterparty.
The total volume of gas to be taken under certain long-term structured contracts depends on a number of factors, including the actual reserves of gas that are eventually determined to be extractable on an economic basis. The commitments disclosed below are based on the minimum quantities of gas and other commodities that the Group is contracted to buy at estimated future prices.
The commitments in this note differ in scope and in basis from the maturity analysis of energy derivatives disclosed in note S3. Whilst the commitments in relation to commodity purchase contracts include all purchase contracts, only certain procurement and sales contracts are within the scope of IAS 39 and included in note S3. In addition, the volumes used in calculating the maturity analysis in note S3 are estimated using valuation techniques, rather than being based on minimum contractual quantities.
On 25 March 2013, the Group and Company announced that it had entered into a 20-year agreement with Cheniere to purchase 89bcf per annum of LNG volumes for export from the Sabine Pass liquefaction plant in the US, subject to a number of project milestones and regulatory approvals being achieved. During 2015, Cheniere made a positive final investment decision on the fifth project at Sabine Pass following receipt of Federal Energy Regulatory Commission approval and a Non-Free Trade Agreement licence from the Department of Energy. Under the terms of the agreement with Cheniere, the Group is committed to make capacity payments of up to £3.8 billion (included in ‘LNG capacity’ below) between 2018 and 2038. The Group may also make up to £8.5 billion of commodity purchases based on market gas prices and foreign exchange rates as at the balance sheet date. The target date for first commercial delivery is estimated by the terminal operator as September 2019.
Centrica plc Annual Report and Accounts 2016 151
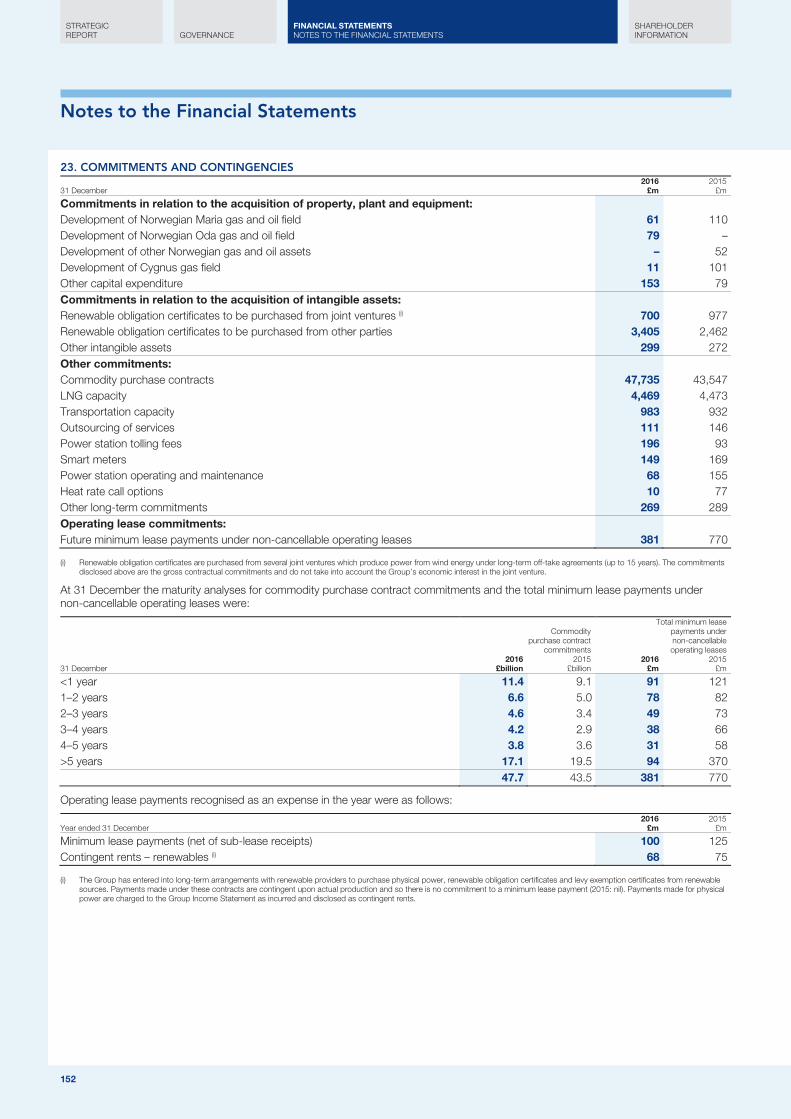
Notes to the Financial Statements
152
23. COMMITMENTS AND CONTINGENCIES
31 December 2016
£m 2015
£m
Commitments in relation to the acquisition of property, plant and equipment: Development of Norwegian Maria gas and oil field 61 110 Development of Norwegian Oda gas and oil field 79 – Development of other Norwegian gas and oil assets – 52 Development of Cygnus gas field 11 101 Other capital expenditure 153 79 Commitments in relation to the acquisition of intangible assets: Renewable obligation certificates to be purchased from joint ventures (i) 700 977 Renewable obligation certificates to be purchased from other parties 3,405 2,462 Other intangible assets 299 272 Other commitments: Commodity purchase contracts 47,735 43,547 LNG capacity 4,469 4,473 Transportation capacity 983 932 Outsourcing of services 111 146 Power station tolling fees 196 93 Smart meters 149 169 Power station operating and maintenance 68 155 Heat rate call options 10 77 Other long-term commitments 269 289 Operating lease commitments: Future minimum lease payments under non-cancellable operating leases 381 770
Renewable obligation certificates are purchased from several joint ventures which produce power from wind energy under long-term off-take agreements (up to 15 years). The commitments (i)disclosed above are the gross contractual commitments and do not take into account the Group’s economic interest in the joint venture.
At 31 December the maturity analyses for commodity purchase contract commitments and the total minimum lease payments under non-cancellable operating leases were:
Commodity purchase contract
commitments
Total minimum lease payments under non-cancellable operating leases
31 December 2016
£billion 2015
£billion 2016
£m 2015
£m
<1 year 11.4 9.1 91 121 1–2 years 6.6 5.0 78 82 2–3 years 4.6 3.4 49 73 3–4 years 4.2 2.9 38 66 4–5 years 3.8 3.6 31 58 >5 years 17.1 19.5 94 370 47.7 43.5 381 770
Operating lease payments recognised as an expense in the year were as follows:
Year ended 31 December 2016
£m 2015
£m
Minimum lease payments (net of sub-lease receipts) 100 125 Contingent rents – renewables (i) 68 75
The Group has entered into long-term arrangements with renewable providers to purchase physical power, renewable obligation certificates and levy exemption certificates from renewable (i)sources. Payments made under these contracts are contingent upon actual production and so there is no commitment to a minimum lease payment (2015: nil). Payments made for physical power are charged to the Group Income Statement as incurred and disclosed as contingent rents.
152
STRATEGIC REPORT GOVERNANCE
SHAREHOLDER INFORMATION
FINANCIAL STATEMENTS NOTES TO THE FINANCIAL STATEMENTS

Notes to the Financial Statements
Centrica plc Annual Report and Accounts 2016 153
23. COMMITMENTS AND CONTINGENCIES (b) Guarantees and indemnities
This section discloses any guarantees and indemnities that the Group has given, where we may have to provide security in the future against existing and future obligations that will remain for a specific period.
In connection with the Group’s energy trading, transportation and upstream activities, certain Group companies have entered into contracts under which they may be required to prepay, provide credit support or provide other collateral in the event of a significant deterioration in creditworthiness. The extent of credit support is contingent upon the balance owing to the third party at the point of deterioration.
The Group has provided a number of guarantees and indemnities in respect of decommissioning costs; the most significant indemnities relate to the decommissioning costs associated with the Morecambe, Statfjord and Kvitebjørn fields. These indemnities are to the previous owners of these fields. Under the licence conditions of the fields, the previous owners will have exposure to the decommissioning costs should these liabilities not be fully discharged by the Group.
With regard to Morecambe, the security is to be provided when the estimated future net revenue stream from the associated gas field falls below a predetermined proportion of the estimated decommissioning cost. The nature of the security may take a number of different forms and will remain in force until the costs of such decommissioning have been irrevocably discharged and the relevant legal decommissioning notices in respect of the relevant fields have been revoked.
Following legislation having been executed, the UK Government has now signed contracts (Decommissioning Relief Deeds – DRDs) with industry, providing certainty on decommissioning tax relief through confirmation of allowance against previous taxable profits. These deeds permit industry to move to post-tax Decommissioning Security Agreements (DSAs), cutting the cost of these and freeing up capital for investment. Centrica has a signed DRD and discussions are ongoing with the relevant counterparty to move to a post-tax DSA for Morecambe.
Security for Statfjord and Kvitebjørn is slightly different in this respect as it was provided to the previous owners as part of the acquisition of these fields.
(c) Contingent liabilities The Group has no material contingent liabilities.
24. SOURCES OF FINANCE (a) Capital structure The Group seeks to maintain an efficient capital structure with a balance of debt and equity as shown in the table below:
31 December 2016 £m
2015 £m
Net debt 3,473 4,747 Equity 2,666 1,178 Capital 6,139 5,925
Debt levels are restricted to limit the risk of financial distress and, in particular, to maintain a strong credit profile. The Group’s credit standing is important for several reasons: to maintain a low cost of debt, limit collateral requirements in energy trading, hedging and decommissioning security arrangements, and to ensure the Group is an attractive counterparty to energy producers and long-term customers.
The Group monitors its current and projected capital position on a regular basis, considering a medium-term view of three to five years, and different stress case scenarios, including the impact of changes in the Group’s credit ratings and significant movements in commodity prices. A number of financial ratios are monitored; including those used by the credit rating agencies, such as debt to cash flow ratios and adjusted EBITDA to gross interest expense. Adjusted EBITDA is defined as earnings from business performance before share of results of joint ventures and associates and before interest, tax, depreciation, impairments and amortisation. At 31 December 2016, the ratio of the Group’s net debt to adjusted EBITDA was 1.5 (2015: 2.0). Adjusted EBITDA to gross interest expense for the year ended 31 December 2016 was 5.9 (2015: 6.3). This measure now excludes capitalised interest, so the comparative has been restated accordingly.
Under the terms of the Company’s Articles of Association, the Group’s borrowings are subject to certain limits. At the start of 2016, the limit in operation was the higher of £5 billion and three times adjusted capital and reserves. As at the date of approval of the consolidated Group Financial Statements for the year ended 31 December 2015, there was a technical breach of Article 94, predominantly due to asset impairments and a resulting reduction in capital and reserves. A resolution was put to the Company’s shareholders at the Annual General Meeting in April 2016, at which time an increase to the limit was approved. Gross borrowings are now restricted to the higher of £10 billion and three times adjusted capital and reserves and the Group is operating within this limitation.
British Gas Insurance Limited (BGIL) is required under PRA regulations to hold a minimum capital amount and has complied with this requirement in 2016 (and 2015).
Centrica plc Annual Report and Accounts 2016 153

Notes to the Financial Statements
154
24. SOURCES OF FINANCE (b) Liquidity risk management and going concern The Group has a number of treasury and risk policies to monitor and manage liquidity risk. Cash forecasts identifying the Group’s liquidity requirements are produced regularly and are stress-tested for different scenarios, including, but not limited to, reasonably possible increases or decreases in commodity prices and the potential cash implications of a credit rating downgrade. The Group seeks to ensure that sufficient financial headroom exists for at least a 12-month period to safeguard the Group’s ability to continue as a going concern. It is the Group’s policy to maintain committed facilities and/or available surplus cash resources of at least £1,200 million, raise at least 75% of its net debt (excluding non-recourse debt) in the long-term debt market and to maintain an average term to maturity in the recourse long-term debt portfolio greater than five years.
At 31 December 2016, the Group had undrawn committed credit facilities of £4,497 million (2015: £4,379 million) and £1,881 million (2015: £935 million, restated for reclassification of bank overdrafts, see note 1 for more details) of unrestricted cash and cash equivalents. 186% (2015: 136%) of the Group’s net debt has been raised in the long-term debt market and the average term to maturity of the long-term debt portfolio was 11.6 years (2015: 12.0 years).
The Group’s liquidity is impacted by the cash posted or received under margin and collateral agreements. The terms and conditions of these depend on the counterparty and the specific details of the transaction. Cash is generally returned to the Group or by the Group within two days of trade settlement. Refer to note 24(c) for movement in cash posted or received as collateral.
The relatively high level of undrawn committed bank facilities and available cash resources has enabled the Directors to conclude that the Group has sufficient headroom to continue as a going concern. The statement of going concern is included in the Directors’ Report – Governance, on page 82.
154
STRATEGIC REPORT GOVERNANCE
SHAREHOLDER INFORMATION
FINANCIAL STATEMENTS NOTES TO THE FINANCIAL STATEMENTS
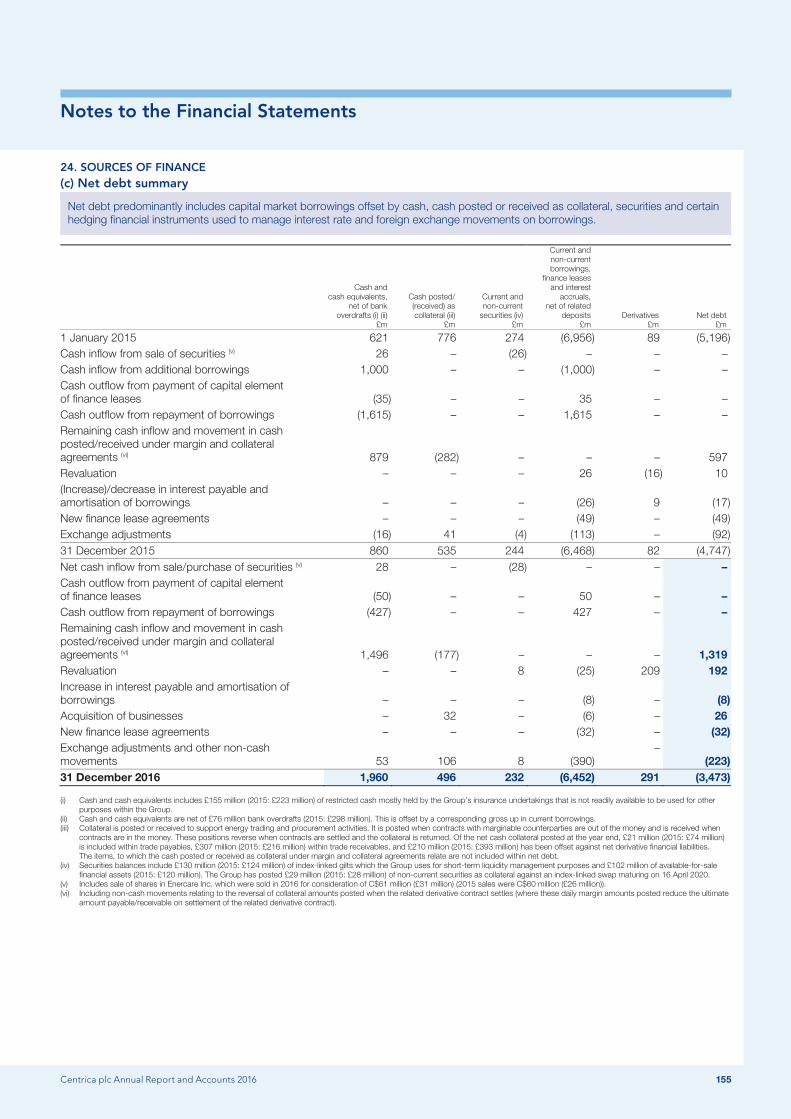
Notes to the Financial Statements
Centrica plc Annual Report and Accounts 2016 155
24. SOURCES OF FINANCE (c) Net debt summary
Net debt predominantly includes capital market borrowings offset by cash, cash posted or received as collateral, securities and certain hedging financial instruments used to manage interest rate and foreign exchange movements on borrowings.
Cash and cash equivalents,
net of bank overdrafts (i) (ii)
£m
Cash posted/ (received) as collateral (iii)
£m
Current and non-current
securities (iv) £m
Current and non-current borrowings,
finance leases and interest
accruals, net of related
deposits £m
Derivatives £m
Net debt £m
1 January 2015 621 776 274 (6,956) 89 (5,196) Cash inflow from sale of securities (v) 26 – (26) – – – Cash inflow from additional borrowings 1,000 – – (1,000) – – Cash outflow from payment of capital element of finance leases (35) – – 35 – – Cash outflow from repayment of borrowings (1,615) – – 1,615 – – Remaining cash inflow and movement in cash posted/received under margin and collateral agreements (vi) 879 (282) – – – 597 Revaluation – – – 26 (16) 10 (Increase)/decrease in interest payable and amortisation of borrowings – – – (26) 9 (17) New finance lease agreements – – – (49) – (49) Exchange adjustments (16) 41 (4) (113) – (92) 31 December 2015 860 535 244 (6,468) 82 (4,747) Net cash inflow from sale/purchase of securities (v) 28 – (28) – – – Cash outflow from payment of capital element of finance leases (50) – – 50 – – Cash outflow from repayment of borrowings (427) – – 427 – – Remaining cash inflow and movement in cash posted/received under margin and collateral agreements (vi) 1,496 (177) – – – 1,319 Revaluation – – 8 (25) 209 192 Increase in interest payable and amortisation of borrowings – – – (8) – (8) Acquisition of businesses – 32 – (6) – 26 New finance lease agreements – – – (32) – (32) Exchange adjustments and other non-cash movements 53 106 8 (390)
– (223)
31 December 2016 1,960 496 232 (6,452) 291 (3,473)
Cash and cash equivalents includes £155 million (2015: £223 million) of restricted cash mostly held by the Group’s insurance undertakings that is not readily available to be used for other (i)purposes within the Group.
Cash and cash equivalents are net of £76 million bank overdrafts (2015: £298 million). This is offset by a corresponding gross up in current borrowings. (ii) Collateral is posted or received to support energy trading and procurement activities. It is posted when contracts with marginable counterparties are out of the money and is received when (iii)
contracts are in the money. These positions reverse when contracts are settled and the collateral is returned. Of the net cash collateral posted at the year end, £21 million (2015: £74 million) is included within trade payables, £307 million (2015: £216 million) within trade receivables, and £210 million (2015: £393 million) has been offset against net derivative financial liabilities. The items, to which the cash posted or received as collateral under margin and collateral agreements relate are not included within net debt.
Securities balances include £130 million (2015: £124 million) of index-linked gilts which the Group uses for short-term liquidity management purposes and £102 million of available-for-sale (iv)financial assets (2015: £120 million). The Group has posted £29 million (2015: £28 million) of non-current securities as collateral against an index-linked swap maturing on 16 April 2020.
Includes sale of shares in Enercare Inc. which were sold in 2016 for consideration of C$61 million (£31 million) (2015 sales were C$60 million (£26 million)). (v) Including non-cash movements relating to the reversal of collateral amounts posted when the related derivative contract settles (where these daily margin amounts posted reduce the ultimate (vi)
amount payable/receivable on settlement of the related derivative contract).
Centrica plc Annual Report and Accounts 2016 155

Notes to the Financial Statements
156
24. SOURCES OF FINANCE (d) Borrowings, finance leases and interest accruals summary
31 December
Coupon rate
% Principal
m Current
£m Non-current
£m
31 December 2016
Total
£m Current
£m Non-current
£m
31 December 2015
(restated) (i) Total
£m
Bank overdrafts (76) – (76) (298) – (298) Bank loans – (148) (148) – (222) (222) Bonds (by maturity date):
24 October 2016 5.500 £300 – – – (308) – (308) 14 April 2017 Floating $200 (162) – (162) – (136) (136) 19 September 2018 7.000 £400 – (425) (425) – (433) (433) 1 February 2019 3.213 €100 – (85) (85) – (74) (74) 25 September 2020 Floating $80 – (65) (65) – (54) (54) 22 February 2022 3.680 HK$450 – (47) (47) – (39) (39) 10 March 2022 6.375 £500 – (541) (541) – (523) (523) 16 October 2023 4.000 $750 – (622) (622) – (525) (525) 4 September 2026 6.400 £200 – (228) (228) – (222) (222) 16 April 2027 5.900 $70 – (56) (56) – (47) (47) 13 March 2029 4.375 £750 – (751) (751) – (739) (739) 5 January 2032 (ii) Zero €50 – (54) (54) – (38) (38) 19 September 2033 7.000 £770 – (763) (763) – (763) (763) 16 October 2043 5.375 $600 – (480) (480) – (401) (401) 12 September 2044 4.250 £550 – (537) (537) – (537) (537) 25 September 2045 5.250 $50 – (40) (40) – (33) (33) 10 April 2075 (iii) 5.250 £450 – (457) (457) – (450) (450) 10 April 2076 (iv) 3.000 €750 – (637) (637) – (550) (550)
(162) (5,788) (5,950) (308) (5,564) (5,872) Obligations under finance leases (v) (39) (194) (233) (43) (207) (250) Other borrowings – – – (4) – (4) Interest accruals (121) – (121) (120) – (120) (398) (6,130) (6,528) (773) (5,993) (6,766)
Restated for reclassification of £298 million of overdrawn bank balances from cash and cash equivalents to current bank overdrafts, bank loans and other borrowings. See note 1 for further details. (i) €50 million of zero coupon notes have an accrual yield of 4.200%, which will result in a €114 million repayment on maturity. (ii) The Group has the right to repay at par on 10 April 2025 and every interest payment date thereafter. (iii) The Group has the right to repay at par on 10 April 2021 and every interest payment date thereafter. (iv) Contingent rents paid under finance lease obligations during the year were £37 million (2015: £27 million). (v)
Maturity analysis for non-current bank loans at 31 December 2016
£m 2015
£m
2–5 years – (100) >5 years (148) (122) (148) (222)
156
STRATEGIC REPORT GOVERNANCE
SHAREHOLDER INFORMATION
FINANCIAL STATEMENTS NOTES TO THE FINANCIAL STATEMENTS

Notes to the Financial Statements
Centrica plc Annual Report and Accounts 2016 157
25. SHARE CAPITAL
Ordinary share capital represents the total number of shares issued which are publicly traded. We also disclose the number of own and treasury shares the Company holds, which the Company has bought itself, principally as part of the share repurchase programme.
Allotted and fully paid share capital of the Company 31 December
2016 £m
2015 £m
5,539,363,372 ordinary shares of 614/81 pence each (2015: 5,128,545,946) 342 317
In May 2016, 350 million new ordinary shares were issued at a price of 200.0 pence per share, raising total proceeds of £694 million net of issuance costs.
The closing price of one Centrica ordinary share on 31 December 2016 was 234.1 pence (2015: 218.1 pence). Centrica employee share ownership trusts purchase Centrica ordinary shares from the open market and receive treasury shares to satisfy future obligations of certain employee share schemes. The movements in own and treasury shares during the year are shown below:
Own shares Treasury shares
2016 Million shares
2015 Million shares
2016 Million shares
2015 Million shares
1 January 6.0 5.5 58.7 76.9 Shares purchased 6.8 3.0 – – Treasury shares placed into trust 1.4 1.5 (1.4) (1.5) Shares released to employees on vesting (5.2) (4.0) (6.5) (16.7) 31 December (i) 9.0 6.0 50.8 58.7
The closing balance in the treasury and own share reserve of own shares was £23 million (2015: £17 million) and treasury shares was £157 million (2015: £181 million). (i)
26. EVENTS AFTER THE BALANCE SHEET DATE
The Group updates disclosures in light of new information being received, or a significant event occurring, in the period between 31 December 2016 and the date of this report.
Disposal On 13 January 2017, Centrica announced the sale of its 50% share in Lincs Wind Farm Limited to the Green Investment Bank for net proceeds of £224 million, of which £113 million relates to a shareholder loan, which exceeds the carrying value of the disposed assets.
The transaction completed on 17 February 2017, but the Group will continue to operate Lincs for a 12-month period with a continued focus on safety and power availability.
Centrica Storage On 16 February 2017, Centrica Storage announced that following further test results at the Rough storage field and review with technical advisors, injection services cannot currently be offered for the 2017/18 storage year.
Centrica Storage will continue and complete the testing programme and will then evaluate the full results from all 24 wells. This analysis is expected to be completed by 30 June 2017 and a further update to the market will be provided at that time. The return to injection operations in 2017 remains subject to successfully completing testing and evaluation of all wells and confirmation that Rough can be safely returned to service.
Dividends The Directors propose a final dividend of 8.40 pence per ordinary share (totalling £461 million) for the year ended 31 December 2016. The dividend will be submitted for formal approval at the Annual General Meeting to be held on 8 May 2017 and, subject to approval, will be paid on 29 June 2017 to those shareholders registered on 12 May 2017.
Centrica plc Annual Report and Accounts 2016 157
Notes to the Financial Statements Supplementary information
158
Supplementary information includes additional information and disclosures we are required to make by accounting standards or regulation.
S1. GENERAL INFORMATION Centrica plc is a company domiciled and incorporated in the UK. The address of the registered office is Millstream, Maidenhead Road, Windsor, Berkshire SL4 5GD. The nature of the Group’s operations and principal activities are set out in note 4(a) and on pages 2 to 64.
The consolidated Financial Statements of Centrica plc are presented in pounds sterling. Operations and transactions conducted in currencies other than pounds sterling are included in the consolidated Financial Statements in accordance with the foreign currencies accounting policy set out in note S2.
S2. SUMMARY OF SIGNIFICANT ACCOUNTING POLICIES
This section sets out the Group’s significant accounting policies in addition to the critical accounting policies applied in the preparation of these consolidated Financial Statements. These accounting policies have been consistently applied to the years presented.
Income Statement presentation The Group Income Statement and segmental note separately identify the effects of re-measurement of certain financial instruments, and items that are exceptional, in order to provide readers with a clear and consistent presentation of the Group’s underlying performance, as described in note 2.
Basis of consolidation The Group Financial Statements consolidate the Financial Statements of the Company and entities controlled by the Company. Subsidiaries are all entities (including structured entities) over which the Group has control. Control is exercised over an entity when the Group is exposed to, or has rights to, variable returns from its involvement with the entity and has the ability to affect those returns through its power over the entity. Subsidiaries are fully consolidated from the date on which control is transferred to the Group. They are deconsolidated from the date that control ceases. Transactions with non-controlling interests that relate to their ownership interests and do not result in a loss of control are accounted for as equity transactions.
The results of subsidiaries acquired or disposed of during the year are consolidated from the effective date of acquisition (at which point the Group gains control over a business as defined by IFRS 3, and applies the acquisition method to account for the transaction as a business combination) or up to the effective date of disposal, as appropriate. Where necessary, adjustments are made to the Financial Statements of subsidiaries, associates and joint ventures to align the accounting policies with those used by the Group.
When the Group ceases to have control, any retained interest in the entity is re-measured to its fair value with the change in carrying amount recognised in profit or loss. This fair value becomes the initial carrying amount for the purposes of subsequently accounting for the retained interest as a joint venture, associate or financial asset.
Segmental reporting The Group’s operating segments are reported in a manner consistent with the internal reporting provided to and regularly reviewed by the Group’s Executive Committee for the purposes of evaluating segment performance and allocating resources.
Revenue Revenue is recognised to the extent that it is probable that the economic benefits will flow to the Group and the revenue can be measured reliably. Revenue includes amounts receivable for goods and services provided in the normal course of business, net of discounts, rebates, VAT and other sales-related taxes.
Energy supply: revenue is recognised on the basis of energy supplied during the year. Revenue for energy supply activities includes an assessment of energy supplied to customers between the date of the last meter reading and the year end (unread). Unread gas and electricity is estimated using historical consumption patterns, taking into account the industry reconciliation process for total gas and total electricity usage by supplier, and is included in accrued energy income within trade and other receivables.
Proprietary energy trading: revenue comprises both realised (settled) and unrealised (fair value changes) net gains and losses from trading in physical and financial energy contracts.
Fixed-fee service and insurance contracts: revenue from these contracts is recognised in the Group Income Statement with regard to the incidence of risk over the life of the contract, reflecting the seasonal propensity of claims to be made under the contracts and the benefits receivable by the customer, which span the life of the contract as a result of emergency maintenance being available throughout the contract term.
Amounts paid in advance are treated as deferred income, with any amount in arrears recognised as accrued income. For one-off services, such as installations, revenue is recognised at the date of service provision.
Storage services: storage capacity revenues are recognised evenly over the contract period, whilst commodity revenues for the injection and withdrawal of gas are recognised at the point of gas flowing into or out of the storage facilities. Gas purchases and gas sales transactions entered into to optimise the performance of the gas storage facilities are presented net within cost of sales. Cushion gas sales revenue is recognised when the gas is transferred to the customer account or sold to the market.
158
STRATEGIC REPORT GOVERNANCE
SHAREHOLDER INFORMATION
FINANCIAL STATEMENTS NOTES TO THE FINANCIAL STATEMENTS
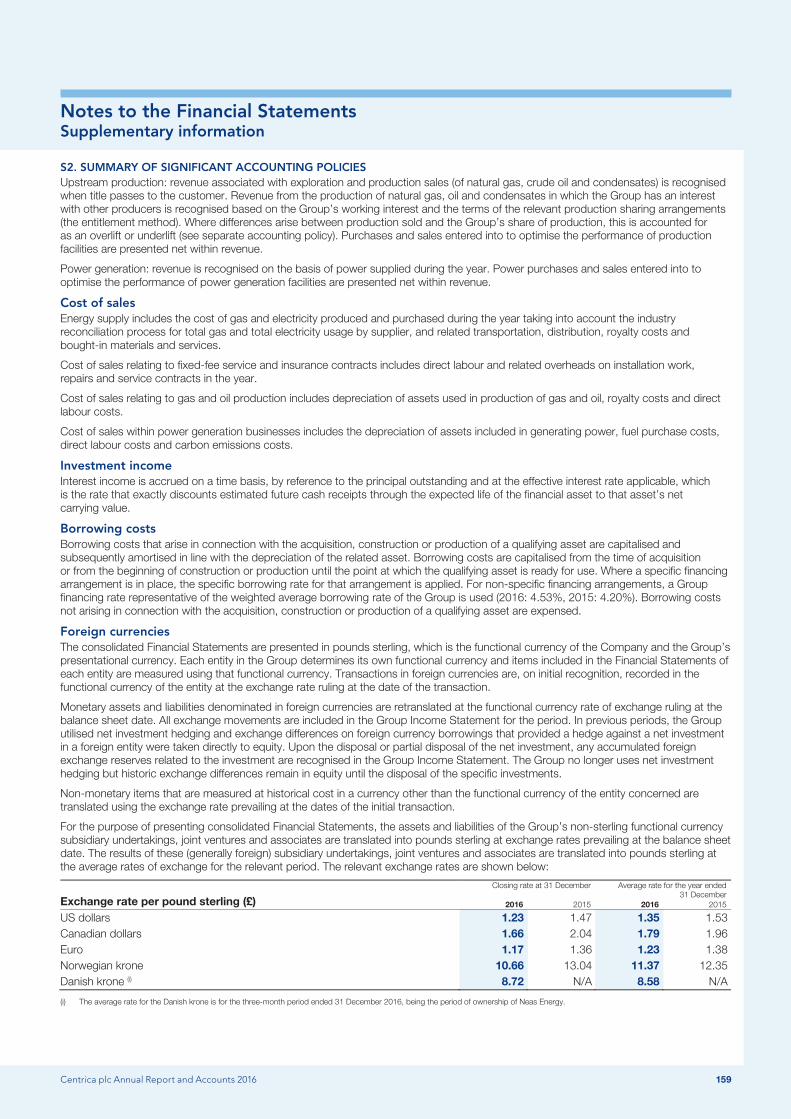
Notes to the Financial Statements Supplementary information
Centrica plc Annual Report and Accounts 2016 159
S2. SUMMARY OF SIGNIFICANT ACCOUNTING POLICIES Upstream production: revenue associated with exploration and production sales (of natural gas, crude oil and condensates) is recognised when title passes to the customer. Revenue from the production of natural gas, oil and condensates in which the Group has an interest with other producers is recognised based on the Group’s working interest and the terms of the relevant production sharing arrangements (the entitlement method). Where differences arise between production sold and the Group’s share of production, this is accounted for as an overlift or underlift (see separate accounting policy). Purchases and sales entered into to optimise the performance of production facilities are presented net within revenue.
Power generation: revenue is recognised on the basis of power supplied during the year. Power purchases and sales entered into to optimise the performance of power generation facilities are presented net within revenue.
Cost of sales Energy supply includes the cost of gas and electricity produced and purchased during the year taking into account the industry reconciliation process for total gas and total electricity usage by supplier, and related transportation, distribution, royalty costs and bought-in materials and services.
Cost of sales relating to fixed-fee service and insurance contracts includes direct labour and related overheads on installation work, repairs and service contracts in the year.
Cost of sales relating to gas and oil production includes depreciation of assets used in production of gas and oil, royalty costs and direct labour costs.
Cost of sales within power generation businesses includes the depreciation of assets included in generating power, fuel purchase costs, direct labour costs and carbon emissions costs.
Investment income Interest income is accrued on a time basis, by reference to the principal outstanding and at the effective interest rate applicable, which is the rate that exactly discounts estimated future cash receipts through the expected life of the financial asset to that asset’s net carrying value.
Borrowing costs Borrowing costs that arise in connection with the acquisition, construction or production of a qualifying asset are capitalised and subsequently amortised in line with the depreciation of the related asset. Borrowing costs are capitalised from the time of acquisition or from the beginning of construction or production until the point at which the qualifying asset is ready for use. Where a specific financing arrangement is in place, the specific borrowing rate for that arrangement is applied. For non-specific financing arrangements, a Group financing rate representative of the weighted average borrowing rate of the Group is used (2016: 4.53%, 2015: 4.20%). Borrowing costs not arising in connection with the acquisition, construction or production of a qualifying asset are expensed.
Foreign currencies The consolidated Financial Statements are presented in pounds sterling, which is the functional currency of the Company and the Group’s presentational currency. Each entity in the Group determines its own functional currency and items included in the Financial Statements of each entity are measured using that functional currency. Transactions in foreign currencies are, on initial recognition, recorded in the functional currency of the entity at the exchange rate ruling at the date of the transaction.
Monetary assets and liabilities denominated in foreign currencies are retranslated at the functional currency rate of exchange ruling at the balance sheet date. All exchange movements are included in the Group Income Statement for the period. In previous periods, the Group utilised net investment hedging and exchange differences on foreign currency borrowings that provided a hedge against a net investment in a foreign entity were taken directly to equity. Upon the disposal or partial disposal of the net investment, any accumulated foreign exchange reserves related to the investment are recognised in the Group Income Statement. The Group no longer uses net investment hedging but historic exchange differences remain in equity until the disposal of the specific investments.
Non-monetary items that are measured at historical cost in a currency other than the functional currency of the entity concerned are translated using the exchange rate prevailing at the dates of the initial transaction.
For the purpose of presenting consolidated Financial Statements, the assets and liabilities of the Group’s non-sterling functional currency subsidiary undertakings, joint ventures and associates are translated into pounds sterling at exchange rates prevailing at the balance sheet date. The results of these (generally foreign) subsidiary undertakings, joint ventures and associates are translated into pounds sterling at the average rates of exchange for the relevant period. The relevant exchange rates are shown below:
Exchange rate per pound sterling (£)
Closing rate at 31 December
Average rate for the year ended 31 December
2016 2015 2016 2015
US dollars 1.23 1.47 1.35 1.53 Canadian dollars 1.66 2.04 1.79 1.96 Euro 1.17 1.36 1.23 1.38 Norwegian krone 10.66 13.04 11.37 12.35 Danish krone (i) 8.72 N/A 8.58 N/A
(i) The average rate for the Danish krone is for the three-month period ended 31 December 2016, being the period of ownership of Neas Energy.
Centrica plc Annual Report and Accounts 2016 159
Notes to the Financial Statements Supplementary information
160
S2. SUMMARY OF SIGNIFICANT ACCOUNTING POLICIES Exchange adjustments arising from the retranslation of the opening net assets and results of non-sterling functional currency operations are transferred to the Group’s foreign currency translation reserve, a separate component of equity, and are reported in the Statement of Comprehensive Income. In the event of the disposal of a non-sterling functional currency subsidiary, the cumulative translation difference arising in the foreign currency translation reserve is charged or credited to the Group Income Statement on disposal.
Employee share schemes The Group operates a number of employee share schemes, detailed in the Remuneration Report on pages 83 to 99, under which it makes equity-settled share-based payments to certain employees. Equity-settled share-based payments are measured at fair value at the date of grant (excluding the effect of non-market based vesting conditions). The fair value determined at the grant date is expensed on a straight-line basis together with a corresponding increase in equity over the vesting period, based on the Group’s estimate of the number of awards that will vest, and adjusted for the effect of non-market based vesting conditions.
The majority of the share-based payment charge arises from five schemes. More information is included in the Remuneration Report on pages 83 to 99.
Deferred Matching Share Scheme (DMSS): ● Applicable employees: Senior Executive Group. ● From 2015 this scheme was replaced by the Annual Incentive Plan (AIP) and Long Term Incentive Plan (LTIP) for Executive Directors
and the On Track Incentive Plan (OTIP) for Senior Executives and senior management. ● Vesting period of four years, comprising bonus year and three-year performance period. ● Participants must defer between 20% and 40% of annual pre-tax bonus into scheme (deferred shares) and can elect to invest
additional amounts of annual bonus up to a maximum of 50% of total potential bonus (investment shares). ● Deferred and investment shares will be matched with conditional shares. On achievement of performance targets over a three-year
period, matching shares are either released immediately or delivered as nil cost options exercisable for seven years. ● Performance measured through Group and segment Economic Profit (EP) targets. ● Leaving prior to vesting date will normally mean forfeiting rights to deferred and matching shares.
Long Term Incentive Scheme (LTIS): ● Applicable employees: senior management. ● From 2015 this scheme was replaced by the AIP and LTIP for Executive Directors and OTIP for Senior Executives and senior management. ● Vesting period of three years following grant date. ● Grants after 2012: number of shares calculated according to EPS, Group EP, total shareholder return (TSR) and non-financial KPIs. ● Following the end of the assessed performance period, and subject to continued employment at that date, shares are either released
immediately or delivered as nil cost options exercisable for seven years. ● Leaving prior to vesting date will normally mean forfeiting rights.
Share Award Scheme (SAS): ● Applicable employees: senior and middle management. ● Shares vest subject to continued employment within the Group in two stages: half after two years and the other half after three years. ● Leaving prior to vesting date will normally mean forfeiting rights.
On Track Incentive Plan (OTIP): ● Applicable employees: Senior Executives, senior and middle management. ● Shares vest subject to continued employment within the Group in two stages: half after two years and the other half after three years. ● Leaving prior to vesting date will normally mean forfeiting rights to the unvested share awards.
Long Term Incentive Plan (LTIP): ● Applicable employees: Executive Directors. ● Shares vest subject to continued employment and performance conditions after a three-year period. ● Number of shares calculated according to EPS, Group EP and non-financial KPIs. ● Mandatory holding period of two years following vesting during which claw back applies. ● Leaving prior to vesting date will normally mean forfeiting rights.
For each of the schemes, the fair value is measured using the market value on the date of the grant.
160
STRATEGIC REPORT GOVERNANCE
SHAREHOLDER INFORMATION
FINANCIAL STATEMENTS NOTES TO THE FINANCIAL STATEMENTS

Notes to the Financial Statements Supplementary information
Centrica plc Annual Report and Accounts 2016 161
S2. SUMMARY OF SIGNIFICANT ACCOUNTING POLICIES Business combinations and goodwill The acquisition of subsidiaries is accounted for using the acquisition method (at the point the Group gains control over a business as defined by IFRS 3. The cost of the acquisition is measured as the cash paid and the aggregate of the fair values, at the date of exchange, of other assets transferred, liabilities incurred or assumed, and equity instruments issued by the Group in exchange for control of the acquiree. The consideration transferred includes the fair value of any asset or liability resulting from a contingent consideration arrangement at the acquisition date.
Acquisition-related costs are expensed as incurred. The acquiree’s identifiable assets, liabilities and contingent liabilities that meet the conditions for recognition under IFRS 3, are recognised at their fair value at the acquisition date, except for non-current assets (or disposal groups) that are classified as held for sale in accordance with IFRS 5, which are recognised and measured at FVLCD. The Group recognises any non-controlling interests in the acquiree on an acquisition-by-acquisition basis, either at fair value or at the non-controlling interests’ proportionate share of the recognised amounts of acquiree’s identifiable net assets.
Goodwill arising on a business combination represents the excess of the consideration transferred, the amount of the non-controlling interests and the acquisition date fair value of any previously held interest in the acquiree over the Group’s interest in the fair value of the identifiable net assets acquired. Goodwill arising on the acquisition of a stake in a joint venture or an associate represents the excess of the consideration transferred over the Group’s interest in the fair value of the identifiable assets and liabilities of the investee at the date of acquisition. Goodwill is initially recognised as an asset at cost and is subsequently measured at cost less any accumulated impairment losses. The goodwill arising on an investment in a joint venture or in an associate is not recognised separately, but is shown under ‘Interests in joint ventures and associates’ in the Group Balance Sheet. If, after reassessment, the Group’s interest in the net fair value of the acquiree’s identifiable assets, liabilities and contingent liabilities exceeds the cost of the business combination, the excess is recognised immediately in the Group Income Statement.
Following the amendment to IFRS 11, acquisitions of joint operations that meet the definition of a business are accounted for as a business combination.
On disposal of a subsidiary, associate or joint venture entity, any amount of goodwill attributed to that entity is included in the determination of the profit or loss on disposal. A similar accounting treatment is applied on disposal of assets that represent a business.
Other intangible assets Intangible assets acquired separately are measured on initial recognition at cost. Intangible assets include contractual customer relationships, brands, application software, emissions trading schemes, renewable obligation certificates, and certain exploration and evaluation expenditures, the accounting policies for which are dealt with separately below. For purchased application software, for example investments in customer relationship management and billing systems, cost includes contractors’ charges, materials, directly attributable labour and directly attributable overheads.
Capitalisation begins when expenditure for the asset is being incurred and activities necessary to prepare the asset for use are in progress. Capitalisation ceases when substantially all the activities that are necessary to prepare the asset for use are complete. Amortisation commences at the point of commercial deployment. The cost of intangible assets acquired in a business combination is their fair value as at the date of acquisition.
Following initial recognition, intangible assets are carried at cost less any accumulated amortisation and any accumulated impairment losses. The useful lives of intangible assets are assessed to be either finite or indefinite. Intangible assets with finite lives are amortised over their useful economic life and are tested for impairment annually otherwise they are assessed for impairment whenever there is an indication that the intangible asset could be impaired. The amortisation period and the amortisation method for an intangible asset are reviewed at each financial year end. Changes in the expected useful life or the expected pattern of consumption of future economic benefits embodied in the asset are accounted for on a prospective basis by changing the amortisation period or method, as appropriate, and treated as changes in accounting estimates.
Intangible assets are derecognised on disposal, or when no future economic benefits are expected from their use.
Intangible assets with indefinite useful lives are tested for impairment annually, and whenever there is an indication that the intangible asset could be impaired, either individually or at the CGU level. Such intangibles are not amortised. The useful life of an intangible asset with an indefinite useful life is reviewed annually to determine whether the indefinite life assessment continues to be supportable. If not, the change in the useful life assessment from indefinite to finite is made on a prospective basis.
The useful economic lives for the principal categories of intangible assets are as follows:
Contractual customer relationships Up to 20 years Strategic identifiable acquired brands Indefinite Application software Up to 15 years Licences Up to 20 years
Centrica plc Annual Report and Accounts 2016 161
Notes to the Financial Statements Supplementary information
162
S2. SUMMARY OF SIGNIFICANT ACCOUNTING POLICIES EU Emissions Trading Scheme and renewable obligation certificates Purchased carbon dioxide emissions allowances are recognised initially at cost (purchase price) within intangible assets. The liability is measured at the cost of purchased allowances up to the level of purchased allowances held, and then at the market price of allowances ruling at the balance sheet date, with movements in the liability recognised in operating profit.
Forward contracts for the purchase or sale of carbon dioxide emissions allowances are measured at fair value with gains and losses arising from changes in fair value recognised in the Group Income Statement. The intangible asset is surrendered and the liability is extinguished at the end of the compliance period to reflect the consumption of economic benefits.
Purchased renewable obligation certificates are recognised initially at cost within intangible assets. A liability for the renewables obligation is recognised based on the level of electricity supplied to customers, and is calculated in accordance with percentages set by the UK Government and the renewable obligation certificate buyout price for that period.
The intangible asset is surrendered and the liability is extinguished at the end of the compliance period to reflect the consumption of economic benefits. Any recycling benefit related to the submission of renewable obligation certificates is recognised in the Group Income Statement when received.
Exploration, evaluation, development and production assets The Group uses the successful efforts method of accounting for exploration and evaluation expenditure. Exploration and evaluation expenditure associated with an exploration well, including acquisition costs related to exploration and evaluation activities are capitalised initially as intangible assets. Certain expenditures such as geological and geophysical exploration costs are expensed. If the prospects are subsequently determined to be successful on completion of evaluation, the relevant expenditure including licence acquisition costs is transferred to PP&E. If the prospects are subsequently determined to be unsuccessful on completion of evaluation, the associated costs are expensed in the period in which that determination is made.
All field development costs are capitalised as PP&E. Such costs relate to the acquisition and installation of production facilities and include development drilling costs, project-related engineering and other technical services costs. PP&E, including rights and concessions related to production activities, are depreciated from the commencement of production in the fields concerned, using the unit of production method, based on all of the 2P reserves of those fields. Changes in these estimates are dealt with prospectively.
The net carrying value of fields in production and development is annually compared on a field-by-field basis with the likely discounted future net revenues to be derived from the remaining commercial reserves. An impairment loss is recognised where it is considered that recorded amounts are unlikely to be fully recovered from the net present value of future net revenues. Exploration assets are reviewed annually for indicators of impairment and production and development assets are tested annually for impairment.
Interests in joint arrangements and associates Under IFRS 11, joint arrangements are those that convey joint control which exists only when decisions about the relevant activities require the unanimous consent of the parties sharing control. Investments in joint arrangements are classified as either joint operations or joint ventures depending on the contractual rights and obligations of each investor. Associates are investments over which the Group has significant influence but not control or joint control, and generally holds between 20% and 50% of the voting rights. The Group’s joint ventures and associates (as defined in note 6) are accounted for using the equity method.
Under the equity method, investments are carried at cost plus post-acquisition changes in the Group’s share of net assets, less any impairment in value in individual investments. The Group Income Statement reflects the Group’s share of the results of operations after tax and interest. Accounting policies of the joint ventures and associates have been changed where necessary to ensure consistency with the policies adopted by the Group. Upon initial acquisition goodwill may arise and is recognised within ‘interests in joint ventures and associates’ in the Group Balance Sheet.
Following the amendment to IFRS 11, acquisitions of joint operations that meet the definition of a business are accounted for as a business combination.
The Group’s interests in joint operations (gas and oil exploration and production licence arrangements) are accounted for by recognising its assets (including its share of assets held jointly), its liabilities (including its share of liabilities incurred jointly), its revenue from the sale of its share of the output arising from the joint operation, its share of the revenue from the sale of the output by the joint operation and its expenses (including its share of any expenses incurred jointly).
Where the Group has an equity stake or a participating interest in operations governed by a joint arrangement for which it is acting as operator, an assessment is carried out to confirm whether the Group is acting as agent or principal. As the terms and conditions negotiated between business partners usually provide joint control to the parties over the relevant activities of the gas and oil fields and/or wind farms that are governed by joint arrangements, the Group is usually deemed to be an agent when it is appointed as operator and not as principal (as the contracts entered into do not convey control to the parties). Accordingly, the Group recognises its interests in these arrangements as outlined above except that it presents gross liabilities and gross receivables of joint operations (including amounts due to or from non-operating partners) in the Group Balance Sheet in accordance with the netting rules of IAS 32.
162
STRATEGIC REPORT GOVERNANCE
SHAREHOLDER INFORMATION
FINANCIAL STATEMENTS NOTES TO THE FINANCIAL STATEMENTS

Notes to the Financial Statements Supplementary information
Centrica plc Annual Report and Accounts 2016 163
S2. SUMMARY OF SIGNIFICANT ACCOUNTING POLICIES Property, plant and equipment PP&E is included in the Group Balance Sheet at cost, less accumulated depreciation and any provisions for impairment. The initial cost of an asset comprises its purchase price or construction cost and any costs directly attributable to bringing the asset into operation. The purchase price or construction cost is the aggregate amount paid and the fair value of any other consideration given to acquire the asset.
Subsequent expenditure in respect of items of PP&E such as the replacement of major parts, major inspections or overhauls, are capitalised as part of the cost of the related asset where it is probable that future economic benefits will arise as a result of the expenditure and the cost can be reliably measured. All other subsequent expenditure, including the costs of day-to-day servicing, repairs and maintenance, is expensed as incurred.
Freehold land is not depreciated. Other PP&E, with the exception of upstream production assets (see above), are depreciated on a straight-line basis at rates sufficient to write off the cost, less estimated residual values, of individual assets over their estimated useful lives. The depreciation periods for the principal categories of assets are as follows:
Freehold and leasehold buildings Up to 50 years Plant Five to 20 years Equipment and vehicles Three to 10 years Power stations and wind farms Up to 30 years Gas storage Up to 40 years
Assets held under finance leases are depreciated over their expected useful economic lives on the same basis as for owned assets, or where shorter, the lease term.
The carrying values of PP&E are tested annually for impairment and are reviewed for impairment when events or changes in circumstances indicate that the carrying value may not be recoverable. Residual values and useful lives are reassessed annually and if necessary changes are accounted for prospectively.
Impairment assumptions Details of the approach taken to impairment are included in note 7(c). The following provides further information on the assumptions used in the VIU calculations:
VIU – Key assumptions used The VIU calculations use pre-tax cash flow projections based on the Group’s Board-approved business plans. The Group’s business plans are based on past experience, and adjusted to reflect market trends, economic conditions, key risks, the implementation of strategic objectives and changes in commodity prices, as appropriate. Commodity prices used in the planning process are based in part on observable market data and in part on internal estimates. The extent to which the commodity prices used in the business plans are based on observable market data is determined by the extent to which the market for the underlying commodity is judged to be active. Note S6 provides additional detail on the active period of each of the commodity markets in which the Group operates.
(a) VIU – Growth rates and discount rates Cash flows beyond the planned period have been extrapolated using long-term growth rates in the market where the CGU operates. Long-term growth rates are determined using a blend of publicly available historical data and long-term growth rate forecasts published by external analysts. Cash flows are discounted using a discount rate specific to each CGU. Discount rates reflect the current market assessments of the time value of money and are based on the estimated cost of capital of each CGU. Additionally, risks specific to the cash flows of the CGUs are reflected within cash flow forecasts. Each CGU’s weighted average cost of capital is then adjusted to reflect the impact of tax in order to calculate an equivalent pre-tax discount rate.
Long-term growth rates and pre-tax discount rates used in the VIU calculations for each of the Group’s CGUs are provided in the table below:
2016 (i)
Energy Supply & Services – UK Home
%
Energy Supply & Services – UK Business
%
Energy Supply & Services –
Ireland %
Energy Supply & Services – NA Home
(ii) %
Energy Supply & Services –
NA Business (ii) %
Connected Home
(iii) %
Distributed Energy & Power
(iii) %
Energy Marketing &
Trading %
Growth rate to perpetuity 1.9 1.9 1.5 2.2/2.1 2.2/2.1 2.2/1.9 2.2/1.9
1.9
Pre-tax discount rate 7.4 7.4 7.2 7.9/7.5 7.9/7.5 10.5/9.6 10.5/9.6 9.6
Comparative data has not been presented following the change in reporting segments. (i) US/Canada respectively. (ii) US/UK respectively. (iii)
(b) VIU – Inflation rates Inflation rates used in the business plan were based on a blend of a number of publicly available inflation forecasts for the UK, Canada, the Republic of Ireland and the US. Inflation rates used for the VIU calculations were as follows: UK: 2.0% (2015: 1.8%); Canada: 2.1% (2015: 2.1%); Republic of Ireland 1.5% (2015: 1.4%); and the US: 2.2% (2015: 2.2%).
Centrica plc Annual Report and Accounts 2016 163

Notes to the Financial Statements Supplementary information
164
S2. SUMMARY OF SIGNIFICANT ACCOUNTING POLICIES (c) Key operating assumptions by CGUs using VIU The key operating assumptions across all CGUs are gross margin, revenues and operating costs. Each of these assumptions is tailored to the specific CGU using management’s knowledge of the environment, as shown in the table below:
CGU Gross margin Revenues Operating costs Energy Supply & Services – UK Home
Existing customers: based on contractual terms. New customers and renewals: based on gross margins achieved in the period leading up to the date of the business plan. Both adjusted for current market conditions and transportation cost inflation. For the Services business, future sales and related gross margins are based on percentages achieved in the period up to the approval of the business plan.
Existing customers: based on contractual terms. Adjusted for: growth forecasts which are based on sales and marketing activity, recent customer acquisitions and current economic environment in the UK. Gas and electricity revenues based on forward market prices.
Wages: projected headcount in line with expected efficiency programme. Salary increases based on inflation expectations. Credit losses: historical assumptions regarding provisions have been updated to reflect the current UK environment.
Energy Supply & Services – UK Business
Existing customers: based on contractual terms. New customers and renewals: based on gross margins achieved in the period leading up to the date of the business plan. Both adjusted for current market conditions and transportation cost inflation.
Market share: percentage immediately prior to business plan. Adjusted for: growth forecasts which are based on sales, marketing activity, recent customer acquisitions and current economic environments in the UK. Gas and electricity revenues based on forward market prices.
Wages: projected headcount in line with expected activity. Salary increases based on inflation expectations. Credit losses: historical assumptions regarding provisions have been updated to reflect the current UK environment.
Energy Supply & Services – Ireland
Existing customers: based on contractual terms. New customers and renewals: based on gross margins achieved in the period leading up to the date of the business plan. Both adjusted for current market conditions, inflation and transportation costs.
Market share: percentage immediately prior to business plan. Adjusted for: growth forecasts which are based on sales, marketing activity and recent customer acquisitions. Gas and electricity revenues based on forward market prices.
Wages: projected headcount in line with expected activity. Salary increases based on inflation expectations. Credit losses: historical assumptions regarding provisions have been updated to reflect the current Irish market environment.
Energy Supply & Services – NA Home
Existing customers: based on contractual terms and gross margins achieved in the period leading up to the date of the business plan. New customers and renewals: based on gross margins achieved in the period leading up to the date of the business plan. Adjusted for: competitor data. For the Services business, adjustments are made for current economic conditions and the status of the housing market as appropriate.
Market share: average percentage immediately prior to business plan. For the Services business, the market share is based on historical growth trends and planned sales activities by individual market sectors. Adjusted for: expectations of growth or decline to reflect competitive differences. For the Services business, adjustments are made for new product offerings and continued penetration into new markets.
Wages: projected headcount in line with expected activity. Salary increases based on inflation expectations. Future developments: reduction in costs to reflect expected savings. Customer acquisition: based on experience of costs required to support acquisition, renewal and other servicing activities. Credit losses: historical assumptions regarding provisions have been updated to reflect the current North American environment.
Energy Supply & Services – NA Business
Existing customers: based on contractual terms. New customers and renewals: based on gross margins achieved historically.
Market share: based on historical growth trends and planned sales activities by individual market sector. Adjusted for: prices based on contractual terms for fixed price contracts and forward market curves for both gas and electricity in Canada and the US.
Wages: projected headcount in line with expected activity. Salary increases based on 3.5% salary growth. Future developments: reduction in costs to reflect expected savings. Customer acquisition: based on experience of costs required to support acquisition, renewal and other servicing activities. Credit losses: historical assumptions regarding provisions have been updated to reflect the current North American environment.
Connected Home
Future sales: based on gross margins achieved in the period leading up to the date of the business plan. Adjusted for: recurring revenue subscriptions by driving service led propositions.
Market share: based on current growth trends and planned sales activities by individual market sector. Adjusted for: new product offerings and continued penetration into new markets. One-off revenues based on current external rates. Recurring revenues based on expected package price and increase in number of products per customer to 3.0.
Wages: projected headcount in line with expected activity. Salary increases based on inflation expectations. Future developments: costs to increase in line with customer growth, adjusted to reflect planned business process efficiencies. Credit losses: historical assumptions regarding provisions have been updated to reflect the current UK and US environment.
164
STRATEGIC REPORT GOVERNANCE
SHAREHOLDER INFORMATION
FINANCIAL STATEMENTS NOTES TO THE FINANCIAL STATEMENTS

Notes to the Financial Statements Supplementary information
Centrica plc Annual Report and Accounts 2016 165
S2. SUMMARY OF SIGNIFICANT ACCOUNTING POLICIES
CGU Gross margin Revenues Operating costs Distributed Energy & Power
Existing customers: based on contractual terms. New customers and renewals: based on gross margins in the period leading up to the date of the business plan and estimates of future profitability.
Customer contracts: customer book immediately prior to business plan. Adjusted for: growth forecasts.
Wages: projected headcount in line with expected activity. Salary increases based on inflation expectations. Credit losses: estimated bad debt and allowances based on historical collection rights and trends which are evaluated by the business.
Energy Marketing & Trading
Asset-backed business: Existing customers: based on contractual terms. New customers and renewals: based on gross margins in the period leading up to the date of the business plan and estimates of future profitability. Trading business: Existing and new markets: management’s estimate of future trading performance.
Asset-backed business: customer book immediately prior to business plan. Adjusted for: growth forecasts.
Wages: projected headcount in line with expected activity. Salary increases based on inflation expectations. Bonuses: in line with expected business performance. Future development: increase in costs to support growth forecasts, adjusted for planned business process efficiencies.
Overlift and underlift Off-take arrangements for gas and oil produced from joint operations are often such that it is not practical for each participant to receive or sell its precise share of the overall production during the period. This results in short-term imbalances between cumulative production entitlement and cumulative sales, referred to as overlift and underlift.
An overlift payable, or underlift receivable, is recognised at the balance sheet date within trade and other payables or trade and other receivables respectively, and is measured at market value, with movements in the period recognised within cost of sales.
Leases The determination of whether an arrangement is, or contains, a lease is based on the substance of the arrangement and requires an assessment of whether the fulfilment of the arrangement is dependent on the use of a specific asset or assets and whether the arrangement conveys a right to use the asset or assets. Leases are classified as finance leases whenever the terms of the lease transfer substantially all the risks and rewards of ownership to the lessee. All other leases are classified as operating leases. Assets held under finance leases are capitalised and included in PP&E at their fair value, or if lower, at the present value of the minimum lease payments, each determined at the inception of the lease. The obligations relating to finance leases, net of finance charges in respect of future periods, are included within bank loans and other borrowings, with the amount payable within 12 months included in bank overdrafts and loans within current liabilities.
Lease payments are apportioned between finance charges and the reduction of the finance lease obligation so as to achieve a constant rate of interest on the remaining balance of the liability. Finance charges are charged directly against income.
Payments under operating leases are charged to the Group Income Statement on a straight-line basis over the term of the relevant lease.
Inventories Inventories are valued on a weighted-average cost basis, at the lower of cost, or estimated net realisable value after allowance for redundant and slow-moving items.
Decommissioning costs Provision is made for the net present value of the estimated cost of decommissioning gas and oil production facilities at the end of the producing lives of fields, and storage facilities and power stations at the end of their useful lives, based on price levels and technology at the balance sheet date.
When this provision relates to an asset with sufficient future economic benefits, a decommissioning asset is recognised and included as part of the associated PP&E and depreciated accordingly. If there is an indication that the new carrying amount of the asset is not fully recoverable, the asset is tested for impairment and an impairment loss is recognised where necessary. Changes in these estimates and changes to the discount rates are dealt with prospectively and reflected as an adjustment to the provision and corresponding decommissioning asset included within PP&E. The unwinding of the discount on the provision is included in the Group Income Statement within interest expense.
Non-current assets and disposal groups held for sale and discontinued operations Non-current assets (and disposal groups) classified as held for sale are measured at the lower of carrying amount and fair value less costs of disposal. No depreciation is charged in respect of non-current assets classified as held for sale.
Non-current assets and disposal groups are classified as held for sale if their carrying amount will be recovered through a sale transaction rather than through continuing use. This condition is regarded as met only when the sale is highly probable, the asset (or disposal group) is available for immediate sale in its present condition and the Directors are committed to the sale which should be expected to qualify for recognition as a completed sale within one year from the date of classification.
Centrica plc Annual Report and Accounts 2016 165
Notes to the Financial Statements Supplementary information
166
S2. SUMMARY OF SIGNIFICANT ACCOUNTING POLICIES The profits or losses and cash flows that relate to a major component of the Group that has been sold or is classified as held for sale are presented separately from continuing operations as discontinued operations within the Group Income Statement and Group Cash Flow Statement.
Pensions and other post employment benefits The Group operates a number of defined benefit and defined contribution pension schemes. The cost of providing benefits under the defined benefit schemes is determined separately for each scheme using the projected unit credit actuarial valuation method. Actuarial gains and losses are recognised in the period in which they occur in the Group Statement of Comprehensive Income.
The cost of providing retirement pensions and other benefits is charged to the Group Income Statement over the periods benefiting from employees’ service. Past service cost is recognised immediately. Costs of administering the schemes are charged to the Group Income Statement. Net interest, being the change in the net defined benefit liability or asset due to the passage of time is recognised in the Group Income Statement net finance cost.
The net defined benefit liability or asset recognised in the Group Balance Sheet represents the present value of the defined benefit obligation of the schemes, and the fair value of the schemes’ assets. The present value of the defined benefit obligation is determined by discounting the estimated future cash outflows using interest rates of high-quality corporate bonds that are denominated in the currency in which the benefits are paid, and that have terms of maturity approximating to the terms of the related pension liability.
Payments to defined contribution retirement benefit schemes are recognised in the Group Income Statement as they fall due.
Provisions Provisions are recognised when the Group has a present obligation (legal or constructive) as a result of a past event, that can be measured reliably, and it is probable that the Group will be required to settle that obligation. Provisions are measured at the best estimate of the expenditure required to settle the obligation at the balance sheet date, and are discounted to present value where the effect is material.
Where discounting is used, the increase in the provision due to the passage of time is recognised in the Group Income Statement within interest expense. Onerous contract provisions are recognised where the unavoidable costs of meeting the obligations under a contract exceed the economic benefits expected to be received under it. Contracts to purchase or sell energy are reviewed on a portfolio basis given the fungible nature of energy, whereby it is assumed that the highest priced purchase contract supplies the highest priced sales contract and the lowest priced sales contract is supplied by the lowest priced purchase contract.
Taxation Current tax, including UK corporation tax, UK petroleum revenue tax and foreign tax is provided at amounts expected to be paid (or recovered) using the tax rates and laws that have been enacted or substantively enacted by the balance sheet date. From time to time, the Group may have open tax issues with a number of revenue authorities. Where an outflow of funds is believed to be probable and a reliable estimate of the dispute can be made, management provides for its best estimate of the liability. These estimates take into account the specific circumstances of each dispute and relevant external advice. Each item is considered separately and on a basis that provides the better prediction of the outcome.
Deferred tax is recognised in respect of all temporary differences identified at the balance sheet date, except to the extent that the deferred tax arises from the initial recognition of goodwill (if impairment of goodwill is not deductible for tax purposes) or the initial recognition of an asset or liability in a transaction which is not a business combination and at the time of the transaction affects neither accounting profit nor taxable profit and loss. Temporary differences are differences between the carrying amount of the Group’s assets and liabilities and their tax base.
Deferred tax liabilities may be offset against deferred tax assets within the same taxable entity or qualifying local tax group. Any remaining deferred tax asset is recognised only when, on the basis of all available evidence, it can be regarded as probable that there will be suitable taxable profits, within the same jurisdiction, in the foreseeable future, against which the deductible temporary difference can be utilised.
Deferred tax is provided on temporary differences arising on subsidiaries, joint ventures and associates, except where the timing of the reversal of the temporary difference can be controlled and it is probable that the temporary difference will not reverse in the foreseeable future.
Deferred tax is measured at the average tax rates that are expected to apply in the periods in which the asset is realised or liability settled, based on tax rates and laws that have been enacted or substantively enacted by the balance sheet date. Measurement of deferred tax liabilities and assets reflects the tax consequences expected from the manner in which the asset or liability is recovered or settled.
Financial instruments Financial assets and financial liabilities are recognised in the Group Balance Sheet when the Group becomes a party to the contractual provisions of the instrument. Financial assets are derecognised when the Group no longer has the rights to cash flows, the risks and rewards of ownership or control of the asset. Financial liabilities are derecognised when the obligation under the liability is discharged, cancelled or expires.
(a) Trade receivables Trade receivables are initially recognised at fair value, which is usually the original invoice amount and are subsequently held at amortised cost using the effective interest rate method less an allowance for any uncollectible amounts. Provision is made when there is objective evidence that the Group may not be able to collect the trade receivable. Balances are written off when recoverability is assessed as being remote. If collection is due in one year or less, receivables are classified as current assets, if not they are presented as non-current assets.
166
STRATEGIC REPORT GOVERNANCE
SHAREHOLDER INFORMATION
FINANCIAL STATEMENTS NOTES TO THE FINANCIAL STATEMENTS
Notes to the Financial Statements Supplementary information
Centrica plc Annual Report and Accounts 2016 167
S2. SUMMARY OF SIGNIFICANT ACCOUNTING POLICIES (b) Trade payables Trade payables are initially recognised at fair value, which is usually the original invoice amount and are subsequently held at amortised cost using the effective interest rate method. If payment is due within one year or less, payables are classified as current liabilities, if not they are presented as non-current liabilities.
(c) Share capital Ordinary shares are classified as equity. Incremental costs directly attributable to the issue of new shares are shown in equity as a deduction from the proceeds received. Own equity instruments that are reacquired (treasury or own shares) are deducted from equity. No gain or loss is recognised in the Group Income Statement on the purchase, sale, issue or cancellation of the Group’s own equity instruments.
(d) Cash and cash equivalents Cash and cash equivalents comprise cash in hand and current balances with banks and similar institutions, which are readily convertible to known amounts of cash and which are subject to insignificant risk of changes in value and have an original maturity of three months or less.
For the purpose of the Group Cash Flow Statement, cash and cash equivalents consist of cash and cash equivalents as defined above, net of outstanding bank overdrafts.
(e) Interest-bearing loans and other borrowings All interest-bearing loans and other borrowings with banks and similar institutions are initially recognised at fair value net of directly attributable transaction costs. After initial recognition, interest-bearing loans and other borrowings are subsequently measured at amortised cost using the effective interest method, except when they are the hedged item in an effective fair value hedge relationship where the carrying value is also adjusted to reflect the fair value movements associated with the hedged risks. Such fair value movements are recognised in the Group Income Statement. Amortised cost is calculated by taking into account any issue costs, discount or premium.
(f) Available-for-sale financial assets Available-for-sale financial assets are those non-derivative financial assets that are designated as available-for-sale, which are recognised initially at fair value in the Group Balance Sheet. Available-for-sale financial assets are re-measured subsequently at fair value with gains and losses arising from changes in fair value recognised directly in equity and presented in the Group Statement of Comprehensive Income, until the asset is disposed of or is determined to be impaired, at which time the cumulative gain or loss previously recognised in equity is included in the Group Income Statement for the period. Accrued interest or dividends arising on available-for-sale financial assets are recognised in the Group Income Statement.
At each balance sheet date the Group assesses whether there is objective evidence that available-for-sale financial assets are impaired. If any such evidence exists, cumulative losses recognised in equity are removed from equity and recognised in the Group Income Statement. The cumulative loss removed from equity represents the difference between the acquisition cost and current fair value, less any impairment loss on that financial asset previously recognised in the Group Income Statement.
Impairment losses recognised in the Group Income Statement for equity investments classified as available-for-sale are not subsequently reversed through the Group Income Statement. Impairment losses recognised in the Group Income Statement for debt instruments classified as available-for-sale are subsequently reversed if an increase in the fair value of the instrument can be objectively related to an event occurring after the recognition of the impairment loss.
(g) Financial assets at fair value through profit or loss The Group holds investments in gilts which it designates at fair value through profit or loss. Investments are measured at fair value on initial recognition and are re-measured to fair value in each subsequent reporting period. Gains and losses arising from changes in fair value are recognised in the Group Income Statement within interest income or interest expense.
(h) Derivative financial instruments The Group routinely enters into sale and purchase transactions for physical delivery of gas, power and oil. A portion of these transactions take the form of contracts that were entered into and continue to be held for the purpose of receipt or delivery of the physical commodity in accordance with the Group’s expected sale, purchase or usage requirements (‘own use’), and are not within the scope of IAS 39. The assessment of whether a contract is deemed to be ‘own use’ is conducted on a Group basis without reference to underlying book structures, business units or legal entities.
Certain purchase and sales contracts for the physical delivery of gas, power and oil are within the scope of IAS 39 due to the fact that they net settle or contain written options. Such contracts are accounted for as derivatives under IAS 39 and are recognised in the Group Balance Sheet at fair value. Gains and losses arising from changes in fair value on derivatives that do not qualify for hedge accounting are taken directly to the Group Income Statement for the year.
The Group uses a range of derivatives for both trading and to hedge exposures to financial risks, such as interest rates, foreign exchange and energy price risks, arising in the normal course of business. The use of derivative financial instruments is governed by the Group’s policies which are approved by the Board of Directors. Further detail on the Group’s risk management policies is included within the Strategic Report – Principal Risks and Uncertainties on pages 56 to 64 and in note S3.
The accounting treatment of derivatives is dependent on whether they are entered into for trading or hedging purposes. A derivative instrument is considered to be used for hedging purposes when it alters the risk profile of an underlying exposure of the Group in line with the Group’s risk management policies and is in accordance with established guidelines. Certain derivative instruments used for hedging purposes are designated in hedge accounting relationships as described by IAS 39. In order to qualify for hedge accounting, the effectiveness of the hedge must be reliably measurable and documentation describing the formal hedging relationship must be prepared at the point of designation. The hedge must be highly effective in achieving its objective. The Group also holds derivatives that are used for hedging purposes which are not designated in hedge accounting relationships and are held for trading.
Centrica plc Annual Report and Accounts 2016 167

Notes to the Financial Statements Supplementary information
168
S2. SUMMARY OF SIGNIFICANT ACCOUNTING POLICIES All derivatives are recognised at fair value on the date on which the derivative is entered into and are re-measured to fair value at each reporting date. Derivatives are carried as assets when the fair value is positive and as liabilities when the fair value is negative. Derivative assets and derivative liabilities are offset and presented on a net basis only when both a legal right of set-off exists and the intention to net settle the derivative contracts is present.
The Group enters into certain energy derivative contracts covering periods for which observable market data does not exist. The fair value of such derivatives is estimated by reference in part to published price quotations from active markets, to the extent that such observable market data exists, and in part by using valuation techniques, the inputs to which include data that is not based on or derived from observable markets. Where the fair value at initial recognition for such contracts differs from the transaction price, a fair value gain or fair value loss will arise. This is referred to as a day-one gain or day-one loss. Such gains and losses are deferred (not recognised) and amortised to the Group Income Statement based on volumes purchased or delivered over the contractual period until such time as observable market data becomes available. When observable market data becomes available, any remaining deferred day-one gains or losses are recognised within the Group Income Statement. Recognition of the gains or losses resulting from changes in fair value depends on the purpose for issuing or holding the derivative. For derivatives that do not qualify for hedge accounting, any gains or losses arising from changes in fair value are taken directly to the Group Income Statement and are included within gross profit or interest income and interest expense. Gains and losses arising on derivatives entered into for speculative energy trading purposes are presented on a net basis within revenue.
Derivatives embedded in other financial instruments or other host contracts are treated as separate derivatives when their risks and characteristics are not closely related to those of the host contracts and the host contracts are not carried at fair value, with gains or losses reported in the Group Income Statement. The closely related nature of embedded derivatives is reassessed when there is a change in the terms of the contract that significantly modifies the future cash flows under the contract. Where a contract contains one or more embedded derivatives, and providing that the embedded derivative significantly modifies the cash flows under the contract, the option to fair value the entire contract may be taken and the contract will be recognised at fair value with changes in fair value recognised in the Group Income Statement.
(i) Hedge accounting For the purposes of hedge accounting, hedges are classified as either fair value hedges or cash flow hedges. Note S5 details the Group’s accounting policies in relation to derivatives qualifying for hedge accounting under IAS 39.
Nuclear activity The Group’s investment in Lake Acquisitions Limited (‘Nuclear’) is accounted for as an associate. The following accounting policies are specific to this nuclear activity.
(a) Fuel costs – nuclear front end Front end fuel costs consist of the costs of procurement of uranium, conversion and enrichment services and fuel element fabrication. All costs are capitalised into inventory and charged to the Group Income Statement in proportion to the amount of fuel burnt.
(b) Fuel costs – nuclear back end Advanced gas-cooled reactors (AGR) Spent fuel extracted from the reactors is sent for reprocessing and/or long-term storage and eventual disposal of resulting waste products. Back end fuel costs comprise of a loading related cost per tonne of uranium and a rebate/surcharge to this cost which is dependent on the out-turn market electricity price in the year and are capitalised into inventory and charged to the Group Income Statement in proportion to the amount of fuel burnt.
Pressurised water reactor (PWR) Back end fuel costs are based on wet storage in station ponds followed by dry storage and subsequent direct disposal of fuel. Back end fuel costs are capitalised into inventory on loading and are charged to the Group Income Statement in proportion to the amount of fuel burnt.
(c) Nuclear property, plant and equipment and depreciation The majority of the costs of the nuclear fleet is depreciated from the date of the Group acquiring its share of the fleet on a straight-line basis, with remaining depreciable periods currently of up to 19 years.
Other expenditure including amounts spent on major inspections and overhauls of production plant is depreciated over the period until the next outage which for AGR power stations is three years and for the PWR power station is 18 months.
(d) Nuclear Liabilities Fund (NLF) funding arrangements Under the arrangements in place with the Secretary of State, the NLF will fund, subject to certain exceptions, qualifying uncontracted nuclear liabilities and qualifying decommissioning costs.
In part consideration for the assumption of these liabilities by the Secretary of State and the NLF, the former British Energy Group agreed to pay fixed decommissioning contributions each year and £150,000 (indexed to RPI) for every tonne of uranium in PWR fuel loaded into the Sizewell B reactor after the date of these arrangements.
(e) NLF and nuclear liabilities receivables The UK Government indemnity is provided to indemnify any future shortfall on NLF funding of qualifying uncontracted nuclear liabilities (including PWR back end fuel services) and qualifying nuclear decommissioning costs such that the receivable equals the present value of the associated qualifying nuclear liabilities (apart from a small timing difference due to timing of receipts from NLF).
(f) Nuclear liabilities Nuclear liabilities represent provision for liabilities in respect of the costs of waste management of spent fuel and nuclear decommissioning.
168
STRATEGIC REPORT GOVERNANCE
SHAREHOLDER INFORMATION
FINANCIAL STATEMENTS NOTES TO THE FINANCIAL STATEMENTS
Notes to the Financial Statements Supplementary information
Centrica plc Annual Report and Accounts 2016 169
S2. SUMMARY OF SIGNIFICANT ACCOUNTING POLICIES (g) Unburnt fuels at shutdown Due to the nature of the nuclear fuel process there will be quantities of unburnt fuel in the reactors at station closure. The costs relating to this unburnt fuel (final core) are fully provided for at the balance sheet date. The provision is based on a projected value per tonne of fuel remaining at closure, discounted back to the balance sheet date and recorded as a long term liability.
S3. FINANCIAL RISK MANAGEMENT
The Group’s normal operating, investing and financing activities expose it to a variety of financial risks: market risk (including commodity price risk, currency risk and interest rate risk), credit risk and liquidity risk. The Group’s overall financial risk management processes are designed to identify, manage and mitigate these risks.
Further detail on the Group’s overall risk management processes is included within the Strategic Report – Principal Risks and Uncertainties on pages 56 to 64.
The Group Financial Risk Management Committee (GFRMC) continued to advise on consolidated Group-wide commodity price risks according to objectives, targets and policies set out by the Board. Commodity price risk management is carried out in accordance with individual business unit policies and directives including appropriate escalation routes.
Treasury risk management, including management of currency risk, interest rate risk and liquidity risk is carried out by a central Group Treasury function in accordance with the Group’s financing and treasury policy, as approved by the Board.
The wholesale credit risks associated with commodity trading and treasury positions are managed in accordance with the Group’s credit risk policy and collateral risk policy. Downstream customer credit risk management is carried out in accordance with individual business unit credit policies.
Market risk management Market risk is the risk of loss that results from changes in market prices (commodity prices, foreign exchange rates and interest rates). The level of market risk to which the Group is exposed at a point in time varies depending on market conditions, expectations of future price or market rate movements and the composition of the Group’s physical asset and contract portfolios.
(a) Commodity price risk management The Group is exposed to commodity price risk in its upstream assets, energy procurement contracts, downstream and proprietary energy trading activities and uses specific limits to manage the exposure to commodity prices associated with the Group’s activities to an acceptable level. The Group uses Profit at Risk (PaR) limits to control exposures to market prices. These are complemented by other limits including Value at Risk (VaR), volumetric or stop-loss limits to control risk around trading activities.
(i) Energy procurement, upstream and downstream activities The Group’s energy procurement, upstream and downstream activities consist of equity gas and liquids production, equity power generation, bilateral procurement and sales contracts, market-traded purchase and sales contracts and derivative positions transacted with the intent of securing gas and power for the Group’s downstream customers in the UK, North America and the Republic of Ireland from a variety of sources at an optimal cost. The Group actively manages commodity price risk by optimising its asset and contract portfolios and making use of volume flexibility.
The Group’s commodity price risk exposure in its energy procurement, upstream and downstream activities is driven by the cost of procuring gas and electricity to serve its downstream customers and selling gas, oil and electricity from its upstream production, which varies with wholesale commodity prices. The primary risk is that market prices for commodities will fluctuate between the time that sales prices are fixed or tariffs are set and the time at which the corresponding procurement cost is fixed, thereby potentially reducing expected margins or making sales unprofitable.
The Group’s downstream activities are also exposed to volumetric risk in the form of an uncertain consumption profile arising from a range of factors, including the weather, energy consumption changes, customer attrition and the economic climate. There is also risk associated with ensuring that there is sufficient commodity available to secure supply to customers. The Group’s upstream activities are also exposed to volumetric risk in the form of uncertain production profiles.
In order to manage the exposure to market prices associated with the Group’s energy procurement, upstream and downstream activities the Group uses a specific set of limits (including volumetric, VaR, PaR and stop-loss) established by the Board, Executive Committee, GFRMC or business unit Financial Risk Committees.
PaR measures the estimated potential loss in a position or portfolio of positions associated with the movement of a commodity price for a given confidence level, over the remaining term of the position or contract. VaR measures the estimated potential loss for a given confidence level over a predetermined holding period. The standard confidence level used is 95%. In addition, regular stress and scenario tests are performed to evaluate the impact on the portfolio of possible substantial movements in commodity prices.
The Group measures and manages the commodity price risk associated with the Group’s entire energy procurement, upstream and downstream portfolio. Only certain of the Group’s energy procurement, upstream and downstream contracts constitute financial instruments under IAS 39 (note S6).
As a result, while the Group manages the commodity price risk associated with both financial and non-financial energy procurement, upstream and downstream contracts, it is the notional value of energy contracts being carried at fair value that represents the exposure of the Group’s energy procurement, upstream and downstream activities to commodity price risk according to IFRS 7: ‘Financial instruments: disclosures’. This is because energy contracts that are financial instruments under IAS 39 are accounted for on a fair value basis and changes in fair value immediately impact profit or equity. Conversely, energy contracts that are not financial instruments under
Centrica plc Annual Report and Accounts 2016 169

Notes to the Financial Statements Supplementary information
170
S3. FINANCIAL RISK MANAGEMENT IAS 39 are accounted for as executory contracts and changes in fair value do not immediately impact profit or equity, and as such, are not exposed to commodity price risk as defined by IFRS 7. So whilst the PaR or VaR associated with energy procurement and downstream contracts that are outside the scope of IAS 39 are monitored for internal risk management purposes; only those energy contracts within the scope of IAS 39 are within the scope of the IFRS 7 disclosure requirements.
(ii) Proprietary energy trading The Group’s proprietary energy trading activities consist of physical and financial commodity purchases and sales contracts taken on with the intent of benefiting from changes in market prices or differences between buying and selling prices. The Group conducts its trading activities in the over-the-counter market and through exchanges in the UK, North America and continental Europe. The Group is exposed to commodity price risk as a result of its proprietary energy trading activities because the value of its trading assets and liabilities will fluctuate with changes in market prices for commodities.
The Group sets volumetric and VaR limits to manage the commodity price risk exposure associated with the Group’s proprietary energy trading activities. VaR measures the estimated potential loss at a 95% confidence level over a one-day holding period. The carrying value of energy contracts used in proprietary energy trading activities at 31 December 2016 is disclosed in note 19.
As with any modelled risk measure, there are certain limitations that arise from the assumptions used in the VaR calculation. VaR assumes that historical price behaviours will continue in the future and that the Group’s trading positions can be unwound or hedged within the predetermined holding period. Furthermore, the use of a 95% confidence level, by definition, does not take into account changes in value that might occur beyond this confidence level.
(b) Currency risk management The Group is exposed to currency risk on foreign currency denominated forecast transactions, firm commitments, monetary assets and liabilities (transactional exposure) and on its net investments in foreign operations (translational exposure). IFRS 7 only requires disclosure of currency risk arising on financial instruments denominated in a currency other than the functional currency of the commercial operation transacting. As a result, for the purposes of IFRS 7, currency risk excludes the Group’s net investments in international operations as well as foreign currency denominated forecast transactions and firm commitments.
(i) Transactional currency risk The Group is exposed to transactional currency risk on transactions denominated in currencies other than the underlying functional currency of the commercial operation transacting. The Group has been increasing its international presence through acquisition and the primary functional currencies remain pounds sterling in the UK, Canadian dollars in Canada, US dollars in the US, Norwegian krone in Norway and euros in the Netherlands and the Republic of Ireland, with the addition of Danish krone in Denmark following the acquisition of Neas Energy. The risk is that the functional currency value of cash flows will vary as a result of movements in exchange rates. Transactional exposure arises from the Group’s energy procurement and upstream activities, where many transactions are denominated in foreign currencies. In addition, in order to optimise the cost of funding, the Group has, in certain cases, issued foreign currency denominated debt or entered into foreign currency loans, primarily in US dollars, euros, Japanese yen or Hong Kong dollars.
It is the Group’s policy to hedge material transactional exposures using derivatives to fix the functional currency value of non-functional currency cash flows, except where there is an economic hedge inherent in the transaction. At 31 December 2016, there were no material unhedged non-functional currency monetary assets or liabilities, firm commitments or probable forecast transactions (2015: nil), other than transactions which have an inherent economic hedge and foreign currency borrowings used to hedge translational exposures.
(ii) Translational currency risk The Group is exposed to translational currency risk as a result of its net investments in North America and Europe. The risk is that the pound sterling value of the net assets of foreign operations will decrease with changes in foreign exchange rates. The Group’s policy is to protect the pounds sterling book value of its net investments in foreign operations where appropriate, subject to certain parameters monitored by the GFRMC, by holding foreign currency debt, entering into foreign currency derivatives, or a mixture of both.
The Group manages translational currency risk taking into consideration the cash impact of any hedging activity as well as the risk to the net asset numbers in the Group’s Financial Statements. The translation hedging programme including the potential cash impact is monitored by the GFRMC.
(c) Interest rate risk management In the normal course of business the Group borrows to finance its operations. The Group is exposed to interest rate risk because the fair value of fixed rate borrowings and the cash flows associated with floating rate borrowings will fluctuate with changes in interest rates. The Group’s policy is to manage the interest rate risk on long-term borrowings by ensuring the exposure to floating interest rates remains within a 30% to 70% range, including the impact of interest rate derivatives.
The return generated on the Group’s cash balance is also exposed to movements in short term interest rates. The Group manages cash balances to protect against adverse changes in rates whilst retaining liquidity.
(d) Sensitivity analysis IFRS 7 requires disclosure of a sensitivity analysis that is intended to illustrate the sensitivity of the Group’s financial position and performance to changes in market variables (commodity prices, foreign exchange rates and interest rates) as a result of changes in the fair value or cash flows associated with the Group’s financial instruments. The sensitivity analysis provided discloses the effect on profit or loss and equity at 31 December 2016, assuming that a reasonably possible change in the relevant risk variable had occurred at 31 December 2016, and has been applied to the risk exposures in existence at that date to show the effects of reasonably possible changes in price on profit or loss and equity. Reasonably possible changes in market variables used in the sensitivity analysis are based on implied volatilities, where available, or historical data for energy prices and foreign exchange rates. Reasonably possible changes in interest rates are based on management judgement and historical experience.
170
STRATEGIC REPORT GOVERNANCE
SHAREHOLDER INFORMATION
FINANCIAL STATEMENTS NOTES TO THE FINANCIAL STATEMENTS
Notes to the Financial Statements Supplementary information
Centrica plc Annual Report and Accounts 2016 171
S3. FINANCIAL RISK MANAGEMENT The sensitivity analysis has been prepared based on 31 December 2016 balances and on the basis that the balances, the ratio of fixed to floating rates of debt and derivatives, the proportion of energy contracts that are financial instruments, the proportion of financial instruments in foreign currencies and the hedge designations in place at 31 December 2016 are all constant. Excluded from this analysis are all non-financial assets and liabilities and energy contracts that are not financial instruments under IAS 39. The sensitivity to foreign exchange rates relates only to monetary assets and liabilities denominated in a currency other than the functional currency of the commercial operation transacting, and excludes the translation of the net assets of foreign operations to pounds sterling.
The sensitivity analysis provided is hypothetical only and should be used with caution as the impacts provided are not necessarily indicative of the actual impacts that would be experienced. This is because the Group’s actual exposure to market rates is changing constantly as the Group’s portfolio of commodity, debt and foreign currency contracts changes. Changes in fair values or cash flows based on a variation in a market variable cannot be extrapolated because the relationship between the change in market variable and the change in fair value or cash flows may not be linear. In addition, the effect of a change in a particular market variable on fair values or cash flows is calculated without considering interrelationships between the various market rates or mitigating actions that would be taken by the Group. The sensitivity analysis provided excludes the impact of proprietary energy trading assets and liabilities because the VaR associated with the Group’s proprietary energy trading activities is less than £5 million.
(i) Transactional currency risk The Group has performed an analysis of the sensitivity of the Group’s financial position and performance to changes in foreign exchange rates. The Group deems 10% movements to US dollar, Canadian dollar and euro currency rates relative to pounds sterling to be reasonably possible. The impact of such movements on profit and equity, both before and after taxation, is immaterial to the Group except for US dollar where a 10% upward movement would increase profit by £99 million and a 10% downward movement would decrease profit by £149 million.
(ii) Interest rate risk The Group has performed an analysis of the sensitivity of the Group’s financial position and performance to changes in interest rates. The Group deems a one percentage point move in UK, US and euro interest rates to be reasonably possible. The impact of such movements on profit and equity, both after taxation, is immaterial.
(iii) Commodity price risk The impacts of reasonably possible changes in commodity prices on profit and equity, both after taxation, based on the assumptions set out above are as follows:
Energy prices Base price
(i)
2016 Reasonably
possible change in variable
% (ii) Base price
(i)
2015 Reasonably
possible change in variable
% (ii)
UK gas (p/therm) 49 +/–15 34 +/–15 UK power (£/MWh) 46 +/–14 36 +/–11 UK coal (US$/tonne) 65 +/–19 43 +/–9 UK emissions (€/tonne) 7 +/–23 8 +/–11 UK oil (US$/bbl) 58 +/–14 47 +/–15 North American gas (US cents/therm) 37 +/–4 25 +/–4 North American power (US$/MWh) 32 +/–6 34 +/–6
Incremental profit/(loss)
2016 Impact on
profit (ii) £m
2015 Impact on
profit (ii) £m
UK energy prices (combined) – increase/(decrease) 82/(86) 52/(63) North American energy prices (combined) – increase/(decrease) 117/(117) 93/(93)
The base price represents the average forward market price over the duration of the active market curve used in the sensitivity analysis provided. (i) The reasonably possible change in variable and the impact on profit are calculated using both the active and inactive market curves for all UK energy prices. (ii)
The impact on equity of such price changes is immaterial.
Credit risk management Credit risk is the risk of loss associated with a counterparty’s inability or failure to discharge its obligations under a contract. The Group continually reviews its rating thresholds for counterparty credit limits, and updates these as necessary based on a consistent set of principles. It continues to operate within its limits. In both the US and Europe, there is an effort to maintain a balance between exchange base trading and bilateral transactions. This allows for a reasonable balance between counterparty credit risk and large liquidity requirements. In addition the Group actively manages the trade-off between credit and liquidity risks by optimising the use of contracts with collateral obligations and physically settled contracts without collateral obligations.
The continued downward pressure in global commodity prices during the year has added financial pressure to many of our counterparties and, in some cases, has had a detrimental impact on their financial strength and resulting credit risk profile. These pressures have been and will continue to be taken into account in counterparty credit reviews. During the year, many large European utilities have been downgraded lowering the overall credit assessment of the industry although market access has not been significantly impaired because of this.
Centrica plc Annual Report and Accounts 2016 171
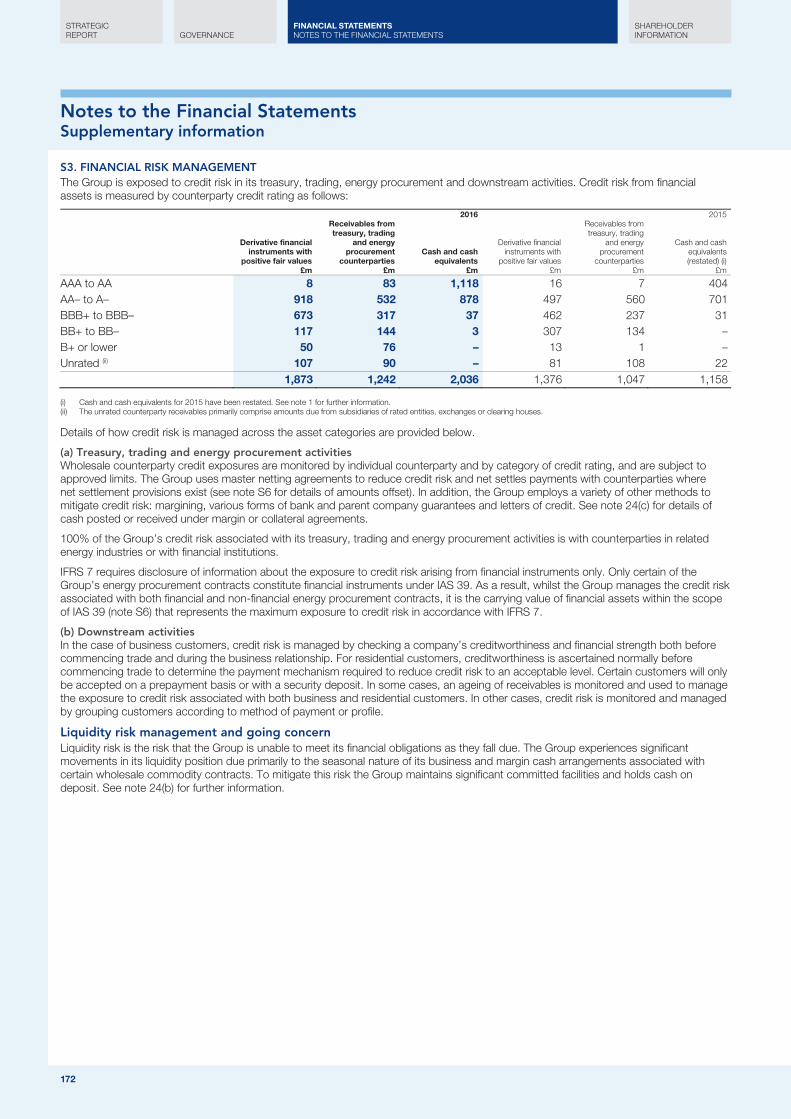
Notes to the Financial Statements Supplementary information
172
S3. FINANCIAL RISK MANAGEMENT The Group is exposed to credit risk in its treasury, trading, energy procurement and downstream activities. Credit risk from financial assets is measured by counterparty credit rating as follows:
2016 2015
Derivative financial instruments with
positive fair values £m
Receivables from treasury, trading
and energy procurement
counterparties £m
Cash and cash equivalents
£m
Derivative financial instruments with
positive fair values £m
Receivables from treasury, trading
and energy procurement
counterparties £m
Cash and cash equivalents (restated) (i)
£m
AAA to AA 8 83 1,118 16 7 404 AA– to A– 918 532 878 497 560 701 BBB+ to BBB– 673 317 37 462 237 31 BB+ to BB– 117 144 3 307 134 – B+ or lower 50 76 – 13 1 – Unrated (ii) 107 90 – 81 108 22 1,873 1,242 2,036 1,376 1,047 1,158
Cash and cash equivalents for 2015 have been restated. See note 1 for further information. (i) The unrated counterparty receivables primarily comprise amounts due from subsidiaries of rated entities, exchanges or clearing houses. (ii)
Details of how credit risk is managed across the asset categories are provided below.
(a) Treasury, trading and energy procurement activities Wholesale counterparty credit exposures are monitored by individual counterparty and by category of credit rating, and are subject to approved limits. The Group uses master netting agreements to reduce credit risk and net settles payments with counterparties where net settlement provisions exist (see note S6 for details of amounts offset). In addition, the Group employs a variety of other methods to mitigate credit risk: margining, various forms of bank and parent company guarantees and letters of credit. See note 24(c) for details of cash posted or received under margin or collateral agreements.
100% of the Group’s credit risk associated with its treasury, trading and energy procurement activities is with counterparties in related energy industries or with financial institutions.
IFRS 7 requires disclosure of information about the exposure to credit risk arising from financial instruments only. Only certain of the Group’s energy procurement contracts constitute financial instruments under IAS 39. As a result, whilst the Group manages the credit risk associated with both financial and non-financial energy procurement contracts, it is the carrying value of financial assets within the scope of IAS 39 (note S6) that represents the maximum exposure to credit risk in accordance with IFRS 7.
(b) Downstream activities In the case of business customers, credit risk is managed by checking a company’s creditworthiness and financial strength both before commencing trade and during the business relationship. For residential customers, creditworthiness is ascertained normally before commencing trade to determine the payment mechanism required to reduce credit risk to an acceptable level. Certain customers will only be accepted on a prepayment basis or with a security deposit. In some cases, an ageing of receivables is monitored and used to manage the exposure to credit risk associated with both business and residential customers. In other cases, credit risk is monitored and managed by grouping customers according to method of payment or profile.
Liquidity risk management and going concern Liquidity risk is the risk that the Group is unable to meet its financial obligations as they fall due. The Group experiences significant movements in its liquidity position due primarily to the seasonal nature of its business and margin cash arrangements associated with certain wholesale commodity contracts. To mitigate this risk the Group maintains significant committed facilities and holds cash on deposit. See note 24(b) for further information.
172
STRATEGIC REPORT GOVERNANCE
SHAREHOLDER INFORMATION
FINANCIAL STATEMENTS NOTES TO THE FINANCIAL STATEMENTS
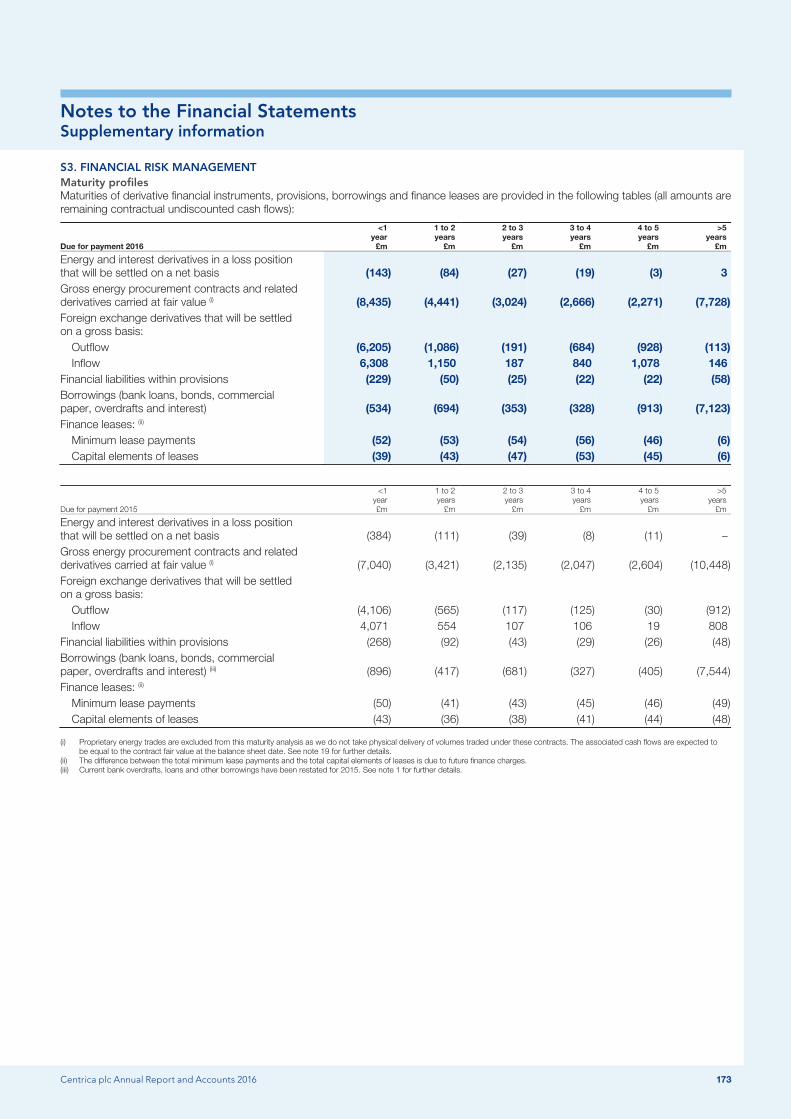
Notes to the Financial Statements Supplementary information
Centrica plc Annual Report and Accounts 2016 173
S3. FINANCIAL RISK MANAGEMENT Maturity profiles Maturities of derivative financial instruments, provisions, borrowings and finance leases are provided in the following tables (all amounts are remaining contractual undiscounted cash flows):
Due for payment 2016
<1 year
£m
1 to 2 years
£m
2 to 3 years
£m
3 to 4 years
£m
4 to 5 years
£m
>5 years
£m
Energy and interest derivatives in a loss position that will be settled on a net basis (143) (84) (27) (19) (3) 3 Gross energy procurement contracts and related derivatives carried at fair value (i) (8,435) (4,441) (3,024) (2,666) (2,271) (7,728) Foreign exchange derivatives that will be settled on a gross basis:
Outflow (6,205) (1,086) (191) (684) (928) (113) Inflow 6,308 1,150 187 840 1,078 146
Financial liabilities within provisions (229) (50) (25) (22) (22) (58) Borrowings (bank loans, bonds, commercial paper, overdrafts and interest) (534) (694) (353) (328) (913) (7,123) Finance leases: (ii)
Minimum lease payments (52) (53) (54) (56) (46) (6) Capital elements of leases (39) (43) (47) (53) (45) (6)
Due for payment 2015
<1 year £m
1 to 2 years
£m
2 to 3 years
£m
3 to 4 years
£m
4 to 5 years
£m
>5 years
£m
Energy and interest derivatives in a loss position that will be settled on a net basis (384) (111) (39) (8) (11) – Gross energy procurement contracts and related derivatives carried at fair value (i) (7,040) (3,421) (2,135) (2,047) (2,604) (10,448) Foreign exchange derivatives that will be settled on a gross basis:
Outflow (4,106) (565) (117) (125) (30) (912) Inflow 4,071 554 107 106 19 808
Financial liabilities within provisions (268) (92) (43) (29) (26) (48) Borrowings (bank loans, bonds, commercial paper, overdrafts and interest) (iii) (896) (417) (681) (327) (405) (7,544) Finance leases: (ii)
Minimum lease payments (50) (41) (43) (45) (46) (49) Capital elements of leases (43) (36) (38) (41) (44) (48)
Proprietary energy trades are excluded from this maturity analysis as we do not take physical delivery of volumes traded under these contracts. The associated cash flows are expected to (i)be equal to the contract fair value at the balance sheet date. See note 19 for further details.
The difference between the total minimum lease payments and the total capital elements of leases is due to future finance charges. (ii) Current bank overdrafts, loans and other borrowings have been restated for 2015. See note 1 for further details. (iii)
Centrica plc Annual Report and Accounts 2016 173

Notes to the Financial Statements Supplementary information
174
S4. OTHER EQUITY
This section summarises the Group’s other equity reserve movements.
Cash flow
hedging reserve
£m
Foreign currency
translation reserve
£m
Actuarial gains and
losses reserve
£m
Available- for-sale reserve
(AFS) £m
Treasury and own
shares reserve
£m
Share- based
payments reserve
£m
Merger and capital
redemption reserve
£m Total
£m
1 January 2015 (25) (341) (316) 18 (256) 95 493 (332) Revaluation of available-for-sale securities – – – 5 – – – 5 Actuarial loss – – (321) – – – – (321) Employee share schemes:
Increase in own shares – – – – (11) – – (11) Exercise of awards – – – – 69 (45) – 24 Value of services provided – – – – – 45 – 45
Cash flow hedges: Net gains 20 – – – – – – 20 Transferred to income and expense (12) – – – – – – (12) Transferred to assets and liabilities 7 – – – – – – 7
Share of other comprehensive income/(loss) of joint ventures and associates, net of taxation 3 – (8) – – – – (5) Taxation on above items (6) – 50 – – (2) – 42 Exchange adjustments – (221) 3 – – – – (218) 31 December 2015 (13) (562) (592) 23 (198) 93 493 (756) Revaluation of available-for-sale securities – – – 9 – – – 9 Transfer of available-for-sale reserve to income statement – – – (5) – – – (5) Actuarial loss – – (1,174) – – – – (1,174) Employee share schemes:
Increase in own shares – – – – (17) – – (17) Exercise of awards – – – – 35 (32) – 3 Value of services provided – – – – – 46 – 46
Cash flow hedges: Net gains 161 – – – – – – 161 Transferred to income and expense (129) – – – – – – (129) Transferred to assets and liabilities (4) – – – – – – (4)
Share of other comprehensive (loss)/income of joint ventures and associates, net of taxation (4) – 65 – – – – 61 Taxation on above items (3) – 194 (1) – – – 190 Exchange adjustments – 513 (7) – – – – 506 31 December 2016 8 (49) (1,514) 26 (180) 107 493 (1,109)
Merger reserve During February 1997, BG plc (formerly British Gas plc) demerged certain businesses (grouped together under GB Gas Holdings Limited (GBGH)) to form Centrica plc. Upon demerger, the share capital of GBGH was transferred to Centrica plc and was recorded at the nominal value of shares issued to BG plc shareholders. In accordance with the Companies Act 1985, no premium was recorded on the shares issued. On consolidation, the difference between the nominal value of the Company’s shares issued and the amount of share capital and share premium of GBGH at the date of demerger was credited to a merger reserve.
Capital redemption reserve In accordance with the Companies Act 1985, the Company has transferred to the capital redemption reserve an amount equal to the nominal value of shares repurchased and subsequently cancelled. Up to 31 December 2016 the cumulative nominal value of shares repurchased and subsequently cancelled was £26 million (2015: £26 million).
174
STRATEGIC REPORT GOVERNANCE
SHAREHOLDER INFORMATION
FINANCIAL STATEMENTS NOTES TO THE FINANCIAL STATEMENTS

Notes to the Financial Statements Supplementary information
Centrica plc Annual Report and Accounts 2016 175
S4. OTHER EQUITY Own shares reserve The own shares reserve reflects the cost of shares in the Company held in the Centrica employee share ownership trusts to meet the future requirements of the Group’s share-based payment plans.
Treasury shares reserve Treasury shares are acquired equity instruments of the Company.
Share-based payments reserve The share-based payments reserve reflects the obligation to deliver shares to employees under the Group’s share schemes in return for services provided.
Foreign currency translation reserve The foreign currency translation reserve comprises exchange adjustments on the translation of the Group’s foreign operations. Historically the Group has hedged its net investments in these foreign operations and the opening balance of the foreign currency translation reserve includes exchange translation adjustments on borrowings and derivatives classified as net investment hedges under the requirements of IAS 39. Note S5 provides further detail on historical net investment hedges.
Cash flow hedging reserve The cash flow hedging reserve comprises fair value movements on instruments designated as cash flow hedges under the requirements of IAS 39. Amounts are transferred from the cash flow hedging reserve to the Group Income Statement or Group Balance Sheet as and when the hedged item affects the Group Income Statement or Group Balance Sheet which is, for the most part, on receipt or payment of amounts denominated in foreign currencies and settlement of interest on debt instruments. Note S5 provides further detail on cash flow hedging.
S5. HEDGE ACCOUNTING
For the purposes of hedge accounting, hedges are classified either as fair value hedges, cash flow hedges or, in previous periods, hedges of net investments in foreign operations.
The fair values of derivatives and primary financial instruments in hedge accounting relationships at 31 December were as follows:
31 December Assets
£m
2016 Liabilities
£m Assets
£m
2015 Liabilities
£m
Fair value hedges 158 (5) 129 (2) Cash flow hedges 151 (3) 28 (69)
The Group’s accounting policies in relation to derivatives qualifying for hedge accounting under IAS 39 are described below.
Fair value hedges A derivative is designated as a hedging instrument and its relationship to a recognised asset or liability is classified as a fair value hedge when it hedges the exposure to changes in the fair value of that recognised asset or liability. The Group’s fair value hedges consist of interest rate swaps used to protect against changes in the fair value of fixed-rate, long-term debt due to movements in market interest rates. Any gain or loss from re-measuring the hedging instrument to fair value is recognised immediately in the Group Income Statement. Any gain or loss on the hedged item attributable to the hedged risk is adjusted against the carrying amount of the hedged item and recognised in the Group Income Statement within net finance cost. The Group discontinues fair value hedge accounting if the hedging instrument expires or is sold, terminated or exercised, the hedge no longer qualifies for hedge accounting or the Group revokes the designation. Any adjustment to the carrying amount of a hedged financial instrument for which the effective interest method is used is amortised to the Group Income Statement. Amortisation may begin as soon as an adjustment exists and shall begin no later than when the hedged item ceases to be adjusted for changes in its fair value attributable to the risk being hedged.
Gains or losses arising on fair value hedges net of gains or losses arising on hedged items attributable to the hedged risk for the years ended 31 December 2016 and 31 December 2015 were immaterial.
Cash flow hedges A derivative is classified as a cash flow hedge when it hedges exposure to variability in cash flows that is attributable to a particular risk either associated with a recognised asset, liability or a highly probable forecast transaction. The Group’s cash flow hedges consist primarily of:
● forward foreign exchange contracts used to protect against the variability of functional currency denominated cash flows associated with non-functional currency denominated highly probable forecast transactions;
● interest rate swaps used to protect against the variability in cash flows associated with floating-rate borrowings due to movements in market interest rates; and
● cross-currency interest rate swaps and forward foreign exchange contracts used to protect against the variability in cash flows associated with borrowings denominated in non-functional currencies.
Centrica plc Annual Report and Accounts 2016 175
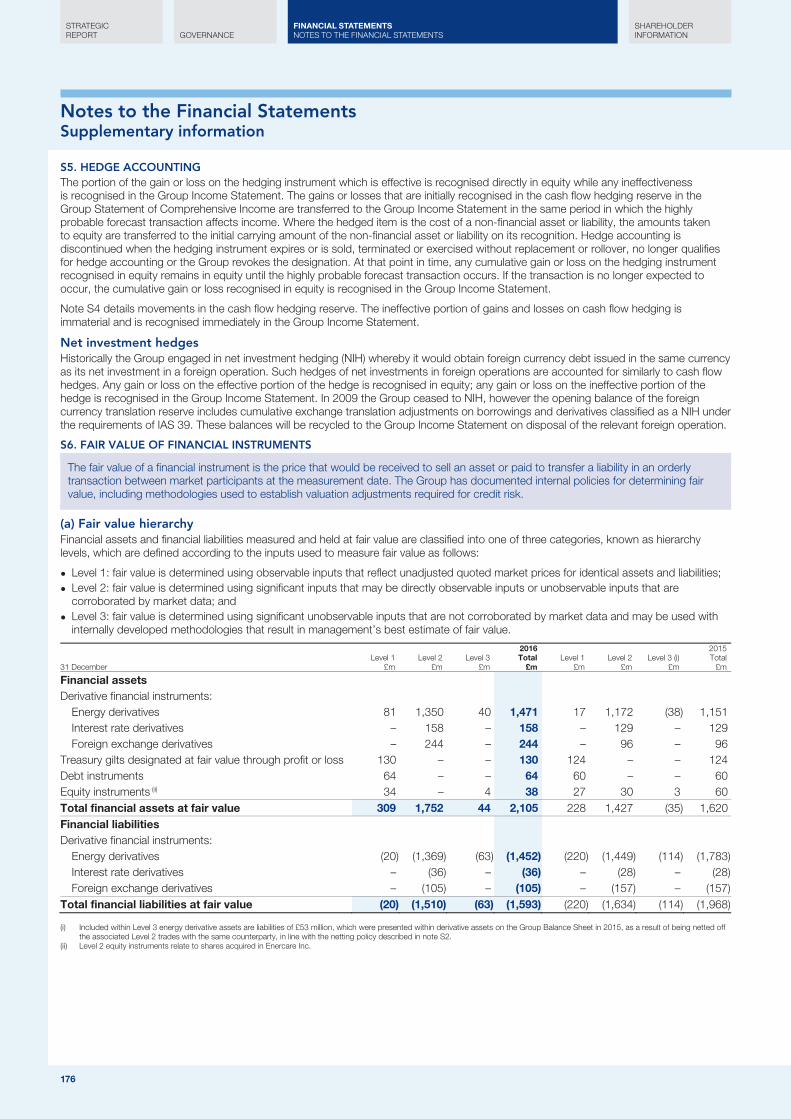
Notes to the Financial Statements Supplementary information
176
S5. HEDGE ACCOUNTING The portion of the gain or loss on the hedging instrument which is effective is recognised directly in equity while any ineffectiveness is recognised in the Group Income Statement. The gains or losses that are initially recognised in the cash flow hedging reserve in the Group Statement of Comprehensive Income are transferred to the Group Income Statement in the same period in which the highly probable forecast transaction affects income. Where the hedged item is the cost of a non-financial asset or liability, the amounts taken to equity are transferred to the initial carrying amount of the non-financial asset or liability on its recognition. Hedge accounting is discontinued when the hedging instrument expires or is sold, terminated or exercised without replacement or rollover, no longer qualifies for hedge accounting or the Group revokes the designation. At that point in time, any cumulative gain or loss on the hedging instrument recognised in equity remains in equity until the highly probable forecast transaction occurs. If the transaction is no longer expected to occur, the cumulative gain or loss recognised in equity is recognised in the Group Income Statement.
Note S4 details movements in the cash flow hedging reserve. The ineffective portion of gains and losses on cash flow hedging is immaterial and is recognised immediately in the Group Income Statement.
Net investment hedges Historically the Group engaged in net investment hedging (NIH) whereby it would obtain foreign currency debt issued in the same currency as its net investment in a foreign operation. Such hedges of net investments in foreign operations are accounted for similarly to cash flow hedges. Any gain or loss on the effective portion of the hedge is recognised in equity; any gain or loss on the ineffective portion of the hedge is recognised in the Group Income Statement. In 2009 the Group ceased to NIH, however the opening balance of the foreign currency translation reserve includes cumulative exchange translation adjustments on borrowings and derivatives classified as a NIH under the requirements of IAS 39. These balances will be recycled to the Group Income Statement on disposal of the relevant foreign operation.
S6. FAIR VALUE OF FINANCIAL INSTRUMENTS
The fair value of a financial instrument is the price that would be received to sell an asset or paid to transfer a liability in an orderly transaction between market participants at the measurement date. The Group has documented internal policies for determining fair value, including methodologies used to establish valuation adjustments required for credit risk.
(a) Fair value hierarchy Financial assets and financial liabilities measured and held at fair value are classified into one of three categories, known as hierarchy levels, which are defined according to the inputs used to measure fair value as follows:
● Level 1: fair value is determined using observable inputs that reflect unadjusted quoted market prices for identical assets and liabilities; ● Level 2: fair value is determined using significant inputs that may be directly observable inputs or unobservable inputs that are
corroborated by market data; and ● Level 3: fair value is determined using significant unobservable inputs that are not corroborated by market data and may be used with
internally developed methodologies that result in management’s best estimate of fair value.
31 December Level 1
£m Level 2
£m Level 3
£m
2016 Total
£m Level 1
£m Level 2
£m Level 3 (i)
£m
2015 Total
£m
Financial assets Derivative financial instruments:
Energy derivatives 81 1,350 40 1,471 17 1,172 (38) 1,151 Interest rate derivatives – 158 – 158 – 129 – 129 Foreign exchange derivatives – 244 – 244 – 96 – 96
Treasury gilts designated at fair value through profit or loss 130 – – 130 124 – – 124 Debt instruments 64 – – 64 60 – – 60 Equity instruments (ii) 34 – 4 38 27 30 3 60 Total financial assets at fair value 309 1,752 44 2,105 228 1,427 (35) 1,620 Financial liabilities Derivative financial instruments:
Energy derivatives (20) (1,369) (63) (1,452) (220) (1,449) (114) (1,783) Interest rate derivatives – (36) – (36) – (28) – (28) Foreign exchange derivatives – (105) – (105) – (157) – (157)
Total financial liabilities at fair value (20) (1,510) (63) (1,593) (220) (1,634) (114) (1,968)
Included within Level 3 energy derivative assets are liabilities of £53 million, which were presented within derivative assets on the Group Balance Sheet in 2015, as a result of being netted off (i)the associated Level 2 trades with the same counterparty, in line with the netting policy described in note S2.
Level 2 equity instruments relate to shares acquired in Enercare Inc. (ii)
176
STRATEGIC REPORT GOVERNANCE
SHAREHOLDER INFORMATION
FINANCIAL STATEMENTS NOTES TO THE FINANCIAL STATEMENTS
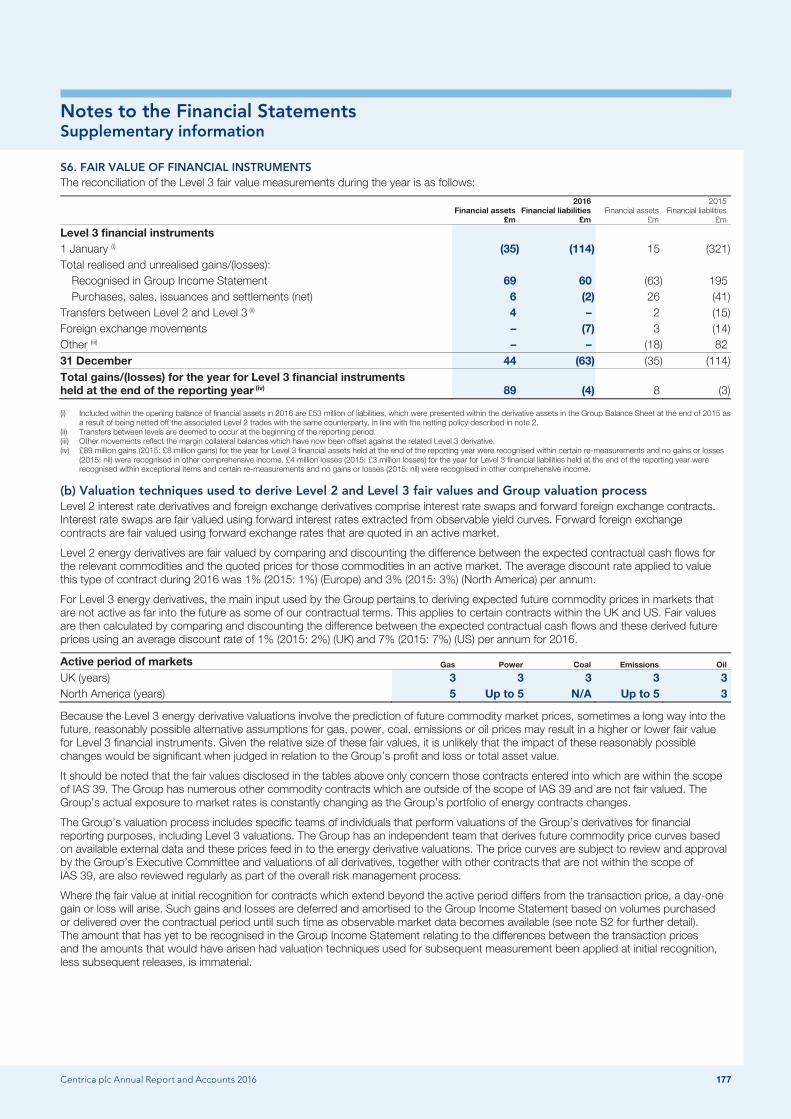
Notes to the Financial Statements Supplementary information
Centrica plc Annual Report and Accounts 2016 177
S6. FAIR VALUE OF FINANCIAL INSTRUMENTS The reconciliation of the Level 3 fair value measurements during the year is as follows:
Financial assets
£m
2016 Financial liabilities
£m Financial assets
£m
2015 Financial liabilities
£m
Level 3 financial instruments 1 January (i) (35) (114) 15 (321) Total realised and unrealised gains/(losses):
Recognised in Group Income Statement 69 60 (63) 195 Purchases, sales, issuances and settlements (net) 6 (2) 26 (41)
Transfers between Level 2 and Level 3 (ii) 4 – 2 (15) Foreign exchange movements – (7) 3 (14) Other (iii) – – (18) 82 31 December 44 (63) (35) (114) Total gains/(losses) for the year for Level 3 financial instruments held at the end of the reporting year (iv) 89 (4) 8 (3)
Included within the opening balance of financial assets in 2016 are £53 million of liabilities, which were presented within the derivative assets in the Group Balance Sheet at the end of 2015 as (i)a result of being netted off the associated Level 2 trades with the same counterparty, in line with the netting policy described in note 2.
Transfers between levels are deemed to occur at the beginning of the reporting period. (ii) Other movements reflect the margin collateral balances which have now been offset against the related Level 3 derivative. (iii) £89 million gains (2015: £8 million gains) for the year for Level 3 financial assets held at the end of the reporting year were recognised within certain re-measurements and no gains or losses (iv)
(2015: nil) were recognised in other comprehensive income. £4 million losses (2015: £3 million losses) for the year for Level 3 financial liabilities held at the end of the reporting year were recognised within exceptional items and certain re-measurements and no gains or losses (2015: nil) were recognised in other comprehensive income.
(b) Valuation techniques used to derive Level 2 and Level 3 fair values and Group valuation process Level 2 interest rate derivatives and foreign exchange derivatives comprise interest rate swaps and forward foreign exchange contracts. Interest rate swaps are fair valued using forward interest rates extracted from observable yield curves. Forward foreign exchange contracts are fair valued using forward exchange rates that are quoted in an active market.
Level 2 energy derivatives are fair valued by comparing and discounting the difference between the expected contractual cash flows for the relevant commodities and the quoted prices for those commodities in an active market. The average discount rate applied to value this type of contract during 2016 was 1% (2015: 1%) (Europe) and 3% (2015: 3%) (North America) per annum.
For Level 3 energy derivatives, the main input used by the Group pertains to deriving expected future commodity prices in markets that are not active as far into the future as some of our contractual terms. This applies to certain contracts within the UK and US. Fair values are then calculated by comparing and discounting the difference between the expected contractual cash flows and these derived future prices using an average discount rate of 1% (2015: 2%) (UK) and 7% (2015: 7%) (US) per annum for 2016.
Active period of markets Gas Power Coal Emissions Oil
UK (years) 3 3 3 3 3 North America (years) 5 Up to 5 N/A Up to 5 3
Because the Level 3 energy derivative valuations involve the prediction of future commodity market prices, sometimes a long way into the future, reasonably possible alternative assumptions for gas, power, coal, emissions or oil prices may result in a higher or lower fair value for Level 3 financial instruments. Given the relative size of these fair values, it is unlikely that the impact of these reasonably possible changes would be significant when judged in relation to the Group’s profit and loss or total asset value.
It should be noted that the fair values disclosed in the tables above only concern those contracts entered into which are within the scope of IAS 39. The Group has numerous other commodity contracts which are outside of the scope of IAS 39 and are not fair valued. The Group’s actual exposure to market rates is constantly changing as the Group’s portfolio of energy contracts changes.
The Group’s valuation process includes specific teams of individuals that perform valuations of the Group’s derivatives for financial reporting purposes, including Level 3 valuations. The Group has an independent team that derives future commodity price curves based on available external data and these prices feed in to the energy derivative valuations. The price curves are subject to review and approval by the Group’s Executive Committee and valuations of all derivatives, together with other contracts that are not within the scope of IAS 39, are also reviewed regularly as part of the overall risk management process.
Where the fair value at initial recognition for contracts which extend beyond the active period differs from the transaction price, a day-one gain or loss will arise. Such gains and losses are deferred and amortised to the Group Income Statement based on volumes purchased or delivered over the contractual period until such time as observable market data becomes available (see note S2 for further detail). The amount that has yet to be recognised in the Group Income Statement relating to the differences between the transaction prices and the amounts that would have arisen had valuation techniques used for subsequent measurement been applied at initial recognition, less subsequent releases, is immaterial.
Centrica plc Annual Report and Accounts 2016 177
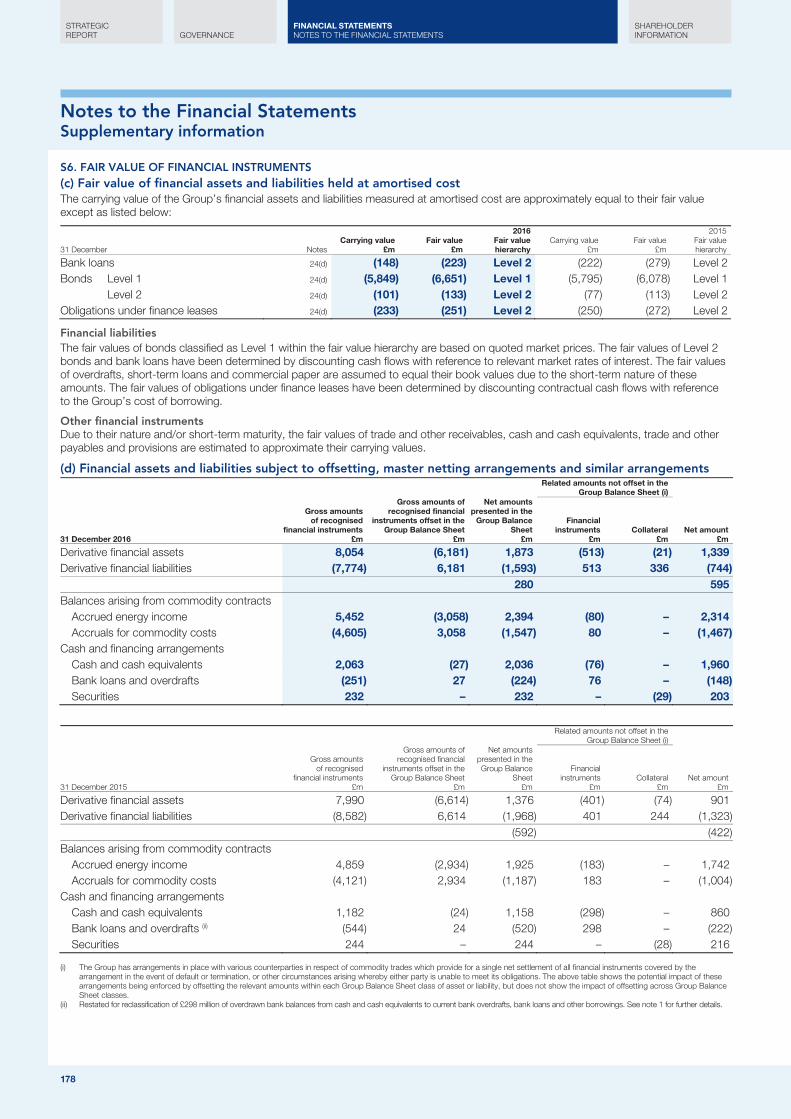
Notes to the Financial Statements Supplementary information
178
S6. FAIR VALUE OF FINANCIAL INSTRUMENTS (c) Fair value of financial assets and liabilities held at amortised cost The carrying value of the Group’s financial assets and liabilities measured at amortised cost are approximately equal to their fair value except as listed below:
31 December Notes Carrying value
£m Fair value
£m
2016 Fair value hierarchy
Carrying value £m
Fair value £m
2015 Fair value hierarchy
Bank loans 24(d) (148) (223) Level 2 (222) (279) Level 2 Bonds Level 1 24(d) (5,849) (6,651) Level 1 (5,795) (6,078) Level 1 Level 2 24(d) (101) (133) Level 2 (77) (113) Level 2 Obligations under finance leases 24(d) (233) (251) Level 2 (250) (272) Level 2
Financial liabilities The fair values of bonds classified as Level 1 within the fair value hierarchy are based on quoted market prices. The fair values of Level 2 bonds and bank loans have been determined by discounting cash flows with reference to relevant market rates of interest. The fair values of overdrafts, short-term loans and commercial paper are assumed to equal their book values due to the short-term nature of these amounts. The fair values of obligations under finance leases have been determined by discounting contractual cash flows with reference to the Group’s cost of borrowing.
Other financial instruments Due to their nature and/or short-term maturity, the fair values of trade and other receivables, cash and cash equivalents, trade and other payables and provisions are estimated to approximate their carrying values.
(d) Financial assets and liabilities subject to offsetting, master netting arrangements and similar arrangements
Related amounts not offset in the
Group Balance Sheet (i)
31 December 2016
Gross amounts of recognised
financial instruments £m
Gross amounts of recognised financial
instruments offset in the Group Balance Sheet
£m
Net amounts presented in the
Group Balance Sheet
£m
Financial instruments
£m Collateral
£m Net amount
£m
Derivative financial assets 8,054 (6,181) 1,873 (513) (21) 1,339 Derivative financial liabilities (7,774) 6,181 (1,593) 513 336 (744) 280 595 Balances arising from commodity contracts
Accrued energy income 5,452 (3,058) 2,394 (80) – 2,314 Accruals for commodity costs (4,605) 3,058 (1,547) 80 – (1,467)
Cash and financing arrangements Cash and cash equivalents 2,063 (27) 2,036 (76) – 1,960 Bank loans and overdrafts (251) 27 (224) 76 – (148) Securities 232 – 232 – (29) 203
Related amounts not offset in the
Group Balance Sheet (i)
31 December 2015
Gross amounts of recognised
financial instruments £m
Gross amounts of recognised financial
instruments offset in the Group Balance Sheet
£m
Net amounts presented in the Group Balance
Sheet £m
Financial instruments
£m Collateral
£m Net amount
£m
Derivative financial assets 7,990 (6,614) 1,376 (401) (74) 901 Derivative financial liabilities (8,582) 6,614 (1,968) 401 244 (1,323) (592) (422) Balances arising from commodity contracts
Accrued energy income 4,859 (2,934) 1,925 (183) – 1,742 Accruals for commodity costs (4,121) 2,934 (1,187) 183 – (1,004)
Cash and financing arrangements Cash and cash equivalents 1,182 (24) 1,158 (298) – 860 Bank loans and overdrafts (ii) (544) 24 (520) 298 – (222) Securities 244 – 244 – (28) 216
The Group has arrangements in place with various counterparties in respect of commodity trades which provide for a single net settlement of all financial instruments covered by the (i)arrangement in the event of default or termination, or other circumstances arising whereby either party is unable to meet its obligations. The above table shows the potential impact of these arrangements being enforced by offsetting the relevant amounts within each Group Balance Sheet class of asset or liability, but does not show the impact of offsetting across Group Balance Sheet classes.
Restated for reclassification of £298 million of overdrawn bank balances from cash and cash equivalents to current bank overdrafts, bank loans and other borrowings. See note 1 for further details. (ii)
178
STRATEGIC REPORT GOVERNANCE
SHAREHOLDER INFORMATION
FINANCIAL STATEMENTS NOTES TO THE FINANCIAL STATEMENTS

Notes to the Financial Statements Supplementary information
Centrica plc Annual Report and Accounts 2016 179
S7. FIXED-FEE SERVICE AND INSURANCE CONTRACTS
This section includes fixed-fee service (FFS) and insurance contract disclosures for services related to UK Home and NA Home.
FFS contracts in North America are entered into with home and business services customers.
FFS contracts in the UK are entered into with home services customers by British Gas Services Limited (BGSL). Insurance contracts in the UK are entered into with home services customers by British Gas Insurance Limited (BGIL), authorised by the PRA and regulated by the FCA and the PRA.
Product offerings include central heating, boiler and controls, plumbing and drains and electrical appliance insurance cover.
FFS contracts continue until cancelled by either party; insurance contracts normally provide cover for 12 months with the option of renewal.
The contracts which protect policyholders against the risk of breakdowns result in the transfer of an element of risk to the contract provider. Benefits provided to customers vary in accordance with terms and conditions of the contracts entered into; however, they generally include maintenance, repair and/or replacement of the items affected.
The levels of risk exposure and service provision to customers under contract terms are dependent on the occurrence of uncertain future events, in particular the nature and frequency of faults and the cost of repair or replacement of the items affected. Accordingly, the timing and amount of future cash outflows associated with the contracts is uncertain. The key terms and conditions that affect future cash flows are as follows:
● provision of labour and parts for repairs, dependent on the agreement and associated level of service; ● a specified number of safety and maintenance inspections are carried out as set out in the agreement (usually once a year); ● no limit to the number of call-outs to carry out repair work; and ● limits on certain maintenance and repair costs.
Revenue is recognised over the life of contracts having regard to the incidence of risk, in particular the seasonal propensity of claims which span the life of the contract as a result of emergency maintenance being available throughout the contract term. Costs incurred to settle claims represent principally the engineer workforce employed by Centrica within home services and the cost of parts utilised in repair or maintenance. These costs are accounted for over a 12-month period with adjustments made to reflect the seasonality of workload over a given year.
Weather conditions and the seasonality of repairs both affect the profile of the workload and associated costs incurred across the year.
The risk exposure of these uncertain events is actively managed by undertaking the following risk mitigation activities:
● an initial service visit is provided to customers taking up most central heating contracts and in some instances pre-existing faults may lead to the contract being cancelled and no further cover being provided;
● an annual maintenance inspection is performed as part of most central heating contracts to help identify and prevent issues developing into significant maintenance or breakdown claims; and
● contract limits are applied to certain types of maintenance and repair work considered to be higher risk in terms of frequency and cost.
The costs of FFS claims and insurance claims incurred during the year were £48 million (2015: £42 million) and £391 million (2015: £381 million) respectively and are included in the table below in ‘Expenses relating to FFS and insurance contracts’. All claims are settled immediately and in full. Due to the short average lead time between claims occurrence and settlement, no material provisions were outstanding at the balance sheet date (2015: nil).
2016
£m 2015
£m
Total revenue 1,177 1,173 Expenses relating to FFS and insurance contracts (1,013) (986) Deferred income (97) (73) Accrued income 29 24
The Group considers whether estimated future cash flows under the contracts will be sufficient to meet expected future costs. Any deficiency is charged immediately to the Group Income Statement. Claims frequency is sensitive to the reliability of appliances as well as the impact of weather conditions. The contracts are not exposed to any interest rate risk or significant credit risk and do not contain any embedded derivatives.
Centrica plc Annual Report and Accounts 2016 179
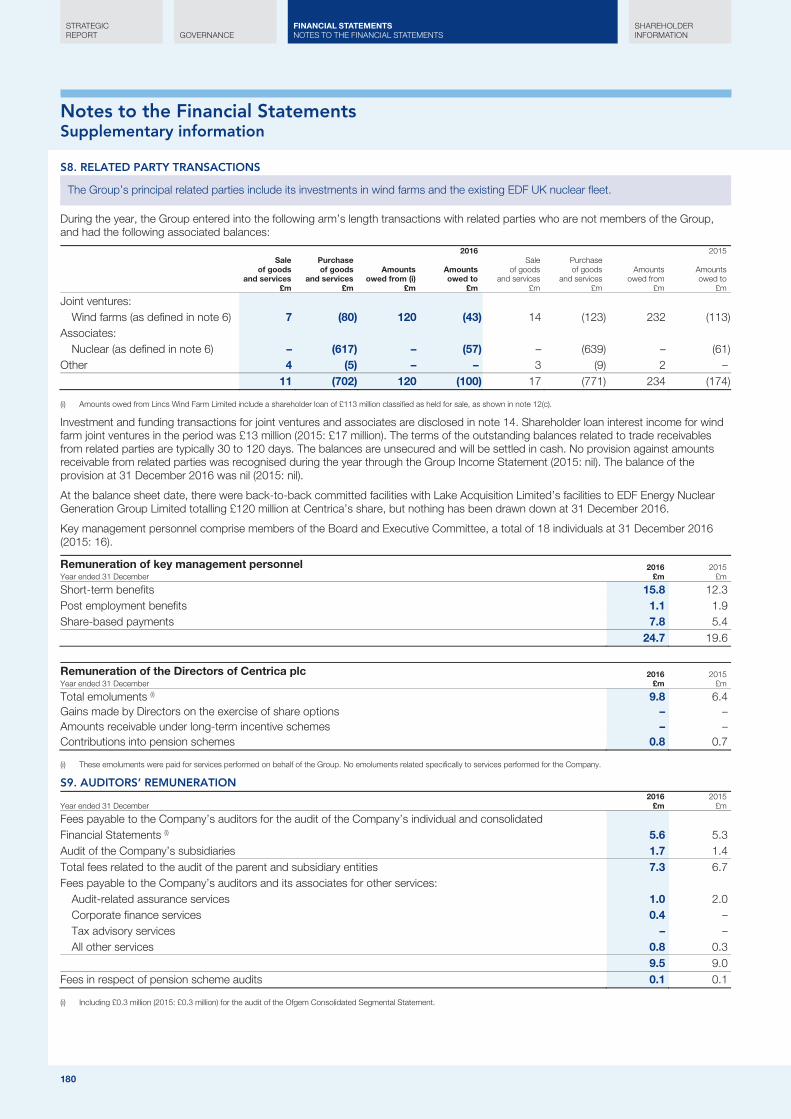
Notes to the Financial Statements Supplementary information
180
S8. RELATED PARTY TRANSACTIONS
The Group’s principal related parties include its investments in wind farms and the existing EDF UK nuclear fleet.
During the year, the Group entered into the following arm’s length transactions with related parties who are not members of the Group, and had the following associated balances:
2016 2015
Sale of goods
and services £m
Purchase of goods
and services £m
Amounts owed from (i)
£m
Amounts owed to
£m
Sale of goods
and services £m
Purchase of goods
and services £m
Amounts owed from
£m
Amounts owed to
£m
Joint ventures: Wind farms (as defined in note 6) 7 (80) 120 (43) 14 (123) 232 (113)
Associates: Nuclear (as defined in note 6) – (617) – (57) – (639) – (61)
Other 4 (5) – – 3 (9) 2 – 11 (702) 120 (100) 17 (771) 234 (174)
Amounts owed from Lincs Wind Farm Limited include a shareholder loan of £113 million classified as held for sale, as shown in note 12(c). (i)
Investment and funding transactions for joint ventures and associates are disclosed in note 14. Shareholder loan interest income for wind farm joint ventures in the period was £13 million (2015: £17 million). The terms of the outstanding balances related to trade receivables from related parties are typically 30 to 120 days. The balances are unsecured and will be settled in cash. No provision against amounts receivable from related parties was recognised during the year through the Group Income Statement (2015: nil). The balance of the provision at 31 December 2016 was nil (2015: nil).
At the balance sheet date, there were back-to-back committed facilities with Lake Acquisition Limited’s facilities to EDF Energy Nuclear Generation Group Limited totalling £120 million at Centrica’s share, but nothing has been drawn down at 31 December 2016.
Key management personnel comprise members of the Board and Executive Committee, a total of 18 individuals at 31 December 2016 (2015: 16).
Remuneration of key management personnel Year ended 31 December
2016 £m
2015 £m
Short-term benefits 15.8 12.3 Post employment benefits 1.1 1.9 Share-based payments 7.8 5.4 24.7 19.6
Remuneration of the Directors of Centrica plc Year ended 31 December
2016 £m
2015 £m
Total emoluments (i) 9.8 6.4 Gains made by Directors on the exercise of share options – – Amounts receivable under long-term incentive schemes – – Contributions into pension schemes 0.8 0.7
These emoluments were paid for services performed on behalf of the Group. No emoluments related specifically to services performed for the Company. (i)
S9. AUDITORS’ REMUNERATION
Year ended 31 December 2016
£m 2015
£m
Fees payable to the Company’s auditors for the audit of the Company’s individual and consolidated Financial Statements (i) 5.6 5.3 Audit of the Company’s subsidiaries 1.7 1.4 Total fees related to the audit of the parent and subsidiary entities 7.3 6.7 Fees payable to the Company’s auditors and its associates for other services:
Audit-related assurance services 1.0 2.0 Corporate finance services 0.4 – Tax advisory services – – All other services 0.8 0.3
9.5 9.0 Fees in respect of pension scheme audits 0.1 0.1
Including £0.3 million (2015: £0.3 million) for the audit of the Ofgem Consolidated Segmental Statement. (i)
180
STRATEGIC REPORT GOVERNANCE
SHAREHOLDER INFORMATION
FINANCIAL STATEMENTS NOTES TO THE FINANCIAL STATEMENTS

Notes to the Financial Statements Supplementary information
Centrica plc Annual Report and Accounts 2016 181
S9. AUDITORS’ REMUNERATION It is the Group’s policy to seek competitive tenders for all major consultancy and advisory projects. Appointments are made taking into account factors including expertise, experience and cost. In addition, the Audit Committee has approved a detailed policy defining the types of work for which the Company’s auditors can tender and the approvals required. In the past, the Company’s auditors have been engaged on assignments in addition to their statutory audit duties where their expertise and experience with the Group are particularly important, including due diligence reporting and corporate finance support for acquisitions and disposals.
S10. RELATED UNDERTAKINGS
The Group has a large number of related undertakings principally in the UK, US, Norway, Canada, Denmark, the Netherlands and the Republic of Ireland. These are listed below.
(a) Subsidiary undertakings
Investments held directly by Centrica plc with 100% voting rights
31 December 2016 Principal activity Country of incorporation/ registered address key (i) Class of shares held
Centrica Beta Holdings Limited Holding company United Kingdom / A Ordinary shares
Centrica Holdings Limited Holding company United Kingdom / A Ordinary shares
Centrica Trading Limited Non-trading United Kingdom / A Ordinary shares
Investments held indirectly by Centrica plc with 100% voting rights
31 December 2016 Principal activity Country of incorporation/ registered address key (i) Class of shares held
1773648 Alberta Ltd. Gas and/or oil exploration and products and/or trading
Canada / B Ordinary shares
8401268 Canada Inc. Gas and/or oil exploration and products and/or trading
Canada / C Ordinary shares
Accord Energy (Trading) Limited Dormant United Kingdom / A Ordinary shares
Accord Energy Limited Dormant United Kingdom / A Ordinary shares Airtron Inc. Home and/or commercial services United States / D Ordinary shares
Alertme.com GmbH Non-trading Germany / E Ordinary shares
Alertme.com Inc. Energy management products and services United States / F Ordinary shares Astrum Solar Inc. Home and/or commercial services United States / G Ordinary shares
Atform Limited Dormant United Kingdom / A Ordinary shares
AWHR America's Water Heater Rentals LLC Home and/or commercial services United States / D Membership interest Benjamin Franklin Franchising LLC Home and/or commercial services United States / H Membership interest
BGPGS Limited (ii) In liquidation United Kingdom / A Ordinary shares
BMS Setpoint Limited (ii) In liquidation United Kingdom / A Ordinary shares BMS Solutions Limited (iii) Dormant United Kingdom / A Ordinary shares
Bord Gáis Energy Limited Energy supply and power generation Republic of Ireland / I Ordinary shares
Bounce Energy Inc. Energy supply United States / D Ordinary shares Bowland Resources (No.2) Limited Gas and/or oil exploration and production United Kingdom / A Ordinary shares
Bowland Resources Limited Gas and/or oil exploration and production United Kingdom / A Ordinary shares
Brae Canada Ltd. Gas and/or oil exploration and production Canada / B Ordinary and preference shares
British Gas Energy Procurement Limited Energy supply United Kingdom / A Ordinary shares British Gas Energy Services Limited (iii) Energy management products and services United Kingdom / A Ordinary shares
British Gas Finance Limited Vehicle leasing United Kingdom / A Ordinary shares
British Gas Housing Services Limited (ii) In liquidation United Kingdom / A Ordinary shares British Gas Insurance Limited Insurance provision United Kingdom / A Ordinary shares
British Gas Limited Dormant United Kingdom / A Ordinary shares
British Gas New Heating Limited Electrical and gas installations United Kingdom / A Ordinary shares British Gas Services (Commercial) Limited Servicing and installation of heating systems United Kingdom / A Ordinary shares
British Gas Services Limited Home services United Kingdom / A Ordinary shares
British Gas Social Housing Limited Servicing and installation of heating systems United Kingdom / A Ordinary shares British Gas Solar Limited Dormant United Kingdom / A Ordinary shares
British Gas Trading Limited Energy supply United Kingdom / A Ordinary shares
Business Gas Limited Dormant United Kingdom / A Ordinary shares BuyMax LLC Home and/or commercial services United States / H Membership interest
Centrica plc Annual Report and Accounts 2016 181

Notes to the Financial Statements Supplementary information
182
S10. RELATED UNDERTAKINGS
31 December 2016 Principal activity Country of incorporation/ registered address key (i) Class of shares held
Caythorpe Gas Storage Limited Gas storage United Kingdom / J Ordinary shares Centrica (BOW) Limited Dormant United Kingdom / A Ordinary shares
Centrica (DSW) Limited Dormant United Kingdom / A Ordinary shares
Centrica (IOM) Limited Dormant Isle of Man / K Ordinary shares Centrica (Lincs) Wind Farm Limited Holding company United Kingdom / A Ordinary shares
Centrica 25 Limited (ii) In liquidation United Kingdom / A Ordinary shares
Centrica 27 Limited (ii) In liquidation United Kingdom / A Ordinary shares Centrica Alpha Finance Limited Dormant United Kingdom / A Ordinary shares
Centrica America Limited Dormant United Kingdom / A Ordinary shares
Centrica Barry Limited Power generation United Kingdom / A Ordinary shares Centrica Brigg Limited Power generation United Kingdom / A Ordinary shares
Centrica Combined Common Investment Fund Limited
Dormant United Kingdom / A Ordinary shares
Centrica Connected Home Canada Inc. (iv) Energy management products and services Canada / B Ordinary shares Centrica Connected Home Limited (v) Energy management products and services United Kingdom / A Ordinary and
preference shares Centrica Connected Home US Inc. (iv) Energy management products and services United States / D Ordinary shares
Centrica Delta Limited Dormant Isle of Man / L Ordinary shares
Centrica Directors Limited Dormant United Kingdom / A Ordinary shares Centrica Distributed Generation Limited (v) Power generation United Kingdom / A Ordinary shares
Centrica Electric Limited (ii) In liquidation United Kingdom / A Ordinary shares
Centrica Energy (Trading) Limited Wholesale energy trading United Kingdom / A Ordinary shares Centrica Energy Limited Wholesale energy trading United Kingdom / A Ordinary shares
Centrica Energy Marketing Limited Wholesale energy trading United Kingdom / A Ordinary shares
Centrica Energy Operations Limited Dormant United Kingdom / A Ordinary shares Centrica Energy Renewable Investments Limited
Dormant United Kingdom / A Ordinary shares
Centrica Energy Tolling BV Non-trading Netherlands / M Ordinary shares
Centrica Engineers Pension Trustees Limited Dormant United Kingdom / A Ordinary shares Centrica Epsilon Limited (ii) In liquidation United Kingdom / A Ordinary shares
Centrica F3 Developments Limited In liquidation United Kingdom / N Ordinary shares
Centrica Finance (Canada) Limited Holding company United Kingdom / A Ordinary shares Centrica Finance (Scotland) Limited Holding company United Kingdom / N Ordinary shares
Centrica Finance (US) Limited Holding company United Kingdom / A Ordinary shares
Centrica Finance Investments Limited Non-trading United Kingdom / A Ordinary shares Centrica Finance Norway Limited Group financing Jersey / O Ordinary shares
Centrica Gamma Holdings Limited Holding company United Kingdom / A Ordinary shares
Centrica HoldCo GP LLC Holding company United States / D Membership interest Centrica Ignite GP Limited Investment company United Kingdom / A Ordinary shares
Centrica Ignite LP Limited Investment company United Kingdom / A Ordinary shares
Centrica India Offshore Private Limited Business services India / P Ordinary shares Centrica Infrastructure BV Construction, ownership and exploitation
of infrastructure Netherlands / M Ordinary shares
Centrica Infrastructure Limited Dormant United Kingdom / N Ordinary shares
Centrica Insurance Company Limited Insurance provision Isle of Man / K Ordinary and preference shares
Centrica International BV Group financing Netherlands / M Ordinary shares
Centrica International C BV (iv) Holding company Netherlands / M Ordinary shares Centrica Jersey Limited Dormant Jersey / Q Ordinary shares
Centrica KL Limited Power generation United Kingdom / A Ordinary shares
Centrica KPS Limited Power generation United Kingdom / A Ordinary shares Centrica Lake Limited Holding company United Kingdom / A Ordinary shares
Centrica Langage Limited Power generation United Kingdom / A Ordinary shares
Centrica Leasing (KL) Limited Dormant United Kingdom / A Ordinary shares Centrica Leasing (PB) Limited (ii) In liquidation United Kingdom / A Ordinary shares
182
STRATEGIC REPORT GOVERNANCE
SHAREHOLDER INFORMATION
FINANCIAL STATEMENTS NOTES TO THE FINANCIAL STATEMENTS
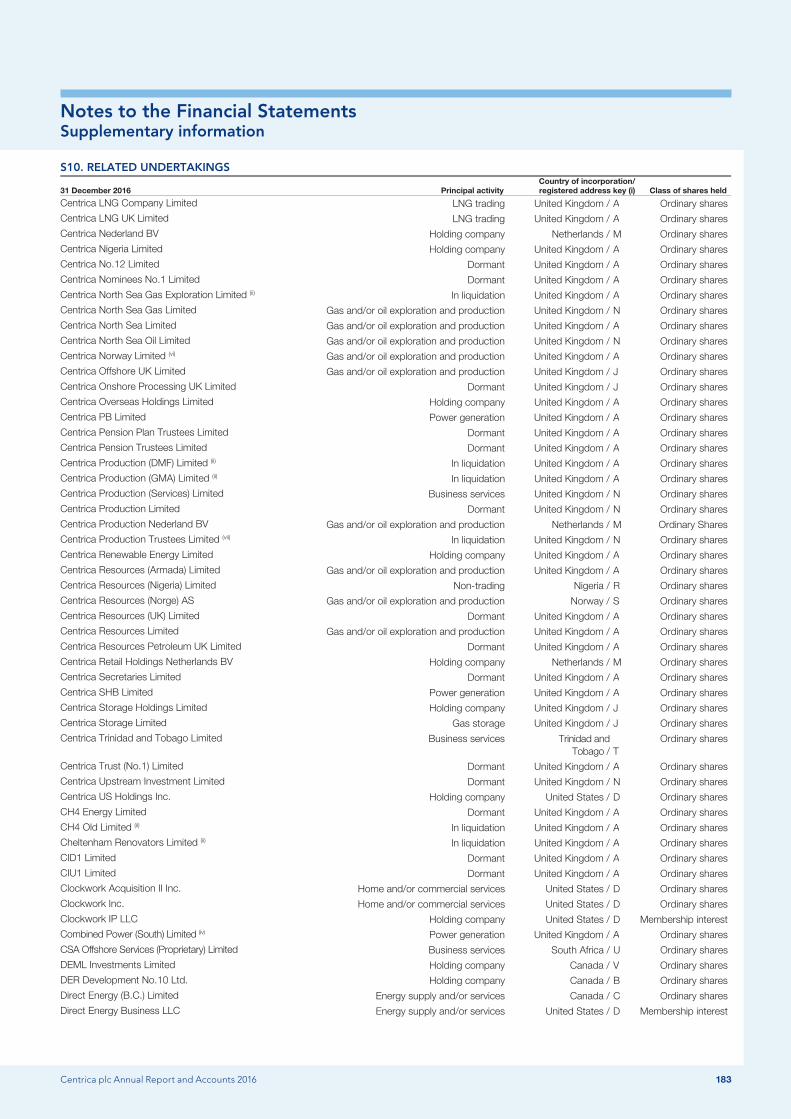
Notes to the Financial Statements Supplementary information
Centrica plc Annual Report and Accounts 2016 183
S10. RELATED UNDERTAKINGS
31 December 2016 Principal activity Country of incorporation/ registered address key (i) Class of shares held
Centrica LNG Company Limited LNG trading United Kingdom / A Ordinary shares Centrica LNG UK Limited LNG trading United Kingdom / A Ordinary shares
Centrica Nederland BV Holding company Netherlands / M Ordinary shares
Centrica Nigeria Limited Holding company United Kingdom / A Ordinary shares Centrica No.12 Limited Dormant United Kingdom / A Ordinary shares
Centrica Nominees No.1 Limited Dormant United Kingdom / A Ordinary shares
Centrica North Sea Gas Exploration Limited (ii) In liquidation United Kingdom / A Ordinary shares Centrica North Sea Gas Limited Gas and/or oil exploration and production United Kingdom / N Ordinary shares
Centrica North Sea Limited Gas and/or oil exploration and production United Kingdom / A Ordinary shares
Centrica North Sea Oil Limited Gas and/or oil exploration and production United Kingdom / N Ordinary shares Centrica Norway Limited (vi) Gas and/or oil exploration and production United Kingdom / A Ordinary shares
Centrica Offshore UK Limited Gas and/or oil exploration and production United Kingdom / J Ordinary shares
Centrica Onshore Processing UK Limited Dormant United Kingdom / J Ordinary shares Centrica Overseas Holdings Limited Holding company United Kingdom / A Ordinary shares
Centrica PB Limited Power generation United Kingdom / A Ordinary shares
Centrica Pension Plan Trustees Limited Dormant United Kingdom / A Ordinary shares Centrica Pension Trustees Limited Dormant United Kingdom / A Ordinary shares
Centrica Production (DMF) Limited (ii) In liquidation United Kingdom / A Ordinary shares
Centrica Production (GMA) Limited (ii) In liquidation United Kingdom / A Ordinary shares Centrica Production (Services) Limited Business services United Kingdom / N Ordinary shares
Centrica Production Limited Dormant United Kingdom / N Ordinary shares
Centrica Production Nederland BV Gas and/or oil exploration and production Netherlands / M Ordinary Shares Centrica Production Trustees Limited (vii) In liquidation United Kingdom / N Ordinary shares
Centrica Renewable Energy Limited Holding company United Kingdom / A Ordinary shares
Centrica Resources (Armada) Limited Gas and/or oil exploration and production United Kingdom / A Ordinary shares Centrica Resources (Nigeria) Limited Non-trading Nigeria / R Ordinary shares
Centrica Resources (Norge) AS Gas and/or oil exploration and production Norway / S Ordinary shares
Centrica Resources (UK) Limited Dormant United Kingdom / A Ordinary shares Centrica Resources Limited Gas and/or oil exploration and production United Kingdom / A Ordinary shares
Centrica Resources Petroleum UK Limited Dormant United Kingdom / A Ordinary shares
Centrica Retail Holdings Netherlands BV Holding company Netherlands / M Ordinary shares Centrica Secretaries Limited Dormant United Kingdom / A Ordinary shares
Centrica SHB Limited Power generation United Kingdom / A Ordinary shares
Centrica Storage Holdings Limited Holding company United Kingdom / J Ordinary shares Centrica Storage Limited Gas storage United Kingdom / J Ordinary shares
Centrica Trinidad and Tobago Limited Business services Trinidad and Tobago /
T
Ordinary shares
Centrica Trust (No.1) Limited Dormant United Kingdom / A Ordinary shares
Centrica Upstream Investment Limited Dormant United Kingdom / N Ordinary shares Centrica US Holdings Inc. Holding company United States / D Ordinary shares
CH4 Energy Limited Dormant United Kingdom / A Ordinary shares
CH4 Old Limited (ii) In liquidation United Kingdom / A Ordinary shares Cheltenham Renovators Limited (ii) In liquidation United Kingdom / A Ordinary shares
CID1 Limited Dormant United Kingdom / A Ordinary shares
CIU1 Limited Dormant United Kingdom / A Ordinary shares Clockwork Acquisition II Inc. Home and/or commercial services United States / D Ordinary shares
Clockwork Inc. Home and/or commercial services United States / D Ordinary shares
Clockwork IP LLC Holding company United States / D Membership interest Combined Power (South) Limited (iv) Power generation United Kingdom / A Ordinary shares
CSA Offshore Services (Proprietary) Limited Business services South Africa / U Ordinary shares
DEML Investments Limited Holding company Canada / V Ordinary shares DER Development No.10 Ltd. Holding company Canada / B Ordinary shares
Direct Energy (B.C.) Limited Energy supply and/or services Canada / C Ordinary shares
Direct Energy Business LLC Energy supply and/or services United States / D Membership interest
Centrica plc Annual Report and Accounts 2016 183
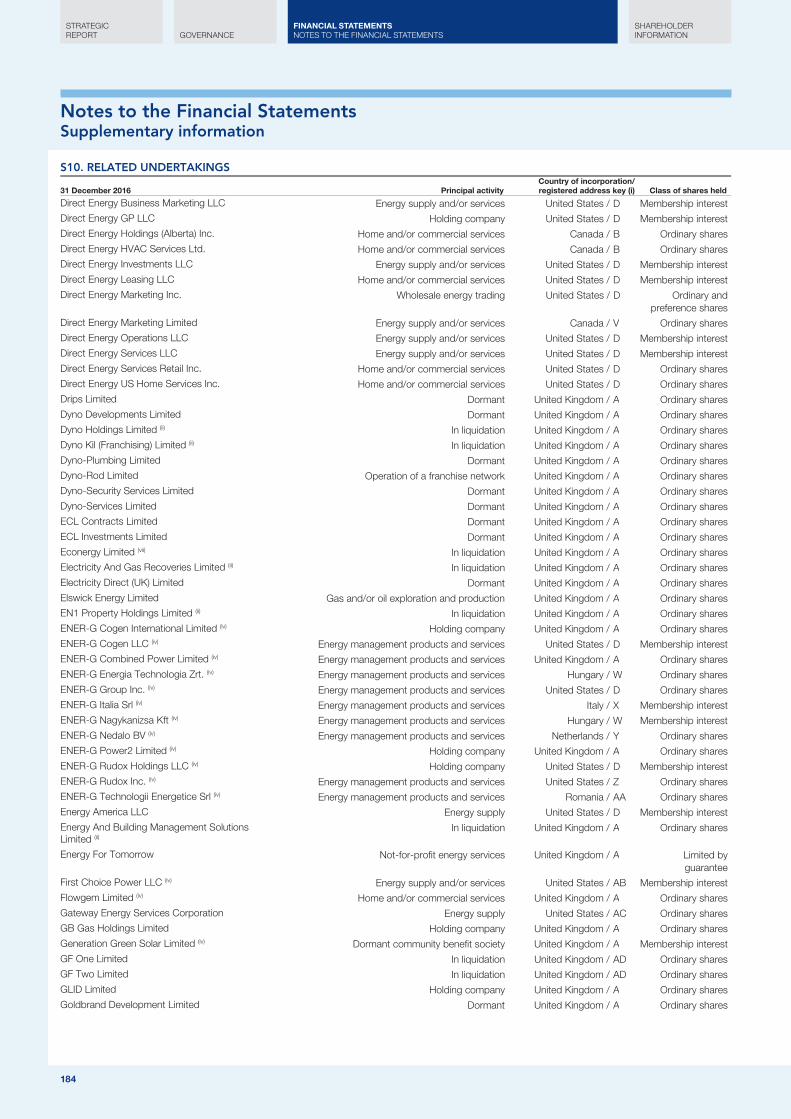
Notes to the Financial Statements Supplementary information
184
S10. RELATED UNDERTAKINGS
31 December 2016 Principal activity Country of incorporation/ registered address key (i) Class of shares held
Direct Energy Business Marketing LLC Energy supply and/or services United States / D Membership interest Direct Energy GP LLC Holding company United States / D Membership interest
Direct Energy Holdings (Alberta) Inc. Home and/or commercial services Canada / B Ordinary shares
Direct Energy HVAC Services Ltd. Home and/or commercial services Canada / B Ordinary shares Direct Energy Investments LLC Energy supply and/or services United States / D Membership interest
Direct Energy Leasing LLC Home and/or commercial services United States / D Membership interest
Direct Energy Marketing Inc. Wholesale energy trading United States / D Ordinary and preference shares
Direct Energy Marketing Limited Energy supply and/or services Canada / V Ordinary shares Direct Energy Operations LLC Energy supply and/or services United States / D Membership interest
Direct Energy Services LLC Energy supply and/or services United States / D Membership interest
Direct Energy Services Retail Inc. Home and/or commercial services United States / D Ordinary shares Direct Energy US Home Services Inc. Home and/or commercial services United States / D Ordinary shares
Drips Limited Dormant United Kingdom / A Ordinary shares
Dyno Developments Limited Dormant United Kingdom / A Ordinary shares Dyno Holdings Limited (ii) In liquidation United Kingdom / A Ordinary shares
Dyno Kil (Franchising) Limited (ii) In liquidation United Kingdom / A Ordinary shares
Dyno-Plumbing Limited Dormant United Kingdom / A Ordinary shares Dyno-Rod Limited Operation of a franchise network United Kingdom / A Ordinary shares
Dyno-Security Services Limited Dormant United Kingdom / A Ordinary shares
Dyno-Services Limited Dormant United Kingdom / A Ordinary shares ECL Contracts Limited Dormant United Kingdom / A Ordinary shares
ECL Investments Limited Dormant United Kingdom / A Ordinary shares
Econergy Limited (vii) In liquidation United Kingdom / A Ordinary shares Electricity And Gas Recoveries Limited (ii) In liquidation United Kingdom / A Ordinary shares
Electricity Direct (UK) Limited Dormant United Kingdom / A Ordinary shares
Elswick Energy Limited Gas and/or oil exploration and production United Kingdom / A Ordinary shares EN1 Property Holdings Limited (ii) In liquidation United Kingdom / A Ordinary shares
ENER-G Cogen International Limited (iv) Holding company United Kingdom / A Ordinary shares
ENER-G Cogen LLC (iv) Energy management products and services United States / D Membership interest ENER-G Combined Power Limited (iv) Energy management products and services United Kingdom / A Ordinary shares
ENER-G Energia Technologia Zrt. (iv) Energy management products and services Hungary / W Ordinary shares
ENER-G Group Inc. (iv) Energy management products and services United States / D Ordinary shares ENER-G Italia Srl (iv) Energy management products and services Italy / X Membership interest
ENER-G Nagykanizsa Kft (iv) Energy management products and services Hungary / W Membership interest
ENER-G Nedalo BV (iv) Energy management products and services Netherlands / Y Ordinary shares ENER-G Power2 Limited (iv) Holding company United Kingdom / A Ordinary shares
ENER-G Rudox Holdings LLC (iv) Holding company United States / D Membership interest
ENER-G Rudox Inc. (iv) Energy management products and services United States / Z Ordinary shares ENER-G Technologii Energetice Srl (iv) Energy management products and services Romania / AA Ordinary shares
Energy America LLC Energy supply United States / D Membership interest
Energy And Building Management Solutions Limited (ii)
In liquidation United Kingdom / A Ordinary shares
Energy For Tomorrow Not-for-profit energy services United Kingdom / A Limited by guarantee
First Choice Power LLC (iv) Energy supply and/or services United States / AB Membership interest
Flowgem Limited (iv) Home and/or commercial services United Kingdom / A Ordinary shares
Gateway Energy Services Corporation Energy supply United States / AC Ordinary shares GB Gas Holdings Limited Holding company United Kingdom / A Ordinary shares
Generation Green Solar Limited (iv) Dormant community benefit society United Kingdom / A Membership interest
GF One Limited In liquidation United Kingdom / AD Ordinary shares GF Two Limited In liquidation United Kingdom / AD Ordinary shares
GLID Limited Holding company United Kingdom / A Ordinary shares
Goldbrand Development Limited Dormant United Kingdom / A Ordinary shares
184
STRATEGIC REPORT GOVERNANCE
SHAREHOLDER INFORMATION
FINANCIAL STATEMENTS NOTES TO THE FINANCIAL STATEMENTS
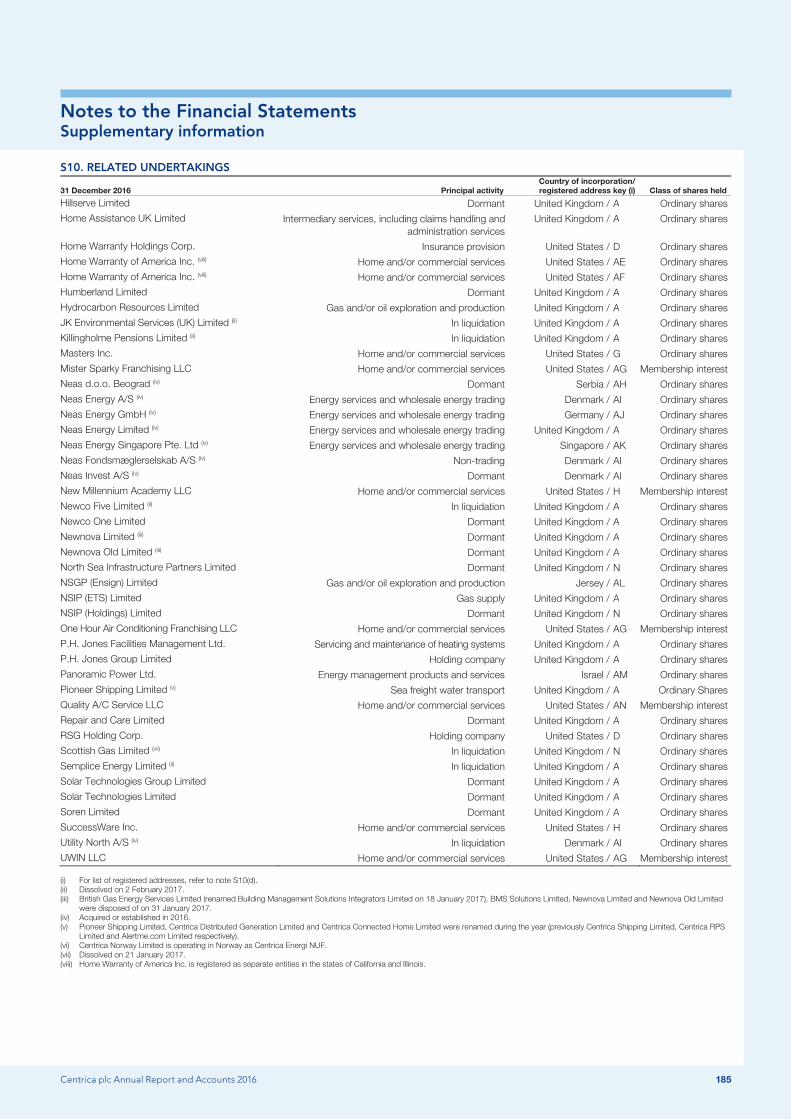
Notes to the Financial Statements Supplementary information
Centrica plc Annual Report and Accounts 2016 185
S10. RELATED UNDERTAKINGS
31 December 2016 Principal activity Country of incorporation/ registered address key (i) Class of shares held
Hillserve Limited Dormant United Kingdom / A Ordinary shares Home Assistance UK Limited Intermediary services, including claims handling and
administration services United Kingdom / A Ordinary shares
Home Warranty Holdings Corp. Insurance provision United States / D Ordinary shares
Home Warranty of America Inc. (viii) Home and/or commercial services United States / AE Ordinary shares
Home Warranty of America Inc. (viii) Home and/or commercial services United States / AF Ordinary shares Humberland Limited Dormant United Kingdom / A Ordinary shares
Hydrocarbon Resources Limited Gas and/or oil exploration and production United Kingdom / A Ordinary shares
JK Environmental Services (UK) Limited (ii) In liquidation United Kingdom / A Ordinary shares Killingholme Pensions Limited (ii) In liquidation United Kingdom / A Ordinary shares
Masters Inc. Home and/or commercial services United States / G Ordinary shares
Mister Sparky Franchising LLC Home and/or commercial services United States / AG Membership interest Neas d.o.o. Beograd (iv) Dormant Serbia / AH Ordinary shares
Neas Energy A/S (iv) Energy services and wholesale energy trading Denmark / AI Ordinary shares
Neas Energy GmbH (iv) Energy services and wholesale energy trading Germany / AJ Ordinary shares Neas Energy Limited (iv) Energy services and wholesale energy trading United Kingdom / A Ordinary shares
Neas Energy Singapore Pte. Ltd (iv) Energy services and wholesale energy trading Singapore / AK Ordinary shares
Neas Fondsmæglerselskab A/S (iv) Non-trading Denmark / AI Ordinary shares Neas Invest A/S (iv) Dormant Denmark / AI Ordinary shares
New Millennium Academy LLC Home and/or commercial services United States / H Membership interest
Newco Five Limited (ii) In liquidation United Kingdom / A Ordinary shares Newco One Limited Dormant United Kingdom / A Ordinary shares
Newnova Limited (iii) Dormant United Kingdom / A Ordinary shares
Newnova Old Limited (iii) Dormant United Kingdom / A Ordinary shares North Sea Infrastructure Partners Limited Dormant United Kingdom / N Ordinary shares
NSGP (Ensign) Limited Gas and/or oil exploration and production Jersey / AL Ordinary shares
NSIP (ETS) Limited Gas supply United Kingdom / A Ordinary shares NSIP (Holdings) Limited Dormant United Kingdom / N Ordinary shares
One Hour Air Conditioning Franchising LLC Home and/or commercial services United States / AG Membership interest
P.H. Jones Facilities Management Ltd. Servicing and maintenance of heating systems United Kingdom / A Ordinary shares P.H. Jones Group Limited Holding company United Kingdom / A Ordinary shares
Panoramic Power Ltd. Energy management products and services Israel / AM Ordinary shares
Pioneer Shipping Limited (v) Sea freight water transport United Kingdom / A Ordinary Shares Quality A/C Service LLC Home and/or commercial services United States / AN Membership interest
Repair and Care Limited Dormant United Kingdom / A Ordinary shares
RSG Holding Corp. Holding company United States / D Ordinary shares Scottish Gas Limited (vii) In liquidation United Kingdom / N Ordinary shares
Semplice Energy Limited (ii) In liquidation United Kingdom / A Ordinary shares
Solar Technologies Group Limited Dormant United Kingdom / A Ordinary shares Solar Technologies Limited Dormant United Kingdom / A Ordinary shares
Soren Limited Dormant United Kingdom / A Ordinary shares
SuccessWare Inc. Home and/or commercial services United States / H Ordinary shares Utility North A/S (iv) In liquidation Denmark / AI Ordinary shares
UWIN LLC Home and/or commercial services United States / AG Membership interest
For list of registered addresses, refer to note S10(d). (i) Dissolved on 2 February 2017. (ii) British Gas Energy Services Limited (renamed Building Management Solutions Integrators Limited on 18 January 2017), BMS Solutions Limited, Newnova Limited and Newnova Old Limited (iii)
were disposed of on 31 January 2017. Acquired or established in 2016. (iv) Pioneer Shipping Limited, Centrica Distributed Generation Limited and Centrica Connected Home Limited were renamed during the year (previously Centrica Shipping Limited, Centrica RPS (v)
Limited and Alertme.com Limited respectively). Centrica Norway Limited is operating in Norway as Centrica Energi NUF. (vi) Dissolved on 21 January 2017. (vii) Home Warranty of America Inc. is registered as separate entities in the states of California and Illinois. (viii)
Centrica plc Annual Report and Accounts 2016 185
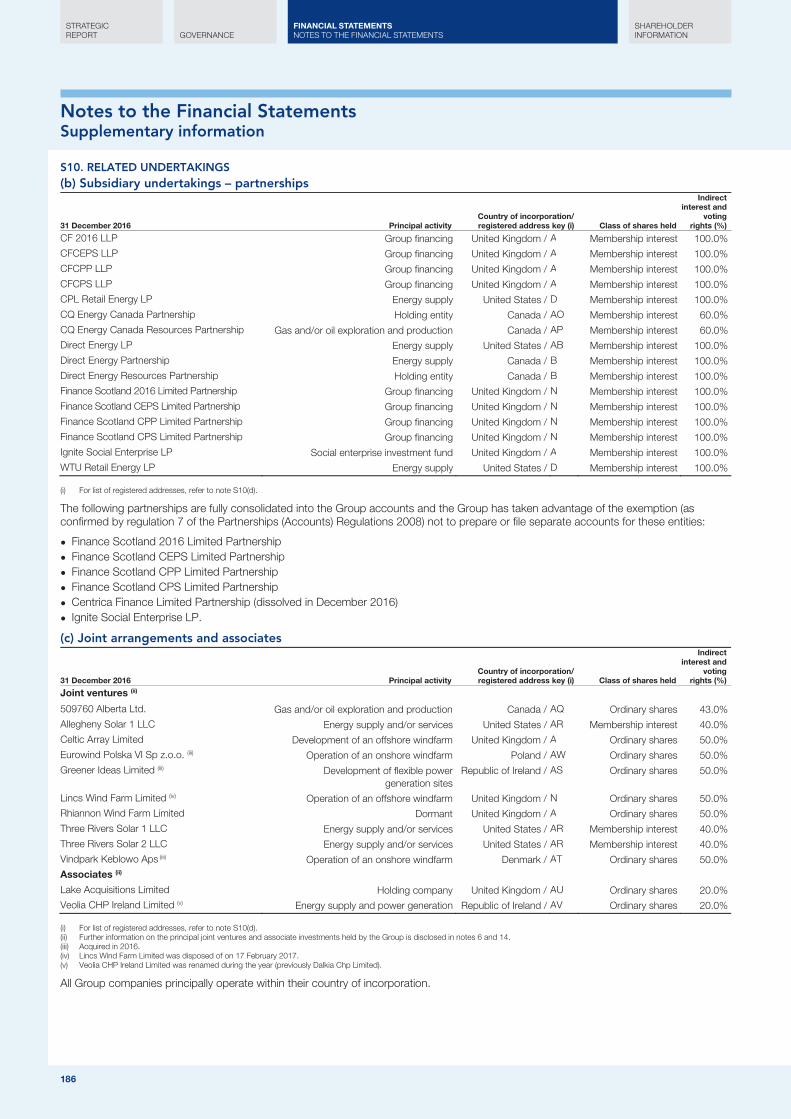
Notes to the Financial Statements Supplementary information
186
S10. RELATED UNDERTAKINGS (b) Subsidiary undertakings – partnerships
31 December 2016 Principal activity Country of incorporation/ registered address key (i) Class of shares held
Indirect interest and
voting rights (%)
CF 2016 LLP Group financing United Kingdom / A Membership interest 100.0% CFCEPS LLP Group financing United Kingdom / A Membership interest 100.0%
CFCPP LLP Group financing United Kingdom / A Membership interest 100.0%
CFCPS LLP Group financing United Kingdom / A Membership interest 100.0% CPL Retail Energy LP Energy supply United States / D Membership interest 100.0%
CQ Energy Canada Partnership Holding entity Canada / AO Membership interest 60.0%
CQ Energy Canada Resources Partnership Gas and/or oil exploration and production Canada / AP Membership interest 60.0% Direct Energy LP Energy supply United States / AB Membership interest 100.0%
Direct Energy Partnership Energy supply Canada / B Membership interest 100.0%
Direct Energy Resources Partnership Holding entity Canada / B Membership interest 100.0% Finance Scotland 2016 Limited Partnership Group financing United Kingdom / N Membership interest 100.0%
Finance Scotland CEPS Limited Partnership Group financing United Kingdom / N Membership interest 100.0%
Finance Scotland CPP Limited Partnership Group financing United Kingdom / N Membership interest 100.0% Finance Scotland CPS Limited Partnership Group financing United Kingdom / N Membership interest 100.0%
Ignite Social Enterprise LP Social enterprise investment fund United Kingdom / A Membership interest 100.0%
WTU Retail Energy LP Energy supply United States / D Membership interest 100.0%
For list of registered addresses, refer to note S10(d). (i)
The following partnerships are fully consolidated into the Group accounts and the Group has taken advantage of the exemption (as confirmed by regulation 7 of the Partnerships (Accounts) Regulations 2008) not to prepare or file separate accounts for these entities:
● Finance Scotland 2016 Limited Partnership ● Finance Scotland CEPS Limited Partnership ● Finance Scotland CPP Limited Partnership ● Finance Scotland CPS Limited Partnership ● Centrica Finance Limited Partnership (dissolved in December 2016) ● Ignite Social Enterprise LP.
(c) Joint arrangements and associates
31 December 2016 Principal activity Country of incorporation/ registered address key (i) Class of shares held
Indirect interest and
voting rights (%)
Joint ventures (ii)
509760 Alberta Ltd. Gas and/or oil exploration and production Canada / AQ Ordinary shares 43.0%
Allegheny Solar 1 LLC Energy supply and/or services United States / AR Membership interest 40.0% Celtic Array Limited Development of an offshore windfarm United Kingdom / A Ordinary shares 50.0%
Eurowind Polska VI Sp z.o.o. (iii) Operation of an onshore windfarm Poland / AW Ordinary shares 50.0%
Greener Ideas Limited (iii) Development of flexible power generation sites
Republic of Ireland / AS Ordinary shares 50.0%
Lincs Wind Farm Limited (iv) Operation of an offshore windfarm United Kingdom / N Ordinary shares 50.0% Rhiannon Wind Farm Limited Dormant United Kingdom / A Ordinary shares 50.0%
Three Rivers Solar 1 LLC Energy supply and/or services United States / AR Membership interest 40.0%
Three Rivers Solar 2 LLC Energy supply and/or services United States / AR Membership interest 40.0% Vindpark Keblowo Aps (iii) Operation of an onshore windfarm Denmark / AT Ordinary shares 50.0%
Associates (ii)
Lake Acquisitions Limited Holding company United Kingdom / AU Ordinary shares 20.0% Veolia CHP Ireland Limited (v) Energy supply and power generation Republic of Ireland / AV Ordinary shares 20.0%
For list of registered addresses, refer to note S10(d). (i) Further information on the principal joint ventures and associate investments held by the Group is disclosed in notes 6 and 14. (ii) Acquired in 2016. (iii) Lincs Wind Farm Limited was disposed of on 17 February 2017. (iv) Veolia CHP Ireland Limited was renamed during the year (previously Dalkia Chp Limited). (v)
All Group companies principally operate within their country of incorporation.
186
STRATEGIC REPORT GOVERNANCE
SHAREHOLDER INFORMATION
FINANCIAL STATEMENTS NOTES TO THE FINANCIAL STATEMENTS
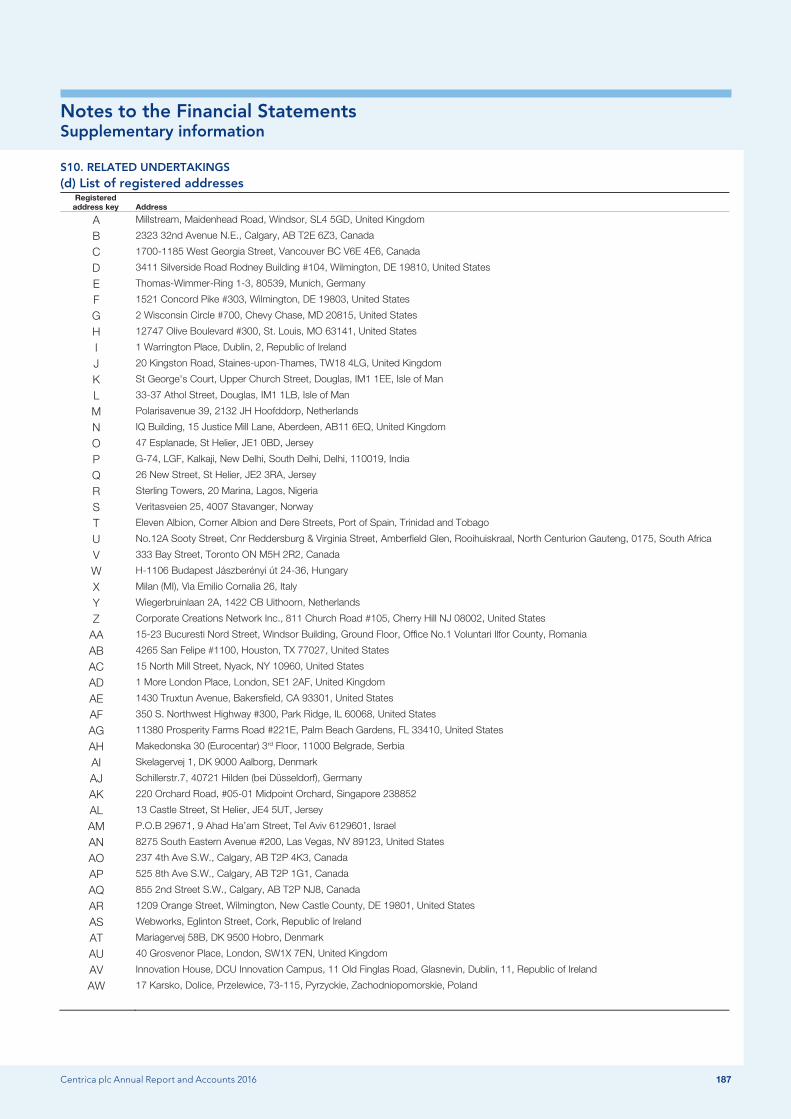
Notes to the Financial Statements Supplementary information
Centrica plc Annual Report and Accounts 2016 187
S10. RELATED UNDERTAKINGS (d) List of registered addresses
Registered address key Address
A Millstream, Maidenhead Road, Windsor, SL4 5GD, United Kingdom
B 2323 32nd Avenue N.E., Calgary, AB T2E 6Z3, Canada
C 1700-1185 West Georgia Street, Vancouver BC V6E 4E6, Canada
D 3411 Silverside Road Rodney Building #104, Wilmington, DE 19810, United States
E Thomas-Wimmer-Ring 1-3, 80539, Munich, Germany
F 1521 Concord Pike #303, Wilmington, DE 19803, United States
G 2 Wisconsin Circle #700, Chevy Chase, MD 20815, United States
H 12747 Olive Boulevard #300, St. Louis, MO 63141, United States
I 1 Warrington Place, Dublin, 2, Republic of Ireland
J 20 Kingston Road, Staines-upon-Thames, TW18 4LG, United Kingdom
K St George's Court, Upper Church Street, Douglas, IM1 1EE, Isle of Man
L 33-37 Athol Street, Douglas, IM1 1LB, Isle of Man
M Polarisavenue 39, 2132 JH Hoofddorp, Netherlands
N IQ Building, 15 Justice Mill Lane, Aberdeen, AB11 6EQ, United Kingdom
O 47 Esplanade, St Helier, JE1 0BD, Jersey
P G-74, LGF, Kalkaji, New Delhi, South Delhi, Delhi, 110019, India
Q 26 New Street, St Helier, JE2 3RA, Jersey
R Sterling Towers, 20 Marina, Lagos, Nigeria
S Veritasveien 25, 4007 Stavanger, Norway
T Eleven Albion, Corner Albion and Dere Streets, Port of Spain, Trinidad and Tobago
U No.12A Sooty Street, Cnr Reddersburg & Virginia Street, Amberfield Glen, Rooihuiskraal, North Centurion Gauteng, 0175, South Africa
V 333 Bay Street, Toronto ON M5H 2R2, Canada
W H-1106 Budapest Jászberényi út 24-36, Hungary
X Milan (MI), Via Emilio Cornalia 26, Italy
Y Wiegerbruinlaan 2A, 1422 CB Uithoorn, Netherlands
Z Corporate Creations Network Inc., 811 Church Road #105, Cherry Hill NJ 08002, United States
AA 15-23 Bucuresti Nord Street, Windsor Building, Ground Floor, Office No.1 Voluntari Ilfor County, Romania
AB 4265 San Felipe #1100, Houston, TX 77027, United States
AC 15 North Mill Street, Nyack, NY 10960, United States
AD 1 More London Place, London, SE1 2AF, United Kingdom
AE 1430 Truxtun Avenue, Bakersfield, CA 93301, United States
AF 350 S. Northwest Highway #300, Park Ridge, IL 60068, United States
AG 11380 Prosperity Farms Road #221E, Palm Beach Gardens, FL 33410, United States
AH Makedonska 30 (Eurocentar) 3rd Floor, 11000 Belgrade, Serbia
AI Skelagervej 1, DK 9000 Aalborg, Denmark
AJ Schillerstr.7, 40721 Hilden (bei Düsseldorf), Germany
AK 220 Orchard Road, #05-01 Midpoint Orchard, Singapore 238852
AL 13 Castle Street, St Helier, JE4 5UT, Jersey
AM P.O.B 29671, 9 Ahad Ha’am Street, Tel Aviv 6129601, Israel
AN 8275 South Eastern Avenue #200, Las Vegas, NV 89123, United States
AO 237 4th Ave S.W., Calgary, AB T2P 4K3, Canada
AP 525 8th Ave S.W., Calgary, AB T2P 1G1, Canada
AQ 855 2nd Street S.W., Calgary, AB T2P NJ8, Canada
AR 1209 Orange Street, Wilmington, New Castle County, DE 19801, United States
AS Webworks, Eglinton Street, Cork, Republic of Ireland
AT Mariagervej 58B, DK 9500 Hobro, Denmark
AU 40 Grosvenor Place, London, SW1X 7EN, United Kingdom
AV Innovation House, DCU Innovation Campus, 11 Old Finglas Road, Glasnevin, Dublin, 11, Republic of Ireland
AW 17 Karsko, Dolice, Przelewice, 73-115, Pyrzyckie, Zachodniopomorskie, Poland
Centrica plc Annual Report and Accounts 2016 187

Notes to the Financial Statements Supplementary information
188
S10. RELATED UNDERTAKINGS (e) Summarised financial information Material joint ventures and associates Management has determined that the investments in Lake Acquisitions Limited and Lincs Wind Farm Limited are sufficiently material to warrant further disclosure on an individual basis. Accordingly, the Group presents summarised financial information, along with reconciliations to the amounts included in the consolidated Group Financial Statements, for these investees.
Lake Acquisitions Limited Summarised Statement of Total Comprehensive Income
2016 2015
Year ended 31 December
Associate information reported to
Group £m
Unadjusted 20% share
£m
Fair value and other
adjustments £m
Group share
£m
Associate information reported to
Group £m
Unadjusted 20% share
£m
Fair value and other
adjustments £m
Group share
£m
Revenue 3,116 623 – 623 3,220 644 – 644 Operating profit before interest and tax 1,011 202 (65) 137 1,351 270 (56) 214 Profit for the year 778 156 (43) 113 1,042 208 (26) 182 Other comprehensive income/(loss) 318 64 – 64 (38) (8) – (8) Total comprehensive income 1,096 220 (43) 177 1,004 200 (26) 174
Summarised Balance Sheet 2016 2015
31 December
Associate information reported to
Group £m
Unadjusted 20% share
£m
Fair value and other
adjustments (i)
£m
Group share
£m
Associate information reported to
Group £m
Unadjusted 20% share
£m
Fair value and other
adjustments (i)
£m
Group share
£m
Non-current assets 13,957 2,791 879 3,670 12,775 2,555 929 3,484 Current assets 3,157 631 7 638 2,800 560 13 573 Current liabilities (746) (149) – (149) (883) (177) – (177) Non-current liabilities (8,743) (1,749) (148) (1,897) (7,613) (1,523) (162) (1,685) Net assets 7,625 1,524 738 2,262 7,079 1,415 780 2,195
Before cumulative impairments of £586 million (2015: £586 million) of the Group’s associate investment. (i)
During the year, dividends of £110 million (2015: £166 million) were paid by the associate to the Group.
Lincs Wind Farm Limited Summarised Statement of Total Comprehensive Income
2016 2015
Year ended 31 December
Joint venture information reported to
Group £m
Unadjusted 50% share
£m
Fair value and other
adjustments £m
Group share
£m
Joint venture information reported to
Group £m
Unadjusted 50% share
£m
Fair value and other
adjustments £m
Group share
£m
Revenue 113 57 – 57 125 62 – 62 Depreciation and amortisation (49) (25) – (25) (49) (24) – (24) Other costs of sales and operating costs (43) (22) – (22) (45) (23) – (23) Profit before interest and tax 21 10 – 10 31 15 – 15 Net finance cost (49) (25) – (25) (54) (27) – (27) Taxation 7 4 – 4 13 6 – 6 Loss for the year (21) (11) – (11) (10) (6) – (6) Other comprehensive (loss)/income (16) (8) – (8) 3 2 – 2 Total comprehensive loss (37) (19) – (19) (7) (4) – (4)
188
STRATEGIC REPORT GOVERNANCE
SHAREHOLDER INFORMATION
FINANCIAL STATEMENTS NOTES TO THE FINANCIAL STATEMENTS

Notes to the Financial Statements Supplementary information
Centrica plc Annual Report and Accounts 2016 189
S10. RELATED UNDERTAKINGS Summarised Balance Sheet
2016 2015
31 December
Joint venture information reported to
Group (i) £m
Unadjusted 50% share
£m
Fair value and other
adjustments £m
Group share
£m
Joint venture information reported to
Group (i) £m
Unadjusted 50% share
£m
Fair value and other
adjustments £m
Group share
£m
Non-current assets 859 429 3 432 943 472 3 475 Current assets (i) 36 18 – 18 116 58 – 58 Current liabilities (i) (86) (43) – (43) (187) (94) – (94) Non-current liabilities (i) (704) (352) – (352) (730) (365) – (365) Net assets 105 52 3 55 142 71 3 74
Current assets includes £7 million (2015: £76 million) of cash and cash equivalents. Non-current liabilities and current liabilities include £651 million (2015: £682 million) and £33 million (i)(2015: £59 million) of borrowings respectively.
Other material joint arrangements owned by the Group that are classified as joint operations and accounted for in accordance with IFRS 11 (see note S2) are detailed below. This list excludes interests in fields where there is no party with overall control since the arrangement does not fulfil the IFRS 11 definition of joint control.
Joint operations – fields/assets
31 December 2016 Location
Percentage holding in ordinary shares and
net assets
Cygnus UK North Sea 49
Material non-controlling interests The Group has two subsidiary undertakings with a non-controlling interest: CQ Energy Canada Partnership and its 100% subsidiary, CQ Energy Canada Resources Partnership.
2016 2015
31 December
Non-controlling
interests %
Loss for the year
£m
Total comprehensive
income £m
Total equity
£m
Distributions to non-
controlling interests (i)
£m
Non- controlling
interests %
Loss for the year
£m
Total comprehensive
loss £m
Total equity
£m
Distributions to non-
controlling interests
£m
CQ Energy Canada Partnership 40 (10) 26 178 (12) 40 (137) (172) 164 –
Includes a £2 million accrual in relation to declared and approved dividends. (i)
Summarised financial information The summarised financial information disclosed is shown on a 100% basis. It represents the consolidated position of CQ Energy Canada Partnership and its subsidiary that would be shown in its consolidated financial statements prepared in accordance with IFRS under Group accounting policies before intercompany eliminations.
Summarised Statement of Total Comprehensive Income
Year ended 31 December 2016
£m 2015
£m
Revenue 201 252 Loss for the year (25) (342) Other comprehensive income/(loss) 90 (88)
Total comprehensive income/(loss) 65 (430)
Summarised Balance Sheet
31 December 2016
£m 2015
£m
Non-current assets 1,040 922 Current assets 66 70 Current liabilities (77) (96) Non-current liabilities (521) (432) Net assets 508 464
Summarised Cash Flow
Year ended 31 December 2016
£m 2015
£m
Net decrease in cash and cash equivalents (8) (6)
Centrica plc Annual Report and Accounts 2016 189
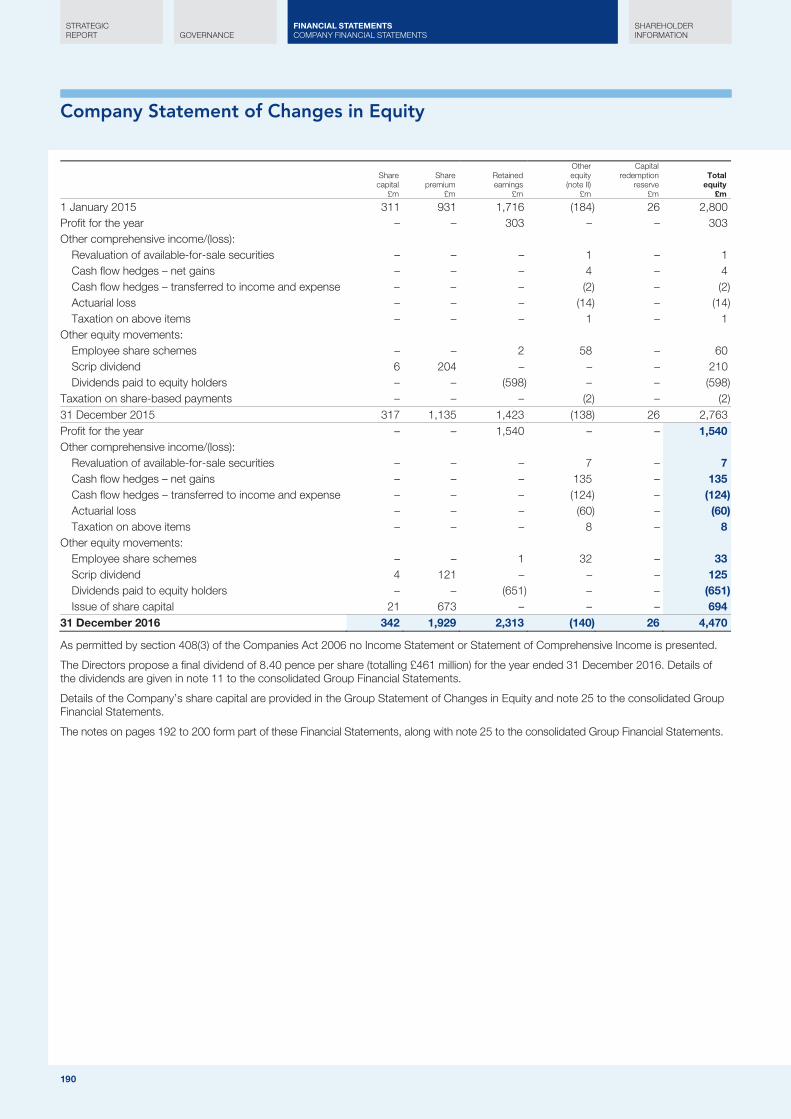
Company Statement of Changes in Equity
190
Share capital
£m
Share premium
£m
Retained earnings
£m
Other equity
(note II) £m
Capital redemption
reserve £m
Total equity
£m
1 January 2015 311 931 1,716 (184) 26 2,800 Profit for the year – – 303 – – 303 Other comprehensive income/(loss):
Revaluation of available-for-sale securities – – – 1 – 1 Cash flow hedges – net gains – – – 4 – 4 Cash flow hedges – transferred to income and expense – – – (2) – (2) Actuarial loss – – – (14) – (14) Taxation on above items – – – 1 – 1
Other equity movements: Employee share schemes – – 2 58 – 60 Scrip dividend 6 204 – – – 210 Dividends paid to equity holders – – (598) – – (598)
Taxation on share-based payments – – – (2) – (2) 31 December 2015 317 1,135 1,423 (138) 26 2,763 Profit for the year – – 1,540 – – 1,540 Other comprehensive income/(loss):
Revaluation of available-for-sale securities – – – 7 – 7 Cash flow hedges – net gains – – – 135 – 135 Cash flow hedges – transferred to income and expense – – – (124) – (124) Actuarial loss – – – (60) – (60) Taxation on above items – – – 8 – 8
Other equity movements: Employee share schemes – – 1 32 – 33 Scrip dividend 4 121 – – – 125 Dividends paid to equity holders – – (651) – – (651) Issue of share capital 21 673 – – – 694
31 December 2016 342 1,929 2,313 (140) 26 4,470
As permitted by section 408(3) of the Companies Act 2006 no Income Statement or Statement of Comprehensive Income is presented.
The Directors propose a final dividend of 8.40 pence per share (totalling £461 million) for the year ended 31 December 2016. Details of the dividends are given in note 11 to the consolidated Group Financial Statements.
Details of the Company’s share capital are provided in the Group Statement of Changes in Equity and note 25 to the consolidated Group Financial Statements.
The notes on pages 192 to 200 form part of these Financial Statements, along with note 25 to the consolidated Group Financial Statements.
190
STRATEGIC REPORT GOVERNANCE
SHAREHOLDER INFORMATION
FINANCIAL STATEMENTS NOTES TO THE COMPANY FINANCIAL STATEMENTS
STRATEGIC REPORT GOVERNANCE
SHAREHOLDER INFORMATION
FINANCIAL STATEMENTS COMPANY FINANCIAL STATEMENTS
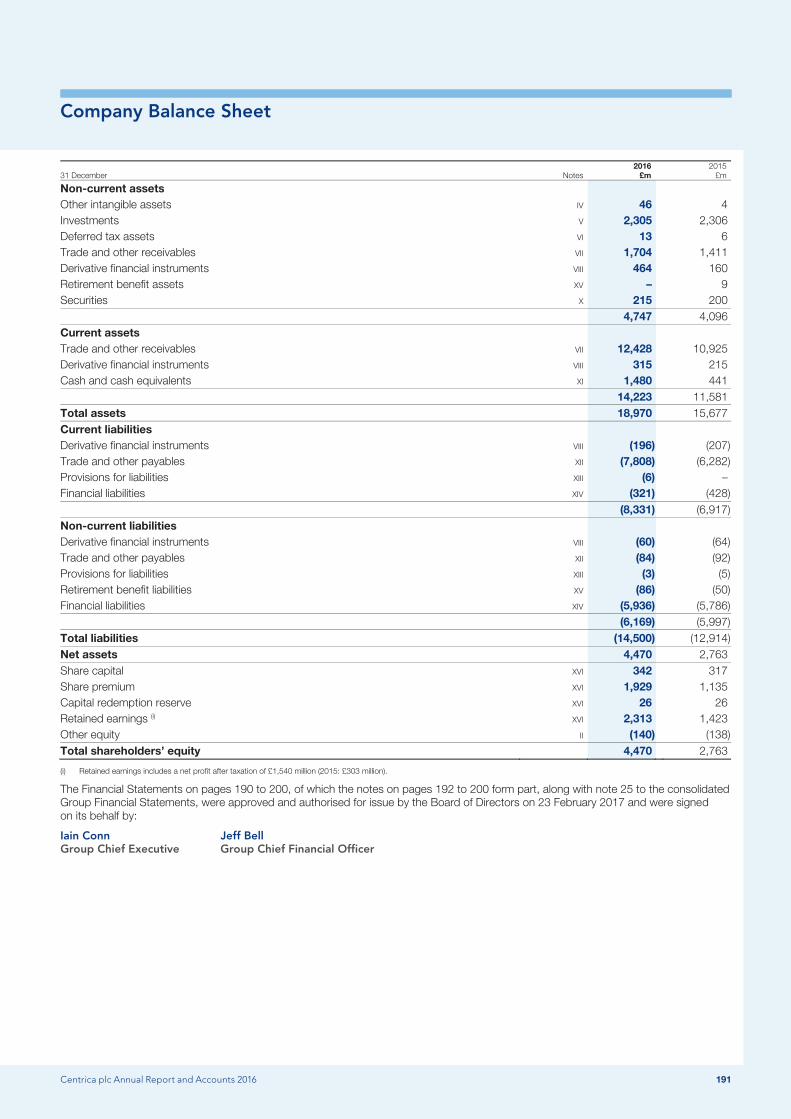
Company Balance Sheet
Centrica plc Annual Report and Accounts 2016 191
31 December Notes 2016
£m 2015
£m
Non-current assets Other intangible assets IV 46 4 Investments V 2,305 2,306 Deferred tax assets VI 13 6 Trade and other receivables VII 1,704 1,411 Derivative financial instruments VIII 464 160 Retirement benefit assets XV – 9 Securities X 215 200 4,747 4,096 Current assets Trade and other receivables VII 12,428 10,925 Derivative financial instruments VIII 315 215 Cash and cash equivalents XI 1,480 441 14,223 11,581 Total assets 18,970 15,677 Current liabilities Derivative financial instruments VIII (196) (207) Trade and other payables XII (7,808) (6,282) Provisions for liabilities XIII (6) – Financial liabilities XIV (321) (428) (8,331) (6,917) Non-current liabilities Derivative financial instruments VIII (60) (64) Trade and other payables XII (84) (92) Provisions for liabilities XIII (3) (5) Retirement benefit liabilities XV (86) (50) Financial liabilities XIV (5,936) (5,786) (6,169) (5,997) Total liabilities (14,500) (12,914) Net assets 4,470 2,763 Share capital XVI 342 317 Share premium XVI 1,929 1,135 Capital redemption reserve XVI 26 26 Retained earnings (i) XVI 2,313 1,423 Other equity II (140) (138) Total shareholders’ equity 4,470 2,763
(i) Retained earnings includes a net profit after taxation of £1,540 million (2015: £303 million).
The Financial Statements on pages 190 to 200, of which the notes on pages 192 to 200 form part, along with note 25 to the consolidated Group Financial Statements, were approved and authorised for issue by the Board of Directors on 23 February 2017 and were signed on its behalf by:
Iain Conn Jeff Bell Group Chief Executive Group Chief Financial Officer
Centrica plc Annual Report and Accounts 2016 191

Notes to the Company Financial Statements
192
I. PRINCIPAL ACCOUNTING POLICIES OF THE COMPANY Basis of preparation The Company Financial Statements have been prepared in accordance with Financial Reporting Standard 101: ‘Reduced disclosure framework’ (FRS 101). In preparing these Financial Statements, the Company applies the recognition, measurement and disclosure requirements of International Financial Reporting Standards as adopted by the EU (‘Adopted IFRSs’), but makes amendments where necessary in order to comply with Companies Act 2006 and sets out below where advantage of the FRS 101 disclosure exemptions has been taken.
In these Financial Statements, the Company has applied the exemptions available under FRS 101 in respect of the following disclosures:
● a Cash Flow Statement and related notes; ● comparative period reconciliations for tangible fixed assets and intangible assets; ● disclosures in respect of transactions with wholly owned subsidiaries; ● disclosures in respect of capital management; and ● the effects of new but not yet effective IFRSs.
No Income Statement or Statement of Comprehensive Income is presented for the Company as permitted by the Companies Act 2006 (section 408(3)). The Company profit after tax for the year was £1,540 million (2015: £303 million).
As the consolidated Group Financial Statements of Centrica plc, which are available from the registered office, include the equivalent disclosures, the Company has also taken the exemptions under FRS 101 available in respect of the following disclosures:
● IFRS 2: ‘Share-based payment’ in respect of Group settled share-based payments; and ● certain disclosures required by IFRS 13: ‘Fair value measurement’ and the disclosures required by IFRS 7: ‘Financial instruments: disclosures’.
Restatements In March 2016, the IFRS Interpretations Committee issued an agenda decision regarding the treatment of offsetting and cash-pooling arrangements in accordance with IAS 32: ‘Financial instruments: presentation’. This provided additional guidance on when bank overdrafts in cash-pooling arrangements would meet the requirement for offsetting in accordance with IAS 32. Following this additional guidance, the Group has reviewed its cash-pooling arrangements and has revised its presentation of bank overdrafts on the Group Balance Sheet. There is no revision required for the Company Balance Sheet.
Measurement convention The Company Financial Statements are prepared on the historical cost basis except for the following assets and liabilities, which are stated at their fair values: derivative financial instruments, financial instruments classified as fair value through the profit or loss or as available-for-sale, and the assets of defined benefit pension schemes. The liabilities of defined benefit pension schemes are measured at the projected unit method of valuation. These Company Financial Statements are rounded to the nearest million pounds sterling. Unless required or permitted by an IFRS, assets and liabilities or income and expenses, are not offset.
Going concern The accounts have been prepared on a going concern basis, as described in the Directors’ Report and note 24(b) of the consolidated Group Financial Statements.
Critical accounting judgements and key sources of estimation uncertainty The critical accounting judgements and key sources of estimation uncertainty are set out in note 3 of the consolidated Group Financial Statements.
The key accounting judgement of the Company is the carrying value of its investments in subsidiary undertakings and receivables from these undertakings. The Company does not deem its investments in subsidiary undertakings to be impaired and supports this judgement through its impairment review process as detailed below. This impairment review process identified that some receivables from Group undertakings were not fully recoverable and accordingly a bad debt provision of £87 million (2015: £262 million) was recognised against receivables during the year and impairments of £404 million (2015: nil) made in previous years were reversed. There were no debt waivers during the year (2015: £25 million).
Key sources of estimation uncertainty include:
● the fair value of derivative financial instruments classified as Level 2 within the fair value hierarchy as a result of the use of valuation techniques, in addition to published price quotations in active markets, to determine these values; and
● the allocation of the Company’s share of pension scheme surplus/deficit, as detailed further within the accounting policies section of these Company Financial Statements.
New standards effective during the year
From 1 January 2016, the following standards and amendments are effective in the Company’s Financial Statements:
● Amendment to IAS 1: ‘Presentation of financial statements’ related to the disclosure initiative; ● Amendment to IAS 16: ‘Property, plant and equipment’ and IAS 38: ‘Intangible assets’ related to the clarification of acceptable
methods of depreciation and amortisation; ● Amendment to IAS 19: ‘Employee benefits’ related to employee contributions to defined benefit plans; ● ‘Annual Improvement Project 2010-2012’; and ● ‘Annual Improvement Project 2012-2014’.
192
STRATEGIC REPORT GOVERNANCE
SHAREHOLDER INFORMATION
FINANCIAL STATEMENTS NOTES TO THE COMPANY FINANCIAL STATEMENTS

Notes to the Company Financial Statements
Centrica plc Annual Report and Accounts 2016 193
I. PRINCIPAL ACCOUNTING POLICIES OF THE COMPANY The accounting policies set out below have, unless otherwise stated, been applied consistently to all periods presented in these Company Financial Statements.
Employee share schemes The Group has a number of employee share schemes under which it makes equity-settled share-based payments as detailed in the Remuneration Report on pages 83 to 99 and in note S2 to the consolidated Group Financial Statements. Equity-settled share-based payments are measured at fair value at the date of grant (excluding the effect of non-market-based vesting conditions). The fair value determined at the grant date is expensed on a straight-line basis together with a corresponding increase in equity over the vesting period, based on the Group’s estimate of the number of awards that will vest and adjusted for the effect of non-market-based vesting conditions. The issue of share incentives by the Company to employees of its subsidiaries represents additional capital contributions. When these costs are recharged to the subsidiary undertaking, the investment balance is reduced accordingly.
Fair value is measured using methods detailed in note S2 to the consolidated Group Financial Statements.
Foreign currencies The Company’s functional and presentational currency is pounds sterling. Transactions in foreign currencies are translated at the rate of exchange ruling at the date of the transaction. Monetary assets and liabilities denominated in foreign currencies are translated into pounds sterling at closing rates of exchange. Exchange differences on monetary assets and liabilities are taken to the Income Statement.
Intangible assets Intangible assets acquired separately are measured on initial recognition at cost. Intangible assets consist of application software for internal use. The cost of purchased application software, for example investments in financial and administrative systems, includes contractors’ charges, materials, directly attributable labour and directly attributable overheads. Intangible assets are amortised on a straight-line basis at rates sufficient to write off the cost, less estimated residual values, of individual assets over their estimated useful lives of up to 10 years. Amortisation of assets under construction commences when the asset is operational.
Investments Fixed asset investments in subsidiaries’ shares are held at cost in accordance with IAS 27: ‘Separate financial statements’, less any provision for impairment as necessary.
Impairment The Company’s accounting policies in respect of impairment of intangible assets and financial assets are consistent with those of the Group.
The carrying values of investments in subsidiary undertakings are reviewed at each reporting date to determine whether there is any indication of impairment. If any such indication exists, then the asset’s recoverable amount is estimated.
The recoverable amount of an investment in a subsidiary undertaking is the greater of its value in use and its fair value less costs of disposal. In assessing value in use, the estimated future cash flows are discounted to their present value using a pre-tax discount rate that reflects current market assessments of the time value of money and the risks specific to the asset. Receivables from Group undertakings are compared to their recoverable amount which is also assessed using the same estimated discounted future cash flow for each undertaking as described above.
An impairment loss is recognised if the carrying amount of an asset exceeds its estimated recoverable amount.
Leases The determination of whether an arrangement is, or contains, a lease is based on the substance of the arrangement and requires an assessment of whether the fulfilment of the arrangement is dependent on the use of a specific asset or assets and whether the arrangement conveys a right to use the asset or assets. Leases are classified as finance leases whenever the terms of the lease transfer substantially all of the risks and rewards of ownership to the lessee. All other leases are classified as operating leases.
Payments under operating leases are charged to the Income Statement on a straight-line basis over the term of the lease.
Pensions and other post employment benefits The Company’s employees participate in a number of the Group’s defined benefit pension schemes. The total Group cost of providing benefits under defined benefit schemes is determined separately for each of the Group’s schemes under the projected unit credit actuarial valuation method. Actuarial gains and losses are recognised in full in the period in which they occur. The key assumptions used for the actuarial valuation are based on the Group’s best estimate of the variables that will determine the ultimate cost of providing post employment benefits, on which further detail is provided in note 22 to the consolidated Group Financial Statements.
The Company’s share of the total Group surplus or deficit at the end of the reporting period for each scheme is calculated in proportion to the Company’s share of ordinary employer contributions to that scheme during the year; ordinary employer contributions are determined by the pensionable pay of the Company’s employees within the scheme and the cash contribution rates set by the scheme trustees. Current service cost is calculated with reference to the pensionable pay of the Company’s employees. The Company’s share of the total Group interest on scheme liabilities, expected return on scheme assets and actuarial gains or losses is calculated in proportion to ordinary employer contributions in the prior accounting period. Changes in the surplus or deficit arising as a result of the changes in the Company’s share of total ordinary employer contributions are also treated as actuarial gains or losses.
Centrica plc Annual Report and Accounts 2016 193
Notes to the Company Financial Statements
194
I. PRINCIPAL ACCOUNTING POLICIES OF THE COMPANY Taxation Current tax, including UK corporation tax, is provided at amounts expected to be paid (or recovered) using the tax rates and laws that have been enacted or substantively enacted by the balance sheet date.
Deferred tax is recognised in respect of all temporary differences identified at the balance sheet date, except for differences arising on:
● the initial recognition of an asset or liability in a transaction which is not a business combination and which at the time of the transaction affects neither accounting profit nor taxable profit; and
● investments in subsidiaries where the Company is able to control the timing of the reversal of the difference and it is probable that the difference will not reverse in the foreseeable future.
Temporary differences are differences between the carrying amount of the Company’s assets and liabilities and their tax base.
Deferred tax assets and liabilities are offset when the Company has a legally enforceable right to offset current tax assets and liabilities and the deferred tax assets and liabilities relate to taxes levied by the same tax authority.
Deferred tax assets that are not eligible for offset against deferred tax liabilities are recognised only when, on the basis of all available evidence, it can be regarded as probable that there will be suitable taxable profits in the foreseeable future, against which the deductible temporary difference can be utilised.
Deferred tax is measured at the average tax rates that are expected to apply in the periods in which the asset is realised or the liability is settled, based on tax rates and laws that have been enacted or substantively enacted by the balance sheet date. Measurement of deferred tax liabilities and assets reflects the tax consequences expected from the manner in which the asset or liability is recovered or settled.
The tax expense for the period comprises current and deferred tax. Tax is recognised in the Income Statement, except to the extent that it relates to items recognised in other comprehensive income or directly in equity. In this case, the tax is also recognised in other comprehensive income or directly in equity, respectively.
Financial instruments The Company’s accounting policies for financial instruments are consistent with those of the Group as disclosed in note S2 to the consolidated Group Financial Statements. The Company’s financial risk management policies are consistent with those of the Group and are described in the Strategic Report – Principal Risks and Uncertainties on pages 56 to 64 and in note S3 to the consolidated Group Financial Statements.
Presentation of derivative financial instruments In line with the Group’s accounting policy for derivative financial instruments, the Company has classified those derivatives held for the purpose of treasury management as current or non-current, based on expected settlement dates.
Provisions A provision is recognised when the Company has a present obligation (legal or constructive) as a result of a past event that can be measured reliably and it is probable that an outflow of economic benefit will be required to settle the obligation.
194
STRATEGIC REPORT GOVERNANCE
SHAREHOLDER INFORMATION
FINANCIAL STATEMENTS NOTES TO THE COMPANY FINANCIAL STATEMENTS

Notes to the Company Financial Statements
Centrica plc Annual Report and Accounts 2016 195
II. OTHER EQUITY
Cash flow
hedging reserve
£m
Actuarial gains and
losses reserve
£m
Available- for-sale reserve
(AFS) £m
Treasury and own
shares reserve
£m
Share- based
payments reserve
£m Total
£m
1 January 2015 (10) (34) 21 (256) 95 (184) Revaluation of available-for-sale securities – – 1 – – 1 Actuarial loss – (14) – – – (14) Employee share schemes:
Exercise of awards – – – 69 (45) 24 Value of services provided – – – – 45 45 Increase in own shares – – – (11) – (11)
Cash flow hedges: Net gains 4 – – – – 4 Transferred to income and expense (2) – – – – (2)
Taxation on above items (1) 2 – – (2) (1) 31 December 2015 (9) (46) 22 (198) 93 (138) Revaluation of available-for-sale securities – – 7 – – 7 Actuarial loss – (60) – – – (60) Employee share schemes:
Exercise of awards – – – 35 (32) 3 Value of services provided – – – – 46 46 Increase in own shares – – – (17) – (17)
Cash flow hedges: Net gains 135 – – – – 135 Transferred to income and expense (124) – – – – (124)
Taxation on above items (2) 11 (1) – – 8 31 December 2016 – (95) 28 (180) 107 (140)
III. DIRECTORS AND EMPLOYEES Details of Directors’ remuneration, share-based payments and pension entitlements in the Remuneration Report on pages 83 to 99 form part of these Company Financial Statements. Information on the main employee share-based payments is given in note S2 to the consolidated Group Financial Statements. Details of the remuneration of key management personnel are given in note S8 to the consolidated Group Financial Statements.
Employee costs
Year ended 31 December 2016
£m 2015
£m
Wages and salaries (78) (56) Social security costs (8) (5) Pension and other post retirement benefits costs (5) (6) Share scheme costs (4) 1 Capitalised employee costs 2 – (93) (66)
Average number of employees during the year
Year ended 31 December 2016
Number 2015
Number
Administration 493 319 Power 184 197 677 516
Centrica plc Annual Report and Accounts 2016 195
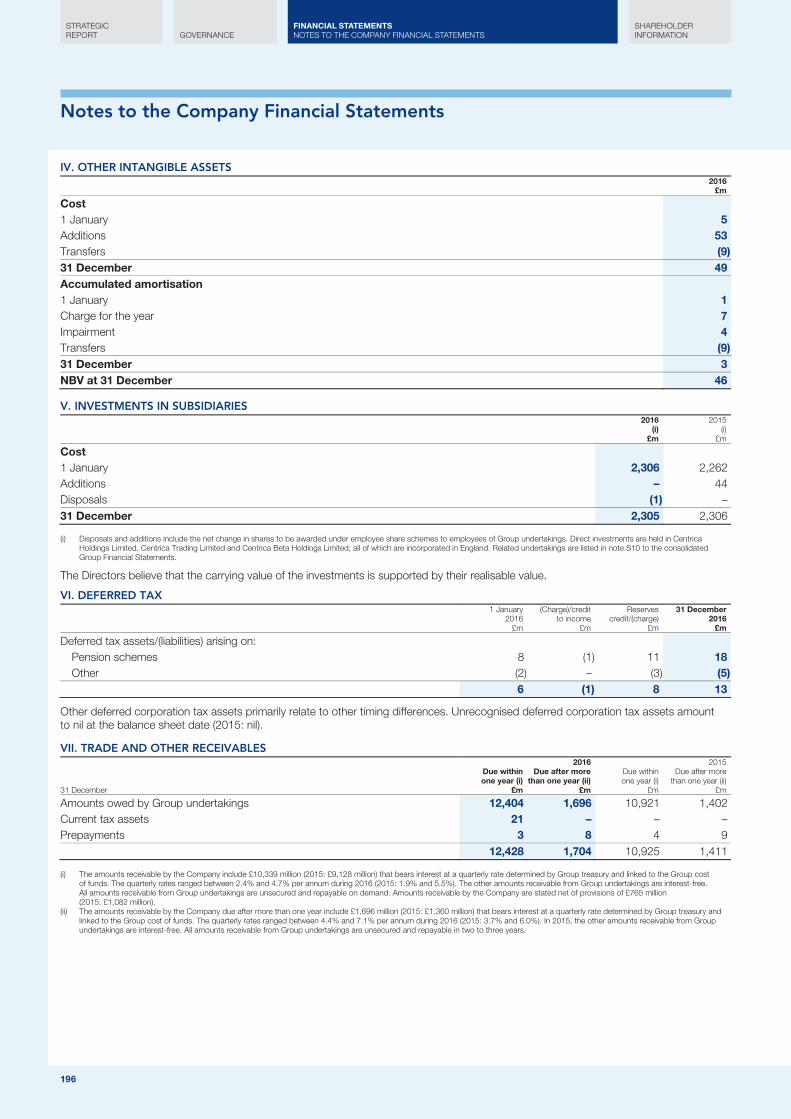
Notes to the Company Financial Statements
196
IV. OTHER INTANGIBLE ASSETS
2016
£m
Cost 1 January 5 Additions 53 Transfers (9) 31 December 49 Accumulated amortisation 1 January 1 Charge for the year 7 Impairment 4 Transfers (9) 31 December 3 NBV at 31 December 46
V. INVESTMENTS IN SUBSIDIARIES 2016 2015
(i)
£m (i)
£m
Cost 1 January 2,306 2,262 Additions – 44 Disposals (1) – 31 December 2,305 2,306
Disposals and additions include the net change in shares to be awarded under employee share schemes to employees of Group undertakings. Direct investments are held in Centrica (i)Holdings Limited, Centrica Trading Limited and Centrica Beta Holdings Limited, all of which are incorporated in England. Related undertakings are listed in note S10 to the consolidated Group Financial Statements.
The Directors believe that the carrying value of the investments is supported by their realisable value.
VI. DEFERRED TAX
1 January 2016
£m
(Charge)/credit to income
£m
Reserves credit/(charge)
£m
31 December 2016
£m
Deferred tax assets/(liabilities) arising on: Pension schemes 8 (1) 11 18 Other (2) – (3) (5)
6 (1) 8 13
Other deferred corporation tax assets primarily relate to other timing differences. Unrecognised deferred corporation tax assets amount to nil at the balance sheet date (2015: nil).
VII. TRADE AND OTHER RECEIVABLES 2016 2015
31 December
Due within one year (i)
£m
Due after more than one year (ii)
£m
Due within one year (i)
£m
Due after more than one year (ii)
£m
Amounts owed by Group undertakings 12,404 1,696 10,921 1,402 Current tax assets 21 – – – Prepayments 3 8 4 9 12,428 1,704 10,925 1,411
The amounts receivable by the Company include £10,339 million (2015: £9,128 million) that bears interest at a quarterly rate determined by Group treasury and linked to the Group cost (i)of funds. The quarterly rates ranged between 2.4% and 4.7% per annum during 2016 (2015: 1.9% and 5.5%). The other amounts receivable from Group undertakings are interest-free. All amounts receivable from Group undertakings are unsecured and repayable on demand. Amounts receivable by the Company are stated net of provisions of £765 million (2015: £1,082 million).
The amounts receivable by the Company due after more than one year include £1,696 million (2015: £1,360 million) that bears interest at a quarterly rate determined by Group treasury and (ii)linked to the Group cost of funds. The quarterly rates ranged between 4.4% and 7.1% per annum during 2016 (2015: 3.7% and 6.0%). In 2015, the other amounts receivable from Group undertakings are interest-free. All amounts receivable from Group undertakings are unsecured and repayable in two to three years.
196
STRATEGIC REPORT GOVERNANCE
SHAREHOLDER INFORMATION
FINANCIAL STATEMENTS NOTES TO THE COMPANY FINANCIAL STATEMENTS
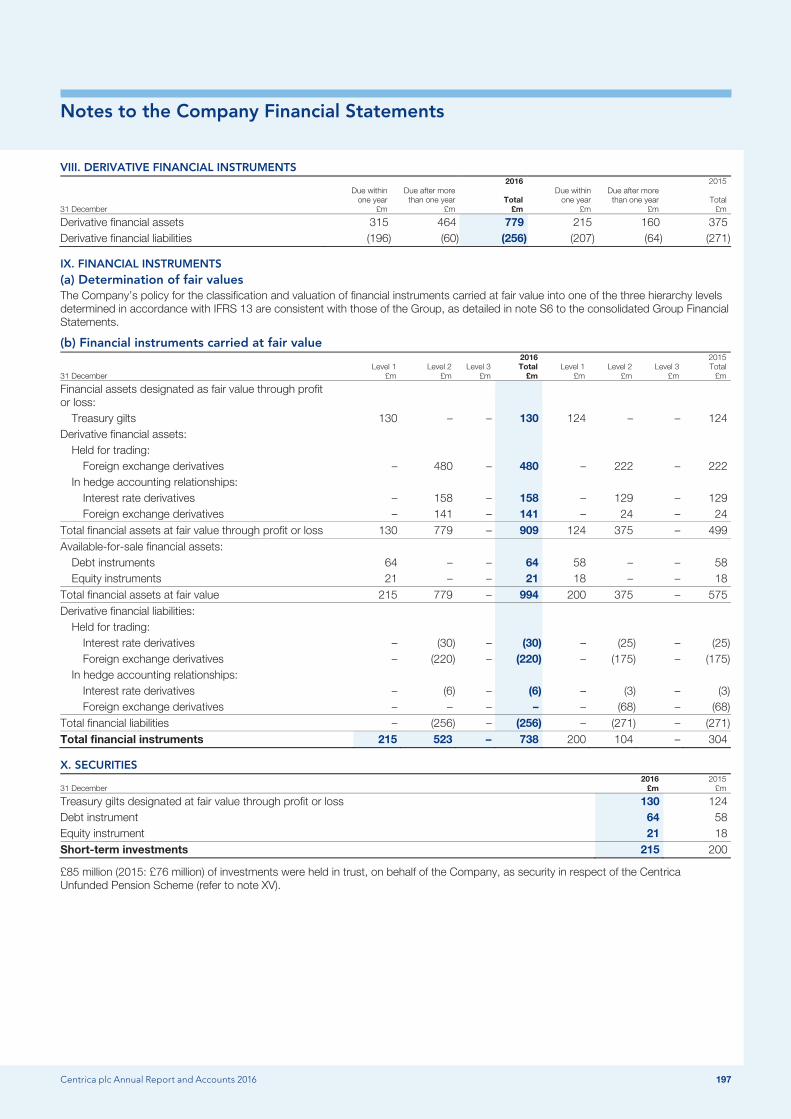
Notes to the Company Financial Statements
Centrica plc Annual Report and Accounts 2016 197
VIII. DERIVATIVE FINANCIAL INSTRUMENTS 2016 2015
31 December
Due within one year
£m
Due after more than one year
£m Total
£m
Due within one year
£m
Due after more than one year
£m Total
£m
Derivative financial assets 315 464 779 215 160 375 Derivative financial liabilities (196) (60) (256) (207) (64) (271)
IX. FINANCIAL INSTRUMENTS (a) Determination of fair values The Company’s policy for the classification and valuation of financial instruments carried at fair value into one of the three hierarchy levels determined in accordance with IFRS 13 are consistent with those of the Group, as detailed in note S6 to the consolidated Group Financial Statements.
(b) Financial instruments carried at fair value
31 December Level 1
£m Level 2
£m Level 3
£m
2016 Total
£m Level 1
£m Level 2
£m Level 3
£m
2015 Total
£m
Financial assets designated as fair value through profit or loss:
Treasury gilts 130 – – 130 124 – – 124 Derivative financial assets:
Held for trading: Foreign exchange derivatives – 480 – 480 – 222 – 222
In hedge accounting relationships: Interest rate derivatives – 158 – 158 – 129 – 129 Foreign exchange derivatives – 141 – 141 – 24 – 24
Total financial assets at fair value through profit or loss 130 779 – 909 124 375 – 499 Available-for-sale financial assets:
Debt instruments 64 – – 64 58 – – 58 Equity instruments 21 – – 21 18 – – 18
Total financial assets at fair value 215 779 – 994 200 375 – 575 Derivative financial liabilities:
Held for trading: Interest rate derivatives – (30) – (30) – (25) – (25) Foreign exchange derivatives – (220) – (220) – (175) – (175)
In hedge accounting relationships: Interest rate derivatives – (6) – (6) – (3) – (3) Foreign exchange derivatives – – – – – (68) – (68)
Total financial liabilities – (256) – (256) – (271) – (271) Total financial instruments 215 523 – 738 200 104 – 304
X. SECURITIES
31 December 2016
£m 2015
£m
Treasury gilts designated at fair value through profit or loss 130 124 Debt instrument 64 58 Equity instrument 21 18 Short-term investments 215 200
£85 million (2015: £76 million) of investments were held in trust, on behalf of the Company, as security in respect of the Centrica Unfunded Pension Scheme (refer to note XV).
Centrica plc Annual Report and Accounts 2016 197
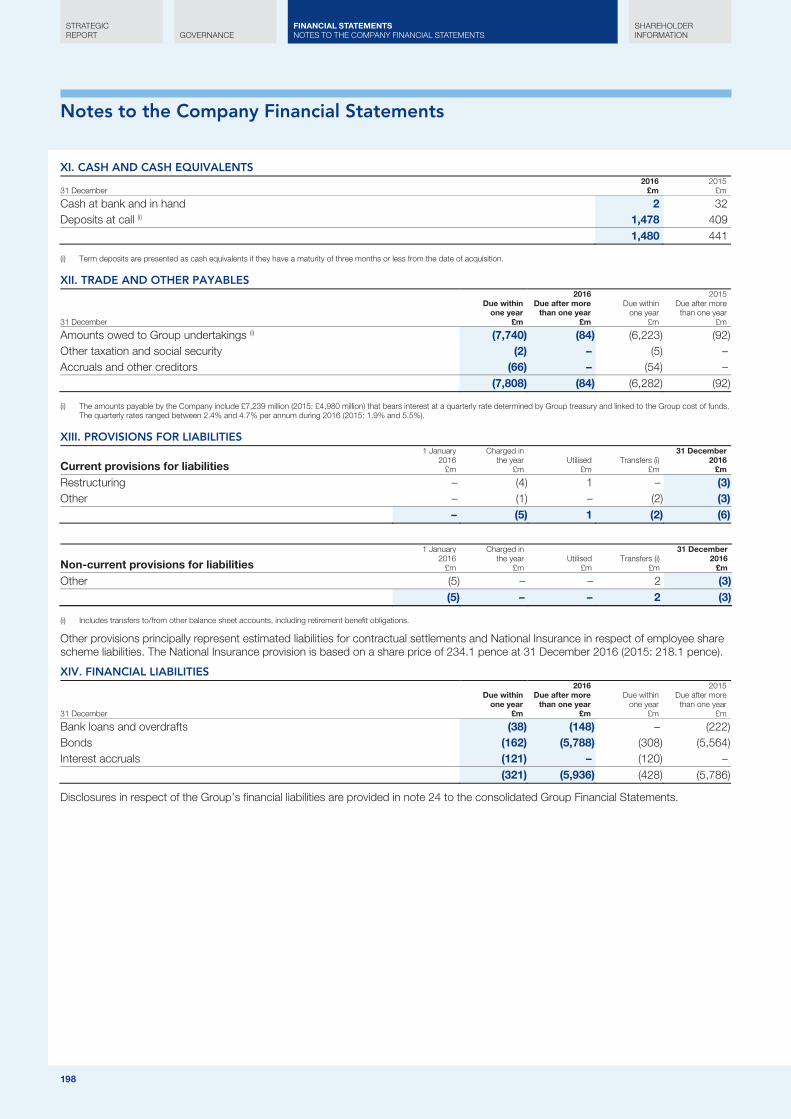
Notes to the Company Financial Statements
198
XI. CASH AND CASH EQUIVALENTS
31 December 2016
£m 2015
£m
Cash at bank and in hand 2 32 Deposits at call (i) 1,478 409 1,480 441
Term deposits are presented as cash equivalents if they have a maturity of three months or less from the date of acquisition. (i)
XII. TRADE AND OTHER PAYABLES 2016 2015
31 December
Due within one year
£m
Due after more than one year
£m
Due within one year
£m
Due after more than one year
£m
Amounts owed to Group undertakings (i) (7,740) (84) (6,223) (92) Other taxation and social security (2) – (5) – Accruals and other creditors (66) – (54) – (7,808) (84) (6,282) (92)
The amounts payable by the Company include £7,239 million (2015: £4,980 million) that bears interest at a quarterly rate determined by Group treasury and linked to the Group cost of funds. (i)The quarterly rates ranged between 2.4% and 4.7% per annum during 2016 (2015: 1.9% and 5.5%).
XIII. PROVISIONS FOR LIABILITIES
Current provisions for liabilities 1 January
2016 £m
Charged in the year
£m Utilised
£m
Transfers (i)
£m
31 December 2016
£m
Restructuring – (4) 1 – (3) Other – (1) – (2) (3) – (5) 1 (2) (6)
Non-current provisions for liabilities 1 January
2016 £m
Charged in the year
£m Utilised
£m
Transfers (i)
£m
31 December 2016
£m
Other (5) – – 2 (3) (5) – – 2 (3)
Includes transfers to/from other balance sheet accounts, including retirement benefit obligations. (i)
Other provisions principally represent estimated liabilities for contractual settlements and National Insurance in respect of employee share scheme liabilities. The National Insurance provision is based on a share price of 234.1 pence at 31 December 2016 (2015: 218.1 pence).
XIV. FINANCIAL LIABILITIES
31 December
Due within one year
£m
2016 Due after more
than one year £m
Due within one year
£m
2015 Due after more
than one year £m
Bank loans and overdrafts (38) (148) – (222) Bonds (162) (5,788) (308) (5,564) Interest accruals (121) – (120) – (321) (5,936) (428) (5,786)
Disclosures in respect of the Group’s financial liabilities are provided in note 24 to the consolidated Group Financial Statements.
198
STRATEGIC REPORT GOVERNANCE
SHAREHOLDER INFORMATION
FINANCIAL STATEMENTS NOTES TO THE COMPANY FINANCIAL STATEMENTS
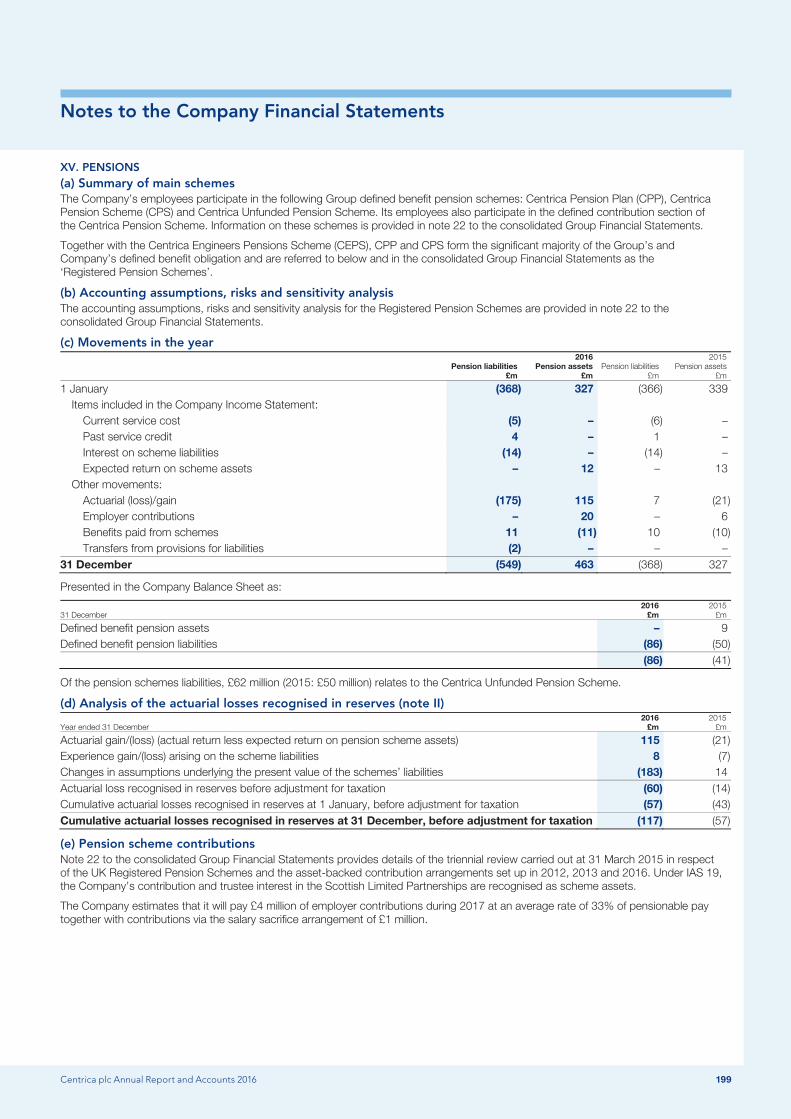
Notes to the Company Financial Statements
Centrica plc Annual Report and Accounts 2016 199
XV. PENSIONS (a) Summary of main schemes The Company’s employees participate in the following Group defined benefit pension schemes: Centrica Pension Plan (CPP), Centrica Pension Scheme (CPS) and Centrica Unfunded Pension Scheme. Its employees also participate in the defined contribution section of the Centrica Pension Scheme. Information on these schemes is provided in note 22 to the consolidated Group Financial Statements.
Together with the Centrica Engineers Pensions Scheme (CEPS), CPP and CPS form the significant majority of the Group’s and Company’s defined benefit obligation and are referred to below and in the consolidated Group Financial Statements as the ‘Registered Pension Schemes’.
(b) Accounting assumptions, risks and sensitivity analysis The accounting assumptions, risks and sensitivity analysis for the Registered Pension Schemes are provided in note 22 to the consolidated Group Financial Statements.
(c) Movements in the year
Pension liabilities
£m
2016 Pension assets
£m Pension liabilities
£m
2015 Pension assets
£m
1 January (368) 327 (366) 339 Items included in the Company Income Statement:
Current service cost (5) – (6) – Past service credit 4 – 1 – Interest on scheme liabilities (14) – (14) – Expected return on scheme assets – 12 – 13
Other movements: Actuarial (loss)/gain (175) 115 7 (21) Employer contributions – 20 – 6 Benefits paid from schemes 11 (11) 10 (10) Transfers from provisions for liabilities (2) – – –
31 December (549) 463 (368) 327
Presented in the Company Balance Sheet as:
31 December 2016
£m 2015
£m
Defined benefit pension assets – 9 Defined benefit pension liabilities (86) (50) (86) (41)
Of the pension schemes liabilities, £62 million (2015: £50 million) relates to the Centrica Unfunded Pension Scheme.
(d) Analysis of the actuarial losses recognised in reserves (note II)
Year ended 31 December 2016
£m 2015
£m
Actuarial gain/(loss) (actual return less expected return on pension scheme assets) 115 (21) Experience gain/(loss) arising on the scheme liabilities 8 (7) Changes in assumptions underlying the present value of the schemes’ liabilities (183) 14 Actuarial loss recognised in reserves before adjustment for taxation (60) (14) Cumulative actuarial losses recognised in reserves at 1 January, before adjustment for taxation (57) (43) Cumulative actuarial losses recognised in reserves at 31 December, before adjustment for taxation (117) (57)
(e) Pension scheme contributions Note 22 to the consolidated Group Financial Statements provides details of the triennial review carried out at 31 March 2015 in respect of the UK Registered Pension Schemes and the asset-backed contribution arrangements set up in 2012, 2013 and 2016. Under IAS 19, the Company’s contribution and trustee interest in the Scottish Limited Partnerships are recognised as scheme assets.
The Company estimates that it will pay £4 million of employer contributions during 2017 at an average rate of 33% of pensionable pay together with contributions via the salary sacrifice arrangement of £1 million.
Centrica plc Annual Report and Accounts 2016 199

Notes to the Company Financial Statements
200
XV. PENSIONS (f) Pension scheme assets
31 December Quoted
£m Unquoted
£m 2016
£m Quoted
£m Unquoted
£m 2015
£m
Equities 1,970 307 2,277 1,867 219 2,086 Diversified asset funds 50 – 50 47 – 47 Corporate bonds 1,274 – 1,274 1,717 – 1,717 High-yield debt 309 1,296 1,605 167 780 947 Liability matching assets 1,241 844 2,085 874 556 1,430 Property – 319 319 – 315 315 Cash pending investment 276 – 276 60 – 60 Asset-backed contribution assets – 406 406 – 243 243 Group pension scheme assets (i) 5,120 3,172 8,292 4,732 2,113 6,845
2016
£m 2015
£m
Company share of the above 463 327
Total pension scheme assets for the UK pension schemes. (i)
XVI. SHAREHOLDERS’ EQUITY AND RESERVES The Directors propose a final dividend of 8.40 pence per share (totalling £461 million) for the year ended 31 December 2016. Details of the dividends are given in note 11 to the consolidated Group Financial Statements.
Details of the Company’s share capital are provided in the Group Statement of Changes in Equity and note 25 to the consolidated Group Financial Statements. Movements in equity are shown in the Company Statement of Changes in Equity.
XVII. COMMITMENTS At 31 December 2016, the Company had commitments of £56 million (2015: £67 million) relating to contracts for outsourced services, £1 million (2015: £1 million) of annual lease payments in respect of land and buildings non-cancellable operating lease commitments expiring in less than one year and £6 million (2015: £5 million) of guaranteed operating commitments of a subsidiary undertaking expiring in more than five years. The Company’s commitment in respect of its agreement with Cheniere is detailed in note 23 to the consolidated Group Financial Statements.
The Company enters into parent company guarantee arrangements and letters of credit in relation to its subsidiary undertakings. The Company has assessed the likelihood of these guarantees being called, or letters of credit being drawn upon, as remote.
XVIII. RELATED PARTIES Following the disposal of a loan relating to Lincs Wind Farm Limited in 2015, the Company received no interest and fees in 2016 (2015: £11 million) and received no repayments (2015: £189 million).
200
STRATEGIC REPORT GOVERNANCE
SHAREHOLDER INFORMATION
FINANCIAL STATEMENTS NOTES TO THE COMPANY FINANCIAL STATEMENTS
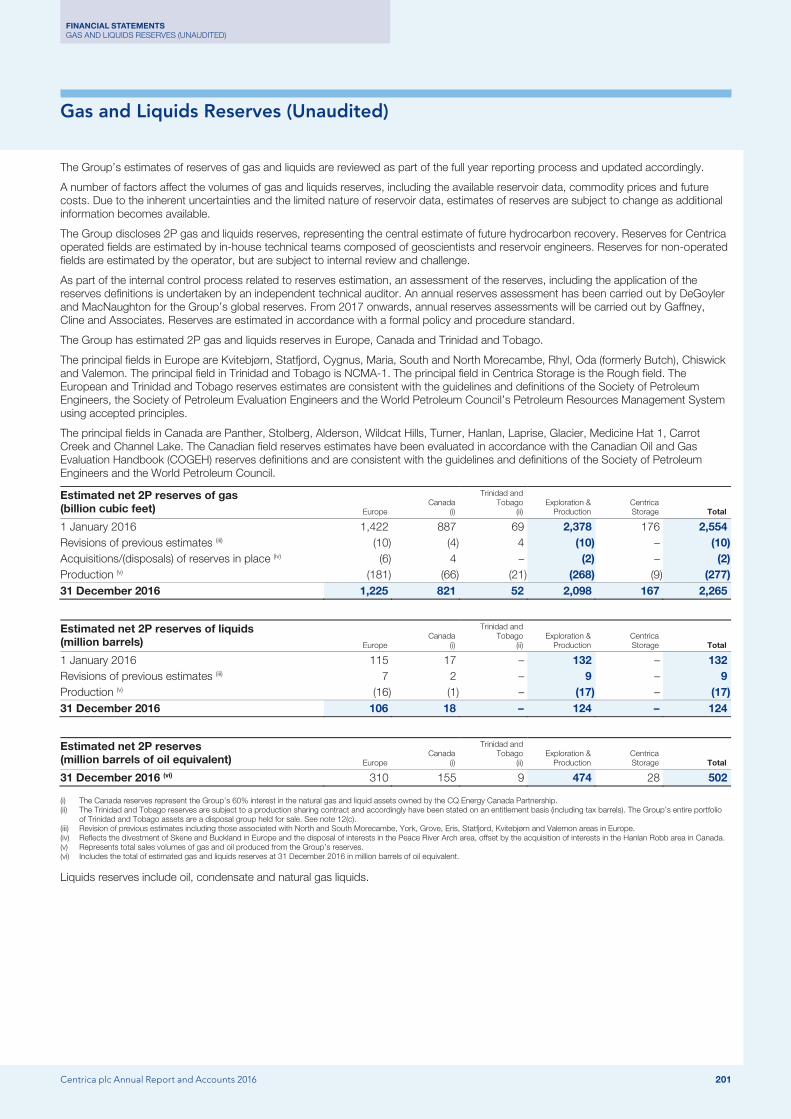
Gas and Liquids Reserves (Unaudited)
Centrica plc Annual Report and Accounts 2016 201
The Group’s estimates of reserves of gas and liquids are reviewed as part of the full year reporting process and updated accordingly.
A number of factors affect the volumes of gas and liquids reserves, including the available reservoir data, commodity prices and future costs. Due to the inherent uncertainties and the limited nature of reservoir data, estimates of reserves are subject to change as additional information becomes available.
The Group discloses 2P gas and liquids reserves, representing the central estimate of future hydrocarbon recovery. Reserves for Centrica operated fields are estimated by in-house technical teams composed of geoscientists and reservoir engineers. Reserves for non-operated fields are estimated by the operator, but are subject to internal review and challenge.
As part of the internal control process related to reserves estimation, an assessment of the reserves, including the application of the reserves definitions is undertaken by an independent technical auditor. An annual reserves assessment has been carried out by DeGoyler and MacNaughton for the Group’s global reserves. From 2017 onwards, annual reserves assessments will be carried out by Gaffney, Cline and Associates. Reserves are estimated in accordance with a formal policy and procedure standard.
The Group has estimated 2P gas and liquids reserves in Europe, Canada and Trinidad and Tobago.
The principal fields in Europe are Kvitebjørn, Statfjord, Cygnus, Maria, South and North Morecambe, Rhyl, Oda (formerly Butch), Chiswick and Valemon. The principal field in Trinidad and Tobago is NCMA-1. The principal field in Centrica Storage is the Rough field. The European and Trinidad and Tobago reserves estimates are consistent with the guidelines and definitions of the Society of Petroleum Engineers, the Society of Petroleum Evaluation Engineers and the World Petroleum Council’s Petroleum Resources Management System using accepted principles.
The principal fields in Canada are Panther, Stolberg, Alderson, Wildcat Hills, Turner, Hanlan, Laprise, Glacier, Medicine Hat 1, Carrot Creek and Channel Lake. The Canadian field reserves estimates have been evaluated in accordance with the Canadian Oil and Gas Evaluation Handbook (COGEH) reserves definitions and are consistent with the guidelines and definitions of the Society of Petroleum Engineers and the World Petroleum Council.
Estimated net 2P reserves of gas (billion cubic feet) Europe
Canada (i)
Trinidad and Tobago
(ii) Exploration &
Production Centrica Storage Total
1 January 2016 1,422 887 69 2,378 176 2,554 Revisions of previous estimates (iii) (10) (4) 4 (10) – (10) Acquisitions/(disposals) of reserves in place (iv) (6) 4 – (2) – (2) Production (v) (181) (66) (21) (268) (9) (277) 31 December 2016 1,225 821 52 2,098 167 2,265
Estimated net 2P reserves of liquids (million barrels) Europe
Canada (i)
Trinidad and Tobago
(ii) Exploration &
Production Centrica Storage Total
1 January 2016 115 17 – 132 – 132 Revisions of previous estimates (iii) 7 2 – 9 – 9 Production (v) (16) (1) – (17) – (17) 31 December 2016 106 18 – 124 – 124
Estimated net 2P reserves (million barrels of oil equivalent) Europe
Canada (i)
Trinidad and Tobago
(ii) Exploration &
Production Centrica Storage Total
31 December 2016 (vi) 310 155 9 474 28 502
The Canada reserves represent the Group’s 60% interest in the natural gas and liquid assets owned by the CQ Energy Canada Partnership. (i) The Trinidad and Tobago reserves are subject to a production sharing contract and accordingly have been stated on an entitlement basis (including tax barrels). The Group’s entire portfolio (ii)
of Trinidad and Tobago assets are a disposal group held for sale. See note 12(c). Revision of previous estimates including those associated with North and South Morecambe, York, Grove, Eris, Statfjord, Kvitebjørn and Valemon areas in Europe. (iii) Reflects the divestment of Skene and Buckland in Europe and the disposal of interests in the Peace River Arch area, offset by the acquisition of interests in the Hanlan Robb area in Canada. (iv) Represents total sales volumes of gas and oil produced from the Group’s reserves. (v) Includes the total of estimated gas and liquids reserves at 31 December 2016 in million barrels of oil equivalent. (vi)
Liquids reserves include oil, condensate and natural gas liquids.
Centrica plc Annual Report and Accounts 2016 201
FINANCIAL STATEMENTS GAS AND LIQUIDS RESERVES (UNAUDITED)
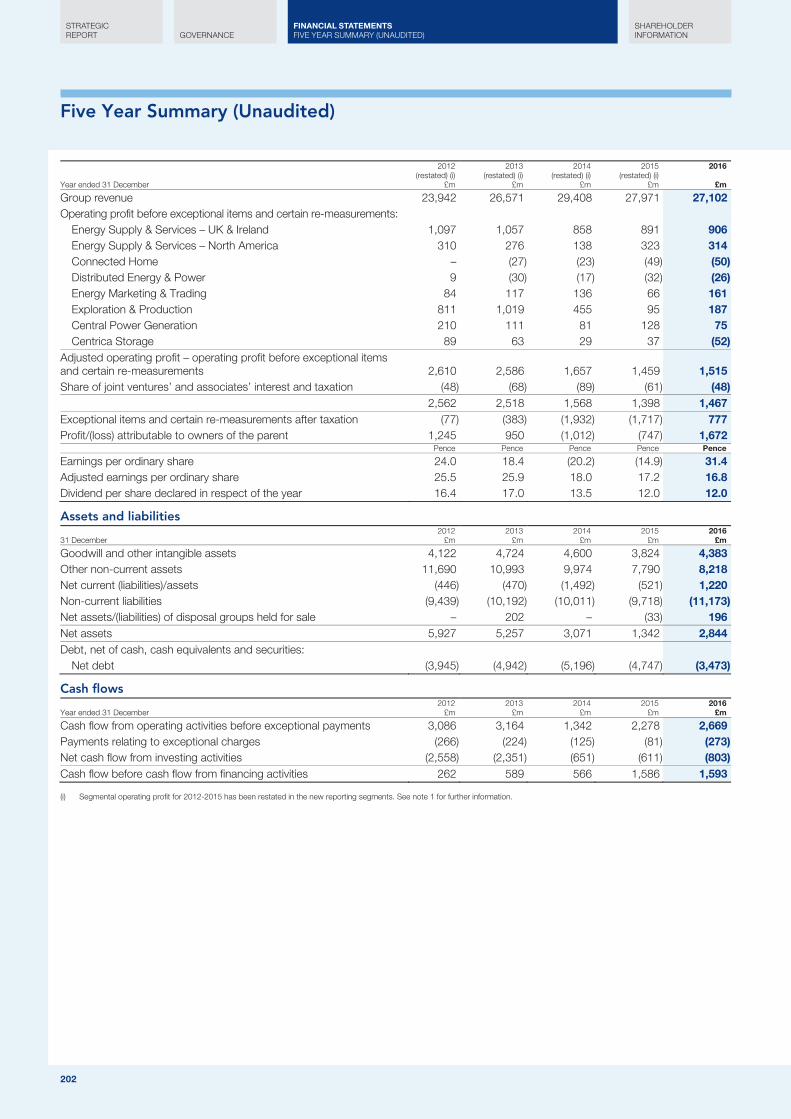
Five Year Summary (Unaudited)
202
Year ended 31 December
2012 (restated) (i)
£m
2013 (restated) (i)
£m
2014 (restated) (i)
£m
2015 (restated) (i)
£m
2016
£m
Group revenue 23,942 26,571 29,408 27,971 27,102 Operating profit before exceptional items and certain re-measurements:
Energy Supply & Services – UK & Ireland 1,097 1,057 858 891 906 Energy Supply & Services – North America 310 276 138 323 314 Connected Home – (27) (23) (49) (50) Distributed Energy & Power 9 (30) (17) (32) (26) Energy Marketing & Trading 84 117 136 66 161 Exploration & Production 811 1,019 455 95 187 Central Power Generation 210 111 81 128 75 Centrica Storage 89 63 29 37 (52)
Adjusted operating profit – operating profit before exceptional items and certain re-measurements 2,610 2,586 1,657 1,459 1,515 Share of joint ventures’ and associates’ interest and taxation (48) (68) (89) (61) (48) 2,562 2,518 1,568 1,398 1,467 Exceptional items and certain re-measurements after taxation (77) (383) (1,932) (1,717) 777 Profit/(loss) attributable to owners of the parent 1,245 950 (1,012) (747) 1,672
Pence Pence Pence Pence Pence
Earnings per ordinary share 24.0 18.4 (20.2) (14.9) 31.4 Adjusted earnings per ordinary share 25.5 25.9 18.0 17.2 16.8 Dividend per share declared in respect of the year 16.4 17.0 13.5 12.0 12.0
Assets and liabilities
31 December 2012
£m 2013 £m
2014 £m
2015 £m
2016 £m
Goodwill and other intangible assets 4,122 4,724 4,600 3,824 4,383 Other non-current assets 11,690 10,993 9,974 7,790 8,218 Net current (liabilities)/assets (446) (470) (1,492) (521) 1,220 Non-current liabilities (9,439) (10,192) (10,011) (9,718) (11,173) Net assets/(liabilities) of disposal groups held for sale – 202 – (33) 196 Net assets 5,927 5,257 3,071 1,342 2,844 Debt, net of cash, cash equivalents and securities:
Net debt (3,945) (4,942) (5,196) (4,747) (3,473)
Cash flows
Year ended 31 December 2012
£m 2013
£m 2014
£m 2015
£m 2016
£m
Cash flow from operating activities before exceptional payments 3,086 3,164 1,342 2,278 2,669 Payments relating to exceptional charges (266) (224) (125) (81) (273) Net cash flow from investing activities (2,558) (2,351) (651) (611) (803) Cash flow before cash flow from financing activities 262 589 566 1,586 1,593
Segmental operating profit for 2012-2015 has been restated in the new reporting segments. See note 1 for further information. (i)
202
STRATEGIC REPORT GOVERNANCE
SHAREHOLDER INFORMATION
FINANCIAL STATEMENTS FIVE YEAR SUMMARY (UNAUDITED)
Ofgem Consolidated Segmental Statement
Centrica plc Annual Report and Accounts 2016 203
INDEPENDENT AUDITOR’S REPORT TO THE DIRECTORS OF CENTRICA PLC AND ITS LICENSEES Our Opinion We have audited the statement (the ‘Consolidated Segmental Statement’ or ‘CSS’) of Centrica plc and its Licensees (as listed in footnote (i)) for the year ended 31 December 2016 in accordance with the terms of our agreement dated 3 January 2017. The CSS has been prepared by the Directors of Centrica plc and its Licensees based on the requirements of Ofgem’s Standard Condition 19A of the Gas and Electricity Supply Licences and the Standard Condition 16B of the Electricity Generation Licences (together, the ‘Licences’) and the basis of preparation on pages 210 to 213.
In our opinion the accompanying CSS of Centrica plc and its Licensees for the year ended 31 December 2016 is prepared, in all material respects, in accordance with:
● the requirements of Ofgem’s Standard Condition 19A of the Gas and Electricity Supply Licences and Standard Condition 16B of the Electricity Generation Licences established by the regulator; and
● the basis of preparation on pages 210 to 213.
Basis for opinion We conducted our audit in accordance with International Standards on Auditing (ISAs). Our responsibilities under those standards are further described in the Auditor’s responsibilities for the audit of the CSS section of our report. We are independent of Centrica plc in accordance with the ethical requirements that are relevant to our audit of the CSS in the United Kingdom, and we have fulfilled our other ethical responsibilities in accordance with these requirements. We believe that the audit evidence we have obtained is sufficient and appropriate to provide a basis for our opinion.
Emphasis of matter – Basis of Accounting and Restriction on Distribution Without modifying our opinion, we draw attention to pages 210 to 213 of the CSS, which describes the basis of preparation. The CSS is prepared in order for Centrica plc and its Licensees to meet the Licence requirement of the Regulator Ofgem rather than in accordance with a generally accepted accounting framework. The CSS should therefore be read in conjunction with both the Licences and the basis of preparation on pages 210 to 213. This basis of preparation is not the same as segmental reporting under IFRS and/or statutory reporting. As a result, the schedule may not be suitable for another purpose.
This report, including our opinion, has been prepared solely for the Board of Directors of Centrica plc and its Licensees in accordance with the agreement between us, to assist the Directors in reporting on the CSS to the Regulator Ofgem.
We permit this report to be disclosed in the Financial Statements section of the Annual Report and Accounts of Centrica plc for the year ended 31 December 2016 and the Financial Statements section of the website (ii) www.centrica.com, to enable the Directors to show they have addressed their governance responsibilities by obtaining an independent assurance report in connection with the CSS. To the fullest extent permitted by law, we do not accept or assume responsibility to anyone other than the Board of Directors and Centrica plc and its Licensees for our work or this report except where terms are expressly agreed between us in writing.
Responsibilities of Management and those charged with governance for the CSS Management is responsible for the preparation of the CSS in accordance with the Licences and the basis of preparation on pages 210 to 213 and for maintaining the underlying accounting records and such internal controls as management determine is necessary to enable the preparation of the CSS that is free from material misstatement, whether due to fraud or error.
In preparing the CSS alongside the Centrica plc Annual Report and Accounts, management is responsible for assessing the Centrica plc group’s ability to continue as a going concern, disclosing, as applicable in the Centrica plc Annual Report and Accounts, matters relating to going concern and using the going concern basis of accounting unless management either intends to liquidate the Group or to cease operations, or has no realistic alternative but to do so.
Those charged with governance are responsible for overseeing the Group’s financial reporting process.
Auditor’s responsibilities for the audit of the CSS Our objectives are to obtain reasonable assurance about whether the CSS as a whole is free from material misstatement, whether due to fraud or error, and to issue an auditor’s report that includes our opinion. Reasonable assurance is a high level of assurance, but is not a guarantee that an audit conducted in accordance with ISAs will always detect a material misstatement when it exists. Misstatements can arise from fraud or error and are considered material if, individually or in the aggregate, they could reasonably be expected to influence the economic decisions of users taken on the basis of this CSS. The materiality level that we used in planning and performing our audit is set at £30 million for each of the segments.
As part of an audit in accordance with ISAs, we exercise professional judgement and maintain professional scepticism throughout the audit. We also:
● Identify and assess the risks of material misstatement of the CSS, whether due to fraud or error, design and perform audit procedures responsive to those risks, and obtain audit evidence that is sufficient and appropriate to provide a basis for our opinion. The risk of not detecting a material misstatement resulting from fraud is higher than for one resulting from error, as fraud may involve collusion, forgery, intentional omissions, misrepresentations, or the override of internal control;
● Obtain an understanding of internal control relevant to the audit in order to design audit procedures that are appropriate in the circumstances, but not for the purpose of expressing an opinion on the effectiveness of the Company’s internal control;
● Evaluate the appropriateness of accounting policies used and the reasonableness of accounting estimates, if any, and related disclosures made by management; and
FINANCIAL STATEMENTS OFGEM CONSOLIDATED SEGMENTAL STATEMENT
Centrica plc Annual Report and Accounts 2016 203
Ofgem Consolidated Segmental Statement
204
INDEPENDENT AUDITORS’ REPORT TO THE DIRECTORS OF CENTRICA PLC AND ITS LICENSEES ● Conclude on the appropriateness of management’s use of the going concern basis of accounting and, based on the audit evidence
obtained, whether a material uncertainty exists related to events or conditions that may cast significant doubt on the Group’s ability to continue as a going concern. If we conclude that a material uncertainty exists, we are required to draw attention in our auditor’s report to the related disclosures in the CSS (and, by cross reference, in the Centrica plc Annual Report and Accounts, where applicable) or, if such disclosures are inadequate, to modify our opinion. Our conclusions are based on the audit evidence obtained up to the date of our auditor’s report. However, future events or conditions may cause the Group to cease to continue as a going concern.
We communicate with those charged with governance regarding, among other matters, the planned scope and timing of the audit and significant audit findings, including any significant deficiencies in internal control that we identify during our audit.
We also provide those charged with governance with a statement that we have complied with relevant ethical requirements regarding independence, and to communicate with them all relationships and other matters that may reasonably be thought to bear on our independence, and where applicable, related safeguards.
The engagement partner on the audit resulting in this independent auditor’s report is Charles Bowman.
PricewaterhouseCoopers LLP London 23 February 2017
British Gas Trading Limited, Neas Energy Limited, Centrica Langage Limited, Centrica SHB Limited, Centrica Barry Limited, Centrica KPS Limited, Centrica PB Limited and (i)Centrica KL Limited.
The maintenance and integrity of Centrica plc’s website is the responsibility of the Directors of Centrica plc; the work carried out by the auditors does not involve consideration of these (ii)matters and, accordingly, the auditors accept no responsibility for any changes that may have occurred to the CSS since it was initially presented on the website.
204
STRATEGIC REPORT GOVERNANCE
SHAREHOLDER INFORMATION
FINANCIAL STATEMENTS OFGEM CONSOLIDATED SEGMENTAL STATEMENT
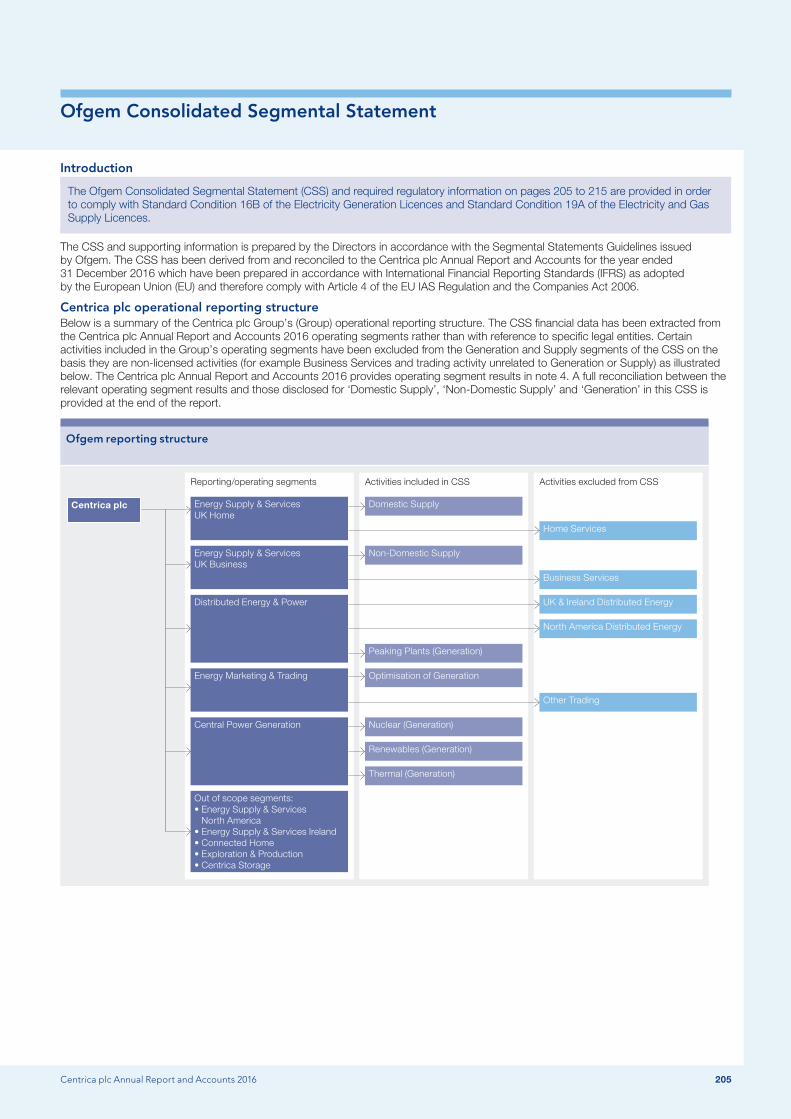
Ofgem Consolidated Segmental Statement
Centrica plc Annual Report and Accounts 2016 205
Introduction
The Ofgem Consolidated Segmental Statement (CSS) and required regulatory information on pages 205 to 215 are provided in order to comply with Standard Condition 16B of the Electricity Generation Licences and Standard Condition 19A of the Electricity and Gas Supply Licences.
The CSS and supporting information is prepared by the Directors in accordance with the Segmental Statements Guidelines issued by Ofgem. The CSS has been derived from and reconciled to the Centrica plc Annual Report and Accounts for the year ended 31 December 2016 which have been prepared in accordance with International Financial Reporting Standards (IFRS) as adopted by the European Union (EU) and therefore comply with Article 4 of the EU IAS Regulation and the Companies Act 2006.
Centrica plc operational reporting structure Below is a summary of the Centrica plc Group’s (Group) operational reporting structure. The CSS financial data has been extracted from the Centrica plc Annual Report and Accounts 2016 operating segments rather than with reference to specific legal entities. Certain activities included in the Group’s operating segments have been excluded from the Generation and Supply segments of the CSS on the basis they are non-licensed activities (for example Business Services and trading activity unrelated to Generation or Supply) as illustrated below. The Centrica plc Annual Report and Accounts 2016 provides operating segment results in note 4. A full reconciliation between the relevant operating segment results and those disclosed for ‘Domestic Supply’, ‘Non-Domestic Supply’ and ‘Generation’ in this CSS is provided at the end of the report.
Ofgem reporting structure
Reporting/operating segments Activities included in CSS Activities excluded from CSS
Domestic SupplyEnergy Supply & Services UK Home
UK & Ireland Distributed EnergyDistributed Energy & Power
Other Trading
Non-Domestic SupplyEnergy Supply & Services UK Business
Peaking Plants (Generation)
Renewables (Generation)
Home Services
North America Distributed Energy
Nuclear (Generation)Central Power Generation
Business Services
Optimisation of GenerationEnergy Marketing & Trading
Out of scope segments:• Energy Supply & Services
North America• Energy Supply & Services Ireland• Connected Home• Exploration & Production• Centrica Storage
Thermal (Generation)
Centrica plc
Centrica plc Annual Report and Accounts 2016 205
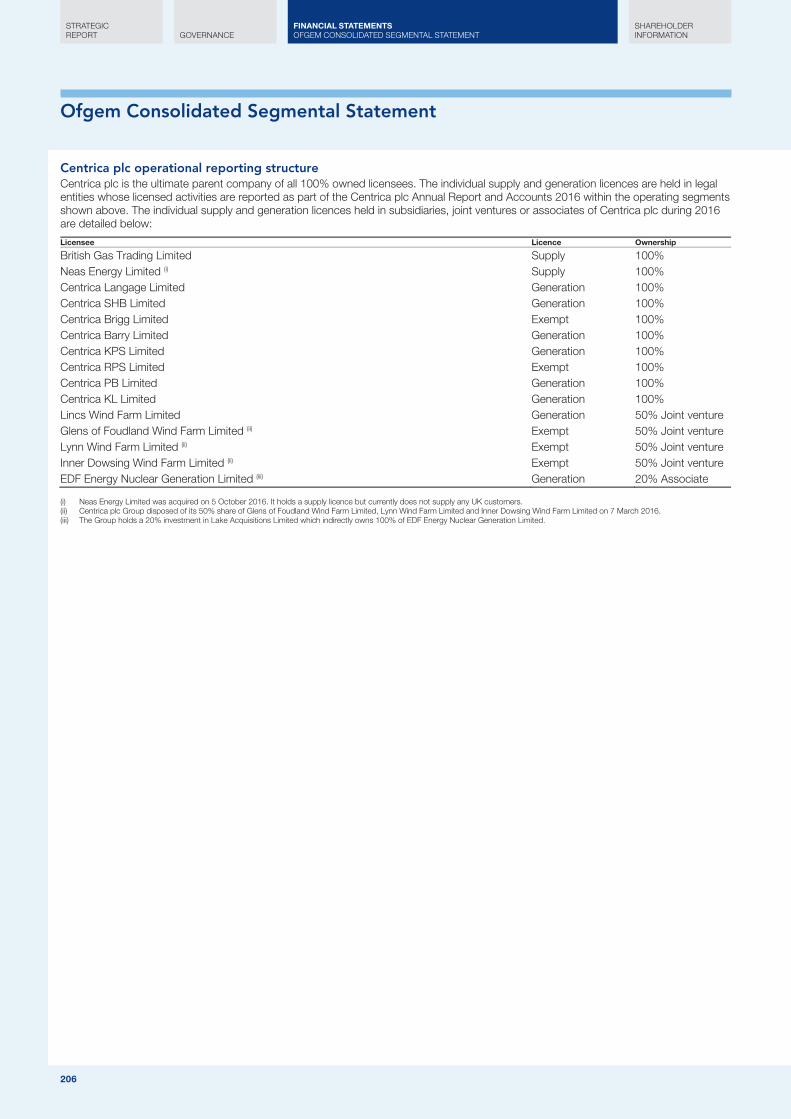
Ofgem Consolidated Segmental Statement
206
Centrica plc operational reporting structure Centrica plc is the ultimate parent company of all 100% owned licensees. The individual supply and generation licences are held in legal entities whose licensed activities are reported as part of the Centrica plc Annual Report and Accounts 2016 within the operating segments shown above. The individual supply and generation licences held in subsidiaries, joint ventures or associates of Centrica plc during 2016 are detailed below:
Licensee Licence Ownership
British Gas Trading Limited Supply 100% Neas Energy Limited (i) Supply 100% Centrica Langage Limited Generation 100% Centrica SHB Limited Generation 100% Centrica Brigg Limited Exempt 100% Centrica Barry Limited Generation 100% Centrica KPS Limited Generation 100% Centrica RPS Limited Exempt 100% Centrica PB Limited Generation 100% Centrica KL Limited Generation 100% Lincs Wind Farm Limited Generation 50% Joint venture Glens of Foudland Wind Farm Limited (ii) Exempt 50% Joint venture Lynn Wind Farm Limited (ii) Exempt 50% Joint venture Inner Dowsing Wind Farm Limited (ii) Exempt 50% Joint venture EDF Energy Nuclear Generation Limited (iii) Generation 20% Associate
Neas Energy Limited was acquired on 5 October 2016. It holds a supply licence but currently does not supply any UK customers. (i) Centrica plc Group disposed of its 50% share of Glens of Foudland Wind Farm Limited, Lynn Wind Farm Limited and Inner Dowsing Wind Farm Limited on 7 March 2016. (ii) The Group holds a 20% investment in Lake Acquisitions Limited which indirectly owns 100% of EDF Energy Nuclear Generation Limited. (iii)
206
STRATEGIC REPORT GOVERNANCE
SHAREHOLDER INFORMATION
FINANCIAL STATEMENTS OFGEM CONSOLIDATED SEGMENTAL STATEMENT
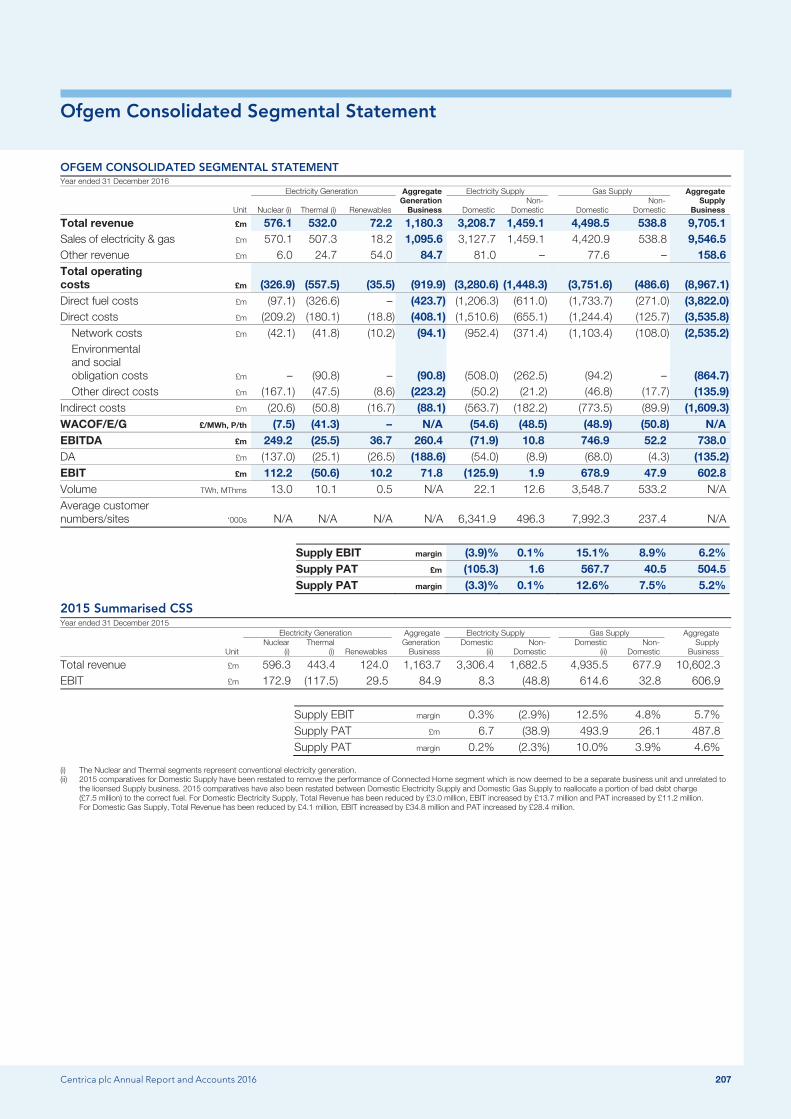
Ofgem Consolidated Segmental Statement
Centrica plc Annual Report and Accounts 2016 207
OFGEM CONSOLIDATED SEGMENTAL STATEMENT Year ended 31 December 2016
Electricity Generation Aggregate Generation
Business
Electricity Supply Gas Supply Aggregate Supply
Business
Unit Nuclear (i) Thermal (i) Renewables Domestic Non-
Domestic Domestic Non-
Domestic
Total revenue £m 576.1 532.0 72.2 1,180.3 3,208.7 1,459.1 4,498.5 538.8 9,705.1 Sales of electricity & gas £m 570.1 507.3 18.2 1,095.6 3,127.7 1,459.1 4,420.9 538.8 9,546.5 Other revenue £m 6.0 24.7 54.0 84.7 81.0 – 77.6 – 158.6 Total operating costs £m (326.9) (557.5) (35.5) (919.9) (3,280.6) (1,448.3) (3,751.6) (486.6) (8,967.1) Direct fuel costs £m (97.1) (326.6) – (423.7) (1,206.3) (611.0) (1,733.7) (271.0) (3,822.0) Direct costs £m (209.2) (180.1) (18.8) (408.1) (1,510.6) (655.1) (1,244.4) (125.7) (3,535.8)
Network costs £m (42.1) (41.8) (10.2) (94.1) (952.4) (371.4) (1,103.4) (108.0) (2,535.2) Environmental and social obligation costs £m – (90.8) – (90.8) (508.0) (262.5) (94.2) – (864.7) Other direct costs £m (167.1) (47.5) (8.6) (223.2) (50.2) (21.2) (46.8) (17.7) (135.9)
Indirect costs £m (20.6) (50.8) (16.7) (88.1) (563.7) (182.2) (773.5) (89.9) (1,609.3) WACOF/E/G £/MWh, P/th (7.5) (41.3) – N/A (54.6) (48.5) (48.9) (50.8) N/A EBITDA £m 249.2 (25.5) 36.7 260.4 (71.9) 10.8 746.9 52.2 738.0 DA £m (137.0) (25.1) (26.5) (188.6) (54.0) (8.9) (68.0) (4.3) (135.2) EBIT £m 112.2 (50.6) 10.2 71.8 (125.9) 1.9 678.9 47.9 602.8 Volume TWh, MThms 13.0 10.1 0.5 N/A 22.1 12.6 3,548.7 533.2 N/A Average customer numbers/sites ‘000s N/A N/A N/A N/A 6,341.9 496.3 7,992.3 237.4 N/A
Supply EBIT margin (3.9)% 0.1% 15.1% 8.9% 6.2% Supply PAT £m (105.3) 1.6 567.7 40.5 504.5 Supply PAT margin (3.3)% 0.1% 12.6% 7.5% 5.2%
2015 Summarised CSS Year ended 31 December 2015
Electricity Generation Aggregate Generation
Business
Electricity Supply Gas Supply Aggregate Supply
Business
Unit Nuclear
(i) Thermal
(i) Renewables Domestic
(ii) Non-
Domestic Domestic
(ii) Non-
Domestic
Total revenue £m 596.3 443.4 124.0 1,163.7 3,306.4 1,682.5 4,935.5 677.9 10,602.3 EBIT £m 172.9 (117.5) 29.5 84.9 8.3 (48.8) 614.6 32.8 606.9
Supply EBIT margin 0.3% (2.9%) 12.5% 4.8% 5.7% Supply PAT £m 6.7 (38.9) 493.9 26.1 487.8 Supply PAT margin 0.2% (2.3%) 10.0% 3.9% 4.6%
The Nuclear and Thermal segments represent conventional electricity generation. (i) 2015 comparatives for Domestic Supply have been restated to remove the performance of Connected Home segment which is now deemed to be a separate business unit and unrelated to (ii)
the licensed Supply business. 2015 comparatives have also been restated between Domestic Electricity Supply and Domestic Gas Supply to reallocate a portion of bad debt charge (£7.5 million) to the correct fuel. For Domestic Electricity Supply, Total Revenue has been reduced by £3.0 million, EBIT increased by £13.7 million and PAT increased by £11.2 million. For Domestic Gas Supply, Total Revenue has been reduced by £4.1 million, EBIT increased by £34.8 million and PAT increased by £28.4 million.
Centrica plc Annual Report and Accounts 2016 207
Ofgem Consolidated Segmental Statement
208
Glossary of terms ● ‘WACOF/E/G’ is weighted average cost of fuel (nuclear), electricity (supply) and gas (thermal and supply) calculated by dividing
direct fuel costs by volumes. For the Thermal sub-segment the cost of carbon emissions is added to direct fuel costs before dividing by the generated volume.
● ‘EBITDA’ is earnings before interest, tax, depreciation and amortisation, and is calculated by subtracting total operating costs from revenue.
● ‘DA’ is depreciation and amortisation. ● ‘EBIT’ is earnings before interest and tax, and is calculated by subtracting total operating costs, depreciation and amortisation
from total revenue. ● ‘Supply EBIT margin’ is a profit margin expressed as a percentage and calculated by dividing EBIT by total revenue and multiplying
by 100 for the Supply segment. ● ‘Supply PAT’ is profit after tax but before interest and is calculated by subtracting Group adjusted tax from EBIT for the Supply
segment. ● ‘Supply PAT margin’ is a profit margin expressed as a percentage and calculated by dividing Supply PAT by total revenue and
multiplying by 100 for the Supply segment. ● ‘Volume’ for Supply is supplier volumes at the meter point (ie net of losses); Generation volume is the volume of power that can
actually be sold in the wholesale market (ie generation volumes after losses up to the point where power is received under the Balancing and Settlement Code but before subsequent losses).
● ‘Average customer numbers/sites’ are calculated by adding average monthly customer numbers/sites (as defined in the basis of preparation) and dividing by 12.
208
STRATEGIC REPORT GOVERNANCE
SHAREHOLDER INFORMATION
FINANCIAL STATEMENTS OFGEM CONSOLIDATED SEGMENTAL STATEMENT
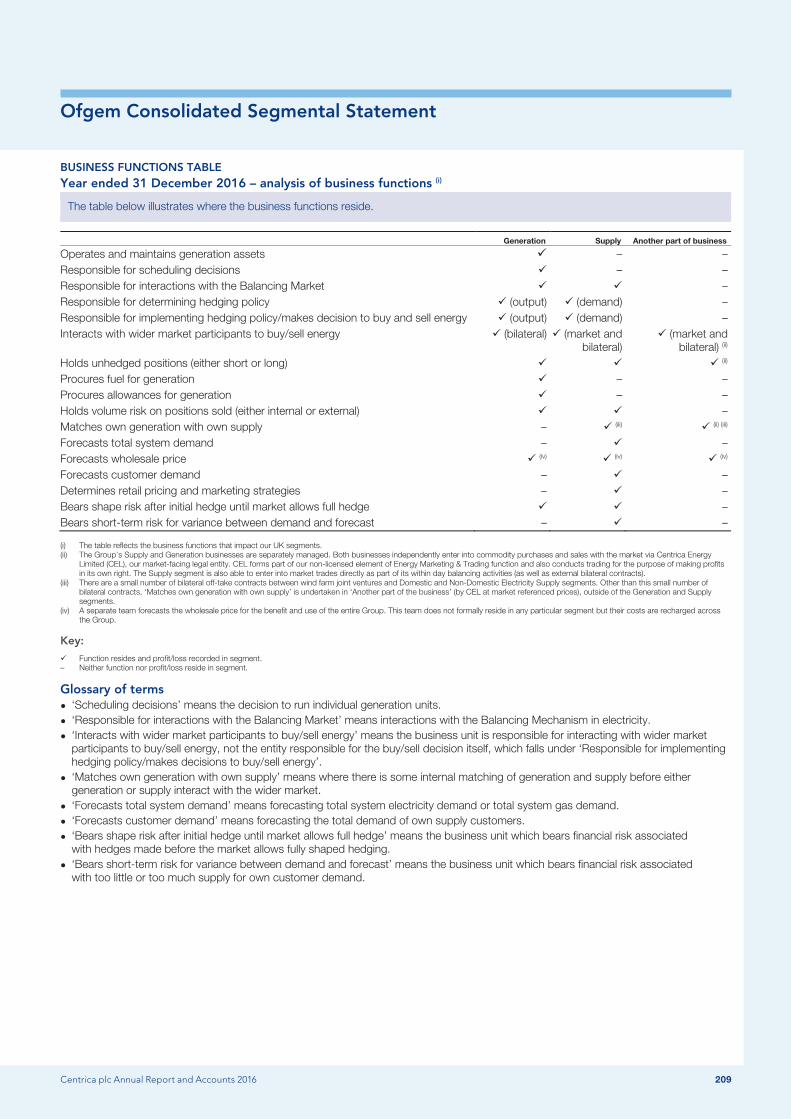
Ofgem Consolidated Segmental Statement
Centrica plc Annual Report and Accounts 2016 209
BUSINESS FUNCTIONS TABLE Year ended 31 December 2016 – analysis of business functions (i)
The table below illustrates where the business functions reside.
Generation Supply Another part of business
Operates and maintains generation assets – – Responsible for scheduling decisions – – Responsible for interactions with the Balancing Market – Responsible for determining hedging policy (output) (demand) – Responsible for implementing hedging policy/makes decision to buy and sell energy (output) (demand) – Interacts with wider market participants to buy/sell energy
(bilateral) (market and
bilateral) (market and
bilateral) (ii) Holds unhedged positions (either short or long) (ii)
Procures fuel for generation – – Procures allowances for generation – – Holds volume risk on positions sold (either internal or external) – Matches own generation with own supply – (iii) (ii) (iii)
Forecasts total system demand – – Forecasts wholesale price (iv) (iv) (iv)
Forecasts customer demand – – Determines retail pricing and marketing strategies – – Bears shape risk after initial hedge until market allows full hedge – Bears short-term risk for variance between demand and forecast – –
The table reflects the business functions that impact our UK segments. (i) The Group’s Supply and Generation businesses are separately managed. Both businesses independently enter into commodity purchases and sales with the market via Centrica Energy (ii)
Limited (CEL), our market-facing legal entity. CEL forms part of our non-licensed element of Energy Marketing & Trading function and also conducts trading for the purpose of making profits in its own right. The Supply segment is also able to enter into market trades directly as part of its within day balancing activities (as well as external bilateral contracts).
There are a small number of bilateral off-take contracts between wind farm joint ventures and Domestic and Non-Domestic Electricity Supply segments. Other than this small number of (iii)bilateral contracts, ‘Matches own generation with own supply’ is undertaken in ‘Another part of the business’ (by CEL at market referenced prices), outside of the Generation and Supply segments.
A separate team forecasts the wholesale price for the benefit and use of the entire Group. This team does not formally reside in any particular segment but their costs are recharged across (iv)the Group.
Key: Function resides and profit/loss recorded in segment. – Neither function nor profit/loss reside in segment.
Glossary of terms ● ‘Scheduling decisions’ means the decision to run individual generation units. ● ‘Responsible for interactions with the Balancing Market’ means interactions with the Balancing Mechanism in electricity. ● ‘Interacts with wider market participants to buy/sell energy’ means the business unit is responsible for interacting with wider market
participants to buy/sell energy, not the entity responsible for the buy/sell decision itself, which falls under ‘Responsible for implementing hedging policy/makes decisions to buy/sell energy’.
● ‘Matches own generation with own supply’ means where there is some internal matching of generation and supply before either generation or supply interact with the wider market.
● ‘Forecasts total system demand’ means forecasting total system electricity demand or total system gas demand. ● ‘Forecasts customer demand’ means forecasting the total demand of own supply customers. ● ‘Bears shape risk after initial hedge until market allows full hedge’ means the business unit which bears financial risk associated
with hedges made before the market allows fully shaped hedging. ● ‘Bears short-term risk for variance between demand and forecast’ means the business unit which bears financial risk associated
with too little or too much supply for own customer demand.
Centrica plc Annual Report and Accounts 2016 209
Ofgem Consolidated Segmental Statement
210
BASIS OF PREPARATION
The following notes provide a summary of the basis of preparation of the 2016 submission.
The Ofgem CSS segments our Supply and Generation activities and provides a measure of profitability, weighted average cost of fuel, and volumes, in order to increase energy market transparency for consumers and other stakeholders.
These statements have been prepared by the Directors of Centrica plc and its Licensees in accordance with Standard Condition 16B of the Electricity Generation Licences and Standard Condition 19A of the Electricity and Gas Supply Licences and the basis of preparation. Throughout the basis of preparation the first paragraph number relates to the generation licence and the second to the supply licence conditions respectively.
The financial data provided has been taken from the relevant licensee’s and affiliate’s financial information for the year ended 31 December 2016, included in the Centrica plc Annual Report and Accounts 2016 which have been prepared under IFRS as adopted by the EU (in accordance with paragraph 3/19A.3).
The CSS has been prepared on a going concern basis, as described in the Directors’ Report and note 24(b) in the Centrica plc Annual Report and Accounts 2016.
For the Generation segment, we have included the financial results from all activities that relate to our generation licences. For clarity the following judgements have been made:
● Where a sub-segment (for example Nuclear, Thermal or Renewables) has undertaken trades to optimise the result of their underlying generation (for example through our Energy Marketing & Trading business), the net revenue and result from these trades has been included in the CSS sub-segment as they are considered to be related to our generation licences.
● The Group has a long-term tolling contract in respect of the Spalding power station, but does not specifically hold the generation licence. This arrangement provides the Group with the right to nominate 100% of the plant capacity in return for a mix of capacity payments and operating payments. We do not own the power station and the Group does not control the physical dispatch of the asset. This contractual arrangement has been accounted for as a finance lease (under IFRS) and therefore the financial result and volume has been included in the Thermal sub-segment, within the Generation segment.
● Brigg and Roosecote power stations had their licences revoked on 2 July 2015 (at their request) because they no longer required an electricity generation licence and are now exempt. Whilst we do not specifically hold a generation licence for these power stations, the financial results from these businesses have been included in the Thermal sub-segment and hence within the Generation segment.
● The Group has a 20% equity interest in eight nuclear power stations (through its indirect investment in EDF Energy Nuclear Generation Limited). Although we do not specifically hold a generation licence for any of the nuclear stations, our gross share of the financial result from this business (including any contractual arrangements) has been included in the Nuclear sub-segment and hence within the Generation segment.
● The Group held equity interests in a number of wind farm joint ventures. Although we do not specifically hold a generation licence for any of the wind farms owned by these entities, our gross share of the financial result from these businesses (including any contractual arrangements) has been included in the Renewables sub-segment and hence within the Generation segment.
● Where power is purchased from third parties (for example from wind farms, power stations or other bilateral arrangements) and we do not have an equity interest in, or a finance leasing arrangement (from an IFRS perspective) over the assets that generate this power, the result related to these activities is excluded from the Generation segment. In all cases, the Generation segment reports direct fuel costs and generation volumes on a consistent basis (if the purchase cost is a direct fuel cost, then the electricity generated is reported in volume).
Domestic Supply represents the revenue and associated costs in supplying gas and electricity to residential customers in the UK. Non-Domestic Supply represents the revenue and associated costs in supplying gas and electricity to business customers in the UK.
As a voluntary disclosure, to aid comparability, a summarised 2015 CSS with margins has been included within the report. The 2015 comparatives for Domestic Supply have been restated to remove the performance of the Connected Home segment which is now deemed to be a separate business unit and unrelated to the licenced supply business. 2015 total revenue has been reduced by £7.1 million, EBIT increased by £48.5 million and PAT increased by £39.6 million for Domestic Supply. In addition, 2015 comparatives have also been restated to reallocate £7.5 million of bad debt charge from Domestic Gas Supply to Domestic Electricity Supply.
Revenues Revenues, costs and profits of the Licensees have been defined below and prepared in compliance with the Group’s accounting policies as detailed in notes 2, 3 and S2 of the Centrica plc Annual Report and Accounts 2016, except for joint ventures and associates which are presented gross (in accordance with paragraph 4(a)/19A.4(a)).
● Revenue from sales of electricity and gas for the Supply segment is recognised on the basis of gas and electricity supplied during the year to both domestic and non-domestic customers.
● Revenue from sales of electricity and gas includes an assessment of energy supplied to customers between the date of the last meter reading and the year end (unread). For the respective Supply segments this means electricity and gas sales. Revenue for domestic supply is after deducting dual fuel discounts where applicable, with the discount split evenly between electricity and gas. Government mandated social tariffs and discounts, such as the Warm Home Discount, and other social discounts, have also been deducted from Domestic Supply revenues directly, charged specifically to each fuel.
● Revenue from sales of electricity for the Generation segment is recognised on the basis of power supplied during the year. Power purchases and sales entered into to optimise the performance of each of the power Generation segments are presented net within revenue.
210
STRATEGIC REPORT GOVERNANCE
SHAREHOLDER INFORMATION
FINANCIAL STATEMENTS OFGEM CONSOLIDATED SEGMENTAL STATEMENT
Ofgem Consolidated Segmental Statement
Centrica plc Annual Report and Accounts 2016 211
BASIS OF PREPARATION ● LEC revenues associated with Renewables are included within sales of electricity and gas because the certificates must be sold
with the electricity. ● The financial risks and rewards of owning and using the Group’s power stations reside entirely in the reported Generation segment. ● Other respective segmental revenues not related to the sale of gas or power have been separately disclosed. Other revenues include: – £54.0 million (2015: £78.4 million) in Renewables principally relating to the sale of ROCs and services provided to joint ventures; – Nil in Non-Domestic Electricity Supply relating to connections and metering installations (2015: £3.4 million); – £81.0 million (2015: £67.8 million) in Domestic Electricity Supply and £77.6 million (2015: £75.8 million) in Domestic Gas Supply
primarily relating to New Housing Connections and smart meter installations; and – £24.7 million (2015: £11.3 million) in Thermal principally relating to Supplementary Balancing Reserve (SBR), Short Term Operating
Reserve (STOR) and Triad revenue.
Direct fuel costs Direct fuel costs for both Generation and Supply include electricity, gas, nuclear fuel and imbalance costs.
● Energy supply to Domestic and Non-Domestic energy customers is procured at a market referenced price, through a combination of bilateral, OTC and exchange-based trades/contracts (see table below). Where energy is procured from within the Group it is also at a market referenced price on an OTC basis (except for a small number of bilateral off-take contracts between wind farm joint ventures and the Supply segments) (i). The market referenced prices used are those prevailing at the time of procurement, which may differ from the price prevailing at the time of supply.
● Domestic and Non-Domestic fixed price products are hedged based upon anticipated demand at the start of the contract period. The majority of the gas and power for Non-Domestic energy and Domestic energy tariff products is purchased in advance (see table below).
● The exact Domestic and Non-Domestic purchasing patterns vary in response to the outlook for commodity markets and commercial factors.
● The Generation segment purchases gas and sells all of its energy at market referenced prices. Gas for CCGTs is procured at market referenced prices through a combination of OTC and exchange based trades/contracts. The cost to the power stations will reflect market referenced prices at the time of procurement, and so may differ from the price prevailing at the time of physical supply.
How we procure electricity, gas and carbon:
Long form bilateral contracts (‘bilateral’)
Individually negotiated contracts with non-standardised terms and conditions which may relate to size, duration or flexibility. Pricing is predominantly indexed to published market referenced prices, adjusted for transfer of risks, cost of carry and administration.
Over-the-counter (‘OTC’) Broker supported market of standardised products, predominantly performed via screen-based trading. These transactions are between two parties, leaving both parties exposed to the other’s default with no necessary intermediation of any exchange. An internal OTC price may be provided where market liquidity prevents external trading, with prices that are reflective of market conditions at the time of execution.
Exchange Regulated electronic platform (notably ICE, APX, and N2EX) where standardised products are traded on exchange through the intermediary of the clearing house which becomes the counterparty to the trade. Membership of a clearing house is required which entails posting of cash or collateral as margin.
WACOF/WACOE/WACOG: ● For Generation this represents the weighted average input cost of gas, carbon and nuclear fuel, shown as £/MWh, used by the
Generation business. Gas for CCGTs is procured at market referenced prices through a combination of OTC and exchange-based trades/contracts. The cost to the power stations will reflect market referenced prices at the time of procurement, and so may differ from the price prevailing at the time of physical supply.
● For Supply this covers the wholesale energy cost, the energy element of reconciliation by difference (RBD) costs and balancing and shaping costs incurred by the Supply licensees. Again, gas and electricity is procured at market referenced prices through a combination of bilateral, OTC and exchange-based trades/contracts. The cost for the Supply business will reflect market referenced prices at the time of procurement, and so may differ from the price prevailing at the time of physical supply. Where gas is procured using (predominantly indexed) bilateral contracts, the fuel cost is then allocated between Domestic and Non-Domestic Supply using annually updated fixed percentages based on the historical split of tariff book volumes. Gas and Electricity balancing costs are allocated between Domestic and Non-Domestic Supply based on their respective volumes multiplied by an appropriate industry referenced price (for example APX or SAP).
● For electricity Supply the weighted average cost of electricity is shown as £/MWh. For gas Supply, the weighted average cost of gas is shown as p/th.
Internal power off-take contracts are long-term power and associated renewable certificate sales from Generation owned assets to Domestic and Non-Domestic Electricity Supply. (i)Pricing is indexed to published market prices, adjusted for the transfer of risks specific to the asset.
Centrica plc Annual Report and Accounts 2016 211
Ofgem Consolidated Segmental Statement
212
BASIS OF PREPARATION Direct costs Direct costs for Supply and Generation are broken down into network costs, environmental and social obligation costs and other direct costs.
● Network costs for Supply and Generation include transportation costs, BSUOS and the transport element of RBD costs. Supply transportation costs include transportation and LNG costs, including £40.8 million incurred by Gas Domestic Supply in 2016, which enables the segment to secure supply by giving the ability to bring gas into the UK from overseas (2015: £42.2 million).
● Environmental and social obligation costs for Domestic Supply include ROCs, FIT and ECO. Non-Domestic Supply includes the cost of LECs, ROCs and FIT. Within the Domestic and Non-Domestic segments, the costs of LECs, FIT and ROCs are included within Electricity, and ECO is allocated between Electricity and Gas based on the relevant legislation. Environmental and social obligation costs for the Generation segment relate to EU ETS carbon emission costs and carbon tax.
● Other direct costs for Generation include employee and maintenance costs. ● Other direct costs for Supply include brokers’ costs and sales commissions when the costs have given rise directly to revenue,
that is, producing a sale. They also include Elexon and Xoserve market participation and wider Smart metering programme costs. Indirect costs Indirect costs for Supply and Generation include operating costs such as sales and marketing, bad debt costs, costs to serve, IT, HR, finance, property, staffing and billing and metering costs (including smart meter costs).
● Indirect costs for the Generation, Domestic and Non-Domestic Supply segments (including corporate and business unit recharges) are allocated based on relevant drivers which include turnover, headcount, operating profit, net book value of fixed assets and proportionate use/benefit. For Supply, indirect costs (including corporate recharges but excluding bad debt costs) are primarily allocated between Electricity and Gas on the basis of customer numbers (Domestic) and sites (Non-Domestic). Bad debt costs are allocated between Electricity and Gas on the basis of actual bad debt cost by individual contract in the billing system (Domestic), and on the basis of revenues (Non-Domestic).
● 2015 indirect costs for Nuclear (within the Generation segment) included a one-off pension credit of £18.7 million. For 2016 there was no such credit.
Other ● For Supply, depreciation and amortisation is allocated between Electricity and Gas on the basis of customer numbers (Domestic)
and sites (Non-Domestic). ● For the purposes of Supply PAT, tax is allocated between Gas and Electricity within both Domestic and Non-Domestic Supply based
on their relative proportions of EBIT. Note 4(c) of the Centrica plc Annual Report and Accounts 2016 provides details of the adjusted operating profit after tax of the relevant operating segments.
● For the Domestic Supply segment, customer numbers are stated based on the number of district meter point reference numbers (MPRNs) and meter point administration numbers (MPANs) in our billing system (for gas and electricity respectively), where it shows an active point of delivery and a meter installation. As a result, our customer numbers do not include those meter points where a meter may recently have been installed but the associated industry registration process has yet to complete, as the meter information will not be present in our billing system.
● For the Non-Domestic Supply segment, sites are based on the number of distinct MPRNs and MPANs in our billing system for gas and electricity respectively.
Transfer pricing for electricity, gas and generation licensees in accordance with paragraph 4(d)/19A.4(d) There are no specific energy supply agreements between the Generation and Supply segments (apart from a small number of bilateral off-take (i) contracts between wind farm joint ventures and Domestic and Non-Domestic Electricity Supply segments).
The Group continues to ensure transfer pricing methodologies are appropriate and up to date. In order to meet this requirement, the Group ensured all transfer pricing and cost allocation methodologies were internally reviewed, updated and collated in a central repository. Internal Audit performed a limited procedures review of the documentation in January 2015 to give comfort over compliance with the Ofgem guidelines, with their next review planned for January 2018.
Internal power off-take contracts are long-term power and associated renewable certificate sales from Generation owned assets to Domestic and Non-Domestic Electricity Supply. (i)Pricing is indexed to published market prices, adjusted for the transfer of risks specific to the asset.
212
STRATEGIC REPORT GOVERNANCE
SHAREHOLDER INFORMATION
FINANCIAL STATEMENTS OFGEM CONSOLIDATED SEGMENTAL STATEMENT
Ofgem Consolidated Segmental Statement
Centrica plc Annual Report and Accounts 2016 213
BASIS OF PREPARATION Treatment of joint ventures and associates The share of results of joint ventures and associates for the year ended 31 December 2016 principally arises from the Group’s interests in the entities listed on page 206.
Under paragraph 5 of the Conditions, the information provided in the CSS includes our gross share of revenues, costs, profits and volumes of joint ventures and associates. In preparing the CSS, joint ventures and associates (which hold a UK generation licence or exemption) are accounted for as follows:
● our proportionate share of revenues of joint ventures and associates has been included within revenue; ● our proportionate share of the profit before tax of joint ventures and associates has been included within EBIT and EBITDA; and ● our proportionate share of the generation volumes of joint ventures and associates has been included within the generation volumes.
For each of the above items, our share of the income and expenses of the joint ventures or associates has been combined line-by-line within the relevant item of the CSS.
The Supply segment has investments in associates but because the investees’ businesses do not relate to the sale of gas and electricity, the share of result (revenue of £0.7 million (2015: £2.0 million), EBIT loss of £0.5 million (2015: £1.0 million loss)) has been included net within indirect costs rather than gross, on a line-by-line basis.
Exceptional items and certain re-measurements Mark-to-market adjustments, profits or losses on disposal, restructuring costs, pension past service credits and impairment charges that have been identified in the Centrica plc Annual Report and Accounts 2016 are excluded from the CSS. For further details of excluded exceptional items and certain re-measurements see note 7 in the Centrica plc Annual Report and Accounts 2016.
The Nuclear sub-segment result includes a £20.9 million (2015: £19.6 million) profit from the revaluation of contingent valuation rights, related to the original acquisition of the Nuclear investment. There has also been an inventory write-down of £5.5 million (2015: nil) and a profit on disposal of the Killingholme power station site of £6.4 million (2015: nil) in the Thermal sub-segment. The Generation segment includes a net impairment reversal of £1.8 million (2015: £7.3 million charge). These results have been included in the Generation segment as they are not exceptional in size, nature or incidence, and do not materially change the Generation result.
The Non-Domestic Supply segment includes fines of £9.5 million for billing failures and £4.5 million for delays in smart meter roll-outs (offset by a £4.0 million provision previously held). These items have been included in the Supply segment as they are not exceptional in size and do not materially change the Non-Domestic result.
A reconciliation of the Segmental Statement revenue, EBIT, depreciation and Supply PAT to the 2016 audited Centrica plc Annual Report and Accounts has been included in accordance with paragraphs 4(b) & (c)/19A.4 (b) & (c) and 6/19A.6.
Centrica plc Annual Report and Accounts 2016 213
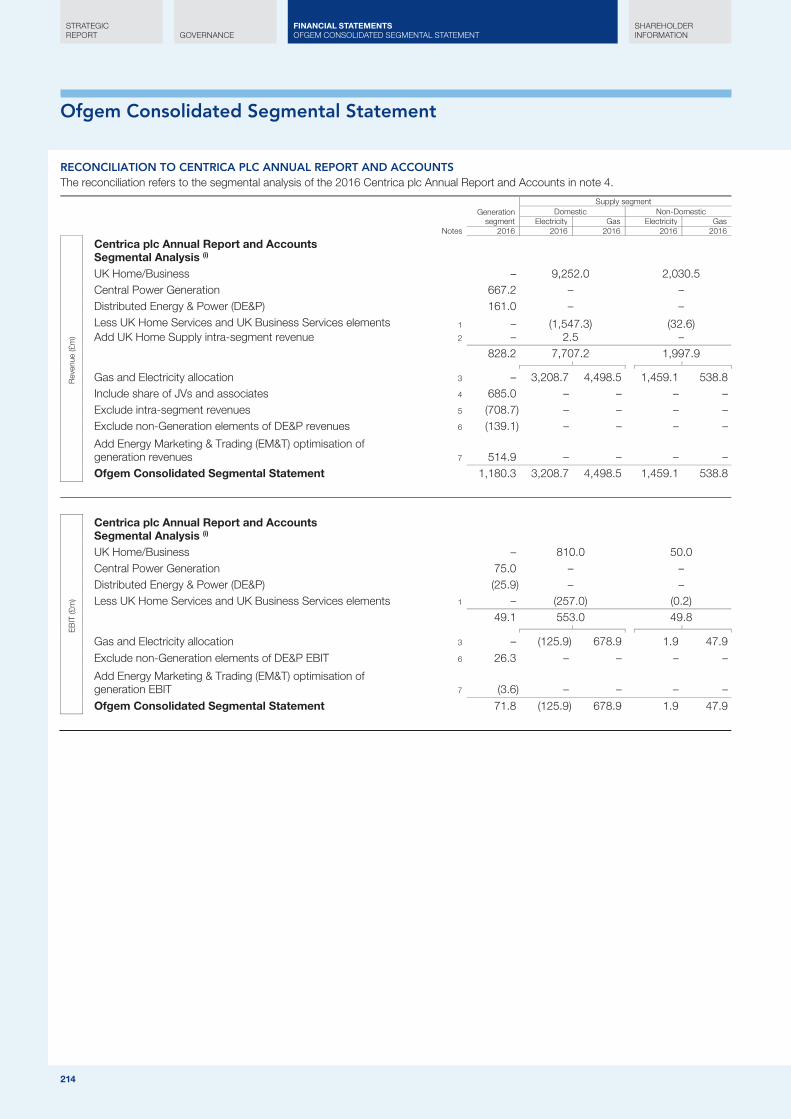
Ofgem Consolidated Segmental Statement
214
RECONCILIATION TO CENTRICA PLC ANNUAL REPORT AND ACCOUNTS The reconciliation refers to the segmental analysis of the 2016 Centrica plc Annual Report and Accounts in note 4.
Generation
segment
Supply segment Domestic Non-Domestic Electricity Gas Electricity Gas Notes 2016 2016 2016 2016 2016
Rev
enue
(£m
)
Centrica plc Annual Report and Accounts Segmental Analysis (i)
UK Home/Business – 9,252.0 2,030.5 Central Power Generation 667.2 – – Distributed Energy & Power (DE&P) 161.0 – – Less UK Home Services and UK Business Services elements Add UK Home Supply intra-segment revenue
1
2
– –
(1,547.3) 2.5
(32.6) –
828.2 7,707.2 1,997.9
Gas and Electricity allocation 3 – 3,208.7 4,498.5 1,459.1 538.8 Include share of JVs and associates 4 685.0 – – – – Exclude intra-segment revenues 5 (708.7) – – – – Exclude non-Generation elements of DE&P revenues 6 (139.1) – – – –
Add Energy Marketing & Trading (EM&T) optimisation of generation revenues 7 514.9
–
–
–
–
Ofgem Consolidated Segmental Statement 1,180.3 3,208.7 4,498.5 1,459.1 538.8
EB
IT (£
m)
Centrica plc Annual Report and Accounts Segmental Analysis (i)
UK Home/Business – 810.0 50.0 Central Power Generation 75.0 – – Distributed Energy & Power (DE&P) (25.9) – – Less UK Home Services and UK Business Services elements 1 – (257.0) (0.2) 49.1 553.0 49.8
Gas and Electricity allocation 3 – (125.9) 678.9 1.9 47.9 Exclude non-Generation elements of DE&P EBIT 6 26.3 – – – –
Add Energy Marketing & Trading (EM&T) optimisation of generation EBIT 7 (3.6)
–
–
–
–
Ofgem Consolidated Segmental Statement 71.8 (125.9) 678.9 1.9 47.9
214
STRATEGIC REPORT GOVERNANCE
SHAREHOLDER INFORMATION
FINANCIAL STATEMENTS OFGEM CONSOLIDATED SEGMENTAL STATEMENT

Ofgem Consolidated Segmental Statement
Centrica plc Annual Report and Accounts 2016 215
RECONCILIATION TO CENTRICA PLC ANNUAL REPORT AND ACCOUNTS
Generation segment
Supply segment Domestic Non-Domestic Electricity Gas Electricity Gas Notes 2016 2016 2016 2016 2016
Dep
reci
atio
n an
d am
ortis
atio
n (£
m)
Centrica plc Annual Report and Accounts Segmental Analysis (i)
UK Home/Business – (162.0) (13.3) Central Power Generation (26.8) – – Distributed Energy & Power (DE&P) (15.0) – – Less UK Home Services and UK Business Services elements 1 – 40.0 0.1 (41.8) (122.0) (13.2)
Gas and Electricity allocation 3 – (54.0) (68.0) (8.9) (4.3) Include share of JVs and associates depreciation 4 (163.2) – – – – Exclude non-Generation elements of DE&P depreciation 6 16.4 – – – –
Ofgem Consolidated Segmental Statement (188.6) (54.0) (68.0) (8.9) (4.3)
PA
T (£
m)
Centrica plc Annual Report and Accounts Segmental Analysis (i)
UK Home/Business 672.0 42.3 Less UK Home Services and UK Business Services elements 1 (209.6) (0.2) 462.4 42.1
Gas and Electricity allocation 3 (105.3) 567.7 1.6 40.5 Ofgem Consolidated Segmental Statement (105.3) 567.7 1.6 40.5
The table above reconciles the Generation segment to Central Power Generation and Distributed Energy & Power, the Domestic Supply segment to UK Home and the Non-Domestic Supply (i)segment to UK Business in note 4 to the 2016 Centrica plc Annual Report and Accounts. Also included in note 4 is a reconciliation to the IFRS compliant statutory result reported by the Centrica plc Group.
Notes: 1. UK Home includes Home Services and UK Business includes Business Services which are non-licensed activities and have been
deducted to reconcile these CSS numbers.
2. UK Home Supply generated revenue of £2.5 million from sales to UK Home Services (EBIT of nil). This revenue is eliminated on consolidation when reporting UK Home in the Centrica plc Annual Report but must be added back when reporting UK Home Supply in the CSS.
3. The share of Domestic and Non-Domestic Revenues, Operating Profit (EBIT), Depreciation (including amortisation) and PAT (adjusted operating profit after tax) as provided in note 4 of the Centrica plc Annual Report and Accounts 2016, has been split between Gas and Electricity.
4. £685.0 million of revenues relating to the Group’s share of joint ventures and associates in Generation are included in the CSS – £623.0 million relating to Nuclear revenues and £62.0 million relating to Renewables revenues. £178.1 million of EBIT in the Generation segment relates to profit from joint ventures (£166.0 million profit relating to Nuclear and £12.1 million profit relating to Renewables). Additionally, costs relating to the Group’s share of joint ventures and associates: £97.1 million direct fuel costs, £228.2 million direct costs, £18.4 million indirect costs and £163.2 million depreciation and amortisation are included. The results of joint ventures and associates are shown separately in the Centrica plc Annual Report and Accounts 2016 in notes 6 and 14.
5. £708.7 million of intra-segment revenues, split £635.9 million between the joint ventures and associates and the Generation segment (included in the £685.0 million of joint venture and associate revenues) and £72.8 million between the CPG and EM&T segment (related to power station tolls), are excluded from the CSS.
6. DE&P includes North America and UK & Ireland Distributed Energy. Revenues of £139.1 million, EBIT loss of £26.3 million and depreciation of £16.4 million have consequently been excluded from the Generation segment of the CSS.
7. £514.9 million of revenues and an EBIT loss of £3.6 million relating to Centrica’s EM&T optimisation are included in the Generation segment of the CSS.
Centrica plc Annual Report and Accounts 2016 215
216
FINANCIAL STATEMENTS
STRATEGIC REPORT GOVERNANCE SHAREHOLDER INFORMATION
Shareholder Information
This section provides shareholders with key information to assist in the management of their shareholding.
MANAGING YOUR SHARESManage your shares onlineWe actively encourage our shareholders to receive communications via email and view documents electronically via our website, centrica.com. Receiving communications and Company documents electronically saves your Company money and reduces our environmental impact.
If you sign up for electronic communications, you will receive an email to notify you that new shareholder documents are available to view online, including the Annual Report and Accounts and Annual Review, on the day they are published. You will also receive alerts to let you know that you can cast your AGM vote online.
You can manage your shareholding online by registering for Shareview at shareview.co.uk, a free, secure, online site where you can access your information and complete a number of functions including:
• viewing information about your shareholding or dividend payments;
• updating your records, including changing your address or bank mandate instructions; and
• appointing a proxy for the AGM.
Centrica FlexiShareFlexiShare is an easy way to hold Centrica shares without a share certificate. Your shares are held by a nominee company, Equiniti Financial Services Limited, however, you are able to attend and vote at general meetings as if the shares were held in your own name. Holding your shares in this way is free and comes with a number of benefits:
• low cost share dealing rates (full details of which are available on centrica.com, together with dealing charges);
• quicker settlement periods for buying and selling shares; and• no paper share certificates to lose.
Centrica.comThe Shareholder Centre on our website includes frequently asked questions and forms that are available to download to:
• change your registered address;• manage your dividend payments; and• elect to join the scrip.
A wealth of other information is also available on our website, including:
• regular updates about our business;• financial results;• comprehensive share price information;• dividend payment dates and amounts;• share and dividend history; and• the Company’s Articles of Association.
This Annual Report and Accounts can also be viewed online by visiting centrica.com/ar16.
General enquiriesCentrica’s share register is administered and maintained by Equiniti, our Registrar, whom you can contact directly if you have any questions about your shareholding which are not answered here or on our website. You can contact Equiniti using the following details:
Address: Equiniti, Aspect House, Spencer Road, Lancing, West Sussex BN99 6DA United Kingdom
Telephone: 0371 384 2985* Outside the UK: +44 (0)121 415 7061
Textphone: 0371 384 2255* Outside the UK: +44 (0)121 415 7028
Website: help.shareview.co.uk
* Calls to an 03 number cost no more than a national rate call to an 01 or 02 number. Lines open 8.30 am to 5.30 pm, Monday to Friday (UK time), excluding public holidays in England and Wales.
When contacting Equiniti or registering via shareview.co.uk, you should have your shareholder reference number at hand. This can be found on your share certificate, dividend confirmation or any other correspondence you have received from Equiniti.
If you hold less than 2,500 shares you will be able to change your registered address or set up a dividend mandate instruction over the phone, however, for security reasons, if you hold more than 2,500 shares, you will need to put this in writing to Equiniti.
Together with Equiniti, we have introduced an electronic queries service to enable our shareholders to manage their investment at a convenient time. Details of this service can be found at shareview.co.uk.
Duplicate documentsIf you receive more than one copy of shareholder documents, it is likely that you have multiple accounts on the share register, perhaps with a slightly different name or address. To combine your shareholdings, please contact Equiniti and provide them with your shareholder reference numbers. This also helps us to reduce our environmental impact and save paper.
DividendsDividends on Centrica shares are usually paid in June and November. Details of the dividends for the year ended 31 December 2016 can be found in note 11 to the Financial Statements on page 133.
If you elect to receive cash dividends you are encouraged to have your dividends paid directly to your bank or building society account. This means that you will receive the money on the day it is paid which avoids the risk of your dividend cheque being delayed or lost in the post. If you do choose to receive your dividends in this way, an annual dividend confirmation will be sent to you each year.
If you do not have a UK bank or building society account, Equiniti is able to pay dividends in local currencies in over 90 countries. For a small fee, you could have your dividends converted from sterling and paid into your designated bank account, usually within five days of the dividend being paid.
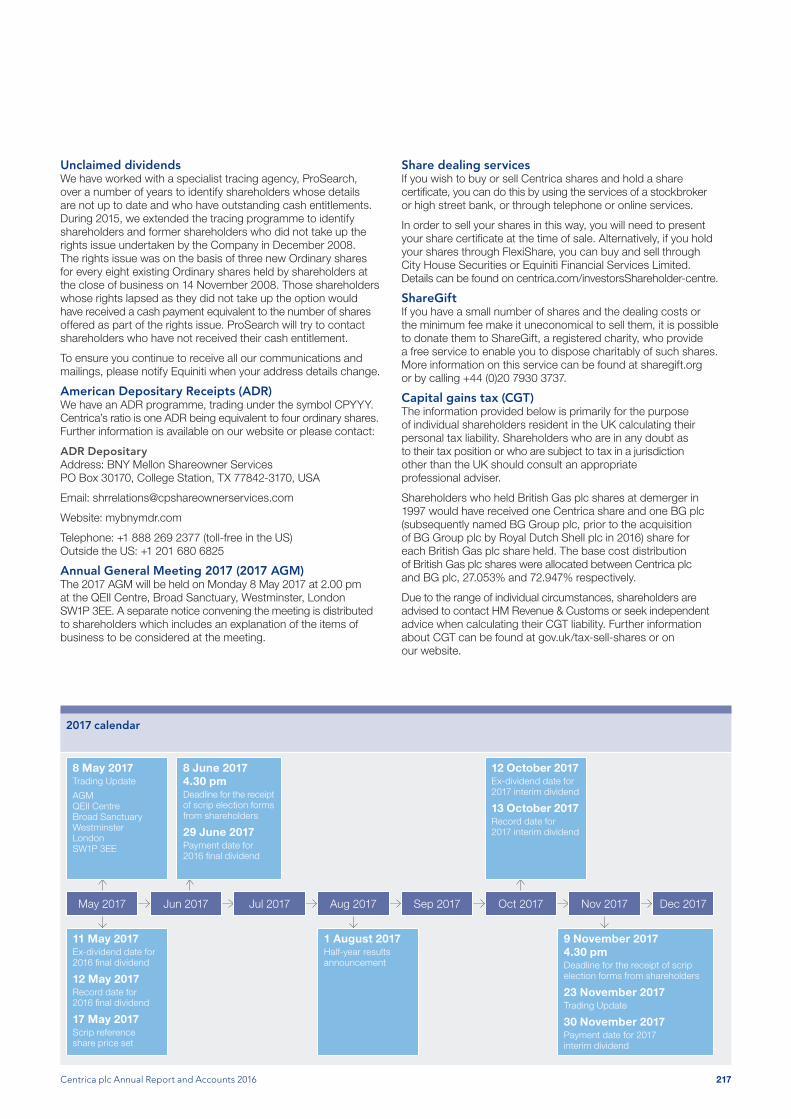
Centrica plc Annual Report and Accounts 2016 217
2017 calendar
Unclaimed dividendsWe have worked with a specialist tracing agency, ProSearch, over a number of years to identify shareholders whose details are not up to date and who have outstanding cash entitlements. During 2015, we extended the tracing programme to identify shareholders and former shareholders who did not take up the rights issue undertaken by the Company in December 2008. The rights issue was on the basis of three new Ordinary shares for every eight existing Ordinary shares held by shareholders at the close of business on 14 November 2008. Those shareholders whose rights lapsed as they did not take up the option would have received a cash payment equivalent to the number of shares offered as part of the rights issue. ProSearch will try to contact shareholders who have not received their cash entitlement.
To ensure you continue to receive all our communications and mailings, please notify Equiniti when your address details change.
American Depositary Receipts (ADR)We have an ADR programme, trading under the symbol CPYYY. Centrica’s ratio is one ADR being equivalent to four ordinary shares. Further information is available on our website or please contact:
ADR DepositaryAddress: BNY Mellon Shareowner Services PO Box 30170, College Station, TX 77842-3170, USA
Email: [email protected]
Website: mybnymdr.com
Telephone: +1 888 269 2377 (toll-free in the US) Outside the US: +1 201 680 6825
Annual General Meeting 2017 (2017 AGM)The 2017 AGM will be held on Monday 8 May 2017 at 2.00 pm at the QEII Centre, Broad Sanctuary, Westminster, London SW1P 3EE. A separate notice convening the meeting is distributed to shareholders which includes an explanation of the items of business to be considered at the meeting.
Share dealing servicesIf you wish to buy or sell Centrica shares and hold a share certificate, you can do this by using the services of a stockbroker or high street bank, or through telephone or online services.
In order to sell your shares in this way, you will need to present your share certificate at the time of sale. Alternatively, if you hold your shares through FlexiShare, you can buy and sell through City House Securities or Equiniti Financial Services Limited. Details can be found on centrica.com/investorsShareholder-centre.
ShareGiftIf you have a small number of shares and the dealing costs or the minimum fee make it uneconomical to sell them, it is possible to donate them to ShareGift, a registered charity, who provide a free service to enable you to dispose charitably of such shares. More information on this service can be found at sharegift.org or by calling +44 (0)20 7930 3737.
Capital gains tax (CGT)The information provided below is primarily for the purpose of individual shareholders resident in the UK calculating their personal tax liability. Shareholders who are in any doubt as to their tax position or who are subject to tax in a jurisdiction other than the UK should consult an appropriate professional adviser.
Shareholders who held British Gas plc shares at demerger in 1997 would have received one Centrica share and one BG plc (subsequently named BG Group plc, prior to the acquisition of BG Group plc by Royal Dutch Shell plc in 2016) share for each British Gas plc share held. The base cost distribution of British Gas plc shares were allocated between Centrica plc and BG plc, 27.053% and 72.947% respectively.
Due to the range of individual circumstances, shareholders are advised to contact HM Revenue & Customs or seek independent advice when calculating their CGT liability. Further information about CGT can be found at gov.uk/tax-sell-shares or on our website.
May 2017 Jun 2017 Jul 2017 Aug 2017 Sep 2017 Oct 2017 Nov 2017 Dec 2017
8 May 2017Trading Update
AGM QEII Centre Broad Sanctuary Westminster London SW1P 3EE
12 October 2017Ex-dividend date for 2017 interim dividend
13 October 2017Record date for 2017 interim dividend
8 June 2017 4.30 pmDeadline for the receipt of scrip election forms from shareholders
29 June 2017Payment date for 2016 final dividend
11 May 2017Ex-dividend date for 2016 final dividend
12 May 2017Record date for 2016 final dividend
17 May 2017Scrip reference share price set
1 August 2017Half-year results announcement
9 November 2017 4.30 pmDeadline for the receipt of scrip election forms from shareholders
23 November 2017Trading Update
30 November 2017Payment date for 2017 interim dividend
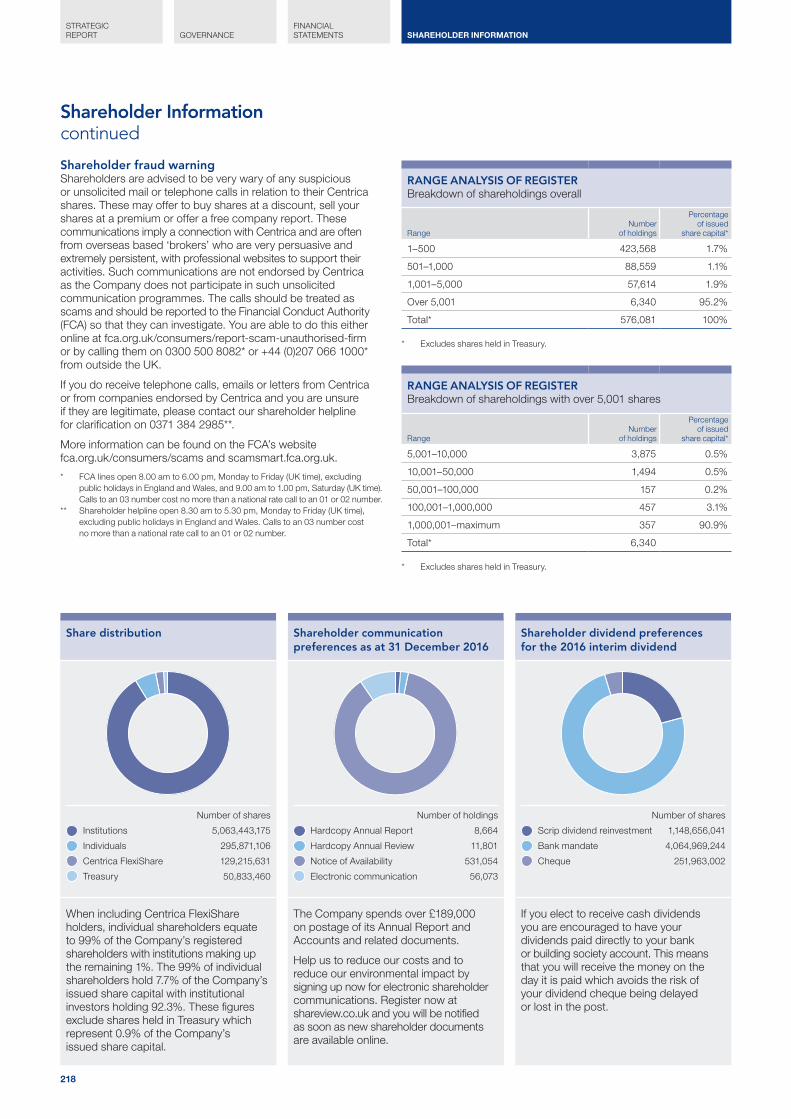
218
FINANCIAL STATEMENTS
STRATEGIC REPORT GOVERNANCE SHAREHOLDER INFORMATION
Share distribution
Number of shares
Institutions 5,063,443,175
Individuals 295,871,106
Centrica FlexiShare 129,215,631
Treasury 50,833,460
Shareholder communication preferences as at 31 December 2016
Number of holdings
Hardcopy Annual Report 8,664
Hardcopy Annual Review 11,801
Notice of Availability 531,054
Electronic communication 56,073
Shareholder dividend preferences for the 2016 interim dividend
Number of shares
Scrip dividend reinvestment 1,148,656,041
Bank mandate 4,064,969,244
Cheque 251,963,002
Shareholder fraud warningShareholders are advised to be very wary of any suspicious or unsolicited mail or telephone calls in relation to their Centrica shares. These may offer to buy shares at a discount, sell your shares at a premium or offer a free company report. These communications imply a connection with Centrica and are often from overseas based ‘brokers’ who are very persuasive and extremely persistent, with professional websites to support their activities. Such communications are not endorsed by Centrica as the Company does not participate in such unsolicited communication programmes. The calls should be treated as scams and should be reported to the Financial Conduct Authority (FCA) so that they can investigate. You are able to do this either online at fca.org.uk/consumers/report-scam-unauthorised-firm or by calling them on 0300 500 8082* or +44 (0)207 066 1000* from outside the UK.
If you do receive telephone calls, emails or letters from Centrica or from companies endorsed by Centrica and you are unsure if they are legitimate, please contact our shareholder helpline for clarification on 0371 384 2985**.
More information can be found on the FCA’s website fca.org.uk/consumers/scams and scamsmart.fca.org.uk.
* FCA lines open 8.00 am to 6.00 pm, Monday to Friday (UK time), excluding public holidays in England and Wales, and 9.00 am to 1.00 pm, Saturday (UK time). Calls to an 03 number cost no more than a national rate call to an 01 or 02 number.
** Shareholder helpline open 8.30 am to 5.30 pm, Monday to Friday (UK time), excluding public holidays in England and Wales. Calls to an 03 number cost no more than a national rate call to an 01 or 02 number.
RANGE ANALYSIS OF REGISTERBreakdown of shareholdings overall
RangeNumber
of holdings
Percentageof issued
share capital*
1–500 423,568 1.7%
501–1,000 88,559 1.1%
1,001–5,000 57,614 1.9%
Over 5,001 6,340 95.2%
Total* 576,081 100%
* Excludes shares held in Treasury.
RANGE ANALYSIS OF REGISTER Breakdown of shareholdings with over 5,001 shares
RangeNumber
of holdings
Percentageof issued
share capital*
5,001–10,000 3,875 0.5%
10,001–50,000 1,494 0.5%
50,001–100,000 157 0.2%
100,001–1,000,000 457 3.1%
1,000,001–maximum 357 90.9%
Total* 6,340
* Excludes shares held in Treasury.
When including Centrica FlexiShare holders, individual shareholders equate to 99% of the Company’s registered shareholders with institutions making up the remaining 1%. The 99% of individual shareholders hold 7.7% of the Company’s issued share capital with institutional investors holding 92.3%. These figures exclude shares held in Treasury which represent 0.9% of the Company’s issued share capital.
The Company spends over £189,000 on postage of its Annual Report and Accounts and related documents.
Help us to reduce our costs and to reduce our environmental impact by signing up now for electronic shareholder communications. Register now at shareview.co.uk and you will be notified as soon as new shareholder documents are available online.
If you elect to receive cash dividends you are encouraged to have your dividends paid directly to your bank or building society account. This means that you will receive the money on the day it is paid which avoids the risk of your dividend cheque being delayed or lost in the post.
Shareholder Informationcontinued
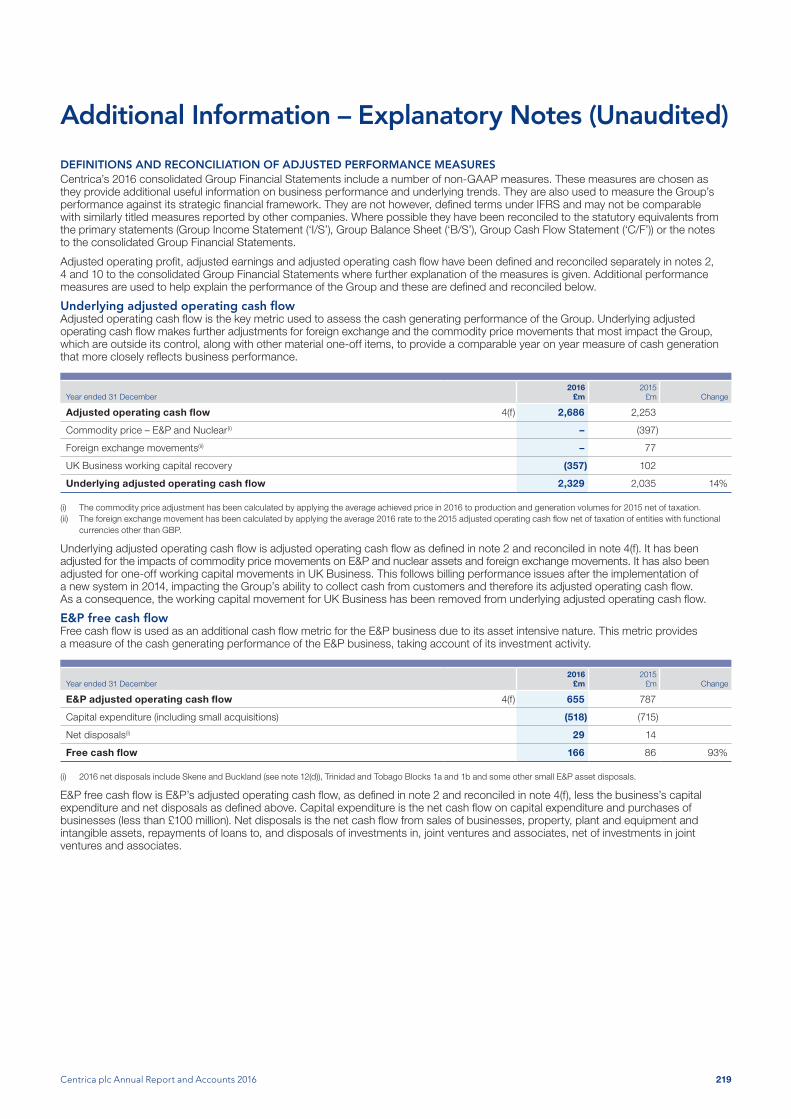
Centrica plc Annual Report and Accounts 2016 219
Additional Information – Explanatory Notes (Unaudited)
DEFINITIONS AND RECONCILIATION OF ADJUSTED PERFORMANCE MEASURESCentrica’s 2016 consolidated Group Financial Statements include a number of non-GAAP measures. These measures are chosen as they provide additional useful information on business performance and underlying trends. They are also used to measure the Group’s performance against its strategic financial framework. They are not however, defined terms under IFRS and may not be comparable with similarly titled measures reported by other companies. Where possible they have been reconciled to the statutory equivalents from the primary statements (Group Income Statement (‘I/S’), Group Balance Sheet (‘B/S’), Group Cash Flow Statement (‘C/F’)) or the notes to the consolidated Group Financial Statements.
Adjusted operating profit, adjusted earnings and adjusted operating cash flow have been defined and reconciled separately in notes 2, 4 and 10 to the consolidated Group Financial Statements where further explanation of the measures is given. Additional performance measures are used to help explain the performance of the Group and these are defined and reconciled below.
Underlying adjusted operating cash flowAdjusted operating cash flow is the key metric used to assess the cash generating performance of the Group. Underlying adjusted operating cash flow makes further adjustments for foreign exchange and the commodity price movements that most impact the Group, which are outside its control, along with other material one-off items, to provide a comparable year on year measure of cash generation that more closely reflects business performance.
Year ended 31 December2016
£m2015
£m Change
Adjusted operating cash flow 4(f) 2,686 2,253
Commodity price – E&P and Nuclear(i) – (397)
Foreign exchange movements(ii) – 77
UK Business working capital recovery (357) 102
Underlying adjusted operating cash flow 2,329 2,035 14%
(i) The commodity price adjustment has been calculated by applying the average achieved price in 2016 to production and generation volumes for 2015 net of taxation.(ii) The foreign exchange movement has been calculated by applying the average 2016 rate to the 2015 adjusted operating cash flow net of taxation of entities with functional
currencies other than GBP.
Underlying adjusted operating cash flow is adjusted operating cash flow as defined in note 2 and reconciled in note 4(f). It has been adjusted for the impacts of commodity price movements on E&P and nuclear assets and foreign exchange movements. It has also been adjusted for one-off working capital movements in UK Business. This follows billing performance issues after the implementation of a new system in 2014, impacting the Group’s ability to collect cash from customers and therefore its adjusted operating cash flow. As a consequence, the working capital movement for UK Business has been removed from underlying adjusted operating cash flow.
E&P free cash flowFree cash flow is used as an additional cash flow metric for the E&P business due to its asset intensive nature. This metric provides a measure of the cash generating performance of the E&P business, taking account of its investment activity.
Year ended 31 December2016
£m2015
£m Change
E&P adjusted operating cash flow 4(f) 655 787
Capital expenditure (including small acquisitions) (518) (715)
Net disposals(i) 29 14
Free cash flow 166 86 93%
(i) 2016 net disposals include Skene and Buckland (see note 12(d)), Trinidad and Tobago Blocks 1a and 1b and some other small E&P asset disposals.
E&P free cash flow is E&P’s adjusted operating cash flow, as defined in note 2 and reconciled in note 4(f), less the business’s capital expenditure and net disposals as defined above. Capital expenditure is the net cash flow on capital expenditure and purchases of businesses (less than £100 million). Net disposals is the net cash flow from sales of businesses, property, plant and equipment and intangible assets, repayments of loans to, and disposals of investments in, joint ventures and associates, net of investments in joint ventures and associates.

220
FINANCIAL STATEMENTS
STRATEGIC REPORT GOVERNANCE SHAREHOLDER INFORMATION
Return on average capital employed (ROACE)Post-tax ROACE is one of the key performance metrics in the financial framework of the Group and represents the return the Group makes from capital employed in its wholly owned assets and its investments in joint ventures and associates.
Year ended 31 December2016
£m2015
£m Change
Adjusted operating profit 4(c) 1,515 1,459
Share of joint ventures’/associates’ interest and taxation 6(a) (48) (61)
Taxation on profit – business performance I/S (282) (286)
Exclude taxation on interest (120) (93)
Return attributable to non-controlling interests 4(c) 5 27
Return 1,070 1,046
Net assets B/S 2,844 1,342
Less: non-controlling interests B/S (178) (164)
Less: net retirement benefit obligations 22(d) 1,137 119
Less: net cash and cash equivalents, bank overdrafts, loans and other borrowings, securities and cash posted/(received) as collateral 24(c) 3,764 4,829
Less: derivative financial instruments 19 (280) 592
Less: deferred tax (assets)/liabilities associated with retirement benefit obligations and derivative financial instruments 16 23 (417)
Effect of averaging and other adjustments (582) 2,476
Average capital employed 6,728 8,777
ROACE 16% 12% 4ppt
Average capital employed takes the Group’s net assets excluding net debt and deducts the net retirement benefit obligation and other derivative financial instruments (together with their associated deferred tax balances) because these represent unrealised positions and therefore do not reflect true capital employed. They are also subject to market driven volatility which could materially distort the ROACE calculation.
Additional Information – Explanatory Notes (Unaudited)continued
Designed and produced by
$ Refers to US dollars unless specified otherwise
2P reserves Proven and probable reserves
AGR Advanced gas-cooled reactor
AIP Annual Incentive Plan
Algorithm A procedure or formula for problem solving, based on a sequence of specified actions or a series of steps
AOCF Adjusted operating cash flow
App vending Allows Smart Pay-as-you-go customers to vend (top-up their meters) via the BG App
bbl Barrels of oil
bcf Billion cubic feet
BSUOS Balancing services use of system
B2B Business-to-business
B2C Business-to-consumer
C&I Commercial and industrial
CCGT Combined cycle gas turbine
CGU Cash generating unit
CHP Combined heat and power
CMA Competition and Markets Authority
CO2 Carbon dioxide
CO2e Universal unit of measurement of the global warming potential (GWP) of greenhouse gases (GHG) expressed in terms of the GWP of one unit of CO2e (carbon dioxide equivalent)
CPI Consumer Price Index
CRM Customer relationship management
CSS Consolidated Segmental Statement
Data analytics The process of examining data sets to draw conclusions and insights about the information they contain
Data lake Storage repository that holds a vast amount of raw data
Data science Collective processes that enable the review, analysis and extraction of valuable knowledge and information from raw data
DECC Department of Energy and Climate Change
DEEPAC Direct Energy Employee Political Action Committee
DRD Decommissioning Relief Deed
DSA Decommissioning Security Agreement
EBT Employee Benefit Trust
ECO Energy Company Obligation
EUA European Union allowance (carbon emissions certificate)
EU ETS European Union Emission Trading Scheme
FCA Financial Conduct Authority
FFS Fixed-fee service
FIT Feed-in tariff
FVLCD Fair value less costs of disposal
gCO2/kWh Grammes of carbon dioxide per kilowatt hour
GDP Gross domestic product
GFRMC Group Financial Risk Management Committee
HSES Health, safety, environment & security
HVAC Heating, ventilation and air conditioning
IoT Internet of Things
IPIECA International Petroleum Industry Environmental Conservation Association
ISA International Standards in Auditing
KPI Key performance indicators
kW Kilowatt
kWe Kilowatt-electric
kWh Kilowatt hour
LEC Levy Exemption Certificate
LNG Liquefied natural gas
LTIFR Lost time injury frequency rate
Machine learning Artificial intelligence (AI) that provides computers with the ability to learn, without being programmed
mmboe Million barrels of oil equivalent
mmth Million therms
MPAN Meter point administration number
MPRN Meter point reference number
mtCO2e Million tonnes of carbon dioxide equivalent
MW Megawatt
MWe Megawatt-electric
MWh Megawatt hour
MWp Megawatt peak
NBV Net book value
NGO Non-governmental organisation
NLF Nuclear Liabilities Fund
nm Not measured
NPS Net promoter score
OECD Organisation for Economic Cooperation and Development
OTC Over the counter
PAC Political Action Committee
PIE Pensions increase exchange
PPA Power purchase agreement
PP&E Property, plant and equipment
ppt Percentage point
PRA Prudential Regulation Authority
Process safety Process safety is concerned with the prevention of harm to people and the environment, or asset damage from major incidents such as fires, explosions and accidental releases of hazardous substances
PRT Petroleum Revenue Tax
PWR Pressurised water reactor
QPI Qatar Petroleum International
RBD Reconciliation by difference
ROC Renewable Obligation Certificate
RPI Retail Price Index
SBR Supplementary Balancing Reserve
SBU Standard bundled unit
SHESEC The Safety, Health, Environment, Security and Ethics Committee
SPA Sale and Purchase Agreement
STOR Short Term Operating Reserve
tCO2e Tonnes of carbon dioxide equivalent
The Code The UK Corporate Governance Code set of principles and provisions issued by the Financial Reporting Council
T&E Technology & Engineering
TSR Total shareholder return
TWh Terawatt hour
VAT Value added tax
VIU Value in use
VPP Virtual Power Plant
WBCSD World Business Council for Sustainable Development
WRI World Resources Institute
Glossary
DisclaimerThis Annual Report and Accounts does not constitute an invitation to underwrite, subscribe for, or otherwise acquire or dispose of any Centrica shares or other securities.
This Annual Report and Accounts contains certain forward-looking statements with respect to the financial condition, results, operations and businesses of Centrica plc. These statements and forecasts involve risk and uncertainty because they relate to events and depend on circumstances that will occur in the future. There are a number of factors that could cause actual results or developments to differ materially from those expressed or implied by these forward-looking statements and forecasts.
Past performance is no guide to future performance and persons needing advice should consult an independent financial adviser.
This report is printed on recycled silk papers made from 100% pre and post-consumer waste. The paper mills are based in the European Union and manufacture papers independently audited and certified by the Forest Stewardship Council® (FSC®) and accredited to the Environmental Management System 14001.
Printed by CPI Colour Limited ISO14001, FSC® certified and CarbonNeutral®.

CENTRICA PLC Registered office: Millstream Maidenhead Road Windsor Berkshire SL4 5GD
Company registered in England and Wales No. 3033654
centrica.com