Sankara Malliga Paper NCEJ
12
Efficient environmental noise reduction system for speech enhancement via fuzzy-based extreme learning machine and fuzzy adaptive Wiener filter T. Meera Devi a) , G. SankaraMalliga b) and K.M. Saravanaraju c) (Received: 2 December 2011; Revised: 30 August 2013; Accepted: 4 September 2013) This paper proposes the application of fuzzy-based extreme learning machine (FELM) and fuzzy-based adaptive Wiener filter for background noise reduction system to improve the signal to noise ratio (SNR) and to reduce the minimum mean square error (MMSE). The Wiener filter minimizes the mean square error and it provides better performance than the conventional filters. Though the background noise is uncertain, fuzzy inference systems (FIS) are proposed in ELM to classify the background noises and Wiener filters are proposed to update Wiener filter coefficients that will increase the SNR of the filtered speech signal. Fuzzy adaptive Wiener filter depends on the adaptation of the filter transfer function from sample to sample based on the signal statistics and it is implemented in time domain rather than in frequency domain to accommodate for the varying nature of the speech signal. The proposed FELM is compared with ELM and fuzzy radial basis function network (FRBFN) for noise classifica- tion and fuzzy adaptive Wiener filter is compared with Wiener and adaptive Wiener filters for noise cancellation. Simulation results show that FELM improves the percentage of classification by 9% than FRBFN, 4% than ELM and fuzzy adaptive Wiener filter improves the SNR by 8 dB than the conven- tional Wiener filter. The real-time implementation of the system is done using TMS320C6713 DSK starter kit. The real-time practical setup using DSK shows an improved SNR of 5 dB. © 2013 Institute of Noise Control Engineering. Primary subject classification: 74.3; Secondary subject classification: 63.3 1 INTRODUCTION Environmental noises can greatly affect the perfor- mance of the devices like mobile phones and hearing aids. There are many types of noise reduction sys- tems including active noise control and adaptive fil- tering. Practical and efficient noise reduction is wholly reliant on an accurate diagnosis of what is causing the noise, which first involves finding the source of noise. An adaptive filter is a filter that self-adjusts its transfer function according to an optimizing algorithm 1 . In this paper, though the type of noise is unknown in background environments, different types of envi- ronmental noise signals are recorded initially. Feature sets are extracted from these recorded signals and preprocessed using fuzzy inference system. These preprocessed data are used as training data set for extreme learning machine to classify the type of noise signal present in the input speech signal. Based on the classified output, one of the recorded noise signals will be used as a reference noise signal for fuzzy adaptive Wiener filter. Figure 1 shows the overall block diagram of noise reduction system presented in this paper. This paper proposes a new technique to improve the SNR and to reduce the MMSE in the processed speech signal by using fuzzy adaptive algorithms. This paper is organized as follows. In Sec. 2, feature extraction pro- cesses are proposed for extracting feature sets from the recorded noise signals. Section 3 confers extreme learning machine and fuzzy extreme learning machine for noise classification technique. A review of the tradi- tional Wiener filter and adaptive Wiener filter is pre- sented in Sec. 4. Though the environmental noise is fuzzy, fuzzy adaptive Wiener filtering approach for speech enhancement is also proposed in Sec. 4. A com- parative study is presented between the proposed work and the existing work in Sec. 5. Section 6 provides the real-time implementation of fuzzy adaptive Wiener filter. Conclusion and future scope are given in Sec. 7. a) ECE, Kongu Engineering College, Erode, INDIA; email: [email protected]. b) Dhanalakshmi College of Engineering, Chennai, INDIA; email: [email protected]. c) CSE, Jazan University, Jazan, SAUDI ARABIA; email: [email protected]. 469 Noise Control Engr. J. 61 (5), September-October 2013
Transcript of Sankara Malliga Paper NCEJ
Efficient environmental noise reduction system for speech enhancement viafuzzy-based extreme learning machine and fuzzy adaptive Wiener filter
a) ECE, Kontmeeradev
b) Dhanalakemail: ma
c) CSE, Jazakmsrajusv
Noise Control E
T. Meera Devia), G. SankaraMalligab) and K.M. Saravanarajuc)
(Received: 2 December 2011; Revised: 30 August 2013; Accepted: 4 September 2013)
This paper proposes the application of fuzzy-based extreme learning machine(FELM) and fuzzy-based adaptive Wiener filter for background noise reductionsystem to improve the signal to noise ratio (SNR) and to reduce the minimummean square error (MMSE). TheWiener filter minimizes the mean square errorand it provides better performance than the conventional filters. Though thebackground noise is uncertain, fuzzy inference systems (FIS) are proposed inELM to classify the background noises and Wiener filters are proposed toupdate Wiener filter coefficients that will increase the SNR of the filtered speechsignal. Fuzzy adaptive Wiener filter depends on the adaptation of the filtertransfer function from sample to sample based on the signal statistics and itis implemented in time domain rather than in frequency domain to accommodatefor the varying nature of the speech signal. The proposed FELM is comparedwith ELM and fuzzy radial basis function network (FRBFN) for noise classifica-tion and fuzzy adaptive Wiener filter is compared with Wiener and adaptiveWiener filters for noise cancellation. Simulation results show that FELMimproves the percentage of classification by 9% than FRBFN, 4% than ELMand fuzzy adaptive Wiener filter improves the SNR by 8 dB than the conven-tional Wiener filter. The real-time implementation of the system is done usingTMS320C6713 DSK starter kit. The real-time practical setup using DSK showsan improved SNR of 5 dB. © 2013 Institute of Noise Control Engineering.
Primary subject classification: 74.3; Secondary subject classification: 63.3
1 INTRODUCTION
Environmental noises can greatly affect the perfor-mance of the devices like mobile phones and hearingaids. There are many types of noise reduction sys-tems including active noise control and adaptive fil-tering. Practical and efficient noise reduction is whollyreliant on an accurate diagnosis of what is causing thenoise, which first involves finding the source of noise.An adaptive filter is a filter that self-adjusts its transferfunction according to an optimizing algorithm1.
In this paper, though the type of noise is unknownin background environments, different types of envi-ronmental noise signals are recorded initially. Featuresets are extracted from these recorded signals andpreprocessed using fuzzy inference system. These
gu Engineering College, Erode, INDIA; email:[email protected] College of Engineering, Chennai, INDIA;[email protected] University, Jazan, SAUDI ARABIA; email:@gmail.com.
ngr. J. 61 (5), September-October 2013
preprocessed data are used as training data set forextreme learning machine to classify the type of noisesignal present in the input speech signal. Based on theclassified output, one of the recorded noise signals willbe used as a reference noise signal for fuzzy adaptiveWiener filter. Figure 1 shows the overall block diagramof noise reduction system presented in this paper.
This paper proposes a new technique to improve theSNR and to reduce the MMSE in the processed speechsignal by using fuzzy adaptive algorithms. This paper isorganized as follows. In Sec. 2, feature extraction pro-cesses are proposed for extracting feature sets fromthe recorded noise signals. Section 3 confers extremelearning machine and fuzzy extreme learning machinefor noise classification technique. A review of the tradi-tional Wiener filter and adaptive Wiener filter is pre-sented in Sec. 4. Though the environmental noise isfuzzy, fuzzy adaptive Wiener filtering approach forspeech enhancement is also proposed in Sec. 4. A com-parative study is presented between the proposed workand the existing work in Sec. 5. Section 6 providesthe real-time implementation of fuzzy adaptive Wienerfilter. Conclusion and future scope are given in Sec. 7.
469

Fig. 1—Overall block diagram of noise reduction system.
2 FEATURE EXTRACTION
When the recorded noise data are too large to be pro-cessed and it is suspected to be notoriously redundantthen the data will be transformed into a reduced repre-sentation set of features. If the extracted features arecarefully chosen, it is expected that the features set willextract the relevant information from the given data inorder to perform the desired task using this reducedrepresentation instead of the full size noise input.The feature extraction process calculates numericalfeatures that characterize the sample and it is neededto reduce the dimensionality of the data passed to theneural network.
Initially various environmental noise signals arerecorded individually for 5 sec. From these recordedsignals feature sets are extracted using line spectralcoefficients, correlation coefficients, MEL cepstralanalysis and principal component analysis (PCA).
2.1 Line Spectral Frequencies
One of the methods to compute the line spectralfrequency (LSF) parameters is to estimate the linearprediction coefficients (LPC) parameters, then to convertthe estimated LPC parameters to LSF parameters. Thebasic idea behind linear predictive analysis is that a spe-cific input sample at the current time can be approxi-mated as a linear combination of past input samples.Through minimizing the sum of squared differences overa finite interval between the actual input samples andlinear predicted values, a unique set of parameters orpredictor coefficients can be determined.
In general, the predicted value is expressed as afunction of the given M past samples.
X n j n� 1; n� 2; . . . ; n�Mð Þ ¼ Ψ
x n� 1ð Þ; x n� 2ð Þ; . . . ; x n� mð Þð Þ ð1Þ
470 Noise Control Engr. J. 61 (5), September-October 2013
Now, if this function Ψ is a linear function of thevariables x(n � 1), x(n � 2),. . ., x(n � M), then theprediction is said to be linear.
The prediction error is defined as
fM nð Þ ¼ x nð Þ � X n n� 1; n� 2; . . . ; n�Mj Þð ð2ÞHere, the subscript M in fM(n) denotes the order of theprediction, i.e., the number of past samples that areused to predict the next sample. In this work LPC coef-ficients are found for the different noise signals with theorder 512. Line spectral frequencies are calculated fromthis estimated linear prediction coefficients. Though thenoise signals are not linear in nature along with linespectral frequencies, three more feature extractionprocesses correlation coefficient, cepstral analysis andprincipal components are considered in this paper.
2.2 Correlation Coefficients
The correlation provides a measure of the similaritybetween a given signal and the replica of the samesignal delayed by a particular time. The autocorrela-tion function of the input process may not be aknown priority. Hence, this will need to be estimatedbased on the input process itself. The expectations havebeen replaced by the time averages and the autocorrela-tion function has been found for lags k = 1, 2,. . ., M,i.e.,
Rxx kð Þ ¼ 1N � K
XNl¼1
X lð ÞX � l � kð Þ: ð3Þ
In Eqn. (3), X(l) and X(l � k) represent the expectedvalue of the product and Rxx(k) is the autocorrelationfunction. In this work M value is considered as 512.Unbiased autocorrelation is found for each frame usingEqn. (3).
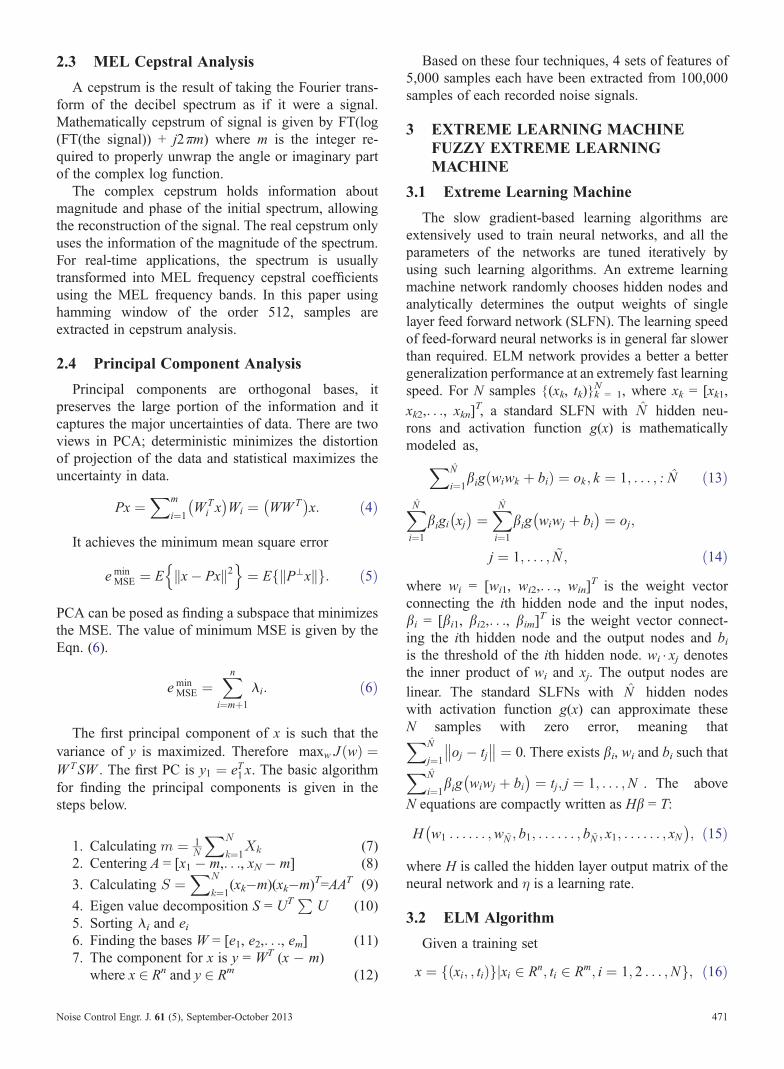
2.3 MEL Cepstral Analysis
A cepstrum is the result of taking the Fourier trans-form of the decibel spectrum as if it were a signal.Mathematically cepstrum of signal is given by FT(log(FT(the signal)) + j2πm) where m is the integer re-quired to properly unwrap the angle or imaginary partof the complex log function.
The complex cepstrum holds information aboutmagnitude and phase of the initial spectrum, allowingthe reconstruction of the signal. The real cepstrum onlyuses the information of the magnitude of the spectrum.For real-time applications, the spectrum is usuallytransformed into MEL frequency cepstral coefficientsusing the MEL frequency bands. In this paper usinghamming window of the order 512, samples areextracted in cepstrum analysis.
2.4 Principal Component Analysis
Principal components are orthogonal bases, itpreserves the large portion of the information and itcaptures the major uncertainties of data. There are twoviews in PCA; deterministic minimizes the distortionof projection of the data and statistical maximizes theuncertainty in data.
Px ¼Xm
i¼1WT
i x� �
Wi ¼ WWT� �
x: ð4Þ
It achieves the minimum mean square error
e minMSE ¼ E x� Pxk k2
n o¼ E P⊥xk kf g: ð5Þ
PCA can be posed as finding a subspace that minimizesthe MSE. The value of minimum MSE is given by theEqn. (6).
e minMSE ¼
Xni¼mþ1
λi: ð6Þ
The first principal component of x is such that thevariance of y is maximized. Therefore maxw J wð Þ ¼WTSW . The first PC is y1 ¼ eT1 x. The basic algorithmfor finding the principal components is given in thesteps below.
No
1. Calculating m ¼ 1N
XN
k¼1Xk (7)
2. Centering A = [x1 � m,. . ., xN � m] (8)
3. Calculating S ¼XN
k¼1(xk�m)(xk�m)T=AAT (9)
4. Eigen value decomposition S = UT P U (10)5. Sorting λi and ei6. Finding the bases W = [e1, e2,. . ., em] (11)7. The component for x is y = WT (x � m)
where x 2 Rn and y 2 Rm (12)
ise Control Engr. J. 61 (5), September-October 2013
Based on these four techniques, 4 sets of features of5,000 samples each have been extracted from 100,000samples of each recorded noise signals.
3 EXTREME LEARNING MACHINEFUZZY EXTREME LEARNINGMACHINE
3.1 Extreme Learning Machine
The slow gradient-based learning algorithms areextensively used to train neural networks, and all theparameters of the networks are tuned iteratively byusing such learning algorithms. An extreme learningmachine network randomly chooses hidden nodes andanalytically determines the output weights of singlelayer feed forward network (SLFN). The learning speedof feed-forward neural networks is in general far slowerthan required. ELM network provides a better a bettergeneralization performance at an extremely fast learningspeed. For N samples {(xk, tk)}
Nk = 1, where xk = [xk1,
xk2,. . ., xkn]T, a standard SLFN with N̂ hidden neu-
rons and activation function g(x) is mathematicallymodeled as,
XN̂
i¼1big wiwk þ bið Þ ¼ ok ; k ¼ 1; . . . ; : N̂ ð13Þ
XN̂i¼1
bigi xj� � ¼ XN̂
i¼1
big wiwj þ bi� � ¼ oj;
j ¼ 1; . . . ; ~N ; ð14Þwhere wi = [wi1, wi2,. . ., win]
T is the weight vectorconnecting the ith hidden node and the input nodes,bi = [bi1, bi2,. . ., bim]
T is the weight vector connect-ing the ith hidden node and the output nodes and biis the threshold of the ith hidden node. wi � xj denotesthe inner product of wi and xj. The output nodes arelinear. The standard SLFNs with N̂ hidden nodeswith activation function g(x) can approximate theseN samples with zero error, meaning thatXN̂
j¼1oj � tj
�� �� ¼ 0. There exists bi, wi and bi such thatXN̂
i¼1big wiwj þ bi
� � ¼ tj; j ¼ 1; . . . ;N . The above
N equations are compactly written as Hb = T:
H w1 . . . . . . ;w~N ; b1; . . . . . . ; b~N ; x1; . . . . . . ; xN� �
; ð15Þ
where H is called the hidden layer output matrix of theneural network and � is a learning rate.
3.2 ELM Algorithm
Given a training set
x ¼ xi; ; tið Þf g xi 2 Rn; ti 2 Rm; i ¼ 1; 2 . . . ;Nj g; ð16Þ
471
0 500 1000 1500 2000 2500 3000 3500 4000-0.01
0
0.01BABBLE NOISE
No of Samples
Am
plitu
de
0 500 1000 1500 2000 2500 3000 3500 4000-1
0
1BUS HORN NOISE
No of Samples
Am
plitu
de
1CAR HORN NOISE
e
where xi is a training sample and ti is the correspondingtarget value, g(x) is the activation function and N is thenumber of hidden neurons.
Step 1: Assign arbitrary input weight Wij and biasbi, j = 1,. . ., N.
Step 2: Calculate the output matrix at the hiddenlayer H = g(wx + b)
Step 3: Calculate the output weight b. b = H † T,where T = [t1, t2,. . ., tN]
T
0 500 1000 1500 2000 2500 3000 3500 4000-1
0
No of Samples
Am
plitu
d
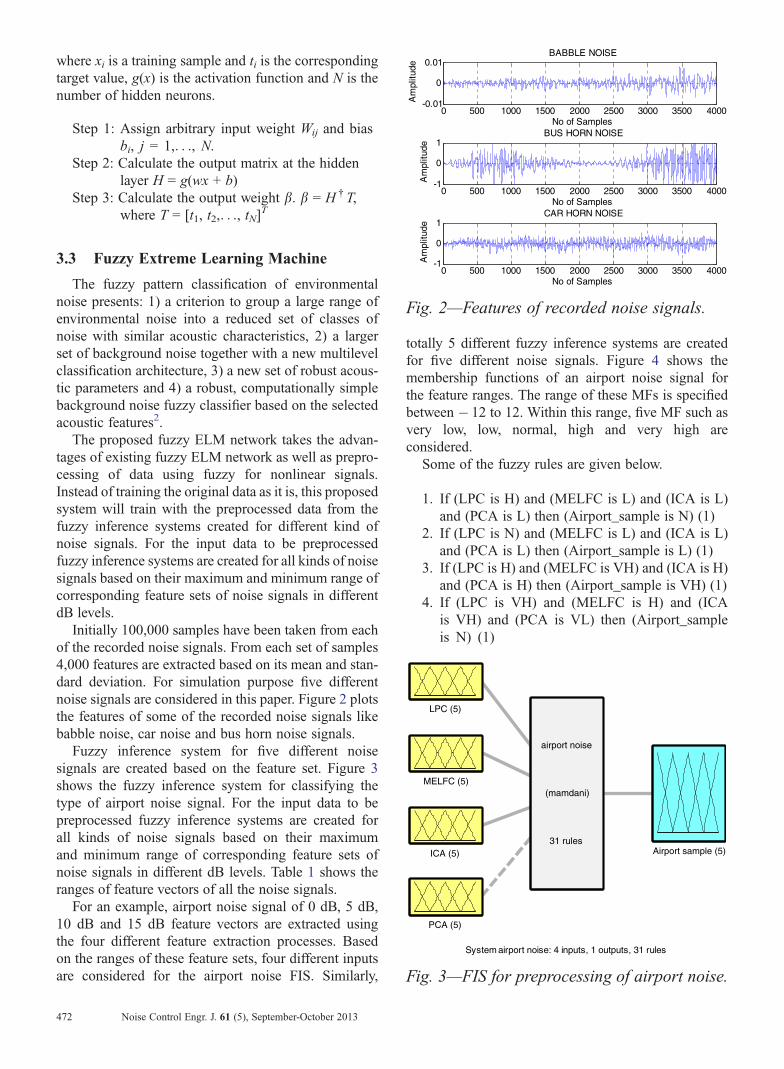
Fig. 2—Features of recorded noise signals.
System airport noise: 4 inputs, 1 outputs, 31 rules
LPC (5)
MELFC (5)
ICA (5)
PCA (5)
Airport sample (5)
airport noise
(mamdani)
31 rules
Fig. 3—FIS for preprocessing of airport noise.
3.3 Fuzzy Extreme Learning Machine
The fuzzy pattern classification of environmentalnoise presents: 1) a criterion to group a large range ofenvironmental noise into a reduced set of classes ofnoise with similar acoustic characteristics, 2) a largerset of background noise together with a new multilevelclassification architecture, 3) a new set of robust acous-tic parameters and 4) a robust, computationally simplebackground noise fuzzy classifier based on the selectedacoustic features2.
The proposed fuzzy ELM network takes the advan-tages of existing fuzzy ELM network as well as prepro-cessing of data using fuzzy for nonlinear signals.Instead of training the original data as it is, this proposedsystem will train with the preprocessed data from thefuzzy inference systems created for different kind ofnoise signals. For the input data to be preprocessedfuzzy inference systems are created for all kinds of noisesignals based on their maximum and minimum range ofcorresponding feature sets of noise signals in differentdB levels.
Initially 100,000 samples have been taken from eachof the recorded noise signals. From each set of samples4,000 features are extracted based on its mean and stan-dard deviation. For simulation purpose five differentnoise signals are considered in this paper. Figure 2 plotsthe features of some of the recorded noise signals likebabble noise, car noise and bus horn noise signals.
Fuzzy inference system for five different noisesignals are created based on the feature set. Figure 3shows the fuzzy inference system for classifying thetype of airport noise signal. For the input data to bepreprocessed fuzzy inference systems are created forall kinds of noise signals based on their maximumand minimum range of corresponding feature sets ofnoise signals in different dB levels. Table 1 shows theranges of feature vectors of all the noise signals.
For an example, airport noise signal of 0 dB, 5 dB,10 dB and 15 dB feature vectors are extracted usingthe four different feature extraction processes. Basedon the ranges of these feature sets, four different inputsare considered for the airport noise FIS. Similarly,
472 Noise Control Engr. J. 61 (5), September-October 2013
totally 5 different fuzzy inference systems are createdfor five different noise signals. Figure 4 shows themembership functions of an airport noise signal forthe feature ranges. The range of these MFs is specifiedbetween � 12 to 12. Within this range, five MF such asvery low, low, normal, high and very high areconsidered.
Some of the fuzzy rules are given below.
1. If (LPC is H) and (MELFC is L) and (ICA is L)and (PCA is L) then (Airport_sample is N) (1)
2. If (LPC is N) and (MELFC is L) and (ICA is L)and (PCA is L) then (Airport_sample is L) (1)
3. If (LPC is H) and (MELFC is VH) and (ICA is H)and (PCA is H) then (Airport_sample is VH) (1)
4. If (LPC is VH) and (MELFC is H) and (ICAis VH) and (PCA is VL) then (Airport_sampleis N) (1)
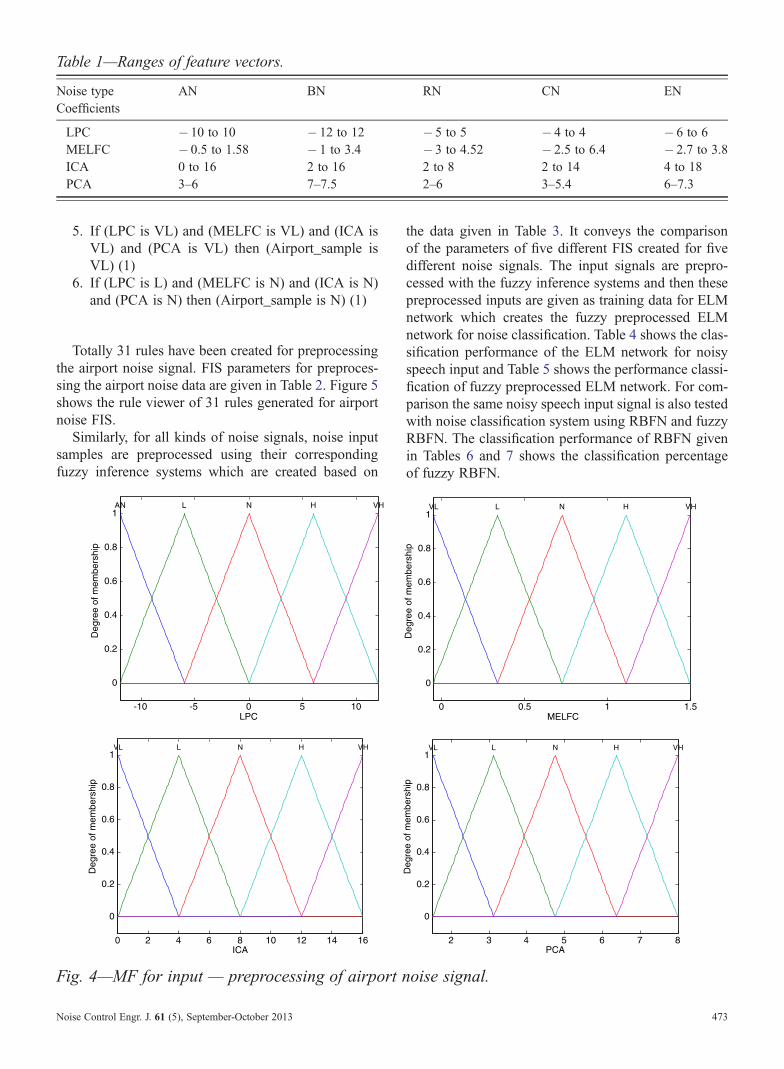
Table 1—Ranges of feature vectors.
Noise type AN BN RN CN ENCoefficients
LPC � 10 to 10 � 12 to 12 � 5 to 5 � 4 to 4 � 6 to 6MELFC � 0.5 to 1.58 � 1 to 3.4 � 3 to 4.52 � 2.5 to 6.4 � 2.7 to 3.8ICA 0 to 16 2 to 16 2 to 8 2 to 14 4 to 18PCA 3–6 7–7.5 2–6 3–5.4 6–7.3
Fi
No
5. If (LPC is VL) and (MELFC is VL) and (ICA isVL) and (PCA is VL) then (Airport_sample isVL) (1)
6. If (LPC is L) and (MELFC is N) and (ICA is N)and (PCA is N) then (Airport_sample is N) (1)
Totally 31 rules have been created for preprocessingthe airport noise signal. FIS parameters for preproces-sing the airport noise data are given in Table 2. Figure 5shows the rule viewer of 31 rules generated for airportnoise FIS.
Similarly, for all kinds of noise signals, noise inputsamples are preprocessed using their correspondingfuzzy inference systems which are created based on
-10 -5 0 5 10
0
0.2
0.4
0.6
0.8
1
LPC
Deg
ree
of m
embe
rshi
p
AN L N H VH
0 2 4 6 8 10 12 14 16
0
0.2
0.4
0.6
0.8
1
ICA
Deg
ree
of m
embe
rshi
p
VL L N H VH
g. 4—MF for input — preprocessing of airport n
ise Control Engr. J. 61 (5), September-October 2013
the data given in Table 3. It conveys the comparisonof the parameters of five different FIS created for fivedifferent noise signals. The input signals are prepro-cessed with the fuzzy inference systems and then thesepreprocessed inputs are given as training data for ELMnetwork which creates the fuzzy preprocessed ELMnetwork for noise classification. Table 4 shows the clas-sification performance of the ELM network for noisyspeech input and Table 5 shows the performance classi-fication of fuzzy preprocessed ELM network. For com-parison the same noisy speech input signal is also testedwith noise classification system using RBFN and fuzzyRBFN. The classification performance of RBFN givenin Tables 6 and 7 shows the classification percentageof fuzzy RBFN.
0 0.5 1 1.5
0
0.2
0.4
0.6
0.8
1
MELFC
Deg
ree
of m
embe
rshi
p
VL L N H VH
2 3 4 5 6 7 8
0
0.2
0.4
0.6
0.8
1
PCA
Deg
ree
of m
embe
rshi
p
VL L N H VH
oise signal.
473

Table 2—FIS parameters for airport noise.
Parameters No. of parameter List of parameters
Inputs 3 LPC, MELFC, ICA, PCAInput membership function 5 VL, L, N, H, VHOutput 1 Airport noise sampleOutput membership function 5 VL, L, N, H, VH
4 WIENER FILTER AND ADAPTIVEWIENER FILTER
4.1 Wiener Filter
Wiener filter is a popular technique that has beenused in many signal enhancement methods. The basicprinciple of the Wiener filter is to obtain a clean signalfrom that corrupted by additive noise. It is required toestimate an optimal filter for the noisy input speechby minimizing the MMSE between the desired signald(n) and the estimated signal d (̂n). Figure 6 showsthe basic block of Wiener filter.
To recover a desired signal d(n) from a given noisyobservation x(n) = d(n) + v(n), here both d(n) and v(n)are assumed to be wide sense stationary processes3.Wiener filter design produces an estimate d (̂n) of thedesired signal d(n) using a linear combination of thedata x(n) and it will minimize the minimum meansquare error function. The mean square error functionis given by
J ¼ E d nð Þ � d∧
nð Þ2� �� �
¼ E e2 nð Þ ð17Þ
Fig. 5—FIS rule viewer — airport noise signal.
474 Noise Control Engr. J. 61 (5), September-October 2013
In this paper, fuzzy extreme learning machine is usedto classify the noises. Based on the classified output,one of the reference noise signals may be taken fromthe recorded noise signals. This will be considered asan initial noise reference. With this initial referencenoise signal, a second set of noise reference will be gen-erated using FIR filter of the order 7. Using the primarysignal as input signal and with the second referencenoise signal, Wiener filter generates a third referencenoise signal that almost resembles the original noisesignal present in the primary signal. This third noisereference is subtracted from the primary signal to ob-tain the original speech signal. The same experimentis tested for three different input signals corrupted withvarious noise signals. For the obtained speech signaland music signals minimum mean square error and sig-nal to noise ratio are calculated and are given in Sec. 5.
4.2 Adaptive Wiener Filter
In adaptive Wiener filter, the optimum filter coeffi-cients which are found by the autocorrelation methodare updated based on the error signal. The basic blockdiagram of an adaptive Wiener filter is shown in Fig. 74.

Table 3—Parameters of fuzzy inference system for preprocessing.
Noise type parameter Airport noise Babble noise Restaurant noise Car horn noise Exhibition noise
No. of inputs 3 3 3 3 3No. of inputmembership function
5 7 7 5 7Very low, low,normal, high,very high
Extremely low,very low, low,normal, high,very high,extremely high
Extremely low,very low, low,normal, high,very high,extremely high
Very low, low,normal, high,very high
Extremely low,very low, low,normal, high,very high,extremely high
No. of outputs 1 1 1 1 1No. of outputmembership function
5 5 5 5 5Very low, low,normal, high,very high
Very low, low,normal, high,very high
Very low, low,normal, high,very high
Very low, low,normal, high,very high
Very low, low,normal, high,very high
No. of rules 31 45 45 34 47Preprocessedoutput sample range
� 8 to 8 � 9 to 9 � 4 to 4 � 3 to 3 � 5 to 5
An adaptive Wiener filter is a modification of an or-dinary Wiener filter. In an adaptive Wiener filter theoutput is compared with a desired signal. The differ-ence in the output is the deviation of the obtained signalfrom the required signal. This deviation is marked as an
Table 4—ELM — classification accuracy for noisyspeech input.
Dataset
Activationfunction
Timein sec
% Accuracy beforepreprocessing
No. ofhiddenunits
Training Testing
AN Bipolar
Gaussian
1.96 92 82 252.21 95 79 501.72 92 82 252.45 93 82 50
BN Bipolar
Gaussian
0.90 93 76 250.95 93 77 500.99 92 80 251.11 95 76 50
RN Bipolar
Gaussian
0.92 93 82 250.94 94 80 500.90 92 83 250.98 93 85 50
CN Bipolar
Gaussian
0.96 93 80 251.06 96 76 500.93 92 81 251.12 92 82 50
EN Bipolar
Gaussian
0.95 93 77 251.15 92 76 500.94 92 80 250.99 92 77 50
Noise Control Engr. J. 61 (5), September-October 2013
error signal. This error signal is used to do the requiredmodification in the transfer function of the filter and theweights are modified accordingly. An adjusting weightalgorithm is used for converting the error signal to acorresponding modification in the weights4–6.
Table 5—Fuzzy preprocessed ELM — classifica-tion accuracy for noisy speech input.
Dataset
Activationfunction
Timein sec
% Accuracy afterpreprocessing
No. ofhiddenunits
Training Testing
AN Bipolar
Gaussian
1.96 92 86 252.21 95 82 501.72 92 86 252.45 93 85 50
BN Bipolar
Gaussian
0.90 93 81 250.95 93 80 500.99 92 85 251.11 95 81 50
RN Bipolar
Gaussian
0.92 93 87 250.94 94 85 500.90 92 88 250.98 93 89 50
CN Bipolar
Gaussian
0.96 93 84 251.06 96 81 500.93 92 86 251.12 92 87 50
EN Bipolar
Gaussian
0.95 93 82 251.15 92 80 500.94 92 83 250.99 92 82 50
475

Table 6—Percentage classification of RBFN.
Testing input/Training input
% of Classification of RBFN
AN BN RN CN EN
AN 72 3 3 20 2BN 0 70 22 0 8RN 1 20 75 2 2CN 19 8 5 68 0EN 4 10 14 6 66
Fig. 6—FIR Wiener filter.
As similar to Wiener filter, an initial noise referenceis selected from the recorded noise signal based on theoutput of FELM classification. Along with the noisereference, Wiener filter coefficients are also updatediteratively to generate the final noise reference signal.This generated noise reference is subtracted from theinput speech signal to obtain the clean speech or musicsignal. The simulation results are shown in Sec. 5.
4.3 Fuzzy Adaptive Wiener Filter
The proposed fuzzy adaptive system of noise cancel-lation uses an adaptive neuro fuzzy inference system(ANFIS) for updating its weight. In the existing work,ANFIS is used for nonlinear noise cancellation inimages, in mobile channel equalizer and in the environ-ment where the nonlinear signal is used as input. SinceANFIS is the appropriate system for nonlinear systems,different ANFIS architectures are proposed and ANFISis trained based on the classified noise input from theclassifier module. For this adaptive neuro fuzzy system,the classified noise signal from the noise classifiermodule and its delayed versions are given as trainingdata set. ANFIS parameters used for this adaptivesystem are given in Table 8.
The ANFIS-based adaptive filter provides outputnoise signal which almost resembles the original noisesignal present in the noisy speech signal. So insteadof eliminating the classified noise signal from the cor-rupted speech signal as such, the noise signal generatedfrom the fuzzy adaptive system will be eliminated from
Table 7—Percentage classification of fuzzy RBFN.
Testing input/Training input
% of Classification of fuzzy RBFN
AN BN RN CN EN
AN 78 2 1 16 3BN 0 74 21 0 5RN 0 20 79 0 1CN 17 5 4 74 0EN 0 12 13 2 73
476 Noise Control Engr. J. 61 (5), September-October 2013
the corrupted speech signal to obtain the clear signal.By considering this noise reference and its delayedversions as training data set, an adaptive neuro fuzzyinference system is created2,7. Figure 8 shows the blockdiagram of a fuzzy adaptive Wiener filter.
5 SIMULATION RESULTS
The input is a speech sequence which is recorded for5 sec both in noiseless and noisy environment. In thissequence 100,000 samples are taken for simulation pur-pose. From the recorded input speech signals, featuresare extracted using line spectral coefficients, auto corre-lation coefficients, cepstrum coefficients and principalcomponents. These features are fuzzified using fuzzyinference systems and then these fuzzy preprocesseddata are given as training data to the ELM network fortraining phase. The corrupted speech signal is givenas checking data for the extreme learning machine net-work. Similarly various combinations of speech withnoise signals like bus horn noise signals (BHN), carhorn noise signals (CHN) and babble noise signals(BN) are tested with FELM. Noise classification net-works ELM and fuzzy ELM are simulated for Gaussianand bipolar activation function with 25 or 50 hiddennodes.
Tables 4 and 5 show the performance of classifica-tion of ELM network and fuzzy FELM under differentnoisy conditions. Hit ratio of fuzzy ELM is better thanELM by 4%. Table 6 shows the classification percent-age of RBFN for the same input data and Table 7 showsthe classification percentage of fuzzy RBFN. Figure 9shows the performance comparison of RBFN andELM network for noisy speech input signal and Fig. 10
Fig. 7—Adaptive Wiener filter.

Table 8—ANFIS parameters.
Input/Parameters Inputnoisyspeechsignal 1
Inputnoisyspeechsignal 2
Inputnoisyspeechsignal 3
Nodes 55 60 60Linear parameters 80 91 83Nonlinear parameters 24 35 28Total no. of parameters 104 126 111Training data pair 1000 1000 1000No. of fuzzy rules 16 18 16Initial step size 0.01 0.01 0.01
Fig. 9—Comparison of RBFN and ELM.
compares the performance of FRBFN and FELM. Fig-ures 9 and 10 visualize that the performance of fuzzyELM has improved performance than FRBFN by 9%and ELM by 4%.
5.1 Results for Case 1
The speech signal is recorded in noisy environment.FELM module classifies the major source of noise sig-nal present in the corrupted input speech signal. Fromthis result, the classified noise signal will be used as areference noise signal for noise cancellation. With theuse of this reference noise signal ANFIS estimates anoise signal and is subtracted from the noisy speechsignal. In the first case the classified noise output fromFELM is babble noise.
The simulation results for the three algorithms Wie-ner filter, adaptive Wiener filter and fuzzy adaptiveWiener filter with the reference noise signal from thenoise classification module as babble noise as referencenoise signal are given in Tables 9 and 10. The other twocases are also considered for the same speech signalwhich is recorded in different noisy environments.Table 9 gives the minimum mean square value of thethree algorithms when babble noise is given as referencenoise signal. Similarly Table 10 gives the signal to noisefor the same.
Fuzzy Aaptive filter – ANFIS
Based LMS , NLMS, RLS, Wiener,
GAL
∑
Noisy input
signal
Pre-dominant noise signal
from noise classification
module Filtered Signal Noise
Fig. 8—Fuzzy adaptive Wiener filter.
Noise Control Engr. J. 61 (5), September-October 2013
5.2 Results for Case 2
In case 2, the major source of noise signal present inthe signal is classified as bus horn noise signal. By us-ing this bus horn signal as reference noise signal, theexperimental results of Wiener filters are shown inTables 11 and 12.
5.3 Results for Case 3
In the third case, classification network provides theoutput as car horn noise signal. With this noise signalas reference noise signal, the experimental results areshown in Tables 13 and 14.
6 REAL-TIME IMPLEMENTATION
This section discusses the implementation of fuzzyWiener filter. Noise classification is performed withMATLAB software. Speech signal is sampled at16 kHz which implies that each value sampled is ac-quired at a rate of 1/16 kHz or 0.0625 ms.TMS320C6713 is based on the VLIW architecturewhich is very well suited for numerically intensivealgorithms. Embedded MATLAB function in Simulinkis used to convert fuzzy Wiener filter algorithm inMATLAB code into embedded c code. The MATLABfunction executes for simulation and generates codefor a real-time workshop target. Wiener filter coeffi-cients are updated using ANFIS and with the known
Fig. 10—Comparison of FRBFN and FELM.
477
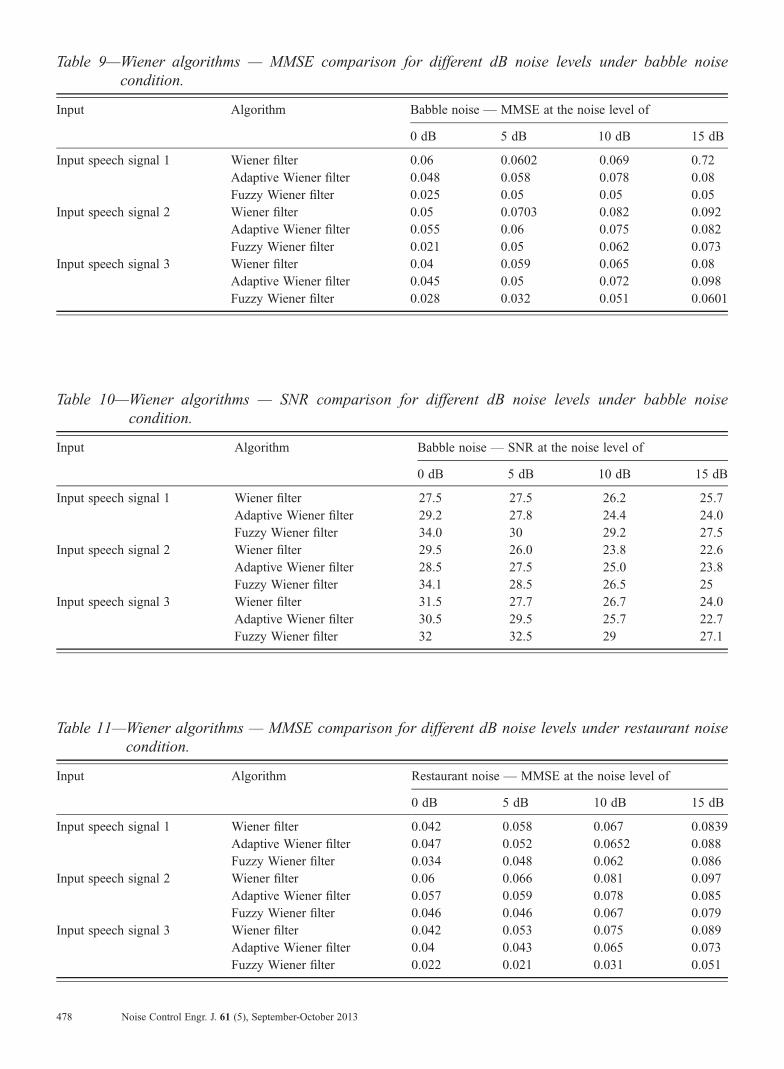
Table 9—Wiener algorithms — MMSE comparison for different dB noise levels under babble noisecondition.
Input Algorithm Babble noise — MMSE at the noise level of
0 dB 5 dB 10 dB 15 dB
Input speech signal 1 Wiener filter 0.06 0.0602 0.069 0.72Adaptive Wiener filter 0.048 0.058 0.078 0.08Fuzzy Wiener filter 0.025 0.05 0.05 0.05
Input speech signal 2 Wiener filter 0.05 0.0703 0.082 0.092Adaptive Wiener filter 0.055 0.06 0.075 0.082Fuzzy Wiener filter 0.021 0.05 0.062 0.073
Input speech signal 3 Wiener filter 0.04 0.059 0.065 0.08Adaptive Wiener filter 0.045 0.05 0.072 0.098Fuzzy Wiener filter 0.028 0.032 0.051 0.0601
Table 10—Wiener algorithms — SNR comparison for different dB noise levels under babble noisecondition.
Input Algorithm Babble noise — SNR at the noise level of
0 dB 5 dB 10 dB 15 dB
Input speech signal 1 Wiener filter 27.5 27.5 26.2 25.7Adaptive Wiener filter 29.2 27.8 24.4 24.0Fuzzy Wiener filter 34.0 30 29.2 27.5
Input speech signal 2 Wiener filter 29.5 26.0 23.8 22.6Adaptive Wiener filter 28.5 27.5 25.0 23.8Fuzzy Wiener filter 34.1 28.5 26.5 25
Input speech signal 3 Wiener filter 31.5 27.7 26.7 24.0Adaptive Wiener filter 30.5 29.5 25.7 22.7Fuzzy Wiener filter 32 32.5 29 27.1
Table 11—Wiener algorithms — MMSE comparison for different dB noise levels under restaurant noisecondition.
Input Algorithm Restaurant noise — MMSE at the noise level of
0 dB 5 dB 10 dB 15 dB
Input speech signal 1 Wiener filter 0.042 0.058 0.067 0.0839Adaptive Wiener filter 0.047 0.052 0.0652 0.088Fuzzy Wiener filter 0.034 0.048 0.062 0.086
Input speech signal 2 Wiener filter 0.06 0.066 0.081 0.097Adaptive Wiener filter 0.057 0.059 0.078 0.085Fuzzy Wiener filter 0.046 0.046 0.067 0.079
Input speech signal 3 Wiener filter 0.042 0.053 0.075 0.089Adaptive Wiener filter 0.04 0.043 0.065 0.073Fuzzy Wiener filter 0.022 0.021 0.031 0.051
478 Noise Control Engr. J. 61 (5), September-October 2013
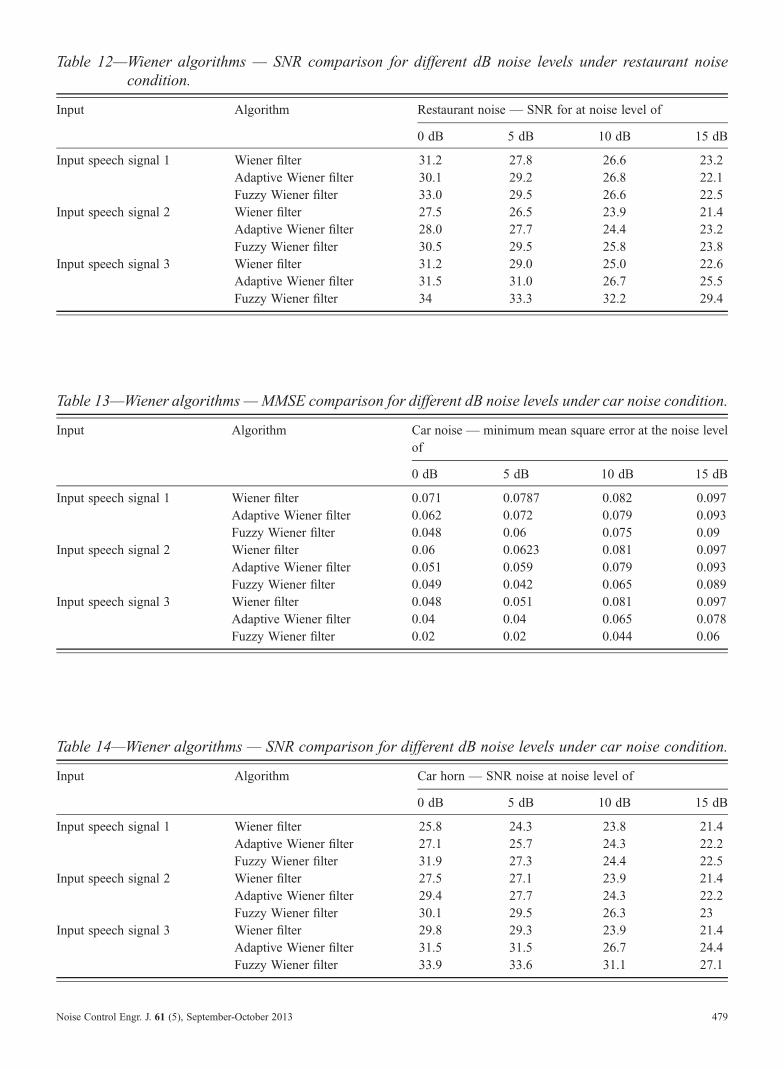
Table 12—Wiener algorithms — SNR comparison for different dB noise levels under restaurant noisecondition.
Input Algorithm Restaurant noise — SNR for at noise level of
0 dB 5 dB 10 dB 15 dB
Input speech signal 1 Wiener filter 31.2 27.8 26.6 23.2Adaptive Wiener filter 30.1 29.2 26.8 22.1Fuzzy Wiener filter 33.0 29.5 26.6 22.5
Input speech signal 2 Wiener filter 27.5 26.5 23.9 21.4Adaptive Wiener filter 28.0 27.7 24.4 23.2Fuzzy Wiener filter 30.5 29.5 25.8 23.8
Input speech signal 3 Wiener filter 31.2 29.0 25.0 22.6Adaptive Wiener filter 31.5 31.0 26.7 25.5Fuzzy Wiener filter 34 33.3 32.2 29.4
Table 13—Wiener algorithms—MMSE comparison for different dB noise levels under car noise condition.
Input Algorithm Car noise — minimum mean square error at the noise levelof
0 dB 5 dB 10 dB 15 dB
Input speech signal 1 Wiener filter 0.071 0.0787 0.082 0.097Adaptive Wiener filter 0.062 0.072 0.079 0.093Fuzzy Wiener filter 0.048 0.06 0.075 0.09
Input speech signal 2 Wiener filter 0.06 0.0623 0.081 0.097Adaptive Wiener filter 0.051 0.059 0.079 0.093Fuzzy Wiener filter 0.049 0.042 0.065 0.089
Input speech signal 3 Wiener filter 0.048 0.051 0.081 0.097Adaptive Wiener filter 0.04 0.04 0.065 0.078Fuzzy Wiener filter 0.02 0.02 0.044 0.06
Table 14—Wiener algorithms — SNR comparison for different dB noise levels under car noise condition.
Input Algorithm Car horn — SNR noise at noise level of
0 dB 5 dB 10 dB 15 dB
Input speech signal 1 Wiener filter 25.8 24.3 23.8 21.4Adaptive Wiener filter 27.1 25.7 24.3 22.2Fuzzy Wiener filter 31.9 27.3 24.4 22.5
Input speech signal 2 Wiener filter 27.5 27.1 23.9 21.4Adaptive Wiener filter 29.4 27.7 24.3 22.2Fuzzy Wiener filter 30.1 29.5 26.3 23
Input speech signal 3 Wiener filter 29.8 29.3 23.9 21.4Adaptive Wiener filter 31.5 31.5 26.7 24.4Fuzzy Wiener filter 33.9 33.6 31.1 27.1
479Noise Control Engr. J. 61 (5), September-October 2013
noise reference signal which is to be given internally in-stead of getting the noise reference from neural network.Since the classifier performance is improved in ELMnetworks, the experimental results of fuzzy Wiener filtergives the performance improvement of 5 dB SNRinstead of getting 8 dB improvement as in simulation.
7 SUMMARYAND CONCLUDINGREMARKS
Though the environmental noise is fuzzy, this fuzzyinference system will be a vital role for finding thenoise reference signal. The experimental results clearlyshow that the classification performance of the fuzzyextreme learning machine is improved by 9% thanFRBFN and 4% than ELM and signal to noise ratioof fuzzy adaptive filter is improved around 8 dB thanthe conventional Wiener filter. The work will be ex-tended towards various noises under various environ-ments and the entire setup is to be implemented forreal-time systems like mobile phones and hearing aids.
480 Noise Control Engr. J. 61 (5), September-October 2013
8 REFERENCES
1. M.A. Abd El-Fattah, M.I. Dessouky and S.M. Diab, “AdaptiveWiener filtering approach for speech enhancement”, Journal ofUbiquitous Computing and Communication, 2(3), 23–31,(2008).
2. Alexander D. Poularikas and Zayed M. Ramadan, Adaptive Fil-tering Primer with MATLAB, CRC/Taylor & Francis, (2006).
3. C.N. Canagarajah and P.J.W. Rayner, “Two stage adaptive fil-tering techniques for noise cancellation”, IEEE InternationalSymposium on Circuits and Systems (ISCAS), 2, 521–524,(1992).
4. Fei Chen and P.C. Loizou, “Speech enhancement using frequencyspecific composite Wiener function”, IEEE Conference onAcoustics, Speech and Signal Processing, 4726–4729, (2010).
5. Namyong Kim, Hyung-Gi Byun and Ki Hyeon Kwon, “Learningbehaviors of stochastic gradient radial basis function networkalgorithms for odor sensing systems”, ETRI Journal, 28(1),59–66, (2006).
6. Chin-Teng Lin and Chia-Feng Juang, “An adaptive neuralfuzzy filter and its applications”, IEEE Transactions on Sys-tems, Man, and Cybernetics—Part b: Cybernetics, 27(4),635–656, (1997).
7. Dian Hui Wang, Guang-Bin Huang and Yuan Lan, “Extremelearning machines: a survey”, Int. J. Mach. Learn. & Cyber, 2,107–122, (2011).